Embed Size (px)
Citation preview
1
Comparison of multiple reanalysis datasets with gridded 1
precipitation observations over the Tibetan Plateau 2
Qinglong You 1*, Jinzhong Min1, Wei Zhang1, Nick Pepin2, Shichang Kang
3 3
1. Earth System Modelling Center (ESMC), Nanjing International Academy of Meteorological 4
Sciences (NIAMS); Key Laboratory of Meteorological Disaster, Ministry of Education; 5
Collaborative Innovation Center on Forecast and Evaluation of Meteorological Disasters; 6
Nanjing University of Information Science and Technology, Nanjing, 210044, China; 7
2. Department of Geography, University of Portsmouth, U.K. ; 8
3. State Key Laboratory of Cryospheric Science, Chinese Academy of Sciences, Lanzhou 9
730000, China; 10
11
12
13
14
15
* Corresponding author E-mail address: [email protected] 16
17
18
Resubmitted to Climate Dynamics, July 22, 2014 19
20
21
22
2
Abstracts: Precipitation is a critical component of the water balance, and hence its variability is 23
critical for cryospheric and climate change in the Tibetan Plateau (TP). Mean annual and seasonal 24
precipitation totals are compared between gridded observations interpolated to a high resolution 25
(0.25°×0.25°) and multiple reanalysis type-datasets during 1979-2001. The latter include two 26
NCEP reanalyses (NCEP1 and NCEP2), two European Centre for Medium-Range Weather 27
Forecasts (ECMWF) reanalyses (ERA-40 and ERA-Interim), three modern reanalyses (the 20th
28
century reanalysis (20century), MERRA and CFSR) and three merged analysis datasets (CMAP1, 29
CMAP2 and GPCP). Observations show an increase in mean precipitation from the northwestern 30
(NW) to the southeastern (SE) regions of the TP which are divided by an isohyet of 400 mm, and 31
overall trends during the studied period are positive. Compared with observations, most of the 32
datasets (NCEP1, NCEP2, CMAP1, CMAP2, ERA-Interim, ERA-40, GPCP, 20century, MERRA 33
and CFSR) can both broadly capture the spatial distributions and identify temporal patterns and 34
variabilities of mean precipitation. However, most multi-datasets overestimate precipitation 35
especially in the SE where summer convection is dominant. There remain substantial 36
disagreements and large discrepancies in precipitation trends due to differences in assimilation 37
systems between datasets. Taylor diagrams are used to show the correlation coefficients, standard 38
deviation, and root-mean-square difference (RMSD) of precipitation totals between interpolated 39
observations and assimilated values on an annual and seasonal basis. Merged analysis data 40
(CMAP1, CMAP2 and GPCP) agree with observations more closely than reanalyses. Thus not all 41
datasets are equally biased and choice of dataset is important. 42
43
Key words: Precipitation; multi-datasets, observation; Tibetan Plateau 44

3
1. Introduction 45
According to the Intergovernmental Panel on Climate Change (IPCC) Fifth Assessment 46
Report (AR5), global mean surface temperatures have warmed by 0.85 (+/-0.2) ℃ between 1880 47
and 2012 [IPCC, 2013]. The Clausius-Clapeyron equation shows that the water holding capacity 48
of air increases by about 7% per degree of warming, leading to increased water vapor in the 49
atmosphere [Trenberth, 2011]. Thus warming could change the amount, intensity, frequency, type, 50
extremes and patterns of precipitation, accelerating the hydrological cycle and increasing extreme 51
events (such as floods and droughts) [Ohmura and Wild, 2002; Trenberth, 2011]. While extreme 52
precipitation events may become more common in a warmer climate, many predictions of future 53
changes in precipitation extremes may be underestimated [Allan and Soden, 2008]. In recent 54
decades, changes in precipitation have attracted much attention. Precipitation is not only a major 55
component of the global hydrological cycle, but also influences the development of all living 56
organisms [IPCC, 2007; Joshi and Pandey, 2011; Trenberth, 2011; Trenberth and Guillemot, 57
1998]. Much societal infrastructure and property is becoming more sensitive to precipitation 58
extremes, making the causes and predictability of precipitation variability of great importance. 59
The Tibetan Plateau (TP) with an average elevation of over 4000 m a.s.l., is called “the roof 60
of the world”, and influences global atmospheric circulation through both thermal and mechanical 61
forcing [Duan and Wu, 2005; Yeh and Gao, 1979]. The TP is also the source of many rivers in 62
South and East Asia, such as the Indus, Ganges-Brahmaputra, Yangtze, and is called “the world 63
water tower” [X D Xu et al., 2008]. It is one of the most active centers of the hydrological cycle in 64
the world [Feng and Zhou, 2012]. In recent decades, both climate and the cryosphere in the TP are 65
undergoing rapid change [Kang et al., 2010; Qiu, 2008], which will have profound effects on the 66
4
Asian “water towers” [Immerzeel et al., 2010]. However, due to limited availability of accurate 67
observations, especially in the western TP, there are limited studies focusing on hydrological 68
responses to climate change and the mechanisms are seldom discussed [Yang et al., 2011]. 69
Precipitation in the TP varies both in space and time, and has significantly increased during 70
recent decades in certain areas based on adjusted station data [You et al., 2012]. Many studies 71
have examined precipitation trends in the TP and demonstrate the link between precipitation and 72
atmospheric/oceanic circulation indices, including the North Atlantic Oscillation (NAO), ENSO, 73
the Indian Ocean Dipole, the Asian-Pacific Oscillation, and the Asian monsoon [Duan et al., 74
2012; Joshi and Pandey, 2011; Liu and Yin, 2001]. However, different researchers calculate 75
correlations using different gridded precipitation datasets, which leads to remarkable 76
inconsistency among results. In addition, observations are particularly scarce in many regions 77
because of rigorous environmental conditions (such as desert). Thus understanding of the current 78
and future precipitation variability depends in part on rigorous evaluation of the many 79
contrasting “datasets” in the region, often a difficult task. Datasets include reanalyses, satellite 80
products, gauge observations, and mixtures of different data sources, often interpolated to a 81
regular grid. Gridded “observations” have been widely used by climate community, because of 82
their spatial and temporal continuity. Regular reanalyses include: The National Centers for 83
Environmental Prediction/National Center for Atmospheric Research Reanalysis (NCEP/NCAR 84
hereafter) [Kalnay et al., 1996; Kistler et al., 2001]; The European Centre for Medium-Range 85
Weather Forecasts (ECMWF) 40 years reanalysis (ERA-40 hereafter) [Uppala et al., 2005]; and 86
the new ECMWF reanalysis ERA-Interim [Dee et al., 2011]. NCEP/NCAR has two versions: 87
NCEP/NCAR 1 reanalysis (NCEP1 hereafter) [Kalnay et al., 1996] and NCEP/NCAR 2 88
5
reanalysis (NCEP2 hereafter) [Kistler et al., 2001]. Both NCEP1 and NCEP2 share similar input 89
raw data and vertical and horizontal resolution (T62, 28 levels, 6 hours), while NCEP2 is an 90
updated and human error-fixed version of NCEP1 [Kanamitsu et al., 2002]. Modern reanalyses 91
include the 20th century reanalysis (20century hereafter) [Compo et al., 2011], the Modern-Era 92
Retrospective Analysis for Research and Application (MERRA hereafter) [Rienecker et al., 2011] 93
and the NCEP Climate Forest System Reanalysis (CFSR hereafter) [Saha et al., 2010]. 94
Precipitation estimates are also provided from merged satellite and gauge observations (gridded). 95
The NOAA Climate Prediction Center (CPC) Merged Analysis of Precipitation (CMAP hereafter) 96
is widely used, which produces monthly analyses of global precipitation in which gauge 97
observations are merged with precipitation estimates from several satellite-based algorithms 98
(infrared and microwave) [Xie and Arkin, 1997]. CMAP contains two versions: standard CMAP 99
(CMAP1 hereafter) and enhanced CMAP (CMAP2 hereafter) [Xie and Arkin, 1997]. Compared 100
with CMAP1, CMAP2 includes not only the satellite estimates, but also blended NCEP/NCAR 101
reanalysis precipitation values. The Global Precipitation Climatology Project (GPCP) Version 102
2.1 monthly precipitation dataset (GPCP hereafter) also combines gauge observations and 103
satellite precipitation data [Adler et al., 2003; Huffman et al., 1997]. However it is produced 104
using different techniques and types of input data [Yin et al., 2004]. 105
The objective of this study is to compare multiple datasets of precipitation (NCEP1, NCEP2, 106
CMAP1, CMAP2, ERA-Interim, ERA-40, GPCP, 20century, MERRA and CFSR) with available 107
gridded observations over the TP. Similarities and differences in precipitation on an annual and 108
seasonal basis (summer: DJF; autumn: MAM; winter: JJA; spring: SON) are investigated. 109
110
6
2. Data and Methods 111
2.1 Observations and multi-datasets 112
Precipitation observations are derived from a new monthly gridded dataset at 0.25° resolution, 113
provided by the National Climate Center of China Meteorological Administration (NCC/CMA). 114
Interpolation is based on an “anomaly approach” using over 2400 stations [Wu and Gao, 2013; 115
Xu et al., 2009], which is similar to the method used to create the CRU (Climatic Research Unit) 116
dataset [New et al., 2002]. This consists of two steps [New et al., 2002; Wu and Gao, 2013; Xu et 117
al., 2009]. Firstly, a 30-year mean daily temperature for 1971–2000 is calculated for each Julian 118
date at each station. Then, the mean is interpolated to a regular 0.25° × 0.25° grid. In the second 119
step, a daily deviation for 1961–2005 is created relative to the 1971–2000 reference period for 120
each contributing station. The deviations are then gridded as anomalies. Finally, the high 121
resolution-gridded observation for the full 1961-2005 period is derived by adding the anomalies to 122
the climatology. This dataset has been widely used to validate regional and global atmospheric 123
model simulations of extreme precipitation indices. Compared with station density over eastern 124
China, there are few stations over western China, where the density of population and urban 125
establishments is much lower. In particular no stations are found over the northwestern part of the 126
Tibetan Plateau, a region largely uninhabited [Xu et al., 2009]. Thus, the TP can be divided into 127
northwestern (NW) and southeastern (SE) regions using the mean annual isohyet of 400 mm 128
(Figure 1 top left). 129
Monthly mean precipitation rates from NCEP1 and NCEP2 reanalyses are provided by 130
NOAA/OAR/ESRL PSD, Boulder, Colorado, USA. The short-term precipitation rate is converted 131
to monthly amount NCEP1 and NCEP2 start from January 1948 and January 1979 respectively, 132
7
and both have a spatial resolution of 2.5°×2.5° [Kalnay et al., 1996; Kistler et al., 2001]. Monthly 133
mean precipitation rates (mm/day) were converted to mm/month. Both NCEP1 and NCEP2 134
precipitation reanalyses use intermittent data assimilation based on a T62 model with 28 vertical 135
sigma levels and the Operational Statistical Interpolation (SSI) procedure [Serreze and Hurst, 136
2000]. Convective and large-scale precipitation are computed separately. The convection scheme 137
has been shown to improve precipitation simulations over the Continental United States and in the 138
tropics, and the large-scale precipitation is parameterized using a top-down approach with 139
checking for super-saturation [Kalnay et al., 1996]. Both NCEP1 and NCEP2 have produced 140
realistic precipitation in high latitudes over both Asia and North America [Kistler et al., 2001]. 141
They have the same spatial and temporal resolution, but NCEP2 (after 1979) uses an improved 142
assimilation procedure based on 4D-variational assimilation. Additional errors in NCEP1 143
including the issue of Southern Hemisphere bogus data (1979-1992) and errors in snow cover 144
(1974-1994) have been fixed in NCEP2 [Kanamitsu et al., 2002]. 145
CMAP contains a collection of precipitation datasets with a spatial resolution of 2.5°×2.5°, 146
constructed from gauge data and satellite-derived estimates [Xie and Arkin, 1997]. CMAP1 147
merges gauge observations and satellite estimates without NCEP/NCAR reanalysis, but CMAP2 148
also includes a reanalysis component [Xie and Arkin, 1997]. Gauge observations contain 149
precipitation distributions with full global coverage and improved quality. Satellite estimates are 150
obtained through combining the Geostationary Operational Environmental Satellite (GOES) 151
Precipitation Index (GPI); an outgoing longwave radiation (OLR)-based Precipitation Index (OPI); 152
a Special Sensor Microwave/Imager (SSM/I) scattering index; and Microwave Sounding Unit 153
(MSU) [Xie and Arkin, 1997]. Therefore both CMAP1 and CMAP2 are dependent on the amount 154
8
of gauge data and the accuracy of satellite estimates (best in the tropics and weakest in the polar 155
regions). However past study has demonstrated their use in climate analysis, numerical model 156
validation and hydrological research [Xie and Arkin, 1997]. 157
The monthly mean surface precipitation in ERA-40 reanalysis is obtained from ECMWF, 158
available from September 1957 to August 2002 with a spatial resolution of 2.5°×2.5° [Uppala, et 159
al., 2005]. This is based on a fixed intermittent data assimilation scheme. The forecast model has a 160
horizontal resolution of T106 with 31 vertical levels and uses three-dimensional semi-Lagrangian 161
advection. An intermittent statistical optimal interpolation is used in ERA-40 precipitation output 162
which requires model initialization [Serreze and Hurst, 2000]. ERA-40 calculates liquid 163
precipitation and snowfall separately, and convective and large-scale precipitation are added to 164
produce total precipitation [Ma et al., 2009]. 165
The newer ECMWF reanalysis ERA-Interim [Dee et al., 2011] has improved correction of 166
satellite observations and the more recent ECMWF model is used for the period since 1979 with a 167
spatial resolution of 1.5°×1.5°. Many have concluded that ERA-Interim yields much more realistic 168
results, with significant improvements in the global hydrological cycle [Betts et al., 2009]. 169
GPCP is the result of an international project of the WMO/WCRP/GEWEX designed to 170
provide improved long-record estimates of precipitation over the globe. The monthly dataset at 171
2.5° resolution from 1979 to present incorporates estimates from low-orbit satellite microwave 172
data, geosynchronous-orbit satellite infrared data, and surface rain gauge observations [Adler et al., 173
2003; Huffman et al., 1997]. The final merged product incorporates the advantages of each data 174
type, and removes bias in a stepwise approach. GPCP has been applied to validate climate models, 175

9
model-based reanalyses, calibrate hydrological models, and has been compared with experimental 176
precipitation estimation techniques [Adler et al., 2003; Huffman et al., 1997]. 177
Reanalysis of 20century is based on objectively-analyzed four-dimensional weather maps 178
from 1871-2011, including uncertainty estimates. An ensemble filter is used to assimilate surface 179
pressure reports and uses observed monthly sea-surface temperature and sea-ice distributions as 180
boundary conditions [Compo et al., 2011]. It is also a valuable resource to the climate research 181
community for both model validation and diagnostic studies. 182
MERRA has been produced by NASA’s Global Modeling and Assimilation Office with two 183
primary objectives: (1) to place observations from NASA’s Earth Observing System satellites into 184
a climate context and (2) to improve hydrological cycle representations in earlier generations of 185
reanalyses [Rienecker et al., 2011]. Focusing on the satellite era from 1979 to the present, 186
MERRA claims significant improvements in precipitation and water vapor climatology compared 187
with older reanalyses, providing vertical integrals and analysis of increment fields for the closure 188
of atmospheric budgets [Rienecker et al., 2011]. 189
Finally, CFSR produced at NCEP covers the period from 1979 to the present, which is 190
considerably more accurate than the previous global reanalysis made at NCEP [Saha et al., 2010]. 191
Meanwhile, it is more comprehensive because it includes analyses of both the ocean and sea ice, 192
and has higher resolution in space and time [Saha et al., 2010]. Similar to ERA-Interim, these 193
latest reanalysis systems (20century, MERRA and CFSR) are more advanced than the earlier 194
versions. Meanwhile, these reanalyses provide higher spatial resolution and yield more detailed 195
climate features at small scales [Zhang et al., 2013]. 196
10
All of these 10 datasets are compared with the observational dataset over the TP region. The 197
domain covers the area from 25°N-40°N and 86°E-105°E. Table 1 provides a summary of critical 198
features of each dataset. A comparable period of 1979-2001 is selected for all analyses. 199
2.2 Methods 200
To quantify similarities and differences between the observations and the other datasets, a 201
Taylor diagram [Taylor, 2001] is employed to facilitate comparisons. This provides a concise 202
statistical summary of how well each dataset matches the observations in terms of their correlation 203
coefficient (R), their root-mean-square difference (RMSD), and the ratio of their standard 204
deviations [Taylor, 2001]. 205
All datasets are converted to a common 2.5°×2.5° longitude-latitude grid using an 206
interpolation scheme present in Climate Data Operators (CDO) software. 207
The Mann-Kendall test for a trend and Sen’s slope estimates were used to detect and quantify 208
trends in annual and seasonal precipitation [Sen, 1968]. A trend is considered to be statistically 209
significant at p<0.05. 210
211
3. Results 212
3.1 Annual precipitation climatology and trends: A comparison of multiple 213
datasets 214
The spatial pattern of mean annual precipitation derived from high resolution gridded 215
observations (Figure 1a – top left) is broadly similar to studies based on individual stations [You et 216
al., 2012]: mean annual precipitation decreases gradually from southeast to northwest. The TP can 217
be divided into northwestern (NW) and southeastern (SE) areas using the isohyet of 400 mm 218
11
which represents the boundary between semi-arid and semi-humid regions. The dry NW TP is 219
dominated by the westerlies for almost the whole year whereas monsoon precipitation-producing 220
weather systems increase annual precipitation to over 1200 mm in the SE region (Figure 1a). 221
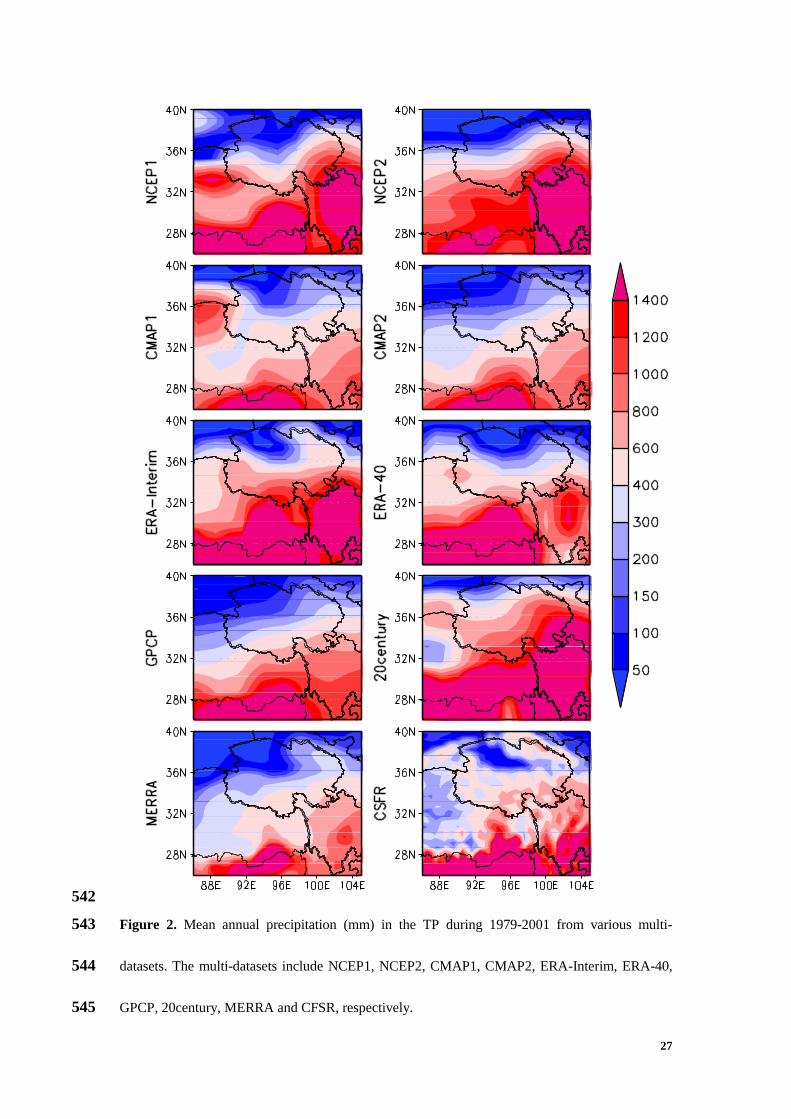
In most cases, the spatial patterns of mean annual precipitation derived from the multi-222
datasets (Figure 2) are quite similar to the gridded-observations, increasing gradually from NW to 223
SE. However, the more subtle patterns are sometimes different. Some datasets (e.g. ERA-40 and 224
GPCP), show the highest precipitation in the south-west of the region (as opposed to the south-225
east) and longitudinal contrasts in precipitation are less consistent between datasets than latitudinal 226
ones. Most multi-datasets, with the exception of CMAP2 and MERRA, tend to overestimate mean 227
annual values, particularly in the south of the region. 228
Spatial trends during 1979-2001 for all the multi-datasets are compared in Figure 3. Patterns 229
show more small-scale spatial variance than the mean precipitation field. For the observations 230
(refer back to Figure 1b, top right panel) increasing trends occur in parts of the south and east 231
with weak drying over northern regions. This pattern is most closely replicated by CMAP1 and 232
CMAP2 but NCEP2 and CFSR also show similarities. Other datasets show widely divergent 233
trend maps. NCEP1 and MERRA have widespread negative trends which do not fit in with the 234
observations. ERA-Interim and ERA-40 show lots of local scale variance in trends, with areas of 235
drying and wetting in close proximity. 236
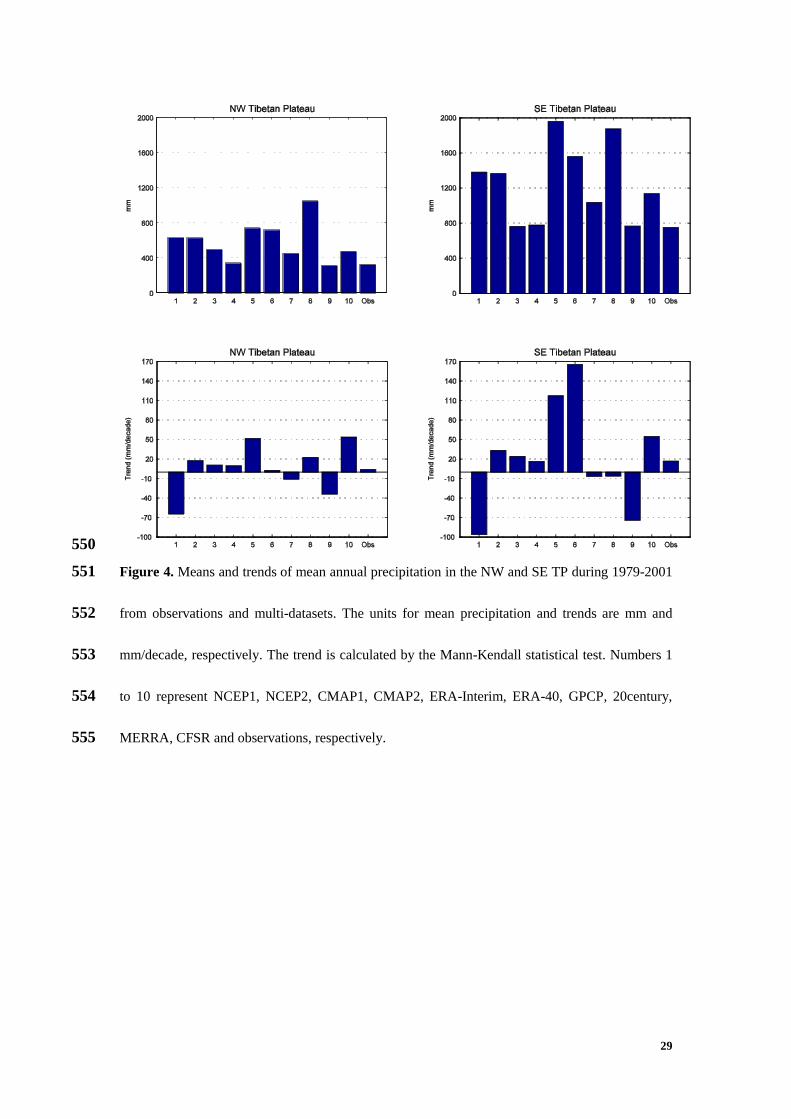
These differences are summarized in Figure 4 for the two sub-regions of the plateau 237
identified earlier (NW and SE). The mean annual precipitation in the NW and SE from 238
observations is 324.3 mm and 751.2 mm, respectively (Figure 4 and also Figures 1c and 1d), with 239
the largest contribution in summer. Mean figures for the NW region for other datasets range from 240
12
312.9 mm (MERRA) to 1049.5 mm (20century) but in most cases figures are over-estimates. The 241
same is true in the SE region where ERA-Interim estimates a mean precipitation of nearly 2000 242
mm. The contrasts in overestimation between datasets are broadly consistent in both regions. 243
CMAP1, CMAP2 and MERRA appear closest to the observations. Trends from observations for 244
the NW and SE TP are +3.99 mm/decade and +16.84 mm/decade, respectively (Figure 4c and d), 245
broadly consistent with previous studies [Z X Xu et al., 2008; You et al., 2012]. Trends in 246
precipitation from NCEP1 and MERRA in particular are strongly negative, and fail to match the 247
wetting shown in the observations. However ERA-Interim, ERA-40 and CFSR show the reverse 248
problem of over-prediction of wetting trends, particularly in the SE. The widely divergent trends 249
in precipitation between datasets are not to be ignored and require further investigation. 250
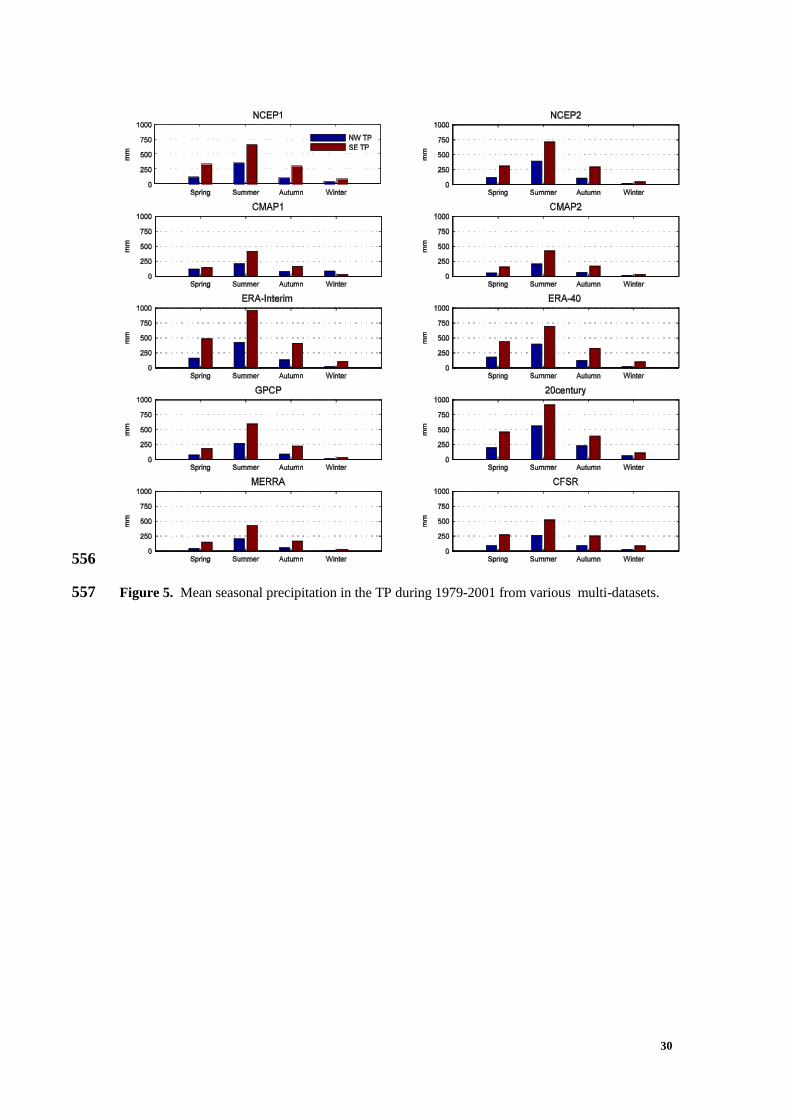
3.2 Seasonal patterns 251
Precipitation in different seasons is dominated by different climate systems, and 252
examination of each season separately may help explain some of the seasonal and regional 253
differences shown in the previous section. The mean seasonal totals for the NW and SE regions 254
for observations (Figure 1e) and each of the nine datasets (Figure 5) are shown. Meanwhile, 255
similar information expressed as a percentage of the annual total is presented in Figure 1f and 256
Figure 6. In the NW TP, most observed precipitation occurs in summer (212.4 mm, accounting for 257
65.4% of the total annual precipitation) (Figures 1e and 1f), associated with the summer monsoon. 258
Spring, autumn and winter are much drier at 42.5mm (13.1%), 59.9mm (18.5%) and 9.6 mm (3%), 259
respectively (Figure 1f). Similar to the observations, summer precipitation in all the multi-datasets 260
contributes largely to the mean annual total. The summer percentage is highest in the drier NW, 261
but still high in the humid SE. 262

13
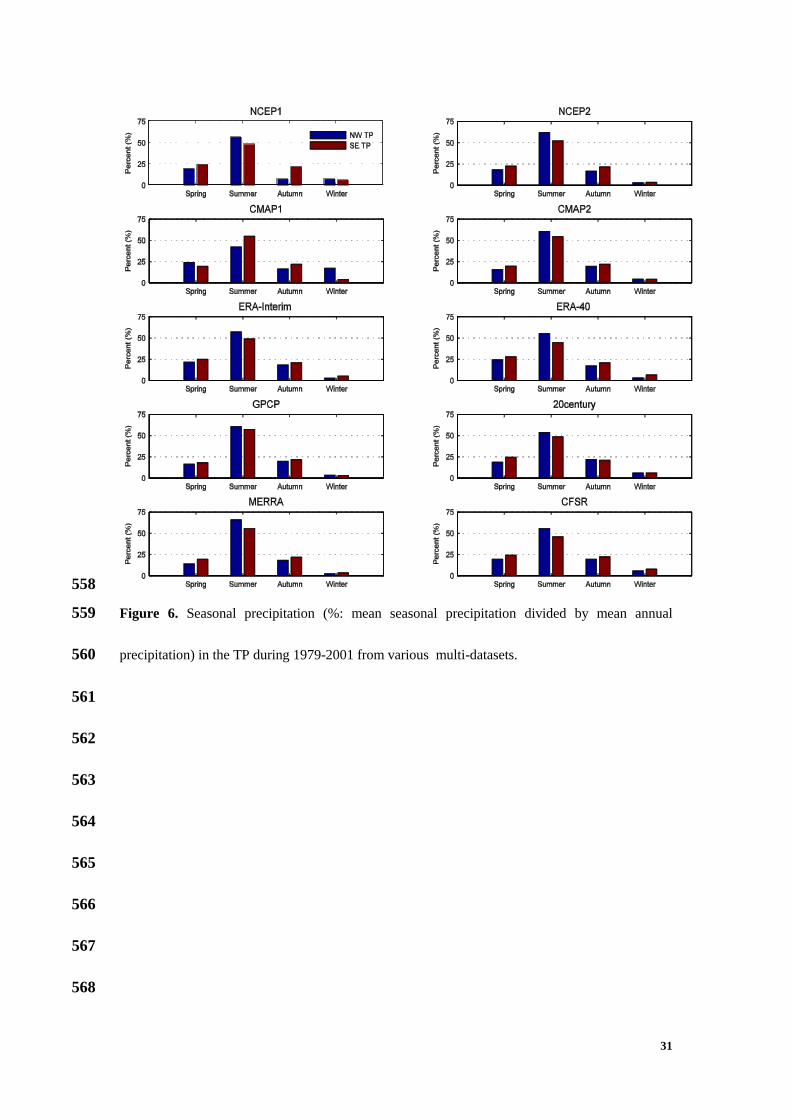
The spatial patterns of mean seasonal precipitation are quite similar to the annual maps. In 263
nearly all seasons most precipitation occurs in the SE part of the plateau. Although summer totals 264
are much higher in the SE region than further NW, the percentage of precipitation which falls in 265
summer in comparison with other seasons (Figure 6) is broadly similar to the NW region. Thus, 266
although absolute amounts differ, there is relatively little difference between datasets in seasonal 267
percentages, suggesting that all of them do simulate monsoonal moisture as the main precipitation 268
source. 269
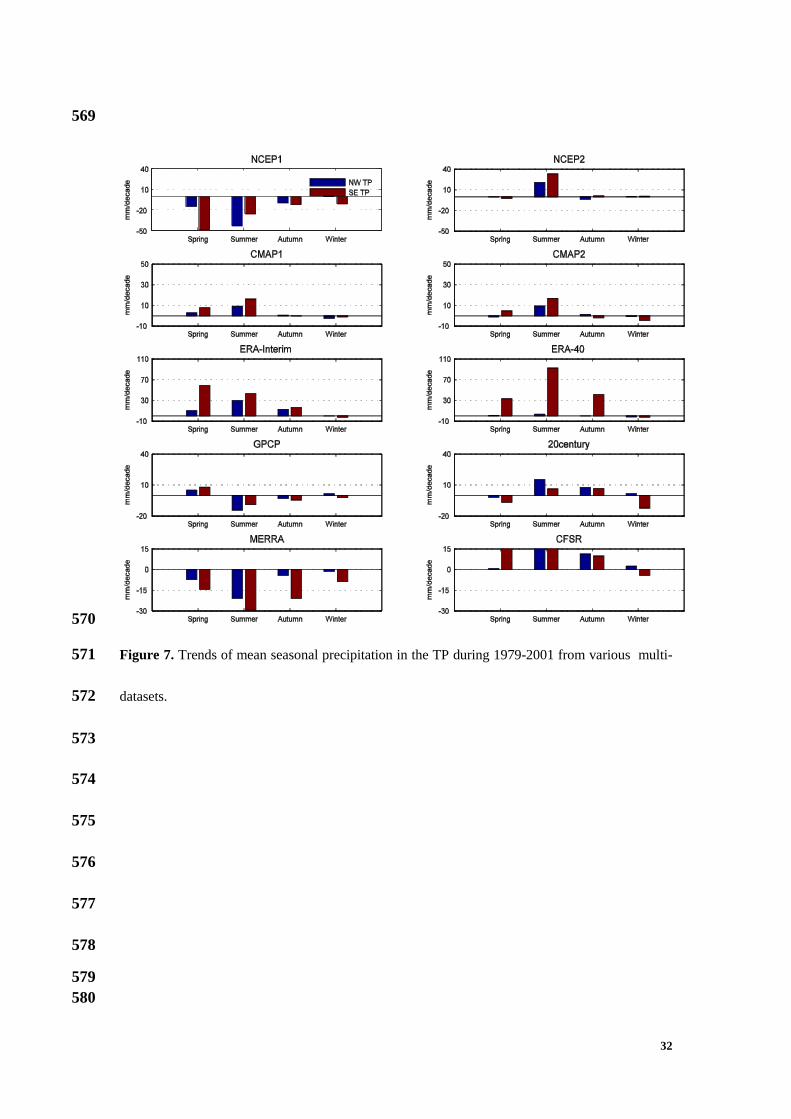
Figure 7 shows trends in mean seasonal precipitation for each dataset. Trend magnitudes are 270
larger in the SE than the NW but this is partly an artifact of higher seasonal amounts. The 271
observations do not show pronounced seasonality in trends (weak wetting in all seasons). Some 272
datasets on the other hand show pronounced drying in spring (NCEP1) or summer (MERRA), 273
while ERA-40 shows strong wetting in summer. Trends in winter are usually small in all datasets. 274
Thus the inconsistencies which exist between multi-datasets for trend analysis are probably driven 275
by differences in the simulation of monsoonal moisture. 276
3.3 Taylor diagram analysis 277
Taylor diagrams provide a concise statistical summary of how well patterns in datasets 278
match each other in terms of their correlation, root-mean-square difference (RMSD) and the ratio 279
of their variances [Taylor, 2001]. The Taylor diagrams show the correlation coefficients, standard 280
deviation, and RMSD of precipitation estimates based on a comparison between observations and 281
each multi-dataset in turn. Separate diagrams are shown for annual precipitation in the NW and SE 282
regions (Figure 8) and for each season in the NW (Figure 9) and SE (Figure 10). The radial and 283
angular coordinates represent the magnitude of standard deviation and correlation coefficients 284
14
between observed and modeled precipitation respectively. The radial distance from the origin is 285
proportional to the standard deviation between the two patterns. Each multi-dataset is represented 286
by a point on the diagram and the closer point is marked “obs”, which is the observations. 287
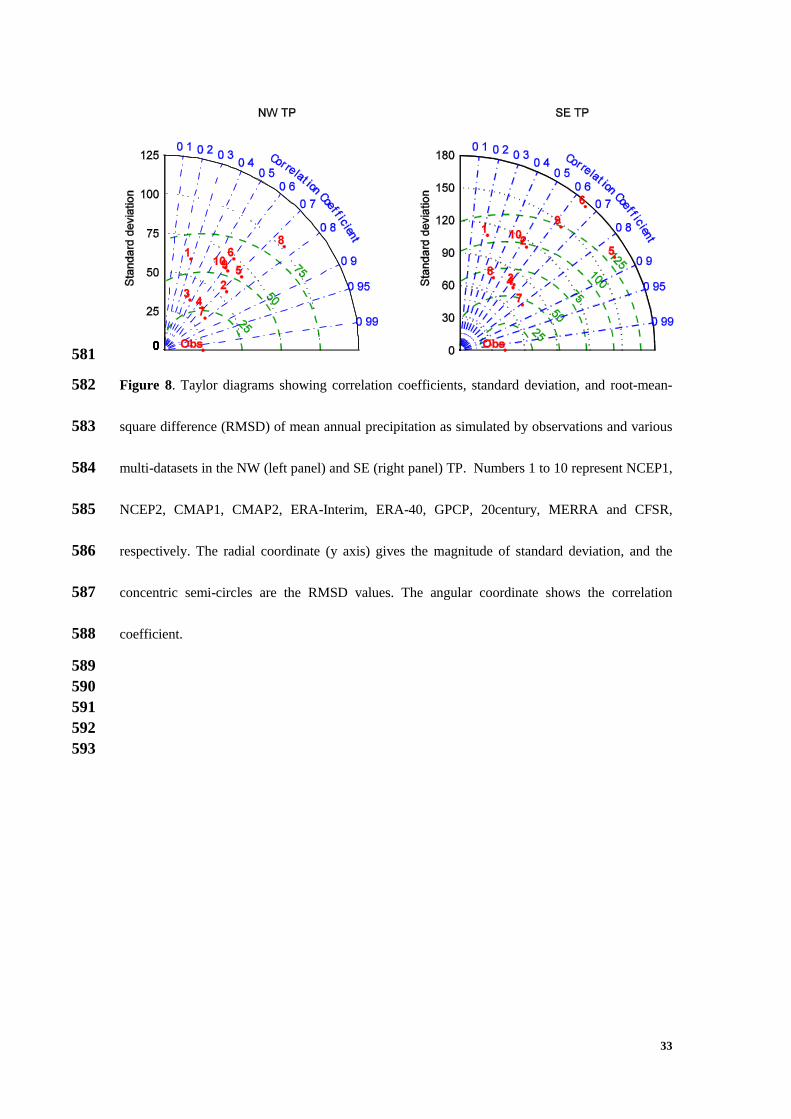
On an annual basis, most multi-datasets are closer to the observations in the NW rather than 288
the SE TP. This is particularly marked for GPCP, CMAP1 and CMAP2 (Figure 8 right column). 289
The Taylor figure clearly shows which multi-datasets perform relatively well and have higher 290
correlation coefficients with the observations (e.g. 20century, ERA-Interim, NCEP2 and GPCP 291
in the NW; ERA-Interim and GPCP in the SE). The smallest RMSD is found in GPCP. 292
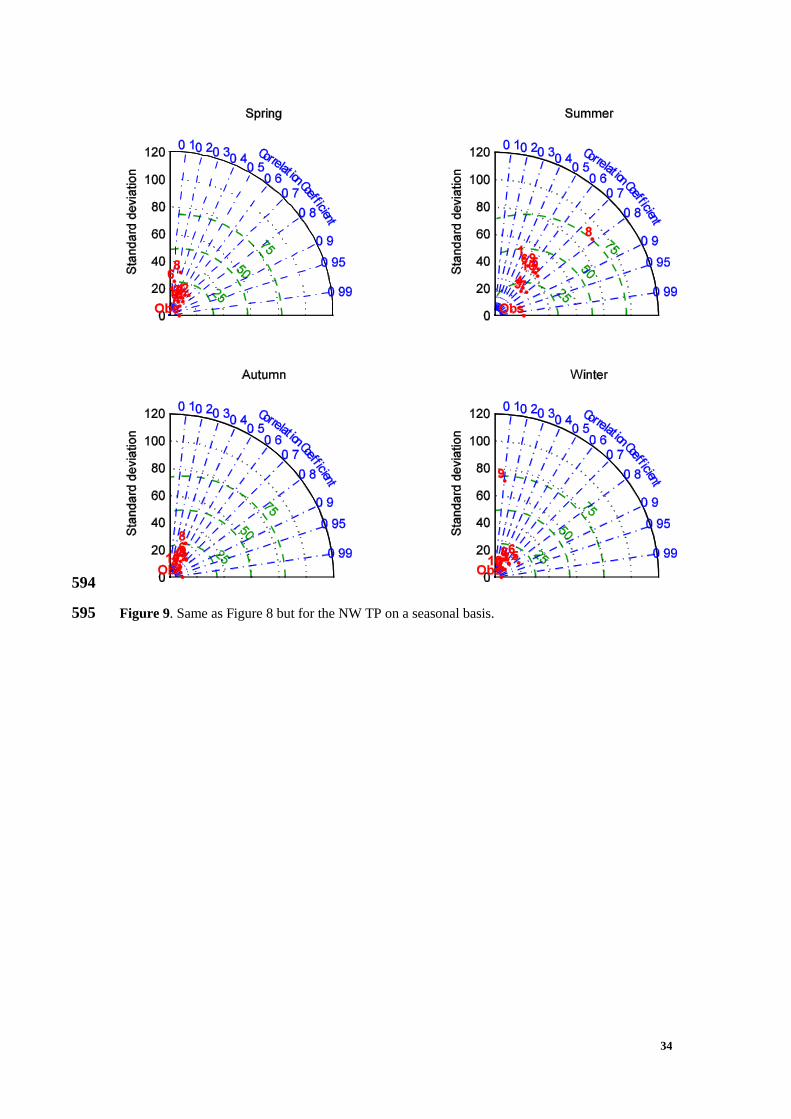
The Taylor diagrams on a seasonal basis for the NW region (Figure 9) show the largest 293
RMSD in summer (Figure 9b) and smaller differences in other seasons. GPCP seems closest to 294
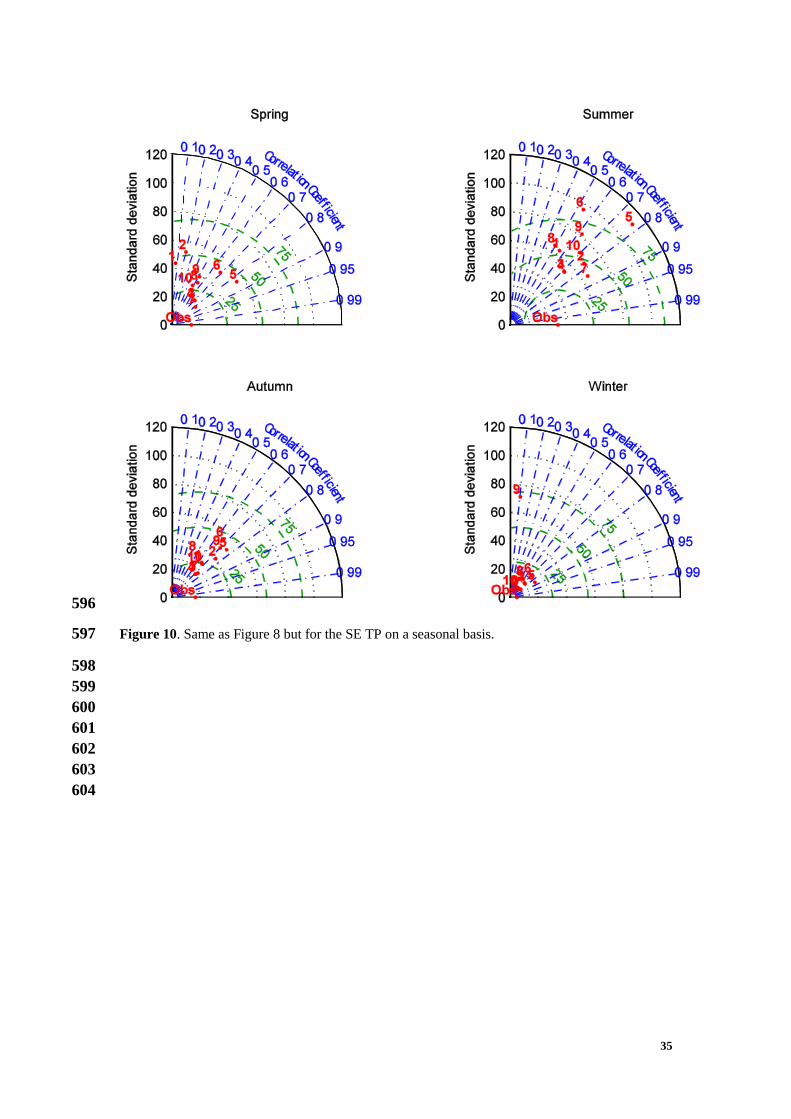
observations in the summer. In the SE region (Figure 10) the smallest RMSD in summer again 295
occurs for GPCP. In other seasons differences between datasets are small. The main results 296
represented in Figure 10 are very similar to those on the annual basis, with summer contributing 297
mostly to differences between modeled and observed precipitation. 298
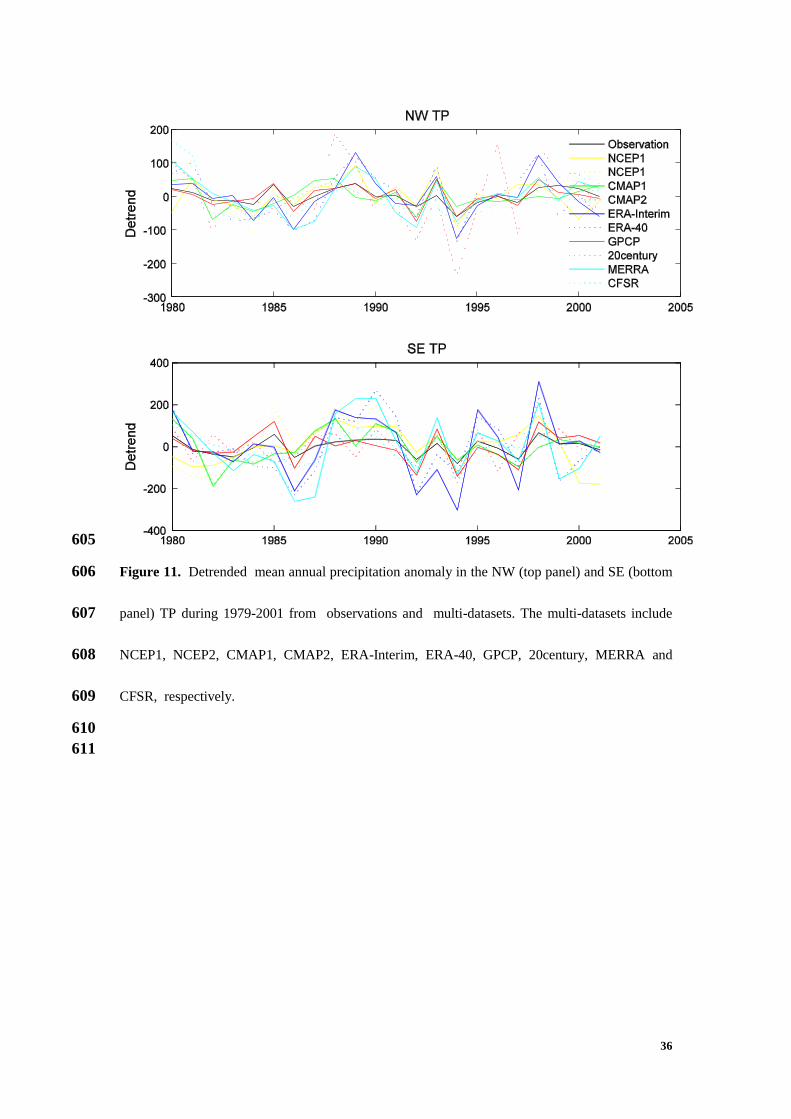
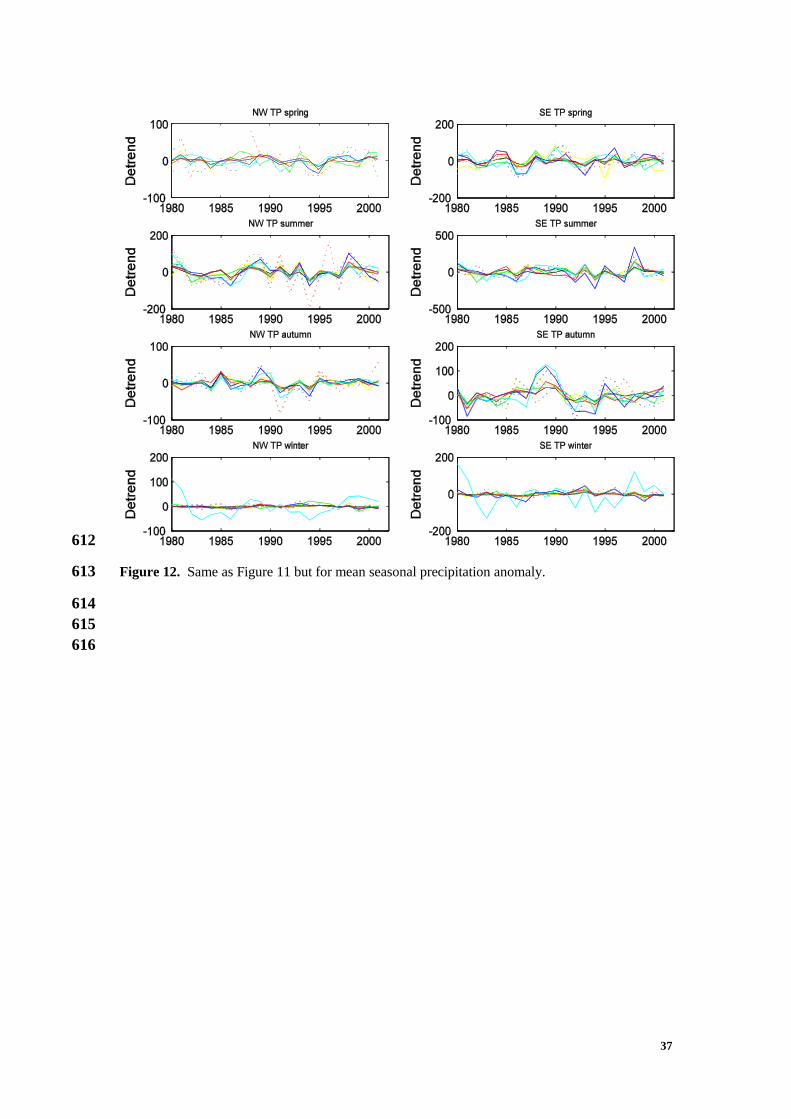
Much of the difference between multi-data sets and observations has been shown to be in 299
the ways in which they derive temporal trends. The process of removing the effects of a trend 300
(de-trending) allows only short-term fluctuations in precipitation to dominate the variance 301
(Figures 11 and 12). These figures show only the absolute changes in mean annual and seasonal 302
precipitation values respectively, and identify both cyclical patterns and major turning points. 303
These are shown to be similar in most datasets but with enhanced variance in ERA-Interim, 304
particularly in the SE region (Figure 11b and Figure 12 right hand column). Thus inter-annual 305
fluctuations are captured well by most datasets, even if trends are not. The most successful 306
15
datasets are different in each region and each season, and there is no one dataset which is 307
obviously the “best”. Most multi-datasets can capture the distributions of mean precipitation 308
fairly well but not necessarily trends. 309
310
4. Discussion and Conclusions 311
Spatial and temporal distributions of mean precipitation in the TP during 1979-2001 based 312
on a gridded-observation dataset with high resolution (0.25°×0.25°) have been examined [Wu 313
and Gao, 2013; Xu et al., 2009]. Mean annual precipitation increases from NW to SE, and 314
seasonal patterns are broadly similar in both regions. Most precipitation falls in summer [You et 315
al., 2012]. Trends estimated by the Mann-Kendall test [Sen, 1968] show that precipitation in all 316
seasons in both NW and SE regions has been increasing with a rate of 3.99 mm/decade in the 317
NW and 16.84 mm/decade in the SE, respectively. 318
Comparison of precipitation between observations and numerous multi-datasets (reanalyses: 319
NCEP1, NCEP2, ERA-Interim, ERA-40, 20century, MERRA and CFSR, merged analyses: 320
CMAP1, CMAP2 and GPCP) has been performed in the TP during 1979-2001. These multi-321
datasets capture the broad distributions of mean precipitation, but there exist discrepancies for 322
trends. 323
Most reanalyses (NCEP1, NCEP2, ERA-Interim, ERA-40, 20century, MERRA and CFSR) 324
overestimate precipitation, particularly in the SE region but MERRA is much closer to the 325
observations for mean precipitation. 20century has particularly large discrepancies. Compared 326
with NCEP1, NCEP2 shows slightly better agreement with observations possibly because NCEP2 327
incorporates new system components such as simple precipitation assimilation over land surfaces 328
16
for improved soil wetness [Kanamitsu et al., 2002]. This result is consistent with other findings 329
that show that the spatial patterns of NCEP2 are closer to observations than NCEP1 [Ma et al., 330
2009]. Similarly, ERA-Interim is better than ERA-40, due to improvement in aspects such as 331
reduced spin-up and drift of precipitation and some improvements in the simulation of the diurnal 332
cycle [Betts et al., 2009]. It is also noted that ERA-40 produces reasonable comparisons over the 333
Northern Hemisphere continent, but weak comparisons in the tropical oceans [Bosilovich et al., 334
2008]. 335
In recent years, several efforts have been made to improve reanalyses, such as 336
implementing a four-dimensional data assimilation system (e.g. ERA-Interim), utilizing ensemble 337
data assimilation and extending temporal resolution (e.g. 20century) and increasing the horizontal 338
and vertical resolution (e.g. MERRA and CFSR) [Zhang et al., 2013]. These efforts have 339
improved precipitation modelling to some extent, but the precipitation from reanalyses is still to 340
be treated with caution due to the complexity of the processes involved in data assimilation. 341
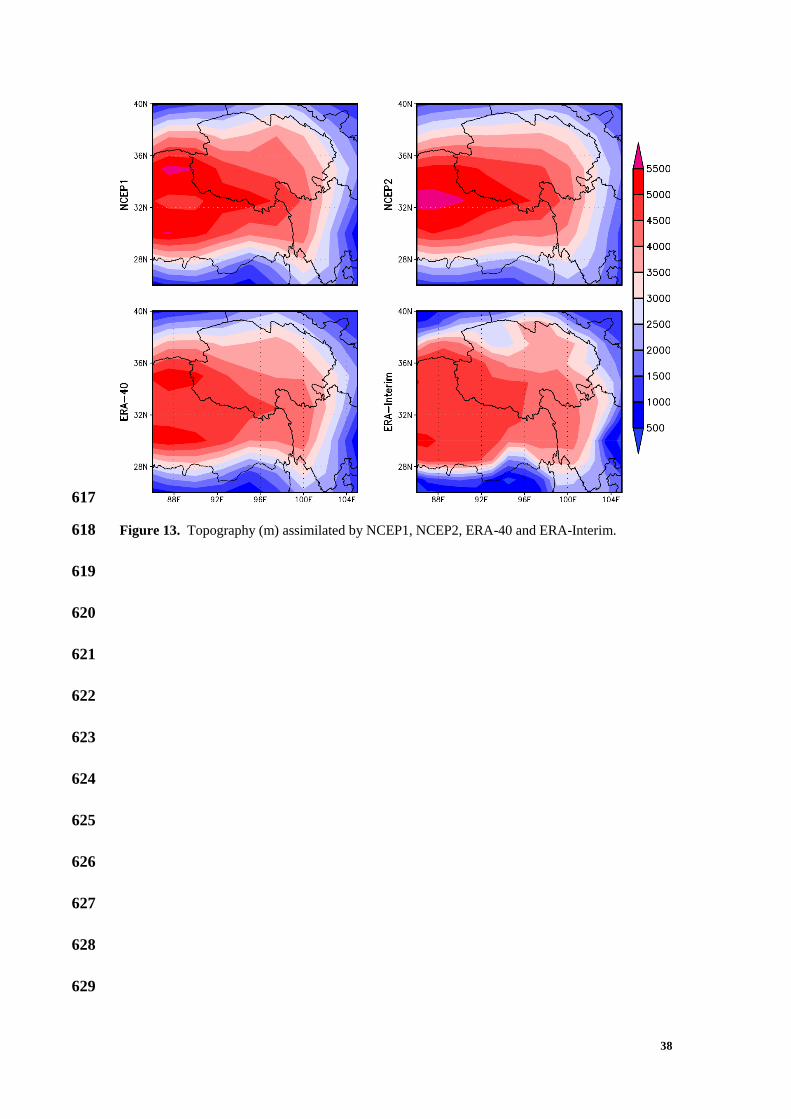
Figure 13 shows the topography assimilated by NCEP1, NCEP2, ERA-40 and ERA-Interim. 342
Because the TP is a region with sharp elevation bands and complex topography, the representation 343
of surface terrain in the reanalysis systems is still different in different reanalyses. This could 344
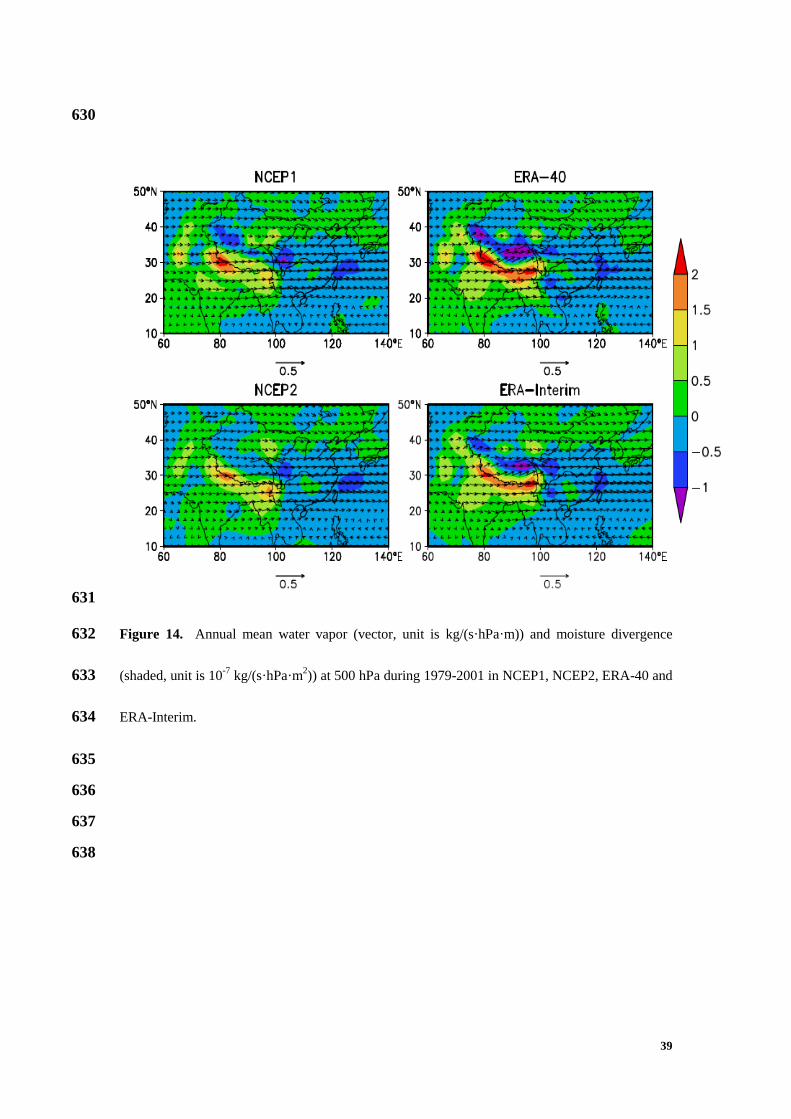
account for some of the discrepancies between them. In particular moisture convergence is 345
sensitive to small scale terrain. This is shown by differences in mean annual water vapor (vector, 346
unit is kg/(s·hPa·m)) and moisture divergence (shaded, unit is 10-7
kg/(s·hPa·m2)) at 500 hPa 347
during 1979-2001 among NCEP1, NCEP2, ERA-40 and ERA-Interim (Figure 14). 348
Most of the merged analysis datasets (CMAP1, CMAP2 and GPCP) also overestimate 349
precipitation in both regions on an annual and seasonal basis, but biases are smaller than the 350

17
reanalyses. Overestimations appear worst in regions with complex topography. CMAP2 has the 351
smallest biases, indicating the best choice for precipitation assessment. 352
Taylor diagrams are used to compare skill in precipitation modelling between multi-353
datasets. The diagrams can clearly indicate which datasets are nearest to observations. Relatively 354
low RMSD are found in CMAP2 and GPCP, suggesting that they may be used as the reference 355
standard. 356
Compared with the reanalyses (NCEP1, NCEP2, ERA-Interim, ERA-40, 20century, MERRA 357
and CFSR), CMAP1, CMAP2 and GPCP show more similar trend magnitudes to the observations 358
as well as more similar mean distributions. Thus merged analysis precipitation appears more 359
reliable than reanalyses, consistent with other studies in China [Ma et al., 2009; Zhao and Fu, 360
2006]. Over the whole of China, precipitation products from multi-datasets and observational 361
stations have been compared [Ma et al., 2009; Zhao and Fu, 2006]. This indicated that CMAP1, 362
CMAP2 and GPCP agreed more closely with the observations than reanalysis data (NCEP1, 363
NCEP2 and ERA40), and that ERA40 was more reliable than NCEP [Ma et al., 2009]. 364
Reanalysis datasets are the output of data assimilation combined with available observations 365
and a background model forecast. Thus uncertainties emerge, related to the model physical 366
parameterizations [Betts et al., 2006; Bosilovich et al., 2008]. In addition, the topography can 367
influence the bias between observations and multi-datasets due to the difference between 368
assimilated and actual topography. In China, Ma et al., [2009] suggested that the reanalyses 369
overestimation of precipitation was a more serious issue in regions with complex terrain and less 370
of a problem in flatter regions. Models may not resolve precipitation in areas of complex 371
topographic relief, especially in the regions with drastic elevation changes where moisture 372
18
convergence is often locally determined, and local convective precipitation is strongly dependent 373
upon local thermal forcing of the terrain. 374
Although the merged datasets in this study are closer to the observations than the reanalyses, 375
contrasting retrieval algorithms, input data, treatment of gauge uncertainties, and quality flags can 376
also result in differences with observations [Adler et al., 2003; Bosilovich et al., 2008; Huffman et 377
al., 2009; Huffman et al., 1997; Xie and Arkin, 1997; Yin et al., 2004]. For example, Yin et al., 378
[2004] found that GPCP and CMAP (CMAP1 and CMAP2) have less/more in common over 379
ocean/land areas, while different merging algorithms can produce a substantial discrepancy in 380
sensitive areas such as equatorial West Africa. GPCP and CMAP exhibited good agreement over 381
the Southern Hemisphere, and also over land in the Northern Hemisphere. In the tropical ocean 382
however, CMAP was wetter than GPCP, and this effect reversed over high latitude oceans [Yin et 383
al., 2004]. GPCP is planned to feature a finer time and space resolution in the near future 384
[Huffman et al., 2009], suggesting that this product is updated continually and that it should be 385
taken as a good reference for studying precipitation over the TP. Clearly the discrepancies 386
between different datasets mean that continuing attention should be paid to the selection of 387
datasets for representing precipitation in the TP region and its trends. 388
389
Acknowledgments. This study is supported by the State Key Program of National Natural 390
Science Foundation of China (41230528), National Natural Science Foundation (41201072); 391
Jiangsu Specially-Appointed Professor (R2013T07), Jiangsu Natural Science Funds for 392
Distinguished Young Scholar “BK20140047”, and the Priority Academic Program Development 393
19
of Jiangsu Higher Education Institutions (PAPD). We are very grateful to the reviewers for their 394
constructive comments and thoughtful suggestions. 395
396
Reference 397
Adler, R. F., et al. (2003), The version-2 global precipitation climatology project (GPCP) monthly 398
precipitation analysis (1979-present), Journal of Hydrometeorology, 4(6), 1147-1167. 399
Allan, R. P., and B. J. Soden (2008), Atmospheric warming and the amplification of precipitation 400
extremes, Science, 321(5895), 1481-1484. 401
Betts, A. K., M. Kohler, and Y. C. Zhang (2009), Comparison of river basin hydrometeorology in 402
ERA-Interim and ERA-40 reanalyses with observations, Journal of Geophysical Research-403
Atmospheres, 114, D02101. 404
Betts, A. K., M. Zhao, P. A. Dirmeyer, and A. C. M. Beljaars (2006), Comparison of ERA40 and 405
NCEP/DOE near-surface data sets with other ISLSCP-II data sets, Journal of Geophysical 406
Research-Atmospheres, 111, D22S04. 407
Bosilovich, M. G., J. Chen, F. R. Robertson, and R. F. Adler (2008), Evaluation of global 408
precipitation in reanalyses, Journal of Applied Meteorology and Climatology, 47(9), 2279-2299. 409
Compo, G. P., et al. (2011), The Twentieth Century Reanalysis Project, Q. J. R. Meteorol. Soc., 410
137(654), 1-28. 411
Dee, D. P., et al. (2011), The ERA-Interim reanalysis: configuration and performance of the data 412
assimilation system, Q. J. R. Meteorol. Soc., 137(656), 553-597. 413
Duan, A. M., and G. X. Wu (2005), Role of the Tibetan Plateau thermal forcing in the summer 414
climate patterns over subtropical Asia, Climate Dynamics, 24(7-8), 793-807. 415
20
Duan, A. M., G. Wu, Y. Liu, Y. Ma, and P. Zhao (2012), Weather and climate effects of the 416
Tibetan Plateau, Advances in Atmospheric Sciences, 29(5), 978-992. 417
Feng, L., and T. J. Zhou (2012), Water vapor transport for summer precipitation over the Tibetan 418
Plateau: Multidata set analysis, Journal of Geophysical Research-Atmospheres, 117, D20114. 419
Huffman, G. J., R. F. Adler, D. T. Bolvin, and G. Gu (2009), Improving the global precipitation 420
record: GPCP Version 2.1, Geophysical Research Letters, 36, L17808. 421
Huffman, G. J., R. F. Adler, P. Arkin, A. Chang, R. Ferraro, A. Gruber, J. Janowiak, A. McNab, B. 422
Rudolf, and U. Schneider (1997), The Global Precipitation Climatology Project (GPCP) 423
Combined Precipitation Dataset, Bulletin of the American Meteorological Society, 78(1), 5-20. 424
Immerzeel, W. W., L. P. H. van Beek, and M. F. P. Bierkens (2010), Climate Change Will Affect 425
the Asian Water Towers, Science, 328(5984), 1382-1385. 426
IPCC (2007), Summary for Policymakers of Climate change 2007: The Physical Science Basis. 427
Contribution of Working Group I to the Fourth Assessment Report of the Intergovernmental Panel 428
on Climate Change Cambridge, UK: Cambridge University Press. 429
IPCC (2013), Summary for Policymakers of Climate change 2013: The Physical Science Basis. 430
Contribution of Working Group I to the Fifth Assessment Report of the Intergovernmental Panel 431
on Climate Change Cambridge, UK: Cambridge University Press. 432
Joshi, M. K., and A. C. Pandey (2011), Trend and spectral analysis of rainfall over India, Journal 433
of Geophysical Research-Atmospheres, 116, D06104. 434
Kalnay, E., et al. (1996), The NCEP/NCAR 40-year reanalysis project, Bulletin of the American 435
Meteorological Society, 77(3), 437-471. 436

21
Kanamitsu, M., W. Ebisuzaki, J. Woollen, S. K. Yang, J. J. Hnilo, M. Fiorino, and G. L. Potter 437
(2002), NCEP-DOE AMIP-II reanalysis (R-2), Bulletin of the American Meteorological Society, 438
83(11), 1631-1643. 439
Kang, S. C., Y. W. Xu, Q. L. You, W. A. Flugel, N. Pepin, and T. D. Yao (2010), Review of 440
climate and cryospheric change in the Tibetan Plateau, Environ. Res. Lett., 5(1), 015101. 441
Kistler, R., et al. (2001), The NCEP-NCAR 50-year reanalysis: Monthly means CD-ROM and 442
documentation, Bulletin of the American Meteorological Society, 82(2), 247-267. 443
Liu, X. D., and Z. Y. Yin (2001), Spatial and temporal variation of summer precipitation over the 444
eastern Tibetan Plateau and the North Atlantic oscillation, J. Clim., 14(13), 2896-2909. 445
Ma, L. J., T. Zhang, O. W. Frauenfeld, B. S. Ye, D. Q. Yang, and D. H. Qin (2009), Evaluation of 446
precipitation from the ERA-40, NCEP-1, and NCEP-2 Reanalyses and CMAP-1, CMAP-2, and 447
GPCP-2 with ground-based measurements in China, Journal of Geophysical Research-448
Atmospheres, 114, D09105. 449
New, M., D. Lister, M. Hulme, and I. Makin (2002), A high-resolution data set of surface climate 450
over global land areas, Climate Research, 21, 1-25. 451
Ohmura, A., and M. Wild (2002), Is the hydrological cycle accelerating?, Science, 298(5597), 452
1345-1346. 453
Qiu, J. (2008), The third pole, Nature, 454(7203), 393-396. 454
Rienecker, M. M., et al. (2011), MERRA: NASA's Modern-Era Retrospective Analysis for 455
Research and Applications, J. Clim., 24(14), 3624-3648. 456
Saha, S., et al. (2010), The NCEP Climate Forecast System Reanalysis, Bulletin of the American 457
Meteorological Society, 91(8), 1015-1057. 458

22
Sen, P. K. (1968), Estimates of regression coefficient based on Kendall's tau, Journal of the 459
American Statistical Association, 63, 1379-1389. 460
Serreze, M. C., and C. M. Hurst (2000), Representation of mean Arctic precipitation from NCEP-461
NCAR and ERA reanalyses, J. Clim., 13(1), 182-201. 462
Taylor, K. E. (2001), Summarizing multiple aspects of model performance in a single diagram, 463
Journal of Geophysical Research-Atmospheres, 106(D7), 7183-7192. 464
Trenberth, K. E. (2011), Changes in precipitation with climate change, Climate Research, 47(1-2), 465
123-138. 466
Trenberth, K. E., and C. J. Guillemot (1998), Evaluation of the atmospheric moisture and 467
hydrological cycle in the NCEP/NCAR reanalyses, Climate Dynamics, 14(3), 213-231. 468
Uppala, S. M., et al. (2005), The ERA-40 re-analysis, Q. J. R. Meteorol. Soc., 131(612), 2961-469
3012. 470
Wu, J., and X. J. Gao (2013), A gridded daily observation dataset over China region and 471
comparison with the other datasets, Chinese Journal of Geophysics, 56(4), 1102-1111. 472
Xie, P. P., and P. A. Arkin (1997), Global precipitation: A 17-year monthly analysis based on 473
gauge observations, satellite estimates, and numerical model outputs, Bulletin of the American 474
Meteorological Society, 78(11), 2539-2558. 475
Xu, X. D., C. G. Lu, X. H. Shi, and S. T. Gao (2008), World water tower: An atmospheric 476
perspective, Geophysical Research Letters, 35(20), L20815. 477
Xu, Y., X. J. Gao, S. Y. Yan, C. H. Xu, Y. Shi, and F. Giorgi (2009), A daily temperature dataset 478
over China and its application in validating a RCM simulation, Advances in Atmospheric Sciences, 479
26(4), 763-772. 480
23
Xu, Z. X., T. L. Gong, and J. Y. Li (2008), Decadal trend of climate in the Tibetan Plateau - 481
regional temperature and precipitation, Hydrological Processes, 22(16), 3056-3065. 482
Yang, K., B. S. Ye, D. G. Zhou, B. Y. Wu, T. Foken, J. Qin, and Z. Y. Zhou (2011), Response of 483
hydrological cycle to recent climate changes in the Tibetan Plateau, Climatic Change, 109(3-4), 484
517-534. 485
Yeh, T. C., and Y. X. Gao (1979), Meteorology of the Qinghai-Xizang (Tibet) Plateau (in 486
Chinese), Science Press, Beijing. 487
Yin, X. G., A. Gruber, and P. Arkin (2004), Comparison of the GPCP and CMAP merged gauge-488
satellite monthly precipitation products for the period 1979-2001, Journal of Hydrometeorology, 489
5(6), 1207-1222. 490
You, Q. L., K. Fraedrich, G. Y. Ren, B. S. Ye, X. H. Meng, and S. C. Kang (2012), 491
Inconsistencies of precipitation in the eastern and central Tibetan Plateau between surface adjusted 492
data and reanalysis, Theoretical and Applied Climatology, 109, 485-496. 493
Zhang, Q., H. Kornich, and K. Holmgren (2013), How well do reanalyses represent the southern 494
African precipitation?, Climate Dynamics, 40, 951-962. 495
Zhao, T., and C. Fu (2006), Comparison of products from ERA-40, NCEP-2, and CRU with 496
station data for summer precipitation over China, Advances in Atmospheric Sciences, 23(4), 593-497
604. 498
499
500
501
502
24
Table 503
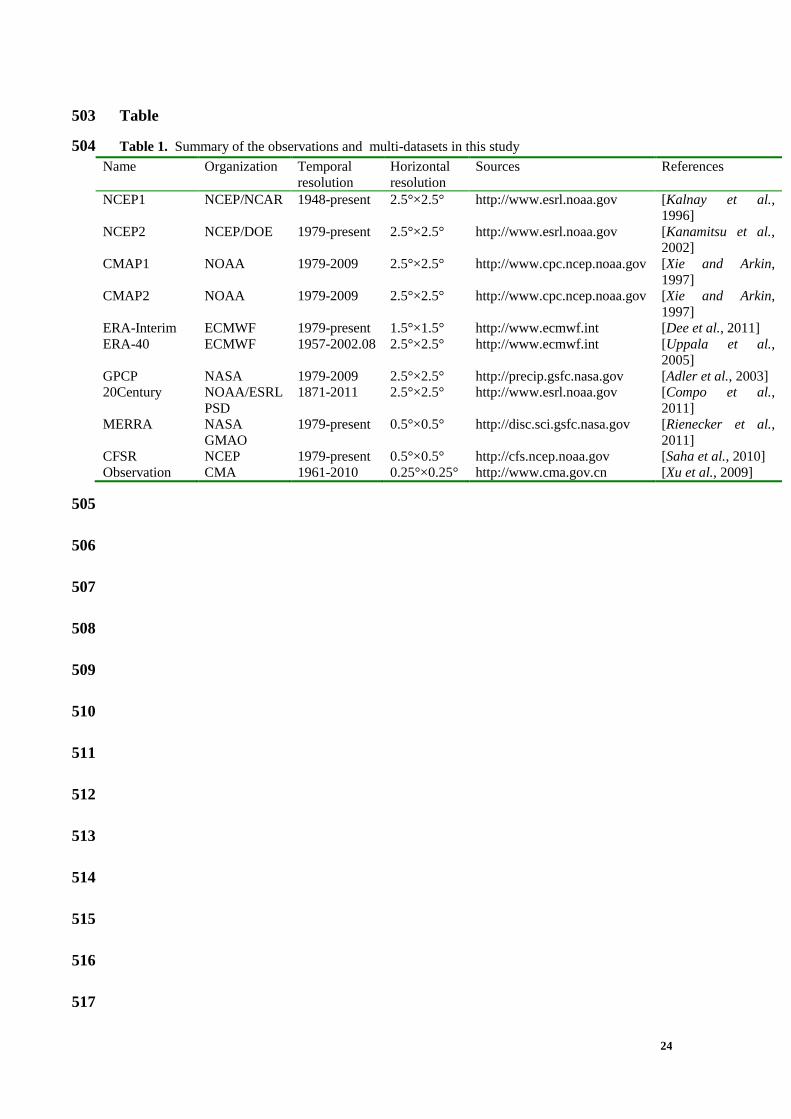
Table 1. Summary of the observations and multi-datasets in this study 504
Name Organization Temporal
resolution
Horizontal
resolution
Sources References
NCEP1 NCEP/NCAR 1948-present 2.5°×2.5° http://www.esrl.noaa.gov [Kalnay et al., 1996]
NCEP2 NCEP/DOE 1979-present 2.5°×2.5° http://www.esrl.noaa.gov [Kanamitsu et al., 2002]
CMAP1 NOAA 1979-2009 2.5°×2.5° http://www.cpc.ncep.noaa.gov [Xie and Arkin,
1997]
CMAP2 NOAA 1979-2009 2.5°×2.5° http://www.cpc.ncep.noaa.gov [Xie and Arkin,
1997]
ERA-Interim ECMWF 1979-present 1.5°×1.5° http://www.ecmwf.int [Dee et al., 2011]
ERA-40 ECMWF 1957-2002.08 2.5°×2.5° http://www.ecmwf.int [Uppala et al., 2005]
GPCP NASA 1979-2009 2.5°×2.5° http://precip.gsfc.nasa.gov [Adler et al., 2003]
20Century NOAA/ESRL
PSD
1871-2011 2.5°×2.5° http://www.esrl.noaa.gov [Compo et al.,
2011]
MERRA NASA
GMAO
1979-present 0.5°×0.5° http://disc.sci.gsfc.nasa.gov [Rienecker et al.,
2011]
CFSR NCEP 1979-present 0.5°×0.5° http://cfs.ncep.noaa.gov [Saha et al., 2010]
Observation CMA 1961-2010 0.25°×0.25° http://www.cma.gov.cn [Xu et al., 2009]
505
506
507
508
509
510
511
512
513
514
515
516
517
25
Figure 518
a
b
c
d
e
f
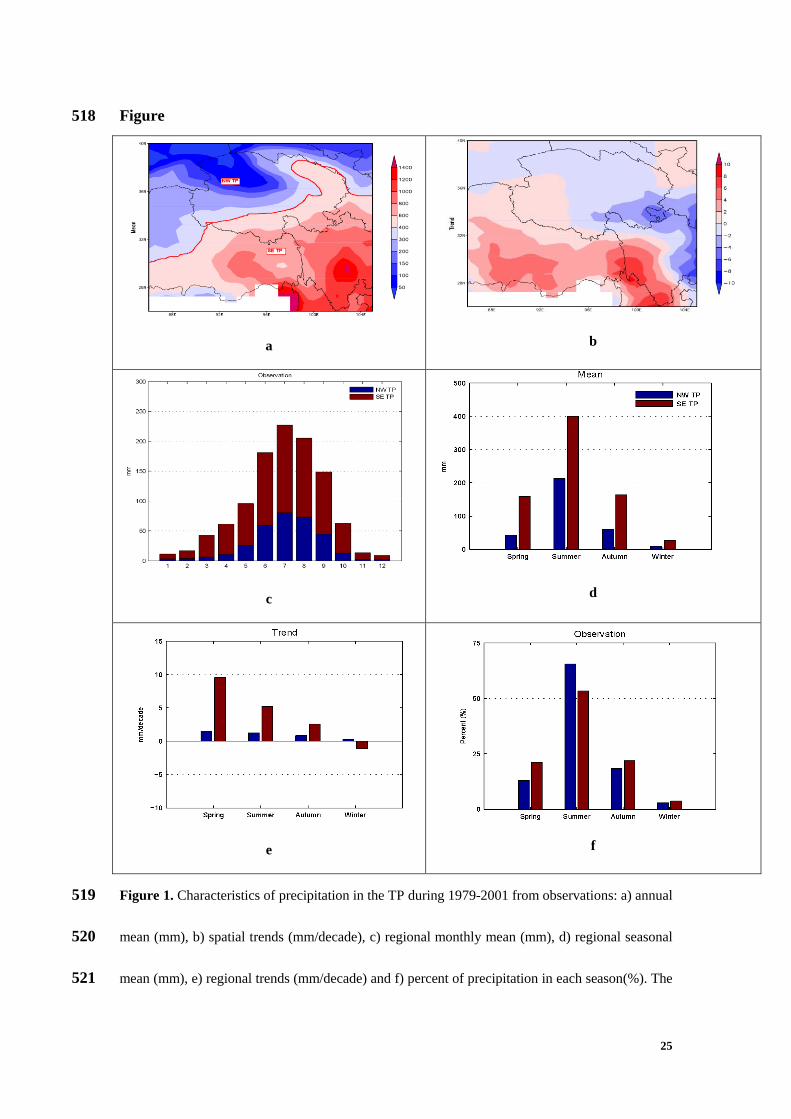
Figure 1. Characteristics of precipitation in the TP during 1979-2001 from observations: a) annual 519
mean (mm), b) spatial trends (mm/decade), c) regional monthly mean (mm), d) regional seasonal 520
mean (mm), e) regional trends (mm/decade) and f) percent of precipitation in each season(%). The 521

26
whole TP is divided into northwestern (NW) and southeastern (SE) regions by the red isohyet of 522
400 mm, representing the boundary between semi-arid and semi-humid regions. 523
524
525
526
527
528
529
530
531
532
533
534
535
536
537
538
539
540
541
27
542
Figure 2. Mean annual precipitation (mm) in the TP during 1979-2001 from various multi-543
datasets. The multi-datasets include NCEP1, NCEP2, CMAP1, CMAP2, ERA-Interim, ERA-40, 544
GPCP, 20century, MERRA and CFSR, respectively. 545

28
546
Figure 3. Spatial patterns of trends (mm/decade) of mean annual precipitation in the TP during 547
1979-2001 from various multi-datasets (same as Figure 2). Trends are calculated by the Mann-548
Kendall test. 549
29
550
Figure 4. Means and trends of mean annual precipitation in the NW and SE TP during 1979-2001 551
from observations and multi-datasets. The units for mean precipitation and trends are mm and 552
mm/decade, respectively. The trend is calculated by the Mann-Kendall statistical test. Numbers 1 553
to 10 represent NCEP1, NCEP2, CMAP1, CMAP2, ERA-Interim, ERA-40, GPCP, 20century, 554
MERRA, CFSR and observations, respectively. 555
30
556
Figure 5. Mean seasonal precipitation in the TP during 1979-2001 from various multi-datasets. 557
31
558
Figure 6. Seasonal precipitation (%: mean seasonal precipitation divided by mean annual 559
precipitation) in the TP during 1979-2001 from various multi-datasets. 560
561
562
563
564
565
566
567
568
32
569
570
Figure 7. Trends of mean seasonal precipitation in the TP during 1979-2001 from various multi-571
datasets. 572
573
574
575
576
577
578
579
580
33
581
Figure 8. Taylor diagrams showing correlation coefficients, standard deviation, and root-mean-582
square difference (RMSD) of mean annual precipitation as simulated by observations and various 583
multi-datasets in the NW (left panel) and SE (right panel) TP. Numbers 1 to 10 represent NCEP1, 584
NCEP2, CMAP1, CMAP2, ERA-Interim, ERA-40, GPCP, 20century, MERRA and CFSR, 585
respectively. The radial coordinate (y axis) gives the magnitude of standard deviation, and the 586
concentric semi-circles are the RMSD values. The angular coordinate shows the correlation 587
coefficient. 588
589
590
591
592
593
34
594
Figure 9. Same as Figure 8 but for the NW TP on a seasonal basis. 595
35
596
Figure 10. Same as Figure 8 but for the SE TP on a seasonal basis. 597
598
599
600
601
602
603
604
36
605
Figure 11. Detrended mean annual precipitation anomaly in the NW (top panel) and SE (bottom 606
panel) TP during 1979-2001 from observations and multi-datasets. The multi-datasets include 607
NCEP1, NCEP2, CMAP1, CMAP2, ERA-Interim, ERA-40, GPCP, 20century, MERRA and 608
CFSR, respectively. 609
610
611
37
612
Figure 12. Same as Figure 11 but for mean seasonal precipitation anomaly. 613
614
615
616
38
617
Figure 13. Topography (m) assimilated by NCEP1, NCEP2, ERA-40 and ERA-Interim. 618
619
620
621
622
623
624
625
626
627
628
629
39
630
631
Figure 14. Annual mean water vapor (vector, unit is kg/(s·hPa·m)) and moisture divergence 632
(shaded, unit is 10-7
kg/(s·hPa·m2)) at 500 hPa during 1979-2001 in NCEP1, NCEP2, ERA-40 and 633
ERA-Interim. 634
635
636
637
638


![Evaluation of Daily Gridded Meteorological Datasets over ...€¦ · weather prediction, flood forecasting, drought monitoring or water resources management [1]. Paucity of data remains](https://img.pdfslide.net/doc/110x75/5fc61947fc178437d36e1a38/evaluation-of-daily-gridded-meteorological-datasets-over-weather-prediction.jpg)