Embed Size (px)
Citation preview
Full Terms & Conditions of access and use can be found athttp://www.tandfonline.com/action/journalInformation?journalCode=rjsp20
Journal of Sports Sciences
ISSN: 0264-0414 (Print) 1466-447X (Online) Journal homepage: http://www.tandfonline.com/loi/rjsp20
Comparison of performance on process- andproduct-oriented assessments of fundamentalmotor skills across childhood
Samuel W. Logan, Lisa M. Barnett, Jacqueline D. Goodway & David F.Stodden
To cite this article: Samuel W. Logan, Lisa M. Barnett, Jacqueline D. Goodway & David F.Stodden (2017) Comparison of performance on process- and product-oriented assessmentsof fundamental motor skills across childhood, Journal of Sports Sciences, 35:7, 634-641, DOI:10.1080/02640414.2016.1183803
To link to this article: https://doi.org/10.1080/02640414.2016.1183803
Published online: 12 May 2016.
Submit your article to this journal
Article views: 761
View related articles
View Crossmark data
Citing articles: 11 View citing articles
Comparison of performance on process- and product-oriented assessments offundamental motor skills across childhoodSamuel W. Logana, Lisa M. Barnettb, Jacqueline D. Goodwayc and David F. Stoddend
aCollege of Public Health and Human Sciences, Oregon State University, Corvallis, OR, USA; bSchool of Health and Social Development, DeakinUniversity, Burwood, VIC, Australia; cDepartment of Human Sciences, The Ohio State University, Columbus, OH, USA; dDepartment of PhysicalEducation and Athletic Training, University of South Carolina, Solomon Blatt Physical Education Center, Columbia, SC, USA
ABSTRACTProcess-oriented motor competence (MC) assessments evaluate how a movement is performed.Product-oriented assessments evaluate the outcome of a movement. Determining the concurrentvalidity of process and product assessments is important to address the predictive utility of motorcompetence for health. The current study aimed to: (1) compare process and product assessments ofthe standing long jump, hop and throw across age groups and (2) determine the capacity of processassessments to classify levels of MC. Participants included 170 children classified into three age groups:4–5, 7–8 and 10–11 years old. Participants’ skills were examined concurrently using three processassessments ((Test of Gross Motor Development-2nd edition [TGMD-2]), Get Skilled; Get Active, anddevelopmental sequences) and one product measure (throw speed, jump and hop distance). Resultsindicate moderate to strong correlations between (1) process assessments across skills and age groups(r range = .37–70) and (2) process and product assessments across skills and age groups(r range = .26–.88). In general, sensitivity to detect advanced skill level is lowest for TGMD-2 andhighest for developmental sequences for all three skills. The use of process and product assessments issuggested to comprehensively capture levels of MC in human movement.
ARTICLE HISTORYAccepted 21 April 2016
KEYWORDSSkill development;childhood; motor
Objectives for studying motor competence (MC) includedescribing, understanding and explaining how the processand product of movement patterns (i.e., movement coordina-tion and control) change over time (Haywood & Getchell,2009). Recent research has emphasised the relationshipbetween MC and important health outcomes (see Robinsonet al. (2015) for a review) such as physical activity (Logan,Webster, Robinson, Getchell, & Pfieffer, 2015), weight status(Cattuzzo et al., 2015; Logan, Scrabis-Fletcher, Modlesky, &Getchell, 2011) and health-related fitness (Cattuzzo et al.,2015; Lubans, Morgan, Cliff, Barnett, & Okely, 2010). Due tothe increased interest and evidence surrounding associationsbetween MC and health, it is imperative that assessments usedto quantify MC are accurate and informative.
One aspect of MC routinely examined in the literature is theperformance of fundamental motor skills (FMS). FMS aredefined as gross motor skills “. . .that involve the large, force-producing muscles of the trunk, arms, and legs” (Clark, 1994, p.245). FMS are typically classified as locomotor (e.g., jump, hopand run) and object control (e.g., throw, kick and strike) skills(Haywood & Getchell, 2009) and are considered the buildingblocks of more advanced movements that are required tosuccessfully participate in physical activity such as sports andgames (Clark & Metcalfe, 2002). FMS assessments are com-monly used as evaluative tools for physical education, motordevelopment and performance profiles. These assessmentsmay vary in the type (i.e., product or process) and number of
skills measured (i.e., individual or subscales), ease of adminis-tration and scoring procedures.
Process-oriented assessments evaluate how a movement isperformed and describe qualitative movement patterns. Threeexamples often used in the literature include the Test of GrossMotor Development-2nd edition (TGMD-2; Ulrich, 2000), GetSkilled; Get Active (GSGA; New South Wales Department ofEducation and Training, 2000) and developmental sequences(Clark & Phillips, 1985; Clark, Phillips, & Peterson, 1989;Roberton & Halverson, 1984, 1988). Specifically, the TGMD-2evaluates children’s FMS based on the presence or absence of3–5 performance criteria for 12 skills including object controland locomotor skills (Ulrich, 2000). Scores across two trials arethen summed to provide a raw score for that particular skill.The GSGA skills are scored in a similar fashion. Alternatively,developmental sequences assess coordination patterns ofindividual components of individual skills that are alignedwith parts of the body (Roberton & Halverson, 1984). Eachqualitatively different component level is evaluated on anordinal developmental scale (e.g., 1–4) with higher levelsequalling more advanced movement pattern. For example,the developmental sequences of throwing include threebody components: trunk, humerus and forearm and eachcomponent has three levels. Process-oriented assessmentsdiffer in their complexity to administer due to the number ofskills included, number of performance criteria for each skilland whether or not performance can be observed and
CONTACT Samuel W. Logan [email protected] College of Public Health and Human Sciences, Oregon State University, 160 SW 26th St.,Women’s Building 203b, Corvallis, OR 97331, USA
JOURNAL OF SPORTS SCIENCES, 2017VOL. 35, NO. 7, 634–641http://dx.doi.org/10.1080/02640414.2016.1183803
© 2016 Informa UK Limited, trading as Taylor & Francis Group

recorded live or whether video analysis is required for accuratescoring. In contrast, a product-oriented assessment evaluatesthe outcome of a movement, which is typically identified as aquantitative score (e.g., speed, distance or number of success-ful attempts). Run, throw or kick speed, jump or hop distanceand the number of successful catches or target “hits” areexamples of product-oriented assessments.
Previous research has examined the associations betweenprocess- and product-oriented assessments of motor compe-tence with mixed results. Recent studies have found low (5.3%;4–11 year olds; Valentini et al., 2015) to moderate amounts ofvariance explained (24%; 3–6 year olds; Logan, Robinson, &Getchell, 2011; 27%; 5–8 year olds; Logan, Robinson, Rudisill,Wadsworth, & Morera, 2014) between overall performance onthe process-oriented TGMD-2 and the product-orientedMovement Assessment Battery for Children-2nd edition.However, due to differences in specific skills measuredbetween the two assessments, comparisons of individual skillperformances could not be addressed. Alternatively, a fewstudies have compared both the product and process of indi-vidual skills that are classified as FMS; again, the strength ofassociations appears to vary depending upon the skill and theassessment. For example, throwing developmental sequencelevels predict 69–85% of ball speed in children aged6–13 years (Roberton & Konczak, 2001) and also are stronglypredictive of kinematic and temporal variables and ball velo-city in children 3–15 years of age (Stodden, Langendorfer,Flesig, & Andrews, 2006a, 2006b). In contrast, only 22% ofthe variance in standing long jump distance was explainedby whole-body developmental sequences in 3–5 year-old-chil-dren (Haubenstricker & Branta, 1997). Similarly, whole-bodydevelopmental sequences of running explained 29% of var-iance in running speed in 2–5-year-old children (Fountain,Ulrich, Haubenstricker, & Seefeldt, 1981). It is apparent thatthere is neither a clear nor a comprehensive understanding ofthe relationship between process- and product-orientedassessments of FMS competence in children.
It is important to understand how and why the strength ofassociations between motor assessments may change acrossage as certain assessments were developed primarily to focuson the identification of developmental delay (e.g., TGMD-2) orto address how change in movement occurs across childhood(e.g., developmental sequences or product scores). It is possi-ble that while assessments are able to detect developmentaldelay, they may not be able to adequately discriminate levelsof skilfulness in typically developing children. Thus, existingassessments may not provide adequate sensitivity in theresearch context to determine how FMS competence relatesto health outcomes and behaviours (Stodden et al., 2008).There is also a need to determine how performances ondifferent process-oriented FMS assessments are related, astheir scoring protocols (e.g., sum of dichotomously scoredcriteria such as the TGMD-2 or GSGA, or ordinal ranked com-ponent levels for developmental sequences) are quite differ-ent from a measurement perspective. To date, there are nostudies that have compared individuals’ performance on twoor more process-oriented FMS assessments.
Overall, comparisons of assessment outcomes will providecritical information to the scientific community as it relates to
how different FMS assessments may provide different types ofinformation relating to MC. In the current study, only assess-ments that specifically measure FMS were included. There aretwo purposes of the current study: (1) to compare process-and product-oriented assessments of the standing long jump,hop and throw across three age groups and (2) to determinethe capacity of process-oriented assessments to classifyadvanced and non-mastery levels of skilfulness.
Method
Participants and setting
Participants included a convenience sample of 170 childrenbetween the ages of 4 and 11 years old (86 girls, 84 boys) fromtwo rural towns in the Southwestern United States. All parti-cipants were enrolled in public schools and attended physicaleducation class on a regular basis. Data from these partici-pants were part of a larger study and data for the currentstudy were uniquely analysed to address the research ques-tions of interest. Participants were Hispanic (n = 94), Caucasian(n = 70), African American (n = 5) and Native American (n = 1).Participants were classified into three age groups: 4–5 years,7–8 years and 10–11 years. See Table 1 for participants’ demo-graphic information. The university’s human participantsreview board approved this study prior to data collection.Verbal assent and written informed consent was obtainedfrom all participants and their legal guardians, respectively.Potential participants with a physical disability or health con-dition that prevented them from completing any of the assess-ments were excluded from testing.
Procedures and assessment
Children completed three skills (standing long jump, hop andthrow) that are each included in the TGMD-2 (Ulrich, 2000),and the GSGA (New South Wales Department of Educationand Training, 2000). Validated developmental sequences existfor these three skills (Clark & Phillips, 1985; Clark et al., 1989;Roberton & Halverson, 1984, 1988). Children performed theseskills at different stations and all skills were video recordedfrom the side view, with an additional camera positionedbehind to assess throwing. Although the different assessmentshave slightly different procedures for scoring administration,the procedures in terms of assessment protocol were identicalfor all three skills. After a researcher demonstrated each skilland exhibited all behavioural components (TGMD-2), childrenwere then allowed two warm-up trials of each skill.Participants also were instructed to perform with maximumeffort, which produces the most advanced movement patternof ballistic skills (Langendorfer, Roberton, & Stodden, 2011). As
Table 1. Children’s demographic information by age group.
Age (years) Height (cm) Weight (kg)
Age group n Boys Girls M SD M SD M SD
4–5 year olds 55 23 32 5 0.54 109.7 6.7 19.5 3.77–8 year olds 61 33 28 8.1 0.62 127.7 6 30.1 8.410–11 year olds 54 28 26 10.7 0.42 142.1 7.6 44.6 14.6
M: Mean; SD: Standard deviation.
JOURNAL OF SPORTS SCIENCES 635
developmental sequences are normally categorised based ontheir modal level, children performed five trials of the throwand standing long jump in order to provide adequate trials toassess modal levels (Stodden et al., 2006a, 2006b). Due to thelevel of specificity required to score developmental sequences,it was not possible to use less than five trials to accuratelyassess performance of each skill. To be consistent with thenumber of trials assessed for the TGMD-2 and GSGA andsatisfy the necessity of a modal level of component sequences,the two standing long jump and throwing trials scored for theTGMD-2 and GSGA were the two trials with the highest speedand longest jump distance. These trials were also consistentwith the highest modal level trials for each component of eachskill. Children hopped approximately 5 m on each foot twice,thus satisfying requirements for all assessments. These proce-dures also ensured that the same trials were being used for allfour assessments. While the GSGA typically involves childrencompleting five trials, for the purpose of this study two trials(as mentioned earlier) were used for scoring to modify the
procedures to be consistent with the TGMD-2 and the productassessment (i.e., Maximum standing long jump and hop dis-tance and throwing speed).
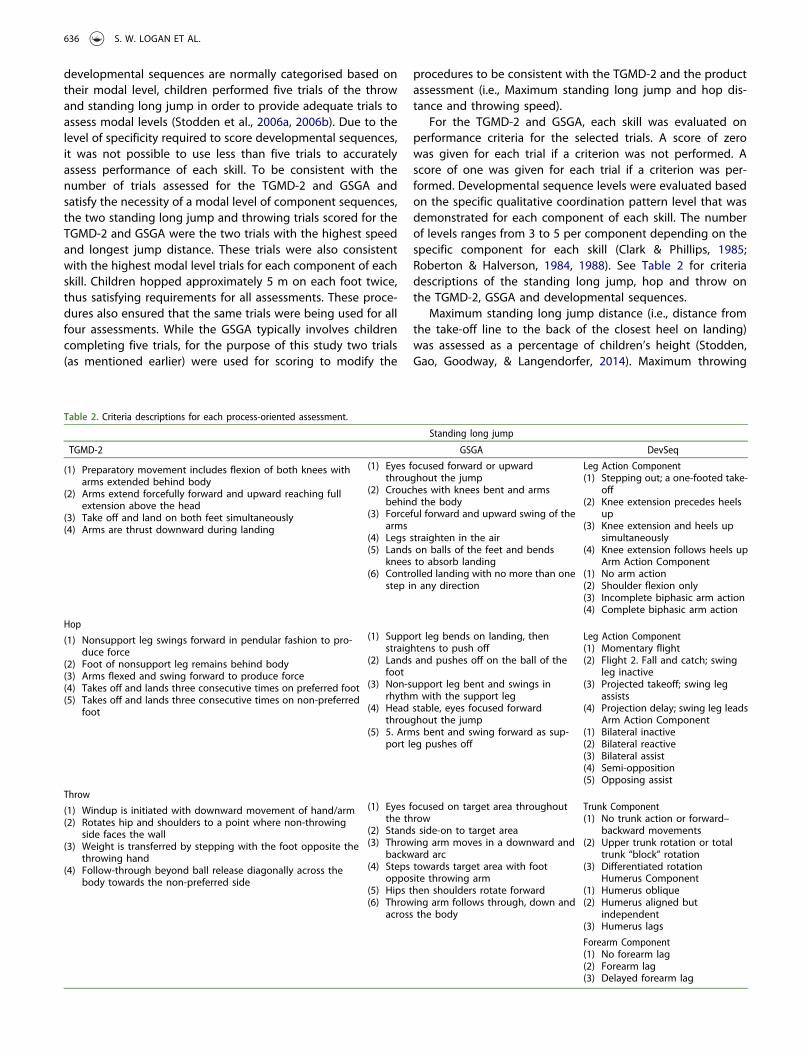
For the TGMD-2 and GSGA, each skill was evaluated onperformance criteria for the selected trials. A score of zerowas given for each trial if a criterion was not performed. Ascore of one was given for each trial if a criterion was per-formed. Developmental sequence levels were evaluated basedon the specific qualitative coordination pattern level that wasdemonstrated for each component of each skill. The numberof levels ranges from 3 to 5 per component depending on thespecific component for each skill (Clark & Phillips, 1985;Roberton & Halverson, 1984, 1988). See Table 2 for criteriadescriptions of the standing long jump, hop and throw onthe TGMD-2, GSGA and developmental sequences.
Maximum standing long jump distance (i.e., distance fromthe take-off line to the back of the closest heel on landing)was assessed as a percentage of children’s height (Stodden,Gao, Goodway, & Langendorfer, 2014). Maximum throwing
Table 2. Criteria descriptions for each process-oriented assessment.
Standing long jump
TGMD-2 GSGA DevSeq
(1) Preparatory movement includes flexion of both knees witharms extended behind body
(2) Arms extend forcefully forward and upward reaching fullextension above the head
(3) Take off and land on both feet simultaneously(4) Arms are thrust downward during landing
(1) Eyes focused forward or upwardthroughout the jump
(2) Crouches with knees bent and armsbehind the body
(3) Forceful forward and upward swing of thearms
(4) Legs straighten in the air(5) Lands on balls of the feet and bends
knees to absorb landing(6) Controlled landing with no more than one
step in any direction
Leg Action Component(1) Stepping out; a one-footed take-
off(2) Knee extension precedes heels
up(3) Knee extension and heels up
simultaneously(4) Knee extension follows heels up
Arm Action Component(1) No arm action(2) Shoulder flexion only(3) Incomplete biphasic arm action(4) Complete biphasic arm action
Hop
(1) Nonsupport leg swings forward in pendular fashion to pro-duce force
(2) Foot of nonsupport leg remains behind body(3) Arms flexed and swing forward to produce force(4) Takes off and lands three consecutive times on preferred foot(5) Takes off and lands three consecutive times on non-preferred
foot
(1) Support leg bends on landing, thenstraightens to push off
(2) Lands and pushes off on the ball of thefoot
(3) Non-support leg bent and swings inrhythm with the support leg
(4) Head stable, eyes focused forwardthroughout the jump
(5) 5. Arms bent and swing forward as sup-port leg pushes off
Leg Action Component(1) Momentary flight(2) Flight 2. Fall and catch; swing
leg inactive(3) Projected takeoff; swing leg
assists(4) Projection delay; swing leg leads
Arm Action Component(1) Bilateral inactive(2) Bilateral reactive(3) Bilateral assist(4) Semi-opposition(5) Opposing assist
Throw
(1) Windup is initiated with downward movement of hand/arm(2) Rotates hip and shoulders to a point where non-throwing
side faces the wall(3) Weight is transferred by stepping with the foot opposite the
throwing hand(4) Follow-through beyond ball release diagonally across the
body towards the non-preferred side
(1) Eyes focused on target area throughoutthe throw
(2) Stands side-on to target area(3) Throwing arm moves in a downward and
backward arc(4) Steps towards target area with foot
opposite throwing arm(5) Hips then shoulders rotate forward(6) Throwing arm follows through, down and
across the body
Trunk Component(1) No trunk action or forward–
backward movements(2) Upper trunk rotation or total
trunk “block” rotation(3) Differentiated rotation
Humerus Component(1) Humerus oblique(2) Humerus aligned but
independent(3) Humerus lags
Forearm Component(1) No forearm lag(2) Forearm lag(3) Delayed forearm lag
636 S. W. LOGAN ET AL.
speed was calculated using a radar gun (Stalker, Inc.) (Stoddenet al., 2006a, 2006b). Hop distance as a percentage of chil-dren’s height was assessed using Dartfish (Dartfish MotionAnalysis Corporation, Marietta, GA). Hop distance was calcu-lated based on a child’s ability to hop at least three times in arow on each leg for at least one of the two trials on that foot.Average hop distance (i.e., distance from heel to heel) wascalculated based on the average of a minimum of three hopsfor each foot.
Two researchers with prior training and experience in ana-lysing TGMD-2 and GSGA performances coded all of the datafor these two assessments using the same video recordings forthe children’s standing long jump, hop and throw perfor-mances. Inter- and intra-rater agreement (>90%) for theGSGA and TGMD was established prior to formal data codingusing the ratio of agreements/disagreements × 100 to estab-lish a percentage of agreement. Inter- and intra-rater reliabilitywas established on 10% of the data set. That is, each raterdouble coded 10% of data to determine intra-rater reliabilityand every rater coded the same 10% of data to determineinter-rater reliability. One researcher with training and exper-tise coded all the developmental sequence data. Intra-raterreliability was established (>90%) on 10% of the developmen-tal sequence data.
Data analysis
Raw scores of standing long jump, hop and throw perfor-mances on each assessment were used for all analyses.Spearman’s Rho correlations were calculated to compare per-formances between process- and product-oriented assessmentsof the standing long jump, hop and throw. Spearman’s Rhocorrelations and Cochran’s Q tests were conducted to compareperformances between three process-oriented assessments ofthe standing long jump, hop and throw. Strength of correla-tions is interpreted as defined by Cohen (1988): 0.10–0.29 = low; 0.30–0.49 moderate; 0.50 and above = strong.Spearman’s Rho correlations (non-parametric) have been usedin previous research to compare performances between FMSassessments (Logan, Robinson, Rudisill, Wadsworth, & Morera,2014; Logan, Robinson, et al., 2011; Valentini et al., 2015).
An additional analysis for examining agreement betweenprocess-oriented assessments included categories of skilful-ness that were defined for each skill: mastery (all criteria ofa skill demonstrated), near mastery (all but one criterion ofa skill demonstrated) and non-mastery (more than one cri-terion of a skill not demonstrated). This classification isbased on a previous method for the Get Skilled; GetActive assessment (Barnett, van Beurden, Morgan, Brooks,& Beard, 2009). For example, the maximum raw score fortwo trials on the TGMD-2 for the hop is 10. A score of 10,8–9 and 7≤ were classified as mastery, near mastery andnon-mastery, respectively. Near mastery was defined with ascore of 8 or 9 because a child could demonstrate all butone criterion of the hop on each trial. The same procedureswere used for the GSGA and developmental sequences(DevSeq). Then, near mastery and mastery classificationswere combined to form a category of “advanced skilful-ness”. Cochran’s Q tests were calculated for each specific
skill to determine if the TGMD-2, GSGA and DevSeq wereequally effective in classifying skill level as advanced or non-mastery. Cochran’s Q is a non-parametric test for repeatedmeasures of a binary variable (i.e., advanced vs. non-mas-tery). Post hoc pairwise comparisons were calculated asappropriate.
Results
Correlations
Table 3 presents Spearman’s Rho correlations, calculated tocompare performances between process- and product-oriented assessments on the standing long jump, hop andthrow. All correlations were statistically significant for thestanding long jump (P < .05; r = .26–.65) with the exceptionof the GSGA and DevSeq to product scores for the 7–8 yearolds. Correlations between assessments for the standing longjump were classified as moderate except for the TGMD-2 toproduct scores (r = .26).
All correlations were statistically significant for the hop(P < .05; r = .41–.88) with the exception of the TGMD-2 toproduct scores for the 10–11 year olds. Correlations betweenassessments in hopping were moderate (7–8 year olds;10–11 year olds) and strong (4–5 year olds).
All correlations were statistically significant for the throw(P < .05; r = .29–.71). Correlations between assessments inthrowing generally were low (4–5 year olds), moderate (7–8 year olds) and strong (10–11 year olds) across age groups.Specifically, when comparing the product assessment to thethree process assessments, developmental sequences generallydemonstrated stronger correlations with product scores whencompared with the TGMD (six of nine comparisons were higheracross age groups). The GSGA also generally demonstratedstronger correlations with product scores (five of nine compar-isons) when compared to the TGMD. The TGMD demonstratedthe strongest relationship to product scores on only one of ninecomparisons (standing long jump in 7–8 year olds).
Spearman’s Rho correlations were calculated to compareperformances between process-oriented assessments on thestanding long jump, hop and throw (See Table 4). All correla-tions were statistically significant for the standing long jump(P < .05; r = .37–.57) with the exception of the TGMD-2 to GSGA
Table 3. Spearman’s Rho correlations between process and product scores.
Age group
Skill 4–5 year olds 7–8 year olds 10–11 year olds
Jump ProductTGMD-2 .46** .26* .47**GSGA .53** 0.17 .41**DevSeq .56** 0.17 .65**
Hop ProductTGMD-2 .65** .41** 0.25GSGA .88* .48** .47**DevSeq .76** .56** .59**
Throw ProductTGMD-2 .30* .47** .62**GSGA .29* .45** .71**DevSeq .31* .46** .71**
* and ** indicate significance at the .05 and .01 levels, respectively.
JOURNAL OF SPORTS SCIENCES 637
for the 10–11 year olds. Correlations between assessments forthe standing long jump were moderate across age groups.
All correlations were statistically significant for the hop(P < .05; r = .47– .79), with the exception of the TGMD-2 toDevSeq in 10–11 year olds. Correlations between assessmentsfor hopping were moderate (7–8 year olds; 10–11 year olds)and strong (4–5 year olds).
All correlations were statistically significant for the throw(P < .05; r = .37–.70). Correlations between assessments forthrowing were moderate (4–5 year olds), moderate to strong(7–8 year olds) and strong (10–11 year olds).
Cochran’s Q tests
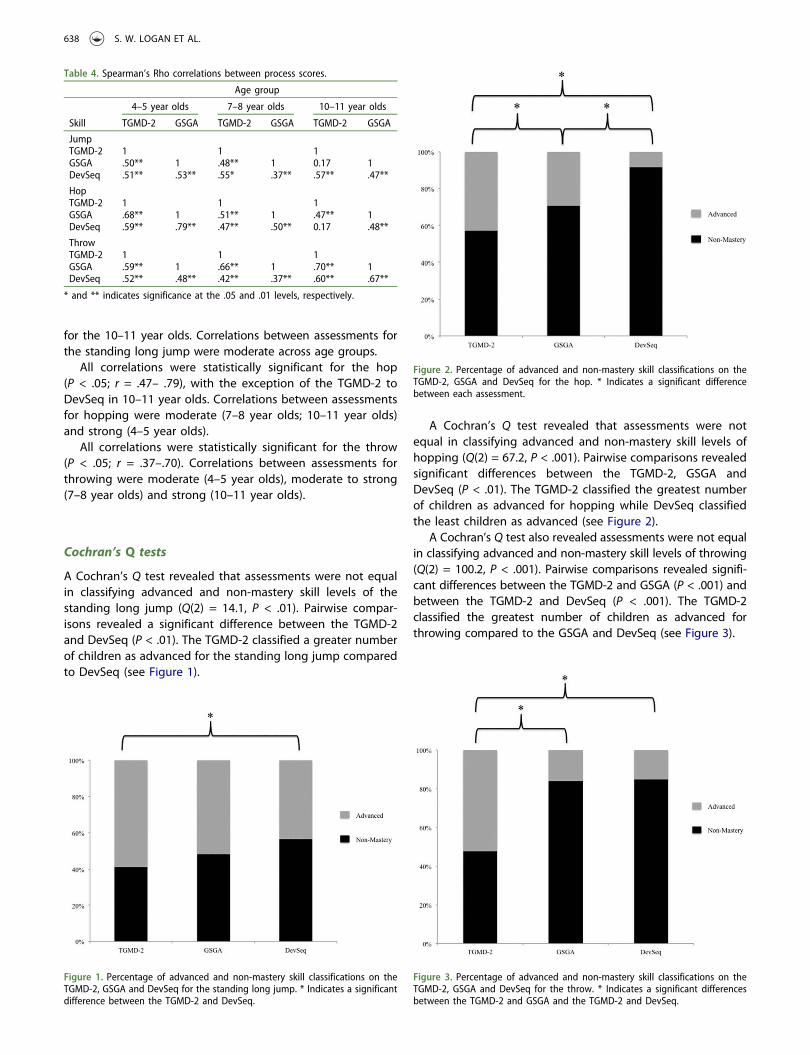
A Cochran’s Q test revealed that assessments were not equalin classifying advanced and non-mastery skill levels of thestanding long jump (Q(2) = 14.1, P < .01). Pairwise compar-isons revealed a significant difference between the TGMD-2and DevSeq (P < .01). The TGMD-2 classified a greater numberof children as advanced for the standing long jump comparedto DevSeq (see Figure 1).
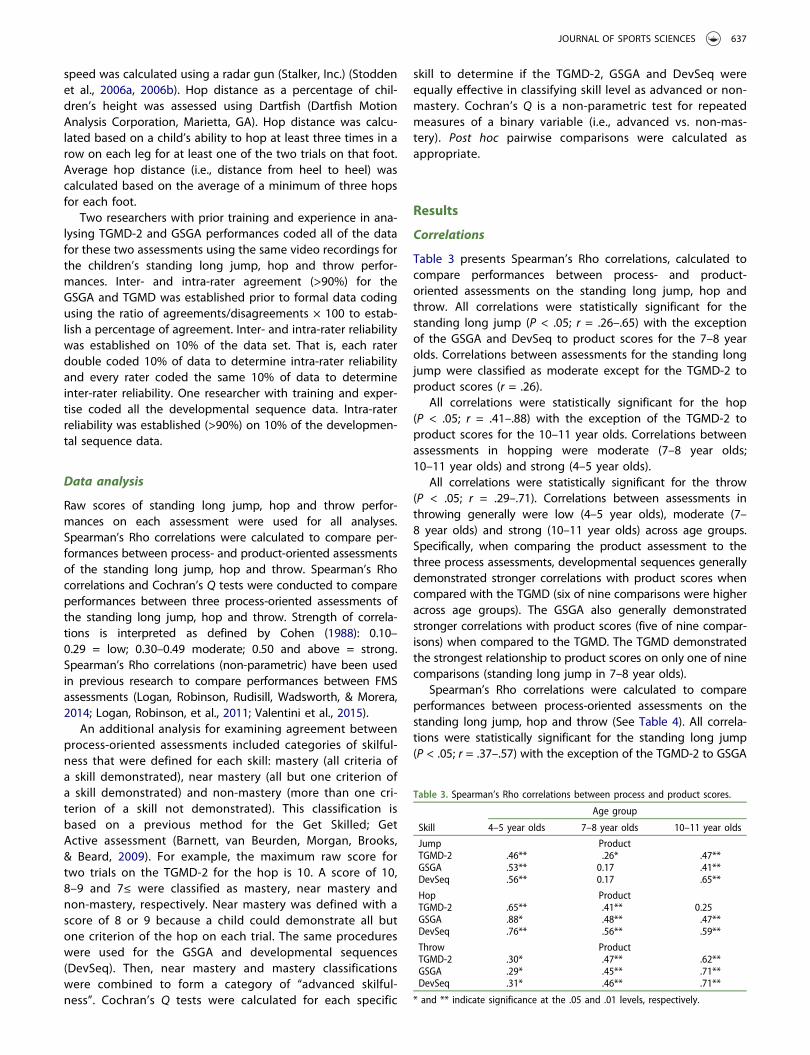
A Cochran’s Q test revealed that assessments were notequal in classifying advanced and non-mastery skill levels ofhopping (Q(2) = 67.2, P < .001). Pairwise comparisons revealedsignificant differences between the TGMD-2, GSGA andDevSeq (P < .01). The TGMD-2 classified the greatest numberof children as advanced for hopping while DevSeq classifiedthe least children as advanced (see Figure 2).
A Cochran’s Q test also revealed assessments were not equalin classifying advanced and non-mastery skill levels of throwing(Q(2) = 100.2, P < .001). Pairwise comparisons revealed signifi-cant differences between the TGMD-2 and GSGA (P < .001) andbetween the TGMD-2 and DevSeq (P < .001). The TGMD-2classified the greatest number of children as advanced forthrowing compared to the GSGA and DevSeq (see Figure 3).
Table 4. Spearman’s Rho correlations between process scores.
Age group
Skill
4–5 year olds 7–8 year olds 10–11 year olds
TGMD-2 GSGA TGMD-2 GSGA TGMD-2 GSGA
JumpTGMD-2 1 1 1GSGA .50** 1 .48** 1 0.17 1DevSeq .51** .53** .55* .37** .57** .47**
HopTGMD-2 1 1 1GSGA .68** 1 .51** 1 .47** 1DevSeq .59** .79** .47** .50** 0.17 .48**
ThrowTGMD-2 1 1 1GSGA .59** 1 .66** 1 .70** 1DevSeq .52** .48** .42** .37** .60** .67**
* and ** indicates significance at the .05 and .01 levels, respectively.
Figure 1. Percentage of advanced and non-mastery skill classifications on theTGMD-2, GSGA and DevSeq for the standing long jump. * Indicates a significantdifference between the TGMD-2 and DevSeq.
Figure 2. Percentage of advanced and non-mastery skill classifications on theTGMD-2, GSGA and DevSeq for the hop. * Indicates a significant differencebetween each assessment.
Figure 3. Percentage of advanced and non-mastery skill classifications on theTGMD-2, GSGA and DevSeq for the throw. * Indicates a significant differencesbetween the TGMD-2 and GSGA and the TGMD-2 and DevSeq.
638 S. W. LOGAN ET AL.

Discussion
The first purpose of the current study was to compare process-and product-oriented assessments of the standing long jump,hop and throw across three age groups. Our results generallyindicate moderate to strong correlations between the process-and product-oriented assessments across skills and agegroups (r range = .26–.88). For the standing long jump andhopping, there was a decrease in strength of correlationsbetween 4–5 year olds and the 7–8 year olds with standinglong jump demonstrating weak or non-significant relation-ships at 7–8 years. Jumping again demonstrated moderateto strong associations for 10–11 year-olds. Hopping correla-tions decreased from strong to moderate as children’s agesincreased. For the throw, there was an increase in strength ofcorrelations across age groups. The decreased strength ofcorrelations in the standing long jump and hop between thetwo younger age groups may be a combined function of theglobal increase of locomotor skill movement pattern develop-ment in this age group that was facilitated by the increase inconsistent movement-related experiences specific to this sam-ple. The 4–5-year-old children in this sample had not receiveddaily physical education in their preschool classes, but the7–8-year-old children had two years of daily physical educa-tion for 30 min · day–1. The physical education curriculum inboth elementary schools was focused on developing FMS andfitness. While only speculative, noted changes (i.e., improve-ments) in coordination patterns of these types of complexskills (i.e., ballistic in nature), as assessed by limited numberof qualitative movement levels, may not necessarily lead tochanges in outcome variables (i.e., speed or distance). Forexample, an increase in an ordinal level of a component (i.e.,developmental sequences) or being able to note the “pre-sence of a characteristic” (i.e., TGMD and GSGA) will notnecessarily capture biomechanical variables (e.g., relative tim-ing, increased segmental angular velocities) or the exploitationof neuromuscular mechanisms (e.g., stretch shortening cycle,recovery of elastic potential) that are critical for increases inperformance (Stodden & Rudisill, 2006; Stodden et al., 2006a,2006b, 2014). Essentially, limitations of qualitative assessmentsto adequately capture certain aspects of “coordination” maybe reflective of an increase in a qualitative assessment valuewithout an immediate and concomitant quantitative perfor-mance improvement. Another potential reason for the correla-tions in the locomotor skills being less strong in the older agecategory is a potential ceiling effect with the TGMD-2, which isanother limitation of many qualitative assessments. The instru-ment is only recommended through age 10 and according tothe normed values it is clear that as children reach this age,scoring levels out towards maximum values (Ulrich, 2000).
In contrast, strength of correlations in throwing increasedacross age groups. This could be due to the complex organi-sation of segmental interactions associated with the kineticchain in object control skills, such as throwing. The realisationof an increased ball speed associated with changes in kine-matics, kinetics and relative timing aspects of the movementpattern may not be realised with less discriminating process-oriented assessments (Stodden et al., 2006a, 2006b).Furthermore, for girls at least, there does not appear to be a
ceiling effect for object control skills as assessed by the TGMD-2 (Ulrich, 2000).
No clear pattern emerged in the strength of associationsbetween process-oriented assessments across skills or agegroups. For example, for 10–11 year olds, the highest correla-tions include: between the TGMD-2 and developmentalsequences (standing long jump, .57); between the GSGA anddevelopmental sequences (hop, .48) and between the TGMD-2and GSGA (throw, .70). When examining comparisons betweenprocess and product assessments and among the processassessments, these data would seem to suggest that any oneof the three process-oriented assessments would be as equallyeffective in assessing levels of skilfulness. However, whenexamining data based on the second set of analyses (i.e.,second purpose of the study), a more clear understanding ofthe predictive utility of the three different process assessmentsemerges.
The second purpose of the current study was to deter-mine the agreement in the capacity of process-orientedassessments to classify advanced and non-mastery levels ofskilfulness. Our results indicate that in general, sensitivity todetect advanced skill level is lowest for TGMD-2 and highestfor developmental sequences for all three skills. This is anintuitive result since the TGMD-2 has the least number ofperformance criteria while developmental sequences havethe most. In addition, developmental sequences also gener-ally demonstrated higher correlations with product scorescompared to the TGMD-2 (six of nine comparisons acrossage groups), which suggests sequences have stronger pre-dictive utility with product scores across developmental timethan the TGMD-2. The demonstrated cross-sectional andlongitudinal validity of developmental sequences providesadditional rationale to explain why the sequences may bemore strongly linked to product scores than the TGMD-2(Roberton & Halverson, 1984, 1988). The GSGA also demon-strated higher correlations on five of nine product-processcomparisons across age groups. Thus, the capability to dis-criminate among different levels of skilfulness may be bestassessed using developmental sequences or the GSGAassessments. However, it is important to note that theGSGA assessment includes five trials, not two trials, andtherefore it was not administered according to protocol.The discriminative ability of the GSGA may have increasedeven further if all five trials were used. Increased discrimina-tion capabilities of MC assessments are becoming increas-ingly important, specifically when attempting to link thelevel or development of MC to other constructs such ashealth-related or cognitive variables.
From a practical and research perspective, there is a trade-off in terms of more performance criteria and the amount oftime and therefore cost involved to analyse video recordingsof skill performance. Based on the authors’ experiences withcoding all three process assessments, individual skill perfor-mances on the TGMD-2 and GSGA generally can be completedin less time than developmental sequences when analysing anequal number of skills. In addition, the TGMD-2 (12 skills) andGSGA (12 skills) have scoring procedures for many skills,whereas only three skills (jump, hop, throw) have validateddevelopmental sequences. Thus, development of additional
JOURNAL OF SPORTS SCIENCES 639

validated sequences is important to provide a more compre-hensive view of FMS competence and how performancesacross assessments are related.
It is always important for a researcher to choose an assess-ment based on the research question. The GSGA seems to bean appropriate process-oriented assessment to use for typi-cally developing children, as it had some capacity to detectadvanced skilfulness and appears to be more closely alignedwith product scores than the TGMD-2. The full GSGA assess-ment also has a broad range of skills and includes staticbalance, vertical jump, sprint run, catch, hop, leap, side gallop,kick, skip, two-hand strike, overarm throw and the dodge (i.e.,an agility skill), although subscales are not identified for typesof skills. However, even though it is a well-utilised instrumentin Australia (Barnett, van Beurden, Morgan, Brooks, & Beard,2009; Hardy, Barnett, Espinel, & Okely, 2013), aside from onepublication on inter-rater reliability (Barnett, van Beurden,Morgan, Lincoln, et al., 2009), no previous validity, test retestreliability or normative scores have been published in regardto the GSGA. Based on the current study, the GSGA appears tohave discriminant and convergent validity and thus furtherresearch is warranted to determine reliability and establishnormative scores.
One of the primary purposes of the TGMD-2 is for theidentification and screening of children delayed in demon-strating FMS competence. Although the TGMD-2 is less cap-able of discriminating advanced skill levels, its capability toidentify developmental delay is consistent with other assess-ment batteries with the same purpose (Logan et al., 2014;Valentini et al., 2015).
In conclusion, the results of the present study generallydemonstrate moderate to strong correlations across process-and product-oriented assessments of the standing long jump,hop and throw across three age groups. The use of develop-mental sequences may be most informative when attemptingto determine advanced levels of skilfulness within those threeskills; however, the feasibility of only assessing three skills isproblematic from a research standpoint. Also, practitionersand researchers may not be well trained on coding develop-mental sequences and/or do not have access to Dartfish soft-ware which further decreases feasibility of this approach. TheGSGA may be a more attractive alternative than the TGMD-2based on its convergent validity against both process andproduct assessments. As suggested by other authors, we sup-port the use of both process- and product-oriented assess-ments when including motor competence as a dependentvariable of interest (Robinson et al., 2015; Rudd et al., 2016).Of course, it is always import to keep in mind the purpose ofassessment and there may be a rationale for choosing oneassessment over another. Considerations of time, effort, costand level of expertise required all contribute to choice ofassessment.
Based on the variability in correlations among assess-ments, it appears that FMS process- and product-orientedassessments, although related, provide different informationwith regard to competence levels. By including both typesof assessments, it allows researchers to more fully under-stand and delineate how MC relates to other variables.Overall, there is a need for a MC assessment that measures
both process- and product-oriented outcomes. One suchassessment (in the form of an obstacle course) has beenrecently developed in Canada (Longmuir et al., in press)and found to be feasible in an Australian PhysicalEducation setting (Lander, Morgan, Salmon, & Barnett,2015). An assessment that measures process- and product-oriented outcomes will potentially provide researchers withone assessment that captures multiple salient descriptors ofMC, although it remains to be seen how this new assess-ment compares existing skill assessments. Accurate andcomprehensive assessment of MC is becoming increasinglyimportant as it will provide researchers with a better under-standing of the relationship between MC levels and healthoutcomes.
Disclosure statement
No potential conflict of interest was reported by the authors.
Funding
This study was funded by the National Institutes of Health [grant numberR21HD055621-01A2].
References
Barnett, L. M., van Beurden, E., Morgan, P. J., Brooks, L. O., & Beard, J. R.(2009). Childhood motor skill proficiency as a predictor of adolescentphysical activity. Journal of Adolescent Health, 44(3), 252–259.doi:10.1016/j.jadohealth.2008.07.004
Barnett, L. M., van Beurden, E., Morgan, P. J., Lincoln, D., Zask, A., & Beard,J. R. (2009). Interrater objectivity for field-based fundamental motor skillassessment. Research Quarterly for Exercise and Sport, 80(2), 363–368.doi:10.1080/02701367.2009.10599571
Cattuzzo, M. T., Henrique, R. S., Re, A. H., Oliveira, L. S., Melo, B. M., Moura,M. D., . . . Stodden, D. (2015). Motor competence and health relatedphysical fitness in youth: A systematic review. Journal of Science andMedicine in Sport, 19(2), 123–129.
Clark, J. E. (1994). Motor development. In V. S. Ramachandran (Ed.),Encyclopedia of human behavior (3rd ed., pp. 245–255). New York, NY:Academic Press.
Clark, J. E., & Metcalfe, J. S. (2002). The mountain of motor development: Ametaphor. In J. E. Clark & J. H. Humphrey (Eds.), Motor development:Research and review (Vol. 2, pp. 62–95). Reston, VA: National Associationfor Sport and Physical Education.
Clark, J. E., & Phillips, S. J. (1985). A developmental sequence of thestanding long jump. In J. E. Clark & J. H. Humphrey (Eds.), Motordevelopment: Current selected research (pp. 73–85). Princeton, NJ:Princeton Book.
Clark, J. E., Phillips, S. J., & Peterson, R. (1989). Developmental stability injumping. Developmental Psychology, 25(6), 929–935. doi:10.1037/0012-1649.25.6.929
Cohen, J. (1988). Statistical power analysis for the behavioral sciences.Hillside: Erlbaum.
Fountain, C., Ulrich, B., Haubenstricker, J., & Seefeldt, V. (1981, March).Relationship of developmental stage and running velocity in children 2.5to 5 years of age. Paper presented to the Midwest District Conventionof the American Association for Health, Physical Education, Recreation,and Dance, Chicago, IL.
Hardy, L. L., Barnett, L. M., Espinel, P., & Okely, A. D. (2013). Thirteen-yeartrends in child and adolescent fundamental movement skills:1997–2010. Medicine & Science in Sports & Exercise, 45(10), 1965–1970.doi:10.1249/MSS.0b013e318295a9fc
Haubenstricker, J. L., & Branta, C. F. (1997). The relationship betweendistance jumped and developmental level on the standing long jump
640 S. W. LOGAN ET AL.
in young children. In J. Clark & J. Humphrey (Eds.), Motor development:Research and reviews (Vol. 1, pp. 64–85). Reston, VA: NationalAssociation for Sport and Physical Education.
Haywood, K. M., & Getchell, N. (2009). Lifespan motor development (5thed.). Champaign, IL: Human Kinetics.
Lander, N. J., Morgan, P. J., Salmon, J., & Barnett, L. M. (2015). Teachers’perceptions of a fundamental movement skill (FMS) assessment batteryin a school setting. Measurement in Physical Education and ExerciseScience, 20(1), 1–13. doi:10.1080/1091367X.2015.1095758
Langendorfer, S. J., Roberton, M. A., & Stodden, D. F. (2011). Chapter 9:Biomechanical aspects of the development of object projection skills. InD. S. C. Korff (editor), Paediatric biomechanics and motor control: Theoryand application. Oxford: Routledge.
Logan, S. W., Robinson, L. E., & Getchell, N. (2011). The comparison of perfor-mances of preschool children on two motor assessments. Perceptual andMotor Skills, 113(3), 715–723. doi:10.2466/03.06.25.PMS.113.6.715-723
Logan, S. W., Robinson, L. E., Rudisill, M. E., Wadsworth, D., & Morera, M.(2014). The comparison of school-age children’s performance on twomotor assessments: The Test of Gross Motor Development and theMovement Assessment Battery for Children. Physical Education & SportPedagogy, 19(1), 48–59. doi:10.1080/17408989.2012.726979
Logan, S. W., Scrabis-Fletcher, K., Modlesky, C., & Getchell, N. (2011). Therelationship between motor skill proficiency and body mass index inpreschool children. Research Quarterly for Exercise and Sport, 82(3), 442–448. doi:10.1080/02701367.2011.10599776
Logan, S. W., Webster, E. K., Robinson, L. E., Getchell, N., & Pfieffer, K. A.(2015). The relationship between motor competence and physicalactivity engagement during childhood: A systematic review.Kinesiology Review, 4, 416–426. doi:10.1123/kr.2013-0012
Longmuir, P. E., Boyer, C., Lloyd, M., Borghese, M. M., Knight, E.,Saunders, T. J., . . . Tremblay, M. S. (in press). Canadian agility andmovement skill assessment of motor skill: Validity, objectivity andreliability evidence for children 8 to 12 years of age. Journal of Sportand Health Science. Advance online publication. doi:10.1016/j.jshs.2015.11.004.
Lubans, D. R., Morgan, P. J., Cliff, D. P., Barnett, L. M., & Okely, A. D. (2010).Fundamental movement skills in children and adolescents: Review ofassociated health benefits. Sports Medicine, 40(12), 1019–1035.doi:10.2165/11536850-000000000-00000
New South Wales Department of Education and Training. (2000). Getskilled: Get active. (DET Product number: 10614/DVD). Sydney: Author.
Roberton, M. A., & Halverson, L. E. (1984). Developing children – Their chan-ging movement: A guide for teachers. Philadelphia, PA: Lea & Febiger.
Roberton, M. A., & Halverson, L. E. (1988). The development of locomotorcoordination: Longitudinal change and invariance. Journal of MotorBehavior, 20(3), 197–241. doi:10.1080/00222895.1988.10735443
Roberton, M. A., & Konczak, J. (2001). Predicting children’s overarm throwball velocities from their developmental levels in throwing. ResearchQuarterly for Exercise and Sport, 72(2), 91–103. doi:10.1080/02701367.2001.10608939
Robinson, L. E., Stodden, D. F., Barnett, L. M., Lopes, V. P., Logan, S. W.,D’Hondt, E., & Rodrigues, L. P. (2015). Motor competence and its effecton positive developmental trajectories of health. Sports Medicine, 45(9),1273–1284. doi:10.1007/s40279-015-0351-6
Rudd, J., Butson, M. L., Barnett, L., Farrow, D., Berry, J., Borkoles, E., &Polman, R. (2016). A holistic measurement model of movement com-petency in children. Journal of Sports Sciences, 34(5), 477–485.doi:10.1080/02640414.2015.1061202
Stodden, D. F., Gao, Z., Goodway, J. D., & Langendorfer, S. J. (2014).Dynamic relationships between motor skill competence and health-related fitness in youth. Pediatric Exercise Science, 26(3), 231–241.doi:10.1123/pes.2013-0027
Stodden, D. F., Goodway, J. D., Langendorfer, S. J., Roberton, M. A.,Rudisill, M. E., Garcia, C., & Garcia, L. E. (2008). A developmentalperspective on the role of motor skill competence in physical activity:An emergent relationship. Quest, 60, 290–306. doi:10.1080/00336297.2008.10483582
Stodden, D. F., Langendorfer, S. J., Flesig, G. S., & Andrews, J. R. (2006a).Kinematic constraints associated with the acquisition of overarmthrowing part I: Step and trunk actions. Research Quarterly for Exerciseand Sport, 77(4), 417–427.
Stodden, D. F., Langendorfer, S. J., Flesig, G. S., & Andrews, J. R. (2006b).Kinematic constraints associated with the acquisition of overarmthrowing part II: Upper extremity actions. Research Quarterly forExercise and Sport, 77(4), 428–436.
Stodden, D. F., & Rudisill, M. E. (2006). Integration of biomechanical anddevelopmental concepts in the acquisition of throwing: Effects ondevelopmental characteristics and gender differences. Journal ofHuman Movement Studies, 51, 117–141.
Ulrich, D. A. (2000). Test of gross motor development (2nd ed.). Austin, TX:PRO-ED.
Valentini, N., Getchell, N., Logan, S. W., Liang, L., Golden, D., Rudisill, M. E.,& Robinson, L. E. (2015). Exploring associations between motor skillassessments in children with, without, and at-risk for developmentalcoordination disorder. Journal of Motor Learning and Development, 3(1),39–52. doi:10.1123/jmld.2014-0048
JOURNAL OF SPORTS SCIENCES 641