Embed Size (px)
Citation preview
Downlo
A. Hunter Fanneye-mail: [email protected]
Mark W. Davis
Brian P. Dougherty
National Institute of Standards and Technology,100 Bureau Drive,
Gaithersburg, MD 20899-8632
David L. King
William E. Boyson
Jay A. Kratochvil
Sandia National Laboratories,PO Box 5800,
MS 1033,Albuquerque, NM 87185-1033
Comparison of PhotovoltaicModule PerformanceMeasurementsComputer simulation tools used to predict the energy production of photovoltaic systemsare needed in order to make informed economic decisions. These tools require inputparameters that characterize module performance under various operational and envi-ronmental conditions. Depending upon the complexity of the simulation model, the re-quired input parameters can vary from the limited information found on labels affixed tophotovoltaic modules to an extensive set of parameters. The required input parametersare normally obtained indoors using a solar simulator or flash tester, or measured out-doors under natural sunlight. This paper compares measured performance parametersfor three photovoltaic modules tested outdoors at the National Institute of Standards andTechnology (NIST) and Sandia National Laboratories (SNL). Two of the three moduleswere custom fabricated using monocrystalline and silicon film cells. The third, a com-mercially available module, utilized triple-junction amorphous silicon cells. The resultingdata allow a comparison to be made between performance parameters measured at twolaboratories with differing geographical locations and apparatus. This paper describesthe apparatus used to collect the experimental data, test procedures utilized, and result-ing performance parameters for each of the three modules. Using a computer simulationmodel, the impact that differences in measured parameters have on predicted energyproduction is quantified. Data presented for each module includes power output at stan-dard rating conditions and the influence of incident angle, air mass, and module tem-perature on each module’s electrical performance. Measurements from the two labora-tories are in excellent agreement. The power at standard rating conditions is within 1%for all three modules. Although the magnitude of the individual temperature coefficientsvaried as much as 17% between the two laboratories, the impact on predicted perfor-mance at various temperature levels was minimal, less than 2%. The influence of air masson the performance of the three modules measured at the laboratories was in excellentagreement. The largest difference in measured results between the two laboratories wasnoted in the response of the modules to incident angles that exceed 75 deg.�DOI: 10.1115/1.2192559�
IntroductionThe performance characteristics of photovoltaic modules are
needed in order to model their annual performance �1–5�. Infor-mation available from manufacturers is typically limited to tem-perature coefficients, short circuit current Isc, open circuit voltageVoc, and the maximum power Pmax, at rating conditions. This in-formation, while useful in comparing photovoltaic module perfor-mance at rating conditions, is inadequate to predict annual perfor-mance under typical operating conditions �6–8�. It has beenshown that the relative performance ranking at rating conditionsmay not agree with the ranking based on annual performance �9�.Discrepancies between the rated and annual rankings are attrib-uted to the large annual variations that are experienced in incidentangle, solar spectrum, operating temperature, and solar irradianceas compared to the typical rating conditions of 25°C cell tempera-ture, a prescribed solar spectrum, 1000 W/m2 irradiance level,and zero angle of incidence.
During a multiyear study at National Institute of Standards andTechnology �NIST�, various photovoltaic modules have been in-tegrated into a building’s south-facing vertical façade �10,11�.During a typical year, the temperature of the photovoltaic cells
Contributed by the Solar Energy Division of ASME for publication in the JOUR-
NAL OF SOLAR ENERGY ENGINEERING. Manuscript received April 27, 2005; final manu-script received January 5, 2006. Review conducted by Antonio Marti. Paper pre-sented at the 2005 International Solar Energy Conference �ISEC2005�, August 6-12,
2005, Orlando, Florida.152 / Vol. 128, MAY 2006 Copyright © 20
aded 25 Jul 2010 to 150.135.114.198. Redistribution subject to ASM
varied from −13°C to over 75°C, the air mass varied from 1.02 to30, the solar irradiance varied from 0 W/m2 to 600 W/m2, andthe incident angle varied between 27 deg and 90 deg. As variousphotovoltaic modules respond differently to each of the param-eters cited above, it is not surprising that the relative performanceof photovoltaic modules exposed to actual operating conditionsdoes not duplicate that obtained at a fixed set of rating conditions�9�.
In order to accurately predict the annual performance of a pho-tovoltaic system for any given geographical location, building ori-entation, and photovoltaic cell technology, models are needed thatcan accurately predict the response of the photovoltaic systems tothe wide range of operational conditions they encounter. SandiaNational Laboratories �SNL� has developed a photovoltaic arrayperformance model �12� that is capable of predicting the annualelectrical energy output of various photovoltaic modules to within5% of the measured values �13�. The performance predictionmethodology developed by SNL has been implemented in a per-sonal computer program called PV Design Pro �14�. This modelrequires detailed input parameters that characterize the responseof a given photovoltaic module to cell temperature, solar irradi-ance, incident angle, and air mass. In order to utilize PV DesignPro to predict the annual performance of modules used in themultiyear studies at NIST, module characterization parameterswere measured at both NIST and SNL. This paper compares NISTand SNL electrical performance measurements for three photovol-
taic modules.06 by ASME Transactions of the ASME
E license or copyright; see http://www.asme.org/terms/Terms_Use.cfm
Downlo
Experimental Apparatus
Photovoltaic Modules. The three photovoltaic modules in thisstudy consisted of two custom fabricated and one commerciallyavailable module, Table 1. The custom fabricated modules wereconstructed using monocrystalline and silicon film cells and sizedto replace existing fenestration units. The commercially availablephotovoltaic module utilized triple-junction amorphous siliconphotovoltaic cells. Unlike the monocrystalline and silicon filmmodules, in which the number of cells can readily be varied toproduce modules of various sizes, the manufacturing process usedto produce triple-junction amorphous silicon modules is notreadily amendable to producing a small quantity of custom sizedmodules. The total cell, coverage, and aperture areas listed inTable 1 represent the combined cell area, the combined areas ofthe cells and any spaces between the cells, and the total area of themodule respectively. A detailed description of the modules isgiven in Fanney et al. �10�.
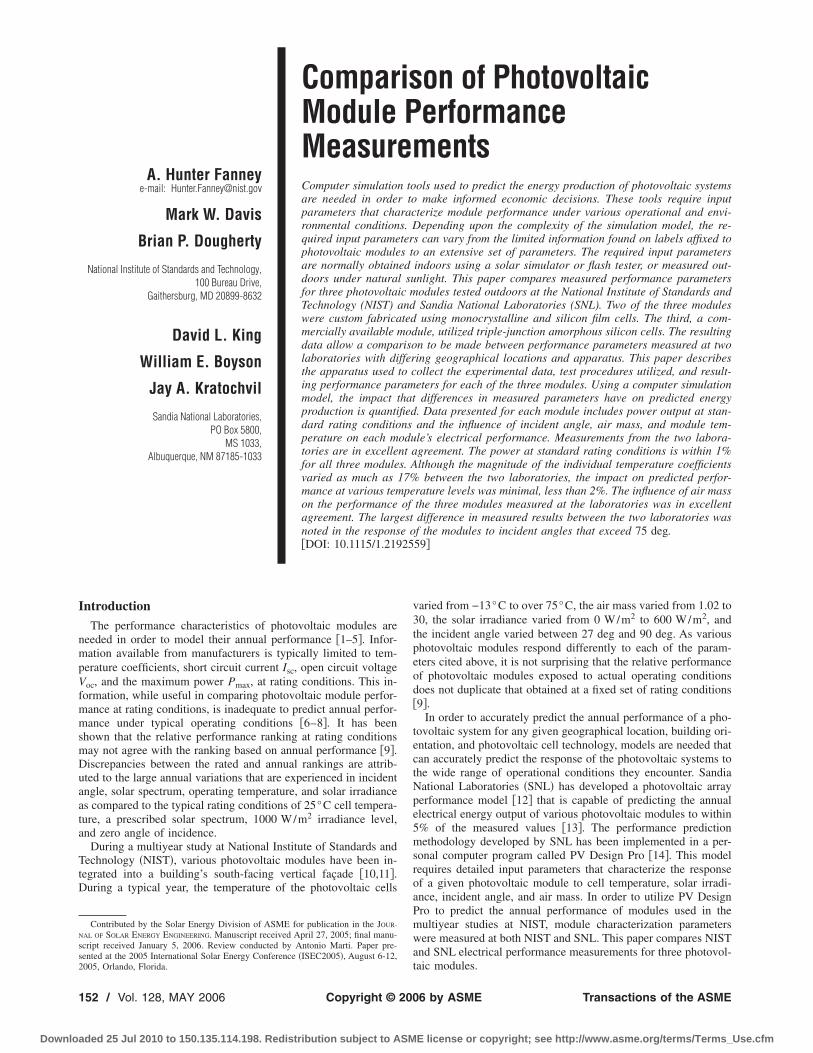
NIST and SNL Solar Tracking Test Facilities. The mobilesolar tracking facility at NIST used to characterize the electricalperformance of building integrated photovoltaic �BIPV� modulesis shown in Fig. 1. The facility incorporates meteorological instru-ments, a data acquisition system, and a current versus voltage �IV�curve tracer. Precision spectral pyranometers are used to measure
Table 1 Modu
Cell technology MonocrystallineModule dimensions �m�m� 1.38�1.18Front cover 6 mm glassEthylene vinyl acetate encapsulant �EVA� XBacksheet/Color Tedlar/CharcoalCell dimensions �mm�mm� 125�125Number of cells �in series� 72Rated power �W� 153Cell area �m2� 1.020Aperture area �m2� 1.682Coverage area �m2� 1.160
aCertain trade names and company products are mentioned in the test or identified inused. In no case does such an identification imply recommendation or endorsement bare necessarily the best available for the purpose.
Fig. 1 NIST’s mobile solar tracking facility
Journal of Solar Energy Engineering
aded 25 Jul 2010 to 150.135.114.198. Redistribution subject to ASM
total �beam plus diffuse� solar radiation. A pyreheliometer is usedto measure the beam component of solar radiation. Spectral radia-tion data from 300 nm to 1100 nm are obtained using a spectro-radiometer with selectable scan intervals. A three-cup anemometerand wind vane assembly is used to measure wind speed and di-rection, respectively. Ambient temperature is measured using aperforated tip, type-T thermocouple sensor enclosed in a naturallyventilated multiplate radiation shield. The output signals of themeteorological instruments and thermocouples associated with thebuilding integrated photovoltaic modules are measured using a60-channel data acquisition system. An electronic ice point refer-ence unit is used to reference the thermocouple junctions.
The IV curve tracer is programmed to sweep the module’s IVcurve and store the resulting values every minute. The current andvoltage resolutions are 14 mV and 2.4 mA, respectively. The solartracking test facility is powered by means of an on-board uninter-ruptible power supply �UPS� capable of operating the equipmentfor approximately 14 h. For multiple day tests, the UPS is chargedthrough the use of a portable generator.
The electrical performance testing at SNL was done with themodules mounted on a computer controlled solar tracker, Fig. 2.Meteorological data instrumentation provided wind speed �three-cup anemometer at 3 m height�, wind direction, pressure, andboth ambient and dew point temperature using an aspirated shield.Total �global� solar irradiance data were provided by a siliconreference cell and a thermopile-based pyranometer mounted onthe solar tracker, and simultaneous measurements from other fa-cility instruments provided direct normal �beam� irradiance andtotal horizontal diffuse irradiance. All solar irradiance instrumentshave calibrations traceable to established standards organizations.Like NIST, the solar spectral content was measured in thewavelength range from 300 nm to 1100 nm using a spectroradi-
specifications
Silicon film Triple-junction amorphous1.38�1.18 1.37�1.486 mm glass
aTefzelX X
Tedlar/Charcoala Stainless steel150�150 119�340
56 4492 128
1.341 1.7801.682 2.1081.371 1.815
illustration in order to adequately specify the experimental procedure and equipmente National Institute of Standards and Technology, nor does it imply that the products
le
a
any th
Fig. 2 SNL’s photovoltaic test facility
MAY 2006, Vol. 128 / 153
E license or copyright; see http://www.asme.org/terms/Terms_Use.cfm
Downlo
ometer. Multiple small gage type-T thermocouples, with an elec-tronic ice point reference mounted on the solar tracker, were usedto measure back surface module temperature.
SNL’s test facility had four separate systems for measuringmodule electrical characteristics, providing the opportunity forside-by-side outdoor testing of different module types. The IVcurve sweep was generated using dc electronic loads. The pro-grammable loads could be configured for power ranges fromabout 1 W to 1800 W using different plug-in cards. Simultaneouscurrent and voltage measurements were obtained using a pair ofprecision autoranging voltmeters with resolution of 0.0035% ofthe measured value, or about 1 mV for a module voltage of 30 V.
Measured ParametersPhotovoltaic system simulation models require information that
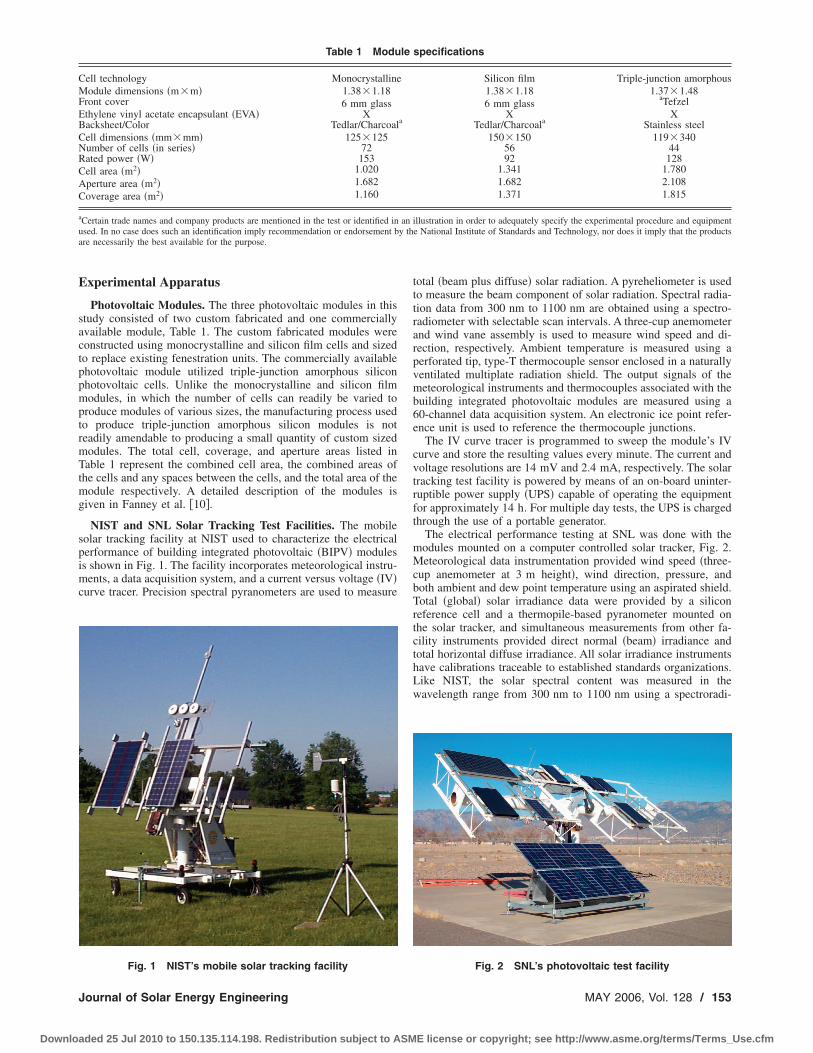
relates the electrical output of photovoltaic modules to variousenvironmental and operating conditions. In this study the inputinformation required by PV DESIGN PRO �14�, a detailed simulationmodel using algorithms developed by King et al. �12,15–17� wasmeasured using facilities at NIST and SNL. The required inputinformation, Table 2, includes the effect of temperature, air mass,and incident angle on a module’s electrical output as well as theelectrical output at standard rating conditions. A description ofeach input parameter, the method of test used to obtain each pa-
Table 2 Summary of measured
Silicon film M
Standardreferencecondition
NISTInsulated
SNLUninsulated
SNLInsulate
Pmpo�W� 103.96 104.95 104.32
Isco�A� 5.11 5.07 5.04
Voco�V� 29.61 30.12 30.23
Impo�A� 4.49 4.46 4.41
Vmpo�V� 23.17 23.53 23.66
Module temperature coefficients�ISC �A/ °C� 4.68E−03 4.78E−03 4.78E−�ISC �1/ °C� 9.16E−04 9.40E−04 1.02E−�IMP �A/ °C� 1.60E−03 2.00E−03 2.00E−�IMP, �1/ °C� 3.58E−04 4.46E−04 4.73E−�VOC �V/ °C� −1.30E−01 −1.41E−01 −1.41E−�VOC �1/ °C� −4.39E−03 −4.69E−03 −4.67E−�VMP �V/ °C� −1.30E−01 −1.40E−01 −1.40E−�VMP �1/ °C� −5.63E−03 −5.95E−03 −5.92E−Cell temperature coefficients�ISC �A/ °C� 8.36E−05 8.54E−05 8.54E−�IMP �A/ °C� 2.86E−05 3.57E−05 3.57E−�VOC �V/ °C� −2.32E−03 −2.52E−03 −2.52E−�VMP �V/ °C� −2.32E−03 −2.50E−03 −2.50E−Air mass coefficientsf�AMa� Cnst 9.38E−01 9.39E−01 9.31E−
Ama 6.22E−02 5.52E−02 6.74E−Ama2 −1.50E−02 −1.09E−02 −1.69E−Ama3 1.22E−03 8.13E−04 1.53E−Ama4 −3.40E−05 −2.35E−05 −5.52E−
Incident angle coefficientsf�AOI� Cnst 9.99E−01 1 1
AOI −6.10E−03 −2.44E−03 −2.44E−AOI2 8.12E−04 3.10E−04 3.10E−AOI3 −3.38E−05 −1.25E−05 −1.25E−AOI4 5.65E−07 2.11E−07 2.11E−AOI5 −3.37E−09 −1.36E−09 −1.36E−
The following values of uncertainty represent the expanded uncertainty usNIST measurement uncertaintiesPmpo-±2.2% Isco-±1.7%Voco-±1.1% Impo-±1.6%Vmpo-±1.4%
rameter, and the measured results follow.
154 / Vol. 128, MAY 2006
aded 25 Jul 2010 to 150.135.114.198. Redistribution subject to ASM
Temperature Coefficients. Temperature coefficients are usedto quantify the relationship between various electrical characteris-tics of a photovoltaic device and its operating temperature. UnlikeASTM E 1036-02 �18� that utilizes only the short circuit tempera-ture coefficients �ISC and the open circuit voltage temperaturecoefficient �VOC to translate measured currents and voltages tovarious operating temperatures, the algorithms developed by Kinget al. �15� use two additional temperature coefficients, the maxi-mum power current and voltage coefficients �IMP and �VMP,respectively.
The procedure specified within ASTM E 1036-02 determinesthe open-circuit voltage and short-circuit current temperature co-efficients from a matrix of open-circuit voltage and short-circuitcurrent values that result from measurements over a range of op-erating temperatures of 0°C to 80°C and a specified irradiance,typically 1000 W/m2.
ASTM E 1036-02 allows measurements to be made using apulsed indoor solar simulator, shuttered continuous solar simula-tor, shuttered sunlight, or continuous sunlight. Temperature coef-ficients for this study were determined outdoors at both laborato-ries using the methodology proposed by Sandia NationalLaboratories �12,15�. At NIST the back of each module wasplaced on a nominal 102 mm thick extruded insulation board thatextends approximately 100 mm beyond the module’s outer perim-eter. At SNL the custom fabricated module using silicon film cells
otovoltaic module parameters
ocrystalline Triple-junction amorphous
NISTInsulated
SNLUninsulated
NISTInsulated
SNLUninsulated
133.4 133.99 57.04 57.24.37 4.32 4.44 4.4842.93 43.53 23.16 23.493.96 3.92 3.61 3.5233.68 34.23 16.04 16.27
1.75E−03 1.50E−03 5.61E−03 6.58E−034.01E−04 3.50E−04 1.26E−03 1.47E−03
−1.54E−03 −1.72E−03 7.35E−03 7.50E−03−3.90E−04 −4.46E−04 2.03E−03 2.15E−03−1.52E−01 −1.74E−01 −9.31E−02 −1.04E−01−3.55E−03 −3.99E−03 −4.02E−03 −4.41E−03−1.54E−01 −1.76E−01 −4.77E−02 −5.07E−02−4.56E−03 −5.13E−03 −2.98E−03 −3.12E−03
2.43E−05 2.08E−05 - -−2.14E−05 −2.39E−05 - -−2.11E−03 −2.42E−03 - -−2.14E−03 −2.44E−03 - -
9.36E−01 9.25E−01 1.1 9.82E−015.43E−02 6.89E−02 −6.14E−02 5.88E−02
−8.68E−03 −1.39E−02 −4.43E−03 −3.73E−025.27E−04 1.15E−03 6.32E−04 4.12E−03
−1.10E−05 −3.83E−05 −1.92E−05 −1.47E−04
1 1 1 1−5.56E−03 −2.44E−03 −5.65E−03 −5.02E−036.53E−04 3.10E−04 7.25E−04 5.84E−04
−2.73E−05 −1.25E−05 −2.93E−05 −2.30E−054.64E−07 2.11E−07 4.97E−07 3.83E−07
−2.82E−09 −1.36E−09 −2.74E−09 −2.31E−09a coverage factor of 2.
SNL measurement uncertaintiesPmpo-±2.3% Isco-±1.9%Voco-±1.0% Impo-±2.0%Vmpo-±1.1%
ph
on
d
0303030401030103
05050303
010202
0305
030405
0709ing
was insulated in an identical manner to the technique used at
Transactions of the ASME
E license or copyright; see http://www.asme.org/terms/Terms_Use.cfm
Downlo
NIST. The remaining two modules were tested at SNL withoutinsulation present. Use of the insulation thermally insulates thephotovoltaic module from the tracker’s mounting structure andhelps ensure temperature uniformity as well as increasing the tem-perature range to which the module is subjected during the tem-perature coefficient tests. Prior to testing, the module is shadedwith a reflective cover positioned approximately 75 mm above thephotovoltaic module.
The average temperature of each module is determined by themean of five thermocouples attached to its rear surface. Duringthe tests, the solar tracking facilities are operated in the full track-ing mode, resulting in the sun’s rays being perpendicular to themodule’s surface throughout the test. The cover used to shade themodule is removed and data collection is initiated. The IV curvetracer at NIST captures the module’s electrical performance eachminute until the photovoltaic module’s average temperature ap-proaches steady state. The SNL current-voltage �IV� scans aremeasured at approximately 30 s intervals with the module held atthe maximum-power point condition between scans.
At NIST the tests are conducted when the absolute air mass isas close as possible to the reference value of 1.5. The measuredshort-circuit current and maximum power current is adjusted bymultiplying the measured values by the ratio of the reference ir-radiance Eo �1000 W/m2� to the measured irradiance. The cur-rents are subsequently adjusted to an absolute air mass �AMa� of1.5 by using the measured air mass function for each module. AtSNL temperature coefficient measurements are made during peri-ods of low wind conditions and “stable” sunshine conditions, typi-cally within an hour of solar noon. A spectral air mass correctionis not applied to the SNL measured current values. The adjustedIsc and Imp for each IV curve are plotted against the average mod-ule temperature. The slopes of the resulting regressions are thetemperature coefficients �isc and �imp.
The temperature coefficients for the open circuit and maximumpower voltage are determined in a similar manner using the sameset of IV curves. Unlike the short-circuit current and maximumpower current, the voltage values are assumed to be independentof the solar irradiance level and air mass. King et al. �15� foundthat there is typically less than a 5% change in the voltage coef-ficients over a tenfold change in irradiance—100 W/m2 to1000 W/m2. The open circuit and maximum power voltage foreach IV curve are plotted versus the module’s temperature. Theslope of the linear regressions relating the voltages to moduletemperature are the voltage temperature coefficients �voc and�vmp.
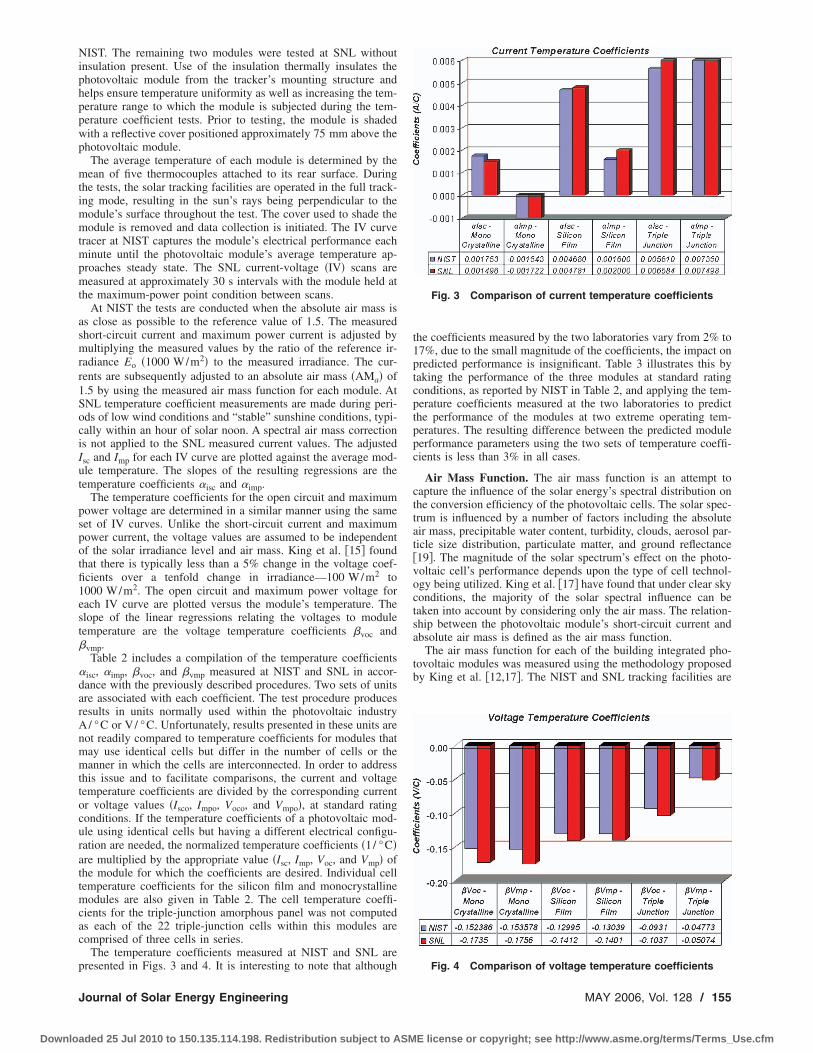
Table 2 includes a compilation of the temperature coefficients�isc, �imp, �voc, and �vmp measured at NIST and SNL in accor-dance with the previously described procedures. Two sets of unitsare associated with each coefficient. The test procedure producesresults in units normally used within the photovoltaic industryA/ °C or V/ °C. Unfortunately, results presented in these units arenot readily compared to temperature coefficients for modules thatmay use identical cells but differ in the number of cells or themanner in which the cells are interconnected. In order to addressthis issue and to facilitate comparisons, the current and voltagetemperature coefficients are divided by the corresponding currentor voltage values �Isco, Impo, Voco, and Vmpo�, at standard ratingconditions. If the temperature coefficients of a photovoltaic mod-ule using identical cells but having a different electrical configu-ration are needed, the normalized temperature coefficients �1/ °C�are multiplied by the appropriate value �Isc, Imp, Voc, and Vmp� ofthe module for which the coefficients are desired. Individual celltemperature coefficients for the silicon film and monocrystallinemodules are also given in Table 2. The cell temperature coeffi-cients for the triple-junction amorphous panel was not computedas each of the 22 triple-junction cells within this modules arecomprised of three cells in series.
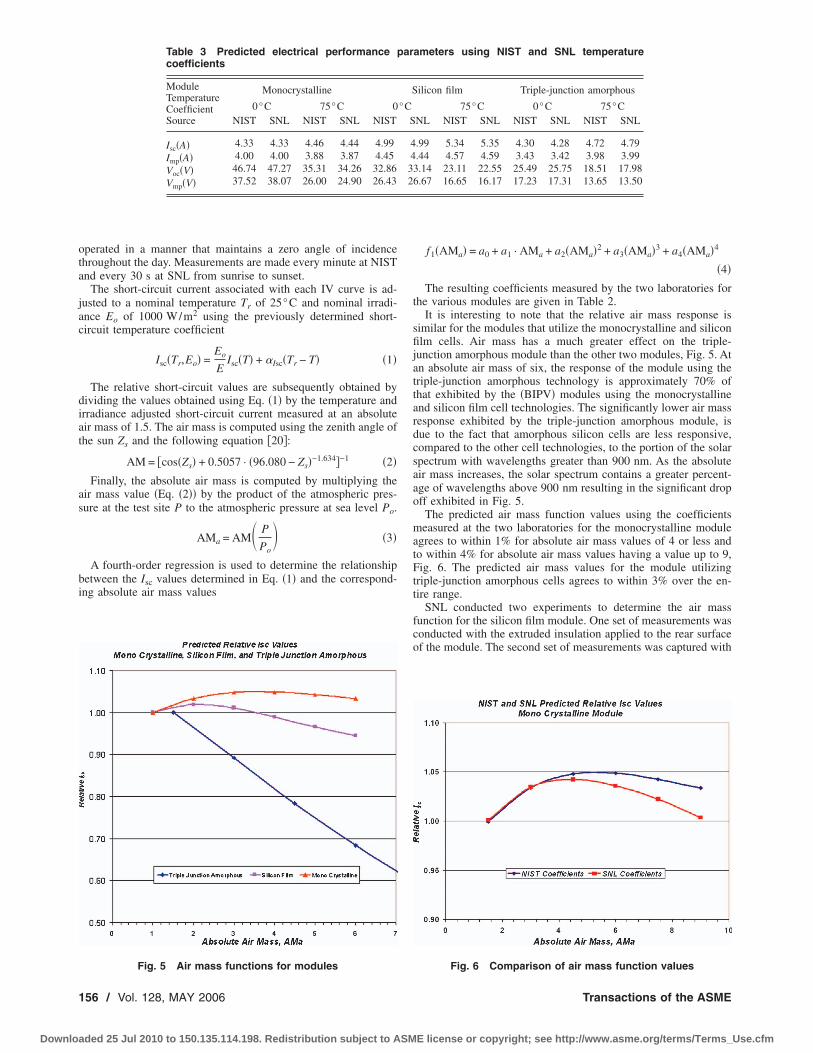
The temperature coefficients measured at NIST and SNL are
presented in Figs. 3 and 4. It is interesting to note that althoughJournal of Solar Energy Engineering
aded 25 Jul 2010 to 150.135.114.198. Redistribution subject to ASM
the coefficients measured by the two laboratories vary from 2% to17%, due to the small magnitude of the coefficients, the impact onpredicted performance is insignificant. Table 3 illustrates this bytaking the performance of the three modules at standard ratingconditions, as reported by NIST in Table 2, and applying the tem-perature coefficients measured at the two laboratories to predictthe performance of the modules at two extreme operating tem-peratures. The resulting difference between the predicted moduleperformance parameters using the two sets of temperature coeffi-cients is less than 3% in all cases.
Air Mass Function. The air mass function is an attempt tocapture the influence of the solar energy’s spectral distribution onthe conversion efficiency of the photovoltaic cells. The solar spec-trum is influenced by a number of factors including the absoluteair mass, precipitable water content, turbidity, clouds, aerosol par-ticle size distribution, particulate matter, and ground reflectance�19�. The magnitude of the solar spectrum’s effect on the photo-voltaic cell’s performance depends upon the type of cell technol-ogy being utilized. King et al. �17� have found that under clear skyconditions, the majority of the solar spectral influence can betaken into account by considering only the air mass. The relation-ship between the photovoltaic module’s short-circuit current andabsolute air mass is defined as the air mass function.
The air mass function for each of the building integrated pho-tovoltaic modules was measured using the methodology proposedby King et al. �12,17�. The NIST and SNL tracking facilities are
Fig. 3 Comparison of current temperature coefficients
Fig. 4 Comparison of voltage temperature coefficients
MAY 2006, Vol. 128 / 155
E license or copyright; see http://www.asme.org/terms/Terms_Use.cfm
Downlo
operated in a manner that maintains a zero angle of incidencethroughout the day. Measurements are made every minute at NISTand every 30 s at SNL from sunrise to sunset.
The short-circuit current associated with each IV curve is ad-justed to a nominal temperature Tr of 25°C and nominal irradi-ance Eo of 1000 W/m2 using the previously determined short-circuit temperature coefficient
Isc�Tr,Eo� =Eo
EIsc�T� + �Isc�Tr − T� �1�
The relative short-circuit values are subsequently obtained bydividing the values obtained using Eq. �1� by the temperature andirradiance adjusted short-circuit current measured at an absoluteair mass of 1.5. The air mass is computed using the zenith angle ofthe sun Zs and the following equation �20�:
AM = �cos�Zs� + 0.5057 · �96.080 − Zs�−1.634�−1 �2�Finally, the absolute air mass is computed by multiplying the
air mass value �Eq. �2�� by the product of the atmospheric pres-sure at the test site P to the atmospheric pressure at sea level Po.
AMa = AM� P
Po� �3�
A fourth-order regression is used to determine the relationshipbetween the Isc values determined in Eq. �1� and the correspond-ing absolute air mass values
Table 3 Predicted electrical performance pcoefficients
ModuleTemperatureCoefficientSource
Monocrystalline
0°C 75°C 0NIST SNL NIST SNL NIST
Isc�A� 4.33 4.33 4.46 4.44 4.99Imp�A� 4.00 4.00 3.88 3.87 4.45Voc�V� 46.74 47.27 35.31 34.26 32.86Vmp�V� 37.52 38.07 26.00 24.90 26.43
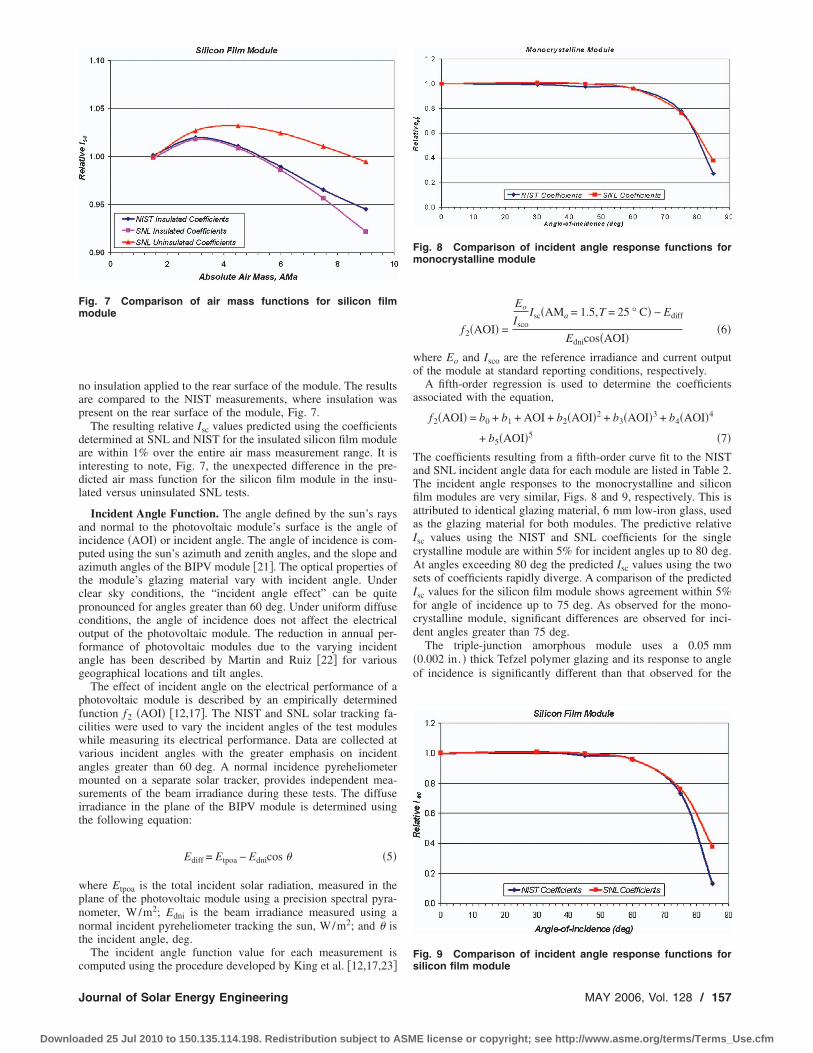
Fig. 5 Air mass functions for modules
156 / Vol. 128, MAY 2006
aded 25 Jul 2010 to 150.135.114.198. Redistribution subject to ASM
f1�AMa� = a0 + a1 · AMa + a2�AMa�2 + a3�AMa�3 + a4�AMa�4
�4�The resulting coefficients measured by the two laboratories for
the various modules are given in Table 2.It is interesting to note that the relative air mass response is
similar for the modules that utilize the monocrystalline and siliconfilm cells. Air mass has a much greater effect on the triple-junction amorphous module than the other two modules, Fig. 5. Atan absolute air mass of six, the response of the module using thetriple-junction amorphous technology is approximately 70% ofthat exhibited by the �BIPV� modules using the monocrystallineand silicon film cell technologies. The significantly lower air massresponse exhibited by the triple-junction amorphous module, isdue to the fact that amorphous silicon cells are less responsive,compared to the other cell technologies, to the portion of the solarspectrum with wavelengths greater than 900 nm. As the absoluteair mass increases, the solar spectrum contains a greater percent-age of wavelengths above 900 nm resulting in the significant dropoff exhibited in Fig. 5.
The predicted air mass function values using the coefficientsmeasured at the two laboratories for the monocrystalline moduleagrees to within 1% for absolute air mass values of 4 or less andto within 4% for absolute air mass values having a value up to 9,Fig. 6. The predicted air mass values for the module utilizingtriple-junction amorphous cells agrees to within 3% over the en-tire range.
SNL conducted two experiments to determine the air massfunction for the silicon film module. One set of measurements wasconducted with the extruded insulation applied to the rear surfaceof the module. The second set of measurements was captured with
ameters using NIST and SNL temperature
ilicon film Triple-junction amorphous
75°C 0°C 75°CNL NIST SNL NIST SNL NIST SNL
.99 5.34 5.35 4.30 4.28 4.72 4.79
.44 4.57 4.59 3.43 3.42 3.98 3.993.14 23.11 22.55 25.49 25.75 18.51 17.986.67 16.65 16.17 17.23 17.31 13.65 13.50
ar
S
°CS
4432
Fig. 6 Comparison of air mass function values
Transactions of the ASME
E license or copyright; see http://www.asme.org/terms/Terms_Use.cfm
Downlo
no insulation applied to the rear surface of the module. The resultsare compared to the NIST measurements, where insulation waspresent on the rear surface of the module, Fig. 7.
The resulting relative Isc values predicted using the coefficientsdetermined at SNL and NIST for the insulated silicon film moduleare within 1% over the entire air mass measurement range. It isinteresting to note, Fig. 7, the unexpected difference in the pre-dicted air mass function for the silicon film module in the insu-lated versus uninsulated SNL tests.
Incident Angle Function. The angle defined by the sun’s raysand normal to the photovoltaic module’s surface is the angle ofincidence �AOI� or incident angle. The angle of incidence is com-puted using the sun’s azimuth and zenith angles, and the slope andazimuth angles of the BIPV module �21�. The optical properties ofthe module’s glazing material vary with incident angle. Underclear sky conditions, the “incident angle effect” can be quitepronounced for angles greater than 60 deg. Under uniform diffuseconditions, the angle of incidence does not affect the electricaloutput of the photovoltaic module. The reduction in annual per-formance of photovoltaic modules due to the varying incidentangle has been described by Martin and Ruiz �22� for variousgeographical locations and tilt angles.
The effect of incident angle on the electrical performance of aphotovoltaic module is described by an empirically determinedfunction f2 �AOI� �12,17�. The NIST and SNL solar tracking fa-cilities were used to vary the incident angles of the test moduleswhile measuring its electrical performance. Data are collected atvarious incident angles with the greater emphasis on incidentangles greater than 60 deg. A normal incidence pyreheliometermounted on a separate solar tracker, provides independent mea-surements of the beam irradiance during these tests. The diffuseirradiance in the plane of the BIPV module is determined usingthe following equation:
Ediff = Etpoa − Ednicos � �5�
where Etpoa is the total incident solar radiation, measured in theplane of the photovoltaic module using a precision spectral pyra-nometer, W/m2; Edni is the beam irradiance measured using anormal incident pyreheliometer tracking the sun, W/m2; and � isthe incident angle, deg.
The incident angle function value for each measurement is
Fig. 7 Comparison of air mass functions for silicon filmmodule
computed using the procedure developed by King et al. �12,17,23�
Journal of Solar Energy Engineering
aded 25 Jul 2010 to 150.135.114.198. Redistribution subject to ASM
f2�AOI� =
Eo
IscoIsc�AMa = 1.5,T = 25 ° C� − Ediff
Ednicos�AOI��6�
where Eo and Isco are the reference irradiance and current outputof the module at standard reporting conditions, respectively.
A fifth-order regression is used to determine the coefficientsassociated with the equation,
f2�AOI� = b0 + b1 + AOI + b2�AOI�2 + b3�AOI�3 + b4�AOI�4
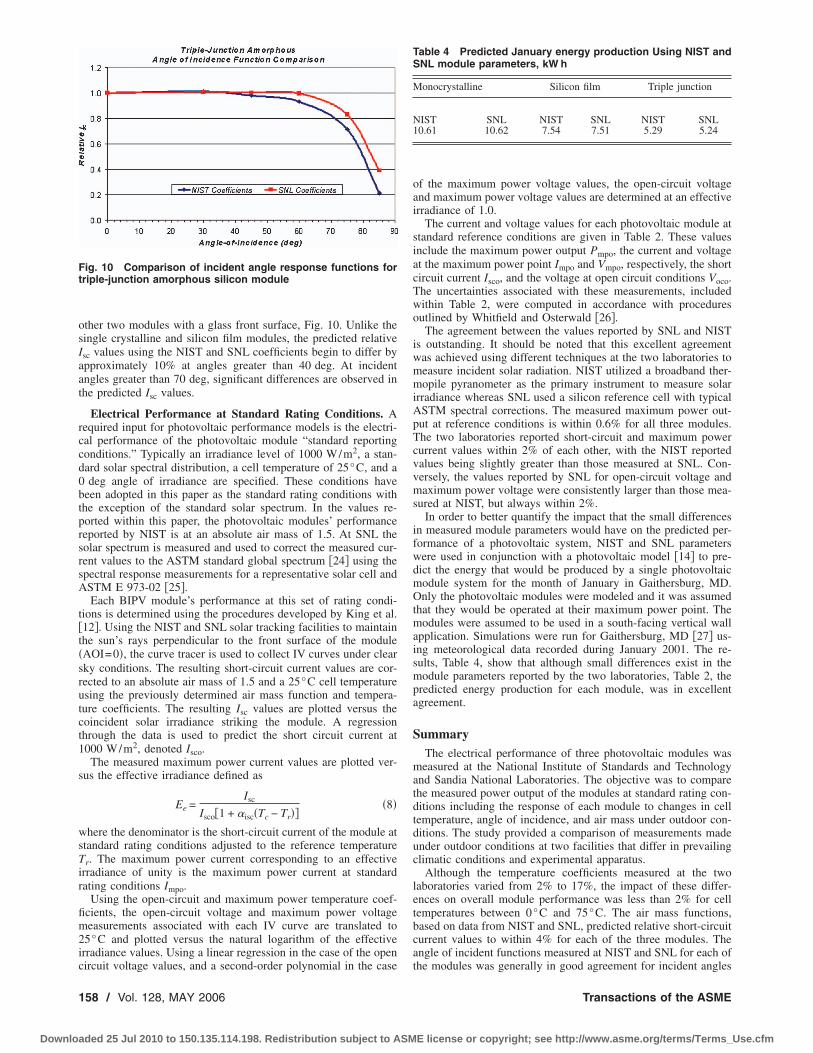
+ b5�AOI�5 �7�The coefficients resulting from a fifth-order curve fit to the NISTand SNL incident angle data for each module are listed in Table 2.The incident angle responses to the monocrystalline and siliconfilm modules are very similar, Figs. 8 and 9, respectively. This isattributed to identical glazing material, 6 mm low-iron glass, usedas the glazing material for both modules. The predictive relativeIsc values using the NIST and SNL coefficients for the singlecrystalline module are within 5% for incident angles up to 80 deg.At angles exceeding 80 deg the predicted Isc values using the twosets of coefficients rapidly diverge. A comparison of the predictedIsc values for the silicon film module shows agreement within 5%for angle of incidence up to 75 deg. As observed for the mono-crystalline module, significant differences are observed for inci-dent angles greater than 75 deg.
The triple-junction amorphous module uses a 0.05 mm�0.002 in. � thick Tefzel polymer glazing and its response to angleof incidence is significantly different than that observed for the
Fig. 8 Comparison of incident angle response functions formonocrystalline module
Fig. 9 Comparison of incident angle response functions for
silicon film moduleMAY 2006, Vol. 128 / 157
E license or copyright; see http://www.asme.org/terms/Terms_Use.cfm
Downlo
other two modules with a glass front surface, Fig. 10. Unlike thesingle crystalline and silicon film modules, the predicted relativeIsc values using the NIST and SNL coefficients begin to differ byapproximately 10% at angles greater than 40 deg. At incidentangles greater than 70 deg, significant differences are observed inthe predicted Isc values.
Electrical Performance at Standard Rating Conditions. Arequired input for photovoltaic performance models is the electri-cal performance of the photovoltaic module “standard reportingconditions.” Typically an irradiance level of 1000 W/m2, a stan-dard solar spectral distribution, a cell temperature of 25°C, and a0 deg angle of irradiance are specified. These conditions havebeen adopted in this paper as the standard rating conditions withthe exception of the standard solar spectrum. In the values re-ported within this paper, the photovoltaic modules’ performancereported by NIST is at an absolute air mass of 1.5. At SNL thesolar spectrum is measured and used to correct the measured cur-rent values to the ASTM standard global spectrum �24� using thespectral response measurements for a representative solar cell andASTM E 973-02 �25�.
Each BIPV module’s performance at this set of rating condi-tions is determined using the procedures developed by King et al.�12�. Using the NIST and SNL solar tracking facilities to maintainthe sun’s rays perpendicular to the front surface of the module�AOI=0�, the curve tracer is used to collect IV curves under clearsky conditions. The resulting short-circuit current values are cor-rected to an absolute air mass of 1.5 and a 25°C cell temperatureusing the previously determined air mass function and tempera-ture coefficients. The resulting Isc values are plotted versus thecoincident solar irradiance striking the module. A regressionthrough the data is used to predict the short circuit current at1000 W/m2, denoted Isco.
The measured maximum power current values are plotted ver-sus the effective irradiance defined as
Ee =Isc
Isco�1 + �isc�Tc − Tr���8�
where the denominator is the short-circuit current of the module atstandard rating conditions adjusted to the reference temperatureTr. The maximum power current corresponding to an effectiveirradiance of unity is the maximum power current at standardrating conditions Impo.
Using the open-circuit and maximum power temperature coef-ficients, the open-circuit voltage and maximum power voltagemeasurements associated with each IV curve are translated to25°C and plotted versus the natural logarithm of the effectiveirradiance values. Using a linear regression in the case of the open
Fig. 10 Comparison of incident angle response functions fortriple-junction amorphous silicon module
circuit voltage values, and a second-order polynomial in the case
158 / Vol. 128, MAY 2006
aded 25 Jul 2010 to 150.135.114.198. Redistribution subject to ASM
of the maximum power voltage values, the open-circuit voltageand maximum power voltage values are determined at an effectiveirradiance of 1.0.
The current and voltage values for each photovoltaic module atstandard reference conditions are given in Table 2. These valuesinclude the maximum power output Pmpo, the current and voltageat the maximum power point Impo and Vmpo, respectively, the shortcircuit current Isco, and the voltage at open circuit conditions Voco.The uncertainties associated with these measurements, includedwithin Table 2, were computed in accordance with proceduresoutlined by Whitfield and Osterwald �26�.
The agreement between the values reported by SNL and NISTis outstanding. It should be noted that this excellent agreementwas achieved using different techniques at the two laboratories tomeasure incident solar radiation. NIST utilized a broadband ther-mopile pyranometer as the primary instrument to measure solarirradiance whereas SNL used a silicon reference cell with typicalASTM spectral corrections. The measured maximum power out-put at reference conditions is within 0.6% for all three modules.The two laboratories reported short-circuit and maximum powercurrent values within 2% of each other, with the NIST reportedvalues being slightly greater than those measured at SNL. Con-versely, the values reported by SNL for open-circuit voltage andmaximum power voltage were consistently larger than those mea-sured at NIST, but always within 2%.
In order to better quantify the impact that the small differencesin measured module parameters would have on the predicted per-formance of a photovoltaic system, NIST and SNL parameterswere used in conjunction with a photovoltaic model �14� to pre-dict the energy that would be produced by a single photovoltaicmodule system for the month of January in Gaithersburg, MD.Only the photovoltaic modules were modeled and it was assumedthat they would be operated at their maximum power point. Themodules were assumed to be used in a south-facing vertical wallapplication. Simulations were run for Gaithersburg, MD �27� us-ing meteorological data recorded during January 2001. The re-sults, Table 4, show that although small differences exist in themodule parameters reported by the two laboratories, Table 2, thepredicted energy production for each module, was in excellentagreement.
SummaryThe electrical performance of three photovoltaic modules was
measured at the National Institute of Standards and Technologyand Sandia National Laboratories. The objective was to comparethe measured power output of the modules at standard rating con-ditions including the response of each module to changes in celltemperature, angle of incidence, and air mass under outdoor con-ditions. The study provided a comparison of measurements madeunder outdoor conditions at two facilities that differ in prevailingclimatic conditions and experimental apparatus.
Although the temperature coefficients measured at the twolaboratories varied from 2% to 17%, the impact of these differ-ences on overall module performance was less than 2% for celltemperatures between 0°C and 75°C. The air mass functions,based on data from NIST and SNL, predicted relative short-circuitcurrent values to within 4% for each of the three modules. Theangle of incident functions measured at NIST and SNL for each of
Table 4 Predicted January energy production Using NIST andSNL module parameters, kW h
Monocrystalline Silicon film Triple junction
NIST SNL NIST SNL NIST SNL10.61 10.62 7.54 7.51 5.29 5.24
the modules was generally in good agreement for incident angles
Transactions of the ASME
E license or copyright; see http://www.asme.org/terms/Terms_Use.cfm
Downlo
of 70° or less. At incident angles that exceed 70°, significant dif-ferences were observed in the predicted Isc values.
The performance of each module at standard rating conditionswas determined using the procedure developed by King et al.�12,16�. The short circuit and maximum power current values re-ported by the two laboratories are within 2%, with the NIST re-ported values consistently greater than those reported by SNL.Conversely, the SNL reported values for open-circuit and maxi-mum power voltages were consistently higher, approximately 2%,than the values determined at NIST. The power output at standardrating conditions was in excellent agreement, within 1%, for eachof the three modules. Finally, the full set of NIST and SNL mea-sured parameters, Table 2, were used in conjunction with a pho-tovoltaic system model �14� to predict monthly energy productionfor the modules using meteorological data recorded during Janu-ary 2001 at Gaithersburg, MD. The monthly energy productionpredicted using the parameters measured by the two differentlaboratories agreed to within 1% for all three modules.
AcknowledgmentThe authors greatly appreciate the financial support provided by
Gerald Ceasar of NIST’s Advanced Technology Program. The au-thors acknowledge Paula R. Svincek for preparing the manuscript,Andrew Heath for preparing the graphics, and Steven Bushey forrunning the computer model simulations. Sandia is a multipro-gram laboratory operated by Sandia Corporation, a LockheedMartin Company, for the United States Department of Energy’sNational Nuclear Security Administration under Contract No. DE-AC04-94AL85000.
References�1� King, D. L., Boyson, W. E., and Kratochvil, J. A., 2002, “Analysis of Factors
Influencing the Annual Energy Production of Photovoltaic Systems,” Proceed-ings of the 29th IEEE Photovoltaic Specialists Conference, New Orleans, LA,May 20–24, pp. 1356–1361.
�2� Marion, B., 2002, “A Method for Modeling the Current-Voltage Curve of a PVModule for Outdoor Conditions,” Prog. Photovoltaics 10, pp. 205–214.
�3� Marion, B., Rummel, S., and Anderberg, A., 2004, “Current-Voltage CurveTranslation by Bilinear Interpolation,” Prog. Photovoltaics 12, pp. 593–607.
�4� Nakajima, A., Ichikawa, M., Kondo, M., Yamamoto, K., Yamagishi, H., andTawada, Y., 2004, “Spectral Effects of a Single-Junction Amorphous SiliconSolar Cell on Outdoor Performance,” Jpn. J. Appl. Phys., Part 1 Part 1,43�5A�, pp. 2425–2531.
�5� Kroposki, B., Marion, W., King, D. L., Boyson, W. E., and Kratochvil, J.,2002, “Comparison of Module Performance Characterization Methods for En-ergy Production,” Paper No. NREL/TP-520-29245.
�6� Marion, B., Kroposki, B., Emergy, K., del Cueto, J., Myers, D., and Osterwald,C., 1999, “Validation of a Photovoltaic Module Energy Ratings Procedure atNREL,” Paper No. NREL/TP-529-26909.
�7� Gay, C. F., Rumberg, J. E., and Wilson, J. H., 1982, “AM-PM: All Day Mod-
ule Performance Measurements,” Proc. 16th IEEE Photovoltaic Specialist’Journal of Solar Energy Engineering
aded 25 Jul 2010 to 150.135.114.198. Redistribution subject to ASM
Conf., San Diego, IEEE New York, pp. 1041–1046.�8� Firor, K., 1985, “Rating PV Systems,” Proc. 18th IEEE Photovoltaic Specialist
Conference, Las Vegas, NV, October, pp. 1443–1448.�9� Fanney, A. H., Dougherty, B. P., and Davis, M. W., 2002, “Performance and
Characterization of Building Integrated Photovoltaic Panels,” Proc. 29th IEEEPhotovoltaic Specialists Conference, �CD-ROM� New Orleans, LA, May 20–24.
�10� Fanney, A. H., Dougherty, B. P., and Davis, M. W., 2001, “Measured Perfor-mance of Building Integrated Photovoltaic Panels,” Sol. Energy, 123, pp.187–193.
�11� Dougherty, B. P., Fanney, A. H., and Davis, M. W., 2005, “Measured Perfor-mance of Building Integrated Photovoltaic Panels-Round 2,” Sol. Energy,127, pp. 314–323.
�12� King, D. L., Boyson, W. E., and Kratochvil, J. A., 2004, “Photovoltaic ArrayPerformance Model,” Sandia Report No. SAND 2004-3535.
�13� Davis, M. W., Fanney, A. H., and Dougherty, B. P., 2002, “Evaluating Build-ing Integrated Photovoltaic Performance Models,” Proc. 29th IEEE Photovol-taic Specialists Conference, �CD-ROM� New Orleans, LA, May 20–24.
�14� PV-Design Pro, 2000, Solar Design Studio, v4.0, Maui Solar Energy SoftwareCorp., Haiku, HI.
�15� King, D. L., Kratochvil, J. A., and Boyson, W. E., 1997, “Temperature Coef-ficients for PV Modules and Arrays: Measurement Methods, Difficulties, andResults,” Proc. 26th IEEE Photovoltaic Specialists Conference, Anaheim, CA,September 29–October 3, pp. 1183–1186.
�16� King, D. L., 1996, “Photovoltaic Module and Array Performance Character-ization Methods for All System Operating Conditions,” Proc. NREL/SNL Pho-tovoltaics Program Review, New York, AIP Press, Lakewood, CO, November18–22, pp. 347–368.
�17� King, D. L., Kratochvil, J. A., and Boyson, W. E., 1997, “Measuring SolarSpectral and Angle-of-Incidence Effects on Photovoltaic Modules and SolarIrradiance Sensors,” Proc. 26th IEEE Photovoltaic Specialists Conference,Anaheim, CA, September 29–October 3, pp. 1113–1116.
�18� ASTM E 1036-02, “Standard Test Methods for Electrical Performance of Non-concentrator Terrestrial Photovoltaic Modules and Arrays Using ReferenceCells,” Annual Book of ASTM Standards, Vol. 12.02.
�19� Myers, D. R., and Emery, K., 2002, “Terrestrial Solar Spectral Modeling Toolsand Applications for Photovoltaic Devices,” IEEE 2002, May 20–24, pp.1683–1686.
�20� Kasten, F., and Young, T., 1989, “Revised Optical Air Mass Tables and Ap-proximation Formula,” Appl. Opt. 28�22�, pp. 4735–4738.
�21� Duffie, J. A., and Beckman, W. A., 1991, Solar Engineering of Thermal Pro-cesses, John Wiley and Sons, New York.
�22� Martin, N., and Ruiz, J. M., 2005, “Annual Angular Reflection Losses in PVModules, Prog. Photovoltaics 13, pp. 75–84.
�23� King, D. L., Kratochvil, J. A., and Boyson, W. E., 1998, “Field Experiencewith a New Performance Characterization Procedure for Photovoltaic Arrays,”Proc. 2nd World Conference and Exhibition on Photovoltaic Solar EnergyConversion, Vienna, Austria, July 6–10.
�24� ASTM G 159-98, “Standard Tables for References Solar Spectral at Air Mass1.5: Direct Hemispherical for a 37° Tilted Surface,” Annual Book of ASTMStandards, Vol. 14.04.
�25� ASTM E 973-02, “Determination of the Spectral Mismatch Parameter Be-tween a Photovoltaic Device and a Photovoltaic Reference Cell,” Annual bookof ASTM Standards, Vol. 12.02.
�26� Whitfield, K., and Osterwald, C. R., 2001, “Procedure for Determining theUncertainty of Photovoltaic Module Outdoor Electrical Performance,” Prog.Photovoltaics 9, pp. 87–102.
�27� Fanney, A. H., and Dougherty, B. P., 2001, “Building Integrated Photovoltaic
Test Facility,” Sol. Energy 123, pp. 200–210.MAY 2006, Vol. 128 / 159
E license or copyright; see http://www.asme.org/terms/Terms_Use.cfm


![Drinking and recreational water-related diseases: a bibliometric … · 2017. 8. 29. · charge machining in tap water of Ti-6Al-4 V and param-eters optimization” [19]. Whenever](https://img.pdfslide.net/doc/110x75/60d8a2fd3bcb7a2a87386df8/drinking-and-recreational-water-related-diseases-a-bibliometric-2017-8-29.jpg)
![SEVENTH FRAMEWORK PROGRAMME...span areas as civil security, health care, agriculture, research, environmen-tal, commercial and military applications [53,6]. There are many param-eters](https://img.pdfslide.net/doc/110x75/5f0a6e7c7e708231d42b9a0b/seventh-framework-programme-span-areas-as-civil-security-health-care-agriculture.jpg)


![arXiv:1702.01522v4 [cond-mat.dis-nn] 6 Nov 2017of quantities normally considered as xed model param-eters (couplings, elds). The observables, such as spin correlations and magnetisations](https://img.pdfslide.net/doc/110x75/5e75a5237bb3f47097071753/arxiv170201522v4-cond-matdis-nn-6-nov-2017-of-quantities-normally-considered.jpg)