Embed Size (px)
Citation preview

COMPARISON OF PHYSICAL AND CHEMICAL CHARACTERISTICS OF IN-SITU BURN RESIDUE AND OTHER ENVIRONMENTAL OIL SAMPLES COLLECTED DURING THE DEEPWATER HORIZON SPILL RESPONSE
Prepared for
Bureau of Safety and Environmental Enforcement (DOIBSEE Agreement Code E13PG00001)
Prepared by
Gary Shigenaka NOAAERD National Oceanic and Atmospheric AdministrationEmergency Response Division
Seattle WA
Ed Overton LSU Buffy Meyer LSU
Heng Gao LSU Scott Miles LSU
Louisiana State UniversityDepartment of Environmental Sciences Baton Rouge LA
June 2015
EXECUTIVE SUMMARY
The 2010 Deepwater Horizon oil spill was the largest in US marine waters and ultimately involved a number of remedial actions that were unprecedented in scale and scope Among these was the technique of in‐situ burning or the controlled combustion of spilled oil in the environment While in‐situ burning had been used for spill response a number of times over the years on both land and water prior to the BP spill in the Gulf of Mexico the Deepwater Horizon burn operations were by far the largest application of the method an estimated 260000 barrels (bbl)109 million gallons of oil were burned between April 28 and July 12 2010 This volume of oil was equivalent to the total volume estimated to have spilled from the Exxon Valdez the nationrsquos largest oil spill prior to the Deepwater Horizon
The scale and duration of the Deepwater Horizon release provided an opportunity to both refine and optimize the operational aspects of in-situ burning of the oil and also to observe the behavior of the burn residue that remained after the oil had been combusted The Macondo wellhead was located at a depth of 1500 m and the largest proportion of in-situ burns took place within 25 km of the wellhead location As such most of the burn residue sank into the deep waters of the Gulf of Mexico
The fate of the large volume of burn residue was of interest but not necessarily an operational concern or consideration However four months after the wellhead was capped and in-situ burn activities had ceased a chance encounter by a small commercial deepwater shrimp fishery (royal red shrimp Hymenopeneaus robustus or Pleoticus robustus) with sunken tarballs at 200 m depth resulted in a closure of that fishery by federal officials and renewed interest in the environmental fate of in-situ burn residue Chemical analyses of the deep water tarballs by chemistry labs supporting the spill response suggested that at least some of the tarballs were burn residues associated with response activities
This study analyzed several oil residue matrices collected during the Deepwater Horizon response and from other sources and compared similarities and differences in physical characteristics and chemical composition with the objective of identifying features that appeared to be unique to in-situ burn residue Samples included Macondo oil collected at the wellhead tarballs recovered from deep water shrimp trawls before and after field samples from operational in-situ burns during the Deepwater Horizon response before and after laboratory samples from controlled burns performed at Louisiana State University (LSU) and a range of oil residues encountered in various habitats during the response The results and forensic interpretations will aid in anticipating the environmental fate of burned oil residues and potential impacts to proximal human activities In addition with greater understanding of residue behaviors strategies for potentially recovering neutrally‐buoyant or sunken in‐situ burn residue can be designed and tested
The sample amounts available for some of the materials were very limited and restricted the number of analyses (particularly physical) that could be performed Highest priority physical characterizations performed on the oil residues were density and percent asphaltenes content These parameters were judged to provide information specific to in-situ burn residues based on preliminary work with these two parameters performed at LSU Chemical characterization of all samples was carried out using gas chromatographymass spectrometry (GCMS) operated in selected ion monitoring (SIM) The target GCMS‐SIM analytes have been widely used to identify petrogenic biogenic and pyrogenic hydrocarbons in a variety of sample matrices These included selected aromatic hydrocarbons and their alkyl homologs saturate compounds from C10 to C35 the isoprenoids pristane and phytane- and four groups of oil ldquobiomarkersrdquo The oil biomarkers
1
included the tri‐ and pentacyclic hopanes- diasteranes and regular steranes- 14β(H) steranes and the triaromatic steroids
The physical and chemical results were used both directly as well as in directly incorporated into indices to make forensic assessments about the oil residues For example petrogenicpyrogenic indices (Fossil Fuel Pollution Index and Wang Pyrogenic Index) were calculated using aromatic hydrocarbon concentrations Biomarker ratios were used to determine if tarballs could be sourced back to Macondo oil origins Asphaltene content appeared to reflect weathered condition of oil residues
A primary objective of this study was to identify possible indicators that could distinguish in‐situ burn residues from other oil residues based on physical and chemical analyses of actual Deepwater Horizon in‐situ burn samples and samples generated from controlled laboratory burns The results showed that there was no single reliable indicator of in‐situ burning among those examined However partial indicators (eg differences in normal alkane profile enhancement of pyrogenic PAHs reduction in the modified Fossil Fuel Pollution Index) when considered as an integrated whole can point to in‐situ burning as the significant driver of weathering and fate
The majority of residues from the Deepwater Horizon oil spill retained their oil biomarker signatures making diagnostic ratio analyses possible The diagnostic ratios were used to
1) Determine if the oil residue was a match to Macondo oil and 2) Determine if there were any differences in the ratios in matching oil residues based on sample matrix and sampling location
Specifically a total of 4 out of the 15 diagnostic biomarker ratios did distinguish in‐situ burn residues from the majority of the other residues Two of these ratios (C28 aaa‐RC29 aaa‐R and C27 BB (S+R)C28 BB (S+R) + C29 BB (S+R)) may be useful for distinguishing ISB oil from other oil residues and in-situ burn tarballs from other tarballs respectively Significant differences were also determined in the comparison of sampling locations These results suggest that weathering of oil residues from the same initial source is highly dependent on the specific environmental compartment in which they reside and the processes driving the weathering within that compartment but these specificities do not compromise the ability to make matchnon‐match determinations with the ratios
It is important to note that the chemical characterization method (GCMS) and target analyte list used for this report only examines about 5 of the total oil mass Other newer or more advanced analytical approaches can separate and identify a much larger percentage of oil constituents and hold promise for the future
The fate of the burn residue from the Deepwater Horizon in‐situ burn operations might never have been known were it not for the chance encounters of the single deep water fishery operating in the same general area as most of the burn operations Impacts to the fishery were minimal and it was quickly re‐opened after testing and analysis by federal fisheries managers and seafood safety specialists However the experience represents a cautionary footnote for future large‐scale in‐situ burn operations that should be factored into response tradeoff analyses In addition the Deepwater Horizon episode suggests a need for additional research into burn residue containment or recovery methods that would reduce or eliminate potential fishery impacts associated with sinking residue
2
ABSTRACT
An unprecedented volume of crude oil was burned during the Deepwater Horizon oil spill response with an estimated 220000-310000 bbl of surface oil consumed by in-situ burning over a ten-week period in 2010 Most of the resultant burn residue from these large-scale operations sank in the relatively deep waters of the Gulf of Mexico However in late 2010 the deep water royal red shrimp fishery operating north of the Macondo wellhead (also referred to by its lease designation Mississippi Canyon Block 252 or MC252) and the primary burn zone encountered tarballs at 200 m At least some of these tarballs were tentatively sourced as Deepwater Horizon in-situ burn residue
This project physically and chemically characterized oil and residue samples from the Deepwater Horizon response as well as laboratory samples of source and burned crude oil to provide insights into the changes that occur when oil is burned Deepwater Horizon burn operations were confirmed as the source for tarballs recovered in shrimp trawls Potential markers of burned crude oil were identified in order to distinguish burn residue from other weathered forms of the same crude oil
INTRODUCTION
In-situ burningmdashthe controlled combustion of spilled oil in the environmentmdashwas one of many remedial techniques employed during the prolonged Deepwater Horizon oil spill response in the Gulf of Mexico in 2010 It has been called the oldest cleanup method applied to oil spills (Fingas 2011) but documentation of its use and scientific evaluation of its efficacy has been spotty and inconsistent over the years Fingas (2011) listed 45 on-water in-situ burns performed during spills or experiments between 1958 and 2008 Although the technique was successfully tested during the landmark Exxon Valdez oil spill in Prince William Sound AK in 1989 (Figure 1) real validation and rigorous scientific evaluation as a response tool occurred in 1993 during a unique experiment off the eastern coast of Canada in 1993 The Newfoundland Offshore Burn Experiment (NOBE Figure 2) was a collaborative effort among 25 agencies from Canada and the US to conduct two experimental burns of Alberta Sweet crude oil to demonstrate feasibility of burning spilled oil on marine waters and to collect a wide range of data related to burn parameters and emissions (Fingas et al 1994a) The NOBE experience was considered to be a logistical and technical success and yielded a wealth of technical and operational information that has been used as the basis for in-situ burn plans and policies ever since
In-situ burning has been used for spill response a number of times over the years on both land and water Fingas (2011) provided a comprehensive overview of the state of knowledge just prior to the Deepwater Horizon incident and a summary of at-sea applications during oil spill response In addition to the 45 water-borne examples listed by Fingas Michel et al (2005) found it was frequently used on the terrestrial side as well however reasonable documentation was available for only 31 of an apparently much larger total Indisputably though the Deepwater Horizon burn operations (Figures 3 amp 4) were by far the largest application of the method an estimated 260000 barrels (bbl)109 million gallons of oil were burned between April 28 and July 12 2010 (Federal Interagency Solutions Group 2010) This volume of oil was equivalent to the total volume estimated to have spilled from the Exxon Valdez the nationrsquos largest oil spill prior to the Deepwater Horizon
3
Figure 1 The Exxon Valdez in-situ burn test March 25 1989 Photo by Alan A Allen
Figure 2 NOBE in-situ burn experiment August 1993 Photo by Gary Shigenaka NOAA
4
Oil in the marine environment undergoes a continuous series of compositional changes that are the result of a combination of several processes referred to as weathering (Mills et al 1999 Overton et al 1994 Hollebone 2015) Weathering processes includes evaporation dissolution emulsification sedimentation and microbial and photo-oxidation Weathering by changing the composition of the original spilled oil changes the oilrsquos physical and toxic properties as well as its appearance As oil weathers it initially loses volatile components which are also the most water-soluble components and the oil becomes more viscous and more likely to glob together as opposed to spreading out in a thin film Typically during the weathering process much of the oil will mix with water and emulsify forming a viscous mixture that is relatively resistant to rapid weathering changes (Leahy and Colwell 1990) Consequently emulsification greatly slows down the weathering processes and is more difficult to remediate by skimming dispersing or in-situ burning
In-situ burning is preferentially applied to remove fairly fresh oil before the oil emulsifies although the heat generated during meso-scale or large-scale burns can break oil and water emulsions and feed the fires Flame temperatures attained during the process of burning crude oil on water vary from 900 to 1200degC However the temperature gradient decreases dramatically from the flame to oil surface (350-500degC) to oil below the surface of the slick (near ambient) to the surface of the water (ambient) (Buist 1998 Mullin and Champ 2003) The burning process of fresh oil generally consumes the majority of the oil upwards of 90 but does leave unburned fairly viscous and dense residues with increased asphaltenes content As oil mixes with seawater and forms emulsions it become more difficult to ignite and is more difficult to burn Furthermore continued mixing of unburned residues can contribute to the sinking of these residues
Despite the scale of the Deepwater Horizon in-situ burn operations there was little organized sample collection and analysis to characterize the physical and chemical changes in the oil occurring as a result of the combustion on the water This information is important for predicting the fate of burn residues in the marine environment as well as potential biological effects The Department of Environmental Sciences of Louisiana State University (LSU) obtained several samples of material related to in-situ burns conducted in the Gulf of Mexico in May of 2010 In addition on-scene personnel of the Emergency Response Division of NOAA arranged for the collection of one before-burn oil and after-burn residue for an operational burn in July of 2010 To our knowledge these were some of the few sets of such samples collected during the Deepwater Horizon response
A series of other Deepwater Horizon oil and residue samples archived by the NOAA chemistry support group at LSU and samples collected following the report of deep water tarballs being brought up in shrimp trawls provided the basis for comparative physical and chemical analyses to determine if the in-situ burn operations might have been a common thread in several oil residues sampled Materials generated during controlled laboratory burns could be used as references for these empirical samples to provide insights into environmental fate and behavior of in-situ burn residues These samples and activities represent the basic components of the present research study
5
Figure 3 Series of in-situ burns during the Deepwater Horizon response June 7 2010 US Coast Guard photo
Figure 4 Deepwater Horizon in-situ burn at dusk June 12 2010 US Coast Guard photo
6
THE DEEPWATER HORIZON IN-SITU BURN EXPERIENCE
A total of 411 individual burns took place during the Deepwater Horizon response between April 28 and July 19 with 376 being judged to have burned significant volumes of oil (see Figures 3 amp 4) On June 18 alone sixteen in-situ burns took place (US Coast Guard 2011) Most of the burns took place within 5-24 km of the wellhead location (Allen et al 2011) Figure 5 shows the estimated volumes of oil burned burned on a daily basis and Figure 6 illustrates the locations of in-situ burn operations in the Gulf of Mexico relative to the Louisiana coast and the location of the Macondo wellhead
Figure 5 Estimated burn volumes during the Deepwater Horizon by date Source Allen et al 2011
The Macondo crude oil released during the Deepwater Horizon spill was a light Louisiana crude with a density measured in the lab of 0839 gcm3 at 15deg C (API gravity 372deg) (SL Ross Environmental Research 2010) The practical implication of its density was that the fresh oil floated on the seawater surface of the Gulf of Mexico In lab studies the density of the oil increased with increased weathering (evaporation) when the volume of oil was reduced by about 45 through artificial weathering its density increased to 0897 As the density of seawater is approximately 102-103 the weathered Macondo oil would have floated in the Gulf of Mexico as well
Along the nearshore Gulf coast some of the weathered oil is believed to have mixed with sand and sediments in the surf zone and consequently became dense enough to sink and to form submerged oil mats attributed as sources of beached tarballs (Operational Science Advisory Team-2 2011) However the oil in the vicinity of the wellhead (roughly 93 km offshore) and where in-situ burn operations took place had little opportunity to mix with sediments and floated on the surface of the Gulf This provided opportunities for large-scale operations like skimming application of chemical
7
dispersants and in-situ burning which are most effective when large contiguous patches of oil are accessible
Figure 6 Map showing in-situ burn locations relative to Macondo wellhead location and coast of Louisiana JB Huyett GenWest Systems
It is well-documented that the physical and chemical characteristics of oil change with combustion including in-situ burning For example Environment Canada chemists studying the NOBE burns in 1993 found that the residues from those two experiments were generally lighter than water but that density was related to burn efficiency They suggested that following a highly efficient (gt999) burn the resultant residue might be neutrally buoyant Chemically Environment Canada determined that the burn residues resembled highly weathered oil with a substantial loss in mass and a shift to multi-ring polycyclic aromatic hydrocarbons (PAHs) (Fingas et al 1994b)
The physical properties of burn residues were investigated by Buist et al (1995) with a specific focus on the changes in density that occur when different oils are burned The authors noted that this was of particular interest and concern because residues from some accidental in-situ burns (eg Haven and Honan Jade) and from large-scale test burns had been observed to sink while laboratory experiments had shown sinking to be less of a possibility Buist et al conducted direct experiments with eight different oil types to determine conditions in which residues of sufficient density to sink in salt water would be created They found that batch-type in-situ burns of thick
8
heavier crudes would result in sinking residues They attributed the increase in density to a process called Equilibrium Flame Vaporization (EFV) in which a fire is fueled by a vapor of constant (mixed) composition over time fed by an oil source of relatively constant compositionmdashas opposed to a distillation process where oil components are progressively burned off from lightest to heaviest The burn process concentrated high molecular weight compounds in the remaining slick which incrementally increased the density of the residue
During the Deepwater Horizon response the environmental fate of the in-situ burn residue both short- and long-term was not routinely monitored However the post-response US Coast Guard Incident-Specific Preparedness Review (2011) included in its recommendations for in-situ burning (ISB)
Unburned oil or other residue from ISB operations should be recovered and accounted for when evaluating the effectiveness of ISB
While not formally monitored US Coast Guard and operational workers did observe and anecdotally communicate changes in the physical characteristics of the Macondo oil once it had been burned its viscosity and density both appeared to increase (Figures 7 amp 8) In fact in-situ burning apparently increased the density of the residual oil to a significant degreemdashto the point where much if not most of the post-burn residue would be heavier than seawater and slowly sink (Figure 9) A US Coast Guard Gulf Strike Team member who witnessed many of the early burn operations recalled
The residue definitely did sink it tended to temporarily float in those strings likehellipin the photo and within a few minutes post burn would begin to sink If you tried to touch it with a pole or other object it began to slowly sink The consistency was sticky like paste The residue appeared generally the same regardless of burn duration with some variation if there was non-petroleum debris in it it had more visible whitish ash (MSTCS Drew Jaeger USCG Gulf Strike Team)
The apparent tendency of the burn residues to sink rendered them both difficult to remove from the marine environment and difficult to sample in order to determine physical and chemical changes Collection protocols for the May 2010 in-situ burn sampleswere not recorded the July post-burn sample analyzed by NOAALSU for this report was obtained as residual material adhered to the fire boom after a burn As such it was likely to be intermediate between the pre-burn oil and the fully combustedmdashand sinkingmdashburn residues pictured in Figure 9 With its known origins we hoped that this would provide another data point for understanding the range of changes that can occur when oil is burned and serve as a basis of comparison for tarballs and other oil residues of unknown origin
9
Figure 7 Burn residue remaining in fire boom at the end of an in-situ burn operation May 2010 US Coast Guard photo CPO RJ Schrader
Figure 8 Burn residue on fire boom following an in-situ burn operation 5 June 2010 US Coast Guard photo
10
Figure 9 In-situ burn residues just below the surface of the water following a burn operation for the Deepwater Horizon oil spill response May 2010 US Coast Guard photos CPO RJ Schrader
11
OVERVIEW OF THE PROJECT
The project is divided into six different tasks to provide insights into the changes that may occur when oil is burned and how the physical and chemical characteristics compare to other forms of oil encountered during a spill (eg emulsified surface oil beach- and marsh-stranded oil etc) The six tasks are
Task 1 Physical and chemical characterization of surface collected Macondo Well source oil (the riser oil)
Task 2 Physical and chemical characterization of Deepwater Horizon in-situ burn samples (pre-burn oil and post-burn residue)
Task 3 Physical and chemical characterization of deep water (~200 m) tarballs collected by royal red shrimp trawlers
Task 4 Burning of surface collected source and emulsified MC252 oil and burning of a surrogate south Louisiana crude oil under controlled conditions
Task 5 Physical and chemical characterizations of burn residues resulting from Task 4
Task 6 Forensic interpretation of analytical results to characterize physical and chemical changes occurring during the combustion of oil to include comparison of changes occurring in various weathered oil samples and identification of potential markers for in-situ burn residues
The physical and chemical analyses of actual Deepwater Horizon in-situ burn samples is the focal point of comparisons for all other oil residue samples of relevant to the spill response Specific comparisons to be made include
1 Samples of Macondo well source oil and the same source oil burned under controlled conditions at the NOAALSU chemistry support lab in Baton Rouge LA
2 Samples of tarballs trawled from depth by deep water shrimp nets in late 2010 and early 2011 north of the blowout location
3 Other samples of Deepwater Horizon oil collected at-sea in marshes and from beaches
As we have noted there were very small amounts of the actual Deepwater Horizon in-situ burn samples (ie pre-burn oil and post-burn residue) available and similarly limited amounts of the Macondo source oil however the NOAA chemistry support group at LSU had both of these key materials archived and in possession Additionally LSU had already chemically characterized hundreds of samples collected through the duration of the response efforts and beyond (into 2013) A total of 100 different samples including tarball material from shrimp trawls had been previously quantitated by LSU to obtain total PAHs The quantitative data also included oil biomarker profiles that were used to calculate diagnostic ratios for this project Physical characterization of archived material was carried out if it had not been previously completed and if enough material was available
These environmental samples established an empirical basis for conceptually modeling how oil changes when it is burned at sea Analysis of the in-situ burn residues and comparison to other oil residues will contribute to our understanding of the longer-term fate of burned oil and identify potential impacts to pelagic and benthic environments as well as human activities like mid-water and bottom trawling In addition to the physics and chemistry of the different oil residues the
12
project will attempt to define ldquoindicatorsrdquo that can distinguish an in-situ burn residue from other spill related oil residues
The results of this project will aid in anticipating the environmental fate of burned oil residues and potential impacts to proximal human activities In addition with greater understanding of residue behaviors strategies for potentially recovering neutrally-buoyant or sunken in-situ burn residue can be designed and tested
13
METHODS
Physical Characterization (Tasks 1 2 3 and 5) Two physical characterizations were performed on the ISB residue or tarballs density and a percent asphaltenes determination Other parameters such as resins and viscosity would also provide important physical characteristics however sample quantities were limited and it was hypothesized that density and percent asphaltenes would provide information specific to ISB residues due to some preliminary determinations of these two parameters Density and percent asphaltenes of MC252 source oil were obtained from the literature (Lewan et al 2014 SL Ross Environmental Research 2010) and determined by the methods described below for BP surrogate oil (ie a light South Louisiana Dorado crude similar to the scarce MC252 oil) used in the laboratory burn experiment and for samples collected during in-situ burn operations In addition density and percent asphaltenes were determined for 55 and 41 oil residue samples collected throughout the Deepwater Horizon response respectively
Two methods were used to determine density depending on the physical state of the oil residue being tested If the ISB residue or tarball material was fluid enough a pycnometer was used to determine density In the event that the ISB residue or tarball material was not pliable enough density was determined by volume displacement (modified ASTM test method D71) Ten milliliters (mL) of deionized (DI) water was poured into a pre-weighed graduated cylinder the meniscus was marked and the weight of the cylinder and water was recorded The cylinder was then emptied and dried in a 100degC oven for 15 minutes Then 1 to 2 grams (g) of in-situ burn (ISB) residue or tarball (free of extraneous material) was weighed The ISB residue or tarball material was then placed in the dried cylinder The cylinder was filled with DI water to 10mL mark and reweighed for a third time The density of the ISB residue or tarball was the weight of the material divided by the difference in weight of the water The difference in water weight was converted to volume with the assumption that the density of water is 1 gmL (eg (eg 5 g x 1 mL 1 g = 5 mL)
Asphaltenes are defined as a broad class of high molecular weight compounds that can be precipitated from oil using pentane hexane or heptane and measured as a percentage by weight (Fingas 2015) Percent asphaltenes (modified ASTM D3279-12) was determined by a two stage process ISB residue or tarballs were first dissolved the ISB residue or tarballs in hexane and then in toluene Approximately 1-to-2 grams (g) of ISB residue or tarball (free of extraneous material) was weighed in a pre-weighed jar The total mass was recorded and 50 to 60 mL of hexane was then added The vial was ultra-sonicated for 30 minutes and then allowed to settle for 30 minutes Pre-labeled filter papers were put in an oven at 100degC for 2 hours to remove any water The initial weights of the dried filter papers were then recorded The ISB residues or tarballs dissolved in hexane were carefully decanted to funnels containing the dried and pre-weighed filter papers The asphaltenes collect on the filter paper since they do not dissolve in hexane and any hexane-soluble fraction collected in a vial below the funnel The filter papers with the collected asphaltenes were air dried under a hood and final weights were recorded To ensure that just asphaltenes were being measured the air dried filter paper was then placed in funnel and rinsed with toluene A preshyweighed vial below the funnel was used to collect the toluene and the toluene was then allowed to evaporate The final weight of the vial was recorded and the difference between the before and after vial weight was the mass of asphaltenes
Reproducibility for each test method was determined using replicate analyses and resulting percent relative deviation (RSD) and standard deviation were calculated For the density determinations the average RSD was 149 (average standard deviation of plusmn0013 n=21) for the pycnometer method and for the volume displacement method the average RSD was 121 (average standard
14
deviation of plusmn013 n=8) Determination of asphaltenes had an average RSD of 28 (average standard deviation of 056 n=9) The higher RSD and standard deviation are influenced by a decrease in precision and accuracy of samples with low levels of asphaltenes Statistical comparisons of physical characteristics for Tasks 1 2 3 and 5 were carried out using a Student two-tailed t-test with the assumption of equal variance
Chemical Characterization (Tasks 1 2 3 5 and 6)
Chemical characterization of all samples was carried out using gas chromatographymass spectrometry (GCMS) operated in selected ion monitoring (SIM) The GCMS methodology has been developed specifically for detection and quantification of compounds unique to oil spills The target GCMS-SIM analytes are given in Table 1 and are widely used to identify petrogenic biogenic and pyrogenic hydrocarbons in a variety of sample matrices Note that the list includes commonly-found aromatic hydrocarbons and their alkyl homologs saturate compounds from C10 to C35 isoprenoids pristane and phytane and four groups of oil ldquobiomarkersrdquo The oil biomarkers include the tri- and pentacyclic hopanes diasteranes and regular steranes 14β(H)-steranes and the triaromatic steroids Chemical characterization of samples was performed using an Agilent 7890 GC equipped with an Agilent 5975 inert XL MSD or an Agilent 6890 GC equipped with an Agilent 5973 MSD Both instrument systems were fitted a 5 diphenyl95 dimethyl polysiloxane high-resolution capillary column (30 m x 025 mm x 025microm) Instrumental acquisition was identical for both instruments and QAQC assured that data was comparable between both systems
Table 1 Targeted Petroleum Hydrocarbon Analytes
Anthracene Fluoranthene C-1 PhenanthrenesAnthracenes Benz[a]anthracene Fluorene C-2 PhenanthrenesAnthracenes Benzo[a]pyrene C-1 Fluorenes C-3 PhenanthrenesAnthracenes Benzo[b]fluorene C-2 Fluorene s C-4 PhenanthrenesAnthracenes Benzo[e]pyrene C-3 Fluorenes Pyrene Benzo[ghi]perylene Indeno[123-cd]pyrene C-1 FluoranthenesPyrenes Benzo[k]fluorene Naphthalene C-2 FluoranthenesPyrenes Chrysene C-1 Naphthalenes C-3 FluoranthenesPyrenes C-1 Chrysenes C-2 Naphthalenes C-4 FluoranthenesPyrenes C-2 Chrysenes C-3 Naphthalenes Saturate Hydrocarbons C-3 Chrysenes C-4 Naphthalenes nC10 -nC35
C-4 Chrysenes Naphthobenzothiophene (NBT) Oil Biomarkers Dibenz[ah]anthracene C-1 NBTs Hopanes (mz 191)
Dibenzothiophene (DBT) C-2 NBTs Diasteranes amp Regular Steranes (mz 217)
C-1 DBTs C-3 NBTS 14β(H) Steranes (mz 218) C-2 DBTs Perylene Triaromatic Steroids (mz 231) C-3 DBTs Phenanthrene
GCMS data were used to generate information regarding chemical characterization both qualitative and quantitative for analyzed samples Qualitative information included chromatographic profiles of specific compound groups (mainly mz 57 the normal alkanes) and quantitative data included ratiosindexes to differentiate petrogenic sources from pyrogenic sources and to calculate biomarker diagnostic ratios for the forensic investigation task of the project
15
For Tasks 1-3 and 5 the Fossil Fuel Pollution Index (FFPI) and the Wang Pyrogenic Index were both calculated to determine if the PAH signatures in in-situ burn residues changed from a petrogenic signature to a more pyrogenic signature The FFPI was first conceived by Boehm and Farrington (1984) and was later modified by LSU-RCAT to incorporate an expanded list of target aromatic compounds The modified FFPI was calculated as follows
Modified FFPI = (((C-1 Naphs + C-2 Naphs + C-3 Naphs + C-4 Naphs + C-1 Fluors + C-2 Fluors + C-3 Fluors + DBT + C-1 DBTs + C-2 DBTs + C-3 DBTs + C-2 Phens + C-3 Phens + C-4 Phens + C-2 Pyrs + C-2 Chrys) + (05 x (Naph + Fluro + Phen + C-1 Pyrs + C-1 Chrys))))(Total Aromatics ndash Perylene)
A modified FFPI value closer to one (10) represents petrogenicoil-derived PAHs while a value less than 06 represents pyrogeniccombustion-derived PAHs The Wang Pyrogenic Index was developed after characterizing PAHs in burn residues and soot samples from experimental in situ burning of diesel fuel (Wang et al 1999) The Wang Pyrogenic Index was slightly modified since biphenyl acenaphthylene and acenaphthene were not included in the target compound list Therefore the modified Wang Pyrogenic Index calculated as follows
Wang Pyrogenic Index = (Anthracene + Fluoranthene + Pyrene + Benz[a]anthracene + Benzo[b]fluoranthene + Benzo[k]fluoranthene + Benzo[e]pyrene + Benzo[a]pyrene + Perylene + Indeno[123-cdpyrene Dibenz[ahanthracene Benzo[ghiperylene) [(sumNaphthalenes (C0-C4) (sumFluorenes (C0-C3) (sumDBTs (C0-C3) (sumPhenanthrenes (C0-C4)]
The Wang Pyrogenic Index for the source diesel was 0004 between 0009 and 0019 for experimental residues and greater than 008 for soot samples (Wang et al 1999) Therefore a higher index value represents a pyrogenic source while a lower index value represents a petrogenic source Statistical comparisons of chemical characteristics (ie GCMS data) for Tasks 1shy3 and 5 were carried out using a Student two-tailed t-test with the assumption of equal variance
Concentrations of individual analytes were based average response factors calculated from a 5shypoint calibration curve prepared from a commercially available oil analysis standard (Absolute Standards Hamden CT) and using the internal standard method Alkylated homologs were quantified using the response factor of the parent Individual internal standards were purchased from AccuStandard (New Haven CT) and mixed in the LSU lab Each analytical batch of samples contained a continuing calibration standard (not to exceed plusmn20 of the original calibration response factors) solvent and instrument blanks (to verify no carry over) and an extract of MC252 source oil The MS was tuned using PFTBA prior to each analytical batch or every 12 hours The instrument tune was evaluated and if any parameters were out of acceptable limits no samples were analyzed until any issues were corrected All solvents used were of reagent grade or higher
Controlled Laboratory Burns of MC252 amp South Louisiana Crude Oil (Task 4)
At NOAArsquos request an initial controlled crude oil burn was performed prior to the initiation of this project on 6 March 2012 using around 5g of MC252 oil The oil was poured into a crucible and burned with a propane torch for 4 to 5 minutes The experiment was conducted in triplicate The initial and final weights of oil and residues were recorded The residues from this initial burn were chemically characterized by GCMS Physical characterization was not possible due to the limited amount of residue remaining after the burn procedure
A second larger-scale burn was conducted on 20 February 2014 (Figure 10) using Dorado oil (a light South Louisiana crude oil) as a surrogate source material acquired from BP in place of MC252
16
oil The larger-scale burn was an attempt to duplicate the sinking phenomenon believed to be a result of in situ burning Fresh and 15 weathered surrogate oil (500mL) was burned in triplicate in large stainless steel containers (Figure 10a) at the LSU Environmental Health and Safety facility on the Baton Rouge campus Emulsified MC252 oil collected by skimming operations during the Deepwater Horizon response was also burned at this time All 500mL of each oil was floated on artificial seawater at an average of 34amp in each stainless steel container The stainless steel containers (33 cm x 28 cm x 10 cm) were placed in a plastic pool of water to help dissipate heat and reduce spattering of the burning oil A large propane torch (Figure 10b) was used to ignite the oil and burn durations were around 5-10 minutes The stainless steel containers were allowed to cool and were then transported back to the lab where the residues were sampled for physical and chemical characterization described in previous sections
Figure 10 (a) Pans of South Louisiana crude on artificial seawater (left) and (b) ignition of oil (right)
(a) (b)
Forensic Interpretation of Analytical Results (Task 6)
Forensic interpretations included both qualitative and quantitative techniques Qualitative techniques involved the visual comparison of GCMS n-alkane profiles including the nC17Pristane and nC18Phytane ratios and the biomarker profiles The visual comparison was used to detect any characteristic features or obvious differences which could possibly eliminate candidate sources from MC252 source oil Matchnon-match determinations could be assigned at this point however quantitative fingerprinting techniques were used to verify the visual results The quantitative approach involved the calculation and statistical comparison of certain diagnostic biomarker ratios for each sample and the MC252 source oil Diagnostic biomarker ratios were used due to the fact that oil biomarkers are more resistant to environmental weathering processes relative to most other oil compounds These ratios were chosen from the mass spectrometer ion groups of the hopanes- the steranes (diasteranes and regular steranes and 14(β)H-steranes) and the triaromatic steroids (eg mz 191 217 218 and 231) A total of 15 diagnostic ratios were calculated for each sample and statistically compared to the same ratios from MC252 source oil In some instances only 9 diagnostic ratios were calculated because some of the samples were analyzed prior to addition of two groups of oil biomarkers (the 14(β)H-steranes and the triaromatic steroids) The foundation and statistical criteria of the diagnostic ratio methodology was adapted from the 2007 edition of Oil Spill Environmental Forensics Fingerprinting and Source Identification Zhendi Wang and Scott Stout editors Chapter 7 ldquoEmerging CEN Methodology for Oil Spill Identificationrdquo by AB Hansen PS Daling L Faksness KR Sorheim P Kienhuis and R Duus The 15 MC252 diagnostic ratios were previously established to be statistically rigorous (Meyer et al 2014) The diagnostic
17
ratios were calculated using heights of certain peaks within the hopanes steranes and triaromatic steroids profiles The specific oil biomarker peaks and the 15 diagnostic ratios are provided in Appendix 1 After determining the absolute and critical differences for each ratio in each sample the sample received a score (the number of ldquomatchingrdquo ratios15 100) that was used to classify the sample as a Match (93-100) Probable Match (80-92) Inconclusive (50-79) and Non-Match (lt50) Only samples in the Match and Probable Match categories were included in the forensic interpretations
Once the samples had been narrowed down into the Match or Probable Match categories they were then sorted based on year sampled sample matrix and sample location Sample matrix included ISB oil ISB tarball oil sediment tarball and other (ie water mousse andor mixed matrix of oilwatersand) Sample locations included marsh ocean depth shore and water surface A one-way ANOVA with a post-hoc Tukey-Kramer pairwise comparison was applied to the sample matrix for each of the 15 diagnostic ratios to determine if any of the ratios could distinguish between in-situ burn residues and other MC252 oil residues For the sample location effects a nested ANOVA with random effects and a variance components covariance structure was carried out for each diagnostic ratio to determine if there were any differences due to location of sample collection In both cases the sample number in each matrix or location was highly unbalanced The mixed procedure (ldquoproc mixedrdquo) in SASreg statistical software version 93 was used to perform the statistical analyses
18
RESULTS AND DISCUSSION
Task 1 Physical and chemical characterization of surface-collected Macondo Well source oil (the riser oil)
Values regarding the physical characterization of MC 252 oil were obtained from published literature The Macondo crude oil released during the Deepwater Horizon spill was a light Louisiana crude with a density measured in the lab of 0839 gcm3 at 15deg C (API gravity 372deg) (SL Ross Environmental Research 2010) The percent asphaltenes of MC252 oil was calculated by Lewan et al (2014) to be 09-10 plusmn 01 MC252 oil that surfaced and subsequently burned in some cases had a significantly different composition than the fluid that flowed from the well blowout at depth Many of the light hydrocarbons and aromatic compounds (compounds with molecular weights less than naphthalene) were dissolved into the water column during the transit of the oil to the surface Therefore the oil burned during in situ burn operations would be considered ldquoweatheredrdquo since the more volatile and lower molecular weight compounds were already depleted For this study the density of weathered MC252 oil increased to 088plusmn08 (n=7) and percent asphaltenes increased to 15plusmn05 (n=5)
Table 2 Density of Weathered MC252 Oil
Pycnometer Pycnometer + Mass o f S ample Volume of Density LSU ID
Wt ( g) Sample (g) (g) Pycnometer (mL) (gmL)
2010147-122 5109 6029 920 115 080
2010147-124 5122 6189 1067 115 093
2010147-126 5121 6199 1078 115 094
2010147-128 5109 5958 848 115 074
2010147-130 5121 6197 1076 115 094
2010147-134 5121 6170 1049 115 091
2010147-136 5121 6184 1063 115 092
AVERAGE 088
STDEV 008
Table 3 Percent Asphaltenes of Weathered MC252 Oil
LSU ID Sample Wt
(g) Initial VOA Vial
Wt (g) Final VOA Vial
Wt (g) VOA Vial Wt
Difference (g) Asphaltenes by
Mass
2010147-122 b 110 2137 2139 002 14
2010147-126 b 097 2158 2159 001 12
2010147-130 b 096 2167 2169 002 23
2010147-134 b 107 2150 2152 001 14
2010147-136 b 097 2149 2150 001 11
AVERAGE 15
STDEV 05
19
200
NA
PH
C1
-Na
ph
sC
2-N
ap
hs
C3
-Na
ph
sC
4-N
ap
hs
FL
UO
RC
1-F
luo
rsC
2-F
luo
rsC
3-
Flu
ors
DB
TC
1-D
BT
sC
2-D
BT
sC
3-
DB
Ts
0
Figure 11 Target analyte profiles for n-alkanes (top) and aromatics (bottom) in fresh MC252 source oil (riser fluid)
PH
EN
C1
-Ph
en
sC
2-P
he
ns
C3
-Ph
en
sC
4-P
he
ns
AN
TH
FL
UO
RA
NT
PY
RC
1-
Py
rsC
2-
Py
rsC
3-
Py
rsC
4-
Py
rsN
BT
C-1
NB
Ts
C-2
NB
Ts
C-3
NB
Ts
B[a
]AN
TH
C
HR
YC
1-
Ch
rys
C2
-C
hry
sC
3-
Ch
rys
C4
-C
hry
sB
[b]F
B[k
]FB
[e]P
B[a
]PP
ER
YL
I[1
23
-cd
]PD
[ah
]AB
[gh
i]P
Co
nc
(mg
k
g)
Co
nc
(mg
k
g)
5000
4000
3000
2000
1000
0
nC
-10
nC
-11
nC
-12
nC
-13
nC
-14
nC
-15
nC
-16
nC
-17
Pri
sta
ne
6000
Total Target Alkanes = 51550 mgkg
MC 252 Target Aromatics
1800
Total Target Aromatics = 11900 mgkg 1600
1400
1200
1000
800
600
400
nC
-18
Ph
yta
ne
nC
-19
nC
-20
nC
-21
nC
-22
nC
-23
nC
-24
nC
-25
nC
-26
nC
-27
nC
-28
nC
-29
nC
-30
nC
-31
nC
-32
nC
-33
nC
-34
nC
-35
The chemical characterization of fresh MC252 is shown in Figure 10 MC252 oil is a light sweet crude oil with a normal alkane hydrocarbon range of nC10 through nC35 (Figure 11 top) and an aromatic profile dominated by the naphthalenes (Figure 11 bottom)
MC252 Target n-Alkanes
20
Task 2 Physical and chemical characterization of Deepwater Horizon in-situ burn samples (pre-burn oil and post-burn residue)
A total of 20 in-situ burn samples collected during response operations were analyzed One batch of 18 samples was received at LSU on 27 May 2010 and two samples one ldquobeforerdquo and one ldquoafterrdquo sample were later received on 20 July 2010 Of these 20 there were 9 sets of before and after samples The sample set from July 2010 was of limited quantity therefore chemical characterization took priority over physical characterization For the physical characterization of the May 2010 samples (Tables 4 and 5) the average density of samples before in-situ burning was 088plusmn008 (n=7) and the average density of samples after in-situ burning was 096plusmn002 (n=8) The increase in density was significant (p=003 Student two-tailed t-test with the assumption of equal variance) The average percent asphaltenes of samples before in-situ burning was 15plusmn05 (n=5) and the average percent asphaltenes of samples after in-situ burning was 42 (n=5) The increase in percent asphaltenes was not statistically significant (p=0 08 Student two-tailed t-test with the assumption of equal variance) It was assumed that percent asphaltenes would have increased as a result of burning it did but did not attain statistical significance
Table 4 Densities for Before and After In Situ Burning of MC252 Oil
LSU ID Burn
Status Pycnometer
Wt (g) Pycnometer +
Sample (g) Mass of
Sample (g)
Volume of Pycnometer
(mL)
Density (gmL)
2010147-122 Before 5109 6029 920 115 080
2010147-124 Before 5122 6189 1067 115 093
2010147-126 Before 5121 6199 1078 115 094
2010147-128 Before 5109 5958 848 115 074
2010147-130 Before 5121 6197 1076 115 094
2010147-134 Before 5121 6170 1049 115 091
2010147-136 Before 5121 6184 1063 115 092
AVERAGE BEFORE 088
STDEV BEFORE 008
2010147-123 After 5124 6221 1097 115 095
2010147-125 After 5109 6177 1068 115 093
2010147-129 After 5122 6244 1122 115 098
2010147-135 After 5108 6246 1138 115 099
2010147-137 After 5105 6228 1123 115 098
2010147-138 After 5121 6246 1125 115 098
2010147-133 After 5108 6178 1070 115 093
AVERAGE AFTER 096
STDEV AFTER 002
21
Table 5 Percent Asphaltenes for Before and After In Situ Burning of MC252 Oil
LSU ID Burn
Status Sample Wt (g)
Initial VOA Vial Wt (g)
Final VOA Vial Wt (g)
VOA Vial Wt Difference (g)
Asphaltenes by Mass
2010147-122 Before 110 2137 2139 002 14
2010147-126 Before 097 2158 2159 001 12
2010147-130 Before 096 2167 2169 002 23
2010147-134 Before 107 2150 2152 001 14
2010147-136 Before 097 2149 2150 001 11
AVERAGE BEFORE 15
STDEV BEFORE 05
2010147-125 After 096 2492 2495 003 31
2010147-133 After 121 2497 2499 001 12
2010147-135 After 118 2153 2163 010 83
2010147-137 After 181 2536 2547 011 62
2010147-138 After 062 2186 2187 001 22
AVERAGE AFTER 42
STDEV AFTER 30
Table 6 summarizes the chemical characterization of MC252 oil by GCMS-SIM before and after in-situ burning in May and July 2010 and Figure 12 displays the average PAH profile for these samples The PAH profile for the before sample for July 2010 indicates that it was more of a weathered oil than the May 2010 before samples The insets in Figure 11 show the enhancement most of which are significant of the less-volatile aromatics that are associated with pyrogenic sources (eg 5-6 ring PAHs) These compounds were already present in MC252 oil (with the exception of indeno[123-cd]pyrene) however their concentrations increased as a result of in-situ burning This increase is also supported by hopane normalized percent decrease or increase for the controlled laboratory burns in Task 4 However it is important to note that even though these compounds increased as a result of burning their increase was outweighed by the decrease in the overall total PAH concentration This finding is consistent with Garrett et al (2000) and Wang et al (1999)
Table 6 Summary of MC252 Oil Before and After In Situ Burning
May 2010 July 2010
Before After Before After
Avg Total Aromatics (mgkg) 5300plusmn900 2600plusmn1910 3800 997
Avg Modified FFPI 077plusmn003 065plusmn010 075 064
Avg Wang Pyrogenic Index 001plusmn0002 007plusmn006 001 005
Avg PhenAnth 81plusmn29 29plusmn19 140 140
Avg FluorAntPyr 046plusmn003 047plusmn009 049 037
n= 8 10 1 1
22
Co
nc
(ng
m
g)
200
150
100
50
0
(b) At-Sea Burn Operations July 2010
Before After
500 Enhanced 5-6 Ring PAHs
450 100
400 80
350 60
40 300
20
250 00
B[b
]F
B[k
]F
B[e
]P
B[a
]P
PE
RY
L
I[1
23
-cd
]P
D[a
h]A
B[g
hi
]P
NA
PH
C1
-Nap
hs
C2
-Nap
hs
C3
-Nap
hs
C4
-Nap
hs
FL
UO
RC
1-F
luo
rsC
2-F
luo
rsC
3-
Flu
ors
DB
TC
1-D
BT
sC
2-D
BT
sC
3-
DB
Ts
PH
EN
C1
-Ph
ens
C2
-Ph
ens
C3
-Ph
ens
C4
-Ph
ens
AN
TH
FL
UO
RA
NT
PY
RC
1-
Py
rsC
2-
Py
rsC
3-
Py
rsC
4-
Py
rsN
BT
C-1
NB
Ts
C-2
NB
Ts
C-3
NB
Ts
B[a
]AN
TH
CH
RY
C1
-C
hry
sC
2-
Ch
rys
C3
-C
hry
sC
4-
Ch
rys
B[b
]FB
[k]F
B[e
]PB
[a]P
PE
RY
LI[
12
3-c
d]P
D[a
h]A
B[g
hi]
P
0
100
200
300
400
500
600
700
800
900
1000
NA
PH
C1
-Nap
hs
C2
-Nap
hs
C3
-Nap
hs
C4
-Nap
hs
FL
UO
RC
1-F
luo
rsC
2-F
luo
rsC
3-
Flu
ors
DB
TC
1-D
BT
sC
2-D
BT
sC
3-
DB
Ts
PH
EN
C1
-Ph
ens
C2
-Ph
ens
C3
-Ph
ens
C4
-Ph
ens
AN
TH
FL
UO
RA
NT
PY
RC
1-
Py
rsC
2-
Py
rsC
3-
Py
rsC
4-
Py
rsN
BT
C-1
NB
Ts
C-2
NB
Ts
C-3
NB
Ts
B[a
]AN
TH
CH
RY
C1
-C
hry
sC
2-
Ch
rys
C3
-C
hry
sC
4-
Ch
rys
B[b
]FB
[k]F
B[e
]PB
[a]P
PE
RY
LI[
12
3-c
d]P
D[a
h]A
B[g
hi]
P
Co
nc
(ng
m
g)
(a) At-Sea Burn Operations May 2010
Before After
00
50
100
150
B[b
]F
B[k
]F
B[e
]P
B[a
]P
PE
RY
L
I[1
23
-cd
]P
D[a
h]A
B[g
hi
]P
Enhanced 5-6 Ring PAHs
Figures 12 PAH profiles and enhancement of 5-6 ring pyrogenic compounds in MC252 oil as a result of in-situ burning May 2010 (a) and July 2010 (b)
Figure 13 shows the changes in the normal alkane profiles of fresh MC252 riser oil MC252 oil prior to in-situ burning and MC252 oil after in-situ burning In-situ burning decreased the average total target aromatics by approximately 49 for May 2010 samples and approximately 26 for the July 2010 sample set Once again the lower percentage for July is reflective of the weathering that had already altered this pre-burn sample
23
1 0 0 0 1 5 0 0 2 0 0 0 2 5 0 0 3 0 0 0 3 5 0 0 4 0 0 0 4 5 0 0 5 0 0 0 5 5 0 0 6 0 0 0
0
2 0 0 0 0 0
4 0 0 0 0 0
6 0 0 0 0 0
8 0 0 0 0 0
1 0 0 0 0 0 0
1 2 0 0 0 0 0
1 4 0 0 0 0 0
1 6 0 0 0 0 0
1 8 0 0 0 0 0
2 0 0 0 0 0 0
2 2 0 0 0 0 0
2 4 0 0 0 0 0
2 6 0 0 0 0 0
2 8 0 0 0 0 0
3 0 0 0 0 0 0
3 2 0 0 0 0 0
3 4 0 0 0 0 0
3 6 0 0 0 0 0
T i m e - - gt
A b u n d a n c e
I o n 5 7 0 0 ( 5 6 7 0 t o 5 7 7 0 ) M U 1 0 1 4 8 T D d a t a m sI o n 5 7 0 0 ( 5 6 7 0 t o 5 7 7 0 ) M U 1 0 1 4 8 U D d a t a m s
(c)
nC17
nC18
(b) nC17
nC18
1 0 0 0 1 5 0 0 2 0 0 0 2 5 0 0 3 0 0 0 3 5 0 0 4 0 0 0 4 5 0 0 5 0 0 0 5 5 0 0 6 0 0 0
0
5 0 0 0 0
1 0 0 0 0 0
1 5 0 0 0 0
2 0 0 0 0 0
2 5 0 0 0 0
3 0 0 0 0 0
3 5 0 0 0 0
4 0 0 0 0 0
4 5 0 0 0 0
5 0 0 0 0 0
5 5 0 0 0 0
6 0 0 0 0 0
6 5 0 0 0 0
7 0 0 0 0 0
7 5 0 0 0 0
8 0 0 0 0 0
8 5 0 0 0 0
9 0 0 0 0 0
9 5 0 0 0 0
T i m e - - gt
A b u n d a n c e
1 0 0 0 1 5 0 0 2 0 0 0 2 5 0 0 3 0 0 0 3 5 0 0 4 0 0 0 4 5 0 0 5 0 0 0 5 5 0 0 6 0 0 0
0
2 0 0 0 0 0
4 0 0 0 0 0
6 0 0 0 0 0
8 0 0 0 0 0
1 0 0 0 0 0 0
1 2 0 0 0 0 0
1 4 0 0 0 0 0
1 6 0 0 0 0 0
1 8 0 0 0 0 0
2 0 0 0 0 0 0
2 2 0 0 0 0 0
2 4 0 0 0 0 0
2 6 0 0 0 0 0
2 8 0 0 0 0 0
3 0 0 0 0 0 0
3 2 0 0 0 0 0
3 4 0 0 0 0 0
3 6 0 0 0 0 0
3 8 0 0 0 0 0
4 0 0 0 0 0 0
4 2 0 0 0 0 0
4 4 0 0 0 0 0
4 6 0 0 0 0 0
4 8 0 0 0 0 0
T i m e - - gt
A b u n d a n c e
I o n 5 7 0 0 ( 5 6 7 0 t o 5 7 7 0 ) M U 1 0 1 4 1 K D d a t a m s
nC17
nC18
(a)
Figures 13a-c Alkane profiles of fresh MC252 riser oil (top a) weathered MC252 oil before in-situ burning (middle b) and MC252 oil after in-situ burning (bottom c) Note progressively larger prominence of alkanes in the boiling point range of 204degC to 538degC (nC12 to nC35) in (b) from weathering and (c) from in situ burning
24
The average FFPI of the before in-situ burning samples was 077plusmn003 and the average FFPI of the after in-situ burning samples was 065plusmn010 indicating a shift from petrogenic to pyrogenic composition This difference was significant (p=0001 Student two-tailed t-test with the assumption of equal variance) The average Wang Pyrogenic Index of the before in situ burning samples was 001plusmn0002 and after in situ burning was 007plusmn006 also indicating a shift from petrogenic to pyrogenic composition This difference is also significant (p=001 Student two-tailed t-test with the assumption of equal variance) Figure 14 is a graphical depiction of the Wang Pyrogenic Index ldquoBeforerdquo samples are clearly separated from most of the ldquoafterrdquo samples in the figure According to Wang et al (1999) lighter petroleum products and most crude oils fall into the range of 000-001 which is supported in this instance The ldquoafterrdquo samples are characterized by an increase in the pyrogenic index along with a decrease in the phenanthreneanthracene ratio however the majority fall in the range of what Wang et al would consider to be heavy oilsfuels and tarballs There are two ldquoafterrdquo samples that align more towards ldquobeforerdquo samples perhaps indicating an inefficient burn
0
20
40
60
80
100
120
140
160
000 002 004 006 008 010 012 014 016 018 020
Ph
en
A
nth
Wang Pyrogenic Index
2010 ISB Samples
Before Burning After Burning
Figure 14 Plot of the Wang pyrogenic index over the ratio of phenanthreneanthracene for before and after in situ burning samples collected in May and July 2010
Task 3 Physical and chemical characterization of deep water (~200 m) tarballs collected by royal red shrimp trawlers
Royal red shrimp background The royal red shrimp (Hymenopeneaus robustus or Pleoticus robustus) shown in Figure 15 is a large deep-water penaeid shrimp that has a wide distribution from the northern US coast to the east coast of South America (Anderson and Lindner 1971) More specifically the known range for royal red shrimp in US waters extends from the Atlantic coast of New England south of Marthas Vineyard through the Gulf of Mexico and the Caribbean Sea to French Guiana They inhabit the upper continental slope region at depths from 180 to 730 m (Farfante 1988)
Unlike other penaeid shrimp species that complete their life cycle within a year royal red shrimp live for several years (Cascorbi 2007) Males reach a maximum total length of 180 mm females 225 mm (Farfante 1988)
Few details are known about the life history of the royal red shrimp Spawning is believed to occur
25
year-round but predominantly between January and May and on the upper regions of the continental slope Larval forms of the shrimp are unknown (Gulf of Mexico Fishery Management Council 2004)
The royal red has won favor as a commercial fisheries product for its sweet juicy flesh and striking red color The fishery for royal red shrimp serves a niche market representing a relatively small proportion of the overall shrimp industry in the Southeast US and Gulf of Mexico (Stiles et al 2007)
Figure 15 Royal red shrimp Pleoticus robustus Photo by Connecticut Sea Grant
Royal red shrimp were investigated as an experimental fishery beginning in 1950 in the southeastern US with support from the Bureau of Fisheries the predecessor federal agency to the NOAA National Marine Fisheries Service (Bullis 1956) The commercial fishery began officially in the Gulf of Mexico and off Floridarsquos east coast in 1962 According to catch statistics for the Gulf of Mexico cited by Cascorbi (2007) landings of royal red shrimp averaged about 123 MT per year since 1998 or about 018 of total Gulf shrimp landings Of nearly 3000 vessels permitted for shrimp fishing in the Gulf of Mexico in 2005 only 15 specifically targeted royal red shrimp (Gulf of Mexico Fishery Management Council 2005) At the time of the Deepwater Horizon spill in 2010 NOAA indicated that there were 250 active royal red permits but that only a few were active
On November 20 2010 NOAA received a report from a fisherman who caught tarballs while trawling for royal red shrimp in federal waters off the coast of Alabama The area had just been reshyopened by NOAA to commercial fishing on November 15 after the established sensory testing of 286 finfish and 55 shrimp samples and chemical analysis of 33 composite samples of 207 finfish and 9 composites of 50 shrimp showed no apparent oil contamination However as a result of the
26
tarballs encountered in the deep water trawl fishery on November 24 2010 NOAA closed 4213 square miles (10911 sq km) to royal red shrimp fishing only (Figure 16) Fishing for finfish or other penaeid shrimp species was still permitted
Figure 16 Fishery closure map 24 November 2010 showing the royal red shrimp closure area due to tarballs Source NOAA
In December 2010 and January 2011 NOAA chartered two fishing vessels to sample royal red shrimp in the closed area over three cruises The samples were assessed via the sensory and chemical protocols jointly established by the US Food and Drug Administration and NOAA for determining the safety of seafood during the Deepwater Horizon response In addition to targeting PAHs by both gas chromatography and mass spectrometry (GCMS) and high performance liquid chromatographyfluorescence (HPLC-UVF) samples were also analyzed for dioctyl sodium sulfosuccinate (DOSS) a component of the Corexit dispersants used during the response Video surveys were also conducted in the closed area to determine the extent of tarball occurrence
Three of the royal red shrimp samples collected in December failed sensory evaluation by a three-person panel ie they were judged to be tainted However chemical analysis failed to show any sign of PAH contamination The areas where the failed sensory samples originated were resampled in January and the shrimp were evaluated by a larger (seven-person) sensory panel All samples passed this round of sensory evaluation
27
Chemistry results summarized in Table 7 from both GCMS and HPLC-UVF for the edible tissues of the royal red shrimp were below the established levels of concern for all samples collected after the November closure Based on the sensory and chemistry results the area was re-opened to all fishing on 3 February 2011
Table 7 Results for Chemical Analysis of Royal Red Shrimp Sampled in December 2010 and January 2011 (Source NOAA)
PAHs Level of Concern Range of values (ppb) Range of values (ppb) (ppb) GCMS HPLCfluorescence^
Naphthalene 123000 063 - 20 lt24
Fluorene 246000 013 - 053 lt041
Anthracene Phenanthrene 1846000 023 - 16 lt124 - 33
Pyrene 185000 lt0070 - 041 lt57
Fluoranthene 246000 lt0071 - 033 lt65
Chrysene 132000 lt014 - 11 lt37
Benzo(k)fluoranthene 13200 lt012 - lt031 lt026 - 27
Benzo(b)fluoranthene 1320 lt012 - lt031 lt066
Benz(a)anthracene 1320 lt011 - lt022 lt11
Indeno(123-cd)pyrene 1320 lt011 - lt022 lt77
Dibenz(ah)anthracene 132 lt0094 - lt023 lt18
Benzo(a)pyrene 132 lt011 - lt028 lt096
DOSS Level of Concern Range of values (ppm) Range of values (ppm) (ppm)
Dioctylsulfosuccinate 500 lt0043 - lt0045 --shy
Level of Concern for Anthracene and Phenanthrene combined ^ HPLCfluorescence (screening) analyses have higher limits of quantitation than the more sensitive and laborious GCMS analyses
Preliminary chemical analysis of some of the tarballs recovered from the trawl catches indicated a possible sourcing to burned Macondo Well oil Many of the trawl locations where tarballs were encountered were 10 km or less from the primary in-situ burn locations
Three sets of tarballs collected from royal red shrimp trawls were analyzed by LSU One set was from the vessel Our Mother and contained 8 tarballs collected in January 2011 The second set was from the vessel Aubreigh Marie and contained 13 tarballs collected in March 2011 The third shrimp trawl set contained five tarballs collected in June 2011 These tarballs were collected ~200 m below the ocean surface and were large viscous and dense globs of oily residue encapsulated within a hardened exterior and the tumbling of these tarballs in the trawl nets incorporated shrimp and other trawl debris into the residue (see Figure 17)
28
Figure 17 Two views of tarball amp shrimp sample recovered in June 2010 LSU photos
The average density and percent asphaltenes of the shrimp trawl tarballs were significantly different from other MC252 tarballs (p=002 and lt0001 respectively Student two-tailed t-test with assumption of homogenous variance) The average density of the shrimp trawl tarballs was 104plusmn022 gmL and the average percent asphaltenes was 22plusmn16mdashcompared to the density of 086plusmn033 gmL and percent asphaltenes of 15plusmn17 for other MC252 tarballs Even though there was a significant difference the variability within each of the tarball groups was high Regardless of the variability the trawl tarballs have an average density that is heavier than sea water with a typical density of 102 gmL Density measurements could be easily affected by any amount of extraneous material incorporated in the tarball and also by the effect of evaporation of the initial oil Percent asphaltenes could be affected by compositional differences caused by the efficiency or extent of the burn since in-situ burning is not a controlled process which greatly affects the consistency of ISB residues
29
The average density of the shrimp trawl tarballs was not significantly higher than the average density of in-situ burn samples collected after burning (p=027) however the asphaltenes content was significantly higher (p=002) than the percent asphaltenes of the in-situ burn samples collected during burn operations This suggests some other factor influencing these ldquosinking tarballsrdquo that was not present or determined for samples taken immediately after in-situ burning at sea and a factor that did not influence other tarballs formed after the Deepwater Horizon incident It is possible that an aspect of the prolonged periods of combustion that caused the increase in density and the eventual tendency of the burn residue to sink and weather at depth enhanced the relative content of asphaltenes in the tarballs that were eventually recovered by shrimp trawls As mentioned earlier Buist et al (1997) suggest that in situ burning results in imperfect equilibrium flash vaporization that selectively concentrates and preserves asphaltene fractions of burn residues regardless of whether the oil was fresh or weathered prior to burning which results in a progressive increase in the density of the residue Density and asphaltenes data are presented in Tables 8 and 9 respectively
Table 8 Shrimp Trawl Tarball Density Comparisons
Shrimp Trawl Density ISB After Density Other MC252 Density Tarballs (gmL) Residue (gmL) Tarballs (gmL)
2011019-01 086 2010147-123 095 2010134-01 185 2011019-02 094 2010147-125 093 2010134-02 104 2011019-03 077 2010147-127 091 2010134-04 112 2011019-04 097 2010147-129 098 2010201-51 095 2011019-05 110 2010147-133 093 2010228-01 117 2011019-06 093 2010147-135 099 2010228-02 069 2011019-07 087 2010147-137 098 2012249-01 057 2011019-08 098 2010147-138 098 2012250-05 056 2011116-01 120 AVERAGE 095 2012250-10 060 2011116-02 087 STDEV 003 2012258-11 056 2011116-03 096 n= 8 2012263-01 112 2011116-04 113 2012265-67 128 2011116-05 147 2012265-68 079 2011116-06 133 2012272-02 086 2011116-07 111 2012278-01 067 2011116-08 157 2012278-02 075 2011116-28 125 2012278-03 058 2011116-29 148 2012289-01 058 2011116-30 078 2012289-02 059 2011116-31 095 2012289-03 078 2011116-32 090 AVERAGE 086 2011187-01 093 STDEV 033 2011187-02 093 n= 20 2011187-03 092 2011187-04 097 2011187-05 094
AVERAGE 104 STDEV 022
n= 26
30
Table 9 Shrimp Trawl Tarball Asphaltenes Comparisons
Shrimp Trawl Asph (wt ) ISB After Residues
Asph (wt ) Other MC252
Tarballs Asph (wt )
2011019-01 26 2010147-125 31 2010131-02 081 2011019-02 39 2010147-133 12 2010134-01 17 2011019-03 35 2010147-135 83 2010146-02 231 2011019-04 52 2010147-137 62 2010228-02 059 2011019-05 39 2010147-138 22 2011059-01 116 2011019-06 36 AVG ISB After 42 2012249-01 080 2011019-07 30 STDEV 30 2012250-09 038 2011019-08 41 n= 5 2012250-10 042 2011019-28 41 2012265-68 66 2011116-02 41 2012278-01 074 2011116-03 43 2012278-02 046 2011116-30 45 2012278-03 062 2011116-31 60 2012289-01 070 2011116-32 58 2012289-02 11 2011187-01 13 2012289-03 43 2011187-02 43 AVG Other 152 2011187-03 88 STDEV 173 2011187-04 18 n= 15 2011187-05 13
AVG Trawl 22 STDEV 162
n= 19
The normal alkane profile of these ldquosinkingrdquo tarballs was significantly different from other MC252 oil tarballs This profile (Figure 18a) appeared to be unique to tarballs collected at ocean depth and was similar to the normal alkane profile of the simulated distillation (SIMDIS) of MC252 oil at 205degC (Figure 18b) The SIMDIS and shrimp trawl tarballs exhibited evidence of thermal combustion that was absent in the normal alkane profiles of the in-situ burn oil residues collected after burning (refer back to Figure 13) The SIMDIS procedure separates oil into various fractions depending on molecular weight and associated boiling points The shrimp trawl sample appears to have undergone a similar process thus resulting in an alkane profile similar to the SIMDIS of MC252 oil Therefore it is believed that the shrimp trawl tarballs are the result of more efficient in-situ burns relative to other field burn residues The shape of the in situ burn tarball profile was very different from tarballs not associated with burning (ie weathered residues Figure 18c) but still considered to be a match to MC252 oil Figure 18d is the normal alkane profile of microbially-weathered MC252 oil This profile demonstrates that residues from in situ burning were not subjected to the typical weathering processes other oil residues reflect
31
(a)
(d)
(b)
(c)
Figures 18 a-d Normal alkane distribution depicting the similarity of a suspected ISB tarball (a) collected in a royal red shrimp trawl and the simulated distillation of MC252 oil at 205degC (b) The alkane distributions in (c) MC252 tarball not associated with in-situ burning and (d) microbially-weathered MC252 oil are dissimilar to (a) and (b) even though all four profiles are MC252 oil
32
The average FFPI of the shrimp trawl samples was 062plusmn006 indicating a pyrogenic composition The average FFPI of the shrimp trawl samples is significantly different from other MC252 tarballs (p=0001 Student two-tailed t-test with the assumption of equal variance) The average Wang Pyrogenic Index of the shrimp trawl samples was 006plusmn002 also indicating a more pyrogenic composition The average Wang Pyrogenic Index is also significantly different from other MC252 tarballs (p=001 Student two-tailed t-test with the assumption of equal variance) Figure 19 is a graphical depiction of the Wang Pyrogenic Index According to Wang et al (1999) lighter petroleum products and most crude oils fall into the range of 000-001 The majority of the samples plotted in the figure have an index greater than 001 and are in the range of what Wang et al would consider to be heavy oilsfuels and tarballs
0
50
100
150
200
250
300
350
000 002 004 006 008 010 012 014
Ph
en
A
nth
Wang Pyrogenic Index
Shrimp Trawl Tarballs
Other Tarballs Suspected ISB Tarballs
Figure 19 Plot of the Wang pyrogenic index over the ratio of phenanthreneanthracene for shrimp trawl tarballs suspected to be sinking MC252 residues from in situ burning
All 26 shrimp trawl tarballs were a match (scored 15 out of 15 or 100) to MC252 oil based on the diagnostic biomarker ratio analyses Figure 20 displays a comparison of the diagnostic ratio results of the shrimp trawl samples MC252 source oil and EPA South Louisiana Crude (SLC) oil standard The EPA-SLC standard scored 8 out of 15 or 53 and would be considered a non-match Table 10 provides the values that are plotted in Figure 20 The ability to discriminate between two SLC oils is a demonstration to the utility of the diagnostic ratio analyses employed for this study Detailed descriptions of the biomarker abbreviations are given in Appendix 1
33
000
050
100
150
200
250
300
350
400R
atio
Val
ueHopane Diagnostic Ratios (mz 191)
000
020
040
060
080
100
120
140
160
180
200
C27D-SC27D-R C29D-SC29D-R C28 aaa-RC29 aaa-R
Ratio
Val
ue
Diasteranes and Regular Steranes (mz 217)
000
010
020
030
040
050
060
070
080
C27 BBC28 BB+C29 BB C28 BBC27 BB+C29 BB C29 BBC27 BB+C28 BB
Ratio
Val
ue
14β(H) Steranes (mz 218)
000
020
040
060
080
100
120
140
160
C20 TAC21 TA C26 TA-SC28 TA-S C27 TA-RC28 TA-R
Ratio
Val
ue
Triaromatic Steriods (mz 231)
MC 252 Avg Ratio Shrimp Trawl Avg Ratio EPA SLC Avg Ratio
Figure 20 Graphical depiction of diagnostic ratio testing of shrimp trawl samples compared to MC252 source oil and EPA South Louisiana Crude Oil standard Error bars represent 5 error margin
34
Table 10 Diagnostic Biomarker Ratio Analysis Results for Shrimp Trawl Samples
Shrimp EPA SLC MC252 Ratio
Trawl Ratios Ratio (n=32)
(n=5) (n=4)
Hopanes (mz 191) AVG AVG AVG
C27-TsC27-Tm 127 126 077
C29-aBC29-Ts 217 217 362
C29-aBC30-aB 048 048 071
C31-aBC32-aB+C33-aB 093 093 134
C32-aBC31-aB+C33-aB 043 043 038
C33-aBC31-aB+C32-aB 028 028 018
Diasteranes and Regular 14a(H)-Steranes (mz 217) AVG AVG AVG
C27D-SC27D-R 161 161 175
C29D-SC29D-R 163 163 167
C28 aaa-RC29 aaa-R 074 074 080
14B(H)-Steranes (mz 218) AVG AVG AVG
C27 BBC28 BB+C29 BB 069 069 062
C28 BBC27 BB+C29 BB 038 038 040
C29 BBC27 BB+C28 BB 046 046 050
Triaromatic Steriods (mz 231) AVG AVG AVG
C20 TAC21 TA 107 107 140
C26 TA-SC28 TA-S 062 063 073
C27 TA-RC28 TA-R 092 092 099
Indicates EPA SLC ratios that are statistically different according to Hansen et al (2007) and Meyer et al (2014)
Task 4 Burning of surface collected Macondo Well source oil and emulsified source oil under controlled laboratory conditions
An initial controlled burn of MC252 oil was performed at LSU on 6 March 2012 Around 5g of MC252 oil was placed in a crucible and burned with a propane torch for ~4-5 minutes The experiment was conducted in triplicate under a laboratory ventilation hood There was not sufficient residue generated by this method to perform both physical and chemical characterization so only chemical characterization was completed Since this burn was performed on a reduced scale plans were made to conduct a second larger-scale burn using an increased volume of oil floated on artificial seawater
The second larger scale burn was conducted on 20 February 2014 at the LSU Environmental Health and Safety facility on the Baton Rouge campus This burn used 500mL of fresh and 15 weathered surrogate south Louisiana crude oil obtained from BP floated on artificial seawater (avg salinity of 34amp) in stainless steel containers Emulsified MC252 oil was also burned in the same manner in this experiment Each set of burns was performed in triplicate and burn durations were ~5-10 minutes Figure 21a-f shows the sequence of the burning process After the burns were completed the stainless steel containers were allowed to cool and were then transported back to the lab where the residues were sampled for both physical and chemical analyses
35
(a) (b)
(c)
(e)
(d)
(f)
Figures 21a-f Images from the larger-scale burn at LSU in 2014 (a) pans with South Louisiana crude floated on seawater (b) ignition procedure (c-e) sequence of mid-burn photos (f) extinguishment
Task 5 Physical and chemical characterization of burn residue resulting from Task 4
There was not enough material to complete both the physical and chemical characterization of the initial smaller-scale burn of MC252 oil in 2012 therefore only chemical characterization was completed for the triplicate burn samples Normal alkane chromatographic profiles (Figure 22) of the replicates from the smaller-scale controlled burn of MC252 oil exhibited similar chemical characteristics as the in-situ burn samples collected during the response to the Deepwater Horizon
36
oil spill and also resemble the normal alkane chromatographic profile of the shrimp trawl tarball in Figure 18a For the ldquoafterrdquo samples the modified FFPI was 054plusmn002 and the modified Wang Pyrogenic Index was 013plusmn002 Significant enhancement in the same pyrogenic PAHs as described earlier for Task 2 was also observed and the total target PAHs were reduced from 12000 mgkg in fresh MC252 oil to an average of 1200 mgkg in the burn residues (a 90 reduction) The PAH profiles for the before and after MC252 from this small-scale burn are shown in Figure 22 along with the PAH profiles from the larger-scale burns
1 0 0 0 1 5 0 0 2 0 0 0 2 5 0 0 3 0 0 0 3 5 0 0 4 0 0 0 4 5 0 0 5 0 0 0 5 5 0 0 6 0 0 0
0
2 0 0 0
4 0 0 0
6 0 0 0
8 0 0 0
1 0 0 0 0
1 2 0 0 0
1 4 0 0 0
1 6 0 0 0
1 8 0 0 0
2 0 0 0 0
2 2 0 0 0
2 4 0 0 0
2 6 0 0 0
2 8 0 0 0
T i m e - - gt
A b u n d a n c e
I o n 5 7 0 0 ( 5 6 7 0 t o 5 7 7 0 ) G T 1 2 0 6 4 I D d a t a m s
1 0 0 0 1 5 0 0 2 0 0 0 2 5 0 0 3 0 0 0 3 5 0 0 4 0 0 0 4 5 0 0 5 0 0 0 5 5 0 0 6 0 0 0
0
2 0 0 0
4 0 0 0
6 0 0 0
8 0 0 0
1 0 0 0 0
1 2 0 0 0
1 4 0 0 0
1 6 0 0 0
1 8 0 0 0
2 0 0 0 0
2 2 0 0 0
2 4 0 0 0
2 6 0 0 0
T i m e - - gt
A b u n d a n c e
I o n 5 7 0 0 ( 5 6 7 0 t o 5 7 7 0 ) G T 1 2 0 6 4 J D d a t a m s
1 0 0 0 1 5 0 0 2 0 0 0 2 5 0 0 3 0 0 0 3 5 0 0 4 0 0 0 4 5 0 0 5 0 0 0 5 5 0 0 6 0 0 0
0
5 0 0 0
1 0 0 0 0
1 5 0 0 0
2 0 0 0 0
2 5 0 0 0
3 0 0 0 0
3 5 0 0 0
4 0 0 0 0
4 5 0 0 0
5 0 0 0 0
5 5 0 0 0
6 0 0 0 0
T i m e - - gt
A b u n d a n c e
I o n 5 7 0 0 ( 5 6 7 0 t o 5 7 7 0 ) G T 1 2 0 6 4 K D d a t a m s
Figure 22 Normal alkane profiles (mz 57) for three replicate samples from a small-scale lab burn of MC252 oil
Results of the second larger-scale burn of surrogate south Louisiana crude oil were quite different from the actual in-situ burn samples previously characterized in Task 2 and from the small-scale burn of MC252 There were no significant changes in density or percent asphaltenes There was no enhancement of the pyrogenic PAHs observed in the actual ISB samples and the smaller scale controlled burn Only the modified FFPI showed a significant (p=lt0001) change The average FFPI
37
before burning was 079plusmn006 and the average FFPI after burning was 070plusmn002 Table 11 summarizes the results of the larger-scale controlled burn described above
Table 11 Summary of Chemical Characteristics from Larger-Scale Controlled Burn
15 Weathered Fresh Surrogate Oil Surrogate Oil Emulsified MC252 Oil
(by weight)
Before After Before After Before After
Avg Total Aromatics 8100 3600plusmn310 9400 3400plusmn310 2700 2600plusmn270
(mgkg)
Avg Modified FFPI 083 069plusmn002 083 071plusmn001 073 071plusmn001
Avg Wang Pyrogenic Index 001 004plusmn001 001 004plusmn0004 001 001plusmn00003
Avg PhenAnth 453 133plusmn20 457 117plusmn12 123 674plusmn88
Avg FluorAntPyr 038 060plusmn006 035 080plusmn001 040 032plusmn002
n= 1 3 1 3 1
15 Weathered Surrogate Oil
Fresh Surrogate Oil (by weight) Emulsified MC252 Oil
Before After Before After Before After
Avg Density (n=3) 086plusmn0001 084plusmn005 090plusmn0002 094plusmn002 098plusmn0003 099plusmn001
Avg Asphaltenes (n) 10(1) 198plusmn067(3) 090(1) 198plusmn068(3) 171(1) 220plusmn034
Figure 23 is a graphical depiction of the Wang Pyrogenic Index ldquoBeforerdquo samples are clearly separated from most of the ldquoafterrdquo samples in the figure Fresh oil before and 15 weathered oil before are on top of each other in the plot (0006 45) According to Wang et al (1999) lighter petroleum products and most crude oils fall into the range of 000-001 which is supported in this instance The ldquoafterrdquo samples are characterized by an increase in the pyrogenic index along with a decrease in the phenanthreneanthracene ratio however the majority fall in the range of what Wang et al would consider to be heavy oilsfuels and tarballs There was very little change in the Wang Pyrogenic Index for the emulsified MC252 oil
0
20
40
60
80
100
120
140
0000 0005 0010 0015 0020 0025 0030 0035 0040 0045 0050
Ph
en
An
th
Wang Pyrogenic Index
Laboratory Controlled Burn
Before Burning After Burning Fresh After Burning 15 Weathered After Burning Emulsified
Figure 23 Plot of the Wang pyrogenic index over the ratio of phenanthreneanthracene for laboratory controlled burning of surrogate crude oil and emulsified MC252 oil
38
3
The difference in results may be due to the use of the surrogate south Louisiana crude oil instead of MC252 oil unfortunately this was the only option for burning a larger volume of oil under controlled conditions as availability of original MC252 riser oil is extremely limited Controlled in-situ burning decreased the average total target aromatics of the fresh surrogate oil by approximately 45 and the average total target aromatics of the 15 weathered surrogate oil by approximately 36 both of which are similar for the field in-situ burn samples
Emulsified MC252 oil collected during the Deepwater Horizon clean-up operations was also burned during this portion of the laboratory work The emulsified MC252 oil did not burn well and as a result reflected the least amount of change from before to after There were no significant changes in the emulsified MC252 oilrsquos total aromatics modified FFPI and there was no enhancement of the pyrogenic PAHs Figure 24 shows the PAH profiles for each oil type and post-burn residues tested in the larger-scale controlled burn
Hopane normalization (Aeppli et al 2014 Douglas et al 1996 Garrett et al 2000 Prince et al 1994) was applied to the Fresh and 15 Weathered surrogate South Louisiana Crude oil Using the hopane normalized concentrations the percent increase or decrease of each target analyte was calculated and are presented in Figure 25 An average 5-point response factor of 091 (R2=09912) was determined for 17β(H)21β(H)-30-hopane This response factor was then used to calculate the concentration of 17α(H)21β(H)-hopane The hopane normalization factor (HopaneOilHopaneWeathered) for the Fresh surrogate oil was 076 and 088 for the 15 Weathered surrogate oil The results of the hopane normalization of controlled laboratory burns confirms the enrichment of higher molecular weight analytes previously documented in Tasks 2 and 5 (small-scale burn of MC252 oil)
39
2000
Co
nc
(mg
k
g)
Co
nc
(mg
k
g)
1500
Before 1000
After
500
0
(d) Emulsified MC252 Oil 2014
350 300 250 200 150
Before 100 50 After
Co
nc
(mg
k
g)
Co
nc
(mg
k
g)
2000
1500
Before 1000
After
500
0
(b) Fresh Surrogate Oil 2014
1600
1400
1200
1000 Before
800 After
600
400
200
0
(c) 15 Weathered Surrogate Oil 2014
(a) MC252 Oil 2012
0
NA
PH
C1
-Nap
hs
C2
-Nap
hs
C3
-Nap
hs
C4
-Nap
hs
FL
UO
RC
1-F
luo
rsC
2-F
luo
rsC
3-
Flu
ors
DB
TC
1-D
BT
sC
2-D
BT
sC
3-
DB
Ts
PH
EN
C1
-Ph
ens
C2
-Ph
ens
C3
-Ph
ens
C4
-Ph
ens
AN
TH
FL
UO
RA
NT
PY
RC
1-
Py
rsC
2-
Py
rsC
3-
Py
rsC
4-
Py
rsN
BT
C-1
NB
Ts
C-2
NB
Ts
C-3
NB
Ts
B(a
)AN
TH
CH
RY
C1
-C
hry
sC
2-
Ch
rys
C3
-C
hry
sC
4-
Ch
rys
B(b
)FB
(k)F
B(e
)PB
(a)P
PE
RY
LIN
DP
YR
D(a
h)A
B(g
hi)
P
Figures 24a-d Before and after PAH profiles for controlled burns of four oil types in 2012 and 2014 (a) MC252 riser oil (b) fresh surrogate South Louisiana crude (c) weathered surrogate South Louisiana crude and (d) emulsified MC252
40
-150
-100
-50
0
50
100
150
200
250
300
350
NA
PH
C1-N
aphs
C2-N
aphs
C3-N
aphs
C4-N
aphs
FLU
OR
C1-F
luor
s
C2-F
luor
s
C3-F
luor
s
DB
T
C1-D
BTs
C2-D
BTs
C3-D
BTs
PHEN
C1-P
hens
C2-P
hens
C3-P
hens
C4-P
hens
AN
TH
FLU
OR
AN
T
PYR
C1-P
yrs
C2-P
yrs
C3-P
yrs
C4-P
yrs
NB
T
C-1
NB
Ts
C-2
NB
Ts
C-3
NB
Ts
B[a
]AN
TH
CHR
Y
C1-C
hrys
C2-C
hrys
C3-C
hrys
C4-C
hrys
B[b
]F
B[k
]F
B[e
]P
B[a
]P
PER
YL
D[a
h]A
B[g
hi]
P
IN
CREA
SE O
R D
ECR
EASE
(a) Fresh Surrogate Oil
-150
-50
50
150
250
350
450
NA
PH
C1-N
aphs
C2-N
aphs
C3-N
aphs
C4-N
aphs
FLU
OR
C1-F
luor
s
C2-F
luor
s
C3-F
luor
s
DB
T
C1-D
BTs
C2-D
BTs
C3-D
BTs
PHEN
C1-P
hens
C2-P
hens
C3-P
hens
C4-P
hens
AN
TH
FLU
OR
AN
T
PYR
C1-P
yrs
C2-P
yrs
C3-P
yrs
C4-P
yrs
NB
T
C-1
NB
Ts
C-2
NB
Ts
C-3
NB
Ts
B[a
]AN
TH
CHR
Y
C1-C
hrys
C2-C
hrys
C3-C
hrys
C4-C
hrys
B[b
]F
B[k
]F
B[e
]P
B[a
]P
PER
YL
D[a
h]A
B[g
hi]
P
IN
CREA
SE O
R D
ECR
EASE
(b) 15 Weathered Surrogate Oil
Figure 25 Determination of percent increase or decrease of target analytes based on hopane normalization for (a) Fresh surrogate oil and (b) 15 Weathered surrogate oil
41
Task 6 Forensic interpretation of analytical results to characterize physical and chemical changes occurring during the combustion of oil to include comparison of changes occurring in various weathered oil samples and identification of potential markers for in-situ burn residues
A primary objective of the forensic interpretation of analytical results was to determine if residues from in-situ burning during the Deepwater Horizon response had measurable characteristics that could distinguish them from other MC252 residues Results from the other tasks previously discussed indicated that these characteristics included bull Significant increase in density and percent asphaltenes bull Enhancement of pyrogenic PAHs bull Decrease in the FFPI Increase in the Wang Pyrogenic Index and bull Evidence of thermal combustion in the normal alkane profile
However it appears that all of these discriminating factors must be present to make the distinction between sources with any confidence Because of this limitation the forensic interpretation was expanded to include a statistical analysis of sample matrices and sampling locations based on the diagnostic biomarker ratio analyses
A total of 130 suspected MC252 residues was initially chosen All samples were grouped according to year sample matrix (eg ISB oil ISB tarball oil other sediment or tarball) and sampling location (eg marsh ocean depth shore or water surface) These samples were then narrowed to a total of 112 by the diagnostic ratio analyses Only samples determined to be a statistical match to MC252 oil were used in the matrix and sampling location comparisons A one-way ANOVA with a post-hoc Tukey-Kramer pairwise comparison Table 12 was applied to the sample matrix analysis for each of the 15 diagnostic ratios to determine if any of the ratios could distinguish between in-situ burn residues and other MC252 oil residues The Tukey-Kramer comparison separates samples into lettered groups based on the minimum significant difference between means (p=005) Groups with the same letter have means that are not significantly different from each other and groups with differing letters are significantly different from each other For the sample location effects a nested ANOVA with random effects and a variance components covariance structure was carried out for each diagnostic ratio to determine if there were any differences due to location of sample collection In both cases the sample number in each matrix or location was highly unbalanced
A total of 7 out of 15 diagnostic ratios had significant differences between sample matrices Of these 7 ratios 4 showed significant differences between in-situ burn residues and other MC252 oil residues
bull The hopane ratio C31 aB (S+R)C32 aB (S+R) + C33 aB (S+R) was significantly different for ISB oil and ISB tarball Both of the in-situ burn residues were significantly different from all other matrices except the tarball matrix
bull Another hopane ratio C33 aB (S+R)C31 aB (S+R) + C32 aB (S+R) for ISB tarball was significantly different from all other matrices and ISB oil was significantly different from all other matrices except tarball and oil
bull The diasterane and regular sterane ratio C28 aaa-RC29 aaa-R was significantly different when comparing ISB oil and oil residues
42
bull The last significant ratio was C27 BB (S+R)C28 BB (S+R) + C29 BB (S+R) (in the 14(β)H-steranes group) This ratio was significantly different when comparing ISB tarballs to other tarballs
Table 12 Tukey-Kramer Pairwise Comparisons of Diagnostic Ratios for Different Matrices
C31 aB (S+R)C32 aB (S+R) + C33 aB (S+R) C28 aaa-RC29 aaa-R
Matrix Mean SE Group Matrix Mean SE Group
Sediment 10533 183E-02 A Oil 07825 943E-03 A
Other 09933 183E-02 AB Other 07767 267E-02 AB
Oil 09575 648E-03 BC Tarball 07592 740E-03 AB
ISBTarball 09451 508E-03 BCD 07477 906E-03 AB
Tarball
ISB Oil 09309 662E-03 CD Sediment 07400 267E-02 AB
ISB 09300 622E-03 D ISB Oil 07361 963E-03 B
Tarball
C33 aB (S+R)C31 aB (S+R) + C32 aB (S+R) C27 BB (S+R)C28 BB (S+R) + C29 BB (S+R)
Matrix Mean SE Group Matrix Mean SE Group
ISB Tarball
02788 290E-03 A Other 07550 345E-02 AB
ISB Oil 02743 309E-03 AB Tarball 07500 824E-03 A
Tarball 02667 237E-03 BC Oil 07340 218E-01 AB
Oil 02646 302E-03 BCD ISB Tarball
07006 115E-01 B
Other 02467 855E-03 CD Sediment 07000 282E-01 AB
Sediment 02400 855E-03 D ISB Oil 06900 218E-02 AB
Therefore C28 aaa-RC29 aaa-R may be useful for distinguishing ISB oil from other oil residues and C27 BB (S+R)C28 BB (S+R) + C29 BB (S+R) may be useful distinguishing ISB tarballs from other tarballs
A total of 5 out of 15 diagnostic ratios showed significant differences between sample matrix and sampling location The statistical analysis did not determine which matrix by sampling location was significant it was performed to determine if sampling location was a factor in distinguishing some of these oil residues Sampling location can have an important role because this often governs how oil residues weather Therefore this analysis supported the notion that oil residues from the same type of oil may show different characteristics determined by differences in weathering in various sampling locations without compromising the ability to make statistical matchnon-match determinations with the same ratios
43
SUMMARY AND CONCLUSIONS
A primary objective of this study was to identify possible indicators that could distinguish in-situ burn residues from other oil residues based on physical and chemical analyses of actual Deepwater Horizon in-situ burn samples Unfortunately while there is no single reliable indicator of in-situ burning partial indicators (eg different normal alkane profile enhancement of pyrogenic PAHs and reduction in the modified Fossil Fuel Pollution Index) when considered as an integrated whole can point to in-situ burning as a significant driver of weathering and fate Table 3 shows some of the characteristics assessed in this study Notable in these results is the enhancement in asphaltenes content for known burn residues and the tarballs recovered from deep water shrimp trawls
Table 13 Comparison of Physical and Chemical Characteristics for Different Oil Matrices
MC252 SLC Pre- SLC Post- ISB Oil ISB Oil Shrimp Other MC252 Riser Burn Burn Pre-Burn Post-Burn Tarballs Tarballs
Density gmL 084 086 084 088 096 104 086
Asphaltene 09-10 10 198 15 42 22 15
FFPI 083 079 070 077 065 062 059 Wang Pyrogenic
0004 001 004 001 007 006 004 Index
Even the use of a series of partial indicators must be employed cautiously comparison of the normal alkane profile for example has the caveat that the same profile was not observed in oil residues collected immediately after in-situ burning The distinctive profile appeared only in tarballs that had been recovered from trawls two hundred meters below the ocean surface The asphaltenes content of the shrimp trawl tarballs was significantly higher than all the other samples which indicates that asphaltenes content positively correlated with the tendency of those oil residues to sink Density was a factor but does not appear to be as critical as the percent asphaltenes with respect to sinking tarballs
The majority of residues from the Deepwater Horizon oil spill retained their oil biomarker signatures making diagnostic ratio analyses possible The diagnostic ratios were used to
1) Determine if the oil residue was a match to MC252 oil and 2) Determine if there were any differences in the ratios in matching oil residues based on
sample matrix and sampling location
A total of 4 out of the 15 diagnostic biomarker ratios did distinguish in-situ burn residues from the majority of the other residues Two of these ratios C28 aaa-RC29 aaa-R and C27 BB (S+R)C28 BB (S+R) + C29 BB (S+R) may be useful for distinguishing ISB oil from other oil residues and ISB tarballs from other tarballs respectively Significant differences were also determined in the comparison of sampling locations These differences suggest that weathering of oil residues from the same initial source is highly dependent on the specific environmental compartment in which they reside without compromising the ability to make matchnon-match determinations with the same ratios
44
The in-situ burning research described in this report combined retrospective analysis of samples collected during the Deepwater Horizon response with new laboratory work and interpretation to increase the relevance and applicability of the physical and chemical results The methodological refinements improved our abilities to distinguish burn products from other weathered oil matrices and helped to confirm the generalized source attributions to burn operations that were made shortly after tarballs were encountered in the Gulf of Mexico royal red shrimp fishery It is important to note that the chemical characterization method (GC-MS) and target analyte list used for this report only examines about 5 of the oil mass Other analytical methods such as GCxGC-FID (Aeppli et al 2014) or APPI FT-ICR MS have become standard instrument systems for analyzing crude oil Both have advantages over GC-MS in that they can separate and identify a much larger percentage of oil compounds however it cannot be denied that GC-MS is still relevant and is one of the most recognized instrument systems for characterizing crude oil in the environment
The Deepwater Horizon spill experience validated the operational feasibility and practical application of in-situ burning as an open water response method Like nearly everything else about this incident the scale of in-situ burn operations was unprecedented between 28 April and 19 July 2010 over 400 individual burns took place consuming an estimated 220000-310000 bbl of oil This is roughly equivalent to the total volume for the Exxon Valdez oil spill in 1989
Implicit in these numbers is the large volume of in-situ burn residue that was generated during the Deepwater Horizon operations Using the standard in-situ burn efficiency estimates of 90-95 percent the amount of residue resulting from the operations potentially ranged from 11000shy33000 bbl This is a substantial amount of petroleum hydrocarbons introduced into a relatively small portion of the marine environmentmdashalthough it should be noted that natural seeps contribute an estimated 560000 to 14 million bbl of oil into the waters of the Gulf of Mexico (National Research Council 2003) each year (note seep locations in Figure 26)
The fate of the burn residue from the Deepwater Horizon in-situ burn operations might never have been known were it not for the chance encounters of the single deep water fishery operating in the same general area as most of the burn operations (Figure 26) Impacts to the fishery were minimal and it was quickly re-opened after testing and analysis by federal fisheries managers and seafood safety specialists However the residue and fishery interactions that occurred in 2010 and 2011 represent a cautionary footnote to large-scale in-situ burn operations that should be factored into tradeoff analysis for future spill responses Further the Deepwater Horizon experience suggests a need for additional research into burn residue containment or recovery methods that would reduce or eliminate potential fishery impacts associated with sinking residue
On a final note we recommend that the Environmental Unit for a spill response where burn operations are regularly taking place should collaborate with the Operations Section to collect analyze and archive paired samples of pre- and post-burn oil to facilitate the process of source identification of oil residues encountered during a response In doing so a solid empirical database of physical and chemical characteristics would be built over time to permit a better understanding of the changes occurring to oil during in-situ burning the circumstances in which residues will floatsink and the specific markers and physical features that might be used to uniquely identify burn residues
45
Figure 26 Composite map showing locations of the Macondo wellhead in-situ burn operations royal red shrimp trawls with preliminary source identifications and known hydrocarbon seeps Numbers in boxes denote approximate tarball counts in each quadrant Prepared by JB Huyett Genwest Systems
46
REFERENCES
Aeppli C RK Nelson JR Radović CA Carmichael DL Valentine and CM Reddy 2014 Recalcitrance and degradation of petroleum biomarkers upon abiotic and biotic natural weathering of Deepwater Horizon oil Environmental Science and Technology 486726-6734
Allen AA NJ Mabile D Jaeger and D Costanzo 2011 The use of controlled burning during the Gulf of Mexico Deepwater Horizon MC-252 oil spill response In Proceedings of the 2011 International Oil Spill Conference 23-26 May 2011 Portland OR 13 pp
httpdxdoiorg1079012169-3358-2011-1-194
American Society for Testing Materials D71-94(2009) Standard test method for relative density of solid pitch and asphalt (displacement method) ASTM International West Conshohocken PA 2012
American Society for Testing Materials D3279-12 Standard test method for n-heptane insoluble ASTM International West Conshohocken PA 2012
Anderson WW and MJ Lindner 1971 Contributions to the biology of the royal red shrimp Hymenopenaeus robustus Smith Fishery Bulletin 69(2)313-336
Boehm PD and JW Farrington 1984 Aspects of the polycyclic aromatic hydrocarbon geochemistry of recent sediments in the Georges Bank Region Environmental Science and Technology 18(11)840-845
Bullis HR Jr 1956 Preliminary results of deep-water exploration for shrimp in the Gulf of Mexico by the MV Oregon (1950-1956) Commer Fish Rev 18(12)1-12
Buist I 1998 Window of opportunity for in situ burning In Proceddings of the In Situ Burning of Oil Spills Workshop US Minerals Management Service Special Publication 935 21-30
Buist I and K Trudel 1995 Laboratory studies of the properties of in-situ burn residues Marine Spill Response Corporation Washington DC MSRC Technical Report Series 95-010 110 p
Buist I K Trudel J Morrison and D Aurand 1995 Laboratory studies of the physical properties of in-situ burn residues In Proceedings of the Eighteenth Arctic and Marine Oilspill Program (AMOP) June 14-16 1995 Edmonton Alberta 1027-1051
Buist I K Trudel J Morrison and D Aurand 1997 Laboratory studies of the properties of in-situ burn residues In Proceedings of the 1997 International Oil Spill Conference April 1997 1997(1)149-156
Cascorbi A 2007 Wild-caught warmwater shrimp (Infraorder Penaeus--the Penaeid shrimps) Gulf of Mexico and US South Atlantic Regions Seafood Watch Seafood Report Monterey Bay Aquarium 52 pp
Douglas GS AE Bence RC Prince SJ McMillen and EL Butler 1996 Environmental stability of selected petroleum hydrocarbon source and weathering ratios Environmental Science and Technology 30(7)2332-2339
47
Farfante IP 1988 Illustrated key to Penaeoid shrimps of commerce in the Americas NOAA Technical Report NMFS 64 April 1988 32 pp
Federal Interagency Solutions Group Oil Budget Calculator Science and Engineering Team 2010 Oil Budget Calculator Deepwater Horizon Technical Documentation A Report to the National Incident Command November 2010 49 pp + appendices
Fingas MF G Halley F Ackerman N Vanderkooy R Nelson MC Bissonnette N Laroche P Lambert P Jokuty K Li W Halley G Warbanski PR Campagna RD Turpin MJ Trespalacios D Dickins EJ Tennyson D Aurand and R Hiltabrand 1994a The Newfoundland Offshore Burn Experiment ndash NOBE experimental design and overview In Proceedings of the Seventeenth Arctic and Marine Oilspill Program (AMOP) June 8-10 1994 Vancouver British Columbia 1053-1063
Fingas MF F Ackerman K Li P Lambert Z Wang MC Bissonnette PR Campagna P Boileau N Laroche P Jokuty R Nelson RD Turpin MJ Trespalacios G Halley J Belanger J Pareacute N Vanderkooy EJ Tennyson D Aurand and R Hiltabrand 1994b The Newfoundland Offshore Burn Experiment ndash NOBE preliminary results of emissions measurement In Proceedings of the Seventeenth Arctic and Marine Oilspill Program (AMOP) June 8-10 1994 Vancouver British Columbia 1099-1164
Fingas M 2011 An overview of in-situ burning Chapter 23 in M Fingas (ed) Oil Spill Science and Technology New York Gulf Professional PublishingElsevier 737-903
Fingas M 2015 Introduction to Oil Chemistry and Properties In Handbook of Oil Spill Science and Technology M Fingas Ed Hoboken NJ John Wiley amp Sons Inc
Garrett RM CC Gueacutenette CE Haith and RC Prince 2000 Pyrogenic polycyclic aromatic hydrocarbons in oil burn residues Environmental Science and Technology 34(10)1934-1937
Gulf of Mexico Fishery Management Council 2004 Appendix C Information on Species Distributions and Habitat Associations Final Environmental Impact Statement for the Generic Essential Fish Habitat Amendment to the following fishery management plans of the Gulf of Mexico (GOM) shrimp fishery of the Gulf of Mexico red drum fishery of the Gulf of Mexico reef fish fishery of the Gulf of Mexico stone crab fishery of the Gulf of Mexico coral and coral reef fishery of the Gulf of Mexico spiny lobster fishery of the Gulf of Mexico and South Atlantic coastal migratory pelagic resources of the Gulf of Mexico and South Atlantic 262 pp
Gulf of Mexico Fishery Management Council 2005 Final Amendment Number 13 to the Fishery Management Plan for the Shrimp Fishery of the Gulf of Mexico US Waters with Environmental Assessment Regulatory Impact Review and Regulatory Flexibility Act analysis August 24 2005 272 pp
Hansen AB PS Daling LG Faksness KR Sorheim P Kienhuis and R Duus 2007 Emerging CEN Methodology for Oil Spill Identification In Oil Spill Environmental Forensics Z Wang and SA Stout Eds Boston MA Elsevier
Jaeger A 2011 Personal communication 27 September 2011
Kucklick JH and D Aurand 1997 Historical dispersant and in-situ burning opportunities in the
48
United States Proc 1997 International Oil Spill Conference 805 ndash 810
Leahy JG and RR Colwell 1990 Microbial degradation of hydrocarbons in the environment Microbiological Reviews 54305-315
Lewan MD A Warden RF Dias ZK Lowry TL Hannah PG Lillis RF Kokaly TM Hoefen GA Swayze CT Mills SH Harris GS Plumlee 2014 Organic Geochemistry 75(2014)54-60
Meyer BM EB Overton and RE Turner 2014 Oil source identification using diagnostic biomarker ratio analyses In 2014 International Oil Spill Conference Proceedings Savannah GA May 5-9 2014(1)2064-2073
Michel J D Scholz SR Warren Jr and AH Walker 2005 In-situ burning A decision-makerrsquos guide to in-situ burning API Publication Number 4740 Washington DC American Petroleum Institute 60 pp
Mills MA TJ McDonald JS Bonner MA Simon and RL Autenrieth 1999 Method for quantifying the fate of petroleum in the environment Chemosphere 39(14)2563-2582
Mullin JV and MA Champ 2003 Introductionoverview to in situ burning of oil spills Spill Science amp Technology 8(4)323-330
National Research Council Committee on Oil in the Sea 2003 Oil in the Sea III Inputs Fates and Effects National Research Council Ocean Studies Board and Marine Board Divisions of Earth and Life Studies and Transportation Research Board Washington DC National Academy Press 265 pp
Operational Science Advisory Team-2 2011 Net Environmental Benefits Analysis (NEBA) Annex M to Summary Report for Fate and Effects of Remnant Oil in the Beach Environment prepared for Lincoln D Stroh US Coast Guard Federal On-Scene Coordinator 48 pp
Overton EB WD Sharp and P Roberts 1994 Toxicity of Petroleum In Basic Environmental Toxicology LG Cockerham and BS Shane Eds Boca Raton FL CRC Press Inc
Prince RC DL Elmendorf JR Lute CS Hsu CE Haith JD Senius GJ Dechert GS Douglas and EL Butler 1994 17α(H)21β(H)-hopane as a conserved internal marker for estimating the biodegradation of crude oil Environmental Science and Technology 28(1)142-145
SL Ross Environmental Research Ltd 2010 Spill Related Properties of MC252 Crude Oil Sample ENT-052210-178 Appendix 8 to Oil Budget Calculator Deepwater Horizon Technical Documentation A Report to the National Incident Command November 2010 7 pp
Stiles ML E Harrould-Kolieb P Faure H Ylitalo-Ward and MF Hirshfield 2007 Deep sea trawl fisheries of the Southeast US and Gulf of Mexico rock shrimp royal red shrimp calico scallops Report for Oceana May 2007 18 pp
US Coast Guard 2011 BP Deepwater Horizon Oil Spill Incident Specific Preparedness Review (ISPR) Final Report Report prepared for ADM RJ Papp Commandant January 2011 158 pp
Wang Z M Fingas YY Shu L Sigouin M Landriault P Lambert R Turpin P Campagna and J
49
Mullin 1999 Quantitative characterization of PAHs in burn residue and soot samples and differentiation of pyrogenic PAHs from petrogenic PAHsmdashthe 1994 Mobile burn study Environ Sci Technol 33(18)3100-3109
Zack S 2007 Royal red shrimp Stoningtonrsquos succulent secret Connecticut Sea GrantWrack Lines 72 FallWinter 2007 6 pp
ACKNOWLEDGMENTS
Funding for this project was provided by the US Department of the Interior Bureau of Safety and Environmental Enforcement (BSEE) under Interagency Agreement E13PG00001 We thank the outside peer reviewers recruited by BSEE for their constructive comments and criticism and for improving the clarity of the project report The authors wish to acknowledge the assistance and support of Alan A Allen of Spiltec and Nere Mabile of BP during the Deepwater Horizon response in Houma LA CPO RJ Schrader of the US Coast Guard shared his expertise experiences and photographs from the field implementation of in-situ burn operations during the spill The data analysis for this report was generated using SAS software Version 93 of the SAS System for Windows Copyright copy 2002-2010 by SAS Institute Inc SAS and all other SAS Institute Inc product or service names are registered trademarks or trademarks of SAS Institute Inc Cary NC USA
DISCLAIMER
Reference to specific commercial products process or service by trade name trademark manufacturer or otherwise does not constitute or imply their endorsement recommendation or favoring by the United States Government The views and opinions of authors expressed do not necessarily state or reflect those of the United States Government and shall not be used for advertising or product endorsement purposes
50
APPENDIX 1
DIAGNOSTIC BIOMARKER RATIOS
Petroleum Biomarkers Used For Calculating MC252 Diagnostic Ratios
Abbreviation Compound Name mz Value
C27 18α(H)-222930-trisnorneohopane 191C27 Ts C27 Tm C27 17α(H)-222930-trisnorhopane 191 C29 aB C29 17α(H)21β(H)-30-norhopane 191 C29 Ts C29 18α(H)-30-norneohopane 191 C30 aB C30 17α(H)21β(H)-hopane 191 C31 aB (S+R) C31 17α(H)21β(H)-22(S+R)-homohopane 191 C32 aB (S+R) C32 17α(H)21β(H)-22(S+R)-bishomohopane 191 C33 aB (S+R) C32 17α(H)21β(H)-22(S+R)-trishomohopane 191 C27D Ba-S C27 13β(H)17α(H)20S-diasterane 217 C27D Ba-R C27 13β(H)17α(H)20R-diasterane 217 C29D Ba-S C29 24-ethyl-13β(H)17α(H)20S-diacholestane 217 C29D Ba-R C29 24-ethyl-13β(H)17α(H)20R-diacholestane 217 C28 aaa-R C28 24-methyl-5α(H)14α(H)17α(H) 20R-cholestane 217 C29 aaa-R C29 24-ethyl-5α(H)14α(H)17α(H) 20R-cholestane 217 C27 BB (R+S) C27 5α(H)14β(H)17β(H)-cholestane (20R+20S) 218 C28 BB (R+S) C28 24-methyl-5α(H)14β(H)17β(H)-cholestane (20R+20S) 218 C29 BB (R+S) C29 24-ethyl-5α(H)14β(H)17β(H)-cholestane (20R+20S) 218 C20 TA C20-triaromatic steroid (pregnane derivative) 231 C21 TA C21-triaromatic steroid (homopregnane derivative) 231 C26 TA-S C26-triaromatic steroid20S (cholestane derivative) 231 C28 TA-S C28-triaromatic steroid20S (ethylcholestane derivative) 231 C27 TA-R C27-triaromatic steroid20R (methylcholestane derivative) 231 C28 TA-R C28-triaromatic steroid20R (ethylcholestane derivative) 231
52
Diagnostic Ratios Chosen for MC252 Source Oil
Ratio mz
Value
C27 Ts C27 Tm 191
C29 aBC29 Ts 191
C29 aBC30 aB 191
C31 aB(S+R)C32 aB(S+R) + C33 aB(S+R) 191
C32 aB(S+R)C31 aB(S+R) + C33 aB(S+R) 191
C33 aB(S+R)C31 aB(S+R) + C32 aB(S+R) 191
C27D Ba-SC27D Ba-R 217
C29D Ba-SC29D Ba-R 217
C28 aaa-RC29 aaa-R 217
C27 BB(R+S)C28 BB(R+S) + C29 BB(R+S) 218
C28 BB(R+S)C27 BB(R+S) + C29 BB(R+S) 218
C29 BB(R+S)C27 BB(R+S) + C28 BB(R+S) 218
C20 TAC21 TA 231
C26 TA-SC28 TA-S 231
C27 TA-RC28 TA-R 231
53

200
NA
PH
C1
-Na
ph
sC
2-N
ap
hs
C3
-Na
ph
sC
4-N
ap
hs
FL
UO
RC
1-F
luo
rsC
2-F
luo
rsC
3-
Flu
ors
DB
TC
1-D
BT
sC
2-D
BT
sC
3-
DB
Ts
0
Figure 11 Target analyte profiles for n-alkanes (top) and aromatics (bottom) in fresh MC252 source oil (riser fluid)
PH
EN
C1
-Ph
en
sC
2-P
he
ns
C3
-Ph
en
sC
4-P
he
ns
AN
TH
FL
UO
RA
NT
PY
RC
1-
Py
rsC
2-
Py
rsC
3-
Py
rsC
4-
Py
rsN
BT
C-1
NB
Ts
C-2
NB
Ts
C-3
NB
Ts
B[a
]AN
TH
C
HR
YC
1-
Ch
rys
C2
-C
hry
sC
3-
Ch
rys
C4
-C
hry
sB
[b]F
B[k
]FB
[e]P
B[a
]PP
ER
YL
I[1
23
-cd
]PD
[ah
]AB
[gh
i]P
Co
nc
(mg
k
g)
Co
nc
(mg
k
g)
5000
4000
3000
2000
1000
0
nC
-10
nC
-11
nC
-12
nC
-13
nC
-14
nC
-15
nC
-16
nC
-17
Pri
sta
ne
6000
Total Target Alkanes = 51550 mgkg
MC 252 Target Aromatics
1800
Total Target Aromatics = 11900 mgkg 1600
1400
1200
1000
800
600
400
nC
-18
Ph
yta
ne
nC
-19
nC
-20
nC
-21
nC
-22
nC
-23
nC
-24
nC
-25
nC
-26
nC
-27
nC
-28
nC
-29
nC
-30
nC
-31
nC
-32
nC
-33
nC
-34
nC
-35
The chemical characterization of fresh MC252 is shown in Figure 10 MC252 oil is a light sweet crude oil with a normal alkane hydrocarbon range of nC10 through nC35 (Figure 11 top) and an aromatic profile dominated by the naphthalenes (Figure 11 bottom)
MC252 Target n-Alkanes
20
Task 2 Physical and chemical characterization of Deepwater Horizon in-situ burn samples (pre-burn oil and post-burn residue)
A total of 20 in-situ burn samples collected during response operations were analyzed One batch of 18 samples was received at LSU on 27 May 2010 and two samples one ldquobeforerdquo and one ldquoafterrdquo sample were later received on 20 July 2010 Of these 20 there were 9 sets of before and after samples The sample set from July 2010 was of limited quantity therefore chemical characterization took priority over physical characterization For the physical characterization of the May 2010 samples (Tables 4 and 5) the average density of samples before in-situ burning was 088plusmn008 (n=7) and the average density of samples after in-situ burning was 096plusmn002 (n=8) The increase in density was significant (p=003 Student two-tailed t-test with the assumption of equal variance) The average percent asphaltenes of samples before in-situ burning was 15plusmn05 (n=5) and the average percent asphaltenes of samples after in-situ burning was 42 (n=5) The increase in percent asphaltenes was not statistically significant (p=0 08 Student two-tailed t-test with the assumption of equal variance) It was assumed that percent asphaltenes would have increased as a result of burning it did but did not attain statistical significance
Table 4 Densities for Before and After In Situ Burning of MC252 Oil
LSU ID Burn
Status Pycnometer
Wt (g) Pycnometer +
Sample (g) Mass of
Sample (g)
Volume of Pycnometer
(mL)
Density (gmL)
2010147-122 Before 5109 6029 920 115 080
2010147-124 Before 5122 6189 1067 115 093
2010147-126 Before 5121 6199 1078 115 094
2010147-128 Before 5109 5958 848 115 074
2010147-130 Before 5121 6197 1076 115 094
2010147-134 Before 5121 6170 1049 115 091
2010147-136 Before 5121 6184 1063 115 092
AVERAGE BEFORE 088
STDEV BEFORE 008
2010147-123 After 5124 6221 1097 115 095
2010147-125 After 5109 6177 1068 115 093
2010147-129 After 5122 6244 1122 115 098
2010147-135 After 5108 6246 1138 115 099
2010147-137 After 5105 6228 1123 115 098
2010147-138 After 5121 6246 1125 115 098
2010147-133 After 5108 6178 1070 115 093
AVERAGE AFTER 096
STDEV AFTER 002
21
Table 5 Percent Asphaltenes for Before and After In Situ Burning of MC252 Oil
LSU ID Burn
Status Sample Wt (g)
Initial VOA Vial Wt (g)
Final VOA Vial Wt (g)
VOA Vial Wt Difference (g)
Asphaltenes by Mass
2010147-122 Before 110 2137 2139 002 14
2010147-126 Before 097 2158 2159 001 12
2010147-130 Before 096 2167 2169 002 23
2010147-134 Before 107 2150 2152 001 14
2010147-136 Before 097 2149 2150 001 11
AVERAGE BEFORE 15
STDEV BEFORE 05
2010147-125 After 096 2492 2495 003 31
2010147-133 After 121 2497 2499 001 12
2010147-135 After 118 2153 2163 010 83
2010147-137 After 181 2536 2547 011 62
2010147-138 After 062 2186 2187 001 22
AVERAGE AFTER 42
STDEV AFTER 30
Table 6 summarizes the chemical characterization of MC252 oil by GCMS-SIM before and after in-situ burning in May and July 2010 and Figure 12 displays the average PAH profile for these samples The PAH profile for the before sample for July 2010 indicates that it was more of a weathered oil than the May 2010 before samples The insets in Figure 11 show the enhancement most of which are significant of the less-volatile aromatics that are associated with pyrogenic sources (eg 5-6 ring PAHs) These compounds were already present in MC252 oil (with the exception of indeno[123-cd]pyrene) however their concentrations increased as a result of in-situ burning This increase is also supported by hopane normalized percent decrease or increase for the controlled laboratory burns in Task 4 However it is important to note that even though these compounds increased as a result of burning their increase was outweighed by the decrease in the overall total PAH concentration This finding is consistent with Garrett et al (2000) and Wang et al (1999)
Table 6 Summary of MC252 Oil Before and After In Situ Burning
May 2010 July 2010
Before After Before After
Avg Total Aromatics (mgkg) 5300plusmn900 2600plusmn1910 3800 997
Avg Modified FFPI 077plusmn003 065plusmn010 075 064
Avg Wang Pyrogenic Index 001plusmn0002 007plusmn006 001 005
Avg PhenAnth 81plusmn29 29plusmn19 140 140
Avg FluorAntPyr 046plusmn003 047plusmn009 049 037
n= 8 10 1 1
22
Co
nc
(ng
m
g)
200
150
100
50
0
(b) At-Sea Burn Operations July 2010
Before After
500 Enhanced 5-6 Ring PAHs
450 100
400 80
350 60
40 300
20
250 00
B[b
]F
B[k
]F
B[e
]P
B[a
]P
PE
RY
L
I[1
23
-cd
]P
D[a
h]A
B[g
hi
]P
NA
PH
C1
-Nap
hs
C2
-Nap
hs
C3
-Nap
hs
C4
-Nap
hs
FL
UO
RC
1-F
luo
rsC
2-F
luo
rsC
3-
Flu
ors
DB
TC
1-D
BT
sC
2-D
BT
sC
3-
DB
Ts
PH
EN
C1
-Ph
ens
C2
-Ph
ens
C3
-Ph
ens
C4
-Ph
ens
AN
TH
FL
UO
RA
NT
PY
RC
1-
Py
rsC
2-
Py
rsC
3-
Py
rsC
4-
Py
rsN
BT
C-1
NB
Ts
C-2
NB
Ts
C-3
NB
Ts
B[a
]AN
TH
CH
RY
C1
-C
hry
sC
2-
Ch
rys
C3
-C
hry
sC
4-
Ch
rys
B[b
]FB
[k]F
B[e
]PB
[a]P
PE
RY
LI[
12
3-c
d]P
D[a
h]A
B[g
hi]
P
0
100
200
300
400
500
600
700
800
900
1000
NA
PH
C1
-Nap
hs
C2
-Nap
hs
C3
-Nap
hs
C4
-Nap
hs
FL
UO
RC
1-F
luo
rsC
2-F
luo
rsC
3-
Flu
ors
DB
TC
1-D
BT
sC
2-D
BT
sC
3-
DB
Ts
PH
EN
C1
-Ph
ens
C2
-Ph
ens
C3
-Ph
ens
C4
-Ph
ens
AN
TH
FL
UO
RA
NT
PY
RC
1-
Py
rsC
2-
Py
rsC
3-
Py
rsC
4-
Py
rsN
BT
C-1
NB
Ts
C-2
NB
Ts
C-3
NB
Ts
B[a
]AN
TH
CH
RY
C1
-C
hry
sC
2-
Ch
rys
C3
-C
hry
sC
4-
Ch
rys
B[b
]FB
[k]F
B[e
]PB
[a]P
PE
RY
LI[
12
3-c
d]P
D[a
h]A
B[g
hi]
P
Co
nc
(ng
m
g)
(a) At-Sea Burn Operations May 2010
Before After
00
50
100
150
B[b
]F
B[k
]F
B[e
]P
B[a
]P
PE
RY
L
I[1
23
-cd
]P
D[a
h]A
B[g
hi
]P
Enhanced 5-6 Ring PAHs
Figures 12 PAH profiles and enhancement of 5-6 ring pyrogenic compounds in MC252 oil as a result of in-situ burning May 2010 (a) and July 2010 (b)
Figure 13 shows the changes in the normal alkane profiles of fresh MC252 riser oil MC252 oil prior to in-situ burning and MC252 oil after in-situ burning In-situ burning decreased the average total target aromatics by approximately 49 for May 2010 samples and approximately 26 for the July 2010 sample set Once again the lower percentage for July is reflective of the weathering that had already altered this pre-burn sample
23
1 0 0 0 1 5 0 0 2 0 0 0 2 5 0 0 3 0 0 0 3 5 0 0 4 0 0 0 4 5 0 0 5 0 0 0 5 5 0 0 6 0 0 0
0
2 0 0 0 0 0
4 0 0 0 0 0
6 0 0 0 0 0
8 0 0 0 0 0
1 0 0 0 0 0 0
1 2 0 0 0 0 0
1 4 0 0 0 0 0
1 6 0 0 0 0 0
1 8 0 0 0 0 0
2 0 0 0 0 0 0
2 2 0 0 0 0 0
2 4 0 0 0 0 0
2 6 0 0 0 0 0
2 8 0 0 0 0 0
3 0 0 0 0 0 0
3 2 0 0 0 0 0
3 4 0 0 0 0 0
3 6 0 0 0 0 0
T i m e - - gt
A b u n d a n c e
I o n 5 7 0 0 ( 5 6 7 0 t o 5 7 7 0 ) M U 1 0 1 4 8 T D d a t a m sI o n 5 7 0 0 ( 5 6 7 0 t o 5 7 7 0 ) M U 1 0 1 4 8 U D d a t a m s
(c)
nC17
nC18
(b) nC17
nC18
1 0 0 0 1 5 0 0 2 0 0 0 2 5 0 0 3 0 0 0 3 5 0 0 4 0 0 0 4 5 0 0 5 0 0 0 5 5 0 0 6 0 0 0
0
5 0 0 0 0
1 0 0 0 0 0
1 5 0 0 0 0
2 0 0 0 0 0
2 5 0 0 0 0
3 0 0 0 0 0
3 5 0 0 0 0
4 0 0 0 0 0
4 5 0 0 0 0
5 0 0 0 0 0
5 5 0 0 0 0
6 0 0 0 0 0
6 5 0 0 0 0
7 0 0 0 0 0
7 5 0 0 0 0
8 0 0 0 0 0
8 5 0 0 0 0
9 0 0 0 0 0
9 5 0 0 0 0
T i m e - - gt
A b u n d a n c e
1 0 0 0 1 5 0 0 2 0 0 0 2 5 0 0 3 0 0 0 3 5 0 0 4 0 0 0 4 5 0 0 5 0 0 0 5 5 0 0 6 0 0 0
0
2 0 0 0 0 0
4 0 0 0 0 0
6 0 0 0 0 0
8 0 0 0 0 0
1 0 0 0 0 0 0
1 2 0 0 0 0 0
1 4 0 0 0 0 0
1 6 0 0 0 0 0
1 8 0 0 0 0 0
2 0 0 0 0 0 0
2 2 0 0 0 0 0
2 4 0 0 0 0 0
2 6 0 0 0 0 0
2 8 0 0 0 0 0
3 0 0 0 0 0 0
3 2 0 0 0 0 0
3 4 0 0 0 0 0
3 6 0 0 0 0 0
3 8 0 0 0 0 0
4 0 0 0 0 0 0
4 2 0 0 0 0 0
4 4 0 0 0 0 0
4 6 0 0 0 0 0
4 8 0 0 0 0 0
T i m e - - gt
A b u n d a n c e
I o n 5 7 0 0 ( 5 6 7 0 t o 5 7 7 0 ) M U 1 0 1 4 1 K D d a t a m s
nC17
nC18
(a)
Figures 13a-c Alkane profiles of fresh MC252 riser oil (top a) weathered MC252 oil before in-situ burning (middle b) and MC252 oil after in-situ burning (bottom c) Note progressively larger prominence of alkanes in the boiling point range of 204degC to 538degC (nC12 to nC35) in (b) from weathering and (c) from in situ burning
24
The average FFPI of the before in-situ burning samples was 077plusmn003 and the average FFPI of the after in-situ burning samples was 065plusmn010 indicating a shift from petrogenic to pyrogenic composition This difference was significant (p=0001 Student two-tailed t-test with the assumption of equal variance) The average Wang Pyrogenic Index of the before in situ burning samples was 001plusmn0002 and after in situ burning was 007plusmn006 also indicating a shift from petrogenic to pyrogenic composition This difference is also significant (p=001 Student two-tailed t-test with the assumption of equal variance) Figure 14 is a graphical depiction of the Wang Pyrogenic Index ldquoBeforerdquo samples are clearly separated from most of the ldquoafterrdquo samples in the figure According to Wang et al (1999) lighter petroleum products and most crude oils fall into the range of 000-001 which is supported in this instance The ldquoafterrdquo samples are characterized by an increase in the pyrogenic index along with a decrease in the phenanthreneanthracene ratio however the majority fall in the range of what Wang et al would consider to be heavy oilsfuels and tarballs There are two ldquoafterrdquo samples that align more towards ldquobeforerdquo samples perhaps indicating an inefficient burn
0
20
40
60
80
100
120
140
160
000 002 004 006 008 010 012 014 016 018 020
Ph
en
A
nth
Wang Pyrogenic Index
2010 ISB Samples
Before Burning After Burning
Figure 14 Plot of the Wang pyrogenic index over the ratio of phenanthreneanthracene for before and after in situ burning samples collected in May and July 2010
Task 3 Physical and chemical characterization of deep water (~200 m) tarballs collected by royal red shrimp trawlers
Royal red shrimp background The royal red shrimp (Hymenopeneaus robustus or Pleoticus robustus) shown in Figure 15 is a large deep-water penaeid shrimp that has a wide distribution from the northern US coast to the east coast of South America (Anderson and Lindner 1971) More specifically the known range for royal red shrimp in US waters extends from the Atlantic coast of New England south of Marthas Vineyard through the Gulf of Mexico and the Caribbean Sea to French Guiana They inhabit the upper continental slope region at depths from 180 to 730 m (Farfante 1988)
Unlike other penaeid shrimp species that complete their life cycle within a year royal red shrimp live for several years (Cascorbi 2007) Males reach a maximum total length of 180 mm females 225 mm (Farfante 1988)
Few details are known about the life history of the royal red shrimp Spawning is believed to occur
25
year-round but predominantly between January and May and on the upper regions of the continental slope Larval forms of the shrimp are unknown (Gulf of Mexico Fishery Management Council 2004)
The royal red has won favor as a commercial fisheries product for its sweet juicy flesh and striking red color The fishery for royal red shrimp serves a niche market representing a relatively small proportion of the overall shrimp industry in the Southeast US and Gulf of Mexico (Stiles et al 2007)
Figure 15 Royal red shrimp Pleoticus robustus Photo by Connecticut Sea Grant
Royal red shrimp were investigated as an experimental fishery beginning in 1950 in the southeastern US with support from the Bureau of Fisheries the predecessor federal agency to the NOAA National Marine Fisheries Service (Bullis 1956) The commercial fishery began officially in the Gulf of Mexico and off Floridarsquos east coast in 1962 According to catch statistics for the Gulf of Mexico cited by Cascorbi (2007) landings of royal red shrimp averaged about 123 MT per year since 1998 or about 018 of total Gulf shrimp landings Of nearly 3000 vessels permitted for shrimp fishing in the Gulf of Mexico in 2005 only 15 specifically targeted royal red shrimp (Gulf of Mexico Fishery Management Council 2005) At the time of the Deepwater Horizon spill in 2010 NOAA indicated that there were 250 active royal red permits but that only a few were active
On November 20 2010 NOAA received a report from a fisherman who caught tarballs while trawling for royal red shrimp in federal waters off the coast of Alabama The area had just been reshyopened by NOAA to commercial fishing on November 15 after the established sensory testing of 286 finfish and 55 shrimp samples and chemical analysis of 33 composite samples of 207 finfish and 9 composites of 50 shrimp showed no apparent oil contamination However as a result of the
26
tarballs encountered in the deep water trawl fishery on November 24 2010 NOAA closed 4213 square miles (10911 sq km) to royal red shrimp fishing only (Figure 16) Fishing for finfish or other penaeid shrimp species was still permitted
Figure 16 Fishery closure map 24 November 2010 showing the royal red shrimp closure area due to tarballs Source NOAA
In December 2010 and January 2011 NOAA chartered two fishing vessels to sample royal red shrimp in the closed area over three cruises The samples were assessed via the sensory and chemical protocols jointly established by the US Food and Drug Administration and NOAA for determining the safety of seafood during the Deepwater Horizon response In addition to targeting PAHs by both gas chromatography and mass spectrometry (GCMS) and high performance liquid chromatographyfluorescence (HPLC-UVF) samples were also analyzed for dioctyl sodium sulfosuccinate (DOSS) a component of the Corexit dispersants used during the response Video surveys were also conducted in the closed area to determine the extent of tarball occurrence
Three of the royal red shrimp samples collected in December failed sensory evaluation by a three-person panel ie they were judged to be tainted However chemical analysis failed to show any sign of PAH contamination The areas where the failed sensory samples originated were resampled in January and the shrimp were evaluated by a larger (seven-person) sensory panel All samples passed this round of sensory evaluation
27
Chemistry results summarized in Table 7 from both GCMS and HPLC-UVF for the edible tissues of the royal red shrimp were below the established levels of concern for all samples collected after the November closure Based on the sensory and chemistry results the area was re-opened to all fishing on 3 February 2011
Table 7 Results for Chemical Analysis of Royal Red Shrimp Sampled in December 2010 and January 2011 (Source NOAA)
PAHs Level of Concern Range of values (ppb) Range of values (ppb) (ppb) GCMS HPLCfluorescence^
Naphthalene 123000 063 - 20 lt24
Fluorene 246000 013 - 053 lt041
Anthracene Phenanthrene 1846000 023 - 16 lt124 - 33
Pyrene 185000 lt0070 - 041 lt57
Fluoranthene 246000 lt0071 - 033 lt65
Chrysene 132000 lt014 - 11 lt37
Benzo(k)fluoranthene 13200 lt012 - lt031 lt026 - 27
Benzo(b)fluoranthene 1320 lt012 - lt031 lt066
Benz(a)anthracene 1320 lt011 - lt022 lt11
Indeno(123-cd)pyrene 1320 lt011 - lt022 lt77
Dibenz(ah)anthracene 132 lt0094 - lt023 lt18
Benzo(a)pyrene 132 lt011 - lt028 lt096
DOSS Level of Concern Range of values (ppm) Range of values (ppm) (ppm)
Dioctylsulfosuccinate 500 lt0043 - lt0045 --shy
Level of Concern for Anthracene and Phenanthrene combined ^ HPLCfluorescence (screening) analyses have higher limits of quantitation than the more sensitive and laborious GCMS analyses
Preliminary chemical analysis of some of the tarballs recovered from the trawl catches indicated a possible sourcing to burned Macondo Well oil Many of the trawl locations where tarballs were encountered were 10 km or less from the primary in-situ burn locations
Three sets of tarballs collected from royal red shrimp trawls were analyzed by LSU One set was from the vessel Our Mother and contained 8 tarballs collected in January 2011 The second set was from the vessel Aubreigh Marie and contained 13 tarballs collected in March 2011 The third shrimp trawl set contained five tarballs collected in June 2011 These tarballs were collected ~200 m below the ocean surface and were large viscous and dense globs of oily residue encapsulated within a hardened exterior and the tumbling of these tarballs in the trawl nets incorporated shrimp and other trawl debris into the residue (see Figure 17)
28
Figure 17 Two views of tarball amp shrimp sample recovered in June 2010 LSU photos
The average density and percent asphaltenes of the shrimp trawl tarballs were significantly different from other MC252 tarballs (p=002 and lt0001 respectively Student two-tailed t-test with assumption of homogenous variance) The average density of the shrimp trawl tarballs was 104plusmn022 gmL and the average percent asphaltenes was 22plusmn16mdashcompared to the density of 086plusmn033 gmL and percent asphaltenes of 15plusmn17 for other MC252 tarballs Even though there was a significant difference the variability within each of the tarball groups was high Regardless of the variability the trawl tarballs have an average density that is heavier than sea water with a typical density of 102 gmL Density measurements could be easily affected by any amount of extraneous material incorporated in the tarball and also by the effect of evaporation of the initial oil Percent asphaltenes could be affected by compositional differences caused by the efficiency or extent of the burn since in-situ burning is not a controlled process which greatly affects the consistency of ISB residues
29
The average density of the shrimp trawl tarballs was not significantly higher than the average density of in-situ burn samples collected after burning (p=027) however the asphaltenes content was significantly higher (p=002) than the percent asphaltenes of the in-situ burn samples collected during burn operations This suggests some other factor influencing these ldquosinking tarballsrdquo that was not present or determined for samples taken immediately after in-situ burning at sea and a factor that did not influence other tarballs formed after the Deepwater Horizon incident It is possible that an aspect of the prolonged periods of combustion that caused the increase in density and the eventual tendency of the burn residue to sink and weather at depth enhanced the relative content of asphaltenes in the tarballs that were eventually recovered by shrimp trawls As mentioned earlier Buist et al (1997) suggest that in situ burning results in imperfect equilibrium flash vaporization that selectively concentrates and preserves asphaltene fractions of burn residues regardless of whether the oil was fresh or weathered prior to burning which results in a progressive increase in the density of the residue Density and asphaltenes data are presented in Tables 8 and 9 respectively
Table 8 Shrimp Trawl Tarball Density Comparisons
Shrimp Trawl Density ISB After Density Other MC252 Density Tarballs (gmL) Residue (gmL) Tarballs (gmL)
2011019-01 086 2010147-123 095 2010134-01 185 2011019-02 094 2010147-125 093 2010134-02 104 2011019-03 077 2010147-127 091 2010134-04 112 2011019-04 097 2010147-129 098 2010201-51 095 2011019-05 110 2010147-133 093 2010228-01 117 2011019-06 093 2010147-135 099 2010228-02 069 2011019-07 087 2010147-137 098 2012249-01 057 2011019-08 098 2010147-138 098 2012250-05 056 2011116-01 120 AVERAGE 095 2012250-10 060 2011116-02 087 STDEV 003 2012258-11 056 2011116-03 096 n= 8 2012263-01 112 2011116-04 113 2012265-67 128 2011116-05 147 2012265-68 079 2011116-06 133 2012272-02 086 2011116-07 111 2012278-01 067 2011116-08 157 2012278-02 075 2011116-28 125 2012278-03 058 2011116-29 148 2012289-01 058 2011116-30 078 2012289-02 059 2011116-31 095 2012289-03 078 2011116-32 090 AVERAGE 086 2011187-01 093 STDEV 033 2011187-02 093 n= 20 2011187-03 092 2011187-04 097 2011187-05 094
AVERAGE 104 STDEV 022
n= 26
30
Table 9 Shrimp Trawl Tarball Asphaltenes Comparisons
Shrimp Trawl Asph (wt ) ISB After Residues
Asph (wt ) Other MC252
Tarballs Asph (wt )
2011019-01 26 2010147-125 31 2010131-02 081 2011019-02 39 2010147-133 12 2010134-01 17 2011019-03 35 2010147-135 83 2010146-02 231 2011019-04 52 2010147-137 62 2010228-02 059 2011019-05 39 2010147-138 22 2011059-01 116 2011019-06 36 AVG ISB After 42 2012249-01 080 2011019-07 30 STDEV 30 2012250-09 038 2011019-08 41 n= 5 2012250-10 042 2011019-28 41 2012265-68 66 2011116-02 41 2012278-01 074 2011116-03 43 2012278-02 046 2011116-30 45 2012278-03 062 2011116-31 60 2012289-01 070 2011116-32 58 2012289-02 11 2011187-01 13 2012289-03 43 2011187-02 43 AVG Other 152 2011187-03 88 STDEV 173 2011187-04 18 n= 15 2011187-05 13
AVG Trawl 22 STDEV 162
n= 19
The normal alkane profile of these ldquosinkingrdquo tarballs was significantly different from other MC252 oil tarballs This profile (Figure 18a) appeared to be unique to tarballs collected at ocean depth and was similar to the normal alkane profile of the simulated distillation (SIMDIS) of MC252 oil at 205degC (Figure 18b) The SIMDIS and shrimp trawl tarballs exhibited evidence of thermal combustion that was absent in the normal alkane profiles of the in-situ burn oil residues collected after burning (refer back to Figure 13) The SIMDIS procedure separates oil into various fractions depending on molecular weight and associated boiling points The shrimp trawl sample appears to have undergone a similar process thus resulting in an alkane profile similar to the SIMDIS of MC252 oil Therefore it is believed that the shrimp trawl tarballs are the result of more efficient in-situ burns relative to other field burn residues The shape of the in situ burn tarball profile was very different from tarballs not associated with burning (ie weathered residues Figure 18c) but still considered to be a match to MC252 oil Figure 18d is the normal alkane profile of microbially-weathered MC252 oil This profile demonstrates that residues from in situ burning were not subjected to the typical weathering processes other oil residues reflect
31
(a)
(d)
(b)
(c)
Figures 18 a-d Normal alkane distribution depicting the similarity of a suspected ISB tarball (a) collected in a royal red shrimp trawl and the simulated distillation of MC252 oil at 205degC (b) The alkane distributions in (c) MC252 tarball not associated with in-situ burning and (d) microbially-weathered MC252 oil are dissimilar to (a) and (b) even though all four profiles are MC252 oil
32
The average FFPI of the shrimp trawl samples was 062plusmn006 indicating a pyrogenic composition The average FFPI of the shrimp trawl samples is significantly different from other MC252 tarballs (p=0001 Student two-tailed t-test with the assumption of equal variance) The average Wang Pyrogenic Index of the shrimp trawl samples was 006plusmn002 also indicating a more pyrogenic composition The average Wang Pyrogenic Index is also significantly different from other MC252 tarballs (p=001 Student two-tailed t-test with the assumption of equal variance) Figure 19 is a graphical depiction of the Wang Pyrogenic Index According to Wang et al (1999) lighter petroleum products and most crude oils fall into the range of 000-001 The majority of the samples plotted in the figure have an index greater than 001 and are in the range of what Wang et al would consider to be heavy oilsfuels and tarballs
0
50
100
150
200
250
300
350
000 002 004 006 008 010 012 014
Ph
en
A
nth
Wang Pyrogenic Index
Shrimp Trawl Tarballs
Other Tarballs Suspected ISB Tarballs
Figure 19 Plot of the Wang pyrogenic index over the ratio of phenanthreneanthracene for shrimp trawl tarballs suspected to be sinking MC252 residues from in situ burning
All 26 shrimp trawl tarballs were a match (scored 15 out of 15 or 100) to MC252 oil based on the diagnostic biomarker ratio analyses Figure 20 displays a comparison of the diagnostic ratio results of the shrimp trawl samples MC252 source oil and EPA South Louisiana Crude (SLC) oil standard The EPA-SLC standard scored 8 out of 15 or 53 and would be considered a non-match Table 10 provides the values that are plotted in Figure 20 The ability to discriminate between two SLC oils is a demonstration to the utility of the diagnostic ratio analyses employed for this study Detailed descriptions of the biomarker abbreviations are given in Appendix 1
33
000
050
100
150
200
250
300
350
400R
atio
Val
ueHopane Diagnostic Ratios (mz 191)
000
020
040
060
080
100
120
140
160
180
200
C27D-SC27D-R C29D-SC29D-R C28 aaa-RC29 aaa-R
Ratio
Val
ue
Diasteranes and Regular Steranes (mz 217)
000
010
020
030
040
050
060
070
080
C27 BBC28 BB+C29 BB C28 BBC27 BB+C29 BB C29 BBC27 BB+C28 BB
Ratio
Val
ue
14β(H) Steranes (mz 218)
000
020
040
060
080
100
120
140
160
C20 TAC21 TA C26 TA-SC28 TA-S C27 TA-RC28 TA-R
Ratio
Val
ue
Triaromatic Steriods (mz 231)
MC 252 Avg Ratio Shrimp Trawl Avg Ratio EPA SLC Avg Ratio
Figure 20 Graphical depiction of diagnostic ratio testing of shrimp trawl samples compared to MC252 source oil and EPA South Louisiana Crude Oil standard Error bars represent 5 error margin
34
Table 10 Diagnostic Biomarker Ratio Analysis Results for Shrimp Trawl Samples
Shrimp EPA SLC MC252 Ratio
Trawl Ratios Ratio (n=32)
(n=5) (n=4)
Hopanes (mz 191) AVG AVG AVG
C27-TsC27-Tm 127 126 077
C29-aBC29-Ts 217 217 362
C29-aBC30-aB 048 048 071
C31-aBC32-aB+C33-aB 093 093 134
C32-aBC31-aB+C33-aB 043 043 038
C33-aBC31-aB+C32-aB 028 028 018
Diasteranes and Regular 14a(H)-Steranes (mz 217) AVG AVG AVG
C27D-SC27D-R 161 161 175
C29D-SC29D-R 163 163 167
C28 aaa-RC29 aaa-R 074 074 080
14B(H)-Steranes (mz 218) AVG AVG AVG
C27 BBC28 BB+C29 BB 069 069 062
C28 BBC27 BB+C29 BB 038 038 040
C29 BBC27 BB+C28 BB 046 046 050
Triaromatic Steriods (mz 231) AVG AVG AVG
C20 TAC21 TA 107 107 140
C26 TA-SC28 TA-S 062 063 073
C27 TA-RC28 TA-R 092 092 099
Indicates EPA SLC ratios that are statistically different according to Hansen et al (2007) and Meyer et al (2014)
Task 4 Burning of surface collected Macondo Well source oil and emulsified source oil under controlled laboratory conditions
An initial controlled burn of MC252 oil was performed at LSU on 6 March 2012 Around 5g of MC252 oil was placed in a crucible and burned with a propane torch for ~4-5 minutes The experiment was conducted in triplicate under a laboratory ventilation hood There was not sufficient residue generated by this method to perform both physical and chemical characterization so only chemical characterization was completed Since this burn was performed on a reduced scale plans were made to conduct a second larger-scale burn using an increased volume of oil floated on artificial seawater
The second larger scale burn was conducted on 20 February 2014 at the LSU Environmental Health and Safety facility on the Baton Rouge campus This burn used 500mL of fresh and 15 weathered surrogate south Louisiana crude oil obtained from BP floated on artificial seawater (avg salinity of 34amp) in stainless steel containers Emulsified MC252 oil was also burned in the same manner in this experiment Each set of burns was performed in triplicate and burn durations were ~5-10 minutes Figure 21a-f shows the sequence of the burning process After the burns were completed the stainless steel containers were allowed to cool and were then transported back to the lab where the residues were sampled for both physical and chemical analyses
35
(a) (b)
(c)
(e)
(d)
(f)
Figures 21a-f Images from the larger-scale burn at LSU in 2014 (a) pans with South Louisiana crude floated on seawater (b) ignition procedure (c-e) sequence of mid-burn photos (f) extinguishment
Task 5 Physical and chemical characterization of burn residue resulting from Task 4
There was not enough material to complete both the physical and chemical characterization of the initial smaller-scale burn of MC252 oil in 2012 therefore only chemical characterization was completed for the triplicate burn samples Normal alkane chromatographic profiles (Figure 22) of the replicates from the smaller-scale controlled burn of MC252 oil exhibited similar chemical characteristics as the in-situ burn samples collected during the response to the Deepwater Horizon
36
oil spill and also resemble the normal alkane chromatographic profile of the shrimp trawl tarball in Figure 18a For the ldquoafterrdquo samples the modified FFPI was 054plusmn002 and the modified Wang Pyrogenic Index was 013plusmn002 Significant enhancement in the same pyrogenic PAHs as described earlier for Task 2 was also observed and the total target PAHs were reduced from 12000 mgkg in fresh MC252 oil to an average of 1200 mgkg in the burn residues (a 90 reduction) The PAH profiles for the before and after MC252 from this small-scale burn are shown in Figure 22 along with the PAH profiles from the larger-scale burns
1 0 0 0 1 5 0 0 2 0 0 0 2 5 0 0 3 0 0 0 3 5 0 0 4 0 0 0 4 5 0 0 5 0 0 0 5 5 0 0 6 0 0 0
0
2 0 0 0
4 0 0 0
6 0 0 0
8 0 0 0
1 0 0 0 0
1 2 0 0 0
1 4 0 0 0
1 6 0 0 0
1 8 0 0 0
2 0 0 0 0
2 2 0 0 0
2 4 0 0 0
2 6 0 0 0
2 8 0 0 0
T i m e - - gt
A b u n d a n c e
I o n 5 7 0 0 ( 5 6 7 0 t o 5 7 7 0 ) G T 1 2 0 6 4 I D d a t a m s
1 0 0 0 1 5 0 0 2 0 0 0 2 5 0 0 3 0 0 0 3 5 0 0 4 0 0 0 4 5 0 0 5 0 0 0 5 5 0 0 6 0 0 0
0
2 0 0 0
4 0 0 0
6 0 0 0
8 0 0 0
1 0 0 0 0
1 2 0 0 0
1 4 0 0 0
1 6 0 0 0
1 8 0 0 0
2 0 0 0 0
2 2 0 0 0
2 4 0 0 0
2 6 0 0 0
T i m e - - gt
A b u n d a n c e
I o n 5 7 0 0 ( 5 6 7 0 t o 5 7 7 0 ) G T 1 2 0 6 4 J D d a t a m s
1 0 0 0 1 5 0 0 2 0 0 0 2 5 0 0 3 0 0 0 3 5 0 0 4 0 0 0 4 5 0 0 5 0 0 0 5 5 0 0 6 0 0 0
0
5 0 0 0
1 0 0 0 0
1 5 0 0 0
2 0 0 0 0
2 5 0 0 0
3 0 0 0 0
3 5 0 0 0
4 0 0 0 0
4 5 0 0 0
5 0 0 0 0
5 5 0 0 0
6 0 0 0 0
T i m e - - gt
A b u n d a n c e
I o n 5 7 0 0 ( 5 6 7 0 t o 5 7 7 0 ) G T 1 2 0 6 4 K D d a t a m s
Figure 22 Normal alkane profiles (mz 57) for three replicate samples from a small-scale lab burn of MC252 oil
Results of the second larger-scale burn of surrogate south Louisiana crude oil were quite different from the actual in-situ burn samples previously characterized in Task 2 and from the small-scale burn of MC252 There were no significant changes in density or percent asphaltenes There was no enhancement of the pyrogenic PAHs observed in the actual ISB samples and the smaller scale controlled burn Only the modified FFPI showed a significant (p=lt0001) change The average FFPI
37
before burning was 079plusmn006 and the average FFPI after burning was 070plusmn002 Table 11 summarizes the results of the larger-scale controlled burn described above
Table 11 Summary of Chemical Characteristics from Larger-Scale Controlled Burn
15 Weathered Fresh Surrogate Oil Surrogate Oil Emulsified MC252 Oil
(by weight)
Before After Before After Before After
Avg Total Aromatics 8100 3600plusmn310 9400 3400plusmn310 2700 2600plusmn270
(mgkg)
Avg Modified FFPI 083 069plusmn002 083 071plusmn001 073 071plusmn001
Avg Wang Pyrogenic Index 001 004plusmn001 001 004plusmn0004 001 001plusmn00003
Avg PhenAnth 453 133plusmn20 457 117plusmn12 123 674plusmn88
Avg FluorAntPyr 038 060plusmn006 035 080plusmn001 040 032plusmn002
n= 1 3 1 3 1
15 Weathered Surrogate Oil
Fresh Surrogate Oil (by weight) Emulsified MC252 Oil
Before After Before After Before After
Avg Density (n=3) 086plusmn0001 084plusmn005 090plusmn0002 094plusmn002 098plusmn0003 099plusmn001
Avg Asphaltenes (n) 10(1) 198plusmn067(3) 090(1) 198plusmn068(3) 171(1) 220plusmn034
Figure 23 is a graphical depiction of the Wang Pyrogenic Index ldquoBeforerdquo samples are clearly separated from most of the ldquoafterrdquo samples in the figure Fresh oil before and 15 weathered oil before are on top of each other in the plot (0006 45) According to Wang et al (1999) lighter petroleum products and most crude oils fall into the range of 000-001 which is supported in this instance The ldquoafterrdquo samples are characterized by an increase in the pyrogenic index along with a decrease in the phenanthreneanthracene ratio however the majority fall in the range of what Wang et al would consider to be heavy oilsfuels and tarballs There was very little change in the Wang Pyrogenic Index for the emulsified MC252 oil
0
20
40
60
80
100
120
140
0000 0005 0010 0015 0020 0025 0030 0035 0040 0045 0050
Ph
en
An
th
Wang Pyrogenic Index
Laboratory Controlled Burn
Before Burning After Burning Fresh After Burning 15 Weathered After Burning Emulsified
Figure 23 Plot of the Wang pyrogenic index over the ratio of phenanthreneanthracene for laboratory controlled burning of surrogate crude oil and emulsified MC252 oil
38
3
The difference in results may be due to the use of the surrogate south Louisiana crude oil instead of MC252 oil unfortunately this was the only option for burning a larger volume of oil under controlled conditions as availability of original MC252 riser oil is extremely limited Controlled in-situ burning decreased the average total target aromatics of the fresh surrogate oil by approximately 45 and the average total target aromatics of the 15 weathered surrogate oil by approximately 36 both of which are similar for the field in-situ burn samples
Emulsified MC252 oil collected during the Deepwater Horizon clean-up operations was also burned during this portion of the laboratory work The emulsified MC252 oil did not burn well and as a result reflected the least amount of change from before to after There were no significant changes in the emulsified MC252 oilrsquos total aromatics modified FFPI and there was no enhancement of the pyrogenic PAHs Figure 24 shows the PAH profiles for each oil type and post-burn residues tested in the larger-scale controlled burn
Hopane normalization (Aeppli et al 2014 Douglas et al 1996 Garrett et al 2000 Prince et al 1994) was applied to the Fresh and 15 Weathered surrogate South Louisiana Crude oil Using the hopane normalized concentrations the percent increase or decrease of each target analyte was calculated and are presented in Figure 25 An average 5-point response factor of 091 (R2=09912) was determined for 17β(H)21β(H)-30-hopane This response factor was then used to calculate the concentration of 17α(H)21β(H)-hopane The hopane normalization factor (HopaneOilHopaneWeathered) for the Fresh surrogate oil was 076 and 088 for the 15 Weathered surrogate oil The results of the hopane normalization of controlled laboratory burns confirms the enrichment of higher molecular weight analytes previously documented in Tasks 2 and 5 (small-scale burn of MC252 oil)
39
2000
Co
nc
(mg
k
g)
Co
nc
(mg
k
g)
1500
Before 1000
After
500
0
(d) Emulsified MC252 Oil 2014
350 300 250 200 150
Before 100 50 After
Co
nc
(mg
k
g)
Co
nc
(mg
k
g)
2000
1500
Before 1000
After
500
0
(b) Fresh Surrogate Oil 2014
1600
1400
1200
1000 Before
800 After
600
400
200
0
(c) 15 Weathered Surrogate Oil 2014
(a) MC252 Oil 2012
0
NA
PH
C1
-Nap
hs
C2
-Nap
hs
C3
-Nap
hs
C4
-Nap
hs
FL
UO
RC
1-F
luo
rsC
2-F
luo
rsC
3-
Flu
ors
DB
TC
1-D
BT
sC
2-D
BT
sC
3-
DB
Ts
PH
EN
C1
-Ph
ens
C2
-Ph
ens
C3
-Ph
ens
C4
-Ph
ens
AN
TH
FL
UO
RA
NT
PY
RC
1-
Py
rsC
2-
Py
rsC
3-
Py
rsC
4-
Py
rsN
BT
C-1
NB
Ts
C-2
NB
Ts
C-3
NB
Ts
B(a
)AN
TH
CH
RY
C1
-C
hry
sC
2-
Ch
rys
C3
-C
hry
sC
4-
Ch
rys
B(b
)FB
(k)F
B(e
)PB
(a)P
PE
RY
LIN
DP
YR
D(a
h)A
B(g
hi)
P
Figures 24a-d Before and after PAH profiles for controlled burns of four oil types in 2012 and 2014 (a) MC252 riser oil (b) fresh surrogate South Louisiana crude (c) weathered surrogate South Louisiana crude and (d) emulsified MC252
40
-150
-100
-50
0
50
100
150
200
250
300
350
NA
PH
C1-N
aphs
C2-N
aphs
C3-N
aphs
C4-N
aphs
FLU
OR
C1-F
luor
s
C2-F
luor
s
C3-F
luor
s
DB
T
C1-D
BTs
C2-D
BTs
C3-D
BTs
PHEN
C1-P
hens
C2-P
hens
C3-P
hens
C4-P
hens
AN
TH
FLU
OR
AN
T
PYR
C1-P
yrs
C2-P
yrs
C3-P
yrs
C4-P
yrs
NB
T
C-1
NB
Ts
C-2
NB
Ts
C-3
NB
Ts
B[a
]AN
TH
CHR
Y
C1-C
hrys
C2-C
hrys
C3-C
hrys
C4-C
hrys
B[b
]F
B[k
]F
B[e
]P
B[a
]P
PER
YL
D[a
h]A
B[g
hi]
P
IN
CREA
SE O
R D
ECR
EASE
(a) Fresh Surrogate Oil
-150
-50
50
150
250
350
450
NA
PH
C1-N
aphs
C2-N
aphs
C3-N
aphs
C4-N
aphs
FLU
OR
C1-F
luor
s
C2-F
luor
s
C3-F
luor
s
DB
T
C1-D
BTs
C2-D
BTs
C3-D
BTs
PHEN
C1-P
hens
C2-P
hens
C3-P
hens
C4-P
hens
AN
TH
FLU
OR
AN
T
PYR
C1-P
yrs
C2-P
yrs
C3-P
yrs
C4-P
yrs
NB
T
C-1
NB
Ts
C-2
NB
Ts
C-3
NB
Ts
B[a
]AN
TH
CHR
Y
C1-C
hrys
C2-C
hrys
C3-C
hrys
C4-C
hrys
B[b
]F
B[k
]F
B[e
]P
B[a
]P
PER
YL
D[a
h]A
B[g
hi]
P
IN
CREA
SE O
R D
ECR
EASE
(b) 15 Weathered Surrogate Oil
Figure 25 Determination of percent increase or decrease of target analytes based on hopane normalization for (a) Fresh surrogate oil and (b) 15 Weathered surrogate oil
41
Task 6 Forensic interpretation of analytical results to characterize physical and chemical changes occurring during the combustion of oil to include comparison of changes occurring in various weathered oil samples and identification of potential markers for in-situ burn residues
A primary objective of the forensic interpretation of analytical results was to determine if residues from in-situ burning during the Deepwater Horizon response had measurable characteristics that could distinguish them from other MC252 residues Results from the other tasks previously discussed indicated that these characteristics included bull Significant increase in density and percent asphaltenes bull Enhancement of pyrogenic PAHs bull Decrease in the FFPI Increase in the Wang Pyrogenic Index and bull Evidence of thermal combustion in the normal alkane profile
However it appears that all of these discriminating factors must be present to make the distinction between sources with any confidence Because of this limitation the forensic interpretation was expanded to include a statistical analysis of sample matrices and sampling locations based on the diagnostic biomarker ratio analyses
A total of 130 suspected MC252 residues was initially chosen All samples were grouped according to year sample matrix (eg ISB oil ISB tarball oil other sediment or tarball) and sampling location (eg marsh ocean depth shore or water surface) These samples were then narrowed to a total of 112 by the diagnostic ratio analyses Only samples determined to be a statistical match to MC252 oil were used in the matrix and sampling location comparisons A one-way ANOVA with a post-hoc Tukey-Kramer pairwise comparison Table 12 was applied to the sample matrix analysis for each of the 15 diagnostic ratios to determine if any of the ratios could distinguish between in-situ burn residues and other MC252 oil residues The Tukey-Kramer comparison separates samples into lettered groups based on the minimum significant difference between means (p=005) Groups with the same letter have means that are not significantly different from each other and groups with differing letters are significantly different from each other For the sample location effects a nested ANOVA with random effects and a variance components covariance structure was carried out for each diagnostic ratio to determine if there were any differences due to location of sample collection In both cases the sample number in each matrix or location was highly unbalanced
A total of 7 out of 15 diagnostic ratios had significant differences between sample matrices Of these 7 ratios 4 showed significant differences between in-situ burn residues and other MC252 oil residues
bull The hopane ratio C31 aB (S+R)C32 aB (S+R) + C33 aB (S+R) was significantly different for ISB oil and ISB tarball Both of the in-situ burn residues were significantly different from all other matrices except the tarball matrix
bull Another hopane ratio C33 aB (S+R)C31 aB (S+R) + C32 aB (S+R) for ISB tarball was significantly different from all other matrices and ISB oil was significantly different from all other matrices except tarball and oil
bull The diasterane and regular sterane ratio C28 aaa-RC29 aaa-R was significantly different when comparing ISB oil and oil residues
42
bull The last significant ratio was C27 BB (S+R)C28 BB (S+R) + C29 BB (S+R) (in the 14(β)H-steranes group) This ratio was significantly different when comparing ISB tarballs to other tarballs
Table 12 Tukey-Kramer Pairwise Comparisons of Diagnostic Ratios for Different Matrices
C31 aB (S+R)C32 aB (S+R) + C33 aB (S+R) C28 aaa-RC29 aaa-R
Matrix Mean SE Group Matrix Mean SE Group
Sediment 10533 183E-02 A Oil 07825 943E-03 A
Other 09933 183E-02 AB Other 07767 267E-02 AB
Oil 09575 648E-03 BC Tarball 07592 740E-03 AB
ISBTarball 09451 508E-03 BCD 07477 906E-03 AB
Tarball
ISB Oil 09309 662E-03 CD Sediment 07400 267E-02 AB
ISB 09300 622E-03 D ISB Oil 07361 963E-03 B
Tarball
C33 aB (S+R)C31 aB (S+R) + C32 aB (S+R) C27 BB (S+R)C28 BB (S+R) + C29 BB (S+R)
Matrix Mean SE Group Matrix Mean SE Group
ISB Tarball
02788 290E-03 A Other 07550 345E-02 AB
ISB Oil 02743 309E-03 AB Tarball 07500 824E-03 A
Tarball 02667 237E-03 BC Oil 07340 218E-01 AB
Oil 02646 302E-03 BCD ISB Tarball
07006 115E-01 B
Other 02467 855E-03 CD Sediment 07000 282E-01 AB
Sediment 02400 855E-03 D ISB Oil 06900 218E-02 AB
Therefore C28 aaa-RC29 aaa-R may be useful for distinguishing ISB oil from other oil residues and C27 BB (S+R)C28 BB (S+R) + C29 BB (S+R) may be useful distinguishing ISB tarballs from other tarballs
A total of 5 out of 15 diagnostic ratios showed significant differences between sample matrix and sampling location The statistical analysis did not determine which matrix by sampling location was significant it was performed to determine if sampling location was a factor in distinguishing some of these oil residues Sampling location can have an important role because this often governs how oil residues weather Therefore this analysis supported the notion that oil residues from the same type of oil may show different characteristics determined by differences in weathering in various sampling locations without compromising the ability to make statistical matchnon-match determinations with the same ratios
43
SUMMARY AND CONCLUSIONS
A primary objective of this study was to identify possible indicators that could distinguish in-situ burn residues from other oil residues based on physical and chemical analyses of actual Deepwater Horizon in-situ burn samples Unfortunately while there is no single reliable indicator of in-situ burning partial indicators (eg different normal alkane profile enhancement of pyrogenic PAHs and reduction in the modified Fossil Fuel Pollution Index) when considered as an integrated whole can point to in-situ burning as a significant driver of weathering and fate Table 3 shows some of the characteristics assessed in this study Notable in these results is the enhancement in asphaltenes content for known burn residues and the tarballs recovered from deep water shrimp trawls
Table 13 Comparison of Physical and Chemical Characteristics for Different Oil Matrices
MC252 SLC Pre- SLC Post- ISB Oil ISB Oil Shrimp Other MC252 Riser Burn Burn Pre-Burn Post-Burn Tarballs Tarballs
Density gmL 084 086 084 088 096 104 086
Asphaltene 09-10 10 198 15 42 22 15
FFPI 083 079 070 077 065 062 059 Wang Pyrogenic
0004 001 004 001 007 006 004 Index
Even the use of a series of partial indicators must be employed cautiously comparison of the normal alkane profile for example has the caveat that the same profile was not observed in oil residues collected immediately after in-situ burning The distinctive profile appeared only in tarballs that had been recovered from trawls two hundred meters below the ocean surface The asphaltenes content of the shrimp trawl tarballs was significantly higher than all the other samples which indicates that asphaltenes content positively correlated with the tendency of those oil residues to sink Density was a factor but does not appear to be as critical as the percent asphaltenes with respect to sinking tarballs
The majority of residues from the Deepwater Horizon oil spill retained their oil biomarker signatures making diagnostic ratio analyses possible The diagnostic ratios were used to
1) Determine if the oil residue was a match to MC252 oil and 2) Determine if there were any differences in the ratios in matching oil residues based on
sample matrix and sampling location
A total of 4 out of the 15 diagnostic biomarker ratios did distinguish in-situ burn residues from the majority of the other residues Two of these ratios C28 aaa-RC29 aaa-R and C27 BB (S+R)C28 BB (S+R) + C29 BB (S+R) may be useful for distinguishing ISB oil from other oil residues and ISB tarballs from other tarballs respectively Significant differences were also determined in the comparison of sampling locations These differences suggest that weathering of oil residues from the same initial source is highly dependent on the specific environmental compartment in which they reside without compromising the ability to make matchnon-match determinations with the same ratios
44
The in-situ burning research described in this report combined retrospective analysis of samples collected during the Deepwater Horizon response with new laboratory work and interpretation to increase the relevance and applicability of the physical and chemical results The methodological refinements improved our abilities to distinguish burn products from other weathered oil matrices and helped to confirm the generalized source attributions to burn operations that were made shortly after tarballs were encountered in the Gulf of Mexico royal red shrimp fishery It is important to note that the chemical characterization method (GC-MS) and target analyte list used for this report only examines about 5 of the oil mass Other analytical methods such as GCxGC-FID (Aeppli et al 2014) or APPI FT-ICR MS have become standard instrument systems for analyzing crude oil Both have advantages over GC-MS in that they can separate and identify a much larger percentage of oil compounds however it cannot be denied that GC-MS is still relevant and is one of the most recognized instrument systems for characterizing crude oil in the environment
The Deepwater Horizon spill experience validated the operational feasibility and practical application of in-situ burning as an open water response method Like nearly everything else about this incident the scale of in-situ burn operations was unprecedented between 28 April and 19 July 2010 over 400 individual burns took place consuming an estimated 220000-310000 bbl of oil This is roughly equivalent to the total volume for the Exxon Valdez oil spill in 1989
Implicit in these numbers is the large volume of in-situ burn residue that was generated during the Deepwater Horizon operations Using the standard in-situ burn efficiency estimates of 90-95 percent the amount of residue resulting from the operations potentially ranged from 11000shy33000 bbl This is a substantial amount of petroleum hydrocarbons introduced into a relatively small portion of the marine environmentmdashalthough it should be noted that natural seeps contribute an estimated 560000 to 14 million bbl of oil into the waters of the Gulf of Mexico (National Research Council 2003) each year (note seep locations in Figure 26)
The fate of the burn residue from the Deepwater Horizon in-situ burn operations might never have been known were it not for the chance encounters of the single deep water fishery operating in the same general area as most of the burn operations (Figure 26) Impacts to the fishery were minimal and it was quickly re-opened after testing and analysis by federal fisheries managers and seafood safety specialists However the residue and fishery interactions that occurred in 2010 and 2011 represent a cautionary footnote to large-scale in-situ burn operations that should be factored into tradeoff analysis for future spill responses Further the Deepwater Horizon experience suggests a need for additional research into burn residue containment or recovery methods that would reduce or eliminate potential fishery impacts associated with sinking residue
On a final note we recommend that the Environmental Unit for a spill response where burn operations are regularly taking place should collaborate with the Operations Section to collect analyze and archive paired samples of pre- and post-burn oil to facilitate the process of source identification of oil residues encountered during a response In doing so a solid empirical database of physical and chemical characteristics would be built over time to permit a better understanding of the changes occurring to oil during in-situ burning the circumstances in which residues will floatsink and the specific markers and physical features that might be used to uniquely identify burn residues
45
Figure 26 Composite map showing locations of the Macondo wellhead in-situ burn operations royal red shrimp trawls with preliminary source identifications and known hydrocarbon seeps Numbers in boxes denote approximate tarball counts in each quadrant Prepared by JB Huyett Genwest Systems
46
REFERENCES
Aeppli C RK Nelson JR Radović CA Carmichael DL Valentine and CM Reddy 2014 Recalcitrance and degradation of petroleum biomarkers upon abiotic and biotic natural weathering of Deepwater Horizon oil Environmental Science and Technology 486726-6734
Allen AA NJ Mabile D Jaeger and D Costanzo 2011 The use of controlled burning during the Gulf of Mexico Deepwater Horizon MC-252 oil spill response In Proceedings of the 2011 International Oil Spill Conference 23-26 May 2011 Portland OR 13 pp
httpdxdoiorg1079012169-3358-2011-1-194
American Society for Testing Materials D71-94(2009) Standard test method for relative density of solid pitch and asphalt (displacement method) ASTM International West Conshohocken PA 2012
American Society for Testing Materials D3279-12 Standard test method for n-heptane insoluble ASTM International West Conshohocken PA 2012
Anderson WW and MJ Lindner 1971 Contributions to the biology of the royal red shrimp Hymenopenaeus robustus Smith Fishery Bulletin 69(2)313-336
Boehm PD and JW Farrington 1984 Aspects of the polycyclic aromatic hydrocarbon geochemistry of recent sediments in the Georges Bank Region Environmental Science and Technology 18(11)840-845
Bullis HR Jr 1956 Preliminary results of deep-water exploration for shrimp in the Gulf of Mexico by the MV Oregon (1950-1956) Commer Fish Rev 18(12)1-12
Buist I 1998 Window of opportunity for in situ burning In Proceddings of the In Situ Burning of Oil Spills Workshop US Minerals Management Service Special Publication 935 21-30
Buist I and K Trudel 1995 Laboratory studies of the properties of in-situ burn residues Marine Spill Response Corporation Washington DC MSRC Technical Report Series 95-010 110 p
Buist I K Trudel J Morrison and D Aurand 1995 Laboratory studies of the physical properties of in-situ burn residues In Proceedings of the Eighteenth Arctic and Marine Oilspill Program (AMOP) June 14-16 1995 Edmonton Alberta 1027-1051
Buist I K Trudel J Morrison and D Aurand 1997 Laboratory studies of the properties of in-situ burn residues In Proceedings of the 1997 International Oil Spill Conference April 1997 1997(1)149-156
Cascorbi A 2007 Wild-caught warmwater shrimp (Infraorder Penaeus--the Penaeid shrimps) Gulf of Mexico and US South Atlantic Regions Seafood Watch Seafood Report Monterey Bay Aquarium 52 pp
Douglas GS AE Bence RC Prince SJ McMillen and EL Butler 1996 Environmental stability of selected petroleum hydrocarbon source and weathering ratios Environmental Science and Technology 30(7)2332-2339
47
Farfante IP 1988 Illustrated key to Penaeoid shrimps of commerce in the Americas NOAA Technical Report NMFS 64 April 1988 32 pp
Federal Interagency Solutions Group Oil Budget Calculator Science and Engineering Team 2010 Oil Budget Calculator Deepwater Horizon Technical Documentation A Report to the National Incident Command November 2010 49 pp + appendices
Fingas MF G Halley F Ackerman N Vanderkooy R Nelson MC Bissonnette N Laroche P Lambert P Jokuty K Li W Halley G Warbanski PR Campagna RD Turpin MJ Trespalacios D Dickins EJ Tennyson D Aurand and R Hiltabrand 1994a The Newfoundland Offshore Burn Experiment ndash NOBE experimental design and overview In Proceedings of the Seventeenth Arctic and Marine Oilspill Program (AMOP) June 8-10 1994 Vancouver British Columbia 1053-1063
Fingas MF F Ackerman K Li P Lambert Z Wang MC Bissonnette PR Campagna P Boileau N Laroche P Jokuty R Nelson RD Turpin MJ Trespalacios G Halley J Belanger J Pareacute N Vanderkooy EJ Tennyson D Aurand and R Hiltabrand 1994b The Newfoundland Offshore Burn Experiment ndash NOBE preliminary results of emissions measurement In Proceedings of the Seventeenth Arctic and Marine Oilspill Program (AMOP) June 8-10 1994 Vancouver British Columbia 1099-1164
Fingas M 2011 An overview of in-situ burning Chapter 23 in M Fingas (ed) Oil Spill Science and Technology New York Gulf Professional PublishingElsevier 737-903
Fingas M 2015 Introduction to Oil Chemistry and Properties In Handbook of Oil Spill Science and Technology M Fingas Ed Hoboken NJ John Wiley amp Sons Inc
Garrett RM CC Gueacutenette CE Haith and RC Prince 2000 Pyrogenic polycyclic aromatic hydrocarbons in oil burn residues Environmental Science and Technology 34(10)1934-1937
Gulf of Mexico Fishery Management Council 2004 Appendix C Information on Species Distributions and Habitat Associations Final Environmental Impact Statement for the Generic Essential Fish Habitat Amendment to the following fishery management plans of the Gulf of Mexico (GOM) shrimp fishery of the Gulf of Mexico red drum fishery of the Gulf of Mexico reef fish fishery of the Gulf of Mexico stone crab fishery of the Gulf of Mexico coral and coral reef fishery of the Gulf of Mexico spiny lobster fishery of the Gulf of Mexico and South Atlantic coastal migratory pelagic resources of the Gulf of Mexico and South Atlantic 262 pp
Gulf of Mexico Fishery Management Council 2005 Final Amendment Number 13 to the Fishery Management Plan for the Shrimp Fishery of the Gulf of Mexico US Waters with Environmental Assessment Regulatory Impact Review and Regulatory Flexibility Act analysis August 24 2005 272 pp
Hansen AB PS Daling LG Faksness KR Sorheim P Kienhuis and R Duus 2007 Emerging CEN Methodology for Oil Spill Identification In Oil Spill Environmental Forensics Z Wang and SA Stout Eds Boston MA Elsevier
Jaeger A 2011 Personal communication 27 September 2011
Kucklick JH and D Aurand 1997 Historical dispersant and in-situ burning opportunities in the
48
United States Proc 1997 International Oil Spill Conference 805 ndash 810
Leahy JG and RR Colwell 1990 Microbial degradation of hydrocarbons in the environment Microbiological Reviews 54305-315
Lewan MD A Warden RF Dias ZK Lowry TL Hannah PG Lillis RF Kokaly TM Hoefen GA Swayze CT Mills SH Harris GS Plumlee 2014 Organic Geochemistry 75(2014)54-60
Meyer BM EB Overton and RE Turner 2014 Oil source identification using diagnostic biomarker ratio analyses In 2014 International Oil Spill Conference Proceedings Savannah GA May 5-9 2014(1)2064-2073
Michel J D Scholz SR Warren Jr and AH Walker 2005 In-situ burning A decision-makerrsquos guide to in-situ burning API Publication Number 4740 Washington DC American Petroleum Institute 60 pp
Mills MA TJ McDonald JS Bonner MA Simon and RL Autenrieth 1999 Method for quantifying the fate of petroleum in the environment Chemosphere 39(14)2563-2582
Mullin JV and MA Champ 2003 Introductionoverview to in situ burning of oil spills Spill Science amp Technology 8(4)323-330
National Research Council Committee on Oil in the Sea 2003 Oil in the Sea III Inputs Fates and Effects National Research Council Ocean Studies Board and Marine Board Divisions of Earth and Life Studies and Transportation Research Board Washington DC National Academy Press 265 pp
Operational Science Advisory Team-2 2011 Net Environmental Benefits Analysis (NEBA) Annex M to Summary Report for Fate and Effects of Remnant Oil in the Beach Environment prepared for Lincoln D Stroh US Coast Guard Federal On-Scene Coordinator 48 pp
Overton EB WD Sharp and P Roberts 1994 Toxicity of Petroleum In Basic Environmental Toxicology LG Cockerham and BS Shane Eds Boca Raton FL CRC Press Inc
Prince RC DL Elmendorf JR Lute CS Hsu CE Haith JD Senius GJ Dechert GS Douglas and EL Butler 1994 17α(H)21β(H)-hopane as a conserved internal marker for estimating the biodegradation of crude oil Environmental Science and Technology 28(1)142-145
SL Ross Environmental Research Ltd 2010 Spill Related Properties of MC252 Crude Oil Sample ENT-052210-178 Appendix 8 to Oil Budget Calculator Deepwater Horizon Technical Documentation A Report to the National Incident Command November 2010 7 pp
Stiles ML E Harrould-Kolieb P Faure H Ylitalo-Ward and MF Hirshfield 2007 Deep sea trawl fisheries of the Southeast US and Gulf of Mexico rock shrimp royal red shrimp calico scallops Report for Oceana May 2007 18 pp
US Coast Guard 2011 BP Deepwater Horizon Oil Spill Incident Specific Preparedness Review (ISPR) Final Report Report prepared for ADM RJ Papp Commandant January 2011 158 pp
Wang Z M Fingas YY Shu L Sigouin M Landriault P Lambert R Turpin P Campagna and J
49
Mullin 1999 Quantitative characterization of PAHs in burn residue and soot samples and differentiation of pyrogenic PAHs from petrogenic PAHsmdashthe 1994 Mobile burn study Environ Sci Technol 33(18)3100-3109
Zack S 2007 Royal red shrimp Stoningtonrsquos succulent secret Connecticut Sea GrantWrack Lines 72 FallWinter 2007 6 pp
ACKNOWLEDGMENTS
Funding for this project was provided by the US Department of the Interior Bureau of Safety and Environmental Enforcement (BSEE) under Interagency Agreement E13PG00001 We thank the outside peer reviewers recruited by BSEE for their constructive comments and criticism and for improving the clarity of the project report The authors wish to acknowledge the assistance and support of Alan A Allen of Spiltec and Nere Mabile of BP during the Deepwater Horizon response in Houma LA CPO RJ Schrader of the US Coast Guard shared his expertise experiences and photographs from the field implementation of in-situ burn operations during the spill The data analysis for this report was generated using SAS software Version 93 of the SAS System for Windows Copyright copy 2002-2010 by SAS Institute Inc SAS and all other SAS Institute Inc product or service names are registered trademarks or trademarks of SAS Institute Inc Cary NC USA
DISCLAIMER
Reference to specific commercial products process or service by trade name trademark manufacturer or otherwise does not constitute or imply their endorsement recommendation or favoring by the United States Government The views and opinions of authors expressed do not necessarily state or reflect those of the United States Government and shall not be used for advertising or product endorsement purposes
50
APPENDIX 1
DIAGNOSTIC BIOMARKER RATIOS
Petroleum Biomarkers Used For Calculating MC252 Diagnostic Ratios
Abbreviation Compound Name mz Value
C27 18α(H)-222930-trisnorneohopane 191C27 Ts C27 Tm C27 17α(H)-222930-trisnorhopane 191 C29 aB C29 17α(H)21β(H)-30-norhopane 191 C29 Ts C29 18α(H)-30-norneohopane 191 C30 aB C30 17α(H)21β(H)-hopane 191 C31 aB (S+R) C31 17α(H)21β(H)-22(S+R)-homohopane 191 C32 aB (S+R) C32 17α(H)21β(H)-22(S+R)-bishomohopane 191 C33 aB (S+R) C32 17α(H)21β(H)-22(S+R)-trishomohopane 191 C27D Ba-S C27 13β(H)17α(H)20S-diasterane 217 C27D Ba-R C27 13β(H)17α(H)20R-diasterane 217 C29D Ba-S C29 24-ethyl-13β(H)17α(H)20S-diacholestane 217 C29D Ba-R C29 24-ethyl-13β(H)17α(H)20R-diacholestane 217 C28 aaa-R C28 24-methyl-5α(H)14α(H)17α(H) 20R-cholestane 217 C29 aaa-R C29 24-ethyl-5α(H)14α(H)17α(H) 20R-cholestane 217 C27 BB (R+S) C27 5α(H)14β(H)17β(H)-cholestane (20R+20S) 218 C28 BB (R+S) C28 24-methyl-5α(H)14β(H)17β(H)-cholestane (20R+20S) 218 C29 BB (R+S) C29 24-ethyl-5α(H)14β(H)17β(H)-cholestane (20R+20S) 218 C20 TA C20-triaromatic steroid (pregnane derivative) 231 C21 TA C21-triaromatic steroid (homopregnane derivative) 231 C26 TA-S C26-triaromatic steroid20S (cholestane derivative) 231 C28 TA-S C28-triaromatic steroid20S (ethylcholestane derivative) 231 C27 TA-R C27-triaromatic steroid20R (methylcholestane derivative) 231 C28 TA-R C28-triaromatic steroid20R (ethylcholestane derivative) 231
52
Diagnostic Ratios Chosen for MC252 Source Oil
Ratio mz
Value
C27 Ts C27 Tm 191
C29 aBC29 Ts 191
C29 aBC30 aB 191
C31 aB(S+R)C32 aB(S+R) + C33 aB(S+R) 191
C32 aB(S+R)C31 aB(S+R) + C33 aB(S+R) 191
C33 aB(S+R)C31 aB(S+R) + C32 aB(S+R) 191
C27D Ba-SC27D Ba-R 217
C29D Ba-SC29D Ba-R 217
C28 aaa-RC29 aaa-R 217
C27 BB(R+S)C28 BB(R+S) + C29 BB(R+S) 218
C28 BB(R+S)C27 BB(R+S) + C29 BB(R+S) 218
C29 BB(R+S)C27 BB(R+S) + C28 BB(R+S) 218
C20 TAC21 TA 231
C26 TA-SC28 TA-S 231
C27 TA-RC28 TA-R 231
53

Co
nc
(ng
m
g)
200
150
100
50
0
(b) At-Sea Burn Operations July 2010
Before After
500 Enhanced 5-6 Ring PAHs
450 100
400 80
350 60
40 300
20
250 00
B[b
]F
B[k
]F
B[e
]P
B[a
]P
PE
RY
L
I[1
23
-cd
]P
D[a
h]A
B[g
hi
]P
NA
PH
C1
-Nap
hs
C2
-Nap
hs
C3
-Nap
hs
C4
-Nap
hs
FL
UO
RC
1-F
luo
rsC
2-F
luo
rsC
3-
Flu
ors
DB
TC
1-D
BT
sC
2-D
BT
sC
3-
DB
Ts
PH
EN
C1
-Ph
ens
C2
-Ph
ens
C3
-Ph
ens
C4
-Ph
ens
AN
TH
FL
UO
RA
NT
PY
RC
1-
Py
rsC
2-
Py
rsC
3-
Py
rsC
4-
Py
rsN
BT
C-1
NB
Ts
C-2
NB
Ts
C-3
NB
Ts
B[a
]AN
TH
CH
RY
C1
-C
hry
sC
2-
Ch
rys
C3
-C
hry
sC
4-
Ch
rys
B[b
]FB
[k]F
B[e
]PB
[a]P
PE
RY
LI[
12
3-c
d]P
D[a
h]A
B[g
hi]
P
0
100
200
300
400
500
600
700
800
900
1000
NA
PH
C1
-Nap
hs
C2
-Nap
hs
C3
-Nap
hs
C4
-Nap
hs
FL
UO
RC
1-F
luo
rsC
2-F
luo
rsC
3-
Flu
ors
DB
TC
1-D
BT
sC
2-D
BT
sC
3-
DB
Ts
PH
EN
C1
-Ph
ens
C2
-Ph
ens
C3
-Ph
ens
C4
-Ph
ens
AN
TH
FL
UO
RA
NT
PY
RC
1-
Py
rsC
2-
Py
rsC
3-
Py
rsC
4-
Py
rsN
BT
C-1
NB
Ts
C-2
NB
Ts
C-3
NB
Ts
B[a
]AN
TH
CH
RY
C1
-C
hry
sC
2-
Ch
rys
C3
-C
hry
sC
4-
Ch
rys
B[b
]FB
[k]F
B[e
]PB
[a]P
PE
RY
LI[
12
3-c
d]P
D[a
h]A
B[g
hi]
P
Co
nc
(ng
m
g)
(a) At-Sea Burn Operations May 2010
Before After
00
50
100
150
B[b
]F
B[k
]F
B[e
]P
B[a
]P
PE
RY
L
I[1
23
-cd
]P
D[a
h]A
B[g
hi
]P
Enhanced 5-6 Ring PAHs
Figures 12 PAH profiles and enhancement of 5-6 ring pyrogenic compounds in MC252 oil as a result of in-situ burning May 2010 (a) and July 2010 (b)
Figure 13 shows the changes in the normal alkane profiles of fresh MC252 riser oil MC252 oil prior to in-situ burning and MC252 oil after in-situ burning In-situ burning decreased the average total target aromatics by approximately 49 for May 2010 samples and approximately 26 for the July 2010 sample set Once again the lower percentage for July is reflective of the weathering that had already altered this pre-burn sample
23
1 0 0 0 1 5 0 0 2 0 0 0 2 5 0 0 3 0 0 0 3 5 0 0 4 0 0 0 4 5 0 0 5 0 0 0 5 5 0 0 6 0 0 0
0
2 0 0 0 0 0
4 0 0 0 0 0
6 0 0 0 0 0
8 0 0 0 0 0
1 0 0 0 0 0 0
1 2 0 0 0 0 0
1 4 0 0 0 0 0
1 6 0 0 0 0 0
1 8 0 0 0 0 0
2 0 0 0 0 0 0
2 2 0 0 0 0 0
2 4 0 0 0 0 0
2 6 0 0 0 0 0
2 8 0 0 0 0 0
3 0 0 0 0 0 0
3 2 0 0 0 0 0
3 4 0 0 0 0 0
3 6 0 0 0 0 0
T i m e - - gt
A b u n d a n c e
I o n 5 7 0 0 ( 5 6 7 0 t o 5 7 7 0 ) M U 1 0 1 4 8 T D d a t a m sI o n 5 7 0 0 ( 5 6 7 0 t o 5 7 7 0 ) M U 1 0 1 4 8 U D d a t a m s
(c)
nC17
nC18
(b) nC17
nC18
1 0 0 0 1 5 0 0 2 0 0 0 2 5 0 0 3 0 0 0 3 5 0 0 4 0 0 0 4 5 0 0 5 0 0 0 5 5 0 0 6 0 0 0
0
5 0 0 0 0
1 0 0 0 0 0
1 5 0 0 0 0
2 0 0 0 0 0
2 5 0 0 0 0
3 0 0 0 0 0
3 5 0 0 0 0
4 0 0 0 0 0
4 5 0 0 0 0
5 0 0 0 0 0
5 5 0 0 0 0
6 0 0 0 0 0
6 5 0 0 0 0
7 0 0 0 0 0
7 5 0 0 0 0
8 0 0 0 0 0
8 5 0 0 0 0
9 0 0 0 0 0
9 5 0 0 0 0
T i m e - - gt
A b u n d a n c e
1 0 0 0 1 5 0 0 2 0 0 0 2 5 0 0 3 0 0 0 3 5 0 0 4 0 0 0 4 5 0 0 5 0 0 0 5 5 0 0 6 0 0 0
0
2 0 0 0 0 0
4 0 0 0 0 0
6 0 0 0 0 0
8 0 0 0 0 0
1 0 0 0 0 0 0
1 2 0 0 0 0 0
1 4 0 0 0 0 0
1 6 0 0 0 0 0
1 8 0 0 0 0 0
2 0 0 0 0 0 0
2 2 0 0 0 0 0
2 4 0 0 0 0 0
2 6 0 0 0 0 0
2 8 0 0 0 0 0
3 0 0 0 0 0 0
3 2 0 0 0 0 0
3 4 0 0 0 0 0
3 6 0 0 0 0 0
3 8 0 0 0 0 0
4 0 0 0 0 0 0
4 2 0 0 0 0 0
4 4 0 0 0 0 0
4 6 0 0 0 0 0
4 8 0 0 0 0 0
T i m e - - gt
A b u n d a n c e
I o n 5 7 0 0 ( 5 6 7 0 t o 5 7 7 0 ) M U 1 0 1 4 1 K D d a t a m s
nC17
nC18
(a)
Figures 13a-c Alkane profiles of fresh MC252 riser oil (top a) weathered MC252 oil before in-situ burning (middle b) and MC252 oil after in-situ burning (bottom c) Note progressively larger prominence of alkanes in the boiling point range of 204degC to 538degC (nC12 to nC35) in (b) from weathering and (c) from in situ burning
24
The average FFPI of the before in-situ burning samples was 077plusmn003 and the average FFPI of the after in-situ burning samples was 065plusmn010 indicating a shift from petrogenic to pyrogenic composition This difference was significant (p=0001 Student two-tailed t-test with the assumption of equal variance) The average Wang Pyrogenic Index of the before in situ burning samples was 001plusmn0002 and after in situ burning was 007plusmn006 also indicating a shift from petrogenic to pyrogenic composition This difference is also significant (p=001 Student two-tailed t-test with the assumption of equal variance) Figure 14 is a graphical depiction of the Wang Pyrogenic Index ldquoBeforerdquo samples are clearly separated from most of the ldquoafterrdquo samples in the figure According to Wang et al (1999) lighter petroleum products and most crude oils fall into the range of 000-001 which is supported in this instance The ldquoafterrdquo samples are characterized by an increase in the pyrogenic index along with a decrease in the phenanthreneanthracene ratio however the majority fall in the range of what Wang et al would consider to be heavy oilsfuels and tarballs There are two ldquoafterrdquo samples that align more towards ldquobeforerdquo samples perhaps indicating an inefficient burn
0
20
40
60
80
100
120
140
160
000 002 004 006 008 010 012 014 016 018 020
Ph
en
A
nth
Wang Pyrogenic Index
2010 ISB Samples
Before Burning After Burning
Figure 14 Plot of the Wang pyrogenic index over the ratio of phenanthreneanthracene for before and after in situ burning samples collected in May and July 2010
Task 3 Physical and chemical characterization of deep water (~200 m) tarballs collected by royal red shrimp trawlers
Royal red shrimp background The royal red shrimp (Hymenopeneaus robustus or Pleoticus robustus) shown in Figure 15 is a large deep-water penaeid shrimp that has a wide distribution from the northern US coast to the east coast of South America (Anderson and Lindner 1971) More specifically the known range for royal red shrimp in US waters extends from the Atlantic coast of New England south of Marthas Vineyard through the Gulf of Mexico and the Caribbean Sea to French Guiana They inhabit the upper continental slope region at depths from 180 to 730 m (Farfante 1988)
Unlike other penaeid shrimp species that complete their life cycle within a year royal red shrimp live for several years (Cascorbi 2007) Males reach a maximum total length of 180 mm females 225 mm (Farfante 1988)
Few details are known about the life history of the royal red shrimp Spawning is believed to occur
25
year-round but predominantly between January and May and on the upper regions of the continental slope Larval forms of the shrimp are unknown (Gulf of Mexico Fishery Management Council 2004)
The royal red has won favor as a commercial fisheries product for its sweet juicy flesh and striking red color The fishery for royal red shrimp serves a niche market representing a relatively small proportion of the overall shrimp industry in the Southeast US and Gulf of Mexico (Stiles et al 2007)
Figure 15 Royal red shrimp Pleoticus robustus Photo by Connecticut Sea Grant
Royal red shrimp were investigated as an experimental fishery beginning in 1950 in the southeastern US with support from the Bureau of Fisheries the predecessor federal agency to the NOAA National Marine Fisheries Service (Bullis 1956) The commercial fishery began officially in the Gulf of Mexico and off Floridarsquos east coast in 1962 According to catch statistics for the Gulf of Mexico cited by Cascorbi (2007) landings of royal red shrimp averaged about 123 MT per year since 1998 or about 018 of total Gulf shrimp landings Of nearly 3000 vessels permitted for shrimp fishing in the Gulf of Mexico in 2005 only 15 specifically targeted royal red shrimp (Gulf of Mexico Fishery Management Council 2005) At the time of the Deepwater Horizon spill in 2010 NOAA indicated that there were 250 active royal red permits but that only a few were active
On November 20 2010 NOAA received a report from a fisherman who caught tarballs while trawling for royal red shrimp in federal waters off the coast of Alabama The area had just been reshyopened by NOAA to commercial fishing on November 15 after the established sensory testing of 286 finfish and 55 shrimp samples and chemical analysis of 33 composite samples of 207 finfish and 9 composites of 50 shrimp showed no apparent oil contamination However as a result of the
26
tarballs encountered in the deep water trawl fishery on November 24 2010 NOAA closed 4213 square miles (10911 sq km) to royal red shrimp fishing only (Figure 16) Fishing for finfish or other penaeid shrimp species was still permitted
Figure 16 Fishery closure map 24 November 2010 showing the royal red shrimp closure area due to tarballs Source NOAA
In December 2010 and January 2011 NOAA chartered two fishing vessels to sample royal red shrimp in the closed area over three cruises The samples were assessed via the sensory and chemical protocols jointly established by the US Food and Drug Administration and NOAA for determining the safety of seafood during the Deepwater Horizon response In addition to targeting PAHs by both gas chromatography and mass spectrometry (GCMS) and high performance liquid chromatographyfluorescence (HPLC-UVF) samples were also analyzed for dioctyl sodium sulfosuccinate (DOSS) a component of the Corexit dispersants used during the response Video surveys were also conducted in the closed area to determine the extent of tarball occurrence
Three of the royal red shrimp samples collected in December failed sensory evaluation by a three-person panel ie they were judged to be tainted However chemical analysis failed to show any sign of PAH contamination The areas where the failed sensory samples originated were resampled in January and the shrimp were evaluated by a larger (seven-person) sensory panel All samples passed this round of sensory evaluation
27
Chemistry results summarized in Table 7 from both GCMS and HPLC-UVF for the edible tissues of the royal red shrimp were below the established levels of concern for all samples collected after the November closure Based on the sensory and chemistry results the area was re-opened to all fishing on 3 February 2011
Table 7 Results for Chemical Analysis of Royal Red Shrimp Sampled in December 2010 and January 2011 (Source NOAA)
PAHs Level of Concern Range of values (ppb) Range of values (ppb) (ppb) GCMS HPLCfluorescence^
Naphthalene 123000 063 - 20 lt24
Fluorene 246000 013 - 053 lt041
Anthracene Phenanthrene 1846000 023 - 16 lt124 - 33
Pyrene 185000 lt0070 - 041 lt57
Fluoranthene 246000 lt0071 - 033 lt65
Chrysene 132000 lt014 - 11 lt37
Benzo(k)fluoranthene 13200 lt012 - lt031 lt026 - 27
Benzo(b)fluoranthene 1320 lt012 - lt031 lt066
Benz(a)anthracene 1320 lt011 - lt022 lt11
Indeno(123-cd)pyrene 1320 lt011 - lt022 lt77
Dibenz(ah)anthracene 132 lt0094 - lt023 lt18
Benzo(a)pyrene 132 lt011 - lt028 lt096
DOSS Level of Concern Range of values (ppm) Range of values (ppm) (ppm)
Dioctylsulfosuccinate 500 lt0043 - lt0045 --shy
Level of Concern for Anthracene and Phenanthrene combined ^ HPLCfluorescence (screening) analyses have higher limits of quantitation than the more sensitive and laborious GCMS analyses
Preliminary chemical analysis of some of the tarballs recovered from the trawl catches indicated a possible sourcing to burned Macondo Well oil Many of the trawl locations where tarballs were encountered were 10 km or less from the primary in-situ burn locations
Three sets of tarballs collected from royal red shrimp trawls were analyzed by LSU One set was from the vessel Our Mother and contained 8 tarballs collected in January 2011 The second set was from the vessel Aubreigh Marie and contained 13 tarballs collected in March 2011 The third shrimp trawl set contained five tarballs collected in June 2011 These tarballs were collected ~200 m below the ocean surface and were large viscous and dense globs of oily residue encapsulated within a hardened exterior and the tumbling of these tarballs in the trawl nets incorporated shrimp and other trawl debris into the residue (see Figure 17)
28
Figure 17 Two views of tarball amp shrimp sample recovered in June 2010 LSU photos
The average density and percent asphaltenes of the shrimp trawl tarballs were significantly different from other MC252 tarballs (p=002 and lt0001 respectively Student two-tailed t-test with assumption of homogenous variance) The average density of the shrimp trawl tarballs was 104plusmn022 gmL and the average percent asphaltenes was 22plusmn16mdashcompared to the density of 086plusmn033 gmL and percent asphaltenes of 15plusmn17 for other MC252 tarballs Even though there was a significant difference the variability within each of the tarball groups was high Regardless of the variability the trawl tarballs have an average density that is heavier than sea water with a typical density of 102 gmL Density measurements could be easily affected by any amount of extraneous material incorporated in the tarball and also by the effect of evaporation of the initial oil Percent asphaltenes could be affected by compositional differences caused by the efficiency or extent of the burn since in-situ burning is not a controlled process which greatly affects the consistency of ISB residues
29
The average density of the shrimp trawl tarballs was not significantly higher than the average density of in-situ burn samples collected after burning (p=027) however the asphaltenes content was significantly higher (p=002) than the percent asphaltenes of the in-situ burn samples collected during burn operations This suggests some other factor influencing these ldquosinking tarballsrdquo that was not present or determined for samples taken immediately after in-situ burning at sea and a factor that did not influence other tarballs formed after the Deepwater Horizon incident It is possible that an aspect of the prolonged periods of combustion that caused the increase in density and the eventual tendency of the burn residue to sink and weather at depth enhanced the relative content of asphaltenes in the tarballs that were eventually recovered by shrimp trawls As mentioned earlier Buist et al (1997) suggest that in situ burning results in imperfect equilibrium flash vaporization that selectively concentrates and preserves asphaltene fractions of burn residues regardless of whether the oil was fresh or weathered prior to burning which results in a progressive increase in the density of the residue Density and asphaltenes data are presented in Tables 8 and 9 respectively
Table 8 Shrimp Trawl Tarball Density Comparisons
Shrimp Trawl Density ISB After Density Other MC252 Density Tarballs (gmL) Residue (gmL) Tarballs (gmL)
2011019-01 086 2010147-123 095 2010134-01 185 2011019-02 094 2010147-125 093 2010134-02 104 2011019-03 077 2010147-127 091 2010134-04 112 2011019-04 097 2010147-129 098 2010201-51 095 2011019-05 110 2010147-133 093 2010228-01 117 2011019-06 093 2010147-135 099 2010228-02 069 2011019-07 087 2010147-137 098 2012249-01 057 2011019-08 098 2010147-138 098 2012250-05 056 2011116-01 120 AVERAGE 095 2012250-10 060 2011116-02 087 STDEV 003 2012258-11 056 2011116-03 096 n= 8 2012263-01 112 2011116-04 113 2012265-67 128 2011116-05 147 2012265-68 079 2011116-06 133 2012272-02 086 2011116-07 111 2012278-01 067 2011116-08 157 2012278-02 075 2011116-28 125 2012278-03 058 2011116-29 148 2012289-01 058 2011116-30 078 2012289-02 059 2011116-31 095 2012289-03 078 2011116-32 090 AVERAGE 086 2011187-01 093 STDEV 033 2011187-02 093 n= 20 2011187-03 092 2011187-04 097 2011187-05 094
AVERAGE 104 STDEV 022
n= 26
30
Table 9 Shrimp Trawl Tarball Asphaltenes Comparisons
Shrimp Trawl Asph (wt ) ISB After Residues
Asph (wt ) Other MC252
Tarballs Asph (wt )
2011019-01 26 2010147-125 31 2010131-02 081 2011019-02 39 2010147-133 12 2010134-01 17 2011019-03 35 2010147-135 83 2010146-02 231 2011019-04 52 2010147-137 62 2010228-02 059 2011019-05 39 2010147-138 22 2011059-01 116 2011019-06 36 AVG ISB After 42 2012249-01 080 2011019-07 30 STDEV 30 2012250-09 038 2011019-08 41 n= 5 2012250-10 042 2011019-28 41 2012265-68 66 2011116-02 41 2012278-01 074 2011116-03 43 2012278-02 046 2011116-30 45 2012278-03 062 2011116-31 60 2012289-01 070 2011116-32 58 2012289-02 11 2011187-01 13 2012289-03 43 2011187-02 43 AVG Other 152 2011187-03 88 STDEV 173 2011187-04 18 n= 15 2011187-05 13
AVG Trawl 22 STDEV 162
n= 19
The normal alkane profile of these ldquosinkingrdquo tarballs was significantly different from other MC252 oil tarballs This profile (Figure 18a) appeared to be unique to tarballs collected at ocean depth and was similar to the normal alkane profile of the simulated distillation (SIMDIS) of MC252 oil at 205degC (Figure 18b) The SIMDIS and shrimp trawl tarballs exhibited evidence of thermal combustion that was absent in the normal alkane profiles of the in-situ burn oil residues collected after burning (refer back to Figure 13) The SIMDIS procedure separates oil into various fractions depending on molecular weight and associated boiling points The shrimp trawl sample appears to have undergone a similar process thus resulting in an alkane profile similar to the SIMDIS of MC252 oil Therefore it is believed that the shrimp trawl tarballs are the result of more efficient in-situ burns relative to other field burn residues The shape of the in situ burn tarball profile was very different from tarballs not associated with burning (ie weathered residues Figure 18c) but still considered to be a match to MC252 oil Figure 18d is the normal alkane profile of microbially-weathered MC252 oil This profile demonstrates that residues from in situ burning were not subjected to the typical weathering processes other oil residues reflect
31
(a)
(d)
(b)
(c)
Figures 18 a-d Normal alkane distribution depicting the similarity of a suspected ISB tarball (a) collected in a royal red shrimp trawl and the simulated distillation of MC252 oil at 205degC (b) The alkane distributions in (c) MC252 tarball not associated with in-situ burning and (d) microbially-weathered MC252 oil are dissimilar to (a) and (b) even though all four profiles are MC252 oil
32
The average FFPI of the shrimp trawl samples was 062plusmn006 indicating a pyrogenic composition The average FFPI of the shrimp trawl samples is significantly different from other MC252 tarballs (p=0001 Student two-tailed t-test with the assumption of equal variance) The average Wang Pyrogenic Index of the shrimp trawl samples was 006plusmn002 also indicating a more pyrogenic composition The average Wang Pyrogenic Index is also significantly different from other MC252 tarballs (p=001 Student two-tailed t-test with the assumption of equal variance) Figure 19 is a graphical depiction of the Wang Pyrogenic Index According to Wang et al (1999) lighter petroleum products and most crude oils fall into the range of 000-001 The majority of the samples plotted in the figure have an index greater than 001 and are in the range of what Wang et al would consider to be heavy oilsfuels and tarballs
0
50
100
150
200
250
300
350
000 002 004 006 008 010 012 014
Ph
en
A
nth
Wang Pyrogenic Index
Shrimp Trawl Tarballs
Other Tarballs Suspected ISB Tarballs
Figure 19 Plot of the Wang pyrogenic index over the ratio of phenanthreneanthracene for shrimp trawl tarballs suspected to be sinking MC252 residues from in situ burning
All 26 shrimp trawl tarballs were a match (scored 15 out of 15 or 100) to MC252 oil based on the diagnostic biomarker ratio analyses Figure 20 displays a comparison of the diagnostic ratio results of the shrimp trawl samples MC252 source oil and EPA South Louisiana Crude (SLC) oil standard The EPA-SLC standard scored 8 out of 15 or 53 and would be considered a non-match Table 10 provides the values that are plotted in Figure 20 The ability to discriminate between two SLC oils is a demonstration to the utility of the diagnostic ratio analyses employed for this study Detailed descriptions of the biomarker abbreviations are given in Appendix 1
33
000
050
100
150
200
250
300
350
400R
atio
Val
ueHopane Diagnostic Ratios (mz 191)
000
020
040
060
080
100
120
140
160
180
200
C27D-SC27D-R C29D-SC29D-R C28 aaa-RC29 aaa-R
Ratio
Val
ue
Diasteranes and Regular Steranes (mz 217)
000
010
020
030
040
050
060
070
080
C27 BBC28 BB+C29 BB C28 BBC27 BB+C29 BB C29 BBC27 BB+C28 BB
Ratio
Val
ue
14β(H) Steranes (mz 218)
000
020
040
060
080
100
120
140
160
C20 TAC21 TA C26 TA-SC28 TA-S C27 TA-RC28 TA-R
Ratio
Val
ue
Triaromatic Steriods (mz 231)
MC 252 Avg Ratio Shrimp Trawl Avg Ratio EPA SLC Avg Ratio
Figure 20 Graphical depiction of diagnostic ratio testing of shrimp trawl samples compared to MC252 source oil and EPA South Louisiana Crude Oil standard Error bars represent 5 error margin
34
Table 10 Diagnostic Biomarker Ratio Analysis Results for Shrimp Trawl Samples
Shrimp EPA SLC MC252 Ratio
Trawl Ratios Ratio (n=32)
(n=5) (n=4)
Hopanes (mz 191) AVG AVG AVG
C27-TsC27-Tm 127 126 077
C29-aBC29-Ts 217 217 362
C29-aBC30-aB 048 048 071
C31-aBC32-aB+C33-aB 093 093 134
C32-aBC31-aB+C33-aB 043 043 038
C33-aBC31-aB+C32-aB 028 028 018
Diasteranes and Regular 14a(H)-Steranes (mz 217) AVG AVG AVG
C27D-SC27D-R 161 161 175
C29D-SC29D-R 163 163 167
C28 aaa-RC29 aaa-R 074 074 080
14B(H)-Steranes (mz 218) AVG AVG AVG
C27 BBC28 BB+C29 BB 069 069 062
C28 BBC27 BB+C29 BB 038 038 040
C29 BBC27 BB+C28 BB 046 046 050
Triaromatic Steriods (mz 231) AVG AVG AVG
C20 TAC21 TA 107 107 140
C26 TA-SC28 TA-S 062 063 073
C27 TA-RC28 TA-R 092 092 099
Indicates EPA SLC ratios that are statistically different according to Hansen et al (2007) and Meyer et al (2014)
Task 4 Burning of surface collected Macondo Well source oil and emulsified source oil under controlled laboratory conditions
An initial controlled burn of MC252 oil was performed at LSU on 6 March 2012 Around 5g of MC252 oil was placed in a crucible and burned with a propane torch for ~4-5 minutes The experiment was conducted in triplicate under a laboratory ventilation hood There was not sufficient residue generated by this method to perform both physical and chemical characterization so only chemical characterization was completed Since this burn was performed on a reduced scale plans were made to conduct a second larger-scale burn using an increased volume of oil floated on artificial seawater
The second larger scale burn was conducted on 20 February 2014 at the LSU Environmental Health and Safety facility on the Baton Rouge campus This burn used 500mL of fresh and 15 weathered surrogate south Louisiana crude oil obtained from BP floated on artificial seawater (avg salinity of 34amp) in stainless steel containers Emulsified MC252 oil was also burned in the same manner in this experiment Each set of burns was performed in triplicate and burn durations were ~5-10 minutes Figure 21a-f shows the sequence of the burning process After the burns were completed the stainless steel containers were allowed to cool and were then transported back to the lab where the residues were sampled for both physical and chemical analyses
35
(a) (b)
(c)
(e)
(d)
(f)
Figures 21a-f Images from the larger-scale burn at LSU in 2014 (a) pans with South Louisiana crude floated on seawater (b) ignition procedure (c-e) sequence of mid-burn photos (f) extinguishment
Task 5 Physical and chemical characterization of burn residue resulting from Task 4
There was not enough material to complete both the physical and chemical characterization of the initial smaller-scale burn of MC252 oil in 2012 therefore only chemical characterization was completed for the triplicate burn samples Normal alkane chromatographic profiles (Figure 22) of the replicates from the smaller-scale controlled burn of MC252 oil exhibited similar chemical characteristics as the in-situ burn samples collected during the response to the Deepwater Horizon
36
oil spill and also resemble the normal alkane chromatographic profile of the shrimp trawl tarball in Figure 18a For the ldquoafterrdquo samples the modified FFPI was 054plusmn002 and the modified Wang Pyrogenic Index was 013plusmn002 Significant enhancement in the same pyrogenic PAHs as described earlier for Task 2 was also observed and the total target PAHs were reduced from 12000 mgkg in fresh MC252 oil to an average of 1200 mgkg in the burn residues (a 90 reduction) The PAH profiles for the before and after MC252 from this small-scale burn are shown in Figure 22 along with the PAH profiles from the larger-scale burns
1 0 0 0 1 5 0 0 2 0 0 0 2 5 0 0 3 0 0 0 3 5 0 0 4 0 0 0 4 5 0 0 5 0 0 0 5 5 0 0 6 0 0 0
0
2 0 0 0
4 0 0 0
6 0 0 0
8 0 0 0
1 0 0 0 0
1 2 0 0 0
1 4 0 0 0
1 6 0 0 0
1 8 0 0 0
2 0 0 0 0
2 2 0 0 0
2 4 0 0 0
2 6 0 0 0
2 8 0 0 0
T i m e - - gt
A b u n d a n c e
I o n 5 7 0 0 ( 5 6 7 0 t o 5 7 7 0 ) G T 1 2 0 6 4 I D d a t a m s
1 0 0 0 1 5 0 0 2 0 0 0 2 5 0 0 3 0 0 0 3 5 0 0 4 0 0 0 4 5 0 0 5 0 0 0 5 5 0 0 6 0 0 0
0
2 0 0 0
4 0 0 0
6 0 0 0
8 0 0 0
1 0 0 0 0
1 2 0 0 0
1 4 0 0 0
1 6 0 0 0
1 8 0 0 0
2 0 0 0 0
2 2 0 0 0
2 4 0 0 0
2 6 0 0 0
T i m e - - gt
A b u n d a n c e
I o n 5 7 0 0 ( 5 6 7 0 t o 5 7 7 0 ) G T 1 2 0 6 4 J D d a t a m s
1 0 0 0 1 5 0 0 2 0 0 0 2 5 0 0 3 0 0 0 3 5 0 0 4 0 0 0 4 5 0 0 5 0 0 0 5 5 0 0 6 0 0 0
0
5 0 0 0
1 0 0 0 0
1 5 0 0 0
2 0 0 0 0
2 5 0 0 0
3 0 0 0 0
3 5 0 0 0
4 0 0 0 0
4 5 0 0 0
5 0 0 0 0
5 5 0 0 0
6 0 0 0 0
T i m e - - gt
A b u n d a n c e
I o n 5 7 0 0 ( 5 6 7 0 t o 5 7 7 0 ) G T 1 2 0 6 4 K D d a t a m s
Figure 22 Normal alkane profiles (mz 57) for three replicate samples from a small-scale lab burn of MC252 oil
Results of the second larger-scale burn of surrogate south Louisiana crude oil were quite different from the actual in-situ burn samples previously characterized in Task 2 and from the small-scale burn of MC252 There were no significant changes in density or percent asphaltenes There was no enhancement of the pyrogenic PAHs observed in the actual ISB samples and the smaller scale controlled burn Only the modified FFPI showed a significant (p=lt0001) change The average FFPI
37
before burning was 079plusmn006 and the average FFPI after burning was 070plusmn002 Table 11 summarizes the results of the larger-scale controlled burn described above
Table 11 Summary of Chemical Characteristics from Larger-Scale Controlled Burn
15 Weathered Fresh Surrogate Oil Surrogate Oil Emulsified MC252 Oil
(by weight)
Before After Before After Before After
Avg Total Aromatics 8100 3600plusmn310 9400 3400plusmn310 2700 2600plusmn270
(mgkg)
Avg Modified FFPI 083 069plusmn002 083 071plusmn001 073 071plusmn001
Avg Wang Pyrogenic Index 001 004plusmn001 001 004plusmn0004 001 001plusmn00003
Avg PhenAnth 453 133plusmn20 457 117plusmn12 123 674plusmn88
Avg FluorAntPyr 038 060plusmn006 035 080plusmn001 040 032plusmn002
n= 1 3 1 3 1
15 Weathered Surrogate Oil
Fresh Surrogate Oil (by weight) Emulsified MC252 Oil
Before After Before After Before After
Avg Density (n=3) 086plusmn0001 084plusmn005 090plusmn0002 094plusmn002 098plusmn0003 099plusmn001
Avg Asphaltenes (n) 10(1) 198plusmn067(3) 090(1) 198plusmn068(3) 171(1) 220plusmn034
Figure 23 is a graphical depiction of the Wang Pyrogenic Index ldquoBeforerdquo samples are clearly separated from most of the ldquoafterrdquo samples in the figure Fresh oil before and 15 weathered oil before are on top of each other in the plot (0006 45) According to Wang et al (1999) lighter petroleum products and most crude oils fall into the range of 000-001 which is supported in this instance The ldquoafterrdquo samples are characterized by an increase in the pyrogenic index along with a decrease in the phenanthreneanthracene ratio however the majority fall in the range of what Wang et al would consider to be heavy oilsfuels and tarballs There was very little change in the Wang Pyrogenic Index for the emulsified MC252 oil
0
20
40
60
80
100
120
140
0000 0005 0010 0015 0020 0025 0030 0035 0040 0045 0050
Ph
en
An
th
Wang Pyrogenic Index
Laboratory Controlled Burn
Before Burning After Burning Fresh After Burning 15 Weathered After Burning Emulsified
Figure 23 Plot of the Wang pyrogenic index over the ratio of phenanthreneanthracene for laboratory controlled burning of surrogate crude oil and emulsified MC252 oil
38
3
The difference in results may be due to the use of the surrogate south Louisiana crude oil instead of MC252 oil unfortunately this was the only option for burning a larger volume of oil under controlled conditions as availability of original MC252 riser oil is extremely limited Controlled in-situ burning decreased the average total target aromatics of the fresh surrogate oil by approximately 45 and the average total target aromatics of the 15 weathered surrogate oil by approximately 36 both of which are similar for the field in-situ burn samples
Emulsified MC252 oil collected during the Deepwater Horizon clean-up operations was also burned during this portion of the laboratory work The emulsified MC252 oil did not burn well and as a result reflected the least amount of change from before to after There were no significant changes in the emulsified MC252 oilrsquos total aromatics modified FFPI and there was no enhancement of the pyrogenic PAHs Figure 24 shows the PAH profiles for each oil type and post-burn residues tested in the larger-scale controlled burn
Hopane normalization (Aeppli et al 2014 Douglas et al 1996 Garrett et al 2000 Prince et al 1994) was applied to the Fresh and 15 Weathered surrogate South Louisiana Crude oil Using the hopane normalized concentrations the percent increase or decrease of each target analyte was calculated and are presented in Figure 25 An average 5-point response factor of 091 (R2=09912) was determined for 17β(H)21β(H)-30-hopane This response factor was then used to calculate the concentration of 17α(H)21β(H)-hopane The hopane normalization factor (HopaneOilHopaneWeathered) for the Fresh surrogate oil was 076 and 088 for the 15 Weathered surrogate oil The results of the hopane normalization of controlled laboratory burns confirms the enrichment of higher molecular weight analytes previously documented in Tasks 2 and 5 (small-scale burn of MC252 oil)
39
2000
Co
nc
(mg
k
g)
Co
nc
(mg
k
g)
1500
Before 1000
After
500
0
(d) Emulsified MC252 Oil 2014
350 300 250 200 150
Before 100 50 After
Co
nc
(mg
k
g)
Co
nc
(mg
k
g)
2000
1500
Before 1000
After
500
0
(b) Fresh Surrogate Oil 2014
1600
1400
1200
1000 Before
800 After
600
400
200
0
(c) 15 Weathered Surrogate Oil 2014
(a) MC252 Oil 2012
0
NA
PH
C1
-Nap
hs
C2
-Nap
hs
C3
-Nap
hs
C4
-Nap
hs
FL
UO
RC
1-F
luo
rsC
2-F
luo
rsC
3-
Flu
ors
DB
TC
1-D
BT
sC
2-D
BT
sC
3-
DB
Ts
PH
EN
C1
-Ph
ens
C2
-Ph
ens
C3
-Ph
ens
C4
-Ph
ens
AN
TH
FL
UO
RA
NT
PY
RC
1-
Py
rsC
2-
Py
rsC
3-
Py
rsC
4-
Py
rsN
BT
C-1
NB
Ts
C-2
NB
Ts
C-3
NB
Ts
B(a
)AN
TH
CH
RY
C1
-C
hry
sC
2-
Ch
rys
C3
-C
hry
sC
4-
Ch
rys
B(b
)FB
(k)F
B(e
)PB
(a)P
PE
RY
LIN
DP
YR
D(a
h)A
B(g
hi)
P
Figures 24a-d Before and after PAH profiles for controlled burns of four oil types in 2012 and 2014 (a) MC252 riser oil (b) fresh surrogate South Louisiana crude (c) weathered surrogate South Louisiana crude and (d) emulsified MC252
40
-150
-100
-50
0
50
100
150
200
250
300
350
NA
PH
C1-N
aphs
C2-N
aphs
C3-N
aphs
C4-N
aphs
FLU
OR
C1-F
luor
s
C2-F
luor
s
C3-F
luor
s
DB
T
C1-D
BTs
C2-D
BTs
C3-D
BTs
PHEN
C1-P
hens
C2-P
hens
C3-P
hens
C4-P
hens
AN
TH
FLU
OR
AN
T
PYR
C1-P
yrs
C2-P
yrs
C3-P
yrs
C4-P
yrs
NB
T
C-1
NB
Ts
C-2
NB
Ts
C-3
NB
Ts
B[a
]AN
TH
CHR
Y
C1-C
hrys
C2-C
hrys
C3-C
hrys
C4-C
hrys
B[b
]F
B[k
]F
B[e
]P
B[a
]P
PER
YL
D[a
h]A
B[g
hi]
P
IN
CREA
SE O
R D
ECR
EASE
(a) Fresh Surrogate Oil
-150
-50
50
150
250
350
450
NA
PH
C1-N
aphs
C2-N
aphs
C3-N
aphs
C4-N
aphs
FLU
OR
C1-F
luor
s
C2-F
luor
s
C3-F
luor
s
DB
T
C1-D
BTs
C2-D
BTs
C3-D
BTs
PHEN
C1-P
hens
C2-P
hens
C3-P
hens
C4-P
hens
AN
TH
FLU
OR
AN
T
PYR
C1-P
yrs
C2-P
yrs
C3-P
yrs
C4-P
yrs
NB
T
C-1
NB
Ts
C-2
NB
Ts
C-3
NB
Ts
B[a
]AN
TH
CHR
Y
C1-C
hrys
C2-C
hrys
C3-C
hrys
C4-C
hrys
B[b
]F
B[k
]F
B[e
]P
B[a
]P
PER
YL
D[a
h]A
B[g
hi]
P
IN
CREA
SE O
R D
ECR
EASE
(b) 15 Weathered Surrogate Oil
Figure 25 Determination of percent increase or decrease of target analytes based on hopane normalization for (a) Fresh surrogate oil and (b) 15 Weathered surrogate oil
41
Task 6 Forensic interpretation of analytical results to characterize physical and chemical changes occurring during the combustion of oil to include comparison of changes occurring in various weathered oil samples and identification of potential markers for in-situ burn residues
A primary objective of the forensic interpretation of analytical results was to determine if residues from in-situ burning during the Deepwater Horizon response had measurable characteristics that could distinguish them from other MC252 residues Results from the other tasks previously discussed indicated that these characteristics included bull Significant increase in density and percent asphaltenes bull Enhancement of pyrogenic PAHs bull Decrease in the FFPI Increase in the Wang Pyrogenic Index and bull Evidence of thermal combustion in the normal alkane profile
However it appears that all of these discriminating factors must be present to make the distinction between sources with any confidence Because of this limitation the forensic interpretation was expanded to include a statistical analysis of sample matrices and sampling locations based on the diagnostic biomarker ratio analyses
A total of 130 suspected MC252 residues was initially chosen All samples were grouped according to year sample matrix (eg ISB oil ISB tarball oil other sediment or tarball) and sampling location (eg marsh ocean depth shore or water surface) These samples were then narrowed to a total of 112 by the diagnostic ratio analyses Only samples determined to be a statistical match to MC252 oil were used in the matrix and sampling location comparisons A one-way ANOVA with a post-hoc Tukey-Kramer pairwise comparison Table 12 was applied to the sample matrix analysis for each of the 15 diagnostic ratios to determine if any of the ratios could distinguish between in-situ burn residues and other MC252 oil residues The Tukey-Kramer comparison separates samples into lettered groups based on the minimum significant difference between means (p=005) Groups with the same letter have means that are not significantly different from each other and groups with differing letters are significantly different from each other For the sample location effects a nested ANOVA with random effects and a variance components covariance structure was carried out for each diagnostic ratio to determine if there were any differences due to location of sample collection In both cases the sample number in each matrix or location was highly unbalanced
A total of 7 out of 15 diagnostic ratios had significant differences between sample matrices Of these 7 ratios 4 showed significant differences between in-situ burn residues and other MC252 oil residues
bull The hopane ratio C31 aB (S+R)C32 aB (S+R) + C33 aB (S+R) was significantly different for ISB oil and ISB tarball Both of the in-situ burn residues were significantly different from all other matrices except the tarball matrix
bull Another hopane ratio C33 aB (S+R)C31 aB (S+R) + C32 aB (S+R) for ISB tarball was significantly different from all other matrices and ISB oil was significantly different from all other matrices except tarball and oil
bull The diasterane and regular sterane ratio C28 aaa-RC29 aaa-R was significantly different when comparing ISB oil and oil residues
42
bull The last significant ratio was C27 BB (S+R)C28 BB (S+R) + C29 BB (S+R) (in the 14(β)H-steranes group) This ratio was significantly different when comparing ISB tarballs to other tarballs
Table 12 Tukey-Kramer Pairwise Comparisons of Diagnostic Ratios for Different Matrices
C31 aB (S+R)C32 aB (S+R) + C33 aB (S+R) C28 aaa-RC29 aaa-R
Matrix Mean SE Group Matrix Mean SE Group
Sediment 10533 183E-02 A Oil 07825 943E-03 A
Other 09933 183E-02 AB Other 07767 267E-02 AB
Oil 09575 648E-03 BC Tarball 07592 740E-03 AB
ISBTarball 09451 508E-03 BCD 07477 906E-03 AB
Tarball
ISB Oil 09309 662E-03 CD Sediment 07400 267E-02 AB
ISB 09300 622E-03 D ISB Oil 07361 963E-03 B
Tarball
C33 aB (S+R)C31 aB (S+R) + C32 aB (S+R) C27 BB (S+R)C28 BB (S+R) + C29 BB (S+R)
Matrix Mean SE Group Matrix Mean SE Group
ISB Tarball
02788 290E-03 A Other 07550 345E-02 AB
ISB Oil 02743 309E-03 AB Tarball 07500 824E-03 A
Tarball 02667 237E-03 BC Oil 07340 218E-01 AB
Oil 02646 302E-03 BCD ISB Tarball
07006 115E-01 B
Other 02467 855E-03 CD Sediment 07000 282E-01 AB
Sediment 02400 855E-03 D ISB Oil 06900 218E-02 AB
Therefore C28 aaa-RC29 aaa-R may be useful for distinguishing ISB oil from other oil residues and C27 BB (S+R)C28 BB (S+R) + C29 BB (S+R) may be useful distinguishing ISB tarballs from other tarballs
A total of 5 out of 15 diagnostic ratios showed significant differences between sample matrix and sampling location The statistical analysis did not determine which matrix by sampling location was significant it was performed to determine if sampling location was a factor in distinguishing some of these oil residues Sampling location can have an important role because this often governs how oil residues weather Therefore this analysis supported the notion that oil residues from the same type of oil may show different characteristics determined by differences in weathering in various sampling locations without compromising the ability to make statistical matchnon-match determinations with the same ratios
43
SUMMARY AND CONCLUSIONS
A primary objective of this study was to identify possible indicators that could distinguish in-situ burn residues from other oil residues based on physical and chemical analyses of actual Deepwater Horizon in-situ burn samples Unfortunately while there is no single reliable indicator of in-situ burning partial indicators (eg different normal alkane profile enhancement of pyrogenic PAHs and reduction in the modified Fossil Fuel Pollution Index) when considered as an integrated whole can point to in-situ burning as a significant driver of weathering and fate Table 3 shows some of the characteristics assessed in this study Notable in these results is the enhancement in asphaltenes content for known burn residues and the tarballs recovered from deep water shrimp trawls
Table 13 Comparison of Physical and Chemical Characteristics for Different Oil Matrices
MC252 SLC Pre- SLC Post- ISB Oil ISB Oil Shrimp Other MC252 Riser Burn Burn Pre-Burn Post-Burn Tarballs Tarballs
Density gmL 084 086 084 088 096 104 086
Asphaltene 09-10 10 198 15 42 22 15
FFPI 083 079 070 077 065 062 059 Wang Pyrogenic
0004 001 004 001 007 006 004 Index
Even the use of a series of partial indicators must be employed cautiously comparison of the normal alkane profile for example has the caveat that the same profile was not observed in oil residues collected immediately after in-situ burning The distinctive profile appeared only in tarballs that had been recovered from trawls two hundred meters below the ocean surface The asphaltenes content of the shrimp trawl tarballs was significantly higher than all the other samples which indicates that asphaltenes content positively correlated with the tendency of those oil residues to sink Density was a factor but does not appear to be as critical as the percent asphaltenes with respect to sinking tarballs
The majority of residues from the Deepwater Horizon oil spill retained their oil biomarker signatures making diagnostic ratio analyses possible The diagnostic ratios were used to
1) Determine if the oil residue was a match to MC252 oil and 2) Determine if there were any differences in the ratios in matching oil residues based on
sample matrix and sampling location
A total of 4 out of the 15 diagnostic biomarker ratios did distinguish in-situ burn residues from the majority of the other residues Two of these ratios C28 aaa-RC29 aaa-R and C27 BB (S+R)C28 BB (S+R) + C29 BB (S+R) may be useful for distinguishing ISB oil from other oil residues and ISB tarballs from other tarballs respectively Significant differences were also determined in the comparison of sampling locations These differences suggest that weathering of oil residues from the same initial source is highly dependent on the specific environmental compartment in which they reside without compromising the ability to make matchnon-match determinations with the same ratios
44
The in-situ burning research described in this report combined retrospective analysis of samples collected during the Deepwater Horizon response with new laboratory work and interpretation to increase the relevance and applicability of the physical and chemical results The methodological refinements improved our abilities to distinguish burn products from other weathered oil matrices and helped to confirm the generalized source attributions to burn operations that were made shortly after tarballs were encountered in the Gulf of Mexico royal red shrimp fishery It is important to note that the chemical characterization method (GC-MS) and target analyte list used for this report only examines about 5 of the oil mass Other analytical methods such as GCxGC-FID (Aeppli et al 2014) or APPI FT-ICR MS have become standard instrument systems for analyzing crude oil Both have advantages over GC-MS in that they can separate and identify a much larger percentage of oil compounds however it cannot be denied that GC-MS is still relevant and is one of the most recognized instrument systems for characterizing crude oil in the environment
The Deepwater Horizon spill experience validated the operational feasibility and practical application of in-situ burning as an open water response method Like nearly everything else about this incident the scale of in-situ burn operations was unprecedented between 28 April and 19 July 2010 over 400 individual burns took place consuming an estimated 220000-310000 bbl of oil This is roughly equivalent to the total volume for the Exxon Valdez oil spill in 1989
Implicit in these numbers is the large volume of in-situ burn residue that was generated during the Deepwater Horizon operations Using the standard in-situ burn efficiency estimates of 90-95 percent the amount of residue resulting from the operations potentially ranged from 11000shy33000 bbl This is a substantial amount of petroleum hydrocarbons introduced into a relatively small portion of the marine environmentmdashalthough it should be noted that natural seeps contribute an estimated 560000 to 14 million bbl of oil into the waters of the Gulf of Mexico (National Research Council 2003) each year (note seep locations in Figure 26)
The fate of the burn residue from the Deepwater Horizon in-situ burn operations might never have been known were it not for the chance encounters of the single deep water fishery operating in the same general area as most of the burn operations (Figure 26) Impacts to the fishery were minimal and it was quickly re-opened after testing and analysis by federal fisheries managers and seafood safety specialists However the residue and fishery interactions that occurred in 2010 and 2011 represent a cautionary footnote to large-scale in-situ burn operations that should be factored into tradeoff analysis for future spill responses Further the Deepwater Horizon experience suggests a need for additional research into burn residue containment or recovery methods that would reduce or eliminate potential fishery impacts associated with sinking residue
On a final note we recommend that the Environmental Unit for a spill response where burn operations are regularly taking place should collaborate with the Operations Section to collect analyze and archive paired samples of pre- and post-burn oil to facilitate the process of source identification of oil residues encountered during a response In doing so a solid empirical database of physical and chemical characteristics would be built over time to permit a better understanding of the changes occurring to oil during in-situ burning the circumstances in which residues will floatsink and the specific markers and physical features that might be used to uniquely identify burn residues
45
Figure 26 Composite map showing locations of the Macondo wellhead in-situ burn operations royal red shrimp trawls with preliminary source identifications and known hydrocarbon seeps Numbers in boxes denote approximate tarball counts in each quadrant Prepared by JB Huyett Genwest Systems
46
REFERENCES
Aeppli C RK Nelson JR Radović CA Carmichael DL Valentine and CM Reddy 2014 Recalcitrance and degradation of petroleum biomarkers upon abiotic and biotic natural weathering of Deepwater Horizon oil Environmental Science and Technology 486726-6734
Allen AA NJ Mabile D Jaeger and D Costanzo 2011 The use of controlled burning during the Gulf of Mexico Deepwater Horizon MC-252 oil spill response In Proceedings of the 2011 International Oil Spill Conference 23-26 May 2011 Portland OR 13 pp
httpdxdoiorg1079012169-3358-2011-1-194
American Society for Testing Materials D71-94(2009) Standard test method for relative density of solid pitch and asphalt (displacement method) ASTM International West Conshohocken PA 2012
American Society for Testing Materials D3279-12 Standard test method for n-heptane insoluble ASTM International West Conshohocken PA 2012
Anderson WW and MJ Lindner 1971 Contributions to the biology of the royal red shrimp Hymenopenaeus robustus Smith Fishery Bulletin 69(2)313-336
Boehm PD and JW Farrington 1984 Aspects of the polycyclic aromatic hydrocarbon geochemistry of recent sediments in the Georges Bank Region Environmental Science and Technology 18(11)840-845
Bullis HR Jr 1956 Preliminary results of deep-water exploration for shrimp in the Gulf of Mexico by the MV Oregon (1950-1956) Commer Fish Rev 18(12)1-12
Buist I 1998 Window of opportunity for in situ burning In Proceddings of the In Situ Burning of Oil Spills Workshop US Minerals Management Service Special Publication 935 21-30
Buist I and K Trudel 1995 Laboratory studies of the properties of in-situ burn residues Marine Spill Response Corporation Washington DC MSRC Technical Report Series 95-010 110 p
Buist I K Trudel J Morrison and D Aurand 1995 Laboratory studies of the physical properties of in-situ burn residues In Proceedings of the Eighteenth Arctic and Marine Oilspill Program (AMOP) June 14-16 1995 Edmonton Alberta 1027-1051
Buist I K Trudel J Morrison and D Aurand 1997 Laboratory studies of the properties of in-situ burn residues In Proceedings of the 1997 International Oil Spill Conference April 1997 1997(1)149-156
Cascorbi A 2007 Wild-caught warmwater shrimp (Infraorder Penaeus--the Penaeid shrimps) Gulf of Mexico and US South Atlantic Regions Seafood Watch Seafood Report Monterey Bay Aquarium 52 pp
Douglas GS AE Bence RC Prince SJ McMillen and EL Butler 1996 Environmental stability of selected petroleum hydrocarbon source and weathering ratios Environmental Science and Technology 30(7)2332-2339
47
Farfante IP 1988 Illustrated key to Penaeoid shrimps of commerce in the Americas NOAA Technical Report NMFS 64 April 1988 32 pp
Federal Interagency Solutions Group Oil Budget Calculator Science and Engineering Team 2010 Oil Budget Calculator Deepwater Horizon Technical Documentation A Report to the National Incident Command November 2010 49 pp + appendices
Fingas MF G Halley F Ackerman N Vanderkooy R Nelson MC Bissonnette N Laroche P Lambert P Jokuty K Li W Halley G Warbanski PR Campagna RD Turpin MJ Trespalacios D Dickins EJ Tennyson D Aurand and R Hiltabrand 1994a The Newfoundland Offshore Burn Experiment ndash NOBE experimental design and overview In Proceedings of the Seventeenth Arctic and Marine Oilspill Program (AMOP) June 8-10 1994 Vancouver British Columbia 1053-1063
Fingas MF F Ackerman K Li P Lambert Z Wang MC Bissonnette PR Campagna P Boileau N Laroche P Jokuty R Nelson RD Turpin MJ Trespalacios G Halley J Belanger J Pareacute N Vanderkooy EJ Tennyson D Aurand and R Hiltabrand 1994b The Newfoundland Offshore Burn Experiment ndash NOBE preliminary results of emissions measurement In Proceedings of the Seventeenth Arctic and Marine Oilspill Program (AMOP) June 8-10 1994 Vancouver British Columbia 1099-1164
Fingas M 2011 An overview of in-situ burning Chapter 23 in M Fingas (ed) Oil Spill Science and Technology New York Gulf Professional PublishingElsevier 737-903
Fingas M 2015 Introduction to Oil Chemistry and Properties In Handbook of Oil Spill Science and Technology M Fingas Ed Hoboken NJ John Wiley amp Sons Inc
Garrett RM CC Gueacutenette CE Haith and RC Prince 2000 Pyrogenic polycyclic aromatic hydrocarbons in oil burn residues Environmental Science and Technology 34(10)1934-1937
Gulf of Mexico Fishery Management Council 2004 Appendix C Information on Species Distributions and Habitat Associations Final Environmental Impact Statement for the Generic Essential Fish Habitat Amendment to the following fishery management plans of the Gulf of Mexico (GOM) shrimp fishery of the Gulf of Mexico red drum fishery of the Gulf of Mexico reef fish fishery of the Gulf of Mexico stone crab fishery of the Gulf of Mexico coral and coral reef fishery of the Gulf of Mexico spiny lobster fishery of the Gulf of Mexico and South Atlantic coastal migratory pelagic resources of the Gulf of Mexico and South Atlantic 262 pp
Gulf of Mexico Fishery Management Council 2005 Final Amendment Number 13 to the Fishery Management Plan for the Shrimp Fishery of the Gulf of Mexico US Waters with Environmental Assessment Regulatory Impact Review and Regulatory Flexibility Act analysis August 24 2005 272 pp
Hansen AB PS Daling LG Faksness KR Sorheim P Kienhuis and R Duus 2007 Emerging CEN Methodology for Oil Spill Identification In Oil Spill Environmental Forensics Z Wang and SA Stout Eds Boston MA Elsevier
Jaeger A 2011 Personal communication 27 September 2011
Kucklick JH and D Aurand 1997 Historical dispersant and in-situ burning opportunities in the
48
United States Proc 1997 International Oil Spill Conference 805 ndash 810
Leahy JG and RR Colwell 1990 Microbial degradation of hydrocarbons in the environment Microbiological Reviews 54305-315
Lewan MD A Warden RF Dias ZK Lowry TL Hannah PG Lillis RF Kokaly TM Hoefen GA Swayze CT Mills SH Harris GS Plumlee 2014 Organic Geochemistry 75(2014)54-60
Meyer BM EB Overton and RE Turner 2014 Oil source identification using diagnostic biomarker ratio analyses In 2014 International Oil Spill Conference Proceedings Savannah GA May 5-9 2014(1)2064-2073
Michel J D Scholz SR Warren Jr and AH Walker 2005 In-situ burning A decision-makerrsquos guide to in-situ burning API Publication Number 4740 Washington DC American Petroleum Institute 60 pp
Mills MA TJ McDonald JS Bonner MA Simon and RL Autenrieth 1999 Method for quantifying the fate of petroleum in the environment Chemosphere 39(14)2563-2582
Mullin JV and MA Champ 2003 Introductionoverview to in situ burning of oil spills Spill Science amp Technology 8(4)323-330
National Research Council Committee on Oil in the Sea 2003 Oil in the Sea III Inputs Fates and Effects National Research Council Ocean Studies Board and Marine Board Divisions of Earth and Life Studies and Transportation Research Board Washington DC National Academy Press 265 pp
Operational Science Advisory Team-2 2011 Net Environmental Benefits Analysis (NEBA) Annex M to Summary Report for Fate and Effects of Remnant Oil in the Beach Environment prepared for Lincoln D Stroh US Coast Guard Federal On-Scene Coordinator 48 pp
Overton EB WD Sharp and P Roberts 1994 Toxicity of Petroleum In Basic Environmental Toxicology LG Cockerham and BS Shane Eds Boca Raton FL CRC Press Inc
Prince RC DL Elmendorf JR Lute CS Hsu CE Haith JD Senius GJ Dechert GS Douglas and EL Butler 1994 17α(H)21β(H)-hopane as a conserved internal marker for estimating the biodegradation of crude oil Environmental Science and Technology 28(1)142-145
SL Ross Environmental Research Ltd 2010 Spill Related Properties of MC252 Crude Oil Sample ENT-052210-178 Appendix 8 to Oil Budget Calculator Deepwater Horizon Technical Documentation A Report to the National Incident Command November 2010 7 pp
Stiles ML E Harrould-Kolieb P Faure H Ylitalo-Ward and MF Hirshfield 2007 Deep sea trawl fisheries of the Southeast US and Gulf of Mexico rock shrimp royal red shrimp calico scallops Report for Oceana May 2007 18 pp
US Coast Guard 2011 BP Deepwater Horizon Oil Spill Incident Specific Preparedness Review (ISPR) Final Report Report prepared for ADM RJ Papp Commandant January 2011 158 pp
Wang Z M Fingas YY Shu L Sigouin M Landriault P Lambert R Turpin P Campagna and J
49
Mullin 1999 Quantitative characterization of PAHs in burn residue and soot samples and differentiation of pyrogenic PAHs from petrogenic PAHsmdashthe 1994 Mobile burn study Environ Sci Technol 33(18)3100-3109
Zack S 2007 Royal red shrimp Stoningtonrsquos succulent secret Connecticut Sea GrantWrack Lines 72 FallWinter 2007 6 pp
ACKNOWLEDGMENTS
Funding for this project was provided by the US Department of the Interior Bureau of Safety and Environmental Enforcement (BSEE) under Interagency Agreement E13PG00001 We thank the outside peer reviewers recruited by BSEE for their constructive comments and criticism and for improving the clarity of the project report The authors wish to acknowledge the assistance and support of Alan A Allen of Spiltec and Nere Mabile of BP during the Deepwater Horizon response in Houma LA CPO RJ Schrader of the US Coast Guard shared his expertise experiences and photographs from the field implementation of in-situ burn operations during the spill The data analysis for this report was generated using SAS software Version 93 of the SAS System for Windows Copyright copy 2002-2010 by SAS Institute Inc SAS and all other SAS Institute Inc product or service names are registered trademarks or trademarks of SAS Institute Inc Cary NC USA
DISCLAIMER
Reference to specific commercial products process or service by trade name trademark manufacturer or otherwise does not constitute or imply their endorsement recommendation or favoring by the United States Government The views and opinions of authors expressed do not necessarily state or reflect those of the United States Government and shall not be used for advertising or product endorsement purposes
50
APPENDIX 1
DIAGNOSTIC BIOMARKER RATIOS
Petroleum Biomarkers Used For Calculating MC252 Diagnostic Ratios
Abbreviation Compound Name mz Value
C27 18α(H)-222930-trisnorneohopane 191C27 Ts C27 Tm C27 17α(H)-222930-trisnorhopane 191 C29 aB C29 17α(H)21β(H)-30-norhopane 191 C29 Ts C29 18α(H)-30-norneohopane 191 C30 aB C30 17α(H)21β(H)-hopane 191 C31 aB (S+R) C31 17α(H)21β(H)-22(S+R)-homohopane 191 C32 aB (S+R) C32 17α(H)21β(H)-22(S+R)-bishomohopane 191 C33 aB (S+R) C32 17α(H)21β(H)-22(S+R)-trishomohopane 191 C27D Ba-S C27 13β(H)17α(H)20S-diasterane 217 C27D Ba-R C27 13β(H)17α(H)20R-diasterane 217 C29D Ba-S C29 24-ethyl-13β(H)17α(H)20S-diacholestane 217 C29D Ba-R C29 24-ethyl-13β(H)17α(H)20R-diacholestane 217 C28 aaa-R C28 24-methyl-5α(H)14α(H)17α(H) 20R-cholestane 217 C29 aaa-R C29 24-ethyl-5α(H)14α(H)17α(H) 20R-cholestane 217 C27 BB (R+S) C27 5α(H)14β(H)17β(H)-cholestane (20R+20S) 218 C28 BB (R+S) C28 24-methyl-5α(H)14β(H)17β(H)-cholestane (20R+20S) 218 C29 BB (R+S) C29 24-ethyl-5α(H)14β(H)17β(H)-cholestane (20R+20S) 218 C20 TA C20-triaromatic steroid (pregnane derivative) 231 C21 TA C21-triaromatic steroid (homopregnane derivative) 231 C26 TA-S C26-triaromatic steroid20S (cholestane derivative) 231 C28 TA-S C28-triaromatic steroid20S (ethylcholestane derivative) 231 C27 TA-R C27-triaromatic steroid20R (methylcholestane derivative) 231 C28 TA-R C28-triaromatic steroid20R (ethylcholestane derivative) 231
52
Diagnostic Ratios Chosen for MC252 Source Oil
Ratio mz
Value
C27 Ts C27 Tm 191
C29 aBC29 Ts 191
C29 aBC30 aB 191
C31 aB(S+R)C32 aB(S+R) + C33 aB(S+R) 191
C32 aB(S+R)C31 aB(S+R) + C33 aB(S+R) 191
C33 aB(S+R)C31 aB(S+R) + C32 aB(S+R) 191
C27D Ba-SC27D Ba-R 217
C29D Ba-SC29D Ba-R 217
C28 aaa-RC29 aaa-R 217
C27 BB(R+S)C28 BB(R+S) + C29 BB(R+S) 218
C28 BB(R+S)C27 BB(R+S) + C29 BB(R+S) 218
C29 BB(R+S)C27 BB(R+S) + C28 BB(R+S) 218
C20 TAC21 TA 231
C26 TA-SC28 TA-S 231
C27 TA-RC28 TA-R 231
53

1 0 0 0 1 5 0 0 2 0 0 0 2 5 0 0 3 0 0 0 3 5 0 0 4 0 0 0 4 5 0 0 5 0 0 0 5 5 0 0 6 0 0 0
0
2 0 0 0 0 0
4 0 0 0 0 0
6 0 0 0 0 0
8 0 0 0 0 0
1 0 0 0 0 0 0
1 2 0 0 0 0 0
1 4 0 0 0 0 0
1 6 0 0 0 0 0
1 8 0 0 0 0 0
2 0 0 0 0 0 0
2 2 0 0 0 0 0
2 4 0 0 0 0 0
2 6 0 0 0 0 0
2 8 0 0 0 0 0
3 0 0 0 0 0 0
3 2 0 0 0 0 0
3 4 0 0 0 0 0
3 6 0 0 0 0 0
T i m e - - gt
A b u n d a n c e
I o n 5 7 0 0 ( 5 6 7 0 t o 5 7 7 0 ) M U 1 0 1 4 8 T D d a t a m sI o n 5 7 0 0 ( 5 6 7 0 t o 5 7 7 0 ) M U 1 0 1 4 8 U D d a t a m s
(c)
nC17
nC18
(b) nC17
nC18
1 0 0 0 1 5 0 0 2 0 0 0 2 5 0 0 3 0 0 0 3 5 0 0 4 0 0 0 4 5 0 0 5 0 0 0 5 5 0 0 6 0 0 0
0
5 0 0 0 0
1 0 0 0 0 0
1 5 0 0 0 0
2 0 0 0 0 0
2 5 0 0 0 0
3 0 0 0 0 0
3 5 0 0 0 0
4 0 0 0 0 0
4 5 0 0 0 0
5 0 0 0 0 0
5 5 0 0 0 0
6 0 0 0 0 0
6 5 0 0 0 0
7 0 0 0 0 0
7 5 0 0 0 0
8 0 0 0 0 0
8 5 0 0 0 0
9 0 0 0 0 0
9 5 0 0 0 0
T i m e - - gt
A b u n d a n c e
1 0 0 0 1 5 0 0 2 0 0 0 2 5 0 0 3 0 0 0 3 5 0 0 4 0 0 0 4 5 0 0 5 0 0 0 5 5 0 0 6 0 0 0
0
2 0 0 0 0 0
4 0 0 0 0 0
6 0 0 0 0 0
8 0 0 0 0 0
1 0 0 0 0 0 0
1 2 0 0 0 0 0
1 4 0 0 0 0 0
1 6 0 0 0 0 0
1 8 0 0 0 0 0
2 0 0 0 0 0 0
2 2 0 0 0 0 0
2 4 0 0 0 0 0
2 6 0 0 0 0 0
2 8 0 0 0 0 0
3 0 0 0 0 0 0
3 2 0 0 0 0 0
3 4 0 0 0 0 0
3 6 0 0 0 0 0
3 8 0 0 0 0 0
4 0 0 0 0 0 0
4 2 0 0 0 0 0
4 4 0 0 0 0 0
4 6 0 0 0 0 0
4 8 0 0 0 0 0
T i m e - - gt
A b u n d a n c e
I o n 5 7 0 0 ( 5 6 7 0 t o 5 7 7 0 ) M U 1 0 1 4 1 K D d a t a m s
nC17
nC18
(a)
Figures 13a-c Alkane profiles of fresh MC252 riser oil (top a) weathered MC252 oil before in-situ burning (middle b) and MC252 oil after in-situ burning (bottom c) Note progressively larger prominence of alkanes in the boiling point range of 204degC to 538degC (nC12 to nC35) in (b) from weathering and (c) from in situ burning
24
The average FFPI of the before in-situ burning samples was 077plusmn003 and the average FFPI of the after in-situ burning samples was 065plusmn010 indicating a shift from petrogenic to pyrogenic composition This difference was significant (p=0001 Student two-tailed t-test with the assumption of equal variance) The average Wang Pyrogenic Index of the before in situ burning samples was 001plusmn0002 and after in situ burning was 007plusmn006 also indicating a shift from petrogenic to pyrogenic composition This difference is also significant (p=001 Student two-tailed t-test with the assumption of equal variance) Figure 14 is a graphical depiction of the Wang Pyrogenic Index ldquoBeforerdquo samples are clearly separated from most of the ldquoafterrdquo samples in the figure According to Wang et al (1999) lighter petroleum products and most crude oils fall into the range of 000-001 which is supported in this instance The ldquoafterrdquo samples are characterized by an increase in the pyrogenic index along with a decrease in the phenanthreneanthracene ratio however the majority fall in the range of what Wang et al would consider to be heavy oilsfuels and tarballs There are two ldquoafterrdquo samples that align more towards ldquobeforerdquo samples perhaps indicating an inefficient burn
0
20
40
60
80
100
120
140
160
000 002 004 006 008 010 012 014 016 018 020
Ph
en
A
nth
Wang Pyrogenic Index
2010 ISB Samples
Before Burning After Burning
Figure 14 Plot of the Wang pyrogenic index over the ratio of phenanthreneanthracene for before and after in situ burning samples collected in May and July 2010
Task 3 Physical and chemical characterization of deep water (~200 m) tarballs collected by royal red shrimp trawlers
Royal red shrimp background The royal red shrimp (Hymenopeneaus robustus or Pleoticus robustus) shown in Figure 15 is a large deep-water penaeid shrimp that has a wide distribution from the northern US coast to the east coast of South America (Anderson and Lindner 1971) More specifically the known range for royal red shrimp in US waters extends from the Atlantic coast of New England south of Marthas Vineyard through the Gulf of Mexico and the Caribbean Sea to French Guiana They inhabit the upper continental slope region at depths from 180 to 730 m (Farfante 1988)
Unlike other penaeid shrimp species that complete their life cycle within a year royal red shrimp live for several years (Cascorbi 2007) Males reach a maximum total length of 180 mm females 225 mm (Farfante 1988)
Few details are known about the life history of the royal red shrimp Spawning is believed to occur
25
year-round but predominantly between January and May and on the upper regions of the continental slope Larval forms of the shrimp are unknown (Gulf of Mexico Fishery Management Council 2004)
The royal red has won favor as a commercial fisheries product for its sweet juicy flesh and striking red color The fishery for royal red shrimp serves a niche market representing a relatively small proportion of the overall shrimp industry in the Southeast US and Gulf of Mexico (Stiles et al 2007)
Figure 15 Royal red shrimp Pleoticus robustus Photo by Connecticut Sea Grant
Royal red shrimp were investigated as an experimental fishery beginning in 1950 in the southeastern US with support from the Bureau of Fisheries the predecessor federal agency to the NOAA National Marine Fisheries Service (Bullis 1956) The commercial fishery began officially in the Gulf of Mexico and off Floridarsquos east coast in 1962 According to catch statistics for the Gulf of Mexico cited by Cascorbi (2007) landings of royal red shrimp averaged about 123 MT per year since 1998 or about 018 of total Gulf shrimp landings Of nearly 3000 vessels permitted for shrimp fishing in the Gulf of Mexico in 2005 only 15 specifically targeted royal red shrimp (Gulf of Mexico Fishery Management Council 2005) At the time of the Deepwater Horizon spill in 2010 NOAA indicated that there were 250 active royal red permits but that only a few were active
On November 20 2010 NOAA received a report from a fisherman who caught tarballs while trawling for royal red shrimp in federal waters off the coast of Alabama The area had just been reshyopened by NOAA to commercial fishing on November 15 after the established sensory testing of 286 finfish and 55 shrimp samples and chemical analysis of 33 composite samples of 207 finfish and 9 composites of 50 shrimp showed no apparent oil contamination However as a result of the
26
tarballs encountered in the deep water trawl fishery on November 24 2010 NOAA closed 4213 square miles (10911 sq km) to royal red shrimp fishing only (Figure 16) Fishing for finfish or other penaeid shrimp species was still permitted
Figure 16 Fishery closure map 24 November 2010 showing the royal red shrimp closure area due to tarballs Source NOAA
In December 2010 and January 2011 NOAA chartered two fishing vessels to sample royal red shrimp in the closed area over three cruises The samples were assessed via the sensory and chemical protocols jointly established by the US Food and Drug Administration and NOAA for determining the safety of seafood during the Deepwater Horizon response In addition to targeting PAHs by both gas chromatography and mass spectrometry (GCMS) and high performance liquid chromatographyfluorescence (HPLC-UVF) samples were also analyzed for dioctyl sodium sulfosuccinate (DOSS) a component of the Corexit dispersants used during the response Video surveys were also conducted in the closed area to determine the extent of tarball occurrence
Three of the royal red shrimp samples collected in December failed sensory evaluation by a three-person panel ie they were judged to be tainted However chemical analysis failed to show any sign of PAH contamination The areas where the failed sensory samples originated were resampled in January and the shrimp were evaluated by a larger (seven-person) sensory panel All samples passed this round of sensory evaluation
27
Chemistry results summarized in Table 7 from both GCMS and HPLC-UVF for the edible tissues of the royal red shrimp were below the established levels of concern for all samples collected after the November closure Based on the sensory and chemistry results the area was re-opened to all fishing on 3 February 2011
Table 7 Results for Chemical Analysis of Royal Red Shrimp Sampled in December 2010 and January 2011 (Source NOAA)
PAHs Level of Concern Range of values (ppb) Range of values (ppb) (ppb) GCMS HPLCfluorescence^
Naphthalene 123000 063 - 20 lt24
Fluorene 246000 013 - 053 lt041
Anthracene Phenanthrene 1846000 023 - 16 lt124 - 33
Pyrene 185000 lt0070 - 041 lt57
Fluoranthene 246000 lt0071 - 033 lt65
Chrysene 132000 lt014 - 11 lt37
Benzo(k)fluoranthene 13200 lt012 - lt031 lt026 - 27
Benzo(b)fluoranthene 1320 lt012 - lt031 lt066
Benz(a)anthracene 1320 lt011 - lt022 lt11
Indeno(123-cd)pyrene 1320 lt011 - lt022 lt77
Dibenz(ah)anthracene 132 lt0094 - lt023 lt18
Benzo(a)pyrene 132 lt011 - lt028 lt096
DOSS Level of Concern Range of values (ppm) Range of values (ppm) (ppm)
Dioctylsulfosuccinate 500 lt0043 - lt0045 --shy
Level of Concern for Anthracene and Phenanthrene combined ^ HPLCfluorescence (screening) analyses have higher limits of quantitation than the more sensitive and laborious GCMS analyses
Preliminary chemical analysis of some of the tarballs recovered from the trawl catches indicated a possible sourcing to burned Macondo Well oil Many of the trawl locations where tarballs were encountered were 10 km or less from the primary in-situ burn locations
Three sets of tarballs collected from royal red shrimp trawls were analyzed by LSU One set was from the vessel Our Mother and contained 8 tarballs collected in January 2011 The second set was from the vessel Aubreigh Marie and contained 13 tarballs collected in March 2011 The third shrimp trawl set contained five tarballs collected in June 2011 These tarballs were collected ~200 m below the ocean surface and were large viscous and dense globs of oily residue encapsulated within a hardened exterior and the tumbling of these tarballs in the trawl nets incorporated shrimp and other trawl debris into the residue (see Figure 17)
28
Figure 17 Two views of tarball amp shrimp sample recovered in June 2010 LSU photos
The average density and percent asphaltenes of the shrimp trawl tarballs were significantly different from other MC252 tarballs (p=002 and lt0001 respectively Student two-tailed t-test with assumption of homogenous variance) The average density of the shrimp trawl tarballs was 104plusmn022 gmL and the average percent asphaltenes was 22plusmn16mdashcompared to the density of 086plusmn033 gmL and percent asphaltenes of 15plusmn17 for other MC252 tarballs Even though there was a significant difference the variability within each of the tarball groups was high Regardless of the variability the trawl tarballs have an average density that is heavier than sea water with a typical density of 102 gmL Density measurements could be easily affected by any amount of extraneous material incorporated in the tarball and also by the effect of evaporation of the initial oil Percent asphaltenes could be affected by compositional differences caused by the efficiency or extent of the burn since in-situ burning is not a controlled process which greatly affects the consistency of ISB residues
29
The average density of the shrimp trawl tarballs was not significantly higher than the average density of in-situ burn samples collected after burning (p=027) however the asphaltenes content was significantly higher (p=002) than the percent asphaltenes of the in-situ burn samples collected during burn operations This suggests some other factor influencing these ldquosinking tarballsrdquo that was not present or determined for samples taken immediately after in-situ burning at sea and a factor that did not influence other tarballs formed after the Deepwater Horizon incident It is possible that an aspect of the prolonged periods of combustion that caused the increase in density and the eventual tendency of the burn residue to sink and weather at depth enhanced the relative content of asphaltenes in the tarballs that were eventually recovered by shrimp trawls As mentioned earlier Buist et al (1997) suggest that in situ burning results in imperfect equilibrium flash vaporization that selectively concentrates and preserves asphaltene fractions of burn residues regardless of whether the oil was fresh or weathered prior to burning which results in a progressive increase in the density of the residue Density and asphaltenes data are presented in Tables 8 and 9 respectively
Table 8 Shrimp Trawl Tarball Density Comparisons
Shrimp Trawl Density ISB After Density Other MC252 Density Tarballs (gmL) Residue (gmL) Tarballs (gmL)
2011019-01 086 2010147-123 095 2010134-01 185 2011019-02 094 2010147-125 093 2010134-02 104 2011019-03 077 2010147-127 091 2010134-04 112 2011019-04 097 2010147-129 098 2010201-51 095 2011019-05 110 2010147-133 093 2010228-01 117 2011019-06 093 2010147-135 099 2010228-02 069 2011019-07 087 2010147-137 098 2012249-01 057 2011019-08 098 2010147-138 098 2012250-05 056 2011116-01 120 AVERAGE 095 2012250-10 060 2011116-02 087 STDEV 003 2012258-11 056 2011116-03 096 n= 8 2012263-01 112 2011116-04 113 2012265-67 128 2011116-05 147 2012265-68 079 2011116-06 133 2012272-02 086 2011116-07 111 2012278-01 067 2011116-08 157 2012278-02 075 2011116-28 125 2012278-03 058 2011116-29 148 2012289-01 058 2011116-30 078 2012289-02 059 2011116-31 095 2012289-03 078 2011116-32 090 AVERAGE 086 2011187-01 093 STDEV 033 2011187-02 093 n= 20 2011187-03 092 2011187-04 097 2011187-05 094
AVERAGE 104 STDEV 022
n= 26
30
Table 9 Shrimp Trawl Tarball Asphaltenes Comparisons
Shrimp Trawl Asph (wt ) ISB After Residues
Asph (wt ) Other MC252
Tarballs Asph (wt )
2011019-01 26 2010147-125 31 2010131-02 081 2011019-02 39 2010147-133 12 2010134-01 17 2011019-03 35 2010147-135 83 2010146-02 231 2011019-04 52 2010147-137 62 2010228-02 059 2011019-05 39 2010147-138 22 2011059-01 116 2011019-06 36 AVG ISB After 42 2012249-01 080 2011019-07 30 STDEV 30 2012250-09 038 2011019-08 41 n= 5 2012250-10 042 2011019-28 41 2012265-68 66 2011116-02 41 2012278-01 074 2011116-03 43 2012278-02 046 2011116-30 45 2012278-03 062 2011116-31 60 2012289-01 070 2011116-32 58 2012289-02 11 2011187-01 13 2012289-03 43 2011187-02 43 AVG Other 152 2011187-03 88 STDEV 173 2011187-04 18 n= 15 2011187-05 13
AVG Trawl 22 STDEV 162
n= 19
The normal alkane profile of these ldquosinkingrdquo tarballs was significantly different from other MC252 oil tarballs This profile (Figure 18a) appeared to be unique to tarballs collected at ocean depth and was similar to the normal alkane profile of the simulated distillation (SIMDIS) of MC252 oil at 205degC (Figure 18b) The SIMDIS and shrimp trawl tarballs exhibited evidence of thermal combustion that was absent in the normal alkane profiles of the in-situ burn oil residues collected after burning (refer back to Figure 13) The SIMDIS procedure separates oil into various fractions depending on molecular weight and associated boiling points The shrimp trawl sample appears to have undergone a similar process thus resulting in an alkane profile similar to the SIMDIS of MC252 oil Therefore it is believed that the shrimp trawl tarballs are the result of more efficient in-situ burns relative to other field burn residues The shape of the in situ burn tarball profile was very different from tarballs not associated with burning (ie weathered residues Figure 18c) but still considered to be a match to MC252 oil Figure 18d is the normal alkane profile of microbially-weathered MC252 oil This profile demonstrates that residues from in situ burning were not subjected to the typical weathering processes other oil residues reflect
31
(a)
(d)
(b)
(c)
Figures 18 a-d Normal alkane distribution depicting the similarity of a suspected ISB tarball (a) collected in a royal red shrimp trawl and the simulated distillation of MC252 oil at 205degC (b) The alkane distributions in (c) MC252 tarball not associated with in-situ burning and (d) microbially-weathered MC252 oil are dissimilar to (a) and (b) even though all four profiles are MC252 oil
32
The average FFPI of the shrimp trawl samples was 062plusmn006 indicating a pyrogenic composition The average FFPI of the shrimp trawl samples is significantly different from other MC252 tarballs (p=0001 Student two-tailed t-test with the assumption of equal variance) The average Wang Pyrogenic Index of the shrimp trawl samples was 006plusmn002 also indicating a more pyrogenic composition The average Wang Pyrogenic Index is also significantly different from other MC252 tarballs (p=001 Student two-tailed t-test with the assumption of equal variance) Figure 19 is a graphical depiction of the Wang Pyrogenic Index According to Wang et al (1999) lighter petroleum products and most crude oils fall into the range of 000-001 The majority of the samples plotted in the figure have an index greater than 001 and are in the range of what Wang et al would consider to be heavy oilsfuels and tarballs
0
50
100
150
200
250
300
350
000 002 004 006 008 010 012 014
Ph
en
A
nth
Wang Pyrogenic Index
Shrimp Trawl Tarballs
Other Tarballs Suspected ISB Tarballs
Figure 19 Plot of the Wang pyrogenic index over the ratio of phenanthreneanthracene for shrimp trawl tarballs suspected to be sinking MC252 residues from in situ burning
All 26 shrimp trawl tarballs were a match (scored 15 out of 15 or 100) to MC252 oil based on the diagnostic biomarker ratio analyses Figure 20 displays a comparison of the diagnostic ratio results of the shrimp trawl samples MC252 source oil and EPA South Louisiana Crude (SLC) oil standard The EPA-SLC standard scored 8 out of 15 or 53 and would be considered a non-match Table 10 provides the values that are plotted in Figure 20 The ability to discriminate between two SLC oils is a demonstration to the utility of the diagnostic ratio analyses employed for this study Detailed descriptions of the biomarker abbreviations are given in Appendix 1
33
000
050
100
150
200
250
300
350
400R
atio
Val
ueHopane Diagnostic Ratios (mz 191)
000
020
040
060
080
100
120
140
160
180
200
C27D-SC27D-R C29D-SC29D-R C28 aaa-RC29 aaa-R
Ratio
Val
ue
Diasteranes and Regular Steranes (mz 217)
000
010
020
030
040
050
060
070
080
C27 BBC28 BB+C29 BB C28 BBC27 BB+C29 BB C29 BBC27 BB+C28 BB
Ratio
Val
ue
14β(H) Steranes (mz 218)
000
020
040
060
080
100
120
140
160
C20 TAC21 TA C26 TA-SC28 TA-S C27 TA-RC28 TA-R
Ratio
Val
ue
Triaromatic Steriods (mz 231)
MC 252 Avg Ratio Shrimp Trawl Avg Ratio EPA SLC Avg Ratio
Figure 20 Graphical depiction of diagnostic ratio testing of shrimp trawl samples compared to MC252 source oil and EPA South Louisiana Crude Oil standard Error bars represent 5 error margin
34
Table 10 Diagnostic Biomarker Ratio Analysis Results for Shrimp Trawl Samples
Shrimp EPA SLC MC252 Ratio
Trawl Ratios Ratio (n=32)
(n=5) (n=4)
Hopanes (mz 191) AVG AVG AVG
C27-TsC27-Tm 127 126 077
C29-aBC29-Ts 217 217 362
C29-aBC30-aB 048 048 071
C31-aBC32-aB+C33-aB 093 093 134
C32-aBC31-aB+C33-aB 043 043 038
C33-aBC31-aB+C32-aB 028 028 018
Diasteranes and Regular 14a(H)-Steranes (mz 217) AVG AVG AVG
C27D-SC27D-R 161 161 175
C29D-SC29D-R 163 163 167
C28 aaa-RC29 aaa-R 074 074 080
14B(H)-Steranes (mz 218) AVG AVG AVG
C27 BBC28 BB+C29 BB 069 069 062
C28 BBC27 BB+C29 BB 038 038 040
C29 BBC27 BB+C28 BB 046 046 050
Triaromatic Steriods (mz 231) AVG AVG AVG
C20 TAC21 TA 107 107 140
C26 TA-SC28 TA-S 062 063 073
C27 TA-RC28 TA-R 092 092 099
Indicates EPA SLC ratios that are statistically different according to Hansen et al (2007) and Meyer et al (2014)
Task 4 Burning of surface collected Macondo Well source oil and emulsified source oil under controlled laboratory conditions
An initial controlled burn of MC252 oil was performed at LSU on 6 March 2012 Around 5g of MC252 oil was placed in a crucible and burned with a propane torch for ~4-5 minutes The experiment was conducted in triplicate under a laboratory ventilation hood There was not sufficient residue generated by this method to perform both physical and chemical characterization so only chemical characterization was completed Since this burn was performed on a reduced scale plans were made to conduct a second larger-scale burn using an increased volume of oil floated on artificial seawater
The second larger scale burn was conducted on 20 February 2014 at the LSU Environmental Health and Safety facility on the Baton Rouge campus This burn used 500mL of fresh and 15 weathered surrogate south Louisiana crude oil obtained from BP floated on artificial seawater (avg salinity of 34amp) in stainless steel containers Emulsified MC252 oil was also burned in the same manner in this experiment Each set of burns was performed in triplicate and burn durations were ~5-10 minutes Figure 21a-f shows the sequence of the burning process After the burns were completed the stainless steel containers were allowed to cool and were then transported back to the lab where the residues were sampled for both physical and chemical analyses
35
(a) (b)
(c)
(e)
(d)
(f)
Figures 21a-f Images from the larger-scale burn at LSU in 2014 (a) pans with South Louisiana crude floated on seawater (b) ignition procedure (c-e) sequence of mid-burn photos (f) extinguishment
Task 5 Physical and chemical characterization of burn residue resulting from Task 4
There was not enough material to complete both the physical and chemical characterization of the initial smaller-scale burn of MC252 oil in 2012 therefore only chemical characterization was completed for the triplicate burn samples Normal alkane chromatographic profiles (Figure 22) of the replicates from the smaller-scale controlled burn of MC252 oil exhibited similar chemical characteristics as the in-situ burn samples collected during the response to the Deepwater Horizon
36
oil spill and also resemble the normal alkane chromatographic profile of the shrimp trawl tarball in Figure 18a For the ldquoafterrdquo samples the modified FFPI was 054plusmn002 and the modified Wang Pyrogenic Index was 013plusmn002 Significant enhancement in the same pyrogenic PAHs as described earlier for Task 2 was also observed and the total target PAHs were reduced from 12000 mgkg in fresh MC252 oil to an average of 1200 mgkg in the burn residues (a 90 reduction) The PAH profiles for the before and after MC252 from this small-scale burn are shown in Figure 22 along with the PAH profiles from the larger-scale burns
1 0 0 0 1 5 0 0 2 0 0 0 2 5 0 0 3 0 0 0 3 5 0 0 4 0 0 0 4 5 0 0 5 0 0 0 5 5 0 0 6 0 0 0
0
2 0 0 0
4 0 0 0
6 0 0 0
8 0 0 0
1 0 0 0 0
1 2 0 0 0
1 4 0 0 0
1 6 0 0 0
1 8 0 0 0
2 0 0 0 0
2 2 0 0 0
2 4 0 0 0
2 6 0 0 0
2 8 0 0 0
T i m e - - gt
A b u n d a n c e
I o n 5 7 0 0 ( 5 6 7 0 t o 5 7 7 0 ) G T 1 2 0 6 4 I D d a t a m s
1 0 0 0 1 5 0 0 2 0 0 0 2 5 0 0 3 0 0 0 3 5 0 0 4 0 0 0 4 5 0 0 5 0 0 0 5 5 0 0 6 0 0 0
0
2 0 0 0
4 0 0 0
6 0 0 0
8 0 0 0
1 0 0 0 0
1 2 0 0 0
1 4 0 0 0
1 6 0 0 0
1 8 0 0 0
2 0 0 0 0
2 2 0 0 0
2 4 0 0 0
2 6 0 0 0
T i m e - - gt
A b u n d a n c e
I o n 5 7 0 0 ( 5 6 7 0 t o 5 7 7 0 ) G T 1 2 0 6 4 J D d a t a m s
1 0 0 0 1 5 0 0 2 0 0 0 2 5 0 0 3 0 0 0 3 5 0 0 4 0 0 0 4 5 0 0 5 0 0 0 5 5 0 0 6 0 0 0
0
5 0 0 0
1 0 0 0 0
1 5 0 0 0
2 0 0 0 0
2 5 0 0 0
3 0 0 0 0
3 5 0 0 0
4 0 0 0 0
4 5 0 0 0
5 0 0 0 0
5 5 0 0 0
6 0 0 0 0
T i m e - - gt
A b u n d a n c e
I o n 5 7 0 0 ( 5 6 7 0 t o 5 7 7 0 ) G T 1 2 0 6 4 K D d a t a m s
Figure 22 Normal alkane profiles (mz 57) for three replicate samples from a small-scale lab burn of MC252 oil
Results of the second larger-scale burn of surrogate south Louisiana crude oil were quite different from the actual in-situ burn samples previously characterized in Task 2 and from the small-scale burn of MC252 There were no significant changes in density or percent asphaltenes There was no enhancement of the pyrogenic PAHs observed in the actual ISB samples and the smaller scale controlled burn Only the modified FFPI showed a significant (p=lt0001) change The average FFPI
37
before burning was 079plusmn006 and the average FFPI after burning was 070plusmn002 Table 11 summarizes the results of the larger-scale controlled burn described above
Table 11 Summary of Chemical Characteristics from Larger-Scale Controlled Burn
15 Weathered Fresh Surrogate Oil Surrogate Oil Emulsified MC252 Oil
(by weight)
Before After Before After Before After
Avg Total Aromatics 8100 3600plusmn310 9400 3400plusmn310 2700 2600plusmn270
(mgkg)
Avg Modified FFPI 083 069plusmn002 083 071plusmn001 073 071plusmn001
Avg Wang Pyrogenic Index 001 004plusmn001 001 004plusmn0004 001 001plusmn00003
Avg PhenAnth 453 133plusmn20 457 117plusmn12 123 674plusmn88
Avg FluorAntPyr 038 060plusmn006 035 080plusmn001 040 032plusmn002
n= 1 3 1 3 1
15 Weathered Surrogate Oil
Fresh Surrogate Oil (by weight) Emulsified MC252 Oil
Before After Before After Before After
Avg Density (n=3) 086plusmn0001 084plusmn005 090plusmn0002 094plusmn002 098plusmn0003 099plusmn001
Avg Asphaltenes (n) 10(1) 198plusmn067(3) 090(1) 198plusmn068(3) 171(1) 220plusmn034
Figure 23 is a graphical depiction of the Wang Pyrogenic Index ldquoBeforerdquo samples are clearly separated from most of the ldquoafterrdquo samples in the figure Fresh oil before and 15 weathered oil before are on top of each other in the plot (0006 45) According to Wang et al (1999) lighter petroleum products and most crude oils fall into the range of 000-001 which is supported in this instance The ldquoafterrdquo samples are characterized by an increase in the pyrogenic index along with a decrease in the phenanthreneanthracene ratio however the majority fall in the range of what Wang et al would consider to be heavy oilsfuels and tarballs There was very little change in the Wang Pyrogenic Index for the emulsified MC252 oil
0
20
40
60
80
100
120
140
0000 0005 0010 0015 0020 0025 0030 0035 0040 0045 0050
Ph
en
An
th
Wang Pyrogenic Index
Laboratory Controlled Burn
Before Burning After Burning Fresh After Burning 15 Weathered After Burning Emulsified
Figure 23 Plot of the Wang pyrogenic index over the ratio of phenanthreneanthracene for laboratory controlled burning of surrogate crude oil and emulsified MC252 oil
38
3
The difference in results may be due to the use of the surrogate south Louisiana crude oil instead of MC252 oil unfortunately this was the only option for burning a larger volume of oil under controlled conditions as availability of original MC252 riser oil is extremely limited Controlled in-situ burning decreased the average total target aromatics of the fresh surrogate oil by approximately 45 and the average total target aromatics of the 15 weathered surrogate oil by approximately 36 both of which are similar for the field in-situ burn samples
Emulsified MC252 oil collected during the Deepwater Horizon clean-up operations was also burned during this portion of the laboratory work The emulsified MC252 oil did not burn well and as a result reflected the least amount of change from before to after There were no significant changes in the emulsified MC252 oilrsquos total aromatics modified FFPI and there was no enhancement of the pyrogenic PAHs Figure 24 shows the PAH profiles for each oil type and post-burn residues tested in the larger-scale controlled burn
Hopane normalization (Aeppli et al 2014 Douglas et al 1996 Garrett et al 2000 Prince et al 1994) was applied to the Fresh and 15 Weathered surrogate South Louisiana Crude oil Using the hopane normalized concentrations the percent increase or decrease of each target analyte was calculated and are presented in Figure 25 An average 5-point response factor of 091 (R2=09912) was determined for 17β(H)21β(H)-30-hopane This response factor was then used to calculate the concentration of 17α(H)21β(H)-hopane The hopane normalization factor (HopaneOilHopaneWeathered) for the Fresh surrogate oil was 076 and 088 for the 15 Weathered surrogate oil The results of the hopane normalization of controlled laboratory burns confirms the enrichment of higher molecular weight analytes previously documented in Tasks 2 and 5 (small-scale burn of MC252 oil)
39
2000
Co
nc
(mg
k
g)
Co
nc
(mg
k
g)
1500
Before 1000
After
500
0
(d) Emulsified MC252 Oil 2014
350 300 250 200 150
Before 100 50 After
Co
nc
(mg
k
g)
Co
nc
(mg
k
g)
2000
1500
Before 1000
After
500
0
(b) Fresh Surrogate Oil 2014
1600
1400
1200
1000 Before
800 After
600
400
200
0
(c) 15 Weathered Surrogate Oil 2014
(a) MC252 Oil 2012
0
NA
PH
C1
-Nap
hs
C2
-Nap
hs
C3
-Nap
hs
C4
-Nap
hs
FL
UO
RC
1-F
luo
rsC
2-F
luo
rsC
3-
Flu
ors
DB
TC
1-D
BT
sC
2-D
BT
sC
3-
DB
Ts
PH
EN
C1
-Ph
ens
C2
-Ph
ens
C3
-Ph
ens
C4
-Ph
ens
AN
TH
FL
UO
RA
NT
PY
RC
1-
Py
rsC
2-
Py
rsC
3-
Py
rsC
4-
Py
rsN
BT
C-1
NB
Ts
C-2
NB
Ts
C-3
NB
Ts
B(a
)AN
TH
CH
RY
C1
-C
hry
sC
2-
Ch
rys
C3
-C
hry
sC
4-
Ch
rys
B(b
)FB
(k)F
B(e
)PB
(a)P
PE
RY
LIN
DP
YR
D(a
h)A
B(g
hi)
P
Figures 24a-d Before and after PAH profiles for controlled burns of four oil types in 2012 and 2014 (a) MC252 riser oil (b) fresh surrogate South Louisiana crude (c) weathered surrogate South Louisiana crude and (d) emulsified MC252
40
-150
-100
-50
0
50
100
150
200
250
300
350
NA
PH
C1-N
aphs
C2-N
aphs
C3-N
aphs
C4-N
aphs
FLU
OR
C1-F
luor
s
C2-F
luor
s
C3-F
luor
s
DB
T
C1-D
BTs
C2-D
BTs
C3-D
BTs
PHEN
C1-P
hens
C2-P
hens
C3-P
hens
C4-P
hens
AN
TH
FLU
OR
AN
T
PYR
C1-P
yrs
C2-P
yrs
C3-P
yrs
C4-P
yrs
NB
T
C-1
NB
Ts
C-2
NB
Ts
C-3
NB
Ts
B[a
]AN
TH
CHR
Y
C1-C
hrys
C2-C
hrys
C3-C
hrys
C4-C
hrys
B[b
]F
B[k
]F
B[e
]P
B[a
]P
PER
YL
D[a
h]A
B[g
hi]
P
IN
CREA
SE O
R D
ECR
EASE
(a) Fresh Surrogate Oil
-150
-50
50
150
250
350
450
NA
PH
C1-N
aphs
C2-N
aphs
C3-N
aphs
C4-N
aphs
FLU
OR
C1-F
luor
s
C2-F
luor
s
C3-F
luor
s
DB
T
C1-D
BTs
C2-D
BTs
C3-D
BTs
PHEN
C1-P
hens
C2-P
hens
C3-P
hens
C4-P
hens
AN
TH
FLU
OR
AN
T
PYR
C1-P
yrs
C2-P
yrs
C3-P
yrs
C4-P
yrs
NB
T
C-1
NB
Ts
C-2
NB
Ts
C-3
NB
Ts
B[a
]AN
TH
CHR
Y
C1-C
hrys
C2-C
hrys
C3-C
hrys
C4-C
hrys
B[b
]F
B[k
]F
B[e
]P
B[a
]P
PER
YL
D[a
h]A
B[g
hi]
P
IN
CREA
SE O
R D
ECR
EASE
(b) 15 Weathered Surrogate Oil
Figure 25 Determination of percent increase or decrease of target analytes based on hopane normalization for (a) Fresh surrogate oil and (b) 15 Weathered surrogate oil
41
Task 6 Forensic interpretation of analytical results to characterize physical and chemical changes occurring during the combustion of oil to include comparison of changes occurring in various weathered oil samples and identification of potential markers for in-situ burn residues
A primary objective of the forensic interpretation of analytical results was to determine if residues from in-situ burning during the Deepwater Horizon response had measurable characteristics that could distinguish them from other MC252 residues Results from the other tasks previously discussed indicated that these characteristics included bull Significant increase in density and percent asphaltenes bull Enhancement of pyrogenic PAHs bull Decrease in the FFPI Increase in the Wang Pyrogenic Index and bull Evidence of thermal combustion in the normal alkane profile
However it appears that all of these discriminating factors must be present to make the distinction between sources with any confidence Because of this limitation the forensic interpretation was expanded to include a statistical analysis of sample matrices and sampling locations based on the diagnostic biomarker ratio analyses
A total of 130 suspected MC252 residues was initially chosen All samples were grouped according to year sample matrix (eg ISB oil ISB tarball oil other sediment or tarball) and sampling location (eg marsh ocean depth shore or water surface) These samples were then narrowed to a total of 112 by the diagnostic ratio analyses Only samples determined to be a statistical match to MC252 oil were used in the matrix and sampling location comparisons A one-way ANOVA with a post-hoc Tukey-Kramer pairwise comparison Table 12 was applied to the sample matrix analysis for each of the 15 diagnostic ratios to determine if any of the ratios could distinguish between in-situ burn residues and other MC252 oil residues The Tukey-Kramer comparison separates samples into lettered groups based on the minimum significant difference between means (p=005) Groups with the same letter have means that are not significantly different from each other and groups with differing letters are significantly different from each other For the sample location effects a nested ANOVA with random effects and a variance components covariance structure was carried out for each diagnostic ratio to determine if there were any differences due to location of sample collection In both cases the sample number in each matrix or location was highly unbalanced
A total of 7 out of 15 diagnostic ratios had significant differences between sample matrices Of these 7 ratios 4 showed significant differences between in-situ burn residues and other MC252 oil residues
bull The hopane ratio C31 aB (S+R)C32 aB (S+R) + C33 aB (S+R) was significantly different for ISB oil and ISB tarball Both of the in-situ burn residues were significantly different from all other matrices except the tarball matrix
bull Another hopane ratio C33 aB (S+R)C31 aB (S+R) + C32 aB (S+R) for ISB tarball was significantly different from all other matrices and ISB oil was significantly different from all other matrices except tarball and oil
bull The diasterane and regular sterane ratio C28 aaa-RC29 aaa-R was significantly different when comparing ISB oil and oil residues
42
bull The last significant ratio was C27 BB (S+R)C28 BB (S+R) + C29 BB (S+R) (in the 14(β)H-steranes group) This ratio was significantly different when comparing ISB tarballs to other tarballs
Table 12 Tukey-Kramer Pairwise Comparisons of Diagnostic Ratios for Different Matrices
C31 aB (S+R)C32 aB (S+R) + C33 aB (S+R) C28 aaa-RC29 aaa-R
Matrix Mean SE Group Matrix Mean SE Group
Sediment 10533 183E-02 A Oil 07825 943E-03 A
Other 09933 183E-02 AB Other 07767 267E-02 AB
Oil 09575 648E-03 BC Tarball 07592 740E-03 AB
ISBTarball 09451 508E-03 BCD 07477 906E-03 AB
Tarball
ISB Oil 09309 662E-03 CD Sediment 07400 267E-02 AB
ISB 09300 622E-03 D ISB Oil 07361 963E-03 B
Tarball
C33 aB (S+R)C31 aB (S+R) + C32 aB (S+R) C27 BB (S+R)C28 BB (S+R) + C29 BB (S+R)
Matrix Mean SE Group Matrix Mean SE Group
ISB Tarball
02788 290E-03 A Other 07550 345E-02 AB
ISB Oil 02743 309E-03 AB Tarball 07500 824E-03 A
Tarball 02667 237E-03 BC Oil 07340 218E-01 AB
Oil 02646 302E-03 BCD ISB Tarball
07006 115E-01 B
Other 02467 855E-03 CD Sediment 07000 282E-01 AB
Sediment 02400 855E-03 D ISB Oil 06900 218E-02 AB
Therefore C28 aaa-RC29 aaa-R may be useful for distinguishing ISB oil from other oil residues and C27 BB (S+R)C28 BB (S+R) + C29 BB (S+R) may be useful distinguishing ISB tarballs from other tarballs
A total of 5 out of 15 diagnostic ratios showed significant differences between sample matrix and sampling location The statistical analysis did not determine which matrix by sampling location was significant it was performed to determine if sampling location was a factor in distinguishing some of these oil residues Sampling location can have an important role because this often governs how oil residues weather Therefore this analysis supported the notion that oil residues from the same type of oil may show different characteristics determined by differences in weathering in various sampling locations without compromising the ability to make statistical matchnon-match determinations with the same ratios
43
SUMMARY AND CONCLUSIONS
A primary objective of this study was to identify possible indicators that could distinguish in-situ burn residues from other oil residues based on physical and chemical analyses of actual Deepwater Horizon in-situ burn samples Unfortunately while there is no single reliable indicator of in-situ burning partial indicators (eg different normal alkane profile enhancement of pyrogenic PAHs and reduction in the modified Fossil Fuel Pollution Index) when considered as an integrated whole can point to in-situ burning as a significant driver of weathering and fate Table 3 shows some of the characteristics assessed in this study Notable in these results is the enhancement in asphaltenes content for known burn residues and the tarballs recovered from deep water shrimp trawls
Table 13 Comparison of Physical and Chemical Characteristics for Different Oil Matrices
MC252 SLC Pre- SLC Post- ISB Oil ISB Oil Shrimp Other MC252 Riser Burn Burn Pre-Burn Post-Burn Tarballs Tarballs
Density gmL 084 086 084 088 096 104 086
Asphaltene 09-10 10 198 15 42 22 15
FFPI 083 079 070 077 065 062 059 Wang Pyrogenic
0004 001 004 001 007 006 004 Index
Even the use of a series of partial indicators must be employed cautiously comparison of the normal alkane profile for example has the caveat that the same profile was not observed in oil residues collected immediately after in-situ burning The distinctive profile appeared only in tarballs that had been recovered from trawls two hundred meters below the ocean surface The asphaltenes content of the shrimp trawl tarballs was significantly higher than all the other samples which indicates that asphaltenes content positively correlated with the tendency of those oil residues to sink Density was a factor but does not appear to be as critical as the percent asphaltenes with respect to sinking tarballs
The majority of residues from the Deepwater Horizon oil spill retained their oil biomarker signatures making diagnostic ratio analyses possible The diagnostic ratios were used to
1) Determine if the oil residue was a match to MC252 oil and 2) Determine if there were any differences in the ratios in matching oil residues based on
sample matrix and sampling location
A total of 4 out of the 15 diagnostic biomarker ratios did distinguish in-situ burn residues from the majority of the other residues Two of these ratios C28 aaa-RC29 aaa-R and C27 BB (S+R)C28 BB (S+R) + C29 BB (S+R) may be useful for distinguishing ISB oil from other oil residues and ISB tarballs from other tarballs respectively Significant differences were also determined in the comparison of sampling locations These differences suggest that weathering of oil residues from the same initial source is highly dependent on the specific environmental compartment in which they reside without compromising the ability to make matchnon-match determinations with the same ratios
44
The in-situ burning research described in this report combined retrospective analysis of samples collected during the Deepwater Horizon response with new laboratory work and interpretation to increase the relevance and applicability of the physical and chemical results The methodological refinements improved our abilities to distinguish burn products from other weathered oil matrices and helped to confirm the generalized source attributions to burn operations that were made shortly after tarballs were encountered in the Gulf of Mexico royal red shrimp fishery It is important to note that the chemical characterization method (GC-MS) and target analyte list used for this report only examines about 5 of the oil mass Other analytical methods such as GCxGC-FID (Aeppli et al 2014) or APPI FT-ICR MS have become standard instrument systems for analyzing crude oil Both have advantages over GC-MS in that they can separate and identify a much larger percentage of oil compounds however it cannot be denied that GC-MS is still relevant and is one of the most recognized instrument systems for characterizing crude oil in the environment
The Deepwater Horizon spill experience validated the operational feasibility and practical application of in-situ burning as an open water response method Like nearly everything else about this incident the scale of in-situ burn operations was unprecedented between 28 April and 19 July 2010 over 400 individual burns took place consuming an estimated 220000-310000 bbl of oil This is roughly equivalent to the total volume for the Exxon Valdez oil spill in 1989
Implicit in these numbers is the large volume of in-situ burn residue that was generated during the Deepwater Horizon operations Using the standard in-situ burn efficiency estimates of 90-95 percent the amount of residue resulting from the operations potentially ranged from 11000shy33000 bbl This is a substantial amount of petroleum hydrocarbons introduced into a relatively small portion of the marine environmentmdashalthough it should be noted that natural seeps contribute an estimated 560000 to 14 million bbl of oil into the waters of the Gulf of Mexico (National Research Council 2003) each year (note seep locations in Figure 26)
The fate of the burn residue from the Deepwater Horizon in-situ burn operations might never have been known were it not for the chance encounters of the single deep water fishery operating in the same general area as most of the burn operations (Figure 26) Impacts to the fishery were minimal and it was quickly re-opened after testing and analysis by federal fisheries managers and seafood safety specialists However the residue and fishery interactions that occurred in 2010 and 2011 represent a cautionary footnote to large-scale in-situ burn operations that should be factored into tradeoff analysis for future spill responses Further the Deepwater Horizon experience suggests a need for additional research into burn residue containment or recovery methods that would reduce or eliminate potential fishery impacts associated with sinking residue
On a final note we recommend that the Environmental Unit for a spill response where burn operations are regularly taking place should collaborate with the Operations Section to collect analyze and archive paired samples of pre- and post-burn oil to facilitate the process of source identification of oil residues encountered during a response In doing so a solid empirical database of physical and chemical characteristics would be built over time to permit a better understanding of the changes occurring to oil during in-situ burning the circumstances in which residues will floatsink and the specific markers and physical features that might be used to uniquely identify burn residues
45
Figure 26 Composite map showing locations of the Macondo wellhead in-situ burn operations royal red shrimp trawls with preliminary source identifications and known hydrocarbon seeps Numbers in boxes denote approximate tarball counts in each quadrant Prepared by JB Huyett Genwest Systems
46
REFERENCES
Aeppli C RK Nelson JR Radović CA Carmichael DL Valentine and CM Reddy 2014 Recalcitrance and degradation of petroleum biomarkers upon abiotic and biotic natural weathering of Deepwater Horizon oil Environmental Science and Technology 486726-6734
Allen AA NJ Mabile D Jaeger and D Costanzo 2011 The use of controlled burning during the Gulf of Mexico Deepwater Horizon MC-252 oil spill response In Proceedings of the 2011 International Oil Spill Conference 23-26 May 2011 Portland OR 13 pp
httpdxdoiorg1079012169-3358-2011-1-194
American Society for Testing Materials D71-94(2009) Standard test method for relative density of solid pitch and asphalt (displacement method) ASTM International West Conshohocken PA 2012
American Society for Testing Materials D3279-12 Standard test method for n-heptane insoluble ASTM International West Conshohocken PA 2012
Anderson WW and MJ Lindner 1971 Contributions to the biology of the royal red shrimp Hymenopenaeus robustus Smith Fishery Bulletin 69(2)313-336
Boehm PD and JW Farrington 1984 Aspects of the polycyclic aromatic hydrocarbon geochemistry of recent sediments in the Georges Bank Region Environmental Science and Technology 18(11)840-845
Bullis HR Jr 1956 Preliminary results of deep-water exploration for shrimp in the Gulf of Mexico by the MV Oregon (1950-1956) Commer Fish Rev 18(12)1-12
Buist I 1998 Window of opportunity for in situ burning In Proceddings of the In Situ Burning of Oil Spills Workshop US Minerals Management Service Special Publication 935 21-30
Buist I and K Trudel 1995 Laboratory studies of the properties of in-situ burn residues Marine Spill Response Corporation Washington DC MSRC Technical Report Series 95-010 110 p
Buist I K Trudel J Morrison and D Aurand 1995 Laboratory studies of the physical properties of in-situ burn residues In Proceedings of the Eighteenth Arctic and Marine Oilspill Program (AMOP) June 14-16 1995 Edmonton Alberta 1027-1051
Buist I K Trudel J Morrison and D Aurand 1997 Laboratory studies of the properties of in-situ burn residues In Proceedings of the 1997 International Oil Spill Conference April 1997 1997(1)149-156
Cascorbi A 2007 Wild-caught warmwater shrimp (Infraorder Penaeus--the Penaeid shrimps) Gulf of Mexico and US South Atlantic Regions Seafood Watch Seafood Report Monterey Bay Aquarium 52 pp
Douglas GS AE Bence RC Prince SJ McMillen and EL Butler 1996 Environmental stability of selected petroleum hydrocarbon source and weathering ratios Environmental Science and Technology 30(7)2332-2339
47
Farfante IP 1988 Illustrated key to Penaeoid shrimps of commerce in the Americas NOAA Technical Report NMFS 64 April 1988 32 pp
Federal Interagency Solutions Group Oil Budget Calculator Science and Engineering Team 2010 Oil Budget Calculator Deepwater Horizon Technical Documentation A Report to the National Incident Command November 2010 49 pp + appendices
Fingas MF G Halley F Ackerman N Vanderkooy R Nelson MC Bissonnette N Laroche P Lambert P Jokuty K Li W Halley G Warbanski PR Campagna RD Turpin MJ Trespalacios D Dickins EJ Tennyson D Aurand and R Hiltabrand 1994a The Newfoundland Offshore Burn Experiment ndash NOBE experimental design and overview In Proceedings of the Seventeenth Arctic and Marine Oilspill Program (AMOP) June 8-10 1994 Vancouver British Columbia 1053-1063
Fingas MF F Ackerman K Li P Lambert Z Wang MC Bissonnette PR Campagna P Boileau N Laroche P Jokuty R Nelson RD Turpin MJ Trespalacios G Halley J Belanger J Pareacute N Vanderkooy EJ Tennyson D Aurand and R Hiltabrand 1994b The Newfoundland Offshore Burn Experiment ndash NOBE preliminary results of emissions measurement In Proceedings of the Seventeenth Arctic and Marine Oilspill Program (AMOP) June 8-10 1994 Vancouver British Columbia 1099-1164
Fingas M 2011 An overview of in-situ burning Chapter 23 in M Fingas (ed) Oil Spill Science and Technology New York Gulf Professional PublishingElsevier 737-903
Fingas M 2015 Introduction to Oil Chemistry and Properties In Handbook of Oil Spill Science and Technology M Fingas Ed Hoboken NJ John Wiley amp Sons Inc
Garrett RM CC Gueacutenette CE Haith and RC Prince 2000 Pyrogenic polycyclic aromatic hydrocarbons in oil burn residues Environmental Science and Technology 34(10)1934-1937
Gulf of Mexico Fishery Management Council 2004 Appendix C Information on Species Distributions and Habitat Associations Final Environmental Impact Statement for the Generic Essential Fish Habitat Amendment to the following fishery management plans of the Gulf of Mexico (GOM) shrimp fishery of the Gulf of Mexico red drum fishery of the Gulf of Mexico reef fish fishery of the Gulf of Mexico stone crab fishery of the Gulf of Mexico coral and coral reef fishery of the Gulf of Mexico spiny lobster fishery of the Gulf of Mexico and South Atlantic coastal migratory pelagic resources of the Gulf of Mexico and South Atlantic 262 pp
Gulf of Mexico Fishery Management Council 2005 Final Amendment Number 13 to the Fishery Management Plan for the Shrimp Fishery of the Gulf of Mexico US Waters with Environmental Assessment Regulatory Impact Review and Regulatory Flexibility Act analysis August 24 2005 272 pp
Hansen AB PS Daling LG Faksness KR Sorheim P Kienhuis and R Duus 2007 Emerging CEN Methodology for Oil Spill Identification In Oil Spill Environmental Forensics Z Wang and SA Stout Eds Boston MA Elsevier
Jaeger A 2011 Personal communication 27 September 2011
Kucklick JH and D Aurand 1997 Historical dispersant and in-situ burning opportunities in the
48
United States Proc 1997 International Oil Spill Conference 805 ndash 810
Leahy JG and RR Colwell 1990 Microbial degradation of hydrocarbons in the environment Microbiological Reviews 54305-315
Lewan MD A Warden RF Dias ZK Lowry TL Hannah PG Lillis RF Kokaly TM Hoefen GA Swayze CT Mills SH Harris GS Plumlee 2014 Organic Geochemistry 75(2014)54-60
Meyer BM EB Overton and RE Turner 2014 Oil source identification using diagnostic biomarker ratio analyses In 2014 International Oil Spill Conference Proceedings Savannah GA May 5-9 2014(1)2064-2073
Michel J D Scholz SR Warren Jr and AH Walker 2005 In-situ burning A decision-makerrsquos guide to in-situ burning API Publication Number 4740 Washington DC American Petroleum Institute 60 pp
Mills MA TJ McDonald JS Bonner MA Simon and RL Autenrieth 1999 Method for quantifying the fate of petroleum in the environment Chemosphere 39(14)2563-2582
Mullin JV and MA Champ 2003 Introductionoverview to in situ burning of oil spills Spill Science amp Technology 8(4)323-330
National Research Council Committee on Oil in the Sea 2003 Oil in the Sea III Inputs Fates and Effects National Research Council Ocean Studies Board and Marine Board Divisions of Earth and Life Studies and Transportation Research Board Washington DC National Academy Press 265 pp
Operational Science Advisory Team-2 2011 Net Environmental Benefits Analysis (NEBA) Annex M to Summary Report for Fate and Effects of Remnant Oil in the Beach Environment prepared for Lincoln D Stroh US Coast Guard Federal On-Scene Coordinator 48 pp
Overton EB WD Sharp and P Roberts 1994 Toxicity of Petroleum In Basic Environmental Toxicology LG Cockerham and BS Shane Eds Boca Raton FL CRC Press Inc
Prince RC DL Elmendorf JR Lute CS Hsu CE Haith JD Senius GJ Dechert GS Douglas and EL Butler 1994 17α(H)21β(H)-hopane as a conserved internal marker for estimating the biodegradation of crude oil Environmental Science and Technology 28(1)142-145
SL Ross Environmental Research Ltd 2010 Spill Related Properties of MC252 Crude Oil Sample ENT-052210-178 Appendix 8 to Oil Budget Calculator Deepwater Horizon Technical Documentation A Report to the National Incident Command November 2010 7 pp
Stiles ML E Harrould-Kolieb P Faure H Ylitalo-Ward and MF Hirshfield 2007 Deep sea trawl fisheries of the Southeast US and Gulf of Mexico rock shrimp royal red shrimp calico scallops Report for Oceana May 2007 18 pp
US Coast Guard 2011 BP Deepwater Horizon Oil Spill Incident Specific Preparedness Review (ISPR) Final Report Report prepared for ADM RJ Papp Commandant January 2011 158 pp
Wang Z M Fingas YY Shu L Sigouin M Landriault P Lambert R Turpin P Campagna and J
49
Mullin 1999 Quantitative characterization of PAHs in burn residue and soot samples and differentiation of pyrogenic PAHs from petrogenic PAHsmdashthe 1994 Mobile burn study Environ Sci Technol 33(18)3100-3109
Zack S 2007 Royal red shrimp Stoningtonrsquos succulent secret Connecticut Sea GrantWrack Lines 72 FallWinter 2007 6 pp
ACKNOWLEDGMENTS
Funding for this project was provided by the US Department of the Interior Bureau of Safety and Environmental Enforcement (BSEE) under Interagency Agreement E13PG00001 We thank the outside peer reviewers recruited by BSEE for their constructive comments and criticism and for improving the clarity of the project report The authors wish to acknowledge the assistance and support of Alan A Allen of Spiltec and Nere Mabile of BP during the Deepwater Horizon response in Houma LA CPO RJ Schrader of the US Coast Guard shared his expertise experiences and photographs from the field implementation of in-situ burn operations during the spill The data analysis for this report was generated using SAS software Version 93 of the SAS System for Windows Copyright copy 2002-2010 by SAS Institute Inc SAS and all other SAS Institute Inc product or service names are registered trademarks or trademarks of SAS Institute Inc Cary NC USA
DISCLAIMER
Reference to specific commercial products process or service by trade name trademark manufacturer or otherwise does not constitute or imply their endorsement recommendation or favoring by the United States Government The views and opinions of authors expressed do not necessarily state or reflect those of the United States Government and shall not be used for advertising or product endorsement purposes
50
APPENDIX 1
DIAGNOSTIC BIOMARKER RATIOS
Petroleum Biomarkers Used For Calculating MC252 Diagnostic Ratios
Abbreviation Compound Name mz Value
C27 18α(H)-222930-trisnorneohopane 191C27 Ts C27 Tm C27 17α(H)-222930-trisnorhopane 191 C29 aB C29 17α(H)21β(H)-30-norhopane 191 C29 Ts C29 18α(H)-30-norneohopane 191 C30 aB C30 17α(H)21β(H)-hopane 191 C31 aB (S+R) C31 17α(H)21β(H)-22(S+R)-homohopane 191 C32 aB (S+R) C32 17α(H)21β(H)-22(S+R)-bishomohopane 191 C33 aB (S+R) C32 17α(H)21β(H)-22(S+R)-trishomohopane 191 C27D Ba-S C27 13β(H)17α(H)20S-diasterane 217 C27D Ba-R C27 13β(H)17α(H)20R-diasterane 217 C29D Ba-S C29 24-ethyl-13β(H)17α(H)20S-diacholestane 217 C29D Ba-R C29 24-ethyl-13β(H)17α(H)20R-diacholestane 217 C28 aaa-R C28 24-methyl-5α(H)14α(H)17α(H) 20R-cholestane 217 C29 aaa-R C29 24-ethyl-5α(H)14α(H)17α(H) 20R-cholestane 217 C27 BB (R+S) C27 5α(H)14β(H)17β(H)-cholestane (20R+20S) 218 C28 BB (R+S) C28 24-methyl-5α(H)14β(H)17β(H)-cholestane (20R+20S) 218 C29 BB (R+S) C29 24-ethyl-5α(H)14β(H)17β(H)-cholestane (20R+20S) 218 C20 TA C20-triaromatic steroid (pregnane derivative) 231 C21 TA C21-triaromatic steroid (homopregnane derivative) 231 C26 TA-S C26-triaromatic steroid20S (cholestane derivative) 231 C28 TA-S C28-triaromatic steroid20S (ethylcholestane derivative) 231 C27 TA-R C27-triaromatic steroid20R (methylcholestane derivative) 231 C28 TA-R C28-triaromatic steroid20R (ethylcholestane derivative) 231
52
Diagnostic Ratios Chosen for MC252 Source Oil
Ratio mz
Value
C27 Ts C27 Tm 191
C29 aBC29 Ts 191
C29 aBC30 aB 191
C31 aB(S+R)C32 aB(S+R) + C33 aB(S+R) 191
C32 aB(S+R)C31 aB(S+R) + C33 aB(S+R) 191
C33 aB(S+R)C31 aB(S+R) + C32 aB(S+R) 191
C27D Ba-SC27D Ba-R 217
C29D Ba-SC29D Ba-R 217
C28 aaa-RC29 aaa-R 217
C27 BB(R+S)C28 BB(R+S) + C29 BB(R+S) 218
C28 BB(R+S)C27 BB(R+S) + C29 BB(R+S) 218
C29 BB(R+S)C27 BB(R+S) + C28 BB(R+S) 218
C20 TAC21 TA 231
C26 TA-SC28 TA-S 231
C27 TA-RC28 TA-R 231
53
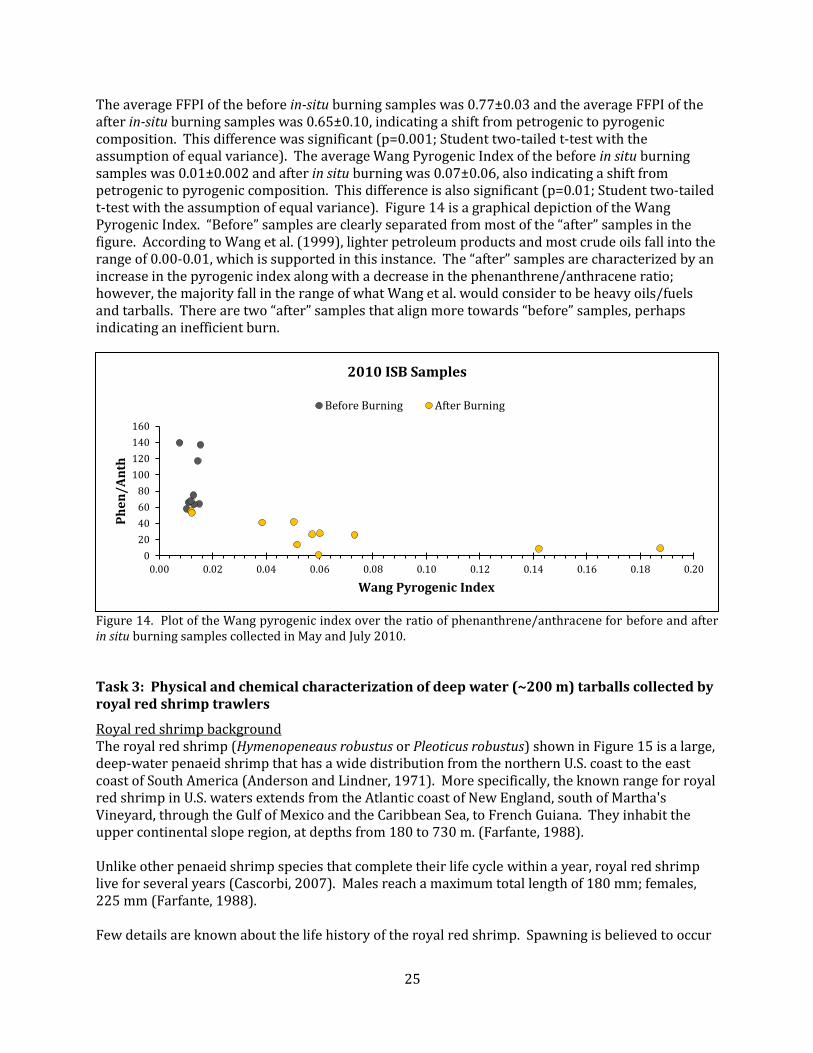
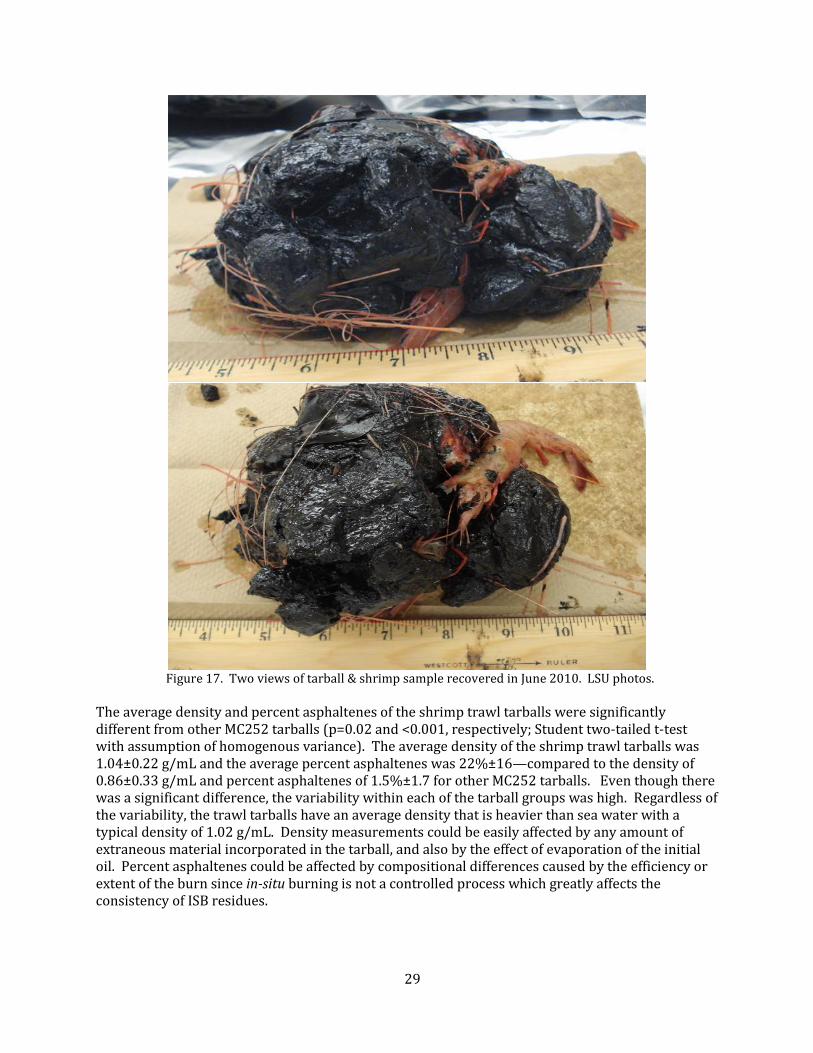

000
050
100
150
200
250
300
350
400R
atio
Val
ueHopane Diagnostic Ratios (mz 191)
000
020
040
060
080
100
120
140
160
180
200
C27D-SC27D-R C29D-SC29D-R C28 aaa-RC29 aaa-R
Ratio
Val
ue
Diasteranes and Regular Steranes (mz 217)
000
010
020
030
040
050
060
070
080
C27 BBC28 BB+C29 BB C28 BBC27 BB+C29 BB C29 BBC27 BB+C28 BB
Ratio
Val
ue
14β(H) Steranes (mz 218)
000
020
040
060
080
100
120
140
160
C20 TAC21 TA C26 TA-SC28 TA-S C27 TA-RC28 TA-R
Ratio
Val
ue
Triaromatic Steriods (mz 231)
MC 252 Avg Ratio Shrimp Trawl Avg Ratio EPA SLC Avg Ratio
Figure 20 Graphical depiction of diagnostic ratio testing of shrimp trawl samples compared to MC252 source oil and EPA South Louisiana Crude Oil standard Error bars represent 5 error margin
34
Table 10 Diagnostic Biomarker Ratio Analysis Results for Shrimp Trawl Samples
Shrimp EPA SLC MC252 Ratio
Trawl Ratios Ratio (n=32)
(n=5) (n=4)
Hopanes (mz 191) AVG AVG AVG
C27-TsC27-Tm 127 126 077
C29-aBC29-Ts 217 217 362
C29-aBC30-aB 048 048 071
C31-aBC32-aB+C33-aB 093 093 134
C32-aBC31-aB+C33-aB 043 043 038
C33-aBC31-aB+C32-aB 028 028 018
Diasteranes and Regular 14a(H)-Steranes (mz 217) AVG AVG AVG
C27D-SC27D-R 161 161 175
C29D-SC29D-R 163 163 167
C28 aaa-RC29 aaa-R 074 074 080
14B(H)-Steranes (mz 218) AVG AVG AVG
C27 BBC28 BB+C29 BB 069 069 062
C28 BBC27 BB+C29 BB 038 038 040
C29 BBC27 BB+C28 BB 046 046 050
Triaromatic Steriods (mz 231) AVG AVG AVG
C20 TAC21 TA 107 107 140
C26 TA-SC28 TA-S 062 063 073
C27 TA-RC28 TA-R 092 092 099
Indicates EPA SLC ratios that are statistically different according to Hansen et al (2007) and Meyer et al (2014)
Task 4 Burning of surface collected Macondo Well source oil and emulsified source oil under controlled laboratory conditions
An initial controlled burn of MC252 oil was performed at LSU on 6 March 2012 Around 5g of MC252 oil was placed in a crucible and burned with a propane torch for ~4-5 minutes The experiment was conducted in triplicate under a laboratory ventilation hood There was not sufficient residue generated by this method to perform both physical and chemical characterization so only chemical characterization was completed Since this burn was performed on a reduced scale plans were made to conduct a second larger-scale burn using an increased volume of oil floated on artificial seawater
The second larger scale burn was conducted on 20 February 2014 at the LSU Environmental Health and Safety facility on the Baton Rouge campus This burn used 500mL of fresh and 15 weathered surrogate south Louisiana crude oil obtained from BP floated on artificial seawater (avg salinity of 34amp) in stainless steel containers Emulsified MC252 oil was also burned in the same manner in this experiment Each set of burns was performed in triplicate and burn durations were ~5-10 minutes Figure 21a-f shows the sequence of the burning process After the burns were completed the stainless steel containers were allowed to cool and were then transported back to the lab where the residues were sampled for both physical and chemical analyses
35
(a) (b)
(c)
(e)
(d)
(f)
Figures 21a-f Images from the larger-scale burn at LSU in 2014 (a) pans with South Louisiana crude floated on seawater (b) ignition procedure (c-e) sequence of mid-burn photos (f) extinguishment
Task 5 Physical and chemical characterization of burn residue resulting from Task 4
There was not enough material to complete both the physical and chemical characterization of the initial smaller-scale burn of MC252 oil in 2012 therefore only chemical characterization was completed for the triplicate burn samples Normal alkane chromatographic profiles (Figure 22) of the replicates from the smaller-scale controlled burn of MC252 oil exhibited similar chemical characteristics as the in-situ burn samples collected during the response to the Deepwater Horizon
36
oil spill and also resemble the normal alkane chromatographic profile of the shrimp trawl tarball in Figure 18a For the ldquoafterrdquo samples the modified FFPI was 054plusmn002 and the modified Wang Pyrogenic Index was 013plusmn002 Significant enhancement in the same pyrogenic PAHs as described earlier for Task 2 was also observed and the total target PAHs were reduced from 12000 mgkg in fresh MC252 oil to an average of 1200 mgkg in the burn residues (a 90 reduction) The PAH profiles for the before and after MC252 from this small-scale burn are shown in Figure 22 along with the PAH profiles from the larger-scale burns
1 0 0 0 1 5 0 0 2 0 0 0 2 5 0 0 3 0 0 0 3 5 0 0 4 0 0 0 4 5 0 0 5 0 0 0 5 5 0 0 6 0 0 0
0
2 0 0 0
4 0 0 0
6 0 0 0
8 0 0 0
1 0 0 0 0
1 2 0 0 0
1 4 0 0 0
1 6 0 0 0
1 8 0 0 0
2 0 0 0 0
2 2 0 0 0
2 4 0 0 0
2 6 0 0 0
2 8 0 0 0
T i m e - - gt
A b u n d a n c e
I o n 5 7 0 0 ( 5 6 7 0 t o 5 7 7 0 ) G T 1 2 0 6 4 I D d a t a m s
1 0 0 0 1 5 0 0 2 0 0 0 2 5 0 0 3 0 0 0 3 5 0 0 4 0 0 0 4 5 0 0 5 0 0 0 5 5 0 0 6 0 0 0
0
2 0 0 0
4 0 0 0
6 0 0 0
8 0 0 0
1 0 0 0 0
1 2 0 0 0
1 4 0 0 0
1 6 0 0 0
1 8 0 0 0
2 0 0 0 0
2 2 0 0 0
2 4 0 0 0
2 6 0 0 0
T i m e - - gt
A b u n d a n c e
I o n 5 7 0 0 ( 5 6 7 0 t o 5 7 7 0 ) G T 1 2 0 6 4 J D d a t a m s
1 0 0 0 1 5 0 0 2 0 0 0 2 5 0 0 3 0 0 0 3 5 0 0 4 0 0 0 4 5 0 0 5 0 0 0 5 5 0 0 6 0 0 0
0
5 0 0 0
1 0 0 0 0
1 5 0 0 0
2 0 0 0 0
2 5 0 0 0
3 0 0 0 0
3 5 0 0 0
4 0 0 0 0
4 5 0 0 0
5 0 0 0 0
5 5 0 0 0
6 0 0 0 0
T i m e - - gt
A b u n d a n c e
I o n 5 7 0 0 ( 5 6 7 0 t o 5 7 7 0 ) G T 1 2 0 6 4 K D d a t a m s
Figure 22 Normal alkane profiles (mz 57) for three replicate samples from a small-scale lab burn of MC252 oil
Results of the second larger-scale burn of surrogate south Louisiana crude oil were quite different from the actual in-situ burn samples previously characterized in Task 2 and from the small-scale burn of MC252 There were no significant changes in density or percent asphaltenes There was no enhancement of the pyrogenic PAHs observed in the actual ISB samples and the smaller scale controlled burn Only the modified FFPI showed a significant (p=lt0001) change The average FFPI
37
before burning was 079plusmn006 and the average FFPI after burning was 070plusmn002 Table 11 summarizes the results of the larger-scale controlled burn described above
Table 11 Summary of Chemical Characteristics from Larger-Scale Controlled Burn
15 Weathered Fresh Surrogate Oil Surrogate Oil Emulsified MC252 Oil
(by weight)
Before After Before After Before After
Avg Total Aromatics 8100 3600plusmn310 9400 3400plusmn310 2700 2600plusmn270
(mgkg)
Avg Modified FFPI 083 069plusmn002 083 071plusmn001 073 071plusmn001
Avg Wang Pyrogenic Index 001 004plusmn001 001 004plusmn0004 001 001plusmn00003
Avg PhenAnth 453 133plusmn20 457 117plusmn12 123 674plusmn88
Avg FluorAntPyr 038 060plusmn006 035 080plusmn001 040 032plusmn002
n= 1 3 1 3 1
15 Weathered Surrogate Oil
Fresh Surrogate Oil (by weight) Emulsified MC252 Oil
Before After Before After Before After
Avg Density (n=3) 086plusmn0001 084plusmn005 090plusmn0002 094plusmn002 098plusmn0003 099plusmn001
Avg Asphaltenes (n) 10(1) 198plusmn067(3) 090(1) 198plusmn068(3) 171(1) 220plusmn034
Figure 23 is a graphical depiction of the Wang Pyrogenic Index ldquoBeforerdquo samples are clearly separated from most of the ldquoafterrdquo samples in the figure Fresh oil before and 15 weathered oil before are on top of each other in the plot (0006 45) According to Wang et al (1999) lighter petroleum products and most crude oils fall into the range of 000-001 which is supported in this instance The ldquoafterrdquo samples are characterized by an increase in the pyrogenic index along with a decrease in the phenanthreneanthracene ratio however the majority fall in the range of what Wang et al would consider to be heavy oilsfuels and tarballs There was very little change in the Wang Pyrogenic Index for the emulsified MC252 oil
0
20
40
60
80
100
120
140
0000 0005 0010 0015 0020 0025 0030 0035 0040 0045 0050
Ph
en
An
th
Wang Pyrogenic Index
Laboratory Controlled Burn
Before Burning After Burning Fresh After Burning 15 Weathered After Burning Emulsified
Figure 23 Plot of the Wang pyrogenic index over the ratio of phenanthreneanthracene for laboratory controlled burning of surrogate crude oil and emulsified MC252 oil
38
3
The difference in results may be due to the use of the surrogate south Louisiana crude oil instead of MC252 oil unfortunately this was the only option for burning a larger volume of oil under controlled conditions as availability of original MC252 riser oil is extremely limited Controlled in-situ burning decreased the average total target aromatics of the fresh surrogate oil by approximately 45 and the average total target aromatics of the 15 weathered surrogate oil by approximately 36 both of which are similar for the field in-situ burn samples
Emulsified MC252 oil collected during the Deepwater Horizon clean-up operations was also burned during this portion of the laboratory work The emulsified MC252 oil did not burn well and as a result reflected the least amount of change from before to after There were no significant changes in the emulsified MC252 oilrsquos total aromatics modified FFPI and there was no enhancement of the pyrogenic PAHs Figure 24 shows the PAH profiles for each oil type and post-burn residues tested in the larger-scale controlled burn
Hopane normalization (Aeppli et al 2014 Douglas et al 1996 Garrett et al 2000 Prince et al 1994) was applied to the Fresh and 15 Weathered surrogate South Louisiana Crude oil Using the hopane normalized concentrations the percent increase or decrease of each target analyte was calculated and are presented in Figure 25 An average 5-point response factor of 091 (R2=09912) was determined for 17β(H)21β(H)-30-hopane This response factor was then used to calculate the concentration of 17α(H)21β(H)-hopane The hopane normalization factor (HopaneOilHopaneWeathered) for the Fresh surrogate oil was 076 and 088 for the 15 Weathered surrogate oil The results of the hopane normalization of controlled laboratory burns confirms the enrichment of higher molecular weight analytes previously documented in Tasks 2 and 5 (small-scale burn of MC252 oil)
39
2000
Co
nc
(mg
k
g)
Co
nc
(mg
k
g)
1500
Before 1000
After
500
0
(d) Emulsified MC252 Oil 2014
350 300 250 200 150
Before 100 50 After
Co
nc
(mg
k
g)
Co
nc
(mg
k
g)
2000
1500
Before 1000
After
500
0
(b) Fresh Surrogate Oil 2014
1600
1400
1200
1000 Before
800 After
600
400
200
0
(c) 15 Weathered Surrogate Oil 2014
(a) MC252 Oil 2012
0
NA
PH
C1
-Nap
hs
C2
-Nap
hs
C3
-Nap
hs
C4
-Nap
hs
FL
UO
RC
1-F
luo
rsC
2-F
luo
rsC
3-
Flu
ors
DB
TC
1-D
BT
sC
2-D
BT
sC
3-
DB
Ts
PH
EN
C1
-Ph
ens
C2
-Ph
ens
C3
-Ph
ens
C4
-Ph
ens
AN
TH
FL
UO
RA
NT
PY
RC
1-
Py
rsC
2-
Py
rsC
3-
Py
rsC
4-
Py
rsN
BT
C-1
NB
Ts
C-2
NB
Ts
C-3
NB
Ts
B(a
)AN
TH
CH
RY
C1
-C
hry
sC
2-
Ch
rys
C3
-C
hry
sC
4-
Ch
rys
B(b
)FB
(k)F
B(e
)PB
(a)P
PE
RY
LIN
DP
YR
D(a
h)A
B(g
hi)
P
Figures 24a-d Before and after PAH profiles for controlled burns of four oil types in 2012 and 2014 (a) MC252 riser oil (b) fresh surrogate South Louisiana crude (c) weathered surrogate South Louisiana crude and (d) emulsified MC252
40
-150
-100
-50
0
50
100
150
200
250
300
350
NA
PH
C1-N
aphs
C2-N
aphs
C3-N
aphs
C4-N
aphs
FLU
OR
C1-F
luor
s
C2-F
luor
s
C3-F
luor
s
DB
T
C1-D
BTs
C2-D
BTs
C3-D
BTs
PHEN
C1-P
hens
C2-P
hens
C3-P
hens
C4-P
hens
AN
TH
FLU
OR
AN
T
PYR
C1-P
yrs
C2-P
yrs
C3-P
yrs
C4-P
yrs
NB
T
C-1
NB
Ts
C-2
NB
Ts
C-3
NB
Ts
B[a
]AN
TH
CHR
Y
C1-C
hrys
C2-C
hrys
C3-C
hrys
C4-C
hrys
B[b
]F
B[k
]F
B[e
]P
B[a
]P
PER
YL
D[a
h]A
B[g
hi]
P
IN
CREA
SE O
R D
ECR
EASE
(a) Fresh Surrogate Oil
-150
-50
50
150
250
350
450
NA
PH
C1-N
aphs
C2-N
aphs
C3-N
aphs
C4-N
aphs
FLU
OR
C1-F
luor
s
C2-F
luor
s
C3-F
luor
s
DB
T
C1-D
BTs
C2-D
BTs
C3-D
BTs
PHEN
C1-P
hens
C2-P
hens
C3-P
hens
C4-P
hens
AN
TH
FLU
OR
AN
T
PYR
C1-P
yrs
C2-P
yrs
C3-P
yrs
C4-P
yrs
NB
T
C-1
NB
Ts
C-2
NB
Ts
C-3
NB
Ts
B[a
]AN
TH
CHR
Y
C1-C
hrys
C2-C
hrys
C3-C
hrys
C4-C
hrys
B[b
]F
B[k
]F
B[e
]P
B[a
]P
PER
YL
D[a
h]A
B[g
hi]
P
IN
CREA
SE O
R D
ECR
EASE
(b) 15 Weathered Surrogate Oil
Figure 25 Determination of percent increase or decrease of target analytes based on hopane normalization for (a) Fresh surrogate oil and (b) 15 Weathered surrogate oil
41
Task 6 Forensic interpretation of analytical results to characterize physical and chemical changes occurring during the combustion of oil to include comparison of changes occurring in various weathered oil samples and identification of potential markers for in-situ burn residues
A primary objective of the forensic interpretation of analytical results was to determine if residues from in-situ burning during the Deepwater Horizon response had measurable characteristics that could distinguish them from other MC252 residues Results from the other tasks previously discussed indicated that these characteristics included bull Significant increase in density and percent asphaltenes bull Enhancement of pyrogenic PAHs bull Decrease in the FFPI Increase in the Wang Pyrogenic Index and bull Evidence of thermal combustion in the normal alkane profile
However it appears that all of these discriminating factors must be present to make the distinction between sources with any confidence Because of this limitation the forensic interpretation was expanded to include a statistical analysis of sample matrices and sampling locations based on the diagnostic biomarker ratio analyses
A total of 130 suspected MC252 residues was initially chosen All samples were grouped according to year sample matrix (eg ISB oil ISB tarball oil other sediment or tarball) and sampling location (eg marsh ocean depth shore or water surface) These samples were then narrowed to a total of 112 by the diagnostic ratio analyses Only samples determined to be a statistical match to MC252 oil were used in the matrix and sampling location comparisons A one-way ANOVA with a post-hoc Tukey-Kramer pairwise comparison Table 12 was applied to the sample matrix analysis for each of the 15 diagnostic ratios to determine if any of the ratios could distinguish between in-situ burn residues and other MC252 oil residues The Tukey-Kramer comparison separates samples into lettered groups based on the minimum significant difference between means (p=005) Groups with the same letter have means that are not significantly different from each other and groups with differing letters are significantly different from each other For the sample location effects a nested ANOVA with random effects and a variance components covariance structure was carried out for each diagnostic ratio to determine if there were any differences due to location of sample collection In both cases the sample number in each matrix or location was highly unbalanced
A total of 7 out of 15 diagnostic ratios had significant differences between sample matrices Of these 7 ratios 4 showed significant differences between in-situ burn residues and other MC252 oil residues
bull The hopane ratio C31 aB (S+R)C32 aB (S+R) + C33 aB (S+R) was significantly different for ISB oil and ISB tarball Both of the in-situ burn residues were significantly different from all other matrices except the tarball matrix
bull Another hopane ratio C33 aB (S+R)C31 aB (S+R) + C32 aB (S+R) for ISB tarball was significantly different from all other matrices and ISB oil was significantly different from all other matrices except tarball and oil
bull The diasterane and regular sterane ratio C28 aaa-RC29 aaa-R was significantly different when comparing ISB oil and oil residues
42
bull The last significant ratio was C27 BB (S+R)C28 BB (S+R) + C29 BB (S+R) (in the 14(β)H-steranes group) This ratio was significantly different when comparing ISB tarballs to other tarballs
Table 12 Tukey-Kramer Pairwise Comparisons of Diagnostic Ratios for Different Matrices
C31 aB (S+R)C32 aB (S+R) + C33 aB (S+R) C28 aaa-RC29 aaa-R
Matrix Mean SE Group Matrix Mean SE Group
Sediment 10533 183E-02 A Oil 07825 943E-03 A
Other 09933 183E-02 AB Other 07767 267E-02 AB
Oil 09575 648E-03 BC Tarball 07592 740E-03 AB
ISBTarball 09451 508E-03 BCD 07477 906E-03 AB
Tarball
ISB Oil 09309 662E-03 CD Sediment 07400 267E-02 AB
ISB 09300 622E-03 D ISB Oil 07361 963E-03 B
Tarball
C33 aB (S+R)C31 aB (S+R) + C32 aB (S+R) C27 BB (S+R)C28 BB (S+R) + C29 BB (S+R)
Matrix Mean SE Group Matrix Mean SE Group
ISB Tarball
02788 290E-03 A Other 07550 345E-02 AB
ISB Oil 02743 309E-03 AB Tarball 07500 824E-03 A
Tarball 02667 237E-03 BC Oil 07340 218E-01 AB
Oil 02646 302E-03 BCD ISB Tarball
07006 115E-01 B
Other 02467 855E-03 CD Sediment 07000 282E-01 AB
Sediment 02400 855E-03 D ISB Oil 06900 218E-02 AB
Therefore C28 aaa-RC29 aaa-R may be useful for distinguishing ISB oil from other oil residues and C27 BB (S+R)C28 BB (S+R) + C29 BB (S+R) may be useful distinguishing ISB tarballs from other tarballs
A total of 5 out of 15 diagnostic ratios showed significant differences between sample matrix and sampling location The statistical analysis did not determine which matrix by sampling location was significant it was performed to determine if sampling location was a factor in distinguishing some of these oil residues Sampling location can have an important role because this often governs how oil residues weather Therefore this analysis supported the notion that oil residues from the same type of oil may show different characteristics determined by differences in weathering in various sampling locations without compromising the ability to make statistical matchnon-match determinations with the same ratios
43
SUMMARY AND CONCLUSIONS
A primary objective of this study was to identify possible indicators that could distinguish in-situ burn residues from other oil residues based on physical and chemical analyses of actual Deepwater Horizon in-situ burn samples Unfortunately while there is no single reliable indicator of in-situ burning partial indicators (eg different normal alkane profile enhancement of pyrogenic PAHs and reduction in the modified Fossil Fuel Pollution Index) when considered as an integrated whole can point to in-situ burning as a significant driver of weathering and fate Table 3 shows some of the characteristics assessed in this study Notable in these results is the enhancement in asphaltenes content for known burn residues and the tarballs recovered from deep water shrimp trawls
Table 13 Comparison of Physical and Chemical Characteristics for Different Oil Matrices
MC252 SLC Pre- SLC Post- ISB Oil ISB Oil Shrimp Other MC252 Riser Burn Burn Pre-Burn Post-Burn Tarballs Tarballs
Density gmL 084 086 084 088 096 104 086
Asphaltene 09-10 10 198 15 42 22 15
FFPI 083 079 070 077 065 062 059 Wang Pyrogenic
0004 001 004 001 007 006 004 Index
Even the use of a series of partial indicators must be employed cautiously comparison of the normal alkane profile for example has the caveat that the same profile was not observed in oil residues collected immediately after in-situ burning The distinctive profile appeared only in tarballs that had been recovered from trawls two hundred meters below the ocean surface The asphaltenes content of the shrimp trawl tarballs was significantly higher than all the other samples which indicates that asphaltenes content positively correlated with the tendency of those oil residues to sink Density was a factor but does not appear to be as critical as the percent asphaltenes with respect to sinking tarballs
The majority of residues from the Deepwater Horizon oil spill retained their oil biomarker signatures making diagnostic ratio analyses possible The diagnostic ratios were used to
1) Determine if the oil residue was a match to MC252 oil and 2) Determine if there were any differences in the ratios in matching oil residues based on
sample matrix and sampling location
A total of 4 out of the 15 diagnostic biomarker ratios did distinguish in-situ burn residues from the majority of the other residues Two of these ratios C28 aaa-RC29 aaa-R and C27 BB (S+R)C28 BB (S+R) + C29 BB (S+R) may be useful for distinguishing ISB oil from other oil residues and ISB tarballs from other tarballs respectively Significant differences were also determined in the comparison of sampling locations These differences suggest that weathering of oil residues from the same initial source is highly dependent on the specific environmental compartment in which they reside without compromising the ability to make matchnon-match determinations with the same ratios
44
The in-situ burning research described in this report combined retrospective analysis of samples collected during the Deepwater Horizon response with new laboratory work and interpretation to increase the relevance and applicability of the physical and chemical results The methodological refinements improved our abilities to distinguish burn products from other weathered oil matrices and helped to confirm the generalized source attributions to burn operations that were made shortly after tarballs were encountered in the Gulf of Mexico royal red shrimp fishery It is important to note that the chemical characterization method (GC-MS) and target analyte list used for this report only examines about 5 of the oil mass Other analytical methods such as GCxGC-FID (Aeppli et al 2014) or APPI FT-ICR MS have become standard instrument systems for analyzing crude oil Both have advantages over GC-MS in that they can separate and identify a much larger percentage of oil compounds however it cannot be denied that GC-MS is still relevant and is one of the most recognized instrument systems for characterizing crude oil in the environment
The Deepwater Horizon spill experience validated the operational feasibility and practical application of in-situ burning as an open water response method Like nearly everything else about this incident the scale of in-situ burn operations was unprecedented between 28 April and 19 July 2010 over 400 individual burns took place consuming an estimated 220000-310000 bbl of oil This is roughly equivalent to the total volume for the Exxon Valdez oil spill in 1989
Implicit in these numbers is the large volume of in-situ burn residue that was generated during the Deepwater Horizon operations Using the standard in-situ burn efficiency estimates of 90-95 percent the amount of residue resulting from the operations potentially ranged from 11000shy33000 bbl This is a substantial amount of petroleum hydrocarbons introduced into a relatively small portion of the marine environmentmdashalthough it should be noted that natural seeps contribute an estimated 560000 to 14 million bbl of oil into the waters of the Gulf of Mexico (National Research Council 2003) each year (note seep locations in Figure 26)
The fate of the burn residue from the Deepwater Horizon in-situ burn operations might never have been known were it not for the chance encounters of the single deep water fishery operating in the same general area as most of the burn operations (Figure 26) Impacts to the fishery were minimal and it was quickly re-opened after testing and analysis by federal fisheries managers and seafood safety specialists However the residue and fishery interactions that occurred in 2010 and 2011 represent a cautionary footnote to large-scale in-situ burn operations that should be factored into tradeoff analysis for future spill responses Further the Deepwater Horizon experience suggests a need for additional research into burn residue containment or recovery methods that would reduce or eliminate potential fishery impacts associated with sinking residue
On a final note we recommend that the Environmental Unit for a spill response where burn operations are regularly taking place should collaborate with the Operations Section to collect analyze and archive paired samples of pre- and post-burn oil to facilitate the process of source identification of oil residues encountered during a response In doing so a solid empirical database of physical and chemical characteristics would be built over time to permit a better understanding of the changes occurring to oil during in-situ burning the circumstances in which residues will floatsink and the specific markers and physical features that might be used to uniquely identify burn residues
45
Figure 26 Composite map showing locations of the Macondo wellhead in-situ burn operations royal red shrimp trawls with preliminary source identifications and known hydrocarbon seeps Numbers in boxes denote approximate tarball counts in each quadrant Prepared by JB Huyett Genwest Systems
46
REFERENCES
Aeppli C RK Nelson JR Radović CA Carmichael DL Valentine and CM Reddy 2014 Recalcitrance and degradation of petroleum biomarkers upon abiotic and biotic natural weathering of Deepwater Horizon oil Environmental Science and Technology 486726-6734
Allen AA NJ Mabile D Jaeger and D Costanzo 2011 The use of controlled burning during the Gulf of Mexico Deepwater Horizon MC-252 oil spill response In Proceedings of the 2011 International Oil Spill Conference 23-26 May 2011 Portland OR 13 pp
httpdxdoiorg1079012169-3358-2011-1-194
American Society for Testing Materials D71-94(2009) Standard test method for relative density of solid pitch and asphalt (displacement method) ASTM International West Conshohocken PA 2012
American Society for Testing Materials D3279-12 Standard test method for n-heptane insoluble ASTM International West Conshohocken PA 2012
Anderson WW and MJ Lindner 1971 Contributions to the biology of the royal red shrimp Hymenopenaeus robustus Smith Fishery Bulletin 69(2)313-336
Boehm PD and JW Farrington 1984 Aspects of the polycyclic aromatic hydrocarbon geochemistry of recent sediments in the Georges Bank Region Environmental Science and Technology 18(11)840-845
Bullis HR Jr 1956 Preliminary results of deep-water exploration for shrimp in the Gulf of Mexico by the MV Oregon (1950-1956) Commer Fish Rev 18(12)1-12
Buist I 1998 Window of opportunity for in situ burning In Proceddings of the In Situ Burning of Oil Spills Workshop US Minerals Management Service Special Publication 935 21-30
Buist I and K Trudel 1995 Laboratory studies of the properties of in-situ burn residues Marine Spill Response Corporation Washington DC MSRC Technical Report Series 95-010 110 p
Buist I K Trudel J Morrison and D Aurand 1995 Laboratory studies of the physical properties of in-situ burn residues In Proceedings of the Eighteenth Arctic and Marine Oilspill Program (AMOP) June 14-16 1995 Edmonton Alberta 1027-1051
Buist I K Trudel J Morrison and D Aurand 1997 Laboratory studies of the properties of in-situ burn residues In Proceedings of the 1997 International Oil Spill Conference April 1997 1997(1)149-156
Cascorbi A 2007 Wild-caught warmwater shrimp (Infraorder Penaeus--the Penaeid shrimps) Gulf of Mexico and US South Atlantic Regions Seafood Watch Seafood Report Monterey Bay Aquarium 52 pp
Douglas GS AE Bence RC Prince SJ McMillen and EL Butler 1996 Environmental stability of selected petroleum hydrocarbon source and weathering ratios Environmental Science and Technology 30(7)2332-2339
47
Farfante IP 1988 Illustrated key to Penaeoid shrimps of commerce in the Americas NOAA Technical Report NMFS 64 April 1988 32 pp
Federal Interagency Solutions Group Oil Budget Calculator Science and Engineering Team 2010 Oil Budget Calculator Deepwater Horizon Technical Documentation A Report to the National Incident Command November 2010 49 pp + appendices
Fingas MF G Halley F Ackerman N Vanderkooy R Nelson MC Bissonnette N Laroche P Lambert P Jokuty K Li W Halley G Warbanski PR Campagna RD Turpin MJ Trespalacios D Dickins EJ Tennyson D Aurand and R Hiltabrand 1994a The Newfoundland Offshore Burn Experiment ndash NOBE experimental design and overview In Proceedings of the Seventeenth Arctic and Marine Oilspill Program (AMOP) June 8-10 1994 Vancouver British Columbia 1053-1063
Fingas MF F Ackerman K Li P Lambert Z Wang MC Bissonnette PR Campagna P Boileau N Laroche P Jokuty R Nelson RD Turpin MJ Trespalacios G Halley J Belanger J Pareacute N Vanderkooy EJ Tennyson D Aurand and R Hiltabrand 1994b The Newfoundland Offshore Burn Experiment ndash NOBE preliminary results of emissions measurement In Proceedings of the Seventeenth Arctic and Marine Oilspill Program (AMOP) June 8-10 1994 Vancouver British Columbia 1099-1164
Fingas M 2011 An overview of in-situ burning Chapter 23 in M Fingas (ed) Oil Spill Science and Technology New York Gulf Professional PublishingElsevier 737-903
Fingas M 2015 Introduction to Oil Chemistry and Properties In Handbook of Oil Spill Science and Technology M Fingas Ed Hoboken NJ John Wiley amp Sons Inc
Garrett RM CC Gueacutenette CE Haith and RC Prince 2000 Pyrogenic polycyclic aromatic hydrocarbons in oil burn residues Environmental Science and Technology 34(10)1934-1937
Gulf of Mexico Fishery Management Council 2004 Appendix C Information on Species Distributions and Habitat Associations Final Environmental Impact Statement for the Generic Essential Fish Habitat Amendment to the following fishery management plans of the Gulf of Mexico (GOM) shrimp fishery of the Gulf of Mexico red drum fishery of the Gulf of Mexico reef fish fishery of the Gulf of Mexico stone crab fishery of the Gulf of Mexico coral and coral reef fishery of the Gulf of Mexico spiny lobster fishery of the Gulf of Mexico and South Atlantic coastal migratory pelagic resources of the Gulf of Mexico and South Atlantic 262 pp
Gulf of Mexico Fishery Management Council 2005 Final Amendment Number 13 to the Fishery Management Plan for the Shrimp Fishery of the Gulf of Mexico US Waters with Environmental Assessment Regulatory Impact Review and Regulatory Flexibility Act analysis August 24 2005 272 pp
Hansen AB PS Daling LG Faksness KR Sorheim P Kienhuis and R Duus 2007 Emerging CEN Methodology for Oil Spill Identification In Oil Spill Environmental Forensics Z Wang and SA Stout Eds Boston MA Elsevier
Jaeger A 2011 Personal communication 27 September 2011
Kucklick JH and D Aurand 1997 Historical dispersant and in-situ burning opportunities in the
48
United States Proc 1997 International Oil Spill Conference 805 ndash 810
Leahy JG and RR Colwell 1990 Microbial degradation of hydrocarbons in the environment Microbiological Reviews 54305-315
Lewan MD A Warden RF Dias ZK Lowry TL Hannah PG Lillis RF Kokaly TM Hoefen GA Swayze CT Mills SH Harris GS Plumlee 2014 Organic Geochemistry 75(2014)54-60
Meyer BM EB Overton and RE Turner 2014 Oil source identification using diagnostic biomarker ratio analyses In 2014 International Oil Spill Conference Proceedings Savannah GA May 5-9 2014(1)2064-2073
Michel J D Scholz SR Warren Jr and AH Walker 2005 In-situ burning A decision-makerrsquos guide to in-situ burning API Publication Number 4740 Washington DC American Petroleum Institute 60 pp
Mills MA TJ McDonald JS Bonner MA Simon and RL Autenrieth 1999 Method for quantifying the fate of petroleum in the environment Chemosphere 39(14)2563-2582
Mullin JV and MA Champ 2003 Introductionoverview to in situ burning of oil spills Spill Science amp Technology 8(4)323-330
National Research Council Committee on Oil in the Sea 2003 Oil in the Sea III Inputs Fates and Effects National Research Council Ocean Studies Board and Marine Board Divisions of Earth and Life Studies and Transportation Research Board Washington DC National Academy Press 265 pp
Operational Science Advisory Team-2 2011 Net Environmental Benefits Analysis (NEBA) Annex M to Summary Report for Fate and Effects of Remnant Oil in the Beach Environment prepared for Lincoln D Stroh US Coast Guard Federal On-Scene Coordinator 48 pp
Overton EB WD Sharp and P Roberts 1994 Toxicity of Petroleum In Basic Environmental Toxicology LG Cockerham and BS Shane Eds Boca Raton FL CRC Press Inc
Prince RC DL Elmendorf JR Lute CS Hsu CE Haith JD Senius GJ Dechert GS Douglas and EL Butler 1994 17α(H)21β(H)-hopane as a conserved internal marker for estimating the biodegradation of crude oil Environmental Science and Technology 28(1)142-145
SL Ross Environmental Research Ltd 2010 Spill Related Properties of MC252 Crude Oil Sample ENT-052210-178 Appendix 8 to Oil Budget Calculator Deepwater Horizon Technical Documentation A Report to the National Incident Command November 2010 7 pp
Stiles ML E Harrould-Kolieb P Faure H Ylitalo-Ward and MF Hirshfield 2007 Deep sea trawl fisheries of the Southeast US and Gulf of Mexico rock shrimp royal red shrimp calico scallops Report for Oceana May 2007 18 pp
US Coast Guard 2011 BP Deepwater Horizon Oil Spill Incident Specific Preparedness Review (ISPR) Final Report Report prepared for ADM RJ Papp Commandant January 2011 158 pp
Wang Z M Fingas YY Shu L Sigouin M Landriault P Lambert R Turpin P Campagna and J
49
Mullin 1999 Quantitative characterization of PAHs in burn residue and soot samples and differentiation of pyrogenic PAHs from petrogenic PAHsmdashthe 1994 Mobile burn study Environ Sci Technol 33(18)3100-3109
Zack S 2007 Royal red shrimp Stoningtonrsquos succulent secret Connecticut Sea GrantWrack Lines 72 FallWinter 2007 6 pp
ACKNOWLEDGMENTS
Funding for this project was provided by the US Department of the Interior Bureau of Safety and Environmental Enforcement (BSEE) under Interagency Agreement E13PG00001 We thank the outside peer reviewers recruited by BSEE for their constructive comments and criticism and for improving the clarity of the project report The authors wish to acknowledge the assistance and support of Alan A Allen of Spiltec and Nere Mabile of BP during the Deepwater Horizon response in Houma LA CPO RJ Schrader of the US Coast Guard shared his expertise experiences and photographs from the field implementation of in-situ burn operations during the spill The data analysis for this report was generated using SAS software Version 93 of the SAS System for Windows Copyright copy 2002-2010 by SAS Institute Inc SAS and all other SAS Institute Inc product or service names are registered trademarks or trademarks of SAS Institute Inc Cary NC USA
DISCLAIMER
Reference to specific commercial products process or service by trade name trademark manufacturer or otherwise does not constitute or imply their endorsement recommendation or favoring by the United States Government The views and opinions of authors expressed do not necessarily state or reflect those of the United States Government and shall not be used for advertising or product endorsement purposes
50
APPENDIX 1
DIAGNOSTIC BIOMARKER RATIOS
Petroleum Biomarkers Used For Calculating MC252 Diagnostic Ratios
Abbreviation Compound Name mz Value
C27 18α(H)-222930-trisnorneohopane 191C27 Ts C27 Tm C27 17α(H)-222930-trisnorhopane 191 C29 aB C29 17α(H)21β(H)-30-norhopane 191 C29 Ts C29 18α(H)-30-norneohopane 191 C30 aB C30 17α(H)21β(H)-hopane 191 C31 aB (S+R) C31 17α(H)21β(H)-22(S+R)-homohopane 191 C32 aB (S+R) C32 17α(H)21β(H)-22(S+R)-bishomohopane 191 C33 aB (S+R) C32 17α(H)21β(H)-22(S+R)-trishomohopane 191 C27D Ba-S C27 13β(H)17α(H)20S-diasterane 217 C27D Ba-R C27 13β(H)17α(H)20R-diasterane 217 C29D Ba-S C29 24-ethyl-13β(H)17α(H)20S-diacholestane 217 C29D Ba-R C29 24-ethyl-13β(H)17α(H)20R-diacholestane 217 C28 aaa-R C28 24-methyl-5α(H)14α(H)17α(H) 20R-cholestane 217 C29 aaa-R C29 24-ethyl-5α(H)14α(H)17α(H) 20R-cholestane 217 C27 BB (R+S) C27 5α(H)14β(H)17β(H)-cholestane (20R+20S) 218 C28 BB (R+S) C28 24-methyl-5α(H)14β(H)17β(H)-cholestane (20R+20S) 218 C29 BB (R+S) C29 24-ethyl-5α(H)14β(H)17β(H)-cholestane (20R+20S) 218 C20 TA C20-triaromatic steroid (pregnane derivative) 231 C21 TA C21-triaromatic steroid (homopregnane derivative) 231 C26 TA-S C26-triaromatic steroid20S (cholestane derivative) 231 C28 TA-S C28-triaromatic steroid20S (ethylcholestane derivative) 231 C27 TA-R C27-triaromatic steroid20R (methylcholestane derivative) 231 C28 TA-R C28-triaromatic steroid20R (ethylcholestane derivative) 231
52
Diagnostic Ratios Chosen for MC252 Source Oil
Ratio mz
Value
C27 Ts C27 Tm 191
C29 aBC29 Ts 191
C29 aBC30 aB 191
C31 aB(S+R)C32 aB(S+R) + C33 aB(S+R) 191
C32 aB(S+R)C31 aB(S+R) + C33 aB(S+R) 191
C33 aB(S+R)C31 aB(S+R) + C32 aB(S+R) 191
C27D Ba-SC27D Ba-R 217
C29D Ba-SC29D Ba-R 217
C28 aaa-RC29 aaa-R 217
C27 BB(R+S)C28 BB(R+S) + C29 BB(R+S) 218
C28 BB(R+S)C27 BB(R+S) + C29 BB(R+S) 218
C29 BB(R+S)C27 BB(R+S) + C28 BB(R+S) 218
C20 TAC21 TA 231
C26 TA-SC28 TA-S 231
C27 TA-RC28 TA-R 231
53
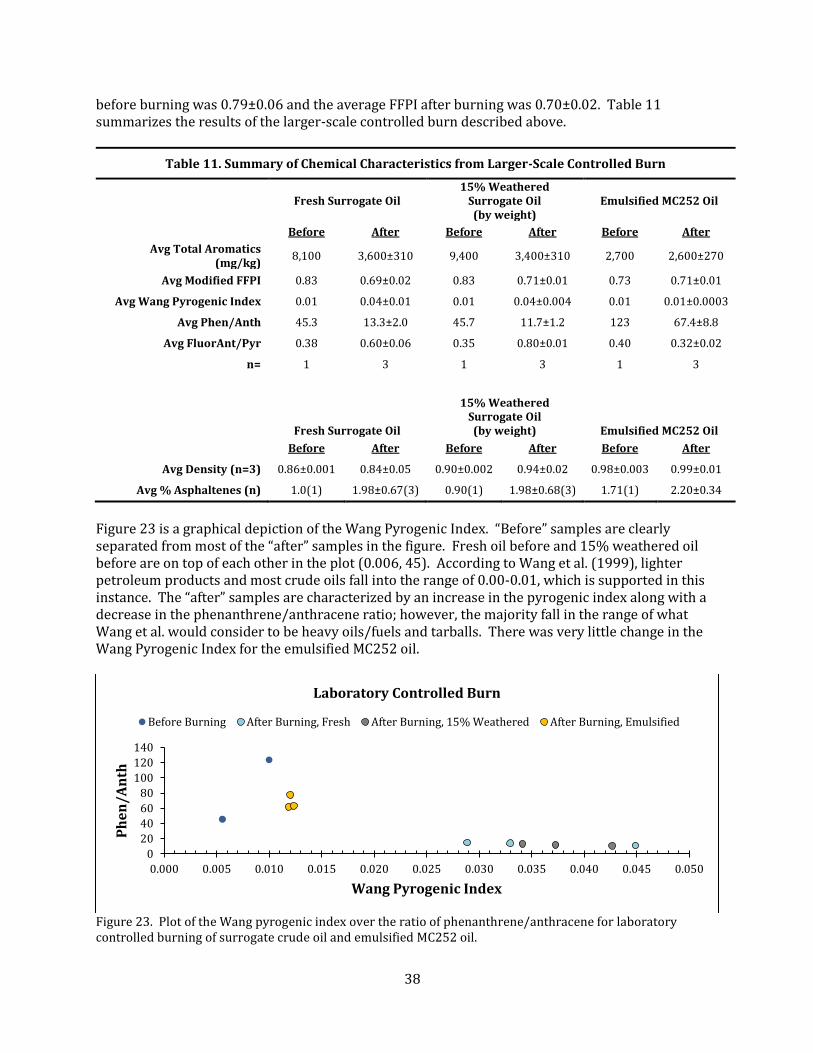

2000
Co
nc
(mg
k
g)
Co
nc
(mg
k
g)
1500
Before 1000
After
500
0
(d) Emulsified MC252 Oil 2014
350 300 250 200 150
Before 100 50 After
Co
nc
(mg
k
g)
Co
nc
(mg
k
g)
2000
1500
Before 1000
After
500
0
(b) Fresh Surrogate Oil 2014
1600
1400
1200
1000 Before
800 After
600
400
200
0
(c) 15 Weathered Surrogate Oil 2014
(a) MC252 Oil 2012
0
NA
PH
C1
-Nap
hs
C2
-Nap
hs
C3
-Nap
hs
C4
-Nap
hs
FL
UO
RC
1-F
luo
rsC
2-F
luo
rsC
3-
Flu
ors
DB
TC
1-D
BT
sC
2-D
BT
sC
3-
DB
Ts
PH
EN
C1
-Ph
ens
C2
-Ph
ens
C3
-Ph
ens
C4
-Ph
ens
AN
TH
FL
UO
RA
NT
PY
RC
1-
Py
rsC
2-
Py
rsC
3-
Py
rsC
4-
Py
rsN
BT
C-1
NB
Ts
C-2
NB
Ts
C-3
NB
Ts
B(a
)AN
TH
CH
RY
C1
-C
hry
sC
2-
Ch
rys
C3
-C
hry
sC
4-
Ch
rys
B(b
)FB
(k)F
B(e
)PB
(a)P
PE
RY
LIN
DP
YR
D(a
h)A
B(g
hi)
P
Figures 24a-d Before and after PAH profiles for controlled burns of four oil types in 2012 and 2014 (a) MC252 riser oil (b) fresh surrogate South Louisiana crude (c) weathered surrogate South Louisiana crude and (d) emulsified MC252
40
-150
-100
-50
0
50
100
150
200
250
300
350
NA
PH
C1-N
aphs
C2-N
aphs
C3-N
aphs
C4-N
aphs
FLU
OR
C1-F
luor
s
C2-F
luor
s
C3-F
luor
s
DB
T
C1-D
BTs
C2-D
BTs
C3-D
BTs
PHEN
C1-P
hens
C2-P
hens
C3-P
hens
C4-P
hens
AN
TH
FLU
OR
AN
T
PYR
C1-P
yrs
C2-P
yrs
C3-P
yrs
C4-P
yrs
NB
T
C-1
NB
Ts
C-2
NB
Ts
C-3
NB
Ts
B[a
]AN
TH
CHR
Y
C1-C
hrys
C2-C
hrys
C3-C
hrys
C4-C
hrys
B[b
]F
B[k
]F
B[e
]P
B[a
]P
PER
YL
D[a
h]A
B[g
hi]
P
IN
CREA
SE O
R D
ECR
EASE
(a) Fresh Surrogate Oil
-150
-50
50
150
250
350
450
NA
PH
C1-N
aphs
C2-N
aphs
C3-N
aphs
C4-N
aphs
FLU
OR
C1-F
luor
s
C2-F
luor
s
C3-F
luor
s
DB
T
C1-D
BTs
C2-D
BTs
C3-D
BTs
PHEN
C1-P
hens
C2-P
hens
C3-P
hens
C4-P
hens
AN
TH
FLU
OR
AN
T
PYR
C1-P
yrs
C2-P
yrs
C3-P
yrs
C4-P
yrs
NB
T
C-1
NB
Ts
C-2
NB
Ts
C-3
NB
Ts
B[a
]AN
TH
CHR
Y
C1-C
hrys
C2-C
hrys
C3-C
hrys
C4-C
hrys
B[b
]F
B[k
]F
B[e
]P
B[a
]P
PER
YL
D[a
h]A
B[g
hi]
P
IN
CREA
SE O
R D
ECR
EASE
(b) 15 Weathered Surrogate Oil
Figure 25 Determination of percent increase or decrease of target analytes based on hopane normalization for (a) Fresh surrogate oil and (b) 15 Weathered surrogate oil
41
Task 6 Forensic interpretation of analytical results to characterize physical and chemical changes occurring during the combustion of oil to include comparison of changes occurring in various weathered oil samples and identification of potential markers for in-situ burn residues
A primary objective of the forensic interpretation of analytical results was to determine if residues from in-situ burning during the Deepwater Horizon response had measurable characteristics that could distinguish them from other MC252 residues Results from the other tasks previously discussed indicated that these characteristics included bull Significant increase in density and percent asphaltenes bull Enhancement of pyrogenic PAHs bull Decrease in the FFPI Increase in the Wang Pyrogenic Index and bull Evidence of thermal combustion in the normal alkane profile
However it appears that all of these discriminating factors must be present to make the distinction between sources with any confidence Because of this limitation the forensic interpretation was expanded to include a statistical analysis of sample matrices and sampling locations based on the diagnostic biomarker ratio analyses
A total of 130 suspected MC252 residues was initially chosen All samples were grouped according to year sample matrix (eg ISB oil ISB tarball oil other sediment or tarball) and sampling location (eg marsh ocean depth shore or water surface) These samples were then narrowed to a total of 112 by the diagnostic ratio analyses Only samples determined to be a statistical match to MC252 oil were used in the matrix and sampling location comparisons A one-way ANOVA with a post-hoc Tukey-Kramer pairwise comparison Table 12 was applied to the sample matrix analysis for each of the 15 diagnostic ratios to determine if any of the ratios could distinguish between in-situ burn residues and other MC252 oil residues The Tukey-Kramer comparison separates samples into lettered groups based on the minimum significant difference between means (p=005) Groups with the same letter have means that are not significantly different from each other and groups with differing letters are significantly different from each other For the sample location effects a nested ANOVA with random effects and a variance components covariance structure was carried out for each diagnostic ratio to determine if there were any differences due to location of sample collection In both cases the sample number in each matrix or location was highly unbalanced
A total of 7 out of 15 diagnostic ratios had significant differences between sample matrices Of these 7 ratios 4 showed significant differences between in-situ burn residues and other MC252 oil residues
bull The hopane ratio C31 aB (S+R)C32 aB (S+R) + C33 aB (S+R) was significantly different for ISB oil and ISB tarball Both of the in-situ burn residues were significantly different from all other matrices except the tarball matrix
bull Another hopane ratio C33 aB (S+R)C31 aB (S+R) + C32 aB (S+R) for ISB tarball was significantly different from all other matrices and ISB oil was significantly different from all other matrices except tarball and oil
bull The diasterane and regular sterane ratio C28 aaa-RC29 aaa-R was significantly different when comparing ISB oil and oil residues
42
bull The last significant ratio was C27 BB (S+R)C28 BB (S+R) + C29 BB (S+R) (in the 14(β)H-steranes group) This ratio was significantly different when comparing ISB tarballs to other tarballs
Table 12 Tukey-Kramer Pairwise Comparisons of Diagnostic Ratios for Different Matrices
C31 aB (S+R)C32 aB (S+R) + C33 aB (S+R) C28 aaa-RC29 aaa-R
Matrix Mean SE Group Matrix Mean SE Group
Sediment 10533 183E-02 A Oil 07825 943E-03 A
Other 09933 183E-02 AB Other 07767 267E-02 AB
Oil 09575 648E-03 BC Tarball 07592 740E-03 AB
ISBTarball 09451 508E-03 BCD 07477 906E-03 AB
Tarball
ISB Oil 09309 662E-03 CD Sediment 07400 267E-02 AB
ISB 09300 622E-03 D ISB Oil 07361 963E-03 B
Tarball
C33 aB (S+R)C31 aB (S+R) + C32 aB (S+R) C27 BB (S+R)C28 BB (S+R) + C29 BB (S+R)
Matrix Mean SE Group Matrix Mean SE Group
ISB Tarball
02788 290E-03 A Other 07550 345E-02 AB
ISB Oil 02743 309E-03 AB Tarball 07500 824E-03 A
Tarball 02667 237E-03 BC Oil 07340 218E-01 AB
Oil 02646 302E-03 BCD ISB Tarball
07006 115E-01 B
Other 02467 855E-03 CD Sediment 07000 282E-01 AB
Sediment 02400 855E-03 D ISB Oil 06900 218E-02 AB
Therefore C28 aaa-RC29 aaa-R may be useful for distinguishing ISB oil from other oil residues and C27 BB (S+R)C28 BB (S+R) + C29 BB (S+R) may be useful distinguishing ISB tarballs from other tarballs
A total of 5 out of 15 diagnostic ratios showed significant differences between sample matrix and sampling location The statistical analysis did not determine which matrix by sampling location was significant it was performed to determine if sampling location was a factor in distinguishing some of these oil residues Sampling location can have an important role because this often governs how oil residues weather Therefore this analysis supported the notion that oil residues from the same type of oil may show different characteristics determined by differences in weathering in various sampling locations without compromising the ability to make statistical matchnon-match determinations with the same ratios
43
SUMMARY AND CONCLUSIONS
A primary objective of this study was to identify possible indicators that could distinguish in-situ burn residues from other oil residues based on physical and chemical analyses of actual Deepwater Horizon in-situ burn samples Unfortunately while there is no single reliable indicator of in-situ burning partial indicators (eg different normal alkane profile enhancement of pyrogenic PAHs and reduction in the modified Fossil Fuel Pollution Index) when considered as an integrated whole can point to in-situ burning as a significant driver of weathering and fate Table 3 shows some of the characteristics assessed in this study Notable in these results is the enhancement in asphaltenes content for known burn residues and the tarballs recovered from deep water shrimp trawls
Table 13 Comparison of Physical and Chemical Characteristics for Different Oil Matrices
MC252 SLC Pre- SLC Post- ISB Oil ISB Oil Shrimp Other MC252 Riser Burn Burn Pre-Burn Post-Burn Tarballs Tarballs
Density gmL 084 086 084 088 096 104 086
Asphaltene 09-10 10 198 15 42 22 15
FFPI 083 079 070 077 065 062 059 Wang Pyrogenic
0004 001 004 001 007 006 004 Index
Even the use of a series of partial indicators must be employed cautiously comparison of the normal alkane profile for example has the caveat that the same profile was not observed in oil residues collected immediately after in-situ burning The distinctive profile appeared only in tarballs that had been recovered from trawls two hundred meters below the ocean surface The asphaltenes content of the shrimp trawl tarballs was significantly higher than all the other samples which indicates that asphaltenes content positively correlated with the tendency of those oil residues to sink Density was a factor but does not appear to be as critical as the percent asphaltenes with respect to sinking tarballs
The majority of residues from the Deepwater Horizon oil spill retained their oil biomarker signatures making diagnostic ratio analyses possible The diagnostic ratios were used to
1) Determine if the oil residue was a match to MC252 oil and 2) Determine if there were any differences in the ratios in matching oil residues based on
sample matrix and sampling location
A total of 4 out of the 15 diagnostic biomarker ratios did distinguish in-situ burn residues from the majority of the other residues Two of these ratios C28 aaa-RC29 aaa-R and C27 BB (S+R)C28 BB (S+R) + C29 BB (S+R) may be useful for distinguishing ISB oil from other oil residues and ISB tarballs from other tarballs respectively Significant differences were also determined in the comparison of sampling locations These differences suggest that weathering of oil residues from the same initial source is highly dependent on the specific environmental compartment in which they reside without compromising the ability to make matchnon-match determinations with the same ratios
44
The in-situ burning research described in this report combined retrospective analysis of samples collected during the Deepwater Horizon response with new laboratory work and interpretation to increase the relevance and applicability of the physical and chemical results The methodological refinements improved our abilities to distinguish burn products from other weathered oil matrices and helped to confirm the generalized source attributions to burn operations that were made shortly after tarballs were encountered in the Gulf of Mexico royal red shrimp fishery It is important to note that the chemical characterization method (GC-MS) and target analyte list used for this report only examines about 5 of the oil mass Other analytical methods such as GCxGC-FID (Aeppli et al 2014) or APPI FT-ICR MS have become standard instrument systems for analyzing crude oil Both have advantages over GC-MS in that they can separate and identify a much larger percentage of oil compounds however it cannot be denied that GC-MS is still relevant and is one of the most recognized instrument systems for characterizing crude oil in the environment
The Deepwater Horizon spill experience validated the operational feasibility and practical application of in-situ burning as an open water response method Like nearly everything else about this incident the scale of in-situ burn operations was unprecedented between 28 April and 19 July 2010 over 400 individual burns took place consuming an estimated 220000-310000 bbl of oil This is roughly equivalent to the total volume for the Exxon Valdez oil spill in 1989
Implicit in these numbers is the large volume of in-situ burn residue that was generated during the Deepwater Horizon operations Using the standard in-situ burn efficiency estimates of 90-95 percent the amount of residue resulting from the operations potentially ranged from 11000shy33000 bbl This is a substantial amount of petroleum hydrocarbons introduced into a relatively small portion of the marine environmentmdashalthough it should be noted that natural seeps contribute an estimated 560000 to 14 million bbl of oil into the waters of the Gulf of Mexico (National Research Council 2003) each year (note seep locations in Figure 26)
The fate of the burn residue from the Deepwater Horizon in-situ burn operations might never have been known were it not for the chance encounters of the single deep water fishery operating in the same general area as most of the burn operations (Figure 26) Impacts to the fishery were minimal and it was quickly re-opened after testing and analysis by federal fisheries managers and seafood safety specialists However the residue and fishery interactions that occurred in 2010 and 2011 represent a cautionary footnote to large-scale in-situ burn operations that should be factored into tradeoff analysis for future spill responses Further the Deepwater Horizon experience suggests a need for additional research into burn residue containment or recovery methods that would reduce or eliminate potential fishery impacts associated with sinking residue
On a final note we recommend that the Environmental Unit for a spill response where burn operations are regularly taking place should collaborate with the Operations Section to collect analyze and archive paired samples of pre- and post-burn oil to facilitate the process of source identification of oil residues encountered during a response In doing so a solid empirical database of physical and chemical characteristics would be built over time to permit a better understanding of the changes occurring to oil during in-situ burning the circumstances in which residues will floatsink and the specific markers and physical features that might be used to uniquely identify burn residues
45
Figure 26 Composite map showing locations of the Macondo wellhead in-situ burn operations royal red shrimp trawls with preliminary source identifications and known hydrocarbon seeps Numbers in boxes denote approximate tarball counts in each quadrant Prepared by JB Huyett Genwest Systems
46
REFERENCES
Aeppli C RK Nelson JR Radović CA Carmichael DL Valentine and CM Reddy 2014 Recalcitrance and degradation of petroleum biomarkers upon abiotic and biotic natural weathering of Deepwater Horizon oil Environmental Science and Technology 486726-6734
Allen AA NJ Mabile D Jaeger and D Costanzo 2011 The use of controlled burning during the Gulf of Mexico Deepwater Horizon MC-252 oil spill response In Proceedings of the 2011 International Oil Spill Conference 23-26 May 2011 Portland OR 13 pp
httpdxdoiorg1079012169-3358-2011-1-194
American Society for Testing Materials D71-94(2009) Standard test method for relative density of solid pitch and asphalt (displacement method) ASTM International West Conshohocken PA 2012
American Society for Testing Materials D3279-12 Standard test method for n-heptane insoluble ASTM International West Conshohocken PA 2012
Anderson WW and MJ Lindner 1971 Contributions to the biology of the royal red shrimp Hymenopenaeus robustus Smith Fishery Bulletin 69(2)313-336
Boehm PD and JW Farrington 1984 Aspects of the polycyclic aromatic hydrocarbon geochemistry of recent sediments in the Georges Bank Region Environmental Science and Technology 18(11)840-845
Bullis HR Jr 1956 Preliminary results of deep-water exploration for shrimp in the Gulf of Mexico by the MV Oregon (1950-1956) Commer Fish Rev 18(12)1-12
Buist I 1998 Window of opportunity for in situ burning In Proceddings of the In Situ Burning of Oil Spills Workshop US Minerals Management Service Special Publication 935 21-30
Buist I and K Trudel 1995 Laboratory studies of the properties of in-situ burn residues Marine Spill Response Corporation Washington DC MSRC Technical Report Series 95-010 110 p
Buist I K Trudel J Morrison and D Aurand 1995 Laboratory studies of the physical properties of in-situ burn residues In Proceedings of the Eighteenth Arctic and Marine Oilspill Program (AMOP) June 14-16 1995 Edmonton Alberta 1027-1051
Buist I K Trudel J Morrison and D Aurand 1997 Laboratory studies of the properties of in-situ burn residues In Proceedings of the 1997 International Oil Spill Conference April 1997 1997(1)149-156
Cascorbi A 2007 Wild-caught warmwater shrimp (Infraorder Penaeus--the Penaeid shrimps) Gulf of Mexico and US South Atlantic Regions Seafood Watch Seafood Report Monterey Bay Aquarium 52 pp
Douglas GS AE Bence RC Prince SJ McMillen and EL Butler 1996 Environmental stability of selected petroleum hydrocarbon source and weathering ratios Environmental Science and Technology 30(7)2332-2339
47
Farfante IP 1988 Illustrated key to Penaeoid shrimps of commerce in the Americas NOAA Technical Report NMFS 64 April 1988 32 pp
Federal Interagency Solutions Group Oil Budget Calculator Science and Engineering Team 2010 Oil Budget Calculator Deepwater Horizon Technical Documentation A Report to the National Incident Command November 2010 49 pp + appendices
Fingas MF G Halley F Ackerman N Vanderkooy R Nelson MC Bissonnette N Laroche P Lambert P Jokuty K Li W Halley G Warbanski PR Campagna RD Turpin MJ Trespalacios D Dickins EJ Tennyson D Aurand and R Hiltabrand 1994a The Newfoundland Offshore Burn Experiment ndash NOBE experimental design and overview In Proceedings of the Seventeenth Arctic and Marine Oilspill Program (AMOP) June 8-10 1994 Vancouver British Columbia 1053-1063
Fingas MF F Ackerman K Li P Lambert Z Wang MC Bissonnette PR Campagna P Boileau N Laroche P Jokuty R Nelson RD Turpin MJ Trespalacios G Halley J Belanger J Pareacute N Vanderkooy EJ Tennyson D Aurand and R Hiltabrand 1994b The Newfoundland Offshore Burn Experiment ndash NOBE preliminary results of emissions measurement In Proceedings of the Seventeenth Arctic and Marine Oilspill Program (AMOP) June 8-10 1994 Vancouver British Columbia 1099-1164
Fingas M 2011 An overview of in-situ burning Chapter 23 in M Fingas (ed) Oil Spill Science and Technology New York Gulf Professional PublishingElsevier 737-903
Fingas M 2015 Introduction to Oil Chemistry and Properties In Handbook of Oil Spill Science and Technology M Fingas Ed Hoboken NJ John Wiley amp Sons Inc
Garrett RM CC Gueacutenette CE Haith and RC Prince 2000 Pyrogenic polycyclic aromatic hydrocarbons in oil burn residues Environmental Science and Technology 34(10)1934-1937
Gulf of Mexico Fishery Management Council 2004 Appendix C Information on Species Distributions and Habitat Associations Final Environmental Impact Statement for the Generic Essential Fish Habitat Amendment to the following fishery management plans of the Gulf of Mexico (GOM) shrimp fishery of the Gulf of Mexico red drum fishery of the Gulf of Mexico reef fish fishery of the Gulf of Mexico stone crab fishery of the Gulf of Mexico coral and coral reef fishery of the Gulf of Mexico spiny lobster fishery of the Gulf of Mexico and South Atlantic coastal migratory pelagic resources of the Gulf of Mexico and South Atlantic 262 pp
Gulf of Mexico Fishery Management Council 2005 Final Amendment Number 13 to the Fishery Management Plan for the Shrimp Fishery of the Gulf of Mexico US Waters with Environmental Assessment Regulatory Impact Review and Regulatory Flexibility Act analysis August 24 2005 272 pp
Hansen AB PS Daling LG Faksness KR Sorheim P Kienhuis and R Duus 2007 Emerging CEN Methodology for Oil Spill Identification In Oil Spill Environmental Forensics Z Wang and SA Stout Eds Boston MA Elsevier
Jaeger A 2011 Personal communication 27 September 2011
Kucklick JH and D Aurand 1997 Historical dispersant and in-situ burning opportunities in the
48
United States Proc 1997 International Oil Spill Conference 805 ndash 810
Leahy JG and RR Colwell 1990 Microbial degradation of hydrocarbons in the environment Microbiological Reviews 54305-315
Lewan MD A Warden RF Dias ZK Lowry TL Hannah PG Lillis RF Kokaly TM Hoefen GA Swayze CT Mills SH Harris GS Plumlee 2014 Organic Geochemistry 75(2014)54-60
Meyer BM EB Overton and RE Turner 2014 Oil source identification using diagnostic biomarker ratio analyses In 2014 International Oil Spill Conference Proceedings Savannah GA May 5-9 2014(1)2064-2073
Michel J D Scholz SR Warren Jr and AH Walker 2005 In-situ burning A decision-makerrsquos guide to in-situ burning API Publication Number 4740 Washington DC American Petroleum Institute 60 pp
Mills MA TJ McDonald JS Bonner MA Simon and RL Autenrieth 1999 Method for quantifying the fate of petroleum in the environment Chemosphere 39(14)2563-2582
Mullin JV and MA Champ 2003 Introductionoverview to in situ burning of oil spills Spill Science amp Technology 8(4)323-330
National Research Council Committee on Oil in the Sea 2003 Oil in the Sea III Inputs Fates and Effects National Research Council Ocean Studies Board and Marine Board Divisions of Earth and Life Studies and Transportation Research Board Washington DC National Academy Press 265 pp
Operational Science Advisory Team-2 2011 Net Environmental Benefits Analysis (NEBA) Annex M to Summary Report for Fate and Effects of Remnant Oil in the Beach Environment prepared for Lincoln D Stroh US Coast Guard Federal On-Scene Coordinator 48 pp
Overton EB WD Sharp and P Roberts 1994 Toxicity of Petroleum In Basic Environmental Toxicology LG Cockerham and BS Shane Eds Boca Raton FL CRC Press Inc
Prince RC DL Elmendorf JR Lute CS Hsu CE Haith JD Senius GJ Dechert GS Douglas and EL Butler 1994 17α(H)21β(H)-hopane as a conserved internal marker for estimating the biodegradation of crude oil Environmental Science and Technology 28(1)142-145
SL Ross Environmental Research Ltd 2010 Spill Related Properties of MC252 Crude Oil Sample ENT-052210-178 Appendix 8 to Oil Budget Calculator Deepwater Horizon Technical Documentation A Report to the National Incident Command November 2010 7 pp
Stiles ML E Harrould-Kolieb P Faure H Ylitalo-Ward and MF Hirshfield 2007 Deep sea trawl fisheries of the Southeast US and Gulf of Mexico rock shrimp royal red shrimp calico scallops Report for Oceana May 2007 18 pp
US Coast Guard 2011 BP Deepwater Horizon Oil Spill Incident Specific Preparedness Review (ISPR) Final Report Report prepared for ADM RJ Papp Commandant January 2011 158 pp
Wang Z M Fingas YY Shu L Sigouin M Landriault P Lambert R Turpin P Campagna and J
49
Mullin 1999 Quantitative characterization of PAHs in burn residue and soot samples and differentiation of pyrogenic PAHs from petrogenic PAHsmdashthe 1994 Mobile burn study Environ Sci Technol 33(18)3100-3109
Zack S 2007 Royal red shrimp Stoningtonrsquos succulent secret Connecticut Sea GrantWrack Lines 72 FallWinter 2007 6 pp
ACKNOWLEDGMENTS
Funding for this project was provided by the US Department of the Interior Bureau of Safety and Environmental Enforcement (BSEE) under Interagency Agreement E13PG00001 We thank the outside peer reviewers recruited by BSEE for their constructive comments and criticism and for improving the clarity of the project report The authors wish to acknowledge the assistance and support of Alan A Allen of Spiltec and Nere Mabile of BP during the Deepwater Horizon response in Houma LA CPO RJ Schrader of the US Coast Guard shared his expertise experiences and photographs from the field implementation of in-situ burn operations during the spill The data analysis for this report was generated using SAS software Version 93 of the SAS System for Windows Copyright copy 2002-2010 by SAS Institute Inc SAS and all other SAS Institute Inc product or service names are registered trademarks or trademarks of SAS Institute Inc Cary NC USA
DISCLAIMER
Reference to specific commercial products process or service by trade name trademark manufacturer or otherwise does not constitute or imply their endorsement recommendation or favoring by the United States Government The views and opinions of authors expressed do not necessarily state or reflect those of the United States Government and shall not be used for advertising or product endorsement purposes
50
APPENDIX 1
DIAGNOSTIC BIOMARKER RATIOS
Petroleum Biomarkers Used For Calculating MC252 Diagnostic Ratios
Abbreviation Compound Name mz Value
C27 18α(H)-222930-trisnorneohopane 191C27 Ts C27 Tm C27 17α(H)-222930-trisnorhopane 191 C29 aB C29 17α(H)21β(H)-30-norhopane 191 C29 Ts C29 18α(H)-30-norneohopane 191 C30 aB C30 17α(H)21β(H)-hopane 191 C31 aB (S+R) C31 17α(H)21β(H)-22(S+R)-homohopane 191 C32 aB (S+R) C32 17α(H)21β(H)-22(S+R)-bishomohopane 191 C33 aB (S+R) C32 17α(H)21β(H)-22(S+R)-trishomohopane 191 C27D Ba-S C27 13β(H)17α(H)20S-diasterane 217 C27D Ba-R C27 13β(H)17α(H)20R-diasterane 217 C29D Ba-S C29 24-ethyl-13β(H)17α(H)20S-diacholestane 217 C29D Ba-R C29 24-ethyl-13β(H)17α(H)20R-diacholestane 217 C28 aaa-R C28 24-methyl-5α(H)14α(H)17α(H) 20R-cholestane 217 C29 aaa-R C29 24-ethyl-5α(H)14α(H)17α(H) 20R-cholestane 217 C27 BB (R+S) C27 5α(H)14β(H)17β(H)-cholestane (20R+20S) 218 C28 BB (R+S) C28 24-methyl-5α(H)14β(H)17β(H)-cholestane (20R+20S) 218 C29 BB (R+S) C29 24-ethyl-5α(H)14β(H)17β(H)-cholestane (20R+20S) 218 C20 TA C20-triaromatic steroid (pregnane derivative) 231 C21 TA C21-triaromatic steroid (homopregnane derivative) 231 C26 TA-S C26-triaromatic steroid20S (cholestane derivative) 231 C28 TA-S C28-triaromatic steroid20S (ethylcholestane derivative) 231 C27 TA-R C27-triaromatic steroid20R (methylcholestane derivative) 231 C28 TA-R C28-triaromatic steroid20R (ethylcholestane derivative) 231
52
Diagnostic Ratios Chosen for MC252 Source Oil
Ratio mz
Value
C27 Ts C27 Tm 191
C29 aBC29 Ts 191
C29 aBC30 aB 191
C31 aB(S+R)C32 aB(S+R) + C33 aB(S+R) 191
C32 aB(S+R)C31 aB(S+R) + C33 aB(S+R) 191
C33 aB(S+R)C31 aB(S+R) + C32 aB(S+R) 191
C27D Ba-SC27D Ba-R 217
C29D Ba-SC29D Ba-R 217
C28 aaa-RC29 aaa-R 217
C27 BB(R+S)C28 BB(R+S) + C29 BB(R+S) 218
C28 BB(R+S)C27 BB(R+S) + C29 BB(R+S) 218
C29 BB(R+S)C27 BB(R+S) + C28 BB(R+S) 218
C20 TAC21 TA 231
C26 TA-SC28 TA-S 231
C27 TA-RC28 TA-R 231
53

-150
-100
-50
0
50
100
150
200
250
300
350
NA
PH
C1-N
aphs
C2-N
aphs
C3-N
aphs
C4-N
aphs
FLU
OR
C1-F
luor
s
C2-F
luor
s
C3-F
luor
s
DB
T
C1-D
BTs
C2-D
BTs
C3-D
BTs
PHEN
C1-P
hens
C2-P
hens
C3-P
hens
C4-P
hens
AN
TH
FLU
OR
AN
T
PYR
C1-P
yrs
C2-P
yrs
C3-P
yrs
C4-P
yrs
NB
T
C-1
NB
Ts
C-2
NB
Ts
C-3
NB
Ts
B[a
]AN
TH
CHR
Y
C1-C
hrys
C2-C
hrys
C3-C
hrys
C4-C
hrys
B[b
]F
B[k
]F
B[e
]P
B[a
]P
PER
YL
D[a
h]A
B[g
hi]
P
IN
CREA
SE O
R D
ECR
EASE
(a) Fresh Surrogate Oil
-150
-50
50
150
250
350
450
NA
PH
C1-N
aphs
C2-N
aphs
C3-N
aphs
C4-N
aphs
FLU
OR
C1-F
luor
s
C2-F
luor
s
C3-F
luor
s
DB
T
C1-D
BTs
C2-D
BTs
C3-D
BTs
PHEN
C1-P
hens
C2-P
hens
C3-P
hens
C4-P
hens
AN
TH
FLU
OR
AN
T
PYR
C1-P
yrs
C2-P
yrs
C3-P
yrs
C4-P
yrs
NB
T
C-1
NB
Ts
C-2
NB
Ts
C-3
NB
Ts
B[a
]AN
TH
CHR
Y
C1-C
hrys
C2-C
hrys
C3-C
hrys
C4-C
hrys
B[b
]F
B[k
]F
B[e
]P
B[a
]P
PER
YL
D[a
h]A
B[g
hi]
P
IN
CREA
SE O
R D
ECR
EASE
(b) 15 Weathered Surrogate Oil
Figure 25 Determination of percent increase or decrease of target analytes based on hopane normalization for (a) Fresh surrogate oil and (b) 15 Weathered surrogate oil
41
Task 6 Forensic interpretation of analytical results to characterize physical and chemical changes occurring during the combustion of oil to include comparison of changes occurring in various weathered oil samples and identification of potential markers for in-situ burn residues
A primary objective of the forensic interpretation of analytical results was to determine if residues from in-situ burning during the Deepwater Horizon response had measurable characteristics that could distinguish them from other MC252 residues Results from the other tasks previously discussed indicated that these characteristics included bull Significant increase in density and percent asphaltenes bull Enhancement of pyrogenic PAHs bull Decrease in the FFPI Increase in the Wang Pyrogenic Index and bull Evidence of thermal combustion in the normal alkane profile
However it appears that all of these discriminating factors must be present to make the distinction between sources with any confidence Because of this limitation the forensic interpretation was expanded to include a statistical analysis of sample matrices and sampling locations based on the diagnostic biomarker ratio analyses
A total of 130 suspected MC252 residues was initially chosen All samples were grouped according to year sample matrix (eg ISB oil ISB tarball oil other sediment or tarball) and sampling location (eg marsh ocean depth shore or water surface) These samples were then narrowed to a total of 112 by the diagnostic ratio analyses Only samples determined to be a statistical match to MC252 oil were used in the matrix and sampling location comparisons A one-way ANOVA with a post-hoc Tukey-Kramer pairwise comparison Table 12 was applied to the sample matrix analysis for each of the 15 diagnostic ratios to determine if any of the ratios could distinguish between in-situ burn residues and other MC252 oil residues The Tukey-Kramer comparison separates samples into lettered groups based on the minimum significant difference between means (p=005) Groups with the same letter have means that are not significantly different from each other and groups with differing letters are significantly different from each other For the sample location effects a nested ANOVA with random effects and a variance components covariance structure was carried out for each diagnostic ratio to determine if there were any differences due to location of sample collection In both cases the sample number in each matrix or location was highly unbalanced
A total of 7 out of 15 diagnostic ratios had significant differences between sample matrices Of these 7 ratios 4 showed significant differences between in-situ burn residues and other MC252 oil residues
bull The hopane ratio C31 aB (S+R)C32 aB (S+R) + C33 aB (S+R) was significantly different for ISB oil and ISB tarball Both of the in-situ burn residues were significantly different from all other matrices except the tarball matrix
bull Another hopane ratio C33 aB (S+R)C31 aB (S+R) + C32 aB (S+R) for ISB tarball was significantly different from all other matrices and ISB oil was significantly different from all other matrices except tarball and oil
bull The diasterane and regular sterane ratio C28 aaa-RC29 aaa-R was significantly different when comparing ISB oil and oil residues
42
bull The last significant ratio was C27 BB (S+R)C28 BB (S+R) + C29 BB (S+R) (in the 14(β)H-steranes group) This ratio was significantly different when comparing ISB tarballs to other tarballs
Table 12 Tukey-Kramer Pairwise Comparisons of Diagnostic Ratios for Different Matrices
C31 aB (S+R)C32 aB (S+R) + C33 aB (S+R) C28 aaa-RC29 aaa-R
Matrix Mean SE Group Matrix Mean SE Group
Sediment 10533 183E-02 A Oil 07825 943E-03 A
Other 09933 183E-02 AB Other 07767 267E-02 AB
Oil 09575 648E-03 BC Tarball 07592 740E-03 AB
ISBTarball 09451 508E-03 BCD 07477 906E-03 AB
Tarball
ISB Oil 09309 662E-03 CD Sediment 07400 267E-02 AB
ISB 09300 622E-03 D ISB Oil 07361 963E-03 B
Tarball
C33 aB (S+R)C31 aB (S+R) + C32 aB (S+R) C27 BB (S+R)C28 BB (S+R) + C29 BB (S+R)
Matrix Mean SE Group Matrix Mean SE Group
ISB Tarball
02788 290E-03 A Other 07550 345E-02 AB
ISB Oil 02743 309E-03 AB Tarball 07500 824E-03 A
Tarball 02667 237E-03 BC Oil 07340 218E-01 AB
Oil 02646 302E-03 BCD ISB Tarball
07006 115E-01 B
Other 02467 855E-03 CD Sediment 07000 282E-01 AB
Sediment 02400 855E-03 D ISB Oil 06900 218E-02 AB
Therefore C28 aaa-RC29 aaa-R may be useful for distinguishing ISB oil from other oil residues and C27 BB (S+R)C28 BB (S+R) + C29 BB (S+R) may be useful distinguishing ISB tarballs from other tarballs
A total of 5 out of 15 diagnostic ratios showed significant differences between sample matrix and sampling location The statistical analysis did not determine which matrix by sampling location was significant it was performed to determine if sampling location was a factor in distinguishing some of these oil residues Sampling location can have an important role because this often governs how oil residues weather Therefore this analysis supported the notion that oil residues from the same type of oil may show different characteristics determined by differences in weathering in various sampling locations without compromising the ability to make statistical matchnon-match determinations with the same ratios
43
SUMMARY AND CONCLUSIONS
A primary objective of this study was to identify possible indicators that could distinguish in-situ burn residues from other oil residues based on physical and chemical analyses of actual Deepwater Horizon in-situ burn samples Unfortunately while there is no single reliable indicator of in-situ burning partial indicators (eg different normal alkane profile enhancement of pyrogenic PAHs and reduction in the modified Fossil Fuel Pollution Index) when considered as an integrated whole can point to in-situ burning as a significant driver of weathering and fate Table 3 shows some of the characteristics assessed in this study Notable in these results is the enhancement in asphaltenes content for known burn residues and the tarballs recovered from deep water shrimp trawls
Table 13 Comparison of Physical and Chemical Characteristics for Different Oil Matrices
MC252 SLC Pre- SLC Post- ISB Oil ISB Oil Shrimp Other MC252 Riser Burn Burn Pre-Burn Post-Burn Tarballs Tarballs
Density gmL 084 086 084 088 096 104 086
Asphaltene 09-10 10 198 15 42 22 15
FFPI 083 079 070 077 065 062 059 Wang Pyrogenic
0004 001 004 001 007 006 004 Index
Even the use of a series of partial indicators must be employed cautiously comparison of the normal alkane profile for example has the caveat that the same profile was not observed in oil residues collected immediately after in-situ burning The distinctive profile appeared only in tarballs that had been recovered from trawls two hundred meters below the ocean surface The asphaltenes content of the shrimp trawl tarballs was significantly higher than all the other samples which indicates that asphaltenes content positively correlated with the tendency of those oil residues to sink Density was a factor but does not appear to be as critical as the percent asphaltenes with respect to sinking tarballs
The majority of residues from the Deepwater Horizon oil spill retained their oil biomarker signatures making diagnostic ratio analyses possible The diagnostic ratios were used to
1) Determine if the oil residue was a match to MC252 oil and 2) Determine if there were any differences in the ratios in matching oil residues based on
sample matrix and sampling location
A total of 4 out of the 15 diagnostic biomarker ratios did distinguish in-situ burn residues from the majority of the other residues Two of these ratios C28 aaa-RC29 aaa-R and C27 BB (S+R)C28 BB (S+R) + C29 BB (S+R) may be useful for distinguishing ISB oil from other oil residues and ISB tarballs from other tarballs respectively Significant differences were also determined in the comparison of sampling locations These differences suggest that weathering of oil residues from the same initial source is highly dependent on the specific environmental compartment in which they reside without compromising the ability to make matchnon-match determinations with the same ratios
44
The in-situ burning research described in this report combined retrospective analysis of samples collected during the Deepwater Horizon response with new laboratory work and interpretation to increase the relevance and applicability of the physical and chemical results The methodological refinements improved our abilities to distinguish burn products from other weathered oil matrices and helped to confirm the generalized source attributions to burn operations that were made shortly after tarballs were encountered in the Gulf of Mexico royal red shrimp fishery It is important to note that the chemical characterization method (GC-MS) and target analyte list used for this report only examines about 5 of the oil mass Other analytical methods such as GCxGC-FID (Aeppli et al 2014) or APPI FT-ICR MS have become standard instrument systems for analyzing crude oil Both have advantages over GC-MS in that they can separate and identify a much larger percentage of oil compounds however it cannot be denied that GC-MS is still relevant and is one of the most recognized instrument systems for characterizing crude oil in the environment
The Deepwater Horizon spill experience validated the operational feasibility and practical application of in-situ burning as an open water response method Like nearly everything else about this incident the scale of in-situ burn operations was unprecedented between 28 April and 19 July 2010 over 400 individual burns took place consuming an estimated 220000-310000 bbl of oil This is roughly equivalent to the total volume for the Exxon Valdez oil spill in 1989
Implicit in these numbers is the large volume of in-situ burn residue that was generated during the Deepwater Horizon operations Using the standard in-situ burn efficiency estimates of 90-95 percent the amount of residue resulting from the operations potentially ranged from 11000shy33000 bbl This is a substantial amount of petroleum hydrocarbons introduced into a relatively small portion of the marine environmentmdashalthough it should be noted that natural seeps contribute an estimated 560000 to 14 million bbl of oil into the waters of the Gulf of Mexico (National Research Council 2003) each year (note seep locations in Figure 26)
The fate of the burn residue from the Deepwater Horizon in-situ burn operations might never have been known were it not for the chance encounters of the single deep water fishery operating in the same general area as most of the burn operations (Figure 26) Impacts to the fishery were minimal and it was quickly re-opened after testing and analysis by federal fisheries managers and seafood safety specialists However the residue and fishery interactions that occurred in 2010 and 2011 represent a cautionary footnote to large-scale in-situ burn operations that should be factored into tradeoff analysis for future spill responses Further the Deepwater Horizon experience suggests a need for additional research into burn residue containment or recovery methods that would reduce or eliminate potential fishery impacts associated with sinking residue
On a final note we recommend that the Environmental Unit for a spill response where burn operations are regularly taking place should collaborate with the Operations Section to collect analyze and archive paired samples of pre- and post-burn oil to facilitate the process of source identification of oil residues encountered during a response In doing so a solid empirical database of physical and chemical characteristics would be built over time to permit a better understanding of the changes occurring to oil during in-situ burning the circumstances in which residues will floatsink and the specific markers and physical features that might be used to uniquely identify burn residues
45
Figure 26 Composite map showing locations of the Macondo wellhead in-situ burn operations royal red shrimp trawls with preliminary source identifications and known hydrocarbon seeps Numbers in boxes denote approximate tarball counts in each quadrant Prepared by JB Huyett Genwest Systems
46
REFERENCES
Aeppli C RK Nelson JR Radović CA Carmichael DL Valentine and CM Reddy 2014 Recalcitrance and degradation of petroleum biomarkers upon abiotic and biotic natural weathering of Deepwater Horizon oil Environmental Science and Technology 486726-6734
Allen AA NJ Mabile D Jaeger and D Costanzo 2011 The use of controlled burning during the Gulf of Mexico Deepwater Horizon MC-252 oil spill response In Proceedings of the 2011 International Oil Spill Conference 23-26 May 2011 Portland OR 13 pp
httpdxdoiorg1079012169-3358-2011-1-194
American Society for Testing Materials D71-94(2009) Standard test method for relative density of solid pitch and asphalt (displacement method) ASTM International West Conshohocken PA 2012
American Society for Testing Materials D3279-12 Standard test method for n-heptane insoluble ASTM International West Conshohocken PA 2012
Anderson WW and MJ Lindner 1971 Contributions to the biology of the royal red shrimp Hymenopenaeus robustus Smith Fishery Bulletin 69(2)313-336
Boehm PD and JW Farrington 1984 Aspects of the polycyclic aromatic hydrocarbon geochemistry of recent sediments in the Georges Bank Region Environmental Science and Technology 18(11)840-845
Bullis HR Jr 1956 Preliminary results of deep-water exploration for shrimp in the Gulf of Mexico by the MV Oregon (1950-1956) Commer Fish Rev 18(12)1-12
Buist I 1998 Window of opportunity for in situ burning In Proceddings of the In Situ Burning of Oil Spills Workshop US Minerals Management Service Special Publication 935 21-30
Buist I and K Trudel 1995 Laboratory studies of the properties of in-situ burn residues Marine Spill Response Corporation Washington DC MSRC Technical Report Series 95-010 110 p
Buist I K Trudel J Morrison and D Aurand 1995 Laboratory studies of the physical properties of in-situ burn residues In Proceedings of the Eighteenth Arctic and Marine Oilspill Program (AMOP) June 14-16 1995 Edmonton Alberta 1027-1051
Buist I K Trudel J Morrison and D Aurand 1997 Laboratory studies of the properties of in-situ burn residues In Proceedings of the 1997 International Oil Spill Conference April 1997 1997(1)149-156
Cascorbi A 2007 Wild-caught warmwater shrimp (Infraorder Penaeus--the Penaeid shrimps) Gulf of Mexico and US South Atlantic Regions Seafood Watch Seafood Report Monterey Bay Aquarium 52 pp
Douglas GS AE Bence RC Prince SJ McMillen and EL Butler 1996 Environmental stability of selected petroleum hydrocarbon source and weathering ratios Environmental Science and Technology 30(7)2332-2339
47
Farfante IP 1988 Illustrated key to Penaeoid shrimps of commerce in the Americas NOAA Technical Report NMFS 64 April 1988 32 pp
Federal Interagency Solutions Group Oil Budget Calculator Science and Engineering Team 2010 Oil Budget Calculator Deepwater Horizon Technical Documentation A Report to the National Incident Command November 2010 49 pp + appendices
Fingas MF G Halley F Ackerman N Vanderkooy R Nelson MC Bissonnette N Laroche P Lambert P Jokuty K Li W Halley G Warbanski PR Campagna RD Turpin MJ Trespalacios D Dickins EJ Tennyson D Aurand and R Hiltabrand 1994a The Newfoundland Offshore Burn Experiment ndash NOBE experimental design and overview In Proceedings of the Seventeenth Arctic and Marine Oilspill Program (AMOP) June 8-10 1994 Vancouver British Columbia 1053-1063
Fingas MF F Ackerman K Li P Lambert Z Wang MC Bissonnette PR Campagna P Boileau N Laroche P Jokuty R Nelson RD Turpin MJ Trespalacios G Halley J Belanger J Pareacute N Vanderkooy EJ Tennyson D Aurand and R Hiltabrand 1994b The Newfoundland Offshore Burn Experiment ndash NOBE preliminary results of emissions measurement In Proceedings of the Seventeenth Arctic and Marine Oilspill Program (AMOP) June 8-10 1994 Vancouver British Columbia 1099-1164
Fingas M 2011 An overview of in-situ burning Chapter 23 in M Fingas (ed) Oil Spill Science and Technology New York Gulf Professional PublishingElsevier 737-903
Fingas M 2015 Introduction to Oil Chemistry and Properties In Handbook of Oil Spill Science and Technology M Fingas Ed Hoboken NJ John Wiley amp Sons Inc
Garrett RM CC Gueacutenette CE Haith and RC Prince 2000 Pyrogenic polycyclic aromatic hydrocarbons in oil burn residues Environmental Science and Technology 34(10)1934-1937
Gulf of Mexico Fishery Management Council 2004 Appendix C Information on Species Distributions and Habitat Associations Final Environmental Impact Statement for the Generic Essential Fish Habitat Amendment to the following fishery management plans of the Gulf of Mexico (GOM) shrimp fishery of the Gulf of Mexico red drum fishery of the Gulf of Mexico reef fish fishery of the Gulf of Mexico stone crab fishery of the Gulf of Mexico coral and coral reef fishery of the Gulf of Mexico spiny lobster fishery of the Gulf of Mexico and South Atlantic coastal migratory pelagic resources of the Gulf of Mexico and South Atlantic 262 pp
Gulf of Mexico Fishery Management Council 2005 Final Amendment Number 13 to the Fishery Management Plan for the Shrimp Fishery of the Gulf of Mexico US Waters with Environmental Assessment Regulatory Impact Review and Regulatory Flexibility Act analysis August 24 2005 272 pp
Hansen AB PS Daling LG Faksness KR Sorheim P Kienhuis and R Duus 2007 Emerging CEN Methodology for Oil Spill Identification In Oil Spill Environmental Forensics Z Wang and SA Stout Eds Boston MA Elsevier
Jaeger A 2011 Personal communication 27 September 2011
Kucklick JH and D Aurand 1997 Historical dispersant and in-situ burning opportunities in the
48
United States Proc 1997 International Oil Spill Conference 805 ndash 810
Leahy JG and RR Colwell 1990 Microbial degradation of hydrocarbons in the environment Microbiological Reviews 54305-315
Lewan MD A Warden RF Dias ZK Lowry TL Hannah PG Lillis RF Kokaly TM Hoefen GA Swayze CT Mills SH Harris GS Plumlee 2014 Organic Geochemistry 75(2014)54-60
Meyer BM EB Overton and RE Turner 2014 Oil source identification using diagnostic biomarker ratio analyses In 2014 International Oil Spill Conference Proceedings Savannah GA May 5-9 2014(1)2064-2073
Michel J D Scholz SR Warren Jr and AH Walker 2005 In-situ burning A decision-makerrsquos guide to in-situ burning API Publication Number 4740 Washington DC American Petroleum Institute 60 pp
Mills MA TJ McDonald JS Bonner MA Simon and RL Autenrieth 1999 Method for quantifying the fate of petroleum in the environment Chemosphere 39(14)2563-2582
Mullin JV and MA Champ 2003 Introductionoverview to in situ burning of oil spills Spill Science amp Technology 8(4)323-330
National Research Council Committee on Oil in the Sea 2003 Oil in the Sea III Inputs Fates and Effects National Research Council Ocean Studies Board and Marine Board Divisions of Earth and Life Studies and Transportation Research Board Washington DC National Academy Press 265 pp
Operational Science Advisory Team-2 2011 Net Environmental Benefits Analysis (NEBA) Annex M to Summary Report for Fate and Effects of Remnant Oil in the Beach Environment prepared for Lincoln D Stroh US Coast Guard Federal On-Scene Coordinator 48 pp
Overton EB WD Sharp and P Roberts 1994 Toxicity of Petroleum In Basic Environmental Toxicology LG Cockerham and BS Shane Eds Boca Raton FL CRC Press Inc
Prince RC DL Elmendorf JR Lute CS Hsu CE Haith JD Senius GJ Dechert GS Douglas and EL Butler 1994 17α(H)21β(H)-hopane as a conserved internal marker for estimating the biodegradation of crude oil Environmental Science and Technology 28(1)142-145
SL Ross Environmental Research Ltd 2010 Spill Related Properties of MC252 Crude Oil Sample ENT-052210-178 Appendix 8 to Oil Budget Calculator Deepwater Horizon Technical Documentation A Report to the National Incident Command November 2010 7 pp
Stiles ML E Harrould-Kolieb P Faure H Ylitalo-Ward and MF Hirshfield 2007 Deep sea trawl fisheries of the Southeast US and Gulf of Mexico rock shrimp royal red shrimp calico scallops Report for Oceana May 2007 18 pp
US Coast Guard 2011 BP Deepwater Horizon Oil Spill Incident Specific Preparedness Review (ISPR) Final Report Report prepared for ADM RJ Papp Commandant January 2011 158 pp
Wang Z M Fingas YY Shu L Sigouin M Landriault P Lambert R Turpin P Campagna and J
49
Mullin 1999 Quantitative characterization of PAHs in burn residue and soot samples and differentiation of pyrogenic PAHs from petrogenic PAHsmdashthe 1994 Mobile burn study Environ Sci Technol 33(18)3100-3109
Zack S 2007 Royal red shrimp Stoningtonrsquos succulent secret Connecticut Sea GrantWrack Lines 72 FallWinter 2007 6 pp
ACKNOWLEDGMENTS
Funding for this project was provided by the US Department of the Interior Bureau of Safety and Environmental Enforcement (BSEE) under Interagency Agreement E13PG00001 We thank the outside peer reviewers recruited by BSEE for their constructive comments and criticism and for improving the clarity of the project report The authors wish to acknowledge the assistance and support of Alan A Allen of Spiltec and Nere Mabile of BP during the Deepwater Horizon response in Houma LA CPO RJ Schrader of the US Coast Guard shared his expertise experiences and photographs from the field implementation of in-situ burn operations during the spill The data analysis for this report was generated using SAS software Version 93 of the SAS System for Windows Copyright copy 2002-2010 by SAS Institute Inc SAS and all other SAS Institute Inc product or service names are registered trademarks or trademarks of SAS Institute Inc Cary NC USA
DISCLAIMER
Reference to specific commercial products process or service by trade name trademark manufacturer or otherwise does not constitute or imply their endorsement recommendation or favoring by the United States Government The views and opinions of authors expressed do not necessarily state or reflect those of the United States Government and shall not be used for advertising or product endorsement purposes
50
APPENDIX 1
DIAGNOSTIC BIOMARKER RATIOS
Petroleum Biomarkers Used For Calculating MC252 Diagnostic Ratios
Abbreviation Compound Name mz Value
C27 18α(H)-222930-trisnorneohopane 191C27 Ts C27 Tm C27 17α(H)-222930-trisnorhopane 191 C29 aB C29 17α(H)21β(H)-30-norhopane 191 C29 Ts C29 18α(H)-30-norneohopane 191 C30 aB C30 17α(H)21β(H)-hopane 191 C31 aB (S+R) C31 17α(H)21β(H)-22(S+R)-homohopane 191 C32 aB (S+R) C32 17α(H)21β(H)-22(S+R)-bishomohopane 191 C33 aB (S+R) C32 17α(H)21β(H)-22(S+R)-trishomohopane 191 C27D Ba-S C27 13β(H)17α(H)20S-diasterane 217 C27D Ba-R C27 13β(H)17α(H)20R-diasterane 217 C29D Ba-S C29 24-ethyl-13β(H)17α(H)20S-diacholestane 217 C29D Ba-R C29 24-ethyl-13β(H)17α(H)20R-diacholestane 217 C28 aaa-R C28 24-methyl-5α(H)14α(H)17α(H) 20R-cholestane 217 C29 aaa-R C29 24-ethyl-5α(H)14α(H)17α(H) 20R-cholestane 217 C27 BB (R+S) C27 5α(H)14β(H)17β(H)-cholestane (20R+20S) 218 C28 BB (R+S) C28 24-methyl-5α(H)14β(H)17β(H)-cholestane (20R+20S) 218 C29 BB (R+S) C29 24-ethyl-5α(H)14β(H)17β(H)-cholestane (20R+20S) 218 C20 TA C20-triaromatic steroid (pregnane derivative) 231 C21 TA C21-triaromatic steroid (homopregnane derivative) 231 C26 TA-S C26-triaromatic steroid20S (cholestane derivative) 231 C28 TA-S C28-triaromatic steroid20S (ethylcholestane derivative) 231 C27 TA-R C27-triaromatic steroid20R (methylcholestane derivative) 231 C28 TA-R C28-triaromatic steroid20R (ethylcholestane derivative) 231
52
Diagnostic Ratios Chosen for MC252 Source Oil
Ratio mz
Value
C27 Ts C27 Tm 191
C29 aBC29 Ts 191
C29 aBC30 aB 191
C31 aB(S+R)C32 aB(S+R) + C33 aB(S+R) 191
C32 aB(S+R)C31 aB(S+R) + C33 aB(S+R) 191
C33 aB(S+R)C31 aB(S+R) + C32 aB(S+R) 191
C27D Ba-SC27D Ba-R 217
C29D Ba-SC29D Ba-R 217
C28 aaa-RC29 aaa-R 217
C27 BB(R+S)C28 BB(R+S) + C29 BB(R+S) 218
C28 BB(R+S)C27 BB(R+S) + C29 BB(R+S) 218
C29 BB(R+S)C27 BB(R+S) + C28 BB(R+S) 218
C20 TAC21 TA 231
C26 TA-SC28 TA-S 231
C27 TA-RC28 TA-R 231
53
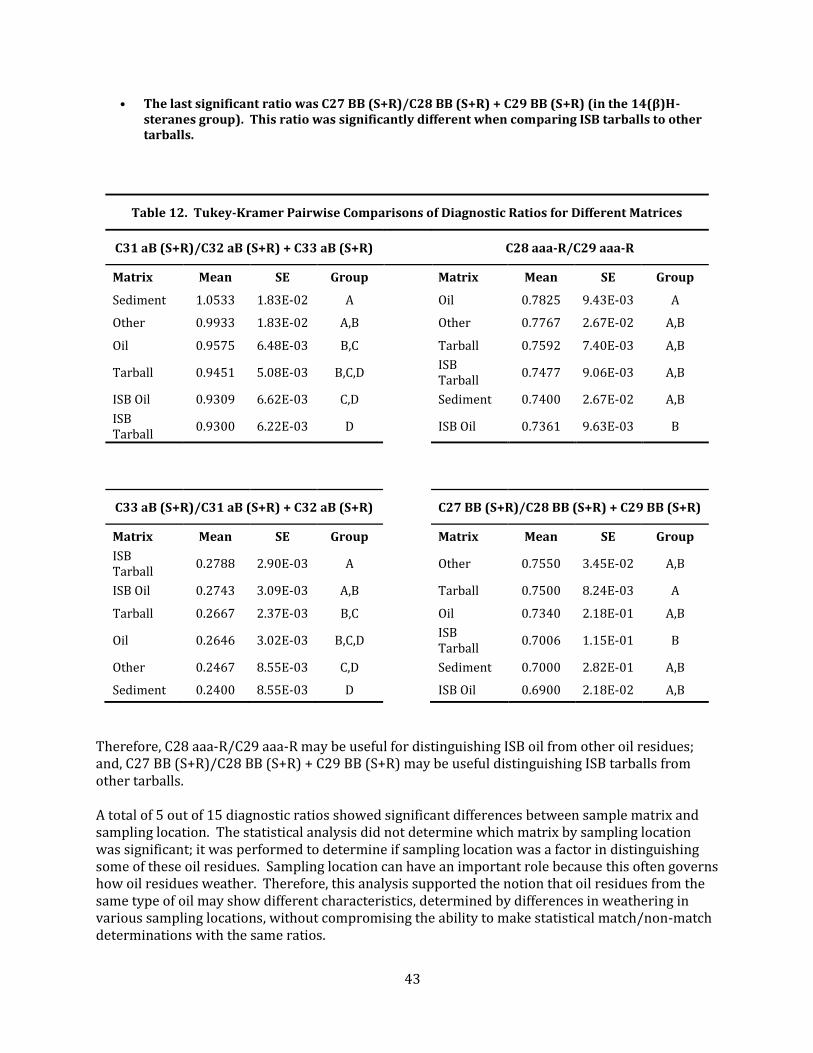