Embed Size (px)
Citation preview
COMPARISON OF PICKER AND STRIPPER HARVESTERS ON IRRIGATED
COTTON ON THE HIGH PLAINS OF TEXAS
A Dissertation
by
WILLIAM BROCK FAULKNER
Submitted to the Office of Graduate Studies of Texas A&M University
in partial fulfillment of the requirements for the degree of
DOCTOR OF PHILOSOPHY
August 2008
Major Subject: Biological and Agricultural Engineering
COMPARISON OF PICKER AND STRIPPER HARVESTERS ON IRRIGATED
COTTON ON THE HIGH PLAINS OF TEXAS
A Dissertation
by
WILLIAM BROCK FAULKNER
Submitted to the Office of Graduate Studies of Texas A&M University
in partial fulfillment of the requirements for the degree of
DOCTOR OF PHILOSOPHY
Approved by:
Chair of Committee, Bryan W. Shaw Committee Members, Eric F. Hequet Calvin B. Parnell, Jr. J. Alex Thomasson Head of Department, Gerald L. Riskowski
August 2008
Major Subject: Biological and Agricultural Engineering
iii
ABSTRACT
Comparison of Picker and Stripper Harvesters on Irrigated Cotton on the High Plains of
Texas. (August 2008)
William Brock Faulkner, B.S., Texas A&M University;
M.S. Texas A&M University
Chair of Advisory Committee: Dr. Bryan W. Shaw
Over a fourth of the cotton produced in the US since 2002 has been produced in
Texas, with most coming from the High Plains. In recent years, Texas has accounted for
almost half of all US cotton production (USDA-NASS, 2008b). Most cotton on the
High Plains is of more storm-proof varieties that have traditionally been harvested using
stripper harvesters. However, improvements in irrigation technology and shifting
markets for US cotton have increased interest in picker harvesters in the region.
A holistic comparison of picker and stripper harvesters in irrigated cotton on
the High Plains of Texas was conducted focusing on differences in system efficiencies,
the costs of ginning, fiber and yarn quality, and potential economic returns under
comparable crop yields and conditions.
Harvester performance was evaluated based on harvest efficiency, time-in-
motion, and fuel consumption. Stripper harvesters left less cotton in the field, but most
of the cotton left by the picker was of low quality. While the time spent in each
operation of harvest was highly dependent on the operator and support equipment
available, in general, picker harvesters were able to harvest a unit area of high-yielding
cotton more quickly than stripper harvesters.
The cost of ginning picked and stripped cotton was evaluated considering current
fee schedules from gins on the High Plains. On average, it cost a producer $4.76 more
per bale to gin stripped-and-field-cleaned cotton than picked cotton.
iv
Fiber quality parameters were compared between harvest treatments based on
results from High Volume Instrument (HVI) and Advanced Fiber Information System
(AFIS) tests. Samples were ring-spun into carded and carded-and-combed yarns.
Differences in fiber quality between harvest treatments were more pronounced when
growing conditions were less favorable. Few differences were detected in carded yarn
quality between harvest treatments, while more pronounced differences favoring picked
cotton were seen in carded-and-combed yarns.
A cost-benefit analysis was conducted to determine the production scenarios in
which picker and stripper harvesters were most appropriate. Results indicate that, if a
producer has sufficient yields coupled with sufficient area to harvest per machine, picker
harvesting is a more profitable alternative to producers of on the High Plains.

v
ACKNOWLEDGEMENTS
This research effort has, at times, been enjoyable, trying, stressful, and exciting,
but in the end it has been incredibly rewarding. A project of this magnitude is rarely
accomplished by the efforts of one individual, and this work is no exception. Many
people have been integral to the success of this work. Some of them worked hard to
achieve the results presented in this manuscript, while many more have labored to instill
good character and a good work ethic in me for which I am incredibly grateful. While
there is not enough space here to acknowledge all of them by name, I appreciate the
patience and persistence they had, as well as the potential they seem to have found in
me.
By the grace of God, He has allowed me to come to know and love His Son Jesus
and has continued to bless me through many circumstances. I owe all to Him and hope
to diligently live to bless Him in response to His kindness.
To my wife, Brittney, I want to say thank you for encouraging me, being patient
with the many nights I’ve been away during harvest, and being excited with me as I have
worked to complete this degree. Thank you for trusting me to provide for you and
Emery, and thanks for being a great mother to our son. Your confidence in me has been
a steady impetus to work at all things well. Marriage to you has been more fun than I
could have imagined, and I look forward to tackling the challenges of the future with
you by my side!
To my Mom, I want to say thank you for loving me and continuing to believe in
me. Thank you for having the foresight to plan for C.W. and me to be able to go to
college and for disciplining us to live and learn on our own. I know that raising two
boys after Daddy died was hard, but (while I'm biased) I think you did a great job! Your
wisdom and strength amaze me.
To my grandparents, I want to say thank you for teaching me to work hard and
teaching me how important character and family are. If it weren't for you, I would not
have come to love working in agriculture as much as I do. And, I remember well all of

vi
the Little League games and elementary school plays that you came to, all of the
weekends and summers I spent at the ranch, the 4-H projects and the family dinners.
You have truly left an eternal legacy for all of your grandchildren.
To my brother, thanks for being a good friend and role model. You have a great
wife and kids, and you have an incredible amount of godly wisdom! Thanks for telling
me the truth, even when I don't think I want to hear it. And thanks for all of the listening
and counseling that you've given me as we have done life together.
To Dr. Shaw, I want to say thank you for trusting me as much as you have and
for letting me have the experiences that you've given me. There has never been any
doubt that you are looking out for my best interests and that you have gone out of your
way to prepare me for what lies ahead. Thanks for the candid discussions and good
humor we’ve enjoyed! Much of what I have learned as a graduate student has been
thanks to your instruction, your guidance, and especially your trust in me. Thank you.
To John Wanjura, Randy Boman, and Dr. Hequet, thanks for your patience and
cooperation with me during the planning and execution of this research. This work
would be only a fraction of what it is if it were not for all of the time and effort you
contributed. From long days in the field running equipment and taking samples to hours
spent in the lab learning about cotton production and processing, you have made
invaluable contributions to this work and to my professional development.
Thanks to Britt Norvell and Kyle Kieschnick for all the help prepping machines
and collecting samples for this project. You guys made field work go smoothly and
made it fun. Your hard work, competence, and especially your humor made doing this
work enjoyable.
I would also like to thank Dr. Ed Barnes from Cotton, Inc. and Mr. Steve Verett
from Plains Cotton Growers for helping secure the financial assistance needed to
conduct this research. Further thanks are due to Mr. Tim Deutsch from John Deere for
providing the 9996 cotton picker used in this project and to Brad Palmer, Craig Heinrich,
Rickey Bearden, and James Brown for letting us harvest your cotton in the middle of a
vii
very busy season. Thank you for your help and I look forward to working with you
again in the future.
And finally, thanks to the folks at Community Church for providing Brittney and
me a great home. The friendships we've built as we have worked together to become the
beautiful bride Christ came to redeem have changed us more than I would have ever
imagined! Thanks for being supportive of Brittney, Emery, and me through some tough
times and some great ones, too. "The body is not one member but many...and when one
member suffers, all members suffer with it; when one member is honored, all parts
rejoice." It's been an honor to be part of a church where that is lived out well.

viii
TABLE OF CONTENTS
Page
ABSTRACT .............................................................................................................. iii
ACKNOWLEDGEMENTS ...................................................................................... v
TABLE OF CONTENTS .......................................................................................... viii
LIST OF FIGURES ................................................................................................... x
LIST OF TABLES .................................................................................................... xi
CHAPTER
I INTRODUCTION ................................................................................ 1
Objective ........................................................................................ 4
II FIELD SITE DESCRIPTIONS ............................................................ 5
Introduction .................................................................................... 5 Site 1 ............................................................................................... 5 Site 2 ............................................................................................... 7 Site 3 ............................................................................................... 8 Site 4 ............................................................................................... 13
III HARVESTER PERFORMANCE ........................................................ 17
Introduction .................................................................................... 17 Methods .......................................................................................... 20 Results and Discussion ................................................................... 23 Conclusions .................................................................................... 26
IV GINNING ............................................................................................. 28
Introduction .................................................................................... 28 Methods .......................................................................................... 31 Results and Discussion ................................................................... 33 Conclusions .................................................................................... 37
V FIBER QUALITY ................................................................................ 39
Introduction .................................................................................... 39 Methods .......................................................................................... 51 Results and Discussion ................................................................... 52 Conclusions .................................................................................... 58
ix
CHAPTER Page
VI YARN QUALITY ................................................................................ 60
Introduction .................................................................................... 60 Methods .......................................................................................... 68 Results and Discussion ................................................................... 74 Conclusions .................................................................................... 88
VII ECONOMIC ANALYSIS .................................................................... 89
Introduction .................................................................................... 89 Methods .......................................................................................... 91 Results and Discussion ................................................................... 95 Conclusions .................................................................................... 100
VIII SUMMARY AND CONCLUSIONS ................................................... 101
Future Work ................................................................................... 104
REFERENCES .......................................................................................................... 106
APPENDIX A SEED COTTON MOISTURE CONTENT DATA ....................... 112
APPENDIX B PLANT HEIGHT DATA ............................................................... 115
APPENDIX C HARVEST EFFICIENCY DATA ................................................. 117
APPENDIX D FRACTIONATION ANALYSIS DATA ...................................... 120
APPENDIX E TURNOUT DATA ........................................................................ 123
APPENDIX F HVI ANALYSIS DATA ................................................................ 126
APPENDIX G AFIS ANALYSIS DATA ............................................................... 129
APPENDIX H CARDED YARN DATA ............................................................... 132
APPENDIX I CARDED-AND-COMBED YARN DATA ................................... 135
APPENDIX J GLOSSARY ................................................................................... 138
VITA ......................................................................................................................... 142
x
LIST OF FIGURES
Page
Figure 1 Percent of US cotton produced in Texas (USDA-NASS, 2008b) ......... 1
Figure 2 Sampling site 1....................................................................................... 6
Figure 3 Sampling site 2....................................................................................... 9
Figure 4 Sampling site 3 – variety trials. ............................................................. 10
Figure 5 Sampling site 3 – time-in-motion .......................................................... 12
Figure 6 Sampling site 4 – variety trials .............................................................. 14
Figure 7 Sampling site 4 – time-in-motion .......................................................... 16
Figure 8 Schematic of harvest efficiency test plots .............................................. 22
Figure 9 Example of typical machinery sequences for modern saw gins processing upland a.) picked and b.) stripped cotton (Anthony et al., 1994b; Baker, 1994) .............................................................................. 30
Figure 10 Cross-section of cotton fiber (Uster Technologies, 2004). .................... 40
Figure 11 Cotton fibers of varying maturity: the fiber on the left is “fully mature,” the one in the center is immature, and the one on the right is dead (Uster Technologies, 2004). .......................................................... 41
Figure 12 Relationship between micronaire and market value (adapted from USDA-AMS, 2001). .............................................................................. 42
Figure 13 2006 AFIS length distributions by number. ........................................... 54
Figure 14 2007 AFIS length distributions of FM 9058 F by number .................... 57
Figure 15 Example yarn twist curve (Smith and Waters, 1985). ........................... 64
Figure 16 Spinning process flow chart for ring spinning ....................................... 69
Figure 17 Draw frame rollers ................................................................................. 71
Figure 18 Breakeven curve between picking and stripping with field cleaner from NPV analysis.. ............................................................................... 96
Figure 19 Breakeven curve between picking and stripping without a field cleaner from NPV analysis.. .................................................................. 97
xi
LIST OF TABLES
Page
Table 1 Fiber quality base grades ....................................................................... 3
Table 2 Time-in-motion data .............................................................................. 24
Table 3 Time-in-motion simulation .................................................................... 25
Table 4 Harvest efficiency .................................................................................. 26
Table 5 Typical trash levels for picked and stripped cotton (Baker et al., 1994) ...................................................................................................... 29
Table 6 Percent composition of harvested seed cotton ....................................... 34
Table 7 Turnout of modules from Site 1 ............................................................. 35
Table 8 Turnout from Sites 3 and 4 .................................................................... 35
Table 9 Average seed weight per 220 kg (480 lbs) bale ..................................... 36
Table 10 Energy consumption for modules from Site 1 ....................................... 36
Table 11 Ginning schedules for 2007-2008 crop for commercial gins on the High Plains ...................................................................................................... 37
Table 12 Length uniformity (USDA-AMS, 2001) ............................................... 43
Table 13 Fiber strength (USDA-AMS, 2001) ....................................................... 44
Table 14 Nep counts (Uster Technologies, 2004) ................................................ 46
Table 15 Short fiber content (Uster Technologies, 2004) ..................................... 47
Table 16 Maturity data (Uster Technologies, 2004) ............................................. 47
Table 17 Results from 2006 HVI analysis ............................................................ 53
Table 18 Selected results from 2006 AFIS analysis ............................................. 53
Table 19 ANOVA results from 2007 HVI analysis .............................................. 55
Table 20 Selected ANOVA results from 2007 AFIS analysis .............................. 56
Table 21 Selected paired sample t-test results from 2007 HVI analysis .............. 56
Table 22 Average loan values and West Texas spot prices (USDA-AMS, 2007) .............................................................................. 58
Table 23 Selected results of 2006 carded yarn analysis ....................................... 74
Table 24 Selected results of 2006 carded-and-combed yarn analysis .................. 75
xii
Page
Table 25 Selected results of 2007 carded yarn analysis ....................................... 76
Table 26 Selected results of 2007 carded-and-combed yarn analysis .................. 77
Table 27 Selected paired-sample t-test results of 2007 carded yarn analysis ....... 77
Table 28 Selected paired-sample t-test results of 2007 carded-and-combed yarn analysis ......................................................................................... 78
Table 29 Regression analysis for CSP from fiber properties ................................ 80
Table 30 Regression analysis for yarn elongation from fiber properties .............. 81
Table 31 Regression analysis for yarn tenacity from fiber properties .................. 82
Table 32 Regression analysis for yarn mass CV from fiber properties ................ 84
Table 33 Regression analysis for thin places from fiber properties ...................... 85
Table 34 Regression analysis for thick places from fiber properties .................... 85
Table 35 Regression analysis for yarn neps (+200%) from fiber properties ........ 86
Table 36 Regression analysis for yarn hairiness from fiber properties ................ 87
Table 37 Harvester parameter inputs measured during 2006 and 2007 harvest seasons ................................................................................................... 93
Table 38 Ranges of values for NPV model input parameters ............................... 94
Table 39 Relative returns ($/ha [$/ac]) for various harvest systems .................... 98
Table 40 Sensitivity of NPV model to input parameters ...................................... 99
Table 41 Average seed cotton moisture content data ........................................... 113
Table 42 Average plant height data ...................................................................... 116
Table 43 Harvest efficiency data .......................................................................... 118
Table 44 Fractionation analysis data ..................................................................... 121
Table 45 Turnout data ........................................................................................... 124
Table 46 HVI data ................................................................................................. 127
Table 47 AFIS data ............................................................................................... 130
Table 48 Carded yarn data .................................................................................... 133
Table 49 Carded-and-combed yarn data ............................................................... 136
1
CHAPTER I
INTRODUCTION
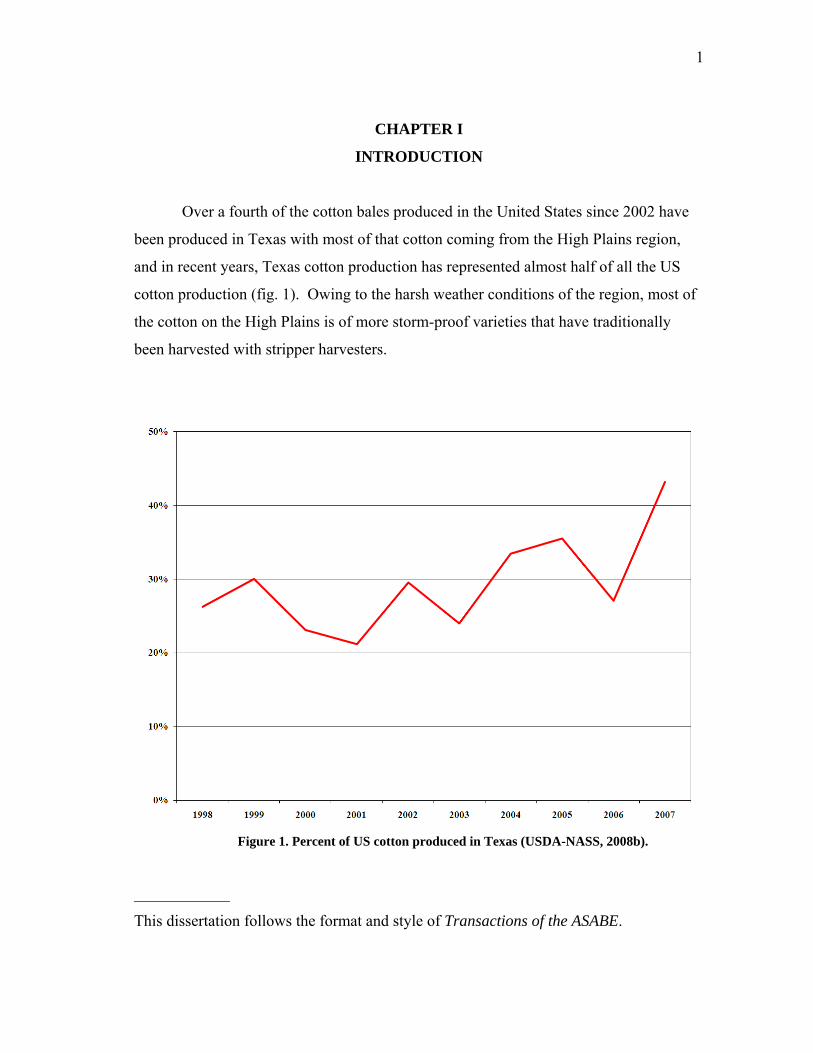
Over a fourth of the cotton bales produced in the United States since 2002 have
been produced in Texas with most of that cotton coming from the High Plains region,
and in recent years, Texas cotton production has represented almost half of all the US
cotton production (fig. 1). Owing to the harsh weather conditions of the region, most of
the cotton on the High Plains is of more storm-proof varieties that have traditionally
been harvested with stripper harvesters.
Figure 1. Percent of US cotton produced in Texas (USDA-NASS, 2008b).
____________
This dissertation follows the format and style of Transactions of the ASABE.
2
Unlike picker harvesters, which use spindles to remove the seed cotton from the
boll of the plant, stripper harvesters use brushes and paddles that indiscriminately
remove seed cotton, bolls, leaves, and many branches from the stem of the plant. As a
result, stripper harvested cotton contains more foreign matter than cotton harvested with
pickers. This increased foreign matter leads to higher transportation costs per bale to
haul modules to the gin as well as potentially higher costs of processing the cotton, due
to the use of additional cleaning machinery at the gin. The indiscriminate harvest by
stripper harvesters also leads to increased harvest of immature bolls that would be left in
the field by a picker harvester. These immature bolls can lead to lower micronaire
values, which may affect dye uptake, and subsequently lower strength, which can
adversely affect spinning performance at the textile mill.
Stripper harvesters have several advantages over picker harvesters, including
significantly lower purchase prices, fewer moving parts in the row units leading to lower
fuel consumption and maintenance requirements, and removal of more cotton from the
plant. Picker harvesters, however, pick cleaner cotton, are perceived to maintain fiber
quality characteristics better than strippers, and may be able able to harvest cotton at
higher speeds in high yielding stands.
As irrigation technology has improved and new cotton varieties have been
introduced and adopted on the High Plains, yields in the region have dramatically
increased, sometimes reaching 9.8 to 12.3 bales/ha (4 to 5 bales/ac). It is estimated that
between 120,000 and 160,000 ha (300,000 and 400,000 ac) of drip irrigation has been
installed on the High Plains in the past ten years for cotton production and over 450,000
ha (1.1 million ac) are irrigated with center pivot systems equipped with high efficiency
application packages. Given these increases in yield, picker harvesters may be able to
harvest irrigated cotton faster and more efficiently than stripper harvesters.
Furthermore, as more US cotton is being exported to foreign markets, production
of a high quality crop is imperative. The base loan quality grade for cotton in the US is
strict low middling 2.70 cm (1-1/16 in.) (41-4-34; i.e. color grade = 41, leaf grade = 4,
staple = 34) compared to the Cotton Outlook A index (international base) of middling
3
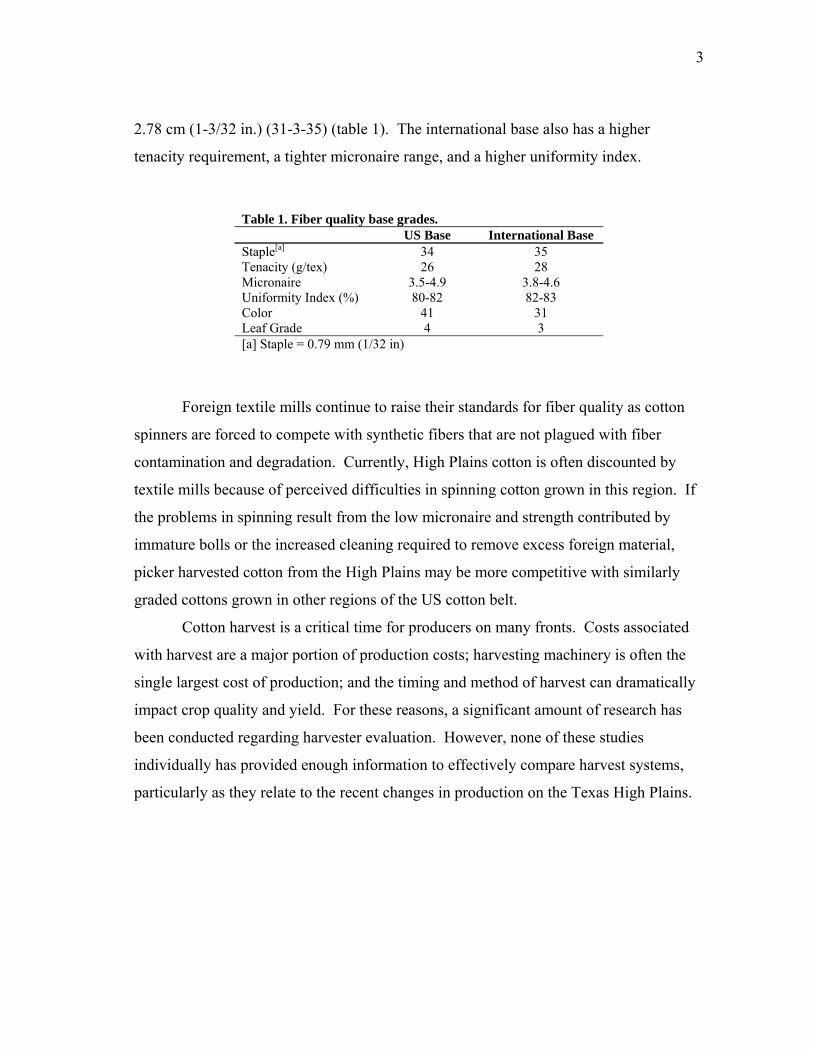
2.78 cm (1-3/32 in.) (31-3-35) (table 1). The international base also has a higher
tenacity requirement, a tighter micronaire range, and a higher uniformity index.
Table 1. Fiber quality base grades. US Base International Base Staple[a] 34 35 Tenacity (g/tex) 26 28 Micronaire 3.5-4.9 3.8-4.6 Uniformity Index (%) 80-82 82-83 Color 41 31 Leaf Grade 4 3 [a] Staple = 0.79 mm (1/32 in)
Foreign textile mills continue to raise their standards for fiber quality as cotton
spinners are forced to compete with synthetic fibers that are not plagued with fiber
contamination and degradation. Currently, High Plains cotton is often discounted by
textile mills because of perceived difficulties in spinning cotton grown in this region. If
the problems in spinning result from the low micronaire and strength contributed by
immature bolls or the increased cleaning required to remove excess foreign material,
picker harvested cotton from the High Plains may be more competitive with similarly
graded cottons grown in other regions of the US cotton belt.
Cotton harvest is a critical time for producers on many fronts. Costs associated
with harvest are a major portion of production costs; harvesting machinery is often the
single largest cost of production; and the timing and method of harvest can dramatically
impact crop quality and yield. For these reasons, a significant amount of research has
been conducted regarding harvester evaluation. However, none of these studies
individually has provided enough information to effectively compare harvest systems,
particularly as they relate to the recent changes in production on the Texas High Plains.
4
OBJECTIVE
The objective of this research is to comprehensively compare picker and stripper
cotton harvesters in irrigated cotton on the High Plains of Texas. Specifically, this
research focuses on comparing:
1. Differences in system efficiency between picker- and stripper-based systems,
including harvest efficiency and time-in-motion,
2. Differences in the costs of ginning between picked and stripped cotton,
including seed cotton transportation and energy costs during ginning,
3. Differences in fiber and yarn quality between cotton harvested with different
harvest systems, and
4. The potential economic returns for picker- and stripper-based systems on
comparable crop yields and conditions.
Each of these components is used to perform a cost-benefit analysis to determine the
production scenarios in which picker and stripper harvesters are most appropriate.
5
CHAPTER II
FIELD SITE DESCRIPTIONS
INTRODUCTION
Field work was conducted in a total of six fields at four different sites on the
High Plains in 2006 and 2007. When possible, time-in-motion studies were conducted
while harvesting on a typical field scale, while most of the seed cotton sampling and
harvest efficiency tests occurred while harvesting smaller plots. Observations were
made during the 2006 and 2007 harvest seasons on the High Plains with a six-row John
Deere 9996 picker harvester with Pro-16 row units and a John Deere 7460 brush
stripper.
SITE 1
In 2006, sampling was conducted at a field approximately 24 km west of Plains,
Texas. The field was located on a Brownfield fine sand, and Stoneville 4554 Bollgard
II® Roundup Ready Flex® (ST 4554 B2RF) was planted on 76 cm (30 in.) centers.
Cotton was irrigated with a center-pivot irrigation system and had an average yield of
5.4 bales/ha (2.2 bales/ac based on 220 kg [480 lbs] bales). The picker was operated by
employees of the producer and was equipped with scrapping plates on both front and
rear drums. A six-row stripper was operated by a custom harvester.
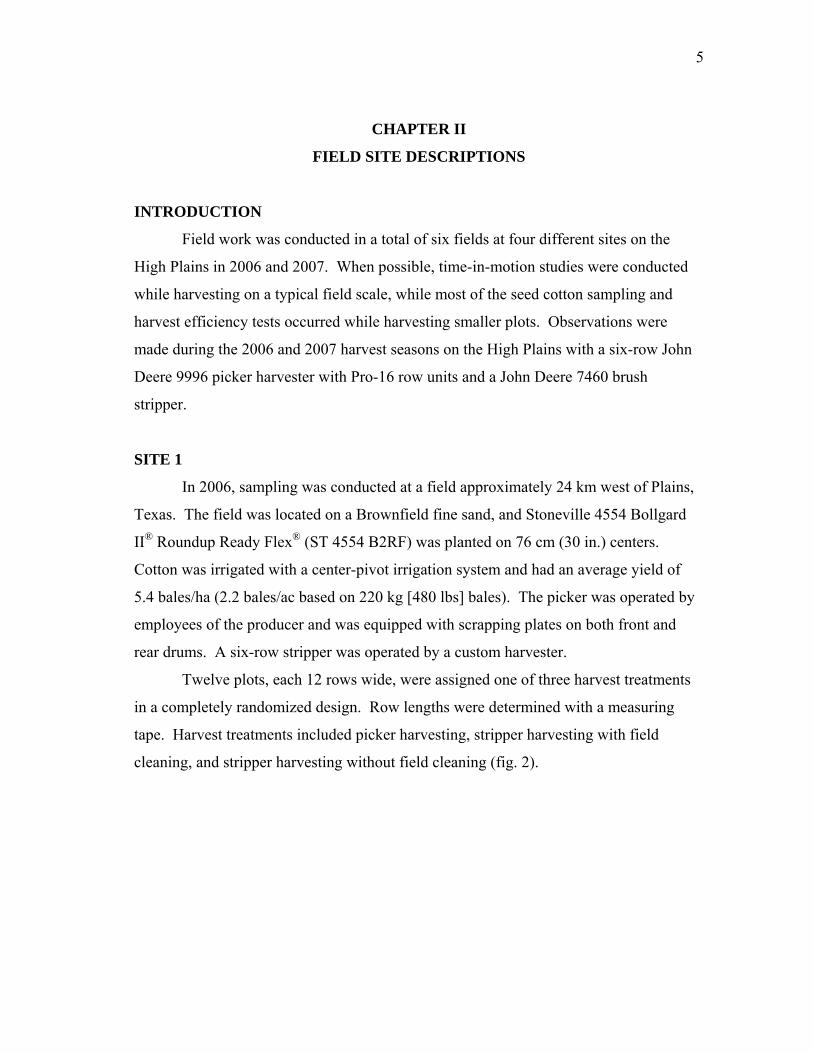
Twelve plots, each 12 rows wide, were assigned one of three harvest treatments
in a completely randomized design. Row lengths were determined with a measuring
tape. Harvest treatments included picker harvesting, stripper harvesting with field
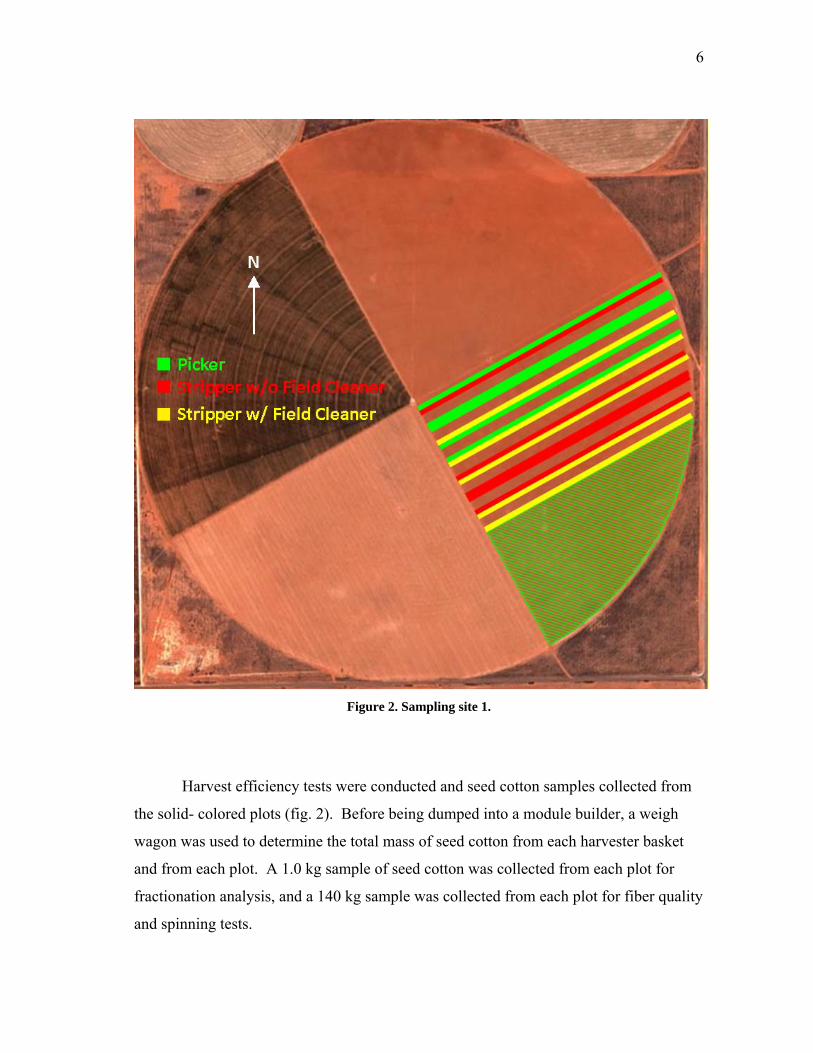
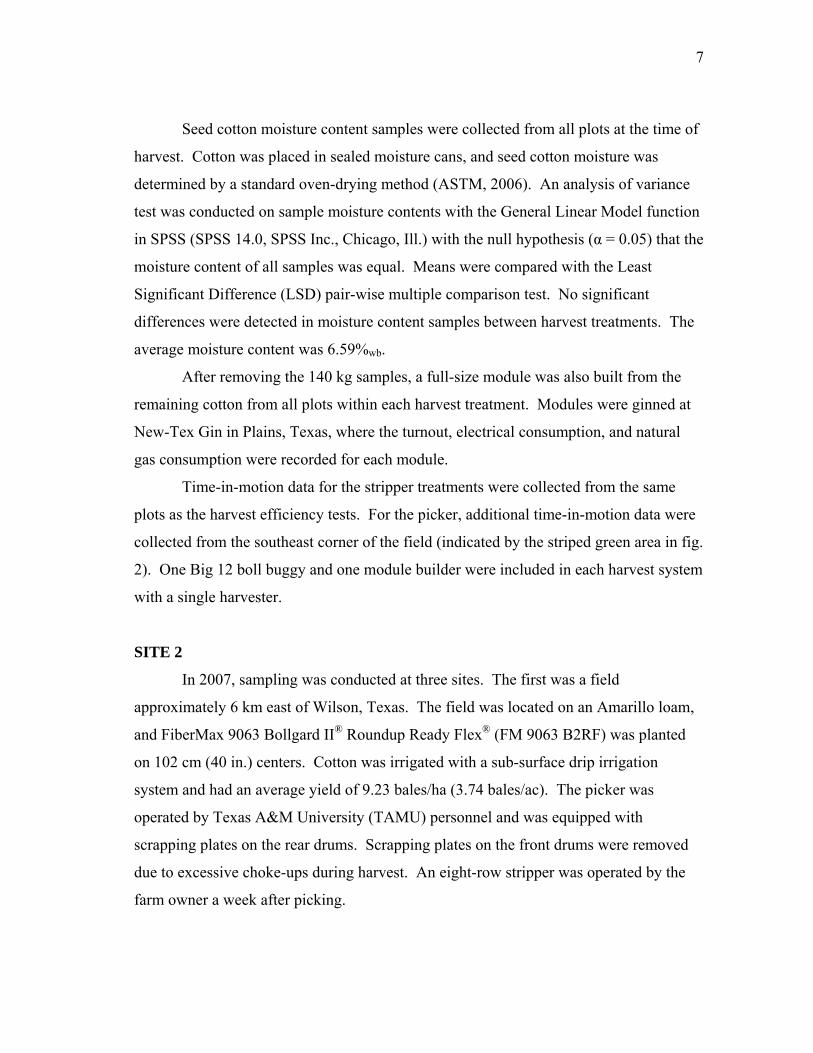
cleaning, and stripper harvesting without field cleaning (fig. 2).
6
Figure 2. Sampling site 1.
Harvest efficiency tests were conducted and seed cotton samples collected from
the solid- colored plots (fig. 2). Before being dumped into a module builder, a weigh
wagon was used to determine the total mass of seed cotton from each harvester basket
and from each plot. A 1.0 kg sample of seed cotton was collected from each plot for
fractionation analysis, and a 140 kg sample was collected from each plot for fiber quality
and spinning tests.
7
Seed cotton moisture content samples were collected from all plots at the time of
harvest. Cotton was placed in sealed moisture cans, and seed cotton moisture was
determined by a standard oven-drying method (ASTM, 2006). An analysis of variance
test was conducted on sample moisture contents with the General Linear Model function
in SPSS (SPSS 14.0, SPSS Inc., Chicago, Ill.) with the null hypothesis (α = 0.05) that the
moisture content of all samples was equal. Means were compared with the Least
Significant Difference (LSD) pair-wise multiple comparison test. No significant
differences were detected in moisture content samples between harvest treatments. The
average moisture content was 6.59%wb.
After removing the 140 kg samples, a full-size module was also built from the
remaining cotton from all plots within each harvest treatment. Modules were ginned at
New-Tex Gin in Plains, Texas, where the turnout, electrical consumption, and natural
gas consumption were recorded for each module.
Time-in-motion data for the stripper treatments were collected from the same
plots as the harvest efficiency tests. For the picker, additional time-in-motion data were
collected from the southeast corner of the field (indicated by the striped green area in fig.
2). One Big 12 boll buggy and one module builder were included in each harvest system
with a single harvester.
SITE 2
In 2007, sampling was conducted at three sites. The first was a field
approximately 6 km east of Wilson, Texas. The field was located on an Amarillo loam,
and FiberMax 9063 Bollgard II® Roundup Ready Flex® (FM 9063 B2RF) was planted
on 102 cm (40 in.) centers. Cotton was irrigated with a sub-surface drip irrigation
system and had an average yield of 9.23 bales/ha (3.74 bales/ac). The picker was
operated by Texas A&M University (TAMU) personnel and was equipped with
scrapping plates on the rear drums. Scrapping plates on the front drums were removed
due to excessive choke-ups during harvest. An eight-row stripper was operated by the
farm owner a week after picking.
8
Harvest efficiency and moisture content samples were collected and detailed
time-in-motion and plant height data recorded for the picker at Site 2. The average
moisture content of the cotton at time of picking was 4.69%wb. Plant height data were
collected by measuring the distance from the cotyledon to the terminal node of ten plants
in five different plots. The average plant height at Site 2 was 72.0 cm (28.3 in.).
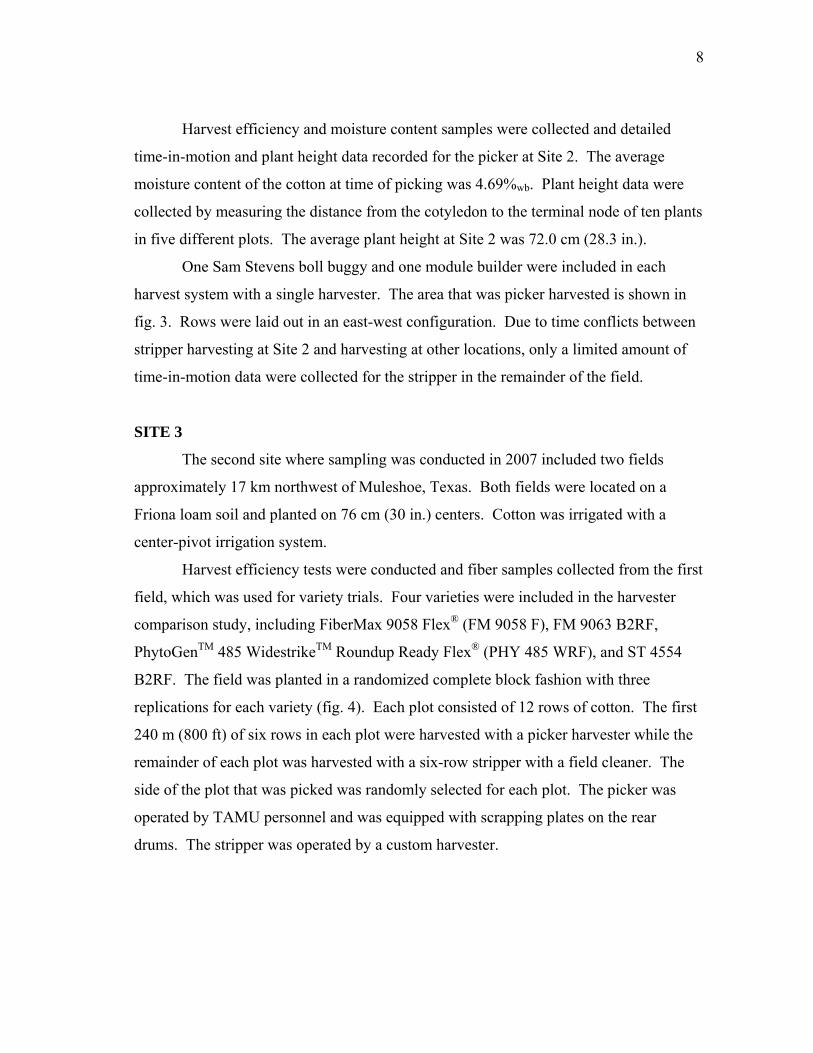
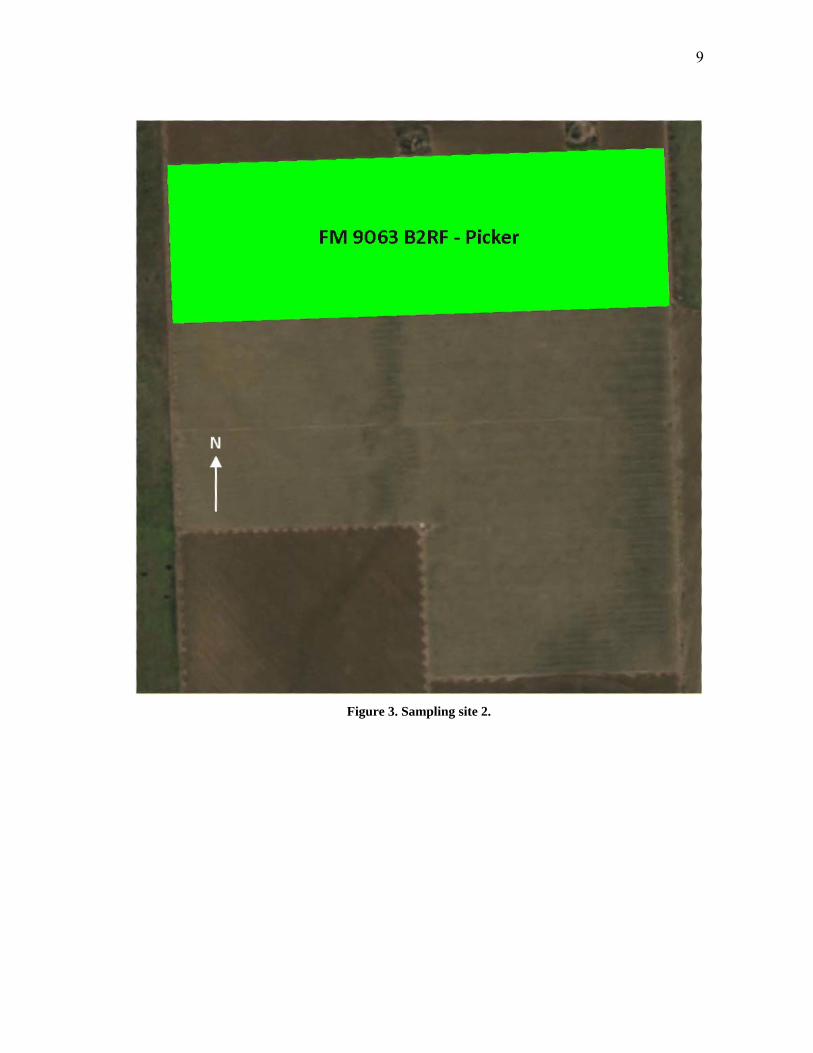
One Sam Stevens boll buggy and one module builder were included in each
harvest system with a single harvester. The area that was picker harvested is shown in
fig. 3. Rows were laid out in an east-west configuration. Due to time conflicts between
stripper harvesting at Site 2 and harvesting at other locations, only a limited amount of
time-in-motion data were collected for the stripper in the remainder of the field.
SITE 3
The second site where sampling was conducted in 2007 included two fields
approximately 17 km northwest of Muleshoe, Texas. Both fields were located on a
Friona loam soil and planted on 76 cm (30 in.) centers. Cotton was irrigated with a
center-pivot irrigation system.
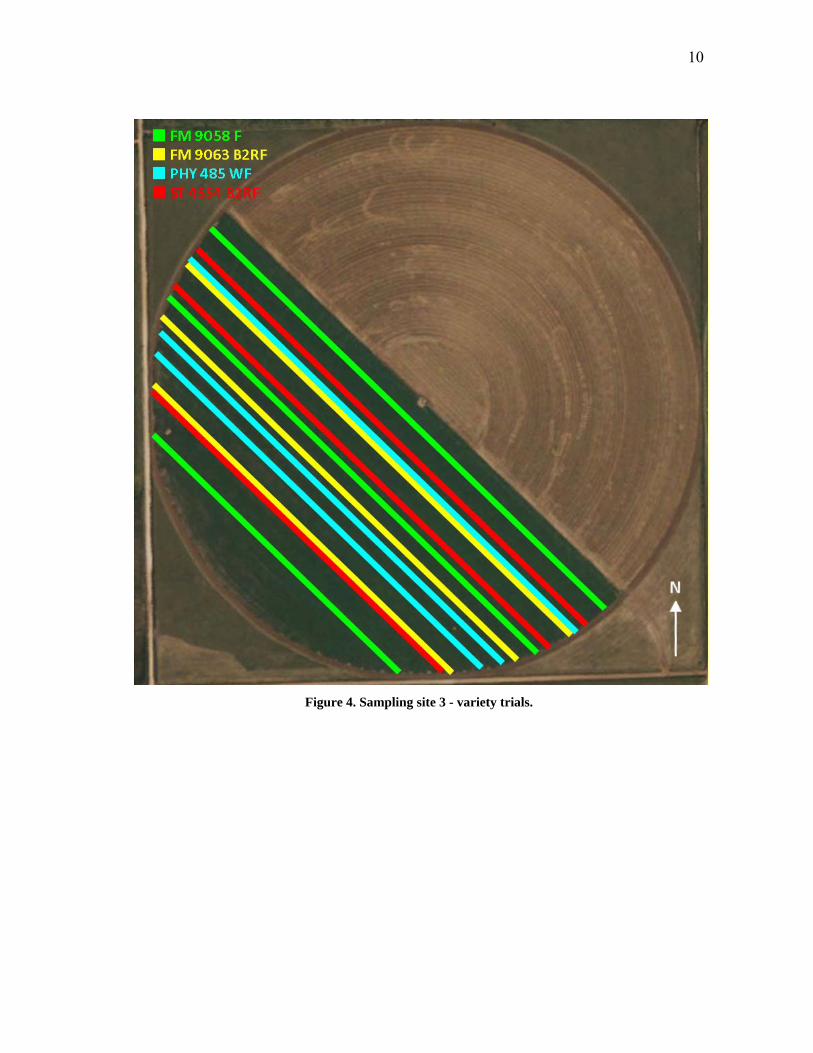
Harvest efficiency tests were conducted and fiber samples collected from the first
field, which was used for variety trials. Four varieties were included in the harvester
comparison study, including FiberMax 9058 Flex® (FM 9058 F), FM 9063 B2RF,
PhytoGenTM 485 WidestrikeTM Roundup Ready Flex® (PHY 485 WRF), and ST 4554
B2RF. The field was planted in a randomized complete block fashion with three
replications for each variety (fig. 4). Each plot consisted of 12 rows of cotton. The first
240 m (800 ft) of six rows in each plot were harvested with a picker harvester while the
remainder of each plot was harvested with a six-row stripper with a field cleaner. The
side of the plot that was picked was randomly selected for each plot. The picker was
operated by TAMU personnel and was equipped with scrapping plates on the rear
drums. The stripper was operated by a custom harvester.
9
Figure 3. Sampling site 2.
10
Figure 4. Sampling site 3 - variety trials.
11
Before being dumped into a module builder, a weigh wagon was used to
determine the total mass of seed cotton from each harvester basket and from each plot.
A 1.0 kg sample of seed cotton was collected for each harvest method in each plot for
fractionation analysis, and a 140 kg sample was collected for both harvest methods in
each plot for fiber quality and spinning tests.
Seed cotton moisture content samples were collected for both harvest treatments
within each plot at the time of harvest and analyzed by the same method as in 2006. No
significant differences were detected in moisture content samples between harvest
treatments within a given variety or between varieties within a given harvest treatment.
The average moisture content for all samples at Site 3 was 4.93%wb. Plant height data
were also collected from each plot for each harvest treatment. No significant differences
were detected in plant height between harvest treatments or variety at Site 3. The
average plant height at Site 3 was 57.4 cm, which was smaller than at Site 2 (p = 0.001)
and Site 4 (p = 0.035).
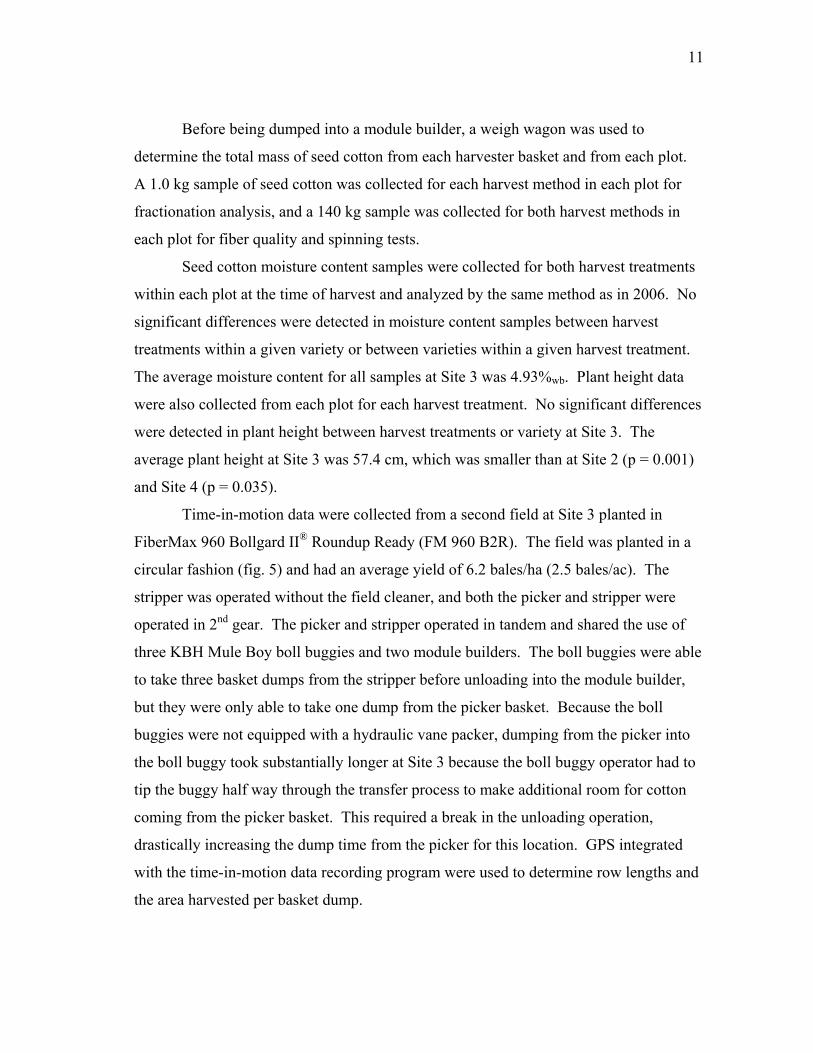
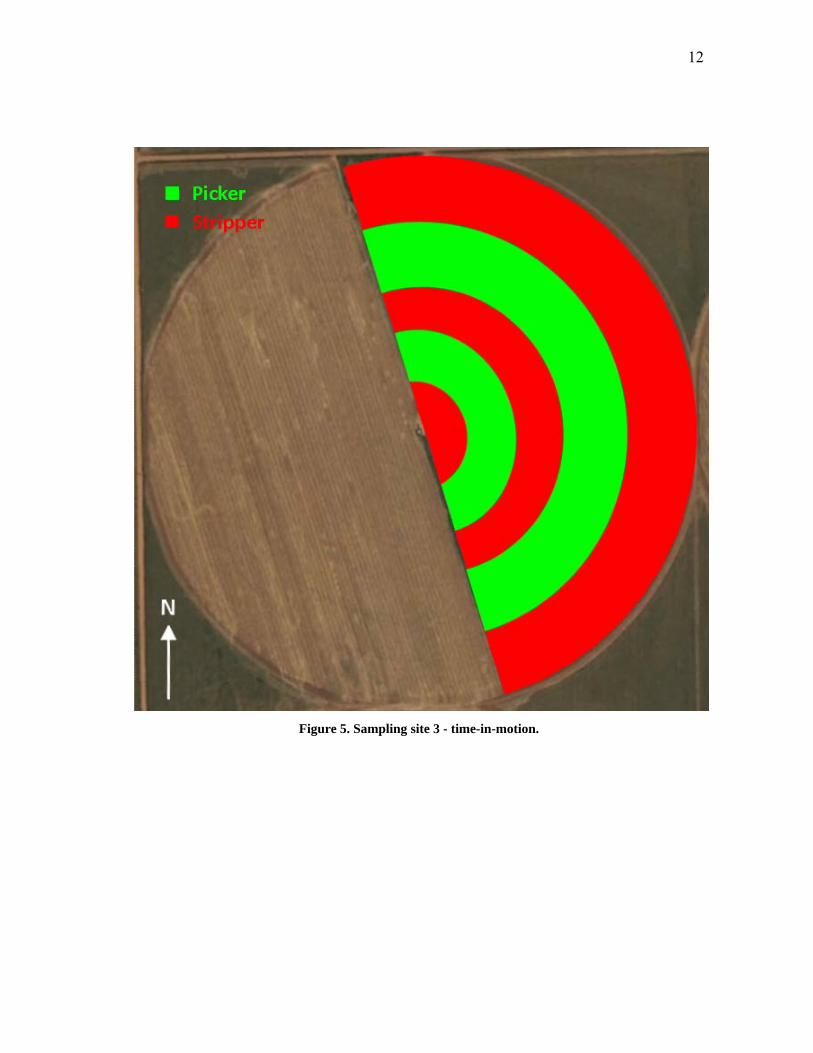
Time-in-motion data were collected from a second field at Site 3 planted in
FiberMax 960 Bollgard II® Roundup Ready (FM 960 B2R). The field was planted in a
circular fashion (fig. 5) and had an average yield of 6.2 bales/ha (2.5 bales/ac). The
stripper was operated without the field cleaner, and both the picker and stripper were
operated in 2nd gear. The picker and stripper operated in tandem and shared the use of
three KBH Mule Boy boll buggies and two module builders. The boll buggies were able
to take three basket dumps from the stripper before unloading into the module builder,
but they were only able to take one dump from the picker basket. Because the boll
buggies were not equipped with a hydraulic vane packer, dumping from the picker into
the boll buggy took substantially longer at Site 3 because the boll buggy operator had to
tip the buggy half way through the transfer process to make additional room for cotton
coming from the picker basket. This required a break in the unloading operation,
drastically increasing the dump time from the picker for this location. GPS integrated
with the time-in-motion data recording program were used to determine row lengths and
the area harvested per basket dump.
12
Figure 5. Sampling site 3 - time-in-motion.
13
SITE 4
The third site where sampling was conducted in 2007 included two fields
approximately 19 km east of Plains, Texas. Both fields were located on a combination
of Amarillo fine sandy loam and Amarillo loamy fine sand planted on 102 cm (40 in.)
centers. Both fields were irrigated with center-pivot irrigation systems.
Harvest efficiency tests were conducted and fiber samples collected from the first
field, which was used for variety trials. The same four varieties harvested from Site 3
were included in the harvester comparison at Site 4. Again, the field was planted in a
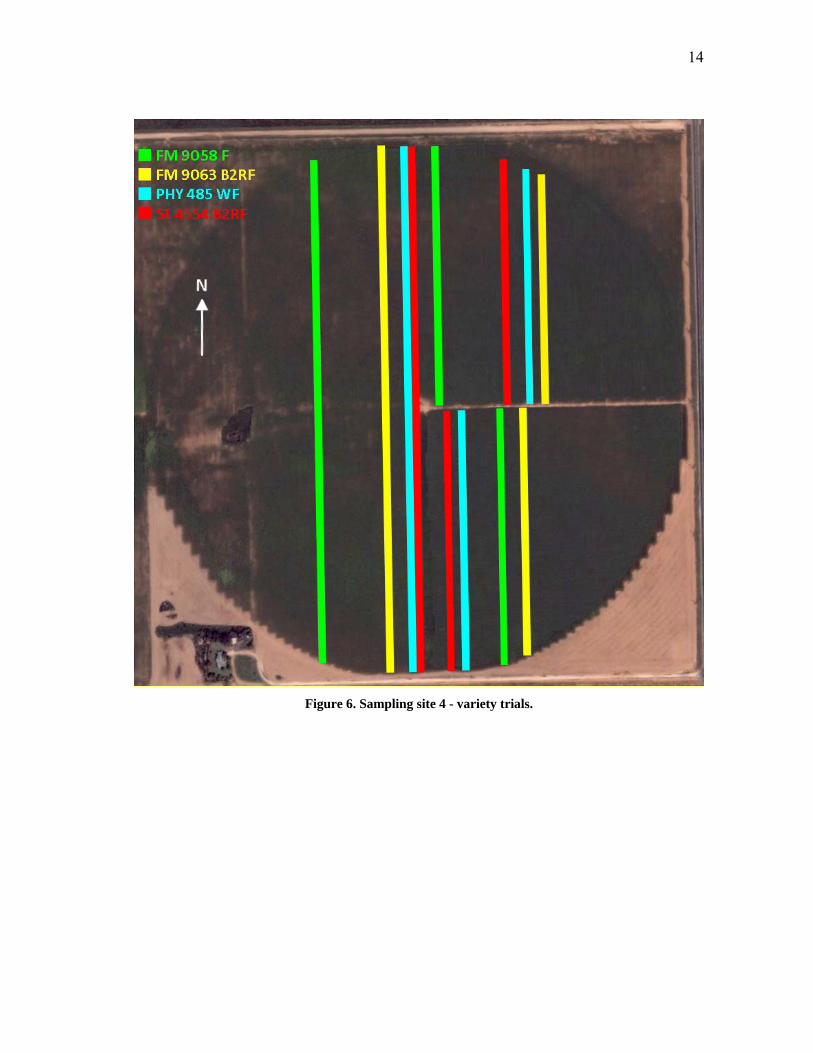
randomized complete block fashion with three replications for each variety (fig. 6). As
at Site 3, each plot consisted of 12 rows of cotton. The first 170 m (550 ft) of six rows in
each plot were harvested with a picker harvester while the remainder of each plot was
harvested with a six-row stripper with a field cleaner. The side of the plot that was
picked was randomly selected for each plot. The picker was operated by TAMU
personnel and was equipped with scrapping plates on the rear drums. The stripper was
operated by employees of the farm owner.
Sampling at Site 4 was conducted in a similar manner to Site 3. No significant
differences were detected in moisture content samples between harvest treatments within
a given variety, with the exception of FM 9063 B2RF, for which the moisture content of
the picked cotton (4.63%wb) was lower (p = 0.041) than the stripped cotton (5.66%wb).
Given the similarity in management practices and soil type combined with the lack of
differences in all other varieties, the difference in moisture content between picked and
stripped treatments of FM 9063 B2RF would likely dissappear with a greater sample
population. No differences were detected in moisture content between varieties within a
given harvest treatment. The average moisture content for all samples at Site 4 was
5.62%wb, which was significantly higher (p = 0.01) than the moisture content of samples
at Site 3.
No significant differences were detected in plant height at Site 4 between harvest
treatments within a given variety or between varieties at Site 4. The average plant height
14
Figure 6. Sampling site 4 - variety trials.
15
at Site 4 was 79.8 cm, which was significantly higher (p < 0.0005) than the average plant
height at Site 3.
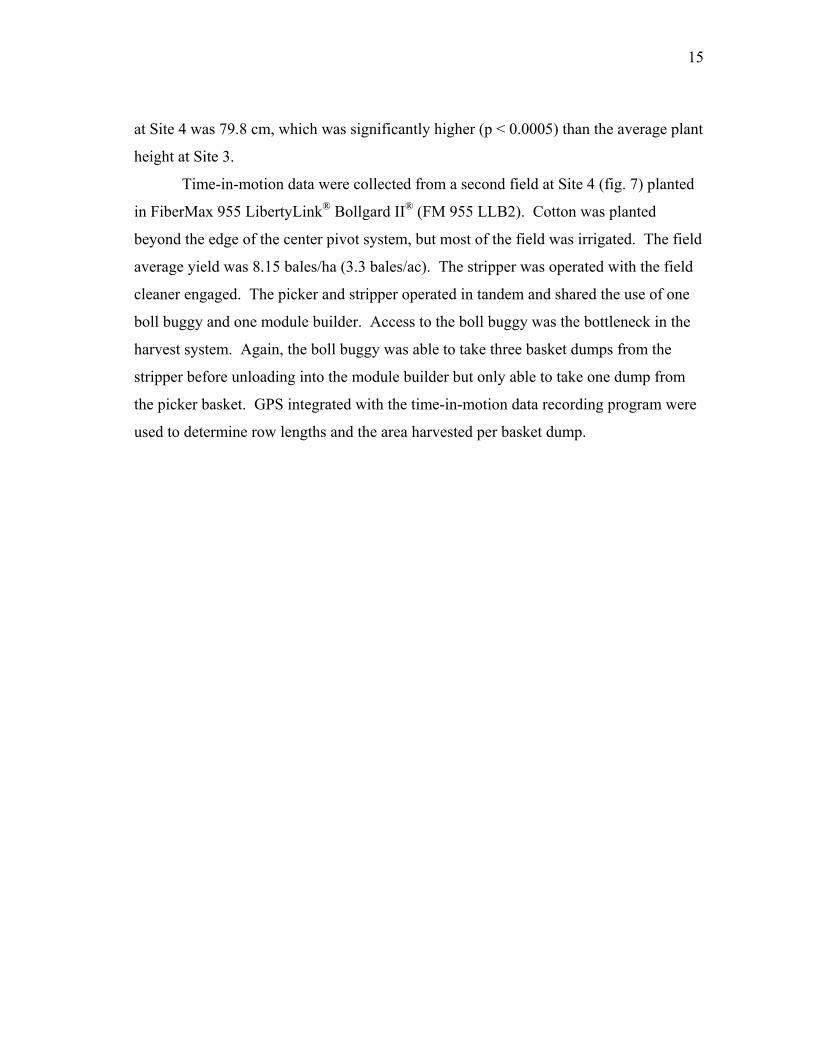
Time-in-motion data were collected from a second field at Site 4 (fig. 7) planted
in FiberMax 955 LibertyLink® Bollgard II® (FM 955 LLB2). Cotton was planted
beyond the edge of the center pivot system, but most of the field was irrigated. The field
average yield was 8.15 bales/ha (3.3 bales/ac). The stripper was operated with the field
cleaner engaged. The picker and stripper operated in tandem and shared the use of one
boll buggy and one module builder. Access to the boll buggy was the bottleneck in the
harvest system. Again, the boll buggy was able to take three basket dumps from the
stripper before unloading into the module builder but only able to take one dump from
the picker basket. GPS integrated with the time-in-motion data recording program were
used to determine row lengths and the area harvested per basket dump.
16
Figure 7. Sampling site 4, time-in-motion.
17
CHAPTER III
HARVESTER PERFORMANCE
INTRODUCTION
Harvesting cotton efficiently in the modern era requires a complex system
involving many machines and skillful machinery management. Aerial or ground
applicators are often used to apply one or more harvest aids, including desiccants and
boll-openers. Picker or stripper harvesters remove seed cotton from the plant, which is
then transferred directly to a module builder or to a boll buggy for transport to the
module builder. Once a module is built and tarped, module trucks transport seed cotton
to the gin. To maximize the profitability of an operation, machinery must be selected
and operated to maximize the utility of each component of the harvest operation.
Harvester performance in the field is critical to ensure timely harvest for quality
preservation and efficient use of labor and capital resources. Harvester performance can
be measured in many different ways, all of which affect the profitability of a production
operation.
Time-in-motion
The time spent during each stage of harvest is a good indicator of the efficiency
of a given system. During a typical harvest, time may be spent harvesting, turning the
harvester onto the next set of rows, waiting for the boll buggy to position to receive seed
cotton from the harvester, dumping the basket, or in downtime for maintenance and
repair. Producers have a narrow window during which to harvest their crop to avoid
quality degradation that comes with time and exposure to harsh weather conditions after
the boll opens. Harvest can be delayed for wet weather or field conditions; high wind;
and, in the case of strippers, high relative humidity.
Because producers face a limited time frame during which to harvest their crop at
peak quality, it is desirable to increase the proportion of time spent harvesting versus the
other necessary tasks enumerated above. Limited data exists on the time spent during
18
each segment of the cotton harvest. Chen et al. (1992) developed a model to predict the
overall cost of harvest for different equipment combinations in the Mississippi Delta
region, but the conditions in this region are significantly different than for the High
Plains, and stripper harvesters were not included in the evaluation. Willcutt and Barnes
(2008) reported that traditional six-row harvesters utilizing boll buggies have a field
efficiency of approximately 70% (i.e. 70% of the time spent in the field is spent picking
cotton). The remaining 30% of time was spent in support operations such as turning at
the end of the row, waiting for boll buggies, transferring seed cotton, and maintaining
row units. When no boll buggies were used, field efficiency was reduced to 49%.
Fuel Use
The amount of fuel used per unit of production directly affects the profitability of
a production operation. Nelson et al. (2001) estimated that stripper harvesters use
approximately 190 L (50 gal) of diesel per day and operate for 10 hr/d, but he did not
report on the yield or area harvested per hour. Matthews et al. (1982) reported that
diesel-powered brush strippers consumed 9.1 L/ha (0.98 gal/ac). Willcutt and Barnes
(2008) measured fuel consumption of machinery from several typical six-row cotton
harvesting operations. Using a six-row John Deere 9976 picker to harvest cotton that
averaged 5.4 bales/ha (2.2 bales/ac), they reported average fuel consumption of 17.0
L/ha (1.82 gal/ac), equivalent to 3.14 L/bale (0.83 gal/bale).
Harvest Efficiency
Harvest efficiency is an important factor for evaluating harvester performance
because it is a measure of the amount of cotton in the field that is harvested and
subsequently cleaned, ginned, and made available for marketing. Machine harvesting of
cotton has led to lower harvest efficiencies, but the gains in labor efficiency have far
surpassed the losses in harvest efficiency, resulting in complete conversion of the US
cotton industry to mechanical harvesters. Because stripper harvesters are less
discriminating than picker harvesters, it would be expected that stripper harvesters
19
would have higher harvest efficiency. Williford et al. (1994) reported that spindle
pickers may harvest at up to 95% efficiency but typically achieve efficiencies between
85 and 90%, whereas stripper harvesters can have efficiencies up to 99%. However, the
cotton left unharvested by a spindle picker is often less mature, having lower micronaire
values and subsequently being weaker. Reductions in harvest efficiency can be the
result of cotton being left on the plant or being knocked off the plant onto the ground.
Both methods of loss represent unmarketable lint for the producer.
Several studies have compared the seed cotton and lint yields of cotton harvested
with both pickers and strippers. Brashears and Hake (1995) compared results from two
varieties of cotton harvested with a two-row spindle picker and a four-row brush-roll
stripper with and without a field cleaner. Varieties tested include Paymaster HS26
(considered a "stripper variety") and Stoneville 132 (an early maturing "picker variety").
Significant differences were found between the yield of seed cotton and turnout of all
harvest methods, while there was no significant difference between lint yield for the
stripper with field cleaner and stripper without field cleaner for either variety. As
expected with a less discriminating harvest method, the lint yield for both stripper
treatments was higher than the lint yield for the picker harvester for both varieties tested.
The analysis conducted by Brashears and Hake (1995) did not measure the
amount of cotton left in the field; therefore while the stripper harvester harvested more
lint than the picker harvester, harvest efficiency between the machines was not
compared. Furthermore, the two-row picker utilized in this study does not reflect the
advances in technology nor capacity of modern harvest machinery, making application
of this study to modern production systems questionable. The harvest yield in this study
was also less than five bales/ha (2 bales/ac), further confounding application of the
results of this study to new varieties of irrigated cotton on the High Plains.
Vories and Bonner (1995) reported results from a similar experiment comparing
spindle picked versus stripped-and-field-cleaned dry-land cotton in Arkansas. Again,
significant differences were detected in seed cotton yield and turnout, but harvest
efficiency was not reported. As with the picker in the Brashears and Hake (1995) study,
20
the brush stripper used in the Vories and Bonner (1995) study (an Allis Chalmers 880
with alternating brushes and flaps) does not represent modern harvesting machinery.
And again, the yields in this study were all below five bales/ha (2 bales/ac).
Faircloth et al. (2004) did a more comprehensive comparison of harvest methods
on irrigated cotton in northeast Louisiana, looking at several varieties. The picker
harvesters used in this study varied by location, but only one brush stripper (equipped
with a field cleaner) was used in all locations. In year one of this study, there was no
difference in lint yield between harvest methods for any location or variety. However, in
year two, differences were detected at all locations with the stripper harvested cotton
yielding higher than the picker harvested cotton. The average yield across all
experiments was 5.2 bales/ha (2.1 bales/ac), with the highest reported yield being 6.7
bales/ha (2.7 bales/ac) with the brush stripper in year two. Again, no absolute
comparison of harvest efficiency was conducted.
Yates et al. (2007) reported results from a comparison of picker and stripper
systems on the Texas High Plains, showing increased lint yield by the stripper harvester.
Again, no absolute measure of harvest efficiency was made, and yields averaged 2.5
bales/ha (1.0 bale/ac) in year one and 6.4 bales/ha (2.6 bale/ac) in year two. The same
picker harvester was used in the Yates et al. (2007) study as in the Brashears and Hake
(1995) study so that similar limitations exist regarding the applicability of this study to
modern production systems.
METHODS
For this study, picker and stripper harvesters were compared based on time-in-
motion, fuel usage, harvest efficiency, and the foreign matter content of seed cotton at
several locations throughout the High Plains.
Time-in-motion
Time-in-motion data were collected for each harvest system by an observer riding in
the cab of the harvester at the four sites described in Chapter II. A macro in Microsoft
21
Excel was used to record a time stamp at the beginning and end of each of the following
operations:
• Begin row
• End row
• Start turn at end of row
• End turn at end of row
• Stop harvest for full basket
• Begin transfer of cotton to boll buggy
• End transfer of cotton to boll buggy
• Start down time
• End down time
The time spent in each operation for each harvest system was calculated and
compared. Basket capacity (in bales) was determined by comparing the number of
basket dumps made into each module by the number of bales produced from each
module at the gin.
Fuel Use
Fuel use was measured by filling harvesters full of diesel before commencing
harvest operations. After harvest operations, a commercially-available fuel meter
(Model MD130; Great Plains Industries, Inc.; Wichita, KS ) was used to determine the
volume of diesel consumed by measuring the volume required to refill the harvester’s
diesel tank to a predetermined level. The corresponding area harvested was measured
manually in 2006 and by GPS in 2007.
Harvest Efficiency
Harvest efficiency tests were conducted to determine the amount of seed cotton
left in the field by each harvester. In 2006, all observations were made in a field planted
22
in ST 4554 B2RF. In 2007, observations were made on four distinct varieties at three
locations.
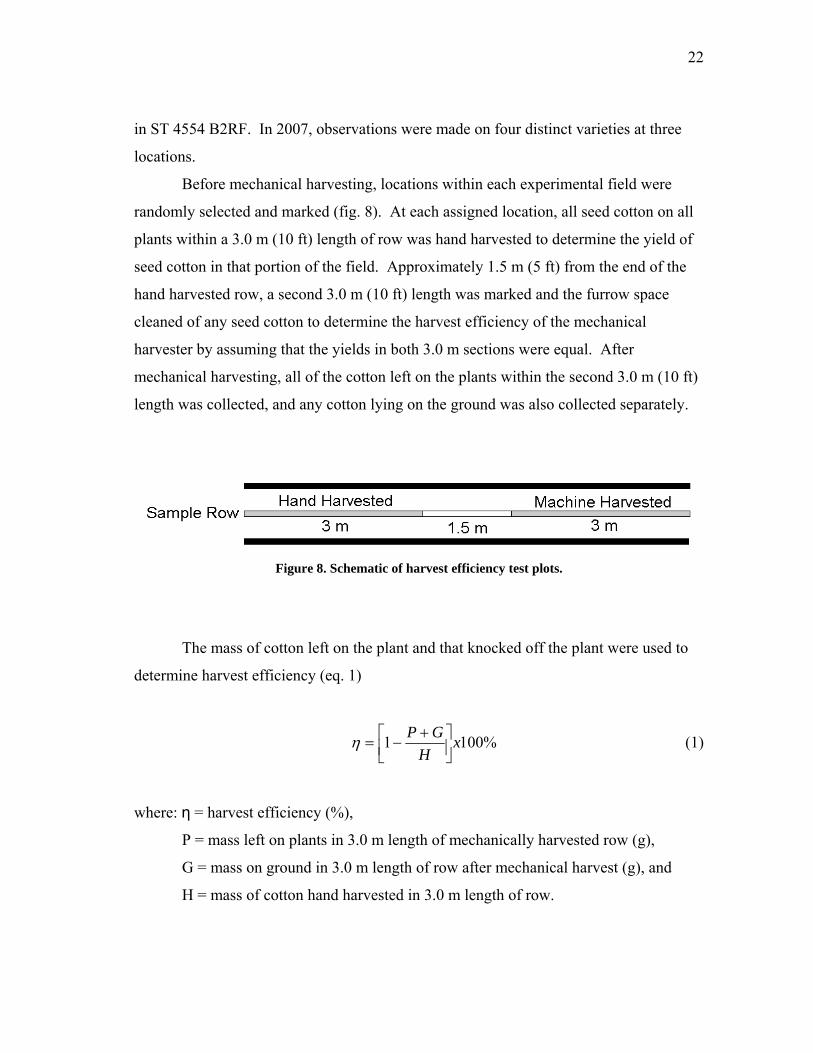
Before mechanical harvesting, locations within each experimental field were
randomly selected and marked (fig. 8). At each assigned location, all seed cotton on all
plants within a 3.0 m (10 ft) length of row was hand harvested to determine the yield of
seed cotton in that portion of the field. Approximately 1.5 m (5 ft) from the end of the
hand harvested row, a second 3.0 m (10 ft) length was marked and the furrow space
cleaned of any seed cotton to determine the harvest efficiency of the mechanical
harvester by assuming that the yields in both 3.0 m sections were equal. After
mechanical harvesting, all of the cotton left on the plants within the second 3.0 m (10 ft)
length was collected, and any cotton lying on the ground was also collected separately.
Figure 8. Schematic of harvest efficiency test plots.
The mass of cotton left on the plant and that knocked off the plant were used to
determine harvest efficiency (eq. 1)
%1001 xH
GP⎥⎦⎤
⎢⎣⎡ +−=η (1)
where: η = harvest efficiency (%),
P = mass left on plants in 3.0 m length of mechanically harvested row (g),
G = mass on ground in 3.0 m length of row after mechanical harvest (g), and
H = mass of cotton hand harvested in 3.0 m length of row.
23
An analysis of variance test was conducted on harvest efficiencies with the
General Linear Model function in SPSS (SPSS 14.0; SPSS Inc., Chicago, Ill.) with the
null hypothesis (α = 0.05) that all harvest efficiencies were equal. Means were
compared with the Least Significant Difference (LSD) pair-wise multiple comparison
test.
Seed cotton moisture content samples were collected from all plots at the time of
harvest as described in Chapter II. Plant height was measured in all plots in 2007 as
described in Chapter II. Correlations were tested between harvest efficiency and both
seed cotton moisture and plant height with Pearson’s two-tailed correlation test (α =
0.05).
RESULTS AND DISCUSSION
Time-in-motion
As expected, the amount of time spent in each harvest operation was highly
dependent on the harvester operator and the amount of support equipment (e.g. boll
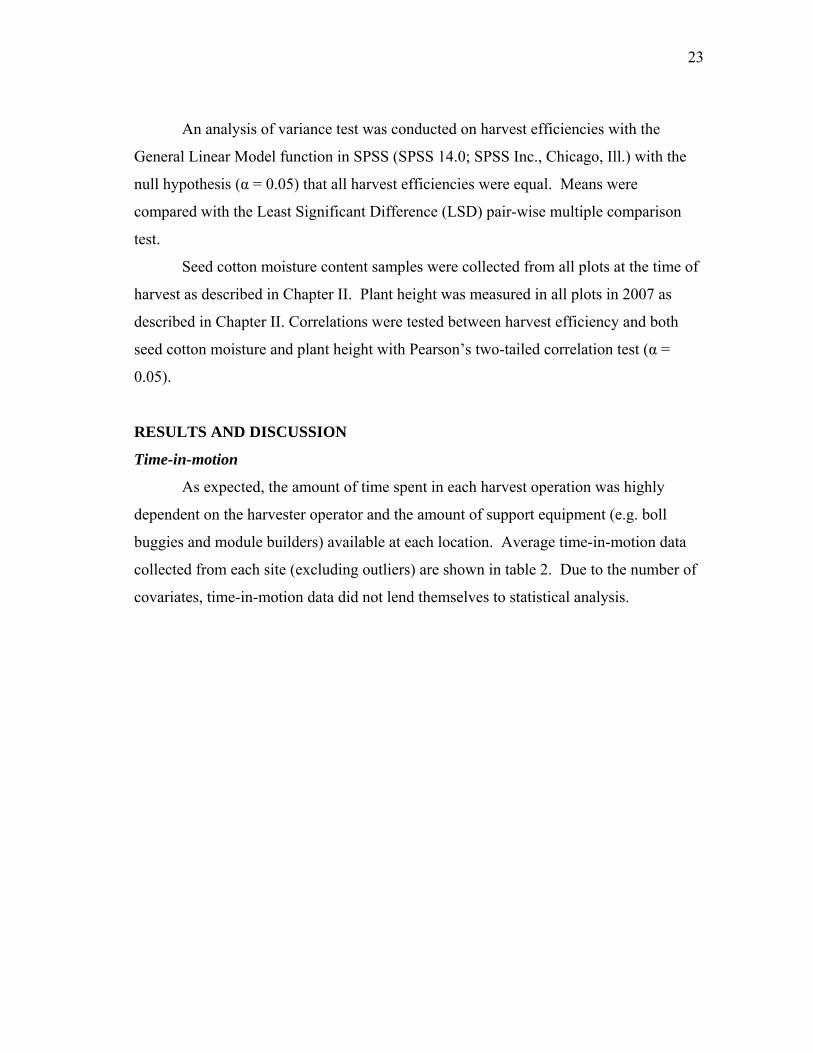
buggies and module builders) available at each location. Average time-in-motion data
collected from each site (excluding outliers) are shown in table 2. Due to the number of
covariates, time-in-motion data did not lend themselves to statistical analysis.
24
Table 2. Time-in-motion data. Harvester Location Yield
(bales/ha [bales/ac])
Speed (km/h [mph])
Basket Capacity (bales)
Dump Time (s)
Turn at End of Row
(s)
Picker Site 1 5.4 (2.2) 6.4 (4.0) -- 77 20 Site 2 9.1 (3.7) 6.0 (3.7) 4.60 49 23 Site 3 6.2 (2.5) 7.7 (4.8)[a] 3.99 104 45 Site 4 8.1 (3.3) 5.8 (3.6) 5.85 -- 42 Avg. 4.81 76 32.5 S. w/ FC[b] Site 1 4.9 (2.0) 6.0 (3.7) 1.98 54 27 Site 2 9.1 (3.7) 4.5 (2.8)[c] -- -- -- Site 4 8.1 (3.3) 4.8 (3.0) 2.26 36 36 Avg. 2.12 45 31.5 S. w/o FC[d] Site 1 5.9 (2.4) 5.5 (3.4) 1.79 54 31 Site 3 6.2 (2.5) 8.9 (5.5)[a] 1.79 20 27 Avg. 1.79 37 29.0 [a] Harvested in 2nd gear [b] S. w/FC = stripper with field cleaner [c] Data from 8-row stripper with field cleaner [d] S. w/o FC = stripper without field cleaner
The smaller basket capacity on the stripper required more frequent transfer of
stripped cotton to a boll buggy compared to the picker, but the transfer process was
faster due to the dumping mechanism on the stripper compared to a floor chain transfer
system on the larger picker basket. As previously mentioned, the dump time for the
picker at Site 3 was substantially longer than at Sites 1 and 2 because the boll buggies at
this site were not equipped with a hydraulic vane packer, so the boll buggy operator had
to tip the buggy half way through the transfer process to make additional room for cotton
coming from the picker basket. The additional transfer time at Site 3 points to the
number of variables that can affect the efficiency of harvest operations as well as the
need for evaluation of the complete harvest system when comparing harvester operation.
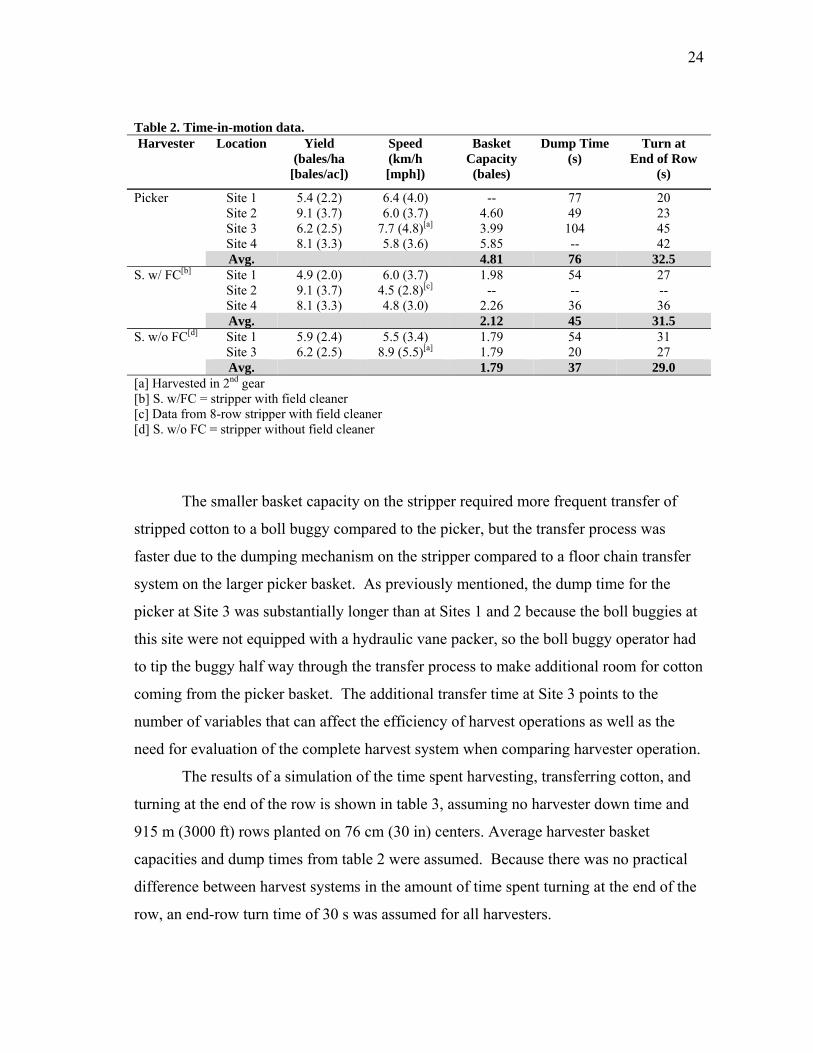
The results of a simulation of the time spent harvesting, transferring cotton, and
turning at the end of the row is shown in table 3, assuming no harvester down time and
915 m (3000 ft) rows planted on 76 cm (30 in) centers. Average harvester basket
capacities and dump times from table 2 were assumed. Because there was no practical
difference between harvest systems in the amount of time spent turning at the end of the
row, an end-row turn time of 30 s was assumed for all harvesters.
25
Table 3. Time-in-motion simulation.[a] Picker Stripper w/FC Stripper w/o FC
3.7 bales/ha (1.5 bales/ac) Speed (kph [mph]) 7.7 (4.8) 8.9 (5.5) 8.9 (5.5) Harvest time (hr/ha [hr/ac]) 0.320 (0.130) 0.289 (0.117) 0.289 (0.117) Harvesting (%) 88.7 85.6 85.7 Transferring (%) 5.1 7.6 7.4 Turning (%) 6.2 6.9 6.9
7.4 bales/ha (3.0 bales/ac)Speed (kph [mph]) 6.1 (3.8) 4.8 (3.0) 5.1 (3.2) Harvest time (hr/ha [hr/ac]) 0.411 (0.166) 0.518 (0.210) 0.488 (0.198) Harvesting (%) 87.2 87.7 87.2 Transferring (%) 7.9 8.5 8.7 Turning (%) 4.8 3.8 4.1
9.9 bales/ha (4.0 bales/ac)Speed (kph [mph]) 5.6 (3.5) 4.5 (2.8) 4.8 (3.0) Harvest time (hr/ha [hr/ac]) 0.453 (0.183) 0.565 (0.229) 0.531 (0.215) Harvesting (%) 86.0 86.1 85.6 Transferring (%) 9.6 10.3 10.7 Turning (%) 4.4 3.5 3.7 [a] Simulation assumes no harvester downtime.
In general, due to the larger basket capacity, in high-yielding stands, the picker
was able to harvest a unit area of cotton more quickly than was either stripper. This
advantage was compounded when extremely high yielding cotton was field-cleaned due
to limitations on the flow rate of seed cotton processed through the field cleaner. In
lower yielding cotton where the field cleaner was not the bottleneck in the system, the
stripper was able to harvest at a faster rate than the picker, giving it an advantage in
terms of area harvested per unit time.
Fuel Use
The average fuel consumption for the picker in 2006 and 2007 was 26.2 L/ha
(2.80 gal/ac). No correlation was detected between fuel use per unit area and yield. The
measured fuel consumption in this study was approximately 55% higher than that
reported by Willcutt and Barnes (2008). However, Willcutt and Barnes (2008) observed
fuel consumption from a John Deere 9976 harvester, which has a 250 horsepower
engine, while observations in this study were from a John Deere 9996 harvester, which
has a 350 horsepower engine. The ratio of fuel use to engine rated horsepower were
26
roughly equivalent in both studies. Because the stripper harvesters were operated by
custom harvesters, insufficient data on stripper fuel use was collected to draw any
conclusions from field measurement. However, all stripper harvesters had 175 HP
engines, from which it may be deduced that, under similar engine loads, the fuel
consumption for strippers would be approximately half that of the John Deere 9996
picker harvesters.
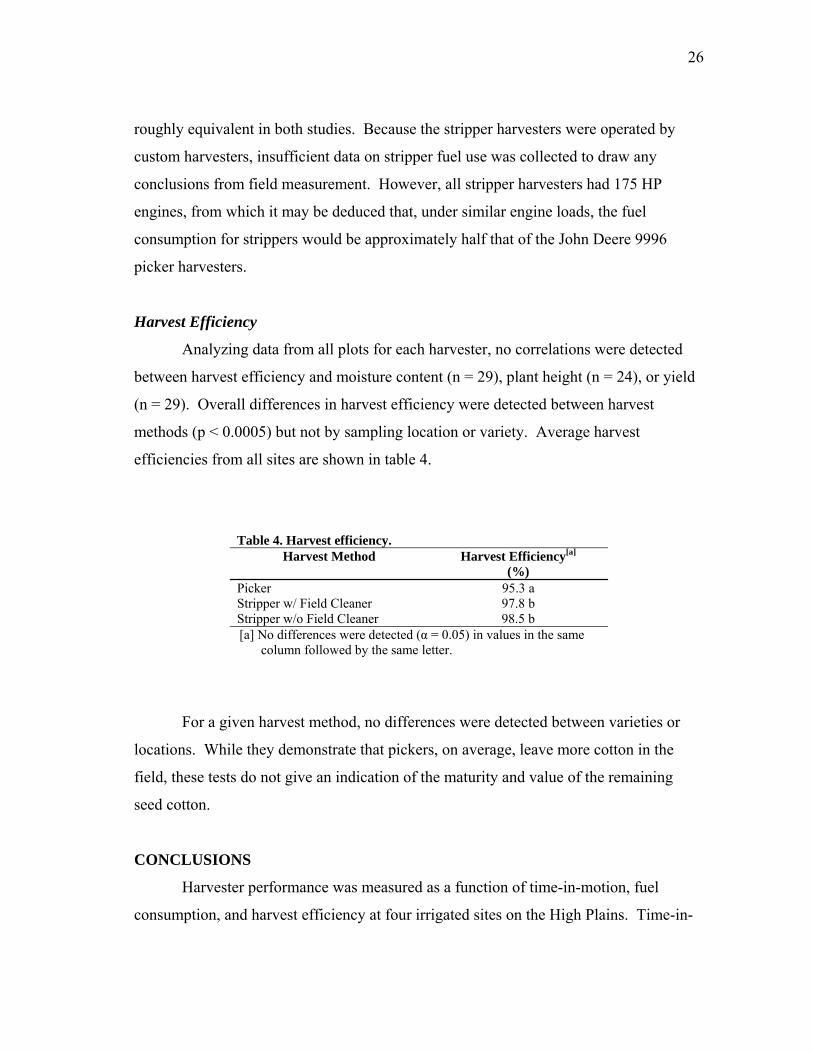
Harvest Efficiency
Analyzing data from all plots for each harvester, no correlations were detected
between harvest efficiency and moisture content (n = 29), plant height (n = 24), or yield
(n = 29). Overall differences in harvest efficiency were detected between harvest
methods (p < 0.0005) but not by sampling location or variety. Average harvest
efficiencies from all sites are shown in table 4.
Table 4. Harvest efficiency.
Harvest Method Harvest Efficiency[a] (%)
Picker 95.3 a Stripper w/ Field Cleaner 97.8 b Stripper w/o Field Cleaner 98.5 b [a] No differences were detected (α = 0.05) in values in the same
column followed by the same letter.
For a given harvest method, no differences were detected between varieties or
locations. While they demonstrate that pickers, on average, leave more cotton in the
field, these tests do not give an indication of the maturity and value of the remaining
seed cotton.
CONCLUSIONS
Harvester performance was measured as a function of time-in-motion, fuel
consumption, and harvest efficiency at four irrigated sites on the High Plains. Time-in-
27
motion performance was highly dependent on equipment used in the harvest system and
machinery operators. In a system where sufficient support equipment such as boll
buggies and module builders were available, although stripper harvesters have smaller
basket capacity than pickers, strippers spent more time harvesting than pickers in lower
yielding cotton. In higher yielding cotton, pickers spent more time harvesting than
strippers. Field cleaner capacity severely limited stripper ground speed in high yielding
cotton.
Fuel consumption for a six-row John Deere 9996 picker was 26.2 L/ha (2.80
gal/ac). No correlation was detected between fuel use per unit area and yield.
The John Deere 9996 picker was shown to have statistically lower harvest
efficiency than the John Deere 7460 stripper regardless of variety or harvest location.
However, these tests gave no indication of the quality or value of cotton left unharvested
by the picker. If the cotton left unpicked is immature, the value of lint per unit area may
be greater for picked cotton even though less cotton is harvested.
28
CHAPTER IV
GINNING
INTRODUCTION
Mechanical methods of separating cotton lint from the seed have been around for
centuries. The Churka gin was a rudimentary machine that used rollers to pinch fibers
from the seed. In 1794, Eli Whitney received a patent for a cotton gin that used metal
spikes in concentric rows to pull cotton fibers through a narrow slot that seeds could not
fit through. In 1796, Henry Ogden Holmes received a patent for a gin employing metal
saws rather than spikes and “ribs” that allowed cleaned seeds to fall out the bottom of
the gin. These improvements, which first allowed for continuous flow ginning, represent
the principle on which modern gin stands function (Mayfield and Anthony, 1994).
In 1834, Alex Jones developed the first successful mechanical feeder for the
cotton gin. The first half of the 20th century saw the development of seed cotton dryers
and cleaners as well as lint cleaners (Mayfield and Anthony, 1994). Today, most gin
facilities employ a labyrinth of machinery to automatically feed and disperse seed cotton
modules; pneumatically convey seed cotton between machinery stages; regulate seed
cotton moisture for cleaning and ginning; separate lint from seeds; clean, compress, and
package lint; and weigh and convey cotton seed. While the machinery specifications
and sequences in each gin differ, all gins have the same goal of preserving fiber quality
while removing foreign matter and seed from the lint in a timely manner without wasting
lint.
Foreign matter in seed cotton may include sticks, burrs, leaf, grass, or other
objects. Increased foreign matter in seed cotton results in more modules of seed cotton
per unit area, resulting in greater seed cotton transportation costs and more required
cleaning at the gin. Because of the indiscriminate manner in which stripper harvesters
remove seed cotton from the plant, stripped cotton generally has more foreign matter
than picked cotton. Field cleaners were added to strippers to reduce the amount of
29
foreign material in the module, but stripped-and-field-cleaned seed cotton generally
contains more foreign matter than picked seed cotton.
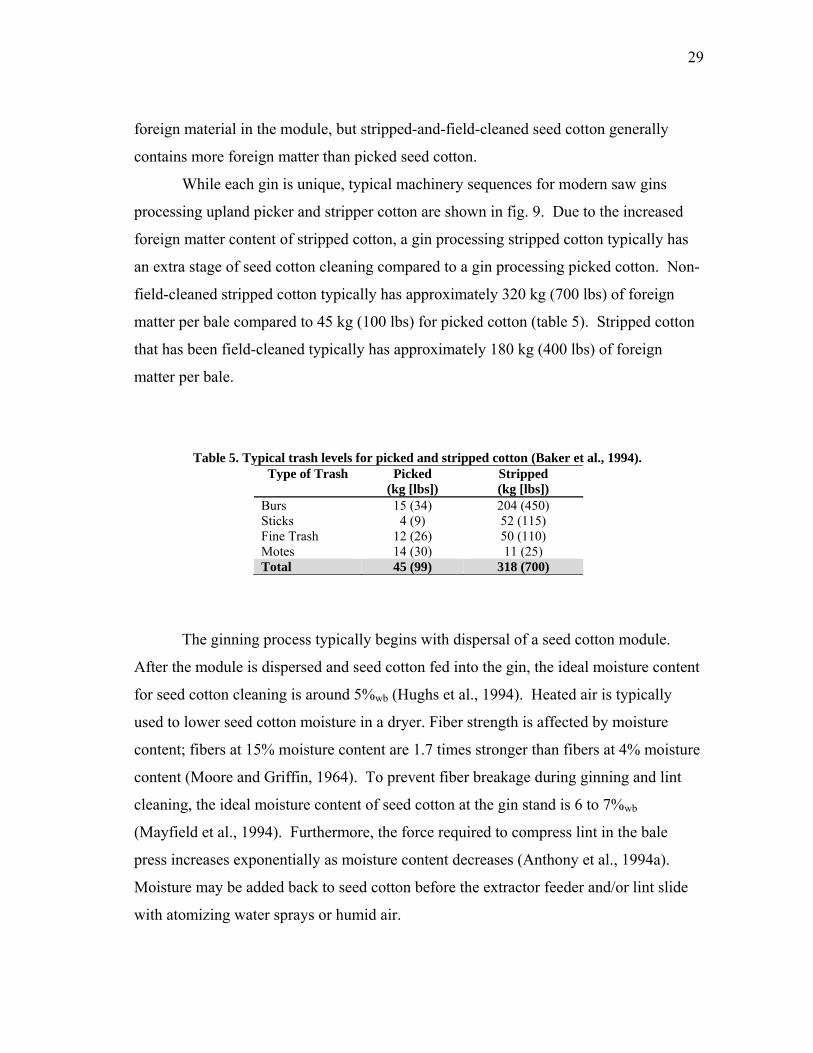
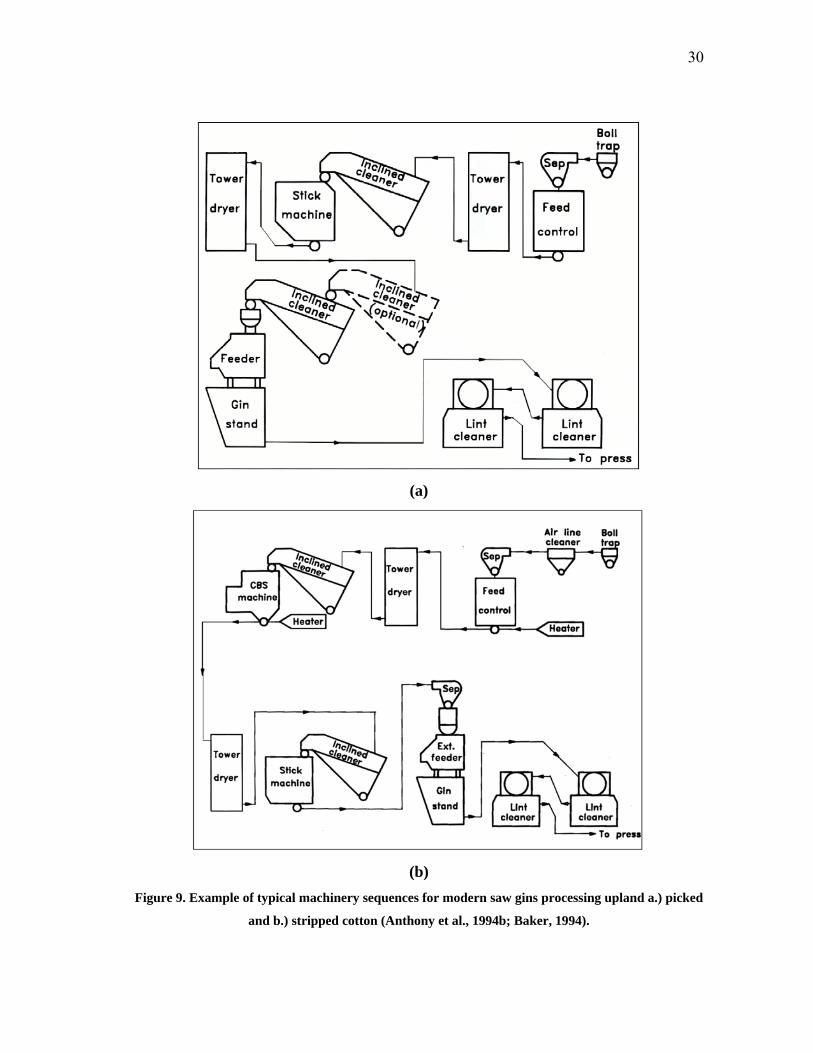
While each gin is unique, typical machinery sequences for modern saw gins
processing upland picker and stripper cotton are shown in fig. 9. Due to the increased
foreign matter content of stripped cotton, a gin processing stripped cotton typically has
an extra stage of seed cotton cleaning compared to a gin processing picked cotton. Non-
field-cleaned stripped cotton typically has approximately 320 kg (700 lbs) of foreign
matter per bale compared to 45 kg (100 lbs) for picked cotton (table 5). Stripped cotton
that has been field-cleaned typically has approximately 180 kg (400 lbs) of foreign
matter per bale.
Table 5. Typical trash levels for picked and stripped cotton (Baker et al., 1994).
Type of Trash Picked (kg [lbs])
Stripped (kg [lbs])
Burs 15 (34) 204 (450) Sticks 4 (9) 52 (115) Fine Trash 12 (26) 50 (110) Motes 14 (30) 11 (25) Total 45 (99) 318 (700)
The ginning process typically begins with dispersal of a seed cotton module.
After the module is dispersed and seed cotton fed into the gin, the ideal moisture content
for seed cotton cleaning is around 5%wb (Hughs et al., 1994). Heated air is typically
used to lower seed cotton moisture in a dryer. Fiber strength is affected by moisture
content; fibers at 15% moisture content are 1.7 times stronger than fibers at 4% moisture
content (Moore and Griffin, 1964). To prevent fiber breakage during ginning and lint
cleaning, the ideal moisture content of seed cotton at the gin stand is 6 to 7%wb
(Mayfield et al., 1994). Furthermore, the force required to compress lint in the bale
press increases exponentially as moisture content decreases (Anthony et al., 1994a).
Moisture may be added back to seed cotton before the extractor feeder and/or lint slide
with atomizing water sprays or humid air.
30
(a)
(b)
Figure 9. Example of typical machinery sequences for modern saw gins processing upland a.) picked
and b.) stripped cotton (Anthony et al., 1994b; Baker, 1994).
31
Anthony and Eckley (1994) reported that gins typically use 40 to 60 kW-h of
electricity per bale, and that electricity consumption per bale has remained steady since
1962. Hughs et al. (1994) suggested that a gin would use approximately 320 MJ/bale
(300,000 BTU/bale) worth of natural gas or commercial propane in moisture control
processes. While neither Anthony and Eckley (1994) nor Hughs et al. (1994) suggested
differences in energy use between gins processing picked and stripped cotton, it is
reasonable to assume that more gas and electricity would be consumed when processing
more material at a gin.
The cost to the producer of ginning seed cotton varies between gins and by year
but is often a function of the mass of seed cotton processed. Therefore, producers may
expect to pay less per bale of lint for picked seed cotton compared to stripped seed
cotton. Gins may also be able to recognize substantial savings in utility and maintenance
costs by using less cleaning machinery and less heat for drying on picked cotton versus
cotton harvested with a stripper. Based on the fee structure of the gin, these savings may
or may not be passed on to the producer, but differences in ginning costs may represent
an important input into any decision matrix used to compare harvester options. The cost
of module transportation is often included in the cost of ginning, as well. Total
transportation costs may be affected by the method of harvest as increased foreign matter
content in seed cotton results in more modules that must be moved to the gin.
The objective of this study was to compare the cost of transporting and ginning
seed cotton harvested with picker harvesters and stripper harvesters with and without
field cleaners. Comparisons between harvest systems were made based on differences in
foreign matter content of seed cotton, turnout, energy consumption at the gin, and the
cost of ginning to the producer.
METHODS
Foreign Matter Content
At Sites 1, 3, and 4, 1.0 kg samples for fractionation analysis were collected from
the weigh wagon for each replication of each harvest-method-by-variety combination.
32
For each sample, foreign matter in the seed cotton was determined by the Pneumatic
Fractionator Method described by Shepherd (1972). Large foreign matter was removed
from the samples by hand before fractionation and was categorized into burrs, sticks, and
other. The mass of the entire sample and those of each fraction of foreign matter were
determined with an Ohaus scale (Model CT1200-S, Florham Park, NJ) with a 0.1 g
resolution. An analysis of variance test was conducted on the percent composition of
samples from each treatment with the General Linear Model function in SPSS (SPSS
14.0; SPSS, Inc.; Chicago, Ill.) with the null hypothesis (α = 0.05) that the percentages
of total foreign material, hulls, sticks, leaf, pin trash, and motes between treatments were
equal. Means were compared with the Least Significant Difference (LSD) pair-wise
multiple comparison test.
Turnout
Turnout is a measure of the mass of marketable lint per unit mass of seed cotton
entering the gin. Turnout is a function of the foreign matter content of seed cotton, the
number of stages of cleaning, and variety (which primarily affects the mass of seed per
unit mass of lint). Williford et al. (1994) reported that turnout for picked cotton is
around 33% while turnout for stripped cotton typically ranges from 15 to 26%. In 2006,
turnout for seed cotton from each harvest method at Site 1 was measured from the full-
size modules ginned at New-Tex gin in Plains, Texas. Because only one module was
produced with each harvest method, no statistical analysis was conducted on 2006
turnout data. In 2007, lint and seed turnout were measured from the samples ginned at
the USDA-ARS Cotton Production and Processing Research Unit. An analysis of
variance test was conducted on the lint turnout, seed turnout, and average seed weight
per bale of samples from Sites 3 and 4 with the General Linear Model function in SPSS
with the null hypothesis (α = 0.05) that means between all samples were equal. Means
were compared with the Least Significant Difference (LSD) pair-wise multiple
comparison test.
33
Energy Consumption
Electricity and natural gas consumption were monitored for each module ginned
at New-Tex Gin in 2006. Due to rainfall late in the season, two stages of lint cleaning
were used to remove leaf from both picked and stripped seed cotton. Again, because
only one module was produced with each harvest method, no statistical analysis was
conducted on energy consumption data. In 2007, all samples were ginned at the USDA-
ARS Cotton Production and Processing Research Unit gin in Lubbock, Texas. Lot sizes
were too small to successfully measure utility consumption during ginning of each
sample.
Cost to Producer
The cost of ginning varies from gin to gin and from year to year. At many gins,
costs are a function of the mass of seed cotton processed. Various other costs such as
module transport costs, bagging and tie charges, and classing fees may be included as
well. In this study, the fee schedules for ginning at several gins were compared and the
cost of ginning to the producer was analyzed as a function of harvest method.
RESULTS AND DISCUSSION
Foreign Matter Content
A MANOVA test using Wilk’s Lambda (n = 60) revealed significant differences
in foreign matter content and composition as a function of location (p = 0.018), variety
(p = 0.011), harvest treatment (p < 0.0005), and interactions of location and treatment (p
< 0.0005). Response variables differing significantly by location include sticks, grass,
leaf, and pin trash. Response variables differing significantly by variety include sticks
and pin trash. Response variables differing significantly by location-treatment
interaction include burrs and pin trash. The composition of seed cotton from each
harvest treatment is shown in table 6.
34
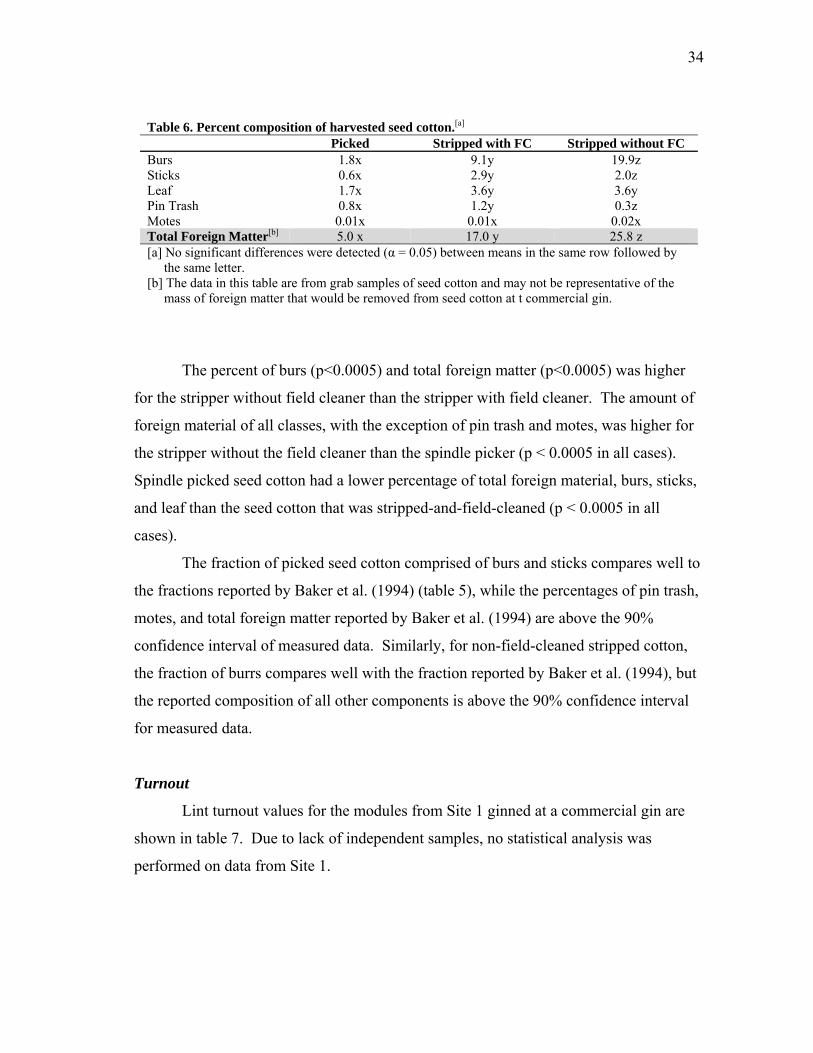
Table 6. Percent composition of harvested seed cotton.[a]
Picked Stripped with FC Stripped without FC Burs 1.8x 9.1y 19.9z Sticks 0.6x 2.9y 2.0z Leaf 1.7x 3.6y 3.6y Pin Trash 0.8x 1.2y 0.3z Motes 0.01x 0.01x 0.02x Total Foreign Matter[b] 5.0 x 17.0 y 25.8 z [a] No significant differences were detected (α = 0.05) between means in the same row followed by the same letter. [b] The data in this table are from grab samples of seed cotton and may not be representative of the
mass of foreign matter that would be removed from seed cotton at t commercial gin.
The percent of burs (p<0.0005) and total foreign matter (p<0.0005) was higher
for the stripper without field cleaner than the stripper with field cleaner. The amount of
foreign material of all classes, with the exception of pin trash and motes, was higher for
the stripper without the field cleaner than the spindle picker (p < 0.0005 in all cases).
Spindle picked seed cotton had a lower percentage of total foreign material, burs, sticks,
and leaf than the seed cotton that was stripped-and-field-cleaned (p < 0.0005 in all
cases).
The fraction of picked seed cotton comprised of burs and sticks compares well to
the fractions reported by Baker et al. (1994) (table 5), while the percentages of pin trash,
motes, and total foreign matter reported by Baker et al. (1994) are above the 90%
confidence interval of measured data. Similarly, for non-field-cleaned stripped cotton,
the fraction of burrs compares well with the fraction reported by Baker et al. (1994), but
the reported composition of all other components is above the 90% confidence interval
for measured data.
Turnout
Lint turnout values for the modules from Site 1 ginned at a commercial gin are
shown in table 7. Due to lack of independent samples, no statistical analysis was
performed on data from Site 1.
35
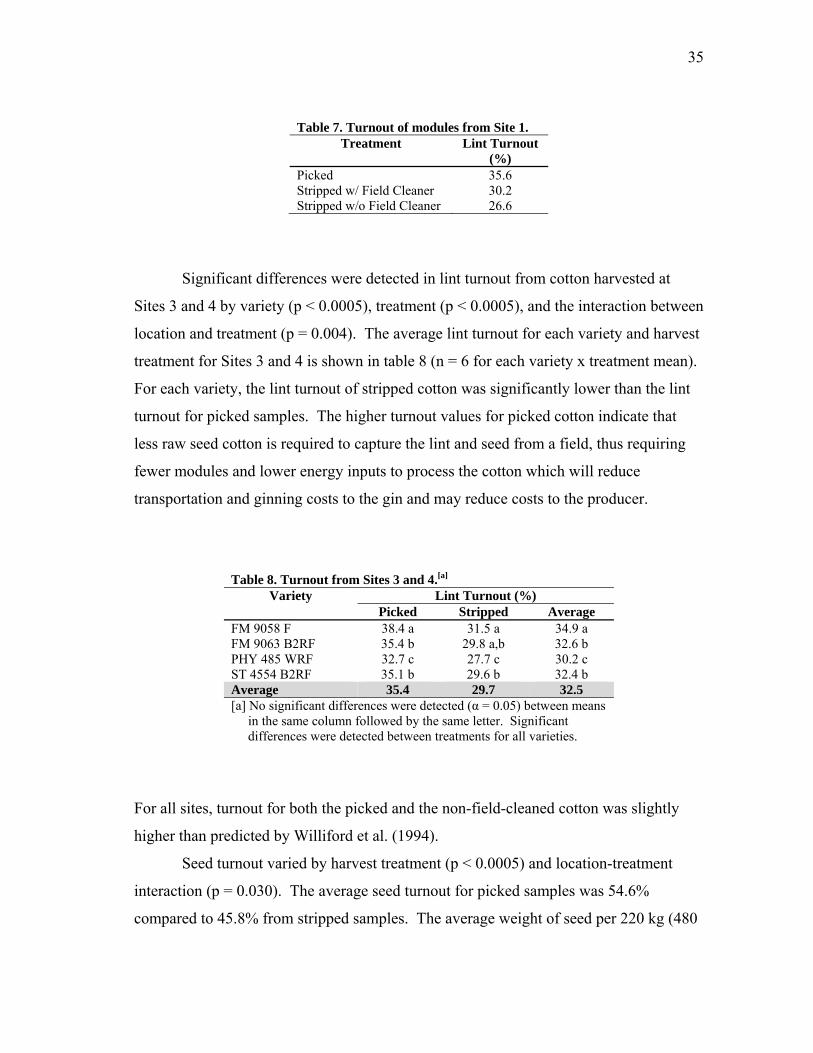
Table 7. Turnout of modules from Site 1. Treatment Lint Turnout
(%) Picked 35.6 Stripped w/ Field Cleaner 30.2 Stripped w/o Field Cleaner 26.6
Significant differences were detected in lint turnout from cotton harvested at
Sites 3 and 4 by variety (p < 0.0005), treatment (p < 0.0005), and the interaction between
location and treatment (p = 0.004). The average lint turnout for each variety and harvest
treatment for Sites 3 and 4 is shown in table 8 (n = 6 for each variety x treatment mean).
For each variety, the lint turnout of stripped cotton was significantly lower than the lint
turnout for picked samples. The higher turnout values for picked cotton indicate that
less raw seed cotton is required to capture the lint and seed from a field, thus requiring
fewer modules and lower energy inputs to process the cotton which will reduce
transportation and ginning costs to the gin and may reduce costs to the producer.
Table 8. Turnout from Sites 3 and 4.[a]
Variety Lint Turnout (%) Picked Stripped Average
FM 9058 F 38.4 a 31.5 a 34.9 a FM 9063 B2RF 35.4 b 29.8 a,b 32.6 b PHY 485 WRF 32.7 c 27.7 c 30.2 c ST 4554 B2RF 35.1 b 29.6 b 32.4 b Average 35.4 29.7 32.5 [a] No significant differences were detected (α = 0.05) between means
in the same column followed by the same letter. Significant differences were detected between treatments for all varieties.
For all sites, turnout for both the picked and the non-field-cleaned cotton was slightly
higher than predicted by Williford et al. (1994).
Seed turnout varied by harvest treatment (p < 0.0005) and location-treatment
interaction (p = 0.030). The average seed turnout for picked samples was 54.6%
compared to 45.8% from stripped samples. The average weight of seed per 220 kg (480
36
lbs) bale varied significantly (p < 0.0005; n = 12) by variety only (table 9). The
variation in seed weight per bale explains the differences in lint turnout as function of
variety for a given harvest treatment.
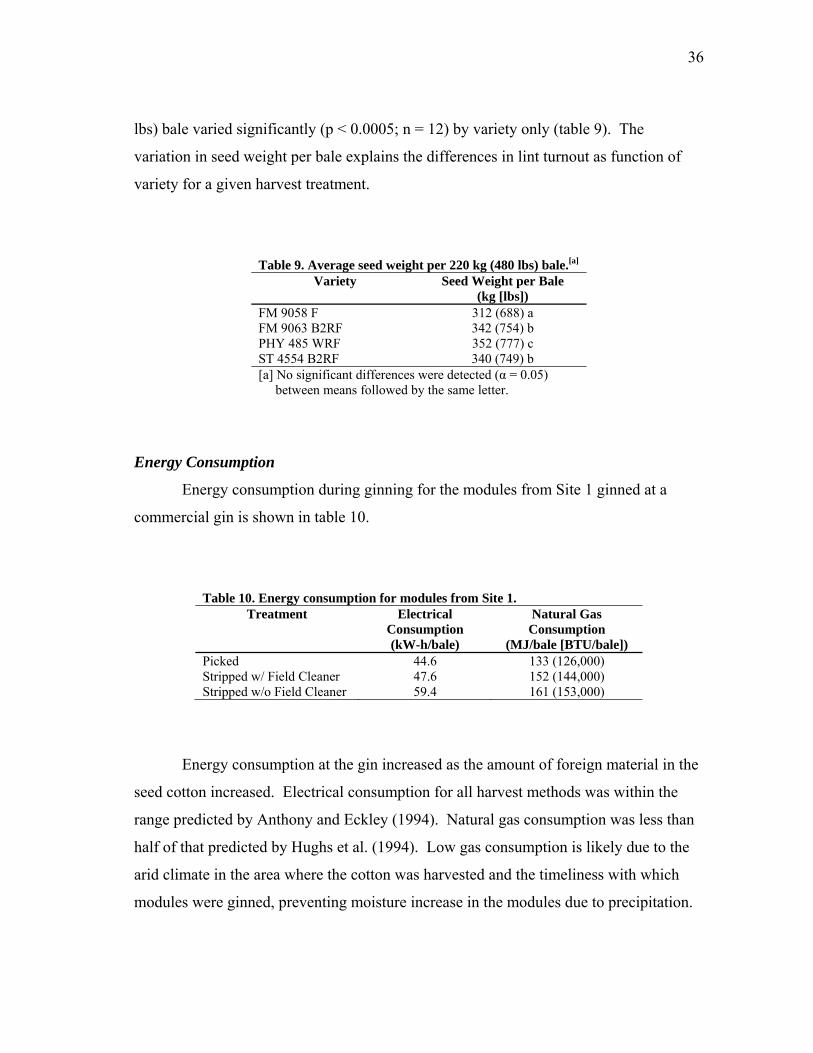
Table 9. Average seed weight per 220 kg (480 lbs) bale.[a]
Variety Seed Weight per Bale (kg [lbs])
FM 9058 F 312 (688) a FM 9063 B2RF 342 (754) b PHY 485 WRF 352 (777) c ST 4554 B2RF 340 (749) b [a] No significant differences were detected (α = 0.05)
between means followed by the same letter.
Energy Consumption
Energy consumption during ginning for the modules from Site 1 ginned at a
commercial gin is shown in table 10.
Table 10. Energy consumption for modules from Site 1.
Treatment Electrical Consumption (kW-h/bale)
Natural Gas Consumption
(MJ/bale [BTU/bale]) Picked 44.6 133 (126,000) Stripped w/ Field Cleaner 47.6 152 (144,000) Stripped w/o Field Cleaner 59.4 161 (153,000)
Energy consumption at the gin increased as the amount of foreign material in the
seed cotton increased. Electrical consumption for all harvest methods was within the
range predicted by Anthony and Eckley (1994). Natural gas consumption was less than
half of that predicted by Hughs et al. (1994). Low gas consumption is likely due to the
arid climate in the area where the cotton was harvested and the timeliness with which
modules were ginned, preventing moisture increase in the modules due to precipitation.
37
Again, lower energy inputs to process picked cotton versus stripped cotton will reduce
costs to the gin and may reduce costs to the producer.
Cost to Producer
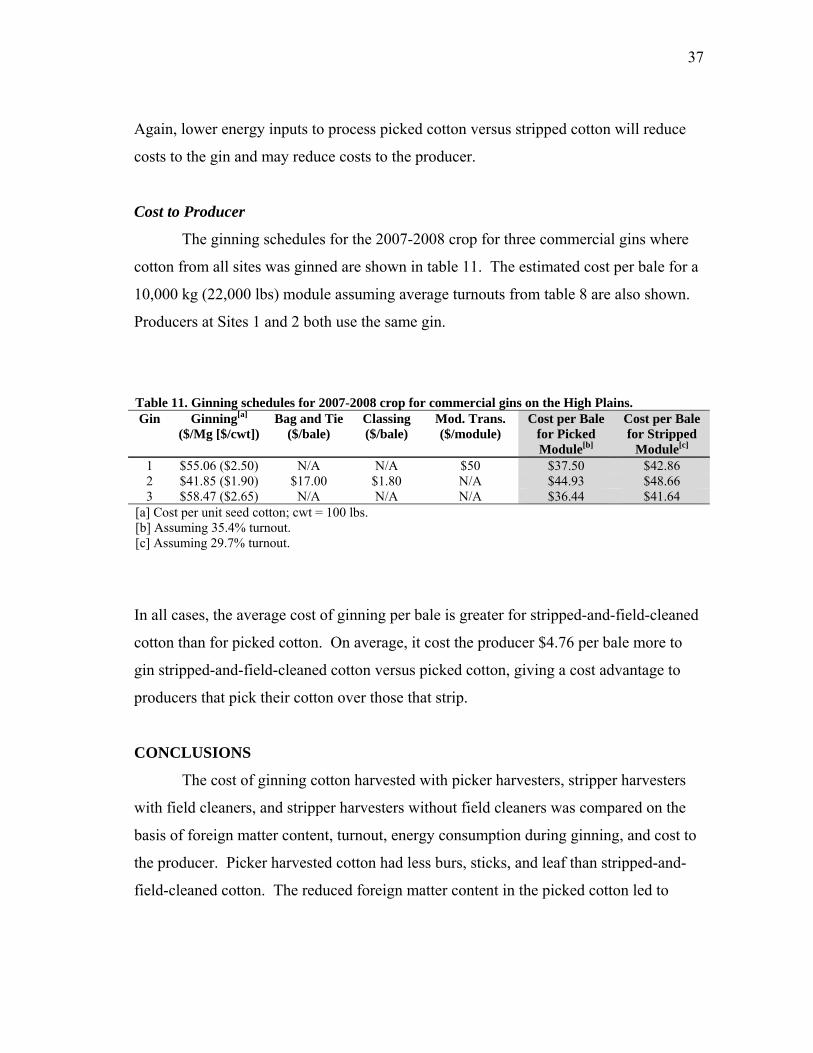
The ginning schedules for the 2007-2008 crop for three commercial gins where
cotton from all sites was ginned are shown in table 11. The estimated cost per bale for a
10,000 kg (22,000 lbs) module assuming average turnouts from table 8 are also shown.
Producers at Sites 1 and 2 both use the same gin.
Table 11. Ginning schedules for 2007-2008 crop for commercial gins on the High Plains. Gin Ginning[a]
($/Mg [$/cwt]) Bag and Tie
($/bale) Classing ($/bale)
Mod. Trans. ($/module)
Cost per Bale for Picked Module[b]
Cost per Bale for Stripped
Module[c] 1 $55.06 ($2.50) N/A N/A $50 $37.50 $42.86 2 $41.85 ($1.90) $17.00 $1.80 N/A $44.93 $48.66 3 $58.47 ($2.65) N/A N/A N/A $36.44 $41.64
[a] Cost per unit seed cotton; cwt = 100 lbs. [b] Assuming 35.4% turnout. [c] Assuming 29.7% turnout.
In all cases, the average cost of ginning per bale is greater for stripped-and-field-cleaned
cotton than for picked cotton. On average, it cost the producer $4.76 per bale more to
gin stripped-and-field-cleaned cotton versus picked cotton, giving a cost advantage to
producers that pick their cotton over those that strip.
CONCLUSIONS
The cost of ginning cotton harvested with picker harvesters, stripper harvesters
with field cleaners, and stripper harvesters without field cleaners was compared on the
basis of foreign matter content, turnout, energy consumption during ginning, and cost to
the producer. Picker harvested cotton had less burs, sticks, and leaf than stripped-and-
field-cleaned cotton. The reduced foreign matter content in the picked cotton led to

38
greater turnout, lower energy consumption during ginning, and a lower overall cost to
the producer for module transportation and ginning.
39
CHAPTER V
FIBER QUALITY
INTRODUCTION
The quality of cotton fibers is dependent on many factors, including genetics,
environmental conditions during production, and handling during harvest and
processing. A number of fiber quality parameters influence the quality of yarn and
fabrics produced from raw fibers and, therefore, the price that consumers are willing to
pay for those fibers. Fiber length, strength, tenacity, maturity, fineness, and uniformity
are among the properties that affect the way in which bundles of fibers will perform in
spinning. Fiber maturity, diameter, color, reflectance, the presence or foreign matter,
seed-coat fragments, and neps (entanglements in fibers) all affect the way a fabric
absorbs dye and, therefore, the quality of the finished product.
HVI
The High Volume Instrument (HVI) system is the suite of instruments used by
the USDA Agricultural Marketing Service (AMS) to class US cotton for marketing
according to quality indicators. HVIs characterize fiber qualities by analyzing a sample
of fibers. Fiber quality parameters reported by HVI include micronaire, length, length
uniformity, strength, elongation, reflectance, yellowness, and trash.
Micronaire
Micronaire is a measure of fiber fineness and maturity. The definition of fiber
fineness (Pierce and Lord, 1939) is given in eq. 2:
( )TPTAH w π−== 52.152.1 (2)
where: H = fineness (mtex),
Aw = wall area (µm2),
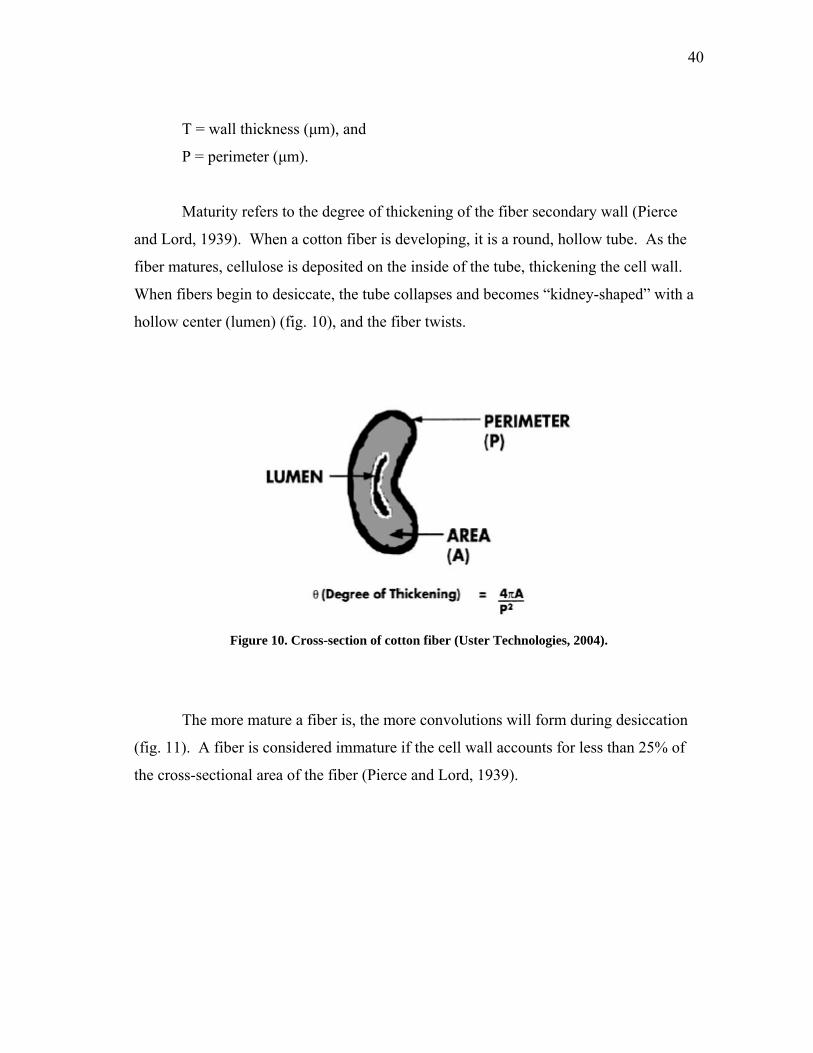
40
T = wall thickness (µm), and
P = perimeter (µm).
Maturity refers to the degree of thickening of the fiber secondary wall (Pierce
and Lord, 1939). When a cotton fiber is developing, it is a round, hollow tube. As the
fiber matures, cellulose is deposited on the inside of the tube, thickening the cell wall.
When fibers begin to desiccate, the tube collapses and becomes “kidney-shaped” with a
hollow center (lumen) (fig. 10), and the fiber twists.
Figure 10. Cross-section of cotton fiber (Uster Technologies, 2004).
The more mature a fiber is, the more convolutions will form during desiccation
(fig. 11). A fiber is considered immature if the cell wall accounts for less than 25% of
the cross-sectional area of the fiber (Pierce and Lord, 1939).
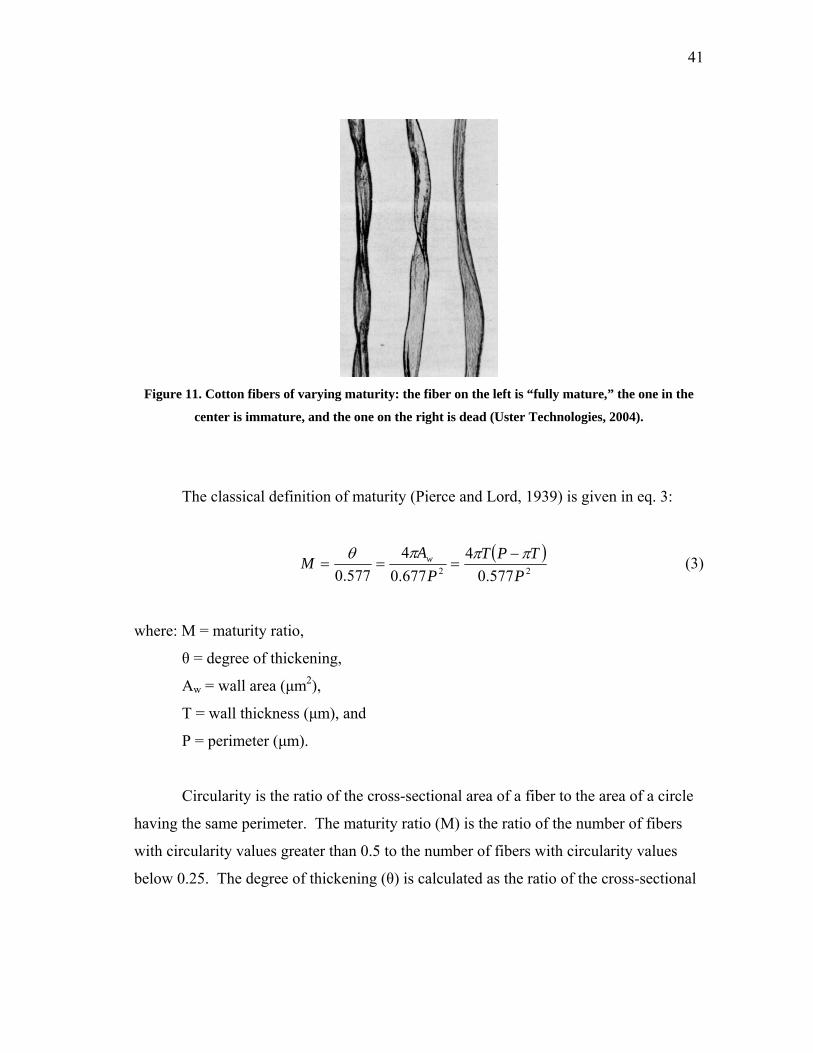
41
Figure 11. Cotton fibers of varying maturity: the fiber on the left is “fully mature,” the one in the
center is immature, and the one on the right is dead (Uster Technologies, 2004).
The classical definition of maturity (Pierce and Lord, 1939) is given in eq. 3:
( )22 577.0
4677.04
577.0 PTPT
PA
M w πππθ −=== (3)
where: M = maturity ratio,
θ = degree of thickening,
Aw = wall area (µm2),
T = wall thickness (µm), and
P = perimeter (µm).
Circularity is the ratio of the cross-sectional area of a fiber to the area of a circle
having the same perimeter. The maturity ratio (M) is the ratio of the number of fibers
with circularity values greater than 0.5 to the number of fibers with circularity values
below 0.25. The degree of thickening (θ) is calculated as the ratio of the cross-sectional
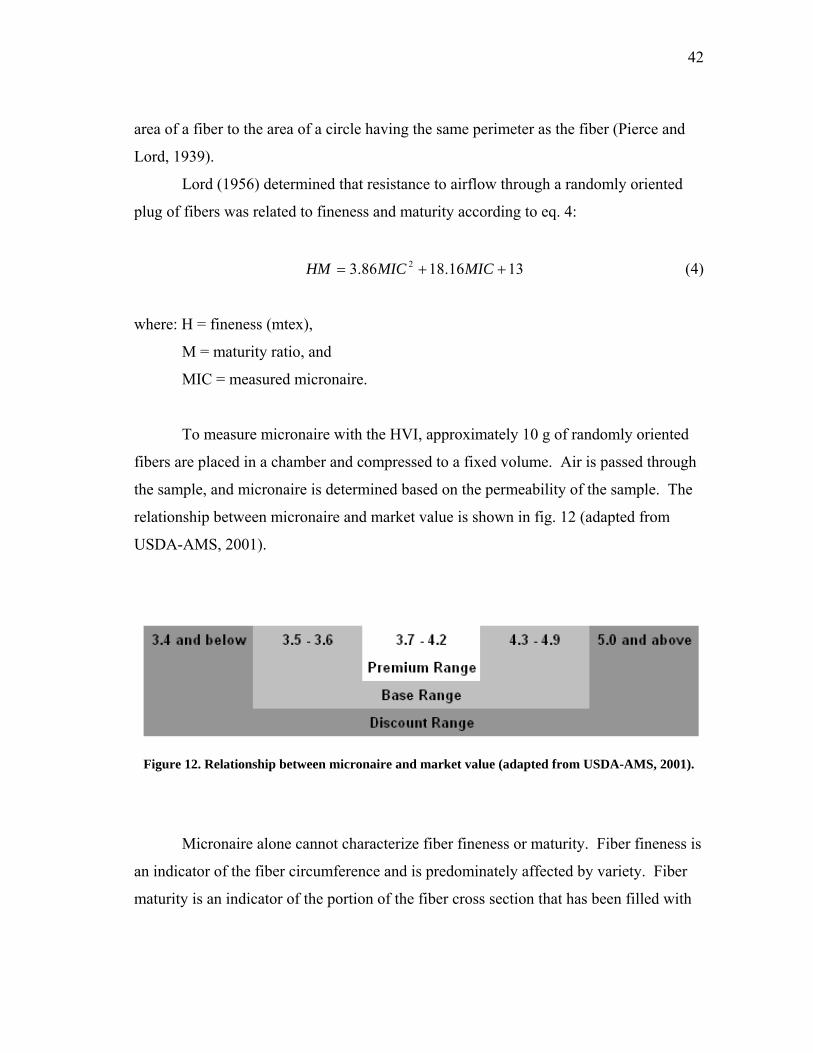
42
area of a fiber to the area of a circle having the same perimeter as the fiber (Pierce and
Lord, 1939).
Lord (1956) determined that resistance to airflow through a randomly oriented
plug of fibers was related to fineness and maturity according to eq. 4:
1316.1886.3 2 ++= MICMICHM (4)
where: H = fineness (mtex),
M = maturity ratio, and
MIC = measured micronaire.
To measure micronaire with the HVI, approximately 10 g of randomly oriented
fibers are placed in a chamber and compressed to a fixed volume. Air is passed through
the sample, and micronaire is determined based on the permeability of the sample. The
relationship between micronaire and market value is shown in fig. 12 (adapted from
USDA-AMS, 2001).
Figure 12. Relationship between micronaire and market value (adapted from USDA-AMS, 2001).
Micronaire alone cannot characterize fiber fineness or maturity. Fiber fineness is
an indicator of the fiber circumference and is predominately affected by variety. Fiber
maturity is an indicator of the portion of the fiber cross section that has been filled with
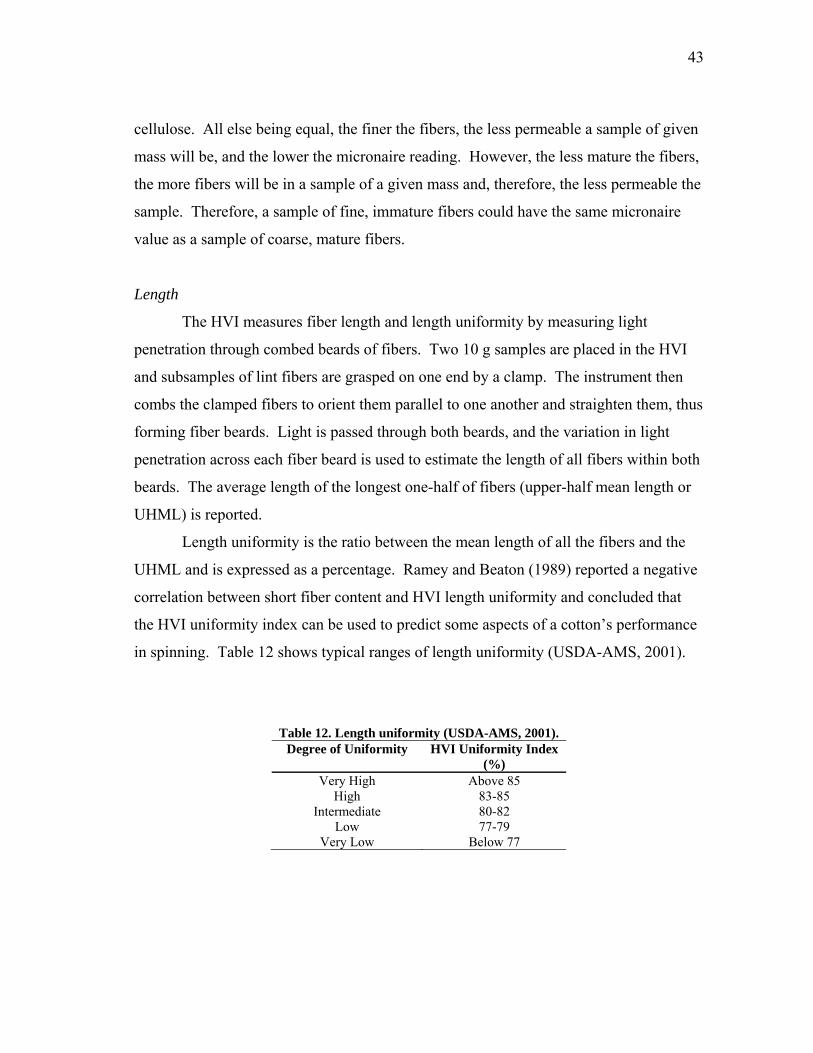
43
cellulose. All else being equal, the finer the fibers, the less permeable a sample of given
mass will be, and the lower the micronaire reading. However, the less mature the fibers,
the more fibers will be in a sample of a given mass and, therefore, the less permeable the
sample. Therefore, a sample of fine, immature fibers could have the same micronaire
value as a sample of coarse, mature fibers.
Length
The HVI measures fiber length and length uniformity by measuring light
penetration through combed beards of fibers. Two 10 g samples are placed in the HVI
and subsamples of lint fibers are grasped on one end by a clamp. The instrument then
combs the clamped fibers to orient them parallel to one another and straighten them, thus
forming fiber beards. Light is passed through both beards, and the variation in light
penetration across each fiber beard is used to estimate the length of all fibers within both
beards. The average length of the longest one-half of fibers (upper-half mean length or
UHML) is reported.
Length uniformity is the ratio between the mean length of all the fibers and the
UHML and is expressed as a percentage. Ramey and Beaton (1989) reported a negative
correlation between short fiber content and HVI length uniformity and concluded that
the HVI uniformity index can be used to predict some aspects of a cotton’s performance
in spinning. Table 12 shows typical ranges of length uniformity (USDA-AMS, 2001).
Table 12. Length uniformity (USDA-AMS, 2001).
Degree of Uniformity HVI Uniformity Index (%)
Very High Above 85 High 83-85
Intermediate 80-82 Low 77-79
Very Low Below 77
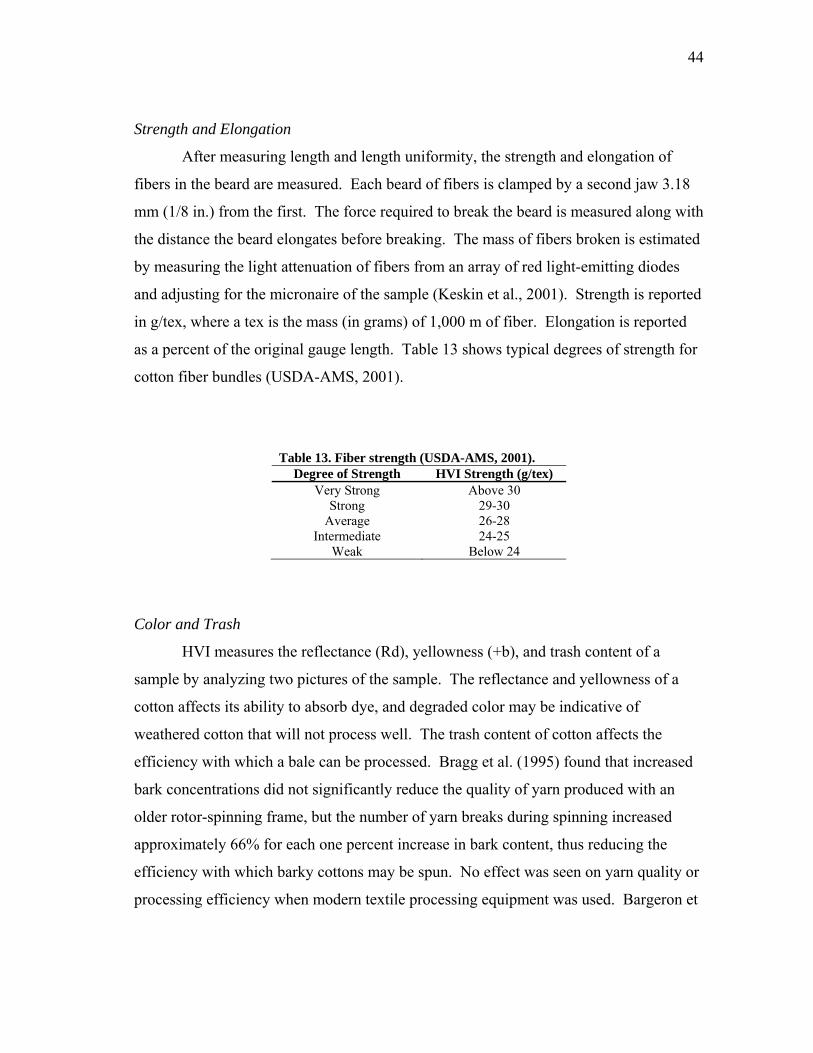
44
Strength and Elongation
After measuring length and length uniformity, the strength and elongation of
fibers in the beard are measured. Each beard of fibers is clamped by a second jaw 3.18
mm (1/8 in.) from the first. The force required to break the beard is measured along with
the distance the beard elongates before breaking. The mass of fibers broken is estimated
by measuring the light attenuation of fibers from an array of red light-emitting diodes
and adjusting for the micronaire of the sample (Keskin et al., 2001). Strength is reported
in g/tex, where a tex is the mass (in grams) of 1,000 m of fiber. Elongation is reported
as a percent of the original gauge length. Table 13 shows typical degrees of strength for
cotton fiber bundles (USDA-AMS, 2001).
Table 13. Fiber strength (USDA-AMS, 2001).
Degree of Strength HVI Strength (g/tex) Very Strong Above 30
Strong 29-30 Average 26-28
Intermediate 24-25 Weak Below 24
Color and Trash
HVI measures the reflectance (Rd), yellowness (+b), and trash content of a
sample by analyzing two pictures of the sample. The reflectance and yellowness of a
cotton affects its ability to absorb dye, and degraded color may be indicative of
weathered cotton that will not process well. The trash content of cotton affects the
efficiency with which a bale can be processed. Bragg et al. (1995) found that increased
bark concentrations did not significantly reduce the quality of yarn produced with an
older rotor-spinning frame, but the number of yarn breaks during spinning increased
approximately 66% for each one percent increase in bark content, thus reducing the
efficiency with which barky cottons may be spun. No effect was seen on yarn quality or
processing efficiency when modern textile processing equipment was used. Bargeron et
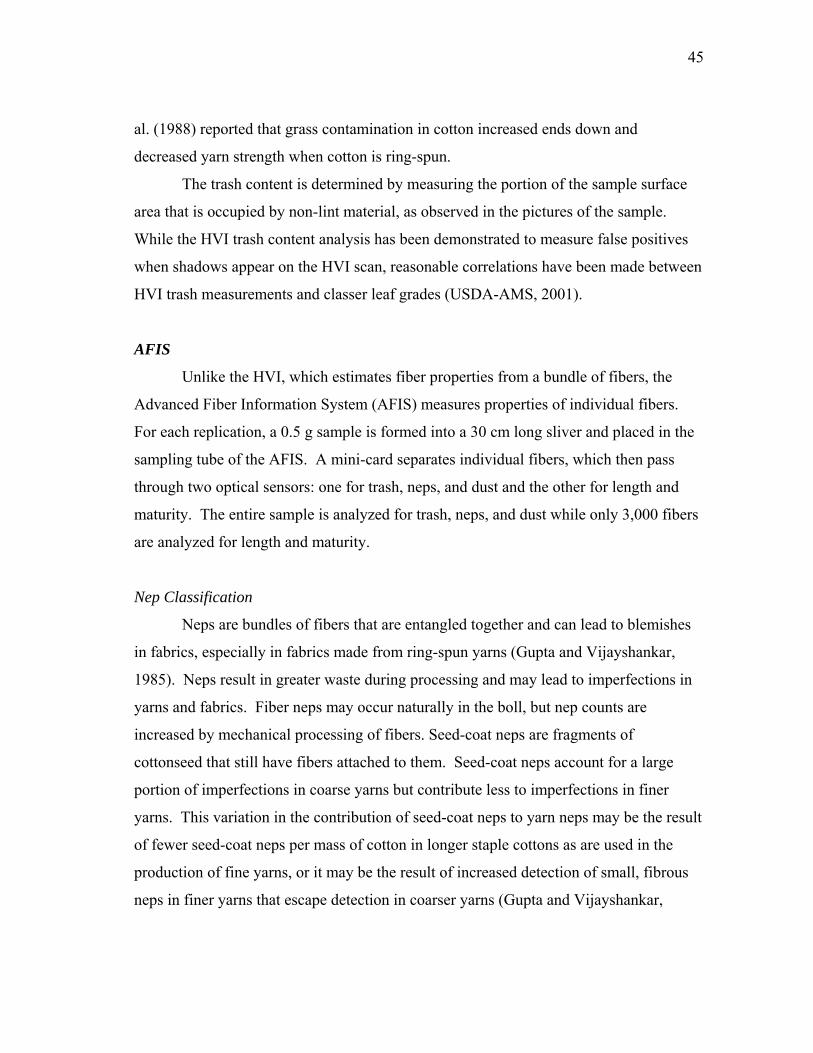
45
al. (1988) reported that grass contamination in cotton increased ends down and
decreased yarn strength when cotton is ring-spun.
The trash content is determined by measuring the portion of the sample surface
area that is occupied by non-lint material, as observed in the pictures of the sample.
While the HVI trash content analysis has been demonstrated to measure false positives
when shadows appear on the HVI scan, reasonable correlations have been made between
HVI trash measurements and classer leaf grades (USDA-AMS, 2001).
AFIS
Unlike the HVI, which estimates fiber properties from a bundle of fibers, the
Advanced Fiber Information System (AFIS) measures properties of individual fibers.
For each replication, a 0.5 g sample is formed into a 30 cm long sliver and placed in the
sampling tube of the AFIS. A mini-card separates individual fibers, which then pass
through two optical sensors: one for trash, neps, and dust and the other for length and
maturity. The entire sample is analyzed for trash, neps, and dust while only 3,000 fibers
are analyzed for length and maturity.
Nep Classification
Neps are bundles of fibers that are entangled together and can lead to blemishes
in fabrics, especially in fabrics made from ring-spun yarns (Gupta and Vijayshankar,
1985). Neps result in greater waste during processing and may lead to imperfections in
yarns and fabrics. Fiber neps may occur naturally in the boll, but nep counts are
increased by mechanical processing of fibers. Seed-coat neps are fragments of
cottonseed that still have fibers attached to them. Seed-coat neps account for a large
portion of imperfections in coarse yarns but contribute less to imperfections in finer
yarns. This variation in the contribution of seed-coat neps to yarn neps may be the result
of fewer seed-coat neps per mass of cotton in longer staple cottons as are used in the
production of fine yarns, or it may be the result of increased detection of small, fibrous
neps in finer yarns that escape detection in coarser yarns (Gupta and Vijayshankar,
46
1985). Table 14 contains general ranges for nep counts in raw upland cotton (Uster
Technologies, 2004).
Table 14. Nep counts (Uster Technologies, 2004).
Description Neps/g Very High Above 451
High 301-450 Medium 201-300
Low 101-200 Very Low Below 101
AFIS provides counts and sizes for fiber and seed-coat neps, using differences in
electrical wave forms from fibers, fiber clumps, and seed coats to differentiate among
the classes of neps.
Length
The length of each individual fiber measured by the AFIS is recorded so that a
fiber length distribution can be determined. Fiber length is estimated by measuring the
length of time it takes for a given fiber to pass through the optical sensors at a known
speed. This length is likely slightly underestimated due to unaccounted-for crimp in
individual fibers. AFIS reports a mean length of fibers by weight and number, the
coefficient of variation for length measurements, the upper quartile length (UQL or
average length of the longest 25% of fibers), and short fiber content (SFC) (i.e. fibers
shorter than 1.27 cm [0.5 in]). Table 15 contains general ranges for SFC in raw upland
cotton (Uster Technologies, 2004).
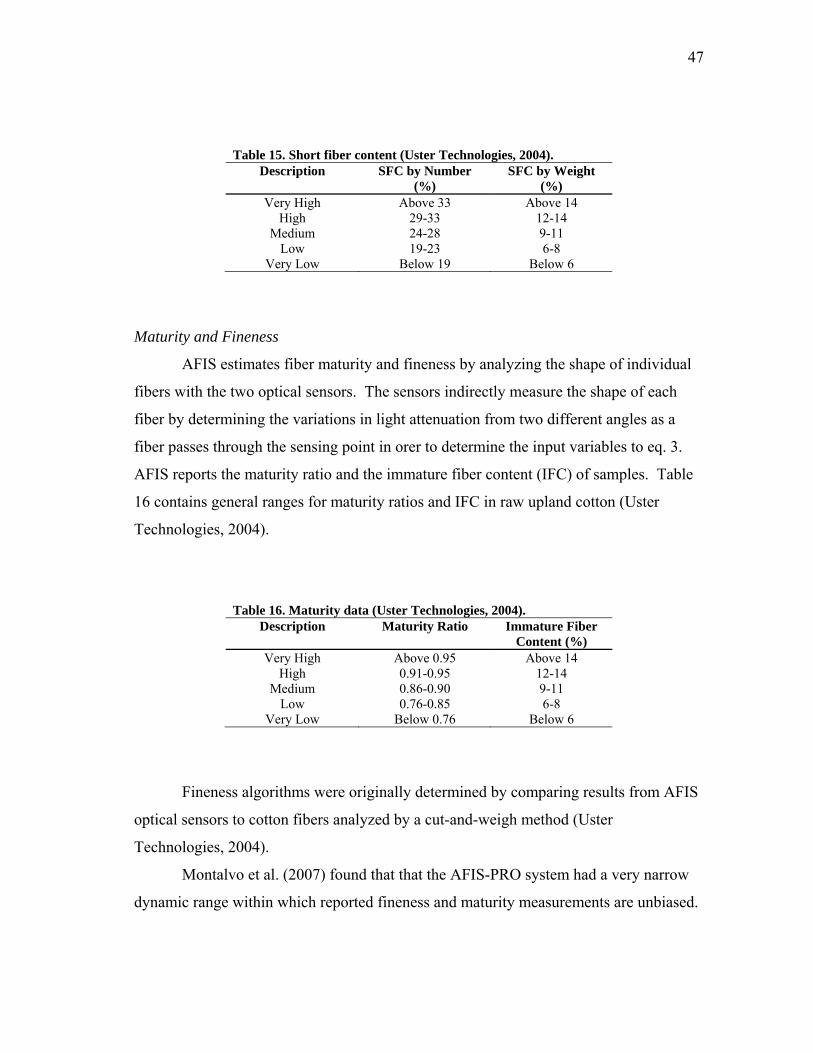
47
Table 15. Short fiber content (Uster Technologies, 2004).
Description SFC by Number (%)
SFC by Weight (%)
Very High Above 33 Above 14 High 29-33 12-14
Medium 24-28 9-11 Low 19-23 6-8
Very Low Below 19 Below 6
Maturity and Fineness
AFIS estimates fiber maturity and fineness by analyzing the shape of individual
fibers with the two optical sensors. The sensors indirectly measure the shape of each
fiber by determining the variations in light attenuation from two different angles as a
fiber passes through the sensing point in orer to determine the input variables to eq. 3.
AFIS reports the maturity ratio and the immature fiber content (IFC) of samples. Table
16 contains general ranges for maturity ratios and IFC in raw upland cotton (Uster
Technologies, 2004).
Table 16. Maturity data (Uster Technologies, 2004).
Description Maturity Ratio
Immature Fiber Content (%)
Very High Above 0.95 Above 14 High 0.91-0.95 12-14
Medium 0.86-0.90 9-11 Low 0.76-0.85 6-8
Very Low Below 0.76 Below 6
Fineness algorithms were originally determined by comparing results from AFIS
optical sensors to cotton fibers analyzed by a cut-and-weigh method (Uster
Technologies, 2004).
Montalvo et al. (2007) found that that the AFIS-PRO system had a very narrow
dynamic range within which reported fineness and maturity measurements are unbiased.
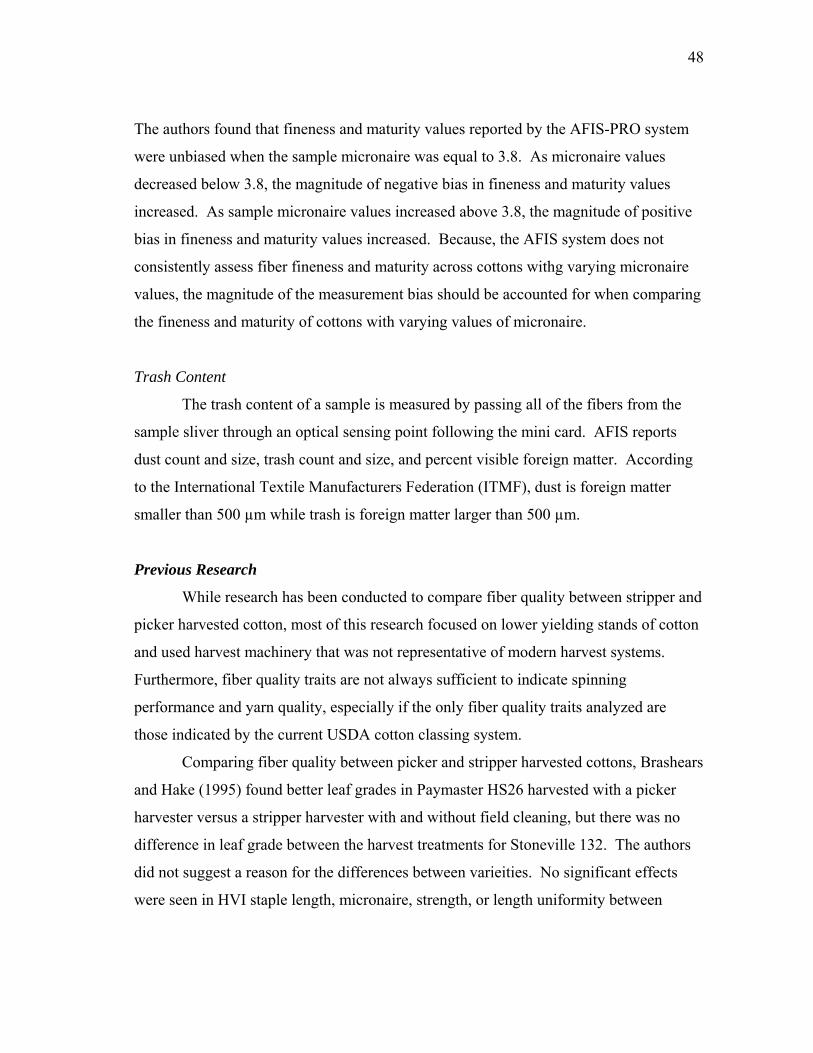
48
The authors found that fineness and maturity values reported by the AFIS-PRO system
were unbiased when the sample micronaire was equal to 3.8. As micronaire values
decreased below 3.8, the magnitude of negative bias in fineness and maturity values
increased. As sample micronaire values increased above 3.8, the magnitude of positive
bias in fineness and maturity values increased. Because, the AFIS system does not
consistently assess fiber fineness and maturity across cottons withg varying micronaire
values, the magnitude of the measurement bias should be accounted for when comparing
the fineness and maturity of cottons with varying values of micronaire.
Trash Content
The trash content of a sample is measured by passing all of the fibers from the
sample sliver through an optical sensing point following the mini card. AFIS reports
dust count and size, trash count and size, and percent visible foreign matter. According
to the International Textile Manufacturers Federation (ITMF), dust is foreign matter
smaller than 500 µm while trash is foreign matter larger than 500 µm.
Previous Research
While research has been conducted to compare fiber quality between stripper and
picker harvested cotton, most of this research focused on lower yielding stands of cotton
and used harvest machinery that was not representative of modern harvest systems.
Furthermore, fiber quality traits are not always sufficient to indicate spinning
performance and yarn quality, especially if the only fiber quality traits analyzed are
those indicated by the current USDA cotton classing system.
Comparing fiber quality between picker and stripper harvested cottons, Brashears
and Hake (1995) found better leaf grades in Paymaster HS26 harvested with a picker
harvester versus a stripper harvester with and without field cleaning, but there was no
difference in leaf grade between the harvest treatments for Stoneville 132. The authors
did not suggest a reason for the differences between varieities. No significant effects
were seen in HVI staple length, micronaire, strength, or length uniformity between
49
harvest methods. The two-row picker used by Brashears and Hake (1995) does not
reflect the advances in technology of modern harvest machinery, making application of
this study to modern production systems questionable.
Vories and Bonner (1995) compared fiber quality between stripped (with field
cleaning) and picked dryland cotton in Arkansas. None of the HVI parameters were
significantly different between harvest methods. In 1992, when weather conditions were
more harsh, fiber quality indices were better for picker harvested cotton than for stripper
harvested cotton, confirming the finding of Kerby et al. (1986) that grade differences
between harvest methods are most pronounced during years of adverse conditions.
Though not significantly different, micronaire values for stripped cotton were lower than
those of picked cotton for two of the three years of the study. Again, the brush stripper
used in the Vories and Bonner (1995) study (an Allis Chalmers 880 with alternating
brushes and flaps) does not represent modern harvesting machinery, making
extrapolation of these results to modern production systems tenuous.
Baker and Brashears (2000) evaluated the effect of field cleaners on fiber and
yarn quality of three stripper varieties of cotton. They found that field cleaners reduced
lint trash content at each stage of lint cleaning, thus resulting in somewhat better color
and leaf grades. Half of the samples analyzed indicated a one leaf grade improvement
from use of a field cleaner. Field-cleaned cotton also had higher micronaire and
maturity ratios and reduced nep counts in fiber and yarn.
Brashears and Baker (2000) compared the quality of two varieties of cotton
harvested with a finger stripper, a brush roll stripper (both with field cleaners), and a
spindle picker. Leaf grades were similar for Paymaster 2200 regardless of harvest
method, while the leaf grade for picker harvested Delta and Pine Land (D&PL) 1220
was significantly lower for the same variety harvested with both strippers. For both
varieties, the fiber length of picked cotton was longer and the micronaire was higher than
that of the same variety that was stripped. Fiber length of brush stripped cotton was also
significantly longer than finger stripped cotton. For both varieties, nep counts were
significantly lower for the picker harvested cotton than for the stripped cotton.
50
Willcutt et al. (2002) compared lint quality as affected by harvester type for
picker varieties grown on the Mississippi delta. They observed better values in nep
counts, short fiber content by weight, visible foreign matter and immature fiber content
for picked cotton than stripped cotton samples. Classer staple, HVI length, uniformity,
and strength were not affected significantly by harvest method.
Faircloth et al. (2004) evaluated turnout, fiber quality, and loan value from cotton
harvested with brush strippers versus spindle harvesters in northeast Louisiana. Yields
in this study ranged from 3.04 to 6.67 bales/ha (1.23 to 2.70 bales/ac assuming 220 kg
[480 lbs] bales). Few statistically significant differences in fiber quality from the two
harvesting treatments were observed, but trends of decreased micronaire and increased
color grade in stripper harvested cotton were seen. The varieties used in the study are
not representative of those used on the High Plains and make extrapolation to this region
troublesome.
McAlister and Rogers (2005) investigated the effect of harvesting method on
fiber and yarn quality from Ultra-Narrow-Row cotton grown in South Carolina. The
authors reported increased micronaire, strength, UHML, and length uniformity and
decreased yellowness in picked samples versus stripped samples. AFIS results showed
that picked samples has fewer short fibers and neps; less dust, trash, and visible foreign
matter; was more mature; and was less fine than stripped samples. However, the
samples analyzed in this study were not harvested until after Christmas due to extremely
wet weather during the harvest season. Due to varietal differences, the use of Ultra-
Narrow-Row cotton, and the extreme weathering of the cotton before harvest, the
applicability of the results of this study to the High Plains is questionable. However, the
protocols for fiber and yarn testing employed in the McAlister and Rogers study are
helpful in determining the effect of harvesting method throughout the processing chain.
The objective of this research was to examine the effects of harvest method on
fiber quality from irrigated cotton harvested on the High Plains of Texas with modern
harvest equipment. Fiber quality parameters were measured with HVI and AFIS. This
51
study represents the first commercial-scale harvester comparison project conducted in
the High Plains region.
METHODS
Irrigated cotton was harvested from commercial farms on the High Plains of
Texas in 2006 and 2007. In 2006, Stoneville 4554 B2RF was harvested from Site 1 in
late October/early November with a six-row John Deere 9996 spindle picker with Pro-16
row units equipped with scrapping plates on the front and rear drums, a six-row John
Deere 7460 stripper harvester with field cleaner, and the same stripper harvester
bypassing the field cleaner. A 140 kg sample of seed cotton was collected from each
plot (four per harvest treatment) and placed in bulk seed bags for ginning.
In 2007, FM 9058 F, FM 9063 B2RF, PHY 485 WRF, and ST 4554 B2RF were
harvested from Sites 3 and 4 with a six-row John Deere 9996 spindle picker with Pro-16
row units equipped with scrapping plates on the front drums and a six-row John Deere
7460 stripper harvester with field cleaner. A 140 kg sample of seed cotton was collected
from each plot (three per harvest treatment per variety per location) and placed in bulk
seed bags for ginning. At all sites, defoliation and harvest aid treatments were identical
for both picked and stripped cotton based on the producer's observations of harvest
readiness.
Samples were ginned at the USDA-ARS Cotton Production and Processing
Research Unit in Lubbock, Texas, on a commercial-scale gin. In both 2006 and 2007,
two stages of seed cotton cleaning were used. Each stage included a tower dryer, stick
machine, and a six-cylinder incline cleaner. The gin stand was a Continental Double
Eagle saw-type gin stand. Due to late season rains in 2006, the leaf trash was difficult to
separate so two stages of lint cleaning were used on all samples. Samples were collected
for HVI and AFIS measurements after one and two stages of lint cleaning to determine if
interactions were present between harvest method and lint cleaning. In 2007, only one
stage of lint cleaning was used.
52
Lint samples were conditioned at 65% RH ± 2% and 21oC ± 1 (according to
ASTM D1776-04 Standard Practice for Conditioning of Textiles) for fiber quality
analysis and tested with an HVI (Model 900A; USTER®; Uster, Switzerland) with four
micronaire readings, four color readings, and ten length and strength readings per
sample, and the AFIS with five replications of 3,000 fibers tested per sample at the
International Textile Center in Lubbock, Texas.
All treatment means from fiber quality tests were compared with the General
Linear Model function in SPSS (SPSS 14.0; SPSS, Inc.; Chicago, IL). A MANOVA test
was conducted to determine overall differences between harvest treatments before
conducting pair-wise comparisons. The null hypothesis tested in all cases was that
means in each harvest treatment were equal. Means were compared with the Least
Significant Difference (LSD) pair-wise multiple comparison test. Two sample
Kolmogorov-Smirnov tests were used to compare fiber length distributions between
harvest treatments. A 0.05 level of significance was used in all tests except where noted
differently.
RESULTS AND DISCUSSION
Because samples collected in 2007 were substantially more mature than samples
collected in 2006, the results from each year are presented separately.
2006
The results from HVI and selected parameters from AFIS testing from samples
collected in 2006 are shown in tables 17 and 18, respectively. Caution should be used
when interpreting results because fiber maturity for all samples was low, which may
exacerbate differences in fiber quality parameters as a function of harvest treatment
because the thin secondary wall of the fibers may lead to lower fiber strength and
elongation. Results of MANOVA analyses (n = 4 for each treatment) indicated that
overall treatment differences were not detected for HVI results at 95% confidence level,
so the results of pair-wise comparisons of HVI data should be analyzed cautiously.
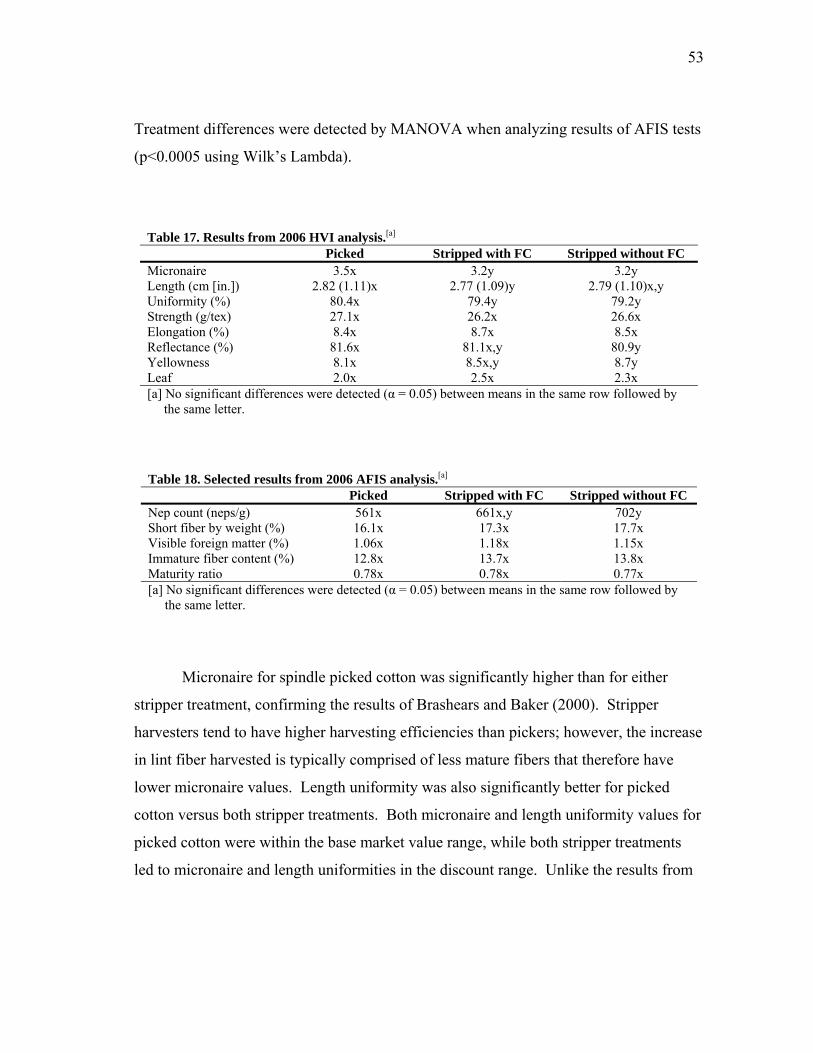
53
Treatment differences were detected by MANOVA when analyzing results of AFIS tests
(p<0.0005 using Wilk’s Lambda).
Table 17. Results from 2006 HVI analysis.[a]
Picked Stripped with FC Stripped without FC Micronaire 3.5x 3.2y 3.2y Length (cm [in.]) 2.82 (1.11)x 2.77 (1.09)y 2.79 (1.10)x,y Uniformity (%) 80.4x 79.4y 79.2y Strength (g/tex) 27.1x 26.2x 26.6x Elongation (%) 8.4x 8.7x 8.5x Reflectance (%) 81.6x 81.1x,y 80.9y Yellowness 8.1x 8.5x,y 8.7y Leaf 2.0x 2.5x 2.3x [a] No significant differences were detected (α = 0.05) between means in the same row followed by the same letter.
Table 18. Selected results from 2006 AFIS analysis.[a] Picked Stripped with FC Stripped without FC Nep count (neps/g) 561x 661x,y 702y Short fiber by weight (%) 16.1x 17.3x 17.7x Visible foreign matter (%) 1.06x 1.18x 1.15x Immature fiber content (%) 12.8x 13.7x 13.8x Maturity ratio 0.78x 0.78x 0.77x [a] No significant differences were detected (α = 0.05) between means in the same row followed by the same letter.
Micronaire for spindle picked cotton was significantly higher than for either
stripper treatment, confirming the results of Brashears and Baker (2000). Stripper
harvesters tend to have higher harvesting efficiencies than pickers; however, the increase
in lint fiber harvested is typically comprised of less mature fibers that therefore have
lower micronaire values. Length uniformity was also significantly better for picked
cotton versus both stripper treatments. Both micronaire and length uniformity values for
picked cotton were within the base market value range, while both stripper treatments
led to micronaire and length uniformities in the discount range. Unlike the results from
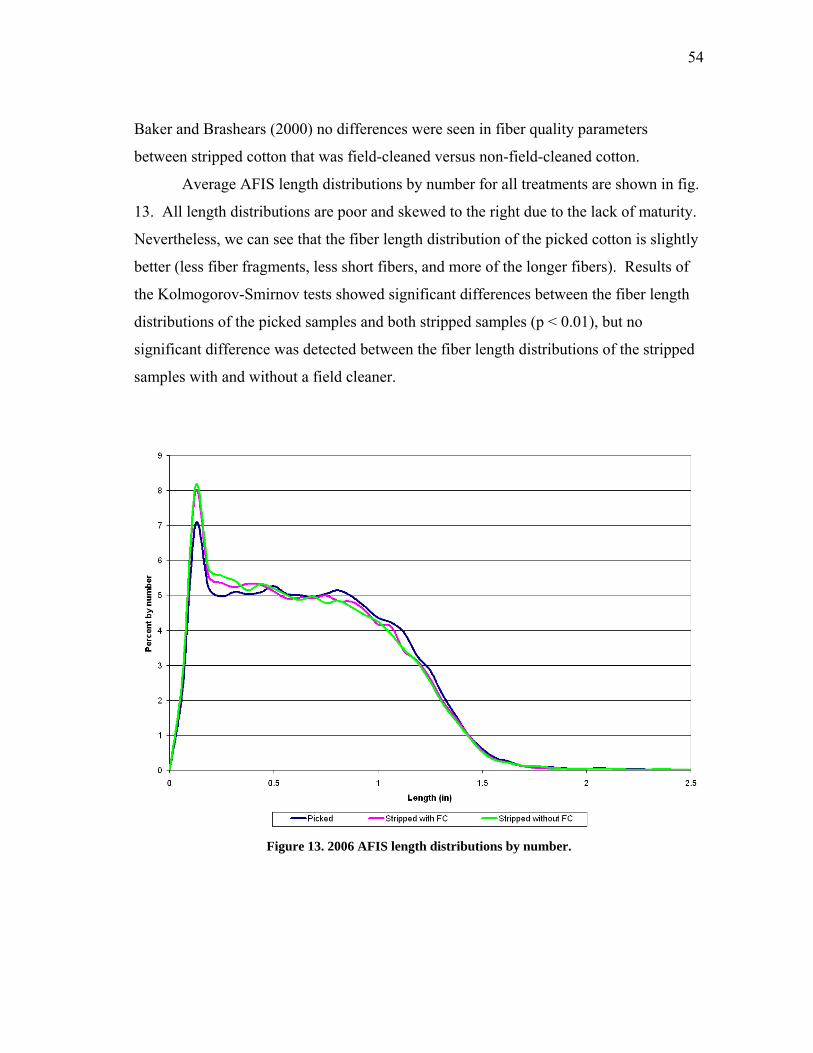
54
Baker and Brashears (2000) no differences were seen in fiber quality parameters
between stripped cotton that was field-cleaned versus non-field-cleaned cotton.
Average AFIS length distributions by number for all treatments are shown in fig.
13. All length distributions are poor and skewed to the right due to the lack of maturity.
Nevertheless, we can see that the fiber length distribution of the picked cotton is slightly
better (less fiber fragments, less short fibers, and more of the longer fibers). Results of
the Kolmogorov-Smirnov tests showed significant differences between the fiber length
distributions of the picked samples and both stripped samples (p < 0.01), but no
significant difference was detected between the fiber length distributions of the stripped
samples with and without a field cleaner.
Figure 13. 2006 AFIS length distributions by number.
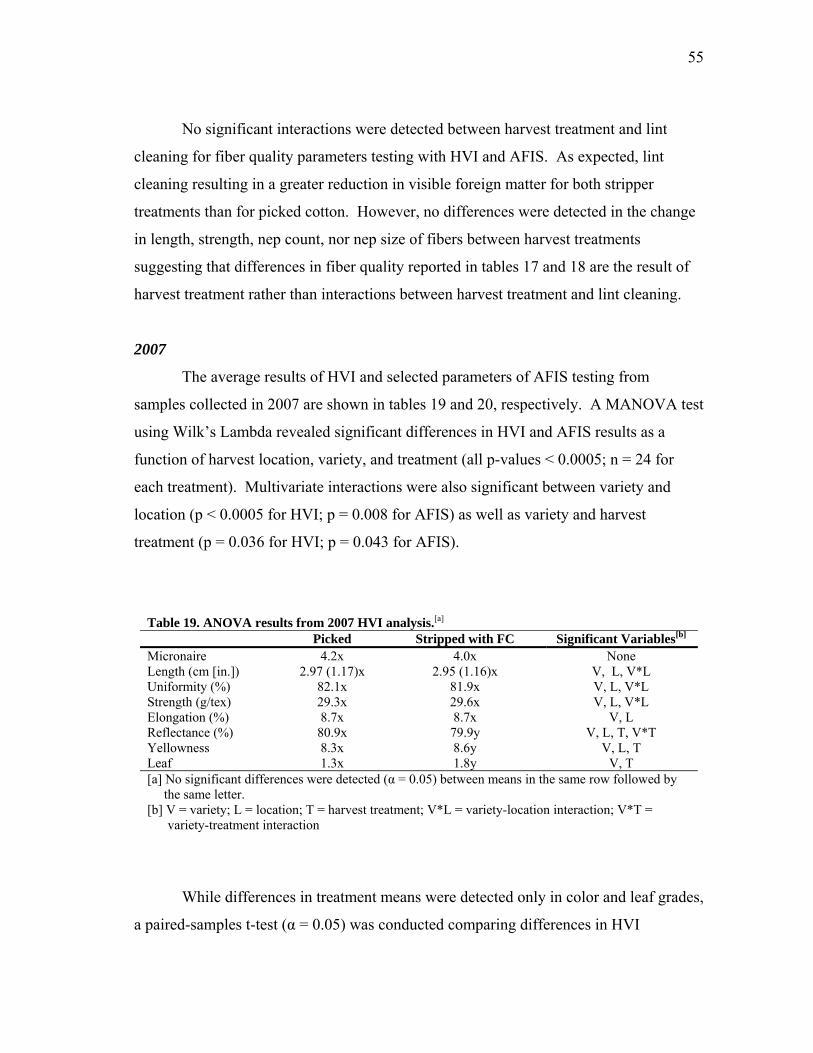
55
No significant interactions were detected between harvest treatment and lint
cleaning for fiber quality parameters testing with HVI and AFIS. As expected, lint
cleaning resulting in a greater reduction in visible foreign matter for both stripper
treatments than for picked cotton. However, no differences were detected in the change
in length, strength, nep count, nor nep size of fibers between harvest treatments
suggesting that differences in fiber quality reported in tables 17 and 18 are the result of
harvest treatment rather than interactions between harvest treatment and lint cleaning.
2007
The average results of HVI and selected parameters of AFIS testing from
samples collected in 2007 are shown in tables 19 and 20, respectively. A MANOVA test
using Wilk’s Lambda revealed significant differences in HVI and AFIS results as a
function of harvest location, variety, and treatment (all p-values < 0.0005; n = 24 for
each treatment). Multivariate interactions were also significant between variety and
location (p < 0.0005 for HVI; p = 0.008 for AFIS) as well as variety and harvest
treatment (p = 0.036 for HVI; p = 0.043 for AFIS).
Table 19. ANOVA results from 2007 HVI analysis.[a]
Picked Stripped with FC Significant Variables[b] Micronaire 4.2x 4.0x None Length (cm [in.]) 2.97 (1.17)x 2.95 (1.16)x V, L, V*L Uniformity (%) 82.1x 81.9x V, L, V*L Strength (g/tex) 29.3x 29.6x V, L, V*L Elongation (%) 8.7x 8.7x V, L Reflectance (%) 80.9x 79.9y V, L, T, V*T Yellowness 8.3x 8.6y V, L, T Leaf 1.3x 1.8y V, T [a] No significant differences were detected (α = 0.05) between means in the same row followed by the same letter. [b] V = variety; L = location; T = harvest treatment; V*L = variety-location interaction; V*T =
variety-treatment interaction
While differences in treatment means were detected only in color and leaf grades,
a paired-samples t-test (α = 0.05) was conducted comparing differences in HVI
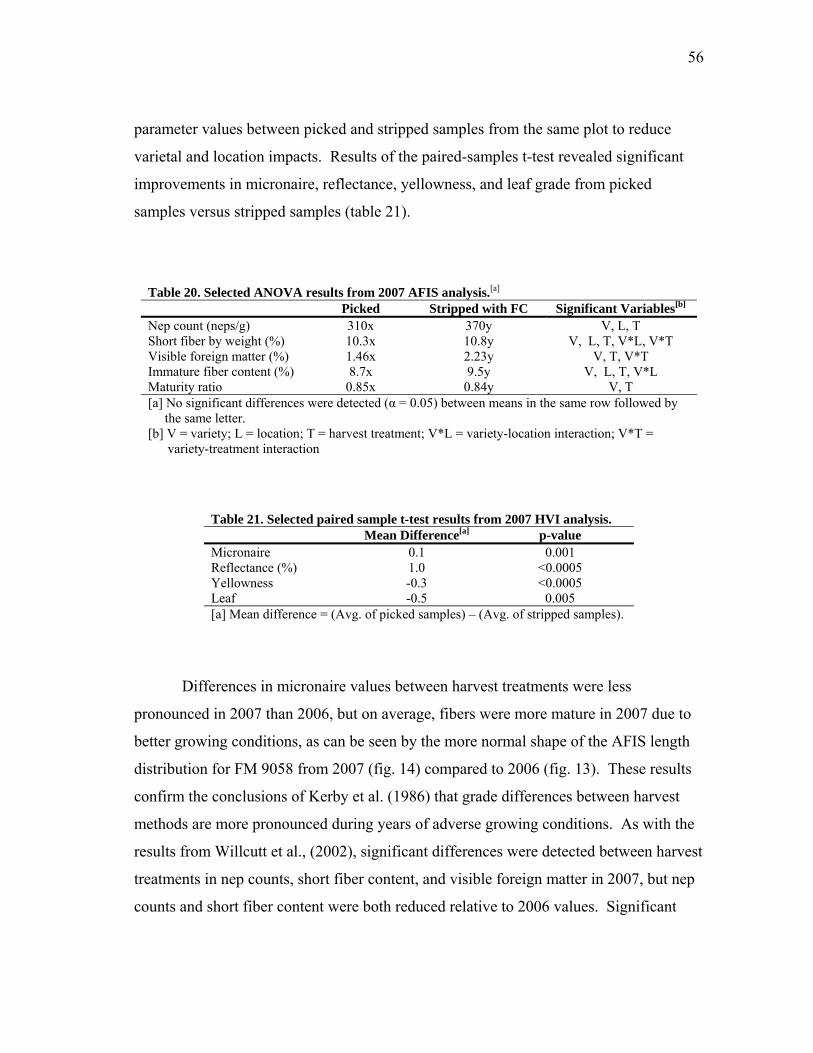
56
parameter values between picked and stripped samples from the same plot to reduce
varietal and location impacts. Results of the paired-samples t-test revealed significant
improvements in micronaire, reflectance, yellowness, and leaf grade from picked
samples versus stripped samples (table 21).
Table 20. Selected ANOVA results from 2007 AFIS analysis.[a] Picked Stripped with FC Significant Variables[b] Nep count (neps/g) 310x 370y V, L, T Short fiber by weight (%) 10.3x 10.8y V, L, T, V*L, V*T Visible foreign matter (%) 1.46x 2.23y V, T, V*T Immature fiber content (%) 8.7x 9.5y V, L, T, V*L Maturity ratio 0.85x 0.84y V, T [a] No significant differences were detected (α = 0.05) between means in the same row followed by the same letter. [b] V = variety; L = location; T = harvest treatment; V*L = variety-location interaction; V*T =
variety-treatment interaction
Table 21. Selected paired sample t-test results from 2007 HVI analysis. Mean Difference[a] p-value Micronaire 0.1 0.001 Reflectance (%) 1.0 <0.0005 Yellowness -0.3 <0.0005 Leaf -0.5 0.005 [a] Mean difference = (Avg. of picked samples) – (Avg. of stripped samples).
Differences in micronaire values between harvest treatments were less
pronounced in 2007 than 2006, but on average, fibers were more mature in 2007 due to
better growing conditions, as can be seen by the more normal shape of the AFIS length
distribution for FM 9058 from 2007 (fig. 14) compared to 2006 (fig. 13). These results
confirm the conclusions of Kerby et al. (1986) that grade differences between harvest
methods are more pronounced during years of adverse growing conditions. As with the
results from Willcutt et al., (2002), significant differences were detected between harvest
treatments in nep counts, short fiber content, and visible foreign matter in 2007, but nep
counts and short fiber content were both reduced relative to 2006 values. Significant
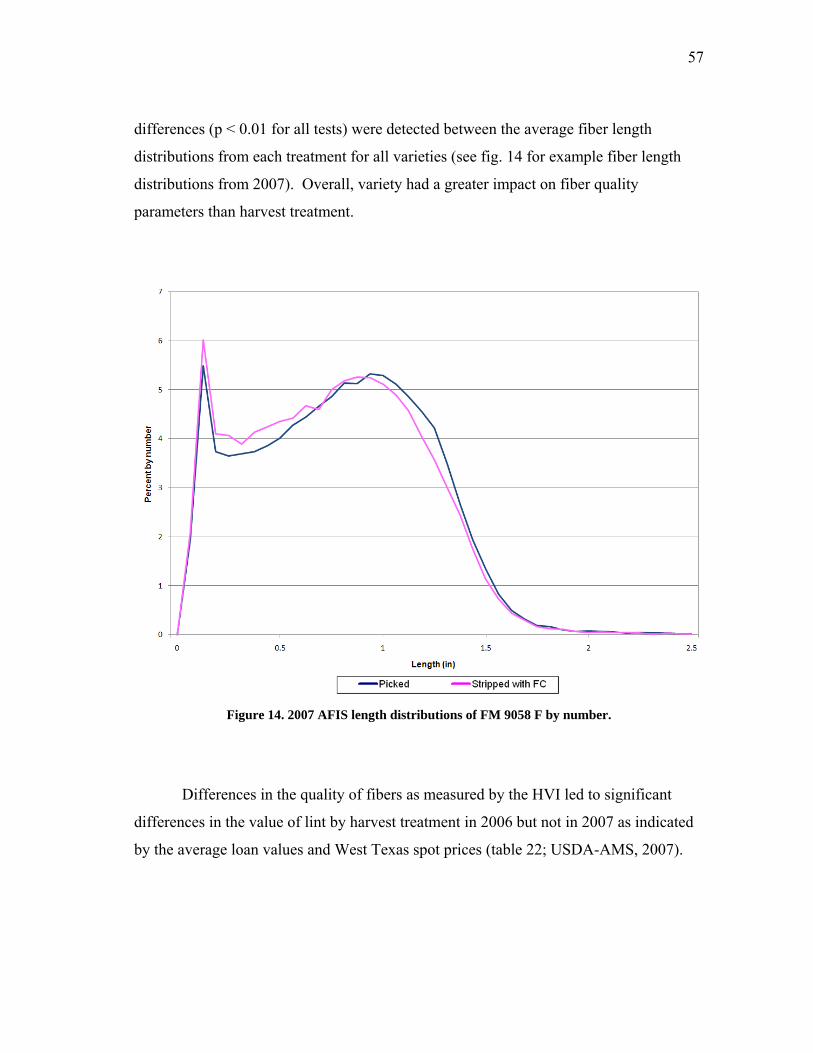
57
differences (p < 0.01 for all tests) were detected between the average fiber length
distributions from each treatment for all varieties (see fig. 14 for example fiber length
distributions from 2007). Overall, variety had a greater impact on fiber quality
parameters than harvest treatment.
Figure 14. 2007 AFIS length distributions of FM 9058 F by number.
Differences in the quality of fibers as measured by the HVI led to significant
differences in the value of lint by harvest treatment in 2006 but not in 2007 as indicated
by the average loan values and West Texas spot prices (table 22; USDA-AMS, 2007).
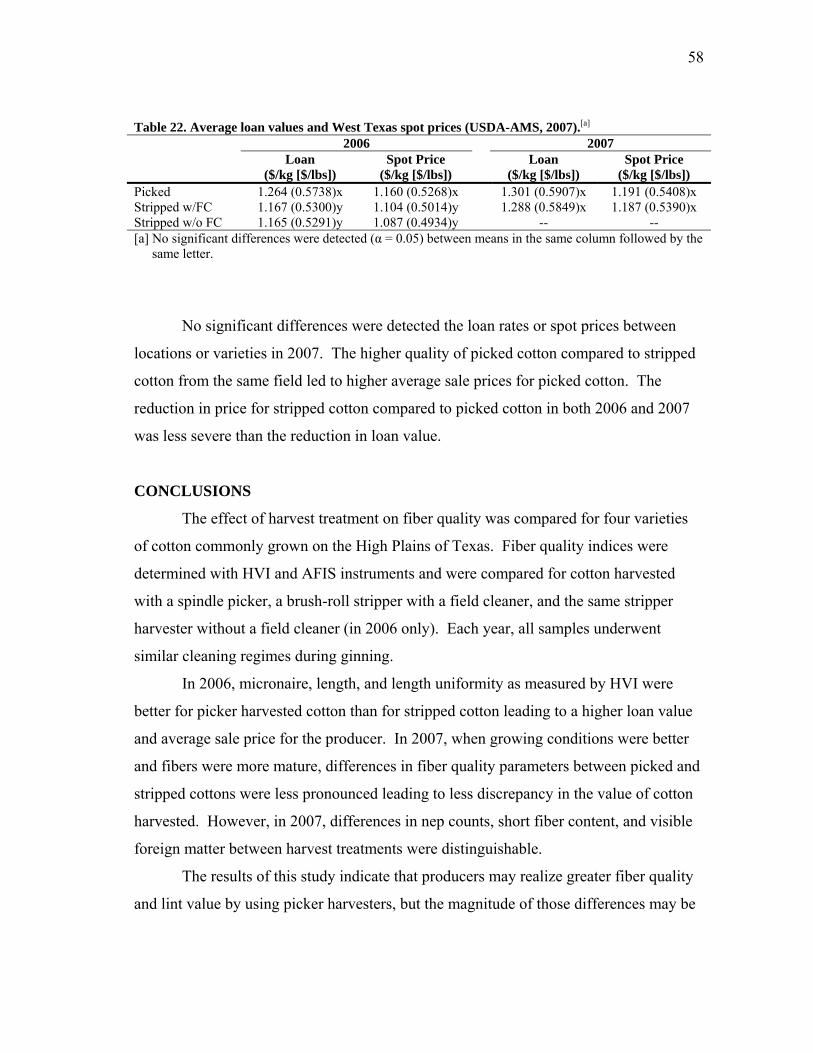
58
Table 22. Average loan values and West Texas spot prices (USDA-AMS, 2007).[a] 2006 2007 Loan
($/kg [$/lbs]) Spot Price
($/kg [$/lbs]) Loan
($/kg [$/lbs]) Spot Price
($/kg [$/lbs]) Picked 1.264 (0.5738)x 1.160 (0.5268)x 1.301 (0.5907)x 1.191 (0.5408)x Stripped w/FC 1.167 (0.5300)y 1.104 (0.5014)y 1.288 (0.5849)x 1.187 (0.5390)x Stripped w/o FC 1.165 (0.5291)y 1.087 (0.4934)y -- -- [a] No significant differences were detected (α = 0.05) between means in the same column followed by the
same letter.
No significant differences were detected the loan rates or spot prices between
locations or varieties in 2007. The higher quality of picked cotton compared to stripped
cotton from the same field led to higher average sale prices for picked cotton. The
reduction in price for stripped cotton compared to picked cotton in both 2006 and 2007
was less severe than the reduction in loan value.
CONCLUSIONS
The effect of harvest treatment on fiber quality was compared for four varieties
of cotton commonly grown on the High Plains of Texas. Fiber quality indices were
determined with HVI and AFIS instruments and were compared for cotton harvested
with a spindle picker, a brush-roll stripper with a field cleaner, and the same stripper
harvester without a field cleaner (in 2006 only). Each year, all samples underwent
similar cleaning regimes during ginning.
In 2006, micronaire, length, and length uniformity as measured by HVI were
better for picker harvested cotton than for stripped cotton leading to a higher loan value
and average sale price for the producer. In 2007, when growing conditions were better
and fibers were more mature, differences in fiber quality parameters between picked and
stripped cottons were less pronounced leading to less discrepancy in the value of cotton
harvested. However, in 2007, differences in nep counts, short fiber content, and visible
foreign matter between harvest treatments were distinguishable.
The results of this study indicate that producers may realize greater fiber quality
and lint value by using picker harvesters, but the magnitude of those differences may be

59
a function of growing conditions and/or fiber maturity. Varietal differences also played
a large role in determining fiber properties, but in 2007, no differences were seen in the
value of harvested lint as a result of these differences.
60
CHAPTER VI
YARN QUALITY
INTRODUCTION
The cotton producer’s final customer is the textile mill to which he sells his
cotton. Textile mills vary in the type and quality of cotton they purchase based on the
product they are producing. Higher quality textiles require longer, finer yarns with
sufficient strength to endure spinning and weaving or knitting processes. Mills
producing products such as denim or socks use lower quality cotton because it is less
expensive yet still meets the requirements to produce goods that will satisfy their
customers. Cottons of varying quality can also be blended together or with synthetic
fibers to produce yarns of varying quality with characteristics desirable for specific
applications.
The first stage of processing at a textile mill includes opening, cleaning, and
blending. Bales are placed in a laydown room where layers are skimmed off and
transported pneumatically to an opener. Opening involves gently separating masses of
fibers to prepare them to feed into the carding machine. Partial cleaning may also occur
in this step. Cotton or cotton blends are then placed into a feed control system that
further reduces tuft size and regulates the flow of material to the carding machine.
The card cleans and parallelizes fibers for subsequent formation into yarn.
Cleaning is conducted by either rotating licker-inns with pins or wire that remove
foreign matter or by flats with increasingly densely packed wire located around the card
cylinder to thin the fiber web and remove trash. The resulting web is then fed through a
trumpet and condensed into a sliver of parallel fibers that are placed into cans.
Slivers formed by the card are then blended and drafted during breaker drawing.
Multiple slivers are combined during this process to reduce variability in the final sliver.
Fibers in the sliver are further parallelized, and the sliver density is made more uniform.
Morton and Summers (1949 and 1950) demonstrated that the number of fiber hooks
resulting from fiber crimp is reduced by drafting, up to three stages, at which point the
61
majority of fibers have no hooks. Garde et al. (1961) demonstrated that “trailing hooks”
are reduced during drafting more efficiently than “leading hooks.” Because the sliver is
drafted in the direction that it is, breaker drawing removes “trailing hooks” on the fibers
coming from the card web. The sliver resulting from breaker drawing is again placed in
a can. For open-end spinning, drawing may be omitted and the slivers can be spun with
no further pre-processing.
After breaker drawing, slivers that will not be combed proceed directly to
finisher drawing. Slivers that will be combed are formed into a lap by blending multiple
slivers and spreading them into a thin lap that is then combed to remove short fibers and
residual foreign material. Between 10 and 15 percent of the material is removed as noils
during the combing process (Werber and Backe, 1994). The slivers formed after
combing then undergo finish drawing, which again blends, parallelizes, and evens the
slivers, this time removing “leading hooks” resulting from fiber crimp.
The final step before ring spinning is roving. Roving involves further drafting
the sliver to avoid exceeding the weight limits of the spinning frame during the spinning
process. During roving, a slight twist is placed into the material before it is wound onto
a bobbin to prevent breaking the roving as it is drawn into the spinning frame.
Most yarn is formed by either ring or open-end spinning methods. In ring
spinning, roving is again drafted and then drawn through a traveler rotating around a
bobbin which adds more twist to the resulting yarn. In open-end spinning, a sliver is fed
into a rotating opener, where trash is removed and the sliver is drafted. In the rotor,
which can spin at speeds exceeding 100,000 rpm, centrifugal force separates the fibers,
which then align in the groove of the rotor. The resulting yarn is pulled out of the rotor
chamber and wound onto a bobbin.
The performance of fibers during processing and spinning is dependent on
several fiber properties. Fiber maturity and strength affect the fiber’s ability to
withstand the forces placed upon fibers during drafting and spinning. Fiber length and
fineness affect the forces between fibers that dictate the “count,” or fineness, of the final
yarn. Foreign matter and neps lead to unevenness in yarns and may result in ends down,
62
or breaks, during spinning that greatly reduce production efficiency or may lead to
imperfections in fabrics.
The spinning limit (i.e. the maximum yarn count achievable) of a cotton is
dependent on fiber properties and spinning method. Yarn count (Ne) is a measure of
fineness indicating the number of 840 yd skeins that can be made from one pound of
yarn (ASTM Standards, 2007). Longer, stronger fibers are better able to withstand the
large forces placed on them during spinning and are therefore able to be spun into finer
yarns. Müller (1991) reported that length distribution of fibers also significantly affects
the spinning limit of a cotton. Typically, the minimum number of fibers in the cross-
section of a commercial yarn is approximately 60 for carded, ring-spun yarns and 100 or
more for carded, rotor-spun yarns (Steadman et al., 1989). Therefore, finer fibers are
able to be spun into finer yarns as well.
While fiber length, strength, and fineness are most frequently correlated to yarn
properties (Krifa et al., 2001), the trash content of cotton can also affect the maximum
yarn count achievable without losing efficiency due to excessive ends down. Due to the
high angular speeds encountered by fibers during spinning, trash particles can cause
fiber breaks by exerting centrifugal force on the forming yarn, particularly during rotor
spinning (Steadman et al., 1989). Finer yarns are particularly susceptible to end breaks
due to the presence of trash in the roving.
Yarn Quality Indices
Count Strength Product
Count strength product (CSP), also known as skein-break factor, is a measure of
yarn strength, and is calculated by multiplying the yarn count by the force required to
break a yarn skein. El Mogahzy (1988) reported that skein break factor increased with
increasing fiber length, length uniformity, and fiber strength but decreased with
increasing reflectance (Rd) and fiber fineness. El Mogahzy et al. (1990) found similar
results for a different set of cottons but did not find significant correlations between
reflectance and CSP. Subramanian (2004) proposed a phenomenological model to
63
predict CSP rather than one derived from multiple linear regression analysis. While the
Subramanian (2004) model accounts for the mode of transfer of fiber tenacity to yarn
tenacity, its usefulness as a predictive equation for yarn tenacity is limited.
Elongation
Like fiber elongation, yarn elongation (%) measures the distance a yarn will
stretch before breaking. Üreyan and Kadoğlu (2006) found that yarn elongation of ring-
spun yarns increased with increasing fiber length and strength but decreased with
increasing micronaire.
Tenacity
Yarn tenacity is a measure of the pressure required to break a yarn and is directly
related to yarn strength. Yarn tenacity increases with increasing fiber strength (Graham
and Taylor, 1978; Üreyan and Kadoğlu, 2006). Ramey et al. (1977) found that fiber
tenacity measured at 3.2 mm gage length explained more than 70% of the variation in
observed yarn tenacity. Longer, more uniform fibers also produce more tenacious yarns
(Ramey et al., 1977; Müller, 1991; Üreyan and Kadoğlu, 2006). Graham and Taylor
(1978) reported that yarn end-breaking strength is related to the slipping resistance of
fibers, which will increase with length due to greater fiber-to-fiber bonds. Steadman et
al. (1989) found that, at fine counts, rotor-spun yarn had fewer end breaks when
combing, which primarily removes short fibers, was done.
Testing 42 cottons, Ramey et al. (1977) found no correlation between micronaire
and yarn tenacity. Üreyan and Kadoğlu (2006) found that yarn tenacity was negatively
correlated to micronaire. However, Üreyan and Kadoğlu (2006) correlated yarn
properties with HVI fiber properties of fibers removed from the sliver after the finishing
draw frame. Because an accurate measure of micronaire requires the fibers in the
compressed sample to be randomly oriented, the relationship between yarn tenacity and
the micronaire of a sample of parallelized fibers may not hold for samples taken directly
from a bale of cotton.
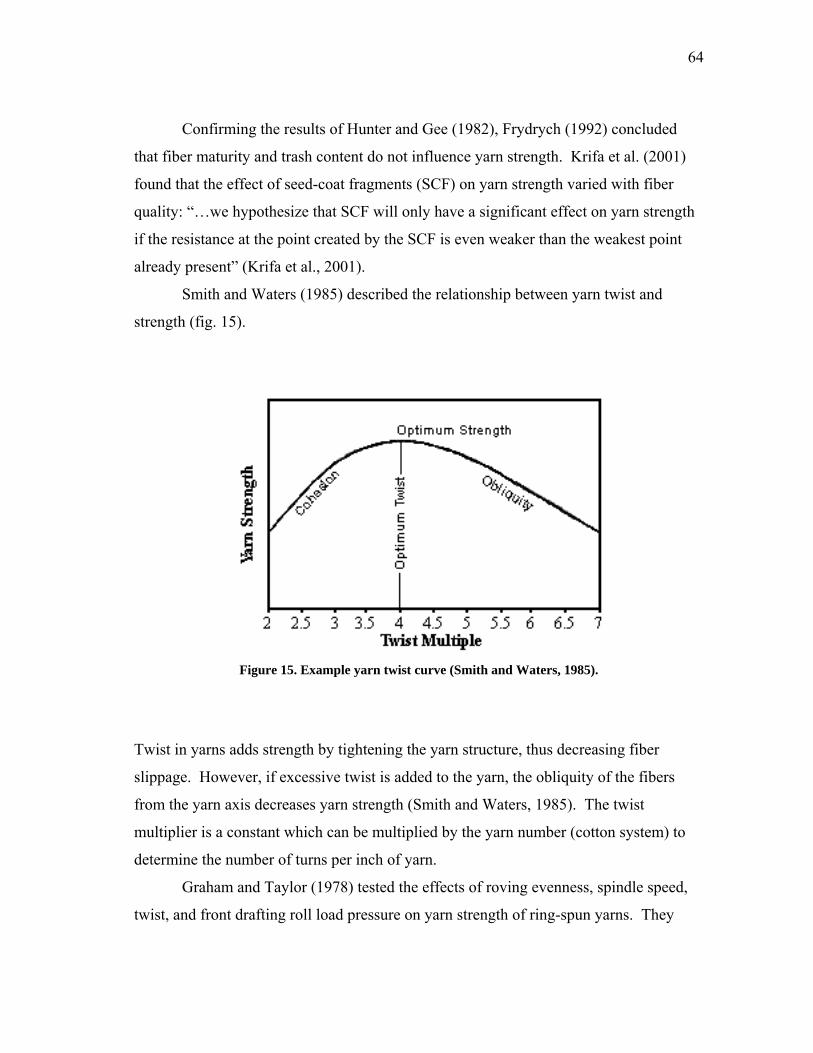
64
Confirming the results of Hunter and Gee (1982), Frydrych (1992) concluded
that fiber maturity and trash content do not influence yarn strength. Krifa et al. (2001)
found that the effect of seed-coat fragments (SCF) on yarn strength varied with fiber
quality: “…we hypothesize that SCF will only have a significant effect on yarn strength
if the resistance at the point created by the SCF is even weaker than the weakest point
already present” (Krifa et al., 2001).
Smith and Waters (1985) described the relationship between yarn twist and
strength (fig. 15).
Figure 15. Example yarn twist curve (Smith and Waters, 1985).
Twist in yarns adds strength by tightening the yarn structure, thus decreasing fiber
slippage. However, if excessive twist is added to the yarn, the obliquity of the fibers
from the yarn axis decreases yarn strength (Smith and Waters, 1985). The twist
multiplier is a constant which can be multiplied by the yarn number (cotton system) to
determine the number of turns per inch of yarn.
Graham and Taylor (1978) tested the effects of roving evenness, spindle speed,
twist, and front drafting roll load pressure on yarn strength of ring-spun yarns. They
65
found that, of these parameters, yarn strength was most substantially affected by front-
drafting roll pressure. The authors speculated that this was because the front-drafting
roll pressure influences fiber cohesion in the yarn.
Evenness
Several parameters are used to indicate yarn evenness. Yarn coefficient of
variation (CV) is a measure of the variability in the thickness of 100 m of yarn (eq. 5).
100*µσ
=CV (5)
where: CV = coefficient of variation (%),
σ = standard deviation of yarn thickness about the mean, and
µ = mean yarn thickness.
Evenness can also be indicated by the number of thick and thin places (points in the yarn
that are over 50% thicker than or less than 50% of the average thickness, respectively)
per km of yarn.
For yarns coarser than 22 tex, rotor-spun yarns are generally more even
(Steadman et al., 1989). Furthermore, Delhom et al. (2007) stated that fiber quality has a
greater effect on the yarn quality (and especially the uniformity) of ring-spun yarns
compared to rotor-spun yarns.
Üreyan and Kadoğlu (2006) found that yarn unevenness was positively
correlated to fiber elongation but negatively correlated to fiber strength, reflectance and
yellowness (which may indicate fiber maturity), length uniformity, and micronaire.
Müller (1991) reported that yarn evenness was correlated to fiber length and length
distribution. Steadman et al. (1989) found that fine count rotor-spun yarns had
decreasing evenness with increasing twist.
Neps are perhaps the greatest cause of unevenness in yarns. Jones and Baldwin
(1996) reported that most of the +200% imperfections in 20, 27, and 37 tex yarns they
tested were due to seed-coat neps with correlations increasing for finer yarns. Frydrych
and Matusiak (2002) developed theoretical estimations of the critical nep size in fibers,
66
that is, the largest nep size permissible in AFIS fiber testing that will not show up in a
yarn (as +200% imperfection) for open-end spinning (eq. 6) and ring spinning (eq. 7):
063.0107.0 TDcrit = (6)
663.0138.0 TDcrit = (7)
where: Dcrit is the critical nep size (mm), and
T is the linear density of yarn (tex)
Experimental data supported the authors’ theoretical conclusions.
Hairiness
Yarn hairiness is a measure of the number of fiber ends and loops protruding
from the body of a yarn (Zhu and Ethridge, 1997). Hairy yarns tend to cling together in
subsequent stages of processing making them difficult to manipulate. Dyed fabrics
made from hairy yarns have an undesirable hazy appearance.
In general, ring-spun yarns are hairier than rotor-spun yarns of the same count,
and coarse yarns are hairier than fine yarns (Barella and Manich, 1988). Barella and
Manich (1988) found that ring-spun yarns of the same count were 2.5 times more hairy
than rotor-spun yarns of the same count. They also found that fiber length, length
uniformity, and micronaire explained only 33% of the hairiness of 15 tex ring-spun
yarns and 18% of 30 tex ring-spun yarns. For rotor-spun yarns, fiber parameters
explained 38-40% of hairiness for both 30 and 50 tex yarns.
Zhu and Ethridge (1997) reported that fiber length is the dominant fiber trait
affecting yarn hairiness, confirming the results of Barella and Manich (1988). The
authors found that increasing fiber length, strength, and elongation reduced hairiness for
both ring and rotor-spun yarns. Correspondingly, yarns made from cottons with higher
short fiber content (SFC) were hairier. The observed effect of these fiber properties on
hairiness was greater for ring-spun yarns than for rotor-spun yarns. Viswanathan et al.
67
(1989) reported similar results for length and strength effects but reported that increased
SFC led to less hairy yarns. However, the author noted that this observation was
contradictory to other findings and may be the result of biased measurement techniques.
Üreyan and Kadoğlu (2006) and Müller (1991) reported negative correlations between
fiber length and yarn hairiness. Viswanathan et al. (1989) also found that fiber fineness
had the greatest effect on yarn hairiness, followed by fiber length, whereas Zhu and
Ethridge (1997) found no correlation between fiber fineness and yarn hairiness.
The results from Zhu and Ethridge (1997) contradicted the results of
Viswanathan et al. (1989) with regards to the effect of fiber maturity on yarn hairiness as
well. Zhu and Ethridge (1997) reported that increasing fiber maturity increased hairiness
for both ring and rotor-spun yarns, while Viswanathan et al. (1989) and Pillay (1964)
reported no significant correlation between fiber maturity and yarn hairiness. However,
Viswanathan et al. (1989), Zhu and Ethridge (1997), and Üreyan and Kadoğlu (2006)
found significant correlations between micronaire and yarn hairiness. Zhu and Ethridge
(1997) reported that yarn hairiness was positively correlated to micronaire and fiber
diameter for rotor-spun yarn but negatively correlated for ring-spun yarn. Üreyan and
Kadoğlu (2006) found that hairiness of ring-spun yarns was positively correlated
micronaire.
Noils
Noils are the waste from the combing process, which primarily removes short
fibers from laps of cotton before finisher drawing and roving. Elevated noils represent
waste in the processing stream, making the inputs to the finished yarn more expensive.
Previous Research
Baker and Brashears (2000) evaluated the effect of field cleaners on open-end
spun yarn quality from three varieties of cotton. The field-cleaned cotton produced
open-end spun yarn with a slightly higher evenness coefficient of variation (CV) and
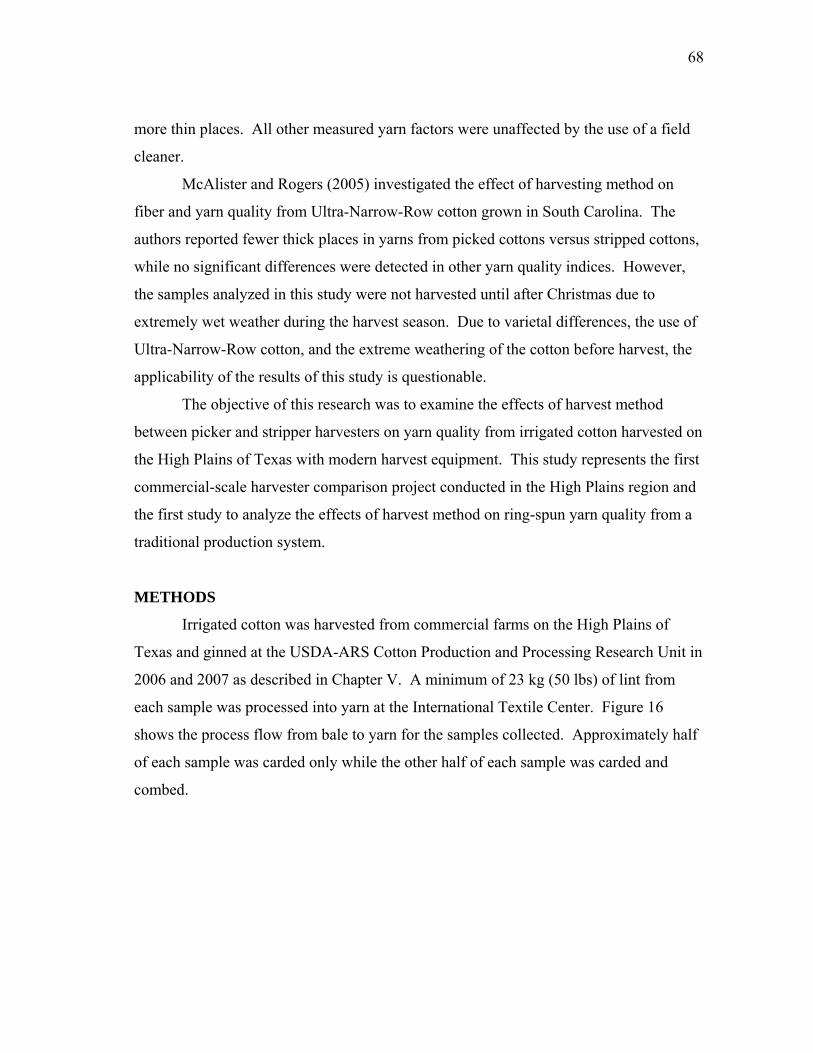
68
more thin places. All other measured yarn factors were unaffected by the use of a field
cleaner.
McAlister and Rogers (2005) investigated the effect of harvesting method on
fiber and yarn quality from Ultra-Narrow-Row cotton grown in South Carolina. The
authors reported fewer thick places in yarns from picked cottons versus stripped cottons,
while no significant differences were detected in other yarn quality indices. However,
the samples analyzed in this study were not harvested until after Christmas due to
extremely wet weather during the harvest season. Due to varietal differences, the use of
Ultra-Narrow-Row cotton, and the extreme weathering of the cotton before harvest, the
applicability of the results of this study is questionable.
The objective of this research was to examine the effects of harvest method
between picker and stripper harvesters on yarn quality from irrigated cotton harvested on
the High Plains of Texas with modern harvest equipment. This study represents the first
commercial-scale harvester comparison project conducted in the High Plains region and
the first study to analyze the effects of harvest method on ring-spun yarn quality from a
traditional production system.
METHODS
Irrigated cotton was harvested from commercial farms on the High Plains of
Texas and ginned at the USDA-ARS Cotton Production and Processing Research Unit in
2006 and 2007 as described in Chapter V. A minimum of 23 kg (50 lbs) of lint from
each sample was processed into yarn at the International Textile Center. Figure 16
shows the process flow from bale to yarn for the samples collected. Approximately half
of each sample was carded only while the other half of each sample was carded and
combed.
69
Figure 16. Spinning process flow chart for ring spinning.
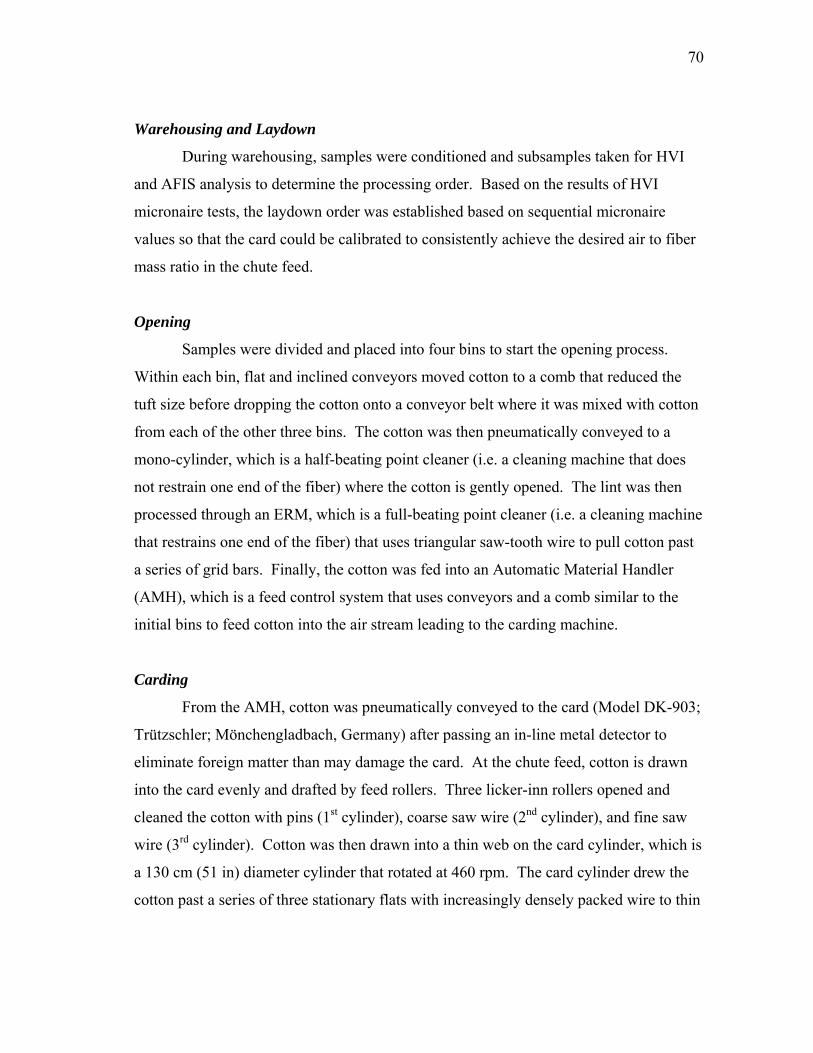
70
Warehousing and Laydown
During warehousing, samples were conditioned and subsamples taken for HVI
and AFIS analysis to determine the processing order. Based on the results of HVI
micronaire tests, the laydown order was established based on sequential micronaire
values so that the card could be calibrated to consistently achieve the desired air to fiber
mass ratio in the chute feed.
Opening
Samples were divided and placed into four bins to start the opening process.
Within each bin, flat and inclined conveyors moved cotton to a comb that reduced the
tuft size before dropping the cotton onto a conveyor belt where it was mixed with cotton
from each of the other three bins. The cotton was then pneumatically conveyed to a
mono-cylinder, which is a half-beating point cleaner (i.e. a cleaning machine that does
not restrain one end of the fiber) where the cotton is gently opened. The lint was then
processed through an ERM, which is a full-beating point cleaner (i.e. a cleaning machine
that restrains one end of the fiber) that uses triangular saw-tooth wire to pull cotton past
a series of grid bars. Finally, the cotton was fed into an Automatic Material Handler
(AMH), which is a feed control system that uses conveyors and a comb similar to the
initial bins to feed cotton into the air stream leading to the carding machine.
Carding
From the AMH, cotton was pneumatically conveyed to the card (Model DK-903;
Trützschler; Mönchengladbach, Germany) after passing an in-line metal detector to
eliminate foreign matter than may damage the card. At the chute feed, cotton is drawn
into the card evenly and drafted by feed rollers. Three licker-inn rollers opened and
cleaned the cotton with pins (1st cylinder), coarse saw wire (2nd cylinder), and fine saw
wire (3rd cylinder). Cotton was then drawn into a thin web on the card cylinder, which is
a 130 cm (51 in) diameter cylinder that rotated at 460 rpm. The card cylinder drew the
cotton past a series of three stationary flats with increasingly densely packed wire to thin
71
and parallelize the web and then past rotating flats that further conditioned the web.
Once the web was removed from the carding cylinder, it passed through two rollers that
crush any remaining foreign matter and then through a trumpet, where the web was
formed into a sliver, which is placed in a can. For this project, the sliver had a linear
density of 4600 tex (65 gr/yd).
Breaker Drawing
Breaker drawing was conducted on an HSR 1000 draw frame (Trützschler;
Mönchengladbach, Germany), bypassing the auto-leveler. Drawing was achieved by
seven rollers (fig. 17). The bottom rollers were powered, and the top rollers rotated due
to the friction of the sliver. During breaker drawing, “trailing hooks” are removed from
the fibers.
Figure 17. Draw frame rollers.
Each set of successive rollers (from left to right) rotate faster than the previous
set, thus drafting the sliver. The distance between each set of rollers is set based on the
fiber length. Therefore, before drawing, the cans from the web were organized
sequentially by length. Each sliver from the card was divided into six slivers which
72
were placed in the creel, from which they were fed into the draw frame. The six slivers
were blended into one (on the left side of fig. 17) and drafted to form one sliver (exiting
the right side of fig. 17). The draft is the ratio of the sliver linear density entering to the
linear density exiting. For this project, the draft was 6.76, resulting in final linear
density of 3900 tex (55 gr/yd). The sliver exiting the draw frame was split between two
cans: 2740 m (3000 yards) of sliver were placed in a can for combing while the rest of
the sliver was placed in a second can to form carded yarn. One can was taken directly to
the finisher draw frame (“Carded Process” from fig. 16) and the other was formed into
laps for combing.
Lap Forming and Combing
The sliver for carded-and-combed yarn tests was divided into 28 slivers that were
blended and rolled into eleven laps. The first two laps and the final lap were discarded
to avoid “piece ups.” Each of the eight remaining laps was then combed and all laps
were combined into a sliver with a final linear density of 3900 tex (55 gr/yd).
Finish Drawing
Both carded and carded-and-combed samples were divided into six can for finish
drawing, which was again conducted on a HSR 1000 draw frame (Trützschler;
Mönchengladbach, Germany). The finish draw frame operates in a similar manner to the
breaker draw frame, but the fibers go through the rollers in the opposite direction as the
breaker draw frame, thus removing “leading hooks” from the fibers. The final linear
density of the sliver after finish drawing was 4250 tex (60 gr/yd).
Roving and Spinning
The final slivers for both combed samples and carded-and-combed samples were
divided into ten cans which were placed on the roving frame, where they were
combined, drawn, and placed on bobbins. A slight twist (0.51-0.63 turn/cm [1.29-1.59
turns/in]) was added to the sliver, which had a final linear density of 490 tex (hank
73
roving of 1.2), to prevent breaking of the roving during spinning. The bobbins of roving
were then spun on a Seussen Fiomax ring spinning frame. Bobbins were spun into 14.5
tex (40Ne) yarn with a twist multiple of 4.2 (weaving twist) using a traveler speed of 32
m/s. Ten bobbins of yarn were made from each sample.
Yarn Testing
Yarn count and skein break tests were conducted with a Scott Tester (ten bobbins
tested per sample); yarn force to break, elongation, tenacity, and work to break were
tested with a Uster Tensorapid 3 (ten bobbins tested per sample and ten breaks per
bobbin); and yarn evenness was tested with an Uster Tester 3 (ten bobbins tested per
sample and 400 m per bobbin).
All treatment means were compared with the General Linear Model function in
SPSS (SPSS 14.0; SPSS, Inc.; Chicago, IL). A MANOVA test was conducted to
determine overall differences between harvest treatments before conducting pair-wise
comparisons. The null hypothesis tested in all cases was that means in each harvest
treatment were equal. Means were compared with the Least Significant Difference
(LSD) pair-wise multiple comparison test. A 0.05 level of significance was used in all
tests.
In order to determine whether the fiber properties that are improved by picker
harvesting versus stripper harvesting are significant contributors to yarn quality
parameters, the relative contributions of fiber properties to yarn properties were analyzed
using a stepwise linear regression (SPSS 14.0; SPSS, Inc.; Chicago, IL). The stepwise
linear regression in SPSS is a forward regression in which, after a new variable is added
to the regression model, the new p-value of all variables already in the model are
checked to determine if they should remain in the model based on the user-specified
significance level for inclusion. For the regression analysis, data from 2006 and 2007
were combined, yielding 28 data points for each regression. Carded yarns were analyzed
separately from carded-and-combed yarns. No significant autocorrelation was detected
for any of the regression analyses presented.
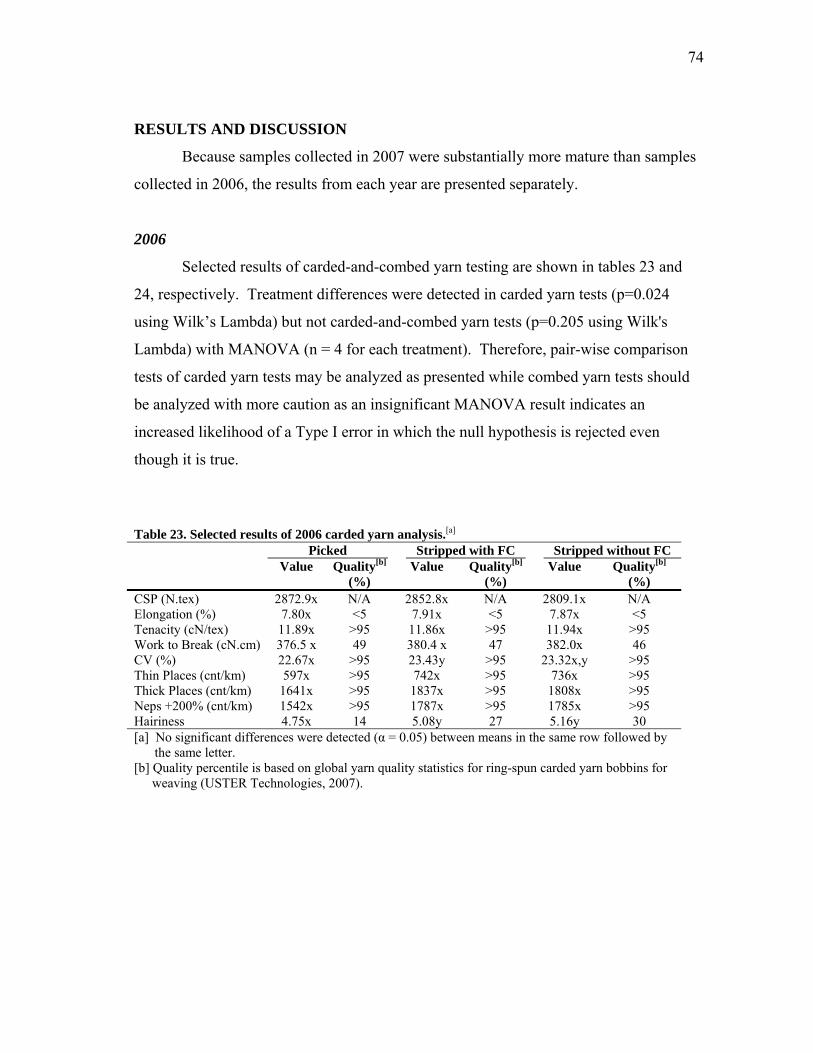
74
RESULTS AND DISCUSSION
Because samples collected in 2007 were substantially more mature than samples
collected in 2006, the results from each year are presented separately.
2006
Selected results of carded-and-combed yarn testing are shown in tables 23 and
24, respectively. Treatment differences were detected in carded yarn tests (p=0.024
using Wilk’s Lambda) but not carded-and-combed yarn tests (p=0.205 using Wilk's
Lambda) with MANOVA (n = 4 for each treatment). Therefore, pair-wise comparison
tests of carded yarn tests may be analyzed as presented while combed yarn tests should
be analyzed with more caution as an insignificant MANOVA result indicates an
increased likelihood of a Type I error in which the null hypothesis is rejected even
though it is true.
Table 23. Selected results of 2006 carded yarn analysis.[a] Picked Stripped with FC Stripped without FC
Value Quality[b] (%)
Value Quality[b] (%)
Value Quality[b] (%)
CSP (N.tex) 2872.9x N/A 2852.8x N/A 2809.1x N/A Elongation (%) 7.80x <5 7.91x <5 7.87x <5 Tenacity (cN/tex) 11.89x >95 11.86x >95 11.94x >95 Work to Break (cN.cm) 376.5 x 49 380.4 x 47 382.0x 46 CV (%) 22.67x >95 23.43y >95 23.32x,y >95 Thin Places (cnt/km) 597x >95 742x >95 736x >95 Thick Places (cnt/km) 1641x >95 1837x >95 1808x >95 Neps +200% (cnt/km) 1542x >95 1787x >95 1785x >95 Hairiness 4.75x 14 5.08y 27 5.16y 30 [a] No significant differences were detected (α = 0.05) between means in the same row followed by
the same letter. [b] Quality percentile is based on global yarn quality statistics for ring-spun carded yarn bobbins for
weaving (USTER Technologies, 2007).
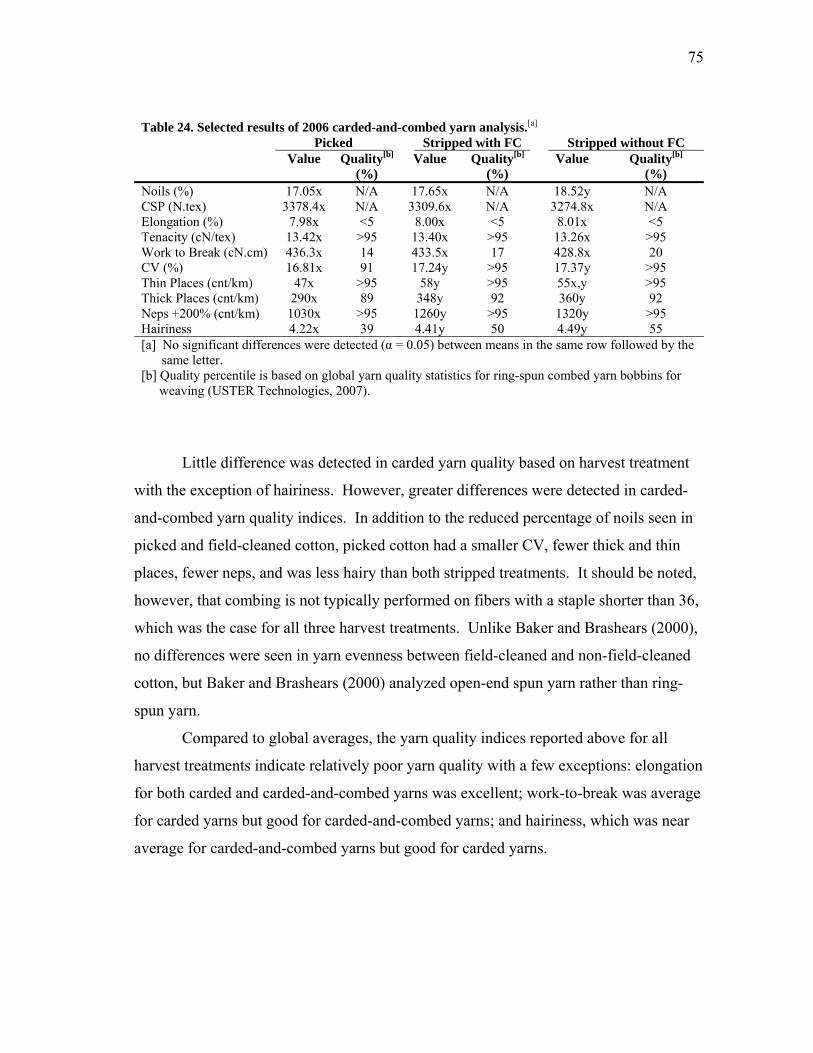
75
Table 24. Selected results of 2006 carded-and-combed yarn analysis.[a] Picked Stripped with FC Stripped without FC
Value Quality[b] (%)
Value Quality[b] (%)
Value Quality[b] (%)
Noils (%) 17.05x N/A 17.65x N/A 18.52y N/A CSP (N.tex) 3378.4x N/A 3309.6x N/A 3274.8x N/A Elongation (%) 7.98x <5 8.00x <5 8.01x <5 Tenacity (cN/tex) 13.42x >95 13.40x >95 13.26x >95 Work to Break (cN.cm) 436.3x 14 433.5x 17 428.8x 20 CV (%) 16.81x 91 17.24y >95 17.37y >95 Thin Places (cnt/km) 47x >95 58y >95 55x,y >95 Thick Places (cnt/km) 290x 89 348y 92 360y 92 Neps +200% (cnt/km) 1030x >95 1260y >95 1320y >95 Hairiness 4.22x 39 4.41y 50 4.49y 55 [a] No significant differences were detected (α = 0.05) between means in the same row followed by the
same letter. [b] Quality percentile is based on global yarn quality statistics for ring-spun combed yarn bobbins for
weaving (USTER Technologies, 2007).
Little difference was detected in carded yarn quality based on harvest treatment
with the exception of hairiness. However, greater differences were detected in carded-
and-combed yarn quality indices. In addition to the reduced percentage of noils seen in
picked and field-cleaned cotton, picked cotton had a smaller CV, fewer thick and thin
places, fewer neps, and was less hairy than both stripped treatments. It should be noted,
however, that combing is not typically performed on fibers with a staple shorter than 36,
which was the case for all three harvest treatments. Unlike Baker and Brashears (2000),
no differences were seen in yarn evenness between field-cleaned and non-field-cleaned
cotton, but Baker and Brashears (2000) analyzed open-end spun yarn rather than ring-
spun yarn.
Compared to global averages, the yarn quality indices reported above for all
harvest treatments indicate relatively poor yarn quality with a few exceptions: elongation
for both carded and carded-and-combed yarns was excellent; work-to-break was average
for carded yarns but good for carded-and-combed yarns; and hairiness, which was near
average for carded-and-combed yarns but good for carded yarns.
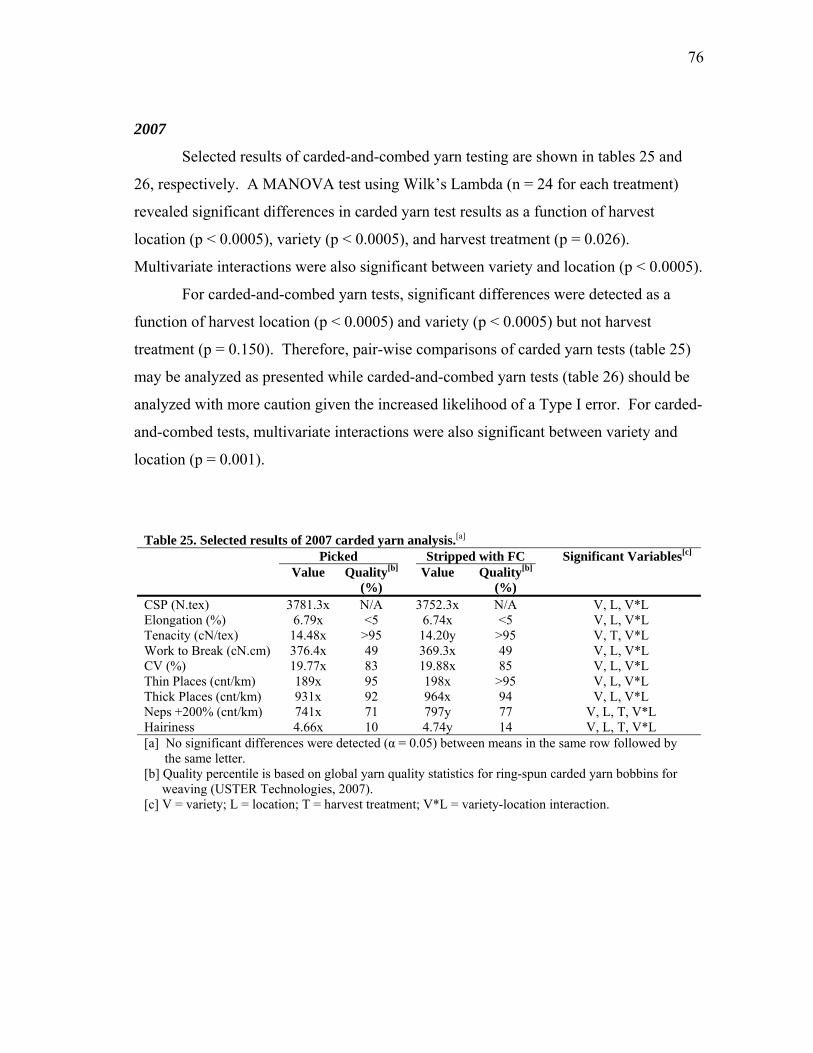
76
2007
Selected results of carded-and-combed yarn testing are shown in tables 25 and
26, respectively. A MANOVA test using Wilk’s Lambda (n = 24 for each treatment)
revealed significant differences in carded yarn test results as a function of harvest
location (p < 0.0005), variety (p < 0.0005), and harvest treatment (p = 0.026).
Multivariate interactions were also significant between variety and location (p < 0.0005).
For carded-and-combed yarn tests, significant differences were detected as a
function of harvest location (p < 0.0005) and variety (p < 0.0005) but not harvest
treatment (p = 0.150). Therefore, pair-wise comparisons of carded yarn tests (table 25)
may be analyzed as presented while carded-and-combed yarn tests (table 26) should be
analyzed with more caution given the increased likelihood of a Type I error. For carded-
and-combed tests, multivariate interactions were also significant between variety and
location (p = 0.001).
Table 25. Selected results of 2007 carded yarn analysis.[a]
Picked Stripped with FC Significant Variables[c] Value Quality[b]
(%) Value Quality[b]
(%)
CSP (N.tex) 3781.3x N/A 3752.3x N/A V, L, V*L Elongation (%) 6.79x <5 6.74x <5 V, L, V*L Tenacity (cN/tex) 14.48x >95 14.20y >95 V, T, V*L Work to Break (cN.cm) 376.4x 49 369.3x 49 V, L, V*L CV (%) 19.77x 83 19.88x 85 V, L, V*L Thin Places (cnt/km) 189x 95 198x >95 V, L, V*L Thick Places (cnt/km) 931x 92 964x 94 V, L, V*L Neps +200% (cnt/km) 741x 71 797y 77 V, L, T, V*L Hairiness 4.66x 10 4.74y 14 V, L, T, V*L [a] No significant differences were detected (α = 0.05) between means in the same row followed by
the same letter. [b] Quality percentile is based on global yarn quality statistics for ring-spun carded yarn bobbins for
weaving (USTER Technologies, 2007). [c] V = variety; L = location; T = harvest treatment; V*L = variety-location interaction.
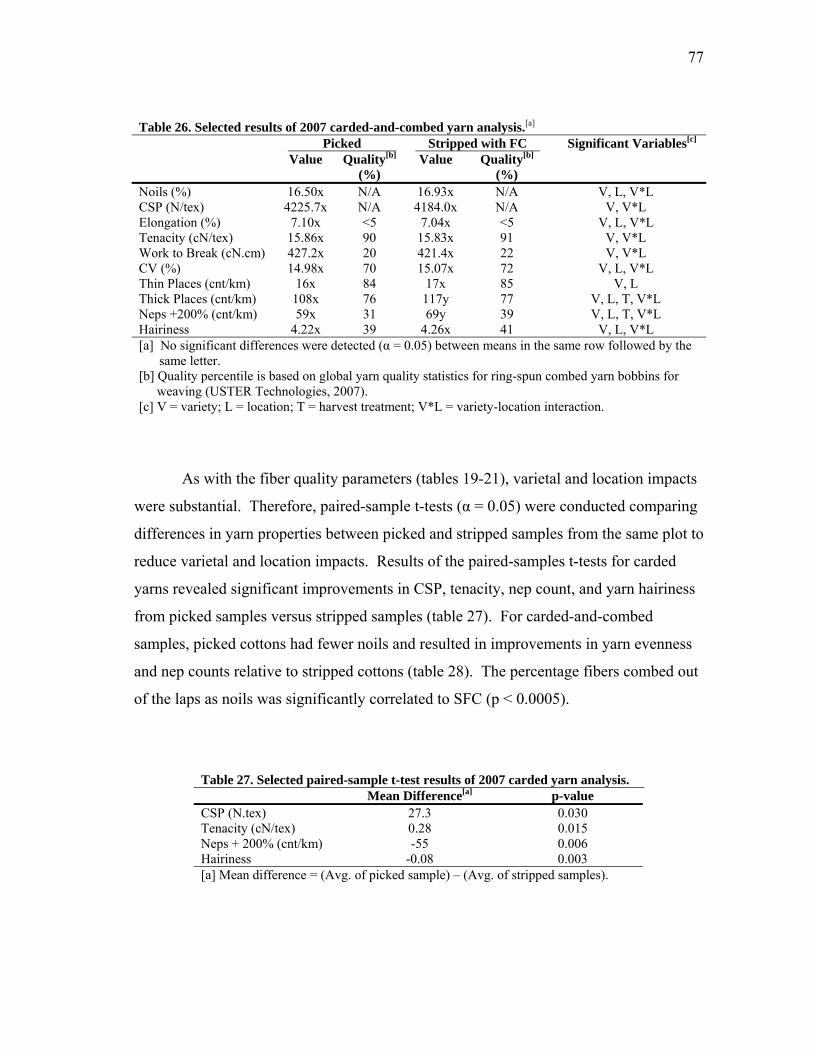
77
Table 26. Selected results of 2007 carded-and-combed yarn analysis.[a] Picked Stripped with FC Significant Variables[c]
Value Quality[b] (%)
Value Quality[b] (%)
Noils (%) 16.50x N/A 16.93x N/A V, L, V*L CSP (N/tex) 4225.7x N/A 4184.0x N/A V, V*L Elongation (%) 7.10x <5 7.04x <5 V, L, V*L Tenacity (cN/tex) 15.86x 90 15.83x 91 V, V*L Work to Break (cN.cm) 427.2x 20 421.4x 22 V, V*L CV (%) 14.98x 70 15.07x 72 V, L, V*L Thin Places (cnt/km) 16x 84 17x 85 V, L Thick Places (cnt/km) 108x 76 117y 77 V, L, T, V*L Neps +200% (cnt/km) 59x 31 69y 39 V, L, T, V*L Hairiness 4.22x 39 4.26x 41 V, L, V*L [a] No significant differences were detected (α = 0.05) between means in the same row followed by the
same letter. [b] Quality percentile is based on global yarn quality statistics for ring-spun combed yarn bobbins for
weaving (USTER Technologies, 2007). [c] V = variety; L = location; T = harvest treatment; V*L = variety-location interaction.
As with the fiber quality parameters (tables 19-21), varietal and location impacts
were substantial. Therefore, paired-sample t-tests (α = 0.05) were conducted comparing
differences in yarn properties between picked and stripped samples from the same plot to
reduce varietal and location impacts. Results of the paired-samples t-tests for carded
yarns revealed significant improvements in CSP, tenacity, nep count, and yarn hairiness
from picked samples versus stripped samples (table 27). For carded-and-combed
samples, picked cottons had fewer noils and resulted in improvements in yarn evenness
and nep counts relative to stripped cottons (table 28). The percentage fibers combed out
of the laps as noils was significantly correlated to SFC (p < 0.0005).
Table 27. Selected paired-sample t-test results of 2007 carded yarn analysis. Mean Difference[a] p-value CSP (N.tex) 27.3 0.030 Tenacity (cN/tex) 0.28 0.015 Neps + 200% (cnt/km) -55 0.006 Hairiness -0.08 0.003 [a] Mean difference = (Avg. of picked sample) – (Avg. of stripped samples).
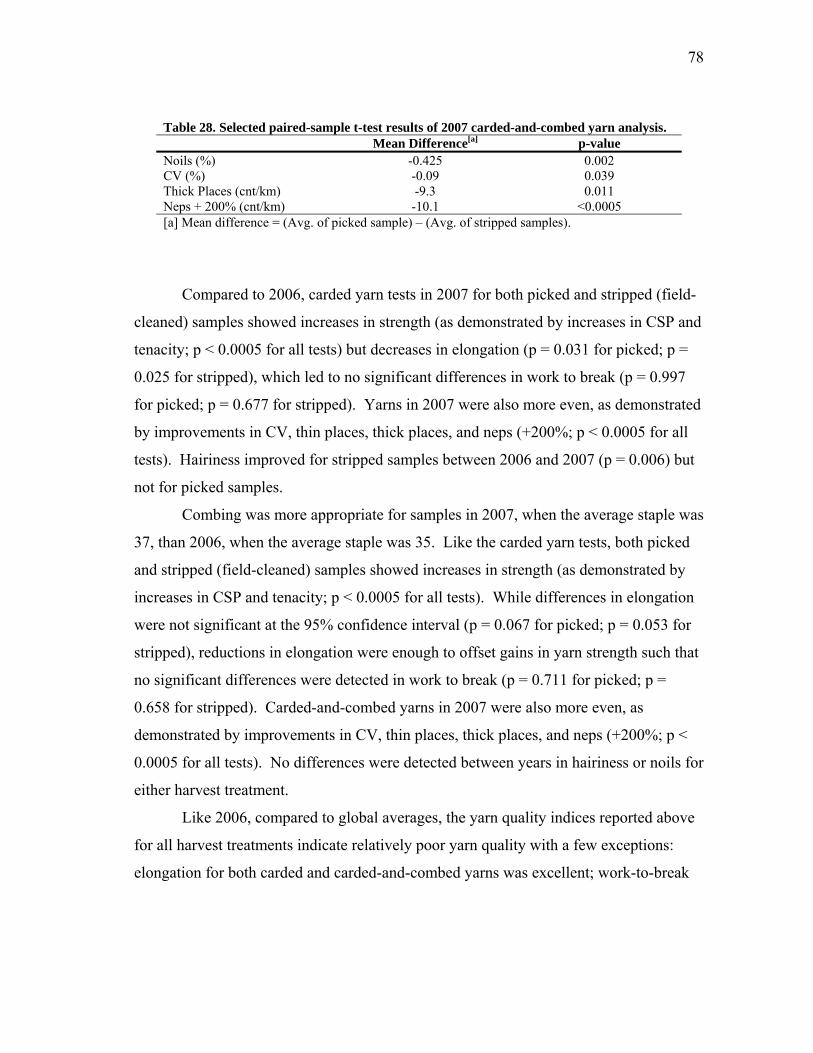
78
Table 28. Selected paired-sample t-test results of 2007 carded-and-combed yarn analysis. Mean Difference[a] p-value Noils (%) -0.425 0.002 CV (%) -0.09 0.039 Thick Places (cnt/km) -9.3 0.011 Neps + 200% (cnt/km) -10.1 <0.0005 [a] Mean difference = (Avg. of picked sample) – (Avg. of stripped samples).
Compared to 2006, carded yarn tests in 2007 for both picked and stripped (field-
cleaned) samples showed increases in strength (as demonstrated by increases in CSP and
tenacity; p < 0.0005 for all tests) but decreases in elongation (p = 0.031 for picked; p =
0.025 for stripped), which led to no significant differences in work to break (p = 0.997
for picked; p = 0.677 for stripped). Yarns in 2007 were also more even, as demonstrated
by improvements in CV, thin places, thick places, and neps (+200%; p < 0.0005 for all
tests). Hairiness improved for stripped samples between 2006 and 2007 (p = 0.006) but
not for picked samples.
Combing was more appropriate for samples in 2007, when the average staple was
37, than 2006, when the average staple was 35. Like the carded yarn tests, both picked
and stripped (field-cleaned) samples showed increases in strength (as demonstrated by
increases in CSP and tenacity; p < 0.0005 for all tests). While differences in elongation
were not significant at the 95% confidence interval (p = 0.067 for picked; p = 0.053 for
stripped), reductions in elongation were enough to offset gains in yarn strength such that
no significant differences were detected in work to break (p = 0.711 for picked; p =
0.658 for stripped). Carded-and-combed yarns in 2007 were also more even, as
demonstrated by improvements in CV, thin places, thick places, and neps (+200%; p <
0.0005 for all tests). No differences were detected between years in hairiness or noils for
either harvest treatment.
Like 2006, compared to global averages, the yarn quality indices reported above
for all harvest treatments indicate relatively poor yarn quality with a few exceptions:
elongation for both carded and carded-and-combed yarns was excellent; work-to-break
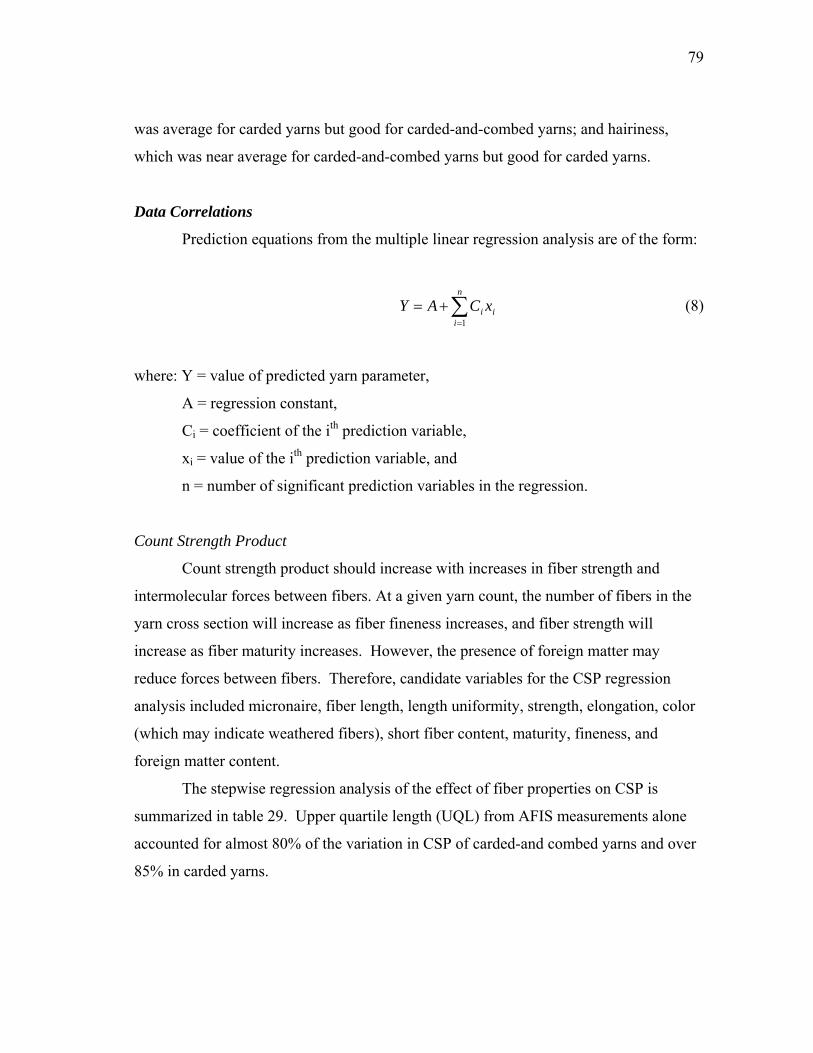
79
was average for carded yarns but good for carded-and-combed yarns; and hairiness,
which was near average for carded-and-combed yarns but good for carded yarns.
Data Correlations
Prediction equations from the multiple linear regression analysis are of the form:
∑=
+=n
iii xCAY
1
(8)
where: Y = value of predicted yarn parameter,
A = regression constant,
Ci = coefficient of the ith prediction variable,
xi = value of the ith prediction variable, and
n = number of significant prediction variables in the regression.
Count Strength Product
Count strength product should increase with increases in fiber strength and
intermolecular forces between fibers. At a given yarn count, the number of fibers in the
yarn cross section will increase as fiber fineness increases, and fiber strength will
increase as fiber maturity increases. However, the presence of foreign matter may
reduce forces between fibers. Therefore, candidate variables for the CSP regression
analysis included micronaire, fiber length, length uniformity, strength, elongation, color
(which may indicate weathered fibers), short fiber content, maturity, fineness, and
foreign matter content.
The stepwise regression analysis of the effect of fiber properties on CSP is
summarized in table 29. Upper quartile length (UQL) from AFIS measurements alone
accounted for almost 80% of the variation in CSP of carded-and combed yarns and over
85% in carded yarns.
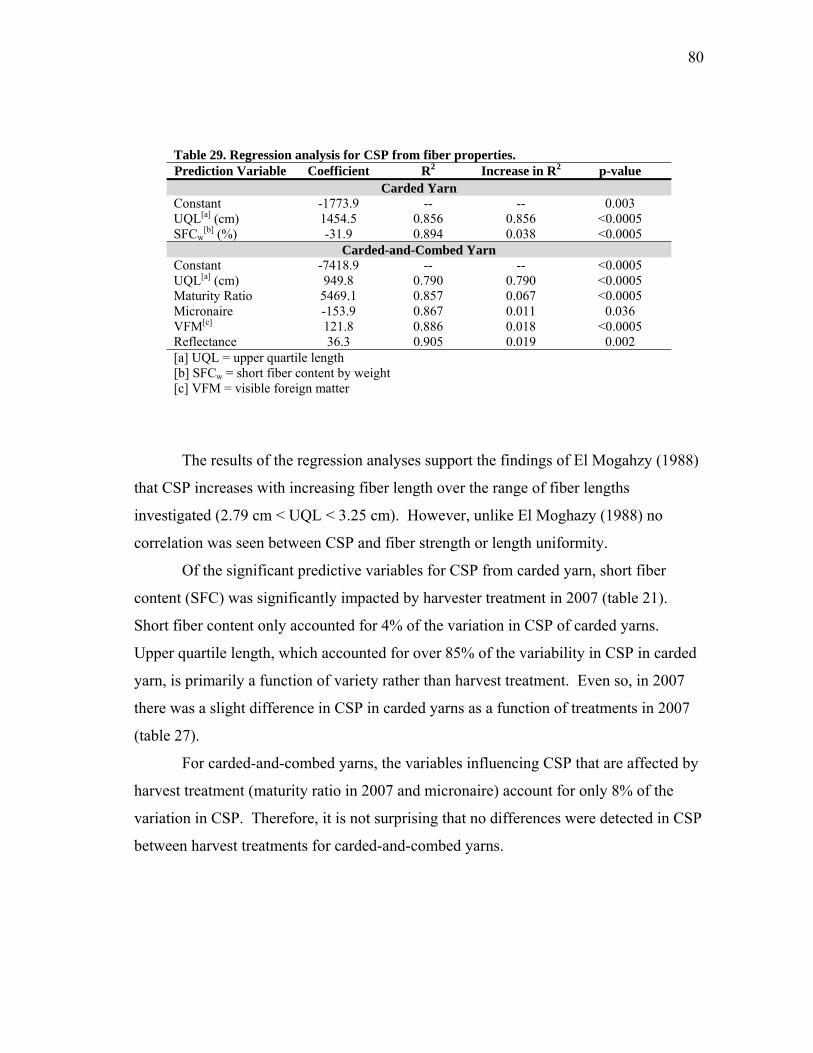
80
Table 29. Regression analysis for CSP from fiber properties.Prediction Variable Coefficient R2 Increase in R2 p-value
Carded YarnConstant -1773.9 -- -- 0.003 UQL[a] (cm) 1454.5 0.856 0.856 <0.0005 SFCw
[b] (%) -31.9 0.894 0.038 <0.0005 Carded-and-Combed Yarn
Constant -7418.9 -- -- <0.0005 UQL[a] (cm) 949.8 0.790 0.790 <0.0005 Maturity Ratio 5469.1 0.857 0.067 <0.0005 Micronaire -153.9 0.867 0.011 0.036 VFM[c] 121.8 0.886 0.018 <0.0005 Reflectance 36.3 0.905 0.019 0.002 [a] UQL = upper quartile length [b] SFCw = short fiber content by weight [c] VFM = visible foreign matter
The results of the regression analyses support the findings of El Mogahzy (1988)
that CSP increases with increasing fiber length over the range of fiber lengths
investigated (2.79 cm < UQL < 3.25 cm). However, unlike El Moghazy (1988) no
correlation was seen between CSP and fiber strength or length uniformity.
Of the significant predictive variables for CSP from carded yarn, short fiber
content (SFC) was significantly impacted by harvester treatment in 2007 (table 21).
Short fiber content only accounted for 4% of the variation in CSP of carded yarns.
Upper quartile length, which accounted for over 85% of the variability in CSP in carded
yarn, is primarily a function of variety rather than harvest treatment. Even so, in 2007
there was a slight difference in CSP in carded yarns as a function of treatments in 2007
(table 27).
For carded-and-combed yarns, the variables influencing CSP that are affected by
harvest treatment (maturity ratio in 2007 and micronaire) account for only 8% of the
variation in CSP. Therefore, it is not surprising that no differences were detected in CSP
between harvest treatments for carded-and-combed yarns.
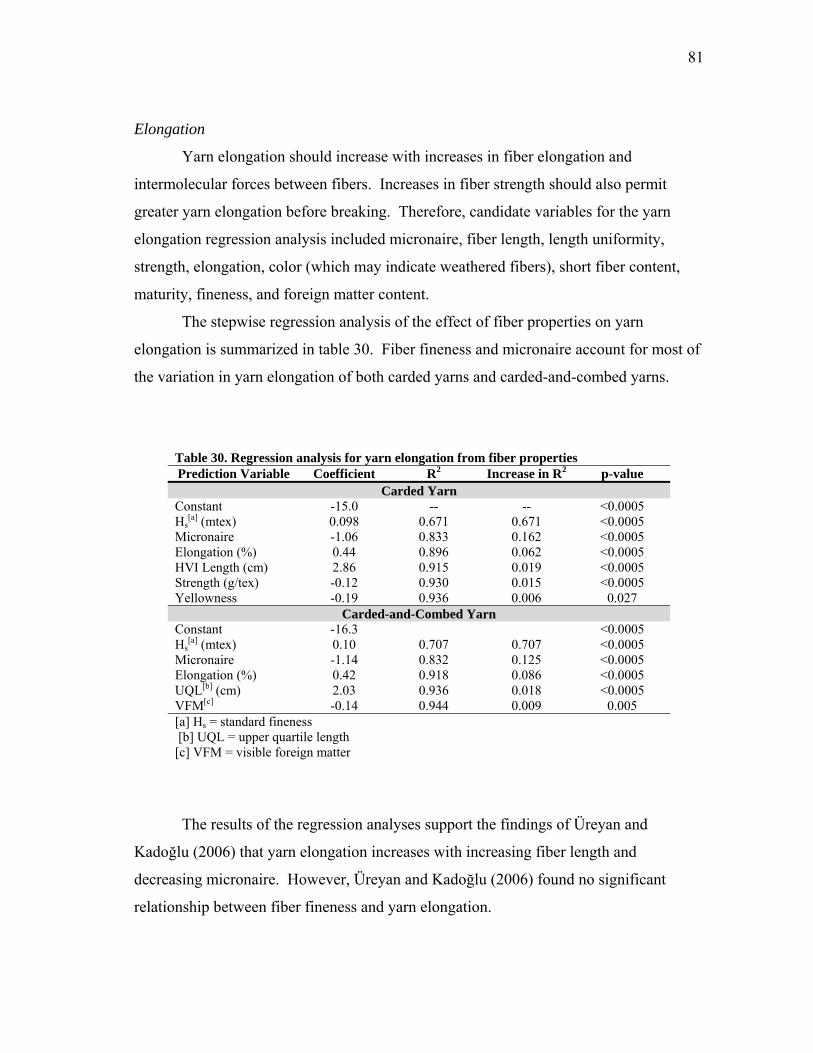
81
Elongation
Yarn elongation should increase with increases in fiber elongation and
intermolecular forces between fibers. Increases in fiber strength should also permit
greater yarn elongation before breaking. Therefore, candidate variables for the yarn
elongation regression analysis included micronaire, fiber length, length uniformity,
strength, elongation, color (which may indicate weathered fibers), short fiber content,
maturity, fineness, and foreign matter content.
The stepwise regression analysis of the effect of fiber properties on yarn
elongation is summarized in table 30. Fiber fineness and micronaire account for most of
the variation in yarn elongation of both carded yarns and carded-and-combed yarns.
Table 30. Regression analysis for yarn elongation from fiber properties Prediction Variable Coefficient R2 Increase in R2 p-value
Carded YarnConstant -15.0 -- -- <0.0005 Hs
[a] (mtex) 0.098 0.671 0.671 <0.0005 Micronaire -1.06 0.833 0.162 <0.0005 Elongation (%) 0.44 0.896 0.062 <0.0005 HVI Length (cm) 2.86 0.915 0.019 <0.0005 Strength (g/tex) -0.12 0.930 0.015 <0.0005 Yellowness -0.19 0.936 0.006 0.027
Carded-and-Combed Yarn Constant -16.3 <0.0005 Hs
[a] (mtex) 0.10 0.707 0.707 <0.0005 Micronaire -1.14 0.832 0.125 <0.0005 Elongation (%) 0.42 0.918 0.086 <0.0005 UQL[b] (cm) 2.03 0.936 0.018 <0.0005 VFM[c] -0.14 0.944 0.009 0.005 [a] Hs = standard fineness [b] UQL = upper quartile length [c] VFM = visible foreign matter
The results of the regression analyses support the findings of Üreyan and
Kadoğlu (2006) that yarn elongation increases with increasing fiber length and
decreasing micronaire. However, Üreyan and Kadoğlu (2006) found no significant
relationship between fiber fineness and yarn elongation.
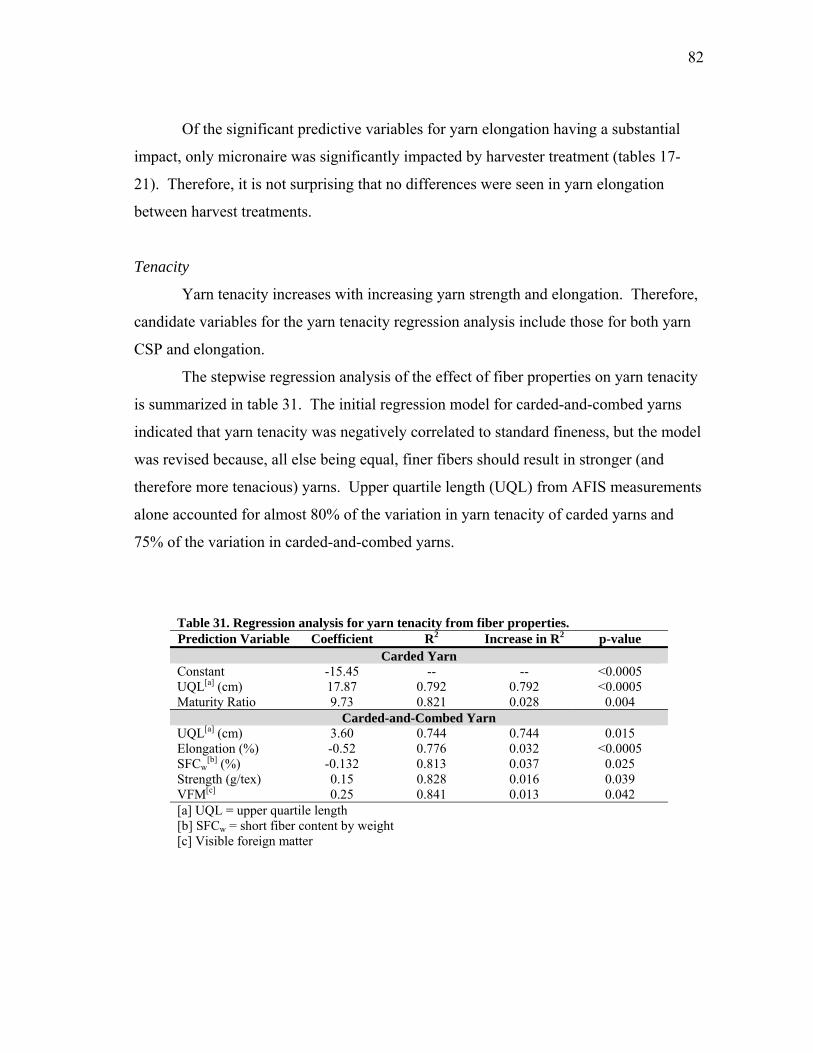
82
Of the significant predictive variables for yarn elongation having a substantial
impact, only micronaire was significantly impacted by harvester treatment (tables 17-
21). Therefore, it is not surprising that no differences were seen in yarn elongation
between harvest treatments.
Tenacity
Yarn tenacity increases with increasing yarn strength and elongation. Therefore,
candidate variables for the yarn tenacity regression analysis include those for both yarn
CSP and elongation.
The stepwise regression analysis of the effect of fiber properties on yarn tenacity
is summarized in table 31. The initial regression model for carded-and-combed yarns
indicated that yarn tenacity was negatively correlated to standard fineness, but the model
was revised because, all else being equal, finer fibers should result in stronger (and
therefore more tenacious) yarns. Upper quartile length (UQL) from AFIS measurements
alone accounted for almost 80% of the variation in yarn tenacity of carded yarns and
75% of the variation in carded-and-combed yarns.
Table 31. Regression analysis for yarn tenacity from fiber properties.Prediction Variable Coefficient R2 Increase in R2 p-value
Carded YarnConstant -15.45 -- -- <0.0005 UQL[a] (cm) 17.87 0.792 0.792 <0.0005 Maturity Ratio 9.73 0.821 0.028 0.004
Carded-and-Combed Yarn UQL[a] (cm) 3.60 0.744 0.744 0.015 Elongation (%) -0.52 0.776 0.032 <0.0005 SFCw
[b] (%) -0.132 0.813 0.037 0.025 Strength (g/tex) 0.15 0.828 0.016 0.039 VFM[c] 0.25 0.841 0.013 0.042 [a] UQL = upper quartile length [b] SFCw = short fiber content by weight [c] Visible foreign matter
83
Several previous studies (Ramey et al., 1977; Graham and Taylor, 1978; Üreyan
and Kadoğlu, 2006) have reported significant correlations between fiber strength and
yarn tenacity. Ramey et al. (1977) reported that variations in fiber tenacity accounted
for 70% of variations in yarn tenacity. However, in this study no correlation was seen
ers (Graham and Taylor, 1978; Ramey et al., 1977; Müller, 1991; Üreyan and Kadoğlu,
2006) that longer fibers produce more tenacious yarns due to increased fiber cohesion.
between yarn strength and fiber strength for carded yarns, and in carded-and-combed
yarns, variations in fiber strength explained only a small portion of the variation in yarn
tenacity. However, the finding that UQL accounted for most of the variation in yarn
tenacity supports the findings of several other research
Based on the regression tests performed, significant variations in yarn tenacity as
a result of harvest treatment would not be expected as UQL is not significantly affected
by harvest treatment. Differences in tenacity between carded yarns from picked and
stripped samples in 2007 were likely the result of interactions between fiber properties or
the result of a predictive variable that did not appear significant in this analysis due to
the limited sample size. No differences were detected in yarn tenacity between harvest
treatments in 2006.
Evenness
The evenness of yarns should improve as the fibers constituting a given yarn and
the spinning conditions become more consistent. Therefore, it is expected that increased
yarn unevenness would result from decreasing fiber uniformity and the presence of short
fibers, neps, foreign matter, and weathered fibers. Immature fibers that cannot stand the
forces of spinning may also lead to yarn unevenness. Candidate variables for evenness
regression analyses included micronaire, fiber length, length uniformity, strength,
elongation, color, short fiber content, maturity, fineness, and foreign matter content.
The stepwise regression analysis of the effect of fiber properties on yarn
evenness is summarized in table 32. Substantially different results were found between
carded yarn tests and carded-and-combed yarn tests. Mean length by number
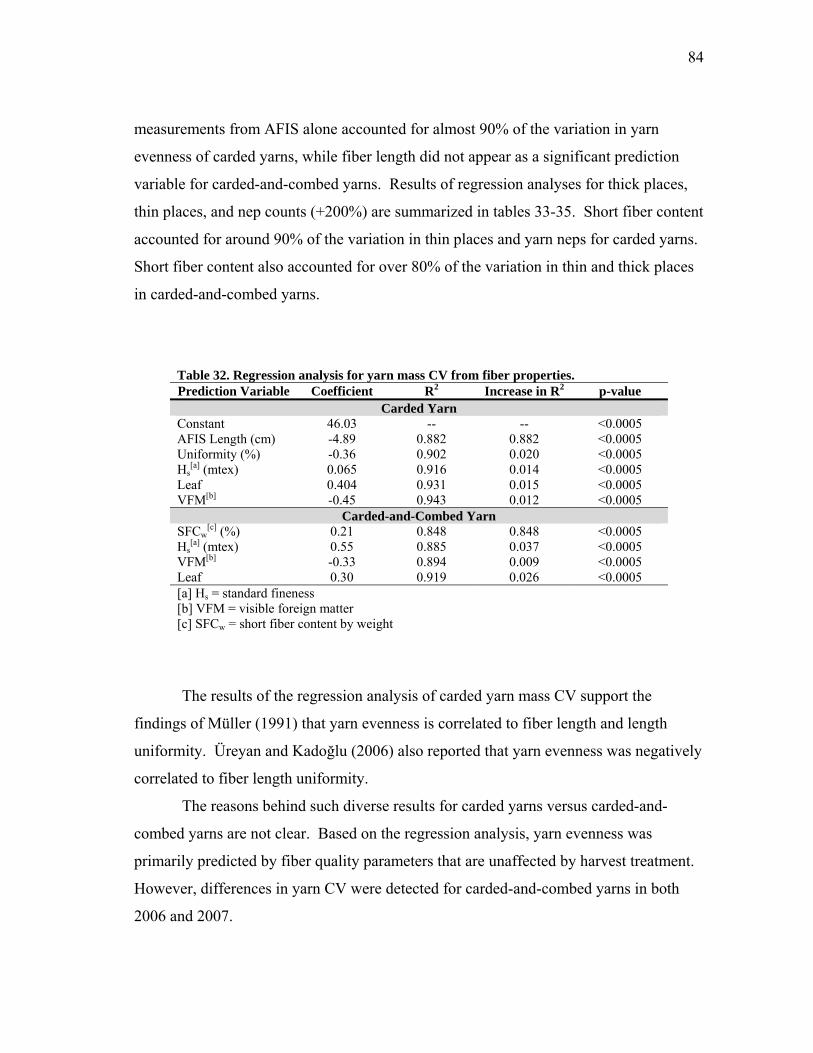
84
measurements from AFIS alone accounted for almost 90% of the variation in yarn
evenness of carded yarns, while fiber length did not appear as a significant prediction
variable for carded-and-combed yarns. Results of regression analyses for thick places,
thin places, and nep counts (+200%) are summarized in tables 33-35. Short fiber content
accounted for around 90% of the variation in thin places and yarn neps for carded yarns.
Short fiber content also accounted for over 80% of the variation in thin and thick places
in carded-and-combed yarns.
Table 32. Regression analysis for yarn mass CV from fiber properties. Prediction Variable Coefficient R2 Increase in R2 p-value
Carded YarnConstant 46.03 -- -- <0.0005 AFIS Length (cm) -4.89 0.882 0.882 <0.0005 Uniformity (%) -0.36 0.902 0.020 <0.0005 Hs
[a] (mtex) 0.065 0.916 0.014 <0.0005 Leaf 0.404 0.931 0.015 <0.0005 VFM[b] -0.45 0.943 0.012 <0.0005
Carded-and-Combed Yarn SFCw
[c] (%) 0.21 0.848 0.848 <0.0005 Hs
[a] (mtex) 0.55 0.885 0.037 <0.0005 VFM[b] -0.33 0.894 0.009 <0.0005 Leaf 0.30 0.919 0.026 <0.0005 [a] Hs = standard fineness [b] VFM = visible foreign matter [c] SFCw = short fiber content by weight
The results of the regression analysis of carded yarn mass CV support the
findings of Müller (1991) that yarn evenness is correlated to fiber length and length
uniformity. Üreyan and Kadoğlu (2006) also reported that yarn evenness was negatively
correlated to fiber length uniformity.
The reasons behind such diverse results for carded yarns versus carded-and-
combed yarns are not clear. Based on the regression analysis, yarn evenness was
primarily predicted by fiber quality parameters that are unaffected by harvest treatment.
However, differences in yarn CV were detected for carded-and-combed yarns in both
2006 and 2007.
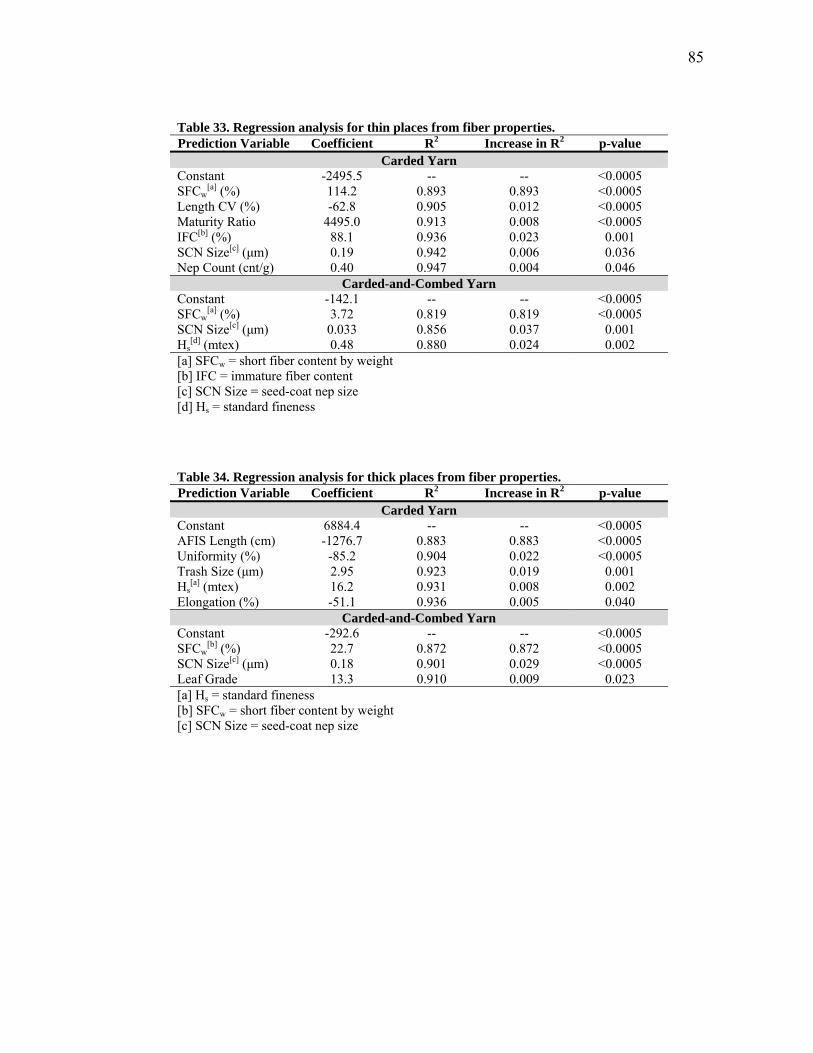
85
Table 33. Regression analysis for thin places from fiber properties.Prediction Variable Coefficient R2 Increase in R2 p-value
Carded YarnConstant -2495.5 -- -- <0.0005 SFCw
[a] (%) 114.2 0.893 0.893 <0.0005 Length CV (%) -62.8 0.905 0.012 <0.0005 Maturity Ratio 4495.0 0.913 0.008 <0.0005 IFC[b] (%) 88.1 0.936 0.023 0.001 SCN Size[c] (µm) 0.19 0.942 0.006 0.036 Nep Count (cnt/g) 0.40 0.947 0.004 0.046
Carded-and-Combed Yarn Constant -142.1 -- -- <0.0005 SFCw
[a] (%) 3.72 0.819 0.819 <0.0005 SCN Size[c] (µm) 0.033 0.856 0.037 0.001 Hs
[d] (mtex) 0.48 0.880 0.024 0.002 [a] SFCw = short fiber content by weight [b] IFC = immature fiber content [c] SCN Size = seed-coat nep size [d] Hs = standard fineness
Table 34. Regression analysis for thick places from fiber properties.Prediction Variable Coefficient R2 Increase in R2 p-value
Carded YarnConstant 6884.4 -- -- <0.0005 AFIS Length (cm) -1276.7 0.883 0.883 <0.0005 Uniformity (%) -85.2 0.904 0.022 <0.0005 Trash Size (µm) 2.95 0.923 0.019 0.001 Hs
[a] (mtex) 16.2 0.931 0.008 0.002 Elongation (%) -51.1 0.936 0.005 0.040
Carded-and-Combed Yarn Constant -292.6 -- -- <0.0005 SFCw
[b] (%) 22.7 0.872 0.872 <0.0005 SCN Size[c] (µm) 0.18 0.901 0.029 <0.0005 Leaf Grade 13.3 0.910 0.009 0.023 [a] Hs = standard fineness [b] SFCw = short fiber content by weight [c] SCN Size = seed-coat nep size
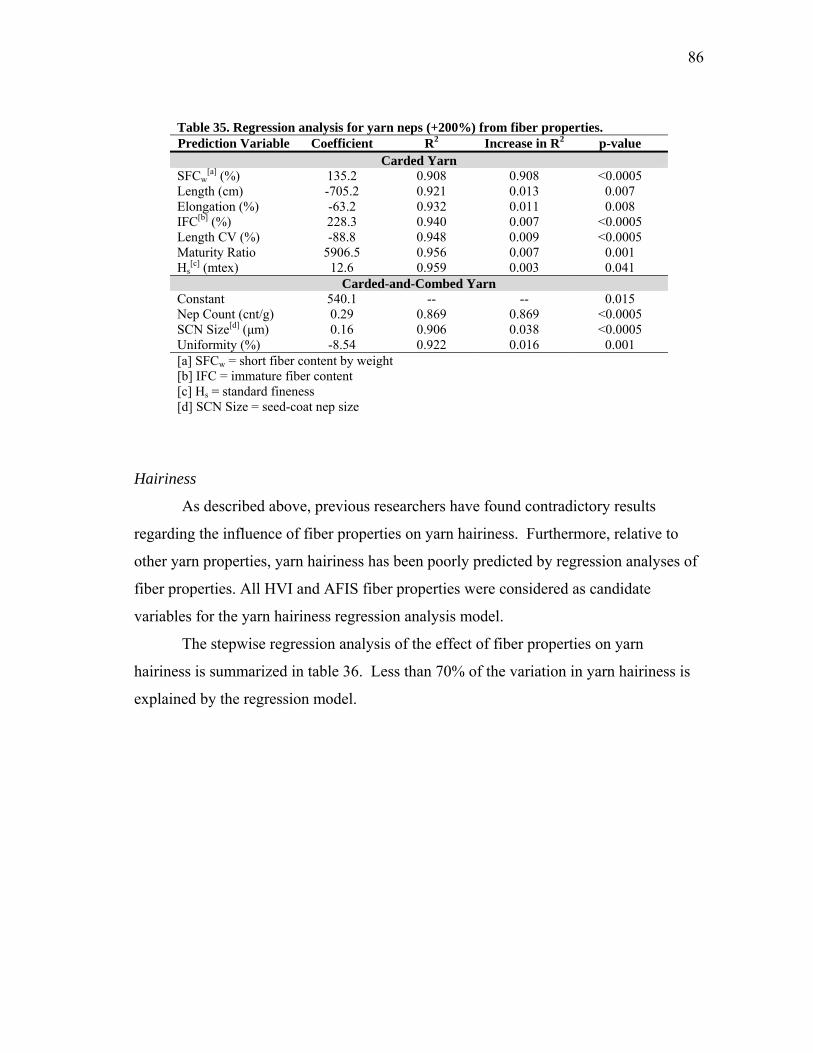
86
Table 35. Regression analysis for yarn neps (+200%) from fiber properties. Prediction Variable Coefficient R2 Increase in R2 p-value
Carded YarnSFCw
[a] (%) 135.2 0.908 0.908 <0.0005 Length (cm) -705.2 0.921 0.013 0.007 Elongation (%) -63.2 0.932 0.011 0.008 IFC[b] (%) 228.3 0.940 0.007 <0.0005 Length CV (%) -88.8 0.948 0.009 <0.0005 Maturity Ratio 5906.5 0.956 0.007 0.001 Hs
[c] (mtex) 12.6 0.959 0.003 0.041 Carded-and-Combed Yarn
Constant 540.1 -- -- 0.015 Nep Count (cnt/g) 0.29 0.869 0.869 <0.0005 SCN Size[d] (µm) 0.16 0.906 0.038 <0.0005 Uniformity (%) -8.54 0.922 0.016 0.001 [a] SFCw = short fiber content by weight [b] IFC = immature fiber content [c] Hs = standard fineness [d] SCN Size = seed-coat nep size
Hairiness
As described above, previous researchers have found contradictory results
regarding the influence of fiber properties on yarn hairiness. Furthermore, relative to
other yarn properties, yarn hairiness has been poorly predicted by regression analyses of
fiber properties. All HVI and AFIS fiber properties were considered as candidate
variables for the yarn hairiness regression analysis model.
The stepwise regression analysis of the effect of fiber properties on yarn
hairiness is summarized in table 36. Less than 70% of the variation in yarn hairiness is
explained by the regression model.
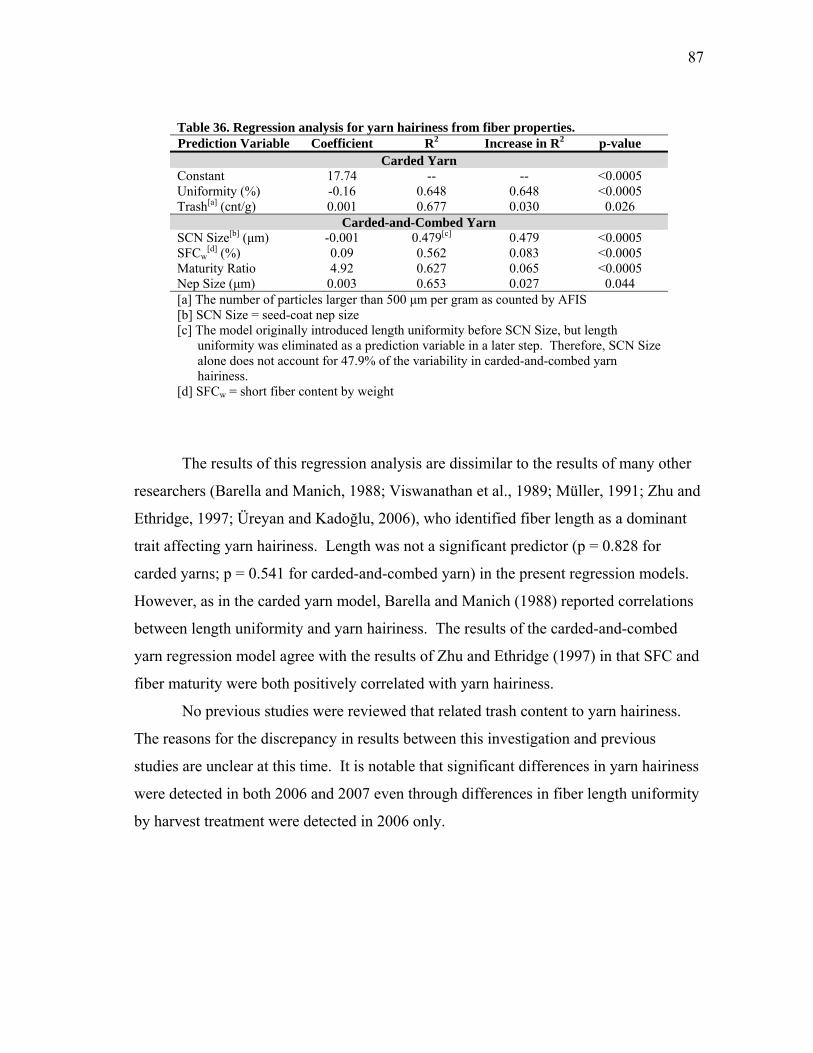
87
Table 36. Regression analysis for yarn hairiness from fiber properties. Prediction Variable Coefficient R2 Increase in R2 p-value
Carded YarnConstant 17.74 -- -- <0.0005 Uniformity (%) -0.16 0.648 0.648 <0.0005 Trash[a] (cnt/g) 0.001 0.677 0.030 0.026
Carded-and-Combed Yarn SCN Size[b] (µm) -0.001 0.479[c] 0.479 <0.0005 SFCw
[d] (%) 0.09 0.562 0.083 <0.0005 Maturity Ratio 4.92 0.627 0.065 <0.0005 Nep Size (µm) 0.003 0.653 0.027 0.044 [a] The number of particles larger than 500 µm per gram as counted by AFIS [b] SCN Size = seed-coat nep size [c] The model originally introduced length uniformity before SCN Size, but length
uniformity was eliminated as a prediction variable in a later step. Therefore, SCN Size alone does not account for 47.9% of the variability in carded-and-combed yarn hairiness.
[d] SFCw = short fiber content by weight
The results of this regression analysis are dissimilar to the results of many other
researchers (Barella and Manich, 1988; Viswanathan et al., 1989; Müller, 1991; Zhu and
Ethridge, 1997; Üreyan and Kadoğlu, 2006), who identified fiber length as a dominant
trait affecting yarn hairiness. Length was not a significant predictor (p = 0.828 for
carded yarns; p = 0.541 for carded-and-combed yarn) in the present regression models.
However, as in the carded yarn model, Barella and Manich (1988) reported correlations
between length uniformity and yarn hairiness. The results of the carded-and-combed
yarn regression model agree with the results of Zhu and Ethridge (1997) in that SFC and
fiber maturity were both positively correlated with yarn hairiness.
No previous studies were reviewed that related trash content to yarn hairiness.
The reasons for the discrepancy in results between this investigation and previous
studies are unclear at this time. It is notable that significant differences in yarn hairiness
were detected in both 2006 and 2007 even through differences in fiber length uniformity
by harvest treatment were detected in 2006 only.
88
CONCLUSIONS
Harvest treatments were compared on the basis of yarn quality indices for four
varieties of cotton commonly grown on the High Plains of Texas over two years.
Regression analyses were also conducted to determine relationships between fiber and
yarn properties.
Few differences were detected in carded yarn quality between harvest treatments,
while more pronounced differences favoring picked cotton were seen in carded-and-
combed yarns. During both 2006 and 2007, the evenness of carded-and-combed yarns
was improved by picking over stripping as measured by yarn CV, thick places, and neps
(+200%), and the hairiness of carded yarns was reduced by picking. In 2007, when
fibers were more mature, picking improved the CSP, tenacity, and nep counts of carded
yarns. Noils, which were correlated to SFC, were also reduced by picking. In 2007,
variety had a greater impact on yarn quality than harvest treatment.
Results of regression analyses were largely consistent with the findings of
previous investigations with regards to CSP, yarn elongation, and carded yarn evenness.
Contrary to previous studies, no significant relationships were detected between yarn
tenacity and fiber strength or between fiber length and yarn hairiness.
89
CHAPTER VII
ECONOMIC ANALYSIS
INTRODUCTION
Cotton production in the High Plains has changed dramatically in the past ten
years as new varieties with superior quality characteristics have been introduced to the
region and irrigated production area has increased. As consumption of US cotton has
shifted from domestic mills to an export market, demands for increased quality have
forced producers to reevaluate their production and marketing goals, leading to changes
in on-farm management practices that have resulted in dramatic increases in length and
strength grades for cotton classed at the USDA-AMS Cotton Classing Offices in
Lubbock and Lamesa, Texas. Furthermore, it is estimated that between 120,000 and
160,000 ha (300,000 and 400,000 ac) of drip irrigation has been installed on the High
Plains in the past ten years for cotton production, and over 450,000 ha (1.1 million ac)
are irrigated with center pivot systems equipped with high efficiency application
packages. As a result, yield potentials in the region have dramatically increased,
sometimes reaching 9.8 to 12.3 bales/ha (4 to 5 bales/ac). The increased emphasis on
quality coupled with increased yields have renewed interest in picker harvester systems
as a means of preserving fiber quality as cotton moves from the field to the mill.
Although picker harvesters are more expensive to purchase and operate, improvements
in the quality of cotton harvested and increases in the speed of harvest may make them
an attractive option to producers of irrigated cotton on the High Plains.
Several economic analyses have attempted to evaluate various cotton harvest
systems. Vories and Bonner (1995) compared gross returns per unit area from picked
and stripped cotton and found that on average, the stripper system produced a greater
return to the producer. However, this study was conducted on cotton yielding less than
4.9 bales/ha (2 bales/ac) and may not be reflective of returns in higher yielding cotton.
Vories and Bonner (1995) also made no attempt to analyze differences in operational
costs between systems but compared returns based on lint value only. Faircloth et al.
90
(2004) found similar results in northeast Louisiana, but their comparison suffered from
similar deficiencies.
Nelson et al. (2001) compared alternative stripper and picker harvesting systems
and included operational and maintenance costs for each system along with the cost of
custom harvesting as an alternative to equipment ownership. The analysis by Nelson et
al. (2001) includes many important considerations and may serve as a model for further
comparisons, but Nelson et al. (2001) only compared different stripper systems with
other stripper systems and picker systems with other picker systems. No comparison
was made between picker- and stripper-based harvest systems. Spurlock et al. (2006)
conducted a similarly robust economic analysis comparing different row configurations
for picker harvesters, but again, no comparison was made between picker and stripper
systems.
Yates et al. (2007) proposed results for an economic study comparing picker and
stripper harvesters, but he extrapolated the fiber quality results from an older two-row
model picker to a new six-row picker and from an older four-row stripper to a new eight-
row picker. Yates et al. (2007) states that "performance rates" were used in the model,
but no discussion is given regarding the information included in those "performance
rates." Yates et al. (2007) described the economic model used as the Cotton Economics
Research Institute Cotton Harvesting Cost Calculator, but gave no details of the model.
Given the lack of information and the questionable extrapolation, the results of Yates et
al. (2007) should not be considered as a viable economic model.
Willcutt et al. (2001) described the most comprehensive economic model for
comparing harvest systems with the COTSIM cotton harvester simulation model
developed by Chen et al. (1992). Willcutt et al. (2001) simulated various harvesters on
various size farms with different row configurations (e.g. skip-row, solid rows, etc.), but
all production systems were assumed to yield 980 kg of lint per ha (1.8 bales/ac).
Willcutt et al. (2001) found that, even with a 2.3 cent per kg ($0.05/lb) reduction in price
for lint, stripper systems yielded higher net returns than picker systems. However,
Willcutt et al. (2001) assumed similar basket volumes for both machines, assumed that
91
strippers could operate the same number of hours per day as pickers, and that the same
number of modules would be produced from both systems. All of these assumptions are
erroneous and may significantly affect harvest system economics. Willcutt et al. (2001)
concluded, however, that if strippers were operated fewer hours per day than pickers and
the number of harvest days available was limited, returns from stripper systems quickly
fell to or below the level of returns from picker harvesters. Furthermore, Willcutt et al.
(2001) did not account for slower stripper speeds that will result from higher yielding
stands, which also favor picker-based systems.
While each of the aforementioned studies yields insight into the decision matrix
needed to determine the best harvest system for irrigated cotton on the High Plains, none
of these studies addresses the issue holistically.
Several well-known financial metrics are available to assess the economic impact
of an investment, including payback period (PP), return on investment (ROI), return on
assets (ROA), and net present value (NPV) (Flaig, 2005). While each of these metrics is
important to consider, only NPV considers the time value of money (Blanchard and
Fabrycky, 1990).
The objective of this research is to use an NPV model to compare economic
returns for picker and stripper harvesters on the High Plains of Texas. Model inputs
regarding harvester performance and cotton fiber quality from each system were
determined from field measurements described in previous chapters. Six-row picker and
stripper systems were compared.
METHODS
NPV for each system was calculated as (Bowlin et al., 1990):
( )∑= +
=n
tt
t
kC
NPV0 1
(9)
92
where: NPV = net present value ($),
n = duration of the investment,
Ct = net cash flow at time period t, and
k = discount rate.
For a given area harvested per machine, the yield required for the NPV of a
picker system to equal the NPV of a stripper system with a field cleaner and a stripper
system bypassing a field cleaner were calculated.
Base Scenario
In the base scenario, the investment cost was determined assuming that each
machine was purchased with 100% liability and the purchase was amortized into equal
payments over seven years, assuming the salvage value as the future value. The real
interest rate (4.8%) was assumed as the discount rate (eq. 10; Bowlin et al., 1990) and
was calculated using the average 2007 intermediate agricultural lending rate (9.28%;
Federal Reserve Bank of Dallas, 2008) adjusted by the farm machinery inflation rate
(4.3%; USDA-NASS, 2008a).
( )( ) 111
−++
=IRNRk (10)
where: k = real discount rate,
NR = nominal rate (here, intermediate agricultural lending rate), and
IR = inflation rate (here, intermediate agricultural lending rate).
The cost of each machine was calculated assuming a purchase price of 90% of
the MSRP (Spurlock et al., 2006) and a salvage value equal to 45% of the purchase price
(Nelson et al., 2001). Taxes, housing, and insurance were calculated as 2% of the
purchase price per year (ASAE Standards, 2006).
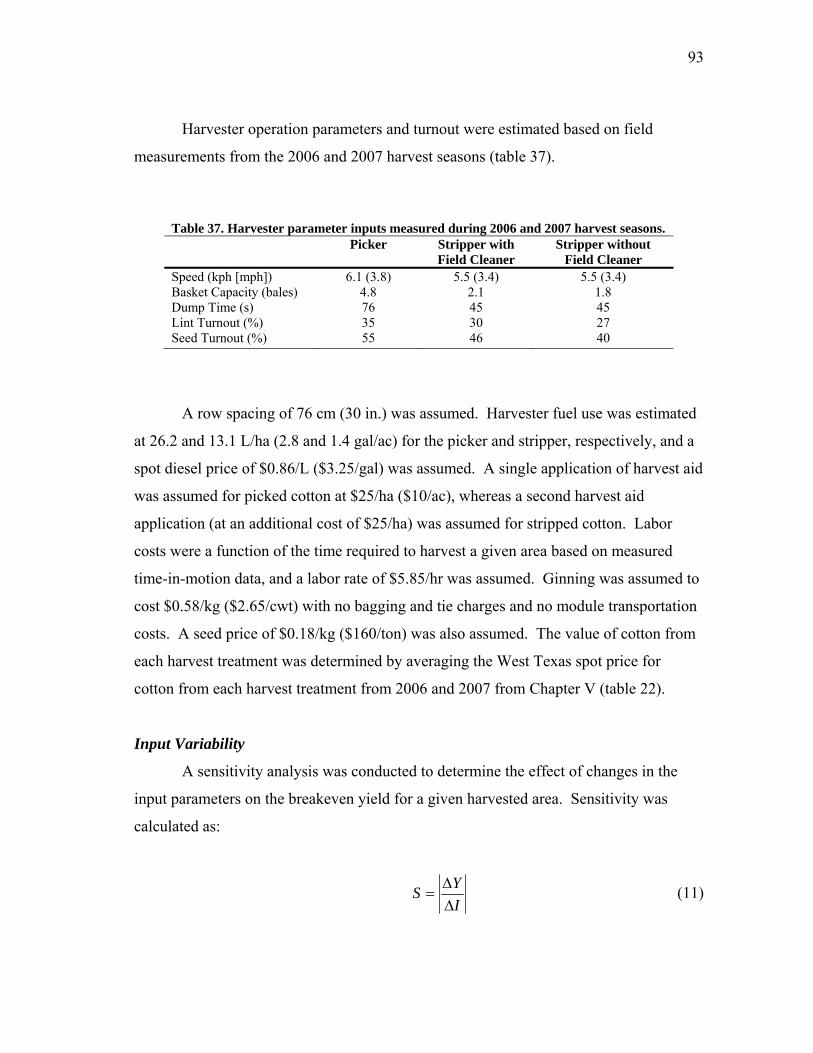
93
Harvester operation parameters and turnout were estimated based on field
measurements from the 2006 and 2007 harvest seasons (table 37).
Table 37. Harvester parameter inputs measured during 2006 and 2007 harvest seasons. Picker Stripper with
Field Cleaner Stripper without
Field Cleaner Speed (kph [mph]) 6.1 (3.8) 5.5 (3.4) 5.5 (3.4) Basket Capacity (bales) 4.8 2.1 1.8 Dump Time (s) 76 45 45 Lint Turnout (%) 35 30 27 Seed Turnout (%) 55 46 40
A row spacing of 76 cm (30 in.) was assumed. Harvester fuel use was estimated
at 26.2 and 13.1 L/ha (2.8 and 1.4 gal/ac) for the picker and stripper, respectively, and a
spot diesel price of $0.86/L ($3.25/gal) was assumed. A single application of harvest aid
was assumed for picked cotton at $25/ha ($10/ac), whereas a second harvest aid
application (at an additional cost of $25/ha) was assumed for stripped cotton. Labor
costs were a function of the time required to harvest a given area based on measured
time-in-motion data, and a labor rate of $5.85/hr was assumed. Ginning was assumed to
cost $0.58/kg ($2.65/cwt) with no bagging and tie charges and no module transportation
costs. A seed price of $0.18/kg ($160/ton) was also assumed. The value of cotton from
each harvest treatment was determined by averaging the West Texas spot price for
cotton from each harvest treatment from 2006 and 2007 from Chapter V (table 22).
Input Variability
A sensitivity analysis was conducted to determine the effect of changes in the
input parameters on the breakeven yield for a given harvested area. Sensitivity was
calculated as:
IYS∆∆
= (11)
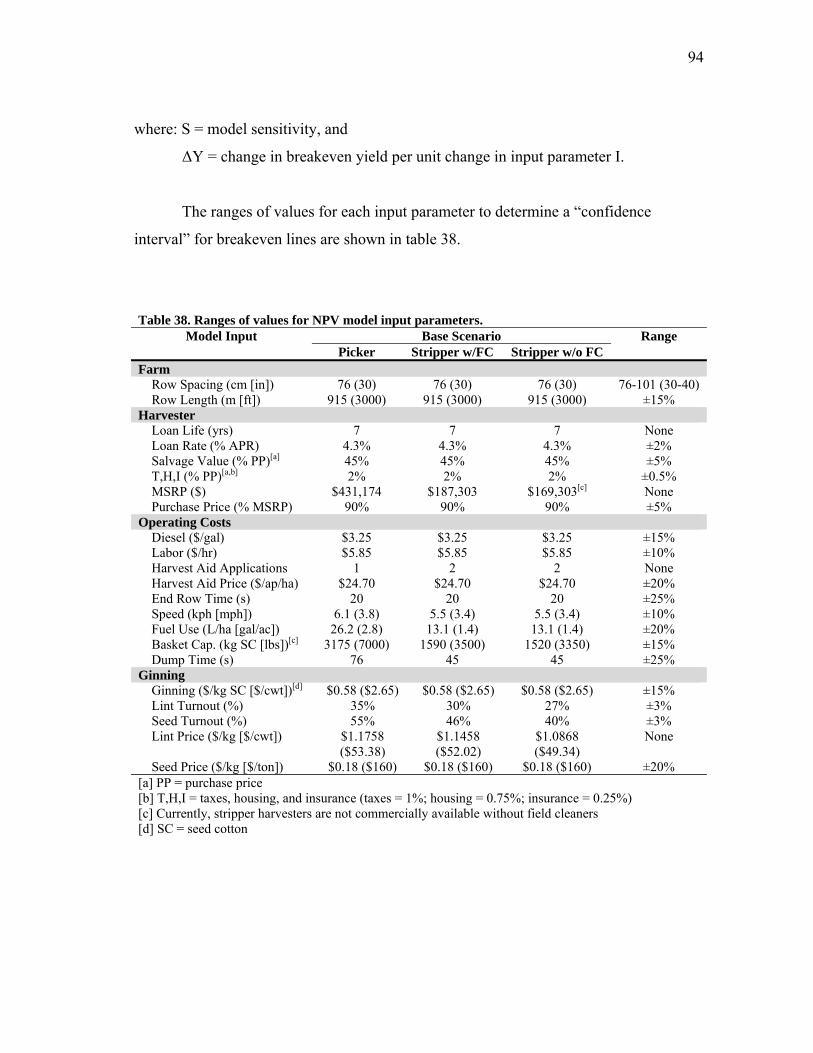
94
where: S = model sensitivity, and
∆Y = change in breakeven yield per unit change in input parameter I.
The ranges of values for each input parameter to determine a “confidence
interval” for breakeven lines are shown in table 38.
Table 38. Ranges of values for NPV model input parameters.
Model Input Base Scenario Range Picker Stripper w/FC Stripper w/o FC
Farm Row Spacing (cm [in]) 76 (30) 76 (30) 76 (30) 76-101 (30-40) Row Length (m [ft]) 915 (3000) 915 (3000) 915 (3000) ±15% Harvester Loan Life (yrs) 7 7 7 None Loan Rate (% APR) 4.3% 4.3% 4.3% ±2% Salvage Value (% PP)[a] 45% 45% 45% ±5% T,H,I (% PP)[a,b] 2% 2% 2% ±0.5% MSRP ($) $431,174 $187,303 $169,303[c] None Purchase Price (% MSRP) 90% 90% 90% ±5% Operating Costs Diesel ($/gal) $3.25 $3.25 $3.25 ±15% Labor ($/hr) $5.85 $5.85 $5.85 ±10% Harvest Aid Applications 1 2 2 None Harvest Aid Price ($/ap/ha) $24.70 $24.70 $24.70 ±20% End Row Time (s) 20 20 20 ±25% Speed (kph [mph]) 6.1 (3.8) 5.5 (3.4) 5.5 (3.4) ±10% Fuel Use (L/ha [gal/ac]) 26.2 (2.8) 13.1 (1.4) 13.1 (1.4) ±20% Basket Cap. (kg SC [lbs])[c] 3175 (7000) 1590 (3500) 1520 (3350) ±15% Dump Time (s) 76 45 45 ±25% Ginning Ginning ($/kg SC [$/cwt])[d] $0.58 ($2.65) $0.58 ($2.65) $0.58 ($2.65) ±15% Lint Turnout (%) 35% 30% 27% ±3% Seed Turnout (%) 55% 46% 40% ±3% Lint Price ($/kg [$/cwt]) $1.1758
($53.38) $1.1458 ($52.02)
$1.0868 ($49.34)
None
Seed Price ($/kg [$/ton]) $0.18 ($160) $0.18 ($160) $0.18 ($160) ±20% [a] PP = purchase price [b] T,H,I = taxes, housing, and insurance (taxes = 1%; housing = 0.75%; insurance = 0.25%) [c] Currently, stripper harvesters are not commercially available without field cleaners [d] SC = seed cotton
95
RESULTS AND DISCUSSION
Under the conditions analyzed, the NPV of the stripper system without a field
cleaner was always lower than the stripper system with a field cleaner, indicating that
stripping without field cleaning is never the most profitable option. However, this
analysis does not take into account the risk averted by stripping without field cleaning on
days that are too windy to transfer picked or field-cleaned seed cotton from the harvester
basket to a boll buggy or module builder. The model also does not place a monetary
value on the reduced risk incurred by being able to pick a field earlier than a producer
can strip a field or the increased risk incurred through the additional capital investment
cost of a picker.
The breakeven yield for a given harvested area decreases as row spacing
increases. For example, the breakeven yield between picking and stripping-with-field-
cleaning when harvesting 320 ha (800 ac) per machine per year is 5.75 bales/ha (2.33
bales/ac) with the base scenario inputs on 76 cm (30 in.) rows, but it decreases to 5.56
bales/ha (2.25 bales/ac) when on 102 cm (40 in.) rows, assuming the same yield of lint
per acre.
The breakeven curve between picking and stripping with a field cleaner is shown
in fig. 18. The breakeven curve between picking and stripping without a field cleaner is
shown in fig. 19. The black line in both figures represents the breakeven curve for the
base scenario while the shaded area represents possible breakeven points within the
range of input variables shown in table 38. Areas above the breakeven line represent
scenarios in which more profit may be obtained from picking while areas below the
breakeven line represent scenarios in which more profit may be obtained by stripper
harvesting. Table 39 shows the relative returns per unit area for the picker and stripper-
with-field-cleaner systems relative to stripping without field cleaning assuming one
machine is used to harvest 243 and 486 ha (600 and 1200 ac), respectively, under the
base scenario.
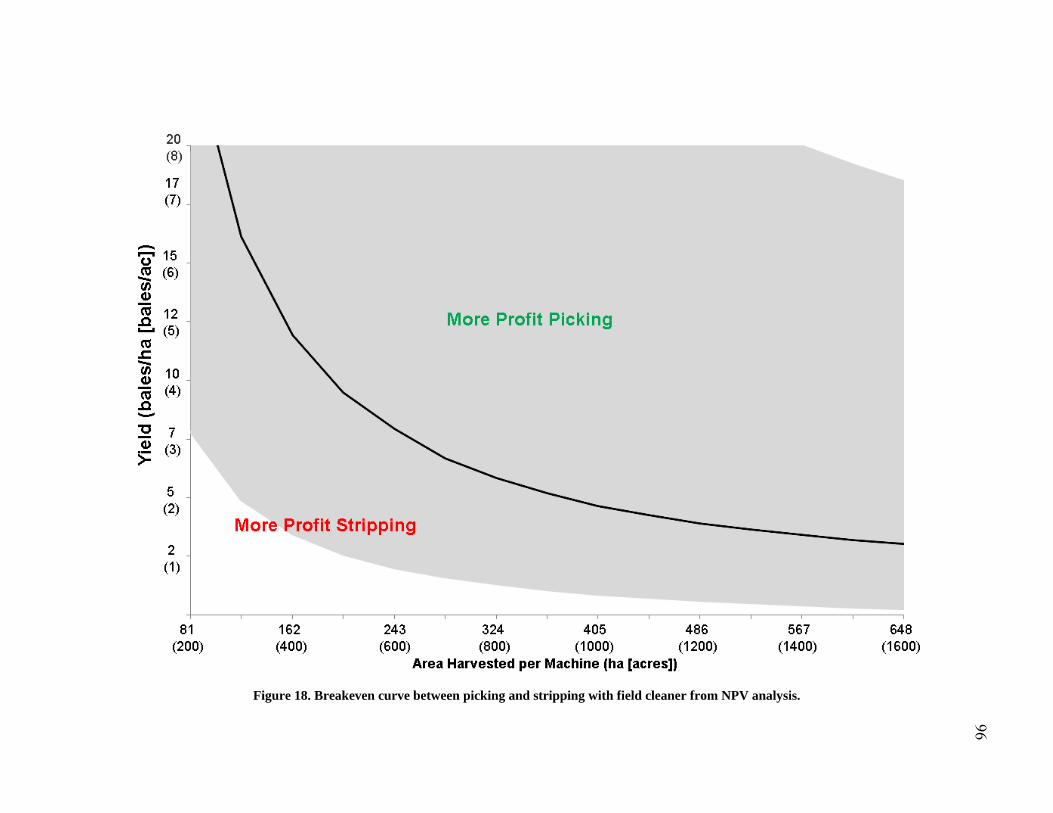
96
Figure 18. Breakeven curve between picking and stripping with field cleaner from NPV analysis.
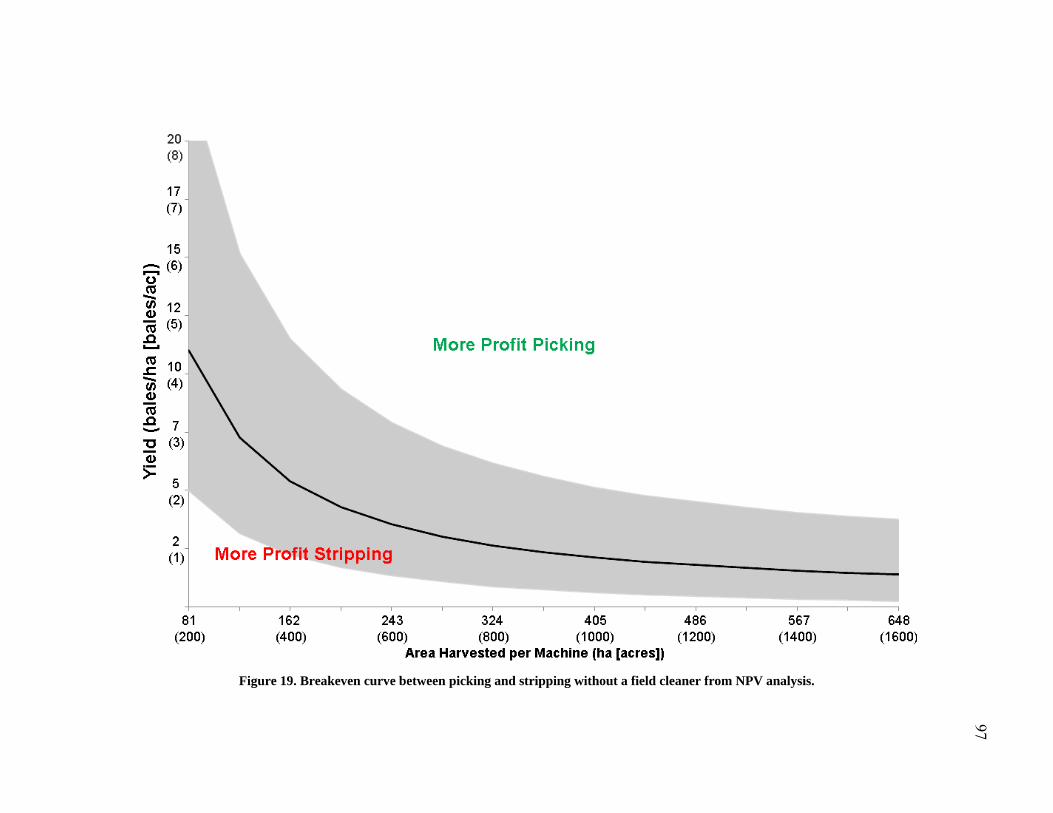
97
Figure 19. Breakeven curve between picking and stripping without a field cleaner from NPV analysis.
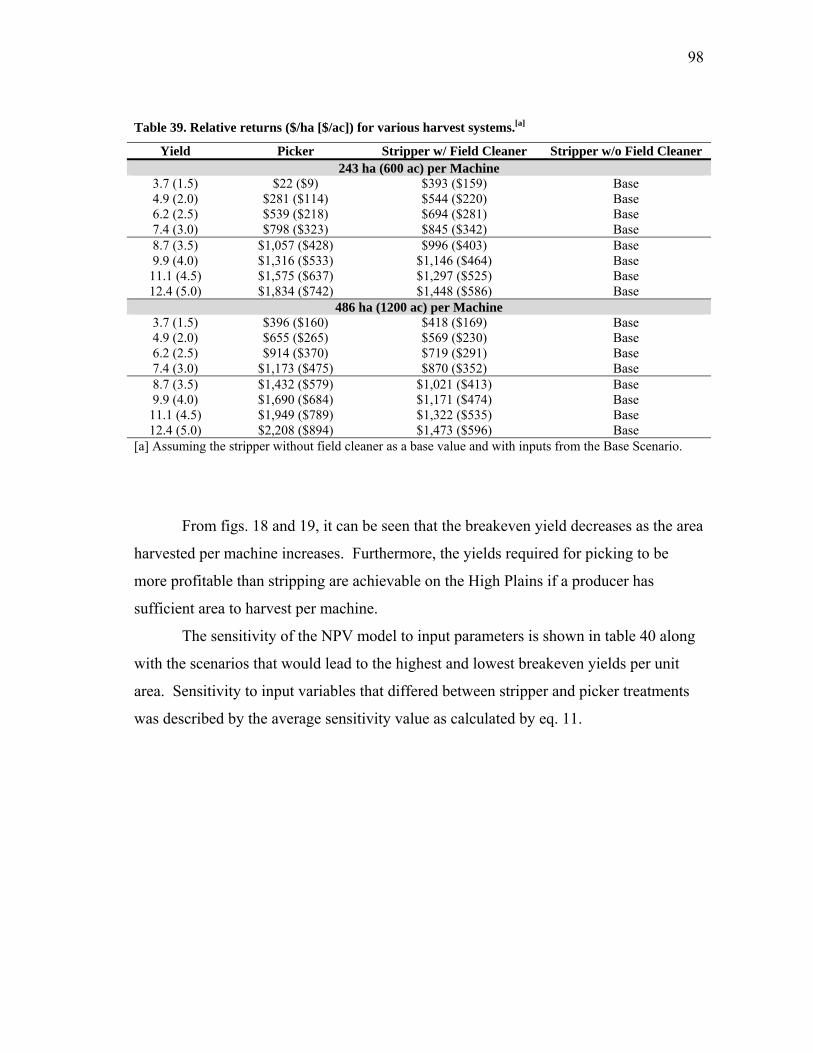
98
Table 39. Relative returns ($/ha [$/ac]) for various harvest systems.[a]
Yield Picker Stripper w/ Field Cleaner Stripper w/o Field Cleaner 243 ha (600 ac) per Machine
3.7 (1.5) $22 ($9) $393 ($159) Base 4.9 (2.0) $281 ($114) $544 ($220) Base 6.2 (2.5) $539 ($218) $694 ($281) Base 7.4 (3.0) $798 ($323) $845 ($342) Base 8.7 (3.5) $1,057 ($428) $996 ($403) Base 9.9 (4.0) $1,316 ($533) $1,146 ($464) Base
11.1 (4.5) $1,575 ($637) $1,297 ($525) Base 12.4 (5.0) $1,834 ($742) $1,448 ($586) Base
486 ha (1200 ac) per Machine3.7 (1.5) $396 ($160) $418 ($169) Base 4.9 (2.0) $655 ($265) $569 ($230) Base 6.2 (2.5) $914 ($370) $719 ($291) Base 7.4 (3.0) $1,173 ($475) $870 ($352) Base 8.7 (3.5) $1,432 ($579) $1,021 ($413) Base 9.9 (4.0) $1,690 ($684) $1,171 ($474) Base
11.1 (4.5) $1,949 ($789) $1,322 ($535) Base 12.4 (5.0) $2,208 ($894) $1,473 ($596) Base
[a] Assuming the stripper without field cleaner as a base value and with inputs from the Base Scenario.
From figs. 18 and 19, it can be seen that the breakeven yield decreases as the area
harvested per machine increases. Furthermore, the yields required for picking to be
more profitable than stripping are achievable on the High Plains if a producer has
sufficient area to harvest per machine.
The sensitivity of the NPV model to input parameters is shown in table 40 along
with the scenarios that would lead to the highest and lowest breakeven yields per unit
area. Sensitivity to input variables that differed between stripper and picker treatments
was described by the average sensitivity value as calculated by eq. 11.
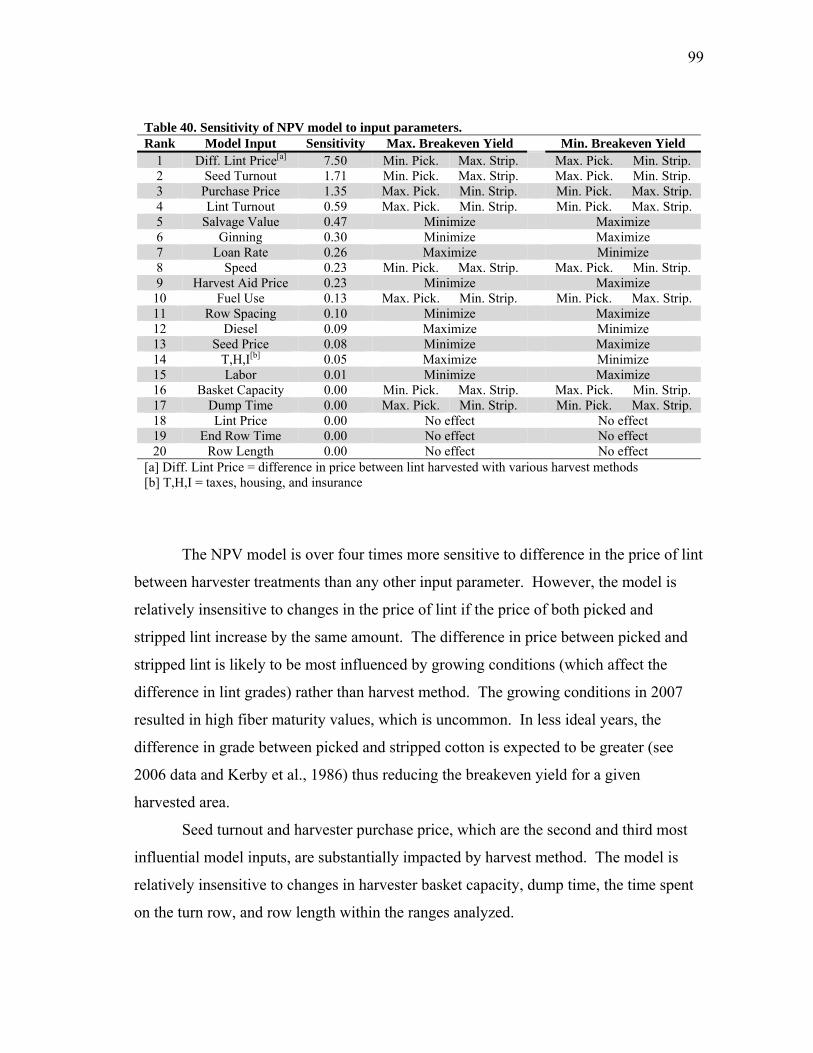
99
Table 40. Sensitivity of NPV model to input parameters. Rank Model Input Sensitivity Max. Breakeven Yield Min. Breakeven Yield
1 Diff. Lint Price[a] 7.50 Min. Pick. Max. Strip. Max. Pick. Min. Strip. 2 Seed Turnout 1.71 Min. Pick. Max. Strip. Max. Pick. Min. Strip. 3 Purchase Price 1.35 Max. Pick. Min. Strip. Min. Pick. Max. Strip. 4 Lint Turnout 0.59 Max. Pick. Min. Strip. Min. Pick. Max. Strip. 5 Salvage Value 0.47 Minimize Maximize 6 Ginning 0.30 Minimize Maximize 7 Loan Rate 0.26 Maximize Minimize 8 Speed 0.23 Min. Pick. Max. Strip. Max. Pick. Min. Strip. 9 Harvest Aid Price 0.23 Minimize Maximize
10 Fuel Use 0.13 Max. Pick. Min. Strip. Min. Pick. Max. Strip. 11 Row Spacing 0.10 Minimize Maximize 12 Diesel 0.09 Maximize Minimize 13 Seed Price 0.08 Minimize Maximize 14 T,H,I[b] 0.05 Maximize Minimize 15 Labor 0.01 Minimize Maximize 16 Basket Capacity 0.00 Min. Pick. Max. Strip. Max. Pick. Min. Strip. 17 Dump Time 0.00 Max. Pick. Min. Strip. Min. Pick. Max. Strip. 18 Lint Price 0.00 No effect No effect 19 End Row Time 0.00 No effect No effect 20 Row Length 0.00 No effect No effect
[a] Diff. Lint Price = difference in price between lint harvested with various harvest methods [b] T,H,I = taxes, housing, and insurance
The NPV model is over four times more sensitive to difference in the price of lint
between harvester treatments than any other input parameter. However, the model is
relatively insensitive to changes in the price of lint if the price of both picked and
stripped lint increase by the same amount. The difference in price between picked and
stripped lint is likely to be most influenced by growing conditions (which affect the
difference in lint grades) rather than harvest method. The growing conditions in 2007
resulted in high fiber maturity values, which is uncommon. In less ideal years, the
difference in grade between picked and stripped cotton is expected to be greater (see
2006 data and Kerby et al., 1986) thus reducing the breakeven yield for a given
harvested area.
Seed turnout and harvester purchase price, which are the second and third most
influential model inputs, are substantially impacted by harvest method. The model is
relatively insensitive to changes in harvester basket capacity, dump time, the time spent
on the turn row, and row length within the ranges analyzed.
100
CONCLUSIONS
A breakeven analysis based on NPV was conducted to compare picker-based and
stripper-based harvest systems with and without field cleaners. Under no conditions
analyzed was the NPV of a stripper system without a field cleaner greater than a stripper
system with a field cleaner. Breakeven curves relating yield to harvested-area-per-
machine were developed to compare picker-based systems with both stripper-based
systems. The breakeven yield decreases as the area harvested per machine increases.
Furthermore, the yields required for picking to be more profitable than stripping are
achievable on the High Plains if a producer has sufficient area to harvest per machine.
The results of a sensitivity analysis of the NPV model demonstrate that the model
is most sensitive to changes in the difference between picked and stripped lint, which is
most influenced by growing conditions rather than harvest method. The model is
relatively insensitive to level changes in the price of lint. The model is relatively
sensitive to changes in seed turnout and machinery purchase price. It is expected that
the breakeven yield for a given harvested area will decrease with more adverse growing
conditions (leading to less mature fibers) and increase with more ideal growing
conditions (leading to more mature fibers).
101
CHAPTER VIII
SUMMARY AND CONCLUSIONS
Harvest machinery represents a substantial expenditure for cotton producers on
the High Plains and throughout the United States. When selecting a harvest system,
capital investment and maintenance costs must be considered within a framework that
includes analysis of the timeliness and efficiency of harvest, the quality of fibers
harvested, and the needs of the textile mill that purchases a producer’s cotton.
The performance of picker and stripper harvesters on irrigated cotton on the High
Plains of Texas was evaluated on the basis of harvest efficiency, time-in-motion, the cost
of ginning, fiber and yarn quality, and economic returns. Harvester performance data
and seed cotton samples were collected from four farms with varying soil and weather
conditions across the High Plains over two harvest seasons.
Harvest efficiency was measured to determine the amount of seed cotton left in
the field by each machine. While stripper harvesters demonstrated higher harvest
efficiencies, the cotton left in the field by the picker was of lower quality and often
reduced the value of the lint harvested per unit area.
Time-in-motion data were collected to characterize the time required for each
operation of harvest, including time spent on the row harvesting, transferring seed cotton
to a boll buggy, and turning at the end of the row. Time-in-motion data were highly
variable and dependent on the support equipment available, such as the number of boll
buggies and module builders supporting each harvester. In general, pickers were able to
travel faster through the field in high yielding cotton, especially when the field cleaner
was the bottleneck in harvester operations. However, as yield decreased, the speed of
the stripper during harvest superseded that of the picker, especially when bypassing the
field cleaner. However, the substantially smaller basket capacity of the stripper required
more frequent dumping, which dramatically impacted the productivity rate of the
stripper systems.
102
The cost of ginning picked and stripped (field-cleaned) cotton was compared
based on ginning schedules from three High Plains gins and measured lint turnouts. On
average, it cost the producer $4.76 per bale more to gin stripped-and-field-cleaned cotton
compared to picked cotton due to the higher foreign matter content of the seed cotton.
Differences were seen in the content of burs, sticks, leaf, and pin trash in seed cotton as a
function of harvest method. The increased foreign matter content also led to increased
utility consumption by the gin while processing stripped cotton compared to picked
cotton.
Fiber quality of cottons from each harvest treatment was analyzed with HVI and
AFIS. In 2006, when fibers were immature, micronaire, length, and length uniformity
were better for picker harvested cotton than for stripped cotton leading to a higher loan
value and average sale price for the producer. In 2007, when growing conditions were
better and fibers were more mature, differences in fiber quality parameters between
picked and stripped cottons were less pronounced leading to less discrepancy in the
value of cotton harvested. However, in 2007, differences in nep counts, short fiber
content (SFC), and visible foreign matter between harvest treatments were
distinguishable. These results support the findings of Kerby et al. (1986) that differences
in fiber quality between harvest treatments are more pronounced in years of adverse
growing conditions.
The results of this study indicate that, by using picker harvesters, producers may
realize greater fiber quality and lint value, but the magnitude of those differences may be
a function of growing conditions and/or fiber maturity. Varietal differences also played
a large role in determining fiber properties, but in 2007, no differences were seen in the
value of harvested lint as a result of these differences.
Yarn quality indices were analyzed to determine differences in ring-spun yarns
from cottons harvested with picker and stripper harvesters. Yarn quality was compared
and regression analyses were conducted to determine relationships between fiber and
yarn properties. Few differences were detected in carded yarn quality between harvest
treatments, while more pronounced differences favoring picked cotton were seen in
103
carded-and-combed yarns. During both 2006 and 2007, the evenness of carded-and-
combed yarns was improved by picking over stripping as measured by yarn CV, thick
places, and neps (+200%), and the hairiness of carded yarns was reduced by picking. In
2007, when fibers were more mature, picking improved the count strength product
(CSP), tenacity, and nep counts of carded yarns. Noils, which were correlated to SFC,
were also reduced by picking. In 2007, variety had a greater impact on yarn quality than
harvest treatment.
Results of regression analyses were consistent with the findings of previous
investigations with regards to CSP, yarn elongation, and carded yarn evenness. Contrary
to previous studies, no significant relationships were detected between yarn tenacity and
fiber strength or between fiber length and yarn hairiness.
The results of the harvester performance and lint quality evaluations were used to
compare the net present value (NPV) of picker and stripper harvesters under a range of
conditions. A breakeven analysis based on NPV was conducted to compare the value of
various harvest systems within the production system. Under no conditions analyzed
was the NPV of a stripper system without a field cleaner greater than a stripper system
with a field cleaner. Breakeven curves relating yield to harvested-area-per-machine
were developed to compare picker-based systems with both stripper-based systems. The
breakeven yield between picking and stripping decreases as the area harvested per
machine increases. The yields required for picking to be more profitable than stripping
are achievable on the High Plains if a producer has sufficient area to harvest per
machine.
The results of a sensitivity analysis of the NPV model demonstrate that the model
is most sensitive to changes in the difference between picked and stripped lint, which is
most influenced by growing conditions. The model is relatively insensitive to level
changes in the price of lint. The model is relatively sensitive to changes in seed turnout
and machinery purchase price. It is expected that the breakeven yield for a given
harvested area will decrease with more adverse growing conditions and increase with
more ideal growing conditions.
104
With increased yields in the High Plains and increased demands from textile
mills for high fiber quality, picker harvesting is a reasonable and potentially profitable
alternative for High Plains producers. The potential profitability of a picker-based
system on the High Plains depends on the area to be harvested per machine and price
differential between picked and stripped cotton, which expands as growing conditions
become more adverse to cotton fiber maturation.
FUTURE WORK
Based on the availability of funding, more data will be collected to further refine
the results of this work. In addition to increasing the sample size of data, the following
have been identified future work in this area:
1. Fiber quality parameters measured by HVI systems and reported as part of
the USDA-AMS cotton classification system provide textile mills with a
substantial amount of information regarding the type of cotton they are
purchasing, but these parameters are insufficient to repeatably predict the
quality of yarn that will result from processing a bale of given HVI quality
parameters. Research could be conducted to determine if differences exist in
yarn quality and spinning performance between bales of cotton that are picker
harvested versus stripper harvested but have the same HVI classification data.
In this manner, it would be possible to determine if there is reason to form a
marketing pool for picked High Plains cotton that could be sold for a
premium based on the spinnability of cotton in the pool.
2. Because of differences in basket capacity between picker and stripper
harvesters, in general, more support equipment such as boll buggies and
module builders are required to support stripper harvesters if they are to
harvest as efficiently as possible. However, larger boll buggies are needed to
receive a full basket of picked seed cotton compared to those required for
stripper harvesting. The economic model may be expanded to include

105
support equipment in order to produce a more comprehensive economic
comparison between harvest systems.
3. With the recent advent of on-harvester module builders for pickers by both
major manufacturers of cotton harvesters, a new layer of data analysis is
possible. The economic model may be expanded to compare stripper-based
systems with on-board module building systems.
106
REFERENCES
Anthony, W.S. and R.C. Eckley. 1994. Energy utilization and conservation in cotton gins. In Cotton Ginners Handbook, 225-236. Handbook Number 503.Washington, D.C.: USDA Agricultural Research Service.
Anthony, W.S., D.W. Van Doorn, and D. Herber. 1994a. Packaging lint cotton. In
Cotton Ginners Handbook, 119-142. Handbook Number 503.Washington, D.C.: USDA Agricultural Research Service.
Anthony, W.S., S.E. Hughs, and W.D. Mayfield. 1994b. Ginning recommendations for
processing machine-picked cotton. In Cotton Ginners Handbook, 240-241. Handbook Number 503.Washington, D.C.: USDA Agricultural Research Service.
ASAE Standards. 2006. EP496.3: Agricultural machinery management. St. Joseph,
Mich.: ASAE. ASTM Standards. 2006. ASTM D2495-01: Standard test method for moisture in cotton
by oven-drying. West Conshohocken, Penn.: ASTM. ASTM Standards. 2007. ASTM D123-07: Standard terminology relating to textiles. West
Conshohocken, Penn.: ASTM. Baker, R.V. 1994. Ginning recommendations for processing machine-stripped cotton. In
Cotton Ginners Handbook, 242-243. Handbook Number 503.Washington, D.C.: USDA Agricultural Research Service.
Baker, R.V., W.S. Anthony, and R.M. Sutton. 1994. Seed cotton cleaning and extracting.
In Cotton Ginners Handbook, 69-90. Handbook Number 503.Washington, D.C.: USDA Agricultural Research Service.
Baker, R.V. and A.D. Brashears. 2000. Combined effects of field cleaning and lint
cleaning on stripper harvested cotton. In Proceedings of the Beltwide Cotton Conferences, 1616-1621. Memphis, Tenn.: National Cotton Council.
Barella, A. and A.M. Manich. 1988. The influence of the spinning process, yarn linear
density, and fibre properties on the hairiness of ring-spun and rotor-spun yarns. Journal of the Textile Institute 79(2): 189-197.
Bargeron, J.D., S.T. Rayburn, and S.R. Griffith. 1988. Effects of grass contaminated
cotton on yarn manufacturing. Transactions of the ASAE 31(1): 2-4.
107
Blanchard, B.S. and W.J. Fabrycky. 1990. Systems Engineering and Analysis. Englewood Cliffs, N.J.: Prentice-Hall.
Bowlin, O.D., J.D. Martin, and D.F. Scott. 1990. Guide to Financial Analysis. 2nd ed. St.
Louis, Mo.: McGraw-Hill Publishing Company. Bragg, C.K., C.L. Simpson, A.D. Brashears, and R.V. Baker. 1995. Bark effect on
spinning efficiency of cotton. Transactions of the ASAE 38(1): 57-64. Brashears, A.D. and R.V. Baker. 2000. Comparison of finger strippers, brush roll
strippers and spindle pickers on the Texas High Plains. In Proceedings of the Beltwide Cotton Conferences, 652-654. Memphis, Tenn.: National Cotton Council.
Brashears, A. D. and K.D. Hake. 1995. Comparing picking a stripping on the Texas high
plains. In Proceedings of the Beltwide Cotton Conferences, 652-654. Memphis, Tenn.: National Cotton Council.
Chen, L.H., T. Ahmad, and M.H. Willcutt. 1992. Simulation model for cotton harvesting
machinery. Transactions of the ASAE 35(3): 1071-1077. Delhom, C.D., D.P. Thibodeaux, and J.E. Rodgers. 2007. Relating fiber quality to yarn
quality utilizing data from multiple years. In Proceedings of the Beltwide Cotton Conferences, 1995-2001. Memphis, Tenn.: National Cotton Council.
El Mogahzy, Y.E. 1988. Selecting cotton fiber properties for fitting reliable equations to
HVI data. Textile Research Journal 58(7): 392-397. El Mogahzy, Y.E., R. Broughton, and W.K. Lynch. 1990. Statistical approach for
determining the technological value of cotton using HVI fiber properties. Textile Research Journal 60(9): 495-500.
Faircloth, J.C., R. Hutchinson, J. Barnett, K. Paxson, A. Coco, and P. Price III. 2004. An
evaluation of alternative cotton harvesting methods in northeast Louisiana - a comparison of the brush stripper and spindle harvester. J. Cotton Science 8: 55-61.
Federal Reserve Bank of Dallas. 2008. Quarterly survey of agricultural credit conditions
– 4th quarter survey. Dallas, Tex.: Federal Reserve Bank of Dallas. Flaig, J.J. 2005. Improving project selection using expected net present value analysis.
Quality Engineering 17: 535-538.
108
Frydrych, I. 1992. A new approach for predicting yarn strength properties of yarn. Textile Research Journal 62(6): 340-348.
Frydrych, I. and M. Matusiak. 2002. Predicting the nep number in cotton yarn –
determining critical nep size. Textile Research Journal 72(10): 917-923. Garde, A.R., V.A. Wakankar, and S.N. Bhaduri. 1961. Fiber configuration in sliver and
roving and its effect on yarn quality. Textile Research Journal 31(12): 1026-1036.
Graham, J.S. and R.A. Taylor. 1978. Development of a method to measure cotton
spinnability. Textile Research Journal 48(5): 286-292. Gupta, A.K. and M.N. Vijayshankar. 1985. Seed-coat fragments in cotton as sources of
blemishes in ring spun yarns. Journal of the Textile Institute 76(6): 393-401. Hughs, S.E., G.J. Mangialardi, and S.G. Jackson. 1994. Moisture control. In Cotton
Ginners Handbook, 58-68. Handbook Number 503.Washington, D.C.: USDA Agricultural Research Service.
Hunter, L. and E. Gee. 1982. Correlation between cotton fiber properties and ring and
rotor yarn. Melliand Textilber 63: 407. Jones, P.C. and J.C. Baldwin. 1996. Zellweger Uster: AFIS detection of seed-coat neps.
Textile World 146(4): 87-88. Kerby, T.A., L.M. Carter, S.E. Hughes, and C.K. Bragg. 1986. Alternate harvesting
systems and cotton quality. Transactions of the ASAE 29(2): 407-412. Keskin, M., R.B. Dodd, and A. Khalilian. 2001. Comparison of different types of light
sources for optical cotton mass measurement. Transactions of the ASAE 44(3): 715-720.
Krifa, M., J.P. Gourlot, and J.Y. Drean. 2001. Effect of seed coat fragments on yarn
strength: dependence on fiber quality. Textile Research Journal 71(11): 981-986. Lord, E. 1956. Airflow through plugs of textile fibers. Part II. The micronaire test of
cotton. J. Textile Inst. 47: T16-T47. Matthews, E.J., P. Shackleford, and J.T. Walker. 1982. Comparison of energy
requirements of narrow row stripper harvested cotton production systems with the standard picker harvested system. In Proceedings of the Beltwide Cotton Conferences. Memphis, Tenn.: National Cotton Council.
109
Mayfield, W. D., W. S. Anthony. 1994. Development of the cotton gin. In Cotton Ginners Handbook, 1-6. Handbook Number 503.Washington, D.C.: USDA Agricultural Research Service.
Mayfield, W. D., W. S. Anthony, R. V. Baker, and S. E. Hughes. 1994. Effects of gin
machinery on cotton quality. In Cotton Ginners Handbook, 237-240. Handbook Number 503.Washington, D.C.: USDA Agricultural Research Service.
McAlister, D.D. and C.D. Rogers. 2005. The effect of harvesting procedures on fiber
and yarn quality of ultra-narrow-row cotton. J. Cotton Science 9(1): 15-23. Montalvo, J.G., T.M. Von Hoven, and G. Davidonis. 2007. Biased experimental fineness
and maturity results. Textile Research Journal 77(10): 743-755. Moore, V.P. and A.C. Griffin. 1964. The relationship of moisture to cotton quality
preservation at gins. USDA-ARS, ARS-42-105. Morton, W.E. and R.J. Summers. 1949. Fibre arrangement in card slivers. Journal of the
Textile Institute 40: P106-P116. Morton, W.E. and R.J. Summers. 1950. Fibre arrangement in fibre drawframe slivers.
Journal of the Textile Institute 41(9): T349-T360. Müller, M. 1991. HVI cotton fibre inspection use, methods and problems. Textile Month
(May): 42-43. Nelson, J.M., S.K. Misra, and A.D. Brashears. 2001. Cost comparison of alternative
stripper and picker cotton harvesting systems. Applied Engineering in Agriculture 17(2): 137-142.
Pierce, F.T. and E. Lord. 1939. The fineness and maturity of cotton. Journal of the
Textile Institute 30: T173-T210. Pillay, K.P.R. 1964. A study of hairiness of cotton yarns – effect of fibre and yarn
factors. Textile Research Journal 34: 663-674. Ramey, H.H. and P.G. Beaton. 1989. Relationship between short fiber content and HVI
fiber length uniformity. Textile Research Journal 59(2): 101-108. Ramey, H.H., R. Lawson, and S. Worley. 1977. Relationship of cotton fiber properties to
yarn tenacity. Textile Research Journal 47(10): 685-691.
110
Shepherd, J.V. 1972. Standard procedures for foreign matter and moisture analytical tests used in cotton ginning research. Agricultural Handbook No. 422. Washington, D.C.: USDA.
Smith, B. and B. Waters. 1985. Extending applicable ranges of regression equations for
yarn strength forecasting. Textile Research Journal 55(12): 713-717. Spurlock, S.R., M.H. Willcutt, and N.W. Buehring. 2006. Costs and returns of
alternative spindle picker systems. In Proceedings of the Beltwide Cotton Conferences. Memphis, Tenn.: National Cotton Council.
Steadman, R.G., J.R. Gipson, R.D. Mehta, and A.S. Soliman. 1989. Factors affecting
rotor spinning of fine count yarns. Textile Research Journal 56(7): 371-382. Subramanian, T.A. 2004. A solution for estimating cotton yarn tenacity. International
Textile Bulletin 4: 36-38. Üreyan, M.E. and H. Kadoğlu. 2006. Regressional estimation of ring cotton yarn
properties from HVI fiber properties. Textile Research Journal 76(5): 360-366. USDA-AMS. 2001. The Classification of Cotton. Handbook Number 566. Washington,
D.C.: USDA Agricultural Marketing Service. USDA-AMS. 2007. Cotton price statistics 2006-2007. Memphis, Tennessee: USDA
Agricultural Marketing Service – Cotton Program. USDA-NASS. 2008a. Agricultural Prices. National Agricultural Statistics Database.
Washington, D.C.: USDA National Agricultural Statistics Service. Available at: www.nass.usda.gov. Accessed 27 March 2008.
USDA- NASS. 2008b. Cotton Ginnings. National Agricultural Statistics Database.
Washington, D.C.: USDA National Agricultural Statistics Service. Available at: www.nass.usda.gov. Accessed 26 February 2008.
Uster Technologies. 2004. USTER® AFIS PRO – What Does the Data Mean?: Common
Test Results in Upland Cotton. Uster, Switzerland: Uster Technologies. Uster Technologies. 2007. Statistics 2007. Uster, Switzerland: Uster Technologies.
Available at www.uster.com. Accessed 22 April 2008. Viswanathan, G., V.G. Munshi, A.V. Ukidve, and K. Chandran. 1989. A critical
evaluation of the relationship between fiber quality parameters and hairiness of cotton yarns. Textile Research Journal 59(11): 707-711.
111
Vories, E.D. and C.M. Bonner. 1995. Comparison of harvest methods for dryland cotton. Fayetteville, Ark.: Arkansas Agricultural Experiment Station.
Werber, F.X. and E.E. Backe. 1994. Textile industry needs. In Cotton Ginners
Handbook, 293-306. Handbook Number 503.Washington, D.C.: USDA Agricultural Research Service.
Willcutt, H. and E. Barnes. 2008. Fuel consumption in spindle picker cotton harvesting
systems. In Proceedings of the Beltwide Cotton Conferences. Memphis, Tenn.: National Cotton Council.
Willcutt, M.H., E. Columbus, and T.D. Valco. 2002. Cotton lint qualities as affected by
harvester type in 10 and 30 inch production systems. In Proceedings of the Beltwide Cotton Conferences. Memphis, Tenn.: National Cotton Council.
Willcutt, M.H., S.D. Filip To, E. Columbus, and T.D. Valco. 2001. Spindle picker and
stripper harvesting systems cost using COTSIM. In Proceedings of the Beltwide Cotton Conferences. Memphis, Tenn.: National Cotton Council.
Williford, J.R., A.D. Brashears, and G.L. Barker. 1994. Harvesting. In Cotton Ginners
Handbook, 11-16. Handbook Number 503.Washington, D.C.: USDA Agricultural Research Service.
Yates, J., R. Boman, M. Kelley, and A. Brashears. 2007. Comparison of costs and
returns for alternative cotton harvest methods in the Texas high plains. In Proceedings of the Beltwide Cotton Conferences. Memphis, Tenn.: National Cotton Council.
Zhu, R. and M.D. Ethridge. 1997. Predicting hairiness for ring and rotor spun yarns and
analyzing the impact of fiber properties. Textile Research Journal 67(9): 694-698.
112
APPENDIX A
SEED COTTON MOISTURE CONTENT DATA
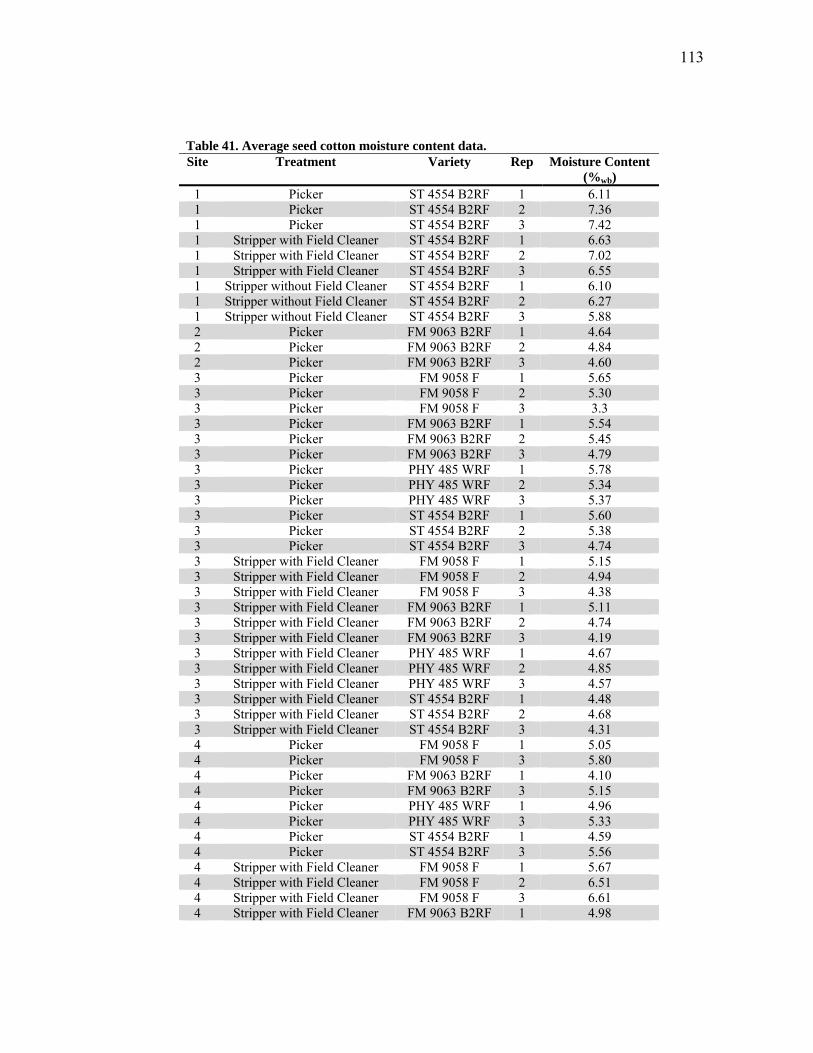
113
Table 41. Average seed cotton moisture content data. Site Treatment Variety Rep Moisture Content
(%wb) 1 Picker ST 4554 B2RF 1 6.11 1 Picker ST 4554 B2RF 2 7.36 1 Picker ST 4554 B2RF 3 7.42 1 Stripper with Field Cleaner ST 4554 B2RF 1 6.63 1 Stripper with Field Cleaner ST 4554 B2RF 2 7.02 1 Stripper with Field Cleaner ST 4554 B2RF 3 6.55 1 Stripper without Field Cleaner ST 4554 B2RF 1 6.10 1 Stripper without Field Cleaner ST 4554 B2RF 2 6.27 1 Stripper without Field Cleaner ST 4554 B2RF 3 5.88 2 Picker FM 9063 B2RF 1 4.64 2 Picker FM 9063 B2RF 2 4.84 2 Picker FM 9063 B2RF 3 4.60 3 Picker FM 9058 F 1 5.65 3 Picker FM 9058 F 2 5.30 3 Picker FM 9058 F 3 3.3 3 Picker FM 9063 B2RF 1 5.54 3 Picker FM 9063 B2RF 2 5.45 3 Picker FM 9063 B2RF 3 4.79 3 Picker PHY 485 WRF 1 5.78 3 Picker PHY 485 WRF 2 5.34 3 Picker PHY 485 WRF 3 5.37 3 Picker ST 4554 B2RF 1 5.60 3 Picker ST 4554 B2RF 2 5.38 3 Picker ST 4554 B2RF 3 4.74 3 Stripper with Field Cleaner FM 9058 F 1 5.15 3 Stripper with Field Cleaner FM 9058 F 2 4.94 3 Stripper with Field Cleaner FM 9058 F 3 4.38 3 Stripper with Field Cleaner FM 9063 B2RF 1 5.11 3 Stripper with Field Cleaner FM 9063 B2RF 2 4.74 3 Stripper with Field Cleaner FM 9063 B2RF 3 4.19 3 Stripper with Field Cleaner PHY 485 WRF 1 4.67 3 Stripper with Field Cleaner PHY 485 WRF 2 4.85 3 Stripper with Field Cleaner PHY 485 WRF 3 4.57 3 Stripper with Field Cleaner ST 4554 B2RF 1 4.48 3 Stripper with Field Cleaner ST 4554 B2RF 2 4.68 3 Stripper with Field Cleaner ST 4554 B2RF 3 4.31 4 Picker FM 9058 F 1 5.05 4 Picker FM 9058 F 3 5.80 4 Picker FM 9063 B2RF 1 4.10 4 Picker FM 9063 B2RF 3 5.15 4 Picker PHY 485 WRF 1 4.96 4 Picker PHY 485 WRF 3 5.33 4 Picker ST 4554 B2RF 1 4.59 4 Picker ST 4554 B2RF 3 5.56 4 Stripper with Field Cleaner FM 9058 F 1 5.67 4 Stripper with Field Cleaner FM 9058 F 2 6.51 4 Stripper with Field Cleaner FM 9058 F 3 6.61 4 Stripper with Field Cleaner FM 9063 B2RF 1 4.98
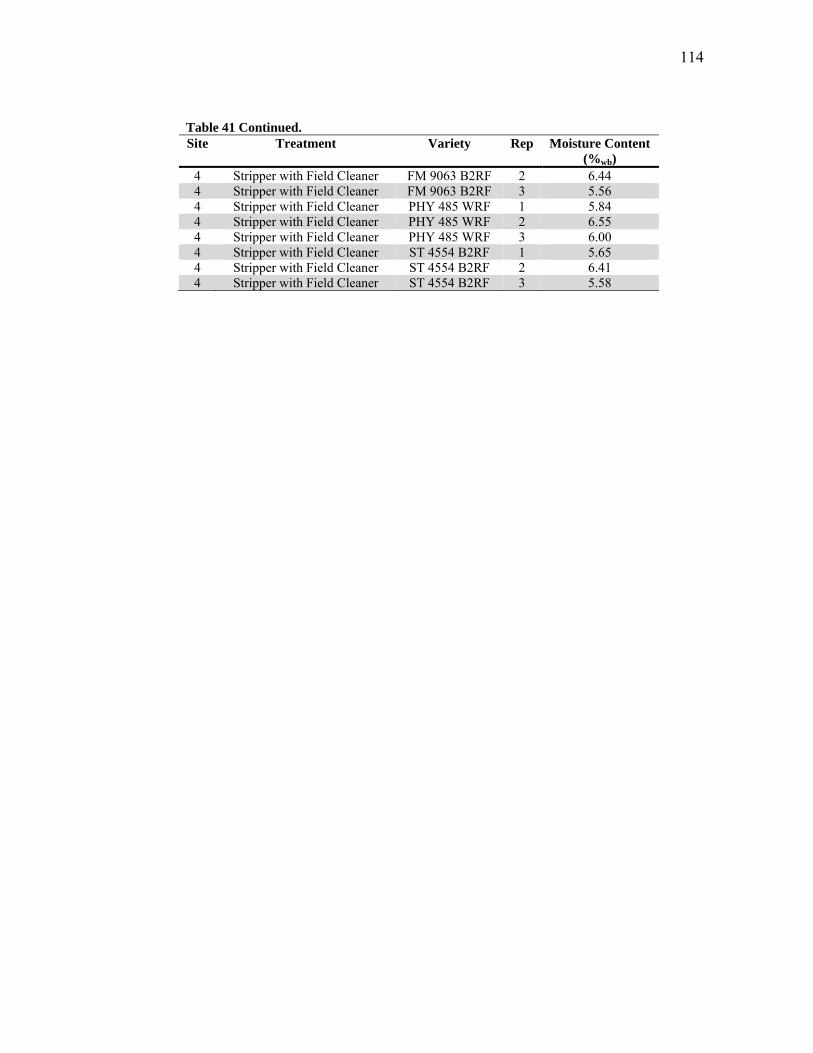
114
Table 41 Continued. Site Treatment Variety Rep Moisture Content
(%wb) 4 Stripper with Field Cleaner FM 9063 B2RF 2 6.44 4 Stripper with Field Cleaner FM 9063 B2RF 3 5.56 4 Stripper with Field Cleaner PHY 485 WRF 1 5.84 4 Stripper with Field Cleaner PHY 485 WRF 2 6.55 4 Stripper with Field Cleaner PHY 485 WRF 3 6.00 4 Stripper with Field Cleaner ST 4554 B2RF 1 5.65 4 Stripper with Field Cleaner ST 4554 B2RF 2 6.41 4 Stripper with Field Cleaner ST 4554 B2RF 3 5.58

115
APPENDIX B
PLANT HEIGHT DATA
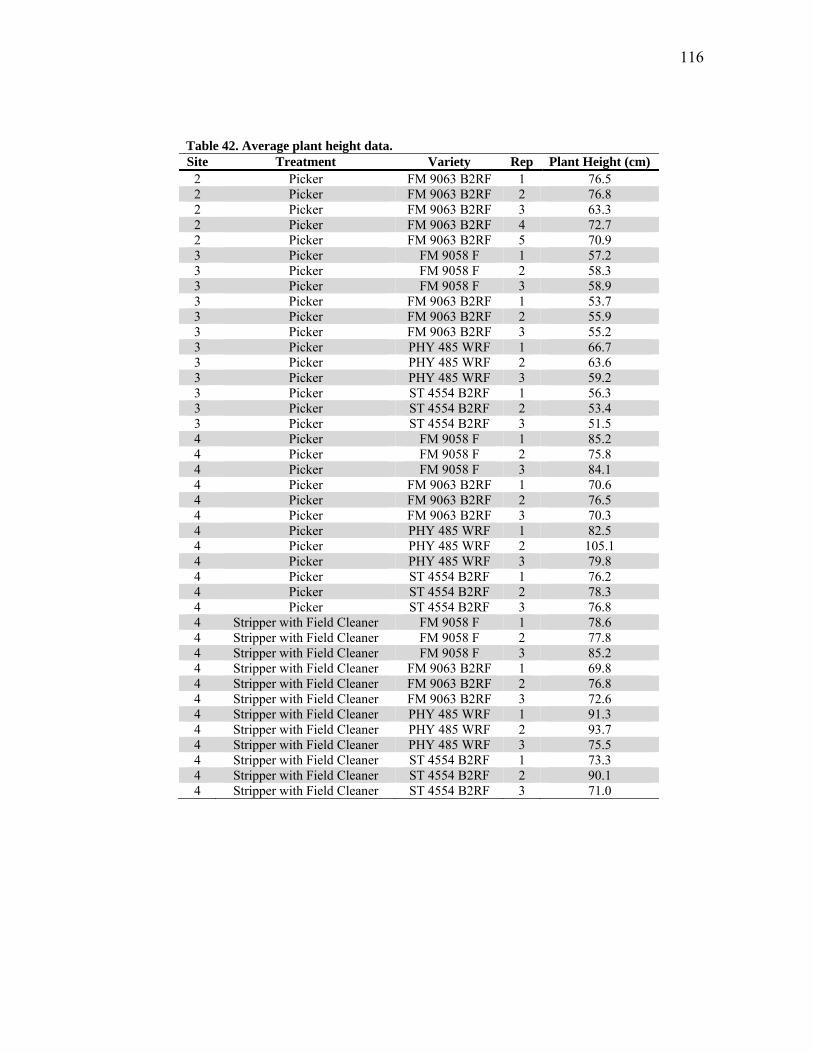
116
Table 42. Average plant height data. Site Treatment Variety Rep Plant Height (cm)
2 Picker FM 9063 B2RF 1 76.5 2 Picker FM 9063 B2RF 2 76.8 2 Picker FM 9063 B2RF 3 63.3 2 Picker FM 9063 B2RF 4 72.7 2 Picker FM 9063 B2RF 5 70.9 3 Picker FM 9058 F 1 57.2 3 Picker FM 9058 F 2 58.3 3 Picker FM 9058 F 3 58.9 3 Picker FM 9063 B2RF 1 53.7 3 Picker FM 9063 B2RF 2 55.9 3 Picker FM 9063 B2RF 3 55.2 3 Picker PHY 485 WRF 1 66.7 3 Picker PHY 485 WRF 2 63.6 3 Picker PHY 485 WRF 3 59.2 3 Picker ST 4554 B2RF 1 56.3 3 Picker ST 4554 B2RF 2 53.4 3 Picker ST 4554 B2RF 3 51.5 4 Picker FM 9058 F 1 85.2 4 Picker FM 9058 F 2 75.8 4 Picker FM 9058 F 3 84.1 4 Picker FM 9063 B2RF 1 70.6 4 Picker FM 9063 B2RF 2 76.5 4 Picker FM 9063 B2RF 3 70.3 4 Picker PHY 485 WRF 1 82.5 4 Picker PHY 485 WRF 2 105.1 4 Picker PHY 485 WRF 3 79.8 4 Picker ST 4554 B2RF 1 76.2 4 Picker ST 4554 B2RF 2 78.3 4 Picker ST 4554 B2RF 3 76.8 4 Stripper with Field Cleaner FM 9058 F 1 78.6 4 Stripper with Field Cleaner FM 9058 F 2 77.8 4 Stripper with Field Cleaner FM 9058 F 3 85.2 4 Stripper with Field Cleaner FM 9063 B2RF 1 69.8 4 Stripper with Field Cleaner FM 9063 B2RF 2 76.8 4 Stripper with Field Cleaner FM 9063 B2RF 3 72.6 4 Stripper with Field Cleaner PHY 485 WRF 1 91.3 4 Stripper with Field Cleaner PHY 485 WRF 2 93.7 4 Stripper with Field Cleaner PHY 485 WRF 3 75.5 4 Stripper with Field Cleaner ST 4554 B2RF 1 73.3 4 Stripper with Field Cleaner ST 4554 B2RF 2 90.1 4 Stripper with Field Cleaner ST 4554 B2RF 3 71.0
117
APPENDIX C
HARVEST EFFICIENCY DATA
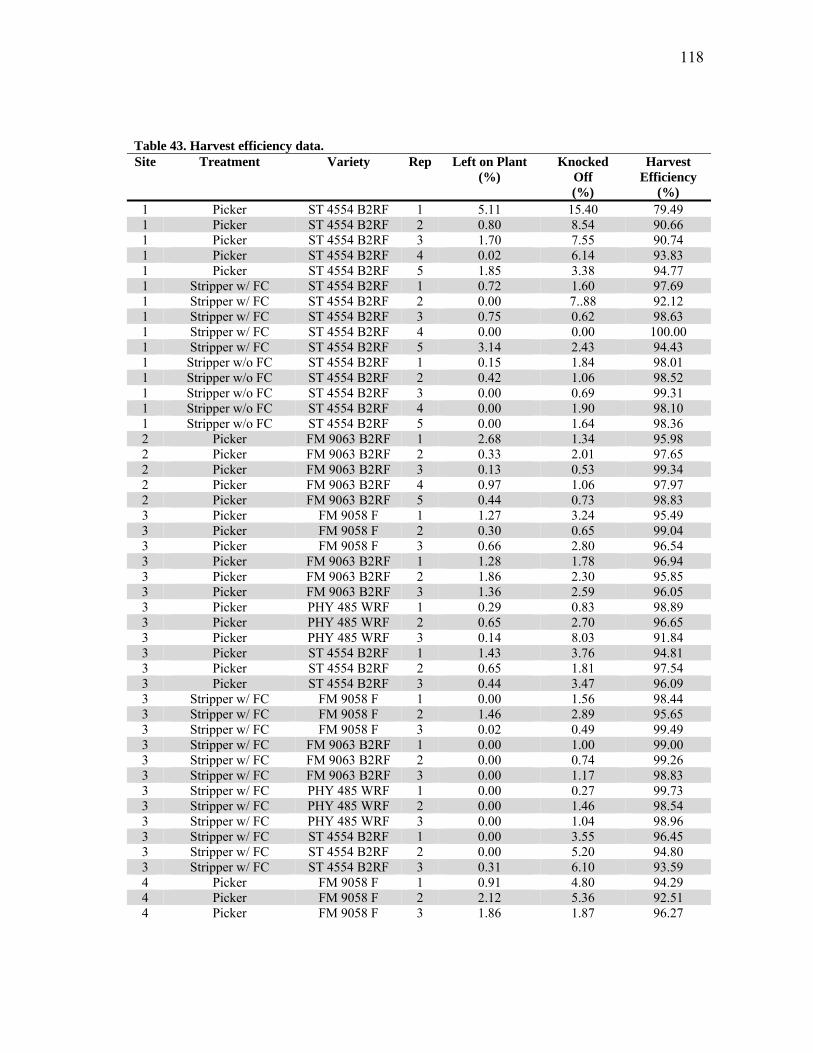
118
Table 43. Harvest efficiency data. Site Treatment Variety Rep Left on Plant
(%) Knocked
Off (%)
Harvest Efficiency
(%) 1 Picker ST 4554 B2RF 1 5.11 15.40 79.49 1 Picker ST 4554 B2RF 2 0.80 8.54 90.66 1 Picker ST 4554 B2RF 3 1.70 7.55 90.74 1 Picker ST 4554 B2RF 4 0.02 6.14 93.83 1 Picker ST 4554 B2RF 5 1.85 3.38 94.77 1 Stripper w/ FC ST 4554 B2RF 1 0.72 1.60 97.69 1 Stripper w/ FC ST 4554 B2RF 2 0.00 7..88 92.12 1 Stripper w/ FC ST 4554 B2RF 3 0.75 0.62 98.63 1 Stripper w/ FC ST 4554 B2RF 4 0.00 0.00 100.00 1 Stripper w/ FC ST 4554 B2RF 5 3.14 2.43 94.43 1 Stripper w/o FC ST 4554 B2RF 1 0.15 1.84 98.01 1 Stripper w/o FC ST 4554 B2RF 2 0.42 1.06 98.52 1 Stripper w/o FC ST 4554 B2RF 3 0.00 0.69 99.31 1 Stripper w/o FC ST 4554 B2RF 4 0.00 1.90 98.10 1 Stripper w/o FC ST 4554 B2RF 5 0.00 1.64 98.36 2 Picker FM 9063 B2RF 1 2.68 1.34 95.98 2 Picker FM 9063 B2RF 2 0.33 2.01 97.65 2 Picker FM 9063 B2RF 3 0.13 0.53 99.34 2 Picker FM 9063 B2RF 4 0.97 1.06 97.97 2 Picker FM 9063 B2RF 5 0.44 0.73 98.83 3 Picker FM 9058 F 1 1.27 3.24 95.49 3 Picker FM 9058 F 2 0.30 0.65 99.04 3 Picker FM 9058 F 3 0.66 2.80 96.54 3 Picker FM 9063 B2RF 1 1.28 1.78 96.94 3 Picker FM 9063 B2RF 2 1.86 2.30 95.85 3 Picker FM 9063 B2RF 3 1.36 2.59 96.05 3 Picker PHY 485 WRF 1 0.29 0.83 98.89 3 Picker PHY 485 WRF 2 0.65 2.70 96.65 3 Picker PHY 485 WRF 3 0.14 8.03 91.84 3 Picker ST 4554 B2RF 1 1.43 3.76 94.81 3 Picker ST 4554 B2RF 2 0.65 1.81 97.54 3 Picker ST 4554 B2RF 3 0.44 3.47 96.09 3 Stripper w/ FC FM 9058 F 1 0.00 1.56 98.44 3 Stripper w/ FC FM 9058 F 2 1.46 2.89 95.65 3 Stripper w/ FC FM 9058 F 3 0.02 0.49 99.49 3 Stripper w/ FC FM 9063 B2RF 1 0.00 1.00 99.00 3 Stripper w/ FC FM 9063 B2RF 2 0.00 0.74 99.26 3 Stripper w/ FC FM 9063 B2RF 3 0.00 1.17 98.83 3 Stripper w/ FC PHY 485 WRF 1 0.00 0.27 99.73 3 Stripper w/ FC PHY 485 WRF 2 0.00 1.46 98.54 3 Stripper w/ FC PHY 485 WRF 3 0.00 1.04 98.96 3 Stripper w/ FC ST 4554 B2RF 1 0.00 3.55 96.45 3 Stripper w/ FC ST 4554 B2RF 2 0.00 5.20 94.80 3 Stripper w/ FC ST 4554 B2RF 3 0.31 6.10 93.59 4 Picker FM 9058 F 1 0.91 4.80 94.29 4 Picker FM 9058 F 2 2.12 5.36 92.51 4 Picker FM 9058 F 3 1.86 1.87 96.27
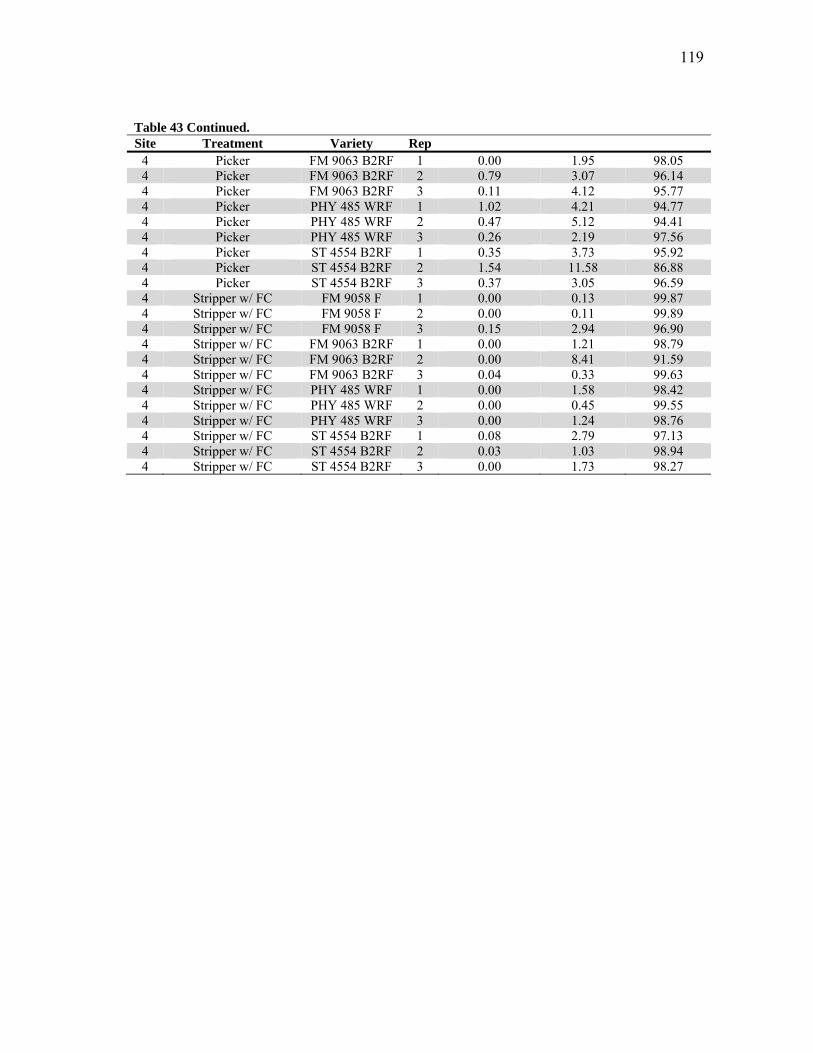
119
Table 43 Continued. Site Treatment Variety Rep
4 Picker FM 9063 B2RF 1 0.00 1.95 98.05 4 Picker FM 9063 B2RF 2 0.79 3.07 96.14 4 Picker FM 9063 B2RF 3 0.11 4.12 95.77 4 Picker PHY 485 WRF 1 1.02 4.21 94.77 4 Picker PHY 485 WRF 2 0.47 5.12 94.41 4 Picker PHY 485 WRF 3 0.26 2.19 97.56 4 Picker ST 4554 B2RF 1 0.35 3.73 95.92 4 Picker ST 4554 B2RF 2 1.54 11.58 86.88 4 Picker ST 4554 B2RF 3 0.37 3.05 96.59 4 Stripper w/ FC FM 9058 F 1 0.00 0.13 99.87 4 Stripper w/ FC FM 9058 F 2 0.00 0.11 99.89 4 Stripper w/ FC FM 9058 F 3 0.15 2.94 96.90 4 Stripper w/ FC FM 9063 B2RF 1 0.00 1.21 98.79 4 Stripper w/ FC FM 9063 B2RF 2 0.00 8.41 91.59 4 Stripper w/ FC FM 9063 B2RF 3 0.04 0.33 99.63 4 Stripper w/ FC PHY 485 WRF 1 0.00 1.58 98.42 4 Stripper w/ FC PHY 485 WRF 2 0.00 0.45 99.55 4 Stripper w/ FC PHY 485 WRF 3 0.00 1.24 98.76 4 Stripper w/ FC ST 4554 B2RF 1 0.08 2.79 97.13 4 Stripper w/ FC ST 4554 B2RF 2 0.03 1.03 98.94 4 Stripper w/ FC ST 4554 B2RF 3 0.00 1.73 98.27

120
APPENDIX D
FRACTIONATION ANALYSIS DATA
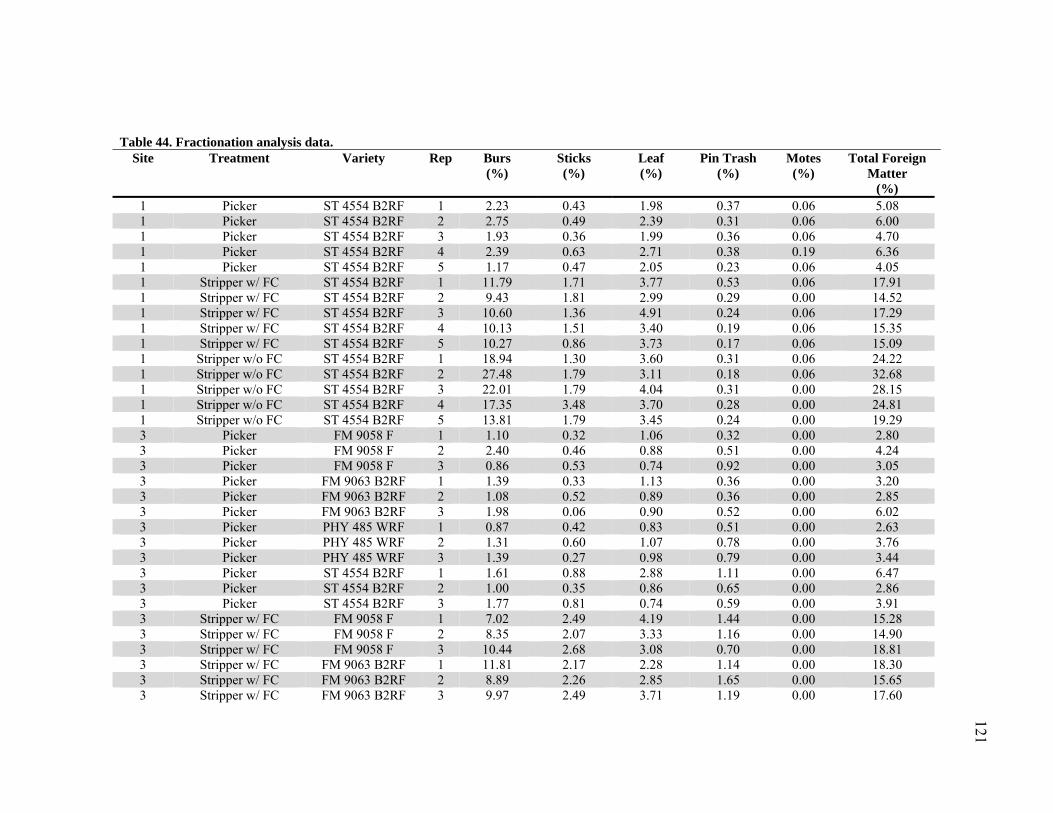
121
Table 44. Fractionation analysis data. Site Treatment Variety Rep Burs
(%) Sticks (%)
Leaf (%)
Pin Trash (%)
Motes (%)
Total Foreign Matter
(%) 1 Picker ST 4554 B2RF 1 2.23 0.43 1.98 0.37 0.06 5.08 1 Picker ST 4554 B2RF 2 2.75 0.49 2.39 0.31 0.06 6.00 1 Picker ST 4554 B2RF 3 1.93 0.36 1.99 0.36 0.06 4.70 1 Picker ST 4554 B2RF 4 2.39 0.63 2.71 0.38 0.19 6.36 1 Picker ST 4554 B2RF 5 1.17 0.47 2.05 0.23 0.06 4.05 1 Stripper w/ FC ST 4554 B2RF 1 11.79 1.71 3.77 0.53 0.06 17.91 1 Stripper w/ FC ST 4554 B2RF 2 9.43 1.81 2.99 0.29 0.00 14.52 1 Stripper w/ FC ST 4554 B2RF 3 10.60 1.36 4.91 0.24 0.06 17.29 1 Stripper w/ FC ST 4554 B2RF 4 10.13 1.51 3.40 0.19 0.06 15.35 1 Stripper w/ FC ST 4554 B2RF 5 10.27 0.86 3.73 0.17 0.06 15.09 1 Stripper w/o FC ST 4554 B2RF 1 18.94 1.30 3.60 0.31 0.06 24.22 1 Stripper w/o FC ST 4554 B2RF 2 27.48 1.79 3.11 0.18 0.06 32.68 1 Stripper w/o FC ST 4554 B2RF 3 22.01 1.79 4.04 0.31 0.00 28.15 1 Stripper w/o FC ST 4554 B2RF 4 17.35 3.48 3.70 0.28 0.00 24.81 1 Stripper w/o FC ST 4554 B2RF 5 13.81 1.79 3.45 0.24 0.00 19.29 3 Picker FM 9058 F 1 1.10 0.32 1.06 0.32 0.00 2.80 3 Picker FM 9058 F 2 2.40 0.46 0.88 0.51 0.00 4.24 3 Picker FM 9058 F 3 0.86 0.53 0.74 0.92 0.00 3.05 3 Picker FM 9063 B2RF 1 1.39 0.33 1.13 0.36 0.00 3.20 3 Picker FM 9063 B2RF 2 1.08 0.52 0.89 0.36 0.00 2.85 3 Picker FM 9063 B2RF 3 1.98 0.06 0.90 0.52 0.00 6.02 3 Picker PHY 485 WRF 1 0.87 0.42 0.83 0.51 0.00 2.63 3 Picker PHY 485 WRF 2 1.31 0.60 1.07 0.78 0.00 3.76 3 Picker PHY 485 WRF 3 1.39 0.27 0.98 0.79 0.00 3.44 3 Picker ST 4554 B2RF 1 1.61 0.88 2.88 1.11 0.00 6.47 3 Picker ST 4554 B2RF 2 1.00 0.35 0.86 0.65 0.00 2.86 3 Picker ST 4554 B2RF 3 1.77 0.81 0.74 0.59 0.00 3.91 3 Stripper w/ FC FM 9058 F 1 7.02 2.49 4.19 1.44 0.00 15.28 3 Stripper w/ FC FM 9058 F 2 8.35 2.07 3.33 1.16 0.00 14.90 3 Stripper w/ FC FM 9058 F 3 10.44 2.68 3.08 0.70 0.00 18.81 3 Stripper w/ FC FM 9063 B2RF 1 11.81 2.17 2.28 1.14 0.00 18.30 3 Stripper w/ FC FM 9063 B2RF 2 8.89 2.26 2.85 1.65 0.00 15.65 3 Stripper w/ FC FM 9063 B2RF 3 9.97 2.49 3.71 1.19 0.00 17.60
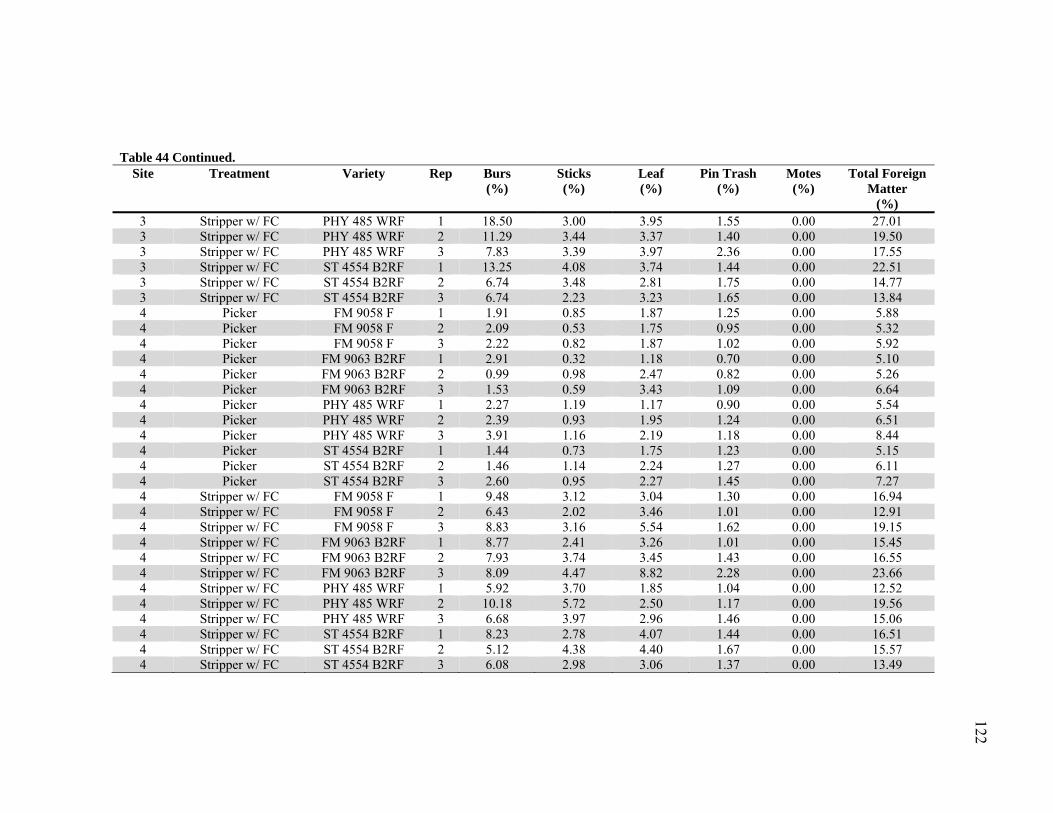
122
Table 44 Continued.
Site Treatment Variety Rep Burs (%)
Sticks (%)
Leaf (%)
Pin Trash (%)
Motes (%)
Total Foreign Matter
(%)3 Stripper w/ FC PHY 485 WRF 1 18.50 3.00 3.95 1.55 0.00 27.01 3 Stripper w/ FC PHY 485 WRF 2 11.29 3.44 3.37 1.40 0.00 19.50 3 Stripper w/ FC PHY 485 WRF 3 7.83 3.39 3.97 2.36 0.00 17.55 3 Stripper w/ FC ST 4554 B2RF 1 13.25 4.08 3.74 1.44 0.00 22.51 3 Stripper w/ FC ST 4554 B2RF 2 6.74 3.48 2.81 1.75 0.00 14.77 3 Stripper w/ FC ST 4554 B2RF 3 6.74 2.23 3.23 1.65 0.00 13.84 4 Picker FM 9058 F 1 1.91 0.85 1.87 1.25 0.00 5.88 4 Picker FM 9058 F 2 2.09 0.53 1.75 0.95 0.00 5.32 4 Picker FM 9058 F 3 2.22 0.82 1.87 1.02 0.00 5.92 4 Picker FM 9063 B2RF 1 2.91 0.32 1.18 0.70 0.00 5.10 4 Picker FM 9063 B2RF 2 0.99 0.98 2.47 0.82 0.00 5.26 4 Picker FM 9063 B2RF 3 1.53 0.59 3.43 1.09 0.00 6.64 4 Picker PHY 485 WRF 1 2.27 1.19 1.17 0.90 0.00 5.54 4 Picker PHY 485 WRF 2 2.39 0.93 1.95 1.24 0.00 6.51 4 Picker PHY 485 WRF 3 3.91 1.16 2.19 1.18 0.00 8.44 4 Picker ST 4554 B2RF 1 1.44 0.73 1.75 1.23 0.00 5.15 4 Picker ST 4554 B2RF 2 1.46 1.14 2.24 1.27 0.00 6.11 4 Picker ST 4554 B2RF 3 2.60 0.95 2.27 1.45 0.00 7.27 4 Stripper w/ FC FM 9058 F 1 9.48 3.12 3.04 1.30 0.00 16.94 4 Stripper w/ FC FM 9058 F 2 6.43 2.02 3.46 1.01 0.00 12.91 4 Stripper w/ FC FM 9058 F 3 8.83 3.16 5.54 1.62 0.00 19.15 4 Stripper w/ FC FM 9063 B2RF 1 8.77 2.41 3.26 1.01 0.00 15.45 4 Stripper w/ FC FM 9063 B2RF 2 7.93 3.74 3.45 1.43 0.00 16.55 4 Stripper w/ FC FM 9063 B2RF 3 8.09 4.47 8.82 2.28 0.00 23.66 4 Stripper w/ FC PHY 485 WRF 1 5.92 3.70 1.85 1.04 0.00 12.52 4 Stripper w/ FC PHY 485 WRF 2 10.18 5.72 2.50 1.17 0.00 19.56 4 Stripper w/ FC PHY 485 WRF 3 6.68 3.97 2.96 1.46 0.00 15.06 4 Stripper w/ FC ST 4554 B2RF 1 8.23 2.78 4.07 1.44 0.00 16.51 4 Stripper w/ FC ST 4554 B2RF 2 5.12 4.38 4.40 1.67 0.00 15.57 4 Stripper w/ FC ST 4554 B2RF 3 6.08 2.98 3.06 1.37 0.00 13.49

123
APPENDIX E
TURNOUT DATA
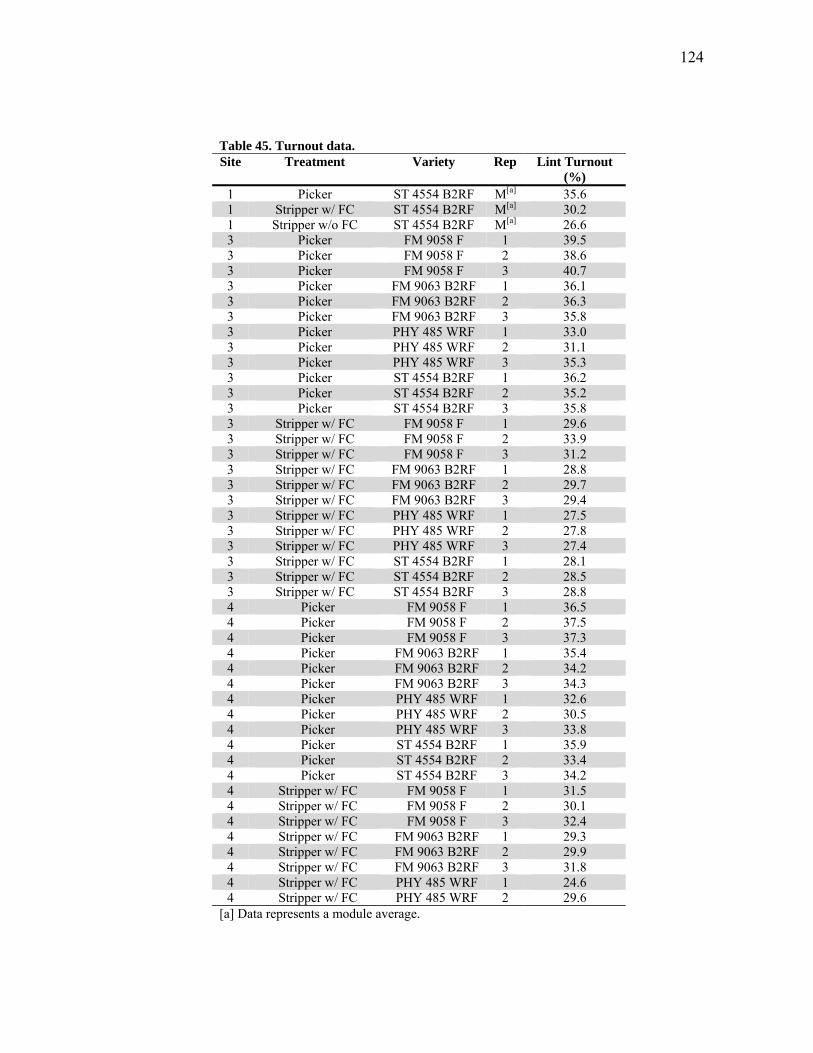
124
Table 45. Turnout data. Site Treatment Variety Rep Lint Turnout
(%) 1 Picker ST 4554 B2RF M[a] 35.6 1 Stripper w/ FC ST 4554 B2RF M[a] 30.2 1 Stripper w/o FC ST 4554 B2RF M[a] 26.6 3 Picker FM 9058 F 1 39.5 3 Picker FM 9058 F 2 38.6 3 Picker FM 9058 F 3 40.7 3 Picker FM 9063 B2RF 1 36.1 3 Picker FM 9063 B2RF 2 36.3 3 Picker FM 9063 B2RF 3 35.8 3 Picker PHY 485 WRF 1 33.0 3 Picker PHY 485 WRF 2 31.1 3 Picker PHY 485 WRF 3 35.3 3 Picker ST 4554 B2RF 1 36.2 3 Picker ST 4554 B2RF 2 35.2 3 Picker ST 4554 B2RF 3 35.8 3 Stripper w/ FC FM 9058 F 1 29.6 3 Stripper w/ FC FM 9058 F 2 33.9 3 Stripper w/ FC FM 9058 F 3 31.2 3 Stripper w/ FC FM 9063 B2RF 1 28.8 3 Stripper w/ FC FM 9063 B2RF 2 29.7 3 Stripper w/ FC FM 9063 B2RF 3 29.4 3 Stripper w/ FC PHY 485 WRF 1 27.5 3 Stripper w/ FC PHY 485 WRF 2 27.8 3 Stripper w/ FC PHY 485 WRF 3 27.4 3 Stripper w/ FC ST 4554 B2RF 1 28.1 3 Stripper w/ FC ST 4554 B2RF 2 28.5 3 Stripper w/ FC ST 4554 B2RF 3 28.8 4 Picker FM 9058 F 1 36.5 4 Picker FM 9058 F 2 37.5 4 Picker FM 9058 F 3 37.3 4 Picker FM 9063 B2RF 1 35.4 4 Picker FM 9063 B2RF 2 34.2 4 Picker FM 9063 B2RF 3 34.3 4 Picker PHY 485 WRF 1 32.6 4 Picker PHY 485 WRF 2 30.5 4 Picker PHY 485 WRF 3 33.8 4 Picker ST 4554 B2RF 1 35.9 4 Picker ST 4554 B2RF 2 33.4 4 Picker ST 4554 B2RF 3 34.2 4 Stripper w/ FC FM 9058 F 1 31.5 4 Stripper w/ FC FM 9058 F 2 30.1 4 Stripper w/ FC FM 9058 F 3 32.4 4 Stripper w/ FC FM 9063 B2RF 1 29.3 4 Stripper w/ FC FM 9063 B2RF 2 29.9 4 Stripper w/ FC FM 9063 B2RF 3 31.8 4 Stripper w/ FC PHY 485 WRF 1 24.6 4 Stripper w/ FC PHY 485 WRF 2 29.6
[a] Data represents a module average.

125
Table 45 Continued.Site Treatment Variety Rep Lint Turnout
(%) 4 Stripper w/ FC PHY 485 WRF 3 29.5 4 Stripper w/ FC ST 4554 B2RF 1 32.1 4 Stripper w/ FC ST 4554 B2RF 2 30.4 4 Stripper w/ FC ST 4554 B2RF 3 29.9

126
APPENDIX F
HVI ANALYSIS DATA
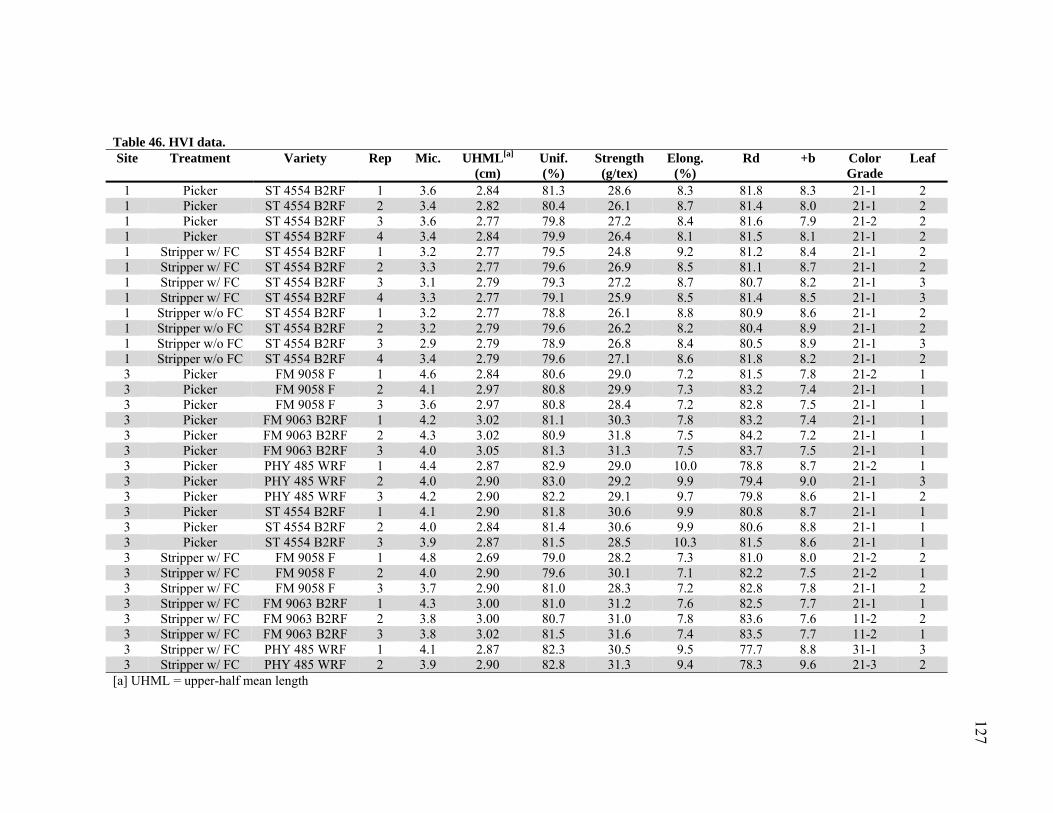
127
Table 46. HVI data. Site Treatment Variety Rep Mic. UHML[a]
(cm) Unif. (%)
Strength (g/tex)
Elong. (%)
Rd
+b Color Grade
Leaf
1 Picker ST 4554 B2RF 1 3.6 2.84 81.3 28.6 8.3 81.8 8.3 21-1 2 1 Picker ST 4554 B2RF 2 3.4 2.82 80.4 26.1 8.7 81.4 8.0 21-1 2 1 Picker ST 4554 B2RF 3 3.6 2.77 79.8 27.2 8.4 81.6 7.9 21-2 2 1 Picker ST 4554 B2RF 4 3.4 2.84 79.9 26.4 8.1 81.5 8.1 21-1 2 1 Stripper w/ FC ST 4554 B2RF 1 3.2 2.77 79.5 24.8 9.2 81.2 8.4 21-1 2 1 Stripper w/ FC ST 4554 B2RF 2 3.3 2.77 79.6 26.9 8.5 81.1 8.7 21-1 2 1 Stripper w/ FC ST 4554 B2RF 3 3.1 2.79 79.3 27.2 8.7 80.7 8.2 21-1 3 1 Stripper w/ FC ST 4554 B2RF 4 3.3 2.77 79.1 25.9 8.5 81.4 8.5 21-1 3 1 Stripper w/o FC ST 4554 B2RF 1 3.2 2.77 78.8 26.1 8.8 80.9 8.6 21-1 2 1 Stripper w/o FC ST 4554 B2RF 2 3.2 2.79 79.6 26.2 8.2 80.4 8.9 21-1 2 1 Stripper w/o FC ST 4554 B2RF 3 2.9 2.79 78.9 26.8 8.4 80.5 8.9 21-1 3 1 Stripper w/o FC ST 4554 B2RF 4 3.4 2.79 79.6 27.1 8.6 81.8 8.2 21-1 2 3 Picker FM 9058 F 1 4.6 2.84 80.6 29.0 7.2 81.5 7.8 21-2 1 3 Picker FM 9058 F 2 4.1 2.97 80.8 29.9 7.3 83.2 7.4 21-1 1 3 Picker FM 9058 F 3 3.6 2.97 80.8 28.4 7.2 82.8 7.5 21-1 1 3 Picker FM 9063 B2RF 1 4.2 3.02 81.1 30.3 7.8 83.2 7.4 21-1 1 3 Picker FM 9063 B2RF 2 4.3 3.02 80.9 31.8 7.5 84.2 7.2 21-1 1 3 Picker FM 9063 B2RF 3 4.0 3.05 81.3 31.3 7.5 83.7 7.5 21-1 1 3 Picker PHY 485 WRF 1 4.4 2.87 82.9 29.0 10.0 78.8 8.7 21-2 1 3 Picker PHY 485 WRF 2 4.0 2.90 83.0 29.2 9.9 79.4 9.0 21-1 3 3 Picker PHY 485 WRF 3 4.2 2.90 82.2 29.1 9.7 79.8 8.6 21-1 2 3 Picker ST 4554 B2RF 1 4.1 2.90 81.8 30.6 9.9 80.8 8.7 21-1 1 3 Picker ST 4554 B2RF 2 4.0 2.84 81.4 30.6 9.9 80.6 8.8 21-1 1 3 Picker ST 4554 B2RF 3 3.9 2.87 81.5 28.5 10.3 81.5 8.6 21-1 1 3 Stripper w/ FC FM 9058 F 1 4.8 2.69 79.0 28.2 7.3 81.0 8.0 21-2 2 3 Stripper w/ FC FM 9058 F 2 4.0 2.90 79.6 30.1 7.1 82.2 7.5 21-2 1 3 Stripper w/ FC FM 9058 F 3 3.7 2.90 81.0 28.3 7.2 82.8 7.8 21-1 2 3 Stripper w/ FC FM 9063 B2RF 1 4.3 3.00 81.0 31.2 7.6 82.5 7.7 21-1 1 3 Stripper w/ FC FM 9063 B2RF 2 3.8 3.00 80.7 31.0 7.8 83.6 7.6 11-2 2 3 Stripper w/ FC FM 9063 B2RF 3 3.8 3.02 81.5 31.6 7.4 83.5 7.7 11-2 1 3 Stripper w/ FC PHY 485 WRF 1 4.1 2.87 82.3 30.5 9.5 77.7 8.8 31-1 3 3 Stripper w/ FC PHY 485 WRF 2 3.9 2.90 82.8 31.3 9.4 78.3 9.6 21-3 2
[a] UHML = upper-half mean length
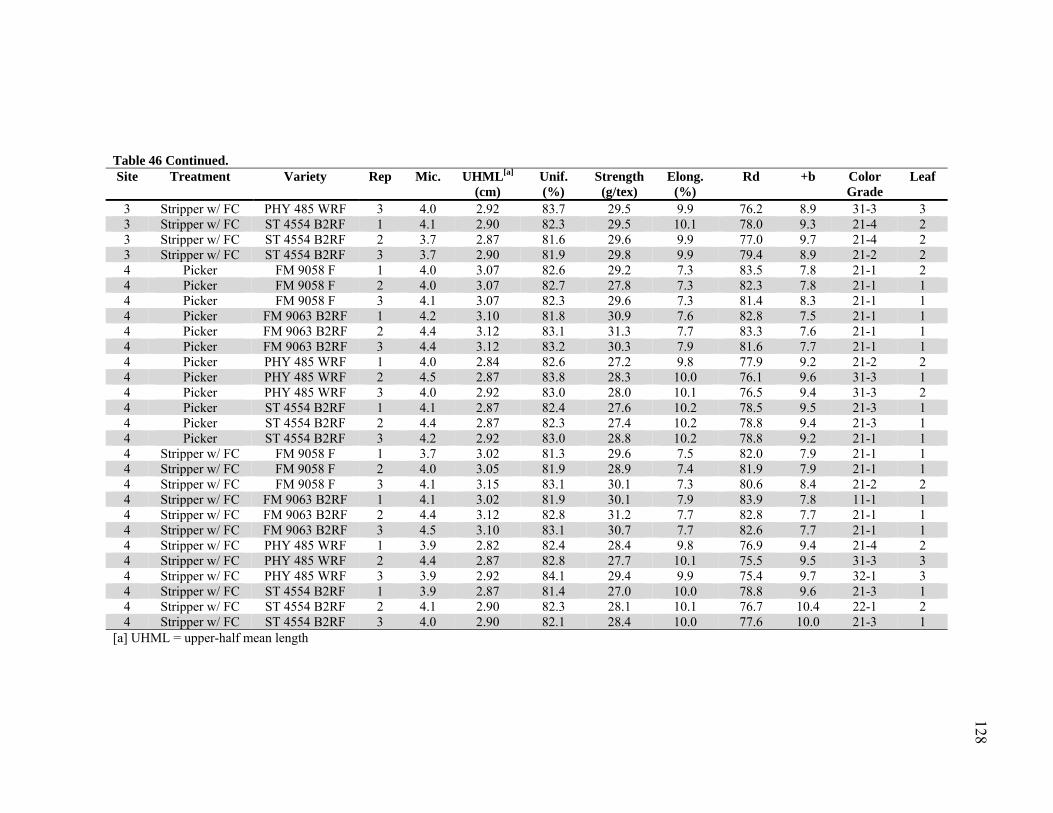
128
Table 46 Continued. Site Treatment Variety Rep Mic. UHML[a]
(cm) Unif. (%)
Strength (g/tex)
Elong. (%)
Rd
+b Color Grade
Leaf
3 Stripper w/ FC PHY 485 WRF 3 4.0 2.92 83.7 29.5 9.9 76.2 8.9 31-3 3 3 Stripper w/ FC ST 4554 B2RF 1 4.1 2.90 82.3 29.5 10.1 78.0 9.3 21-4 2 3 Stripper w/ FC ST 4554 B2RF 2 3.7 2.87 81.6 29.6 9.9 77.0 9.7 21-4 2 3 Stripper w/ FC ST 4554 B2RF 3 3.7 2.90 81.9 29.8 9.9 79.4 8.9 21-2 2 4 Picker FM 9058 F 1 4.0 3.07 82.6 29.2 7.3 83.5 7.8 21-1 2 4 Picker FM 9058 F 2 4.0 3.07 82.7 27.8 7.3 82.3 7.8 21-1 1 4 Picker FM 9058 F 3 4.1 3.07 82.3 29.6 7.3 81.4 8.3 21-1 1 4 Picker FM 9063 B2RF 1 4.2 3.10 81.8 30.9 7.6 82.8 7.5 21-1 1 4 Picker FM 9063 B2RF 2 4.4 3.12 83.1 31.3 7.7 83.3 7.6 21-1 1 4 Picker FM 9063 B2RF 3 4.4 3.12 83.2 30.3 7.9 81.6 7.7 21-1 1 4 Picker PHY 485 WRF 1 4.0 2.84 82.6 27.2 9.8 77.9 9.2 21-2 2 4 Picker PHY 485 WRF 2 4.5 2.87 83.8 28.3 10.0 76.1 9.6 31-3 1 4 Picker PHY 485 WRF 3 4.0 2.92 83.0 28.0 10.1 76.5 9.4 31-3 2 4 Picker ST 4554 B2RF 1 4.1 2.87 82.4 27.6 10.2 78.5 9.5 21-3 1 4 Picker ST 4554 B2RF 2 4.4 2.87 82.3 27.4 10.2 78.8 9.4 21-3 1 4 Picker ST 4554 B2RF 3 4.2 2.92 83.0 28.8 10.2 78.8 9.2 21-1 1 4 Stripper w/ FC FM 9058 F 1 3.7 3.02 81.3 29.6 7.5 82.0 7.9 21-1 1 4 Stripper w/ FC FM 9058 F 2 4.0 3.05 81.9 28.9 7.4 81.9 7.9 21-1 1 4 Stripper w/ FC FM 9058 F 3 4.1 3.15 83.1 30.1 7.3 80.6 8.4 21-2 2 4 Stripper w/ FC FM 9063 B2RF 1 4.1 3.02 81.9 30.1 7.9 83.9 7.8 11-1 1 4 Stripper w/ FC FM 9063 B2RF 2 4.4 3.12 82.8 31.2 7.7 82.8 7.7 21-1 1 4 Stripper w/ FC FM 9063 B2RF 3 4.5 3.10 83.1 30.7 7.7 82.6 7.7 21-1 1 4 Stripper w/ FC PHY 485 WRF 1 3.9 2.82 82.4 28.4 9.8 76.9 9.4 21-4 2 4 Stripper w/ FC PHY 485 WRF 2 4.4 2.87 82.8 27.7 10.1 75.5 9.5 31-3 3 4 Stripper w/ FC PHY 485 WRF 3 3.9 2.92 84.1 29.4 9.9 75.4 9.7 32-1 3 4 Stripper w/ FC ST 4554 B2RF 1 3.9 2.87 81.4 27.0 10.0 78.8 9.6 21-3 1 4 Stripper w/ FC ST 4554 B2RF 2 4.1 2.90 82.3 28.1 10.1 76.7 10.4 22-1 2 4 Stripper w/ FC ST 4554 B2RF 3 4.0 2.90 82.1 28.4 10.0 77.6 10.0 21-3 1
[a] UHML = upper-half mean length

129
APPENDIX G
AFIS ANALYSIS DATA
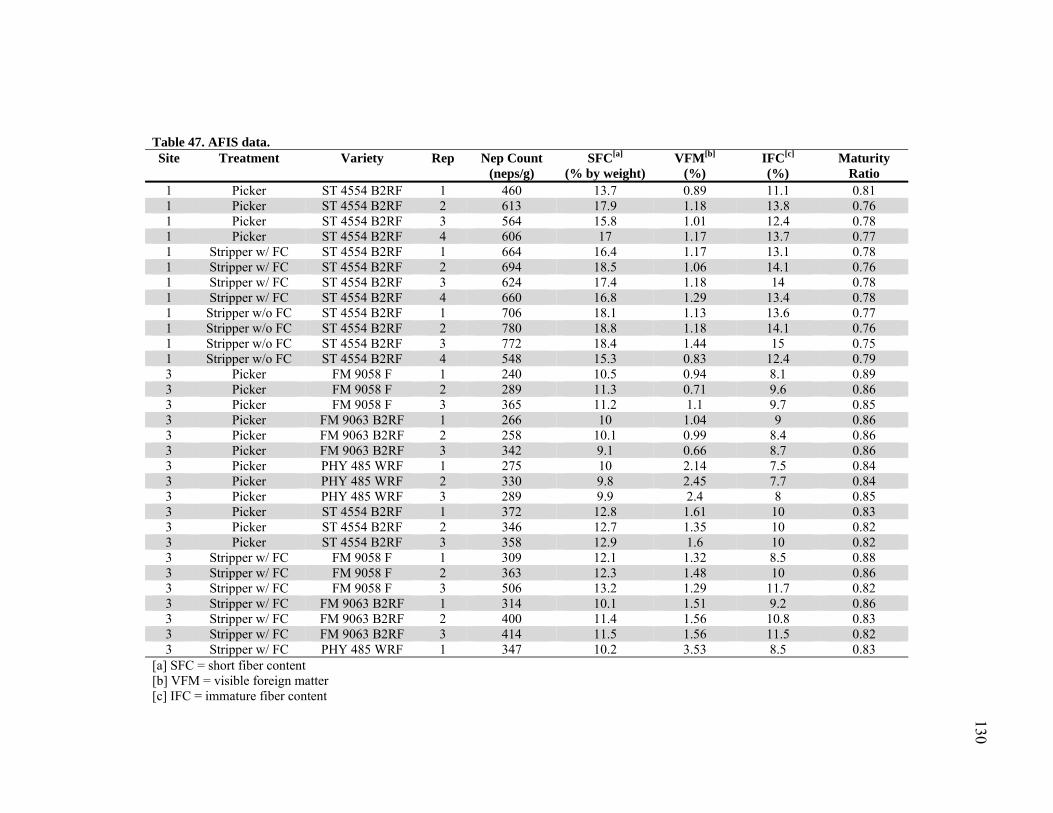
130
Table 47. AFIS data. Site Treatment Variety Rep Nep Count
(neps/g) SFC[a]
(% by weight) VFM[b]
(%) IFC[c] (%)
Maturity Ratio
1 Picker ST 4554 B2RF 1 460 13.7 0.89 11.1 0.81 1 Picker ST 4554 B2RF 2 613 17.9 1.18 13.8 0.76 1 Picker ST 4554 B2RF 3 564 15.8 1.01 12.4 0.78 1 Picker ST 4554 B2RF 4 606 17 1.17 13.7 0.77 1 Stripper w/ FC ST 4554 B2RF 1 664 16.4 1.17 13.1 0.78 1 Stripper w/ FC ST 4554 B2RF 2 694 18.5 1.06 14.1 0.76 1 Stripper w/ FC ST 4554 B2RF 3 624 17.4 1.18 14 0.78 1 Stripper w/ FC ST 4554 B2RF 4 660 16.8 1.29 13.4 0.78 1 Stripper w/o FC ST 4554 B2RF 1 706 18.1 1.13 13.6 0.77 1 Stripper w/o FC ST 4554 B2RF 2 780 18.8 1.18 14.1 0.76 1 Stripper w/o FC ST 4554 B2RF 3 772 18.4 1.44 15 0.75 1 Stripper w/o FC ST 4554 B2RF 4 548 15.3 0.83 12.4 0.79 3 Picker FM 9058 F 1 240 10.5 0.94 8.1 0.89 3 Picker FM 9058 F 2 289 11.3 0.71 9.6 0.86 3 Picker FM 9058 F 3 365 11.2 1.1 9.7 0.85 3 Picker FM 9063 B2RF 1 266 10 1.04 9 0.86 3 Picker FM 9063 B2RF 2 258 10.1 0.99 8.4 0.86 3 Picker FM 9063 B2RF 3 342 9.1 0.66 8.7 0.86 3 Picker PHY 485 WRF 1 275 10 2.14 7.5 0.84 3 Picker PHY 485 WRF 2 330 9.8 2.45 7.7 0.84 3 Picker PHY 485 WRF 3 289 9.9 2.4 8 0.85 3 Picker ST 4554 B2RF 1 372 12.8 1.61 10 0.83 3 Picker ST 4554 B2RF 2 346 12.7 1.35 10 0.82 3 Picker ST 4554 B2RF 3 358 12.9 1.6 10 0.82 3 Stripper w/ FC FM 9058 F 1 309 12.1 1.32 8.5 0.88 3 Stripper w/ FC FM 9058 F 2 363 12.3 1.48 10 0.86 3 Stripper w/ FC FM 9058 F 3 506 13.2 1.29 11.7 0.82 3 Stripper w/ FC FM 9063 B2RF 1 314 10.1 1.51 9.2 0.86 3 Stripper w/ FC FM 9063 B2RF 2 400 11.4 1.56 10.8 0.83 3 Stripper w/ FC FM 9063 B2RF 3 414 11.5 1.56 11.5 0.82 3 Stripper w/ FC PHY 485 WRF 1 347 10.2 3.53 8.5 0.83
[a] SFC = short fiber content [b] VFM = visible foreign matter [c] IFC = immature fiber content
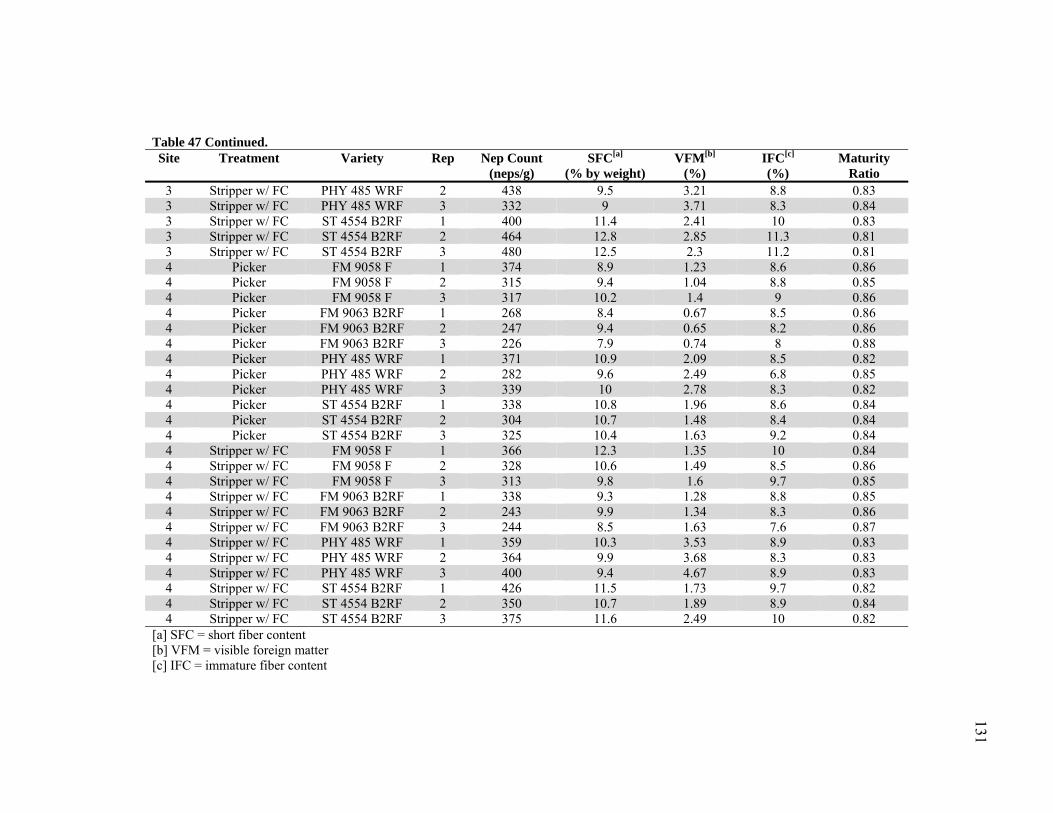
131
Table 47 Continued. Site Treatment Variety Rep Nep Count
(neps/g) SFC[a]
(% by weight) VFM[b]
(%) IFC[c] (%)
Maturity Ratio
3 Stripper w/ FC PHY 485 WRF 2 438 9.5 3.21 8.8 0.83 3 Stripper w/ FC PHY 485 WRF 3 332 9 3.71 8.3 0.84 3 Stripper w/ FC ST 4554 B2RF 1 400 11.4 2.41 10 0.83 3 Stripper w/ FC ST 4554 B2RF 2 464 12.8 2.85 11.3 0.81 3 Stripper w/ FC ST 4554 B2RF 3 480 12.5 2.3 11.2 0.81 4 Picker FM 9058 F 1 374 8.9 1.23 8.6 0.86 4 Picker FM 9058 F 2 315 9.4 1.04 8.8 0.85 4 Picker FM 9058 F 3 317 10.2 1.4 9 0.86 4 Picker FM 9063 B2RF 1 268 8.4 0.67 8.5 0.86 4 Picker FM 9063 B2RF 2 247 9.4 0.65 8.2 0.86 4 Picker FM 9063 B2RF 3 226 7.9 0.74 8 0.88 4 Picker PHY 485 WRF 1 371 10.9 2.09 8.5 0.82 4 Picker PHY 485 WRF 2 282 9.6 2.49 6.8 0.85 4 Picker PHY 485 WRF 3 339 10 2.78 8.3 0.82 4 Picker ST 4554 B2RF 1 338 10.8 1.96 8.6 0.84 4 Picker ST 4554 B2RF 2 304 10.7 1.48 8.4 0.84 4 Picker ST 4554 B2RF 3 325 10.4 1.63 9.2 0.84 4 Stripper w/ FC FM 9058 F 1 366 12.3 1.35 10 0.84 4 Stripper w/ FC FM 9058 F 2 328 10.6 1.49 8.5 0.86 4 Stripper w/ FC FM 9058 F 3 313 9.8 1.6 9.7 0.85 4 Stripper w/ FC FM 9063 B2RF 1 338 9.3 1.28 8.8 0.85 4 Stripper w/ FC FM 9063 B2RF 2 243 9.9 1.34 8.3 0.86 4 Stripper w/ FC FM 9063 B2RF 3 244 8.5 1.63 7.6 0.87 4 Stripper w/ FC PHY 485 WRF 1 359 10.3 3.53 8.9 0.83 4 Stripper w/ FC PHY 485 WRF 2 364 9.9 3.68 8.3 0.83 4 Stripper w/ FC PHY 485 WRF 3 400 9.4 4.67 8.9 0.83 4 Stripper w/ FC ST 4554 B2RF 1 426 11.5 1.73 9.7 0.82 4 Stripper w/ FC ST 4554 B2RF 2 350 10.7 1.89 8.9 0.84 4 Stripper w/ FC ST 4554 B2RF 3 375 11.6 2.49 10 0.82
[a] SFC = short fiber content [b] VFM = visible foreign matter [c] IFC = immature fiber content
132
APPENDIX H
CARDED YARN DATA
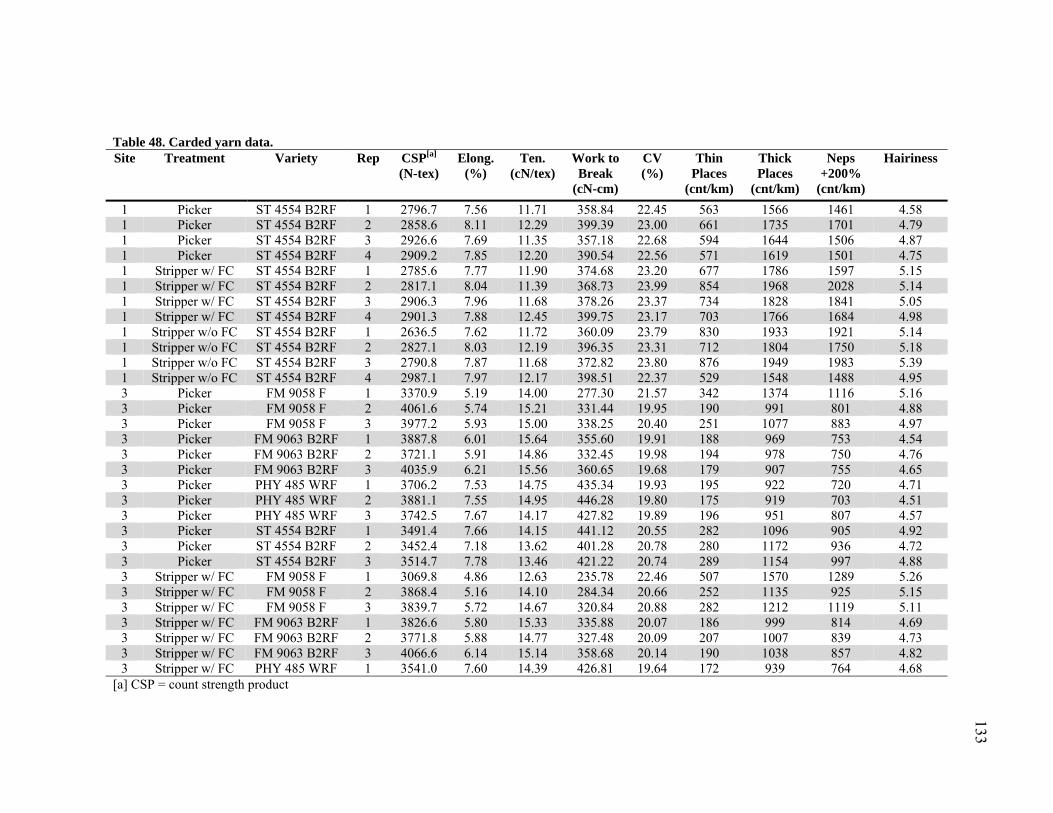
133
Table 48. Carded yarn data. Site Treatment Variety Rep CSP[a]
(N-tex) Elong.
(%) Ten.
(cN/tex) Work to Break
(cN-cm)
CV (%)
Thin Places
(cnt/km)
Thick Places
(cnt/km)
Neps +200%
(cnt/km)
Hairiness
1 Picker ST 4554 B2RF 1 2796.7 7.56 11.71 358.84 22.45 563 1566 1461 4.58 1 Picker ST 4554 B2RF 2 2858.6 8.11 12.29 399.39 23.00 661 1735 1701 4.79 1 Picker ST 4554 B2RF 3 2926.6 7.69 11.35 357.18 22.68 594 1644 1506 4.87 1 Picker ST 4554 B2RF 4 2909.2 7.85 12.20 390.54 22.56 571 1619 1501 4.75 1 Stripper w/ FC ST 4554 B2RF 1 2785.6 7.77 11.90 374.68 23.20 677 1786 1597 5.15 1 Stripper w/ FC ST 4554 B2RF 2 2817.1 8.04 11.39 368.73 23.99 854 1968 2028 5.14 1 Stripper w/ FC ST 4554 B2RF 3 2906.3 7.96 11.68 378.26 23.37 734 1828 1841 5.05 1 Stripper w/ FC ST 4554 B2RF 4 2901.3 7.88 12.45 399.75 23.17 703 1766 1684 4.98 1 Stripper w/o FC ST 4554 B2RF 1 2636.5 7.62 11.72 360.09 23.79 830 1933 1921 5.14 1 Stripper w/o FC ST 4554 B2RF 2 2827.1 8.03 12.19 396.35 23.31 712 1804 1750 5.18 1 Stripper w/o FC ST 4554 B2RF 3 2790.8 7.87 11.68 372.82 23.80 876 1949 1983 5.39 1 Stripper w/o FC ST 4554 B2RF 4 2987.1 7.97 12.17 398.51 22.37 529 1548 1488 4.95 3 Picker FM 9058 F 1 3370.9 5.19 14.00 277.30 21.57 342 1374 1116 5.16 3 Picker FM 9058 F 2 4061.6 5.74 15.21 331.44 19.95 190 991 801 4.88 3 Picker FM 9058 F 3 3977.2 5.93 15.00 338.25 20.40 251 1077 883 4.97 3 Picker FM 9063 B2RF 1 3887.8 6.01 15.64 355.60 19.91 188 969 753 4.54 3 Picker FM 9063 B2RF 2 3721.1 5.91 14.86 332.45 19.98 194 978 750 4.76 3 Picker FM 9063 B2RF 3 4035.9 6.21 15.56 360.65 19.68 179 907 755 4.65 3 Picker PHY 485 WRF 1 3706.2 7.53 14.75 435.34 19.93 195 922 720 4.71 3 Picker PHY 485 WRF 2 3881.1 7.55 14.95 446.28 19.80 175 919 703 4.51 3 Picker PHY 485 WRF 3 3742.5 7.67 14.17 427.82 19.89 196 951 807 4.57 3 Picker ST 4554 B2RF 1 3491.4 7.66 14.15 441.12 20.55 282 1096 905 4.92 3 Picker ST 4554 B2RF 2 3452.4 7.18 13.62 401.28 20.78 280 1172 936 4.72 3 Picker ST 4554 B2RF 3 3514.7 7.78 13.46 421.22 20.74 289 1154 997 4.88 3 Stripper w/ FC FM 9058 F 1 3069.8 4.86 12.63 235.78 22.46 507 1570 1289 5.26 3 Stripper w/ FC FM 9058 F 2 3868.4 5.16 14.10 284.34 20.66 252 1135 925 5.15 3 Stripper w/ FC FM 9058 F 3 3839.7 5.72 14.67 320.84 20.88 282 1212 1119 5.11 3 Stripper w/ FC FM 9063 B2RF 1 3826.6 5.80 15.33 335.88 20.07 186 999 814 4.69 3 Stripper w/ FC FM 9063 B2RF 2 3771.8 5.88 14.77 327.48 20.09 207 1007 839 4.73 3 Stripper w/ FC FM 9063 B2RF 3 4066.6 6.14 15.14 358.68 20.14 190 1038 857 4.82 3 Stripper w/ FC PHY 485 WRF 1 3541.0 7.60 14.39 426.81 19.64 172 939 764 4.68
[a] CSP = count strength product
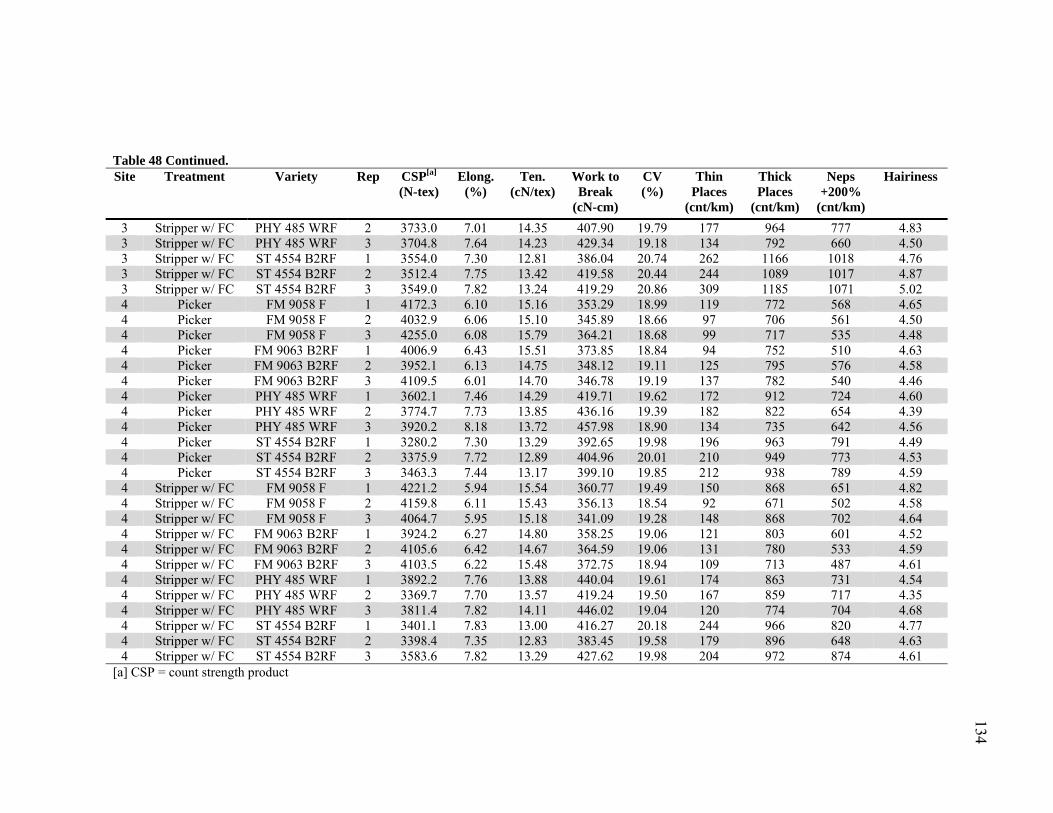
134
Table 48 Continued. Site Treatment Variety Rep CSP[a]
(N-tex) Elong.
(%) Ten.
(cN/tex) Work to Break
(cN-cm)
CV (%)
Thin Places
(cnt/km)
Thick Places
(cnt/km)
Neps +200%
(cnt/km)
Hairiness
3 Stripper w/ FC PHY 485 WRF 2 3733.0 7.01 14.35 407.90 19.79 177 964 777 4.83 3 Stripper w/ FC PHY 485 WRF 3 3704.8 7.64 14.23 429.34 19.18 134 792 660 4.50 3 Stripper w/ FC ST 4554 B2RF 1 3554.0 7.30 12.81 386.04 20.74 262 1166 1018 4.76 3 Stripper w/ FC ST 4554 B2RF 2 3512.4 7.75 13.42 419.58 20.44 244 1089 1017 4.87 3 Stripper w/ FC ST 4554 B2RF 3 3549.0 7.82 13.24 419.29 20.86 309 1185 1071 5.02 4 Picker FM 9058 F 1 4172.3 6.10 15.16 353.29 18.99 119 772 568 4.65 4 Picker FM 9058 F 2 4032.9 6.06 15.10 345.89 18.66 97 706 561 4.50 4 Picker FM 9058 F 3 4255.0 6.08 15.79 364.21 18.68 99 717 535 4.48 4 Picker FM 9063 B2RF 1 4006.9 6.43 15.51 373.85 18.84 94 752 510 4.63 4 Picker FM 9063 B2RF 2 3952.1 6.13 14.75 348.12 19.11 125 795 576 4.58 4 Picker FM 9063 B2RF 3 4109.5 6.01 14.70 346.78 19.19 137 782 540 4.46 4 Picker PHY 485 WRF 1 3602.1 7.46 14.29 419.71 19.62 172 912 724 4.60 4 Picker PHY 485 WRF 2 3774.7 7.73 13.85 436.16 19.39 182 822 654 4.39 4 Picker PHY 485 WRF 3 3920.2 8.18 13.72 457.98 18.90 134 735 642 4.56 4 Picker ST 4554 B2RF 1 3280.2 7.30 13.29 392.65 19.98 196 963 791 4.49 4 Picker ST 4554 B2RF 2 3375.9 7.72 12.89 404.96 20.01 210 949 773 4.53 4 Picker ST 4554 B2RF 3 3463.3 7.44 13.17 399.10 19.85 212 938 789 4.59 4 Stripper w/ FC FM 9058 F 1 4221.2 5.94 15.54 360.77 19.49 150 868 651 4.82 4 Stripper w/ FC FM 9058 F 2 4159.8 6.11 15.43 356.13 18.54 92 671 502 4.58 4 Stripper w/ FC FM 9058 F 3 4064.7 5.95 15.18 341.09 19.28 148 868 702 4.64 4 Stripper w/ FC FM 9063 B2RF 1 3924.2 6.27 14.80 358.25 19.06 121 803 601 4.52 4 Stripper w/ FC FM 9063 B2RF 2 4105.6 6.42 14.67 364.59 19.06 131 780 533 4.59 4 Stripper w/ FC FM 9063 B2RF 3 4103.5 6.22 15.48 372.75 18.94 109 713 487 4.61 4 Stripper w/ FC PHY 485 WRF 1 3892.2 7.76 13.88 440.04 19.61 174 863 731 4.54 4 Stripper w/ FC PHY 485 WRF 2 3369.7 7.70 13.57 419.24 19.50 167 859 717 4.35 4 Stripper w/ FC PHY 485 WRF 3 3811.4 7.82 14.11 446.02 19.04 120 774 704 4.68 4 Stripper w/ FC ST 4554 B2RF 1 3401.1 7.83 13.00 416.27 20.18 244 966 820 4.77 4 Stripper w/ FC ST 4554 B2RF 2 3398.4 7.35 12.83 383.45 19.58 179 896 648 4.63 4 Stripper w/ FC ST 4554 B2RF 3 3583.6 7.82 13.29 427.62 19.98 204 972 874 4.61
[a] CSP = count strength product

135
APPENDIX I
CARDED-AND-COMBED YARN DATA
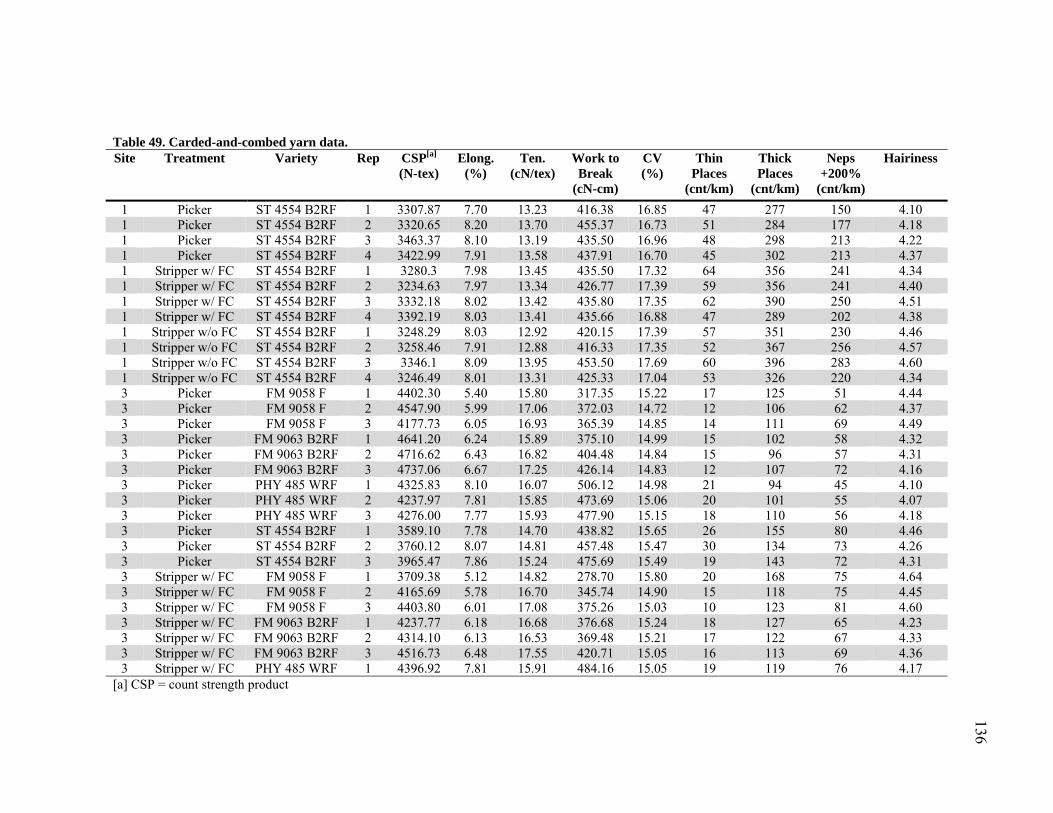
136
Table 49. Carded-and-combed yarn data. Site Treatment Variety Rep CSP[a]
(N-tex) Elong.
(%) Ten.
(cN/tex) Work to Break
(cN-cm)
CV (%)
Thin Places
(cnt/km)
Thick Places
(cnt/km)
Neps +200%
(cnt/km)
Hairiness
1 Picker ST 4554 B2RF 1 3307.87 7.70 13.23 416.38 16.85 47 277 150 4.10 1 Picker ST 4554 B2RF 2 3320.65 8.20 13.70 455.37 16.73 51 284 177 4.18 1 Picker ST 4554 B2RF 3 3463.37 8.10 13.19 435.50 16.96 48 298 213 4.22 1 Picker ST 4554 B2RF 4 3422.99 7.91 13.58 437.91 16.70 45 302 213 4.37 1 Stripper w/ FC ST 4554 B2RF 1 3280.3 7.98 13.45 435.50 17.32 64 356 241 4.34 1 Stripper w/ FC ST 4554 B2RF 2 3234.63 7.97 13.34 426.77 17.39 59 356 241 4.40 1 Stripper w/ FC ST 4554 B2RF 3 3332.18 8.02 13.42 435.80 17.35 62 390 250 4.51 1 Stripper w/ FC ST 4554 B2RF 4 3392.19 8.03 13.41 435.66 16.88 47 289 202 4.38 1 Stripper w/o FC ST 4554 B2RF 1 3248.29 8.03 12.92 420.15 17.39 57 351 230 4.46 1 Stripper w/o FC ST 4554 B2RF 2 3258.46 7.91 12.88 416.33 17.35 52 367 256 4.57 1 Stripper w/o FC ST 4554 B2RF 3 3346.1 8.09 13.95 453.50 17.69 60 396 283 4.60 1 Stripper w/o FC ST 4554 B2RF 4 3246.49 8.01 13.31 425.33 17.04 53 326 220 4.34 3 Picker FM 9058 F 1 4402.30 5.40 15.80 317.35 15.22 17 125 51 4.44 3 Picker FM 9058 F 2 4547.90 5.99 17.06 372.03 14.72 12 106 62 4.37 3 Picker FM 9058 F 3 4177.73 6.05 16.93 365.39 14.85 14 111 69 4.49 3 Picker FM 9063 B2RF 1 4641.20 6.24 15.89 375.10 14.99 15 102 58 4.32 3 Picker FM 9063 B2RF 2 4716.62 6.43 16.82 404.48 14.84 15 96 57 4.31 3 Picker FM 9063 B2RF 3 4737.06 6.67 17.25 426.14 14.83 12 107 72 4.16 3 Picker PHY 485 WRF 1 4325.83 8.10 16.07 506.12 14.98 21 94 45 4.10 3 Picker PHY 485 WRF 2 4237.97 7.81 15.85 473.69 15.06 20 101 55 4.07 3 Picker PHY 485 WRF 3 4276.00 7.77 15.93 477.90 15.15 18 110 56 4.18 3 Picker ST 4554 B2RF 1 3589.10 7.78 14.70 438.82 15.65 26 155 80 4.46 3 Picker ST 4554 B2RF 2 3760.12 8.07 14.81 457.48 15.47 30 134 73 4.26 3 Picker ST 4554 B2RF 3 3965.47 7.86 15.24 475.69 15.49 19 143 72 4.31 3 Stripper w/ FC FM 9058 F 1 3709.38 5.12 14.82 278.70 15.80 20 168 75 4.64 3 Stripper w/ FC FM 9058 F 2 4165.69 5.78 16.70 345.74 14.90 15 118 75 4.45 3 Stripper w/ FC FM 9058 F 3 4403.80 6.01 17.08 375.26 15.03 10 123 81 4.60 3 Stripper w/ FC FM 9063 B2RF 1 4237.77 6.18 16.68 376.68 15.24 18 127 65 4.23 3 Stripper w/ FC FM 9063 B2RF 2 4314.10 6.13 16.53 369.48 15.21 17 122 67 4.33 3 Stripper w/ FC FM 9063 B2RF 3 4516.73 6.48 17.55 420.71 15.05 16 113 69 4.36 3 Stripper w/ FC PHY 485 WRF 1 4396.92 7.81 15.91 484.16 15.05 19 119 76 4.17
[a] CSP = count strength product
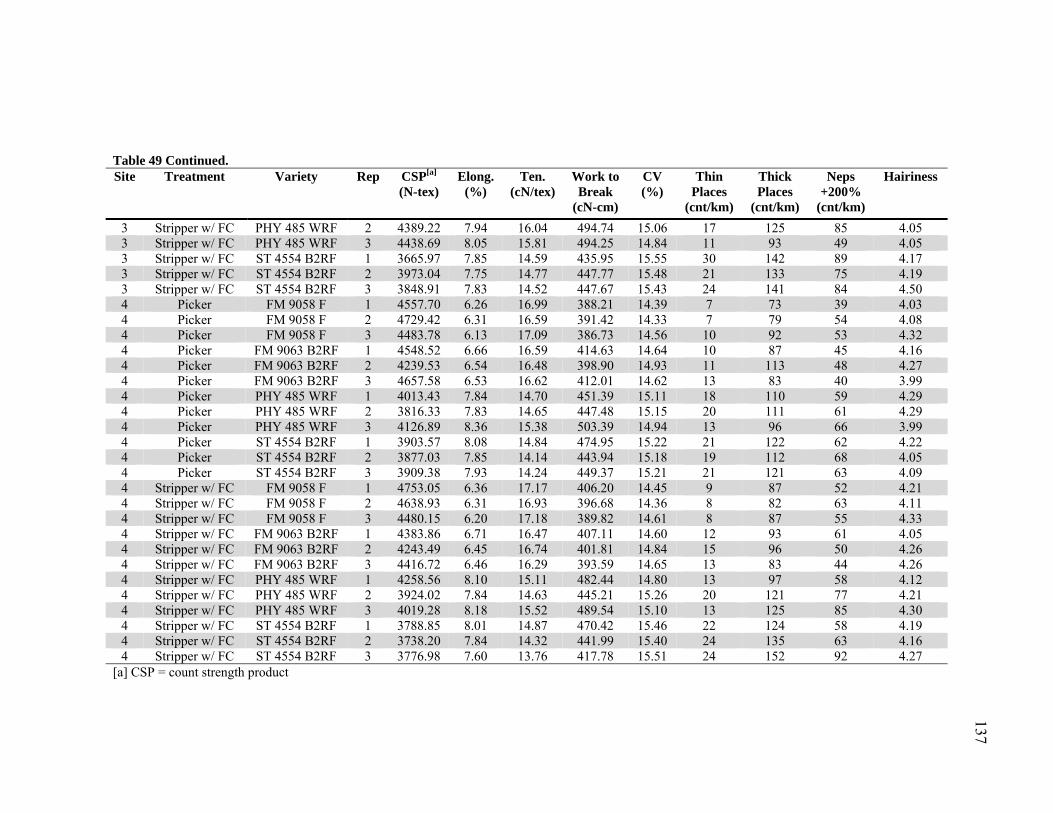
137
Table 49 Continued. Site Treatment Variety Rep CSP[a]
(N-tex) Elong.
(%) Ten.
(cN/tex) Work to Break
(cN-cm)
CV (%)
Thin Places
(cnt/km)
Thick Places
(cnt/km)
Neps +200%
(cnt/km)
Hairiness
3 Stripper w/ FC PHY 485 WRF 2 4389.22 7.94 16.04 494.74 15.06 17 125 85 4.05 3 Stripper w/ FC PHY 485 WRF 3 4438.69 8.05 15.81 494.25 14.84 11 93 49 4.05 3 Stripper w/ FC ST 4554 B2RF 1 3665.97 7.85 14.59 435.95 15.55 30 142 89 4.17 3 Stripper w/ FC ST 4554 B2RF 2 3973.04 7.75 14.77 447.77 15.48 21 133 75 4.19 3 Stripper w/ FC ST 4554 B2RF 3 3848.91 7.83 14.52 447.67 15.43 24 141 84 4.50 4 Picker FM 9058 F 1 4557.70 6.26 16.99 388.21 14.39 7 73 39 4.03 4 Picker FM 9058 F 2 4729.42 6.31 16.59 391.42 14.33 7 79 54 4.08 4 Picker FM 9058 F 3 4483.78 6.13 17.09 386.73 14.56 10 92 53 4.32 4 Picker FM 9063 B2RF 1 4548.52 6.66 16.59 414.63 14.64 10 87 45 4.16 4 Picker FM 9063 B2RF 2 4239.53 6.54 16.48 398.90 14.93 11 113 48 4.27 4 Picker FM 9063 B2RF 3 4657.58 6.53 16.62 412.01 14.62 13 83 40 3.99 4 Picker PHY 485 WRF 1 4013.43 7.84 14.70 451.39 15.11 18 110 59 4.29 4 Picker PHY 485 WRF 2 3816.33 7.83 14.65 447.48 15.15 20 111 61 4.29 4 Picker PHY 485 WRF 3 4126.89 8.36 15.38 503.39 14.94 13 96 66 3.99 4 Picker ST 4554 B2RF 1 3903.57 8.08 14.84 474.95 15.22 21 122 62 4.22 4 Picker ST 4554 B2RF 2 3877.03 7.85 14.14 443.94 15.18 19 112 68 4.05 4 Picker ST 4554 B2RF 3 3909.38 7.93 14.24 449.37 15.21 21 121 63 4.09 4 Stripper w/ FC FM 9058 F 1 4753.05 6.36 17.17 406.20 14.45 9 87 52 4.21 4 Stripper w/ FC FM 9058 F 2 4638.93 6.31 16.93 396.68 14.36 8 82 63 4.11 4 Stripper w/ FC FM 9058 F 3 4480.15 6.20 17.18 389.82 14.61 8 87 55 4.33 4 Stripper w/ FC FM 9063 B2RF 1 4383.86 6.71 16.47 407.11 14.60 12 93 61 4.05 4 Stripper w/ FC FM 9063 B2RF 2 4243.49 6.45 16.74 401.81 14.84 15 96 50 4.26 4 Stripper w/ FC FM 9063 B2RF 3 4416.72 6.46 16.29 393.59 14.65 13 83 44 4.26 4 Stripper w/ FC PHY 485 WRF 1 4258.56 8.10 15.11 482.44 14.80 13 97 58 4.12 4 Stripper w/ FC PHY 485 WRF 2 3924.02 7.84 14.63 445.21 15.26 20 121 77 4.21 4 Stripper w/ FC PHY 485 WRF 3 4019.28 8.18 15.52 489.54 15.10 13 125 85 4.30 4 Stripper w/ FC ST 4554 B2RF 1 3788.85 8.01 14.87 470.42 15.46 22 124 58 4.19 4 Stripper w/ FC ST 4554 B2RF 2 3738.20 7.84 14.32 441.99 15.40 24 135 63 4.16 4 Stripper w/ FC ST 4554 B2RF 3 3776.98 7.60 13.76 417.78 15.51 24 152 92 4.27
[a] CSP = count strength product

138
APPENDIX J
GLOSSARY
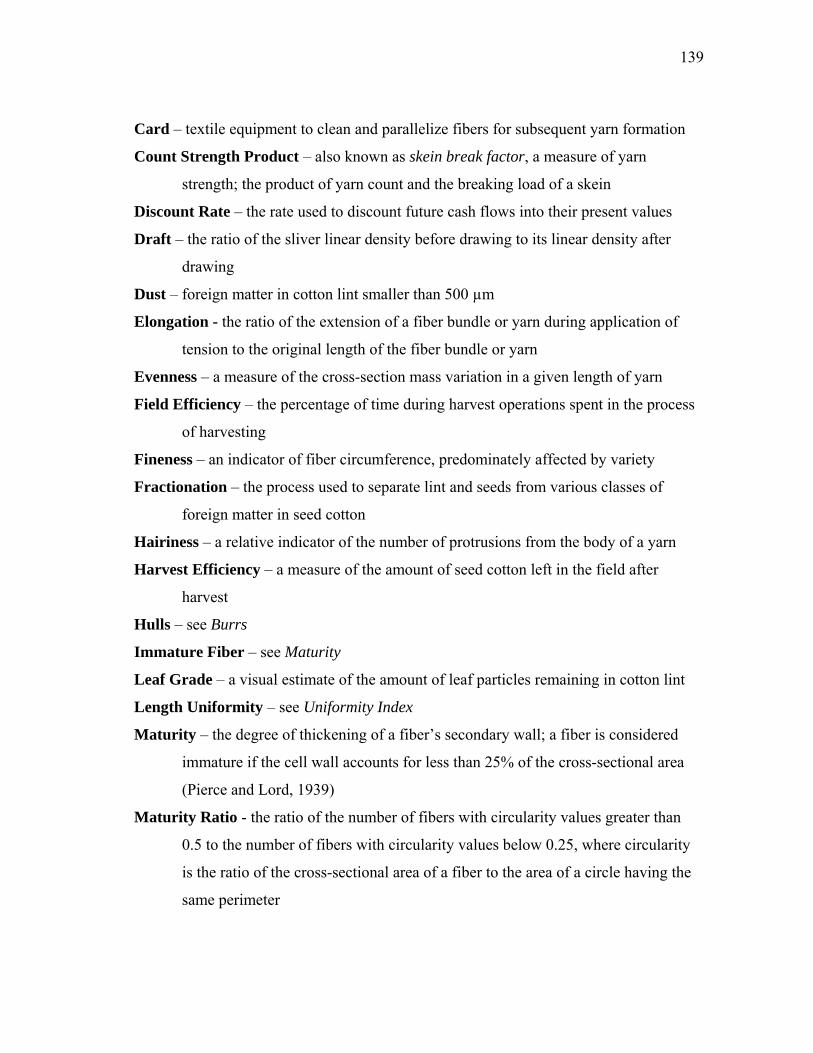
139
Card – textile equipment to clean and parallelize fibers for subsequent yarn formation
Count Strength Product – also known as skein break factor, a measure of yarn
strength; the product of yarn count and the breaking load of a skein
Discount Rate – the rate used to discount future cash flows into their present values
Draft – the ratio of the sliver linear density before drawing to its linear density after
drawing
Dust – foreign matter in cotton lint smaller than 500 µm
Elongation - the ratio of the extension of a fiber bundle or yarn during application of
tension to the original length of the fiber bundle or yarn
Evenness – a measure of the cross-section mass variation in a given length of yarn
Field Efficiency – the percentage of time during harvest operations spent in the process
of harvesting
Fineness – an indicator of fiber circumference, predominately affected by variety
Fractionation – the process used to separate lint and seeds from various classes of
foreign matter in seed cotton
Hairiness – a relative indicator of the number of protrusions from the body of a yarn
Harvest Efficiency – a measure of the amount of seed cotton left in the field after
harvest
Hulls – see Burrs
Immature Fiber – see Maturity
Leaf Grade – a visual estimate of the amount of leaf particles remaining in cotton lint
Length Uniformity – see Uniformity Index
Maturity – the degree of thickening of a fiber’s secondary wall; a fiber is considered
immature if the cell wall accounts for less than 25% of the cross-sectional area
(Pierce and Lord, 1939)
Maturity Ratio - the ratio of the number of fibers with circularity values greater than
0.5 to the number of fibers with circularity values below 0.25, where circularity
is the ratio of the cross-sectional area of a fiber to the area of a circle having the
same perimeter
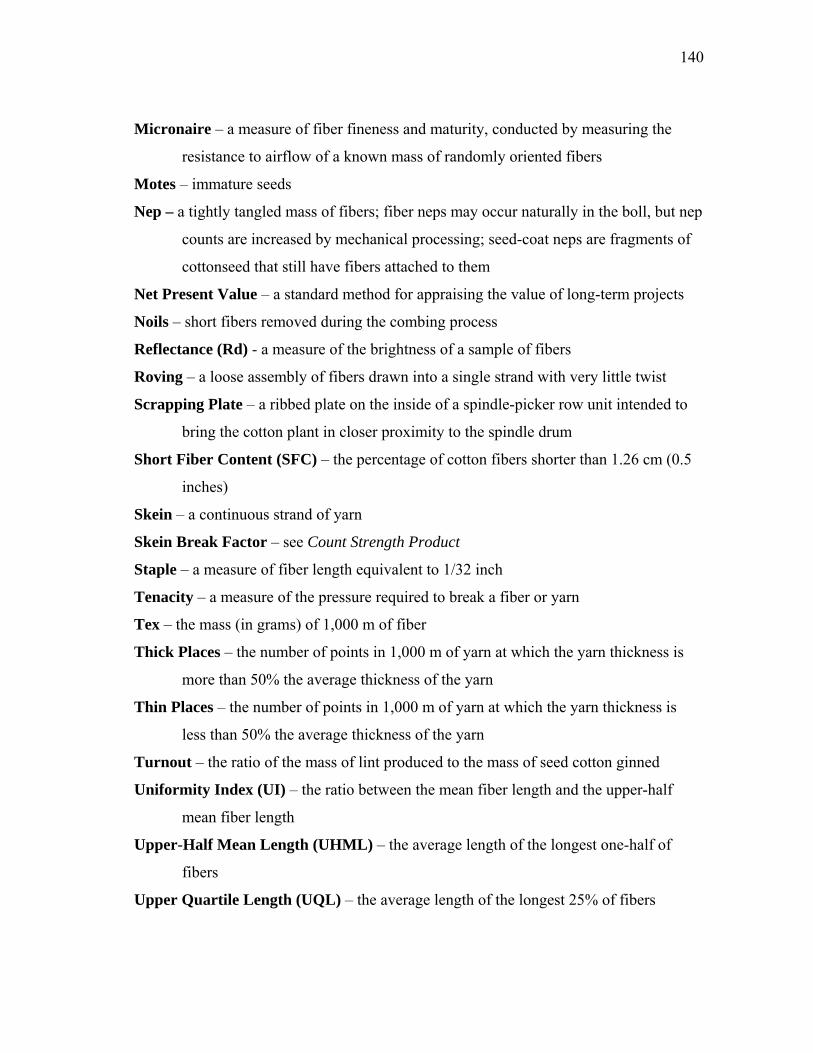
140
Micronaire – a measure of fiber fineness and maturity, conducted by measuring the
resistance to airflow of a known mass of randomly oriented fibers
Motes – immature seeds
Nep – a tightly tangled mass of fibers; fiber neps may occur naturally in the boll, but nep
counts are increased by mechanical processing; seed-coat neps are fragments of
cottonseed that still have fibers attached to them
Net Present Value – a standard method for appraising the value of long-term projects
Noils – short fibers removed during the combing process
Reflectance (Rd) - a measure of the brightness of a sample of fibers
Roving – a loose assembly of fibers drawn into a single strand with very little twist
Scrapping Plate – a ribbed plate on the inside of a spindle-picker row unit intended to
bring the cotton plant in closer proximity to the spindle drum
Short Fiber Content (SFC) – the percentage of cotton fibers shorter than 1.26 cm (0.5
inches)
Skein – a continuous strand of yarn
Skein Break Factor – see Count Strength Product
Staple – a measure of fiber length equivalent to 1/32 inch
Tenacity – a measure of the pressure required to break a fiber or yarn
Tex – the mass (in grams) of 1,000 m of fiber
Thick Places – the number of points in 1,000 m of yarn at which the yarn thickness is
more than 50% the average thickness of the yarn
Thin Places – the number of points in 1,000 m of yarn at which the yarn thickness is
less than 50% the average thickness of the yarn
Turnout – the ratio of the mass of lint produced to the mass of seed cotton ginned
Uniformity Index (UI) – the ratio between the mean fiber length and the upper-half
mean fiber length
Upper-Half Mean Length (UHML) – the average length of the longest one-half of
fibers
Upper Quartile Length (UQL) – the average length of the longest 25% of fibers

141
Yarn Count (Ne) – a measure of the linear density of yarn; the number of 840 yard
skeins that can be made from a one pound hank of yarn
Yellowness (+b) – a measure of the degree of color pigmentation of cotton fibers
142
VITA
William Brock Faulkner 201 Scoates Hall MS 2117 TAMU
College Station, Texas 77843-2117 EDUCATION Doctor of Philosophy in Biological and Agricultural Engineering Texas A&M University (August 2008) Master of Science in Biological and Agricultural Engineering Texas A&M University (May 2006) Bachelor of Science in Agricultural Engineering; Minor in Agronomy Texas A&M University (May 2004) HONORS National Science Foundation Graduate Research Fellow Texas A&M University Regents Fellow PUBLICATIONS Faulkner, W.B., B.W. Shaw, and T. Grosch. 2008. Sensitivity of two dispersion models
(AERMOD and ISCST3) to input parameters for a rural ground level area source. Journal of the Air and Waste Management Association (in press).
Faulkner, W.B., M.D. Buser, D.P. Whitelock, and B.W. Shaw. 2008. Effects of cyclone diameter on performance of 1D3D cyclones: cut point and slope. Transactions of the ASABE 51(1): 287-292.
Faulkner, W.B. and B.W. Shaw. 2008. Review of ammonia emission factors for United States animal agriculture. Atmospheric Environment (in press).
Faulkner, W.B., J.J. Powell, J.M. Lange, B.W. Shaw, R.E. Lacey, and C.B. Parnell. 2007. Comparison of dispersion models for ammonia emissions from a ground level area source. Transactions of the ASABE 50(6): 2189-2197.
Faulkner, W.B., J.M. Lange, J.J. Powell, B.W. Shaw, and C.B. Parnell. 2007. Sampler placement to determine emission factors from ground level area sources. Atmospheric Environment 41(35): 7672-7678.
Faulkner, W.B., M.D. Buser, D.P. Whitelock, and B.W. Shaw. 2007. Effects of cyclone diameter on performance of 1D3D cyclones: collection efficiency. Transactions of the ASABE 50(3): 1053-1059.
Faulkner, W.B., B.W. Shaw, and R.E. Lacey. 2007. Coarse fraction aerosol particles: theoretical analysis of rural versus urban environments. Applied Engineering in Agriculture 23(2): 239-244.
Faulkner, W.B. and B.W. Shaw. 2006. Efficiency and pressure drop of cyclones across a range of inlet velocities. Applied Engineering in Agriculture 22(1): 155-161.