Embed Size (px)
Citation preview
WORKSHOP 10
Comparison of
RBE2 vs. RBE3
MSC.Nastran 105 Exercise Workbook 10-1
100 lb
Objectives
■ Demonstrate the difference between two rigid body elements.
■ Run a linear static analysis.
■ Create a deformation plot of the model.
■ Review the results.

10-2 MSC.Nastran 105 Excercise Workbook
WORKSHOP 10 RBE2 vs. RBE3
MSC.Nastran 105 Exercise Workbook 10-3
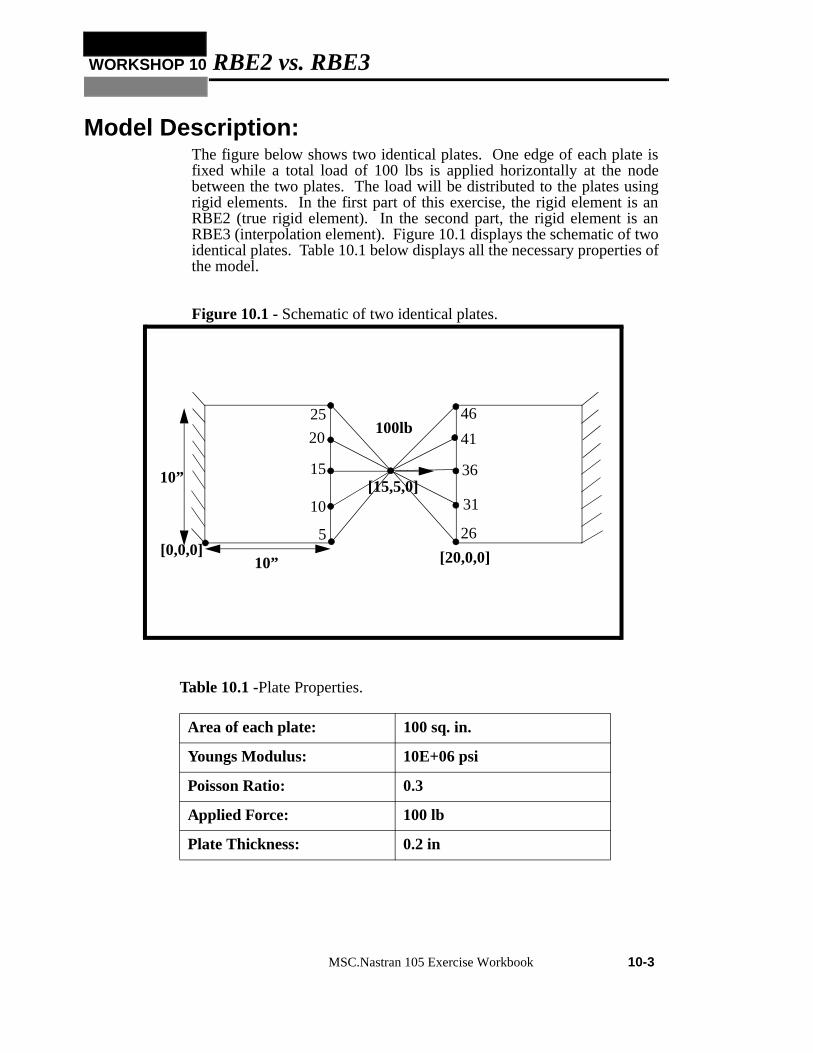
Model Description:The figure below shows two identical plates. One edge of each plate isfixed while a total load of 100 lbs is applied horizontally at the nodebetween the two plates. The load will be distributed to the plates usingrigid elements. In the first part of this exercise, the rigid element is anRBE2 (true rigid element). In the second part, the rigid element is anRBE3 (interpolation element). Figure 10.1 displays the schematic of twoidentical plates. Table 10.1 below displays all the necessary properties ofthe model.
Figure 10.1 - Schematic of two identical plates.
Table 10.1 -Plate Properties.
Area of each plate: 100 sq. in.
Youngs Modulus: 10E+06 psi
Poisson Ratio: 0.3
Applied Force: 100 lb
Plate Thickness: 0.2 in
10”[0,0,0] [20,0,0]
100lb25
20
15
10
5 26
31
36
41
46
10”[15,5,0]
10-4 MSC.Nastran 105 Excercise Workbook
Suggested Exercise Steps
■ Explicitly generate a finite element representation of the plate models (i.e., the nodes (GRID) and element connectivities (QUAD4)).
(Note: Mesh w/ global edge length of 2.5)
■ Define load application point (GRID 1000 located at [15,5,0]).
■ Define material (MAT 1) and element (PSHELL) properties.
■ Apply the fixed boundary constraints (SPC 1) at two extreme (left and right) edges.
■ Apply concentrated force of 100 lbs (FORCE) at +x direction.
■ Define RBE2 as interface.
■ Prepare the model for a linear static analysis (SOL 101).
■ Generate an input file and submit it to the MSC.Nastran solver for linear static analysis.
■ Review the results.

WORKSHOP 10 RBE2 vs. RBE3
MSC.Nastran 105 Exercise Workbook 10-5
ID SEMINAR,PROB10______________________________________________________________________________________________________________________________________________________________________________________________________________________________________________________________________________________________________________________________________________________________________________________________________________________________________________________________________________
CEND________________________________________________________________________________________________________________________________________________________________________________________________________________________________________________________________________________________________________________________________________________________________________________________________________________________________________________________________________________________________________________________________________________________________________________________________________________________________________________________________________________________________________________________________________________________________________________________________________________________________________________________________________________________________________________________________________________________________________________________________________________________________________________________________________________________________________________________________________________________________________________________________________________________________________________________________________________________________________________________________________________________________________________________________________________________________________________________________________________________________________________________________________________________________________________________________________________________________________________________________________________________

10-6 MSC.Nastran 105 Excercise Workbook
BEGIN BULK
1 2 3 4 5 6 7 8 9 10
ENDDATA

WORKSHOP 10 RBE2 vs. RBE3
MSC.Nastran 105 Exercise Workbook 10-7
1 2 3 4 5 6 7 8 9 10

10-8 MSC.Nastran 105 Excercise Workbook
1 2 3 4 5 6 7 8 9 10
ENDDATA

WORKSHOP 10 RBE2 vs. RBE3
MSC.Nastran 105 Exercise Workbook 10-9
■ Generating an input file for MSC.Nastran Users:
MSC.Nastran users can generate an input file using the data from Table10a. The result should be similar to the output below.
1. MSC.Nastran input file: Prob10a.dat
SOL 101CENDECHO = NONESUBCASE 1 SPC = 1 LOAD = 1 DISPLACEMENT=ALL SPCFORCES=ALL MPCFORCE=ALLBEGIN BULKPARAM POST -1$ PSHELL 1 1 .2 1 1$ CQUAD4 1 1 1 2 7 6CQUAD4 2 1 2 3 8 7CQUAD4 3 1 3 4 9 8CQUAD4 4 1 4 5 10 9CQUAD4 5 1 6 7 12 11CQUAD4 6 1 7 8 13 12CQUAD4 7 1 8 9 14 13CQUAD4 8 1 9 10 15 14CQUAD4 9 1 11 12 17 16CQUAD4 10 1 12 13 18 17CQUAD4 11 1 13 14 19 18CQUAD4 12 1 14 15 20 19CQUAD4 13 1 16 17 22 21CQUAD4 14 1 17 18 23 22CQUAD4 15 1 18 19 24 23CQUAD4 16 1 19 20 25 24CQUAD4 17 1 26 27 32 31CQUAD4 18 1 27 28 33 32CQUAD4 19 1 28 29 34 33CQUAD4 20 1 29 30 35 34CQUAD4 21 1 31 32 37 36CQUAD4 22 1 32 33 38 37CQUAD4 23 1 33 34 39 38CQUAD4 24 1 34 35 40 39CQUAD4 25 1 36 37 42 41CQUAD4 26 1 37 38 43 42CQUAD4 27 1 38 39 44 43CQUAD4 28 1 39 40 45 44CQUAD4 29 1 41 42 47 46CQUAD4 30 1 42 43 48 47CQUAD4 31 1 43 44 49 48CQUAD4 32 1 44 45 50 49
10-10 MSC.Nastran 105 Excercise Workbook
$ MAT1 1 1.+7 .3$ RBE2 33 1000 123456 5 10 15 20 25 + A+ A 26 31 36 41 46$ GRID 1 0. 0. 0.GRID 2 2.5 0. 0.GRID 3 5. 0. 0.GRID 4 7.5 0. 0.GRID 5 10. 0. 0.GRID 6 0. 2.5 0.GRID 7 2.5 2.5 0.GRID 8 5. 2.5 0.GRID 9 7.5 2.5 0.GRID 10 10. 2.5 0.GRID 11 0. 5. 0.GRID 12 2.5 5. 0.GRID 13 5. 5. 0.GRID 14 7.5 5. 0.GRID 15 10. 5. 0.GRID 16 0. 7.5 0.GRID 17 2.5 7.5 0.GRID 18 5. 7.5 0.GRID 19 7.5 7.5 0.GRID 20 10. 7.5 0.GRID 21 0. 10. 0.GRID 22 2.5 10. 0.GRID 23 5. 10. 0.GRID 24 7.5 10. 0.GRID 25 10. 10. 0.GRID 26 20. 0. 0.GRID 27 22.5 0. 0.GRID 28 25. 0. 0.GRID 29 27.5 0. 0.GRID 30 30. 0. 0.GRID 31 20. 2.5 0.GRID 32 22.5 2.5 0.GRID 33 25. 2.5 0.GRID 34 27.5 2.5 0.GRID 35 30. 2.5 0.GRID 36 20. 5. 0.GRID 37 22.5 5. 0.GRID 38 25. 5. 0.GRID 39 27.5 5. 0.GRID 40 30. 5. 0.GRID 41 20. 7.5 0.GRID 42 22.5 7.5 0.GRID 43 25. 7.5 0.GRID 44 27.5 7.5 0.GRID 45 30. 7.5 0.GRID 46 20. 10. 0.GRID 47 22.5 10. 0.GRID 48 25. 10. 0.GRID 49 27.5 10. 0.GRID 50 30. 10. 0.

WORKSHOP 10 RBE2 vs. RBE3
MSC.Nastran 105 Exercise Workbook 10-11
GRID 1000 15. 5. 0.$ SPC1 1 123456 1 6 11 16 21 30 + B+ B 35 40 45 50$ FORCE 1 1000 0 100. 1. 0. 0.$ ENDDATA

10-12 MSC.Nastran 105 Excercise Workbook
Figure 10.2 - Deformed plot for Case 1.
The nodal results read from the F06 are as follows:
MPC Forces Displacement
Node T1 T2 T1 T2
25 7.27 2.02 2.42e5 0
20 11.90 1.03 2.42e5 0
15 11.66 0 2.42e5 0
10 11.90 -1.03 2.42e5 0
5 7.27 -2.02 2.42e5 0
46 7.27 -2.02 2.42e5 0
41 11.90 -1.03 2.42e5 0
36 11.66 0 2.42e5 0
31 11.90 1.03 2.42e5 0
26 7.27 2.02 2.42e5 0

WORKSHOP 10 RBE2 vs. RBE3
MSC.Nastran 105 Exercise Workbook 10-13
■ Replace the RBE2 w/ RBE3 using coefficient of 1 for all Independent nodes.
MSC.Nastran users can generate an input file using the data from Table10b. The result should be similar to the output below.
2. MSC.Nastran input file: 10b.dat
SOL 101CENDECHO = NONE SPC = 1 LOAD = 1 DISPLACEMENT=ALL SPCFORCES=ALL MPCFORCE=ALLBEGIN BULKPARAM POST -1$ PSHELL 1 1 .2 1 1$ CQUAD4 1 1 1 2 7 6CQUAD4 2 1 2 3 8 7CQUAD4 3 1 3 4 9 8CQUAD4 4 1 4 5 10 9CQUAD4 5 1 6 7 12 11CQUAD4 6 1 7 8 13 12CQUAD4 7 1 8 9 14 13CQUAD4 8 1 9 10 15 14CQUAD4 9 1 11 12 17 16CQUAD4 10 1 12 13 18 17CQUAD4 11 1 13 14 19 18CQUAD4 12 1 14 15 20 19CQUAD4 13 1 16 17 22 21CQUAD4 14 1 17 18 23 22CQUAD4 15 1 18 19 24 23CQUAD4 16 1 19 20 25 24CQUAD4 17 1 26 27 32 31CQUAD4 18 1 27 28 33 32CQUAD4 19 1 28 29 34 33CQUAD4 20 1 29 30 35 34CQUAD4 21 1 31 32 37 36CQUAD4 22 1 32 33 38 37CQUAD4 23 1 33 34 39 38CQUAD4 24 1 34 35 40 39CQUAD4 25 1 36 37 42 41CQUAD4 26 1 37 38 43 42CQUAD4 27 1 38 39 44 43CQUAD4 28 1 39 40 45 44CQUAD4 29 1 41 42 47 46CQUAD4 30 1 42 43 48 47CQUAD4 31 1 43 44 49 48CQUAD4 32 1 44 45 50 49

10-14 MSC.Nastran 105 Excercise Workbook
$ MAT1 1 1.+7 .3$RBE3 33 1000 123456 1. 123456 5 10 + A+ A 15 20 25 26 31 36 41 46$ GRID 1 0. 0. 0.GRID 2 2.5 0. 0.GRID 3 5. 0. 0.GRID 4 7.5 0. 0.GRID 5 10. 0. 0.GRID 6 0. 2.5 0.GRID 7 2.5 2.5 0.GRID 8 5. 2.5 0.GRID 9 7.5 2.5 0.GRID 10 10. 2.5 0.GRID 11 0. 5. 0.GRID 12 2.5 5. 0.GRID 13 5. 5. 0.GRID 14 7.5 5. 0.GRID 15 10. 5. 0.GRID 16 0. 7.5 0.GRID 17 2.5 7.5 0.GRID 18 5. 7.5 0.GRID 19 7.5 7.5 0.GRID 20 10. 7.5 0.GRID 21 0. 10. 0.GRID 22 2.5 10. 0.GRID 23 5. 10. 0.GRID 24 7.5 10. 0.GRID 25 10. 10. 0.GRID 26 20. 0. 0.GRID 27 22.5 0. 0.GRID 28 25. 0. 0.GRID 29 27.5 0. 0.GRID 30 30. 0. 0.GRID 31 20. 2.5 0.GRID 32 22.5 2.5 0.GRID 33 25. 2.5 0.GRID 34 27.5 2.5 0.GRID 35 30. 2.5 0.GRID 36 20. 5. 0.GRID 37 22.5 5. 0.GRID 38 25. 5. 0.GRID 39 27.5 5. 0.GRID 40 30. 5. 0.GRID 41 20. 7.5 0.GRID 42 22.5 7.5 0.GRID 43 25. 7.5 0.GRID 44 27.5 7.5 0.GRID 45 30. 7.5 0.GRID 46 20. 10. 0.GRID 47 22.5 10. 0.GRID 48 25. 10. 0.GRID 49 27.5 10. 0.GRID 50 30. 10. 0.

WORKSHOP 10 RBE2 vs. RBE3
MSC.Nastran 105 Exercise Workbook 10-15
GRID 1000 15. 5. 0.$ SPC1 1 123456 1 6 11 16 21 30 + B+ B 35 40 45 50$ FORCE 1 1000 0 100. 1. 0. 0.$ ENDDATA
10-16 MSC.Nastran 105 Excercise Workbook
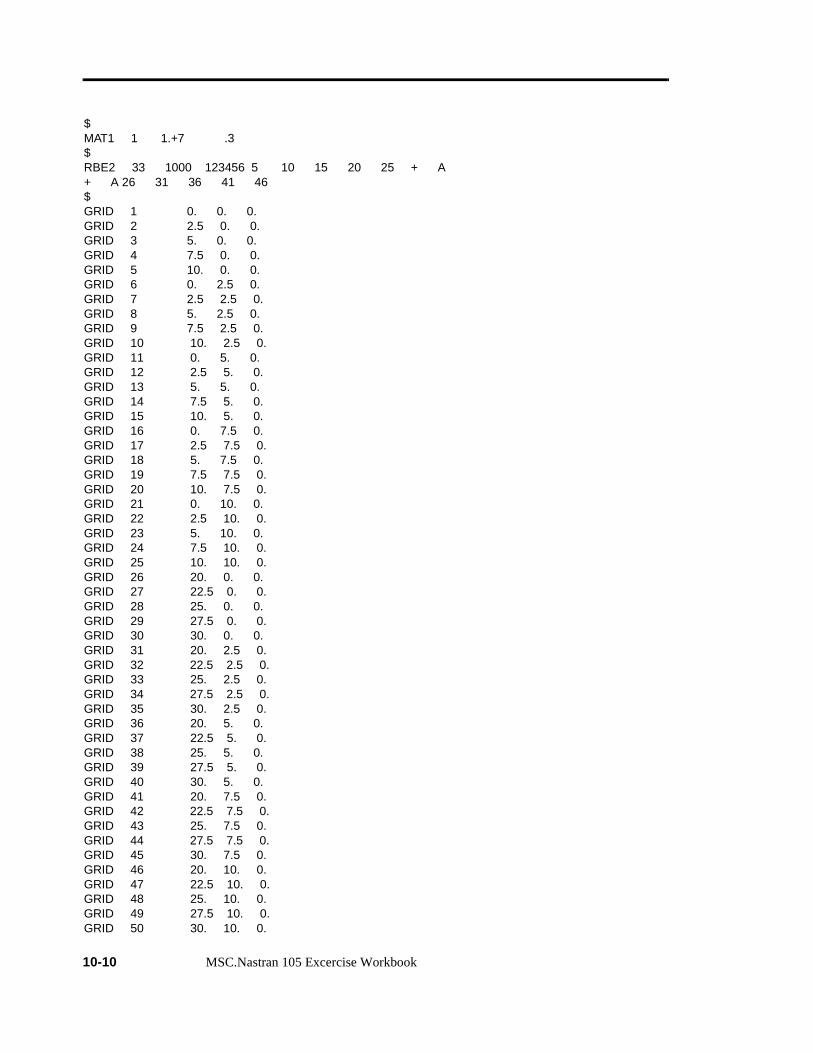
Figure 10.3 - Deformed plot for Case 2.
The nodal results read from the F06 are as follows:
MPC Forces Displacement
Node T1 T2 T1 T2
25 10 0 3.23e-5 -8.11e-6
20 10 0 2.23e-5 -4.14e-5
15 10 0 2.17e-5 0
10 10 0 2.23e-5 4.14e-6
5 10 0 3.23e-5 8.11e-6
46 10 0 3.23e-5 8.11e-6
41 10 0 2.23e-5 4.14e-5
36 10 0 2.17e-5 0
31 10 0 2.23e-5 -4.14e-6
26 10 0 3.23e-5 -8.11e-6
WORKSHOP 10 RBE2 vs. RBE3
MSC.Nastran 105 Exercise Workbook 10-17
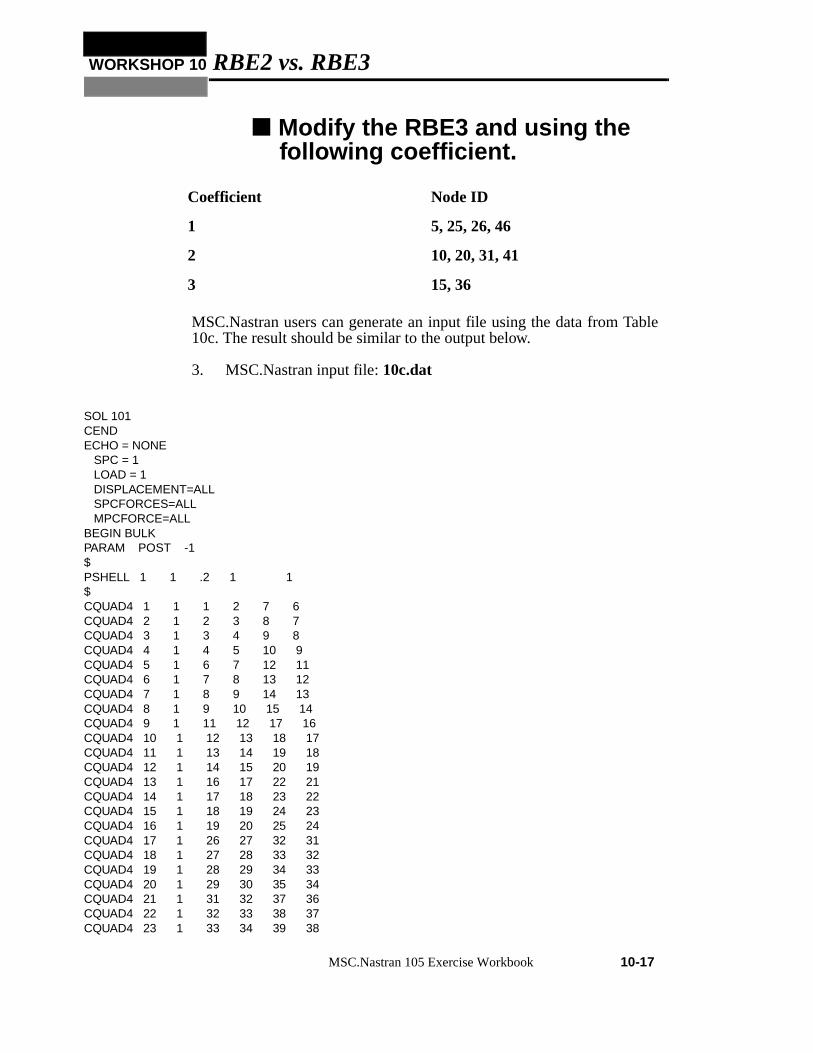
■ Modify the RBE3 and using the following coefficient.
MSC.Nastran users can generate an input file using the data from Table10c. The result should be similar to the output below.
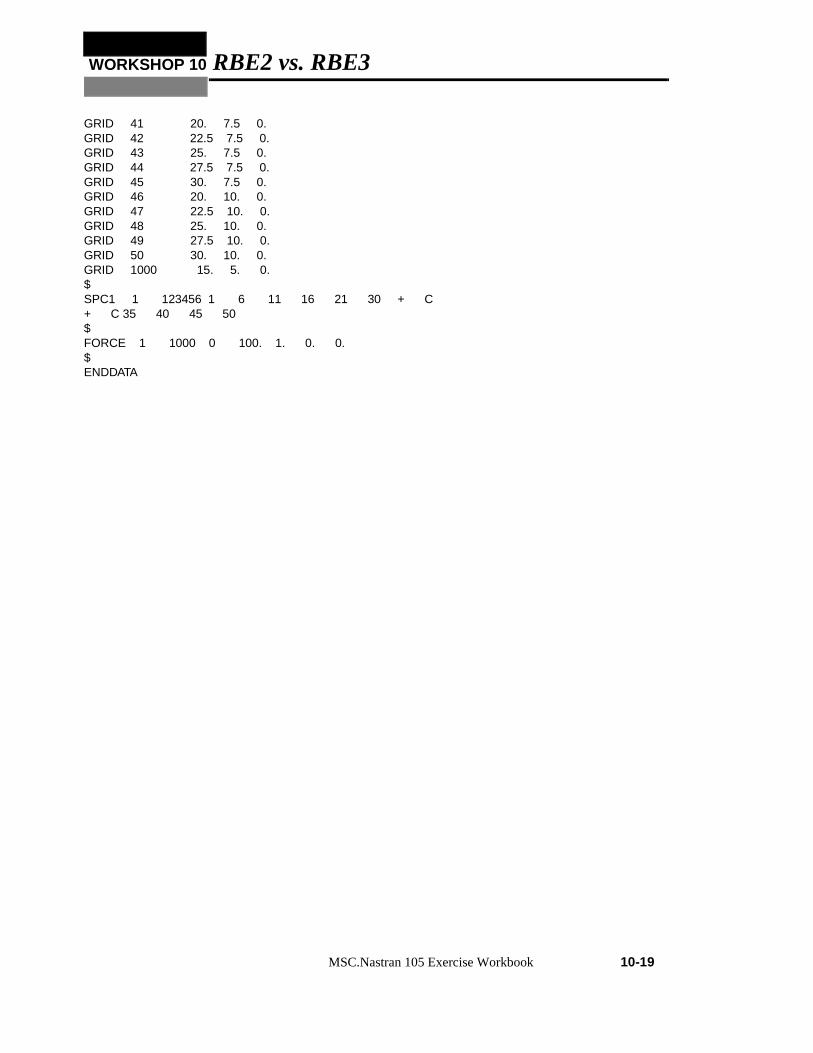
3. MSC.Nastran input file: 10c.dat
SOL 101CENDECHO = NONE SPC = 1 LOAD = 1 DISPLACEMENT=ALL SPCFORCES=ALL MPCFORCE=ALLBEGIN BULKPARAM POST -1$ PSHELL 1 1 .2 1 1$ CQUAD4 1 1 1 2 7 6CQUAD4 2 1 2 3 8 7CQUAD4 3 1 3 4 9 8CQUAD4 4 1 4 5 10 9CQUAD4 5 1 6 7 12 11CQUAD4 6 1 7 8 13 12CQUAD4 7 1 8 9 14 13CQUAD4 8 1 9 10 15 14CQUAD4 9 1 11 12 17 16CQUAD4 10 1 12 13 18 17CQUAD4 11 1 13 14 19 18CQUAD4 12 1 14 15 20 19CQUAD4 13 1 16 17 22 21CQUAD4 14 1 17 18 23 22CQUAD4 15 1 18 19 24 23CQUAD4 16 1 19 20 25 24CQUAD4 17 1 26 27 32 31CQUAD4 18 1 27 28 33 32CQUAD4 19 1 28 29 34 33CQUAD4 20 1 29 30 35 34CQUAD4 21 1 31 32 37 36CQUAD4 22 1 32 33 38 37CQUAD4 23 1 33 34 39 38
Coefficient Node ID
1 5, 25, 26, 46
2 10, 20, 31, 41
3 15, 36

10-18 MSC.Nastran 105 Excercise Workbook
CQUAD4 24 1 34 35 40 39CQUAD4 25 1 36 37 42 41CQUAD4 26 1 37 38 43 42CQUAD4 27 1 38 39 44 43CQUAD4 28 1 39 40 45 44CQUAD4 29 1 41 42 47 46CQUAD4 30 1 42 43 48 47CQUAD4 31 1 43 44 49 48CQUAD4 32 1 44 45 50 49$ MAT1 1 1.+7 .3$ RBE3 33 1000 123456 3. 123456 15 36 + A+ A 2. 123456 10 20 31 41 1. 123456 + B+ B 5 25 26 46$ GRID 1 0. 0. 0.GRID 2 2.5 0. 0.GRID 3 5. 0. 0.GRID 4 7.5 0. 0.GRID 5 10. 0. 0.GRID 6 0. 2.5 0.GRID 7 2.5 2.5 0.GRID 8 5. 2.5 0.GRID 9 7.5 2.5 0.GRID 10 10. 2.5 0.GRID 11 0. 5. 0.GRID 12 2.5 5. 0.GRID 13 5. 5. 0.GRID 14 7.5 5. 0.GRID 15 10. 5. 0.GRID 16 0. 7.5 0.GRID 17 2.5 7.5 0.GRID 18 5. 7.5 0.GRID 19 7.5 7.5 0.GRID 20 10. 7.5 0.GRID 21 0. 10. 0.GRID 22 2.5 10. 0.GRID 23 5. 10. 0.GRID 24 7.5 10. 0.GRID 25 10. 10. 0.GRID 26 20. 0. 0.GRID 27 22.5 0. 0.GRID 28 25. 0. 0.GRID 29 27.5 0. 0.GRID 30 30. 0. 0.GRID 31 20. 2.5 0.GRID 32 22.5 2.5 0.GRID 33 25. 2.5 0.GRID 34 27.5 2.5 0.GRID 35 30. 2.5 0.GRID 36 20. 5. 0.GRID 37 22.5 5. 0.GRID 38 25. 5. 0.GRID 39 27.5 5. 0.GRID 40 30. 5. 0.
WORKSHOP 10 RBE2 vs. RBE3
MSC.Nastran 105 Exercise Workbook 10-19
GRID 41 20. 7.5 0.GRID 42 22.5 7.5 0.GRID 43 25. 7.5 0.GRID 44 27.5 7.5 0.GRID 45 30. 7.5 0.GRID 46 20. 10. 0.GRID 47 22.5 10. 0.GRID 48 25. 10. 0.GRID 49 27.5 10. 0.GRID 50 30. 10. 0.GRID 1000 15. 5. 0.$ SPC1 1 123456 1 6 11 16 21 30 + C+ C 35 40 45 50$FORCE 1 1000 0 100. 1. 0. 0.$ ENDDATA
10-20 MSC.Nastran 105 Excercise Workbook
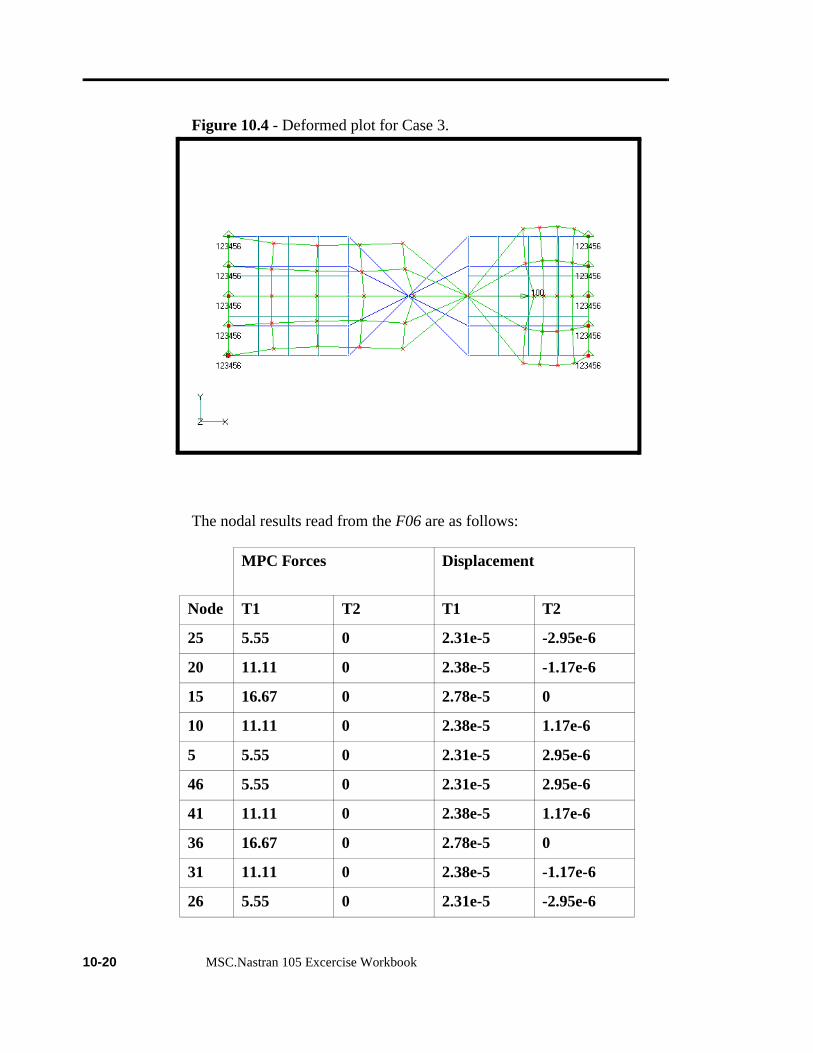
Figure 10.4 - Deformed plot for Case 3.
The nodal results read from the F06 are as follows:
MPC Forces Displacement
Node T1 T2 T1 T2
25 5.55 0 2.31e-5 -2.95e-6
20 11.11 0 2.38e-5 -1.17e-6
15 16.67 0 2.78e-5 0
10 11.11 0 2.38e-5 1.17e-6
5 5.55 0 2.31e-5 2.95e-6
46 5.55 0 2.31e-5 2.95e-6
41 11.11 0 2.38e-5 1.17e-6
36 16.67 0 2.78e-5 0
31 11.11 0 2.38e-5 -1.17e-6
26 5.55 0 2.31e-5 -2.95e-6

WORKSHOP 10 RBE2 vs. RBE3
MSC.Nastran 105 Exercise Workbook 10-21
1. MSC.Nastran Users have finished this exercise. MSC.Patran Users should proceed to the next step.
2. Proceed with the Reverse Translation process, that is importing the prob2a.op2 results file into MSC.Patran. To do this, return to the Analysis form and proceed as follows:
When the translation is complete bring up the Results form.
To reset the graphics, click on this icon:
You can go back and select any Results Case, Fringe Results orDeformation Results you are interested in.
◆ Analysis
Action: Read Output2
Object: Result Entities
Method Translate
Select Results File...
Select Results File prob10.op2
OK
Apply
◆ Results
Form Type: Advanced
Select Results Cases 1.1-Default, Static Subcase
Get Results
Select Result 2.1 Displacements, Translational
Plot Type Vector Plot
Plot
Display/Results...
Vectors... ■ Show Result Values
Apply
Reset Graphics

10-22 MSC.Nastran 105 Excercise Workbook
Quit MSC.Patran when you are finished with this exercise.

![ADAMS 2012 [Compatibiliteitsmodus] - Home - In Summa€¦ · RBE2 (rigid connected nodes) & RBE3 (weighted balanced nodes) FEM ... ADAMS 2012 vs. SimXpert Benelux ADAMS User Meeting](https://img.pdfslide.net/doc/110x75/5b5e83fe7f8b9a553d8cb174/adams-2012-compatibiliteitsmodus-home-in-rbe2-rigid-connected-nodes.jpg)