Embed Size (px)
Citation preview
Submit Manuscript | http://medcraveonline.com
IntroductionThe processes of sediment transport, scour, and deposition in an
alluvial channel are extremely complex. Theoretical developments of sediment transport functions for different flow and sediment conditions are based on assumptions of different degrees of complexity.1 Some of the simplified assumptions are based on idealized laboratory conditions that may not be true for the much more complicated natural river systems.2,3 Ahmed & Medhaat4 and Chang5 opined that sediment transport is an important part in the quantitave and qualitative management of river engineering. The rate of sediment transport in water bodies depends on availability of transport materials and transport capability of the water bodies. For a scientific approach to sedimentation, morphology and behaviour of the river must be understood. Morphology (of river) is a field of science which deals with the change of river plan form and cross sections due to sedimentation and erosion. In this field, dynamics of flow and sediment transport are the principal elements.6 The morphological studies, therefore, play an important role in planning, designing and maintaining river engineering structures. In recent years, there has been a growing awareness about the need for taking up morphological study of rivers in the country, especially with particular reference to their unique problems.7,8
Sediment transport is divided into different categories. The transport modes of particular relevance in morphological modelling are suspended load materials and the bed load. Wash load by definition does not interact with sediment on the river bed. Measurements of sediment transport rate at different locations are useful for calibration of the sediment transport model.9 Incidence of flooding has been on the increase in Ibadan, Oyo State Nigeria recently; and this exemplifies the problem operating in most urban centres in Nigeria. Problems associated with high runoff discharge have been a common occurrence in some parts of Nigeria like Ilorin, Ibadan, Lokoja, Delta, Benue and Bayelsa, to mention a few. This extreme hydro-climatic event exemplifies the problem currently
operating not only in Nigeria but also in most developing countries of the world. The need for studies relating to river catchment analysis therefore becomes pertinent.10 Most rivers in South-Western Nigeria particularly River Omi, River Ogunpa and River Oba are not fully gauged, with the resultant evidence of little or no hydrological record. Hydrometric stations are not adequate and those that are monitored have interrupted hydrological records. Olaniyan9 described that there are three sediment transport modes. They are wash load, bed load and suspended load. Wash load are very fine particles which are transported by the water, but these particles do not exist on the bed. Therefore the knowledge of bed material composition does not permit any prediction of wash load transport.11 Yang & Simoes12 described bed load as part of the total load which has more or less continuous contact with the bed. Thus the bed load must be determined in relation to the effective shear stress which acts directly on the grain surface. Suspended load are part of the total load which is moving without continuous contact with the bed as the result of the agitation of the fluid turbulence.13 The basic idea of splitting the total sediment load into bed-load and suspended load is that, as described above, two different mechanisms are effective during the transport.9,14
Brief description of the study area
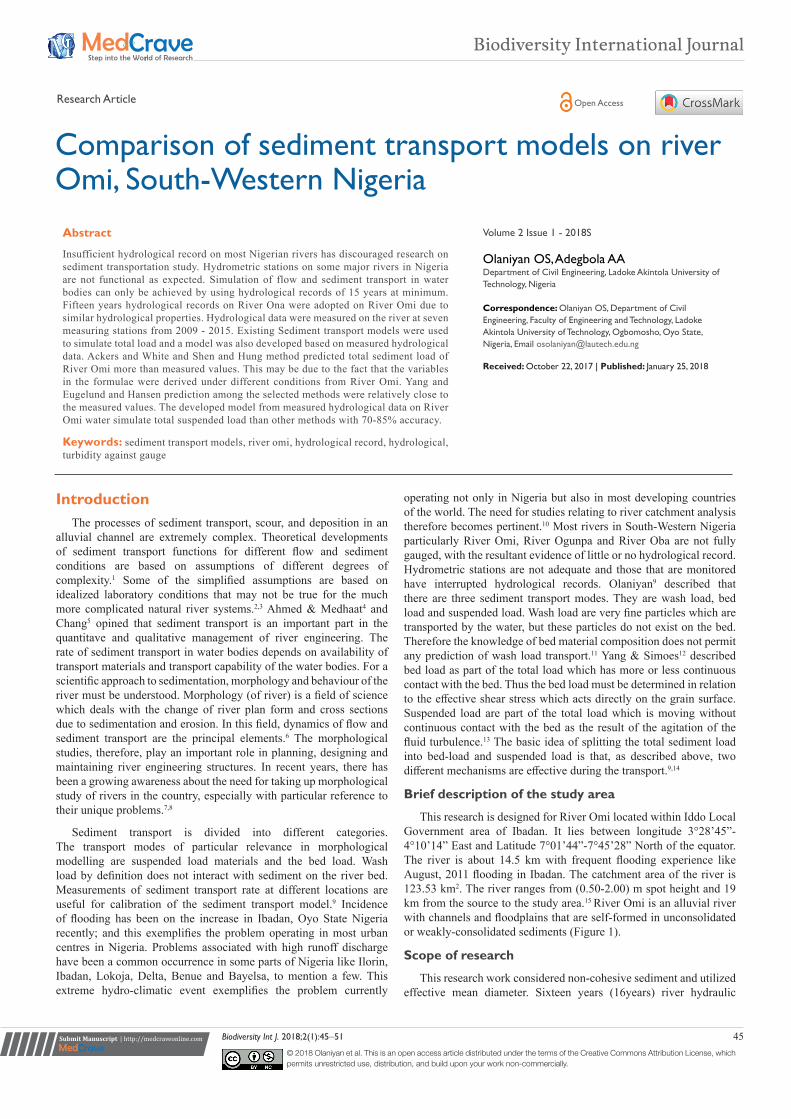
This research is designed for River Omi located within Iddo Local Government area of Ibadan. It lies between longitude 3°28’45”-4°10’14” East and Latitude 7°01’44”-7°45’28” North of the equator. The river is about 14.5 km with frequent flooding experience like August, 2011 flooding in Ibadan. The catchment area of the river is 123.53 km2. The river ranges from (0.50-2.00) m spot height and 19 km from the source to the study area.15 River Omi is an alluvial river with channels and floodplains that are self-formed in unconsolidated or weakly-consolidated sediments (Figure 1).
Scope of research
This research work considered non-cohesive sediment and utilized effective mean diameter. Sixteen years (16years) river hydraulic
Biodiversity Int J. 2018;2(1):45‒51 45© 2018 Olaniyan et al. This is an open access article distributed under the terms of the Creative Commons Attribution License, which permits unrestricted use, distribution, and build upon your work non-commercially.
Comparison of sediment transport models on river Omi, South-Western Nigeria
Volume 2 Issue 1 - 2018S
Olaniyan OS, Adegbola AADepartment of Civil Engineering, Ladoke Akintola University of Technology, Nigeria
Correspondence: Olaniyan OS, Department of Civil Engineering, Faculty of Engineering and Technology, Ladoke Akintola University of Technology, Ogbomosho, Oyo State, Nigeria, Email [email protected]
Received: October 22, 2017 | Published: January 25, 2018
Abstract
Insufficient hydrological record on most Nigerian rivers has discouraged research on sediment transportation study. Hydrometric stations on some major rivers in Nigeria are not functional as expected. Simulation of flow and sediment transport in water bodies can only be achieved by using hydrological records of 15 years at minimum. Fifteen years hydrological records on River Ona were adopted on River Omi due to similar hydrological properties. Hydrological data were measured on the river at seven measuring stations from 2009 - 2015. Existing Sediment transport models were used to simulate total load and a model was also developed based on measured hydrological data. Ackers and White and Shen and Hung method predicted total sediment load of River Omi more than measured values. This may be due to the fact that the variables in the formulae were derived under different conditions from River Omi. Yang and Eugelund and Hansen prediction among the selected methods were relatively close to the measured values. The developed model from measured hydrological data on River Omi water simulate total suspended load than other methods with 70-85% accuracy.
Keywords: sediment transport models, river omi, hydrological record, hydrological, turbidity against gauge
Biodiversity International Journal
Research Article Open Access
Comparison of sediment transport models on river Omi, South-Western Nigeria 46Copyright:
©2018 Olaniyan et al.
Citation: Olaniyan OS, Adegbola AA. Comparison of sediment transport models on river Omi, South-Western Nigeria. Biodiversity Int J. 2018;2(1):45‒51. DOI: 10.15406/bij.2018.02.00042
data from River Ona were adopted on River Omi due to their similar hydrological characteristics. River Omi is a tributary of River Ona both located in Ibadan. Five (5) years of hydraulic data measured on River Omi from June 2010 were used for this study.
Figure 1 Hydrological Map of part of Ibadan showing Sampling Stations on River Omi.
MethodologyHydraulics and sediment transport data sets including discharge,
bed load, suspended load and total load were collected from the measuring locations on the River omi from 2009 to 2014. Gauge and discharge records from 1970-1986 were plotted in Microsoft excel and mathematical equation between the two records was obtained. The equation was analysed using running method according to Subramanya.16 It was calibrated and validated using measured hydrological data from 2010-2013 and 2014, respectively. This was in agreement with approach by Subramanya16 and Adegbola & Olaniyan17 to deal with hydrological catchments with inadequate data. Flow meter (model 32986) was used to measure the velocity at each cross section. Flow depth was measured using surveying equipment; wetted area and perimeter were also determined.The measuring points on the river are shown in Table 1. Insufficient data is a pertinent problem for hydrologist most especially discharges. Wilson (1990) opined that it is possible to reproduce series of data exhibiting variation as the natural data. Synthetic data in this study were generated using Institute of Hydrology equation was used to predict discharge as shown in equation 1. In this study, the synthesis data was neither use for calibration or validation. The synthesis data only shows the rainfall intensity and catchment properties over the years.
0.92 1.22 2.00.00066Q Area SAAR SOIL= 1
1 2 3
1 2 3 4 5
4 50.15S 0.30S 0.40S 0.45S 0.5S
S S S S SSOIL
+ + + +=
+ + + + 2
Where:
S1-S5=Proportion of catchment covered by each soil class 1-5
S1=Soil class 1 with highest infiltration capacity
S5=Soil class 5 with highest infiltration capacity
SAAR=Average annual rainfall obtained by taken weight average over the catchmentTable 1 Location of Sampling Stations on River Omi
Sampling station Longitude Latitude
Upstream
(Z1) 7.425 3.795
(Z2) 7.425 3.78
(Z3) 7.425 3.77
(Z4) 7.425 3.786
Mid-stream(Z5) 7.425 3.778
(Z6) 7.425 3.773
Down-stream (Z7) 7.373 3.773
Total sediment load measurement
Suspended load was measured by using standard light weight hand held sediment sampler (US DH-48). Depth integrated sampler was used to collect water sample at 0.1, 0.5 and 1.0m depth from water surface. The sampling at each depth were done two times, analysed and averaged for Suspended Sediment Concentration (SSC) computation. Sediment sampling was taken twice in a week and this was increase during high during flood events when turbidity changes more quickly. A relationship between turbidity and suspended sediment concentration were established at each location by sampling a wide range of turbidities and sediment concentrations over a year. 50 ml of thoroughly mixed water samples from each station was filtered through 0.4µm, oven dried and weighed to determine the SSC using equation 3.13 Turbid meter (HI 93703) was used to measure turbidity of the water sample and a calibration curve was developed.
3SSC = mg/l/1000/1000 = tonne L-1
SSC = Suspended Sediment Concentration (mg/l)
Bed materials were collected using Van veen grab samplers at upstream, midstream and downstream. The scoop was used to take bed material samples at each gauging site by positioning it at an angle on the stream bed and the wire pulled in order to raise the shutter. The obtained samples from upstream, midstream and downstream were mixed together and part of the mixture was taken to the laboratory for particle size analysis as shown in Table 2.
The unmeasured sediment loads discharged at the gauging sites on the river was estimated by using Colby approach as described by Otun & Adeogun.18 The bed load component of the unmeasured sediment is accounted for by analyzing the bed materials sampled at the gauging sites. Meyer-Peter and Müller’s 1948, Ackers and White’s 1973, Engelund and Hansen’s 1972 and Yang’s 1979 sand and 1984 gravel transport formulas were used in this study for computing sediment transportation.
Engelund and hansen’s approach: Engelund and Hansen (1972) used Bagnold’s stream power concept and the similarity principle to obtain a sediment transport function as shown:9
(5/2)0.1if θφ = 4
( ){ }( )( )
weightofmembranefilter dryresidue weightofmembranefilter mg 1000SSC
VolumeofFilteredwater mL
+ − ×=
Comparison of sediment transport models on river Omi, South-Western Nigeria 47Copyright:
©2018 Olaniyan et al.
Citation: Olaniyan OS, Adegbola AA. Comparison of sediment transport models on river Omi, South-Western Nigeria. Biodiversity Int J. 2018;2(1):45‒51. DOI: 10.15406/bij.2018.02.00042
Where:
22 /if gSD V= 4(a)
0.53t sq
gdγ γ
γ γ
−−
∅ =
4(b)
( )s d
τθ
γ γ=
− 4(c)
Where:
g=Gravitational acceleration (m/s),
S=Energy slope,
V=Average flow velocity (m/s),
q=Total sediment discharge by weight per unit width,
sγ and γ =Specific weights of sediment and water, respectively,
d=Median particle diameter, and
τ=Shear stress along the bedTable 2 Grain size distribution on River Omi Bed Materials
Grain size (mm)
Average grain size (mm) Percentage distribution
D>2.00 - 17.29
2.00>D>0.600 0.92 32.5
0.600>D>0.200 0.36 39.3
0.200>D -
D50=0.40mm, D65=0.90mm, D95=1.90mm
Ackers and white’s approach: This approach applied dimensional analysis to express mobility and sediment transport rate in terms of some dimensionless parameters Yang.19 The mobility number for sed-iment transport is given as:
( )
11/2
0 132 log log
n
n sgr
VF U gd
Dd
γ
αγ
−−
= −
5
Where:
U0=Shear velocity
n=Transition exponent, depending on sediment size
a=Coefficient in rough turbulent equation (= l0),
d=Sediment particle size, and
D=Water depth
The dimensionless grain diameter which expresses grain size is given as:
( )1/3
2
1s
gr
gd d
v
γγ
−
=
6
Where
v=Kinematic viscosity
The generalized dimensionless sediment transport function can be simply expressed as:
1
m
grgr
FG C
A= −
7
Ackers and White (1973) used laboratory data to determine the values of A, C, m, and n with sediment size greater than 0.04 mm and Froude number less than 0.8. For the transition zone with 1< dgr≤ 60,
n=l .00 - 0.56 log dgr 8
( 1/2)0.23 0.143gA d r −= +
9
For coarse sediment, dgr>60
n=0, A=0.17, m =1.5 and C=0.025
For the transition zone:9.66
1.34gr
md
= +
10
( )2log log 2.86 log log log log 3.53gr grC d d= − −
11
Yang approach: Yang20,21 extended his dimensionless unit stream power equation for sand transport to gravel transport. The gravel and sand equations thus obtained is:
* *log log 6.681 0.633 log log 4.816 log log 2.784 0.305 log log 0.282 log log log log crV SU Ud d VSCtg
v v
ω ω
ω ω ω ω= − − + − − −
12(a)
* *log log 5.435 0.286 log log 0.457 log log 1.799 0.409 log log 0.314 log log log log crts
U V SUd d VSC
v v
ω ω
ω ω ω ω= − − + − − −
12 (b)
Yang (1996) extended his dimensionless unit stream power equation for sand transport to gravel transport. The gravel equation thus obtained is:
* *log log 5.165 0.153 log log 0.297 log log 1.780 0.36 log log 0.48 log log log logt
U Ud d VSC
v v s
ω ω γ
ω ω ω γ γ= − − + − − −
−
12 (c)
Comparison of sediment transport models on river Omi, South-Western Nigeria 48Copyright:
©2018 Olaniyan et al.
Citation: Olaniyan OS, Adegbola AA. Comparison of sediment transport models on river Omi, South-Western Nigeria. Biodiversity Int J. 2018;2(1):45‒51. DOI: 10.15406/bij.2018.02.00042
Where:
Ct=Total sediment concentration, with wash load excluded (in ppm by weight)
VS=Unit stream power,
U*=Shear velocity,
v=Kinematic viscosity,
ω=Fall velocity of sediment, and
d=Median particle diameter (m).
Meyer-peter and miiller formula: Meyer-Peter and Miiller (1948) formulated an empirical formula for the bed load discharge in natural streams.9 Their formula for a rectangular channel is given as:
3/2 1/3
2/30.047 0.25is ss m s
r
Q KdS D g
Q K g
γγ γ= +
13
But 1n
m i si bD D i== ∑ 13a
Where
γ =The specific weight of water (t/m3)
Qs=That part of the water discharge apportioned to the bed (l/s),
Q=The total water discharge (l/s),
Ks=Strickler’s coefficient of bed roughness, equal to 1 divided by Manning’s roughness coefficient n,
Kr=The coefficient of particle roughness, equal to (26 /D90)1/6,
D90=Particle size, in m, for which 90% of the bed mixture is finer,
d=The mean depth (m)
S=Energy gradient in m per m3/23/21/6
900.368 0.0698ss m
s
Q Dg dS D
Q n= −
14
Where:
gs=The bed load discharge for dry weight, in m/s per m of width,
Q, Qs=Sediment and water discharges, respectively, in l/s,
D90, Dm=Sediment particle diameter at which 90% of the material, by weight, is finer and
mean particle diameter, respectively,
d=Water depth and
ns=Manning’s roughness value for the bed of the stream
( )( )( )3/2
50
80.047s S
s
La gC JR Dρ ρ ρ
ρ ρ ρ= − −
−
14(a)
Where:
Cs=Sediment transport capacity (m3/s)
D50=Median diameter of sediment (m)
J=Friction slope
La=Active width (m)
ρs=Density of sediment (kg/m3)
ρ=Density of water (kg/m3)
This equation is better simplified as:
( ) ( )3/23 * *1 8s criticalC s gd τ τ= − − 14(b)
Where
( )* *, 0.047
1 h
critical
R S
s dτ τ= =
− 14(c)
qb=Bed flux (volume rate of transport per unit length of surface)
d=Particle diameter (m)
ρs=Sediment density kg/m3
s=(ρs/ρ) = relative density
S=Channel slope
The total carrying capacity or sediment concentration for a particular river section, Ct, is computed by using the formula:
1Ni i iC PCt == ∑
15
Where:
pi=Percentage of material of size fraction I available in the bed;
Ci=Sediment concentration or carrying capacity for each size fraction; and
N=Number of size fractions
Shen and hung equation: Shen and Hung regression analysis devel-oped the empirical equation 16 to compute the total sediment load as shown in equation 16 (Olaniyan, 2014):
log Ct = -107,404.45938164 + 324,214.74734085Y -326,309.58908739Y2 + 109,503.87232539Y3 16
Where :
Y=(VS0.57/ω0.32)0.00750189
Ct=Total sediment concentration in ppm by weight, and
ω=Average fall velocity of sediment particle
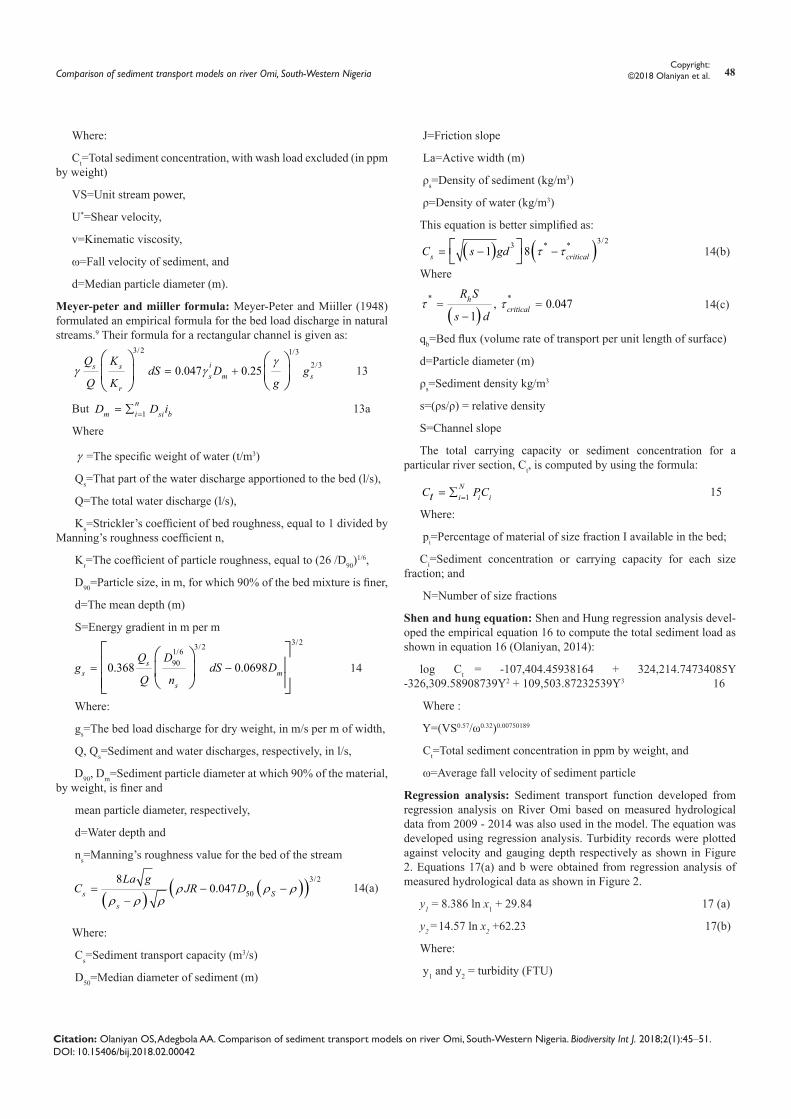
Regression analysis: Sediment transport function developed from regression analysis on River Omi based on measured hydrological data from 2009 - 2014 was also used in the model. The equation was developed using regression analysis. Turbidity records were plotted against velocity and gauging depth respectively as shown in Figure 2. Equations 17(a) and b were obtained from regression analysis of measured hydrological data as shown in Figure 2.
y1 = 8.386 ln x1 + 29.84 17 (a)
y2 =14.57 ln x2 +62.23 17(b)
Where:
y1 and y2 = turbidity (FTU)
Comparison of sediment transport models on river Omi, South-Western Nigeria 49Copyright:
©2018 Olaniyan et al.
Citation: Olaniyan OS, Adegbola AA. Comparison of sediment transport models on river Omi, South-Western Nigeria. Biodiversity Int J. 2018;2(1):45‒51. DOI: 10.15406/bij.2018.02.00042
x1=gauge depth (m), x2= velocity (m/s)
Figure 2 Turbidity against Gauge and Velocity.
It was equally realized from literature the velocity-depth ratio affects sediment transport in a river. This ratio was considered in the development of the model. A strong relationship exists between turbidity and velocity with a 71% coefficient of regression. The model was calibrated by minimizing the residual between the measured and simulated values. The equation developed from measured stage, discharge and suspended sediment concentration after calibration was:
( )
( )0.8659 ln ln 2.866
n
hmgy
l vh
+=
18
Where:
h=Depth of water (m)
v= Average velocity (m/s)
n= Exponent
0.5, 0.4vn ifh
= ≤
3.375, 0.4 1.9vn ifh
= − < ≥
0.9, 1.9vn ifh
= − >
The statistical package employed in this study to analyse results obtained from sediment transport function is t-test and Analysis of Variance (ANOVA). The alpha value (α) used for the analysis for each sediment functions was 0.05.
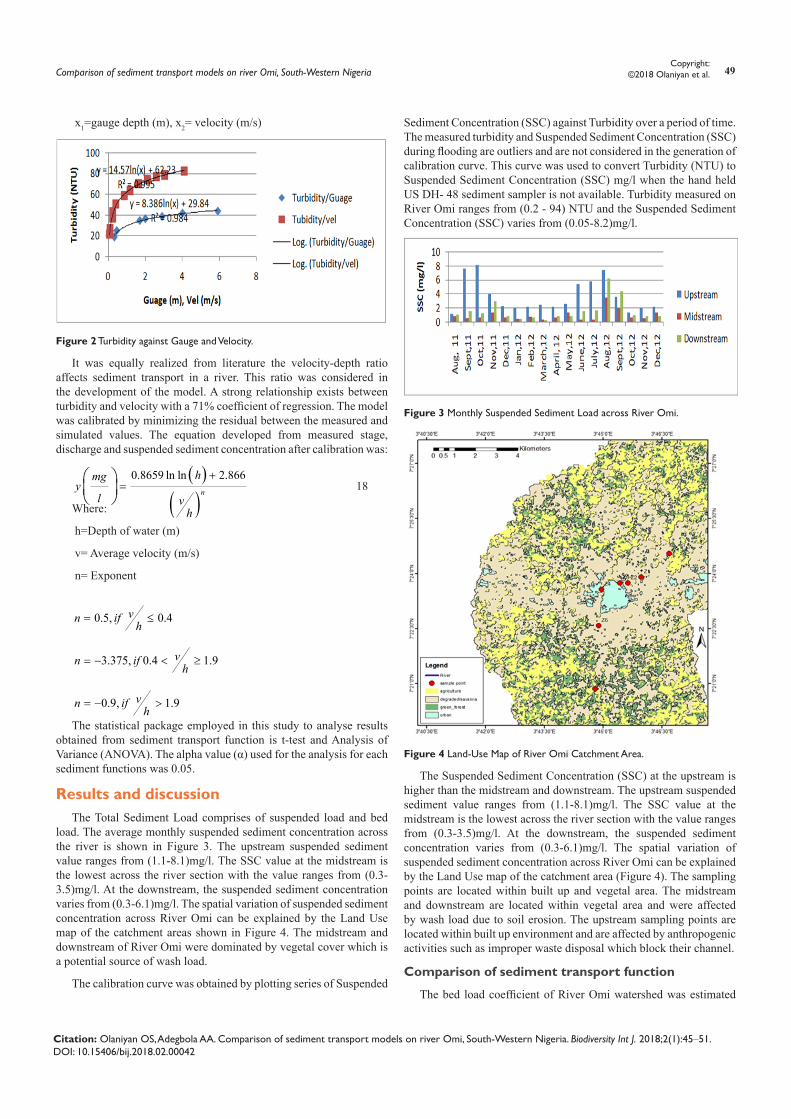
Results and discussionThe Total Sediment Load comprises of suspended load and bed
load. The average monthly suspended sediment concentration across the river is shown in Figure 3. The upstream suspended sediment value ranges from (1.1-8.1)mg/l. The SSC value at the midstream is the lowest across the river section with the value ranges from (0.3- 3.5)mg/l. At the downstream, the suspended sediment concentration varies from (0.3-6.1)mg/l. The spatial variation of suspended sediment concentration across River Omi can be explained by the Land Use map of the catchment areas shown in Figure 4. The midstream and downstream of River Omi were dominated by vegetal cover which is a potential source of wash load.
The calibration curve was obtained by plotting series of Suspended
Sediment Concentration (SSC) against Turbidity over a period of time. The measured turbidity and Suspended Sediment Concentration (SSC) during flooding are outliers and are not considered in the generation of calibration curve. This curve was used to convert Turbidity (NTU) to Suspended Sediment Concentration (SSC) mg/l when the hand held US DH- 48 sediment sampler is not available. Turbidity measured on River Omi ranges from (0.2 - 94) NTU and the Suspended Sediment Concentration (SSC) varies from (0.05-8.2)mg/l.
Figure 3 Monthly Suspended Sediment Load across River Omi.
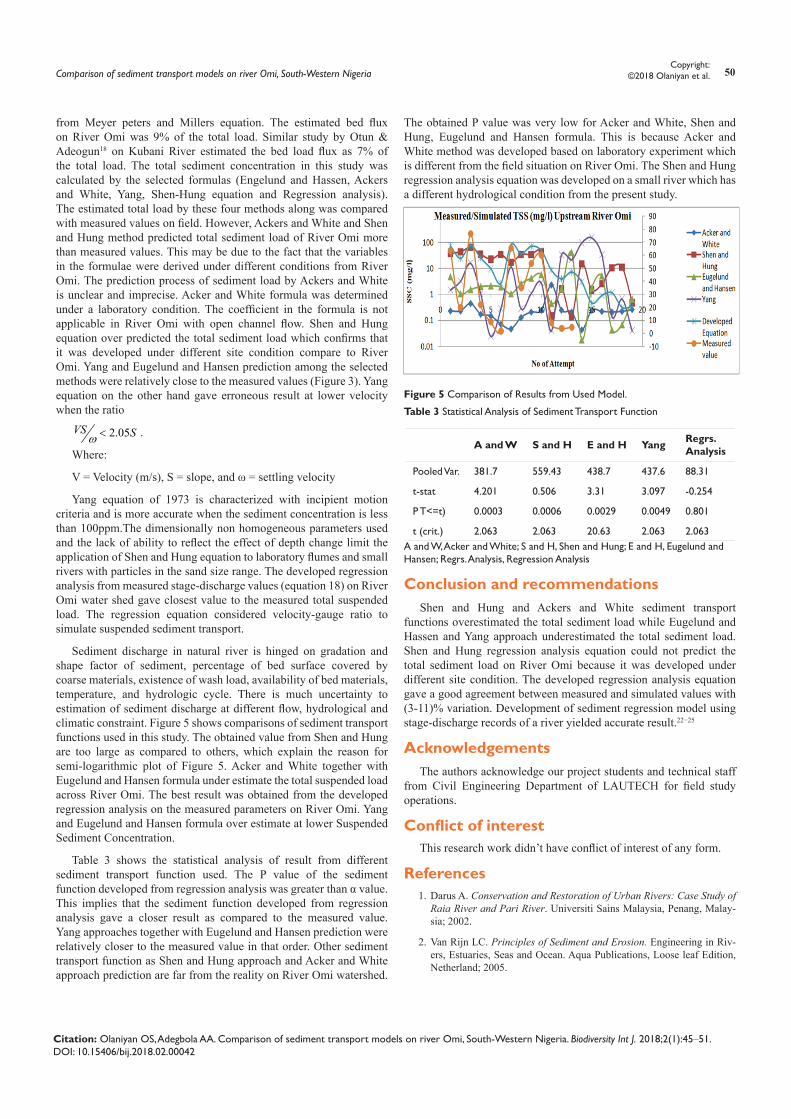
Figure 4 Land-Use Map of River Omi Catchment Area.
The Suspended Sediment Concentration (SSC) at the upstream is higher than the midstream and downstream. The upstream suspended sediment value ranges from (1.1-8.1)mg/l. The SSC value at the midstream is the lowest across the river section with the value ranges from (0.3-3.5)mg/l. At the downstream, the suspended sediment concentration varies from (0.3-6.1)mg/l. The spatial variation of suspended sediment concentration across River Omi can be explained by the Land Use map of the catchment area (Figure 4). The sampling points are located within built up and vegetal area. The midstream and downstream are located within vegetal area and were affected by wash load due to soil erosion. The upstream sampling points are located within built up environment and are affected by anthropogenic activities such as improper waste disposal which block their channel.
Comparison of sediment transport function
The bed load coefficient of River Omi watershed was estimated
Comparison of sediment transport models on river Omi, South-Western Nigeria 50Copyright:
©2018 Olaniyan et al.
Citation: Olaniyan OS, Adegbola AA. Comparison of sediment transport models on river Omi, South-Western Nigeria. Biodiversity Int J. 2018;2(1):45‒51. DOI: 10.15406/bij.2018.02.00042
from Meyer peters and Millers equation. The estimated bed flux on River Omi was 9% of the total load. Similar study by Otun & Adeogun18 on Kubani River estimated the bed load flux as 7% of the total load. The total sediment concentration in this study was calculated by the selected formulas (Engelund and Hassen, Ackers and White, Yang, Shen-Hung equation and Regression analysis). The estimated total load by these four methods along was compared with measured values on field. However, Ackers and White and Shen and Hung method predicted total sediment load of River Omi more than measured values. This may be due to the fact that the variables in the formulae were derived under different conditions from River Omi. The prediction process of sediment load by Ackers and White is unclear and imprecise. Acker and White formula was determined under a laboratory condition. The coefficient in the formula is not applicable in River Omi with open channel flow. Shen and Hung equation over predicted the total sediment load which confirms that it was developed under different site condition compare to River Omi. Yang and Eugelund and Hansen prediction among the selected methods were relatively close to the measured values (Figure 3). Yang equation on the other hand gave erroneous result at lower velocity when the ratio
2.05VS Sω < .
Where:
V = Velocity (m/s), S = slope, and ω = settling velocity
Yang equation of 1973 is characterized with incipient motion criteria and is more accurate when the sediment concentration is less than 100ppm.The dimensionally non homogeneous parameters used and the lack of ability to reflect the effect of depth change limit the application of Shen and Hung equation to laboratory flumes and small rivers with particles in the sand size range. The developed regression analysis from measured stage-discharge values (equation 18) on River Omi water shed gave closest value to the measured total suspended load. The regression equation considered velocity-gauge ratio to simulate suspended sediment transport.
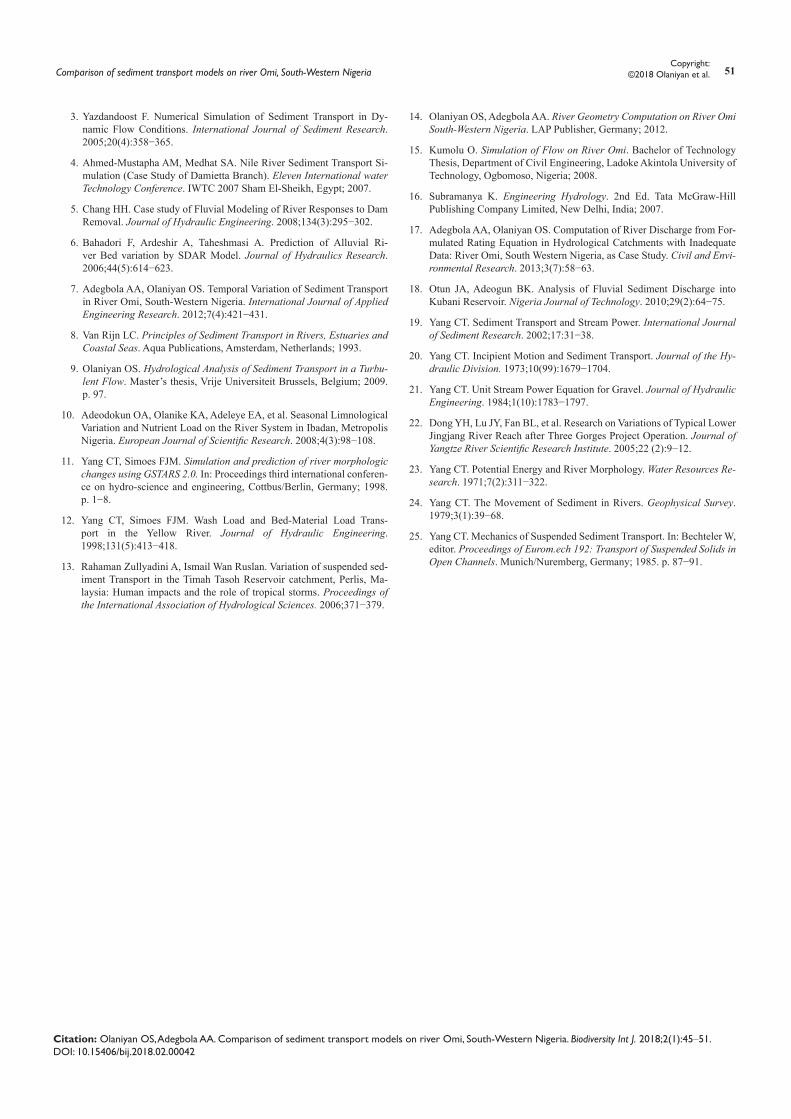
Sediment discharge in natural river is hinged on gradation and shape factor of sediment, percentage of bed surface covered by coarse materials, existence of wash load, availability of bed materials, temperature, and hydrologic cycle. There is much uncertainty to estimation of sediment discharge at different flow, hydrological and climatic constraint. Figure 5 shows comparisons of sediment transport functions used in this study. The obtained value from Shen and Hung are too large as compared to others, which explain the reason for semi-logarithmic plot of Figure 5. Acker and White together with Eugelund and Hansen formula under estimate the total suspended load across River Omi. The best result was obtained from the developed regression analysis on the measured parameters on River Omi. Yang and Eugelund and Hansen formula over estimate at lower Suspended Sediment Concentration.
Table 3 shows the statistical analysis of result from different sediment transport function used. The P value of the sediment function developed from regression analysis was greater than α value. This implies that the sediment function developed from regression analysis gave a closer result as compared to the measured value. Yang approaches together with Eugelund and Hansen prediction were relatively closer to the measured value in that order. Other sediment transport function as Shen and Hung approach and Acker and White approach prediction are far from the reality on River Omi watershed.
The obtained P value was very low for Acker and White, Shen and Hung, Eugelund and Hansen formula. This is because Acker and White method was developed based on laboratory experiment which is different from the field situation on River Omi. The Shen and Hung regression analysis equation was developed on a small river which has a different hydrological condition from the present study.
Figure 5 Comparison of Results from Used Model.
Table 3 Statistical Analysis of Sediment Transport Function
A and W S and H E and H Yang Regrs. Analysis
Pooled Var. 381.7 559.43 438.7 437.6 88.31
t-stat 4.201 0.506 3.31 3.097 -0.254
P T<=t) 0.0003 0.0006 0.0029 0.0049 0.801
t (crit.) 2.063 2.063 20.63 2.063 2.063A and W, Acker and White; S and H, Shen and Hung; E and H, Eugelund and Hansen; Regrs. Analysis, Regression Analysis
Conclusion and recommendationsShen and Hung and Ackers and White sediment transport
functions overestimated the total sediment load while Eugelund and Hassen and Yang approach underestimated the total sediment load. Shen and Hung regression analysis equation could not predict the total sediment load on River Omi because it was developed under different site condition. The developed regression analysis equation gave a good agreement between measured and simulated values with (3-11)% variation. Development of sediment regression model using stage-discharge records of a river yielded accurate result.22−25
AcknowledgementsThe authors acknowledge our project students and technical staff
from Civil Engineering Department of LAUTECH for field study operations.
Conflict of interestThis research work didn’t have conflict of interest of any form.
References1. Darus A. Conservation and Restoration of Urban Rivers: Case Study of
Raia River and Pari River. Universiti Sains Malaysia, Penang, Malay-sia; 2002.
2. Van Rijn LC. Principles of Sediment and Erosion. Engineering in Riv-ers, Estuaries, Seas and Ocean. Aqua Publications, Loose leaf Edition, Netherland; 2005.
Comparison of sediment transport models on river Omi, South-Western Nigeria 51Copyright:
©2018 Olaniyan et al.
Citation: Olaniyan OS, Adegbola AA. Comparison of sediment transport models on river Omi, South-Western Nigeria. Biodiversity Int J. 2018;2(1):45‒51. DOI: 10.15406/bij.2018.02.00042
3. Yazdandoost F. Numerical Simulation of Sediment Transport in Dy-namic Flow Conditions. International Journal of Sediment Research. 2005;20(4):358−365.
4. Ahmed-Mustapha AM, Medhat SA. Nile River Sediment Transport Si-mulation (Case Study of Damietta Branch). Eleven International water Technology Conference. IWTC 2007 Sham El-Sheikh, Egypt; 2007.
5. Chang HH. Case study of Fluvial Modeling of River Responses to Dam Removal. Journal of Hydraulic Engineering. 2008;134(3):295−302.
6. Bahadori F, Ardeshir A, Taheshmasi A. Prediction of Alluvial Ri-ver Bed variation by SDAR Model. Journal of Hydraulics Research. 2006;44(5):614−623.
7. Adegbola AA, Olaniyan OS. Temporal Variation of Sediment Transport in River Omi, South-Western Nigeria. International Journal of Applied Engineering Research. 2012;7(4):421−431.
8. Van Rijn LC. Principles of Sediment Transport in Rivers, Estuaries and Coastal Seas. Aqua Publications, Amsterdam, Netherlands; 1993.
9. Olaniyan OS. Hydrological Analysis of Sediment Transport in a Turbu-lent Flow. Master’s thesis, Vrije Universiteit Brussels, Belgium; 2009. p. 97.
10. Adeodokun OA, Olanike KA, Adeleye EA, et al. Seasonal Limnological Variation and Nutrient Load on the River System in Ibadan, Metropolis Nigeria. European Journal of Scientific Research. 2008;4(3):98−108.
11. Yang CT, Simoes FJM. Simulation and prediction of river morphologic changes using GSTARS 2.0. In: Proceedings third international conferen-ce on hydro-science and engineering, Cottbus/Berlin, Germany; 1998. p. 1−8.
12. Yang CT, Simoes FJM. Wash Load and Bed-Material Load Trans-port in the Yellow River. Journal of Hydraulic Engineering. 1998;131(5):413−418.
13. Rahaman Zullyadini A, Ismail Wan Ruslan. Variation of suspended sed-iment Transport in the Timah Tasoh Reservoir catchment, Perlis, Ma-laysia: Human impacts and the role of tropical storms. Proceedings of the International Association of Hydrological Sciences. 2006;371−379.
14. Olaniyan OS, Adegbola AA. River Geometry Computation on River Omi South-Western Nigeria. LAP Publisher, Germany; 2012.
15. Kumolu O. Simulation of Flow on River Omi. Bachelor of Technology Thesis, Department of Civil Engineering, Ladoke Akintola University of Technology, Ogbomoso, Nigeria; 2008.
16. Subramanya K. Engineering Hydrology. 2nd Ed. Tata McGraw-Hill Publishing Company Limited, New Delhi, India; 2007.
17. Adegbola AA, Olaniyan OS. Computation of River Discharge from For-mulated Rating Equation in Hydrological Catchments with Inadequate Data: River Omi, South Western Nigeria, as Case Study. Civil and Envi-ronmental Research. 2013;3(7):58−63.
18. Otun JA, Adeogun BK. Analysis of Fluvial Sediment Discharge into Kubani Reservoir. Nigeria Journal of Technology. 2010;29(2):64−75.
19. Yang CT. Sediment Transport and Stream Power. International Journal of Sediment Research. 2002;17:31−38.
20. Yang CT. Incipient Motion and Sediment Transport. Journal of the Hy-draulic Division. 1973;10(99):1679−1704.
21. Yang CT. Unit Stream Power Equation for Gravel. Journal of Hydraulic Engineering. 1984;1(10):1783−1797.
22. Dong YH, Lu JY, Fan BL, et al. Research on Variations of Typical Lower Jingjang River Reach after Three Gorges Project Operation. Journal of Yangtze River Scientific Research Institute. 2005;22 (2):9−12.
23. Yang CT. Potential Energy and River Morphology. Water Resources Re-search. 1971;7(2):311−322.
24. Yang CT. The Movement of Sediment in Rivers. Geophysical Survey. 1979;3(1):39−68.
25. Yang CT. Mechanics of Suspended Sediment Transport. In: Bechteler W, editor. Proceedings of Eurom.ech 192: Transport of Suspended Solids in Open Channels. Munich/Nuremberg, Germany; 1985. p. 87−91.