Embed Size (px)
Citation preview

COMPARISON OF SOLUTION BEHAVIOR OF POLYSACCHARIDES
Andrd M. Striegel 1 and Judy D. Timpa2"1University of New Orleans & zUSDA,
ARS, Southern Regional Research Center, P. O. Box 19687New Orleans, LA 70179
ABSTRACT
Polysaccharides function in key roles in textiles, biomass, foodstuffs, and plant cell walls, in addition to
pharmaceuticals and immunological interactions. Structural information is. badly needed, but complexity of the
polymers has been a limiting aspect. We investigated the solution behavior of polysaccharides representing typical
classes of natural products via GPC using refractive index and viscometric detectors. The solvent of choice for high-
molecular weight cellulose analysis, dimethylacetamide with lithium chloride, was used for direct dissolution without
extraction or derivafization. For more effective comparisons all of the compounds were dissolved in the same
soivant. Polysaccharides included a range of molecular weights, linear and branched polymers, as well as varying
linkages (i.e. celluloses, amyloses, amylopectins, dextrans, pullulans, and curdlan). In addition to molecular weights
and molecular weight distributions, calculated parameters defining the compounds' solution characteristics (intrln."_c
viscosity, radius of gyration, Mark-Houwink coefficients) were determined. Comparison between compounds with
similar molecular weights which differed either in their branching or their linkages were made. The calculated data
was correlated with theoretical results predicted in the titeratme and/or with known results, where such infonnmion
was available. Correlations of polymer linkage type and branching assessments with solution properties will be
presented.
'Corresponding author
567

6/INTRODUCTION
Gel permeation chromatography (GPC) when applied to the characterization of
polysaccharides offers a number of distinct advantages. Molecular weight averages and, more
importantly, molecular weight distributions can be calculated using this technique. Other
important solution parameters can also be obtained, such as intrinsic viscosity ([riD, radius of
gyration (Rg), polydispersity ratio (PD), and Mark-Houwink constants (a and log K), as well as
branching parameters. These last include branching frequency (_.) and branching number (Bn).
Physical properties are instrumental in the study of polysaccharides, as they are governedby the
molecular structure of the polymers. It is well known, for example, that a linear molecule
occupies a higher hydrodynamic volume than a branched molecule of equal molecular weight,
and thus solutions of the former will be moreviscous than those of the latter. In this fashion the
intrinsic viscosities and radii of gyration of polysaccharides can be directly related to chain
branching. Different properties or combinations of properties, such as chain length distribution,
branching of the molecular chain, type(s) of linkage(s) within the molecule, have a direct bearing
on the functional differences between polysaccharides. GPC provides an excellent means of
quantifying many important solution properties of polysaccharides.
Polysaccharides such as dextrans, pullulans, cellulose, are of great importance in the
medical and pharmaceuticalfields, as well as in the food, pulp and paper, and textile industries,
among others1 (Table I). They are essential to virtuallyall biological systems2. Optimizing the
functions these compounds perform is directly dependent upon knowledge of their structureand
molecular weight distribution(MWD), and the extent to which these affect polymer behavior.
This can only be achieved through a techniquesuch as GPC thatcan quantify these parameters
to establish effective comparisonsamong different polysaccharides.
While a number of polysaccharides are water-soluble and can thus be analyzed using
aqueous mobile phases, this property is by no means universal. Investigation of a number of
importantand ubiquitous polysaccharides such as cellulose and starch has been hinderedby their
568

poor solubility. Isolation and fractionation prior to solubilization, which detracts from
comparisons with the native or starting material, is often performed. Thus a solvent which
dissolves a wide range of carbohydrates (i.e. a variety of polysaccharide types over a wide
molecular weight range) is extremely important in GPC. In this study we have used N,N-
dimethylacetamide/lithium chloride (DMAc/LiC1), the solvent of choice for high-molecular
weight cellulose analysis, to dissolve all of the polysaccharides under consideration. The
appropriateness of choosing this solvent will be addressed.
In this work, GPC of polysaccharides, dissolved in DMAc/0.5% LiC1, has been used to
probe the dilute solution behavior of sugars representing different classes of polysaccharides. The
concept of universal calibration 3 has been applied (see Results and Discussion/Universal
Calibration). Variations in dilute solution properties have been related to both molecular weight
distribution and branching. Additionally, a comparison is made between number-average
molecular weight (1_) as determined with and without the use of a concentration (refractive
index or RI) detector. The latter average is generally referred to as the Goldwasser 1_ 4
EXPERIMENTAL
Materials. All polysaecharides analyzed are commercially available, and were used
without further purification. Samples included celluloses (J. T. Baker, Cat. Nos. 1525-1 and
1528-1); pullulans (Pfanstiehl, Cat. Nos. 12474 and 12476); dextran T10, T40, T70, TS00,
T2000, (Pharmacia, Code Nos. 17-0250-01, 17-0270-01, 17-0280-01, 17-0320-01, 17-0330-01,
respectively); dextran Low Fraction, High Fraction (J. T. Baker, Cat. Nos. G200-5, G202-05,
respectively); dextran Industrial Grade (Sigma, No. D-5501); arabinogalactan (Atomergic
Chemetals, 6030); corn amylose (Sigma, No. A-7043); potato amylose (Sigma, No. A-0512);
corn amylopectin (Sigma, No. A-7780); potato amylopeetin (Sigma, No. A-8515). Materials were
N,N-dimethylacetamide (Burdick & Jackson), dried with molecular sieves (Baker, Activated Type
3A); lithium chloride (Baker), oven-dried and stored in desiccator; I0 mL ReactaVials (Pierce);
heating block (Pierce); Teflon magnetic stirbars (2.5 cm); Baker 10 extraction apparatus;
disposable Teflon filters (Millipore, Millex-SR and TYPE FI-I, 0.5 l.tm); 10 em 3 glass syringes
569

(BD); 4 mL WISP vials with Teflon septa; 50 mL volumetric flasks. Polystyrene standards were
from Toyo Soda Manufacturing (Types F-288, F-20, F-80, F-10, F-128, F-4, F-40, F-2, A-5000,
F-I, with nominal molecular weights of 2.89 xl0 6, 1.9 xlO s, 7.1 xl(Y, 1.02 xlO s, 1.26 xl&,
4.39 xl04, 3.55 xl0 s, 1.96 xl04, 6.2 xl&, 1.03 xl(Y, respectively).
Sample Preparation. Samples were dissolved generally following the procedure reported
for cotton s. 30 mg of polysaccharide was added to 5 mL DMAc in 10 mL ReactaVials with a
conical magnetic stirrer in a heating block. The temperature was raised to 150"C and maintained
with stirring for 1 hour. The mixture was allowed to cool to 100"C. 0.250 g dried LiC1 was
added. The vials were shaken by hand and returned to the heating block, where the mixture was
maintained with stirring at 100*C for 1 hour. The temperature of the block was lowered to 50"C
and samples were stirred at this temperature overnight. The solutions were quantitatively
transferred to 50 mL volumetric flasks and diluted to volume with DMAc. They were then
filtered through a solvent-resistant Teflon disposable filter. An extraction apparatus was employed
with 10 cm 3 glass syringes fitted onto filters with 4 mL glass vials held in the small volumetric
holder. The final concentration of each polysaccharide was 0.6 mg/mL in DMAc/0.5% LiC1.
Chromatography. The mobile-phase/solvent for GPC was DMAc/0.5% LiCI prepared
by raising the temperature of 1 L of DMAc to 101YCand then adding 5 g of dried LiC1. The salt
was stirred until it dissolved, and the solvent was filtered through a Teflon filter with a glass
filter apparatus 5. Filtered samples were analyzed on a GPC system consisting of an automated
sampler (Waters WISP) with an HPLC pump (Waters Model 590), pulse dampener (Viscotek),
viscometer detector (Viscotek Model 100), and refractive index detector (Waters Model 410),
at a flow rate of 1.0 mL/min. The detectors were connected in series with the refractive index
detector last due to back-pressure considerations. The columns configuration consisted of three
101aMixed-B columns (Burdick & Jackson/Polymer Laboratories) preceded by a guard column
(Burdick & Jackson/Polymer Laboratories). The system was operated at 80"C, with temperature
controlled by a column heater (Waters column temperature system). Injection volumes were 100
and 150 laL with a run time of 34 rain per sample. Data acquisition and calculations were
performed using the software package TriSEC GPC 6. Universal calibration was determined with
570

polystyrene standards dissolved directly in DMAc/0.5% LiC1. The universal calibration curve
was linear as a logarithmic function of the product of the intrinsic viscosity times molecular
weight versus retention volume using a third-order fit. Data were obtained from two dissolutions
per sample with two GPC runs per dissolution.
RESULTS AND DISCUSSION
Solution Properties of Polysaccharides
In analyzing dilute solutions of the polysaccharides in T_ble I dissolved in DMAc/LiCI
via GPC, the following parameters were determined: weight-average molecular weight (/_),
number-average molecular weight (_7I,),Goldwasser _I,, molecular weight polydispersity ratio
(PD = _ (Table II), weight-average intrinsic viscosity ([rl]_), weight-average radius of
gyration (Rgw),Mark-Houwink constants (a and log K) (Table liT), and branching number (Bn)
and branching frequency (X).Branching calculations were made according to the theory of Zimm
and Stockmayer via TriSEC software6 and correlated well with calculated parameters. Small
deviations in branching results are likely due to underlying assumptions in the theory involving
long-chain branching and theta (0) solvents7"8.
Even though the dextrans are generally described as being branched glueans, it has been
reported that lower molecular weight (MW) dextrans possess a near-linear StruCtUre 9. Previously
reported results from our group support this conclusion and extend the range of near-linearity to
-< -2.5 × I05. The importance of this fact will become evident in the discussion to follow.
A Mark-Houwink equation for near-linear dextrans dissolved in DMAc/LiC1 was derived7, with
the values a = 1.3 and K = 1.7 × 10⁷. A plot of the MWD of several dextran standards with
varying _ is given in Figure 1. It can be seen that the lower MW dextrans (T10, T70) have
fairly narrow MWD and polydispersity ratios -I-1.5, while the higher MW dextran (T2000) has
a broad MWD and large PD. Intrinsic viscosity was found to be more correlated to radius of
gyration (r = 0.958) than to lVI,,(r = 0.667), which is the ease for other classes of compounds 23.
571

As mentioned above, a linear molecule will occupy a larger hydrodynamic volume than
a branched molecule of equal molecular weight. The latter's higher coil density will be reflected
in lower values for its [rl] and Rg (as well as higher values for _. and Bn), and deviations from
linearity will be observed in the dependence of log [rl]wvs. log _7L,1°'1_.Archetypal behavior can
be observed when comparing arabinogalactan with dextran LF. The first is a highly branched
galactan consisting of two main fractions. Approximately 10% of the molecular weight fraction
is located below MW = 20,000 and comprises the smaller of the two main fractions, with 1_
~ 14,000. The larger fraction comprises the other approximately 90% of the molecular weight
fraction, with I_ ~ 90,000. The overall 1_ of this polysaccharide is 8.4 x 10⁴. Dextran LF is
a near-linear dextran (see definition above) with an l_w equivalent to that of arabinogalaetan
(Table II). Even though the values for _ for these two saccharides are nearly identical, large
differences in their solution behavior earl be noted by comparing such parameters as [rl],, (0.06
dL/g for arabinogalactan vs. 0.38 for dextran LF) and Rg,, (5.2 nm for arabinogalactan vs. 10.0
for dextran LF) (Figure 2 and Table 11). The constant a, which has proven to be a good indicator
of branching for the dextrans, is similarly much smaller for arabinogalactan (-0.1) than for the
dextran (1.1) (Table 1/I). This wide variability in solution behavior can be explained by the
extensive branching of the arabinogalaetan (X = 0.61, Bn ~ 300). Much smaller values would
be expected for the near-linear dextran for the branching argument to hold, and indeed _ = 0.08
and Bn ~ 9 for dextran LF.
A further example of the influence of branching of the main polysaccharide chain on
solution behavior is given by contrasting potato amylose with dextran T500. The former is a
linear gluean while the latter is branched (Table I). Their NI_ values are fairly close (< 15%
difference), although the MWD of dextran T500 is slightly higher (Figure 3). Significant
differences may be observed in the high-MW portion of the dextran, where the majority of the
branching is believed to occur in dextrans 7. Here its [rl]w and Rg_ are lower than those of the
amylose.
When comparing the two major components of starch, amylose and amylopectin, to each
other, the second had a higher M_, regardless of the source (corn or potato). While the branched
572

amylopectins did have a lower [_],,. than the amyloses (Table III), it is not prudent to compare
solution parameters for these two classes of polysaccharides due to the large differences in their
1_,, values and MWD (Table II and Figures 4 and 5). This set of examples showcases the ability
of the GPC technique to provide multiple profiles of a number of important solution parameters.
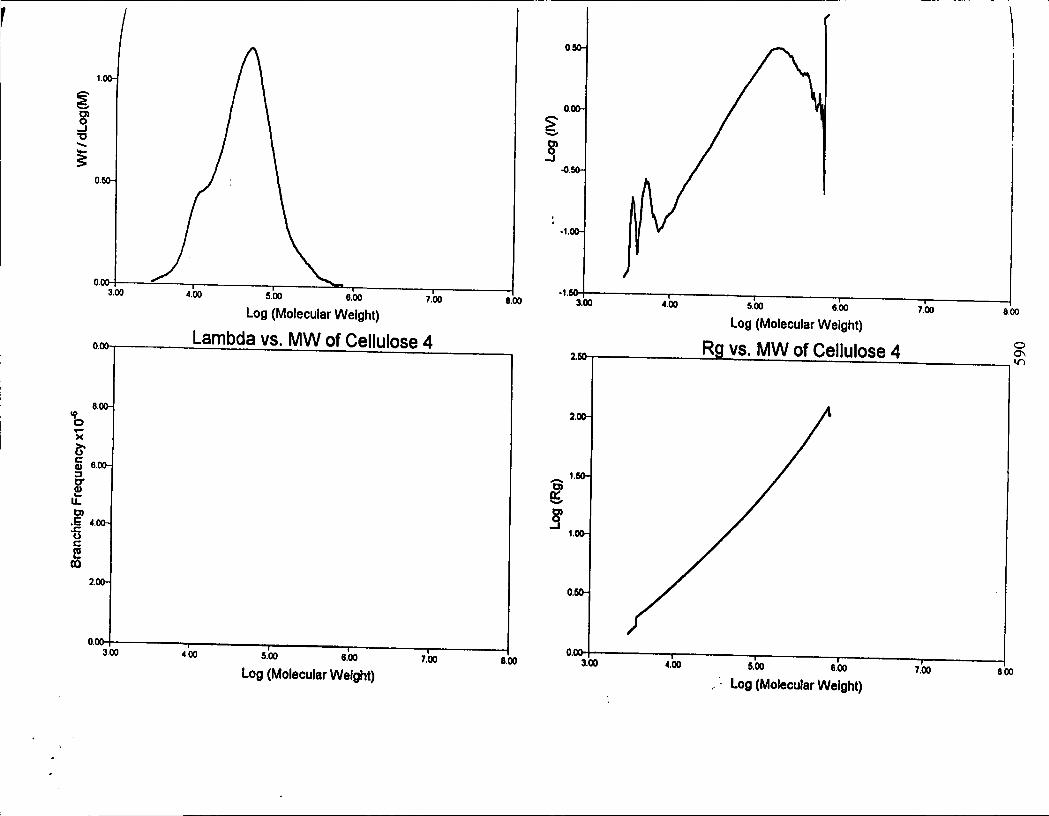
Cellulose and pullulan are both linear molecules with a wide variety of applications (Table
I). The broad MWD and low MW ranges observed for the cellulose powders analyzed (Table II
and Figure 6) are in direct contrast to the high MW secondary wall component of native cotton
fiber5. Cellulose 5 was used as a linear polymer reference for the branching calculations. Even
though pulhlan is a linear carbohydrate, a small degree of branching is observed (Figure 7).
While it is impossible from this study to conclude with certainty the reason for the branching,
we postulate what we believe to be a likely cause. The structure of pullulan consists of repeating
units of maltotriose (a-D-(l_4) linkages)joined by tx-D-(I---_6) linkages in a step-wise manner.
In addition, pulhlan contains -6.6% ofa maltotetraose subunit 2'. It should not be concluded that
the maltotetraose units are arranged in such a fashion as to cause short-chain branching, as Catley
and Whelan showed that the tetramer is linked exclusively through its ends in pullulan 12.We
propose that it is possible that the combination of different repeating units, linkage types, and the
step-wise arrangement of the molecule all contribute to the amount of branching observed.
Choice of Solvent
A number of polymer properties are dependent upon the solvent used. Macromolecular
chains or coils tend to form secondary valence bonds within the molecules themselves. If a poor
solvent is used, undissolved associated segments will be found within the coil, and consequently
the coil will be tighter and its viscosity lower. A molecule dissolved in a better solvent will have
fewer secondary valence links within its coil, as molecules of the dissolved material will form
secondary valence bonds with molecules of the solvent. The coil density will thus be lower and
the viscosity higher. Polymers such as cellulose, which possess strong secondary valence links
in the form of hydrogen bonds will be dissolved only if the solvent attaches itself to the chain
with a strength equal to or greater than that of the hydrogen bonds. A logical conclusion to be
573

drawn is that any solvent capable of dissolving cellulose will be by definition a good solvent for
this type of molecule. In such a solvent coil densities will be low and, accordingly, viscosities
will be high s'l°.
At the theta (0) temperature s the chemical potential of the chain-solvent reaction in the
volume element becomes zero. Accordingly the 0 temperature is also known as the ideal
temperature, and usually lies in the range 0-40°C. If the exponent a = 0.5 in a solvent at the
0 temperature, the solvent is known as a 0 solvent. Good solvents exert a buttressing effect on
the molecular backbone; the coil will be stiffened and expanded, and a will not be 0.5 but a
much higher value which can reach 1 or 2 for bulky and/or maximally extended chains 1°.
The DMAc/LiC1 solvent system has been employed to dissolve cellulose 13._4.Our
laboratory has developed procedures for the dissolution and characterization of high MW
cellulose chains in cotton fiber without the need for prior extraction, derivatization, or
fractionation 5. In this study branching was related to decreases in the value of a (Table 111).
Intrinsic viscosity provides an index of random coil dimensions and chain conformation through
the Mark-Houwink equation _. Values for [rl],, <- -1.0 were observed with the exception of
arabinogalactan, which has been addressed above. All carbohydrates were dissolved without
difficulty. Comparison of observed solution behavior to that characteristic of polymers in dilute
solutions leads to the conclusion that DMAc/LiC1 is a good solvent for polysaccharides. A major
advantage gained by employing this solvent system is that it can be used both for dissolving the
starting material as well as the processed or derivatized products t3-ts'_6.Therefore the solvent used
for dissolution is the same as the mobile phase being utilized in the GPC analysis, and the
polymer properties will not vary as a function of solvent.
Another parameter of importance in GPC analysis of polysaccharides is temperature. It
will exert an effect on the secondary valence bonds, and consequently on parameters such as [rl].
Accordingly, it is extremely important that the temperature be kept constant over the course of
the experiment. To this effect a column heater was used to control the temperature and maintain
it at 80°C. In addition, the elevated temperature assists in decreasing the viscosity of the mobile
574

l ]phase.
Goldwasser 1_7I.
The number-average molecular weight, 1_,, provides a way of measuring the Maverage"
chain length in a polymer sample. It has been correlated with a number of polymer physical
properties such as fiber and film strength, polymer solubility, fiber tenacity, solution viscosity,
etc 17.Goldwasser has proposed a method for the determination of 1_ using an online differential
viscometer as the sole detector 4. This method eliminates the need to utilize Mark-Houwink
constants or to determine the weight fraction of the eluting sample with a concentration (e.g.
refractive index) detector. He derived (I) to calculate the number-average molecular weight.
1_n = {3_bC_V_}/{4/_VsE(rl.p,/Vhi) } (1)
Where t_ = Flory constant
C_ = Injected polymer concentration
VI = Injection volume
Vs = Slice volume
q,pi = Specific viscosity of eluting species i
Vhi = Hydrodynamic volume of eluting polymer species i
Goldwasser obtained good agreement between the number-averages determined by his
method and those expected using Mark-Houwink constants for several different polymers and
polymer mixtures. Other research _oups who applied this concept to the characterization of
copolymers by GPC found that Goldwasser lfl. values sometimes correlated well with averages
obtained by other methods (e.g., light scattering), but sometimes showed large deviations which
remained unexplained is.
Comparison of the l_n obtained by both methods can be made from those results shown
in Table II. 1_ values obtained with and without the concentration detector follow the same
575

pattern detected by Gores and Kilz, sometimes showing good agreement with each other and
sometimes not. The overall correlation between the two was poor (r2 = 0.641). A different
picture appears when looking at the molecular weight polydispersity ratio, lVI,JlVl,.This ratio is
a measure of the breadth of the polymer molecular weight distribution. Results derived from
using the 1Vl,obtained with the refractive index detector were comparable to those obtained using
the average derived from Goldwasser's method (r2 = 0.999). While no logical explanation has
been found for the sometimes large deviations in 1VI,values from method to method, we agree
with other researchers in that calculated values are dependent upon baseline settings and baseline
noise tS. It is likely that these factors become even more important at the lower molecular weight
end of the chromatogram, which is more heavily influential upon the number-average molecular
weight.
Universal Calibration
Universal calibration as applied to GPC takes into account the behavior of the polymer
in solution, thereby providing accurate MW values 3. Linear calibration curves are obtained
employing this method, which describes the relationship between hydrodynamic volume (log MW
x [rl]) and retention volume. It avoids the problem of limited availability of polymer standards
having identical chemical structure and narrow MWD at discrete levels of molecular weight over
the range of MW of the unknown polymers. It was thus possible to use polystyrene (PS)
standards of sharp MWD, known MW and covering a wide range of MW valuess. This
methodology has been applied in our laboratory for monitoring cell wall polymers during cotton
fiber development _9'-'°, and was subsequently extended to quantify the effects of extrusion
processing on starches from corn and wheat tS'2t'22.PS standards were also employed in the
calculations for the samples described in this paper. Universal calibration curves were obmlned
with the carbohydrates of known MW studied here (data not shown). Although the data appeared
to agree with the PS calibration, the carbohydrate standards do not extend over as large a MW
range as the calibration curve obtained with the polystyrene stalldards 7.
576
CONCLUSIONS
GPC with differential viscometer and refractive index detectors is an effective means of
characterizing important solution parameters of polysaccharides dissolved in DMAc/LiC1, over
the range of the MWD. Applying the concept of universal calibration based on polystyrene
standards afforded 1_ values comparable to those supplied with the carbohydrates. This curve
extended over a greater MW range than curves obtained using the carbohydrates. The parameters
determined were related to branched versus linear composition of the polymers within the limits
of the determinations, lVlnvalues determined with the refractive index as a detector and without
(Goldwasser's approach) show wide variability in their correlations, sometimes being closely
correlated and sometimes not. While no suitable theory has emerged to explain this behavior,
molecular weight polydispersity ratios calculated using both number averages do show good
correlation. Finally, DMAe/LiC1 seems to behave as a thermodynamieaUy good solvent for
polysaccharides, one in which dilute solution behavior can be readily studied.
ACKNOWI _EDGEMENTS
We thank Dr. Richard Cole (University of New Orleans) for his valuable advice and partial
sponsorship of this work under USDA, ARS Cooperative Agreement 58-6435-2-110. We also
thank Drs. Margaret Clarke and Les Edye (Sugar Processing Research Institute) for the gift of
the dextrans, Drs. Bruce Wasserman and Mary Politz (Rutgers University) for the amyloses and
amylopectins, and Dr. Barbara Triplett (SRRC) for helpful discussions.
NOTES
Names of companies or commercial products are given solely for the purpose of providing
specific information; their mention does not imply recommendation or endorsementby the Unites
States Department of Agriculture over others not mentioned.
577

SAFETY CONSIDERATIONS
N,N-dimethylacetamide is an exceptional contact hazard that may be harmful if inhaled or
absorbed through skin and may be fatal to embryonic life in pregnant females (Baker Chemical
C. N,N-dimethylacetamide, Material Safety Data Sheet, 1985, D5784-01; pp. 1-4).
REFERENCES
1. R.L. Whistler and J.N. BeMiller (Eds.), Industrial Gums, 3rd ed., Academic Press, San
Diego (1993).
2. A. Varld, Glycobiol., 3 (1993) 97-130.
3. A. Grubisic, P. Rempp, H.A. Benoit, Polym. Lett., 5 (1967) 753-759.
4. J.M. Goldwasser, in T. Provder (Ed.), Chromatography ofPolymers -Charcterization by
SEC and FFF, ACS Symposium Series 521, American Chemical Society, Washington,
D.C. (1993) 243-251.
5. J.D. Timpa, J. Agr. Food Chem., 39 (1991) 270-275.
6. TriSEC GPC Software, Release V 2.61, (c) 1994, Viscotek Corp.
7. A.M. Striegel and J.D. Timpa, Carbohydr. Res. (in press).
8. P.J. Flory, Principles of Polyn_r Chemistry, ComeU University Press, Ithaca, N.Y.
(1953) 610-612, 622-626.
9. K. Gekko, Makromol. Chem., 148 (1971) 229-238.
10. B. Vollmert, Polymer Chemistry, Springer-Verlag, New York (1973) 513-529.
11. L. Vilenchik and R. Ayotte, J. App. Polym. Sci.: App. Polym. Syrup. 51 (1992) 73-90.
12. B.J. Cafley and W.J. Whelan, Arch. Biochem. Biophys., 143 (1971) 138-142.
13. C.L. MeCromick, P.A. CaUais and B.H. Hutchinson, Macromol., 18 (1985) 2394-2401.
14. A.F. Turbak, A. E1-Kafrawy, F.W. Snyder and A.B. Auerbach, U.S. Patent 4,302,252
0981).
15. M.L. Politz, J.D. Timpa, A.R. White and B.P. Wasserman, Carbohydr. Polym. 24
(1994) 91-99.
578

16. T.R. Dawsey and C.L. McCormick, JMS-Rev. Macromol. Chem.Phys. , C30 (1990) 405-
440.
17. W.W. Yau, J.J. Kirkland,and D.D. Bly, Modern Si2v-Exclusion &'quidChromatography,
John Wiley & Sons, New York (1979).
18. F. Gores and P. Kilz, in T. Provder (Ed.), Chromatography of Polymers -Characteriza-
tion by SBC and FFF, ACS Symposium Series 521, American Chemical Society,
Washington, D.C. (1993) 122-148.
19. J.D. Timpa, in T. Provder (Ed.), Chromatography of Polymers -Characterization by SBC
and FFF, ACS Symposium Series 521, American Chemical Society, Washington D.C.
(1993) 302-313.
20. J.D. Timpa and B.A. Triplett, Planta, 189 (1993) 101-108.
21. B.P. Wassermanand J.D. Timpa, Starch/Starl_, 43 (1991) 389-392.
22. M.L. Politz, J.D. Timpa and B.P. Wasserman, Cereal Chem. (in press).
23. M.L. Fishman, D.T. Gillespie and B. Levaj, in T. Provder (Ed.), Chromatography of
Pol3_ners -Characterization by SEC and FFF, ACS Symposium Series 521, American
Chemical Society, Washington, D.C. (1993) 314-325.
24. Y.Tsujisaka and M. Mitsuhashi,in I. 447-460.
579

Table I
Structure and applications of selected polysaccharides.
Polysaccharide Branching and Linkage Applications
Amylopeetin branched (l---_4)-a-D-glucan Food product.
Amylose linear (1---_4)-a-D_lucan Food product.
Arabinogalactan branched (l---_3)-I_-D-galactan In printing, mining,pharmaceutical, andfood industries.
Cellulose linear (1--+4)-[_-D-glucan In textile, pulp andpaper, and plasticsindustries.
Dextran branched (l_6)-_-D-glucan In the medical field.In the cosmetics and
photography indus-tries. Chromato-
graphy standards.
Pullulan linear (l---_6)-ot-D-glucan In the food, printing,plastics, cosmetics,medical, and pharma-ceutical industries.Chromatographystandards.
580

Table !1
Calculated molecular weight averages of polysaccharides dissolved in DMAc/LiCI.
Sample ID l_w l_w" l_. ° 1_.° PD(I) b PD(2y(Supplied) (with RI) (Goldwasser)
Amylopectin (Potato) N/A d 1.2 × 10⁶ 5.8 x 10⁴ 7.1 x 10⁴ 21.4 18.0Amylopectin (Corn) N/A 2.1 x 10⁷ 6:1 x 10⁴ 3.3 x 10⁴ 349.0 689.0
Amylose (Potato) N/A 4.9 x I0"_ 5.0 x 10⁴ 4.3 x 10⁴ 9.8 I 1.4Amylose (Corn) N/A 6.2 x lO-_ 8.6 x 10⁴ 7.3 x 10⁴ 7.2 8.7Arabinogalactan 8.0 x 10⁴ 8.4 x 10⁴ 3.2 x 10⁴ 3.6 x 10⁴ 2.6 2.3Cellulose 4 1.8 x 10"_ 1.8 x 10"_ 2.7 x 10⁴ 2.7 x 10⁴ 6.8 6.8Cellulose 5 3.2 x 10_ 3.3 x I05 4.2 x 10⁴ 4.6 x 10⁴ 7.9 7.2
Dextran TIO l.O × 104 1.9 x IO4 1.7 x 10⁴ 1.8 x 10⁴ I.I 1.0Dextran T40 4.4 x IO4 4.7 x IO' 3.6 x IO' 3.4 x 10⁴ 1.3 1.3Dextran T70 7.0 x IO4 7.6 x 10⁴ 4.8 x IO' 3.9 x 10⁴ 1.6 2.0
Dextran LFt 6.0 - 9.0 x 10⁴ 8.4 x lO' 6.4 x 10⁴ 2.5 x 10⁴ 1.3 3.4Dextran HF g 2.0 - 3.0 x !0 "_ 2.5 x IOs 5.6 x 10⁴ 3.8 x 10⁴ 4.4 6.6Dextran T500 5.0 x 10"_ 5.5 x 10"_ 6.8 x 10⁴ 4.5 x 10⁴ 7.9 12.7Dextran T2000 2.0 x 10⁶ !.9 x I0_ 5.4 x 10⁴ 5.4 x !04 36.2 36.3 o_Dextran 1Gh 5.0- 40.0 x 10⁶ 5.1 x 10⁶ 4.8 x 10⁴ 4.8 x 10⁴ 104.9 108.8
Pullulan I 1.0 x l0 "_ l.l x l0 s 3.5 x l04 3.4 x 10⁴ 3.0 3.2Pullulan 3 3.0 x l0 "_ 3.1 x l0 _ 3.4 × 10⁴ 3.3 x l04 9.3 9.6
"Values calculated using GPC. bPD(I) = M,,/I_, (with RI). 'PD(2) = l_wlM, (Goldwasser). JN/A = Value not available.Walues from ref 13. rLF = Low Fraction. SHF -- High Fraction. biG = Industrial Grade.

Table III
I Calculated solution parameters for polysaccharides in DMAc/LiC1.
Sample [D [qk Rg,, Mark-Houwink
(dL/g) (tam) a . log K
Amylopectin (Potato) 0.59 25.7 0.4 -2.7
Amylopectin (Corn) 0.40 33.0 0.2 -1.9Amylose (Potato) 0.83 17.7 0.9 -5.1Amylose (Corn) 0.65 19.2 0.7 -4.0Arabinogalactan 0.06 5.2 -0.1 -0.9Cellulose 4 1.04 14.0 1.0 -5.1Cellulose 5 0.71 16.2 0.7 -4.0Dextran TI0 0.15 4.5 1.1 -5.5
Dextran T40 0.29 7.3 1.8 -8.8Dextran T70 0.40 9.4 1.4 -7.4Dextran LF_ 0.38 10.0 1.1 -5.8Dextran HF ° 0.64 16.2 0.5 -3.0
Dextran TS00 0.84 21.0 0.4 -2.3Dextran T2000 0.78 26.1 0.4 -2.5Dextran IGc 0.14 21.1 0.4 -3.6Pullulan 1 0.69 12.3 1.1 -5.6Pullulan 3 0.89 14.5 0.8 -4.3
*LF = Low Fraction. bHF = High Fraction. ClG = I.ndn_trial Grade.
582

rLEGENDS FOR FIGURES
Figure 1. Relationship between molecular weight distributions (MWD) of dextrans TI0,
T70, and T2000.
Figure 2. Solution parameters of arabinogalactan. (A) Molecular weight distribution
(MWD). (B) log-log plot of intrinsic viscosity ([rl]) vs.
molecular weight (MW). (C) Plot of branching frequency CA)vs.
log molecular weight. (D) log-log plot of radius of gyration (Rg)
vs. molecular weight (MW).
Figure 3. Solution parameters of arabinogalactan. (A) Molecular weight
distribution (MWD). (B) log-log plot of intrinsic viscosity
([rl]) vs. molecular weight (MW). (C) Plot of branching frequency
CA)vs. log molecular weight (MW). (D) log-log plot of radius of
gyration (Rg) vs. molecular weight (MW).
Figure 4. Solution parameters of corn amylose. (A) Molecular weight
distribution (MWD). (B) log-log plot of intrinsic viscosity
([rid vs. molecular weight (MW). (C) Plot of branching frequency
CA)vs. molecular weight. (D) log-log plot of radius of gyration
(Rg) vs. molecular weight (MW).
Figure 5. Solution parameters of corn amylopectin. (A) Molecular weight
distribution (MWD). (B) log-log plot of intrinsic viscosity
([rid vs. molecular weight (MW). (C) Plot of branching frequency
CA)vs. molecular weight. (D) log-log plot of radius of gyration
(Rg) vs. molecular weight.
Figure 6. Solution parameters of cellulose 4. (A) Molecular weight
distribution (MWD). (B) log-log plot of intrinsic viscosity
583

([rl]) vs. molecular weight (MW). (C) Plot of branching frequency (_.) vs.
molecular weight. (D) log-log plot of radius of gyration (Rg) vs. molecularweight.
Figure 7. Solution parameters of pullulan 1. (A) Molecular weight distribution (MWD).
(B) log-log plot of intrinsic viscosity ([q]) vs. molecular weight (MW). (C) Plot
of branching frequency ('A)vs. molecular weight. (D) log-log plot of radius of
gyration (Rg) vs. molecular weight.
584

Figure 1.
,oo Molecular Weight Distribution of Dextrans
T10
3.00- _ T70,_ f
0..! 2.00-"10
1.00-

2.O0- -O.50-
1.00- _ ..
• 150-
0.00 , -2,50! !3oo ,0o _0o e0o 7_o aoo 30o ,0o 5_o 6_o '• 7.00 8.0O
Log(MolecularWeight) Log (MolecularWeight) _o
,5.o Lambdavs. MW ofArabinogalactan ,.= Rg vs. MW of Arabinogalactan oo
12.0-
_) 1.00"
U.
.G
"_C 6.0-0.50-
rn
3.0-0.0 J 0.0O3.00 ,.0o 5.0o e._o _._o a.0o 3.00 ,._o 5._o e._o 7._o a.0o
Log(MolecularWeight) ..:Log(MolecularWeight)

_.)- • ....
IV vs. MW of DextranT500MWD of DextranT500 o.5o
; 1.50 I
0._1"
1.00"
• _ _ -0.I_"
0.50-
: .1.1111-J.
o.oo . 7:oo a.oo 3.oo ,.oo s._o 6.'0o 7:o0 8.oo3.00 4.00 5.00 6.00
Log (MolecularWeight) Log (MolecularWeight) t--
Lambda vs. MW of Dextran T500 zoo Rgvs. MW of Dextran T5002.50
2.00-
-_'O 1.50
x
_ 1.50- _,- _ 1.(_-
._= l._-r-
_ o._-IX)
0.50-f
• _ _ J o._o.oo , ' 4._o s._o 6._o 7._o 6.go3.o0 ,,.oo 5:oo sJoo 7.00 6.oo =.ooLog (MolecularWeight) " Log(MolecularWeight)
/

f j
|
O.OC -I.S0• !
3.o0 _oo 5.oo 6.oo 7.oo 8,oo 3.oo 4.oo 5._o e._o 7._o 8.oo
Log(MolecularWeight) Log(MolecularWeight)oo
,._o Lambda vs. MW of Corn Amylose Rg vs. MWof CornAmylose _
bx
.1 1.50-
U.
GI
IO.OO L. O.OO
i
3.00 ,.oo s._o e._o 7._o a.oo 3.oo ,._o s._o e._o 7._o aooLog (MolecularWeight) .Log(MolecularWeight)

• AbUA_; ,..),
MWD of CornAmylopectin IV vs. MW of Corn Amylopectin0.00 0.50
I
0.00 , , -250 ,3.00 ,.oo 5._o 6._o 7.00 a.oo 3.oo ,,.oo 5._o e_oo 7;00 6.00Log(MolecularWeight) Log (MolecularWeight) oo
Lambdavs. MW.of CornAmylopectin Rg vs. MW of CornAm_5.00
4.00-
¢..
O').cJ_ 2.00-e-
1.00-
0.00 _---- _ '3.0o ,ioo s_oo 67oo _;oo a.oo 3.oo ,._o s._o e._o 7._o aooLog (MolecularWeight) Log(MolecularWeight)
0.50-
1.00-
-0.50-
0.50--
-1.00-
0.00. , -1.503.oo ,.oo 5.oo e.oo 7._o a.oo 3.oo ,._o 5._o 6._o 7._o aoo
Log(MolecularWeight) Log(MolecularWeight)
o.oo Lambdavs. MW of Cellulose4 2.= Rg vs. MW of Cellulose4 o_
8.00- 2.00-
X
i e°°- _."_
_) 4.0o- 1.0o-,mr-¢.)C
O0
2.00- 0.50"
0.00- , 0.003oo _._o 5._o e_ ",_oo a.oo 3.0o 4Joo s:oo e._o _.oo 80oLog (MolecularWeight) _- Log(MolecularWeight)

MWD of Pullulan 1 IV vs. MW of Pullulan 11.50 1.50
/_ 0.50-1.00-
0.50-
0.00 _ -2.50300 ,'00 s._o e_oo 7._0 aoo 3.00 4_00 s_o e_o 7._0 aoo
Log(MolecularWeight) Log(MolecularWeight)
Lambda vs. MW of Pullulan1 Rg vs. MW of Pullulan1 o_ZOO 2.00
I
1.50- 1.50-
LL, 1.00- 1.00-
II1
0.50- 0.50-
,o.oo ..... o.ooi
_.oo __ s'oo e_oo 7.'oo a.oo 3.oo ,._o 5._o 6._o 7._ 8oo
Log (,MolecularWeight) ' Log(MolecularWeight)
m ............ i ,, ,, i i ii ........ -- -- _ __


![Comparison of Regulated Methods Using Ion Chromatography ... · natural mineral waters and spring waters treated by ozonation [8]. However, these limits were based on the feasibility](https://img.pdfslide.net/doc/110x75/5e53e6b27bdaf83730474aa4/comparison-of-regulated-methods-using-ion-chromatography-natural-mineral-waters.jpg)