Embed Size (px)
Citation preview

Scientia Iranica A (2021) 28(1), 124{137
Sharif University of TechnologyScientia Iranica
Transactions A: Civil Engineeringhttp://scientiairanica.sharif.edu
Comparison of static pushover analysis and IDA-basedprobabilistic methods for assessing the seismicperformance factors of diagrid structures
A. Seyedkazemia and F. Rahimzadeh Rofooeib;�
a. Department of Civil Engineering, Sharif University of Technology, Kish International Branch, Kish Island, Iran.b. Department of Civil Engineering, Sharif University of Technology, Tehran, Iran.
Received 14 September 2018; received in revised form 11 January 2019; accepted 26 August 2019
KEYWORDSDiagrids;Steel structures;Pushover analysis;Nonlinear dynamicanalysis;Seismic performancefactors.
Abstract. The present study aims to reliably quantify the seismic response parametersof steel diagrid structural systems. To this end, in addition to the conventional StaticPushover Analysis (SPA), Dynamic Pushover Analysis (DPA) based on IncrementalDynamic Analysis (IDA) technique was taken into account. FEMA P-695 recommendsa methodology for establishing Seismic Performance Factors (SPFs). The objective of thepresent study was to propose a simpler framework for estimating and validating SPFs whileapplying the concepts of FEMA P-695 guideline. The results showed that the R factorsobtained through SPA procedure for steel diagrid systems were conservative and the IDA-based probabilistic method ensured a more rational value for the R coe�cient. Furthermore,the proposed simpli�ed method was in agreement with FEMA P-695 in predicting thecollapse capacity of diagrid models.
© 2021 Sharif University of Technology. All rights reserved.
1. Introduction
Today, diagrids are among the common structuralsystems utilized in high-rise buildings. These systemsconsist of diagonal grids on the perimeter of thebuildings, making them stable even in the absence ofcolumns [1]. Previous studies have focused on devel-oping design criteria for diagrid structures in termsof sti�ness and strength [2{4]. Other studies haveinvestigated the ultimate capacity and performanceof these structures under lateral loading [1,5,6]. Thee�ect of the angle of the diagonal elements on the
*. Corresponding author. Tel./Fax: +98 21 6616-4233E-mail addresses: [email protected] (A.Seyedkazemi); [email protected] (F. Rahimzadeh Rofooei)
doi: 10.24200/sci.2019.51555.2250
lateral load-carrying capability of diagrid structureswas examined in References [7,8]. The results indicatedthat the diagrids had high sti�ness and low ductility.Such characteristics facilitate the development of largerseismic loads than a tubular structure with the sameproperties.
Thus, it is essential to further study the seismicbehavior of this structural system. Seismic Perfor-mance Factors (SPFs), i.e., the over-strength, ductility,and response modi�cation factors (R), are appropriateindicators for describing the seismic behavior of struc-tural systems. However, few studies have assessed theSPFs of diagrid systems; thus, they have not beenexplicitly introduced in the existing building codes.According to a study carried out by Baker et al. [9],the response modi�cation factor was determined tobe 3.64 for a particular diagrid structure using thePerform 3-D program [10]. In their study, the post-
A. Seyedkazemi and F. Rahimzadeh Rofooei/Scientia Iranica, Transactions A: Civil Engineering 28 (2021) 124{137 125
buckling behavior of diagonal members in compressionwas discarded. In addition, Static Pushover Analysis(SPA) was performed to calculate the initial R fac-tor.
SPA was also employed to determine the SPFsof other structural systems [11{13] due to its simplic-ity and ease of use. However, the results obtainedfrom SPA are strongly dependent on the employedlateral load pattern. To this end, many studies havebeen carried out in recent years to propose e�cientload patterns for SPA [14{16]. However, the resultsobtained from the nonlinear dynamic analyses bearmore similarity to the actual behavior of the structuresthan the SPA, especially in high-rise buildings. Nev-ertheless, there are still major concerns regarding thedependency of these responses on the frequency contentof the selected earthquake records (i.e., the uncertaintyin responses). Therefore, a reliable evaluation of thecollapse capacity, seismic safety, and performance ofstructures is considered a major challenge in earth-quake engineering [17].
Several studies have been carried out to comparethe nonlinear static and dynamic analyses of somestructural systems [18{21] and their results indicatedthat the damage patterns and failure mechanisms,drawn from the static and dynamic analyses, were notin agreement. In other words, these two methods couldyield di�erent results, particularly in the case of struc-tures with severe damages. Therefore, both nonlinearstatic and dynamic analyses should be simultaneouslyutilized to accurately determine the seismic responseparameters of the buildings.
The present study aims to present a new frame-work for a reliable evaluation of the SPFs and collapseassessment of steel diagrid systems. The proposedprocedure, which is based on the concepts described inthe FEMA P-695 [22], employs both SPA and DynamicPushover Analysis (DPA) to estimate the initial R-factor. In this research, nonlinear analyses were carriedout using the OpenSees [23] program and the post-buckling behavior of diagonal members in compressionwas considered in their modeling.
2. Seismic Performance Factors (SPFs)
R factors are generally used in current building designcodes to estimate the strength and deformation de-mands of seismic-force-resisting structural systems thatare designed using linear methods while respondingin a nonlinear range [22]. In order to calculate theSPFs, the structural capacity curve (base shear versusroof displacement curve) is replaced by a bilinear curvebased on the equivalence in the energy absorptioncapacity as de�ned in ASCE 41-13 [24]. According tothe idealized pushover curve in Figure 1, the seismicperformance coe�cients are de�ned as follows [25]:
Figure 1. The lateral load-roof displacement relationship[25].
R = 0 R�Rr; 0 =VyVd;
R� =VeVy
; � =�max
�y; (1)
where R is the response modi�cation factor, and Vy, Vd,and Ve represent the yield strength, design shear force,and elastic shear strength of the structure, respectively.The parameter 0 represents the over-strength factor,R� is the ductility-related reduction factor, and Rr isthe redundancy factor that is assumed 1.0 for diagridstructures due to their multiple bays in each directionto resist the lateral loadings. � is the ductilityfactor of the system, �max is the roof displacementcorresponding to the maximum base shear or targetdisplacement, and �y is the yield displacement of thesystem.
3. Performance evaluation in FEMA P-695
In FEMA P-695, the structural models are divided intotwo performance groups as archetypes with T � Tsand T > Ts, where T is the fundamental periodof the structure and Ts is the transition period (theperiod between the constant acceleration and constantvelocity regions of the design spectrum). Then, bothnonlinear static analysis and Incremental DynamicAnalysis (IDA) were performed on the models. Thelateral load pattern used in the static nonlinear analysiswas proportional to the fundamental mode shape ofthe archetype model. The 44 far-�eld ground motionrecords provided in Table A-4A of FEMA P-695 [22]were utilized for the IDA. The steps in evaluating theperformance are as follows [26]:
1. The collapse probability is calculated using Col-

126 A. Seyedkazemi and F. Rahimzadeh Rofooei/Scientia Iranica, Transactions A: Civil Engineering 28 (2021) 124{137
lapse Margin Ratio (CMR) de�ned as follows:
CMR =SCTSMT
; (2)
where SCT is the median collapse capacity obtainedfrom the nonlinear dynamic analysis and SMT is theMaximum Considered Earthquake (MCE) groundmotion spectral demand.
2. Adjusted Collapse Margin Ratio (ACMR) is calcu-lated by multiplying CMR and a Spectral ShapeFactor (SSF):
ACMRi= SSFi�CMRi: (3)
SSF which is a function of the fundamental pe-riod (T ), period-based ductility (�T = �u/�y;eff ),and applicable Seismic Design Category (SDC) isdetermined using Table 7-1 of FEMA P-695 [22].While computing the period-based ductility, �uis the ultimate roof displacement de�ned as theroof displacement corresponding to 0:8 Vmax, whereVmax is the maximum shear force of the fullyyielded system and �y;eff is the e�ective yield roofdisplacement de�ned as follows:
�y;eff = C0Vmax
W
h g4�2
i(max (T; T1))2; (4)
where W is the building weight, g is the gravityacceleration, T is the fundamental period of thestructural model determined by Eq. 5-5 of FEMAP-695 [22], and T1 is the fundamental period ofthe structure calculated via modal analysis. Thecoe�cient C0 relates the fundamental mode dis-placement to the roof displacement and can beestimated as:
C0 = �1;r
NP1mi�1;i
NP1mi�2
1;i
; (5)
where mi is the mass at the story level, i, �l;i(�l;r)is the ordinate of the fundamental mode at storylevel i (r represents roof), and N is the number ofstories. Figure 2 depicts the maximum base shearforce, yield, and ultimate state in FEMA P-695methodology.
3. The acceptable values of the ACMR of the sys-tem are estimated. These values are denoted byACMR10% and ACMR20% for each performancegroup and individual archetype, respectively. Thesubscripts 10% and 20% refer to the probabilitylimits of collapse due to MCE ground motions. Ac-cording to Table 7-3 of FEMA P-695 [22], the valuesof ACMR10% and ACMR20% are determined based
Figure 2. Bilinear idealization of static pushover curve inFEMA P-695 [22].
on the total system collapse uncertainty (�TOT ),which depends on the quality grades related tothe design requirements (�DR), nonlinear models(�MDL), test data (�TD), and record-to-recordvariability (�RTR), as calculated below:
�TOT=q�2RTR+�2
DR+�2TD+�2
MDL; (6)
where �DR, �TD, and �MDL are rated as: Superior:� = 0:10, Good: � = 0:20, Fair: � = 0:35, andPoor: � = 0:50. �RTR is de�ned as follows:
�RTR = 0:1 + 0:1�T � 0:40: (7)
�RTR should be greater than or equal to 0.20.The computed values of ACMR are compared withtheir acceptable values. Acceptable performanceis achieved when the following relationships aresatis�ed:
ACMRi � ACMR10%; (8)
ACMRi � ACMR20%; (9)
where the subscript i refers to individual archetypeand ACMRi is the average value of ACMR foreach performance group. In case the system failsto accomplish the required performance objectives,the system should be rede�ned. Rede�ning thesystem could be done by modifying the designrequirements, recharacterizing the behavior, andredesigning it using a new trial value of R factor.Then, the new system is reevaluated using theaforementioned methodology.
4. New proposed framework for determiningthe SPFs
In case the FEMA P-695 methodology is used to eval-uate the seismic performance of the diagrid structures,the following problems may arise:
A. Seyedkazemi and F. Rahimzadeh Rofooei/Scientia Iranica, Transactions A: Civil Engineering 28 (2021) 124{137 127
1. In the process of determining the ductility ratio� using the SPA, the ultimate displacement isregarded as the roof displacement at the point of20% of the maximum strength loss (0:8 Vmax). Sincethe brittle fracture is the most common failuremode in a diagrid structure, collapse is likely tooccur at a displacement before the point of 0:8 Vmax;thus, determining the ultimate displacement usingan alternative method gains signi�cance;
2. Although FEMA P-695 does not directly provide amethod for determining the R factor, it validatesthe R factor used for design of models. It alsoemploys the SPA method to estimate � and 0while the IDA technique is applied for assessingthe R factor validity. This procedure is based onthe assumption that 100% of the e�ective seismicmass of the structural system contributes to thefundamental mode of vibration. However, in tallor special structures such as diagrid buildings, thee�ective modal mass ratios for higher modes aretaken into consideration. As a result, the SPFsobtained from the pushover analysis may turn outto be highly inaccurate;
3. FEMA P-965 utilizes a set of 44 records for assess-ing the collapse and validating the R factor. In casethe validity of the R factor used in the archetypedesign is not con�rmed, a new (lower) trial valueof the R factor must be re-evaluated. Thus, theassessment process can be time consuming.
Given the discussed issues, the following newframework is proposed to determine the SPFs:
1. The archetype model is analyzed using the SPAmethod. The static pushover curve is plotted andthe points corresponding to Vy, Vmax and ultimatedisplacement (�u) are determined;
2. The limited numbers of ground motion records(at least 7 records), adequately matched with thedesign spectrum, are selected from the FEMA P-695 far-�eld record set to perform the IDA;
3. The IDA is conducted to develop the IDA andDynamic Pushover Envelope (DPE) curves. Tothis end, the intensity of ground motion records isgradually increased until the collapse of structuralmodels. The maximum base shear force, roofdisplacement, inter-story drift, and spectralacceleration are calculated for each earthquakeintensity. The IDA and DPE curves are obtainedby plotting the spectral acceleration (ST ) versusmaximum inter-story drift ratios as well as themaximum base shear force versus the maximumroof displacement, respectively. The method forgenerating capacity curve (base shear force - roofdisplacement) is called (DPA);
4. By using the IDA curves, the collapse capacityand ultimate roof displacement for the structuralmodels are determined based on the lateraldynamic instability, as proposed by Vamvatsikosand Cornell [27]. The ultimate roof displacementcalculated by the IDA method may exceed the oneestimated using SPA method;
5. SPFs are computed using both SPA and DPEcurves. The average value for the SPFs calculatedby DPA is compared to that for the SPF estimatedby SPA, and the higher R factor is selected asa new updated R factor. For a tall or specialbuilding, choosing the R factor based on DPAresults seems more rational;
6. The structural model is redesigned with theupdated R factor and the validity of the modi�edSPFs is evaluated using the FEMA P-695procedure. The same ground motion records usedfor performance assessment are those that havebeen selected in Stage 3.
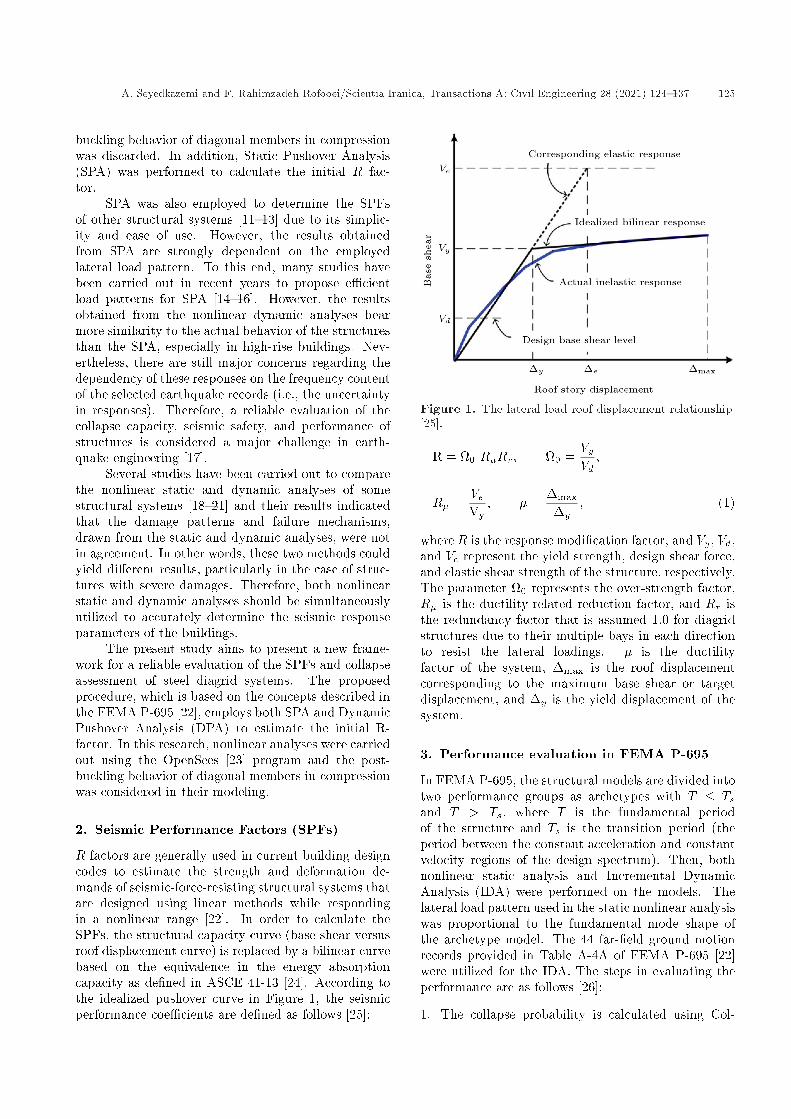
The outline of the proposed procedure for determiningthe SPFs is shown in Figure 3.
5. Designing the structural archetypes andnonlinear models
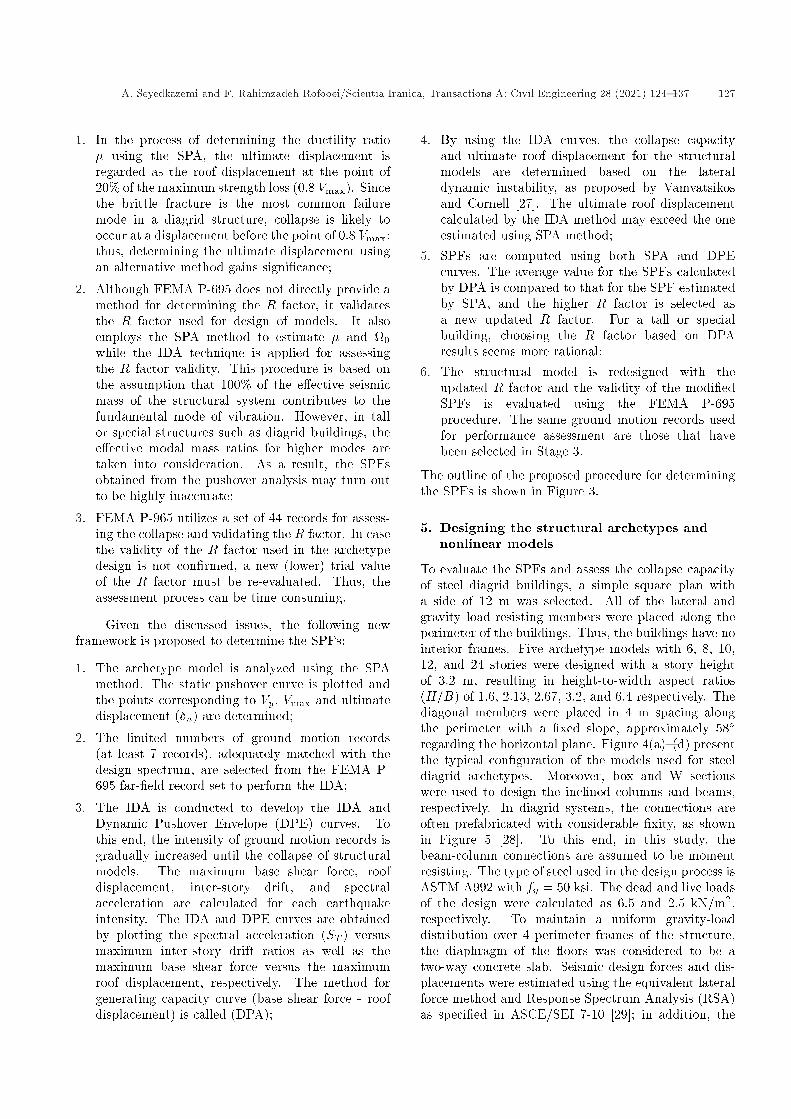
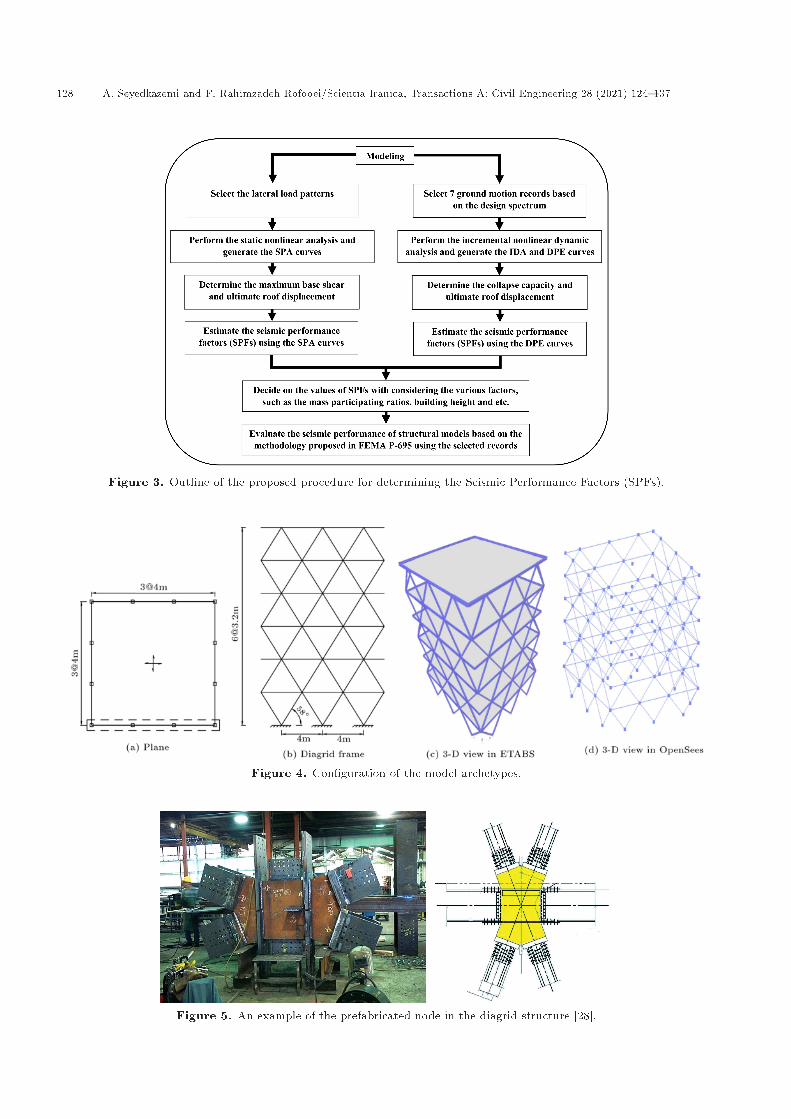
To evaluate the SPFs and assess the collapse capacityof steel diagrid buildings, a simple square plan witha side of 12 m was selected. All of the lateral andgravity load-resisting members were placed along theperimeter of the buildings. Thus, the buildings have nointerior frames. Five archetype models with 6, 8, 10,12, and 24 stories were designed with a story heightof 3.2 m, resulting in height-to-width aspect ratios(H=B) of 1.6, 2.13, 2.67, 3.2, and 6.4 respectively. Thediagonal members were placed in 4 m spacing alongthe perimeter with a �xed slope, approximately 58�regarding the horizontal plane. Figure 4(a){(d) presentthe typical con�guration of the models used for steeldiagrid archetypes. Moreover, box and W sectionswere used to design the inclined columns and beams,respectively. In diagrid systems, the connections areoften prefabricated with considerable �xity, as shownin Figure 5 [28]. To this end, in this study, thebeam-column connections are assumed to be momentresisting. The type of steel used in the design process isASTM A992 with fy = 50 ksi. The dead and live loadsof the design were calculated as 6.5 and 2.5 kN/m2,respectively. To maintain a uniform gravity-loaddistribution over 4 perimeter frames of the structure,the diaphragm of the oors was considered to be atwo-way concrete slab. Seismic design forces and dis-placements were estimated using the equivalent lateralforce method and Response Spectrum Analysis (RSA)as speci�ed in ASCE/SEI 7-10 [29]; in addition, the
128 A. Seyedkazemi and F. Rahimzadeh Rofooei/Scientia Iranica, Transactions A: Civil Engineering 28 (2021) 124{137
Figure 3. Outline of the proposed procedure for determining the Seismic Performance Factors (SPFs).
Figure 4. Con�guration of the model archetypes.
Figure 5. An example of the prefabricated node in the diagrid structure [28].

A. Seyedkazemi and F. Rahimzadeh Rofooei/Scientia Iranica, Transactions A: Civil Engineering 28 (2021) 124{137 129
Load and Resistance Factor Design (LRFD) methodin AISC 360-10 [30] was employed in their design. Inthis study, it was assumed that the diagrid structureswere located in a highly seismic zone and the designspectral acceleration parameters were SD1 = 0:6 g andSDS = 1 g. These values are in complete agreementwith those for the SDC Dmax in the FEMA P-695methodology. To design the models, a building sitewith soil type D, a seismic importance factor (Ie) of 1.0,and a Rayleigh damping matrix with a damping ratioof 5% for the �rst two modes were taken into account.Initially, the response modi�cation factor (R factor)was assumed to be 3 and was iteratively updatedin the proposed methodology; then, the redesignedstructural systems were re-evaluated based on FEMAP-695 methodology. The structural elements weredesigned using ETABS [31] software, and the OpenSeesprogram was used for nonlinear analyses and collapseevaluation. Table 1 shows the design base shear anddynamic characteristics of the diagrid archetypes.
To prepare the diagrid models in the OpenSeesprogram, each story mass was lumped at the oorlevel and the oor diaphragm was considered rigid. Anonlinear �ber beam-column element with a sectionconsidering the distributed plasticity was utilized formodeling di�erent members. The Menegotto-Pintomaterial model [32] with isotropic strain hardening of2% was employed to simulate the mechanical propertiesof the steel material. In this study, an approachsuggested by Uriz et al. [33] was used for modeling theinelastic buckling behavior of the diagonal members. Aco-rotational formulation was utilized to model the in-clined columns and examine the e�ects of buckling andlarge deformation. Figure 6 indicates the model usedfor the global buckling of diagonal columns. As Urizet al. [33] suggested in their study, the initial camberof the diagonal columns was 0.1% and the inelastic re-sponses in the critical sections of the elements were es-timated by considering 10 to 15 �bers across the depthof the cross-section and 5 integration points along eachelement. The Newton-Raphson algorithm was used forconducting the nonlinear dynamic analyses. To de�nethe Rayleigh damping matrix, as already explained, the
Figure 6. Implemented model to consider the bucklingbehavior of diagonal members.
Figure 7. Comparison between the pushover results inOpenSees and �ndings of Baker et al. [9].
damping ratios for the �rst two modes were measuredas 5%. The initial sti�ness matrix of the model wasutilized to generate the Rayleigh damping matrices.
In order to verify the modeling process and the re-sults obtained from the nonlinear analysis, the diagridstructural model used in a recent study conducted byBaker et al. [9] was re-modeled by utilizing OpenSeesprogram and keeping the critical assumptions identicalto the original model in Baker's paper. In this model,the post-buckling behavior of the diagonal membersin compression is ignored, while the P � � e�ectsare considered in the analysis. Figure 7 compares theresults of the NSA of the model prepared in OpenSeesprogram with those obtained by Baker et al. using thePerform-3D program. As observed, the results werein good agreement. The deviation of Baker's results
Table 1. Design base shear force and the modal properties of diagrid models.
Fundamental mode
Model ID number Vd (kN) Vd=W Period (sec) Modal participationmass (%)
6St-Diagrid 1913.6 0.333 0.435 71.58St-Diagrid 2565.6 0.333 0.595 67.710St-Diagrid 2595.2 0.242 0.826 65.312St-Diagrid 2467.6 0.190 1.080 64.224St-Diagrid 2683.5 0.113 3.098 59.8

130 A. Seyedkazemi and F. Rahimzadeh Rofooei/Scientia Iranica, Transactions A: Civil Engineering 28 (2021) 124{137
for roof displacements larger than 18 inches seems tobe related to the convergence issues of the utilizedprogram.
6. Nonlinear analyses and derivation of Rfactor
The gravity loads for nonlinear analyses are given inthe following load combination:
1:05D + 0:25L; (10)
where D and L are dead and live loads, respectively.To perform the nonlinear SPA, a lateral load patterncorresponding to the fundamental mode shape andmass distribution of the structure was applied, asshown in the following:
Fx / mx�1;x; (11)
where Fx, mx, and �1;x are the story seismic force,story mass, and ordinate of the fundamental modeat level x, respectively. To perform the IDAs, sevenearthquake records with adequate agreement with thedesign spectrum were selected from FEMA P-695 far-�eld record set. Table 2 shows the characteristics ofthe selected ground motion records. Figure 8 depictsthe response and design spectra of the selected records.
Figure 9(a){(e) show the static and dynamicpushover curves of the diagrid structural models. The
Figure 8. The design spectrum and the response spectraof the selected records.
points corresponding to the design base shear, yield,and ultimate displacement are marked on the pushovercurves. As shown in these �gures, the DPE curvesof the 24-story archetype have larger dispersion thanother mid-rise model buildings, indicating the sensitiv-ity of the nonlinear structural response of tall diagridbuildings to the time-varying frequency content ofground motion records. Furthermore, the values forSPFs of the proposed models are provided in Table 3.Given the SPFs data obtained from DPE curves, thecurves for the probability of exceedance are generatedemploying a cumulative distribution function de�nedby Eq. (12):
F (SPF = X) = 1� ��X � ��
�; (12)
where F is the probability of exceedance correspondingto the SPF equal to X, � is the normal cumulativedistribution function, and � and � are the mean andstandard deviation of the SPF values, respectively.Figure 10 shows the exceedance probability curves forSPFs of the diagrid models. For mid-rise buildingswith 6{12 stories, the average values of R calculated bySPA and DPA methods are 3.45 and 3.81, respectively.Although the R factor calculated by the SPA method isslightly conservative, the results of these two methodsare consistent for mid-rise diagrid buildings. For tall24-story buildings, the value of R factor calculated bythe SPA method is signi�cantly di�erent from thatcomputed using the DPA method mainly due to thee�ect of the higher modes, which is considerable intaller diagrids. This di�erence is mainly due to thechanges in the over-strength factors rather than theductility factors calculated using these two methods.Furthermore, the standard deviation of the R valuescalculated by DPA method is quite larger for 24-storydiagrids than other archetypes, easily observed in theexceedance probability curves for R factors.
The obtained results clearly show the need formore comprehensive studies before making a rationaldecision regarding the R factor of this archetype model.In this regard, by considering the importance of theutilized load pattern in the SPA approach, the e�ects
Table 2. Earthquake record information.
EQ ID M Year Earthquake name Recording station PGA (g) PGV (cm/s)
1 6.7 1994 Northridge Canyon Country-WLC 0.472 41.1282 7.1 1999 Duzce, Turkey Bolu 0.739 55.9343 6.5 1979 Imperial Valley Delta 0.35 32.9994 7.5 1999 Kocaeli, Turkey Duzce 0.312 58.8675 7.4 1990 Manjil, Iran Abbar 0.497 50.5916 6.5 1987 Superstition Hills El Centro Imp. Co. 0.357 48.0717 6.5 1987 Superstition Hills Poe Road (temp) 0.286 29.016

A. Seyedkazemi and F. Rahimzadeh Rofooei/Scientia Iranica, Transactions A: Civil Engineering 28 (2021) 124{137 131
Figure 9. The static and dynamic pushover curves.
Table 3. The computed seismic performance factors for the diagrid models.Procedure
DPA methodModel IDnumber
SPF EQ ID1 EQ ID2 EQ ID3 EQ ID4 EQ ID5 EQ ID6 EQ ID7 Average Standarddeviation
SPAmethod
6St-Diagrid
0 2.82 2.74 3.68 2.85 3.17 2.92 3.45 3.09 0.36 2.99R� 1.27 1.21 1.34 1.21 1.23 1.34 1.15 1.25 0.07 1.28R 3.60 3.32 4.94 3.45 3.91 3.92 3.98 3.87 0.53 3.81
8St-Diagrid
0 3.05 2.80 2.43 2.74 3.17 2.83 2.56 2.80 0.26 2.25R� 1.22 1.19 1.45 1.35 1.35 1.35 1.56 1.35 0.13 1.58R 3.71 3.34 3.51 3.70 4.28 3.83 4.00 3.77 0.31 3.56
10St-Diagrid
0 2.20 2.51 2.54 2.48 3.42 2.56 2.71 2.63 0.38 2.25R� 1.41 1.28 1.41 1.41 1.41 1.54 1.54 1.43 0.09 1.46R 3.10 3.22 3.58 3.49 4.82 3.93 4.16 3.76 0.60 3.29
12St-Diagrid
0 2.93 3.55 2.61 2.74 2.56 2.53 3.23 2.88 0.39 2.04R� 0.95 1.09 1.43 1.31 1.75 1.52 1.43 1.35 0.27 1.54R 2.78 3.85 3.72 3.59 4.48 3.85 4.61 3.84 0.61 3.14
24St-Diagrid
0 3.64 2.66 2.93 2.12 2.39 4.47 3.21 3.06 0.80 1.40R� 2.21 1.34 1.28 1.75 1.48 1.70 2.24 1.71 0.39 1.84R 8.02 3.57 3.74 3.72 3.53 7.61 7.17 5.34 2.13 2.56

132 A. Seyedkazemi and F. Rahimzadeh Rofooei/Scientia Iranica, Transactions A: Civil Engineering 28 (2021) 124{137
Figure 10. The probability of exceedance curves for the seismic performance factors.
of using both other available load patterns in the SPAmethod and the large number of earthquake recordsin the DPA method on the SPFs of taller diagridstructures can be examined.
7. Further investigation of R factor for the24-story diagrid model
As discussed earlier, in addition to the lateral loadpattern suggested by FEMA P-695 and most of theseismic building codes shown in Eq. (11), the e�ects ofthe following lateral load patterns on the results of theSPA are investigated including:
1. Triangular force distribution;2. Uniform force distribution;3. Lateral load distribution based on the SRSS com-
bination of the e�ective modes, as shown in thefollowing [34]:
Fi =
vuut NXj=1
(�j�ijSajmi)2: (13)
4. Lateral load distribution based on the de�nition ofan equivalent fundamental mode �i, de�ned as [34]:
Fi =mi ��i
NPk=1
mk ��k; (14)
where �i is determined through a combination ofe�ective modes using the SRSS method as follows:
��i =
vuut NXj=1
(�ij�j)2: (15)
5. Lateral load distribution based on the combinationof the e�ective modes according to the DirectVectorial Addition (DVA) method as described by[35,36]:
Figure 11. The static pushover curves for the 24-storydiagrid model for di�erent load patterns.
Fi =NXj=1
(�j�j�ijSajmi); (16)
where Fi and mi are the story seismic force andstory mass of the ith story, respectively; N is thenumber of the considered modes, �ij is the ithamplitude component of the jth vibration mode;Saj is the pseudo-spectral acceleration of the jthmode; �j is the modal participation factor of thejth mode; and �j is the modal mass coe�cient ofthe jth mode.
Figure 11 shows the static pushover curves ofthe model for di�erent load patterns. The values ofSPFs estimated by the SPA procedure for di�erent loadpatterns are summarized in Table 4.
For the types of load patterns (4, 5, and 6), allthe modes for which the sum of e�ective modal masseswas more than 90% of the total structural mass couldbe considered as the e�ective modes. The maximum Rfactor of 4.3 was obtained for the load pattern de�nedby Eq. (16), in which the e�ect of higher modes wasconsidered, and the minimum R factor of 2.57 wasfound when the e�ect of higher modes was neglected(i.e., Eq. (11)). Thus, as expected, the higher modeshave considerable e�ect on the response modi�cationfactor of the diagrid archetype.
A. Seyedkazemi and F. Rahimzadeh Rofooei/Scientia Iranica, Transactions A: Civil Engineering 28 (2021) 124{137 133
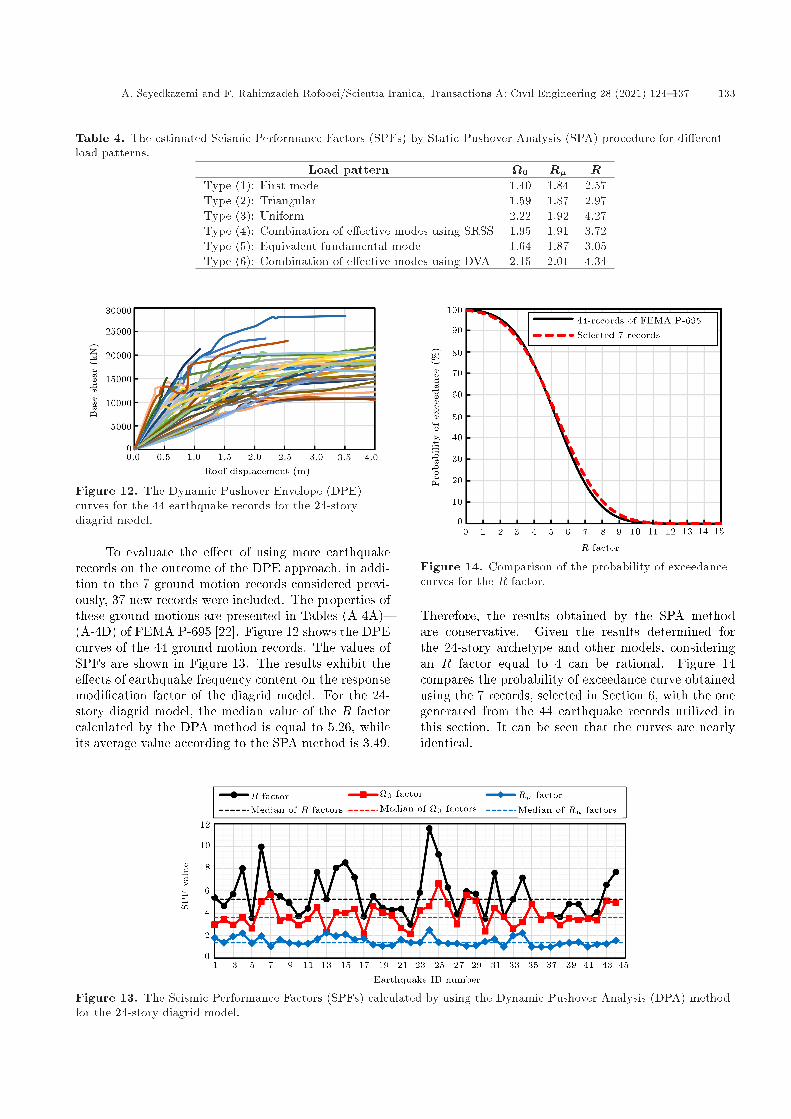
Table 4. The estimated Seismic Performance Factors (SPFs) by Static Pushover Analysis (SPA) procedure for di�erentload patterns.
Load pattern 0 R� RType (1): First mode 1.40 1.84 2.57Type (2): Triangular 1.59 1.87 2.97Type (3): Uniform 2.22 1.92 4.27Type (4): Combination of e�ective modes using SRSS 1.95 1.91 3.72Type (5): Equivalent fundamental mode 1.64 1.87 3.05Type (6): Combination of e�ective modes using DVA 2.15 2.01 4.34
Figure 12. The Dynamic Pushover Envelope (DPE)curves for the 44 earthquake records for the 24-storydiagrid model.
To evaluate the e�ect of using more earthquakerecords on the outcome of the DPE approach, in addi-tion to the 7 ground motion records considered previ-ously, 37 new records were included. The properties ofthese ground motions are presented in Tables (A-4A){(A-4D) of FEMA P-695 [22]. Figure 12 shows the DPEcurves of the 44 ground motion records. The values ofSPFs are shown in Figure 13. The results exhibit thee�ects of earthquake frequency content on the responsemodi�cation factor of the diagrid model. For the 24-story diagrid model, the median value of the R factorcalculated by the DPA method is equal to 5.26, whileits average value according to the SPA method is 3.49.
Figure 14. Comparison of the probability of exceedancecurves for the R factor.
Therefore, the results obtained by the SPA methodare conservative. Given the results determined forthe 24-story archetype and other models, consideringan R factor equal to 4 can be rational. Figure 14compares the probability of exceedance curve obtainedusing the 7 records, selected in Section 6, with the onegenerated from the 44 earthquake records utilized inthis section. It can be seen that the curves are nearlyidentical.
Figure 13. The Seismic Performance Factors (SPFs) calculated by using the Dynamic Pushover Analysis (DPA) methodfor the 24-story diagrid model.

134 A. Seyedkazemi and F. Rahimzadeh Rofooei/Scientia Iranica, Transactions A: Civil Engineering 28 (2021) 124{137
Table 5. The performance evaluation results for the steel diagrid archetypes.Model ID number Procedure SMT [T ] (g) Sct (g) �TOT CMR SSF ACMR Acceptance check
Value Error (%) AcceptableACMR
Pass/Fail
Performance group no. diagrid-1 (T < Ts)
6St-Diagrid FEMA P-695 (44 records) 1.5 3.962 15.71 0.688 2.64 1.190 3.14 1.78 PassNew method (7 records) 3.340 2.23 2.65 Pass
8St-Diagrid FEMA P-695 (44 records) 1.5 3.815 0.17 0.690 2.54 1.211 3.08 1.78 PassNew method (7 records) 3.822 2.55 3.09 Pass
Mean ofperformance group:
FEMA P-695 (44 records) 3.11 2.42 PassNew method (7 records) 2.87 Pass
Performance group no. diagrid-2 (T > Ts)
10St-Diagrid FEMA P-695 (44 records) 1.09 3.240 0.67 0.684 2.97 1.224 3.64 1.77 PassNew method (7 records) 3.218 2.95 3.61 Pass
12St-Diagrid FEMA P-695 (44 records) 0.85 2.222 12.97 0.700 2.60 1.263 3.29 1.80 PassNew method (7 records) 2.510 2.94 3.71 Pass
24St-Diagrid FEMA P-695 (44 records) 0.51 1.008 3.22 0.700 1.99 1.346 2.67 1.80 PassNew method (7 records) 1.041 2.05 2.76 Pass
Mean ofperformance group:
FEMA P-695 (44 records) 3.20 2.44 PassNew method (7 records) 3.36 Pass
8. Performance evaluation
By using the IDA technique, the collapse groundmotion intensity of archetypes under the e�ect of eachrecord is obtained based on the dynamic instabilitycriteria. The median collapse acceleration (SCT ) andthe CMR are determined using both the 44 recordsprovided in FEMA P-695 and the 7 records selectedin the newly proposed method. These values aresummarized in Table 5. Using the collapse dataextracted from the IDA results, the collapse fragilitycurve is obtained for each model. The collapse fragilitycurve, which expresses the probability of collapse asa function of ground motion intensity, is attained by�tting a lognormal cumulative distribution function tothe collapse data as follows [37]:
P (C/ST = x) = ��Lnx� �
�
�; (17)
where P (C=ST = x) is the probability of collapsecorresponding to a spectral intensity (ST ) equal to x,� is the normal cumulative distribution function, and� and � are the median and standard deviations ofLn(ST ). Figure 15 compares the collapse fragility curvegenerated using the 44 records of FEMA P-695 withthe one obtained using the selected 7 records. Resultscon�rm the applicability of the proposed methodol-ogy for evaluating the seismic performance of diagridbuildings. The seismic performance of diagrid struc-tural models is evaluated based on the methodologyproposed in FEMA P-695 by using the 44 ground
motion records provided in FEMA P-695 and the 7ground motion records selected for this study. Inthat regard, besides the estimation of the ACMR byEq. (3), the total system collapse uncertainty (�TOT )is also needed. To calculate �TOT , the quality gradefor design requirements and index archetype modelsfor the steel diagrid systems is rated good. Moreover,the quality of the test data is considered to be poorbecause there are not enough test data to assess theseismic capacity of these systems. The values ofACMR and �TOT for diagrid models are summarizedin Table 5. The acceptable ACMR is determinedbased on the total system collapse uncertainty andthe acceptable conditional probability of collapse underthe MCE ground motions, taken as 10% and 20%for each performance group and each index archetype,respectively.
Performance evaluation results for steel diagridarchetypes are summarized in Table 5 for both the 44proposed records in FEMA P-695 as well as the selected7 records in this study. The results show that all diagridmodels have su�cient safety against the collapse at theMCE level earthquakes. Therefore, the validity of SPFsis con�rmed for the models of diagrid steel structures.
9. Conclusions
This study attempted to propose a new, simplerand reliable methodology for estimating the SeismicPerformance Factors (SPFs) of steel diagrid structuralsystems while applying the framework of FEMA P-695

A. Seyedkazemi and F. Rahimzadeh Rofooei/Scientia Iranica, Transactions A: Civil Engineering 28 (2021) 124{137 135
Figure 15. The collapse fragility curves generated using both the 44 records provided in FEMA P-695 and the 7 recordsselected in the proposed method.
for assessing the validity of SPFs. In the proposedprocedure, in addition to the conventional nonlinearstatic analysis, a probabilistic method based on the In-cremental Dynamic Analysis (IDA) technique was alsoemployed for the evaluation of employed SPFs. Also,a limited number of earthquake records would su�cein the �nal step of seismic performance evaluation incomparison to the 44 ground motion records of FEMAP-695. The results of the current study are summarizedin the following:
1. For mid-rise steel diagrid buildings considered inthis study, the mean values of over-strength, duc-tility, and response modi�cation factors obtainedfrom the Static Pushover Analysis (SPA) methodwere 2.38, 1.46, and 3.45, respectively, while byusing the probabilistic method based on the IDAtechnique, the values of these coe�cients became2.85, 1.34, and 3.81, respectively. In the case of the24-story tall building with the height-to-width ratioof 6.4, the mean values of over-strength, ductility,and response modi�cation factors calculated by theSPA method for di�erent load patterns were 1.83,1.90, and 3.49, respectively, while the values of theseparameters determined by the probability-basedDynamic Pushover Analysis (DPA) method were3.64, 1.37, and 5.26, respectively. Therefore, theSPA method obtained a more conservative value forR factor than the probability-based DPA method;
2. The e�ect of higher modes and frequency content ofground motions on the response modi�cation factorof the tall diagrid model was signi�cant. The use ofthe �rst mode load pattern prescribed in FEMA P-695 to perform the SPA yielded unreasonable (over-conservative) R factor values for the 24-story tallarchetype, while the lateral load patterns that take
into account the e�ects of higher modes presentedresults closer to those obtained by the probability-based DPA method;
3. The preliminary results for the diagrid structuralsystem showed that the use of the probability-basedDPA method could be suitable for determining theused SPFs. Although the use of more earthquakerecords could increase the accuracy of results byusing this approach, it would prolong the evaluationprocess. In the proposed framework, a limitednumber of earthquake records were selected usinga method described in the previous sections, andthese records were used for the overall assessment ofSPFs. For the considered diagrid models, the pro-posed framework had an acceptable performancein determining the initial R factor. Also, therewas an average error of 6.5% in predicting thecollapse capacity of diagrids in comparison to thecollapse intensity calculated using the FEMA P-695 far-�eld record set. Although the observederror was relatively low, further studies need to beconducted on the feasibility of using the proposedmethod for assessing the SPFs of other structuralsystems. In addition, it is possible to use a limitednumber of earthquake records in the early stage ofevaluation, i.e., for determining the initial R factorand increasing the number of earthquake records inthe �nal stage for assessing the validity of R factor.
References
1. Kim, J. and Lee, Y.H. \Seismic performance eval-uation of diagrid system buildings", The StructuralDesign of Tall and Special Buildings, 21(10), pp. 736{749 (2012).
2. Moon, K.S., Connor, J.J., and Fernandez, J.E. \Di-

136 A. Seyedkazemi and F. Rahimzadeh Rofooei/Scientia Iranica, Transactions A: Civil Engineering 28 (2021) 124{137
agrid structural systems for tall buildings: character-istics and methodology for preliminary design", TheStructural Design of Tall and Special Buildings, 16(2),pp. 205{230 (2007).
3. Jani, K. and Patel, P.V. \Analysis and design ofdiagrid structural system for high rise steel buildings",Procedia Engineering, 51, pp. 92{100 (2013).
4. Montuori, G.M., Mele, E., Brandonisio, G., and Luca,A.D. \Design criteria for diagrid tall buildings: sti�-ness versus strength", The Structural Design of Talland Special Buildings, 23(17), pp. 1294{1314 (2014).
5. Milana, G., Olmati, P., Gkoumas, K., and Bontempi,F. \Ultimate capacity of diagrid systems for tall build-ings in nominal con�guration and damaged state",Periodica Polytechnica Civil Engineering, 59(3), pp.381{391 (2015).
6. Kamath, K., Hirannaiah, S., and Noronha, J.C.K.B.\An analytical study on performance of a diagridstructure using nonlinear static pushover analysis",Perspectives in Science, 8, pp. 90{92 (2016).
7. Moon, K. \Optimal grid geometry of diagrid struc-tures for tall buildings", Architectural Science Review,51(3), pp. 239{251 (2008).
8. Zhang, C., Zhao, F., and Liu, Y. \Diagrid tube struc-tures composed of straight diagonals with graduallyvarying angles", The Structural Design of Tall andSpecial Buildings, 21(4), pp. 283{295 (2012).
9. Baker, W., Besjak, C., Sarkisian, M., Lee, P., and Doo,C.-S. \Proposed methodology to determine seismicperformance factors for steel diagrid framed systems",CTBUH Technical Paper, Council of Tall Buildingsand Urban Habitat (2010).
10. PERFORM-3D/ Nonlinear Analysis and PerformanceAssessment for 3D Structures, Computer & StructuresInc., Berkeley, CA (2007).
11. Akbari Hamed, A. and Mo�d, M. \Parametric studyand computation of seismic performance factors ofbraced shear panels", Scientia Iranica, A, 23(2), pp.460{474 (2016).
12. Asghari, A. and Azimi, B. \Evaluation of sensitivityof CBFs for types of bracing and story numbers",Scientia Iranica, A, 24(1), pp. 40{52 (2017).
13. Attia, W.A. and Irheem, M.M.M. \Boundary con-dition e�ect on response modi�cation factor of X-braced steel frames", HBRC Journal, 14(1), pp. 104{121 (2018).
14. Etedali, S. and Irandegani, M.A. \A proposed lateralload pattern for pushover analysis of structures sub-jected to earthquake excitations", Journal of Vibro-Engineering, 17(3), pp. 1363{1371 (2015).
15. Rofooei, F.R. and Mirjalili, M.R. \Dynamic-basedpushover analysis for one-way plan asymmetric build-ings", Engineering Structures, 163, pp. 332{346(2018).
16. Liu, Y., Kuang, J.S., and Huang, Q. \Extendedspectrum-based pushover analysis for predicting
earthquake-induced forces in tall buildings", Engineer-ing Structures, 167, pp. 351{362 (2018).
17. Estekanchi, H.E., Vafai, A., and Basim, M.Ch. \Designand assessment of seismic resilient structures by theendurance time method", Scientia Iranica, A, 23(4),pp. 1648{1657 (2016).
18. Causevic, M. and Mitrovic, S. \Comparison betweennon-linear dynamic and static seismic analysis ofstructures according to European and US provisions",Bulletin of Earthquake Engineering, 9(2), pp. 467{489(2011).
19. Mourad, B. and Sabah, M. \Comparison betweenstatic nonlinear and time history analysis using exibility-based model for an existing structure and ef-fect of taking into account soil using domain reductionmethod for a single media", KSCE Journal of CivilEngineering, 19(3), pp. 651{663 (2015).
20. Li, S., Zuo, Z., Zhai, C., and Xie, L. \Comparison ofstatic pushover and dynamic analyses using RC build-ing shaking table experiment", Engineering Structures,136, pp. 430{440 (2017).
21. Endo, Y., Pel�a, L., and Roca, P. \Review of di�erentpushover analysis methods applied to masonry build-ings and comparison with nonlinear dynamic analysis",Journal of Earthquake Engineering, 21(8), pp. 1234{1255 (2017).
22. FEMA P-695 \Quanti�cation of building seismic per-formance factors", ATC-63 Report, Federal Emer-gency Management Agency, Washington, DC (2009).
23. OpenSees \Open system for earthquake engineeringsimulation", version 2.4.5, Paci�c Earthquake Engi-neering Research Center: University of California,Berkeley, from: http://opensees.berkeley.edu/ (2013).
24. ASCE 41-13, \Seismic evaluation and retro�t of exist-ing buildings", American Society of Civil Engineers,Reston, Virginis (2014).
25. Kim, J. and Choi, H. \Response modi�cation factorsof chevron-braced frames", Engineering Structures,27(2), pp. 285{300 (2005).
26. NEHRP Consultants Joint Venture \Evaluation of theFEMA P-695 methodology for quanti�cation of build-ing seismic performance factors", National Instituteof Standards and Technology, U.S. Department ofCommerce, Gaithersburg, MD 20899-8600 (2010).
27. Vamvatsikos, D. and Cornell, C.A. \Incremental dy-namic analysis", Earthquake Engineering and Struc-tural Dynamics, 31(3), pp. 491{514 (2002).
28. McCain, I. (n.d.) \Diagrid: structural e�ciency andincreasing popularity", from: http://www.dsg.fgg.uni-lj.si/dubaj2009/images/stories/Diagrid%20tehnologija.pdf, Retrieved October,15 (2016).
29. ASCE 7-10, Minimum Design Loads for Buildings andOther Structures, American Society of Civil Engineers,Reston, VA (2010).

A. Seyedkazemi and F. Rahimzadeh Rofooei/Scientia Iranica, Transactions A: Civil Engineering 28 (2021) 124{137 137
30. AISC 360-10, Speci�cation for Structural Steel Build-ing, American Institute of Steel Construction, Chicago,IL (2010).
31. ETABS/ Integrated Building Design Software, Com-puters and Structures Inc., Berkeley, CA (2013).
32. Menegotto, M. and Pinto, P.E. \Method of analysis forcyclically loaded R.C. plane frames including changesin geometry and non-elastic behavior of elements undercombined normal force and bending", IABSE Sympo-sium on the Resistance and Ultimate Deformability ofStructures Acted on by Well De�ned Repeated Loads,Zurich, Switzerland (1973).
33. Uriz, P., Filippou, F.C., and Mahin, S.A. \Model forcyclic inelastic buckling of steel braces", Journal ofStructural Engineering, 134(4), pp. 619{628 (2008).
34. Requena, M. and Ayala, G. \Evaluation of a simpli�edmethod for the determination of the non-linear seismicresponse of RC frames", Proceedings of the TwelfthWorld Conference on Earthquake Engineering, Paper2109, New Zealand Society for Earthquake Engineer-ing, Upper Hutt, New Zealand (2000).
35. Antoniou, S. and Pinho, R. \Advantages and lim-itations of adaptive and non-adaptive force-basedpushover procedures", Journal of Earthquake Engi-neering, 8(4), pp. 497{522 (2008).
36. Antoniou, S. and Pinho, R. \Development and ver-i�cation of a displacement-based adaptive pushoverprocedure", Journal of Earthquake Engineering, 8(5),pp. 643{661 (2008).
37. Ibarra, L.F. and Krawinkler, H. \Global collapse offrame structures under seismic excitations", Technical
Report No. 152, John A. Blume Earthquake Engineer-ing Center, Stanford, CA, 324 (2005).
Biographies
Ali Seyedkazemi is currently a PhD candidate inStructural and Earthquake Engineering at Sharif Uni-versity of Technology, Iran. He is a faculty memberat the Civil Engineering Department of Islamic AzadUniversity, Amol, Iran. He received his BSc degree inCivil Engineering from University of Tabriz, Iran in2003. He received his MSc degree in Structural En-gineering from Mazandaran University of Science andTechnology, Iran in 2005. His research interests includethe structural seismic performance and rehabilitationof existing structures and structures in architecture.
Fayaz Rahimzadeh Rofooei has been a Professor ofCivil Engineering at Sharif University of Technology,Iran since 2005. He received his BSc degree in CivilEngineering from Iran University of Science and Tech-nology. He received his MSc degrees in Mathematicsand Structural Optimization and also PhD degree inCivil Engineering (Structural Control) from RensselaerPolytechnic Institute, Troy, N.Y., USA. His researchinterests are active and passive structural control,nonlinear structural analysis, base isolation, seismicvulnerability analysis, and retro�tting of structures andlifelines.


![INELASTIC STATIC PUSHOVER ANALYSIS OF …assessed by inelastic pushover analysis. Lloyd and Clawson [3] discusses the sources of reserve and residual strength of frame behavior. Marshall](https://img.pdfslide.net/doc/110x75/5e2c164e611432794a7286d7/inelastic-static-pushover-analysis-of-assessed-by-inelastic-pushover-analysis-lloyd.jpg)