Embed Size (px)
Citation preview

Journal of Engg. Research Vol. 7 No. (4) December 2019 pp. 58-80
Comparison of the earthquake responses of super-high-rise building structures based on different seismic design spectra
Jing Zhou*, Xiaodan Fang*,** and Yi Jiang**
*Key Laboratory of Subtropical Architecture Science, South China University of Technology, Guangzhou, 510641, China**Architectural Design & Research Institute, South China University of Technology, Guangzhou 510641, China*Corresponding Author: [email protected]
ABSTRACTTo evaluate the reliability of the long-period segments of seismic design spectra, two super-high-rise buildings
with long-period vibration periods are analyzed. The response spectrum method and dynamic time-history method are employed to investigate the maximum displacement of the building’s top and the maximum earthquake shear of the building’s base. Based on the long-period segments stipulated in the Japanese and Chinese design codes, the displacement spectra increase significantly as the vibrational period increases, which is not consistent with the statistical attenuation characteristics. The maximum earthquake shear force calculated in accordance with the response spectrum method in the proposed design spectrum is consistent with the average results calculated by the dynamic time-history method as well as with the results calculated according to the Chinese design spectrum and the design spectrum utilized in the US. However, the proposed design spectrum better characterizes the shear response of the long-period building with high-order modes. For large long-period buildings, the maximum displacement calculated in accordance with the Chinese design spectrum increases with the damping ratio. The variation of the maximum shear force of the building’s base is very small. This indicates that the long-period segment in the Chinese design spectrum is not reasonable. For large long-period buildings, the increasing ratio of the damping force to the structural system’s internal force as the damping ratio increases cannot be ignored. Therefore, the reduction ratio of the damping force in the long-period segments of the response spectrum should be appropriately selected.
Keywords: Long-period ground motion; design spectra; modal decomposition response spectrum method; dynamic time-history analysis method; damping ratio.
INTRODUCTIONSince the 1985 Ms 8.0 Mexico earthquake, engineers have paid increasing attention to the risks of long-period
ground motions in the far field (Yu et al., 1997 & Takewakii et al., 2011). The May 12, 2008, Ms 8.0 Wenchuan earthquake was one of the most disastrous earthquakes in China, and strong shaking was detected in high-rise buildings in the cities of Baoji and Xi’an, China, which were located 520 kilometers and 700 kilometers, respectively, from the earthquake epicenter (Liang et al., 2009). When the Ms 9.0 earthquake hit Tohoku-Oki, Japan, in 2011, strong shaking was detected in super-high-rise government office buildings in Osaka, which was located 770 kilometers from the epicenter. The seismic response of high-rise buildings in Osaka was nearly the same as that of buildings in Sendai, which was only 100 kilometers from the epicenter (Zhou et al., 2012 & Takewakii et al., 2011). Therefore, studying the dynamic behavior of super-high-rise building structures under long-period ground motions and proposing safe and practical seismic design methods are important topics that structural engineers working in seismic regions must undertake. The Code for Seismic Design of Buildings (GB50011, 2010) and Technical Specification for Concrete Structures of Tall Buildings (JGJ 3, 2010) in China incorporate the design of seismic isolation and seismic energy-dissipating buildings into the code and also provide specific values for the design spectra of different damping ratios.

59Jing Zhou, Xiaodan Fang and Yi Jiang
However, with the extensive construction of high-rise reinforced concrete (RC) buildings and energy-dissipating high-rise RC buildings with added damping devices, new requirements and challenges have emerged concerning the applicability of the long-period segment of the design spectrum in the seismic design of high-rise RC buildings. Over the past decade, many studies in China (Chen & Yu, 2007; Cao et al., 2011; Luo et al., 2011; Li et al., 2012; Fang et al., 2014) have focused on the selection of the long-period segment values in the design spectrum stipulated in the Technical Specification for Concrete Structures of Tall Buildings (JGJ 3, 2010). The seismic design spectrum’s long-period segment should be evaluated and verified by several ground motions with rich long-period components and high-rise RC buildings. Numerous factors affect the attenuation of the earthquake response spectrum (Chandler et al., 2003) and its damping reduction factor spectrum (Zhou et al., 2014), including the structural system’s internal factors, such as the structure’s damping and vibration period, and external factors, such as the earthquake magnitude, source rupture mechanism, epicentral distance, ground motion duration, and site conditions. The design spectrum stipulated in the Chinese seismic design codes for buildings has many shortcomings, which must be improved (Fang et al., 2014; Luo et al., 2011; Chen et al., 2007). For example, during the design process, due to the artificial adjustment of the long periods, the statistical characteristics of the ground motion change, which causes an anomaly in the long periods of the power spectrum that corresponds to the acceleration response spectrum. The relative displacement spectrum obtained based on the quasi-spectral relation increases linearly with the extension of the structural self-vibration period under any site and damping ratio conditions. This results in an unreasonably large calculated displacement of the long-period building structure due to the effect of an earthquake, which is not consistent with the statistical characteristics of the relative displacement spectrum. In addition, the earthquake influence coefficient curves of different damping ratios bifurcate after they intersect at the long period segment. The attenuation rate of the earthquake influence coefficient of larger damping ratios is significantly lower than that of smaller damping coefficients. This is not consistent with the vibration attenuation relationships of building structures with different damping ratios in practical engineering. In this paper, two super-high-rise building structures are analyzed using the design spectrum stipulated in the seismic design codes of China, the US, and Japan as well as the design response spectrum proposed by the authors in a previous study (hereinafter referred to as the proposed design spectrum (Zhou et al., 2017)). The differences between the calculated results obtained based on the different seismic design spectra are compared. The calculated results are also compared with those calculated based on dynamic time-history analysis. The results obtained in this paper can be used as a reference for the seismic design of long-period building structures.
SEISMIC ACTION AND STRUCTURAL MODELSeismic design spectrumThe Chinese seismic design code (GB 50011, 2010) defines the seismic precautionary intensity as having a greater
than 10% probability of occurring during the 50-year design reference period. The maximum earthquake considered in the US seismic design code (ASCE, 2010) is defined as having a greater than 2% probability of occurring over the 50-year design reference period, and 2/3 of the seismic acceleration of the maximum earthquake considered is used as the design earthquake magnitude. The Japanese seismic design code (Mistumasa et al., 2003 & Sun et al., 2011) does not specify the precautionary intensity. The precautionary criterion is based on the standard horizontal seismic shear coefficient C0 and the seismic partition coefficient Z. In Japan’s seismic design code, the standard seismic shear coefficient C0=0.2, and the design acceleration is approximately 80 gal (0.2×9.81×100/2.5=78.48 gal). This is slightly higher than the acceleration of frequent earthquakes in the 8-degree zone of Chinese seismic design code. The maximum seismic design acceleration in the second stage is approximately 400 gal, which is equivalent to the acceleration of rare earthquakes encountered in the 8-degree zone of the Chinese seismic design code. The most significant difference between the Japanese seismic design code and other countries’ seismic design codes is the expression of the seismic action. In the allowable stress method, the seismic action is represented by horizontal shear in the floor caused by an earthquake. However, the ultimate strength design method uses the ground surface acceleration spectrum method, which is similar to the earthquake influence coefficient spectrum method utilized in Chinese seismic design codes. To compare the response spectra of different seismic designs with similar on-site conditions, the spectral curves of the building base’s earthquake influence coefficient of the elastic seismic design in

Comparison of the earthquake responses of super-high-rise building structures based on different seismic design spectra60
the first stage are given. The corresponding displacement coefficient spectrum is given based on the quasi-spectral relation. The damping ratio of the structural system is selected as 5%.
In the Chinese seismic design code (GB 50011, 2010), the design spectrum curves are based on the frequent earthquake in an 8-degree zone. The maximum earthquake influence coefficient is α=0.16, the site is Class III, the group is 3, the site’s characteristic period Tg=0.65 s, and the transition period of the long period’s starting point TD=5Tg. The spectrum curve is extended along a straight line for segments longer than 6.0 s.
(1)
where α(T ) is the earthquake influence coefficient; αmax is the maximum earthquake influence coefficient at the
site; , which is the curve’s attenuation index in the descending section; , which is no
less than 0; , which is the damping adjustment coefficient and is no less than 0.55; and ξ is the damping
ratio of the structural system.
Classes D and E sites in the US seismic design codes (ASCE, 2010) are roughly equivalent to a Class III site in the Chinese seismic design codes. Compared to the results of a Class D site, the calculated displacement and the base earthquake shear force are smaller. The risk level of the design earthquake (2/3 of the maximum acceleration of the earthquake ground motion is considered) is equivalent to that of the strengthened intensity in the Chinese standard. In the Chinese standard, to determine the precautionary intensity of an 8-degree zone, the earthquake’s peak acceleration is taken as 0.2 g. Using an iterative calculation process and based on the design spectrum in the US seismic design code that corresponds to a Class III site, the maximum acceleration in the response spectrum platform is approximately SS=1.04 g. At a period of 1 s, the maximum acceleration is S1=0.5 g (Luo et al., 2006). For a Type E site, the minimum acceleration is S1=0.75 g. Therefore, the intermediate value S1=0.625 g is used in the following analysis. During the first stage of seismic design, the strength reduction factor R is used to adjust the design of the seismic action. R is dependent on the specific structural system. For an RC frame-core tube building structure, R=4.5.
(2)
(3)
where Fa=1.084; Fv=1.5; =0.7516 g; = 0.625 g; =0.1663 s; =0.8316 s; TL is the
transition period of the long-period starting point (usually, TL=6.0 s); and is the damping correction factor.

61Jing Zhou, Xiaodan Fang and Yi Jiang
In the design spectrum curve of the Japanese seismic design code (Mistumasa et al., 2003), the earthquake partition coefficient is Z=0.9 (Z=0.9 and Z=1.0 are two major seismic zones in Japan). The standard seismic shear coefficient is C0=0.2, and the seismic design’s maximum acceleration in the first stage is approximately 70.6 gal, which is equivalent to that of the 8-degree zone frequent earthquake in the Chinese seismic design code. A Class II site in the Japanese seismic design code is roughly equivalent to a Class III site in the Chinese seismic design code.
(4)
where Gv is the magnification factor for a Class II site in the Japanese seismic design code, and Gv=2.03; ; and g is the gravitational acceleration.
The seismic design spectra in the Chinese seismic design code (GB 50011, 2010) only specify standard spectra up to 6.0 s, and the spectrum curve is generally extended in a straight line for segments longer than 6.0 s. The spectra are not sufficiently long, and the values are often not reliable, which means that the seismic design code cannot accurately define the seismic design requirements for long-period building structures. Taking into account the actual conditions of Chinese seismic design, Zhou et al. (2015 & 2017) developed attenuation relationships of acceleration response spectra for periods up to 10.0 s based on digital recordings with rich long-period components from destructive shallow crustal strong earthquakes. A total of 4209 acceleration recordings from 109 earthquake events within 800 km of the causative fault were selected, and the average elastic spectrum was used to study the spectrum’s characteristic period as well as the attenuation index and damping adjustment factors. The influences of the distance and site conditions on the long-period response spectrum were discussed, and the shapes of the amplification spectra were compared with the standard spectra specified in the Chinese seismic design code. The proposed long-period spectrum has several distinct characteristics; for example, the spectrum’s platform segment is affected by the type of site, and the characteristic period of the site has a larger variation. In this paper, the proposed design spectrum curve (Zhou et al., 2017) is selected based on the frequent earthquake in the 8-degree zone. The maximum earthquake influence coefficient is given as αmax=0.178 (70×2.5/100×9.81=0.178), which corresponds to the third group in a Class III site, Tg=0.9 s, and TD=3.5 s. The site effect coefficient is Si=SIII=1.1. Compared with the seismic design spectrum in the Chinese seismic design code, attenuation coefficients of -1 and -2, which are consistent with steeper descending slopes, have been suggested to be used in the descending section of the designed spectrum. This selection takes into account the influence of the site classification. The site’s characteristic period increases by 0.25 s.
(5)
where Tg is the site’s characteristic period; TD is the transition period of the long period; and the damping adjustment
coefficient is , which is no less than 0.5.

Comparison of the earthquake responses of super-high-rise building structures based on different seismic design spectra62
A comparison of four seismic design spectra is shown in Figure 1a. When the damping ratio is ξ=0.05 (Figure 1a), the earthquake influence coefficients of the long period (approximately T>4.5 s) are different. The Japanese seismic design code gives the largest spectrum, followed by the spectra given by the Chinese and US seismic design codes, whereas the proposed design spectrum is the smallest. After approximately 7 s, the spectra given by the Japanese and Chinese seismic design codes are similar to each other, whereas the proposed seismic spectrum (Zhou et al., 2017) is similar to that given by the US seismic design codes. The overall trend is that the spectra attenuate with an increase of the vibration period. However, the attenuation indexes are different. The displacement coefficient spectrum (Figure 1b) obtained based on the quasi-spectral relationship (Sd=Sα /ω2) shows significant differences in the long-period segment. The displacement coefficient spectrum given by the US seismic design code (T>6 s) and the proposed design spectrum (T>3.5 s) remained unchanged with an increase of the vibration period. In contrast, the displacement coefficient spectra given by the Japanese and Chinese seismic design codes increase significantly as the vibration period increases. In the long-period segment, the displacement spectrum’s increase with increasing period is not consistent with the statistical characteristics of the displacement spectrum’s attenuation. In reality, when the structure’s self-vibration period reaches a certain value, its relative displacement spectrum does not increase as its self-vibration period increases. The displacement at extremely long periods should be equal to the maximum displacement of the ground motion.
When the damping ratio is ξ=0.10 or 0.20 (Figure 1c and Figure 1d, respectively), the Chinese seismic design code gives the largest spectrum value in the long-period segment, which is even larger than that given by the Japanese seismic design code. The difference increases with increasing damping ratio. Research has shown that the long-period section of the response spectrum in the Chinese seismic design code is artificially adjusted. This changes the statistical characteristics of the ground motion, which results in anomalies in the displacement spectrum and the power spectrum in the long-period segment. These spectra correspond to the acceleration spectrum in the long-period segment. The seismic design spectrum is extracted from the absolute acceleration spectrum based on the seismic inertia force, and the damping adjustment coefficient is not set appropriately. As a result, the spectrum value of the design spectrum in the long-period segment increases as the damping ratio increases. This is inconsistent with the actual attenuation pattern in damped building structures.
(a)

63Jing Zhou, Xiaodan Fang and Yi Jiang
(b)
(c)
(d)
Figure 1. Comparison of seismic design spectra: (a) earthquake influence coefficient curves (ξ=0.05); (b) displacement coefficient curves (ξ=0.05); (c) earthquake influence coefficient curves (ξ=0.1); and
(d) earthquake influence coefficient curves (ξ=0.2).

Comparison of the earthquake responses of super-high-rise building structures based on different seismic design spectra64
Ground motion recordsThe seismic design spectrum is the most representative statistical mean curve that can be extracted from a large
number of seismic response spectra under the same basic conditions. Therefore, the structural response based on the design response spectrum analysis may be larger than the actual response. To assess the reliability of the results provided by the response spectrum analysis method, the results of the time-history analysis based on two sets of ground motion are compared. Eight records from ground motions in the Wenchuan earthquake and the Tohoku-Oki earthquake are selected. The two groups of records both contain significant amounts of information specific to the long-period segment. It is important to select proper ground motions to estimate seismic demands using linear response history analyses. Current seismic design provisions such as GB 50011-2010 provide criteria for selecting ground motions. In this study, to evaluate the reliability of the seismic design spectra in the long-period segment, far-field ground motions with long-period components are selected. The selection criteria are as follows: earthquake magnitude Ms≥8.0 (large magnitude), source depth ≤45 km (destructive shallow earthquake), epicentral distance 300 km≤R≤700 km (long distance), and the station has detailed geological survey data.
An elastic dynamic time-history analysis is conducted under the conditions of the 8-degree zone seismic acceleration (a=70 gal) in accordance with the Chinese seismic design code (GB 50011, 2010). The original seismic record information is shown in Table 1. After applying a zero line correction and bandpass filtering, the low frequency cutoff frequency is 0.05 Hz. The site conditions in the Tohoku-Oki ground motion record are determined in accordance with the site classification criteria of the Chinese seismic design code. To preserve the spectral characteristics, only the acceleration peak is scaled (amplitude modulation). Based on the response spectrum analysis, the average acceleration response spectra and the displacement response spectra of the two sets of seismic records are shown in Figure 2. The average displacement response spectra show that the selected ground motion records have many long-period components.
Table 1. Ground motion records used in the dynamic time-history analysis.
Record group Sequence Station Component
Distance to epicenter
(km)
PGA(gal)
Delay(s) Site Classification
Wenchuan Earthquake
records
E1 61FEX NS 540 21.6 127 Medium-soft soilE2 61HXI NS 597 90.3 439 Medium-soft soilE3 61LOX NS 537 89.3 173 Medium-soft soilE4 61QIS NS 552 37.3 306 Medium-soft soilE5 62HEP NS 557 43.2 434 Medium-soft soilE6 62KLE NS 489 13.1 223 Medium-soft soilE7 62LJB NS 566 14.7 251 Medium-soft soilE8 62ZXX NS 588 13.6 147 Medium-soft soil
Tohoku-Oki Earthquake
records
E9 ABSH11 EW2 655 13.117 300 Type IIIE10 AICH06 EW2 650 8.107 285 Type IIIE11 IBRH20 EW2 316 187.623 300 Type IIIE12 NMRH03 EW2 630 21.010 300 Type IIIE13 SBSH07 EW2 546 10.804 300 Type IIIE14 TKCH07 EW2 526 32.3 300 Type IIIE15 SZOH35 EW2 487 48.5 300 Type IIIE16 SZOH42 EW2 495 61.038 300 Type III

65Jing Zhou, Xiaodan Fang and Yi Jiang
(a)
(b)
Figure 2. Response spectra in the ground motion records: (a) acceleration response spectra; (b) displacement response spectra.
Structural model Taking two actual projects as examples, the differences between the results obtained from the response spectrum
analysis and the elastic dynamic time-history analysis in accordance with the Chinese seismic design code, the Japanese seismic design code, the design spectrum in the US seismic design code, and the proposed design spectrum are compared in Figure 1. The square root of the sum of the squares (SRSS) combination is used to analyze the mode-superposition response spectra. Three-dimensional views of the structures are shown in Figure 3.
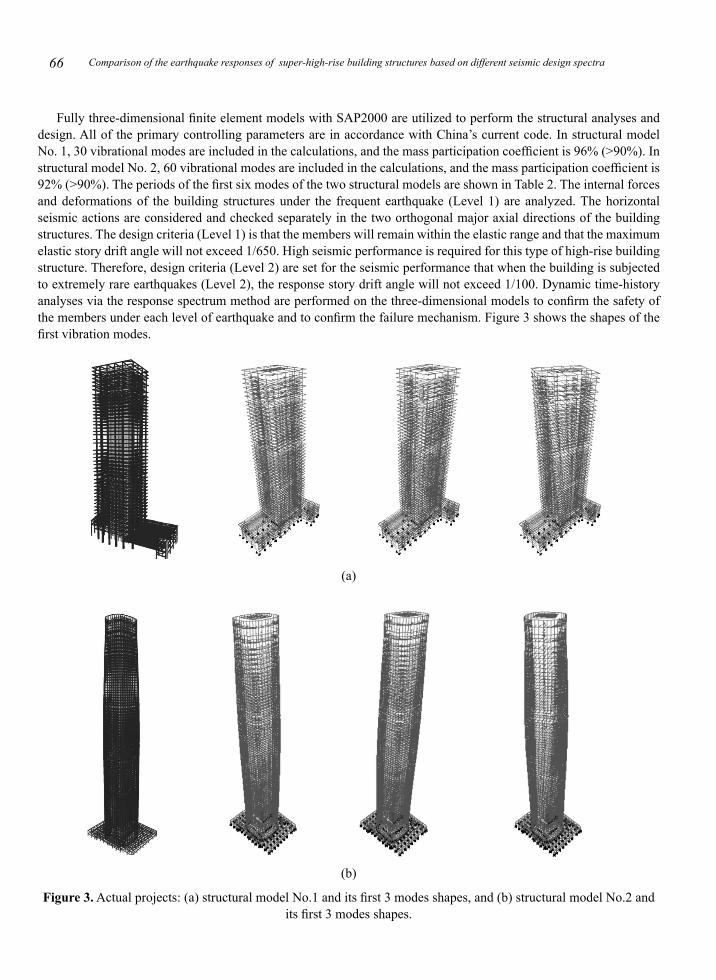
Structural model No. 1 represents the Olympic Park International Center in Shenzheng, China. The height of the building structure above the ground is 200.5 m, and it has 48 floors. The structural system is basically a core-supported structure, and its structural members are beams, columns, and the shear wall core, which are generally RC elements. Structural model No. 2 represents the International Financial Center in Guizhou, China, which has a structural height of 380 m above the ground and 80 floors. The structural system is also a core-supported structure, and its structural members are beams, columns, and the shear wall core. The columns are concrete-filled circular hollow section (CHS) members. The beams are generally RC elements, and the shear wall cores are typical steel RC walls. This composite wall core is designed because the structural core is the main element that withstands horizontal loads.
Comparison of the earthquake responses of super-high-rise building structures based on different seismic design spectra66
Fully three-dimensional finite element models with SAP2000 are utilized to perform the structural analyses and design. All of the primary controlling parameters are in accordance with China’s current code. In structural model No. 1, 30 vibrational modes are included in the calculations, and the mass participation coefficient is 96% (>90%). In structural model No. 2, 60 vibrational modes are included in the calculations, and the mass participation coefficient is 92% (>90%). The periods of the first six modes of the two structural models are shown in Table 2. The internal forces and deformations of the building structures under the frequent earthquake (Level 1) are analyzed. The horizontal seismic actions are considered and checked separately in the two orthogonal major axial directions of the building structures. The design criteria (Level 1) is that the members will remain within the elastic range and that the maximum elastic story drift angle will not exceed 1/650. High seismic performance is required for this type of high-rise building structure. Therefore, design criteria (Level 2) are set for the seismic performance that when the building is subjected to extremely rare earthquakes (Level 2), the response story drift angle will not exceed 1/100. Dynamic time-history analyses via the response spectrum method are performed on the three-dimensional models to confirm the safety of the members under each level of earthquake and to confirm the failure mechanism. Figure 3 shows the shapes of the first vibration modes.
(a)
(b)
Figure 3. Actual projects: (a) structural model No.1 and its first 3 modes shapes, and (b) structural model No.2 and its first 3 modes shapes.
67Jing Zhou, Xiaodan Fang and Yi Jiang
Table 2. The vibrational periods of the first 6 modes in the structural models.
Vibrational Mode
Structural model No. 1 Structural model No. 2Vibrational Period (s) Vibrational Direction Vibrational
Period (s) Vibrational Direction
1st mode 5.994 Mainly horizontal motion in the Y direction 9.557 Mainly horizontal motion in the
X direction
2nd mode 5.503 Mainly horizontal motion in the X direction 8.976 Mainly horizontal motion in the
Y direction
3rd mode 4.118 Mainly torsion 5.724 Mainly torsion
4th mode 1.559 Mainly torsion 3.258 Mainly horizontal motion in the X direction
5th mode 1.493 Mainly horizontal motion in the X direction 2.755 Mainly horizontal motion in the
Y direction
6th mode 1.341 Mainly horizontal motion in the Y direction 2.185 Mainly torsion
RESULTS AND DISCUSSIONThe damping ratio of the structural system is considered to be 5%. The maximum displacement (DT) response at
the top of the building structure and the maximum base earthquake shear force (VS) are taken as reference parameters, and the seismic responses in the X and Y directions are recorded. The displacement response obtained from the dynamic time-history analysis and the seismic shear responses are highly discrete. Eight seismic records from the Wenchuan earthquake and eight seismic records from the Tohoku-Oki earthquake are selected, and the average values (μ) of all 16 seismic records are selected for comparison (Tables 3 and 4).
Maximum displacement response at the topThe maximum displacement response (Table 3 and Figure 4) calculated based on the response spectrum method is
large, which is consistent with the sequence of the displacement spectrum (Figure 1b) obtained from the quasi-spectral relationship. The spectrum in the Japanese seismic design codes gives the largest result, followed by those in the Chinese and US seismic design codes. The proposed design spectrum gives the smallest result. The basic vibrational period of structural model No. 2 is larger. The displacement responses calculated based on the US seismic design code and the proposed design spectrum are significantly different from those calculated based on the Japanese and Chinese seismic design codes (Figure 4b). This observation reflects the characteristics of the displacement response spectrum (Figure 1b). The maximum displacement responses calculated based on the four seismic design spectra are all larger than the maximum average displacement response (μ1, μ2, μ3) calculated based on the time-history analysis. For structural model No. 2 (Figure 4b), which has a longer vibration period, the maximum displacement response calculated based on the spectrum in the Japanese seismic design code is more than 2.8 times the maximum average displacement response μ3 calculated based on the time-history analysis. If calculated based on the spectrum in the Chinese and US seismic design codes, this ratio will be more than 2.5 and 1.4 times greater, respectively. However, the maximum displacement response calculated based on the proposed design spectrum is only approximately 1.1 times the maximum average displacement response μ3 calculated based on the time-history analysis, which means that these two results are more similar to each other. A comparison of the calculated results based on structural model No. 1 (Figure 4a) shows that the overall trends are similar, although the difference between the displacement responses is distinct due to the model’s short vibration period. In the US seismic design code, the transition period of the long-period segment’s starting point is longer, and the displacement response spectrum is larger. The difference is

Comparison of the earthquake responses of super-high-rise building structures based on different seismic design spectra68
more pronounced than in the displacement response calculated based on the time-history analysis. The two engineering examples also show that, for the long-period building structures, the displacement responses calculated based on the design spectrum in the Japanese and Chinese seismic design codes are too conservative. These results are not consistent with the actual seismic response of the building structure, which may lead to a conservative seismic design. However, the proposed design spectrum reflects the real ground motion characteristics, which are characterized by a rapidly descending earthquake velocity due to the effect of the long period response spectrum. The difference between the maximum calculated displacement response and the maximum calculated average displacement response based on the time-history analysis decreases significantly. Therefore, the proposed design spectrum is highly reliable.
Table 3. Comparison of the different calculation methods (ξ=0.05).
Dynamic calculation methodStructural model No. 1 Structural model No. 2
DT (mm) VS (kN) DT (mm) VS (kN)X Y X Y X Y X Y
Resp
onse
spec
trum
meth
od Spectra of Chinese code 341.5 422.2 36,961 35,848 655.3 643.8 39,365 43,359Spectra of Japanese code 397.0 471.6 49,725 47,682 757.7 713.6 52,858 57,649
Spectra of US code 287.5 342.2 36,673 35,301 361.8 357.1 33,076 37,764Proposed design spectrum 243.4 264.8 39,834 38,679 297.2 287.1 38,189 43,939
Tim
e-hi
stor
y an
alys
is m
etho
d
Sei
smic
rec
ords
of W
ench
uan
eart
hqua
ke
E1 72.8 82.6 35,615 29,570 140.0 191.6 22,042 37,376E2 211.3 191.2 37,548 34,453 148.2 192.9 18,254 37,450E3 104.0 110.7 33,595 31,072 181.3 210.4 30,436 34,008E4 145.2 145.9 46,698 38,751 98.0 146.7 22,506 37,468E5 84.1 77.5 32,007 29,642 92.4 90.7 22,030 34,018E6 231.8 240.2 53,834 52,509 687.5 615.7 76,685 65,398E7 127.3 124.6 21,396 14,061 200.3 198.7 22,647 24,005E8 131.4 159.6 37,690 47,526 194.4 209.1 35,066 35,156
Average μ1 138.5 141.5 37,298 34,698 217.8 232.0 31,208 38,110Standard deviation σ1 56.9 55.2 9079 11,120 194.1 160.2 17,919 11,109
Sei
smic
rec
ords
of T
ohok
u-O
kiea
rthq
uake
E9 115.2 141.4 40,735 45,436 250.4 192.7 41,992 52,624E10 307.7 267.7 62,174 55,197 300.9 325.8 32,952 66,852E11 233.7 222.2 36,478 35,888 685.3 684.4 17,693 21,788E12 94.0 89.0 23,449 29,343 82.7 103.1 16,522 23,596E13 188.6 195.2 51,491 44,503 196.1 186.9 46,148 38,737E14 75.4 84.1 30,635 35,959 97.5 117.9 19,114 21,794E15 81.1 86.6 35,784 41,241 167.0 154.8 24,180 38,360E16 115.7 124.8 31,192 27,660 222.0 216.7 24,645 35,386
Average μ2 175.8 161.0 38,992 39,403 289.6 284.9 27,906 37,392Standard deviation σ2 83.5 69.2 12,453 9091 207.1 208.4 11,290 15,963
Overall average μ3 154.5 150.6 38,145 37,051 248.5 254.7 29,557 37,751Overall standard deviation σ3 69.3 60.6 10,821 10,508 195.3 176.8 15,286 13,597
Spectra of Chinese code /μ3 2.21 2.80 0.97 0.97 2.64 2.53 1.33 1.15Spectra of Japanese code /μ3 2.57 3.13 1.30 1.29 3.05 2.80 1.79 1.53
Spectra of US code /μ3 1.86 2.27 0.96 0.95 1.46 1.40 1.12 1.00Proposed design spectrum /μ3 1.58 1.76 1.04 1.04 1.20 1.13 1.29 1.16

69Jing Zhou, Xiaodan Fang and Yi Jiang
(a)
(b)
Figure 4. Maximum displacement of the top: (a) structural model No.1 (ξ=0.05), and (b) structural model No.2 (ξ=0.05).
Maximum seismic response of the base shear forceThe differences in the maximum base shear force (Figure 5) calculated based on the mode-superposition response
spectrum method are not as significant as the differences in the maximum displacement response at the top. The difference between the results calculated in accordance with the spectra stipulated in the Chinese and US seismic design codes and the proposed design spectrum is less than 16%. The spectrum stipulated in the Japanese seismic design code gives the largest maximum shear force. This is because, in the full period spectrum of the earthquake influence coefficient spectrum, the spectrum values in the Japanese seismic design codes are always the largest. For the earthquake effect coefficient that corresponds to the basic vibrational period (T1=5.994 s) in structural model No. 1 (Figure 1a), the spectrum value in the Chinese seismic design code is 1.65 times that given by the proposed design spectrum. For the earthquake effect coefficient that corresponds to the basic vibrational period (T1=9.557 s) in structural model No. 2, the spectrum value in the Chinese seismic design code is 2.65 times that given by the proposed design spectrum. However, the differences between the maximum base shear forces (Figure 5) are small. In structural

Comparison of the earthquake responses of super-high-rise building structures based on different seismic design spectra70
model No. 1 (Figure 5a), the result given by the proposed design spectrum is approximately 8% larger than the results calculated based on the spectrum in the Chinese seismic design code. The main reason for this result is that, in the acceleration-sensitive section (platform section) and the velocity-sensitive section (Tg<T<3.5 s), the proposed design spectrum value is larger than the spectrum values in the Chinese seismic design code. When the vibration model’s mass participation coefficient is greater than 90%, most of the high-order vibration modes studied are located in the short-period segment. Therefore, the complex maximum base shear force after the SRSS complex vibration analysis does not decrease. This shows that, compared with the Chinese seismic design code spectrum, the analysis based on the proposed design spectrum can better characterize the effect of high-order vibration modes on long-period building structures and the dynamic responses of the ultra-high and long-period building structures.
(a)
(b)
Figure 5. Maximum base shear force: (a) structural model No. 1 (ξ=0.05); (b) structural model No. 2 (ξ=0.05).

71Jing Zhou, Xiaodan Fang and Yi Jiang
Comparison of the responses for high damping ratios
The response spectra for the high damping ratios (ξ=0.1 and ξ=0.2; Figures 1c and 1d, respectively) are used to perform the modal decomposition response analysis, and the time-history analysis is conducted simultaneously. The maximum displacement at the top and the maximum base shear force in the Y direction are taken as reference parameters, and the results are compared in Table 4 and Figures 6 and 7. Except for the results calculated based on the design spectrum in the Chinese seismic design code, the results calculated based on the design spectra and the average results calculated based on the time-history analysis show the same trends. The maximum displacement responses at the top and the maximum base shear force decrease as the damping ratio increases. The results calculated based on the design spectrum in the Japanese seismic design code change the most.
For structural model No. 1 (T1=5.994 s), the maximum displacement response and the maximum base shear force calculated based on the design spectrum in the Chinese seismic design code also decrease as the damping ratio increases, although the decreases are limited. However, for structural model No. 2 (T1=9.557 s), the maximum displacement response increases as the damping ratio increases, whereas the maximum base shear force does not change significantly. The design spectrum in the Chinese seismic design code (Figure 1) shows that, in the long period, the design spectrum value in the Chinese seismic design code increases as the damping ratio increases. This phenomenon becomes more pronounced as the vibrational period increases. Therefore, for structural model No. 2 in the long period, this is demonstrated by the anomaly in the displacement variation. In addition, the base shear force, which decreases as the damping ratio increases, may be essentially the same as the shearing force generated by the increase of the response spectrum’s value. Therefore, the base shear force does not change significantly.
The results of the displacement responses calculated based on the four design spectra are all larger than the average results calculated based on the time-history analysis. All of the cases have large safety margins. However, as the damping ratio increases, the maximum base shear forces calculated in accordance with the spectra in the Japanese and US seismic design codes, as well as the proposed design spectra, are all smaller than the average results calculated based on the time-history analysis. The main reason is that the design spectra in the Japanese and US seismic design codes and the proposed design spectrum use the damping adjustment ratio, which does not change with the vibrational period. Several previous analyses have demonstrated that, for both the absolute acceleration spectrum values calculated based on the earthquake’s inertial forces and the quasi-acceleration spectrum calculated based on the hysteresis restoring force, the increasing proportion of the damping force in the internal force of the structural system as the damping increases in the long-period segment cannot be neglected. Therefore, for the design spectrum in the long period, the damping adjustment should be appropriately reduced.

Comparison of the earthquake responses of super-high-rise building structures based on different seismic design spectra72
Table 4. Comparison of the different calculation methods (responses in the Y direction).
Dynamic calculation method
Structural model No.1 Structural model No.2
DT (mm) VS (kN) DT (mm) VS (kN)
ξ=0.1 ξ=0.2 ξ=0.1 ξ=0.2 ξ=0.1 ξ=0.2 ξ=0.1 ξ=0.2
Res
pons
e sp
ectr
umm
etho
d
Spectra of Chinese code 395.0 365.4 31,083 27,021 698.7 753.4 42,576 42,681
Spectra of Japanese code 353.7 235.8 35,784 23,853 536.6 356.8 43,303 28,825
Spectra of US code 283.3 224.3 28,494 21,753 306.6 257.6 31,328 24,879
Proposed design spectrum 207.6 154.9 30,291 22,565 224.7 167.4 34,419 25,621
Tim
e-hi
stor
y an
alys
is m
etho
d
Seis
mic
rec
ords
of W
ench
uan
eart
hqua
ke
E1 75.5 66.7 25,415 21,193 152.0 117.4 29,212 24,607
E2 168.5 132.3 30,186 22,032 152.8 171.1 26,943 21,583
E3 104.3 94.5 36,673 31,551 170.0 112.8 37,165 38,590
E4 120.0 86.4 28,897 23,160 118.9 91.1 27,847 22,064
E5 66.7 54.6 25,232 21,044 79.6 64.7 27,334 21,916
E6 189.0 198.8 29,768 29,708 547.2 417.5 53,146 36,465
E7 118.9 101.7 14,575 15,177 171.0 137.1 20,091 18,174
E8 131.3 93.9 34,247 26,980 181.9 145.9 29,585 25,804
Average μ1 121.8 103.6 28,124 23,856 196.7 157.2 31,415 26,150
Standard deviation σ1 41.9 44.9 6734 5310 145.5 110.2 9936 7394
Seis
mic
rec
ords
of T
ohok
u-O
ki e
arth
quak
e E9 119.2 92.4 34,652 26,568 177.6 138.3 46,177 34,535
E10 212.6 159.6 45,283 38,452 250.2 189.3 46,206 38,546
E11 180.8 138.7 31,636 25,757 120.0 96.4 21,846 21,156
E12 78.1 66.7 23,287 21,436 96.2 86.6 22,828 21,319
E13 180.5 115.9 39,027 30,987 149.5 100.8 34,316 30,625
E14 68.2 50.6 28,468 23,037 102.2 80.8 22,169 19,846
E15 77.5 65.4 31,753 25,692 136.6 124.0 34,479 29,367
E16 115.2 99.3 26,084 24,859 193.3 158.6 29,547 23,879
Average μ2 129.0 98.6 32,524 27,099 153.2 121.9 32,196 27,409
Standard deviation σ2 55.5 38.0 7114 5367 51.9 38.2 10,028 6916
Overall average μ3 125.4 101.1 30,324 25,477 174.9 139.5 31,806 26,780
Overall standard deviation σ3 47.6 40.3 7067 5423 107.9 81.7 9652 6947
Spectra of Chinese seismic code /μ3 3.15 3.61 1.03 1.06 3.99 5.40 1.34 1.59
Spectra of Japanese seismic code /μ3 2.82 2.33 1.18 0.94 3.07 2.56 1.36 1.08
Spectra of US seismic code /μ3 2.26 2.22 0.94 0.85 1.75 1.85 0.98 0.93
Proposed design spectrum /μ3 1.66 1.53 1.01 0.89 1.28 1.20 1.08 0.96

73Jing Zhou, Xiaodan Fang and Yi Jiang
(a)
(b)
Figure 6. Maximum displacement at the top: (a) structural model No. 1 (Y direction), and (b) structural model No. 2 (Y direction).
Comparison of the earthquake responses of super-high-rise building structures based on different seismic design spectra74
(a)
(b)
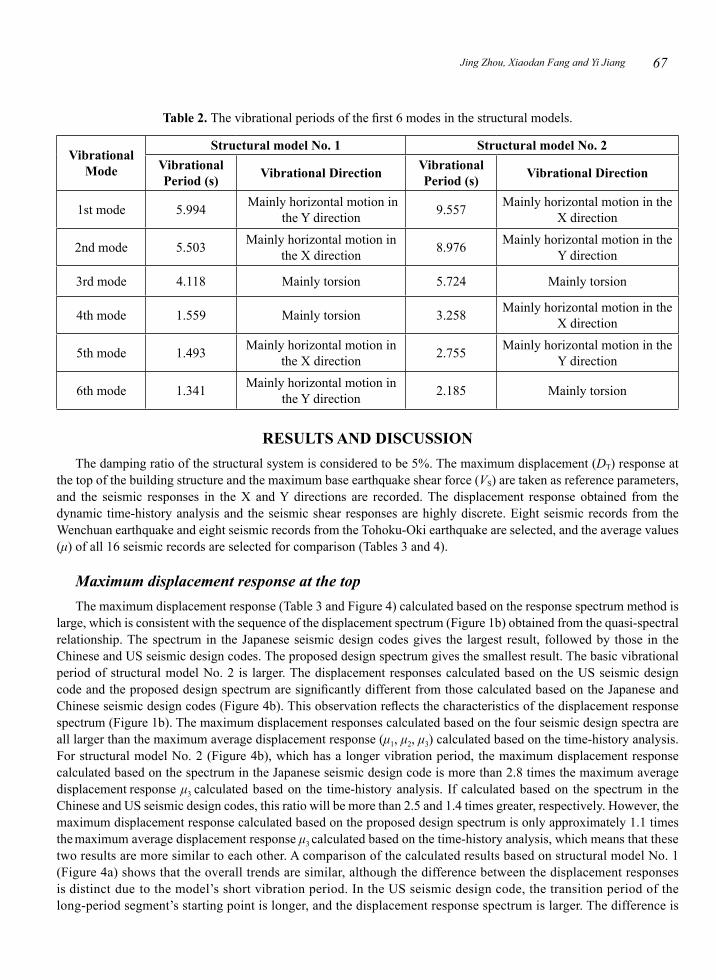
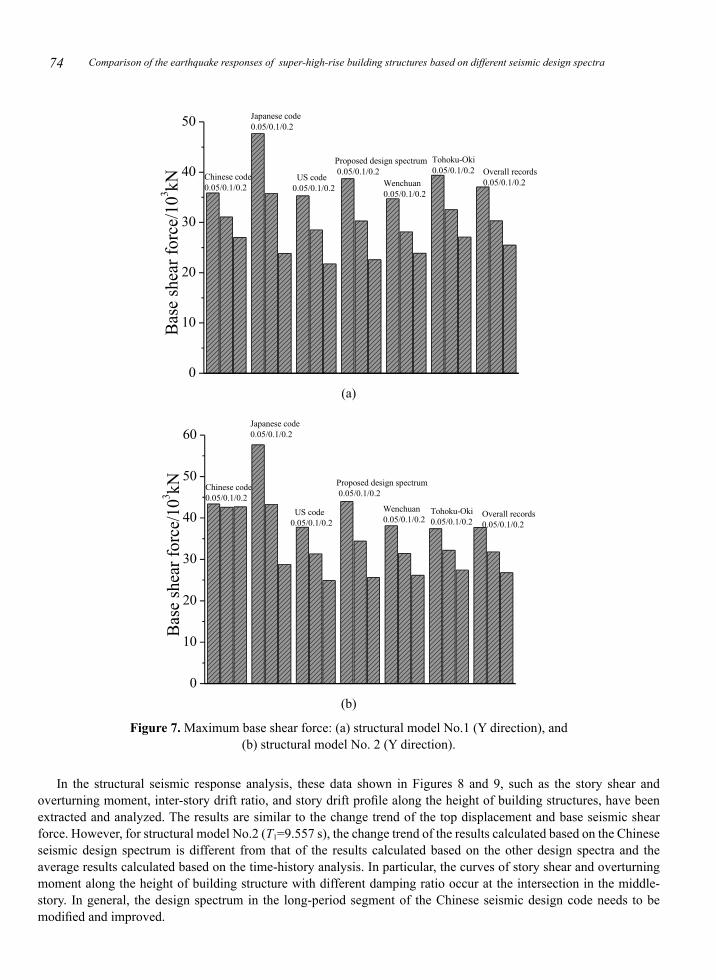
Figure 7. Maximum base shear force: (a) structural model No.1 (Y direction), and (b) structural model No. 2 (Y direction).
In the structural seismic response analysis, these data shown in Figures 8 and 9, such as the story shear and overturning moment, inter-story drift ratio, and story drift profile along the height of building structures, have been extracted and analyzed. The results are similar to the change trend of the top displacement and base seismic shear force. However, for structural model No.2 (T1=9.557 s), the change trend of the results calculated based on the Chinese seismic design spectrum is different from that of the results calculated based on the other design spectra and the average results calculated based on the time-history analysis. In particular, the curves of story shear and overturning moment along the height of building structure with different damping ratio occur at the intersection in the middle-story. In general, the design spectrum in the long-period segment of the Chinese seismic design code needs to be modified and improved.

75Jing Zhou, Xiaodan Fang and Yi Jiang
(a)
(b)
(c)

Comparison of the earthquake responses of super-high-rise building structures based on different seismic design spectra76
(d) Figure 8. Structural model No.1 (Y direction): (a) story shear, (b) overturning moment, (c) inter-story drift ratio,
and (d) story drift profile.
(a)
(b)

77Jing Zhou, Xiaodan Fang and Yi Jiang
(c)
(d)
Figure 9. Structural model No.2 (Y direction): (a) story shear, (b) overturning moment, (c) inter-story drift ratio, and (d) story drift profile.
CONCLUSIONSIn the long period segments of the design spectra in the Japanese and Chinese seismic design codes, the displacement
spectra increase significantly as the vibrational period increases. This is not consistent with the statistical attenuation characteristics and the physical meaning of the displacement response spectrum.
The maximum displacement responses at the top of long-period building structures, which are calculated using the mode-superposition response spectrum method in the design spectra stipulated in the Japanese and Chinese seismic design codes, are significantly larger than the average result calculated based on the dynamic time-history analysis method. The Japanese and Chinese seismic design codes are too conservative in this regard. The differences between the displacements calculated based on the design spectrum stipulated in the US seismic design code or the proposed design spectrum and the results calculated based on the time-history analysis are relatively small. Therefore, the US seismic design code and the proposed design spectrum are highly reliable in this regard.

Comparison of the earthquake responses of super-high-rise building structures based on different seismic design spectra78
When the damping ratio is 0.05, the maximum base earthquake shear force of the long-period building structure calculated using the mode-superposition response spectrum method in the proposed design spectrum is larger than the average results calculated based on the time-history analysis. Therefore, the proposed design spectrum is highly reliable in this regard. Taking into account the site conditions, by increasing the maximum value of the acceleration-sensitive segment in the short-period segment and increasing the site’s characteristic period, the proposed design spectrum can better characterize the influence of the higher-order vibrational modes in the long-period building structure.
For the large long-period building structures, the maximum displacement responses calculated based on the design spectrum in the Chinese seismic design code increase as the damping ratio increases, whereas the maximum base shear forces do not change significantly. This indicates that the long period segment of the design spectrum in the Chinese seismic design code must be modified and improved. For large long-period building structures, as the damping ratio increases, the proportion of the damping force in the internal force of the structural system increases and thus cannot be neglected. Therefore, the damping force reduction ratio in the long period section of the response spectrum must be reduced appropriately.
ACKNOWLEDGMENTThe authors gratefully acknowledge the financial support provided by the Foundation of the State Key Laboratory
of Subtropical Building Science, South China University of Technology (grant nos. 2018ZB28 and 2017KC18), the Natural Science Foundation of Guangdong Province (grant no. 2018A030313688), and the Natural Science Foundation of Hunan Province (grant no. 2018JJ2401).
REFERENCESASCE, 2010. Minimum design loads for buildings and other structures. American Society of Civil Engineers, Reston, Virginia,
USA.
Cao, J., Shi, W., Liu, W. & Jiang, X., 2011. Relative displacement response spectrum of a long-period structure. Journal of Vibration and Shock, 30(7):63-70.
Chandler, A. & Lam, N., 2003. An attenuation model for distant earthquakes. Earthquake Engineering and Structural Dynamics, 33(2):183-210.
Chen, Y. & Yu, Y., 2007. Adaptability of long-period portion of multi-damping-ratio-spectra in the code for seismic design of buildings (GB50011-2001). Earthquake Research in China, 23(2):131-140.
Fang, X., Wei, L. & Zhou, J., 2014. Characteristics of earthquake response for long-period structure and response spectrum. Journal of Building Structures, 35(3): 16-23.
GB 50011, 2010. Code for seismic design of buildings, China academy of building research. China Architecture & Building Press, Beijing, China.
JGJ 3, 2010. Technical specification for concrete structures of tall buildings. China Architecture & Building Press, Beijing, China.
Liang, X., Dong, Z., Wang, Y., et al., 2009. Damage to tall buildings in areas with large epicentral distance during M8.0 Wenchuan earthquake. Journal of Earthquake Engineering and Engineering Vibration, 29(1):24-31.
Li, H., Li, L. & Feng, Q., 2012. Seismic design spectra in long-period from spectral displacement analyses. Journal of Earthquake Engineering and Engineering Vibration, 32(4):47-53.
Luo, K. & Wang, Y., 2011. Researches about the response spectra with different damping ratio. Building Structures, 41(11):16-21.
Luo, K. & Wang, Y., 2006. Research on conversion relationship among the parameters of ground motions in seismic design codes of China, America and Europe. Building Structures, 36(8): 103-107.
Mistumasa, M., Izuru, O., Masanori, I., et al., 2003. Performance-based seismic design code for buildings in Japan. Earthquake Engineering and Engineering Seismology, 4(1):15-25.
Sun, Y., Zhao, S. & Ye, L., 2011. Comparative study of seismic design method for reinforced concrete structures in China and
79Jing Zhou, Xiaodan Fang and Yi Jiang
Japan. Building Structures, 41(5): 13-19+32.
Takewakii, I., Murakami, S., Fujita, K., et al., 2011. The 2011 off the Pacific coast of Tohoku earthquake and response of high-rise buildings under long-period ground motions. Soil Dynamic and Earthquake Engineering, 31(11):1511-1528.
Yu, Y. & Wang, S., 1997. The long period ground motion response spectra of southern Yellow Sea earthquake, November 9, 1996. Earthquake, 17(4):364-370.
Zhou, F., Gui, H., Shigetake, A., et al., 2012. Inspection report of the disaster of the East Japan earthquake by Sino Japanese joint mission. Building Structures, 42(4): 1-20.
Zhou, J., Fang, X. & Jiang, Y., 2015. Characteristic periods of response spectrum for long-period far-field seismic ground motions. Journal of Building Structures, 36(6): 1-12.
Zhou, J., Fang, X. & Mao, W., 2017. Attenuation power index and damping reduction factor of seismic design spectrum for long-period ground motions. Journal of Building Structures, 38(1): 62-75.
Zhou, J., Tang. K., Wang. H. & Fang, X., 2014. Influence of ground motion duration on the damping reduction factor. Journal of Earthquake Engineering, 18(5):816-830.
Submitted: 21/11/2017Revised: 09/01/2018Accepted: 08/03/2018

Comparison of the earthquake responses of super-high-rise building structures based on different seismic design spectra80
W ËUI* WHK WO UO rO UB vK ΡUM ‰“ôeK Ϋb WI UA « w U *« q UO qF œËœ— W —UI
‰“ôe «
!UO w **Ë m U Ê«œ ËUO **¨* ¨uA mMO *5B « ¨uA G «u ¨UO u uMJ K ÊU «u WF U ¨W uO ü« WOz«u ô« o UM*« U AM ÂuKF vM u « d *«*
5B « ¨uA G «u ¨UO u uMJ K ÊU «u WF U ¨Y «Ë Í—ULF*« rOLB « bNF **
W�ö)«
WK u “«e « «d H ŸUH —ô« 5I U 5OM qOK% - ¨w «e e « rOLB « ·UO √ s q _« WK u ¡«e _« WO u u rOOI
- ¨WF «b « ÈuI « a —«u Ë U Ë√ qOK%Ë WO «e e « ‰UL _« ◊U/√ l “u Ë pJH qF œ— qOK%Ë b�— ‰ö s Ë ÆÈb*«
W M U Æ U U _« bM WO «e e « ‰UL ú ÈuBI « hI « …u qF œ—Ë `D « bM vB _« w UI ô« qFH « œ— W —UI
l dO qJA W «“ù« ·UO √ œ«œe ¨WOMOB «Ë WO U UO « rOLB « “u — w UNOK ’uBM*« q _« WK u WO UOI « rO UB K
‰«e eK h …u vB √ o «u Æw UI ô« qFH « œ— nOH WOzUB ù« hzUB)« l v UL ô U u Ë ¨“«e ô« …d …œU “
wJO UM b « X u «Ë a —U « WI dD W u ;« ZzU M « j u l Õd IÔ*« rOLB « nO w W U ô« WI dD ÎUI Ë UN U -
qJA eO1 Õd IÔ*« rOLB « nO ÊS ¨p – l Ë ÆWOJ d _«Ë WOMOB « WO UOI « rO UB K ÎUI Ë W u ;« ZzU M « l p c Ë
œ— œ«œe ¨ÎUO q _« WK u q UONK W M U Æd √ qJA WFH d*« «eNK q _« WK u q UON « h …u qF œ— qC √
w dOOG « W —œ ÊuJ ULMO Ɖö L{ô« ‰bF œU œ“« l WOMOB « WO UOI « rO UB K ÎUI Ë »u ;« vB _« w UI ô« qFH «
dO X «“U WOMOB « WO UOI « rO UB K q _« WK u «œ«b ù« Ê√ 5 Íc « d _« ÆΫb …dOG� U U _« bM hI « …u
‰ö L{ô« …u W œU œ“« q U& sJ1 ô ¨‰ö L{ô« ‰bF œU œ“« V Ë ªq _« WK u …dO J « q UONK W M U ÆW u u
X u « ‰u l qFH « œ— qOKI s W&UM « ‰ö L{ô« …u s qOKI « V ¨p c ÆvKJON « ÂUEMK WOK «b « ÈuI « j Ë
ÆV UM qJA