Embed Size (px)
Citation preview

1
Comparison of the South African Spondaic wordlist and the
CID W-1 wordlist for measuring Speech Recognition Threshold
by
Tanya Heather Hanekom
A dissertation submitted in fulfilment of the requirements for the degree
M Communication Pathology
(Audiology)
in the
Department of Speech-Language Pathology and Audiology at the
UNIVERSITY OF PRETORIA
FACULTY OF HUMANITIES
SUPERVISOR: Dr M. Soer
CO-SUPERVISOR: Dr L. Pottas
July 2014
i
With thanks to
My Lord and Saviour, the Good Shepherd, for life, and life in abundance.
My husband, Marc Hanekom, for your love, unending support and endless offers of tea.
Dr Maggi Soer and Dr Lidia Pottas for the many hours you have spent on this work. Thank
you for your encouragement and respect.
My family, especially my parents, for always believing in me.
Alana Boulle, for lifelong friendship and for telling anyone who will listen.
My colleagues, especially Margot Hamman & Jucelynn Richter, for grace at work.
Hennie Gerber, for his assistance.
Brent Archer, for the initial inspiration earned over lunch.
Dedicated to the memory of my mormor
1927-2008
Speech is civilisation itself.
The word,
even the most contradictious word, preserves contact –
it is silence which isolates.
Thomas Mann, The Magic Mountain (1924)

ii
I declare that the dissertation, which I hereby submit for the degree M. Communication
Pathology (Audiology) at the University of Pretoria, is my own work and has not previously
been submitted by me for a degree at this or any other tertiary institution.
Please note that the South African Spondaic wordlist was originally developed in part at the
University of the Witwatersrand, as an unpublished 4th year research report submitted in
partial fulfilment of the requirements for the degree BA(Sp.&H.Th), Department of Speech
Pathology and Audiology, School of Human and Community Development, Faculty of
Humanities, University of the Witwatersrand.
The University of the Witwatersrand has granted permission for the work to be used in the
current study. The researcher, Tanya Hanekom, was registered at the University of the
Witwatersrand as Tanya Durrant (maiden name) in 2006.

iii
Abstract
Title: Comparison of the South African Spondaic wordlist and the CID W-1 wordlist for
measuring Speech Recognition Threshold
Researcher: Mrs Tanya Hanekom
Supervisors: Dr M. Soer and Dr L. Pottas
Department: Speech-Language Pathology and Audiology
Degree: M. Communication Pathology
Introduction. The Central Institute for the Deaf published Auditory Tests W-1 (CID W-1)
spondaic wordlist was developed in the USA in 1947 and 1952. Certain American-English
words contained in the wordlist are unfamiliar to many South Africans, even English first
language (EFL) speakers, but particularly those who use English as a second language (ESL).
Familiarity with spondaic words is one of the most important qualities of the test items used
to determine Speech Recognition Threshold (SRT).
Objectives. The aim of this study was to compare the SRT results obtained with the English
South African Spondaic (SAS) wordlist developed by Durrant (2006) and the English CID
W-1 spondaic wordlist when measuring the SRT of adult ESL speakers in South Africa.
Method. Audiometric Pure Tone Average (PTA) and SRT measurements were obtained for
101 (197 ears) ESL participants with normal hearing or a minimal hearing loss <26 dBHL
(mean age 33.3). PTA/SRT correlations were compared when using the SAS wordlist (groups
one and two), as well as either the ‘less familiar’ CID W-1 (group one) or ‘more familiar’
CID W-1 (group two), in a mixed matched group design.
Results. A Pearson correlation analysis revealed a significant and positive correlation for all
three wordlists. The Pearson correlation analysis revealed a strong PTA/SRT correlation
when using the South African Spondaic (SAS) wordlist (right ear: 0.65; left ear 0.58) and the
‘more familiar’ words from the CID W-1 wordlist (right ear: 0.63; left ear: 0.56). The use of
the ‘less familiar’ words from the CID W-1 wordlist revealed weak correlations (right ear:
0.30; left ear: 0.32). Paired sample T-tests indicated a statistically significantly stronger
PTA/SRT correlation when the SAS wordlist was used, rather than either of the CID W-1
wordlists, at a 95% level of confidence.
Conclusions. The use of the SAS wordlist yields a stronger PTA/SRT correlation than the use
of the CID W-1 wordlist, when performing SRT testing as part of the speech audiometry
battery on South African ESL speakers with normal hearing, or minimal hearing loss <26
dBHL.
Key words: Speech Recognition Threshold (SRT), English second language (ESL), South
Africa, South African Spondaic wordlist, CID W-1 wordlist, familiarity.

iv
Table of contents
Chapter 1: Introduction and background ........................................................................... 1
1.1 Rationale...................................................................................................................... 1
1.2 Definition of terms ...................................................................................................... 5
1.3 Chapter layout ............................................................................................................. 8
2 Chapter 2: Literature review: theoretical background to spondaic words and wordlists ... 9
2.1 Familiarity ................................................................................................................... 9
2.2 Homogeneity ............................................................................................................. 10
2.3 The development of wordlists for audiometric testing.............................................. 11
2.4 Recorded wordlists or monitored live voice ............................................................. 12
2.5 Speech audiometry within the South African context ............................................... 13
2.6 Alternative solutions to speech audiometry in South Africa..................................... 16
2.6.1 Digit pairs........................................................................................................... 16
2.6.2 Wordlists in African languages .......................................................................... 16
2.6.3 The development of the SAS wordlist ............................................................... 17
2.7 Summary ................................................................................................................... 18
3 Chapter 3: Methodology .................................................................................................. 18
3.1 Research aims ............................................................................................................ 18
3.1.1 Main aim ............................................................................................................ 18
3.1.2 Sub-aims ............................................................................................................ 19
3.2 Hypotheses ................................................................................................................ 19
3.2.1 Null hypothesis .................................................................................................. 19
3.2.2 Alternative hypothesis ....................................................................................... 19
3.3 Research design and approach .................................................................................. 19
3.4 Ethical considerations ............................................................................................... 20

v
3.5 Pilot study .................................................................................................................. 33
3.6 Sample population ..................................................................................................... 21
3.6.1 Criteria for the selection of participants............................................................. 22
3.6.2 Material and apparatus used for the selection of participants ............................ 23
3.6.3 Procedure for the selection of participants......................................................... 24
3.6.4 Description of the sample .................................................................................. 27
3.7 Material and apparatus used for data collection ........................................................ 29
3.7.1 Development of the material .............................................................................. 30
3.7.2 Material and apparatus used for the recording of wordlists ............................... 31
3.7.3 Material and apparatus used for the assessment of SRT .................................... 33
3.8 Procedure for the collection of data .......................................................................... 35
3.8.1 Procedure for the recording of wordlists ........................................................... 35
3.8.2 Procedure for the assessment of SRT ................................................................ 36
3.9 Procedure for the capturing of data ........................................................................... 38
3.10 Procedure for the processing and analysis of data ................................................. 38
3.10.1 The determination of correlation ....................................................................... 38
3.10.2 The comparison of the difference in mean scores for PTA and SRT ................ 39
3.10.3 The description of differences in mean scores for PTA and SRT according to
various factors .................................................................................................................. 40
3.10.4 The description of errors .................................................................................... 40
3.10.5 The description of inter-ear reliability per wordlist ........................................... 40
3.10.6 The description of intergroup reliability ............................................................ 40
Chapter 4: Results and discussion............................................................................................ 42
4 Introduction ...................................................................................................................... 42
4.1 The results and discussion for PTA/SRT correlation ................................................ 42

vi
4.1.1 Results and discussion for PTA/SRT correlation when using list A ................. 42
4.1.2 Results and discussion for PTA/SRT correlation when using list B ................. 45
4.1.3 Results and discussion for PTA/SRT correlation when using list C ................. 46
4.1.4 Results and discussion for the comparison of the PTA/SRT correlations for lists
A, B and C........................................................................................................................ 48
4.2 Results and discussion for the comparison of the difference in mean scores for PTA
and SRT for lists A, B and C ............................................................................................... 49
4.3 The results and discussion of the difference in mean scores for PTA and SRT for
lists A, B and C according to various factors ....................................................................... 51
4.4 The results and discussion of the description of errors ............................................. 54
4.5 The results and discussion of the description of inter-ear reliability per wordlist .... 57
4.6 The description of intergroup reliability ................................................................... 60
4.7 Summary ................................................................................................................... 61
5 Chapter 5: Conclusions, limitations and recommendations ............................................. 63
5.1 Conclusions ............................................................................................................... 63
5.2 Limitations of the study............................................................................................. 64
5.3 Recommendations for further research ..................................................................... 65
5.4 Summary ................................................................................................................... 66

vii
List of Appendices
Appendix A – Ethical clearance form ........................................................................................ I
Appendix B - Participation information letter .......................................................................... II
Appendix C - Informed consent form ...................................................................................... IV
Appendix D – Permission from the hospital ............................................................................. V
Appendix E – Case history interview questions ...................................................................... VI
Appendix F – Proof of submitting an article to a journal ...................................................... VII
Appendix G – Raw data summary and raw data capturing .................................................. VIII

viii
List of Tables
Table 1. The South African Spondaic wordlist (SAS) ............................................................... 4
Table 2. Distribution of participants by age and gender .......................................................... 27
Table 3. Available spondaic wordlists in terms of familiarity ................................................. 30
Table 4. Time breakdown per participant for pilot study ........................................................ 35
Table 5. Interpretive guide for correlation coefficients (Schiavetti & Metz, 2006) ................ 39
Table 6. Summary of PTA/SRT correlation per list ................................................................ 48
Table 7. Examples of errors made upon word repetition with unfamiliar wordlists ............... 54

ix
List of Figures
Figure 1. Distribution of the South African population by first language spoken (Statistics
South Africa, 2012) .................................................................................................................. 14
Figure 2. Distribution of first language groups in the sample ................................................. 28
Figure 3. Distribution of educational levels within the participant sample ............................. 29
Figure 4. PTA/SRT correlation for list A in group one (N=54R; 51L) ................................... 43
Figure 5. PTA/SRT correlation for list A in group two (N = 46R; 46L) ................................. 43
Figure 6. PTA/SRT correlation for list B in group one (N = 54R; 51L) ................................. 45
Figure 7. PTA/SRT correlation for list C in group two (N = 46R; 46L) ................................. 47
Figure 8. The mean difference (y-axis) between PTA/SRT in relation to various factors (x-
axis) that may influence the correlation ................................................................................... 53
Figure 9. Paired sample T-test: Matched pairs list B – Left versus Right ............................... 57
Figure 10. Paired sample T-test: Matched pairs list B – Left versus Right ............................. 58
Figure 11. Paired sample T-test: Matched pairs list C – Left versus Right ............................. 59
x
List of abbreviations
CID W-1 Central Institute for the Deaf Auditory wordlist W-1
dB Decibel
dB HL Decibel (Hearing Level)
dB SL Decibel (Sensation Level)
EFL English first language speakers
ESL
LoLT
English second language speakers
Language of Learning and Teaching
MLV Monitored Live Voice
PTA Pure Tone Average
SAE South African English
SRT Speech Recognition Threshold
VU meter Volume Unit meter

1
Chapter 1: Introduction and background
In this chapter, the rationale and contextual background will be presented, as well as the
definition of terms and chapter layout.
1.1 Rationale
Speech audiometry is a vital element of the audiological test battery as it assesses the
individual’s ability to hear, understand or recognise speech, in its complexity of rhythm,
frequency, rate, intensity and duration. Speech audiometry tests the ability of the auditory
system beyond the level of the ear, as comprehension, knowledge, audition, and
concentration are simultaneously assessed, thus providing a more realistic test of hearing
function (Brandy, 2002).
The measurement of the speech recognition threshold (SRT) is a speech audiometry test that
relies on the participant's recognition of familiar spondaic words from a closed set (American
Speech-Language-Hearing Association, 1988). SRT is defined as the lowest intensity at
which the spondaic words are correctly identified 50% of the time (Evans, 1997; Martin &
Clark, 2003). A spondaic word consists of two long syllables (Evans, 1997). It is important to
use spondees, or spondaic words, for determining SRT, as they are easier to identify, or
recognise, than monosyllabic words (Evans, 1997). In conversational English, spondees are
usually spoken as one long and one short syllable (Evans, 1997). During audiological testing
however, it is necessary for the tester who presents the words to manipulate the stress to be
equal across both syllables of the spondee (Martin & Clark, 2003).
There are three purposes for testing SRT. The first is to determine the participant's threshold
level, that is, their hearing sensitivity for identifying speech. The second is to check the
accuracy of the Pure Tone Average (PTA) results, by determining the correlation between
PTA and SRT (American Speech-Language-Hearing Association, 1988), and the third is as a
reference point for suprathreshold speech tests (Brandy, 2002). The most commonly used

2
word list for assessing SRT is the Central Institute for the Deaf Auditory Word List W-1
(CID W-1) (Hirsh, Davis, Silverman, Reynolds, Eldert & Benson, 1952). The original
spondaic words were developed by Hudgins, Hawkins, Karlin and Stevens (1947) at the
Harvard Psycho-Acoustic Laboratories. Of the original 42 spondaic words, 36 are included in
the Central Institute for the Deaf (CID) published Auditory Tests W-1 (CID W-1) (McArdle
& Hnath-Chisolm, 2009, Hirsh et al., 1952).
The original CID W-1 words were developed at Harvard University, in 1947 and 1952. This
is far removed in both space and time, from current day South Africa, where this study is
established.
South Africa presents with a distinctly unique amalgamation of languages, dialects, cultures
and linguistic communities (Tuomi, 1994, as cited in Swanepoel, 2006). There are 11 official
languages and most of the population has a working knowledge of more than one language
(Swanepoel, 2006). Although only 8% of the population uses English as their home language
(Swanepoel, 2006), the majority of the population use English as one of their multiple
languages, and English is considered the lingua franca, and is used extensively in
government, business, commerce, education and tertiary education in South Africa (Minow,
2010). English is the language of learning and teaching (LoLT) of more than 90% of South
African learners (Strauss, Van der Linde, Plekker & Strauss, 1999:10-11, as cited in De Wet,
2002).
The home language of the majority of audiology professionals in South Africa is either
English or Afrikaans, and tertiary level training is frequently conducted in English or
Afrikaans (Swanepoel, 2006). Roets (2005) found that 82 out of 84 surveyed audiologists in
the South African clinic setting use English wordlists when conducting speech audiometry.
This is in stark contrast to the demographics of South Africa, where the home language of the
majority of the population is an African language (Uys & Hugo, 1997, as cited in Swanepoel,
2006). As a result, audiologists in South Africa face a predicament when the need arises to
assess the speech recognition thresholds (SRT) of English second language (ESL) speakers,

3
due to the implications of multilingualism on speech audiometry results (Von Hapsburg &
Pena, 2002).
In South Africa, the CID W-1 wordlist (Hirsh et al., 1952), or variations thereof, is routinely
used in speech audiometry as the test material for measuring SRT (Roets, 2005). The wordlist
was originally developed and standardized on American English population groups, and
many of the words, such as “inkwell”, “drawbridge” and “horseshoe”, are specific to
American English, and is not standardised for people who do not have American English as
their home language (Ramkissoon, Proctor, Lansing & Bilger, 2002). The wordlist is
therefore unfamiliar to many South Africans, which may therefore lead to flawed results,
particularly when testing multilingual speakers. Familiarity, as well as homogeneity and
intelligibility of spondaic words is important (Ramkissoon, 2001; Sreedhar, Venkatesh,
Nagaraja & Srinivasan, 2011). If spondaic words used in testing are familiar to the
participant, it ensures that the auditory threshold is measured, rather than vocabulary or
intelligence, thus resulting in good face validity (Ramkissoon, 2001; Ramkissoon et al., 2002;
Sreedhar et al., 2011). In a multilingual, multicultural country such as South Africa
(Dumakude, 2003; Swanepoel, 2006), this may seriously compromise the validity of the
measurement, due to linguistically and culturally biased test items (Rudmin, 1987, as cited in
Ramkissoon, 2001).
It is important that audiologists acknowledge the implications of multilingualism on speech
audiometry results (Von Hapsburg & Pena, 2002), particularly in a context such as South
Africa. The current SRT audiometry practices are in need of improvement. It is imperative
that audiologists develop speech audiometry test materials that are familiar, sufficiently long
(Ramkissoon, 2001) and relevant to the ESL population in the South African situation,
provided that the speakers have a working knowledge of English. One of these alternative
wordlists may be the South African Spondaic (SAS) wordlist which was developed by
Durrant in 2006 (Durrant, 2006).
In 2006, Durrant assessed the subjective familiarity rating of the existing CID W-1 wordlist
(Hirsh et al., 1952) among a group of English first language (EFL) and ESL speakers. A list

4
of English spondaic words, which were determined as structurally balanced in terms of
syllable structure, was developed by the researcher at the University of the Witwatersrand
(Durrant, 2006). Permission was expressly granted by the University of the Witwatersrand to
use this wordlist for the current study. A sample of 387 participants who broadly represented
the South African population in terms of first language, additional spoken languages, age,
gender, occupation and education levels, rated the spondaic words in terms of familiarity,
through self-report, on a three point scale (Durrant, 2006). The highest rated words were
therefore determined as the more familiar spondaic words among the South African
population, as the SAS wordlist, which is listed below in Table 1 (Durrant, 2006).
Table 1. The South African Spondaic wordlist (SAS)
SOUTH AFRICAN SPONDAIC (SAS) WORDLIST
(Durrant, 2006)*
LIST A
Cellphone
Bathroom
Sandwich
Building
Township
Dancing
Welcome
Housewife
Lightning
Toothbrush
Basket
Popcorn
Public
Workshop
Suitcase
Birthday
Sunlight
Homework
Sunshine
*Permission was expressly granted by the University of the Witwatersrand to use this wordlist for the current study.
Table 1 consists of the most familiar spondaic words as selected by a group of South
Africans. The 18 words make up the new South African Spondaic (SAS) wordlist. The
PTA/SRT correlation of the SAS wordlist is compared to the CID W-1 in the current study.

5
Typically, SRT is used as part of a crosscheck for the reliability of Pure Tone Average
(PTA), and vice versa. PTA refers to the three-frequency average of pure-tone thresholds
obtained at 500 Hz, 1000 Hz and 2000 Hz (Brandy, 2002). Clinically, literature specifies that
PTA and SRT should be within 6 dB of one another to indicate good correlation and
reliability from test results (Brandy, 2002). This may be referred to as the PTA/SRT
relationship. Thus, PTA/SRT correlation, as opposed to PTA/SRT relationship, was used in
order to compare the use of the SAS wordlist and the CID W-1 (Hirsh et al., 1952) original
spondaic wordlist when measuring the SRTs of ESL speakers in South Africa.
This study aimed to answer the following question: Which list (CID W-1 or SAS wordlist)
yields the most favourable PTA/SRT correlation when testing a group of South African
English second language participants?
1.2 Definition of terms
Central Institute for the Deaf Auditory Word List W-1 (CID W-1)
A spondaic word list developed in 1952 by familiarity rating (Hirsh et al., 1952).
Decibel (dB)
A measurement unit for expressing intensity on a loudness scale; the difference
between two sound pressure levels (Martin & Clark, 2003).
Decibel (Hearing Level) (dB HL)
The decibel level above an average intensity for normal hearing (0 dBHL) (Martin &
Clark, 2003).
Decibel (Sensation Level) (dB SL)
The decibel level above the hearing threshold of an individual participant (Martin &
Clark, 2003).
English first language (EFL) Speakers
Speakers of English who use English as their primary language of communication
(Ramkissoon et al., 2002).

6
English second language speakers (ESL)
Speakers of English who do not use English as a first language, but rather have learnt
English secondary to a home language, and who use any other language as their primary
language, and have a speaking knowledge of English as one of their additional multiple
languages, with various degrees of proficiency (Ramkissoon et al., 2002; Butler & Hakuta,
2008).
Monitored Live Voice (MLV)
The use of a speech signal in speech audiometry through a microphone. The loudness
is monitored by the Volume Unit (VU) meter (Martin & Clark, 2003).
Pure Tone Average (PTA)
The average of pure-tone thresholds at three mid-frequencies of 500 Hz, 1000 Hz,
2000 Hz for each ear (Martin & Clark, 2003).
Pure Tone Average / Speech Recognition Threshold correlation (PTA/SRT correlation)
The statistical relationship of correlation observed between PTA and SRT obtained
for each ear for each participant (Schiavetti & Metz, 2006).
Pure Tone Average / Speech Recognition Threshold relationship (PTA/SRT relationship)
Clinically, the PTA/SRT relationship refers to the literature specification that PTA
and SRT should be within 6 dB of one another to indicate good correlation and reliability
from test results (Brandy, 2002).
South African English (SAE)
A distinct form of English used in South Africa, which has been influenced
historically and presently by surrounding languages such as Afrikaans and the African
languages, as well as languages of trade (Wade, 1995).
Speech Recognition Threshold (SRT)
The lowest intensity at which the spondaic words are correctly identified 50% of the
time (Martin & Clark, 2003).
Spondaic word (“spondee”)
A word with two syllables manipulated to be presented with equal stress on each
syllable (Martin & Clark, 2003).

7
Volume Unit (VU) meter
A meter on an audiometer which tracks the loudness of input into the microphone by a
series of light diodes (Martin & Clark, 2003).

8
1.3 Chapter layout
Chapter 1 (Introduction and background): This chapter provides an introduction and
rationale for the research study, as well as the statement of the problem. It includes a
definition of terminology used in the study. This chapter ends with the research question.
Chapter 2 (Literature review): This chapter provides further overview regarding the history
of speech audiometry, further theoretical background of speech audiometry, the development
of existing wordlists, the context of the country of South Africa, and alternative solutions to
the speech audiometry dilemma in South Africa.
Chapter 3 (Methodology): This chapter provides an explanation and background to the
methodology used for the study. The main aim and sub-aims are stated according to the
research question. The pilot study, sample population, selection criteria, research design,
materials and apparatus, as well as data collection procedure and data analysis are described.
Reliability and validity are also discussed.
Chapter 4 (Results and discussion): This chapter provides the results and discussion of the
study. Statistical results and their significance and clinical implications are presented,
together with a description, interpretation and discussion of each result, according to the aims
and sub-aims of the study. Reliability of the results will also be addressed.
Chapter 5 (Conclusions, limitations and recommendations): This chapter provides
conclusions with regard to the results obtained, as well as a presentation of the clinical value,
and a critical evaluation with regard to limitations, and recommendations for future research
possibilities.

9
2 Chapter 2: Literature review: theoretical background to spondaic
words and wordlists
This chapter provides further overview regarding the history of speech audiometry, further
theoretical background of speech audiometry, the development of existing wordlists, speech
audiometry in the South African context and alternative solutions to the speech audiometry
predicament in South Africa.
Spondaic (spondee) words are unique in the sense that they are made up of bi-syllabic words,
typically English nouns, with equal stress placed on each syllable. Examples of typical
spondaic words include ‘sunset’, ‘hotdog’ and ‘birthday’ (Gelfand, 2009). Spondaic words
are structurally balanced words (consonant-vowel-consonant; consonant-vowel-consonant,
CVC-CVC), which lend themselves to the production of equal stress across the two syllables,
which is ensured by the presenter during audiological testing (Martin & Clark, 2003).
Spondaic words are so redundant that only minimal auditory cueing is necessary (Sreedhar et
al., 2011), thus it is appropriate to use spondaic words to assess the SRT, rather than speech
discrimination testing. Historically, Hudgins et al. (1947) determined that four criteria are
essential for developing speech audiometry materials, namely familiarity, phonetic
dissimilarity, representative sample of English speech sounds, and homogeneity of audibility.
Ramkissoon (2001) determined that only familiarity and homogeneity are necessary criteria
for threshold determination. All four criteria should be met for suprathreshold testing. Two of
the criteria, namely, familiarity and homogeneity, are discussed in section 2.1 and 2.2 below.
2.1 Familiarity
Familiarity of spondaic words is "arguably one of the most important criterion to be
considered in word list development" (Nissen, Harris, Jennings, Eggett & Buck, 2005, p.
391). Familiarity ensures that auditory threshold is measured, not knowledge of vocabulary
(Ramkissoon, 2001). In terms of speech audiometry, familiarity means that the participant is

10
frequently exposed to the word, socially using and hearing the word, as well as being aware
that the word is part of the test items (Ramkissoon, 2001). Word familiarity is dependent on
the individual but certain words are more familiar than others in a socio-linguistic group
(Brandy, 2002). Aspects such as familiarity and emotional loading would be considered
linguistic and psychological factors, therefore it is important that these factors are controlled
(Brandy, 2002). According to Dillon and Ching (1995, as cited in Dietrich, 1999), the most
important qualities of the items used in determining SRT are the participant’s familiarity with
the language and dialect in which the test is given, the educational level of the participant,
familiarity with all the test words, and the presentation of the test words in a uniform manner.
According to Fry (1997, as cited in Dietrich, 1999), prediction of the most likely signal heard
when listening to moderately degraded speech items is easier in one’s first language, as one
has a knowledge of acoustic and phonetic patterns, as well as an increased ability to
discriminate between phonemes and predict words that are more likely (Braisby & Gellatly,
2012). Errors drew heavily from the participant’s knowledge of the world, and more common
words were exchanged for the unknown word, that is ‘mouthwash’ for ‘whitewash’,
‘freeway’ or ‘fairway’ for ‘stairway’ etc. (Dietrich, 1999). Participants tended to obtain SRT
at a lower level (softer intensity) when tested in their first language, since they exhibited
easier recognition of words from their first language (Dietrich, 1999; Brandy 2002).
Familiarity lends to improved intelligibility of the words (Sreedhar et al., 2011), and
increased familiarity results in improved performance, as the words are more readily
recognised.
2.2 Homogeneity
Spondaic words should be homogenous in terms of structure, and in terms of audibility, to
ensure valid test results (American Speech-Language-Hearing Association, 1988).
Homogenous structure requires each word to have two equally stressed syllables (Brandy,
2002). Both syllables of the spondaic words should peak at zero Volume Unit (VU), on the
Volume Unit meter (VU meter), psychophysically, to allow for equal loudness presentation

11
between the words, but this does not necessarily improve homogeneity of audibility
(Schiavetti & Metz, 2006).
Historically, spondees are identified as having the highest homogeneity of audibility (Egan,
1948; Ramkissoon, 2001). Homogeneity of audibility requires each word in the wordlist to
reach the speaker’s ear at the same intensity as one another, and the ease with which the
words are heard, resulting in similarity of thresholds (Brandy, 2002). Homogeneity of
audibility allows for precise measurements to be made within a small range of intensity
changes (Ramkissoon, 2001). Homogeneity of audibility can be improved by selecting
certain words, or through the manipulation of the recording of the words. During audiological
testing, it is necessary for the tester who presents the words to manipulate the stress to be
equal across both syllables of the spondee (Martin & Clark, 2003).
Historically, familiarity and homogeneity are essential in the development of speech
audiometry materials (Hudgins et al., 1947; Ramkissoon, 2001). Other aspects of the
development of wordlists shall be discussed in section 2.3.
2.3 The development of wordlists for audiometric testing
Wordlists have historically been developed by determining the familiarity of words and the
homogeneity of the words, which should be of equal difficulty.
The original spondaic words were developed by Hudgins et al. (1947) at the Harvard Psycho-
Acoustic Laboratories (PAL). Following the development of the PAL wordlists, the words
were evaluated for homogeneity of audibility, within ±2 dB for mean recognition thresholds
(Gelfand, 2009). Six words were excluded from the original 42 spondaic words, and the
remaining 36 were recorded and adjusted for homogeneity (McArdle & Hnath-Chisolm,
2009; Hirsh et al., 1952).

12
In the past, speech audiometry materials have been developed in different languages, such as
Arabic (Alusi, Hinchcliffe, Ingham, Knight, & North, 1974; Ashoor & Prochazka, 1982);
Brazilian Portuguese (Harris, Goffi, Pedalini, Gygi & Merrill, 2001); Korean (Harris, Kim &
Eggett, 2003); Polish (Harris, Nielson, McPherson, Skarzynski & Eggett, 2004); Russian
(Aleksandrovsky, McCullough, & Wilson, 1998); Mandarin (Nissen et al., 2005); Teluga
(Sreedhar et al., 2011); Tswana (Khoza, Ramma, Mophosho & Moroka, 2008) and Zulu
(Panday, 2009), among others as cited in Sreedhar et al. (2011), as well as digits
(Ramkissoon et al., 2002).
The wordlists were typically generated informally and were non-standardised prior to testing
(Nissen et al., 2005; Sreedhar et al., 2011; Khoza et al., 2008; Panday, 2009). The words were
rated for familiarity (Nissen et al., 2005; Sreedhar et al., 2011) and inappropriate words were
excluded from the wordlists. This procedure is similar to the procedure followed by Durrant
(2006). Thereafter, the appropriate words were assessed by determining the correlation of the
SRT obtained with the new wordlist with the PTA of the participants (Ramkissoon et al.,
2002; Sreedhar et al., 2011; Khoza et al., 2008; Panday 2009), which is the aim in the current
study.
The use of logistic regression to determine the regression slope and intercept of each of the
spondaic words is valuable to ensure the words are homogenous and have a steep
psychometric function slopes (Nissen et al., 2005). An analysis of homogeneity is further
recommended for future research.
2.4 Recorded wordlists or monitored live voice
Either recorded materials, or monitored live voice may be used for speech audiometry.
Monitored live voice is a generally accepted means of presenting speech signals during
clinical audiological testing (Brandy, 2002), as it is flexible and quicker to administer
(Roeser, Valente & Hosford-Dunn, 2000). However, the use of recorded materials is
favourable, particularly in the light of research, as the presentation is standardised and
homogeneity of audibility is much improved, as each item gets presented in the same manner

13
and at the same intensity level (Gelfand, 2009), which naturally assists with the homogeneity
of audibility. The American Speech-Language-Hearing Association (1988) recommends the
use of recorded materials (Panday, 2006). Monitored live voice is typically used in South
African audiology contexts (Ramkissoon & Khan, 2003). Little attention has been given to
the quality of recorded materials for speech audiometry, resulting in broad variations in
protocols and quality of recordings (Di Berardino, Tognola, Paglialonga, Alpini, Grandori, &
Cesarani, 2010). Speech audiometry in the South African context will be discussed in the
following section.
2.5 Speech audiometry within the South African context
South Africa presents with a distinctly unique amalgamation of languages, dialects, cultures
and linguistic communities (Tuomi, 1994, as cited in Swanepoel, 2006). There are 11 official
languages, which are listed below in Figure 1, and most of the population is multilingual,
with a working knowledge of more than one language (Swanepoel, 2006).
Figure 1 depicts the distribution of first language use among South Africans (Statistics South
Africa, 2012).

14
Figure 1. Distribution of the South African population by first language spoken
(Statistics South Africa, 2012)
As shown in Figure 1, Zulu and Xhosa are the most widely spoken first languages among
South Africans at 22.7% and 16% respectively. In comparison, only 9.6% of South Africans
speak English as their first language in the home, making English the fourth most spoken first
language.
With the resolution of apartheid, the 1996 constitution of South Africa prescribed a national
language policy which structured 11 official languages, with the intent to restore the African
languages to a position of use in mainstream society. Despite these changes, and although
English is spoken by the minority as a first language, English is considered the lingua franca.
Historically, English has been used extensively in public and private life, as well as
education, law, government, news broadcasts, business, commerce, the army and
parliamentary debate (Kamwangamalu, 1998; Verhoef, 1998; Wade, 1995; Alexander, 2000;
Deumert, 2010; Minow, 2010).

15
Research has shown that South Africans are tending to choose to educate their children in
English, rather than in their home language. Historically, English has been viewed by many
African language speakers as the dominant and empowering language for industry
(Mondstuk, 1996; Webb, 1992; Reagan, 1985, as cited in De Wet, 2002). If English is not
spoken proficiently, many Africans in South Africa have experienced fear in the past that
they will be unable to achieve success in the job market (Beukes, 1992, as cited in De Wet,
2002). Access to English may be considered the key to power in society in South Africa at
present (Alexander, 2000). As a result, a cycle perpetuates where English remains the
dominant language in South Africa society.
Although only 9, 6% of the population uses English as their home language (Statistics South
Africa, 2012), the majority of the population use English as one of their multiple languages.
Reportedly, between 32% and 69% of the population use English as one of their multiple
languages. Due to various interpretations of the term, there are broad ranges in the statistical
estimates (Market Research Africa 1994; Department of National Education, 1994:7, as cited
in De Klerk, 1999; Minow, 2010).
The home language of the majority of audiology professionals in South Africa is either
English or Afrikaans, and tertiary level training is frequently conducted in English or
Afrikaans (Swanepoel, 2006). Roets (2005) found that 82 out of 84 surveyed audiologists in
the South African clinic setting use English wordlists when conducting speech audiometry.
This is in stark contrast to the demographics of South Africa, as seen in Figure 1, where the
home language of the majority of the population is an African language (Uys & Hugo, 1997,
as cited in Swanepoel, 2006). As a result, audiologists in South Africa face a predicament
when the need arises to assess the SRTs of ESL speakers, due to the implications of
multilingualism on speech audiometry results (Von Hapsburg & Pena, 2002).
The majority of audiologists registered in South Africa are white English-speaking, or
Afrikaans-speaking individuals. The minority of audiology professionals in South Africa are
African (Penn, Frankel, Watermeyer & Muller, 2009). The non-African professionals are
unlikely to speak an African language (Khoza et al., 2008). This indicates a significant

16
mismatch between the overall population in South Africa who speak an African language as
their first language, (approximately 77% of the population) (Statistics South Africa, 2012),
and the number of audiologists who are likely to speak an African language as one of their
multiple languages.
2.6 Alternative solutions to speech audiometry in South Africa
In light of the context of South Africa as discussed above, the following section will describe
existing and potential alternatives for speech audiometry material for use in South Africa.
2.6.1 Digit pairs
The use of digit-pair stimuli as an alternative has been determined as an appropriate solution
to the problem, but it is a short term solution. Ramkissoon et al. (2002) aimed to develop a
valid test of SRT for ESL speakers, by using pairs of digits to measure SRT. The digits were
paired in order to form two-syllable words, with equal stress, that is spondees. Digit-pairs can
be used cross-culturally, thus eliminating the cultural bias threat to validity. Even those with a
minimal competence in speaking English are able to recognise the numbers from one to ten,
and thus this improves validity (Ramkissoon, 2001). The use of digit-pairs resulted in SRT
measurements that are more accurate than the use of CID W-1 words, when testing ESL
participants (Ramkissoon, 2001). Continued research in the use of digits for SRT testing is
still indicated.
2.6.2 Wordlists in African languages
Regarding the development of wordlists in other African languages, several wordlists have
been developed in South Africa, but the wordlists are generally not formally standardised.
Khoza et al. (2008) determined that PTA/SRT correlation was optimal when testing a group
of first-language Tswana speakers using a Tswana SRT wordlist, as opposed to the English
CID W-1 wordlist or digits. One of the recognised shortfalls of the study is that the
participants were all tertiary students, who were proficient in English, and enrolled at a

17
university where the language of instruction is in English (Khoza et al., 2008). Additionally
the words were presented via monitored live voice by a Tswana speaking individual. The use
of wordlists in the home language of the patient, for example Tswana, requires the
presenter/audiologist to be proficient in that language (Khoza et al., 2008) to allow for natural
and proficient production of the words, without erroneous accent and stress. Although, this
would be ideal practice, at present, there are minimal recorded wordlists in the African
languages. According to Scott (1998, as cited in Ramkissoon, 2001) clinicians should be
proficient in the language of the test to ensure accuracy in administration and scoring.
The African languages spoken in South Africa differ substantially from English in terms of
morphology and syntax (Donaldson, 1991, as cited in Khoza et al., 2008). In particular, many
African languages are multisyllabic tonal languages. That is, production of words in that
language by a second language speaker may result in significant errors of production (Khoza
et al., 2008). In addition, the use of the Zulu wordlists for determining SRT is flawed, as the
words used are not spondaic. The words are monosyllabic, instead of bisyllabic, which
compromises their audibility and redundancy (Ramkissoon & Khan, 2003).
This mismatch between audiologists who speak an African language and the population in
South Africa means that the use of African wordlists is not a practical solution at this time in
South Africa. On the contrary, all audiologists are likely to use English as one of their
multiple languages (Swanepoel, 2006), and the majority (up to 69%) of the population speak
English as one of their multiple languages, particularly in urban areas (Market Research
Africa, 1994; Department of National Education, 1994:7, as cited in De Klerk, 1999). Thus
the use of an English wordlist that is familiar to all South Africans who use English as one of
their multiple languages may be a good solution.
2.6.3 The development of the SAS wordlist
In 2006, Durrant developed a list of structurally balanced (consonant-vowel-consonant;
consonant-vowel-consonant, CVC-CVC) South African English spondaic words, which were
rated in terms of familiarity, through self-report, on a three point scale, by a broad sample of

18
387 South African participants. Simultaneously, the familiarity of the existing CID W-1
wordlist (Hirsh et al., 1952) was also determined. The top rated words in terms of familiarity
were combined into a list known as the South African Spondaic wordlist (Durrant, 2006).
This list requires further testing, which is the purpose of the current study.
2.7 Summary
In this chapter, overview was provided regarding the history of speech audiometry,
theoretical background of speech audiometry, the development of existing wordlists, the
context of the country of South Africa and alternative solutions to the speech audiometry
dilemma in South Africa.
The next chapter will focus on the methodology used to answer the research question, which
is: Which list (CID W-1 or SAS wordlist) yields the most favourable PTA/SRT correlation
when testing a group of South African English second language (ESL) participants?
3 Chapter 3: Methodology
This chapter will describe the research design, sample population, participation criteria,
procedures for data collection, equipment used, and data analysis methods.
3.1 Research aims
With cognisance of the research problem described in Chapter 1 and Chapter 2, and with the
research question in mind, the following research aims were formulated for this study:
3.1.1 Main aim
The main aim of the investigation was to compare the SAS wordlist and the CID W-1
wordlist for measuring SRT when testing a group of South African ESL participants.

19
3.1.2 Sub-aims
The following sub-aims were formulated:
To determine the PTA/SRT correlation when using the SAS wordlist
To determine the PTA/SRT correlation when using the CID W-1 wordlist
To compare the results obtained with the SAS wordlist and the CID W-1 wordlist
3.2 Hypotheses
3.2.1 Null hypothesis
There is no statistically significant difference between the results obtained for PTA/SRT
correlation with the use of the SAS wordlist or the CID W-1 wordlist, at a .05 level of
statistical significance.
3.2.2 Alternative hypothesis
There is a statistically significant difference between the results obtained for PTA/SRT
correlation with the use of the SAS wordlist and the CID W-1 wordlist, at a .05 level of
statistical significance.
3.3 Research design and approach
The experimental design was mixed in nature. That is, the design contained both between-
participants and within-participants designs. A mixed group design studies one independent
variable with a within-participants design, and another independent variable with a between-
participants design (Schiavetti & Metz, 2006).
A within-participants design exposes all participants to the same test condition. In this
instance, every participant was exposed to the same test material, that is, the SAS wordlist.
The within-participant design allowed for test-retest reliability within the same patient,

20
thereby eliminating certain extraneous conditions, such as language level and education level
(Schiavetti & Metz, 2006).
A between-participants design exposed the participants to two conditions, that is, the ‘more
familiar’ and ‘less familiar’ CID W-1 wordlists. Participants were randomly assigned to one
of two groups: group one or group two. This design allowed for comparisons to be made
between the groups. The design also ensured that factors that could jeopardise internal
validity were controlled as the groups were matched in every variable, except for the test
condition (Schiavetti & Metz, 2006).
The research approach was quantitative and correlational in nature (Schiavetti & Metz, 2006).
Quantitative research allows for measurable quantities to be determined, with a change in
variable or circumstance (Schiavetti & Metz, 2006). Correlational research aims to study the
relationship between two variables (that is, PTA and SRT), to determine the degree of change
on the first variable depending on the test conditions of the second variable. Correlational
research is typically depicted on scattergrams (Schiavetti & Metz, 2006).
3.4 Ethical considerations
The ethical implications of the study needed to be considered, as the study involved the
participation of humans (Schiavetti & Metz, 2006). The research proposal was approved by
the Postgraduate Research and Ethics Committee of the Faculty of Humanities of the
University of Pretoria (Appendix A) prior to beginning the study. The following ethical
considerations were addressed in the planning of this study.
Informed consent was obtained from every participant. This ensured that the participants
were aware and accepted the known risks and implications in the study (Bulman & Osborn,
2002, as cited in Avula, 2013). Participants were issued with a written information sheet
about the nature, purpose and risks of the study, which was also verbally explained, and a
consent form was signed (Appendix B & Appendix C). Only participants who gave their
informed written consent were included in the study. Participants were made aware that their

21
participation was voluntary; that they could withdraw from the study at any time; and that
confidentiality and anonymity were ensured. The comfort, security and freedom of the
participants were valued at all times (Schiavetti & Metz, 2006). The participants’ right to
privacy was honoured through the use of numbering and the use of initials, as well as
conducting the testing in a private room to ensure anonymity. Confidentiality was ensured by
using only the initials of the participants, and using a numbering system (Schiavetti & Metz,
2006). Participants were informed that the results of the study would be made available to
other researchers and society, while maintaining confidentiality of participants, and that the
data and results would be archived for 15 years at the University of Pretoria (Mouton, 2001;
Babbie & Mouton, 2001).
The researcher has a responsibility to report the information obtained from the research
(Schiavetti & Metz, 2006). Following completion, the results will be made known to the
audiological community in a complete form through oral presentations and printed articles.
All publications that contributed to the content of the research paper were acknowledged and
referenced appropriately, to avoid plagiarism (Babbie & Mouton, 2001).
3.5 Sample population
In this section, the criteria for participant selection are discussed, as well as the justification
of each parameter. Adult ESL participants (n=101, 197 ears) who were employed at the
participating hospital were invited to participate in the study. The participant sample had a
broad range of age, ethnicity, first language use, education and occupation, which will be
described in more detail.
In this study, purposive non-probability sampling was used. Sampling allows one to obtain
information about a population based on a sample of that population (Avula, 2013).
Purposive non-probability sampling is not a probabilistic sample, and therefore is not
representative of the population as a whole (Schreuder, Gregoire & Weyer, 2001). The
participants were all drawn from the participating hospital, using convenience sampling.
Purposive sampling is a selection method determined by the researcher according to the

22
purpose of the study. In this study, a predefined group of ESL adults was determined and
sampled accordingly using convenience sampling (Tansey, 2007). Advertisements for
participants included the use of posters, word of mouth and announcements distributed within
the hospital. Ideally, a sample that is representative of the various first languages spoken in
South Africa would be obtained, with the exception of English. The limitations of
convenience sampling might have resulted in bias or unknown trends. However, due to the
broad representation obtained in the sample, this is unlikely (Schreuder et al., 2001).
3.5.1 Criteria for the selection of participants
The criteria for the selection of participants are outlined below:
Age
Inclusion criteria stipulated that participants had to be older than 18 years of age, in order for
informed consent to be obtained without parental consent (Gill, 2004, as cited in Coyne,
2010). Further ethical considerations were discussed in section 3.4. There was not an upper
age limit, as the sample was of adults, and factors such as hearing thresholds and auditory
processing related to age were not considered to be significant, as discussed in section 3.5.4.
Language
Participants had to be ESL speakers, with a speaking knowledge of English. As the wordlists
are primarily targeted for use with speakers who use English as one of their multiple
languages, but not as their first language, the participants had to be ESL speakers. ESL
speakers may be considered to use a second language, with various degrees of proficiency, to
communicate with other speakers in a given society. Depending on one’s definition of
bilingualism, this may be considered as a degree of bilingualism (Butler & Hakuta, 2008).
Hearing thresholds
All participants had to have hearing thresholds within normal limits, or a minimal hearing
loss. Those participants who had audiometric thresholds lower than 26 dBHL from 250 Hz to

23
8000 Hz were considered to have hearing within normal limits, or a minimal hearing loss.
The classification of degree of hearing loss was obtained from Silman and Silverman’s
(1991) classification system (Northern & Downs, 2002, as cited in Schlauch & Nelson,
2009). Participants were excluded from the study if audiometric thresholds were identified at
levels higher than 26 dBHL at any frequency. Exclusion was ear-specific if hearing loss was
present in one ear only. The criterion of hearing thresholds within normal limits was
necessary at this stage to eliminate extraneous variables such as degree, type and
configuration of hearing loss (Schiavetti & Metz, 2006). The participants with hearing loss
were referred for further diagnostic testing. Participants were not excluded from the study
based on tympanogram results, unless the middle ear status contributed to a hearing loss
(PTA>26 dBHL). Further audiological and/or appropriate medical management was made
available to the excluded participants.
Employment
ESL speakers who were employed at the participating hospital were invited to participate in
the study. This was primarily for the purpose of convenience sampling. The sample revealed
a broad range of age, language and education, although this might have limitations as the
generalisation may be compromised (Schiavetti & Metz, 2006).
3.5.2 Material and apparatus used for the selection of participants
Case history interview
The researcher interviewed each participant based on the questions as indicated in Appendix
F. Pen and paper were used to record verbal responses. Questions included age, gender,
language use, language exposure, subjective language proficiency, audiological concerns,
education and occupation. The information obtained was recorded on a table that may be seen
in Appendix F.
Heine mini 3000 otoscope
Otoscopic examinations were conducted using a handheld Heine mini 3000 otoscope.

24
Maico M134 tympanometer
Immittance audiometry was conducted using a Maico MI34 immittance machine, which was
calibrated on 6 April 2011.
Interacoustics diagnostic audiometer
Audiometric pure-tone audiometry was conducted using an Interacoustics diagnostic
audiometer (AD229b, calibrated on 6 April 2011), using TDH-39 headphones, in a single
sound-treated audiology booth in a quiet office (American Speech-Language-Hearing
Association, 2005).
3.5.3 Procedure for the selection of participants
The management of the participating hospital was contacted, and provided with the research
proposal to inform management about the intended purpose of the study, as well as the
implications on the staff’s wellbeing and time demands. The management granted permission
to conduct the study (Appendix E). ESL speakers who were employed at the participating
hospital were invited to participate in the study. Advertisements for participants included the
use of posters, word of mouth and announcements. Participants were scheduled in 15 minute
interval appointments with the researcher.
The steps taken in the preliminary testing are outlined below. Case history interviews,
otoscopic examinations, immittance testing and pure-tone air-conduction testing were
conducted. Only participants who had given their informed consent were selected for this
section of the study (n=104).
3.5.3.1 Procedure for case history interview
Participants were seated across a desk from the researcher, and underwent a brief verbal
interview, the contents of which were noted under material and apparatus.
25
3.5.3.2 Procedure for otoscopic examinations
Otoscopic examinations were carried out on each participant, which involves a visual
inspection of the outer ear. Light was directed into the external auditory canal using a
handheld otoscope, to ensure there was no excess cerumen in the external ear canal, and to
ensure that the tympanic membranes were visible (Martin & Clark, 2003). The tympanic
membrane had to have a pearl-grey appearance, and had to be translucent if it was in a
normal and healthy condition. The tympanic membrane had to be in a neutral position, with a
distinct cone of light, handle, short process of the malleus and umbo visible (Martin & Clark,
2003). Participants were not excluded from the study if there was a pathology noted, unless the
pathology caused a hearing loss, but they were later referred for further medical treatment.
3.5.3.3 Procedure for immittance testing
Tympanometry procedures were carried out on each participant. A low frequency probe tone
of 226 Hz was used, while the pressure change initiated by the tympanometer measured the
displacement of the tympanic membrane from the resting position, thereby measuring
compliance and the pressure level at the highest compliance (Martin & Clark, 2003). The
tympanogram type by classification was noted. Participants were not excluded from the study
based on tympanogram results, unless the middle ear status contributed to a mild or greater
hearing loss (PTA>26 dBHL). It should be noted that a test battery approach was used
(Roeser et al., 2000).
The tympanogram classifications were based on Jerger’s categorizations (1970, as cited in
Martin & Clark, 2003): Type A tympanograms indicate middle ear pressure to be within
normal limits at or near 0 daPa (±50 daPa) and compliance within 0.3 to 1.7 ml (Margolis &
Hunter, 2000, as cited in Martin & Clark, 2003). Type As and Ad tympanograms indicate
normal middle ear pressure, as above, with compliance levels that fall below (Type As) or
above (Type Ad) the norms stated above (Margolis & Hunter, 2000, as cited in Martin &
Clark, 2003). Type B tympanograms indicate no maximum compliance level through the
range of pressure, and likely indicate fluid within the middle ear system (Margolis & Hunter,

26
2000, as cited in Martin & Clark, 2003). A Type B tympanogram with normal ear canal
volume suggests otitis media or the presence of fluid in the middle ear system. A Type B
tympanogram with increased ear canal volume suggests a perforation or grommet in situ in
the tympanic membrane Type C tympanograms occur when the maximum compliance of the
tympanic membrane occurs at a negative pressure of -100 daPa or greater, or positive
pressure of +100 daPa or greater (Margolis & Hunter, 2000, as cited in Martin & Clark,
2003). Further audiological and/or appropriate medical management was made available to
the excluded participants, where indicated.
3.5.3.4 Procedure for pure-tone air-conduction audiometry
Pure-tone testing was conducted to measure hearing thresholds from 250 to 8000 Hz. Pure-
tone thresholds was measured by presenting tones at each octave point frequency (250, 500,
1000, 2000, 4000, 8000 Hz) (Martin & Clark, 2003), using the modified Hughson-Westlake
procedure (Harrell, 2002). Initial presentation began at 40 dBHL, and decreased in 10 dB
steps after the participant responded to the tone by pushing a response button. Ascending
steps were in 5 dB increments. When the participant responded to 50 percent of the
presentations at a given intensity, then that intensity level was considered to be the pure-tone
threshold for that frequency (Martin & Clark, 2003).
Those participants who had audiometric thresholds that were lower than 26 dB from 250 Hz
to 8000 Hz were considered to have hearing within normal limits, or a minimal hearing loss.
The classification of degree of hearing loss was obtained from Silman and Silverman’s
(1991) classification system.
Participants with hearing thresholds outside of normal limits were excluded from the study.
Exclusion was ear-specific due to the presence of hearing loss. Further audiological and/or
appropriate medical management was made available to the excluded participants, where
indicated.
27
Pure-tone average (PTA) per ear was calculated from the sum of hearing thresholds at 500
Hz, 1000 Hz, and 2000 Hz, divided by three, and rounded off to within one decimal place for
each ear (Martin & Clark, 2003).
3.5.4 Description of the sample
Following pure-tone testing, 101 participants (197 ears – 100 right ears, 97 left ears) were
considered suitable for the study. The age range was 19 to 63 years. The mean age of the
participants was 33.3 years. Participants included 27 males and 74 females. There was a
broad range of highest education level achieved (grade 9 to master’s degree) and occupation
(plumbers, waitresses, security, reception, nurses and management).
Table 2 below depicts the distribution of the participant sample across the age groups,
according to gender.
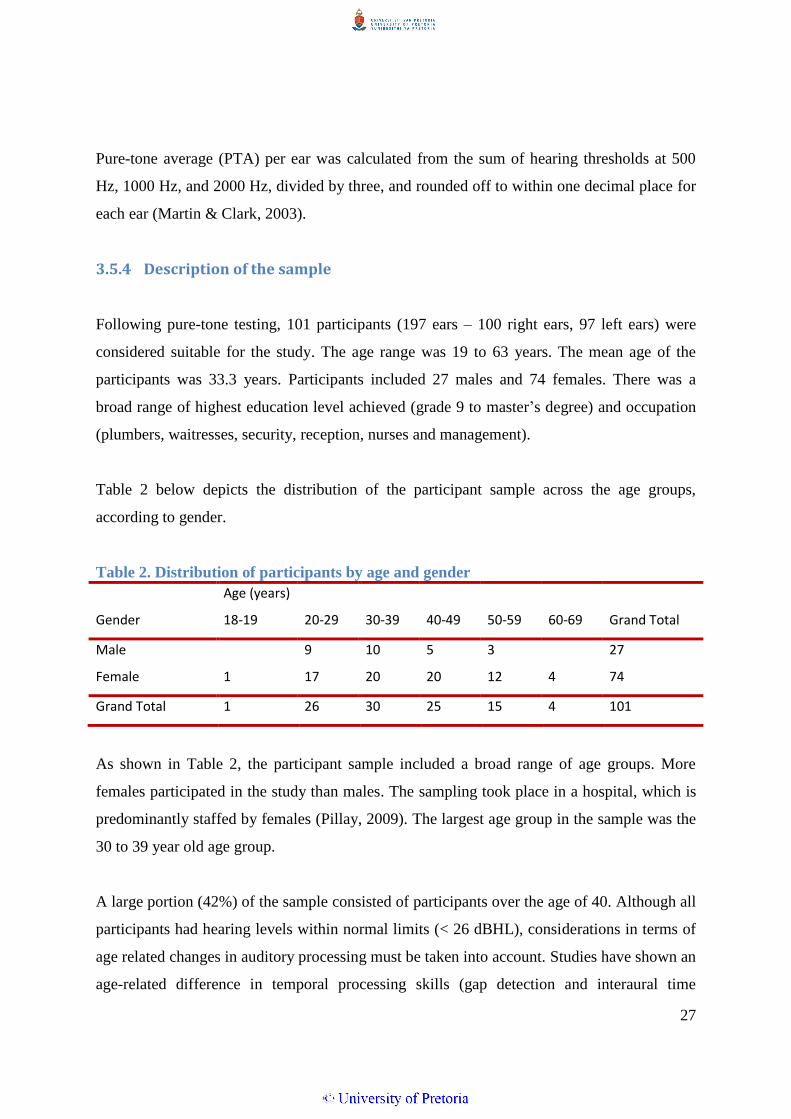
Table 2. Distribution of participants by age and gender
Sum of 2ND LG Age (years)
Gender 18-19 20-29 30-39 40-49 50-59 60-69 Grand Total
Male
9 10 5 3
27
Female 1 17 20 20 12 4 74
Grand Total 1 26 30 25 15 4 101
As shown in Table 2, the participant sample included a broad range of age groups. More
females participated in the study than males. The sampling took place in a hospital, which is
predominantly staffed by females (Pillay, 2009). The largest age group in the sample was the
30 to 39 year old age group.
A large portion (42%) of the sample consisted of participants over the age of 40. Although all
participants had hearing levels within normal limits (< 26 dBHL), considerations in terms of
age related changes in auditory processing must be taken into account. Studies have shown an
age-related difference in temporal processing skills (gap detection and interaural time

28
differences) in older individuals (Pichora-Fuller & Souza, 2003). However, there is no
evidence of a relationship between temporal resolution and performance in speech perception
tasks. Although they are presented at low intensities, spondaic words are highly redundant
and highly predictable, which excludes the factors of temporal cues on speech recognition
tasks (Sreedhar et al., 2011). Therefore, the contribution of age may be considered negligible
in terms of determining SRT. Figure 2 provides a depiction of the first language use among
the participants in the study.
Figure 2. Distribution of first language groups in the sample
As shown in Figure 2, the first language distribution of the sample was comparable to the
language distribution of the country, indicating a sample that is representative of the various
first languages spoken in South Africa. First language use included Afrikaans, Zulu, Venda,
Sotho, Pedi, Xhosa, Ndebele, Tsonga, Tswana, Swati (10 of the 11 official South African
languages, with the exception of English, which was not sampled) (Statistics South Africa,
2012). First language speakers of Xhosa were under-sampled due to the geographical location
of the sampling (see Figure 1 in the introduction and Figure 2 above).

29
The distribution of educational levels among the participants is depicted in Figure 3.
36%
28% 27%
9%
Figure 3. Distribution of educational levels within the participant sample
As shown in Figure 3, a broad range of educational levels was represented in the participant
sample. The term ‘matric’ or ‘matriculation’ is a South African term which refers to the final
year of secondary or high school qualification (the twelfth year of formal schooling), and the
qualification obtained for completing high school (Kaabwe, 2003). 28% of the sample did not
complete their secondary schooling. 55% of the sample had no additional schooling other
than high school. Educational level has implications with regard to word familiarity, due to
exposure, language use and vocabulary (Song & Fox, 2008), and is therefore a factor to be
taken into account when considering the vocabulary content of unfamiliar wordlists. The
sampled population may be considered to be a fair representation of the current education
levels in South Africa.
3.6 Material and apparatus used for data collection
The material and apparatus used to collect the data is discussed in this section. The first phase
of the study involved recording of the wordlists. The second phase of the study involved the
evaluation of the participants’ performance with each of the wordlists.

30
3.6.1 Development of the material
The speech audiometry material used in this study is listed below in Table 3. The
development of the material is discussed in this section.
Table 3. Available spondaic wordlists in terms of familiarity
South African Spondaic (SAS)
wordlist
(Durrant, 2006)*
‘Less familiar’ CID W-1
wordlist (Hirsh et al., 1952,
Durrant, 2006)
‘More familiar’ CID W-1
wordlist (Hirsh et al., 1952,
Durrant, 2006)
LIST A
LIST B LIST C Cellphone Greyhound Schoolboy
Bathroom Inkwell Sunset
Sandwich Whitewash Grandson
Building Mousetrap Toothbrush
Township Duckpond Playground
Dancing Sidewalk Cowboy
Welcome Horseshoe Northwest
Housewife Baseball Hotdog
Lightning Stairway Mushroom
Toothbrush Iceberg Hardware
Basket
Popcorn
Railroad Workshop
Public Oatmeal Eardrum
Workshop Drawbridge Headlight
Suitcase Hothouse Birthday
Birthday Daybreak Pancake
Sunlight Airplane Armchair
Homework Padlock Sunshine Nutmeg *Permission was expressly granted by the University of the Witwatersrand to use this wordlist for the current study.
As shown in Table 3, Durrant developed list A, the SAS wordlist, which is a list of
structurally balanced (consonant-vowel-consonant; consonant-vowel-consonant, CVC-CVC)
South African English spondaic words, which were rated in terms of familiarity, through self-
report, on a three point scale, by a broad sample of 387 South African participants (Durrant,
2006). Simultaneously, the familiarity of the existing CID W-1 wordlist (Hirsh et al., 1952)
was also determined. The top rated words in terms of familiarity were combined into a list
known as the South African Spondaic (SAS) wordlist (see Table 1), (Durrant, 2006). The
original CID W-1 words were grouped into list B (least familiar) and list C (more familiar),

31
according to the same rating scale. The CID W-1 words were split into two lists (lists B and
C) for the sake of comparison. Clinically, this may have implications if the ‘less familiar’
words were excluded from the CID W-1, and the ‘more familiar’ words were used instead.
The exclusion of certain unfamiliar words from an existing wordlist may be an alternative
solution to the problem. However, the exclusion of certain words would reduce the set size of
a list, and contradict the normative data of the wordlists as a whole, and is therefore not
recommended (Ramkissoon & Khan, 2003).
Some of the words included in the SAS wordlist, as shown in Table 3, namely ‘building’,
‘public’, ‘lightning’, ‘basket’ and ‘dancing’ may be questionable as spondaic words,
depending on the definition used. Although the words are structurally balanced (consonant-
vowel-consonant; consonant-vowel-consonant, CVC-CVC), which lends itself to equal stress
across the two syllables, these words may be considered to be ‘trochees’, which have two
syllables with unequal stress, according to Gelfand (2009). However, in conversational
English, spondees are usually spoken as one long and one short syllable (Evans, 1997).
During audiological testing however, it is necessary for the tester who presents the words to
manipulate the stress to be equal across both syllables of the spondee (Martin & Clark, 2003).
Therefore the above words may be included, provided the audiologist applies appropriate
stress when presenting the words using monitored live voice (Martin & Clark, 2003). This
aspect was considered in the recording of the wordlists. The stress was also modified using
Praat (Boersma & Weenink, 2009), which is described in the following section.
3.6.2 Material and apparatus used for the recording of wordlists
The recording of the wordlists for the purpose of the current study will now be described. An
Olympus WS-100 digital voice recorder, a single sound-treated audiology booth, an
Interacoustics diagnostic audiometer (AD229b, last calibrated 6 April 2011), TDH-39
headphones, a scientific software program, Praat (Boersma & Weenink, 2009), and a
recordable compact disc (CD) were used for the recording of the wordlists. The apparatus
will be described in this section:

32
Interacoustics diagnostic audiometer
The wordlists (lists A, B and C, as seen in Table 3) were presented through the microphone
of an Interacoustics diagnostic audiometer (AD229b, last calibrated 6 April 2011), which is
connected to speakers in free-field in a sound-treated audiology booth.
Sound treated audiology booth
A single sound treated audiology booth (2 metres square) was used to eliminate background
noise. The words were recorded in the booth with a digital voice recorder.
Digital voice recorder
A portable digital voice recorder (Olympus WS100, serial number 200107495) was used. The
digital voice recorder was placed one meter away from the sound source speaker, and the
spoken words were recorded as various tracks on the digital voice recorder.
Praat
Praat is a scientific computer software program developed by Paul Boersma and David
Weenink (2013). Praat (the Afrikaans and Dutch word for ‘talk’) was initially developed in
Amsterdam in 1995, at the University of Amsterdam. Praat is an open-source software and
can be downloaded free of charge (Boersma & Weenink, 2013).
Praat allows for the acoustic analysis, synthesising and manipulation of speech sounds in
recorded phonetics. Therefore the pitch contour, as well as the duration and amplitude of each
syllable could be manipulated to result in a list of homogenous wordlist recordings.
Praat has been cited in more than 800 research articles since 2002, including linguistics,
acoustics and communication disorders journals (Boersma & Weenink, 2013).
Compact disc (CD)
The digital wordlists were burned onto a recordable compact disc, to allow for playback via a
CD player attached to an audiometer.

33
3.6.3 Material and apparatus used for the assessment of SRT
Speech audiometry was conducted using an Interacoustics diagnostic audiometer (AD229b,
calibrated on 6 April 2011), using TDH-39 headphones, in a single sound-treated audiology
booth in a quiet office, with a compact disc player connected via an audio cable to allow for
presentation of the recorded wordlists.
Prior to the collection of data, a pilot study was conducted.
3.7 Pilot study
A pilot study is recommended to allow for assessing the feasibility, determining resources
required, allowing errors to be corrected prior to beginning the study. This tends to result in
improved reliability and internal validity (Van Teijlingen & Hundley, 2001).
The following aims were established for the pilot study:
To determine the efficacy of the verbal history wording and recording of data;
To determine if the instructions given to the participants were easily understood;
To determine the efficiency of the test process and the recording of data;
To determine the time period required for each participant for the test procedure to be
completed.
Eleven participants were tested as part of the pilot study. Two of the participants presented
with hearing loss in one ear only. Exclusion was ear specific, so the total subject count was
11 participants (20 ears). Participant selection was obtained in the same manner as for the
final study. Testing took place during regular work hours. Testing was conducted in the same
room and using the same recorded words and equipment as the final study. The participants
were not informed that they were part of the pilot study only. The data collected of these
participants was not used in the final study. After selection of the participants, preliminary
case histories, otoscopic examinations and immittance testing were conducted in the office
which contains the sound proof booth. The results of the pilot study were as follows:

34
The participants demonstrated sufficient use of English to answer the case history questions
and the participants all demonstrated full understanding of the verbal interview questions.
Therefore the wording of the verbal history questions was appropriate. The recording of the
participants’ responses was easily noted, demonstrating that the recording table developed for
the study was easy to use (Appendix F). No changes were made to the questions or the
recording thereof.
Similarly, the participants demonstrated full understanding of the instructions given for the
test procedure. The instructions did not need to be repeated for any of the participants.
Next, the efficiency of the test process and the ease of the recording of data were determined.
Pure-tone testing was conducted in the sound proof booth. Thereafter, the participants were
instructed for SRT testing and familiarised with the recorded wordlists in a randomised order,
as recommended by Gelfand (2009). Following familiarisation, SRT was determined per ear
using two different wordlists for each participant. The test procedure was found to be stream-
lined and did not require any changes. The results were effectively and easily recorded on the
data form (Appendix F).
There was a mismatch in the results for PTA and SRT, which was later identified as the result
of poor recording quality, but unfortunately this trend was not identified at the stage of the
pilot study, due to the small sample size. Further adaptations and considerations for the
difference in results will be discussed in the results and discussion section.
Finally, the time period required for each participant for the test procedure to be completed
was determined. Table 4 indicates the time demands per participant during the pilot study:

35
Table 4. Time breakdown per participant for pilot study
Test procedure Time taken per participant
Case history 2 minutes
Otoscopic examination 1 minute
Tympanometry 2 minutes
Pure-tone testing 4 minutes
SRT familiarisation 2 minutes
SRT threshold (both ears) 4 minutes
As shown in Table 4 above, the time requirement totalled 15 minutes per participant in the
pilot study. The participants were therefore booked at 15 minute intervals in the final study.
This allowed for planning of time demands in the final study.
With the knowledge gained from the pilot study, the data collection for the final study was
conducted as follows:
3.8 Procedure for the collection of data
The following procedures were carried out for the collection of data.
3.8.1 Procedure for the recording of wordlists
A South African, English-first-language female audiologist spoke the wordlists (lists A, B
and C, as seen in Table 3), with equal stress on each syllable, into the microphone of the
audiometer. The spondaic words were recorded without a carrier phrase onto a digital voice
recorder, in a single sound-treated audiology booth. The use of a carrier phrase is indicated
for suprathreshold testing, but the literature indicates mixed findings with regard to the
benefit of using a carrier phrase for threshold testing, as it may be considered time consuming
and distracting (Gelfand, 2009).

36
The recorded words were analysed in terms of frequency spread, duration and intensity of
each syllable within each word, with the software program Praat (Boersma & Weenink,
2009). The words were normalised to peak at zero decibels (0 dB) and were adjusted to allow
for similar frequency spread, duration and intensity of each syllable within and between each
spondaic word, to allow for maximum homogeneity in terms of audibility. The words were
burned onto a recordable compact disc.
Three wordlists were recorded. List A contains the South African Spondaic (SAS) words
(Durrant, 2006), list B contains those original CID W-1 (Hirsh et al., 1952) words that were
rated as ‘less’ familiar by Durrant (2006), and list C contains those original CID W-1 (Hirsh
et al., 1952) words that were rated as ‘more’ familiar by Durrant (2006). Each wordlist was
recorded twice, in different orders, to allow for familiarisation with one list, and threshold
determination with the second list. Familiarisation with the spondaic words is recommended
prior to actual threshold testing. Familiarisation allows the participant to know the test
vocabulary and recognise the test words to allow for accurate interpretation of the words at
soft intensities (Gelfand, 2009). The importance of familiarisation is a well-established
concept (Gelfand, 2009). If a participant is not familiarised with the words prior to testing, it
may result in SRTs that are 4 dB to 5 dB poorer than their actual thresholds (Gelfand, 2009).
3.8.2 Procedure for the assessment of SRT
Only participants who met the specified selection criteria were selected for this portion of the
study (n=101). The recorded words were presented through a compact disc (CD) unit
attached to the diagnostic audiometer, with both syllables of the spondaic words peaking at
zero Volume Unit (VU), on the VU meter, to allow for equal loudness presentation between
the words (Gelfand, 2009). The participants were given the following instructions:
“The aim of this test is to measure the softest level at which you can recognise and
repeat some words. The words will have two syllables, and all the words will first be
said at a comfortable loudness level. Those same words will then be repeated, but this
time will be made softer and softer. Keep repeating the words, even when they are

37
very soft, but try not to guess. Are there any questions?” (Martin & Clark, 2003,
p.115).
Each of the wordlists was initially presented at 75 dBHL in one ear, in order to familiarise the
participant with the spondaic words prior to testing (Brandy, 2002). The presentation level
was at a comfortable suprathreshold intensity, which allowed for adequate loudness levels for
familiarisation, without presenting the sound at loudness which may be uncomfortably loud
(Martin & Clark, 2003). No masking was applied as this procedure was conducted simply to
familiarise the participants with the wordlists.
All participants were therefore familiarised with list A (SAS wordlist). Thereafter, the
participants were randomly delegated to group one or group two. The test participants in
group one were similarly familiarised with List B (the less familiar CID W-1 words), and the
participants in group two were familiarised with list C (the more familiar CID W-1 words).
Following familiarisation, SRT was determined in each ear using the second recordings of
lists A, B or C, which has the same content as the first lists, but in a different presentation
order, to exclude variables such as order effect. SRT was determined by beginning with the
presentation of a single word at 40 dBHL, and decreasing in 10 dB steps, presenting one
word at each intensity level. When one word was repeated incorrectly, the tester stopped
descending and presented three more words at that level. The intensity level was then
increased or decreased in 5 dB steps to determine the softest intensity at which 50% of the
words were repeated correctly, as first described by Carhart (1946, as cited in Brandy, 2002).
The order of presentation of the wordlists was randomized in order to minimize the effects of
sequencing (Schiavetti & Metz, 2006). The use of 5 dB steps was favoured over the use of 1
dB or 2 dB steps in the interest of clinical timeliness and brevity. However, for research
purposes, 1 dB or 2 dB steps would have been more precise (Brandy, 2002). This is discussed
further under recommendations for future research.

38
3.9 Procedure for the capturing of data
All the raw data was captured on a spreadsheet, to allow for systematic management,
interpretation and statistical analysis of the data. A summary and a sample of the captured
raw data can be viewed in Appendix G.
3.10 Procedure for the processing and analysis of data
The statistical techniques used included one-way Analysis of Variance (ANOVA),
Multivariate Analysis of Variance (MANOVA), paired sample T-tests and a Pearson
correlation analysis. Intergroup reliability was also determined using paired T-tests (Howell,
2009).
A raw data summary (Appendix G) was analysed using the statistical analysis package SAS
JMP version 10.0 (Gerber, 2012, personal consultation).
3.10.1 The determination of correlation
A correlation matrix was calculated to measure the strength and direction of the relationship
between two variables, namely PTA and SRT for lists A, B and C. List A was also split for
the two groups (groups one and two). A Pearson correlation analysis was conducted (Howell,
2009). To determine if the correlation was statistically significant, a statistical test was
conducted to determine the probability value (p-value) (Howell, 2009).
Table 5 was extrapolated from Schiavetti and Metz (2006), to show the strength of
correlational relationship.

39
Table 5. Interpretive guide for correlation coefficients (Schiavetti & Metz, 2006)
Coefficient Direction Strength
+1.00 Positive Maximum
+0.50 to +1.00 Positive Moderate to strong
+0.50 Positive Moderate
0.00 to +0.50 Positive Weak to moderate
0.00 Nil Nil
0.00 to -0.50 Negative Weak to moderate
-0.50 Negative Moderate
-0.50 to -1.00 Negative Moderate to strong
-1.00 Negative Maximum
As shown in Table 5, a correlation relationship may be considered positive if the correlation
occurs in the same direction. The strength of the correlation relationship is determined
according to the correlation coefficient.
3.10.2 The comparison of the difference in mean scores for PTA and SRT
The differences between the mean scores for PTA and SRT were compared for lists A, B and
C using the paired sample T-test (the PTA and SRT values were paired).
Lists A and B were compared, using the difference between PTA and SRT for the total
number of ears using the paired sample T-test (lists A and B were paired).
Lists A and B were compared, using the total difference between PTA and SRT for the total
number of ears using the paired sample T-test (lists A and B were paired).
Lists A and C were compared, using the difference between PTA and SRT for the total
number of ears using the paired sample T-test (lists A and C were paired).

40
Finally, lists A and C were compared, using the total difference between PTA and SRT for
the total number of ears using the paired sample T-test (lists A and C were paired) (Howell,
2009).
3.10.3 The description of differences in mean scores for PTA and SRT according to
various factors
The mean difference between PTA and SRT was then analysed according to various factors
such as the subjective rating of English language proficiency, age, education and occupation.
3.10.4 The description of errors
The description of errors was evaluated qualitatively and descriptively.
3.10.5 The description of inter-ear reliability per wordlist
The differences between the mean scores for the right and left ears were compared for lists A,
B and C using the paired sample T-test (the left and right values were paired) to determine
the inter-ear reliability, to ensure that there was good test-retest reliability within participants
(Howell, 2009).
3.10.6 The description of intergroup reliability
The ANOVA, MANOVA and paired T-tests (Howell, 2009) were conducted to determine
intergroup reliability for groups one and two, to ensure there was no bias between the groups.
This could only be conducted using list A, due to the design of the study.
To determine the intergroup reliability, if there were statistically significant differences
between the mean SRT of groups one and two, for the right and left ears, one-way Analysis
of Variance (ANOVA), that is, only one independent variable (SRT) per group was
considered, and Multivariate Analysis of Variance (MANOVA) (both PTA and SRT) were

41
considered (Howell, 2009). The measurements were used to ensure that there was no bias
between groups one and two, for the right and left ears. The ANOVA and MANOVA could
only be applied to list A due to the study design.
Intergroup reliability was also determined using paired T-tests to compare the differences
between the mean scores for PTA and SRT for groups one and two using the paired sample
T-test (the PTA and SRT values were paired) when using list A (Howell, 2009).
The results of the analysis will now be presented.

42
Chapter 4: Results and discussion
4 Introduction
In this chapter, the results and discussion will be presented according to the aims of the study.
4.1 The results and discussion for PTA/SRT correlation
Typically, SRT is used as part of a crosscheck for the reliability of Pure Tone Average
(PTA), and vice versa. PTA refers to the three-frequency average of pure-tone thresholds
obtained at 500 Hz, 1000 Hz and 2000 Hz (Brandy, 2002). PTA and SRT should be within 6
dB of one another to indicate good correlation and reliability from test results (Brandy, 2002).
In order to determine which of the wordlists (lists A, B or C) yielded the most favourable
PTA/SRT correlation, when testing a group of the South African ESL participants, the
PTA/SRT correlation was determined in the following scenarios:
4.1.1 Results and discussion for PTA/SRT correlation when using list A
A correlation matrix was calculated to measure the strength and direction of the relationship
between two variables, namely PTA and SRT for list A. List A was also split for the two
groups (groups one and two). The relationship between two variables can be illustrated
graphically on a scattergram (Schiavetti & Metz, 2006). The strength and direction of the
relationship between PTA and SRT was determined for list A, as reflected in Figures 4 and 5
(below) for groups one and two respectively. The scattergrams represent PTA for the right
and left ears and SRT (list A) for the right and left ears. The correlation strengths are
described below.

43
Figure 4. PTA/SRT correlation for list A in group one (N=54R; 51L)
Figure 5. PTA/SRT correlation for list A in group two (N = 46R; 46L)

44
As may be seen in Figures 4 and 5 above, the scattergrams are densely clustered, with a
similar pattern for groups 1 and 2, for both the right and left ears (Schiavetti & Metz, 2006),
suggestive of good inter-group reliability. The scattergram is clustered between 15 dB and 35
dB thresholds for SRT, with a corresponding range of 0 dB to 25 dB for PTA. A Pearson
correlation analysis revealed a significant and positive, moderate to strong correlation
relationship for list A. That is, as the variable of SRT tends to increase according to the
increase of the variable of PTA, the relationship may be considered positive in all instances
(Howell, 2009; Schiavetti & Metz, 2006).
Where “1” denotes a perfect positive correlation, and “0” denotes no correlation (Howell,
2009), when compared to PTA for the right ear, list A (right ear) revealed a moderate to
strong correlation of 0.63 (N = 54, p<0.0001) for group one, and 0.67 (N = 46, p<0.0001) for
group two. When compared to PTA for the left ear, list A (left ear) revealed a moderate to
strong correlation of 0.58 (N = 51, p<0.0001) for group one, and 0.57 (N = 46, p<0.0001) for
group two. When the results for groups one and two were combined, list A (right ear)
revealed a moderate to strong correlation of 0.65 (N = 100, p<0.0001) (Schiavetti & Metz,
2006). When the results for groups one and two were combined, list A (left ear) revealed a
moderate to strong correlation of 0.58 (N = 97, p<0.0001) (Schiavetti & Metz, 2006).
The relationship is considered moderate to strong (0.65 and 0.58 for the right and left ears
respectively) with the use of list A due to the high value of the correlation, as well as the
density with which the plots of the scattergram are clustered (Schiavetti & Metz, 2006).
It is interesting to note that the correlation for the right ear is stronger than the correlation for
the left ear, despite the randomisation of test order. This may be related to right ear
processing dominance for speech which may require further investigation in future studies
(Bellis, 2003).
For all conditions, the correlations between PTA and SRT were statistically significant for list
A, at a 95% level of confidence since the p-value is smaller than 0.05 (Schiavetti & Metz,
2006). In addition, there were no significant differences between groups one and two for list
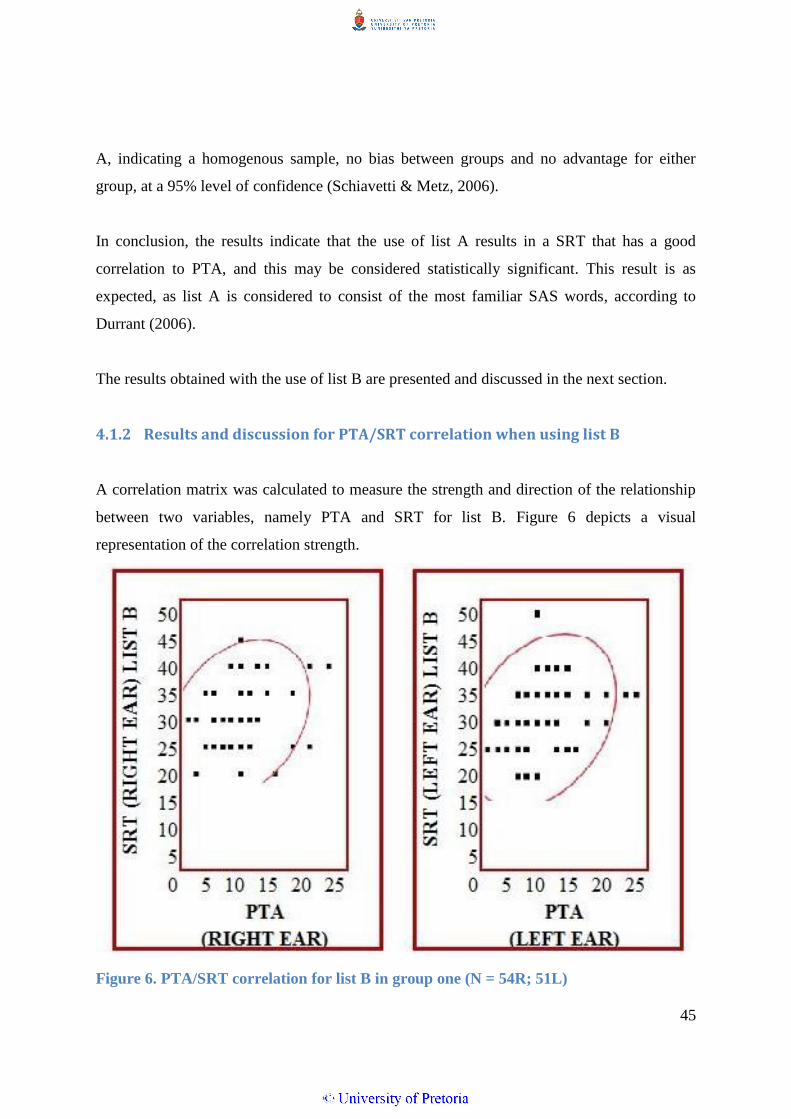
45
A, indicating a homogenous sample, no bias between groups and no advantage for either
group, at a 95% level of confidence (Schiavetti & Metz, 2006).
In conclusion, the results indicate that the use of list A results in a SRT that has a good
correlation to PTA, and this may be considered statistically significant. This result is as
expected, as list A is considered to consist of the most familiar SAS words, according to
Durrant (2006).
The results obtained with the use of list B are presented and discussed in the next section.
4.1.2 Results and discussion for PTA/SRT correlation when using list B
A correlation matrix was calculated to measure the strength and direction of the relationship
between two variables, namely PTA and SRT for list B. Figure 6 depicts a visual
representation of the correlation strength.
Figure 6. PTA/SRT correlation for list B in group one (N = 54R; 51L)

46
As may be seen in Figure 6 above, the scattergrams are less densely clustered, with a similar
pattern for the right and left ears (Schiavetti & Metz, 2006). The scattergram is clustered
between 20 dB and 50 dB thresholds for SRT, with a corresponding range of 0 dB to 25 dB
for PTA, indicating much higher SRT responses when list B was used, despite the matched
groups. A Pearson correlation analysis revealed a positive, moderate to weak correlation
relationship for list B, for both the right and left ears (Howell, 2009, Schiavetti & Metz,
2006). Where “1” denotes a perfect positive correlation, and “0” denotes no correlation, when
compared to PTA for the right ear, list B (right ear) revealed a moderate to weak correlation
of 0.30 (N = 54, p = 0.0266). When compared to PTA for the left ear, list B (left ear)
revealed a moderate to weak correlation of 0.32 (N = 51, p = 0.0226). As the variable of SRT
for list B tends to increase according to the increase of the variable of PTA, the relationship
may be considered positive (Schiavetti & Metz, 2006). However, the strength of the
relationship is considered moderate to weak (0.30 and 0.32 for the right and left ears
respectively, with p = 0.0266 in both instances) with the use of list B due to the low value of
the correlation (Schiavetti & Metz, 2006). This is indicative of a poor correlation with PTA
when list B is used.
The correlations between PTA and SRT were statistically significant for list B, at a 95% level
of confidence since the p-value is smaller than 0.05 (Schiavetti & Metz, 2006). This result is
as expected, due to the unfamiliar linguistic content and vocabulary of the words contained in
list B. Many ESL South Africans have never been exposed to many of the words contained in
list B and they are considered the most unfamiliar words, according to Durrant (2006).
The results of list C are presented and discussed in the next section.
4.1.3 Results and discussion for PTA/SRT correlation when using list C
A correlation matrix was calculated to measure the strength and direction of the relationship
between two variables, namely PTA and SRT for list C. Figure 7 depicts a visual
representation of the correlation strength.

47
Figure 7. PTA/SRT correlation for list C in group two (N = 46R; 46L)
As may be seen in Figure 7 above, the scattergrams are densely clustered, with a similar
pattern for the right and left ears (Schiavetti & Metz, 2006). The scattergram is clustered
between 10 dB and 40 dB thresholds for SRT, with a corresponding range of 0 dB to 25 dB
for PTA. A Pearson correlation analysis was conducted, and revealed a significant and
positive, moderate to strong correlation relationship for list C, for both the right and the left
ear (Schiavetti & Metz, 2006; Howell, 2009). Where “1” denotes a perfect positive
correlation, and “0” denotes no correlation, when compared to PTA for the right ear, list C
(right ear) revealed a moderate to strong correlation of 0.63 (N = 46, p <0.0001). When
compared to PTA for the left ear, list C (left ear) revealed a moderate to strong correlation of
0.56 (N = 46, p<0.0001).
The relationship is considered moderate to strong (0.63 and 0.56 for the right and left ears
respectively) with the use of list C due to the high value of the correlation, as well as the
density with which the plots of the scattergram are clustered (Schiavetti & Metz, 2006).
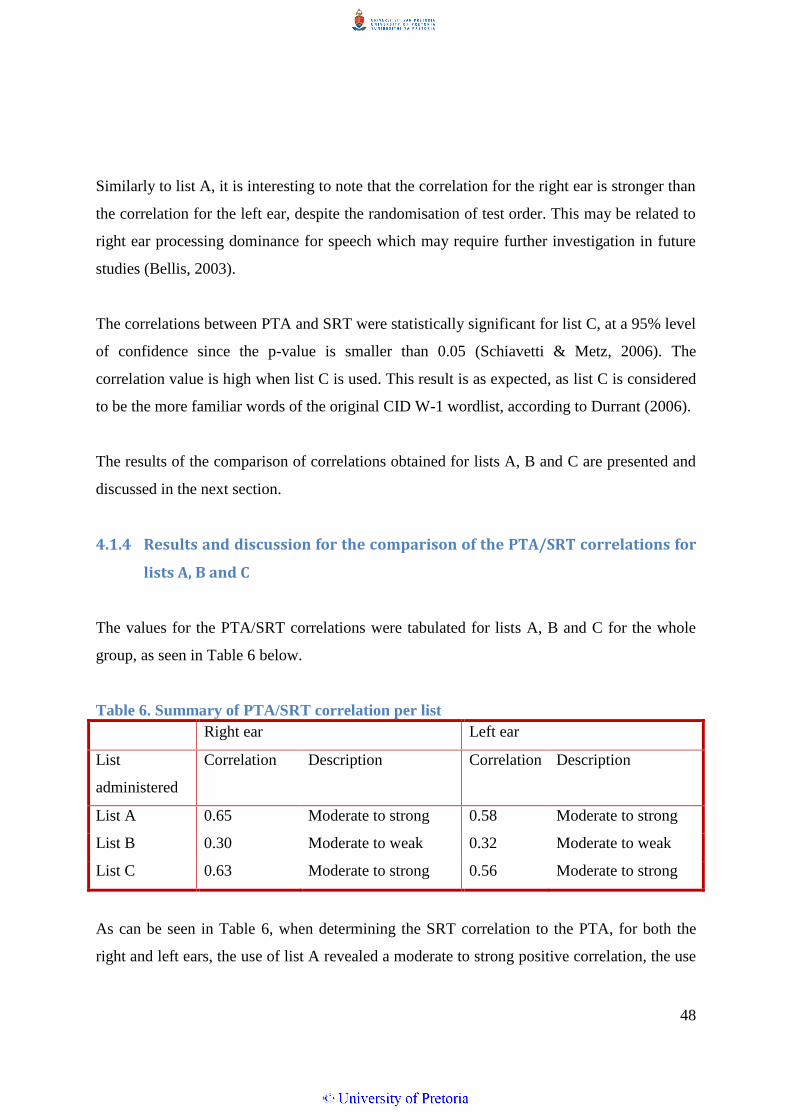
48
Similarly to list A, it is interesting to note that the correlation for the right ear is stronger than
the correlation for the left ear, despite the randomisation of test order. This may be related to
right ear processing dominance for speech which may require further investigation in future
studies (Bellis, 2003).
The correlations between PTA and SRT were statistically significant for list C, at a 95% level
of confidence since the p-value is smaller than 0.05 (Schiavetti & Metz, 2006). The
correlation value is high when list C is used. This result is as expected, as list C is considered
to be the more familiar words of the original CID W-1 wordlist, according to Durrant (2006).
The results of the comparison of correlations obtained for lists A, B and C are presented and
discussed in the next section.
4.1.4 Results and discussion for the comparison of the PTA/SRT correlations for
lists A, B and C
The values for the PTA/SRT correlations were tabulated for lists A, B and C for the whole
group, as seen in Table 6 below.
Table 6. Summary of PTA/SRT correlation per list
Right ear Left ear
List
administered
Correlation
Description Correlation
Description
List A 0.65 Moderate to strong 0.58 Moderate to strong
List B 0.30 Moderate to weak 0.32 Moderate to weak
List C 0.63 Moderate to strong 0.56 Moderate to strong
As can be seen in Table 6, when determining the SRT correlation to the PTA, for both the
right and left ears, the use of list A revealed a moderate to strong positive correlation, the use

49
of list B revealed a moderate to weak positive correlation, and the use of list C revealed a
moderate to strong positive correlation (Schiavetti & Metz, 2006).
The correlation obtained for list A (0.65; 0.58) and list C (0.63; 0.56) are comparable to the
correlation obtained by Khoza et al. (2008) when using the CID W-1 wordlist (0.61), a
Tswana wordlist (0.62) and a digit wordlist (0.60), in their sample of university ESL students,
as well as the correlation obtained by Ramkissoon et al. (2002) for the CID W-1 wordlist
(0.63) for ESL speakers. However, the correlation obtained by Ramkissoon et al. for the digit
wordlist was slightly stronger (0.71). This is evident of improved performance for digit
testing, for Ramkissoon’s study (2002).
The correlation for each of the lists differs significantly from 0 at a 95% level of confidence
since the p-value is smaller than 0.05 (Schiavetti & Metz, 2006). However lists A and C
revealed a higher absolute correlation than list B, indicating a stronger correlation for lists A
and C.
These results indicate that lists A and C yield a similarly stronger PTA/SRT correlation than
the use of list B when measuring SRT of the participants. This is as expected, based on the
familiar ratings of the wordlists (Durrant, 2006).
The results of the comparison of the difference in mean scores obtained for lists A, B and C
are presented and discussed in the next section.
4.2 Results and discussion for the comparison of the difference in mean
scores for PTA and SRT for lists A, B and C
The differences between the mean scores for PTA and SRT were compared for lists A, B and
C using the paired sample T-test (the PTA and SRT values were paired).
The mean differences between PTA and SRT for list A (11.66 and 11.96) and list C (14.84
and 12.80) were significantly lower than that for list B (22.13 and 20.90), for the right and

50
left ear respectively, indicating stronger PTA/SRT compliance for lists A and C. The analysis
showed a significant difference for all three lists - greater than the ideal of 6 dB (Brandy,
2002). This discrepancy exists due to a suboptimal quality of the recording, due to the nature
of the recording equipment used. Audibility of the wordlists was compromised somewhat,
and this was only noted following the analysis of raw data. However, it should be noted that
this discrepancy occurs equally across all the wordlists (lists A, B and C), as the wordlists
were all recorded in the same manner, and under the same conditions, with acceptable inter-
ear and intergroup reliability.
Lists A and B were compared, using the difference between PTA and SRT for both ears using
the paired sample T-test (lists A and B were paired). The analysis showed a difference
between PTA and SRT correlation of 11.08 for the right ear, and of 9.51 for the left ear, both
of which are statistically significant (with a t-value of <.0001), which indicates that lists A
and B differ significantly at a 99% level of confidence, yielding a stronger PTA/SRT
correlation when list A is used.
Lists A and B were compared, using the total difference between PTA and SRT for combined
sets of ears using the paired sample T-test (lists A and B were paired). The analysis showed a
difference between PTA and SRT correlation of 20.58 for the combined ears, which is
statistically significant (with a t-value of <.0001), which indicates that lists A and B differ
significantly at a 99% level of confidence, yielding a stronger PTA/SRT correlation when list
A is used.
The use of the paired sample T-test indicates a large difference in mean scores between lists
A and B, which differ significantly at a 99% level of confidence, yielding a significantly
stronger PTA/SRT correlation when list A is used. List B contains the less familiar words
within the CID W-1 original spondaic wordlist, and those words may be deemed unreliable
when testing SRT in the ESL sample, due to the poor correlation obtained.
Lists A and C were compared, using the difference between PTA and SRT for both ears using
the paired sample T-test (lists A and C were paired). The analysis showed a mean difference

51
between PTA and SRT of 2.67 for the right ear, which is statistically significant (with a t-
value of 0.0015), and only 0.45 for the left ear, which is not statistically significant (with a t-
value of 0.5612), yielding a statistically stronger PTA/SRT difference for the right ear only.
Finally, lists A and C were compared, using the total difference between PTA and SRT for
combined sets of ears using the paired sample T-test (lists A and C were paired). The analysis
showed a mean difference between PTA and SRT of 3.12 for the combined ears, which is
statistically significant (with a t-value of 0.0232). The use of lists A and C revealed similar
correlations, with a small difference in mean scores, yielding similar results. However, the
use of the paired sample T-test indicates that lists A and C differ significantly at a 95% level
of confidence, yielding a statistically significantly stronger PTA/SRT correlation when list A
is used.
The null hypothesis is that there is no statistically significant difference in PTA/SRT
correlation, when lists A, B or C is used, at a .05 level of statistical significance. Therefore
the null hypothesis is disproved as there is a statistically significant difference in PTA/SRT
correlation.
The alternative hypothesis is that list A yields a statistically significantly stronger PTA/SRT
correlation than the use of lists B or C, at a .05 level of statistical significance. The alternative
hypothesis is proven correct.
The results of the influence of various factors on the mean difference in PTA and SRT scores
for lists A, B and C are presented and discussed in the next section.
4.3 The results and discussion of the difference in mean scores for PTA
and SRT for lists A, B and C according to various factors
Certain factors may be considered to influence the test results, such as age, education,
occupation and subjective language proficiency. Figure 8 depicts the mean difference

52
between PTA and SRT according to the factors of subjective rating of English language
proficiency, age, education and occupation
As can be noted from Figure 8, the use of list A (groups one and two) and the use of list C
results in a much smaller mean difference between PTA and SRT for all participants. The use
of list B results in a much larger mean difference between PTA and SRT for all participants.
The use of list B resulted in great variation in the difference between PTA and SRT. Those
participants who rated their own use of English as ‘excellent’ tended to yield a smaller (17.04
dB) mean difference in PTA and SRT. Those who considered their English language use to
be ‘poor’ tended to yield a larger (25.03 dB) mean difference in PTA and SRT. Participants
who have a ‘matriculation’ level of education tended to yield a larger (25.21 dB) mean
difference in PTA and SRT. The use of list B results in a higher degree of variation in the
mean difference between PTA and SRT, with a minimum difference of 8.11 dB and a
maximum difference of 13.76 dB, with a range of 5.65 dB, depending on factors such as
education and subjective language proficiency.
In contrast, those who were tested with lists A and C resulted in less variation in test results
with regard to various factors. Those who rated their own English as ‘excellent’ tended to
yield a smaller (8.11 dB and 9.8 dB for groups 1 and 2 respectively) mean difference in PTA
and SRT with the use of list A.
Those who considered their English language use to be ‘poor’ tended to perform similarly
with lists A and C, yielding 13.76 dB, 12.95 dB and 14.45 dB mean difference in PTA and
SRT for lists A (group one), A (group two) and C respectively. This indicates minimal
variation in the range of performance (1.5 dB range), even with participants who consider
their own English proficiency to be poor. Furthermore, there is minimal variation in
performance with the use of list A and/or list C (range of 7.77 dB) with regard to factors such
as age, subjective language proficiency, education or occupation. For example, a cleaner who
has a grade 9 level of education and who considers his own English proficiency to be ‘poor’

53
Figure 8. The mean difference (y-axis) between PTA/SRT in relation to various factors (x-axis) that may influence the correlation

54
can obtain a similar test score to a professional nurse who considers her own English
proficiency to be good.
In the following section, the errors made during testing are reported and described:
4.4 The results and discussion of the description of errors
Certain errors were noted when participants were exposed to unfamiliar words for SRT
testing, even at suprathreshold intensities, and at soft intensities. Table 7 tabulates the errors.
Table 7. Examples of errors made upon word repetition with unfamiliar wordlists
List target word
expected
error word
produced by
participant
description of the
phonetic error –
first syllable
description of the
phonetic error –
second syllable
Is the word
valid or
nonsensical?
A building everything no pattern vowel and final
phoneme correct
valid
building all day no pattern first phoneme
correct
valid
toothbrush dishwash no pattern final phoneme
correct
nonsensical
suitcase sweetcakes initial and final
phonemes correct
initial and final
phonemes correct
valid
sunlight sunrise correct vowel correct
valid
sunshine sunrise correct vowel correct
valid

55
List target word
expected
error word
produced by
participant
description of the
phonetic error –
first syllable
description of the
phonetic error –
second syllable
Is the word
valid or
nonsensical?
B inkwell involve first vowel and
consonant correct
mid-phoneme
correct
valid
whitewash mouthwash no pattern correct valid
whitewash nightwatch vowel and final
phoneme correct
initial phoneme
and vowel correct
valid
mousetrap mousetrack correct initial cluster and
vowel correct
nonsensical
horseshoe horsecream correct no pattern nonsensical
baseball facebook vowel and final
phoneme correct
first phoneme
correct
valid
stairway stay away initial cluster
correct
correct valid
stairway stay there initial cluster
correct
no pattern valid
railroad main road vowel correct correct valid
oatmeal hotel vowel correct final phoneme
correct
valid
oatmeal ordeal no pattern vowel and final
phoneme correct
valid
drawbridge ‘corporage’ vowel correct vowel and final
phoneme correct
nonsensical
word
hothouse whitehouse final phoneme
correct
correct valid word
hothouse hotel initial and final
consonants correct
no pattern valid word
airplane anything final vowel correct no pattern
valid word

56
List target word
expected
error word
produced by
participant
description of the
phonetic error –
first syllable
description of the
phonetic error –
second syllable
Is the word
valid or
nonsensical?
C playground powerpoint initial phoneme
correct
no pattern valid word
cowboy powerball vowel correct initial phoneme
correct
valid word
cowboy tallboy no pattern correct nonsensical
word
headlight headlice correct initial phoneme
and vowel correct
valid word
Table 7 represents some of the errors that were made in response to the task of repeating
unfamiliar words. The table shows that the majority of errors occurred with list B, which is
the list of the least familiar words. The nature of the errors, even when simply repeating a
word at suprathreshold intensities, is evident of a stark lack of familiarity and exposure to the
words (Postma, 2000).
Listeners tend to use sounds and syllables from their first language to make predictions of
words that are more likely (Braisby & Gellatly, 2012). Errors draw heavily from the
participant’s knowledge of the world, and more common words tend to be exchanged for the
unknown word (Dietrich, 1999). Dietrich (1999) reported similar errors, such as ‘mouthwash’
for ‘whitewash’, ‘freeway’ or ‘fairway’ for ‘stairway’.
As the vowel pronunciation in English is reduced in ESL speakers, many vowels may be
confused (such as in the instance of ‘stair-way’ error ‘stay-away’. In addition, South African
English does not product the final /r/ as in stair.
The majority of the words produced in error were valid words, some specific to the South
African lexicon (such as ‘powerball’, which is the name of a lottery game). The errors were
typically with either the first or second syllable of the word. At least one of the phonemes
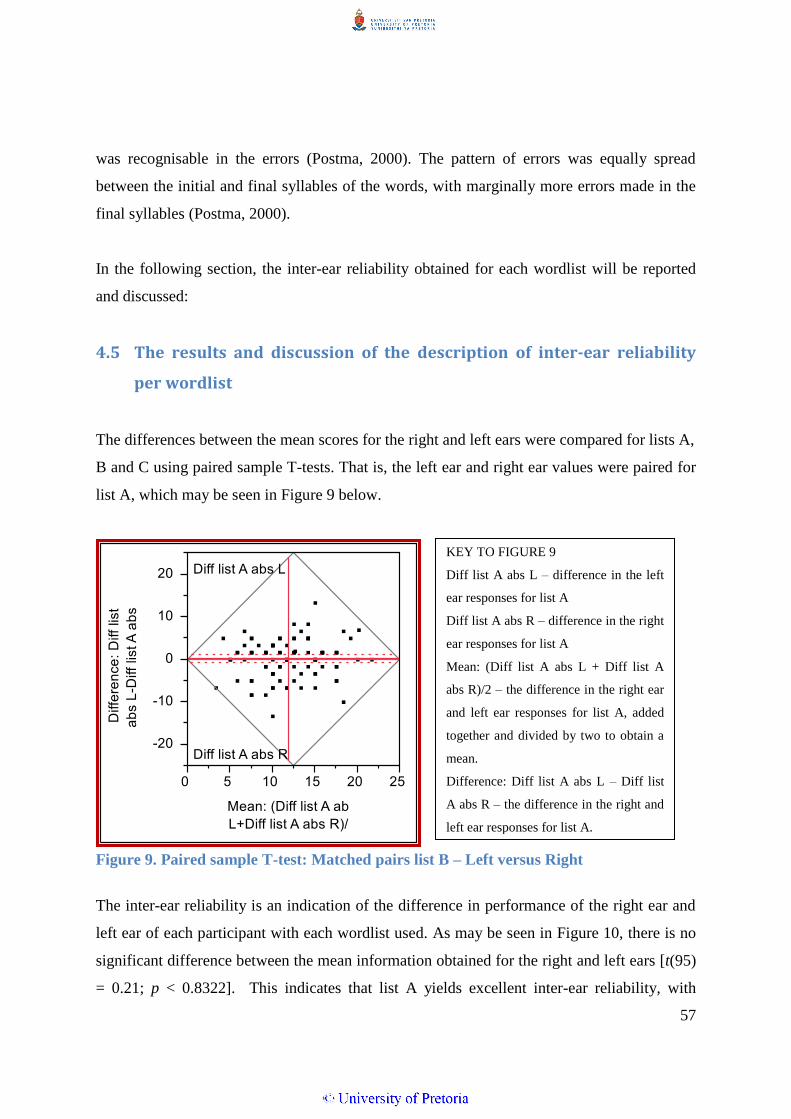
57
was recognisable in the errors (Postma, 2000). The pattern of errors was equally spread
between the initial and final syllables of the words, with marginally more errors made in the
final syllables (Postma, 2000).
In the following section, the inter-ear reliability obtained for each wordlist will be reported
and discussed:
4.5 The results and discussion of the description of inter-ear reliability
per wordlist
The differences between the mean scores for the right and left ears were compared for lists A,
B and C using paired sample T-tests. That is, the left ear and right ear values were paired for
list A, which may be seen in Figure 9 below.
Figure 9. Paired sample T-test: Matched pairs list B – Left versus Right
The inter-ear reliability is an indication of the difference in performance of the right ear and
left ear of each participant with each wordlist used. As may be seen in Figure 10, there is no
significant difference between the mean information obtained for the right and left ears [t(95)
= 0.21; p < 0.8322]. This indicates that list A yields excellent inter-ear reliability, with
KEY TO FIGURE 9
Diff list A abs L – difference in the left
ear responses for list A
Diff list A abs R – difference in the right
ear responses for list A
Mean: (Diff list A abs L + Diff list A
abs R)/2 – the difference in the right ear
and left ear responses for list A, added
together and divided by two to obtain a
mean.
Difference: Diff list A abs L – Diff list
A abs R – the difference in the right and
left ear responses for list A.

58
minimal differences between the values obtained for the right and left ears. Therefore, the use
of list A may be considered to result in good within-participant reliability, thereby
eliminating certain extraneous conditions, such as language level and education level
(Schiavetti & Metz, 2006).
Paired sample T-tests were also used to pair the left ear and right ear values for list B, which
may be seen in Figure 10 below.
Figure 10. Paired sample T-test: Matched pairs list B – Left versus Right
The inter-ear reliability is an indication of the difference in performance of the right ear and
left ear of each participant with each wordlist used. As may be seen in Figure 11, the analysis
showed a significant difference between the mean information obtained for the right and left
ears for list B [t(50) = -2.01; p < 0.0496]. This indicates that list B yields poor inter-ear
reliability, with significant differences between the values obtained for the right and left ears.
Therefore, the use of list B may be considered to result in a less favourable within-participant
reliability than for list A. Extraneous conditions such as language level and education level
may therefore have more of an influence on the test results when list B is used (Schiavetti &
Metz, 2006). This is consistent with the implications of education level on word familiarity,
KEY TO FIGURE 10
Mean: (Diff list B abs L + Diff list B abs
R)/2 – the difference in the right ear and
left ear responses for list B, added
together and divided by two to obtain a
mean.
Difference: Diff list B abs L – Diff list
B abs R – the difference in the right and
left ear responses for list B.

59
due to exposure, language use and vocabulary (Song & Fox, 2008), and these factors should
be taken into account when considering the vocabulary content of unfamiliar wordlists such
as list B. It should be noted that list B was tested on the same group of participants as list A.
Paired sample T-tests were also used to pair the left ear and right ear values for list C, which
may be seen in Figure 11 below.
Figure 11. Paired sample T-test: Matched pairs list C – Left versus Right
The inter-ear reliability is an indication of the difference in performance of the right ear and
left ear of each participant with each wordlist used. As may be seen in Figure 11, the analysis
showed a significant difference between the mean information obtained for the right and left
ears for list C [t(44) = -2.96; p < 0.0050]. Similarly, this indicates that list C yields poor inter-
ear reliability, with significant differences between the values obtained for the right and left
ears. Therefore, the use of list C may be considered to result in a less favourable within-
participant reliability than for list A. Extraneous conditions such as language level and
education level may therefore have more of an influence on the test results when list C is
used (Schiavetti & Metz, 2006). Similarly, this is consistent with the implications of
KEY TO FIGURE 11
Mean: (Diff list C abs L + Diff list C abs
R)/2 – the difference in the right ear and
left ear responses for list C, added
together and divided by two to obtain a
mean.
Difference: Diff list C abs L – Diff list C
abs R – the difference in the right and
left ear responses for list C.

60
education level on word familiarity, due to exposure, language use and vocabulary (Song &
Fox, 2008), and these factors should be taken into account when considering the vocabulary
content of unfamiliar wordlists such as list B. It should be noted that list B was tested on the
same group of participants as list A.
The use of lists B and C resulted in poor inter-ear reliability, with a larger mean inter-ear
difference. It should be recalled that lists B and C were tested on the same participants as list
A (groups one and two), which removes extraneous factors which could influence the test
results. The use of list A may be considered to result in improved within-participant
reliability than the use of lists B or C.
This may be due to the less familiar vocabulary contained in lists B and C, which can
compromise validity and reliability due to linguistically biased content (Ramkissoon, 2001;
Ramkissoon et al., 2002; Sreedhar et al., 2011).
In the following section intergroup reliability is discussed:
4.6 The description of intergroup reliability
The ANOVA, MANOVA and paired T-tests (Howell, 2009) were conducted to determine
intergroup equivalence for groups one and two, to ensure there was no bias between the
groups. This could only be conducted using list A, due to the design of the study.
When considering the results of the ANOVA, to determine the statistical significant
differences between groups one and two, the F-test was used at a 95% level of confidence. If
the calculated p-value is greater than 0.05, it may be considered as not significantly different
(Schiavetti & Metz, 2006). There were no significant differences between the groups
[F (1, 99) ≈ 2.01, p =0.1596 for the right ear; F (1, 96) ≈ 1.19, p = 0.2786 for the left ear],
indicating a homogenous sample, no bias between groups and no advantage for either group,
at a 95% level of confidence (Schiavetti & Metz, 2006).
61
When considering the results of the MANOVA, the SRT mean and PTA mean were similar
between the two groups, with no statistical difference between the groups. To determine the
statistically significant differences between groups one and two, the F-test was used at a 95%
level of confidence. If the calculated p-value is greater than 0.05, it may be considered as not
significantly different. There were no significant differences between the groups
[F (2, 97) ≈ 1.33, p =0.2683 for the right ear; F (2, 94) ≈ 0.64, p = 0.5293 for the left ear],
indicating a homogenous sample, no bias between groups and no advantage for either group,
at a 95% level of confidence.
When considering the results of the paired T-tests, the differences between the mean scores
for PTA and SRT were compared for list A, comparing groups one and two using the paired
sample T-test (the PTA and SRT values were paired). The analysis showed that the mean
differences between PTA and SRT for list A for group one (11.17 and 11.61) and group two
(12.24 and 12.36), for the right and left ear respectively, were similar, indicating good
intergroup equivalence. This is to be expected, as the groups were matched. It does indicate
that the sample is homogenous in terms of performance, despite the variations in age, gender,
first language use, education and language proficiency.
4.7 Summary
All the correlations for PTA/SRT were considered significant. The correlations for lists A and
C were stronger than the correlation for list B, indicating a higher correlation for lists A and
C.
The mean differences between PTA and SRT were significant for all lists; however the
differences for lists A and C were lower than the difference between PTA and SRT for list B.
This indicates a stronger compliance for lists A and C. Note that the mean is still above 6 dB
for all three lists.
The PTA/SRT correlations for lists A and B differ significantly at a 99% level of confidence,
yielding a stronger PTA/SRT correlation when list A is used. Lists A and C differ
62
significantly at a 95% level of confidence, yielding a stronger PTA/SRT correlation when list
A is used.
The use of lists A and C results in a much smaller mean difference between PTA and SRT,
compared to the use of list B, which resulted in much larger mean differences and more
variation between PTA and SRT, according to various factors, such as age, subjective
language proficiency, education or occupation.
The errors that were made on repetition of words were significant. More errors were made
with list B. The number and nature of errors indicate a stark unfamiliarity with many of the
words contained in list B particularly.
The inter-ear differences between the right and left ears were significant for lists B and C, but
the use of list A resulted in improved inter-ear reliability. The use of list A may be considered
to result in improved within-participant reliability than the use of lists B or C.
There were no significant intergroup differences. This indicates that the sample was
homogenous in terms of performance, despite the variations in age, gender, first language
use, education and language proficiency.
Therefore the null hypothesis - that no statistically significant difference between the results
obtained for PTA/SRT correlation with the use of the SAS wordlist or the CID W-1 wordlist,
at a .05 level of statistical significance – was found to be disproved as there is a statistically
significant difference in PTA/SRT correlation.
The alternative hypothesis – that a statistically significant difference was found between the
results obtained for PTA/SRT correlation with the use of the SAS wordlist and the CID W-1
wordlist, at a 0.05 level of statistical significance – is proven correct.
This chapter presented the results obtained and the discussion thereof. The conclusions and
limitations of the study will be presented in the following chapter:

63
5 Chapter 5: Conclusions, limitations and recommendations
In this chapter, the conclusions, limitations and recommendations are presented subsequent to
the results as described in Chapter 4.
5.1 Conclusions
The spondaic words, which have been determined as the more familiar words to the South
African population who use English as one of their multiple languages, were compiled to
form a spondaic wordlist specific to South Africa (Durrant, 2006), the SAS wordlist. The
main aim of this study was to compare the PTA/SRT correlation when using the SAS
wordlist and the CID W-1, for measuring SRT in a group of South African English second
language participants.
The null hypothesis is rejected in favour of the alternative hypothesis. The alternative
hypothesis is as follows: The use of the SAS wordlist does yield a statistically significantly
stronger PTA/SRT correlation than the use of the CID W-1 when measuring SRT in the
South African population with normal hearing or a minimal hearing loss <26 dBHL, who use
English as a second language.
The use of the SAS wordlist may be employed tentatively when performing SRT testing as
part of the speech audiometry battery on a South African ESL speaker with normal hearing,
or minimal hearing loss <26 dBHL, within the understanding that the wordlist has not been
standardized at a national level.
Considering that the home language of the majority of audiology professionals in South
Africa is either English or Afrikaans (Swanepoel, 2006), whereas most South Africans speak
an African language as their home language (Uys & Hugo, 1997, as cited in Swanepoel,
2006), the use of an English wordlist, which is familiar to the South African population who
use English as a second language indicates a potential solution to the predicament faced when

64
testing the speech recognition thresholds (SRT) of English second language (ESL) speakers,
due to the implications of multilingualism on speech audiometry results (Von Hapsburg &
Pena, 2002).
Although this is not an ideal solution to the predicament that audiologists face when
conducting speech audiometry in South Africa, in light of limited resources and the complex
linguistic context of the country at present, this may be considered a reasonable solution
which will yield more reliable results than using the lists which are currently used.
5.2 Limitations of the study
The limitations of the study include the exclusive use of participants with normal hearing or
minimal hearing loss <26 dBHL, as participants with different degrees of hearing loss were
not included in the study.
The participants were sampled from the province of Gauteng only, and the results of the
study may not be applicable to other provinces within South Africa.
The use of 5 dB increments was employed for the purpose of SRT determination. The use of
5 dB increments was preferred over the use of 1 dB or 2 dB increments, as this is more
clinically relevant. The use of 1 to 2 dB increments may result in more accurate PTA/SRT
correlations due to more specific SRT measurements, although it is not necessarily clinically
relevant.
The quality of recording was unfortunately substandard, resulting in mean differences
between PTA and SRT that are disproportionate for each of the wordlists, but the mean
differences were equal for each list, and this was accounted for in the statistical analysis.
According to Di Berardino et al. (2010), the sensitivity of the VU meter should be adjusted
according to the speech material levels prior to testing, in order to compensate for any
differences. This was not identified prior to data collection.

65
Lastly, the length of the SAS wordlist may be considered to be a limitation, due to the
relatively short length of the SAS wordlist (19 words) in comparison to the recommended
length of the CID W-1 (36 words) (Hirsh et al., 1952).
5.3 Recommendations for further research
Future studies should include participants with hearing loss of various types, degrees and
configurations, to allow for clinically relevant application of the results to include the
population with hearing loss. In addition, this allows for interpretation of results to include
factors such as type, degree and configuration of hearing loss (Martin & Clark, 2003).
Further studies should include participants from different regions of South Africa. The SAS
wordlist should be tested on a national basis, as current participants resided in one province
only, namely Gauteng. Due to the broad differences in population and language use across
South Africa, this would be valuable information (Statistics South Africa, 2012). This would
allow for more accurate generalisation of the results for use within South Africa
Future studies may use 1 dB or 2 dB steps for the purposes of determining SRT, as this
allows for more precise information and correlation to be gleaned (Brandy, 2002).
In future testing, an improved quality of recording would be strongly recommended, and
should an improved quality of recording be utilized, an equally proportioned improvement in
PTA/SRT correlation would be expected for each of the wordlists. Additionally, the
sensitivity of the VU meter would be adjusted, and specified accordingly (Di Berardino et al.,
2010).
Furthermore, the evaluation of each of the spondaic words in the SAS wordlist should be
conducted in terms of homogeneity of audibility, using a performance-intensity, or
articulation gain curve, which gives information about the precision with which threshold can
be obtained (Brandy, 2002).

66
The SRT obtained using the SAS wordlist should be compared with the SRT obtained when
using a digit wordlist when testing ESL speakers in South Africa (Ramkissoon et al., 2002).
5.4 Summary
In this chapter, conclusions were made about the use of the SAS wordlist. The limitations
were discussed and suggestions made for further research.

67
6 References
Alexander, N. (2000). English unassailable but unattainable. The dilemmas of South African
language policy in education. Cape Town: PRAESA.
American Speech-Language-Hearing Association (1988). Determining Threshold Level for
Speech [Guidelines]. Available from www.asha.org/policy
American Speech-Language-Hearing Association (2005). Guidelines for Manual Pure-Tone
Threshold Audiometry [Guidelines]. Available from www.asha.org/policy
Avula, H. (2013). Periodontal research: Basics and beyond – Part II (ethical issues, sampling,
outcome measures and bias). Journal of Indian Society of Periodontology, 17, 571-
576.
Babbie, E. & Mouton, J. (2001). The practice of social research: South African edition. Cape
Town: Oxford University Press Southern Africa.
Bellis, T. J. (2003). Assessment and Management of Central Auditory Processing Disorders
in the Educational Setting: From Science to Practice. New York: Delmar Learning.
Butler, Y. G. & Hakuta, K. (2008). Bilingualism and Second Language Acquisition. In T. K.
Bhatia & W. C. Ritchie (Eds.), The Handbook of Bilingualism (pp. 114-145). Oxford:
Blackwell Publishing.
Boersma, P. & Weenink, D. (2013). Praat: doing phonetics by computer (Version 5.1. 05)
[Computer program]. Online: http://www.praat.org.
Braisby, N. & Gellatly, A. (2012). Cognitive Psychology. Oxford: Oxford University Press.
Brandy, W. T. (2002). Speech Audiometry. In J. Katz (Ed.), Handbook of Clinical Audiology
(pp. 96-110). Philadelphia: Lippincott Williams and Wilkins.
Coyne, I. (2010). Research with Children and Young People: The Issue of Parental (Proxy)
Consent. Children & Society, 24(3), 311-324.

68
De Klerk, V. A. (1999). Black South African English: Where to from here? World Englishes,
18(3), 311-324.
De Wet, C. (2002). Factors influencing the choice of English as language of learning and
teaching (LoLT) — a South African perspective. South African Journal of Education,
22(2), 119-124.
Deumert, A. (2010). Tracking the demographics of (urban) language shift – an analysis of
South African census data. Journal of Multilingual and Multicultural Development,
31 (1), 13-35.
Di Berardino, F., Tognola, G., Paglialonga, A., Alpini, D., Grandori, F. & Cesarani, A.
(2010). Influence of compact disk recording protocols on reliability and comparability
of speech audiometry outcomes: acoustic analysis. The Journal of Laryngology &
Otology, 124, 859-863.
Dietrich, J. (1999). A comparison of speech recognition scores between Afrikaans and
English in native Afrikaans speakers from the Coloured community of the Western
Cape utilizing the Afrikaans Foneties Gebalanseerde Woordelyste and the Central
Institute of the Deaf CID W22 phonetically balanced wordlists. Unpublished B.Sc.
Logopaedics Dissertation, University of Cape Town.
Durrant. T. H. (2006). The development of a familiar spondaic wordlist for the South African
population who use English as one of their multiple languages. Unpublished 4th year
research report submitted in partial fulfilment of the requirements for the degree: BA
(Sp&H.Th) Department of Speech Pathology and Audiology, School of Human and
Community Development, Faculty of Humanities, University of the Witwatersrand.
Egan, J. P. (1948). Articulation testing methods. The Laryngoscope, 58, 3-31.
Evans, P. (1997). Speech Audiometry for Differential Diagnosis. In M. Martin (Ed.), Speech
Audiometry (pp. 131-149). London: Whurr Publishers.
Gelfand, S. A. (2009). Essentials of Audiology. New York: Thieme Medical Publishers.
Gerber, H. Statistical Consulting Services. Personal consultation. [email protected]

69
Harrell, R. W. (2002). Puretone Evaluation. In J. Katz (Ed.), Handbook of Clinical Audiology
(pp. 71-87). Philadelphia: Lippincott Williams and Wilkins.
Hirsh, I. J., Davis, H. D., Silverman, S. R., Reynolds, E. G., Eldert, E. & Benson, R. W.
(1952). Development of Materials for Speech Audiometry. Journal of Speech and
Hearing Disorders, 17(3), 321-327.
Howell, D. C. (2009). Statistical methods for psychology. (7th Ed.). Duxberry Press.
Hudgins, C.V., Hawkins, J.E., Karlin, J.E. & Stevens, S. S. (1947). The development of
recorded auditory tests for measuring hearing loss for speech. The Laryngoscope, 57, 57–89.
Kaabwe, E. (2003). Gender Issues in Education and Management. In J. Lumby, D.
Middlewood & E. Kaabwe (Eds.), Managing Human Resources in South African
Schools (201-220). South Africa: Commonwealth Secretariat.
Kamwangamalu, N. (1998) Identities of English and code-switching in post-apartheid South
Africa. Multilingua, 17(2/3), 277-296.
Khoza, K., Ramma, L., Mophosho, M. & Moroka, D. (2008). Digit Speech Reception
Threshold testing in Tswana/English speakers. In The South African Journal of
Communication Disorders, 55, 20-27.
Martin, F. N. & Clark, J. G. (2003). Introduction to Audiology. (8th Ed.). Boston: Allyn and
Bacon.
McArdle, R. & Hnath-Chisolm, T. (2009). Speech Audiometry. In J. Katz, L. Medwetsky, R.
Burkard & L. Hood (Eds.), Handbook of Clinical Audiology (pp. 64-79). Philadelphia:
Lippincott Williams and Wilkins.
Minow, V. (2010). Variation in the Grammar of Black South African English. Frankfurt:
Peter Lang.
Mouton, J. (2001). How to succeed in your master’s and doctoral studies: a South African
guide and research book. Pretoria: Van Schaik, 239-244.

70
Nissen, S. L., Harris, R. W., Jennings, L. J., Eggett, D. L. & Buck, H. (2005).
Psychometrically equivalent trisyllabic words for speech reception threshold testing in
Mandarin. International Journal of Audiology, 44, 391-399.
Panday, S. (2009). The homogeneity of audibility and prosody of Zulu words for speech
reception threshold (SRT) testing. South African Journal of Communication
Disorders, 56, 60-75.
Penn, C., Frankel, T., Watermeyer, J. & Müller, M. (2009). Informed consent and aphasia:
Evidence of pitfalls in the process. Aphasiology, 23(1), 3-32.
Pichora-Fuller, M. K. & Souza, P. E. (2003). Effects of aging on auditory processing of
speech. International Journal of Audiology, 42, 2811-2816.
Pillay, R. (2009). Work satisfaction of professional nurses in South Africa: a comparative
analysis of the public and private sectors. Human Resources for Health, 7(15).
Postma, A. (2000). Detection of errors during speech production. Cognition, 7, 97-131.
Ramkissoon, I. (2001). SRTs for multilingual populations. Communication Disorders
Quarterly, 22(3), 158-162.
Ramkissoon, I., Proctor, A., Lansing, C. R. & Bilger, R. C. (2002). Digit SRT for non-native
speakers of English. American Journal of Audiology, 11(1), 23-29.
Ramkissoon, I. & Khan, F. (2003, February 18). Serving Multilingual Clients with Hearing
Loss: How Linguistic Diversity Affects Audiologic Management. The ASHA Leader.
Roeser, R. J., Valente, M., & Hosford-Dunn, H. (2000). Audiology: Diagnosis. USA: Thieme
Medical Publishers.
Roets, R. (2005). Spraakaudiometrie in Suid-Afrika: Kriterium versus praktyk. Unpublished
master’s thesis. University of Pretoria.
Schiavetti, N. & Metz, D. E. (2006). Evaluating Research in Communication Disorders. (5th
Ed.). Boston: Allyn and Bacon.

71
Schlauch, R.S. & Nelson, P. (2009). Puretone Evaluation. In J. Katz, L. Medwetsky, R.
Burkard & L. Hood (Eds.), Handbook of Clinical Audiology (pp. 30-49). Philadelphia:
Lippincott Williams and Wilkins.
Schreuder, H. T., Gregoire, T. G. & Weyer, J. P. (2001). For what applications can
probability and non-probability sampling be used? Environmental Monitoring and
Assessment, 66, 281–291.
Silman, S. & Silverman, C.A. (1991). Auditory diagnosis: Principles and Applications. San
Diego: Academic Press.
Song, Y. & Fox, R. (2008). Using PDA for undergraduate student incidental vocabulary
testing. ReCALL, 20(3), 290-314.
Sreedhar, J. S., Venkatesh, L., Nagaraja, M. N. & Srinivasan, P. (2011). Development and
Evaluation of Paired Words for Testing of Speech Recognition Threshold in Telugu:
A Preliminary Report. Journal of Indian Speech Language & Hearing Association,
25(2), 128-136.
Statistics South Africa (Stats SA), (2012). Census, 2011 Census in brief / Statistics South
Africa. Published by Statistics South Africa, Pretoria. Report no.: 03-01-41
Swanepoel, D. (2006). Audiology in South Africa. International Journal of Audiology, 45,
262-266.
Tansey, O. (2007). Process Tracing and Elite Interviewing: A Case for Non-probability
Sampling. Political Science and Politics, 40(4).
Van Teijlingen, E.R. & Hundley, V. (2001). The importance of pilot studies. Social research
update, 35. Guildford: Department of Sociology, University of Surrey. Retrieved from
http://sru.soc.surrey.ac.uk/SRU35
Verhoef, M. (1998) In pursuit of multilingualism in South Africa. Multilingua, 17 (2/3), 181-
196.
Von Hapsburg, D. & Pena, E. D. (2002). Understanding bilingualism and its impact on
speech audiometry. Journal of Speech, Language, and Hearing Research, 45(1), 202-
214.

72
Wade, R. (1995) A new English for a new South Africa: restandardisation of South African
English. South African Journal of Linguistics Supplement, 27, 189-202.

I
Appendix A – Ethical clearance form

II
Appendix B - Participation information letter

III

IV
Appendix C - Informed consent form

V
Appendix D – Permission from the hospital

VI
Appendix E – Case history interview questions
Patient initials / number
First language
Second language
Age of first exposure to English
Highest level of education
Occupation
Own rating of English
Male / female
Age
Subjective hearing concerns?
INITI
ALS
EAR PTA
SRT
(SA) LIST
SRT
(CID-W1) LIST
TYMP
(A/B/C)
1ST
LG
2ND
LG
AGE OF
FIRST
EXPOSURE
TO ENG EDUCATION JOB
RATE
OWN ENG
M/
F
AGE
Right
Left
Right
Left
Right
Left
Right
Left
Right
Left

VII
Appendix F – Proof of submitting an article to a journal
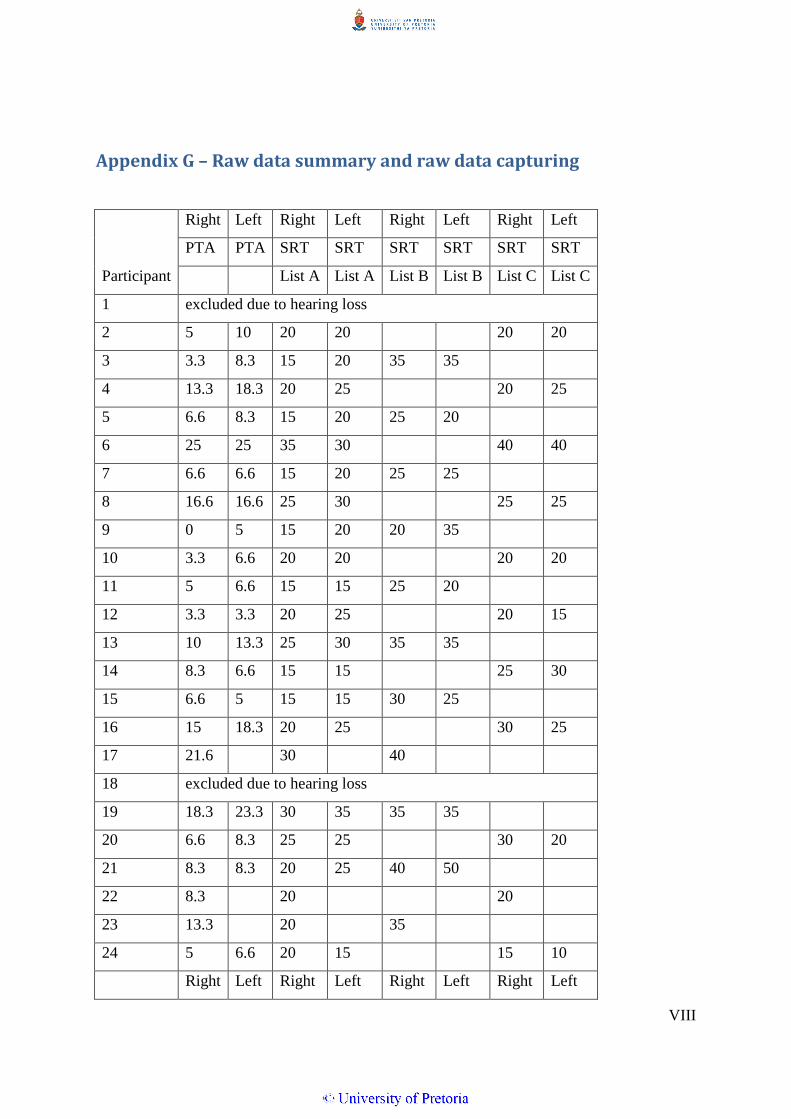
VIII
Appendix G – Raw data summary and raw data capturing
Right Left Right Left Right Left Right Left
PTA PTA SRT SRT SRT SRT SRT SRT
Participant List A List A List B List B List C List C
1 excluded due to hearing loss
2 5 10 20 20 20 20
3 3.3 8.3 15 20 35 35
4 13.3 18.3 20 25 20 25
5 6.6 8.3 15 20 25 20
6 25 25 35 30 40 40
7 6.6 6.6 15 20 25 25
8 16.6 16.6 25 30 25 25
9 0 5 15 20 20 35
10 3.3 6.6 20 20 20 20
11 5 6.6 15 15 25 20
12 3.3 3.3 20 25 20 15
13 10 13.3 25 30 35 35
14 8.3 6.6 15 15 25 30
15 6.6 5 15 15 30 25
16 15 18.3 20 25 30 25
17 21.6 30 40
18 excluded due to hearing loss
19 18.3 23.3 30 35 35 35
20 6.6 8.3 25 25 30 20
21 8.3 8.3 20 25 40 50
22 8.3 20 20
23 13.3 20 35
24 5 6.6 20 15 15 10
Right Left Right Left Right Left Right Left

IX
PTA PTA SRT SRT SRT SRT SRT SRT
Participant List A List A List B List B List C List C
25 1.6 3.3 10 15 25 25
26 5 8.3 20 25 15 25
27 5 8.3 20 25 25 20
28 10 8.3 20 20 35 25
29 8.3 6.6 20 10 35 25
30 6.6 10 20 15 25 20
31 8.3 11.6 20 20 20 25
32 3.3 5 15 15 10 15
33 3.3 1.6 20 20 30 30
34 10 8.3 25 30 25 20
35 25 25 30 30 40 35
36 5 6.6 15 20 20 20
37 6.6 11.6 15 15 30 30
38 10 10 15 20 30 25
39 11.6 8.3 20 30 40 40
40 5 8.3 15 20 20 15
41 8.3 1.6 15 10 30 25
42 10 8.3 25 25 25 20
43 8.3 6.6 20 15 25 20
44 1.6 13.3 15 20 15 20
45 8.3 8.3 20 20 20 20
46 excluded due to hearing loss
47 13.3 16.6 25 20 40 35
48 8.3 10 25 20 25 25
49 21.6 20 25
50 11.6 10 20 20 20 20
51 5 5 20 20 25 20
Right Left Right Left Right Left Right Left

X
PTA PTA SRT SRT SRT SRT SRT SRT
Participant List A List A List B List B List C List C
52 20 16.6 35 25 30 20
53 -1.6 1.6 15 15 30 30
54 15 11.6 25 30 35 30
55 0 5 20 20 30 35
56 5 5 25 20 25 15
57 1.6 5 15 20 35 35
58 10 10 15 20 20 20 20
59 0 0 20 20 20 25
60 13.3 10 20 20 25 20
61 10 10 25 25 35 40
62 3.3 6.6 15 20 25 25
63 10 15 20 20 25 25
64 6.6 3.3 25 20 20 15
65 1.6 3.3 15 15 25 25
66 8.3 11.6 25 30 30 30
67 3.3 16.6 15 30 30 30
68 5 3.3 15 20 25 20
69 5 5 10 10 25 20
70 20 10 30 25 25 25
71 3.3 16.6 20 20 30 35
72 1.6 8.3 15 15 15 20
73 10 10 25 25 30 30
74 6.6 8.3 15 25 20 20
75 10 11.6 15 20 35 35
76 8.3 13.3 20 30 20 30
77 13.3 20 20 20 35 35
78 6.6 8.3 15 20 20 20
Right Left Right Left Right Left Right Left

XI
PTA PTA SRT SRT SRT SRT SRT SRT
Participant List A List A List B List B List C List C
79 8.3 6.6 20 20 30 30
80 1.6 6.6 15 15 15 20
81 5 5 15 20 30 25
82 6.6 5 15 15 20 25
83 11.6 10 15 20 30 35
84 15 6.6 25 15 25 15
85 6.6 13.3 25 25 40 40
86 1.6 11.6 25 25 25 25
87 5 5 15 15 25 25
88 13.3 16.6 25 25 25 25
89 3.3 5 20 20 35 35
90 8.3 8.3 10 15 25 30
91 0 3.3 15 15 25 25
92 3.3 3.3 15 20 25 30
93 6.6 5 15 15 25 30
94 11.6 25 25
95 10 11.6 25 25 30 30
96 8.3 8.3 20 20 30 30
97 6.6 8.3 15 20 20 20
98 18.3 20 30 30 25 30
99 3.3 1.3 20 25 30 30
100 3.3 1.3 15 15 20 20
101 8.3 11.6 15 20 45 40
102 3.3 6.6 20 25 35 35
103 3.3 3.3 25 25 20 25
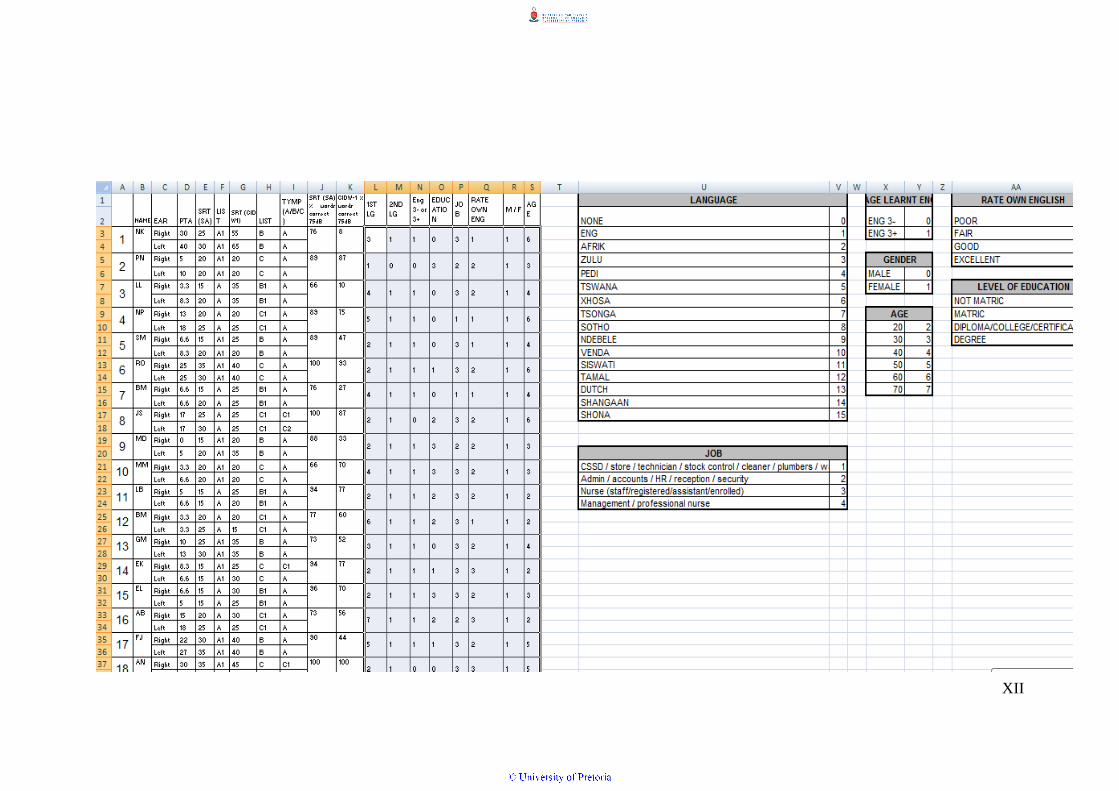
XII

XIII