Embed Size (px)
Citation preview
S.V. RajGlenn Research Center, Cleveland, Ohio
Comparison of the Thermal Expansion Behavior of Several Intermetallic Silicide Alloys Between 293 and 1523 K
NASA/TM—2014-216678
May 2014
https://ntrs.nasa.gov/search.jsp?R=20140008660 2020-03-29T02:03:03+00:00Z
������������ ��������������
�������������������������������������������������������� ����������������������������������������������������������������������� ���������!���� ����"����#�"��������������������� �������������� ���������
���������������� �������������������������������������"�$�������� �����%����������������������&�������������������������������� �����������'����������������������� ����������������������������������������������(����������������������������������������������������)��������������������������������������������������������������������������������������������*����)�����������������������������+�������������������"����������������������)�����������*���������������������*���������"���, .� �:$;��$�<��=><�$���%���)�������
� ����������������� �?������������������ ������������������������������������������ ���������������@����������������������������"��������������� ���������������������������������������������������������� �������� ������������������������������������������������������+����*���� ������������������������������������������� ���������� ���������������������@��������������������������
.� �:$;��$�<�D:D%)��(=D������������
���������������������������������� ���"�� ����������&������������������F���#�������� ������*#���������������������������������������� ��� �������������(��������������@������������"����
.� $%��)�$�%)�):�%)�����������������
�������������������"�����+������� ��������������������
.� $%�G:):�$:��=><�$���%���$��������������� �������������������������������������" �������� ����������� �������������������������"������
.� ��:$��<��=><�$���%��������������
������������������������ ������ � �������� ����?���������� ���������������������*�������?���������������������������������������
.� �:$;��$�<��)���<���%���:������+
���������������������������������������������������� ����������������������'�� ������
��������&����������������������������������� ����������������������� �&������������������&���������������������������������
G� ����� �������������������������� �������������*���,
.� ����������������������� �� ����������http://www.sti.nasa.gov
.� :+ ����"��F���������[email protected] .� G�@�"��F����������������������
��� �����(��#����HHJLOPOLPQRJ .� ��������������������� �����(��#���� HHJLOPOLPQRU .� V�����,
������������������ �����(��# �����$������������������ ���������������OWWP���������(��������������;������D(�UWROXLWJUR
S.V. RajGlenn Research Center, Cleveland, Ohio
Comparison of the Thermal Expansion Behavior of Several Intermetallic Silicide Alloys Between 293 and 1523 K
NASA/TM—2014-216678
May 2014
����������������������������� ���������
Y�����)�������$���� $����������%���HHWJP
Acknowledgments
�������������#�����������D������������&��������������������� ����@������� ����� ������������������*������������"���������������� �����'���)D(����������G������� ����������������������"���#�*��������
�����������
�����$������������������ ����OWWP���������(���;������D(�UWROXLWJUR
��������������������� �����������PJRW����*����)��
���@�������Z��UUJWU
���������������������"��������,[[***������������
������� ����������� �#���������������������������������������"��������������������������������������������� ������������@��������� ��������"���������������������������
�������� ����������
Level of Review,������ ��������������������������"�����*����"����������� ����� �����
NASA/TM—2014-216678 1
Comparison of the Thermal Expansion Behavior of Several Intermetallic Silicide Alloys Between 293 and 1523 K
S.V. Raj
National Aeronautics and Space Administration Glenn Research Center Cleveland, Ohio 44135
Abstract Thermal expansion measurements were conducted on hot-pressed CrSi2, TiSi2, WSi2 and a two-phase
Cr-Mo-Si intermetallic alloy between 293 and 1523 K during three heat-cool cycles. The corrected thermal expansion, (�L/L0)thermal, varied with the absolute temperature, T, as (�L/L0)thermal = A(T-293)3 + B(T-293)2 + C(T-293) + D, where A, B, C and D are regression constants. Excellent reproducibility was observed for most of the materials after the first heat-up cycle. In some cases, the data from the first heat-up cycle deviated from those determined in the subsequent cycles. This deviation was attributed to the presence of residual stresses developed during processing, which are relieved after the first heat-up cycle.
1.0 Introduction Intermetallic silicides have found applications as ohmic contacts in the semiconductor industry
[1,2,3,4,5], thermoelectric materials [6], heating elements [7,8], protective coatings [9] and they have been proposed for structural applications [10]. A knowledge of the thermal expansion behavior of these silicides is important in these applications in order to reduce or eliminate thermal stresses between the intermetallic silicide and the substrate. Although a compilation of the thermal expansion data on many intermetallic silicides is available [11], the data are fairly old and it is unclear whether they were influenced by impurities and processing methods. Verkhorobin and Matyushenko [12] reported limited data on the coefficients of thermal expansion (CTE) of CrSi2, MoSi2, NbSi2, TaSi2 and VSi2 determined from x-ray data. A more complete thermal expansion data on transition metal silicides also determined by x-ray diffraction (XRD) have been reported by Engström and Lönnberg [13]. In contrast, there are only limited thermal expansion data on hot-pressed silicides generated by dilatometric measurements.
The present investigation was undertaken to determine and compare the thermal expansion behavior of hot-pressed CrSi2, TiSi2, WSi2 and a two-phase Cr-Mo-Si intermetallic alloy between 293 and 1523 K by dilatometric measurements.
2.0 Experimental Procedures Commercially produced powders (–325 mesh) of CrSi2, TiSi2, WSi2 and a Cr-30(at.%)Mo-30%Si1
alloy were hot-pressed into 25.4 mm long and 9.5 mm in diameter cylindrical specimens at temperatures between 1183 and 1623 K under a pressure 69 to 90 MPa for 0.25 to 4 h under pure argon. The Cr-30%Mo-30%Si alloy was procured from ATI Powder Metals, Pittsburgh, Pennsylvania, as gas atomized powder. Three CrSi2 specimens were fabricated in separate hot-press runs (582, 619 and 620) in order to evaluate the effect of batch-to-batch variabilities on the thermal expansion data. The two faces of hot-pressed specimens were machined to ensure that they were flat and parallel. The thermal expansion measurements were conducted using a NETZSCH Dilatometer Model DIL 402C2 equipped with a high purity alumina as a calibration standard. Measurements were made over three heat-cool cycles to (a)
1 All compositions are reported in at.% in this paper. 2 Trademark of NETZSCH Instruments, North America, LLC, MA.
NASA/TM—2014-216678 2
minimize the effects of compositional, microstructural and processing variables on the data, (b) determine the extent of scatter in the data, and (c) to evaluate a statistical average of the coefficients for the regression curve. The specimen was placed in a sample holder and aligned with a single push-rod with an applied constant load of 0.2 N. The specimens were heated from 293 to 1523 K at 10 K/min. in the first cycle and cooled to 373 K at 10 K/min. in the first cool-down cycle. Subsequent cycles consisted of heating and cooling between 373 and 1523 K. All measurements were conducted in a He atmosphere flowing at 60 cc/min. The length changes were recorded by a computerized data acquisition system. The experimental strain, �L/L0, where �L is the differential change in length, L-L0, and L0 is the original length of the specimen at room temperature, were measured.
3.0 Results and Discussion 3.1 Microstructures
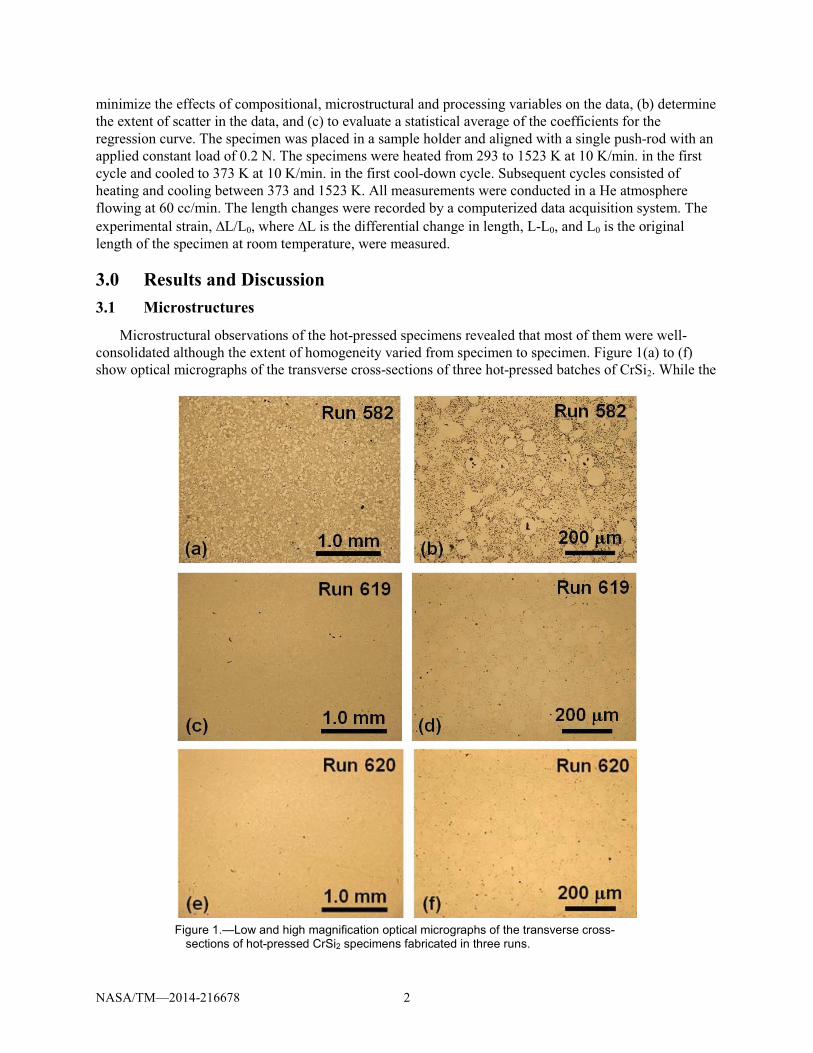
Microstructural observations of the hot-pressed specimens revealed that most of them were well-consolidated although the extent of homogeneity varied from specimen to specimen. Figure 1(a) to (f) show optical micrographs of the transverse cross-sections of three hot-pressed batches of CrSi2. While the
Figure 1.—Low and high magnification optical micrographs of the transverse cross-
sections of hot-pressed CrSi2 specimens fabricated in three runs.
NASA/TM—2014-216678 3
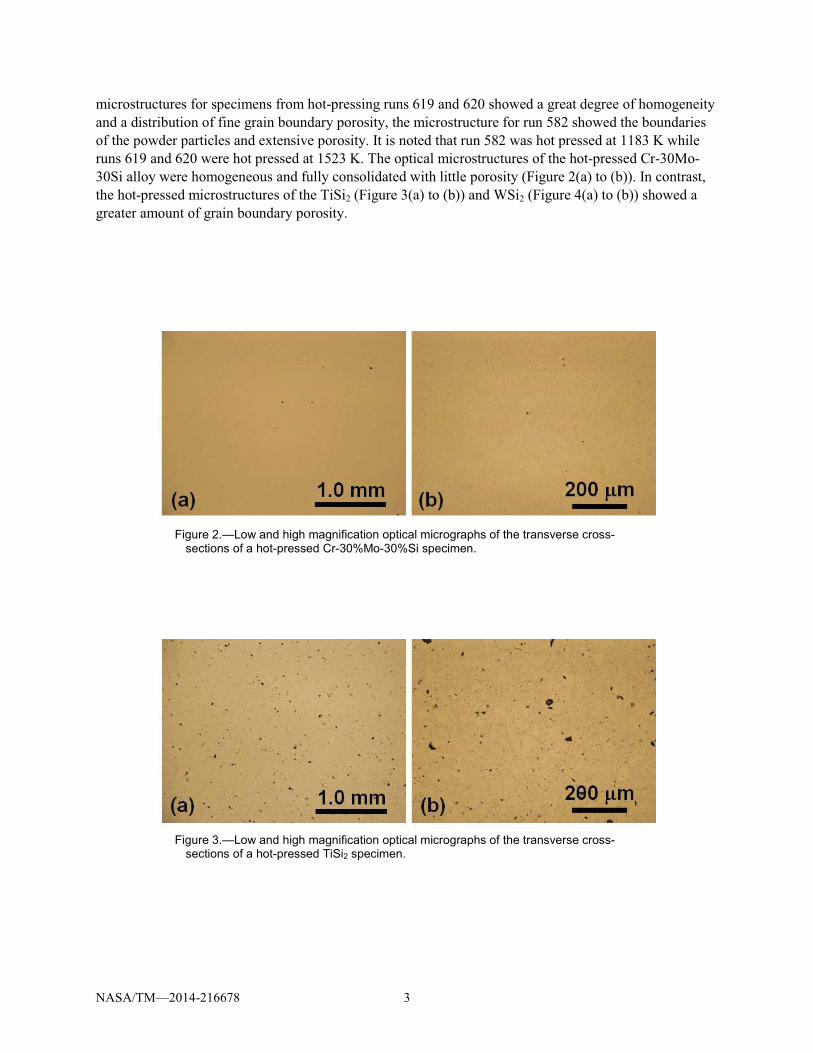
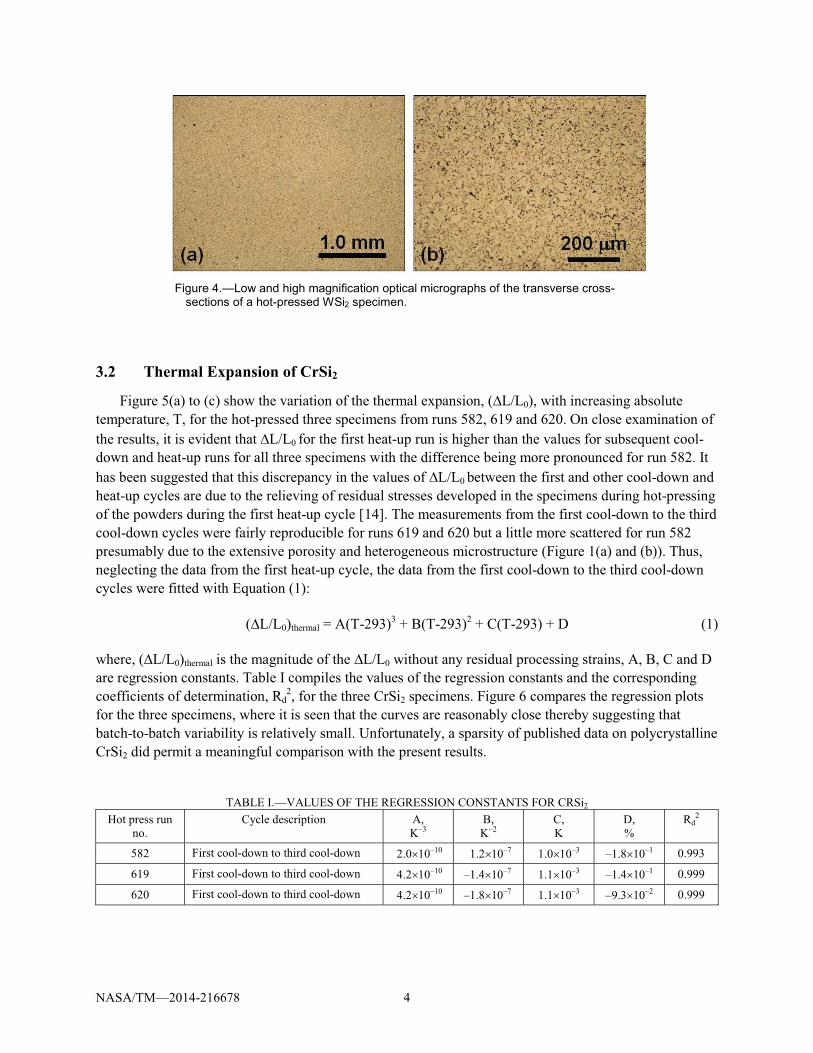
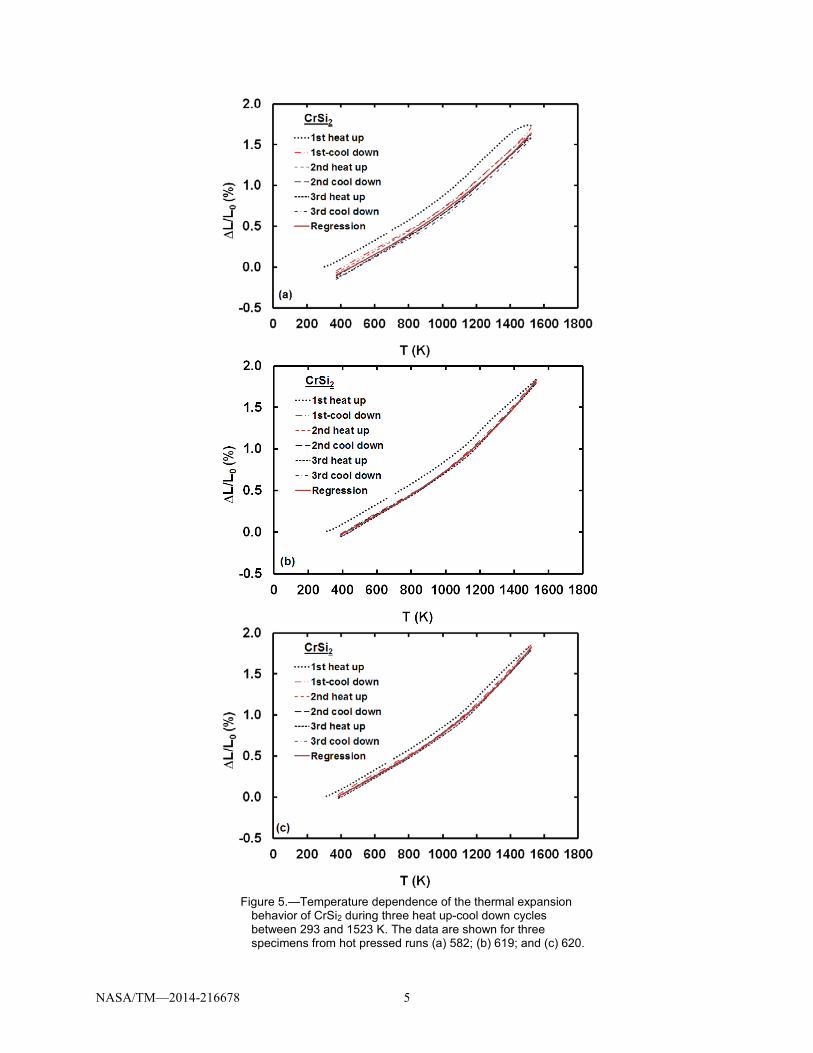
microstructures for specimens from hot-pressing runs 619 and 620 showed a great degree of homogeneity and a distribution of fine grain boundary porosity, the microstructure for run 582 showed the boundaries of the powder particles and extensive porosity. It is noted that run 582 was hot pressed at 1183 K while runs 619 and 620 were hot pressed at 1523 K. The optical microstructures of the hot-pressed Cr-30Mo-30Si alloy were homogeneous and fully consolidated with little porosity (Figure 2(a) to (b)). In contrast, the hot-pressed microstructures of the TiSi2 (Figure 3(a) to (b)) and WSi2 (Figure 4(a) to (b)) showed a greater amount of grain boundary porosity.
Figure 2.—Low and high magnification optical micrographs of the transverse cross-
sections of a hot-pressed Cr-30%Mo-30%Si specimen.
Figure 3.—Low and high magnification optical micrographs of the transverse cross-
sections of a hot-pressed TiSi2 specimen.
NASA/TM—2014-216678 4
Figure 4.—Low and high magnification optical micrographs of the transverse cross-sections of a hot-pressed WSi2 specimen.
3.2 Thermal Expansion of CrSi2
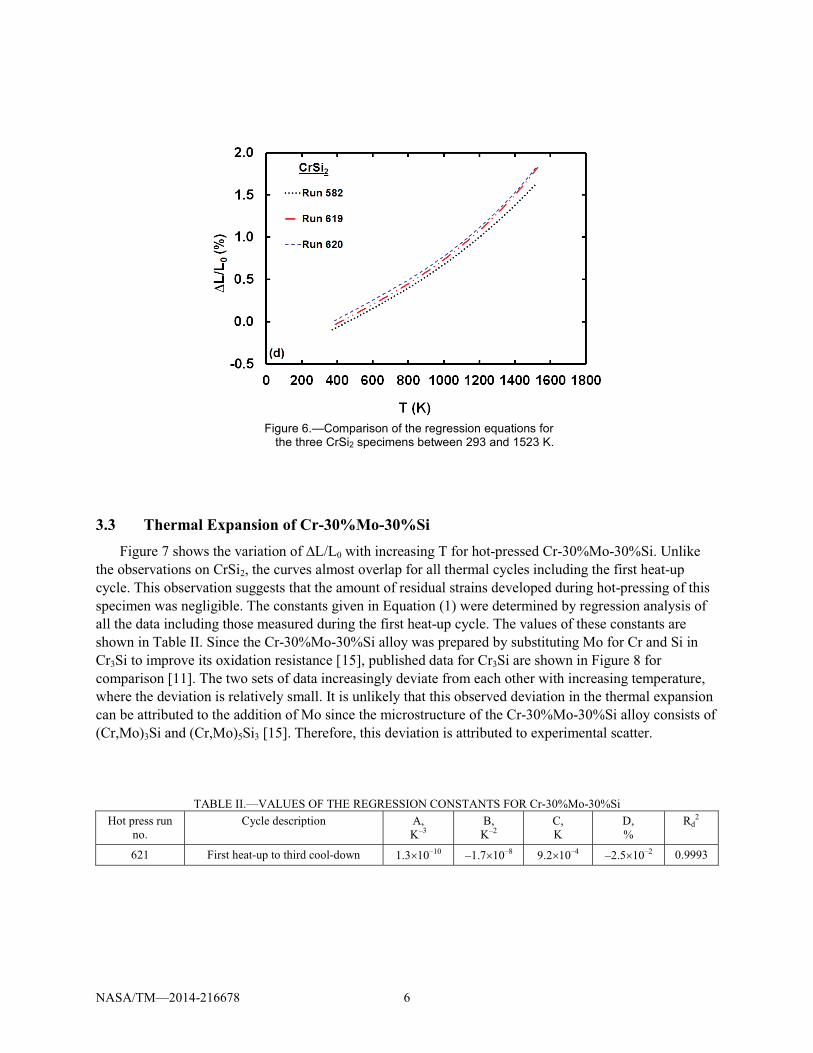
Figure 5(a) to (c) show the variation of the thermal expansion, (�L/L0), with increasing absolute temperature, T, for the hot-pressed three specimens from runs 582, 619 and 620. On close examination of the results, it is evident that �L/L0 for the first heat-up run is higher than the values for subsequent cool-down and heat-up runs for all three specimens with the difference being more pronounced for run 582. It has been suggested that this discrepancy in the values of �L/L0 between the first and other cool-down and heat-up cycles are due to the relieving of residual stresses developed in the specimens during hot-pressing of the powders during the first heat-up cycle [14]. The measurements from the first cool-down to the third cool-down cycles were fairly reproducible for runs 619 and 620 but a little more scattered for run 582 presumably due to the extensive porosity and heterogeneous microstructure (Figure 1(a) and (b)). Thus, neglecting the data from the first heat-up cycle, the data from the first cool-down to the third cool-down cycles were fitted with Equation (1):
(�L/L0)thermal = A(T-293)3 + B(T-293)2 + C(T-293) + D (1)
where, (�L/L0)thermal is the magnitude of the �L/L0 without any residual processing strains, A, B, C and D are regression constants. Table I compiles the values of the regression constants and the corresponding coefficients of determination, Rd
2, for the three CrSi2 specimens. Figure 6 compares the regression plots for the three specimens, where it is seen that the curves are reasonably close thereby suggesting that batch-to-batch variability is relatively small. Unfortunately, a sparsity of published data on polycrystalline CrSi2 did permit a meaningful comparison with the present results.
TABLE I.—VALUES OF THE REGRESSION CONSTANTS FOR CRSi2 Hot press run
no. Cycle description A,
K–3 B, K–2
C, K
D, %
Rd2
582 First cool-down to third cool-down 2.0�10–10 1.2�10–7 1.0�10–3 –1.8�10–1 0.993
619 First cool-down to third cool-down 4.2�10–10 –1.4�10–7 1.1�10–3 –1.4�10–1 0.999
620 First cool-down to third cool-down 4.2�10–10 –1.8�10–7 1.1�10–3 –9.3�10–2 0.999
NASA/TM—2014-216678 5
Figure 5.—Temperature dependence of the thermal expansion behavior of CrSi2 during three heat up-cool down cycles between 293 and 1523 K. The data are shown for three specimens from hot pressed runs (a) 582; (b) 619; and (c) 620.
NASA/TM—2014-216678 6
Figure 6.—Comparison of the regression equations for
the three CrSi2 specimens between 293 and 1523 K.
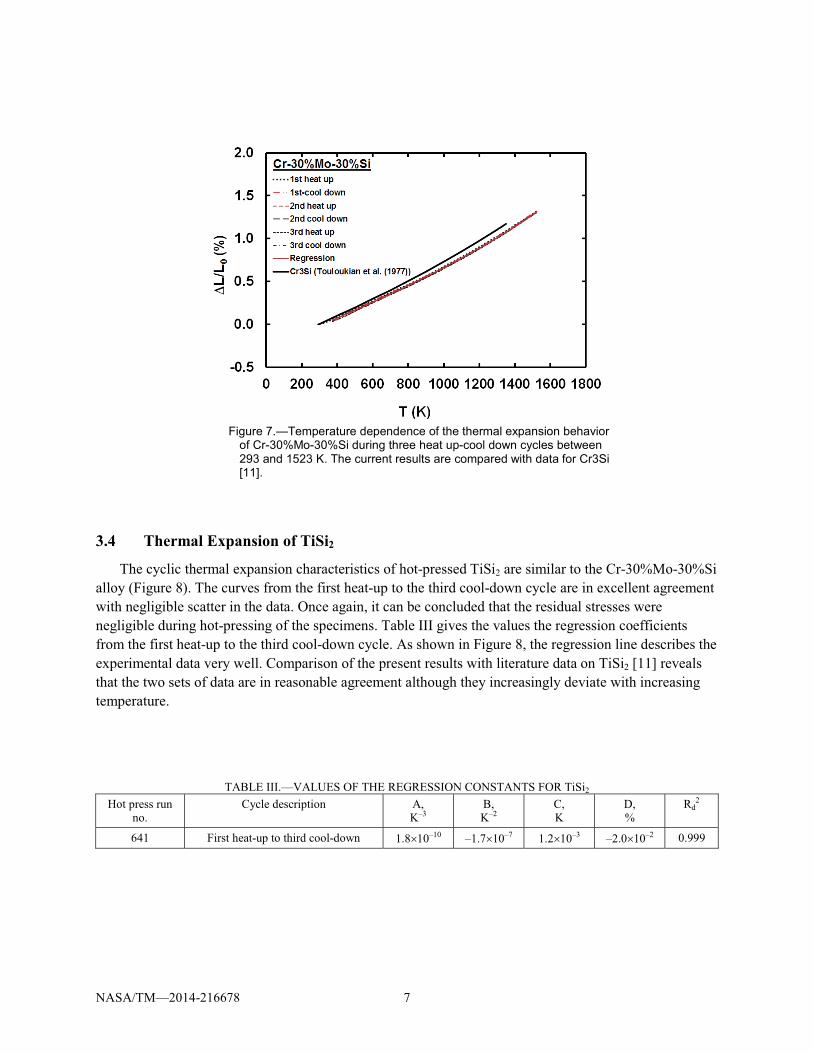
3.3 Thermal Expansion of Cr-30%Mo-30%Si Figure 7 shows the variation of �L/L0 with increasing T for hot-pressed Cr-30%Mo-30%Si. Unlike
the observations on CrSi2, the curves almost overlap for all thermal cycles including the first heat-up cycle. This observation suggests that the amount of residual strains developed during hot-pressing of this specimen was negligible. The constants given in Equation (1) were determined by regression analysis of all the data including those measured during the first heat-up cycle. The values of these constants are shown in Table II. Since the Cr-30%Mo-30%Si alloy was prepared by substituting Mo for Cr and Si in Cr3Si to improve its oxidation resistance [15], published data for Cr3Si are shown in Figure 8 for comparison [11]. The two sets of data increasingly deviate from each other with increasing temperature, where the deviation is relatively small. It is unlikely that this observed deviation in the thermal expansion can be attributed to the addition of Mo since the microstructure of the Cr-30%Mo-30%Si alloy consists of (Cr,Mo)3Si and (Cr,Mo)5Si3 [15]. Therefore, this deviation is attributed to experimental scatter.
TABLE II.—VALUES OF THE REGRESSION CONSTANTS FOR Cr-30%Mo-30%Si Hot press run
no. Cycle description A,
K–3 B, K–2
C, K
D, %
Rd2
621 First heat-up to third cool-down 1.3�10–10 –1.7�10–8 9.2�10–4 –2.5�10–2 0.9993
NASA/TM—2014-216678 7
Figure 7.—Temperature dependence of the thermal expansion behavior
of Cr-30%Mo-30%Si during three heat up-cool down cycles between 293 and 1523 K. The current results are compared with data for Cr3Si [11].
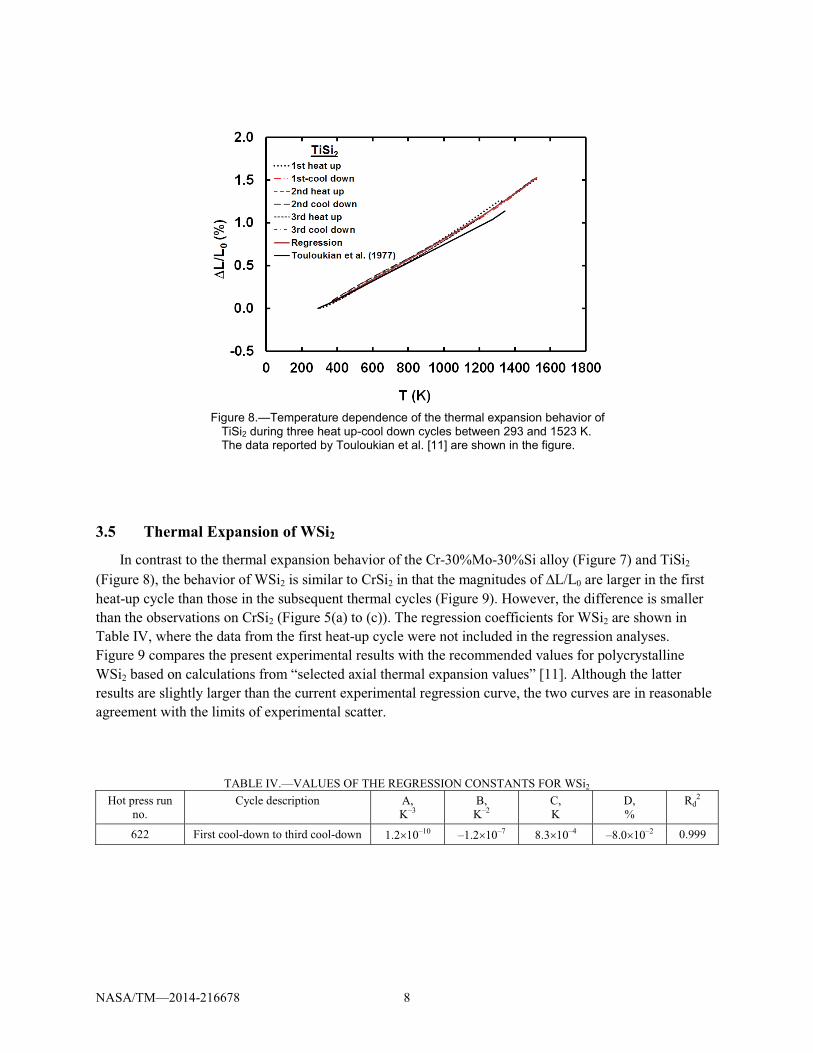
3.4 Thermal Expansion of TiSi2
The cyclic thermal expansion characteristics of hot-pressed TiSi2 are similar to the Cr-30%Mo-30%Si alloy (Figure 8). The curves from the first heat-up to the third cool-down cycle are in excellent agreement with negligible scatter in the data. Once again, it can be concluded that the residual stresses were negligible during hot-pressing of the specimens. Table III gives the values the regression coefficients from the first heat-up to the third cool-down cycle. As shown in Figure 8, the regression line describes the experimental data very well. Comparison of the present results with literature data on TiSi2 [11] reveals that the two sets of data are in reasonable agreement although they increasingly deviate with increasing temperature.
TABLE III.—VALUES OF THE REGRESSION CONSTANTS FOR TiSi2 Hot press run
no. Cycle description A,
K–3 B, K–2
C, K
D, %
Rd2
641 First heat-up to third cool-down 1.8�10–10 –1.7�10–7 1.2�10–3 –2.0�10–2 0.999
NASA/TM—2014-216678 8
Figure 8.—Temperature dependence of the thermal expansion behavior of
TiSi2 during three heat up-cool down cycles between 293 and 1523 K. The data reported by Touloukian et al. [11] are shown in the figure.
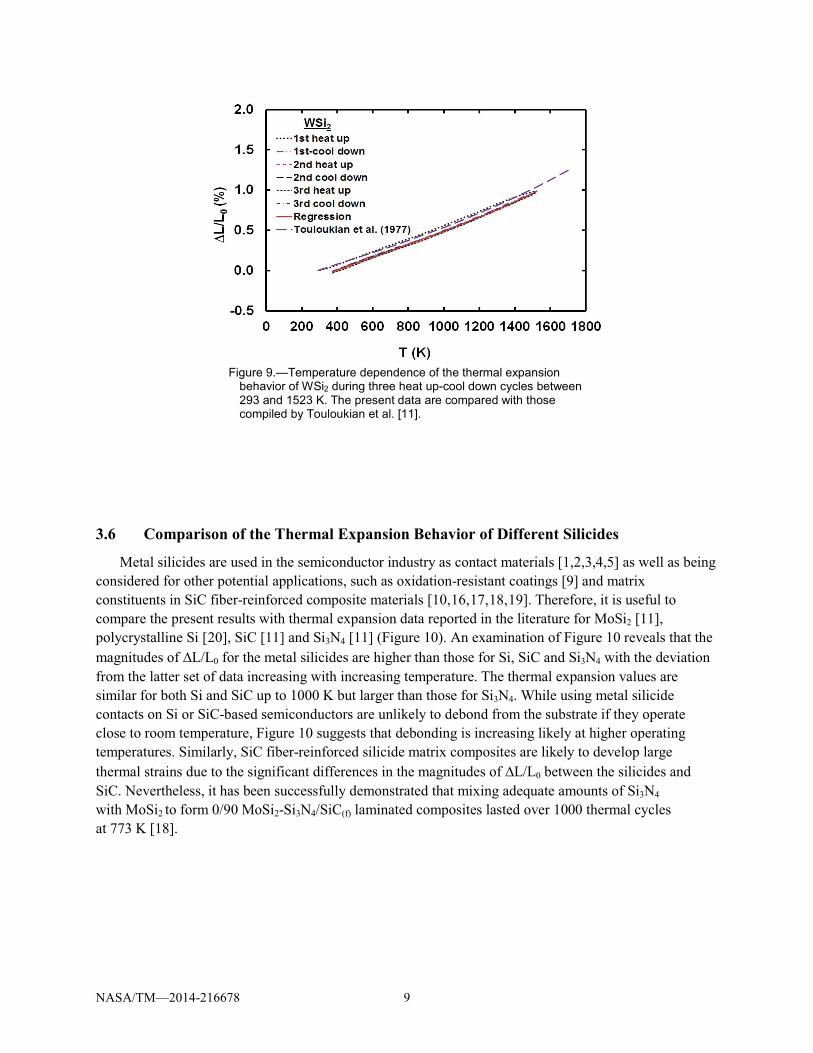
3.5 Thermal Expansion of WSi2
In contrast to the thermal expansion behavior of the Cr-30%Mo-30%Si alloy (Figure 7) and TiSi2 (Figure 8), the behavior of WSi2 is similar to CrSi2 in that the magnitudes of �L/L0 are larger in the first heat-up cycle than those in the subsequent thermal cycles (Figure 9). However, the difference is smaller than the observations on CrSi2 (Figure 5(a) to (c)). The regression coefficients for WSi2 are shown in Table IV, where the data from the first heat-up cycle were not included in the regression analyses. Figure 9 compares the present experimental results with the recommended values for polycrystalline WSi2 based on calculations from “selected axial thermal expansion values” [11]. Although the latter results are slightly larger than the current experimental regression curve, the two curves are in reasonable agreement with the limits of experimental scatter.
TABLE IV.—VALUES OF THE REGRESSION CONSTANTS FOR WSi2 Hot press run
no. Cycle description A,
K–3 B, K–2
C, K
D, %
Rd2
622 First cool-down to third cool-down 1.2�10–10 –1.2�10–7 8.3�10–4 –8.0�10–2 0.999
NASA/TM—2014-216678 9
Figure 9.—Temperature dependence of the thermal expansion
behavior of WSi2 during three heat up-cool down cycles between 293 and 1523 K. The present data are compared with those compiled by Touloukian et al. [11].
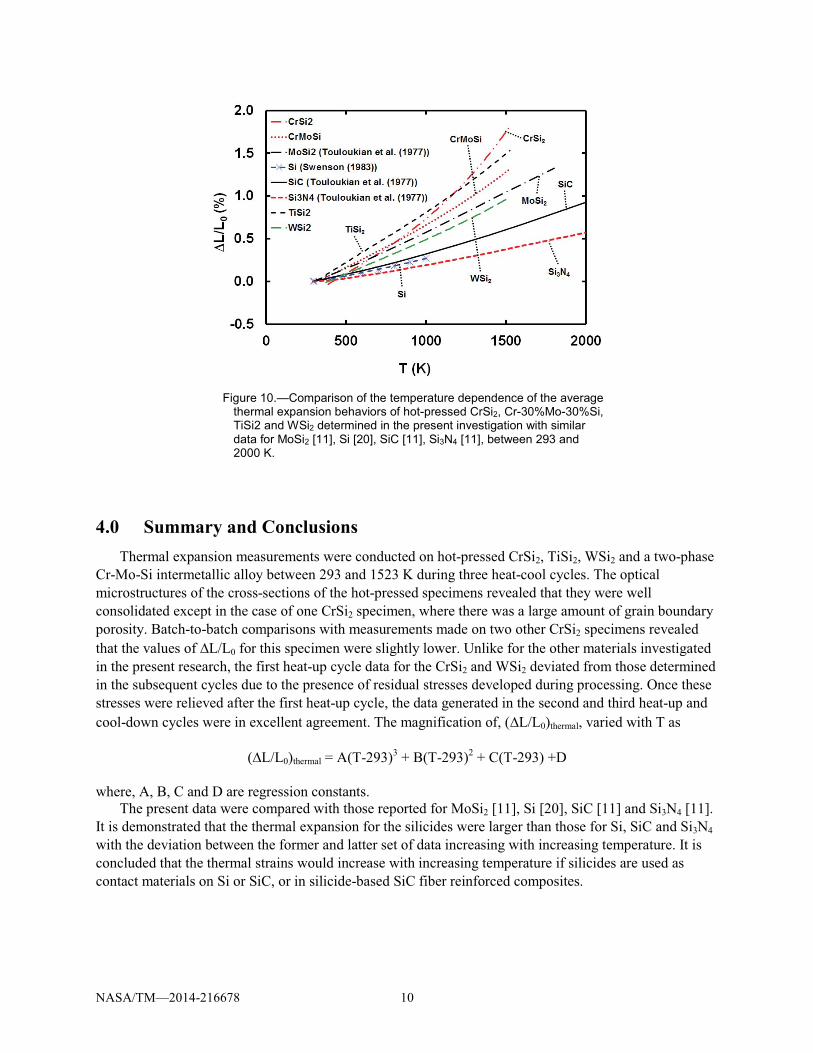
3.6 Comparison of the Thermal Expansion Behavior of Different Silicides
Metal silicides are used in the semiconductor industry as contact materials [1,2,3,4,5] as well as being considered for other potential applications, such as oxidation-resistant coatings [9] and matrix constituents in SiC fiber-reinforced composite materials [10,16,17,18,19]. Therefore, it is useful to compare the present results with thermal expansion data reported in the literature for MoSi2 [11], polycrystalline Si [20], SiC [11] and Si3N4 [11] (Figure 10). An examination of Figure 10 reveals that the magnitudes of �L/L0 for the metal silicides are higher than those for Si, SiC and Si3N4 with the deviation from the latter set of data increasing with increasing temperature. The thermal expansion values are similar for both Si and SiC up to 1000 K but larger than those for Si3N4. While using metal silicide contacts on Si or SiC-based semiconductors are unlikely to debond from the substrate if they operate close to room temperature, Figure 10 suggests that debonding is increasing likely at higher operating temperatures. Similarly, SiC fiber-reinforced silicide matrix composites are likely to develop large thermal strains due to the significant differences in the magnitudes of �L/L0 between the silicides and SiC. Nevertheless, it has been successfully demonstrated that mixing adequate amounts of Si3N4 with MoSi2 to form 0/90 MoSi2-Si3N4/SiC(f) laminated composites lasted over 1000 thermal cycles at 773 K [18].
NASA/TM—2014-216678 10
Figure 10.—Comparison of the temperature dependence of the average thermal expansion behaviors of hot-pressed CrSi2, Cr-30%Mo-30%Si, TiSi2 and WSi2 determined in the present investigation with similar data for MoSi2 [11], Si [20], SiC [11], Si3N4 [11], between 293 and 2000 K.
4.0 Summary and Conclusions Thermal expansion measurements were conducted on hot-pressed CrSi2, TiSi2, WSi2 and a two-phase
Cr-Mo-Si intermetallic alloy between 293 and 1523 K during three heat-cool cycles. The optical microstructures of the cross-sections of the hot-pressed specimens revealed that they were well consolidated except in the case of one CrSi2 specimen, where there was a large amount of grain boundary porosity. Batch-to-batch comparisons with measurements made on two other CrSi2 specimens revealed that the values of �L/L0 for this specimen were slightly lower. Unlike for the other materials investigated in the present research, the first heat-up cycle data for the CrSi2 and WSi2 deviated from those determined in the subsequent cycles due to the presence of residual stresses developed during processing. Once these stresses were relieved after the first heat-up cycle, the data generated in the second and third heat-up and cool-down cycles were in excellent agreement. The magnification of, (�L/L0)thermal, varied with T as
(�L/L0)thermal = A(T-293)3 + B(T-293)2 + C(T-293) +D
where, A, B, C and D are regression constants. The present data were compared with those reported for MoSi2 [11], Si [20], SiC [11] and Si3N4 [11].
It is demonstrated that the thermal expansion for the silicides were larger than those for Si, SiC and Si3N4 with the deviation between the former and latter set of data increasing with increasing temperature. It is concluded that the thermal strains would increase with increasing temperature if silicides are used as contact materials on Si or SiC, or in silicide-based SiC fiber reinforced composites.
NASA/TM—2014-216678 11
References
1. K. N. Tu and J. W. Mayer, Silicide Formation in Thin Films: Interdiffusion and Reactions, edited by J. M. Poate, K. N. Tu and J. W. Mayer, Wiley, New York, p. 359 (1978).
2. S. P. Muraka, Silicides for VLSI Applications, Academic, Orlando, FL, (1983). 3. J. P. Gambino and E. P. Colgan, “Silicide and ohmic contacts,” Materials Chemistry and Physics, 52,
pp. 99-146 (1998). 4. L. Miglio and F. M. D’Heurle (Eds.), Silicides: Fundamentals and Applications, World Scientific,
Washington, D.C. (2000). 5. L. J. Chen, “Metal silicides: An integral part of microelectronics,” 57, pp. 24-31 (2004). 6. A. Heinrich, “Semiconducting silicides: Thermoelectric properties and applications,” Silicides:
Fundamentals and Applications, edited by L. Miglio and F. M. D’Heurle, World Scientific, Washington, D.C. (2000).
7. A. S. Pogosyan and A. Kh. Badyon, “Molybdenum disilicide heating elements manufactured by the high-temperature heating-element factory of Kirovkan,” Soviet Powder. Metall. Met. Ceram., 9, pp. 1023-1029 (1970).
8. Z. Yao, J. J. Stiglich and T. S. Sudarshan, “Molybdenum silicide based materials and their properties,” J. Mater. Eng. Perform., 8, pp. 291-304 (1999).
9. S. J. Grisaffe and S. R. Levine, “Fused silicide coatings containing discrete particles for protecting niobium alloys,” U. S. Patent US3931447 A (1976).
10. A. K. Vasudeva, and J. J. Petrovic, “A comparative overview of molybdenum disilicide composites,” Mat. Sci. Eng., A155, 1-17, 1992.
11. Y.S. Touloukian, R. K. Kirby, R. E. Taylor and T. Y. R. Lee (Eds.) in Thermal Expansion: Nonmetallic Solids, Thermophysical Properties of Matter, vol. 13, Plenum, New York, pp. 1195-1220.
12. L. F. Verkhorobin and N. N. Matyushenko, “The thermal expansion of disilicides of some transition metals,” Soviet Powder. Metall. Met. Ceram., 2, pp. 468-469 (1963).
13. I. Engström and B. Lönnberg, “Thermal expansion studies of the group IV-VII transition-metal disilicides,” J. App. Phys., 63, pp. 4476-4484 (1988).
14. S. V. Raj and A. Palczer, “Thermal expansion of vacuum plasma sprayed coatings,” Mater. Sci. Eng., A 527, pp. 2129-2135 (2010).
15. S. V. Raj, “An evaluation of the properties of Cr3Si alloyed with Mo,” Mater. Sci. Eng., A 201, pp. 229-241 (1995).
16. R. P. Messner and Y. M. Chiang, “Liquid-phase reaction-bonding of silicon carbide using alloyed silicon-molybdenum melts,” J. Amer. Ceram. Soc., 73, pp. 1193-1200 (1990).
17. Y. Pan and J. L. Baptista, “The infiltration of cobalt silicides into silicon carbide preforms,” J. Eur. Ceram. Soc., 18, pp. 201-207 (1998).
18. M. G. Hebsur, “Development and characterization of SiC(f)/MoSi2-Si3N4(p) hybrid composites,” Mater. Sci. Eng., A 261, pp. 24-37 (1999).
19. X. Lin, L. Cheng, L. Zhang, Y. Xu and C. You, “Microstructure and oxidation resistance of carbon/silicon carbide composites infiltrated with chromium silicide,” Mater. Sci. Eng., A 290, pp. 89-94 (2000).
20. C. A. Swenson, “Recommended values of thermal expansivity of silicon from 0 to 1000 K,” J. Phys. Chem. Ref. Data, 12, pp. 179-182 (1983).