Embed Size (px)
Citation preview

Title Page
Comparison of the Use of Notched Wedge Joints vs. Traditional Butt Joints in Connecticut
Final Report Report No. CT-2249-F-08-4
Prepared by:
Scott Zinke CAP Lab/CTI James Mahoney CAP Lab/CTI
Eric Jackson CAP Lab/CTI Gregg Shaffer ConnDOT
November 7, 2008
Research Project SPR-2249
Report No.
CT-2249-F-08-4
Connecticut Advanced Pavement Laboratory Connecticut Transportation Institute
University of Connecticut Storrs, Connecticut

ii
Technical Report Documentation Page
1. Report No.
CT-2249-F-08-4
2. Government Accession No.
3. Recipient’s Catalog No.
5. Report Date November 7, 2008
4. Title and Subtitle Comparison of the Use of Notched Wedge Joints Versus Traditional Butt Joints in Connecticut – Final Report
6. Performing Organization Code N/A
7. Author(s) Scott Zinke, James Mahoney, Eric Jackson and Gregg Shaffer
8. Performing Organization Report No. CAPLAB 1-2008
10 Work Unit No. (TRAIS) N/A 11. Contract or Grant No. Agreement No. 1.24-04(06)
9. Performing Organization Name and Address University of Connecticut Connecticut Transportation Institute 179 Middle Turnpike, U-202 Storrs, Connecticut 06269-5202
13. Type of Report and Period Covered
Final Report 2/06 – 11/08
12. Sponsoring Agency Name and Address Connecticut Department of Transportation Office of Research and Materials 280 West Street, Rocky Hill CT 06067-0207
14. Sponsoring Agency Code SPR-2249
15. Supplementary Notes A study conducted in cooperation with the U.S. Department of Transportation, Federal Highway Administration. 16. Abstract Performance of Hot Mix Asphalt (HMA) longitudinal joints have been an item of increasing scrutiny in Connecticut. The traditional butt joint has typically been the method used in Connecticut. These joints have been reportedly opening up, creating a longitudinal crack at the joint, and thus, contributing significantly to the premature failure of the wearing surface. It has been widely speculated that alternative longitudinal joint construction methods could be employed to reduce the rate at which joints fail. This project investigated the Notched Wedge Joint, as well as the traditionally used butt joint for comparison purposes. Two resurfacing projects were constructed in Connecticut during the 2006 paving season, and one in 2007, that utilized the notched wedge joint construction method. Nuclear density and volumetric density from cut cores along the longitudinal joints from these projects were investigated. Also investigated during the 2006 and 2007 construction season were resurfacing projects which utilized the traditional butt joint. 17. Key Words
Asphalt Pavements, longitudinal joints, notched wedge joint, butt joint, density, compaction
18.Distribution Statement
No restrictions. This document is available to the public through the National Technical Information Service, Springfield, Virginia 22161.
19. Security Classif. (of report) Unclassified
20. Security Classif. (of this page) Unclassified
21. No. of Pages 100
21. Price N/A
Form DOT F 1700.7 (8-72) Reproduction of completed page authorized
iii
Disclaimer The content of this report reflect the views of the authors who are responsible for the
facts and accuracy of the data presented herein. The contents do not necessarily reflect
the official views or policies of the University of Connecticut or the Connecticut
Department of Transportation. This report does not constitute a standard, specification or
regulation.

iv
Acknowledgements The authors would like to thank the following agencies and contractors without whose support; this research would not have been accomplished:
• Connecticut Department of Transportation • Federal Highway Administration • Tilcon Connecticut • O&G Industries • American Industries • Galasso Materials • CT Paving • Santoro, Inc

v
SI* (MODERN METRIC) CONVERSION FACTORS APPROXIMATE CONVERSIONS TO SI UNITS
Symbol When You Know Multiply By To Find Symbol LENGTH
in inches 25.4 millimeters mm ft feet 0.305 meters m yd yards 0.914 meters m mi miles 1.61 kilometers km
AREA in2 square inches 645.2 square millimeters mm2
ft2 square feet 0.093 square meters m2
yd2 square yard 0.836 square meters m2
ac acres 0.405 hectares ha mi2 square miles 2.59 square kilometers km2
VOLUME fl oz fluid ounces 29.57 milliliters mL gal gallons 3.785 liters L ft3 cubic feet 0.028 cubic meters m3
yd3 cubic yards 0.765 cubic meters m3
NOTE: volumes greater than 1000 L shall be shown in m3
MASS oz ounces 28.35 grams glb pounds 0.454 kilograms kgT short tons (2000 lb) 0.907 megagrams (or "metric ton") Mg (or "t")
TEMPERATURE (exact degrees) oF Fahrenheit 5 (F-32)/9 Celsius oC
or (F-32)/1.8 ILLUMINATION
fc foot-candles 10.76 lux lx fl foot-Lamberts 3.426 candela/m2 cd/m2
FORCE and PRESSURE or STRESS lbf poundforce 4.45 newtons N lbf/in2 poundforce per square inch 6.89 kilopascals kPa
APPROXIMATE CONVERSIONS FROM SI UNITS Symbol When You Know Multiply By To Find Symbol
LENGTHmm millimeters 0.039 inches in m meters 3.28 feet ft m meters 1.09 yards yd km kilometers 0.621 miles mi
AREA mm2 square millimeters 0.0016 square inches in2
m2 square meters 10.764 square feet ft2
m2 square meters 1.195 square yards yd2
ha hectares 2.47 acres ac km2 square kilometers 0.386 square miles mi2
VOLUME mL milliliters 0.034 fluid ounces fl oz L liters 0.264 gallons gal m3 cubic meters 35.314 cubic feet ft3
m3 cubic meters 1.307 cubic yards yd3
MASS g grams 0.035 ounces ozkg kilograms 2.202 pounds lbMg (or "t") megagrams (or "metric ton") 1.103 short tons (2000 lb) T
TEMPERATURE (exact degrees) oC Celsius 1.8C+32 Fahrenheit oF
ILLUMINATION lx lux 0.0929 foot-candles fc cd/m2 candela/m2 0.2919 foot-Lamberts fl
FORCE and PRESSURE or STRESS N newtons 0.225 poundforce lbf kPa kilopascals 0.145 poundforce per square inch lbf/in2
*SI is the symbol for th International System of Units. Appropriate rounding should be made to comply with Section 4 of ASTM E380. e(Revised March 2003)

vi
TABLE OF CONTENTS Title Page......................................................................................................................................................... i Technical Report Documentation Page ........................................................................................................... i Disclaimer ..................................................................................................................................................... iii Acknowledgements ....................................................................................................................................... iv Metric Conversion Factors ............................................................................................……………………..v TABLE OF CONTENTS .............................................................................................................................. vi LIST OF FIGURES..................................................................................................................................... viii LIST OF TABLES ...................................................................................................................................... viii Executive Summary....................................................................................................................................... ix Background .................................................................................................................................................... 1 Objective ........................................................................................................................................................ 2 Longitudinal Joint Construction ..................................................................................................................... 3
Connecticut Standard Practice.................................................................................................................... 3 Literature Review Summary....................................................................................................................... 4 Traditional Vertical or Butt Joint Construction Method............................................................................. 5 Notched Wedge Construction Method ....................................................................................................... 7
Field Evaluation Plan at Time of Construction .............................................................................................. 9 Data Storage ............................................................................................................................................. 12
Joint Data Correction Factors ....................................................................................................................... 13 Butt Joint Correction Factors.................................................................................................................... 15 Notched Wedge Joint Correction Factors................................................................................................. 17 Comparison of Correction Factors and Methods...................................................................................... 18
Analysis of Field Data .................................................................................................................................. 21 Butt Joint Analysis ................................................................................................................................... 21
Utilization of a Rubberized Joint Sealant ..................................................................................................... 23 Project #91-108 ........................................................................................................................................ 23
Project Equipment: ............................................................................................................................... 24 Field Observations- Constructability:................................................................................................... 26 Field Observations- ConnDOT Pavement Advisory Team: ................................................................. 26 Field Observations- Acceptance of the Joint ........................................................................................ 27
Notched Wedge Pilot Projects...................................................................................................................... 28 Project #171-326C Description ................................................................................................................ 29
Project Equipment: ............................................................................................................................... 30 Field Observations – Constructability: ................................................................................................. 30 Field Observations - ConnDOT Pavement Advisory Team – Traffic on Open Joints ......................... 31 Field Observations – Acceptance Testing of the Joint.......................................................................... 32
Project #98-98 Description....................................................................................................................... 32 Project Equipment: ............................................................................................................................... 33 Field Observations – Constructability: ................................................................................................. 34 Field Observations – ConnDOT Pavement Advisory Team - Traffic on Open Joints: ........................ 36 Field Observations – Acceptance Testing of the Joint.......................................................................... 37
Project #63-577 Description..................................................................................................................... 38 Project Equipment ................................................................................................................................ 38 Field Observations- Constructability:................................................................................................... 39

vii
Field Observations- ConnDOT Pavement Advisory Team- Traffic on Open Joints ............................ 40 Field Observations- Acceptance Testing of the Joint: .......................................................................... 41 Analysis of Project #63-577 ................................................................................................................. 41
Initial Profile Analysis: All Notched Wedge Joint Projects .................................................................... 44 Comparison: Notched Wedge vs. Butt Joint................................................................................................ 49 Conclusions .................................................................................................................................................. 52 Recommendations ........................................................................................................................................ 54 References .................................................................................................................................................... 57 Appendix A. Literature Review.................................................................................................................... 58 Appendix B. Before & After Application of Correction Factor (Butt Joint Projects) .................................. 89 Appendix C. Before & After Application of Correction Factor (Notched Wedge Joint Projects) ............... 93 Appendix D. Analysis of Variance for Traditional Butt Joint ...................................................................... 95 Appendix E. Analysis of Variance For Notched Wedge Joint ..................................................................... 98

viii
LIST OF FIGURES Figure 1 Typical Butt Joint Construction Protocol (Image Courtesy NETTCP) ............................................ 3 Figure 2 Notched Wedge Forming Device..................................................................................................... 8 Figure 3 Wedge Compaction Device and Setup............................................................................................. 8 Figure 4 Notched Wedge Joint Diagram ........................................................................................................ 9 Figure 5 Profile View of Core Extraction Protocol ...................................................................................... 11 Figure 6 Data Collection Diagram. Typical Test Section............................................................................ 11 Figure 7 Plot of Correction Factor Effect on Butt Joints .............................................................................. 16 Figure 8 Plot of Correction Factor Effect on Wedge Joints.......................................................................... 18 Figure 9 Comparison of Correction Factor Procedures for Use on Butt Joints ............................................ 19 Figure 10 Comparison of Correction Factors for Use on Notched Wedge Joints......................................... 20 Figure 11 Butt Joint Core and Corrected Nuclear Density by Profile Location ........................................... 22 Figure 12 Rubberized Joint Sealant Melting Pot on Trailer ......................................................................... 25 Figure 13 Rubberized Joint Sealant Application .......................................................................................... 25 Figure 14 Rubberized Joint Sealant Applied to Cold Side of Joint .............................................................. 26 Figure 15 Effect of Rubberized Joint Sealant............................................................................................... 28 Figure 16 Compaction Device Setup and Attachments ................................................................................ 34 Figure 17 Traffic on Open Notched Wedge Joint......................................................................................... 35 Figure 18 Tack Coat On Bottom Half of Wedge.......................................................................................... 35 Figure 19 Traffic Traversing Open Joint ...................................................................................................... 37 Figure 20 Vibrating Plate Attachments ........................................................................................................ 39 Figure 21 Vibrating Plate Attachments ........................................................................................................ 39 Figure 22 I-91 Windsor Average Joint Density Comparison (Notched Wedge vs. Butt Joint) ................... 42 Figure 23 Closed vs. Exposed Notched Wedge Joint Average Density Behavior........................................ 43 Figure 24 Notched Wedge Average % Corrected Nuclear Density by Profile Location.............................. 46 Figure 25 Notched Wedge Average % Volumetric Core Density by Profile Location ................................ 46 Figure 26 Butt Joint Vs. Notched Wedge Joint (Nuclear Density).............................................................. 50 Figure 27 Butt Joint Vs. Notched Wedge Joint (Core Density).................................................................... 51
LIST OF TABLES Table 1. ConnDOT Measurement of Mean Density Values (Butt Joint Projects).......................................... 7 Table 2. Discarded Core Density Values (Butt Joints) ................................................................................. 14 Table 3. Discarded Core Values (Notched Wedge Joint) ............................................................................. 15 Table 4. Butt Joint Corrected Nuclear Density Averages by Profile Location............................................. 21 Table 5. Butt Joint Core Density Averages by Profile Location .................................................................. 21 Table 6. Corrected Nuclear Density Averages by Profile Location for All Notched Wedge Joints............. 44 Table 7. Core Density Averages by Profile Location for All Notched Wedge Joints .................................. 44 Table 8. Corrected Nuclear Density Values ................................................................................................. 50 Table 9. Core Density Values...................................................................................................................... 50

ix
Executive Summary Traditional butt joints have been the customary method used in constructing longitudinal joints in hot mix asphalt (HMA) pavements in Connecticut. The longitudinal joints on many Connecticut roadways have cracked or pulled apart, thus expediting premature failure of the roadway and causing safety hazards to bicyclists, motorcyclists and pedestrians. The anticipated cause for this joint failure is a lack of material at the joint, thereby creating areas of low density, during the compaction phase of construction. Expansion and contraction of the pavements due to thermal cycling occurs virtually every day. The overall thickness of the pavement will tend to increase with each thermal cycle. For this thickness change to occur, the HMA will pull in from all directions, and if the longitudinal joint does not have enough material to compensate, the longitudinal joint will tend to open. As time progresses and further thermal cycling takes place, this crack increases in size to the point where it may be as wide as or wider than the thickness of the wearing surface. In addition to safety hazards that this causes, it allows water and incompressible materials to penetrate between pavements layers. In an effort to evaluate and compare an alternative method of HMA longitudinal joint construction, with traditional longitudinal butt joint construction, the Connecticut Advanced Pavement Laboratory (CAP Lab), in cooperation with the Connecticut Department of Transportation (ConnDOT) and the Federal Highway Administration (FHWA), investigated the use of a notched wedge joint on three pilot projects in Connecticut and compared the collected data with data collected from several butt joint construction projects throughout Connecticut during the same two construction seasons. On all of the evaluated projects, multiple nuclear density profiles were measured across the longitudinal joint at various random locations. This created a density profile across the joint which was investigated. At each location, five cores were cut to provide a density profile based on volumetric density. In all, there were 50 nuclear density measurements taken from each randomly located section and five extracted cores. Results show a higher level of density at the joint on the warm side (second paver pass) with both construction methods. This is most likely due to the first paver pass providing lateral confinement for the second pass to be compacted against regardless of the method used. Results also show that the density profile across the joint is more uniform with the use of the notched wedge joint. That is the range of average density is less using that longitudinal joint construction method. The recommendations from this research include employing a nuclear density correction factor based on cores cut from the same project. It is also recommended that there be no further delay in allowing the use of the notched wedge joint as it was found to be more beneficial from a density standpoint than the traditional method. Based on the use of the notched wedge joint, it is recommended that the tapered portion of the wedge be compacted using a vibratory plate compactor or similar device upon placement to ensure desired density is achieved. It is also recommended that the pilot projects investigated during the course of this research be evaluated over time to establish the actual the increased performance of longitudinal joints constructed using the notched wedge joint. Finally, it is recommended that consideration be given to using the density from both the warm and cold side of the joint averaged together for acceptance purposes.

1
Background Longitudinal joints in hot mix asphalt (HMA) paving are formed where the edge of one
paver pass interfaces with the edge of the next paver pass. Longitudinal joints tend to
split apart at this interface so as to cause a crack that has the potential to reach the full
depth of the wearing surface. As time progresses, the width of the crack at the
longitudinal joint interface increases as the processes and mechanisms that initially
caused the joint to split continue to occur. This is especially dangerous to pedestrians,
bicyclists and motorcyclists as the opening of the joint has the potential to be as wide as a
person’s foot, bicycle tire or motorcycle tire. Infiltration of water into the crack, as well
as raveling of the material at the joint, may also increase the rate at which the
longitudinal joint will open, thus significantly contributing to the premature failure of the
roadway. Longitudinal joints which open up significantly require maintenance, which
entails crack sealing and filling, patching and, in some cases, milling off the existing
wearing surface and replacing it.
The primary mechanism that drives longitudinal joint failures is environmental stresses.
The asphalt binder in the HMA pavement expands and contracts every day through the
normal temperature cycling experienced by the pavement. As the asphalt binder expands
with an increase in temperature, aggregates in the pavement are forced upward since the
surface of the pavement is not confined. As with all materials, pavement expands in the
direction of least resistance. As the asphalt binder cools on the downward trend of the
thermal cycle, it contracts, trying to return to the original pavement thickness.
Unfortunately, internal friction of the aggregates prevents the pavement from returning
exactly to the original compacted thickness. Therefore, the thickness of the pavement

2
increases marginally with each thermal cycle. The cumulative effect of this process
eventually causes enough of a change in thickness to cause a decrease the lateral width of
the pavement. As the pavement structure has a finite volume, an increase in thickness
requires an adjustment of one of its other dimensions to maintain this finite volume. As
most paver passes are between 12-14 feet wide, width has the least frictional resistance to
overcome for a dimensional adjustment. This adjustment causes the longitudinal joints to
open up. A lack of material at the interface of the two passes is responsible for the lack
of density and thus weakness at the joint as is described in Chapter 16 of the NETTCP
Paving Inspector Manual. (NETTCP, 2006)
To slow the rate at which longitudinal joints fail, proper construction techniques that
ensure a high density at the longitudinal joint are essential. Increased longitudinal joint
densities ensure there is enough material present at the longitudinal joint to allow for
some vertical thickness increase without requiring the material to split.
Objective The purpose of this study was to evaluate the constructability and durability of an
alternate Hot Mix Asphalt (HMA) longitudinal joint method, the notched wedge joint and
compare the measurable performance properties of this construction method with those of
the traditional joint construction method used in Connecticut. The notched wedge joint is
a longitudinal joint method being investigated to improve upon the State’s standard
longitudinal joint method, the vertical or butt joint. Constructability includes the time,
effort and equipment to form and compact the material at the joint and the measurable
performance properties are the resulting in-place density upon completion. The two
different longitudinal construction joint methods are to be compared on the basis of these

3
constructability concerns as well as the stated performance measureables. Furthermore, a
modified approach to these methods was also evaluated (on a limited basis on one
project) through the application of an asphaltic joint sealant material during construction.
The overall goal of this study was to collect data on the longitudinal joints at the time of
construction which could be analyzed immediately and provide critical data for the
evaluation of the long-term performance of the joints. Joint performance will be judged
according to their ability to delay the formation of cracks at the joint as well as
minimizing the width of the crack that forms.
Longitudinal Joint Construction
Connecticut Standard Practice
The traditional method for constructing a longitudinal joint in Connecticut is a vertical or
butt joint which “butts” the warm material from the second pass to the cold material from
the first pass creating an essentially (although not entirely) vertical interface (See Figure
1).
Figure 1 Typical Butt Joint Construction Protocol (Image Courtesy NETTCP)

4
Achieving adequate density on the cold edge of the longitudinal joint is difficult because
at the time of its compaction, there is no lateral confinement to compact it against.
Therefore, the unconfined edge is able to move laterally when the downward compaction
force is applied. Theoretically, the ideal compaction method would provide some sort of
lateral confinement on both edges of the pass such that the density at the longitudinal
joint would approach the same density found at the center of the mat where it is expected
and generally observed to be higher. This type of compaction is not practically
achievable for typical construction situations. Thus, it would be beneficial to develop a
joint construction method to minimize all of these problems.
Literature Review Summary
This section contains a brief summary of a detailed literature review contained in
Appendix A. Typically, the longitudinal joint of the HMA mat is the first failure point.
Low densities, as well as thermal expansion and contraction of the pavement, leave the
surface susceptible to a multitude of destructive forces. To combat these issues, research
has turned to new construction methods to build a better longitudinal joint. These
techniques involved the use of: multiple variations of the notched wedge joint; restrained
edge during placement; joint re-heating; the use of a joint maker; and, using a cutting
wheel with tack coat (Fleckenstien et al, 2002, Kandhal et al, 1997, Kandhal et al, 2002,
Toepel, 2003, Akpinar et al, 2004, Denehy, 2005).
The construction of the modified joints presented several problems which were addressed
in the field. For the notch wedge joint, these problems included: preserving the upper
notch during compaction; raveling of the outside or lower portion of the wedge; and, the
small tow-behind roller picking up aggregate (Fleckenstien et al, 2002). Another issue

5
which arose was the notch wedge equipment put enough drag on the paver to twist it out
of plane while paving (Fleckenstien et al, 2002). This made use of the ski poles difficult.
When applying sealant to longitudinal joints the application of the sealant to the joint
itself was difficult and time consuming using the conical shaped nozzle (Denehy, 2005).
The switch to an ellipsoid shape nozzle expedited the process and made application
easier; however, there is a risk of overheating the sealant during nozzle changes (Denehy,
2005). In the studies reviewed, all problems encountered in construction were corrected
and controlled allowing for proper placement of the pavement.
The notched wedge joint and edge restraining device typically had the largest reduction
in permeability or increase in density (Kandhal et al, 1997, Fleckenstien et al, 2002,
Toepel, 2003). However, six years after placement, the use of a rubberized joint material
on the traditional butt joint appeared to perform the best, even though the joint densities
obtained during placement were among the worst (Kandhal et al, 2002). The literature
indicates the notched wedge joint, or the use of a sealant or tack coat on the traditional
butt joint, have the most significant impact on improving in-place density or pavement
durability. Both of these methods will be evaluated in this research report.
Traditional Vertical or Butt Joint Construction Method The traditional butt joint is constructed by butting the edge of the second paver pass with
the edge of the first paver pass and finally compacting the joint. It is stated in Chapter 10
of NETTCP Paving Inspector Manual (NETTCP, 2006) that the hot material from the
second paver pass is placed against the edge of the first pass and an overlap of 1 to 1.5
inches should be used in order to ensure an adequate amount of material for compaction.
This is shown in Figure 1 which was extracted from Chapter 10 in the NETTCP manual.
6
This method was used on 9 of the 10 projects investigated during the 2006 and 2007
construction seasons. One project utilized the notched wedge joint exclusively and two
of the projects utilized both the notched wedge joint and the traditional butt joint.
Table 1 shows the 2006 and 2007 projects that utilized the traditional butt joint method
which were investigated for the purposes of this research. Also shown in Table 1, are the
average density measurements as measured by Connecticut DOT acceptance personnel
for acceptance both on the mat and across the joint at these projects. These average
densities are those which were measured as part of the quality assurance program and
were obtained from ConnDOT. It should be noted that these average densities and values
are different from the measurements found by the research team.

7
Table 1. ConnDOT Measurement of Mean Density Values (Butt Joint Projects)
Project Town Route Mat % MTD (Acceptance) Joint % MTD (Acceptance)
172-364C N. Stonington 184 92.7% 93.1%
171-326C Berlin 15 No Data No Data
172-363F Salem 354 92.9% 92.4%
172-363F Montville 82 93.6% 92.1%
173-381C Easton 59 93.0% 92.8%
172-363A Killingly 6 92.8% 92.2%
174-332H Kent 341 92.1% 91.2%
63-577 Windsor I-91 94.3% 93.4%*
91-108 New Hartford 219 95.8%** 93.1%, 94.8% ***
*Composite of notched wedge joint and butt joint **Average missing 2 days of production which may not have been top course and so were not included ***Joint density value where a rubberized joint sealant was used
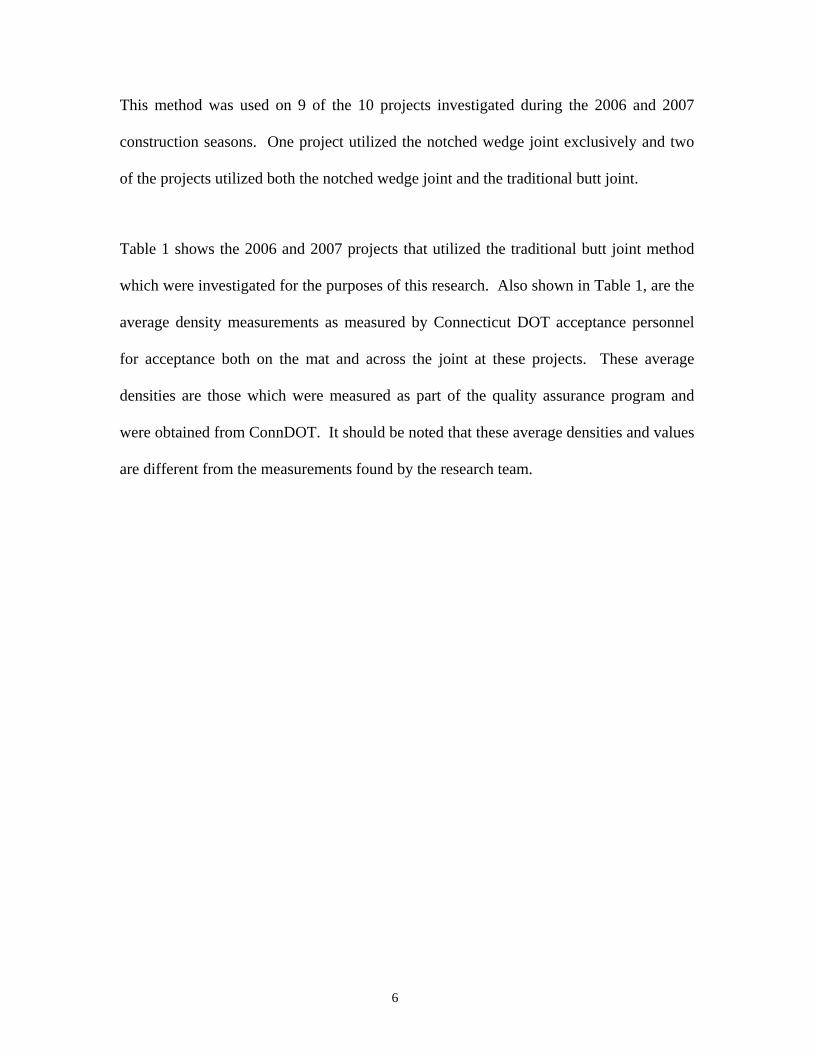
Notched Wedge Construction Method The notched wedge joint was formed by using a Contractor-supplied device attached
within the wing of the paver to form its shape (Figure 2). The device was designed to
create a notched wedge joint to meet the State’s trial specifications. The device allowed
for adjustment in the formation of the wedge in its length and slope. The depth of the
notch is also adjustable. To compact the wedge, a vibrating plate compactor was used.
The plate is connected to the paver and is set just behind the wing directly over the wedge
(Figure 3). The resulting notched-wedge joint is shown via a theoretical diagram in
Figure 4.
8
Figure 2 Notched Wedge Forming Device
Figure 3 Wedge Compaction Device and Setup

9
Figure 4 Notched Wedge Joint Diagram
Field Evaluation Plan at Time of Construction CAP Lab personnel were onsite with the tools necessary for obtaining all data and
samples pertinent to evaluating the longitudinal joint on both the notched wedge pilot
projects as well as the traditional butt joint projects. (Project #174-332H, Rt. 341, Kent,
is an exception as CAP Lab personnel were not present during paving. As such, there is
no nuclear density data for this project. However, there is volumetric data from the cut
cores. The equipment included a drill with a 6-inch coring bit, generator, cooling water,
distance measurement devices, digital camera, infrared temperature gun, nuclear density
gauge and a field book for recording data and notes.
It was desired at the outset of this research that profiles be obtained that demonstrated the
behavior of density from the cold side of the joint across to the warm side of the joint. If
such profiles could be obtained, this may explain a great deal about the problem with the
premature failure of the longitudinal joints. More specifically, it was desired to
determine what the density of the material was on both sides of the joint, as well as
directly on the joint, for comparison purposes. If this information could be obtained, it
Hot side Cold Side
8” – 12” Taper
Vertical Notch ½” – 1”

10
may provide insight as to the effectiveness of the added confinement provided by the
wedge joint during compaction.
This data was obtained through vigorous nuclear density testing of the material and
finally extraction of cores in several of the nuclear density test locations for laboratory
measurement. Unfortunately, while it is possible to perform non-destructive nuclear
density tests immediately adjacent to one another, cutting cores immediately adjacent to
one another to form a profile is not possible. First, subsequent cores that would be cut
would have been disturbed by the extraction of the previous core. Second, the amount of
damage to such a small area of the mat may have been problematic. Therefore, nuclear
density profiles were measured across the joint starting 1 foot from the joint on the cold
side and continuing in 6-inch increments to 1 foot from the joint on the warm side
(Figures 5 and 6). In addition, profiles were created at 5-foot intervals in the direction of
paving. Cores were extracted from the first profile in the location where the nuclear
density testing took place 1 foot from the joint on the cold side. Moving to the next
profile which would be 5 feet in the longitudinal direction, a core was extracted in the
location where the nuclear tests were performed 6 inches from the joint on the cold side.
5 feet from that location in the direction of paving another core was extracted directly on
the joint where nuclear measurements took place. The core extraction was repeated 6
inches from the joint on the warm side, and finally, 1 foot from the joint on the warm
side. Thus, five nuclear density profiles and five cores were obtained over each 20-foot
section (Figure 6).

11
Figure 5 Profile View of Core Extraction Protocol
Figure 6 Data Collection Diagram (Typical Test Section)
Right shoulder Hot Side Cold Side Left turn lane
Location D
Location E Location A
Location B
Location C
Center of wedge or butt

12
Once paving began, CAP Lab personnel performed a daily standard count with the
nuclear density gauge to account for any radiation source decay. CAP Lab personnel also
generated random locations for each test section. Care was taken to give adequate time
and distance (~300-350 feet) for the paving crew to make necessary adjustments before
CAP Lab personnel began collecting data. The distance of paving as well as the quality
and presence of traffic control on each particular day
(or night) ultimately dictated how many sections of data were possible to collect. Some
days were longer than others, however, on average, 2 to 3 sections per day were possible.
60-second counts were used with the nuclear density gauge. Each location was measured
twice rotating the nuclear density gauge 180° between measurements. The average of the
two readings was used as the final measurement. This equates to 50 minutes of nuclear
gauge measurements per section. Once the nuclear density data was collected, cores were
extracted, labeled and brought to the CAP Lab for volumetric measurement.
Data Storage
A FileMaker Database developed by CAP Lab was used to hold all of the data pertinent
to the projects including date, route, town, joint type, section number, core location, core
ID, project specific notes, volumetric data from the plant, nuclear density values,
volumetric core density values, as measured by CAP Lab, and project specific numerical
summaries of all the measurement data. The data was filed according to individual
nuclear density profile. Each section of data collected then, entailed five records. There
are a total of 270 records that contain all the data collected from the 2006 and 2007
construction seasons for this research. It is important to note that not all 270 cores were
suitable for analysis due to occasional damage done to the cores during the extraction
process which is explained in the following section.

13
Joint Data Correction Factors ConnDOT Report No. CT-2242-F-05-5, Correlation of Nuclear Density Readings with
Cores Cut from Compacted Roadways (Padlo et al, 2005), illustrates a method by which
an average error can be calculated utilizing cores to develop a correlation factor to be
added to nuclear density gauge values on a project/mix specific basis. It was desired that
this procedure be investigated for use on longitudinal joints during the proceedings of this
research. This procedure involves cutting a predetermined number of cores to be used in
determining the correlation/correction factor. In addition to the cores cut on the
longitudinal joints, cores were also extracted from areas on the compacted mat that were
not close to the joint. The purpose of these cores was to develop a correction factor that
would not only be applicable to nuclear density readings taken toward the center of the
mat, but also used to determine its applicability to nuclear density readings taken along
the longitudinal joint.
The procedure traditionally used by ConnDOT to adjust/correct nuclear gauge
measurements involved measuring blocks of granite and Portland cement concrete of
known densities with the nuclear density gauge at hand. The difference between the
known density and the measured density was considered the ‘bias’ and was applied to all
nuclear measurements taken during the course of that year’s construction season.
The core correction factor procedure subtracts the volumetric density value from the
nuclear density value to obtain the error. Padlo, et al, 2005, indicated that a density
discrepancy where the nuclear densities were 2% or greater as compared to the core were
an indication of a potentially a broken or damaged core. The core correlation procedure

14
prescribes discarding density values with errors in excess of +2% Maximum Theoretical
Density (MTD). Rather than simply discarding those readings for this project, the
research team visually inspected those cores for signs of damage. If there was no
evidence of damage caused by the extraction process, the values were used and the higher
level of the errors was considered valid. In cases where there were clearly signs of
damage caused by the extraction process, those values were discarded and not used in the
correlation procedure. Table 2 shows the number of discarded core values per project
while attempting to generate correction factors for the nuclear gauge values on the butt
joint projects. Table 3 shows the number of cores that were deemed invalid for use for
each of the notched wedge joint projects.
Table 2. Discarded Core Density Values (Butt Joints)
Project Town Route Total Cores Cores Discarded as Unusable172-364C N. Stonington 184 10 1 171-326C Berlin 15 10 0 172-363F Salem 354 20 4 172-363F Montville 82 15 1 173-381C Easton 59 30 3 172-363A Killingly 6 25 3 174-332H Kent 341 40 0 (No nuclear data obtained)
63-577 Windsor I-91 25 0 91-108 New Hartford 219 20 2
15
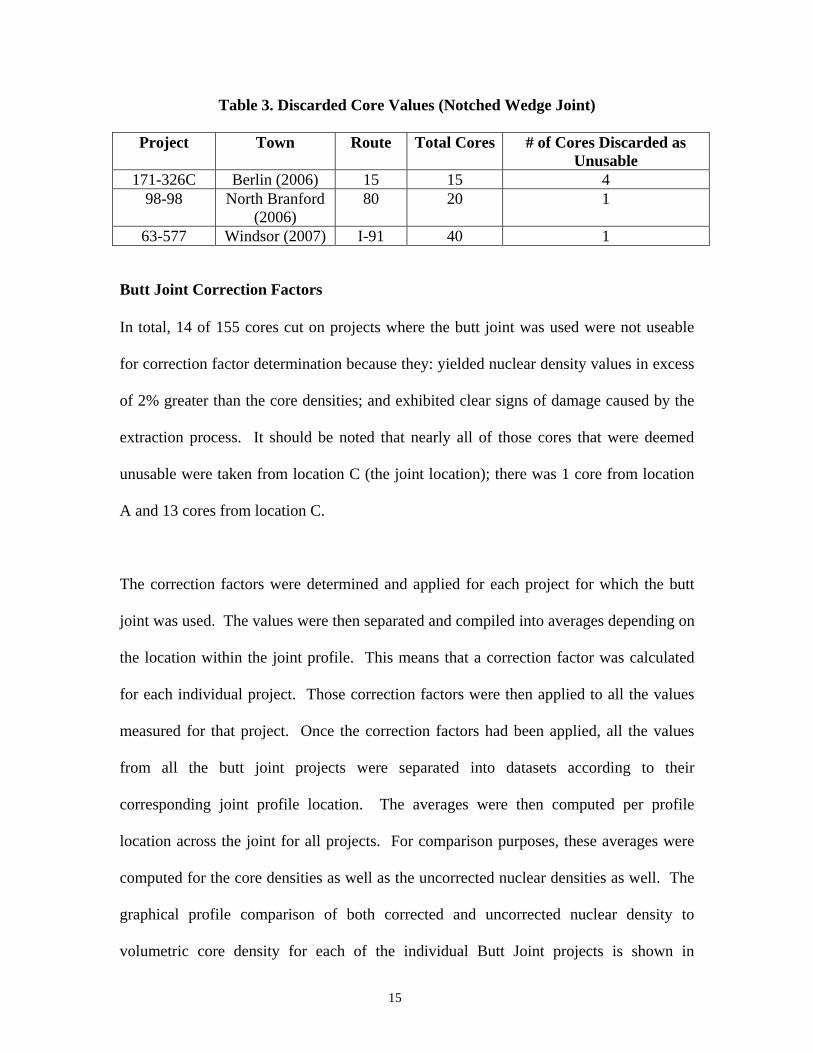
Table 3. Discarded Core Values (Notched Wedge Joint)
Project Town Route Total Cores # of Cores Discarded as Unusable
171-326C Berlin (2006) 15 15 4 98-98 North Branford
(2006) 80 20 1
63-577 Windsor (2007) I-91 40 1
Butt Joint Correction Factors In total, 14 of 155 cores cut on projects where the butt joint was used were not useable
for correction factor determination because they: yielded nuclear density values in excess
of 2% greater than the core densities; and exhibited clear signs of damage caused by the
extraction process. It should be noted that nearly all of those cores that were deemed
unusable were taken from location C (the joint location); there was 1 core from location
A and 13 cores from location C.
The correction factors were determined and applied for each project for which the butt
joint was used. The values were then separated and compiled into averages depending on
the location within the joint profile. This means that a correction factor was calculated
for each individual project. Those correction factors were then applied to all the values
measured for that project. Once the correction factors had been applied, all the values
from all the butt joint projects were separated into datasets according to their
corresponding joint profile location. The averages were then computed per profile
location across the joint for all projects. For comparison purposes, these averages were
computed for the core densities as well as the uncorrected nuclear densities as well. The
graphical profile comparison of both corrected and uncorrected nuclear density to
volumetric core density for each of the individual Butt Joint projects is shown in

16
Appendix B. Figure 7 shows the overall comparison of average nuclear density values to
average core density values both before and after the application of the correction factor.
Locations B and C correspond to the areas within the average profile that exhibit the
lowest density. The fact that the correction factor appears to be least effective in location
C (the joint location) may be due in part to a number of things. First, in determining
correction factors, there were fewer useable cores for this region of the joint than in each
of the locations A, B, D and E. This is because several of them were broken upon
extraction. There is also a possibility that nuclear density gauges produce readings of
lesser accuracy at lower density levels and, in turn, better accuracy at higher density
levels.
Correction Factor Effect on Density (Butt Joints)
85.0
86.0
87.0
88.0
89.0
90.0
91.0
12" Cold 6" Cold Joint 6" Hot 12" Hot
Joint Profile Location
Ave
rage
Den
sity
(% M
TD)
Core Density Nuclear Density Before Correction Nuclear Density After Correction
Figure 7 Plot of Correction Factor Effect on Butt Joints

17
It should be noted that the data used to compile the comparison for Table 2, Appendix B
and for Figure 7 does not include data from Project 174-332H, Rt. 341 in Kent. There are
no nuclear density data available for that project. However, all further butt joint data
analyses and comparisons will include and use volumetric core density data from that
project.
Notched Wedge Joint Correction Factors
The core correlation procedure for the notched wedge joint was conducted using data
obtained from the 2006 and 2007 construction seasons. The correction factors were
determined and applied for each profile location for the notched wedge joint projects.
Figure 8 shows the overall comparison of average nuclear density values to average core
density values both before and after the application of the correction factor. Once a
correction factor was calculated for each project, the nuclear density readings
corresponding to core locations were compared to the laboratory density values. This
correction factor was applied to all of the nuclear density readings on the two projects.
The graphical profile comparison of both corrected and uncorrected nuclear density to
volumetric core density for each of the individual Butt Joint projects is shown in
Appendix C.

18
Correction Factor Effect on Density (Notched Wedge Joints)
88.5
89.0
89.5
90.0
90.5
91.0
12" Cold 6" Cold Joint 6" Hot 12" Hot
Joint Profile Location
Aver
age
Dens
ity (%
MTD
)
Core Density Nuclear Density Before Correction Nuclear Density After Correction
Figure 8 Plot of Correction Factor Effect on Wedge Joints
Comparison of Correction Factors and Methods
The block density correction method and the core correlation method are compared in
this section using the CAP Lab’s nuclear density gauge. The correction factors were
established using random cores cut from the mat, away from the joint. This was done in
order to determine if the core correlation procedure, (Padlo, et al., 2005) could be applied
to the longitudinal joint without having to actually cut cores on the joint. Another reason
for this comparison was to determine the accuracy of the ConnDOT block bias procedure
and its overall applicability. The resulting correction factors from both methods were
applied to the nuclear gage readings to determine the ‘corrected’ density value. These
‘corrected’ measurements were then compared with the volumetric density of the cores
cut from those locations and the error was computed. The error of the nuclear reading is
obtained by subtracting the volumetric density of the core from the corrected nuclear
reading. Figures 9 and 10 show the difference in these errors after both techniques were
applied. The x-axis of both figures indicates the number of cores used in determining the

19
correction factor which produced the corresponding average error on the y-axis for the
correlation procedure. The block bias procedure is simply one number added to, or
subtracted from, a nuclear gauge reading. This is the reason for the constant average
error shown for the block bias data series. Figure 9 indicates for butt joints the core
correction factor procedure kept the error well within 1% of maximum theoretical
density. The block bias application for the butt joints yielded an error of 2.1% of
maximum theoretical density on the butt joints. Figure 10 shows that for notched wedge
joints the application of the core correction factor resulted in errors all less than 1.0% of
maximum theoretical density. The block bias application resulted in an average error of
1.8% maximum theoretical density. It should be noted that all of the cores and nuclear
density values used for these comparisons came from the same project (63-577, I-91
constructed in 2007). This project was selected for this comparison because this is the
project with the largest random mat core dataset as well as the largest butt joint and
notched wedge joint dataset.
Windsor I-91 Longitudinal Joint Core Correlation (Butt Joint) Utilizing Random Cores Cut from the Mat vs. ConnDOT Block Bias
-0.5
0.0
0.5
1.0
1.5
2.0
2.5
0 1 2 3 4 5 6 7 8 9 10 11 12 13 14 15 16 17 18
Number of Cores
Aver
age
Erro
r (%
MTD
)
Core Correction Factor Errors Block Bias Average Errors
Figure 9 Comparison of Correction Factor Procedures for Use on Butt Joints

20
Windsor I-91 Longitudinal Joint Core Correlation (Notched Wedge Joint) Utilizing Random Cores Cut from the Mat vs. ConnDOT Block Bias
-1.0
-0.5
0.0
0.5
1.0
1.5
2.0
0 1 2 3 4 5 6 7 8 9 10 11 12 13 14 15 16 17 18
Number of Cores
Ave
rage
Err
or (%
MTD
)
Core Correction Factor Errors Block Bias Average Errors Figure 10 Comparison of Correction Factors for Use on Notched Wedge Joints
These differences are significant in a couple of ways. First, ConnDOT bases payments
and/or penalties in part on density measured by nuclear density gauges which necessitates
a higher level of accuracy. Secondly, for this research, accurate correction of the nuclear
gage readings is critical since the analysis, results and conclusions depend heavily on the
nuclear gauge measurements. Therefore, cores cut from the longitudinal joint locations
would be used to develop the longitudinal joint correction factor since the nuclear density
data could be compared directly to the laboratory core values from those exact locations.
Because the correction factor was established using cores cut from the joint locations
specifically, there is reason to be more confident in the accuracy of the measurements.
This is because even cores that were not directly compared to those locations in the above
comparisons yielded a smaller error than the traditionally used measurement techniques
utilizing the ConnDOT block bias procedure.

21
Analysis of Field Data
Butt Joint Analysis After the nuclear readings were adjusted using the correction factors, the average of the
core values and corrected nuclear density values by profile location were further
analyzed. The statistical nuclear density comparison made between profile location
averages for all of the butt joints are shown in Appendix D. It was necessary to analyze
the performance of the butt joint alone before any comparison could be made with the
notched wedge joint. The average nuclear density value per profile location for all of the
butt joint projects is shown in Table 4 and the average core density values are shown in
Table 5.
Table 4. Butt Joint Corrected Nuclear Density Averages by Profile Location
Joint Location (within the density profile) A B C D E
Sample Size 155 155 155 155 155
Average Density 89.1 86.8 87.5 90.8 90.7
A = 1 foot cold side B = 6 inches cold side C = joint location D = 6 inches warm side E = 1 foot warm side
Table 5. Butt Joint Core Density Averages by Profile Location
Joint Location (within the density profile) A B C D E
Sample Size 38 39 26 39 39
Average Density 89.9 87.4 85.6 90.4 91.2
A = 1 foot cold side B = 6 inches cold side C = joint location D = 6 inches warm side E = 1 foot warm side
The two sets of data are shown in profile in Figure 11. The volumetric core density
average values in Figure 11 do include the values from the Rt 341, Kent project.

22
Volumetric Core vs. Corrected Nuclear Density (Butt Joints
85
86
87
88
89
90
91
92
12" Cold 6" Cold Joint 6" Hot 12" Hot
Joint Profile Location
Aver
age
Dens
ity(%
MTD
)
Core Density Corrected Nuclear Density
Figure 11 Butt Joint Core and Corrected Nuclear Density by Profile Location
Given the data and graphical depictions of the density in Tables 4, 5 and in Figure 11, it
is clear that the density in the vicinity of 6 inches on the cold side to the joint location
itself (Locations B and C) exhibit a significantly lower density value than all of the other
areas (Locations A, D and E). It can also be observed that the density at Locations D and
E exhibit the highest level of density within the profile. The difference from Location C
to Location D, is the largest (most significant) change in density over the profile whether
looking at nuclear density data or volumetric core data. This is largely due to the
presence of lateral confinement from the previous pass when paving the second pass and
finishing the longitudinal joint.
The population comparisons between profile locations for the butt joint were made using
the nuclear density data. This was done due to a substantially larger data set than there is
for the volumetric core values even though there were no nuclear data for Project # 174-
332H, Rt 341 in Kent. It was desirable to utilize the nuclear data as it came from a much
larger data set than the core data.

23
The statistical breakdown of the comparison from location to location within the butt
joint data set was made via several single factor analyses of variance (Appendix D, using
a 95% confidence limit). When comparing Location A to Location B, there exists a
statistically significant difference in density (P < 0.001). This may be attributed to the
fact that Location A lies 12 inches from the joint location while Location B only lies 6
inches from the butt location. As the joint location is approached as would be from the
center of the mat, it can be expected that the density would drop in a somewhat linear
fashion. That is, for each unit length closer to the unconfined edge of the mat, the density
would also drop one unit of measurement due to lack of lateral confinement at the edge of
the first pass. This is nearly the case with respect to locations A and B. It can be seen
that there is an inadequate level of density overall at both this location and the joint
location. In looking at the density behavior when the second pass is placed, given Figure
11, and the variance analysis between locations C and D in Appendix D, the density
improves drastically. That is there is a very large separation in the statistical density
averages between these locations. This vast improvement in the overall density value is
due in part to the fact that there is the first pass present for which the edge of the second
pass can be compacted against. There exists some level of lateral confinement from the
first pass such that the hot side of the joint is allowed to be compacted to a greater degree
than was the first.
Utilization of a Rubberized Joint Sealant Project #91-108 – Route 219 in New Hartford is a pilot project which utilized a joint seal
material applied to a traditional butt joint. It was paved during the month of October
2007. The bituminous concrete material was supplied by Galasso Materials out of East

24
Granby, Connecticut. The paving consisted of two 2-inch lifts of 0.375-inch Superpave
level 2. The joint seal material was used on the top lift only. A section of roadway at the
northern end of the project was chosen for the pilot project. The remaining sections of
the project used the traditional butt joint without sealant applied. The project was paved
in two paver passes, creating a single longitudinal joint at the center of the roadway.
Project Equipment: Galasso used no special equipment during paving to create the butt
joint. Normal paving practices were used. Santoro, Inc. performed the joint seal
application. They used a melting pot mounted on a trailer with a wand applicator. The
material used was supplied by Crafco, Inc. The product was their Pavement Joint
Adhesive, Product #34524. See Figures 12 - 14.

25
Figure 12 Rubberized Joint Sealant Melting Pot on Trailer
Figure 13 Rubberized Joint Sealant Application

26
Figure 14 Rubberized Joint Sealant Applied to Cold Side of Joint
Field Observations- Constructability: The method of application consisted of the trailer
mounted melting pot being pulled by a pick-up truck with a technician applying the joint
adhesive by wand to the joint. The application rate was controlled by a valve on the
wand handle. The “foot” applicator at the end of the wand was dragged along the face of
the butt joint spreading the joint seal material.
Field Observations- ConnDOT Pavement Advisory Team: The rough surface of the butt
joint made applying the material evenly difficult. Any short stops allowed joint seal
material to slightly puddle. Quick movements resulted in a lack of adequate joint seal
material in those small areas. To help resolve this issue, the paving contractor’s lute-man
used his lute to lightly compact the rough, unconfined edge of the butt joint. Using a

27
tamping motion, it was just enough to flatten the edge so the wand could slide more
easily along the butt joint. This greatly improved the consistency of the application.
Field Observations- Acceptance of the Joint: Nuclear density tests were performed by
consultant inspectors with Dewbury/Goodkind for acceptance by ConnDOT. The
average density of the longitudinal joint with no joint seal applied was 93.1%. The
average density of the longitudinal joint with joint seal applied was 94.8%, an average
increase of 1.7%. These averages are the averages as measured for acceptance and do not
reflect any of the values as measured by the research team.
A performance analysis on the use of the rubberized joint sealant is difficult at this time
in that it depends on the length of time for which the joint remains durable. This analysis
may be performed in the future. For purposes of this research, it was desired to try and
combine this data with the data already collected for the butt joint. There were only 20
cores (4 sections) of data collected on this project. To make the determination as to
whether or not this data could be combined with the existing butt joint data, the density
averages of those sections which were paved using the joint sealant were simply plotted
against the existing density averages. This plot is shown in Figure 15.

28
Rt 219 New Hartford. Joint Adhesive Cores Compared with All Butt Joint Cores
84.0
85.0
86.0
87.0
88.0
89.0
90.0
91.0
92.0
93.0
94.0
12" Cold 6" Cold Joint 6" Hot 12" Hot
Joint Profile Location
Aver
age
Dens
ity (%
MTD
)
Adhesive (3) All Butt Joint Cores
Figure 15 Effect of Rubberized Joint Sealant
As seen in Figure 15, the joint adhesive had little (if any) effect on the density behavior at
the joint location. The density plots also cross over each other indicating some similarity.
As such, it was decided by the research team that this data could be included with the butt
joint data and there was no reason to treat it any differently. That decision being made,
all butt joint data presented in this report includes the cores and nuclear density values
obtained from Project #91-108.
Notched Wedge Pilot Projects The notched wedge joint was tested on two ConnDOT projects during the 2006
construction season and on one pilot project during the 2007 construction season. The
first was a Vendor-in-Place (VIP) State Project on Route 15 in Berlin: Project #171-
326C. The second was a ConnDOT Construction Project on Route 80 in North Branford:
Project #98-98. The third project which took place during the 2007 construction season
was a ConnDOT Construction project on Interstate 91 in Windsor, Project #63-577. All
three projects were paved at night.

29
Project #171-326C Description Rt. 15 in Berlin, Connecticut was the first pilot project, paved on the nights of September
6 - 7, 2006. The asphalt material was supplied by Tilcon Connecticut’s Plainville plant.
The material was also placed by one of Tilcon’s paving crews. The roadway had a
Portland Cement Concrete base overlaid with bituminous concrete. The bituminous
concrete surface was first milled at a depth of 75-mm (3 inches). A 25-mm (1 inch)
leveling course of Superpave 9.5-mm (0.375 inch) traffic level 3 was placed over the
milled surface prior to the wearing surface which consisted of a (50-mm) 2 inch course of
Superpave 12.5-mm (0.5 inch) traffic level 3. The notched wedge joint method was
applied to the top course between the right and left travel lanes in the northbound
direction only. Longitudinal joints for the right shoulder and left turn lanes consisted of
the standard butt joint. The southbound lanes consisted of the standard butt joint method
for all longitudinal joints.
To allow for a continuous paving operation, two pavers were used. A small paver was
used to pave the left turn lanes and gore areas out in front of the main paver. This
allowed the main paver, utilizing the notched wedge joint equipment, to pave the left
travel lane and shoulder in a single pass without interruption. The main paver simply
matched the butt joint along the left turn lanes as it passed. These butt joints were
constructed in a warm state as opposed to the notched wedge joints which were
constructed over two nights. An effort was made to locate the notched wedge joint over
the centerline longitudinal joint of the concrete base. This could make it difficult to
identify the source of cracking if this project is examined in the future.

30
Project Equipment: Tilcon modified their equipment to help in the compaction of the
notched wedge joint. In order to attach the vibrating plate to the paver, mounting points
were welded or cut into the wing of the paver. A welded steel pipe, chain binder and
chains were used to attach the plate at various points. The chain mounts were adjustable
to keep the plate parallel to paving. The vibrating plate was connected to run off the
hydraulic system of the paver’s vibrating screed so they started and stopped in unison.
To ensure that the vibrating plate’s width matched that of the wedge, it was further
modified by cutting off a portion of the base and welding it back at an angle to prevent it
from dragging on the base which is pointed out by the arrow in Figure 3.
Additional equipment used in the paving operation included a Roadtec SB-2500 Material
Transfer Vehicle (MTV) and the TOPCON non-contact automatic grading system.
Tack coat was applied with special attention to ensure proper coverage to include under
the wedge portion of the joint. This was considered important to achieve sufficient
bonding of the material forming the joint to help prevent raveling when exposed to
traffic.
Field Observations – Constructability: After some minor adjustments, the wedge
attachment appeared to function well. The plate compactor seemed to work very well
also. Density was not measured on the actual taper of the joint however it appeared to be
smooth and uniform. Minor adjustments were made throughout the night to achieve and
maintain the desired notch depth, slope of the wedge and position of the compactor.
There were no major problems with the functionality of the attachment or the vibrating
plate compactor. The only significant incident occurred when the wing of the paver with

31
the attachment was inadvertently closed. This severed a chain connection to the vibratory
plate which was quickly repaired and paving continued.
By using this new joint method, the contractor was able to complete the entire travel lane
in a single pass. This eliminated the need for two transverse construction joints. Thus,
not having to back the paver up between passes and change warning sign patterns saved a
considerable amount of time and effort. Adjustments to maintain the proper notched
wedge required minimal down time.
On the second night, the notched wedge joint was completed. One issue was placing tack
coat on the wedge portion of the joint. The tack coat was placed using a tack truck and
the difficulty was to not over spray tack material onto the finished surface. The result
was that the coverage varied. On average, only the bottom half of the wedge was coated.
The trial specifications called for the entire wedge and notch to be coated. This was not
possible with the tack coat application method being used.
Field Observations - ConnDOT Pavement Advisory Team – Traffic on Open Joints:
The notched wedge joint was inspected and evaluated the following day. A video
recording of the construction and daily traffic use of the joint was made by the ConnDOT
Pavement Advisory Team. The joint held up very well to traffic with minimal raveling.
Cars and trucks alike had no problem traversing the joint while changing lanes. Some
large loose aggregate was noticed in the travel lanes later that morning after the notched
wedge joint was exposed to traffic for a few hours. It was assumed that the open wedge
was the source of the loose aggregate. At approximately 10:30 AM, a sweeper was used

32
to clean the travel lanes of the loose aggregate. No problems or claims of damage were
reported.
Field Observations – Acceptance Testing of the Joint: Nuclear density tests performed
by ConnDOT for acceptance on the notched wedge joint averaged 92.5% of Maximum
Theoretical Density (MTD) with no failing tests. The procedure ConnDOT used on the
joints for acceptance testing on this project is as follows. All ConnDOT nuclear density
measurements were taken after the warm side of the joint was paved and compacted.
ConnDOT personnel placed the gauge immediately to the warm side of the line that
formed once the joint was completed. Because the joint was a notched wedge joint, this
positioned the gauge directly over the top of the wedge. Two thirty-second
measurements were made per location. The gauge was rotated 180º between
measurements. There were six joint measurements taken by ConnDOT for acceptance
testing.
The CAP Lab completed their nuclear density testing and core sampling. Cores were
taken at three longitudinal joint locations. Five cores were extracted at each location.
Project #98-98 Description Rt. 80 in North Branford, Connecticut, was the second pilot project investigated. It was
paved on the nights of October 10 -12, 2006. The material was supplied by Tilcon
Connecticut’s North Branford plant. The material was placed by CT Paving. A 50-mm
(2 inch) course of Superpave 12.5-mm (0.5 inch) level 2 was used. This was a full depth
reconstruction project with a bituminous concrete base. The base course was 150-mm (6
inch) of Superpave 37.5-mm (1.5 inch) level 2. The lift directly below the top 50-mm (2

33
inch) lift was 40-mm of Superpave 12.5-mm (0.5 inches) level 2. Since there was no
underlying concrete longitudinal joint for reference on this project such as there was in
the previous project, the notched wedge joint was located in the normal location for all
bituminous longitudinal joints; offset a minimum 6 inches from the underlying
longitudinal joint. The notched wedge joint was used for the wearing surface only.
Some milling took place at transitions.
Project Equipment: The contractor utilized the same notched wedge joint device and
vibrating plate as the contractor in the previous pilot project. They modified their paver
to adapt to the new equipment. However, there were some mechanical improvements to
the device and vibrating plate setup. The vibrating plate had new mounting locations.
While the primary attachment was still mounted to the wing, the chain attachments were
mounted to the body of the paver. This eliminated the danger of cutting the chain when
closing the wing. A ratcheting device (chain binder) was added to the chain mount to
make it easier to adjust the angle of the vibrating plate. Figure 16 shows the setup used
on this pilot project.

34
Figure 16 Compaction Device Setup and Attachments
This project was shorter in overall paving lane length and did not have a center median
area or any left or right turning lanes. Therefore, there was no need for a second paver
and only a single paver was used. A Material Transfer Vehicle was not incorporated to
the placement of this material. A 30-foot long contact ski was used for automatic grade
control.
Field Observations – Constructability: The first night, October 10, 2006, the westbound
travel lane and shoulder were placed. Again, the entire travel lane and shoulder were
completed eliminating all transverse construction joints. By paving both the travel lane
and shoulder, the exposed notched wedge joint was at the centerline of the roadway
(Figure 17). This also meant that a completed joint was formed between the shoulder and

35
westbound travel lane that same night. Tack coat on the joint was again an issue. The
majority of the joint had only the bottom half coated as shown in Figure 18. This
problem would need to be addressed on future trial or study projects incorporating the
notched wedge joint method.
Figure 17 Traffic on Open Notched Wedge Joint
Figure 18 Tack Coat on Bottom Half of Wedge
Tack Coat
Cold Side
8” – 12” Taper

36
The two west bound lanes being paved remained closed to traffic through the course of
the first night’s paving so the exposed notched wedge which would connect the shoulder
with the travel lane was not subjected to any traffic. On the second night, the eastbound
travel lane was paved and the traffic was all shifted into the west bound travel lanes.
During paving of the eastbound lane and shoulder, the notched wedge joint separated the
construction zone from the traffic. Thus, the only traffic to traverse the exposed wedge
was traffic needing to cross the eastbound lanes to access a business or side road which
was infrequent. The eastbound shoulder was paved on the third night.
Field Observations – ConnDOT Pavement Advisory Team - Traffic on Open Joints: The construction and use of the exposed joint as it was opened to traffic was filmed once
again by ConnDOT’s Pavement Advisory Team. Because the joint was located at the
centerline of opposing traffic, it was not traversed as regularly as it was on the previous
project. It was only traversed when cars were entering/exiting businesses and side streets.
This resulted in very little loose aggregate visible in the travel lanes. No additional
sweeping was performed as it was deemed not to be necessary. Once again, cars and
trucks had no problem traversing the notched wedge joint (Figure 19).

37
Figure 19 Traffic Traversing Open Joint
Field Observations – Acceptance Testing of the Joint: Nuclear density tests performed
by ConnDOT for acceptance on the notched wedge joint averaged 93.5% of Maximum
Theoretical Density (MTD) with no failing tests. The procedure ConnDOT used on the
joints for acceptance testing was similar to the procedure used on Project 171-326C. All
ConnDOT nuclear density measurements were taken after the warm side of the joint was
paved and compacted. ConnDOT personnel placed the gauge immediately to the warm
side of the line that formed once the joint was completed. Because the joint was a
notched wedge joint, this positioned the gauge directly over the top of the wedge. Two
thirty-second measurements were made per location. The gauge was rotated 180º
between measurements. There were five joint measurements taken by ConnDOT for
acceptance testing each night. There were three nights of testing which resulted in a total

38
of 15 nuclear density measurements taken on the joint for acceptance over the course of
the project.
The Connecticut Advanced Pavement Laboratory was on site again to core the notched
wedge joint. ConnDOT District III performed the nuclear density testing for acceptance.
Project #63-577 Description Interstate 91 in Hartford, Connecticut, and Windsor, Connecticut was the third pilot
project utilizing the notched wedge joint. It was paved at night during the months of July
through October 2007. The material was placed by Tilcon Connecticut and supplied by
their Plainville plant. The bituminous concrete surface was first milled at a depth of 75-
mm (3 inch). A 25-mm (1 inch) leveling course of Superpave 4 level 2 mix was placed
over the milled surface prior to the wearing surface which consisted of a 50-mm (2 inch)
course of Superpave 12.5-mm (0.5 inch) traffic level 4. The notched wedge joint was
used on the surface course in the mainline travel lanes only. It was not used on the right
or left shoulders, High Occupancy Vehicle (HOV) lanes, separator lane or most ramps.
These other areas utilized the standard butt joint.
Project Equipment: Tilcon utilized the same notched wedge joint device and vibrating
plate as the previous two pilot projects. It was, however, modified once again in the way
that the vibrating plate was attached to the paver. The chain and ratcheting device were
replaced by a steel bar that was able to be more quickly adjusted and fixed at any length,
thus reducing the time for plate adjustments. See Figures 20 and 21.

39
Figure 20 Vibrating Plate Attachments
Figure 21 Vibrating Plate Attachments
Field Observations- Constructability: As with the other projects, the notched wedge joint
was constructed without experiencing any major issues. The angle and slope were
40
adjusted throughout placement as necessary and done with relative ease. Adjustments to
the paver wing caused some minor difficulties. When the wing needed to be adjusted
either in or extended out, it took several feet (25-50 ft.) to regain the proper wedge. This
was partially due to necessary adjustments to the position of the plate compactor.
Consecutive lanes had to be paved to reach the application of grade. This was necessary
for water flow off the highway in case of inclement weather. The tack coat operation was
much improved. The operator applied the tack in reverse using only the last three nozzles
of the spray bar. The wedge portion of the joint was almost completely covered in most
areas up to the top notch unlike the previous two projects during the 2006 construction
season in which generally only the bottom portion of the wedge was tacked. The travel
lanes then received the tack coat application using the full spray bar.
Field Observations- ConnDOT Pavement Advisory Team- Traffic on Open Joints Interstate traffic had no problems traversing the exposed notched wedge joint. The first
project left the joint open between travel lanes on a two-lane split highway, speed limit
50 mph, and the second was a single-lane secondary roadway, speed limit 40 mph. This
was the first pilot project that left the joint open between travel lanes on a limited access
highway with a posted speed limit of 65 mph. Traffic regularly travels at or above this
posted speed in this area. The joint had no failing or spalling areas due to traffic. There
was little or no large aggregate loss observed on the roadway after the joint was exposed
to traffic. Having traffic traverse the joint at highway speeds appeared to have no more
effect on the notched wedge joint than slower moving traffic.

41
Field Observations- Acceptance Testing of the Joint: Nuclear density tests were
performed by ConnDOT, Vanasse Hangen and Brustlin, Inc., (VHB) and Garg
Consulting Services for acceptance on the notched wedge joint. There were several nights
of joint density testing. Of those, only two nights had average densities below
specification (92.0%- 97.0%), each of those nights averaging 91%. One night averaged
above specification at 97.9%. The overall average joint density for the project was
93.4%. It should be noted that the data collected by the research team does not reflect
any of these numbers. The Connecticut Advanced Pavement Laboratory cut cores in the
joint and mat for testing purposes.
Analysis of Project #63-577 Over the course of the 2006 construction season, there were only two opportunities for
the research team to collect data and observe density behavior on notched wedge joints.
Neither of these two projects lasted long enough to yield a satisfactory sample size to
base any intelligent analysis on. At the conclusion of the 2006 construction season, there
were only three sections of data collected on the first project and four sections of data
collected on the second project. Even as a composite sample this was hardly sufficient.
Fortunately, during the 2007 construction season, ConnDOT constructed Project #63-577
for which there was large scale use of both the notched wedge joint and the butt joint.
There were also sections of the notched wedge which were left open to traffic over night
and sections that were finished in the same night. This data was more favorable for
analysis as the project was constructed by one crew, the material came from the same
source and overall variability was thus reduced. The research team was able to collect a
larger data set, and although all data will be finally combined to use in a composite
fashion, it was desired to conduct an analysis on this project alone as well.

42
In total, there were eight sections (40 cores) of data collected for the notched wedge
sections on this project and five sections (25 cores) of data collected from the butt joint
sections. This totaled 65 cores cut and 325 nuclear density measurements for analysis.
Figure 22 shows the density comparison between the two joint construction methods
based on the results of the cores which were not damaged.
Notched Wedge vs. Butt Joint Density Behavior (I-91 Windsor 2007) Data Based on Volumetric Core Density Only
84.0
85.0
86.0
87.0
88.0
89.0
90.0
91.0
92.0
12" Cold 6" Cold Joint 6" Hot 12" Hot
Joint Profile Location
Ave
rage
Den
sity
(%M
TD)
Butt Joint Notched Wedge Joint
Figure 22 I-91 Windsor Average Joint Density Comparison (Notched Wedge vs. Butt Joint)
In viewing the plots in Figure 22, it is clear that the density in the sections which utilized
the butt joint exhibited a large decrease in density (~4.5 % MTD) moving from 6” on the
cold side to the joint location itself. There is also a drop in density (~2.0% MTD) from
12” on the cold side to 6” on the cold side. This decrease in density is then mitigated
moving from the joint location to 6” on the hot side of the joint. This inconsistency is not
present when viewing the plot which outlines the density of the notched wedge sections.
The notched wedge plot remains relatively uniform moving across the longitudinal joint
in comparison with the plot of butt joint density. Also of importance in this comparison
is simply the improvement in the level of density at the joint location with the use for the
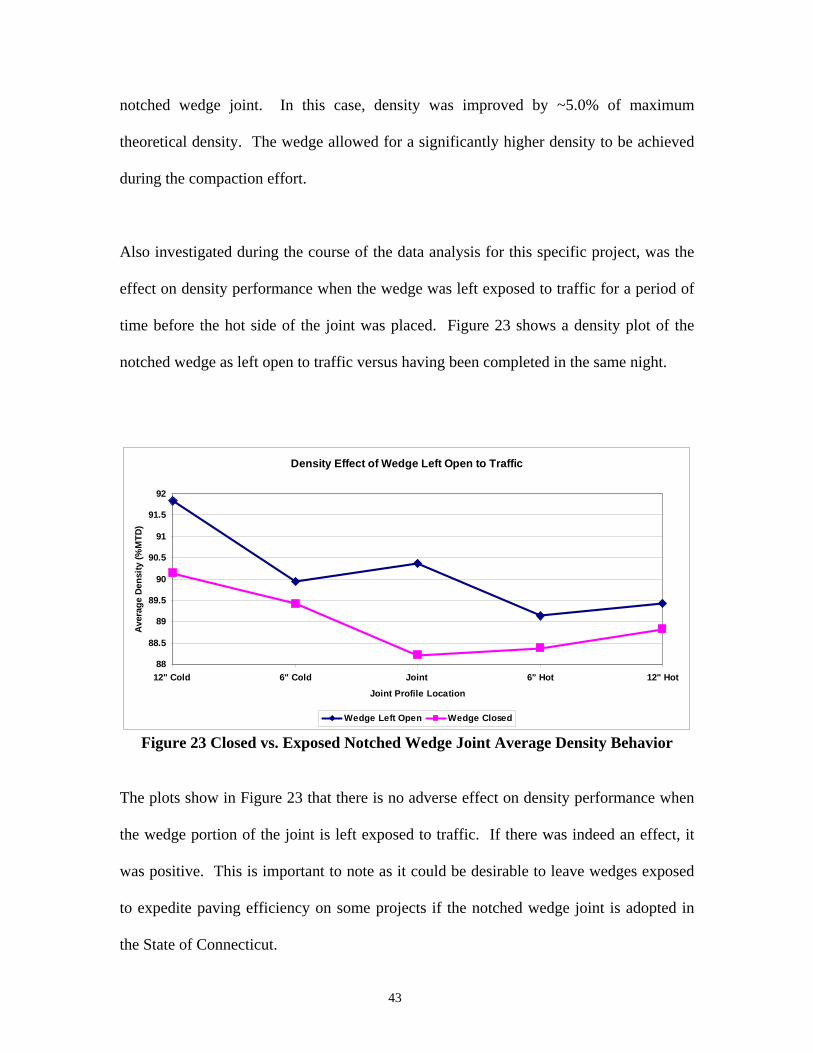
43
notched wedge joint. In this case, density was improved by ~5.0% of maximum
theoretical density. The wedge allowed for a significantly higher density to be achieved
during the compaction effort.
Also investigated during the course of the data analysis for this specific project, was the
effect on density performance when the wedge was left exposed to traffic for a period of
time before the hot side of the joint was placed. Figure 23 shows a density plot of the
notched wedge as left open to traffic versus having been completed in the same night.
Density Effect of Wedge Left Open to Traffic
88
88.5
89
89.5
90
90.5
91
91.5
92
12" Cold 6" Cold Joint 6" Hot 12" Hot
Joint Profile Location
Aver
age
Dens
ity (%
MTD
)
Wedge Left Open Wedge Closed
Figure 23 Closed vs. Exposed Notched Wedge Joint Average Density Behavior
The plots show in Figure 23 that there is no adverse effect on density performance when
the wedge portion of the joint is left exposed to traffic. If there was indeed an effect, it
was positive. This is important to note as it could be desirable to leave wedges exposed
to expedite paving efficiency on some projects if the notched wedge joint is adopted in
the State of Connecticut.

44
Initial Profile Analysis: All Notched Wedge Joint Projects
After the correction factors had been applied, an overall average was taken of nuclear
density by profile location. That is all of the nuclear densities for the location 1 foot from
the joint on the cold side were averaged. This was repeated for the locations 6 inches
from the joint on the cold side, the joint location, 6 inches from the joint on the warm side
and 1 foot from the joint on the warm side. This included data from all three notched
wedge projects as well as all nine butt joint projects. (The average core values are given
for all nine of the butt joint projects while the average corrected nuclear density values
were given for eight of the butt joint projects as there were no nuclear density values
obtained from Project #174-332H). The corrected nuclear density averages taken along
the notched wedge joint can be seen in Table 6.
Table 6. Corrected Nuclear Density Averages by Profile Location for All Notched Wedge Joints
Joint Location (within the density profile) A B C D E Sample Size 75 75 75 75 75 Average Density (%MTD) 89.7 88.5 88.5 90.2 89.5
A = 1 foot cold side B = 6 inches cold side C = joint location D = 6 inches warm side E = 1 foot warm side
As a quick check for relevance, the same averages were computed for the volumetric
density values of the cores by profile location, albeit the sample size was only about 1/5th
that of the nuclear density values. These averages are shown in Table 7.
Table 7. Core Density Averages by Profile Location for All Notched Wedge Joints
Joint Location (within the density profile) A B C D E Sample Size 15 14 11 15 14 Average Density (%MTD) 90.3 89.0 88.8 89.2 90.0
A = 1 foot cold side B = 6 inches cold side C = joint location D = 6 inches warm side E = 1 foot warm side

45
In comparison, the average values are relatively close between the nuclear density
averages and the core averages. The largest difference was at location D (6" on the hot
side of the joint) which was 1.0% MTD. The nuclear density values at these locations
were higher than the volumetric density values of the cores cut at those locations. It was
speculated that the largest difference would be at the joint location. The nuclear gauge in
some cases needed to be shifted slightly in the transverse direction from the joint in order
to ensure adequate contact at the interface of the pavement and the nuclear density gauge.
At times, there was a slight hump or vertical irregularity in the pavement surface that
would cause this.
Figure 24 shows a plot of the average nuclear density behavior. The cold side of the joint
overall appears to maintain lower density and more specifically the area of lowest density
occurs from 6 inches on the cold side of the joint to the joint location itself which was
also the case for traditional butt joints which will be discussed later in further detail. This
may be due in part to less lateral confinement present during the compaction of the first
paver pass. During the compaction of the second paver pass, the first paver pass provides
the lateral confinement that the second pass can be compacted against. This holds true
for traditional butt joints as well.

46
Notched Wedge Joint Average Corrected Nuclear Density by Profile Location
88.0
88.5
89.0
89.5
90.0
90.5
12" Cold 6" Cold Joint 6" Hot 12" Hot
Joint Profile Location
Aver
age
Dens
ity (%
MTD
)
Figure 24 Notched Wedge Average % Corrected Nuclear Density by Profile
Location
Notched Wedge Joint Average Volumetric Core Density by Profile Location
88.0
88.5
89.0
89.5
90.0
90.5
12" Cold 6" Cold Joint 6" Hot 12" Hot
Joint Profile Location
Aver
age
Dens
ity (%
MTD
)
Figure 25 Notched Wedge Average % Volumetric Core Density by Profile Location
Also of importance are the population comparisons between profile locations in the
datasets. In addition to a graphical depiction of the differences in density from location A
to location B, from B to C, etc., a statistical population comparison was conducted
between different locations within the density profile to determine if in fact these
differences were significant. This was done with five simple, single-factor analyses of
variance (ANOVA). The ANOVA takes into consideration the mean value, standard

47
deviation and sample size of both populations. A statistic ( F ) is then calculated based
on these three factors. Then, given the sample size, a value for which this statistic is
compared against ( Fcrit ) is derived. Fcrit is the value for which the statistic F must not
exceed in order for a statistical difference between sample sets to be non-existent. These
comparisons were all made on a spreadsheet program with data analysis tools. The
comparisons are shown in Appendix E.
Considering both Figure 23 and Appendix C, the graphical differences between density
profile location A and B (12” on the cold side and 6” on the cold side) can be explained
by the magnitude of the statistic F. The drop in density from 1 foot on the cold side to 6
inches on the cold side is shown both in the plot as well as the amount that the statistic F
exceeds the critical value of F. The critical value of F is more than doubled indicating a
large statistical difference between the two average density values. This is due to the lack
of lateral confinement as the edge of the cold pass is compacted. Even though in most
cases the wedge was compacted by the vibratory plate, this shows that there may be more
effort required to gain additional compaction towards the joint during the first paver pass.
This is not the case for the comparison between location B and location C (6” on the cold
side and the joint location). It can be seen in the plot that the density average remains
steady moving between these locations. This is also shown by the statistic F which does
not exceed its critical value as shown in Appendix E and, therefore, there is not a
statistically significant difference between the average density values at these locations.

48
This scenario is then reversed as there is a significantly large difference in density
between the joint location and 6" on the hot side of the joint. The comparison between
the joint and 6 inches from the joint on the warm side indicates an increase in density on
the warm side of the joint as well. Fcrit was indeed exceeded by several times the
statistic F in this comparison as can be seen in Appendix E. This is also evident in the
slope increase between these two points on the plot. This is most likely due to the
presence of the already placed cold side to act as lateral confinement for the warm side of
the joint. This reinforces that the lateral confinement present at the joint location during
the placement of the second pass has a positive impact on the density achieved at that
location.
There is also a statistically significant difference between locations D and E (6” on the
hot side and 12” on the hot side). The average density value decreases from 6 inches on
the warm side to 1 foot on the warm side by approximately 0.75% of Maximum
Theoretical Density. The difference is not as significant as seen in the previous
comparison as both can be seen in Appendix E and this level of variation in density could
be expected across a uniform mat.
It can also be seen that the average density value 1 foot from the joint on the warm side is
very near the average density value 1 foot on the cold side. (Within 0.25% of maximum
Theoretical Density) This indicates the non-homogeneous nature of the density around
the joint and that those conditions become more homogeneous toward the center of the
mat.

49
Also examined and compared were the two locations 6” on either side of the joint
location. As stressed earlier, lateral confinement plays a large role in achieving desirable
levels of density at the joint and this is evident in comparing location B and location D
(6” on the cold side and 6” on the hot side). The average difference in density is
approximately 1.75% and, as shown in Appendix C, this difference is one of the largest
and most significant of all the comparisons indicating it should be considered for further
improvement in future studies.
Comparison: Notched Wedge vs. Butt Joint
The notched wedge joint data was taken from three projects, which comprised a total of
fifteen sections, or 75 total cut cores, of which six were discarded as damaged or
unusable. The butt joint projects constructed during the 2006 and 2007 construction
seasons were more prevalent and there is more data available for those projects. The
2006 and 2007 butt joint data included nine projects, which comprised a total of 39
sections, or 195 cut cores of which 14 were discarded as damaged. On one of the butt
joint projects where there were eight sections of cores collected (40 cores), there are no
nuclear data available.
Table 8 shows the average nuclear density by profile location between the two joint
construction methods while Table 9 shows the average core density values by profile
location. It should be repeated at this time that there is volumetric core data available for
the Rt. 341, Kent project; however, there is no nuclear density data available. This means
that only the core density dataset is included in the data for that project.

50
Table 8. Corrected Nuclear Density Values
Joint Location (within the density profile)Butt Joint Data
A B C D E
Sample Size 155 155 155 155 155 Average Density 89.1 86.8 87.5 90.8 90.7Joint Location (within the density profile)Notched Wedge Joint Data A B C D E
Sample Size 75 75 75 75 75 Average Density (%MTD) 89.7 88.5 88.5 90.2 89.5
A = 1 foot cold side B = 6 inches cold side C = joint location D = 6 inches warm side E = 1 foot warm side
Notched Wedge Joint vs. Butt Joint Nuclear Density Profile Comparisons
86
86.5
87
87.5
88
88.5
89
89.5
90
90.5
91
12" Cold 6" Cold Joint 6" Hot 12" Hot
Joint Profile Location
Aver
age
Dens
ity (%
MTD
)
Butt Joints Notched Wedge Joints
Figure 26 Butt Joint vs. Notched Wedge Joint (Nuclear Density)
Table 9. Core Density Values
Joint Location (within the density profile)Butt Joint Data A B C D E
Sample Size 38 29 26 39 39 Average Density 89.9 87.4 85.6 90.4 91.2Joint Location (within the density profile)Notched Wedge Joint Data A B C D E
Sample Size 15 14 11 15 14 Average Density (%MTD) 90.3 89.0 88.8 89.2 90.0
A = 1 foot cold side B = 6 inches cold side C = joint location D = 6 inches warm side E = 1 foot warm side

51
Notched Wedge Joint vs. Butt Joint Volumetric Core Density Profile Comparisons
85
86
87
88
89
90
91
92
12" Cold 6" Cold Joint 6" Hot 12" Hot
Joint Profile Location
Aver
age
Dens
ity (%
MTD
)
Butt Joints Notched Wedge Joints
Figure 27 Butt Joint vs. Notched Wedge Joint (Core Density)
It appears, based upon these comparisons, that the notched wedge joint provides a higher
level of density on the cold side of the joint than does the butt joint. This is the case with
both of these two comparisons. This could perhaps be a result of the material present in
the wedge acting as lateral confinement for the material being compacted at locations A
and B. The density at the joint itself appears to be higher on the notched wedge joint than
the butt joint when examining both the core density values as well as the nuclear density
values. The density at location D (6 inches on the hot side) appears to be less than 1%
lower on the notched wedge joint than the butt joint on both plots. The density of the
material at location E (12 inches on the hot side) is also lower for the notched wedge joint
than the butt joint when examining the core and nuclear density as well. In both cases,
the difference is less than 1.5% and this level of variation can be expected as density is
observed across a pavement mat. The profiles illustrating the density performance for the
butt joints is less uniform than that of the notched wedge joint as well. The range of
density within the butt joint averages is 5.6% MTD while that of the notched wedge joint

52
averages is 1.5% MTD based on core values. The higher level of density achieved with
the use of the notched wedge joint combined with the more uniform density profile across
the joint displayed for both density measurement techniques implies that that the notched
wedge joint may be a more preferable method of joint construction from a measureable
performance standpoint.
Conclusions Based on the data analyzed throughout this report, it is evident that if a correction factor
or bias is to be established for use with a nuclear density gauge, cores need to be cut from
the mat which the gauge is to be used on and a correction factor developed in accordance
with or similarly to that process outlined in ConnDOT Report # CT-2242-F-05-5. This
correction factor procedure prescribes those cores with density values in excess of 2%
MTD less than the corresponding nuclear density values be discarded. It was found over
the course of this research that those cores need to be visually analyzed in order to
determine whether they were damaged during the extraction process before the values are
discarded. This method of correction was shown to produce more accurate results than
was the current method employed by ConnDOT using the block bias method. The
correlation procedure prescribes that 10 random mat cores be cut in order to develop a
correction factor that will be beneficial to the accuracy of the nuclear density data.
There is a statistically significant lower average density value 6 inches on the cold side of
the joint than on the warm side of the joint for both the notched wedge joint comparisons
as well as the butt joint comparisons. That can be seen in the comparisons in Figures 7,
26 and 27 as well as in Appendix D and Appendix E. This can be attributed to a lack of
lateral confinement on the joint edge during compaction of the first pass or cold side

53
which allows lateral movement of the joint material. This is also evident in the
comparisons between the joint location and 6” on the warm side of the joint as seen in the
above comparisons particularly within the butt joint dataset. There is a large increase in
average density between these two locations for both sets of data. This also can be seen
graphically in Figures 7, 26 and 27. The reason for this increase is the presence of the
edge of the first pass (cold side) providing lateral confinement for the material being
compacted at the edge of the second pass thus resulting in the significantly higher
density.
The notched wedge joint provided for an overall average higher density at the joint
location as well as on the cold side of the joint. The plots in Figures 26 and 27 display
this as do the variance analyses in Appendices D and E.
The range of average density moving across the longitudinal joint was smaller on the
notched wedge joints than it was on the butt joints. This smaller range in average density
across the profile demonstrates that the notched wedge joints provided a more uniform
density profile than did the butt joints and this was particularly evident in the location 6
inches on the cold side as well as directly on the joint location itself.
The use of the notched wedge joint did not impede the paving process during the three
investigated pilot projects. Crews will also become more familiar and efficient with this
process as they gain experience with it.
54
The application of a rubberized joint sealant on the cold edge of the butt joint on one pilot
project was investigated. This process did not impede construction and the there is no
reason at this time to believe that the initial density performance of this type of
construction behaves differently than traditionally constructed butt joints. However, only
long-term observation of this joint’s performance can be used to validate its potential for
improved durability.
Recommendations
It is recommended at this time that any correction factor or bias established for use with a
nuclear density gauge on hot mix asphalt be done so with cut cores similarly to the
method described in ConnDOT Report # CT-2242-F-05-5 as opposed to using Portland
cement concrete blocks and/or granite blocks as has traditionally been the case with
ConnDOT.
There is sufficient evidence in this research to suggest that the use of the notched wedge
joint as constructed on the three discussed pilot projects does not adversely impact the in
place performance properties of the hot mix asphalt at or around the joint location. As
shown in the plot comparisons, the notched wedge joint provided a smoother and more
uniform density profile as well as a higher overall density at the joint location.
Therefore, the research team feels there is no reason that the use of this joint construction
method should be delayed or withheld in the State of Connecticut.
Additional monitoring of the projects investigated in this research should also take place.
The long term performance of the stated notched wedge joint projects compared with the
investigated butt joint projects would provide insight as to the effect of age on the

55
performance of each different joint type including the rubberized joint sealant.
Additional pilot projects should be considered using the joint adhesive materials. The
one pilot project that utilized the joint adhesive was constructed with little to no traffic on
the roadway as that section of the road was closed to all through traffic.
Consideration of a joint density specification that measures the density on both the cold
side of the joint and warm side joint should be considered. Under the ConnDOT
specification, only the densities on the warm side of the joint are used for the acceptance
process. Data collected for this project demonstrates that the density on the cold side of
the joint is considerably lower than the warm side density. The joint densities on the
warm side tend to be much higher as there is confinement during the compaction process
which leads to higher densities. Therefore, one side of the longitudinal joint may have a
relatively high density and the cold side of the joint may have relatively low density. The
low density on the cold side of the joint is, therefore, the weak link in the mat and may
very well be the cause of poor joint performance. The recommended changes to
longitudinal joint density specification would use the average of the warm and cold side
densities. It is unrealistic to expect the average density of the longitudinal joint to
achieve a minimum density of 92 percent as currently required. Some data collection
would have to be performed to determine what minimum average density value of the
warm and cold sides could be realistically achieved.
The tapered portion of the notched wedge joint should be compacted using a vibrating
plate compactor or other means at the time of construction. The research team believes
that this compaction serves three purposes. The first benefit of the compaction of the

56
taper is that the compaction of the taper immediately after placement provides density at
the taper while it is still warm. As the wedge has considerably less mass, the tapered
portion tends to cool more quickly. Producing some level of confinement during
compaction (such as utilizing a plate compactor), would reduce the amount of lateral
movement during compaction of the mat. The second benefit is that it helps the joint to
resist damage from traffic if the joint is going to be left open and traffic is transitioning
between lanes on the open joint. The third benefit is the assumption that the overall
density of the joint density will be increased. The data collected during this study could
not prove this assumption as there were no projects that did not employ the tag along
compactor.

57
References
1. Hot Mix Asphalt Paving Inspector Certification Manual. Version 2.0. New England Transportation Technician Certification Program (NETTCP). January, 2006.
2. Fleckenstien, John L, Allen, David L., Schultz Jr., David B. Compaction at
the Longitudinal Construction Joint in Asphalt Pavements. Research Report No. KTC-02-10/SPR208-00-1F. Kentucky Transportation Center. College of Engineering. University of Kentucky. Lexington, Kentucky. May, 2002.
3. Kandhal, Prithvi S. and Mallick, Rajib B. Longitudinal Joint Construction
Techniques For Asphalt Pavements. NCAT Report No. 97-4. National Center for Asphalt Technology. Auburn University, Alabama. August, 1997
4. Kandhal, Prithvi S., Ramirez, Timothy L and Ingram, Paul M. Evaluation of
Eight Longitudinal Joint Construction Techniques for Asphalt Pavements in Pennsylvania. NCAT Report No. 02-03. National Center for Asphalt Technology. Auburn University, Alabama. February, 2002.
5. Toepel, Amanda. Evaluation of Techniques for Asphaltic Pavement
Longitudinal Joint Construction, Final Report. Report No. WI-08-03. WisDOT Highway Research Study No. 93-08. Division of Transportation Infrastructure Development, Bureau of Highway Construction Pavements Section, Wisconsin Department of Transportation. November, 2003.
6. Akpinar, Muhammet Vefa. and Hossain, Mustaque. Longitudinal Joint
Construction for Hot Mix Asphalt Pavements. Report No. K-TRAN: KSU-98-4, Final Report. Kansas State University. Manhattan, Kansas. March, 2004.
7. Estakhri, Cindy K., Thomas J. Freeman, Clifford H. Spiegelman. Density
Evaluation of the Longitudinal Construction Joint of Hot-Mix Asphalt Pavements. Report No. FHWA/TX-01/1757-1. Texas Transportation Institute. April, 2001.
8. Marquis, Brian. Longitudinal Joint Study. Final Report. Federal
Experimental Report 96-2. State of Maine Department of Transportation. September, 2001.
9. Denehy, Edward J. Constructability of Longitudinal Construction Joints in
Hot-Mix Asphalt Pavements with Sealers to Retard Future Deterioration. New York State Department of Transportation. 2005.
10. Padlo, Patricia T., Mahoney, James., Aultman-Hall, Lisa and Zinke, Scott.
Correlation of Nuclear Density Readings with Cores Cut From Compacted Roadways. Report # CT-2242-F-05-5. Connecticut Transportation Institute. University of Connecticut. August, 2005.

58
Appendix A. Literature Review (Fleckenstien et al, 2002) Compaction at the Longitudinal Construction Joints in
Asphalt Pavements
Kentucky Transportation Center
Improper longitudinal joint construction in Kentucky was recognized as an origin of
premature failure of HMA pavements. It is believed that this is caused by a lack of
proper compaction at the longitudinal joints and that this lack of compaction, in turn,
leads to increased levels of permeability. This permeability is said to accelerate the
deterioration of the pavement. Some problem areas were recognized in Kentucky as
exhibiting these types of premature failures. Review of these locations indicated that the
construction joints were allowing water to enter the pavement rapidly. The problems
encountered as a result of this include de-bonding of surface layers, mixture stripping,
oxidizing and hardening of the asphalt binder, all of which contribute to the premature
failure of the roadway. It was stated that several pavements in Kentucky have been
resurfaced or were in the process of being resurfaced as a result of premature failure
caused by the lack of compaction and poor construction of the longitudinal joints.
The purpose of this investigation was to evaluate different methods of longitudinal joint
construction on HMA pavements. The intention was to specifically investigate the
intensity of water infiltration and material segregation at the constructed joint and
conclude their effect on the performance of the longitudinal joint. This research was to
take place on both existing and new construction/surfacing projects. Another intention of
this research was to determine the best methods and techniques for constructing a

59
longitudinal joint. This determination would be made by reviewing methods,
construction practices, experiences and specifications of not only Kentucky, but outside
agencies, states and countries who take part in joint construction and whose experiences
would prove beneficial to establishing and determining the best practice for longitudinal
joint construction and the elimination of longitudinal joint segregation. The final
objectives of this project were to specify the proper construction methods to ensure
proper compaction at the construction joint and to review different equipment and
attachments for improving the level of compaction at the unsupported edge of the
pavement mat.
This research included the examination of longitudinal joint construction and techniques
on twelve different construction projects. Each project included both a control section as
well as a section in which the experimental method was used. On some of these projects
more than one method was used. The following longitudinal joint construction methods
were observed:
• Notched wedge joint (12:1);
• Restrained edge ;
• Joint re-heater; and,
• Joint Maker.
Some joint adhesives were also studied and included in this report. They were Crafco®
and joint tape by Tbond®. The following actions were taken following final compaction
on each project: nuclear density tests were performed; permeability/vacuum tests were
60
performed; and, cores were cut from the mat. Both core samples and field tests were
performed at the centerline of the longitudinal joint and at six inches, 18 inches, and six
feet on either side of the longitudinal joint.
There were four notched wedge joint projects used. Contractors usually built their own
notched wedge equipment however one of the contractors purchased equipment from a
manufacturer. Both devices were said to produce joints that appeared to be similar by
eye. The specs on the joints were a 0.5-inch upper and lower notch and a 12:1 taper
between them. The equipment for making the notched wedge joint is mounted on the
paver just even with the end gate and adjustments are made for the formation of the
wedge. The edge is compacted with a small roller (~400lb.) that is pulled behind along
the wedge.
A few minor issues were noticed with the use of the notch wedge joint. These include
preserving the upper notch during compaction, raveling of the outside or lower portion of
the wedge, and the small tow behind roller picking up aggregate. Another issue was
observed during construction of a base course using the notched wedge joint; the
equipment used to form and compact the wedge put enough drag on the paver to twist it
out of plane while paving. This made use of the ski poles difficult. All of these problems
were corrected for and controlled.
Analysis of the notched wedge joint data from the cores shows that the density, on
average, increases in comparison with the control section. Only on one project was the
density at the joint not seen to increase. This may be due to the surface being constructed

61
over a new base course. It is speculated that the new base course may be increasing the
over all density of the control section and decreasing the overall difference between the
notched wedge joint section and the control section.
The data indicates that the overall mat density has increased as a result of the notched
wedge joint as well. This is because the wedge restrains lateral movement of the mat
during construction. The permeability and field vacuum tests indicate that the
permeability at the joint decreases with use of the notch wedge joint as well and that the
permeability at the notched wedge joint is less than any other portion of the mat.
Recommendations that were made regarding use of the notched wedge joint include use
on lifts that are 1.5 inches or larger, use of a strike off plate on the small roller used for
compacting the wedge, a nonstop paving train in order to reduce segregation and
raveling, and keeping the end gate down and flush with the surface of the lift.
The restrained edge joint construction method was used on four resurfacing projects. The
cost of this equipment was $10,000. A hydraulic arm attaches the restrained edge wheel
to the breakdown roller. This arm is also used to raise and lower the wheel and as such
control the vertical force on the edge of the mat.
The device was first used on a 1-inch resurfacing project and results were positive. It left
a smooth edge and densely compacted edge on the mat. The second project the
restraining wheel was used on was a 1.5-inch lift. It was found that the beveled
restraining wheel did not provide enough height to accommodate the thickness of the lift

62
and two passes with the breakdown roller were necessary before the restraining wheel
could be used. It was said that the two passes of the breakdown roller before the wheel
was used likely reduced the effectiveness of the restraining method and allowed the
material to be pushed laterally since it wasn’t restrained for those two passes. On the
third project, the wheel was used on the beveled wheel dimensions were increased to
cover the entire uncompacted face of the freshly placed mat. The mix was said to be
slightly tender. The mix pushed upward in between the main drum and the restraining
wheel. When this was then compacted after the first pass, a longitudinal crack was
formed. This led to the wheel being used only after the initial breakdown which allowed
for some lateral movement of the mix thereby reducing overall effectiveness.
Analysis from the collected data showed that the overall density of the joint improved
with use of the restrained edge equipment on all observed projects in comparison with the
control sections. Permeability tests conducted on the restrained edge joint indicate that a
lower permeability can be achieved at the HMA joint when using the restrained edge
joint as opposed to the control section as well. A recommendation that was made for the
use of the restrained edge method was to obtain or modify restraining wheels to fit the lift
at hand. For instance, if a 2-inch lift is being constructed, the vertical distance between
the top and bottom of the bevel on the wheel should suit that particular lift such that there
is no material build up in between the main drum and the restraining wheel.
The Joint Maker® system by Trans Tech was observed on three construction projects.
This is a non-mechanical piece that mounts 0.5 inches above the screed interface and
forms a 30-degree upward angle with the surface of the pavement. The Joint Maker adds

63
initial compaction to the mix prior to the material being passed over by the screed. A
Kicker Plate was used in conjunction with the Joint Maker on some of the projects. The
Kicker Plate mounts adjacent to the end gate and forces a more vertical edge on the face
of the joint. A Joint Matcher was used on some projects as well. The Joint Matcher
automatically controls the edge gate so that the joints are matched more readily.
There were some construction problems with this equipment. The first problem was the
confusion in setting up the equipment. The contractor was uncertain as to how the device
mounted as well as its proper positioning. Another problem with the equipment use was
the dragging of the mix, however, this was corrected by pre heating the device prior to
paving.
After analysis of the data collected on the projects that were constructed with the Joint
Maker equipment it was observed that the equipment only very slightly improved joint
density in comparison with the control section. Permeability tests showed varying
results. The laboratory permeability tests showed higher permeability values at the joints
and the field permeability tests showed lower permeability values at the joints. It was
stated that due to the low level of improvement, there was no reason to continue using or
testing the devices.
The research team reviewed some information from the state of New Hampshire where a
Ray-Tech® infrared joint re-heater was tested in the field. Results showed that the air
voids content of cores taken from the control section joint were ~20 percent higher than
those taken from the section where the joint re-heater was used. The research team

64
elected to use this same system in its own study. The system is intended to work by
reheating the surface of the first mat that was paved initially until it reaches a plastic state
thereby increasing compaction capabilities at the joint. This is intended then to make the
joint less permeable and denser than conventional joint construction methods.
Two of the heaters are pulled about 100 feet ahead of the paver and the third is mounted
directly on the paver. The first two heaters are intended to provide initial heat to raise the
temperature of the pavement and the third is intended to bring the pavement back to its
plastic state immediately prior to the placement of the second mat. Temperature averages
immediately after exposure to the third heater were shown to be approximately 375° F.
Some problems that were encountered with this system were related to construction rate.
The contractor could not use the ski poles due to the heater being mounted on the paver.
The heaters caused the paving train to move slower as well because additional time was
needed for the heat to penetrate the mat.
Results from the core testing on this project showed that the overall density of the joint
and entire mat was increased in the test section in comparison with the control section.
The permeability of the test section also was reduced in these areas. The system was not
fully functional at the time of the project and the asphalt was said to be scorched in some
areas. The research team recommended that the attachments be better constructed such
that the ski poles can be used in order to better control smoothness. Though the research
team found some positive results with this system, they also stated that further
investigation is needed.

65
In addition to the joint construction methods described, two types of joint adhesives were
also tested. The first was a hot-melt poured adhesive by Crafco® and a joint tape called
Tbond®. The Crafco material was used on conventional joints, a notched wedge joint
and a restrained edge joint. The material is applied similarly to the way crack sealant is
applied. The joint tape was applied to conventional joints as well as notched wedge
joints. The tape is delivered in rolls in boxes and applied with tack or hammered onto the
pavement.
The only real issues that presented themselves during construction were the additional
man power required for the application of the adhesives as well as some protection
needed to prevent pickup of the adhesives by construction traffic.
Tests conducted on the pavements after construction concluded that lower permeability
was achieved with either joint adhesive. The Tbond joint tape showed significant
improvement in the reduction of permeability at the joint when used in conjunction with a
notched wedge joint. This was attributed to the adhesive being able to spread out
horizontally more readily on the slope of the wedge than on the conventional joint which
was used in the control section. Density was said to be higher at the notched wedge joint
with the tape as opposed to the notched wedge joint without the tape.
The research team suggests that while both materials reduce the overall permeability of
the joint, they are both also more labor intensive and require additional personnel. It was

66
stated that the application of the Crafco material was not quite as labor intensive as the
Tbond joint tape.
An analysis of the densities measured on all of the three initial joint construction method
projects showed that the highest overall average percent density at the joint was achieved
with the restrained-edge joint construction method. Analysis also shows that the
notched-wedge joint increases density across the entire mat.
An overall analysis of permeability measurements on all of the three initial joint
construction methods showed that the notched wedge joint had the greatest reduction in
permeability. The restrained-edge method showed the second highest reduction in
permeability and the joint-reheater showed little to no reduction permeability at the joint.
The research team collected preliminary performance data at the three, four, five, and six
year mark and have stated that the joints constructed with the adhesives were performing
as well if not better than the joints constructed with out the adhesives.
(Kandhal et al, 1997) Longitudinal Joint Construction Techniques For Asphalt
Pavements
NCAT – Auburn University
The NCAT research team for this project recognized that lower densities as well as
surface irregularities cause distresses such as cracking and raveling and eventually lead to

67
premature failure of the longitudinal joint. This report focuses on thirty different test
sections in the states of Michigan, Wisconsin, Colorado, and Pennsylvania. In these test
sections, the following construction methods were studied: rolling from the hot side;
rolling from the cold side; rolling from the hot side 6 inches away from the joint; (12:1)
tapered joint with 12.5 mm offset without tack coat; (12:1) tapered joint with 12.5 mm
offset with tack coat; edge restraining device; cutting wheel with tack coat; cutting wheel
without tack coat; Joint Maker; tapered (3:1) joint with 25 mm vertical offset; rubberized
asphalt tack coat; NJ wedge (3:1); and, infrared heating. Each test section was 500 ft.
long.
Rolling from the hot side entailed maintaining the majority of the rolling wheel on the
freshly placed (hot) side of the joint with no more than a six-inch overlap to the cold side.
Rolling from the cold side entailed the same manner in which the previous method except
naturally the majority of the rolling wheel remained on the cold side of the joint. Rolling
from the cold side was done in static mode. Rolling from the hot side 6 inches from the
joint was intended to cause the material to push laterally towards the joint in order to
achieve higher density. The tapered (12:1) joint with 12.5-mm offset without tack coat is
constructed with two overlapping wedges. This is done by tapering the edge of the first
paved lane with a slope of (12:1) and leaving a 12.5-mm vertical offset between the
pavement surface and the top of the wedge so that the top of the second lift has some
lateral restraint during compaction. When the adjacent lane is paved, this wedge is then
overlapped. The tapered (12:1) joint with 12.5-mm offset with tack coat is constructed in
a similar manner to the previously stated method excepting a layer of tack coat applied to
the unrestrained tapered edge of the first mat. The edge restraining device by its very

68
nature is a device that provides compaction restraint at the edge of the first pass. The
device is a wheel attached to the roller on a mechanical arm which rolls along the edge of
the mat pinching the unrestrained edge of the first pass. This is intended to increase the
density of the unrestrained edge. The cutting wheel with tack coat is a method by which
1.5 – 2 inches of the newly placed, unrestrained and low density edge of the pavement is
cut off just after compaction is complete. A 10” cutting wheel attached to an
intermediate roller is generally used to achieve this. The newly formed vertical edge of
the pavement is then tack coated prior to the placement of the adjacent mat. The cutting
wheel without tack coat is the same process as the previously stated method excepting the
use of tack coat. The tapered (3:1) joint with vertical 25-mm offset is a method by which
the unrestrained edge of the 2-inch lift is offset vertically 1 inch and tapered on a (1:3)
slope. The vertical face of the unrestrained edge was not tacked however the tapered
surface of the edge was tacked and rolling of the joint was done from the hot side. The
rubberized asphalt tack coat was used on the unconfined, untapered edge of the first mat
the day after it was placed immediately prior to placement of the adjacent mat. The New
Jersey Wedge (3:1) was constructed by attaching a sloping steel plate to the corner of the
paver screed extension. An infrared heater was then pulled along the tapered edge of the
first pass prior to the placement of the second pass. The heater increased the temperature
of the edge of the first pass to about 200° F. The joint was then rolled from the hot side.
On each test section, a minimum of six sets of cores were taken. A set consisted of one
core taken directly on the joint and another taken 300 mm away from the joint. The
different joint construction methods were ranked based on the density of the obtained
cores from those test sections.

69
On the Michigan project which consisted of seven test sections, the (12:1) tapered joint
with a 12.5-mm tapered offset both with and without tack and the cutting wheel with tack
coat gave the best results (highest joint densities). Of the rolling patterns that were
experimented with, rolling from the hot side gave the best results followed by rolling
from the hot side 6 inches from the joint.
Three years after the Michigan sections were completed, visual observations were made
as to the performance of the joints constructed using the different methods. There were
significant amounts of cracking at each test section except for the two test sections
utilizing the (12:1) taper with 12.5-mm offset both with and without tack. There was no
significant difference found in the performance of the 12:1 tapered joint with tack coat
and without tack coat. It was stated that the performance ranking of the different joint
construction methods used relied heavily on the overall density of the joint at the time of
construction.
On the Wisconsin project which consisted of eight test sections, the edge restraining
device and the cutting wheel gave the best initial results (highest densities). These two
methods were followed by the 12:1 taper and the Joint Maker. Of the three rolling
techniques used on this project, rolling from the hot side gave the best results followed by
rolling from the hot side 6 inches away from the joint.
Four years after construction of the sections in Wisconsin, visual observations were made
as to the performance of the different joint construction methods used and it was found

70
that the joints were cracked in all eight sections. In all eight sections, cracks have shown
some spalling. The width of cracking varied, however, and joint construction methods
were ranked from best to least effective, as follows, based on visual observation:
1. Edge-Restraining Device;
2. Tapered 12:1 joint with tack coat;
3. Tapered 12:1 joint without tack coat;
4. Joint maker;
5. Cutting Wheel with tack coat;
6. Rolling from the hot side (butt joint);
7. rolling from the hot side 6 inches away from the joint (butt joint); and,
8. Rolling from the cold side (butt joint).
It was stated by the research team that the differences seen in the performances of the
different joints were only subtle. It was stated that the 12:1 tapered joint was not
constructed with any vertical offset such as in the Michigan project and this may have
factored into its failure. It was also stated that the overall performance of the joints on
this project appeared to be influenced by the original density as measured from the cores
that were tested at the time of construction.
On the Colorado project which consisted of seven test sections, the 3:1 taper with 25-mm
vertical offset produced the best results (highest density). This was followed in ranking
by the cutting wheel with tack coat. Rolling from the hot side gave the least density
when the 3:1 taper without the 25-mm vertical offset was used.

71
Two years after construction, visual observations were made as to the overall
performance of these different joint construction methods and they were ranked as
follows:
1. Tapered 3:1 joint with 25 mm vertical offset;
2. Cutting Wheel with tack coat;
3. Rubberized asphalt tack coat (butt joint);
4. Cutting Wheel with out tack coat;
5. Tapered 3:1 joint rolling from hot side 6 inches away from joint;
6. Tapered 3:1 joint rolling from hot side; and,
7. Tapered 3:1 joint rolling from cold side.
The research team stated that better evaluation of long term performance would involve
further observation in coming years. It was also stated that with further observation in
the future, these rankings are likely to change.
On the Pennsylvania project which consisted of eight different test sections, the Edge-
restraining device produced the best initial results (highest density) at the joint followed
by the cutting wheel with tack coat, Joint Maker, and rolling from the cold side
techniques. While the Edge Restraining Device provided the highest density average,
they were all reported as generating similar densities. The methods reported to produce
the lower densities were rolling from the hot side 6 inches from the joint, rubberized
asphalt tack coat and the NJ Wedge (3:1) Taper techniques.

72
One year after construction, the sections were revisited for performance observation;
however, the sections had yet to develop any cracks. Some sections had developed
raveling at the joint in variable widths up to three inches. After the visual observations,
the eight different techniques used on these sections were ranked as follows:
1. Cutting wheel;
2. Rubberized asphalt tack coat (butt joint);
3. Rolling from the hot side (butt joint);
4. Joint Maker;
5. Rolling from the hot side six inches from joint (butt joint);
6. Rolling from the cold side (butt joint);
7. Edge restraining Device; and,
8. New Jersey 3:1 Taper with infrared heater.
The research team reports that although the edge restraining device produced a high
density at the joint, the long term performance may be dependent upon the experience of
the roller operator. The operator must keep the device aligned correctly throughout
compaction of the joint. The research team also states that the rankings are likely to
change in coming years as the cracking and raveling of the joints in the long term will be
more prevalent than after just one year.
The final conclusions drawn on the overall results of this experiment are based on 12
different joint construction techniques constructed on 30 different test sections. They

73
were all evaluated once during a span of one to four years after construction. It was
found that the general performance of the joint depends on the density measured at the
time of constructions. That is, the higher the density was immediately after construction,
the higher the overall performance ranking was when the sections were revisited. As of
the conclusion of this report, the four different projects all had different joint construction
methods that were performing better than the rest. Of the three rolling techniques used
on the butt joints, rolling from the hot side turned out the best performing joint followed
by rolling from the hot side six inches from the joint.
The research team at this point has recommended that the Michigan 12:1 Tapered joint
with the 25-mm vertical offset yields the best chances of achieving an acceptable
longitudinal joint. The 25-mm vertical offset is a necessary component of this joint
construction method. The cutting wheel as well, as the restraining edge device also have
promising potential however they are both operator dependant and therefore may lack
consistent results from project to project. A butt joint is not desirable and the hot side
should overlap the cold side by at least 1 to 1.5 inches. Rolling should always be
conducted from the hot side of the joint using a vibratory roller. It was recommended
that paver manufacturers are suggested to construct pavers with a steel plate that attaches
to the screed in order to achieve a taper such as that in the Michigan wedge as well as
some vibratory or tamping mechanism for the unconfined edge to achieve better density
values initially. The final recommendation made by the research team is that the
specification for joint density be set at no more than two percent less than what is
specified for the mat.

74
(Kandhal et al, 2002) Evaluation of Eight Longitudinal Joint Construction
Techniques for Asphalt Pavements in Pennsylvania. NCAT – Auburn University
This report gives the six year evaluation of the performance of the eight different
longitudinal joint construction methods that were used in the NCAT project described in
the previous sections of this literature review for the test sections that were constructed in
Pennsylvania in 1995.
The density tests on cores that were taken directly on the joint as well as on the area 300
mm away from the joint show the Edge-restraining device provided the highest density
values. This was followed in order by the cutting wheel, the Joint Maker, rolling from
the cold side, rolling from the hot side 6 inches away from the joint, rolling from the hot
side, rubberized asphalt tack coat and the NJ wedge (3:1) with infrared heating. The
areas where the edge-restraining device was used having the higher density is consistent
with the initial long term field observation results made at one year after construction.
Visual observations were made at the six year mark as well. These observation were
ranked from best to worst field performance, based on the percent length of joint that
exhibited cracking, as well as: width of any cracking, percent length, and severity of any
raveling the joints exhibited. They were ranked according to these criteria at the six-year
mark as follows:

75
1. Rubberized joint material (butt joint);
2. Cutting wheel;
3. Rolling from the hot side six inches away from the joint (butt joint);
4. NJ Wedge (3:1);
5. Edge restraining device;
6. Joint-Maker;
7. Rolling from the hot side (butt joint); and,
8. Rolling from the cold side (butt joint).
The section with the rubberized joint material visually appeared to be performing better
than all of the other sections even though the density measured on the joint in this section
was among the worst.
The following observations were made by the research team. The long-term performance
of the joints constructed during this project is influenced by the level of density shown at
the time of construction as well as is shown during long term visual performance
observations. It is recommended that the average air voids content at the joint not exceed
ten percent of maximum theoretical density. It was stated by the authors that the
performance ranking from year to year changed from 1997 to 2001, as expected, and
stated in the previously reviewed report. It was expected that some joints would change
as the initial appearance of a constructed joint may be better than others; however, that
joint may also deteriorate faster than others when subjected to further extreme
environmental conditions over coming years. Similarly, a joint with low density and less
than desirable initial appearance may exhibit more durability over time and maintain its

76
integrity longer than other methods as is the case with the rubberized asphalt tack coat. It
was also recommended by the research team that rubberized joint material or a notched
wedge joint be used because they perform more consistently than the other methods.
Rolling from the hot side 6 inches away from the joint seemed to work best according to
the research team and is recommended as the preferred method. The final
recommendation made was a specification of joint density set at 2 percent lower than that
of the mat and that joint density is measured on cores as opposed to nuclear density as
there are seating problems when the gauge is used.
(Toepel, 2003) Evaluation of Techniques for Asphaltic Pavement Longitudinal Joint
Construction -- Wisconsin Department of Transportation
In 1993, the Wisconsin Department of Transportation initiated this research project in an
effort to accompany the NCAT Auburn research that was described in the previous two
reviewed documents. Initial reported results in the NCAT study reported the wedge joint
to be one of the best performing methods among reviewed techniques. This, however,
was not the case in Wisconsin. Possible reasons for this include lack of proper equipment
as well as lack of experience with the wedge joint at the time of placement.
In this research, eight different longitudinal joint construction methods were studied.
They are as follows: conventional method; wedge joint with truck tire rolling; wedge
joint without rolling; wedge joint with steel side roller wheel; wedge joint with rubber
side roller wheel; wedge joint with tag along roller; cut joint method; and, conventional

77
joint with edge restraining device. It should be noted that in the NCAT study, the wedge
joints that were constructed in Wisconsin did not have a ½-inch vertical offset like the
Michigan wedge joints did, nor were the faces of the wedges compacted. With that in
mind, the primary focus of this research was on the wedge joint.
The conventional joints constructed in this research conformed to the basic industry
standard butt-type joint. This entails a tack coat placed on the edge of the cold lane and
the second pass slightly overlaps the first pass. The breakdown roller first compacts the
joint by rolling 4-6 inches away on the hot side to move the material laterally towards the
joint and on the second pass; the roller overlaps the cold side by six inches. The wedge
joint method in this project utilized a shoe attached to the end of the screed to create a
wedge with a ½-inch vertical offset and a 12:1 taper which was tacked prior to the
placement of the hot side of the joint. The cut joint method removes approximately 2
inches of the unrestrained material from the compacted joint. A tack coat is applied to
the vertical cut edge of the pavement. The conventional method with the edge constraint
device provides restraint on the edge (cold side of the joint) material during compaction.
This is accomplished via the attachment of a tapered restraining wheel to the breakdown
roller. This is intended to reduce the amount of creep that experienced by the normally
unsupported edge of the pavement.
The test sections constructed for this research ranged from just less than one mile to over
2 miles. At the time of construction, density tests were conducted both by means of a
nuclear density gauge as well as using cut cores and testing them volumetrically in the
laboratory. Nuclear density was read directly at the joint, as well as one foot, and five

78
feet away from the joint on both sides. Cores were cut from the centerline as well as one
foot away from the centerline of the joint. There were seven equally-spaced locations
throughout each section which were selected for testing. After some evaluation, it was
determined that the nuclear gauge values were not reliable and the laboratory testing of
the cut cores was selected as the chosen method of density determination for this project.
All longitudinal joint construction methods utilized on this project produced density
gradients with the vortex of each plot taking seat at the joint. The upper or surface layer
of an HMA pavement is specified at a minimum of 92 percent of maximum theoretical
density in Wisconsin. The only two methods that were found to produce acceptable
densities were the wedge with the steel wheel side roller and the wedge with the tag along
roller attached to the paver.
Performance rankings of each of the longitudinal construction joint techniques took place
in the summer of 2003, ten years after placement of the HMA pavement. It was found
that after ten years, from a broad standpoint, the wedge joint methods performed better
that the other joint methods. In fact, as was the case immediately after construction, the
wedge joint with the steel wheel side roller and the wedge joint with the tag along roller
attached to the paver performed the best out of all the joints. The research team reported
that the wedge joint with the steel wheeled side roller was the most construction friendly
and also the only one to rank top 3 in each of the performance reviews which were
conducted at the time of construction as well as 2, 3, 4, 5 and 10 years.

79
Conclusions of this research state that the wedge joint is the best performing joint of the
eight joint construction methods tested. It was stated as being desirable because it does
not create debris such as the cut joint does and it is significantly safer for traffic to
traverse the construction zone over a wedge than a butt-style pavement edge. The
conclusions also state that Wisconsin has made a Special Provision Longitudinal Joint
Specification that allows the contractor to utilize a wedge joint if desired.
Recommendations from the research team include investigation into the use of nuclear
density gauges for measuring compaction at the joints, investigation into the use of
wedge joints with the steel roller over various subgrades, additional methods of
evaluating longitudinal joints during construction, investigation into other states success
with the use of joint reheaters and joint adhesives. Also included in the research team’s
recommendations are that the previously described Special Provision Longitudinal Joint
Specification be changed such that use of a wedge joint becomes a requirement as
opposed to an option.
(Akpinar et al, 2004) Longitudinal Joint Construction for Hot Mix Asphalt
Pavements, Kansas State University
This research was comprised of a literature review of several different factors affecting
the quality and performance of longitudinal joints, different methods of constructing
longitudinal joints as well as compaction techniques with respect to longitudinal joints.
This research involved an extensive review of the NCAT project described in previous

80
sections of this report. The findings of this research are as follows: the longitudinal
joints in HMA that exhibit the best performance are those which also exhibit the highest
values of measured density. Longitudinal joint construction protocol and specifications
across the country and from state to state vary greatly. The ability of a roller to change
vibratory characteristics rapidly in order to accommodate changes in the conditions of the
job is important however the research team suggests that there is a lack of an acceptable
2nd standard rolling pattern procedure.
The recommendations made by the study team include specifying the exact location of a
longitudinal joint on the roadway during the design phase in an effort to minimize direct
load application. The compaction technique recommended by the research team is
rolling from the hot side and overlapping the roller 6 inches over the cold side for butt
joints. The research team indicates that wedge joints could be constructed and observed
experimentally. The research team recommends that the joint have the same full depth
density, smoothness and texture specifications as the rest of the HMA mat.
(Estakhri, 2001) Density Evaluation of the Longitudinal Construction Joint of Hot-Mix Asphalt Pavements – Texas Transportation Institute
Recognizing the inferior performance of longitudinal joints in comparison with the rest of
the HMA pavement mats in Texas lead to this research investigation. The objectives of
this research were to investigate the density of the longitudinal joints of numerous HMA
pavements in Texas to determine if low density of longitudinal joints is a problem.
Another objective of this research was to review aviation construction data involving

81
specification of joint density and determine if this specification can be met by paving
contractors. The final objective was to modify HMA specifications to require density
measurements at the longitudinal joint if it is justified.
In light of the nature and methods of the research involved with this study and its
similarity to other previously mentioned studies with respect to some of the actual
research work as well as the findings, the entire scope of this research will not be detailed
here, however, the objectives previously mentioned will be matched with their respective
outcomes and results in the following paragraphs.
With respect to the first objective (determining if a problem exists in Texas with low
density at longitudinal joints), indeed a problem existed. Low density was found in the
first paved lane along the unrestrained pavement edge. This was investigated on 35
different pavements throughout Texas and these findings compared with density in the
center of the paved lane almost always produced a significant difference. On a scale of
percentage of maximum theoretical, this range was 4% to 5%.
The review of aviation construction data where a longitudinal joint density specification
existed, it was found that the contractors involved with these construction projects were
routinely able to meet density requirements.
It was stated at the close of the findings and recommendations of this report that Texas
DOT implemented a longitudinal joint density specification. This specification requires
the contractor to perform a density test at each construction sub lot. This measurement

82
has to take place within two feet of the edge of the pavement mat and compared with a
measurement taken on the interior of the mat (more than two feet from the unconfined
edge. When the difference of this comparison exceeds more than 5 pcf, the sub lot fails
and the contractor must take corrective measures to improve the joint density during
construction. When two consecutive verifications fail, HMA production must cease and
the contractor must change his operation or the production operation and two consecutive
verification sub lots must be accepted before operations can continue.
(Marquis, 2001) Longitudinal Joint Study – Final Report. – State of Maine
Department of Transportation
The Maine Department of Transportation recognized that the premature degradation of
longitudinal joints on their highways and roads in the past has increased the cost of
maintenance and caused an unacceptable amount of reflective cracking when they are
overlaid. The purpose of this research was to experiment with new longitudinal joint
products as well as different longitudinal joint rolling techniques in an effort to produce
joints with higher densities and ultimately increase the service life of the pavement
structure.
The experimental section utilized for this research consisted of six subsections: four 1970
ft. sections; one 2300 ft. section; and, one 1640 ft. section. Three different rolling
techniques, a cutting wheel and the Joint Maker product similar to the one used in both
the Kentucky Transportation Center project as well as the NCAT project were used in
this experiment.

83
The contractor purchased the Joint Maker as a package from Transtech Systems, Inc.
The package included the Joint maker as well as a kicker plate and an edge follower. The
kicker plate mounts on the outside edge of the endplate ski. The kicker plate is an
adjustable raking edge that collects loose and excess HMA material that has leaked out
from the screed to the adjacent previously paved cold mat. The intention of the kicker
plate is to windrow the material directly over the joint where it is needed the most in
order to increase density. The edge follower is a device intended to automate the closure
or overlap of the longitudinal joint. It is a non-contact, sensing unit that is used to
automatically position the end-gate. It is intended to eliminate excess overlap and the
need for a screed operator during the placement of the material on the closing of the
longitudinal joint.
In the first test section, the first pass was paved with a Joint Maker on both the left and
right end plate. This pass was rolled in such a manner that the breakdown roller makes
its first pass on the hot side of the mat and then the mat is rolled from the cold side to the
hot side. This pattern was recommended by Transtech. The second mat in the first
section was paved using a Joint Maker on the right side end plate and a kicker plate and a
Joint Follower on the left side. The second pass was rolled from the cold to the hot side
as per recommendation by Transtech.
The second section was a butt joint control section. The rolling took place from the cold
side of the mat to within six inches of the joint. Then, the joint was overlapped by two
feet over the cold mat.

84
In the third section, Technique A was used. Technique A consists of a first roller pass
from the hot side with a six inch overlap to the cold side of the mat and follow up rolling
from the hot side to the cold side.
The fourth section was paved and finished using Technique B. Technique B utilized a
static roller pass from the cold mat with a six inch overlap on the hot map and follow up
rolling in vibratory mode from the cold side to the hot side.
Technique C was used on the fifth section. A first pass six inches from the joint was
followed by a second pass which pinched the joint. The mat was then rolled from the hot
side to the cold side.
The sixth section involved the use of a cutting wheel attached to a grader. The first two
inches of the leading edge was cut off and discarded. Tack was then applied to the joint
prior to paving the next pass. The mat was rolled from the cold side to within six inches
of the joint and finally pinched with two feet of the roller over the cold mat.
Of the several techniques that were used in this experimentation, Sections one (Joint
Maker on both the left and right end plate), Section three (first roller pass from the hot
side with a six inch overlap to the cold side), Section five (a first pass six inches from the
joint was followed by a second pass which pinched the joint) and Section six (cutting
wheel attached to a grader) exhibited characteristics that were decidedly unfavorable,
whether upon review of the site a given time later or during construction. The Section

85
five rolling technique was not suggested by the authors as an alternative rolling technique
due to the time-consuming nature of the process which designates the breakdown roller to
roll the entire mat. The Section three rolling technique was also not recommended
because it created a ridge at the center of the mat which was difficult and time-consuming
to smooth out. The edge trimming process that was used in Section six was also not
recommended because keeping a straight edge on the mat was difficult. The Section one
process using the Joint Maker exhibited the highest amount of joint separation during
long term observation. It was, however, stated by the authors that the Joint Maker
equipment precompacted the mix before rolling took place and combined with the rolling
scheme from section two, this could form a quality joint.
Section four (static roller pass from the cold mat with a six inch overlap on the hot map
and follow up rolling in vibratory mode from the cold side to the hot side) revealed the
least amount and severity of cracking upon revisiting and the authors state that the rolling
technique used could be used as a standard in an effort to reduce the amount of centerline
cracking. Section two (butt joint control section) was also stated as having a very low
amount and severity of centerline cracking. The authors suggest that a conscientious
paving crew combined with this compaction scheme should be used in order to prevent
premature cracking at the joint.
(Denehy, 2005) Constructability of Longitudinal Construction Joints in Hot-Mix
Asphalt Pavements with Sealers to Retard Future Deterioration. -- New York State
Department of Transportation.
86
A task force on longitudinal joints recommended to NYSDOT that a notched wedge joint
be added to their specifications as an alternative to the traditionally used butt joint. The
task force also recommended to NYSDOT that the rolling pattern specification include
the following method of compaction: rolling from the hot mat with six inches of overlap
onto the cold mat for one pass towards and away from the paver and then rolling
commence from the low side to the high side. Specification changes were made by the
task force upon approval.
NYSDOT also experimented with the use of TransTech’s Joint Maker. The experiment
involved two 305-m sections of new pavements on three different projects to compare the
Joint Maker to the traditional butt joint. The density at the longitudinal joints on all three
test projects were lower where the Joint Maker had been used than where the traditional
butt joint was used. In light of this outcome, NYSDOT did not pursue the Joint Maker
further.
Upon review of several other studies regarding longitudinal joint construction, NYSDOT
decided to investigate use of longitudinal joint sealers. Three projects were selected as
pilot test sections for trial of the sealers and placement variations.
The first project utilized a notched wedge joint with a 12.5-mm notch and a 1:8 wedge.
Preceding placement of the second pass, Crafco Inc, placed joint sealer using crack
sealing equipment. The sealant covered the notch and covered the wedge only partially.
A pickup truck was driven over the sealant to test for possible pick up which did not
occur. During compaction of the first paver pass, the roller rolled the edge of the notch

87
but did not go further than the edge of the notch. The second mat was placed overlapping
the cold mat by 25 mm to 40 mm. A vibratory roller was used to compact the joint
immediately after paving. The roller overlapped the cold mat by 150 mm to 200 mm.
Rolling of the rest of the mat took place from the low side to the high side. The author
states that there were no adverse affects caused by the use of the sealant material. The
rollers did not pick up any of the sealant and there was only a thin line of the sealant
visible after compaction.
The second project which sealant was used on also involved a 1:8 notched wedge joint.
The rolling process of the first mat was exactly the same as the preceding project. Deery
sealant was used on this section and was placed using crack sealing equipment. This
material was placed such that it formed a band of sealant in the middle third of the taper
of the wedge. The author states that this material became tacky very quickly (within a
few minutes) as did the previous project. There was no difference in installation time and
the placement of the second paver pass as well as compaction procedures and rolling
patterns were exactly the same. Also like the previous project, paving was not negatively
affected. There was no pick up of the sealant by the rollers. The sealant was not visible
on the completed joint because the band was placed in the middle third of the wedge
taper.
The third project utilized a conventional butt joint. Conventional joint sealing equipment
was used to place the Asphalt Materials Inc. sealant. The author reports that this material
was thicker than either the Deery or Crafco sealants and achieving placement at the right
thickness was difficult with a 50-mm sealing shoe. The contractor switched the

88
application method to use a conical wand head with a nozzle of an ellipsoid shape and
application proceeded with ease following that. The author reports that there was little
volume of sealant needed for this project. This caused concern that the large kettle may
have overheated the sealant. Switching of the application nozzle was also said to take a
considerable amount of time which may have lead to some overheating of the material.
The butt joint was completely covered by the joint sealant and it was reportedly tacky
within a few minutes as were the previous two projects. Installation time was not
negatively affected and only a thin line of the sealant material was visible after
compaction of the joint.
In conclusion, the author reports no significant difficulties or problems with the
installation of the three different sealants by three different contractors on the three
different projects that were geographically separated into the extreme eastern part of NY
State, the extreme western part of NY State, and one section, which is more centrally
located within the state. It was recommended by the author that larger scale projects be
undertaken on the installation of these sealants to investigate their performance with use
in longitudinal joint construction.

89
Appendix B. Before & After Application of Correction Factor (Butt Joint Projects)
Berlin
Average % Volumetric Core Density and Corrected & Uncorrected Nuclear Density by Profile Location
84.0
85.0
86.0
87.0
88.0
89.0
90.0
91.0
92.0
12" Cold 6" Cold Joint 6" Hot 12" Hot
Joint Profile Location
% D
ensi
ty (M
TD)
Core Density Uncorrected Nuclear Density Corrected Nuclear Density
North Stonington
Average % Volumetric Core Density and Corrected & Uncorrected Nuclear Density by Profile Location
88.0
88.5
89.0
89.5
90.0
90.5
91.0
91.5
92.0
12" Cold 6" Cold Joint 6" Hot 12" Hot
Joint Profile Location
% D
ensi
ty (M
TD)
Core Density Uncorrected Nuclear Density Corrected Nuclear Density

90
Salem
Average % Volumetric Core Density and Corrected & Uncorrected Nuclear Density by Profile Location (All Joint Cores Broken)
82.0
84.0
86.0
88.0
90.0
92.0
94.0
12" Cold 6" Cold Joint 6" Hot 12" Hot
Joint Profile Location
% D
ensi
ty (M
TD)
Core Density Uncorrected Nuclear Density Corrected Nuclear Density
Montville
Average % Volumetric Core Density and Corrected & Uncorrected Nuclear Density by Profile Location (Correction Factor = 0.0 so Corrected and Uncorrected Series are
the Same)
86.0
87.0
88.0
89.0
90.0
91.0
92.0
93.0
12" Cold 6" Cold Joint 6" Hot 12" Hot
Joint Profile Location
% D
ensi
ty (M
TD)
Core Density Uncorrected Nuclear Density Corrected Nuclear Density

91
Easton
Average % Volumetric Core Density and Corrected & Uncorrected Nuclear Density by Profile Location
83.0
84.0
85.0
86.0
87.0
88.0
89.0
90.0
91.0
12" Cold 6" Cold Joint 6" Hot 12" Hot
Joint Profile Location
% D
ensi
ty (M
TD)
Core Density Uncorrected Nuclear Density Corrected Nuclear Density
Killingly
Average % Volumetric Core Density and Corrected & Uncorrected Nuclear Density by Profile Location
84.5
85.5
86.5
87.5
88.5
89.5
90.5
91.5
12" Cold 6" Cold Joint 6" Hot 12" Hot
Joint Profile Location
% D
ensi
ty (M
TD)
Core Density Uncorrected Nuclear Density Corrected Nuclear Density

92
Windsor
Average % Volumetric Core Density and Corrected & Uncorrected Nuclear Density by Profile Location
84.0
85.0
86.0
87.0
88.0
89.0
90.0
91.0
12" Cold 6" Cold Joint 6" Hot 12" Hot
Joint Profile Location
% D
ensi
ty (M
TD)
Core Density Uncorrected Nuclear Density Corrected Nuclear Density
New Hartford
Average % Volumetric Core Density and Corrected & Uncorrected Nuclear Density by Profile Location
85.0
86.0
87.0
88.0
89.0
90.0
91.0
92.0
93.0
94.0
12" Cold 6" Cold Joint 6" Hot 12" Hot
Joint Profile Location
% D
ensi
ty (M
TD)
Core Density Uncorrected Nuclear Density Corrected Nuclear Density
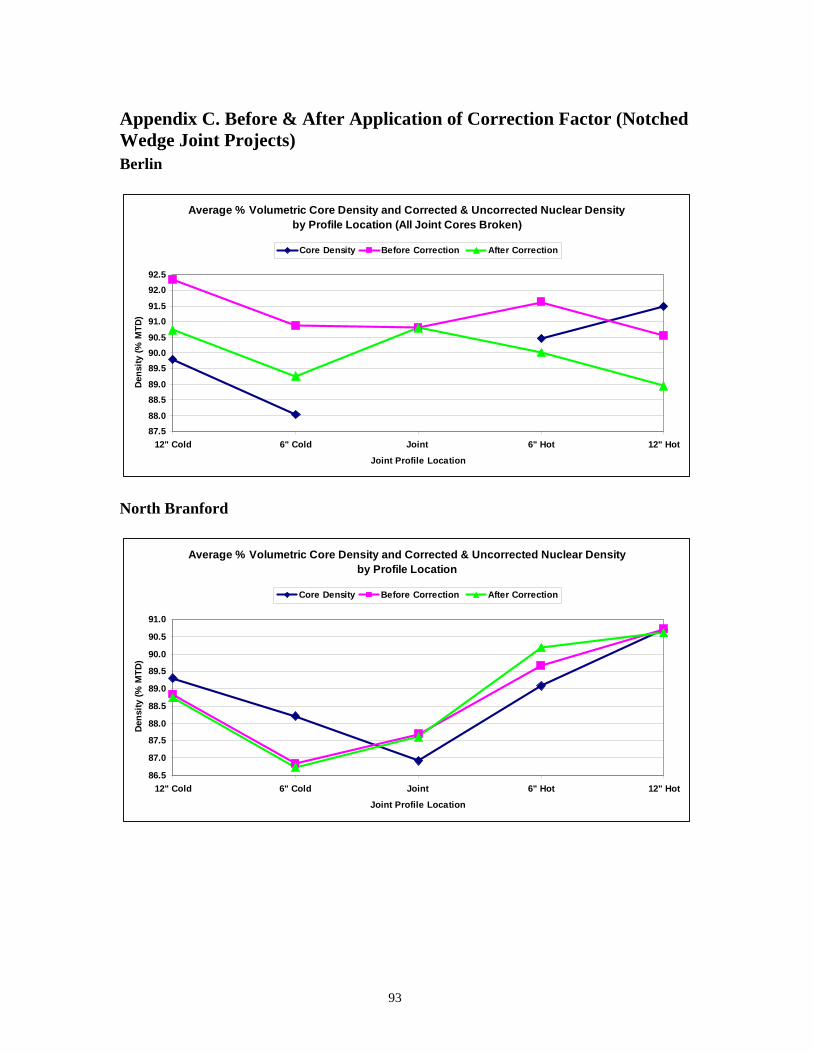
93
Appendix C. Before & After Application of Correction Factor (Notched Wedge Joint Projects) Berlin
Average % Volumetric Core Density and Corrected & Uncorrected Nuclear Density by Profile Location (All Joint Cores Broken)
87.588.0
88.589.0
89.590.090.5
91.091.5
92.092.5
12" Cold 6" Cold Joint 6" Hot 12" Hot
Joint Profile Location
Den
sity
(% M
TD)
Core Density Before Correction After Correction
North Branford
Average % Volumetric Core Density and Corrected & Uncorrected Nuclear Density by Profile Location
86.5
87.0
87.5
88.0
88.5
89.0
89.5
90.0
90.5
91.0
12" Cold 6" Cold Joint 6" Hot 12" Hot
Joint Profile Location
Den
sity
(% M
TD)
Core Density Before Correction After Correction

94
Windsor
Average % Volumetric Core Density and Corrected & Uncorrected Nuclear Density by Profile Location
88.5
89.0
89.5
90.0
90.5
91.0
91.5
12" Cold 6" Cold Joint 6" Hot 12" Hot
Joint Profile Location
Den
sity
(% M
TD)
Core Density Before Correction After Correction

95
Appendix D. Analysis of Variance for Traditional Butt Joint Location A and Location B (12” Cold & 6” Cold) ANOVA: Single Factor SUMMARY
Groups Count Sum Average Variance 12" Cold 155 13817.63 89.14601 3.495478 6" Cold 155 13457.57 86.82303 6.644714 ANOVA
Source of Variation SS df MS F P-value F crit
Between Groups 418.2086 1 418.2086 82.485341.32E-
17 3.871827Within Groups 1561.59 308 5.070096 Total 1979.798 309
Location B and Location C (6” Cold & Joint) ANOVA: Single Factor SUMMARY
Groups Count Sum Average Variance 6" Cold 155 13457.57 86.82303 6.644714 Joint 155 13563.54 87.50672 12.39183 ANOVA
Source of Variation SS df MS F P-value F crit
Between Groups 36.22582 1 36.22582 3.805925 0.051978 3.871827Within Groups 2931.627 308 9.518271 Total 2967.853 309

96
Location C and Location D (Joint & 6” Hot) ANOVA: Single Factor SUMMARY
Groups Count Sum Average Variance Joint 155 13563.54 87.50672 12.39183 6" Hot 155 14079.03 90.83245 6.083337 ANOVA
Source of Variation SS df MS F P-value F crit
Between Groups 857.1886 1 857.1886 92.793612.28E-
19 3.871827Within Groups 2845.176 308 9.237583 Total 3702.364 309
Location D and Location E (6” Hot & 12” Hot) ANOVA: Single Factor SUMMARY
Groups Count Sum Average Variance 6" Hot 155 14079.03 90.83245 6.083337 12" Hot 155 14064.86 90.74103 5.765678 ANOVA
Source of Variation SS df MS F P-value F crit
Between Groups 0.647753 1 0.647753 0.109335 0.741128 3.871827Within Groups 1824.748 308 5.924508 Total 1825.396 309

97
Location B and Location D (6” Cold & 6” Hot) ANOVA: Single Factor SUMMARY
Groups Count Sum Average Variance 6" Cold 155 13457.57 86.82303 6.644714 6" Hot 155 14079.03 90.83245 6.083337 ANOVA
Source of Variation SS df MS F P-value F crit
Between Groups 1245.848 1 1245.848 195.7641 9E-35 3.871827Within Groups 1960.12 308 6.364026 Total 3205.968 309

98
Appendix E. Analysis of Variance For Notched Wedge Joint
Location A and Location B (12” Cold & 6” Cold) ANOVA: Single Factor SUMMARY
Groups Count Sum Average Variance 12" Cold 75 6725.349 89.67132 3.589162 6" Cold 75 6637.098 88.49463 4.966073 ANOVA Source of Variation SS df MS F P-value F crit Between Groups 51.92182 1 51.92182 12.13802 0.00065 3.90506Within Groups 633.0874 148 4.277617 Total 685.0092 149
Location B and Location C (6” Cold & Joint) ANOVA: Single Factor SUMMARY
Groups Count Sum Average Variance 6" Cold 75 6637.098 88.49463 4.966073 Joint 75 6635.143 88.46858 8.55073 ANOVA Source of Variation SS df MS F P-value F crit Between Groups 0.025464 1 0.025464 0.003768 0.951138 3.90506Within Groups 1000.243 148 6.758401 Total 1000.269 149

99
Location C and Location D (Joint and 6” Hot) ANOVA: Single Factor SUMMARY
Groups Count Sum Average Variance Joint 75 6635.143 88.46858 8.55073 6" Hot 75 6767.305 90.23073 4.086688 ANOVA Source of Variation SS df MS F P-value F crit
Between Groups 116.4448 1 116.4448 18.428573.17E-
05 3.90506Within Groups 935.1689 148 6.318709 Total 1051.614 149
Location D and Location E (6” Hot & 12” Hot) ANOVA: Single Factor SUMMARY
Groups Count Sum Average Variance 6" Hot 75 6767.305 90.23073 4.086688 12" Hot 75 6714.839 89.53119 2.730145 ANOVA Source of Variation SS df MS F P-value F crit Between Groups 18.35082 1 18.35082 5.383972 0.021689 3.90506Within Groups 504.4456 148 3.408416 Total 522.7964 149

100
Location B and Location D (6” Cold & 6” Hot)
ANOVA: Single Factor SUMMARY
Groups Count Sum Average Variance 6" Cold 75 6637.098 88.49463 4.966073 6" Hot 75 6767.305 90.23073 4.086688 ANOVA Source of Variation SS df MS F P-value F crit
Between Groups 113.0263 1 113.0263 24.970571.62E-
06 3.90506Within Groups 669.9043 148 4.52638 Total 782.9306 149