Embed Size (px)
Citation preview
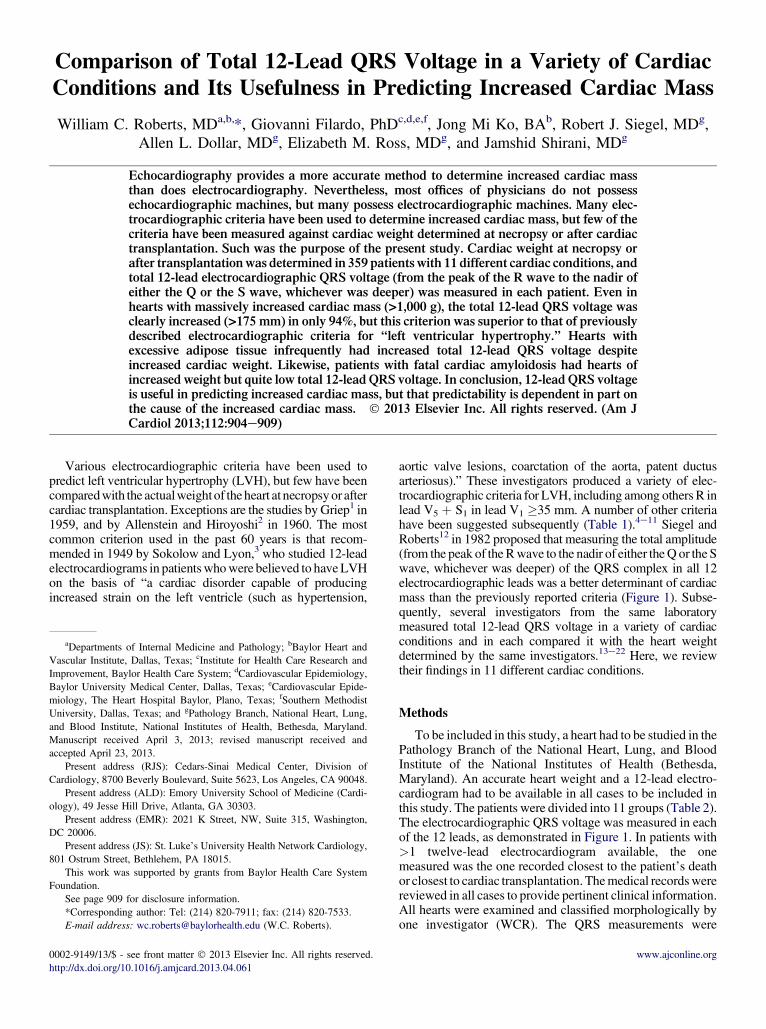
Comparison of Total 12-Lead QRS Voltage in a Variety of CardiacConditions and Its Usefulness in Predicting Increased Cardiac Mass
William C. Roberts, MDa,b,*, Giovanni Filardo, PhDc,d,e,f, Jong Mi Ko, BAb, Robert J. Siegel, MDg,Allen L. Dollar, MDg, Elizabeth M. Ross, MDg, and Jamshid Shirani, MDg
Echocardiography provides a more accurate method to determine increased cardiac mass
aDepartmentsVascular Institute,Improvement, BayBaylor Universitymiology, The HeaUniversity, Dallasand Blood InstituManuscript receivaccepted April 23
Present addreCardiology, 8700
Present addresology), 49 Jesse H
Present addresDC 20006.
Present addres801 Ostrum Street
This work waFoundation.
See page 909*CorrespondinE-mail addres
0002-9149/13/$ -http://dx.doi.org/1
than does electrocardiography. Nevertheless, most offices of physicians do not possessechocardiographic machines, but many possess electrocardiographic machines. Many elec-trocardiographic criteria have been used to determine increased cardiac mass, but few of thecriteria have been measured against cardiac weight determined at necropsy or after cardiactransplantation. Such was the purpose of the present study. Cardiac weight at necropsy orafter transplantation was determined in 359 patients with 11 different cardiac conditions, andtotal 12-lead electrocardiographic QRS voltage (from the peak of the R wave to the nadir ofeither the Q or the S wave, whichever was deeper) was measured in each patient. Even inhearts with massively increased cardiac mass (>1,000 g), the total 12-lead QRS voltage wasclearly increased (>175 mm) in only 94%, but this criterion was superior to that of previouslydescribed electrocardiographic criteria for “left ventricular hypertrophy.” Hearts withexcessive adipose tissue infrequently had increased total 12-lead QRS voltage despiteincreased cardiac weight. Likewise, patients with fatal cardiac amyloidosis had hearts ofincreased weight but quite low total 12-lead QRS voltage. In conclusion, 12-lead QRS voltageis useful in predicting increased cardiac mass, but that predictability is dependent in part onthe cause of the increased cardiac mass. � 2013 Elsevier Inc. All rights reserved. (Am JCardiol 2013;112:904e909)
Various electrocardiographic criteria have been used topredict left ventricular hypertrophy (LVH), but few have beencomparedwith the actualweightof the heart at necropsyor aftercardiac transplantation. Exceptions are the studies byGriep1 in1959, and by Allenstein and Hiroyoshi2 in 1960. The mostcommon criterion used in the past 60 years is that recom-mended in 1949 by Sokolow and Lyon,3 who studied 12-leadelectrocardiograms in patientswhowere believed to haveLVHon the basis of “a cardiac disorder capable of producingincreased strain on the left ventricle (such as hypertension,
of Internal Medicine and Pathology; bBaylor Heart andDallas, Texas; cInstitute for Health Care Research andlor Health Care System; dCardiovascular Epidemiology,Medical Center, Dallas, Texas; eCardiovascular Epide-rt Hospital Baylor, Plano, Texas; fSouthern Methodist, Texas; and gPathology Branch, National Heart, Lung,te, National Institutes of Health, Bethesda, Maryland.ed April 3, 2013; revised manuscript received and, 2013.ss (RJS): Cedars-Sinai Medical Center, Division ofBeverly Boulevard, Suite 5623, Los Angeles, CA 90048.s (ALD): Emory University School of Medicine (Cardi-ill Drive, Atlanta, GA 30303.s (EMR): 2021 K Street, NW, Suite 315, Washington,
s (JS): St. Luke’s University Health Network Cardiology,, Bethlehem, PA 18015.s supported by grants from Baylor Health Care System
for disclosure information.g author: Tel: (214) 820-7911; fax: (214) 820-7533.s: [email protected] (W.C. Roberts).
see front matter � 2013 Elsevier Inc. All rights reserved.0.1016/j.amjcard.2013.04.061
aortic valve lesions, coarctation of the aorta, patent ductusarteriosus).” These investigators produced a variety of elec-trocardiographic criteria for LVH, including among others R inlead V5 þ S1 in lead V1 �35 mm. A number of other criteriahave been suggested subsequently (Table 1).4e11 Siegel andRoberts12 in 1982 proposed that measuring the total amplitude(from the peak of the Rwave to the nadir of either theQ or the Swave, whichever was deeper) of the QRS complex in all 12electrocardiographic leads was a better determinant of cardiacmass than the previously reported criteria (Figure 1). Subse-quently, several investigators from the same laboratorymeasured total 12-lead QRS voltage in a variety of cardiacconditions and in each compared it with the heart weightdetermined by the same investigators.13e22 Here, we reviewtheir findings in 11 different cardiac conditions.
Methods
To be included in this study, a heart had to be studied in thePathology Branch of the National Heart, Lung, and BloodInstitute of the National Institutes of Health (Bethesda,Maryland). An accurate heart weight and a 12-lead electro-cardiogram had to be available in all cases to be included inthis study. The patients were divided into 11 groups (Table 2).The electrocardiographic QRS voltage was measured in eachof the 12 leads, as demonstrated in Figure 1. In patients with>1 twelve-lead electrocardiogram available, the onemeasured was the one recorded closest to the patient’s deathor closest to cardiac transplantation. Themedical recordswerereviewed in all cases to provide pertinent clinical information.All hearts were examined and classified morphologically byone investigator (WCR). The QRS measurements were
www.ajconline.org
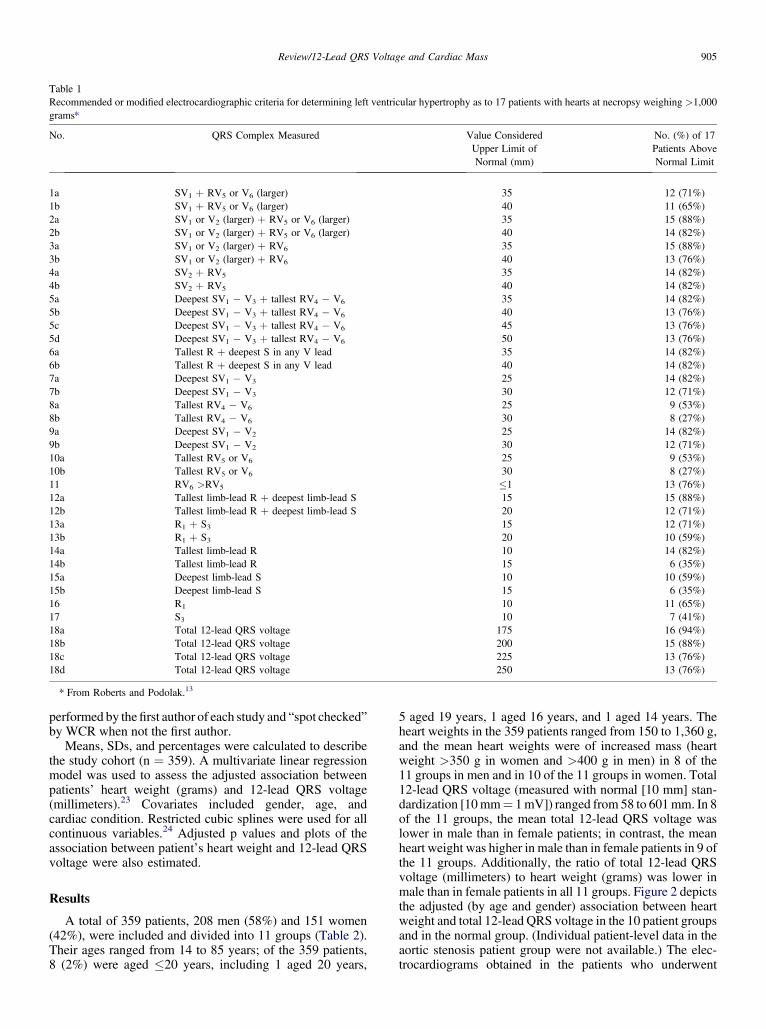
Table 1Recommended or modified electrocardiographic criteria for determining left ventricular hypertrophy as to 17 patients with hearts at necropsy weighing >1,000grams*
No. QRS Complex Measured Value ConsideredUpper Limit ofNormal (mm)
No. (%) of 17Patients AboveNormal Limit
1a SV1 þ RV5 or V6 (larger) 35 12 (71%)1b SV1 þ RV5 or V6 (larger) 40 11 (65%)2a SV1 or V2 (larger) þ RV5 or V6 (larger) 35 15 (88%)2b SV1 or V2 (larger) þ RV5 or V6 (larger) 40 14 (82%)3a SV1 or V2 (larger) þ RV6 35 15 (88%)3b SV1 or V2 (larger) þ RV6 40 13 (76%)4a SV2 þ RV5 35 14 (82%)4b SV2 þ RV5 40 14 (82%)5a Deepest SV1 � V3 þ tallest RV4 � V6 35 14 (82%)5b Deepest SV1 � V3 þ tallest RV4 � V6 40 13 (76%)5c Deepest SV1 � V3 þ tallest RV4 � V6 45 13 (76%)5d Deepest SV1 � V3 þ tallest RV4 � V6 50 13 (76%)6a Tallest R þ deepest S in any V lead 35 14 (82%)6b Tallest R þ deepest S in any V lead 40 14 (82%)7a Deepest SV1 � V3 25 14 (82%)7b Deepest SV1 � V3 30 12 (71%)8a Tallest RV4 � V6 25 9 (53%)8b Tallest RV4 � V6 30 8 (27%)9a Deepest SV1 � V2 25 14 (82%)9b Deepest SV1 � V2 30 12 (71%)10a Tallest RV5 or V6 25 9 (53%)10b Tallest RV5 or V6 30 8 (27%)11 RV6 >RV5 �1 13 (76%)12a Tallest limb-lead R þ deepest limb-lead S 15 15 (88%)12b Tallest limb-lead R þ deepest limb-lead S 20 12 (71%)13a R1 þ S3 15 12 (71%)13b R1 þ S3 20 10 (59%)14a Tallest limb-lead R 10 14 (82%)14b Tallest limb-lead R 15 6 (35%)15a Deepest limb-lead S 10 10 (59%)15b Deepest limb-lead S 15 6 (35%)16 R1 10 11 (65%)17 S3 10 7 (41%)18a Total 12-lead QRS voltage 175 16 (94%)18b Total 12-lead QRS voltage 200 15 (88%)18c Total 12-lead QRS voltage 225 13 (76%)18d Total 12-lead QRS voltage 250 13 (76%)
* From Roberts and Podolak.13
Review/12-Lead QRS Voltage and Cardiac Mass 905
performed by thefirst author of each study and “spot checked”by WCR when not the first author.
Means, SDs, and percentages were calculated to describethe study cohort (n ¼ 359). A multivariate linear regressionmodel was used to assess the adjusted association betweenpatients’ heart weight (grams) and 12-lead QRS voltage(millimeters).23 Covariates included gender, age, andcardiac condition. Restricted cubic splines were used for allcontinuous variables.24 Adjusted p values and plots of theassociation between patient’s heart weight and 12-lead QRSvoltage were also estimated.
Results
A total of 359 patients, 208 men (58%) and 151 women(42%), were included and divided into 11 groups (Table 2).Their ages ranged from 14 to 85 years; of the 359 patients,8 (2%) were aged �20 years, including 1 aged 20 years,
5 aged 19 years, 1 aged 16 years, and 1 aged 14 years. Theheart weights in the 359 patients ranged from 150 to 1,360 g,and the mean heart weights were of increased mass (heartweight >350 g in women and >400 g in men) in 8 of the11 groups in men and in 10 of the 11 groups in women. Total12-lead QRS voltage (measured with normal [10 mm] stan-dardization [10mm¼ 1mV]) ranged from 58 to 601mm. In 8of the 11 groups, the mean total 12-lead QRS voltage waslower in male than in female patients; in contrast, the meanheart weight was higher in male than in female patients in 9 ofthe 11 groups. Additionally, the ratio of total 12-lead QRSvoltage (millimeters) to heart weight (grams) was lower inmale than in female patients in all 11 groups. Figure 2 depictsthe adjusted (by age and gender) association between heartweight and total 12-lead QRS voltage in the 10 patient groupsand in the normal group. (Individual patient-level data in theaortic stenosis patient group were not available.) The elec-trocardiograms obtained in the patients who underwent
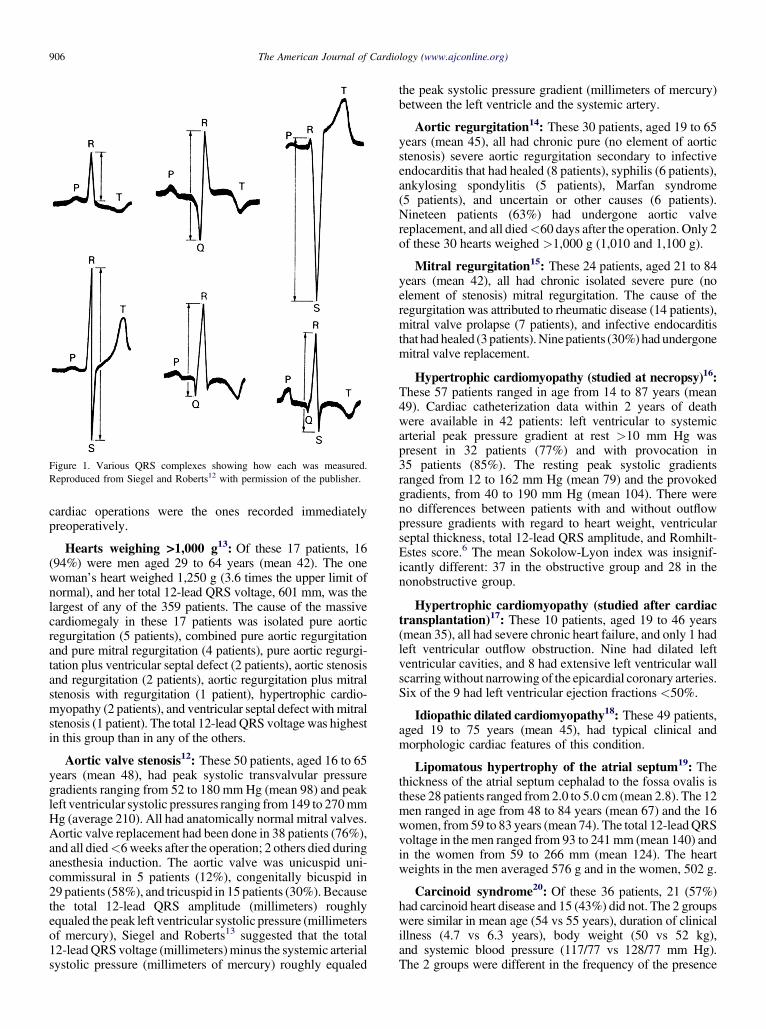
Figure 1. Various QRS complexes showing how each was measured.Reproduced from Siegel and Roberts12 with permission of the publisher.
906 The American Journal of Cardiology (www.ajconline.org)
cardiac operations were the ones recorded immediatelypreoperatively.
Hearts weighing >1,000 g13: Of these 17 patients, 16(94%) were men aged 29 to 64 years (mean 42). The onewoman’s heart weighed 1,250 g (3.6 times the upper limit ofnormal), and her total 12-lead QRS voltage, 601 mm, was thelargest of any of the 359 patients. The cause of the massivecardiomegaly in these 17 patients was isolated pure aorticregurgitation (5 patients), combined pure aortic regurgitationand pure mitral regurgitation (4 patients), pure aortic regurgi-tation plus ventricular septal defect (2 patients), aortic stenosisand regurgitation (2 patients), aortic regurgitation plus mitralstenosis with regurgitation (1 patient), hypertrophic cardio-myopathy (2 patients), and ventricular septal defect with mitralstenosis (1 patient). The total 12-lead QRS voltage was highestin this group than in any of the others.
Aortic valve stenosis12: These 50 patients, aged 16 to 65years (mean 48), had peak systolic transvalvular pressuregradients ranging from 52 to 180 mmHg (mean 98) and peakleft ventricular systolic pressures ranging from149 to 270mmHg (average 210). All had anatomically normal mitral valves.Aortic valve replacement had been done in 38 patients (76%),and all died<6weeks after the operation; 2 others died duringanesthesia induction. The aortic valve was unicuspid uni-commissural in 5 patients (12%), congenitally bicuspid in29 patients (58%), and tricuspid in 15 patients (30%). Becausethe total 12-lead QRS amplitude (millimeters) roughlyequaled the peak left ventricular systolic pressure (millimetersof mercury), Siegel and Roberts13 suggested that the total12-leadQRS voltage (millimeters)minus the systemic arterialsystolic pressure (millimeters of mercury) roughly equaled
the peak systolic pressure gradient (millimeters of mercury)between the left ventricle and the systemic artery.
Aortic regurgitation14: These 30 patients, aged 19 to 65years (mean 45), all had chronic pure (no element of aorticstenosis) severe aortic regurgitation secondary to infectiveendocarditis that had healed (8 patients), syphilis (6 patients),ankylosing spondylitis (5 patients), Marfan syndrome(5 patients), and uncertain or other causes (6 patients).Nineteen patients (63%) had undergone aortic valvereplacement, and all died<60 days after the operation. Only 2of these 30 hearts weighed >1,000 g (1,010 and 1,100 g).
Mitral regurgitation15: These 24 patients, aged 21 to 84years (mean 42), all had chronic isolated severe pure (noelement of stenosis) mitral regurgitation. The cause of theregurgitation was attributed to rheumatic disease (14 patients),mitral valve prolapse (7 patients), and infective endocarditisthat had healed (3patients).Ninepatients (30%) had undergonemitral valve replacement.
Hypertrophic cardiomyopathy (studied at necropsy)16:These 57 patients ranged in age from 14 to 87 years (mean49). Cardiac catheterization data within 2 years of deathwere available in 42 patients: left ventricular to systemicarterial peak pressure gradient at rest >10 mm Hg waspresent in 32 patients (77%) and with provocation in35 patients (85%). The resting peak systolic gradientsranged from 12 to 162 mm Hg (mean 79) and the provokedgradients, from 40 to 190 mm Hg (mean 104). There wereno differences between patients with and without outflowpressure gradients with regard to heart weight, ventricularseptal thickness, total 12-lead QRS amplitude, and Romhilt-Estes score.6 The mean Sokolow-Lyon index was insignif-icantly different: 37 in the obstructive group and 28 in thenonobstructive group.
Hypertrophic cardiomyopathy (studied after cardiactransplantation)17: These 10 patients, aged 19 to 46 years(mean 35), all had severe chronic heart failure, and only 1 hadleft ventricular outflow obstruction. Nine had dilated leftventricular cavities, and 8 had extensive left ventricular wallscarringwithout narrowing of the epicardial coronary arteries.Six of the 9 had left ventricular ejection fractions <50%.
Idiopathic dilated cardiomyopathy18: These 49 patients,aged 19 to 75 years (mean 45), had typical clinical andmorphologic cardiac features of this condition.
Lipomatous hypertrophy of the atrial septum19: Thethickness of the atrial septum cephalad to the fossa ovalis isthese 28 patients ranged from 2.0 to 5.0 cm (mean 2.8). The 12men ranged in age from 48 to 84 years (mean 67) and the 16women, from59 to 83 years (mean 74). The total 12-leadQRSvoltage in the men ranged from 93 to 241 mm (mean 140) andin the women from 59 to 266 mm (mean 124). The heartweights in the men averaged 576 g and in the women, 502 g.
Carcinoid syndrome20: Of these 36 patients, 21 (57%)had carcinoid heart disease and 15 (43%) did not. The 2 groupswere similar in mean age (54 vs 55 years), duration of clinicalillness (4.7 vs 6.3 years), body weight (50 vs 52 kg),and systemic blood pressure (117/77 vs 128/77 mm Hg).The 2 groups were different in the frequency of the presence
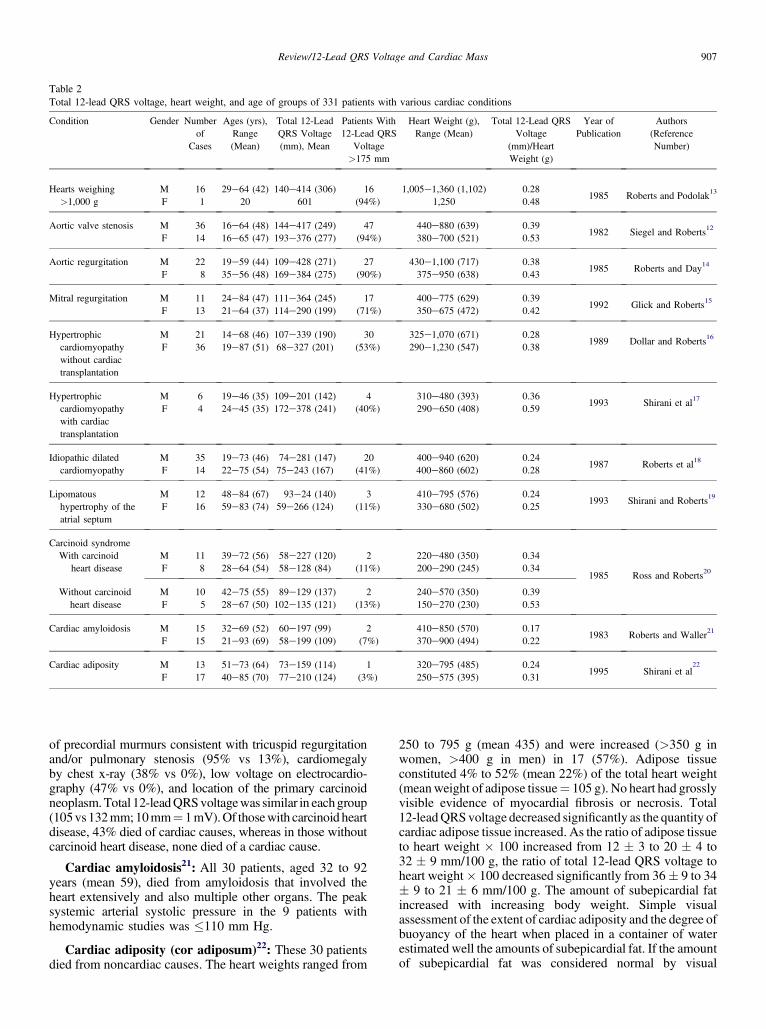
Table 2Total 12-lead QRS voltage, heart weight, and age of groups of 331 patients with various cardiac conditions
Condition Gender Numberof
Cases
Ages (yrs),Range(Mean)
Total 12-LeadQRS Voltage(mm), Mean
Patients With12-Lead QRS
Voltage>175 mm
Heart Weight (g),Range (Mean)
Total 12-Lead QRSVoltage
(mm)/HeartWeight (g)
Year ofPublication
Authors(ReferenceNumber)
Hearts weighing>1,000 g
MF
161
29e64 (42)20
140e414 (306)601
16(94%)
1,005e1,360 (1,102)1,250
0.280.48
1985 Roberts and Podolak13
Aortic valve stenosis M 36 16e64 (48) 144e417 (249) 47 440e880 (639) 0.391982 Siegel and Roberts12
F 14 16e65 (47) 193e376 (277) (94%) 380e700 (521) 0.53
Aortic regurgitation M 22 19e59 (44) 109e428 (271) 27 430e1,100 (717) 0.381985 Roberts and Day14
F 8 35e56 (48) 169e384 (275) (90%) 375e950 (638) 0.43
Mitral regurgitation M 11 24e84 (47) 111e364 (245) 17 400e775 (629) 0.391992 Glick and Roberts15
F 13 21e64 (37) 114e290 (199) (71%) 350e675 (472) 0.42
Hypertrophiccardiomyopathywithout cardiactransplantation
MF
2136
14e68 (46)19e87 (51)
107e339 (190)68e327 (201)
30(53%)
325e1,070 (671)290e1,230 (547)
0.280.38
1989 Dollar and Roberts16
Hypertrophiccardiomyopathywith cardiactransplantation
MF
64
19e46 (35)24e45 (35)
109e201 (142)172e378 (241)
4(40%)
310e480 (393)290e650 (408)
0.360.59
1993 Shirani et al17
Idiopathic dilatedcardiomyopathy
MF
3514
19e73 (46)22e75 (54)
74e281 (147)75e243 (167)
20(41%)
400e940 (620)400e860 (602)
0.240.28
1987 Roberts et al18
Lipomatoushypertrophy of theatrial septum
MF
1216
48e84 (67)59e83 (74)
93e24 (140)59e266 (124)
3(11%)
410e795 (576)330e680 (502)
0.240.25
1993 Shirani and Roberts19
Carcinoid syndromeWith carcinoid
heart diseaseMF
118
39e72 (56)28e64 (54)
58e227 (120)58e128 (84)
2(11%)
220e480 (350)200e290 (245)
0.340.34
1985 Ross and Roberts20
Without carcinoidheart disease
MF
105
42e75 (55)28e67 (50)
89e129 (137)102e135 (121)
2(13%)
240e570 (350)150e270 (230)
0.390.53
Cardiac amyloidosis M 15 32e69 (52) 60e197 (99) 2 410e850 (570) 0.171983 Roberts and Waller21
F 15 21e93 (69) 58e199 (109) (7%) 370e900 (494) 0.22
Cardiac adiposity M 13 51e73 (64) 73e159 (114) 1(3%)
320e795 (485) 0.241995 Shirani et al
22
F 17 40e85 (70) 77e210 (124) 250e575 (395) 0.31
Review/12-Lead QRS Voltage and Cardiac Mass 907
of precordial murmurs consistent with tricuspid regurgitationand/or pulmonary stenosis (95% vs 13%), cardiomegalyby chest x-ray (38% vs 0%), low voltage on electrocardio-graphy (47% vs 0%), and location of the primary carcinoidneoplasm.Total 12-leadQRSvoltagewas similar in eachgroup(105vs132mm;10mm¼ 1mV).Of thosewith carcinoid heartdisease, 43% died of cardiac causes, whereas in those withoutcarcinoid heart disease, none died of a cardiac cause.
Cardiac amyloidosis21: All 30 patients, aged 32 to 92years (mean 59), died from amyloidosis that involved theheart extensively and also multiple other organs. The peaksystemic arterial systolic pressure in the 9 patients withhemodynamic studies was �110 mm Hg.
Cardiac adiposity (cor adiposum)22: These 30 patientsdied from noncardiac causes. The heart weights ranged from
250 to 795 g (mean 435) and were increased (>350 g inwomen, >400 g in men) in 17 (57%). Adipose tissueconstituted 4% to 52% (mean 22%) of the total heart weight(meanweight of adipose tissue¼ 105 g). No heart had grosslyvisible evidence of myocardial fibrosis or necrosis. Total12-leadQRSvoltage decreased significantly as the quantity ofcardiac adipose tissue increased. As the ratio of adipose tissueto heart weight � 100 increased from 12 � 3 to 20 � 4 to32 � 9 mm/100 g, the ratio of total 12-lead QRS voltage toheart weight� 100 decreased significantly from 36� 9 to 34� 9 to 21 � 6 mm/100 g. The amount of subepicardial fatincreased with increasing body weight. Simple visualassessment of the extent of cardiac adiposity and the degree ofbuoyancy of the heart when placed in a container of waterestimated well the amounts of subepicardial fat. If the amountof subepicardial fat was considered normal by visual
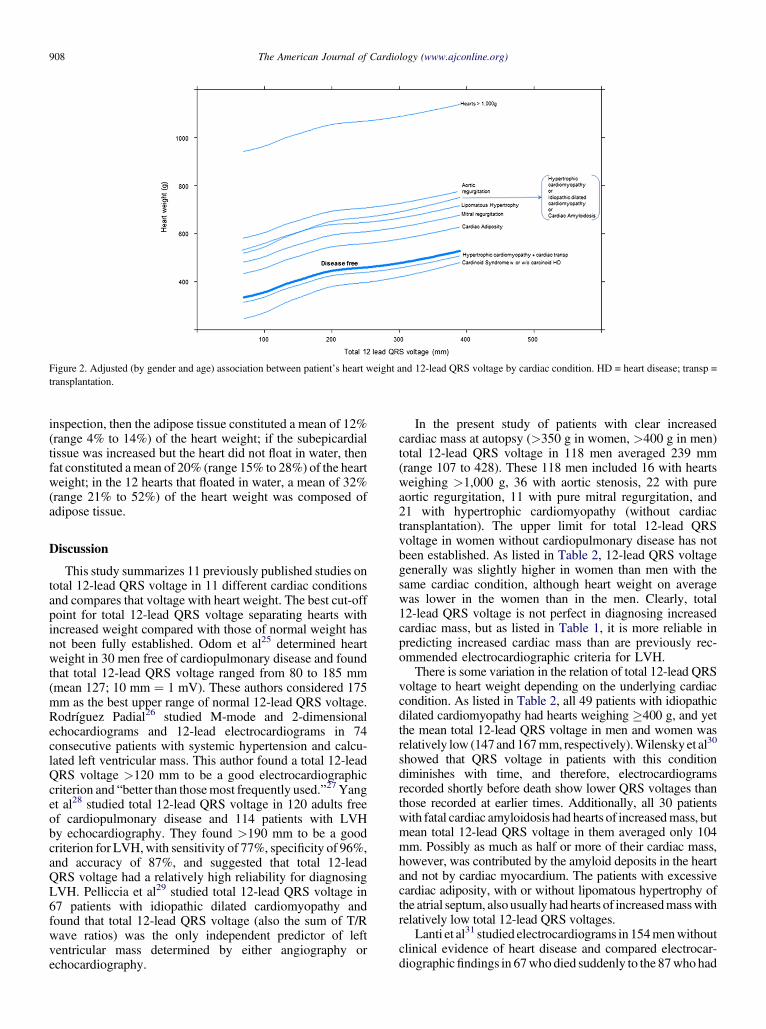
Figure 2. Adjusted (by gender and age) association between patient’s heart weight and 12-lead QRS voltage by cardiac condition. HD = heart disease; transp =transplantation.
908 The American Journal of Cardiology (www.ajconline.org)
inspection, then the adipose tissue constituted a mean of 12%(range 4% to 14%) of the heart weight; if the subepicardialtissue was increased but the heart did not float in water, thenfat constituted amean of 20% (range 15% to 28%) of the heartweight; in the 12 hearts that floated in water, a mean of 32%(range 21% to 52%) of the heart weight was composed ofadipose tissue.
Discussion
This study summarizes 11 previously published studies ontotal 12-lead QRS voltage in 11 different cardiac conditionsand compares that voltage with heart weight. The best cut-offpoint for total 12-lead QRS voltage separating hearts withincreased weight compared with those of normal weight hasnot been fully established. Odom et al25 determined heartweight in 30 men free of cardiopulmonary disease and foundthat total 12-lead QRS voltage ranged from 80 to 185 mm(mean 127; 10 mm ¼ 1 mV). These authors considered 175mm as the best upper range of normal 12-lead QRS voltage.Rodríguez Padial26 studied M-mode and 2-dimensionalechocardiograms and 12-lead electrocardiograms in 74consecutive patients with systemic hypertension and calcu-lated left ventricular mass. This author found a total 12-leadQRS voltage >120 mm to be a good electrocardiographiccriterion and “better than thosemost frequently used.”27 Yanget al28 studied total 12-lead QRS voltage in 120 adults freeof cardiopulmonary disease and 114 patients with LVHby echocardiography. They found >190 mm to be a goodcriterion for LVH,with sensitivity of 77%, specificity of 96%,and accuracy of 87%, and suggested that total 12-leadQRS voltage had a relatively high reliability for diagnosingLVH. Pelliccia et al29 studied total 12-lead QRS voltage in67 patients with idiopathic dilated cardiomyopathy andfound that total 12-lead QRS voltage (also the sum of T/Rwave ratios) was the only independent predictor of leftventricular mass determined by either angiography orechocardiography.
In the present study of patients with clear increasedcardiac mass at autopsy (>350 g in women, >400 g in men)total 12-lead QRS voltage in 118 men averaged 239 mm(range 107 to 428). These 118 men included 16 with heartsweighing >1,000 g, 36 with aortic stenosis, 22 with pureaortic regurgitation, 11 with pure mitral regurgitation, and21 with hypertrophic cardiomyopathy (without cardiactransplantation). The upper limit for total 12-lead QRSvoltage in women without cardiopulmonary disease has notbeen established. As listed in Table 2, 12-lead QRS voltagegenerally was slightly higher in women than men with thesame cardiac condition, although heart weight on averagewas lower in the women than in the men. Clearly, total12-lead QRS voltage is not perfect in diagnosing increasedcardiac mass, but as listed in Table 1, it is more reliable inpredicting increased cardiac mass than are previously rec-ommended electrocardiographic criteria for LVH.
There is some variation in the relation of total 12-lead QRSvoltage to heart weight depending on the underlying cardiaccondition. As listed in Table 2, all 49 patients with idiopathicdilated cardiomyopathy had hearts weighing �400 g, and yetthe mean total 12-lead QRS voltage in men and women wasrelatively low (147and 167mm, respectively).Wilensky et al30
showed that QRS voltage in patients with this conditiondiminishes with time, and therefore, electrocardiogramsrecorded shortly before death show lower QRS voltages thanthose recorded at earlier times. Additionally, all 30 patientswith fatal cardiac amyloidosis had hearts of increasedmass, butmean total 12-lead QRS voltage in them averaged only 104mm. Possibly as much as half or more of their cardiac mass,however, was contributed by the amyloid deposits in the heartand not by cardiac myocardium. The patients with excessivecardiac adiposity, with or without lipomatous hypertrophy ofthe atrial septum, alsousually had hearts of increasedmasswithrelatively low total 12-lead QRS voltages.
Lanti et al31 studied electrocardiograms in 154menwithoutclinical evidence of heart disease and compared electrocar-diographicfindings in 67who died suddenly to the 87whohad
Review/12-Lead QRS Voltage and Cardiac Mass 909
nonsudden death. They found that 12-lead QRS voltage hada significant and independent relation to sudden death andhelped identify subjects at increased risk for sudden coronarydeath. These investigators also found that the Sokolow-Lyonindex was inversely related to nonsudden death.
The strong features of the present study are thefollowing: (1) the 12-lead QRS voltage was determined ina variety of cardiac conditions, and (2) heart weights in allpatients studied were available and accurately determined.Relatively few previous studies on electrocardiographicdetermination of LVH actually compared the electrocar-diographic criteria with actual heart weight, and those thatdid acquired those data from autopsy protocols produced bya variety of prosecutors with varying expertise in cardio-vascular disease.
Disclosures
The authors have no conflicts of interest to disclose.
1. Griep AH. Pitfalls in the electrocardiographic diagnosis of leftventricular hypertrophy: a correlative study of 200 autopsied patients.Circulation 1959;20:30e34.
2. Allenstein BJ, Hiroyoshi M. Evaluation of electrocardiographic diag-nosis of ventricular hypertrophy based on autopsy comparison.Circulation 1960;21:401e412.
3. Sokolow M, Lyon TP. The ventricular complex in left ventricularhypertrophy as obtained by unipolar precordial and limb leads. AmHeart J 1949;37:161e186.
4. Holt DH, Spodick DH. The Rv6:Rv5 voltage ratio in left ventricularhypertrophy. Am Heart J 1962;63:65e66.
5. Carter WA, Estes EH Jr. Electrocardiographic manifestations ofventricular hypertrophy; a computer study of ECG-anatomic correla-tions in 319 cases. Am Heart J 1964;68:173e182.
6. Romhilt DW, Estes WH Jr. A point-score system for the ECGdiagnosis of left ventricular hypertrophy. Am Heart J 1968;75:752e758.
7. Romhilt DW, Bove KE, Norris RJ, Conyers E, Conradi S, RowlandsDT, Scott RC. A critical appraisal of the electrocardiographic criteriafor the diagnosis of left ventricular hypertrophy. Circulation 1969;40:185e195.
8. Bennett DH, Evans DW. Correlation of left ventricular mass deter-mined by echocardiography with vectorcardiographic and electrocar-diographic voltage measurements. Br Heart J 1974;36:981e987.
9. Casale PN, Devereux RB, Alonso DR, Camp E, Kligfield P. Improvedsex-specific criteria of left ventricular hypertrophy for clinical andcomputer interpretation of electrocardiograms: validation with autopsyfindings. Circulation 1987;3:565e572.
10. Koito H, Spokick DH. Accuracy of the RV6:RV5 voltage ratio forincreased left ventricular mass. Am J Cardiol 1988;62:985e987.
11. Velury S, Spodick DH. Increased left ventricular mass in patientswith lateral low voltage electrocardiograms. Am J Cardiol 1992;69:707e708.
12. Siegel RJ, Roberts WC. Electrocardiographic observations in severeaortic valve stenosis: correlative necropsy study to clinical, hemody-namic, and ECG variables demonstrating relation of 12-lead QRS
amplitude to peak systolic transaortic pressure gradient. Am Heart J1982;103:210e221.
13. Roberts WC, Podolak MJ. The king of hearts: analysis of 23 patientswith hearts weighing 1000 grams or more. Am J Cardiol 1985;55:485e494.
14. Roberts WC, Day PJ. Electrocardiographic observations in clinicallyisolated, pure, chronic, severe aortic regurgitation: analysis of 30necropsy patients aged 19 to 65 years. Am J Cardiol 1985;55:431e438.
15. Glick BN, Roberts WC. Usefulness of total 12-lead QRS voltage indiagnosing left ventricular hypertrophy in clinically isolated, pure,chronic, severe mitral regurgitation. Am J Cardiol 1992;70:1088e1092.
16. Dollar AL, Roberts WC. Usefulness of total 12-lead QRS voltagecompared with other criteria for determining left ventricular hyper-trophy in hypertrophic cardiomyopathy: analysis of 57 patients studiedat necropsy. Am J Med 1989;87:377e381.
17. Shirani J, Maron BJ, Cannon RO III, Shahin S, Roberts WC. Clini-copathologic features of hypertrophic cardiomyopathy managed bycardiac transplantation. Am J Cardiol 1993;72:434e440.
18. RobertsWC,SiegelRJ,McManusBM. Idiopathic dilatedcardiomyopathy:analysis of 152 necropsy patients. Am J Cardiol 1987;60:1340e1355.
19. Shirani J, Roberts WC. Clinical, electrocardiographic and morphologicfeatures of massive fatty deposits (“lipomatous hypertrophy”) in theatrial septum. J Am Coll Cardiol 1993;22:226e238.
20. Ross EM, Roberts WC. The carcinoid syndrome: comparison of 21necropsy subjects with carcinoid heart disease to 15 necropsy subjectswithout carcinoid heart disease. Am J Heart 1985;79:339e354.
21. Roberts WC, Waller BF. Cardiac amyloidosis causing cardiac dysfunc-tion: analysis of 54 necropsy patients. Am J Cardiol 1983;52:137e146.
22. Shirani J, Berezowski K, Roberts WC. Quantitative measurement ofnormal and excessive (cor adiposum) subepicardial adipose tissue, itsclinical significance, and its effect on electrocardographic QRS voltage.Am J Cardiol 1995;76:414e418.
23. Harrell FE Jr. Regression Modeling Strategies: With Application toLinear Models, Logistic Regression, and Survival Analysis. New York:Springer-Verlag, 2001.
24. Filardo G, Hamilton C, Hamman B, Ng HK, Grayburn P. CategorizingBMI may lead to biased results in studies investigating in-hospitalmortality after isolated CABG. J Clin Epidemiol 2007;60:1132e1139.
25. Odom H II, Davis JL, Dinh H, Baker BJ, Roberts WC, Murphy ML.QRS voltage measurements in autopsied men free of cardiopulmonarydisease: a basis for evaluating total QRS voltage as a index of leftventricular hypertrophy. Am J Cardiol 1986;58:801e804.
26. Rodríguez Padial L. Usefulness of total 12-lead QRS voltage fordetermining the presence of left ventricular hypertrophy in systemichypertension. Am J Cardiol 1991;68:261e262.
27. Rodríguez Padial L, Navarro A, Sánchez J. RVG: RV5 voltage ratio insystemic hypertension. Am J Cardiol 1990;66:869e871.
28. Yang TH, Deng SY, Cai YC. The normal values of total 12-lead QRSvoltage and its significance in diagnosing left ventricular hypertrophy.Chinese J Cardiol 1988;16:353e355.
29. Pelliccia F, Critelli G, Cianfrocca C, Nigri A, Reale A. Electrocar-diographic correlates with left ventricular morphology in idiopathicdilated cardiomyopathy. Am J Cardiol 1991;68:642e647.
30. Wilensky RL, Yudelman P, Cohen A, Fletcher RD, Atkinson J,Virmani R, Roberts WC. Serial electrocardiographic changes in idio-pathic dilated cardiomyopathy confirmed at necropsy. Am J Cardiol1988;62:276e283.
31. Lanti M, Puddu PE, Menotti A. Voltage criteria of left ventricularhypertrophy in sudden and nonsudden coronary artery diseasemortality: the Italian section of the seven countries study. Am J Cardiol1990;66:1181e1185.