Embed Size (px)
Citation preview
URCA PROPOSAL
COMPARISON OF TYPE IA SUPERNOVAMODELS WITH YOUNGEST KNOWN
SUPERNOVA REMNANT
ALAN BLACK
Abstract. Type Ia supernovae (SNe Ia) are produced by the thermonuclear explosionof a white dwarf star. These supernovae(SNe) are the source of most iron in the universe.Additionally, the uniform peak brightness of SNe allows for precise distance calculations toremote points in the universe; these distance calculations lend themselves to more preciseestimations of the scale of the universe. There have not been any recent observations ofSNe Ia in our galaxy, but supernova remnants (SNRs) hold valuable information aboutthe SNe themselves. There is, however, a gap in what we know about SNe and what weknow through observing their remnants; the exact mechanism of the explosion is still notunderstood. By using data from a SN Ia model simulation 100 seconds after the explosionas the initial conditions for a hydrodynamic simulation, we can predict the appearance ofthe remnant hundreds of years later. Specifically, we aim to compare these results to theyoungest known SNR ( 100 years old) in our galaxy, G1.9+.03 Previous 2D simulationsworked on the assumption of spherical symmetry; by starting with a 3D model we may finddifferent result. With our model, we can predict the location of light elements expelled bythe blast (carbon and oxygen) as well as moderate (sulfur and silicon) and heavy elements(iron) formed in the SN that produced the remnant. This may also give us some insightinto the composition of the interstellar medium surrounding G1.9+.03
1. Introduction
Type Ia supernovae (SNe Ia) are the result of the thermonuclear detonation of a whitedwarf star. When gravitationally bound to a companion star, a normal (giant or main se-quence) star or another white dwarf, matter from the companion is accreted by the whitedwarf(WD). This matter accumulates on the WD until reaching the star’s critical mass,
Date: June 8, 2012.1
2 ALAN BLACK
the Chandrasekhar limit. The increase in density and temperature caused by the addi-tional mass restarts thermonuclear fusion by allowing for the fusion of carbon, a previouslyunfuseable element, in the core of the WD. The WD is unable to regulate this reaction asnormal stars do, so a runaway fusion reaction known as carbon detonation may begin. Theexact ignition mechanism of this “nuclear flame” is still not understood entirely.
SNe Ia are astronomically important for several reasons. Not only do they producethe majority of iron in the universe, they have a uniform peak brightness (due to theuniform mass of the WD) that allows them to be used as “standard candles” in precisedistance calculations. Supernova remnants (SNR) are the leftover matter expanding fromthe explosion.There have not been any recent observations of SNe Ia in our galaxy, butSNR can give some insight into the SNe themselves.
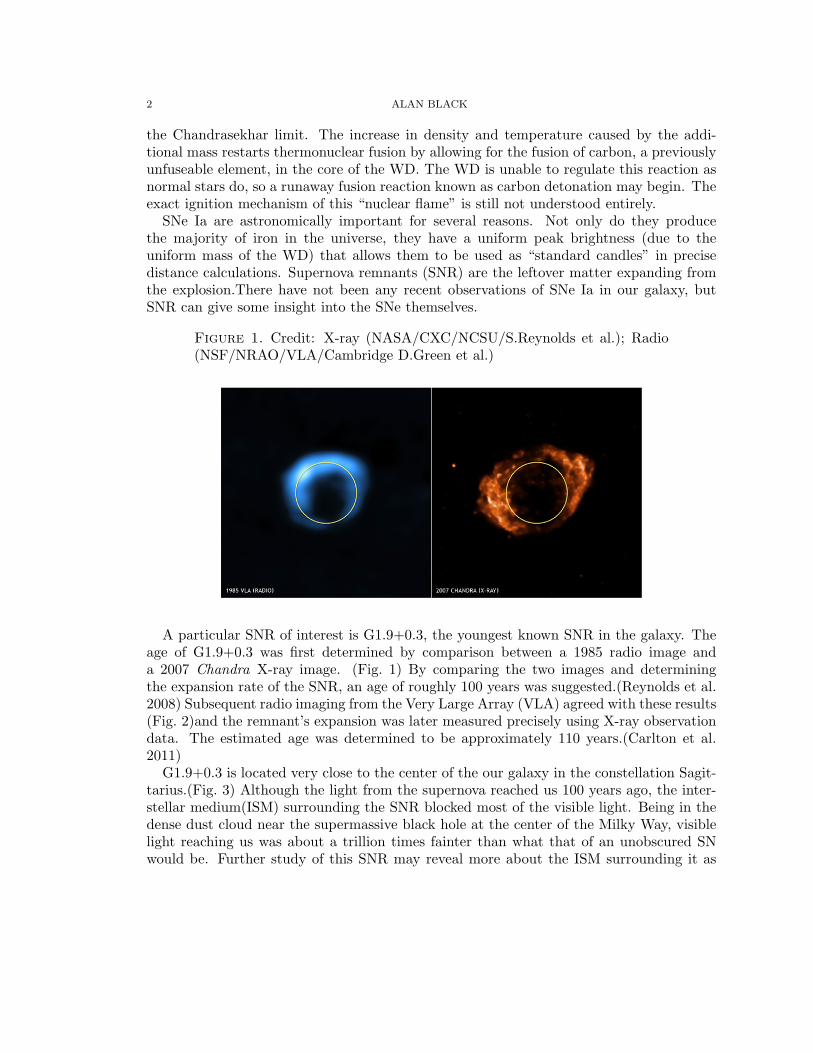
Figure 1. Credit: X-ray (NASA/CXC/NCSU/S.Reynolds et al.); Radio(NSF/NRAO/VLA/Cambridge D.Green et al.)
A particular SNR of interest is G1.9+0.3, the youngest known SNR in the galaxy. Theage of G1.9+0.3 was first determined by comparison between a 1985 radio image anda 2007 Chandra X-ray image. (Fig. 1) By comparing the two images and determiningthe expansion rate of the SNR, an age of roughly 100 years was suggested.(Reynolds et al.2008) Subsequent radio imaging from the Very Large Array (VLA) agreed with these results(Fig. 2)and the remnant’s expansion was later measured precisely using X-ray observationdata. The estimated age was determined to be approximately 110 years.(Carlton et al.2011)
G1.9+0.3 is located very close to the center of the our galaxy in the constellation Sagit-tarius.(Fig. 3) Although the light from the supernova reached us 100 years ago, the inter-stellar medium(ISM) surrounding the SNR blocked most of the visible light. Being in thedense dust cloud near the supermassive black hole at the center of the Milky Way, visiblelight reaching us was about a trillion times fainter than what that of an unobscured SNwould be. Further study of this SNR may reveal more about the ISM surrounding it as

URCA PROPOSAL 3
Figure 2. Credit:(NSF/NRAO/VLA/Cambridge D.Green et al.)
the density structure and composition of the surrounding ISM affects the overall structureand composition of the remnant. (Dwarkadas and Chevalier 1998)
The elemental composition of G1.9+0.3 has also been determined by observation ofthermal X-ray emission. Spectral lines of Si, S, Fe, and possibly Ar and Ca were detected;this indicates that matter composed of these elements has passed through the reverseshock wave. The presence of radioactive Scandium-44, produced by electron capture fromTitanium-44. Unexpectedly, Sc-44 was found in away from the inner ejecta; this indicatesthat the explosion may have been substantially asymmetric.(Borkowski et al. 2010)
Figure 3. Credit: NASA/CXC/M.Weiss
4 ALAN BLACK
2. Problem Statement
My project will center around evolving a 3D model of a SNE Ia and comparing it toG1.9+0.3 We will make spatial and kinematic comparisons between the model and our dataon the SNR provided by X-ray and radio imaging. Using this model, we will predict thelocation of light elements expelled by the blast (carbon and oxygen) as well as intermediate(sulfur and silicon) and heavy elements (iron) formed in the SN that produced the remnant.With this data, we may learn more about the ISM surrounding G1.9+0.3 as well as itsexplosion mechanism. We will test our model to see if it can replicate the presence of theshocked intermediate and heavy elements found in the remnant as well as its observed sizeand expansion speed.
3. Proposed Work
We will run simulations based on an existing, highly-detailed numerical model set 100seconds after the beginning of the explosion. The goal is to evolve this model forward intime to an age of 100 years using VH-1, a Fortran-based hydrodynamics code, and attemptto match the observed size and expansion speed of the SNR by adjusting external density.
A two-dimensional simulation like this has been made before, but modeling in threedimensions will operate without the assumption of cyllindrical symmetry used in the 2Dsimulation.(Griffeth et al. 2011)
4. Summary
The successful outcome of this project will hopefully yield new information on theyoungest galactic SNR, SNe Ia in general, and current modeling techniques. The recentobservations of G1.9+0.3 will undoubtably continue, allowing for more information withwhich we can evaluate our model. We will determine whether this SN model (and thoselike it) can produce something similar to G1.9+0.3 and, if not, how our current modelsfail. Perhaps most importantly, we may learn more about the explosion mechanism.
References
[Reynolds et al.(2008)] Reynolds, S. P.; Borkowski, K. J.; Green, D. A.; Hwang, U.; Harrus, I.; Petre, R[Dwarkadas and Chevalier(1998)] Vikram V. Dwarkadas and Roger A. Chevalier 1998, ApJ 497[Borkowski et al.(2010)] Borkowski, Kazimierz J.; Reynolds, S.P.; Green, D. A.; Hwang, U.; Petre, R.;Krishnamurthy, K.; Willett, R.; 2012, ApJ 724 L161
[Carlton et al. (2011)] Carlton ,A.K.; Borkowski,K.J.; Reynolds,S.P.; Hwang,U., Petre,R.; Green,D.A.; Kr-ishnamurthy,K.; Willett,R.; 2011, ApJ, 737 L22
[Sushch et al.(2012)] Sushch, Iurii; Chaves, Ryan C. G.; Paz Arribas, Manuel; Volpe, Francesca; Komin,Nukri; Kerschhaggl, Matthias; 2012, for the H. E. S. S. Collaboration
[Griffeth et al.(2011)] Griffeth, A.; Reynolds, S. P.; Frohlich, C.; Blondin, J. M., American AstronomicalSociety, HEAD meeting 12, 34.26
URCA RESEARCH PROPOSAL
BREATHING MODE INSTABILITY INHOYLE-LYTTLETON ACCRETION
ANNA S. CARR
Abstract. Gravitational accretion acts as a ubiquitous source of power for many celes-tial objects, yet how different conditions affect its fundamental properties remains poorlyunderstood. Proposed in 1939, the Hoyle-Lyttleton model of accretion describes math-ematically the behavior of a uniform gas cloud collecting onto a compact star. Whilethis model has been found to predict generally accurate data, it is limited to steady,axisymmetric flow and fails to address many idiosyncrasies present in such a system.[Edgar, 2004] Recent studies of high-resolution simulations of HL accretion demonstrateinstability in the mass accretion rate creating breathing mode oscillations of unclear origin.[Blondin and Raymer, 2012] We propose an in-depth investigation of accretion breathingmodes using 2D simulations to characterize their nature as a function of changing condi-tions. By converting 3D simulations created by Blondin and Raymer (2012) into 2D, wewill be able to study axisymmetric accretors of smaller radii in a high resolution grid forlonger periods of time. We will examine the effects of changing the adiabatic index (γ)with a constant accretor radius and also observe results produced from an increasing machnumber. Additionally, predictions made by Foglizzo (2001) will be evaluated during thisprocess in an attempt to find any inherent relationships between variables and explainthe mechanism behind breathing mode oscillation.
1. Introduction
As one of the four fundamental forces, gravity is responsible for copious phenomena inour universe and in particular, gravitational accretion. The process of accretion catalyzesinnumerable celestial developments including star and planet formation, gamma-ray bursts,and type Ia supernovae. In 1939 Hoyle and Lyttleton aimed to explain climate variationsby quantifying the mass accretion onto the sun as it moves through an interstellar uniform
Date: June 12, 2012.1
2 ANNA S. CARR
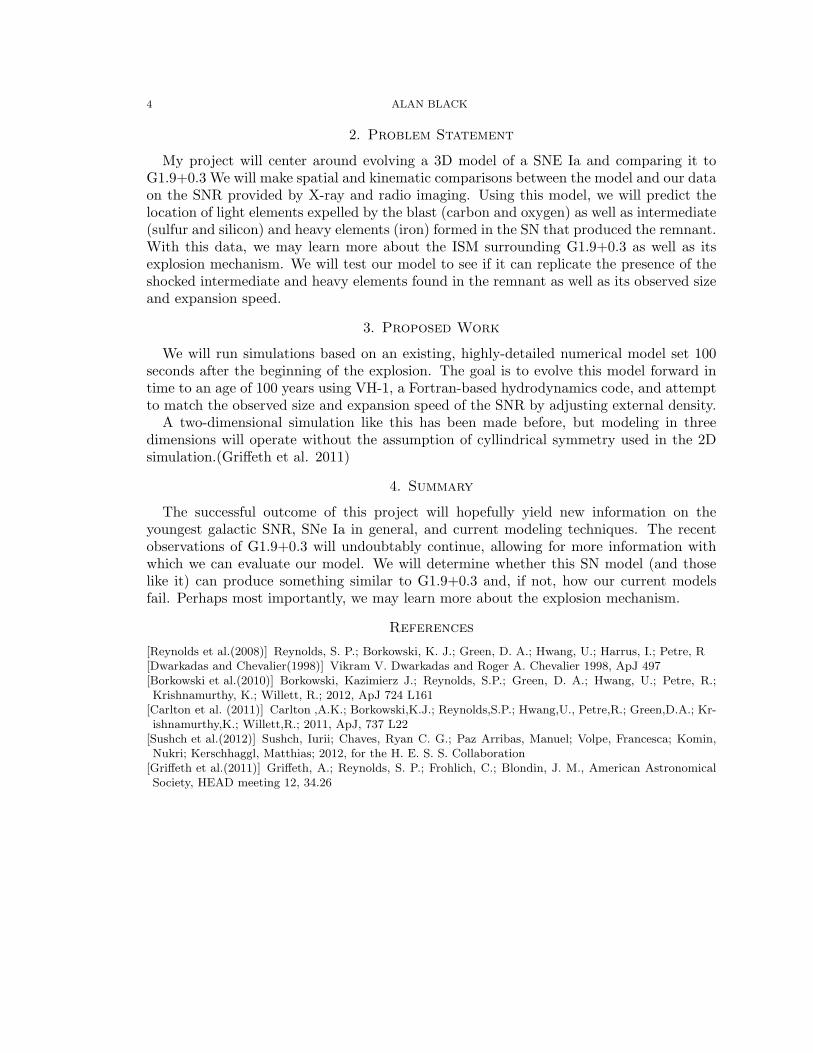
Figure 1. Edgar 2004: Sketch of the BondiHoyleLyttleton accretion geometry.
gas cloud. They derived equations for the radius of accreted material and the rate at whichthat material is accreted.
Ra =(
2GMv2∞
)(1)
The above equation describes the radius of accreting materials at a velocity of v∞. Matterwill be collected by the point mass at a distance ζ as shown in fig. 1. The equation belowshows the rate of mass accreted by the object with the material moving at v∞ and with adensity of ρ∞.
HL =(
4πG2M2ρ∞v3∞
)(2)
While they failed to achieve their goals of elucidating the fluctuations in Earth’s climate,they did deduce a generally accurate model for material accretion of a point mass through asteady medium. A review of Hoyle-Lyttleton accretion was conducted by Richard Edgar in2004 in which he discusses factors that were not addressed in the original methods, includingdrag force, flow stability, density and velocity gradients, radiation, and relativistic effects.Recent studies performed with simulations of Bondi-Hoyle-Lyttleton accretion attemptingto include these aspects have yielded interesting results.
Simulations in both two and three dimensions of Hoyle-Lyttleton accretion have pro-duced instabilities in the flow of an accreting object. Flip-flop instability in Hoyle-Lyttletonaccretion, first described by Matsuda et al. (1987), is characterized by an oscillation inthe wake of an accreting object, the flow switching between negative and positive an-gular momentum. This instability was thought to be a product of methodological er-rors, however it continued to manifest in more advanced two-dimensional simulations.[Blondin and Pope, 2009] The first high resolution three-dimensional simulations [Blondinand Raymer, 2012] established that with a sufficiently small accretor radius, breathingmode instabilities appear. Oscillations in the mass accretion rate reflect the breathing
URCA RESEARCH PROPOSAL 3
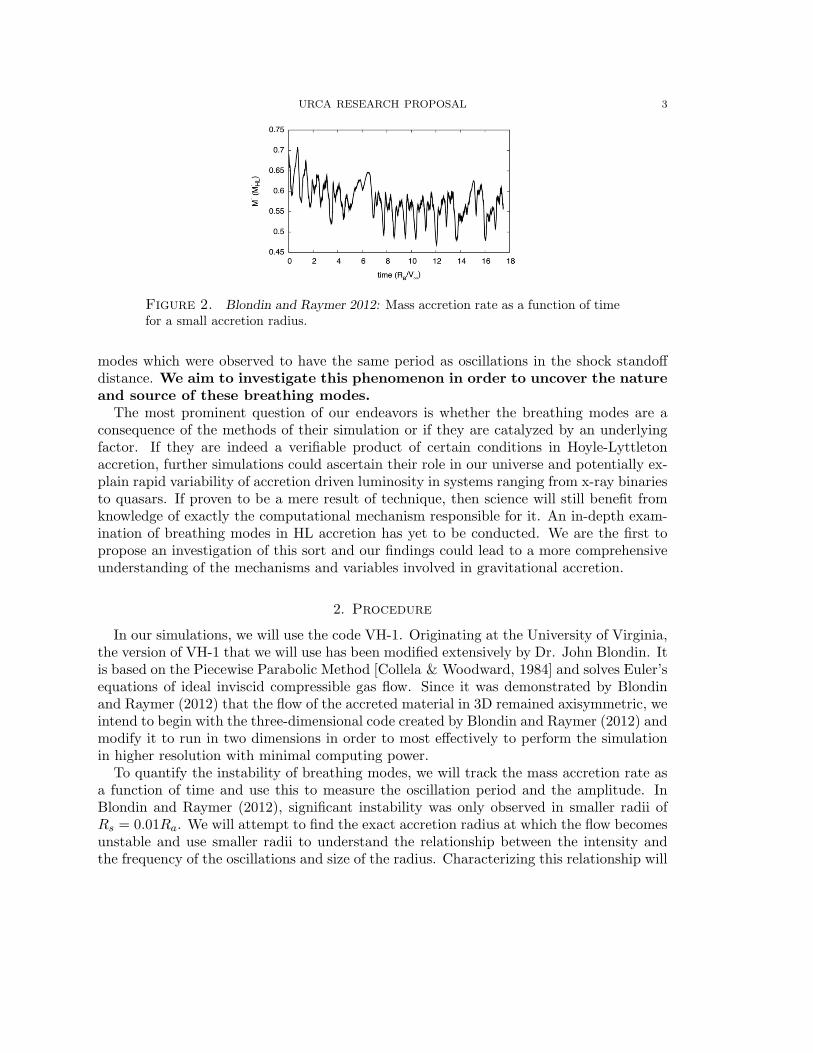
Figure 2. Blondin and Raymer 2012: Mass accretion rate as a function of timefor a small accretion radius.
modes which were observed to have the same period as oscillations in the shock standoffdistance. We aim to investigate this phenomenon in order to uncover the natureand source of these breathing modes.
The most prominent question of our endeavors is whether the breathing modes are aconsequence of the methods of their simulation or if they are catalyzed by an underlyingfactor. If they are indeed a verifiable product of certain conditions in Hoyle-Lyttletonaccretion, further simulations could ascertain their role in our universe and potentially ex-plain rapid variability of accretion driven luminosity in systems ranging from x-ray binariesto quasars. If proven to be a mere result of technique, then science will still benefit fromknowledge of exactly the computational mechanism responsible for it. An in-depth exam-ination of breathing modes in HL accretion has yet to be conducted. We are the first topropose an investigation of this sort and our findings could lead to a more comprehensiveunderstanding of the mechanisms and variables involved in gravitational accretion.
2. Procedure
In our simulations, we will use the code VH-1. Originating at the University of Virginia,the version of VH-1 that we will use has been modified extensively by Dr. John Blondin. Itis based on the Piecewise Parabolic Method [Collela & Woodward, 1984] and solves Euler’sequations of ideal inviscid compressible gas flow. Since it was demonstrated by Blondinand Raymer (2012) that the flow of the accreted material in 3D remained axisymmetric, weintend to begin with the three-dimensional code created by Blondin and Raymer (2012) andmodify it to run in two dimensions in order to most effectively to perform the simulationin higher resolution with minimal computing power.
To quantify the instability of breathing modes, we will track the mass accretion rate asa function of time and use this to measure the oscillation period and the amplitude. InBlondin and Raymer (2012), significant instability was only observed in smaller radii ofRs = 0.01Ra. We will attempt to find the exact accretion radius at which the flow becomesunstable and use smaller radii to understand the relationship between the intensity andthe frequency of the oscillations and size of the radius. Characterizing this relationship will
4 ANNA S. CARR
provide insight into why the flow becomes unstable and potentially reveal further conditionsto be tested.
Blondin and Pope (2009) found that with a changing adiabatic index, an accretor of aconstant radius exhibited instability in γ below a certain threshold. We will use similarmethods to discern whether different adiabatic indexes will have a similar effect on theinstability in breathing modes. Additionally, by increasing the Mach number (>3), wewill be able to observe any effects on level of instability. By simulating these changeswe will obtain a greater understanding of the exact way each differing condition affectsthe instability which will help determine the mechanism that creates breathing modes inHoyle-Lyttleton accretion.
3. Conclusion
A thorough understanding of the behavior of matter accreting onto an object is essentialto furthering our knowledge of the way the universe behaves. To this end we propose acareful investigation of the instabilities produced in previous simulations in order to obtainsuch an understanding. Our simulations of breathing mode instabilities may demonstratenew relationships among the variables involved in accreting materials or simply prove tobe a mistake in previous simulations. Either result will advance our methods and benefitscientists working towards creating reality in computational simulations.
References
[Blondin and Raymer, 2012] Blondin, J., & Raymer, E. 2012, ApJ, 752, 30[Blondin and Pope, 2009] Blondin, J., & Pope, C. 2012, ApJ, 700, 95-102[Edgar, 2004] Edgar, R.,2004, New Astronomy Reviews, 48, 843-859[Foglizzo, 2001] Foglizzo, T.,2001, A&A, 368, 311-324[Matsuda et al.,1987] Metsuda, T., Inoue, M., Sawada, K., 1987, Monthly Notices of the Royal Astronom-ical Society, 226, 785-811
[Hoyle and Lyttleton, 1939] Hoyle, F., & Lyttleton A., 1939, Proceedings of the Cambridge PhilosophicalSociety, 35, 405
[Collela & Woodward, 1984] Collela, P., Woodward P.R., 1984, Journal of Computational Physics, 54, 174-201
The Effects of Progenitor Rotation on SASI inCore-Collapse Supernovae
NCSU PHYSICS: UNDERGRAD RESEARCH IN COMP. ASTROPHYSICS
ELLIOT CARTEE
Abstract. Current simulations of core-collapse supernovae (CCSNe) suggest that thepost-bounce shockwave stalls at a radius of approximately 100km. This stalled shock-wave has been found to be unstable, in what is known as the Spherical Accretion ShockInstability (SASI). Recent numerical simulations suggest that the SASI plays an impor-tant role in reviving the explosion and powering CCSNe. Previous simulations involvingSASI, however, are limited in their study of how rotation of the progenitor star affects theSASI. We propose to systematically investigate progenitor star rotation in our simulationsof CCSNe. We will use the VH-1 hydrodynamics code in two dimensions following themethods described by Blondin and Shaw. Our goal with these simulations is to quantifythe effects of rotation on the SASI,by measuring growth rates of the SASI as a functionof progenitor rotation.
1. Introduction
Core Collapse Supernovae (CCSNe) are well recognized as playing a vital and importantrole in the chemical evolution of the universe and our understanding of stellar evolution.Attempts to understand the explosion mechanism of these supernovae through numericalsimulations have encountered many difficulties. In particular, after the gravitational col-lapse of the core, the post-bounce shockwave is known to stall at a radius on the order of100 km. The existence of CCSNe implies that the shock is revived and continues to explodethe star, but the exact mechanism by which the shock is revived is not yet completely de-termined. Many candidates exist for this mechanism, including interactions with neutrinosfrom the proto-neutron star (PNS), or convection, but another possible candidate is in theinstability of this stalled accretion shock, Known as the SASI.
The SASI was discovered in numerical simulations by Blondin et al.(2003). In thesesimulations, the SASI was dominated by a sloshing mode related to the spherical harmonicl = 1. Further simulations by Blondin (2005) have also shown that there exists a non-axisymmetric spiral wave mode identified by the harmonic m = 1. This m = 1 spiralwave mode has also been shown to be related to the accretion of significant amounts of
Date: June 19, 2012.1
2 ELLIOT CARTEE
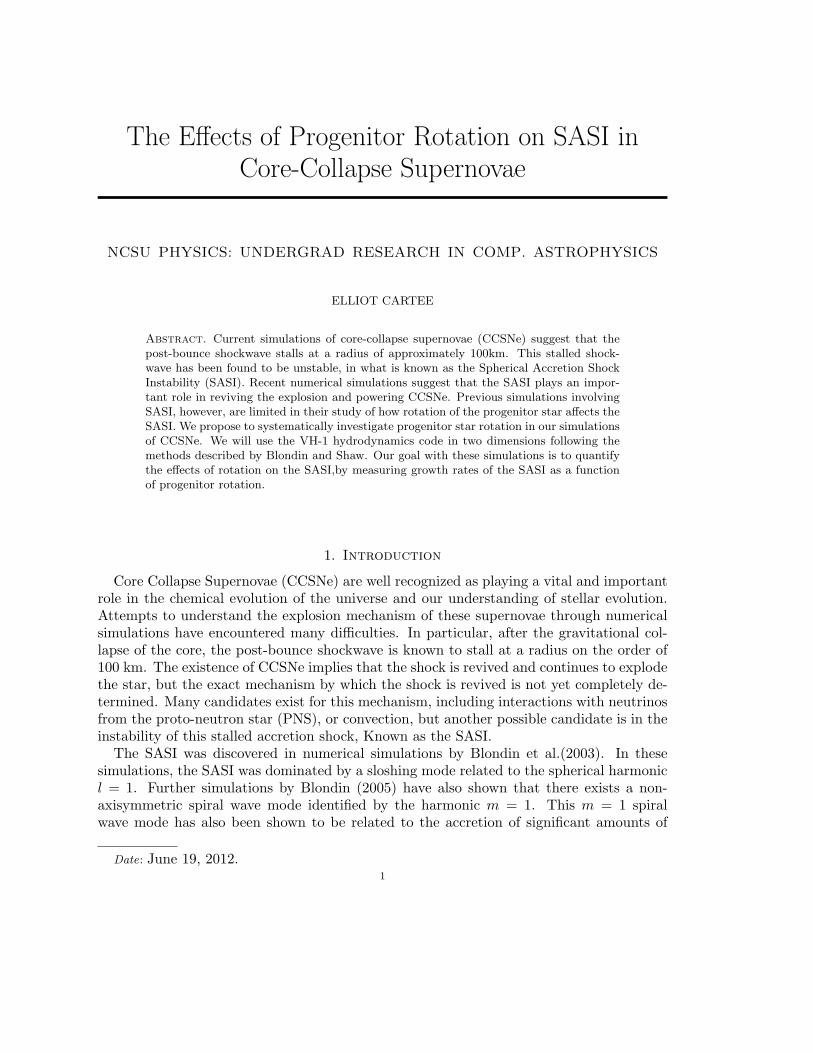
Figure 1. From Yamasaki & Foglizzo (2008): “Growth rate and corotationradius as a function of the specific angular momentum L... Thick lines arefor the modes with m > 0 and thin lines are for m < 0... The solid, dotted,and dashed lines are for the fundamental modes and the first and secondovertones, respectively...”
angular momentum (Blondin & Mezzacappa 2007), suggesting a possible explanation ofthe extremely rapid rotation of pulsars created by CCSNe.
The growth rate of the SASI, and specifically these spiral wave modes, have been thefocus of much theoretical and analytical study in recent years. Yamasaki & Foglizzo (2008)studied the SASI in a simple toy model with cylindrical geometry, and found that angularmomentum of the flow and the growth rates of the spiral modes are almost linearly depen-dent. They also found that the one-armed spiral mode m = 1 is linked to small rotationrates, while the two-armed spiral mode m = 2 is linked to stronger rotation rates. Theyalso found that the spiral mode present is found to be rotating in the same direction asthe flow, in agreement with numerical simulations by Blondin & Mezzacappa (2007).
2. Motivation
Investigation of the effect of progenitor star rotation rates on the SASI is interesting for anumber of reasons. For instance, progenitor rotation has been shown to be in the oppositedirection of the spin of the neutron star in 3D simulations of SASI (Blondin & Mezzacappa2007). So progenitor rotation clearly plays an important role in the conditions of thecompact supernova remnant, and is a likely explanation for the rapid rotation rates seenin pulsars created in CCSNe. We also wish to test the theoretical predictions of Yamasaki
NCSU PHYSICS: UNDERGRAD RESEARCH IN COMP. ASTROPHYSICS 3
1
2
3
1 10
ωr
∆R / Rs
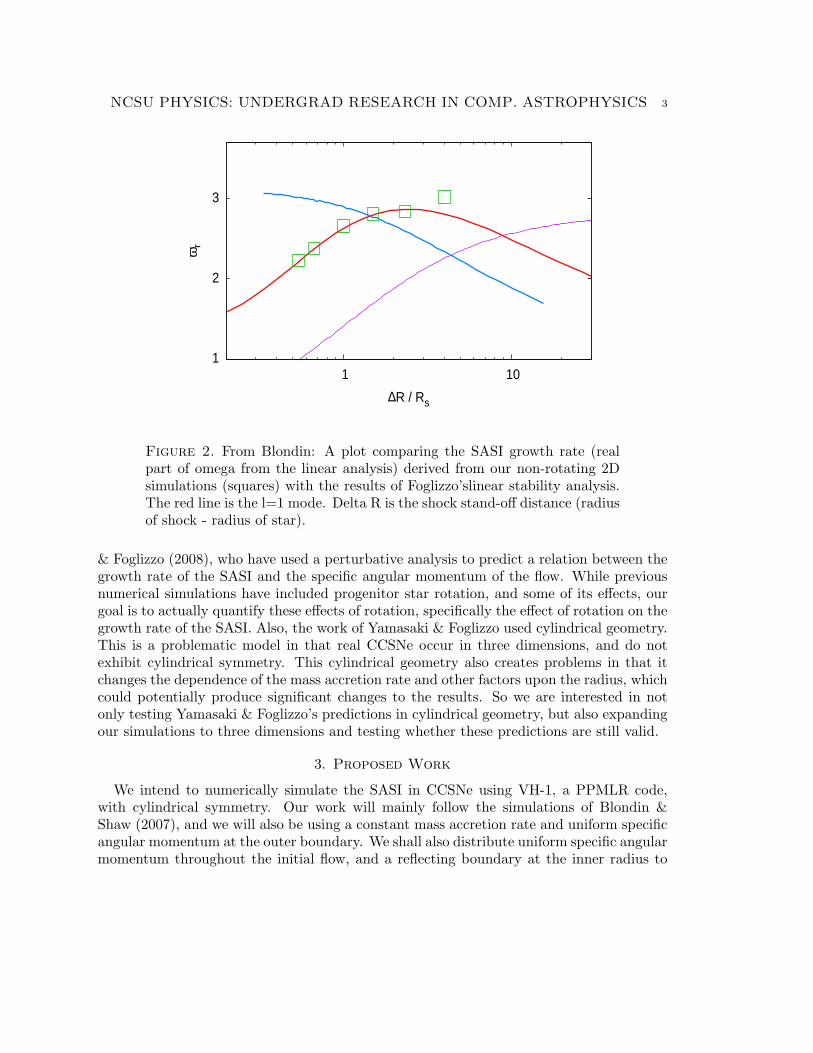
Figure 2. From Blondin: A plot comparing the SASI growth rate (realpart of omega from the linear analysis) derived from our non-rotating 2Dsimulations (squares) with the results of Foglizzo’slinear stability analysis.The red line is the l=1 mode. Delta R is the shock stand-off distance (radiusof shock - radius of star).
& Foglizzo (2008), who have used a perturbative analysis to predict a relation between thegrowth rate of the SASI and the specific angular momentum of the flow. While previousnumerical simulations have included progenitor star rotation, and some of its effects, ourgoal is to actually quantify these effects of rotation, specifically the effect of rotation on thegrowth rate of the SASI. Also, the work of Yamasaki & Foglizzo used cylindrical geometry.This is a problematic model in that real CCSNe occur in three dimensions, and do notexhibit cylindrical symmetry. This cylindrical geometry also creates problems in that itchanges the dependence of the mass accretion rate and other factors upon the radius, whichcould potentially produce significant changes to the results. So we are interested in notonly testing Yamasaki & Foglizzo’s predictions in cylindrical geometry, but also expandingour simulations to three dimensions and testing whether these predictions are still valid.
3. Proposed Work
We intend to numerically simulate the SASI in CCSNe using VH-1, a PPMLR code,with cylindrical symmetry. Our work will mainly follow the simulations of Blondin &Shaw (2007), and we will also be using a constant mass accretion rate and uniform specificangular momentum at the outer boundary. We shall also distribute uniform specific angularmomentum throughout the initial flow, and a reflecting boundary at the inner radius to

4 ELLIOT CARTEE
model the surface of the PNS. We shall also use a thin cooling layer parametrized byα = 3/2 and β = 5/2. Our first step would be to develop one-dimensional simulations of theaccretion shock, in both cylindrical (as in Yamasaki & Foglizzo) and spherical geometries(as in Blondin & Shaw), and use these as initial conditions for later simulations. Then wewill develop two-dimensional models without rotation, and compare the growth rates asa function of accretion radius with already published data from Blondin & Mezzacappa.Then we would expand our two-dimensional simulations to include rotation, and cover atwo-dimensional parameter space determined by flow angular momentum and accretionshock radius. To measure the growth rate of the SASI, we will follow the technique usedin Blondin & Mezzacappa (2006), and fit the simulation data for the shock radius to afunction of the form Rs(t) = R0 +R1e
ωrtsin(ωit+ δ) using least-squares fitting. From thiswe will obtain the real and imaginary components of the growth rate, ω.
4. Summary
Overall, CCSNe are among the most fascinating and important phenomena in astro-physics, and we wish to learn more about the instability of the stalled accretion shock, asthis may provide both a mechanism for reviving and continuing the shock, and also othereffects, such as determining the spin of the remnant pulsar. To this end, we propose tonumerically simulate the SASI in cylindrical symmetry at different initial rotation rates,and then quantify the effects that this rotation has upon the SASI. Ultimately, we wish tonumerically test the theoretical predictions of Yamasaki & Foglizzo (2008) regarding therelationship between specific angular momentum of the flow and growth rates of the SASI,and extend that result to more realistic geometry.
References
[Blondin et al.(2003)] Blondin, J.M., Mezzacappa, A., & Demarino, C. 2003, ApJ, 584, 971[Blondin, J.M.(2005)] Blondin, J.M. 2005, in J. Physics Conf. Ser. 16, SciDAC 2005, ed. A. Mezzacappa(Philadelphia: IOP), 370
[Blondin & Mezzacappa (2007)] Blondin, J.M., Mezzacappa, A. 2007, Nature, 445, 58[Blondin & Mezzacappa (2006)] Blondin, J.M., Mezzacappa, A. 2006, ApJ, 642, 401[Blondin & Shaw (2007)] Blondin, J.M., Shaw, S. 2007, ApJ, 656, 366[Laming (2007)] Laming, J.M. 2007, ApJ, 659, 1449[Yamasaki & Foglizzo] Yamasaki, T. & Foglizzo, T. 2008, ApJ, 679, 607
URCA PROPOSAL
THE CUMULATIVE EFFECTS OFTURBULENCE AND NEUTRINO SELFINTERACTIONS IN CORE-COLLAPSE
SUPERNOVAE
KELSEY REPPERT AND NEEL KABADI
Abstract. During core-collapse supernovae explosions large fluxes of neutrinos are emit-ted from the proto-neutron star formed at its center. As these neutrinos escape the flavorcomposition evolves: turbulence in the material flowing down upon the proto-neutroncaused by the stalled shock wave and the super high neutrino density in core-collapsesupernovae both have an effect. To date studies of the two effects have focused uponeach separately even though both occur simultaneously. Using new codes for the neutrinoevolution and hydro simulations we propose to calculate the neutrino evolution in the coreof supernovae incorporating both turbulence and high neutrino density in an attempt todetermine whether neutrino signatures of collective effects are modified by the turbulenceand whether these changes can be observed. If they are detectable, then this will allowus to have a greater understanding of what is occurring during a future core-collapsesupernova.
1. Introduction
The neutrino flux emitted from a core-collapse supernova releases a great deal of theenergy in a supernova explosion. Additionally, it is responsible for transferring momentumwhich causes the stalled shock wave, at a size of 200km in radius, to regain movement [5].After the explosion ends, these neutrinos are released and will eventually reach the Earth.Since these core-collapse supernovae event only come a few times per century [3], we werenot able to obtain a great deal of information from the neutrinos from SN 1987A, as our
Date: June 8, 2012.1
2 KELSEY REPPERT AND NEEL KABADI
neutrino telescopes were not fully prepared to receive massive amounts of data. Modernneutrino telescopes, however, are capable of collecting data which can tell us a wealth ofinformation concerning the progression of a supernova. But before we can fully understandthe next supernova explosion, we must develop theory on how to decode the signals thatwe recieve from neutrinos. Because there are several different factors which can influencethe oscillations of the large number of neutrinos (on the order of 1058) which are emittedin a core-collapse supernova, we must understand them completely so we know what kindof neutrinos were emitted.
2. Analysing the Various Factors
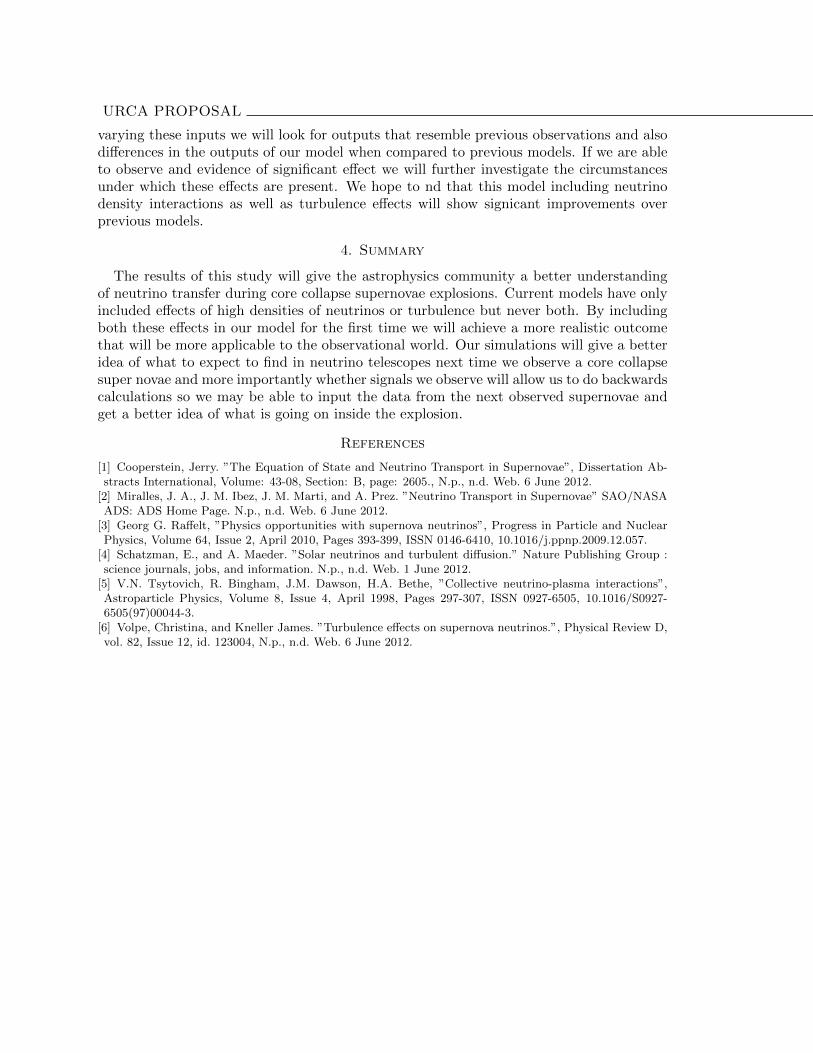
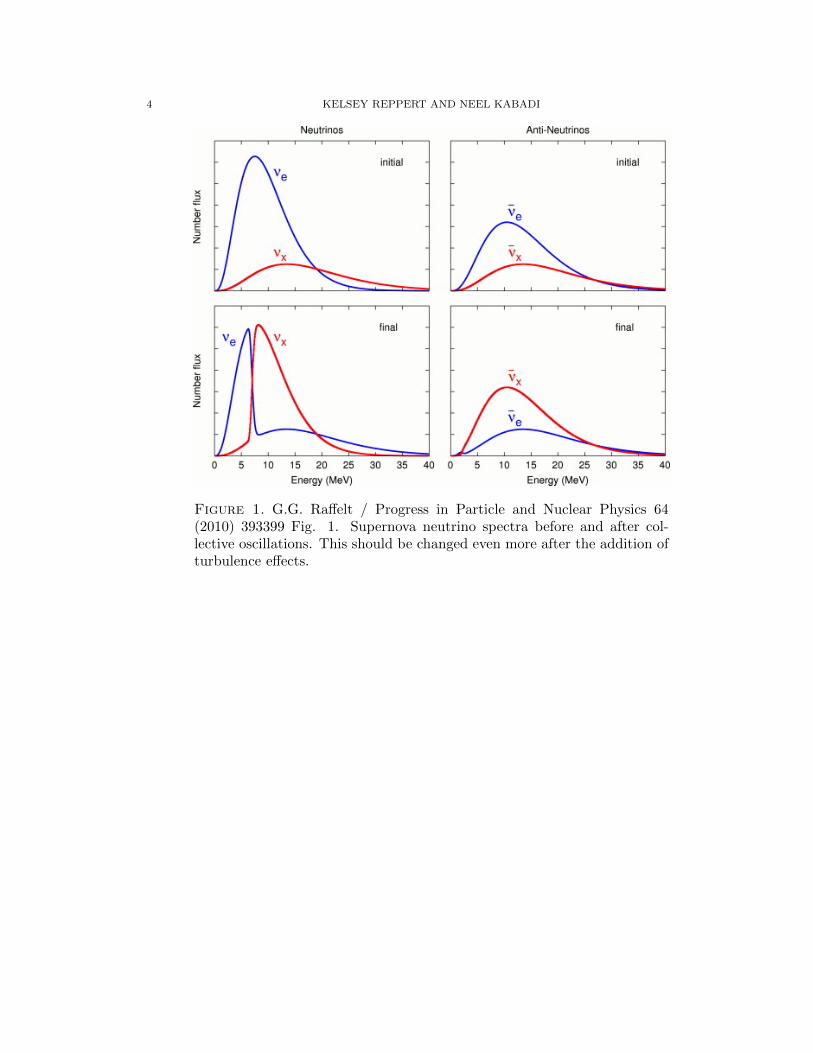
While it is clear that that there are many variables which affect neutrino oscillations,their combined effect has not yet been fully analyzed. It is not certain how much turbulenceis necessary to cause significant fluctuations in the neutrino density as the radial distancefrom the star increases. The extremely high neutrino density and the neutrino-neutrinointeractions both have effects upon the changing lepton flavors of the neutrinos, also knownas neutrino oscillations. This is seen in a recent study which re-examines data from thecollective oscillations from SN 1987A on lepton flavor and found that the neutrinos canprovide us with a wealth of information concerning the progression of supernovae by simplyobserving the oscillations [3]. In addition, there is turbulence generated by the aforemen-tioned stalled shock wave, which also effects the oscillations. By observing these effects, wecan determine what effects correlate to energy transfers and other events concerning theneutrino flux. Figure 1 shows the effects of neutrino neutrino interactions on the flux ofdifferent energy neutrinos. There is a clear difference in the neutrino fluxes of both electronneutrinos and anti electron neutrinos before and after the addition of interaction effects.We expect that upon the addition of turbulence effects there will be an even greater changein the fluxes of neutrinos of different energies.
3. Proposed Work
We will use new code for the neutrino evolution and hydro simulations to calculatethe neutrino evolution in the core of supernovae. This new code will incorporate bothturbulence and high neutrino density. This will then allows us to compare results of thisjoint simulation to simulations of the past. We will be able to determine whether neutrinosignatures of collective effects are modied by the turbulence and whether these changescan be observed. The code has already been written so we must rst learn the appropriatebackground material including quantum mechanics and C++. We must learn the basicsof neutrino transfer and how they interact with each other as well as surrounding matter.After this we can proceed to run full simulations varying dierent parameters like the initialdistance, nal distance, range of energies, the number of calculations, and the radius of theneutron star. This will take the most time as we use data from six super novae profiles. Wewill run two O-Ne-Mg supernova, two from a 10.8 solar mass model and two from a 18 solarmass model. We will be running each twice in order to vary the time stamp. Depending onthe required number of calculations we may need to utilize a local super computer. While
URCA PROPOSAL THECUMULATIVEEFFECTSOFTURBULENCEANDNEUTRINO SELF INTERACTIONS INCORE-COLLAPSE SUPERNOVAE 3
varying these inputs we will look for outputs that resemble previous observations and alsodifferences in the outputs of our model when compared to previous models. If we are ableto observe and evidence of significant effect we will further investigate the circumstancesunder which these effects are present. We hope to nd that this model including neutrinodensity interactions as well as turbulence effects will show signicant improvements overprevious models.
4. Summary
The results of this study will give the astrophysics community a better understandingof neutrino transfer during core collapse supernovae explosions. Current models have onlyincluded effects of high densities of neutrinos or turbulence but never both. By includingboth these effects in our model for the first time we will achieve a more realistic outcomethat will be more applicable to the observational world. Our simulations will give a betteridea of what to expect to find in neutrino telescopes next time we observe a core collapsesuper novae and more importantly whether signals we observe will allow us to do backwardscalculations so we may be able to input the data from the next observed supernovae andget a better idea of what is going on inside the explosion.
References
[1] Cooperstein, Jerry. ”The Equation of State and Neutrino Transport in Supernovae”, Dissertation Ab-stracts International, Volume: 43-08, Section: B, page: 2605., N.p., n.d. Web. 6 June 2012.
[2] Miralles, J. A., J. M. Ibez, J. M. Marti, and A. Prez. ”Neutrino Transport in Supernovae” SAO/NASAADS: ADS Home Page. N.p., n.d. Web. 6 June 2012.
[3] Georg G. Raffelt, ”Physics opportunities with supernova neutrinos”, Progress in Particle and NuclearPhysics, Volume 64, Issue 2, April 2010, Pages 393-399, ISSN 0146-6410, 10.1016/j.ppnp.2009.12.057.
[4] Schatzman, E., and A. Maeder. ”Solar neutrinos and turbulent diffusion.” Nature Publishing Group :science journals, jobs, and information. N.p., n.d. Web. 1 June 2012.
[5] V.N. Tsytovich, R. Bingham, J.M. Dawson, H.A. Bethe, ”Collective neutrino-plasma interactions”,Astroparticle Physics, Volume 8, Issue 4, April 1998, Pages 297-307, ISSN 0927-6505, 10.1016/S0927-6505(97)00044-3.
[6] Volpe, Christina, and Kneller James. ”Turbulence effects on supernova neutrinos.”, Physical Review D,vol. 82, Issue 12, id. 123004, N.p., n.d. Web. 6 June 2012.
4 KELSEY REPPERT AND NEEL KABADI
Figure 1. G.G. Raffelt / Progress in Particle and Nuclear Physics 64(2010) 393399 Fig. 1. Supernova neutrino spectra before and after col-lective oscillations. This should be changed even more after the addition ofturbulence effects.
URCA RESEARCH PROPOSAL
A QUEST FOR AN ELUSIVE COMPANION STAR
SHENGKAI ALWIN MAO
Abstract. The mechanism behind Thermonuclear (Type Ia) Supernovae is believed to involvea white dwarf and a companion star, which could be a normal star (single-degenerate model)or a white dwarf (double-degenerate model). Finding the companion star would show thatthe companion star was not destroyed in the collision, implying a single-degenerate progenitor.Due to the sheer size of the supernovae and the number of candidate stars contained therein,it is necessary to determine the star’s rough location before making an exhaustive search. Itis thought that the companion star can be found at the explosion center, but assumptionsthat the explosion center would be at the remnant’s geometric center have proved fruitless.However, these searches did not factor in the possibility that a nonuniform interstellar medium(ISM) density could cause an asymmetric expansion, which would cause the apparent geometriccenter to shift from the true explosion site. By running numerical hydrodynamics simulationsmodeling the effects of ISM density gradients, a collection of remnants can be formed, and amore reliable search location can be determined. The results will be applied by examining pastsearches on two young supernova remnants in order to determine if their search regions wereinsufficiently vast to account for such shifting.
1. Introduction
1.1. Supernovae, best known for their distinctly high luminosities, are categorized into severalgroups. One of these classifications is known as Type Ia, defined by a distinct lack of hydrogenand helium spectral lines. Type Ia supernovae are also unique in that they are believed tobe thermonuclear explosions of white dwarfs in close binaries which have managed to gainenough mass from a companion star to exceed the Chandrasekhar limit. However, some ofthe greatest significance of Type Ia supernovae can be found in their importance to cosmologyand to understanding the chemical evolution of galaxies. The convenient uniformity of theirbrightness allows them to be used as standard candles. Then, using Type 1a supernovae asstandard candles, distances, redshifts, and velocities can be measured. Such measurementshave brought to light the acceleration of the expansion of the Universe. Even our knowledge ofthe cosmological parameters themselves depends upon the accuracy of these measurements. Inaddition, Type Ia supernovae are responsible for the majority of iron production in the universe.To better understand Type Ia supernovae is to better understand the chemical evolution ofgalaxies.[8]
1.2. However, the accuracy and reliability of the results and the understanding garnered fromType Ia supernova studies are arguably questionable. The nature of the companion star is notfully understood, which affects the reliability of necessary assumptions such as those of uniformbrightness. In order to better understand the Universe and the galaxies within, it is critical toimprove our understanding of Type Ia supernovae, and more specifically, their progenitors.[8]
Date: June 8, 2012.1
2 SHENGKAI ALWIN MAO
1.3. Currently, the two most prominent proposed models are the single-degenerate model andthe double-degenerate model. In the single-degenerate model, the white dwarf accretes massfrom a non-degenerate companion star. By accreting hydrogen and helium, the white dwarfcan gradually increase its mass to the Chandrasekhar mass, at which point the supernovais triggered. Alternatively, according to the double-degenerate model, the companion star isinstead a white dwarf. If the two white dwarfs combine, and if they have a combined massgreater than the Chandrasekhar mass, a supernova results. [8]
1.4. Both models have advantages and disadvantages. For example, the single-degenerate modelrequires the accretion of hydrogen, which has been shown to be difficult to drive.[1] On theother hand, the gradual accretion to a Chandrasekhar mass involved in the single-degeneratemodel also effectively explains why Type Ia supernovae would be fairly uniform.[8] The double-degenerate model is successful in explaining a lack of hydrogen and helium in Type 1a super-novae, since only carbon-oxygen white dwarfs are involved. However, this model presents thetroubling possibility of neutron star formation instead of supernova ignition.
2. Problem
2.1. Since arguments and debates cannot and have yet to identify the correct model, a differentapproach must be taken.[7] A distinguishing property between the single-degenerate and double-degenerate models is that the companion star in a single-degenerate supernova should survive,while the combination of two white dwarfs in a double-degenerate supernova will not leaveanything.[8] Thus, finding the companion star in a supernova remnant would provide absoluteproof of the single-degenerate scenario.
2.2. Unfortunately, this task is in and of itself prone to difficulty and controversy. Although itis possible to identify the progenitor star amongst other stars through its characteristic higherradial-velocity and unusual spectral lines, supernova remnants are enormous, and efforts tofind the companion star are too resource-intensive due to the sheer number of candidate starscontained within. In addition, attempting to narrow down the search to the apparent geometricsupernova remnant center has proved fruitless. (See Figure 1.) The only claimed discovery ofa companion star in a Type Ia supernova was the supposed progenitor of Tycho’s supernova of1572. However, the validity of this result was highly controversial, not absolute.[6][7] Thus, aprogenitor of a Type Ia supernova is yet to be found.
3. Proposed Solution
3.1. It is known that density irregularities in the interstellar medium surrounding a super-nova remnant can cause the remnant to become non-spherical.[4]As the remnant expands intoa nonuniform interstellar medium, the interactions form asymmetric remnants and shift theapparent geometric center of the remnant away from the true supernova origin.[2] Since pastsearches did not account for these effects, it is possible that past surveys did not consider dis-tances far away enough from the apparent geometric center. Only by factoring in these effectscan a more definitive result be attained. By conducting a search in an area which is far morelikely to contain the true supernova center, the result will be far more likely to be valid, accepted,and applicable.
3.2. In order to determine a better search location, the possible shift of the apparent centerfrom the true center must be calculated. This will be done by using numerical hydrodynamicssimulations to model the expansion of a supernova remnant into a nonuniform interstellarmedium with various density gradients. Thus, a collection of remnants can be formed to studythe displacement of the apparent center in relation to the interstellar medium density gradient.Then, the hydrodynamics code will be used to attempt to reproduce real supernova remnantsin order to predict where their progenitors, if existent, may be found. Since the brightness andmass density of supernova remnants have been found to be correlated[5], observational data ofthose supernovae can be used to describe their interstellar medium density gradients. Those
URCA RESEARCH PROPOSAL 3
conditions will be analyzed by hydrodynamic simulations to estimate the apparent supernovaremnant center shift.
3.3. I must first learn and familiarize myself with VH-1 hydrodynamics code in order to modelthe expansion of supernova remnants. In the process, I may have to learn Fortran. Afterwards,I will select different density gradients and starting conditions with which to run simulations. Iwill record the results in order to better understand how the supernova remnant center shifts.Then, I will adjust the simulation parameters in an attempt to model actual supernova remnantsso that I can provide a better location in which to search for a progenitor.
4. Summary
Type Ia supernovae are extremely important for studying cosmology and the chemical evolu-tion of galaxies. This is because of inherent traits such as predictable brightness and high ironproduction unique to Type Ia supernovae. Since our knowledge of topics, such as the expansionof the universe and the delay time before the formation of iron, hinges on our understanding ofthose inherent traits, it is paramount to understand the progenitor and mechanism which makesa Type Ia supernova possible. In order to do so, the debate between single and double progenitorscenarios must be settled, and the most definitive way to do so would be to find the progenitor.This can only be achieved through a well-guided rummage of a well-chosen area. Hopefully,through hydrodynamics modeling and consideration of the effects of interstellar medium densitygradients, my research can provide what’s necessary to answer the progenitor problem.
References
[1] Badenes, Carles, John P. Hughes, Eduardo Bravo, and Norbert Langer. “Are the Models for Type Ia SupernovaProgenitors Consistent with the Properties of Supernova Remnants?” The Astrophysical Journal 662.1 (2007):472-486.
[2] Dohm-Palmer, Robbie C., and T. W. Jones. “Young Supernova Remnants in Nonuniform Media.” Astrophys-ical Journal 471 (1996): 279-290.
[3] Ferreira, S. E. S., and O. C. de Jager. “Supernova remnant evolution in uniform and non-uniform media.”Astronomy and Astrophysics 478.1 (2008): 17-29.
[4] Hnatyk, B., and O. Petruk. “Evolution of supernova remnants in the interstellar medium with a large-scaledensity gradient. I. General properties of the morphological evolution and X-ray emission.” Astronomy andAstrophysics 344 (1999): 295-309.
[5] Petruk, O.. “Evolution of supernova remnants in the interstellar medium with a large-scale density gradient.II. The 2-D modelling of the evolution and X-ray emission of supernova remnant RCW 86.” Astronomy andAstrophysics 346 (1999): 961-968.
[6] Ruiz-Lapuente, Pilar et al.. “The binary progenitor of Tycho Brahe’s 1572 supernova.” Nature 431 (2004):1069-1072.
[7] Schaefer, Bradley E., and Ashley Pagnotta. “An absence of ex-companion stars in the type Ia supernovaremnant SNR 0509-67.5.” Nature 481.7380 (2012): 164-166.
[8] Wang, Bo, and Zhanwen Han. “Progenitors of type Ia supernovae.” New Astronomy Reviews 56 (2012):122-141.

4 SHENGKAI ALWIN MAO
Figure 1. This image of SNR 0509-67.5 reveals the scope of the problem: thevast number of stars that must be checked in a supernova remnant. The circleis a projection of where the progenitor could be, with a 99.73% chance of beingwithin the circle, ignoring the asymmetries in the remnant.[7]

URCA RESEARCH PROPOSAL
TWO- AND THREE-DIMENSIONALTURBULENCE IN CORE-COLLAPSE
SUPERNOVAE
MITHI A. DE LOS REYES
Abstract. The Spherical Accretion Shock Instability (SASI), in which a supernova shockwave stalls and produces a turbulent post-shock flow, has generally been accepted as animportant phenomenon in core-collapse supernovae. However, the effects of the turbulencecaused by SASI have yet to be thoroughly investigated; indeed, it has been hypothesizedthat two- and three-dimensional SASI simulations may produce incongruent results dueto this turbulence. We therefore propose to use both two- and three-dimensional hydro-dynamic simulations of core-collapse supernovae to study the growth of the SASI-drivenflows. We will produce and analyze Fourier transform power spectra to quantify energyconversion (i.e. gravitational potential energy to the kinetic energy of turbulent flow) ondifferent length scales. Finally, we hope to compare two- and three-dimensional results todetermine if kinetic energy cascades toward small or large length scales, and if turbulenceenergy saturates at similar levels in two and three dimensions.
1. Introduction
Supernovae are not only one of the most famous stellar phenomena, but also one of the mostscientifically important, due to their importance in nucleosynthesis and the formation ofneutron stars and black holes. The less-common type II or core-collapse supernova (CCSN)occurs when a supergiant star can no longer fuse nuclei past iron in its core. The corethen collapses in on itself until it reaches nuclear density, at which point it can no longercompress. The consequent core bounce creates a massive shock wave that expands radially
Date: June 14, 2012.1

2 MITHI A. DE LOS REYES
outward, leaving behind either a neutron star or a black hole, as well as an expandinggaseous supernova remnant (see Fig. 1).
Figure 1. Composite X-ray and optical photo of supernova remnantG292.0+1.8. Photo from NASA.gov.
Although this simple definition is widely accepted, the exact process by which these CCSNoccur is still not fully understood. Unfortunately, we cannot directly observe the inside ofa proto-neutron star (PNS), let alone the inside of a supernova, and so we must rely onnumerical simulations based on first principles to shed light on CCSN.
2. Turbulence in core-collapse supernovae
Hydrodynamic simulations, in particular, have made important progress in modeling CCSN.Initial hydrodynamic models did not explode (e.g. [Mezzacappa et al. 2001]); instead, thesupernova shock wave was found to stall at a radius of approximately 100km, where itwould remain until some combination of factors (neutrinos, convection, magnetic fields,etc.) presumably revived it. This standing accretion shock appeared to be stable in spher-ical symmetry.
Blondin et al. (2003) then found that while one-dimensional accretion shocks are indeedstable, two-dimensional spherical accretion shocks actually produce low-modal (l=1, 2)growing oscillations when perturbed. This Spherical Accretion Shock Instability (SASI)was initially thought to be produced by a vortical-acoustic cycle [Foglizzo 2002]; it waslater suggested that the SASI could result from a standing pressure wave that oscillatesinside of the cavity of the accretion shock [Blondin & Mezzacappa 2005]. Whatever itsorigin, the SASI first undergoes a linear regime, in which the accretion shock remains in aroughly spherical shape with a radial post-shock flow. Once the pressure wave in the l=1sloshing mode grows large enough to distort the accretion shock, the SASI transitions intothe nonlinear regime (Fig. 2).

URCA RESEARCH PROPOSAL TWO-ANDTHREE-DIMENSIONALTURBULENCE INCORE-COLLAPSE SUPERNOVAE 3
Figure 2. The SASI transitions from the linear phase (left) to the nonlin-ear phase (right), displaying a characteristic shift from radial to non-radialflow. [Blondin & Mezzacappa 2005]
The nonlinear SASI has been investigated in non-axisymmetric two- and three-dimensionalmodels [Blondin & Shaw 2007, Blondin & Mezzacappa 2007]. In the nonlinear phase, theSASI begins to generate higher-mode turbulence in a positive feedback loop of sorts—turbulent flows drive pressure waves, which in turn propagate around the closed sphereand further distort the accretion shock from its spherical shape, creating further turbu-lence. This non-axisymmetric SASI displays a spiral mode (m=1), in which the SASI wavepropagates around the axis of the PNS and creates a shock front (see Fig. 3).
Figure 3. In the non-axisymmetric SASI, the leading front of theSASI wave (shown in blue) propagates around the face of the shock.[Blondin & Mezzacappa 2007]
To conserve zero net angular momentum, a rapid narrow downflow of gas spirals inwardsagainst the direction of the SASI wave, accreting on the surface of the PNS core. Thisaccretion spins up the angular momentum of the PNS, potentially explaining how rapidly-rotating pulsars may form from non-rotating progenitor stars [Blondin & Mezzacappa 2007].The SASI therefore serves as a method to convert gravitational potential energy from theinfalling star into the angular momentum of a pulsar; not only that, but combined with
4 MITHI A. DE LOS REYES
the energy of neutrino heating, turbulent kinetic energy may help revive the stalled shockand power a supernova explosion.
3. Recent questions
The SASI has since been accepted as a valid phenomenon, and recent literature has begunto investigate its role in core-collapse supernovae. In particular, recent work has shownthe SASI-driven turbulence may generate or amplify magnetic fields [Endeve et al. 2010,Endeve et al. 2012], which could have implications for the magnetization of neutron stars.However, the post-shock turbulence produced by the SASI is still poorly understood. Sincethe energy of this turbulence could potentially power a supernova explosion, characterizingthe turbulent flows of a CCSN may further our understanding of the supernova mecha-nism.
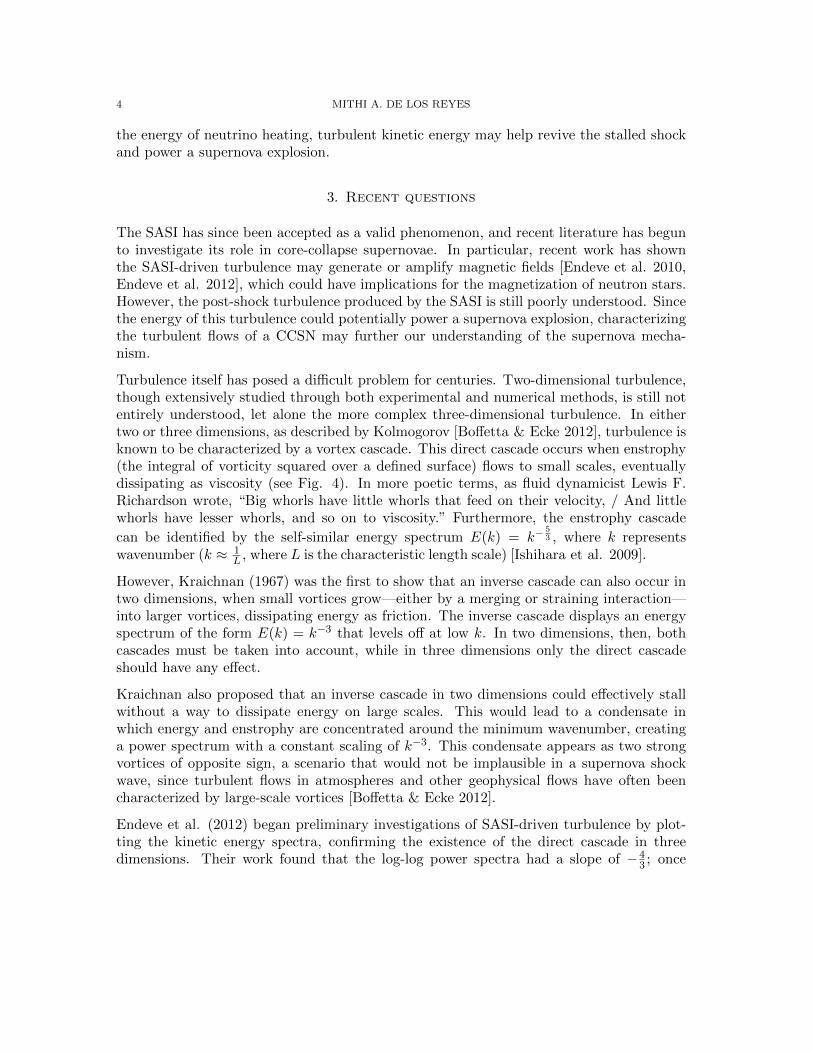
Turbulence itself has posed a difficult problem for centuries. Two-dimensional turbulence,though extensively studied through both experimental and numerical methods, is still notentirely understood, let alone the more complex three-dimensional turbulence. In eithertwo or three dimensions, as described by Kolmogorov [Boffetta & Ecke 2012], turbulence isknown to be characterized by a vortex cascade. This direct cascade occurs when enstrophy(the integral of vorticity squared over a defined surface) flows to small scales, eventuallydissipating as viscosity (see Fig. 4). In more poetic terms, as fluid dynamicist Lewis F.Richardson wrote, “Big whorls have little whorls that feed on their velocity, / And littlewhorls have lesser whorls, and so on to viscosity.” Furthermore, the enstrophy cascade
can be identified by the self-similar energy spectrum E(k) = k−53 , where k represents
wavenumber (k ≈ 1L , where L is the characteristic length scale) [Ishihara et al. 2009].
However, Kraichnan (1967) was the first to show that an inverse cascade can also occur intwo dimensions, when small vortices grow—either by a merging or straining interaction—into larger vortices, dissipating energy as friction. The inverse cascade displays an energyspectrum of the form E(k) = k−3 that levels off at low k. In two dimensions, then, bothcascades must be taken into account, while in three dimensions only the direct cascadeshould have any effect.
Kraichnan also proposed that an inverse cascade in two dimensions could effectively stallwithout a way to dissipate energy on large scales. This would lead to a condensate inwhich energy and enstrophy are concentrated around the minimum wavenumber, creatinga power spectrum with a constant scaling of k−3. This condensate appears as two strongvortices of opposite sign, a scenario that would not be implausible in a supernova shockwave, since turbulent flows in atmospheres and other geophysical flows have often beencharacterized by large-scale vortices [Boffetta & Ecke 2012].
Endeve et al. (2012) began preliminary investigations of SASI-driven turbulence by plot-ting the kinetic energy spectra, confirming the existence of the direct cascade in threedimensions. Their work found that the log-log power spectra had a slope of −4
3 ; once
URCA RESEARCH PROPOSAL TWO-ANDTHREE-DIMENSIONALTURBULENCE INCORE-COLLAPSE SUPERNOVAE 5
Figure 4. Direct cascade, in which enstrophy flows to smaller scales andis dissipated as viscosity. β is the scaling factor, here taken to be 1
2 .[Ecke 2005]
corrected for density stratification, the scaling became k−53 , matching the Kolmogorov
scaling law [Ishihara et al. 2009]. However, given that their earlier observations of velocityprobability distribution functions (PDFs) implied intermittency due to their skewed non-Gaussian forms, we believe that the Kolmogorov assumption of self-similarity is invalid inthis situation, and that the Kolmogorov scaling laws may require some correction.
Furthermore, Endeve et al. gave the impression that the peak of the spectrum moved tosmaller k over time and used this observation as evidence to support the conclusion thatenergy cascaded from large to small scales. Since wavenumber k and length scale L are in-versely proportional [Boffetta & Ecke 2012], this conclusion is a direct contradiction of thedata, and either the presentation or the interpretation of this data must be incorrect.
4. Proposed work
We therefore aim to clarify and extend the work of Endeve et al. by comparing bothtwo- and three-dimensional turbulence. We will use VH-1, a multidimensional FORTRANcode, to numerically solve the idealized Euler equations of gas flow. VH-1 uses the piece-wise parabolic method to solve the finite-difference versions of these differential equa-tions in Lagrangian coordinates, then remaps them onto the original Eulerian grid (see[Blondin et al. 2003] for further details regarding VH-1).

6 MITHI A. DE LOS REYES
From the data produced by VH-1, we will create power spectra of turbulent velocity usingthe 3DEX code for spherical Fourier-Bessel decomposition (details of this code are presentedin [Leistedt et al. 2012]). By measuring the peaks of the spectra at successive times, wecan quantitatively measure the length scale of greatest energy conversion (i.e. gravitationalpotential energy to kinetic turbulence energy). We hope to determine conclusively whetherthe spectrum peaks shift towards lower (see Fig. 4) or higher wavenumbers (longer orshorter length scales, respectively) in our model, which will help to clarify Endeve et al.’sconflicting data.
We will then analyze the log-log plots of two- and three-dimensional power spectra to
determine the slope. We will compare this scaling with Kolmogorov’s universal law of k−53
and the Kraichnan’s proposed scaling of k−3 for two-dimensional turbulence. Deviationsfrom either scaling may suggest that either scaling law makes assumptions that are invalidin the case of turbulence in CCSN.
Finally, to investigate claims of anomalous scaling due to intermittent turbulent flows, wewill also compare probability distribution functions (PDFs) of a single velocity componentwith Gaussian distributions; highly non-Gaussian PDFs will suggest strong intermittency,so that proposed logarithmic corrections [Boffetta & Ecke 2012] are required for the theo-retical value to match the experimental data.
5. Summary
To better understand turbulence length scales in core-collapse supernovae, we proposeto use VH-1 code to produce two- and three-dimensional hydrodynamic simulations ofthe SASI. We will use the Fourier-Bessel decomposition outlined in 3DEX code to createpower spectra, and we will use these power spectra of the turbulent velocity to determinethe direction of cascade of turbulent energy—whether it is from small scales to large scales(inverse cascade) or large to small (direct cascade)—thus resolving an apparent contradic-tion in the work of Endeve et al. (2012). We will also create PDFs of velocity componentsto determine the extent of intermittency in the SASI-driven turbulence.
References
[Blondin et al. 2003] Blondin, J. M., A. Mezzacappa, and C. DeMarino. ”Stability of Standing AccretionShocks, with an Eye toward Core-Collapse Supernovae.” Astrophysical Journal 584.2 (2003).
[Blondin & Mezzacappa 2005] Blondin, J. M., and A. Mezzacappa. ”The Spherical Accretion Shock Insta-bility in the Linear Regime.” Astrophysical Journal 642 (2005).
[Blondin & Mezzacappa 2007] Blondin, J. M., and A. Mezzacappa. ”Pulsar Spins from an Instability inthe Accretion Shock of Supernovae.” Nature 445 (2007).
[Blondin & Shaw 2007] Blondin, J. M., and S. Shaw. ”Linear Growth of Spiral SASI Modes in Core-CollapseSupernovae.” Astrophysical Journal 656 (2007).
[Boffetta & Ecke 2012] Boffetta, G., and R. E. Ecke. ”Two-Dimensional Turbulence.” Annual Review ofFluid Mechanics 44 (2012).
URCA RESEARCH PROPOSAL TWO-ANDTHREE-DIMENSIONALTURBULENCE INCORE-COLLAPSE SUPERNOVAE 7
[Ecke 2005] Ecke, R. ”The Turbulence Problem: An Experimentalist’s Perspective.” Los Alamos Science29 (2005).
[Endeve et al. 2010] Endeve, E., C. Y. Cardall, R. D. Budiardja, and A. Mezzacappa. ”Generation ofMagnetic Fields By the Stationary Accretion Shock Instability.” Astrophysical Journal 713.2 (2010).
[Endeve et al. 2012] Endeve, E., et al. ”Magnetic Field Amplification from Spiral SASI Modes: Implicationsfor Core-collapse Supernovae and Proto-neutron Star Magnetization.” Astrophysical Journal 751.26 (2012).
[Foglizzo 2002] Foglizzo, T. ”Non-radial Instabilities of Isothermal Bondi Accretion with a Shock: Vortical-acoustic Cycle vs. Post-shock Acceleration.” Astronomy and Astrophysics 392 (2002).
[Ishihara et al. 2009] Ishihara, T., T. Gotoh, and Y. Kaneda. ”Study of HighReynolds Number IsotropicTurbulence by Direct Numerical Simulation.” Annual Review of Fluid Mechanics 41 (2009).
[Kraichnan 1967] Kraichnan, R. H. ”Inertial Ranges in Two-Dimensional Turbulence.” Physics of Fluids10 (1967).
[Leistedt et al. 2012] Leistedt, B., A. Rassat, A. Refregier, and J-L Stark. ”3DEX: A Code for Fast SphericalFourier-Bessel Decomposition of 3D Surveys.” Astronomy and Astrophysics 540 (2012).
[Mezzacappa et al. 2001] Mezzacappa, A., et al. ”Simulation of the Spherically Symmetric Stellar CoreCollapse, Bounce, and Postbounce Evolution of a Star of 13 Solar Masses with Boltzmann NeutrinoTransport, and Its Implications for the Supernova Mechanism.” Physical Review Letters 86.10 (2001).
URCA RESEARCH PROPOSAL
REDSHIFT AND ANGULAR EFFECTS ON THEDETECTED DURATION OF GAMMA-RAY BURST
LIGHT CURVES
MICHELLE VILLENEUVE
Abstract. As some massive stars evolve, it is thought that long-duration (>2 sec) GRBs areproduced from relativistic jets from the poles of the star before the star collapses forming a blackhole. The length of time these jets produce these gamma-rays (Tengine) was always thought tobe the same length of time that the bursts were detected (T90). By creating GRB simulations atdifferent redshifts, introducing noise and observing angle, the light curve and therefore detection ofthe burst changes. These simulations can show that bursts produced by the same stellar explosioncould have different T90 times, depending on the distance and observing angle.
1. Introduction
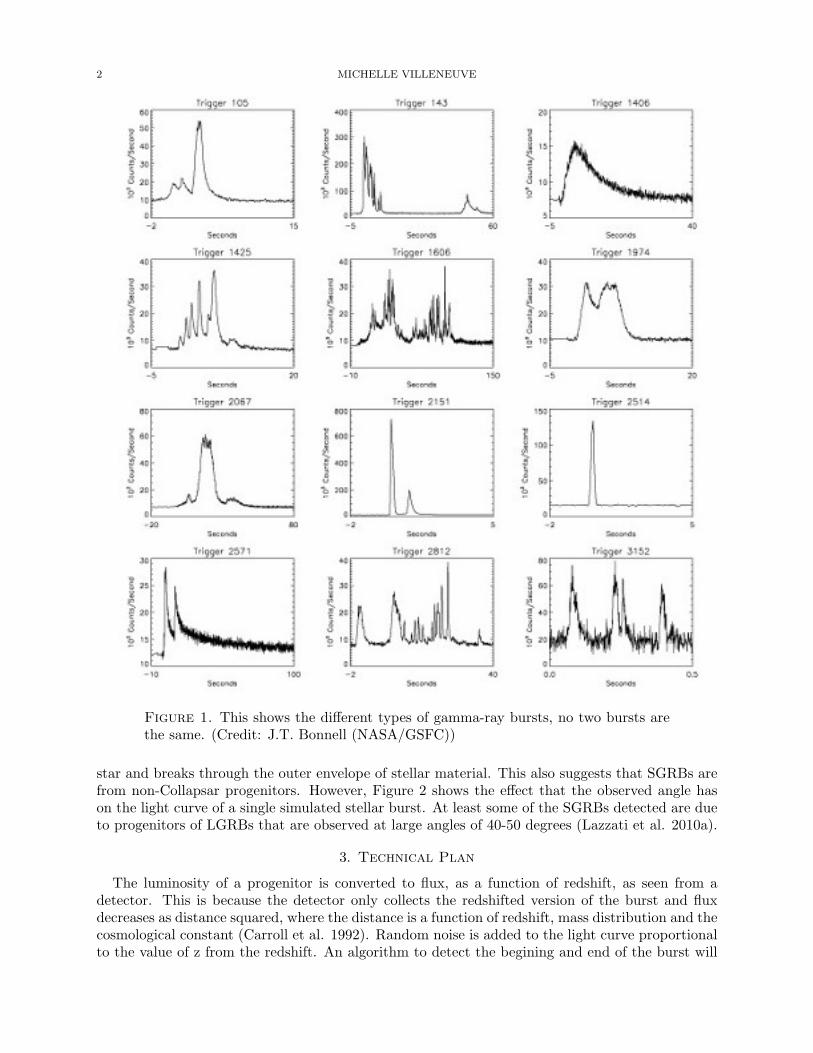
There are two types of gamma-ray bursts observed in space. The short bursts (SGRBs) last lessthan 2 seconds, while the long duration bursts (LGRBs) last longer than 2 seconds and up to afew hundred seconds. Figure 1 shows different light curves, based on detected GRBs. The LGRBsare associated with jets that form at the poles of a massive star, that is rotating very fast, at theend of its life as it collapses to form a black hole. LGRBs are seen at redshifts up to z = 8.2(Lazzati et al. 2010a) because of the intense energy emitted. The time the relativistic jets producea gamma-ray burst is called Tengine. The gamma-ray burst is detected and a light curve is madeplotting the number of photons per second vs time. The time it takes 90 percent of the photonsto be collected is widely considered to be the same time that the burst is emitted.
2. Redshift and Angular Effects
The effects of redshift and viewing angle of the gamma-ray jets can distort the detection ofthe burst to almost non-recognition. The light curve of the LGRB, as the redshift value changes,changes such that the curve is not distinctly defined. As redshift increases, noise throughout thecurve increases. This can greatly effect the detection of the LGRB in that the start and end time ofthe burst may change due to this noise. The angle that the burst makes with the detector will alsochange the light curve. Based on work by Morsony et al. (2010) , for angles <5 degrees, increasingthe angle leads to a decrease in the luminosity throughout the curve. Previous work has made theassumption that the observed duration of GRBs is characterized by T90 (Bromberg et al. 2012).LGRBs are thought to follow the Collapsar model, where a jet starts at the center of a massive
Date: June 14, 2012.1
2 MICHELLE VILLENEUVE
Figure 1. This shows the different types of gamma-ray bursts, no two bursts arethe same. (Credit: J.T. Bonnell (NASA/GSFC))
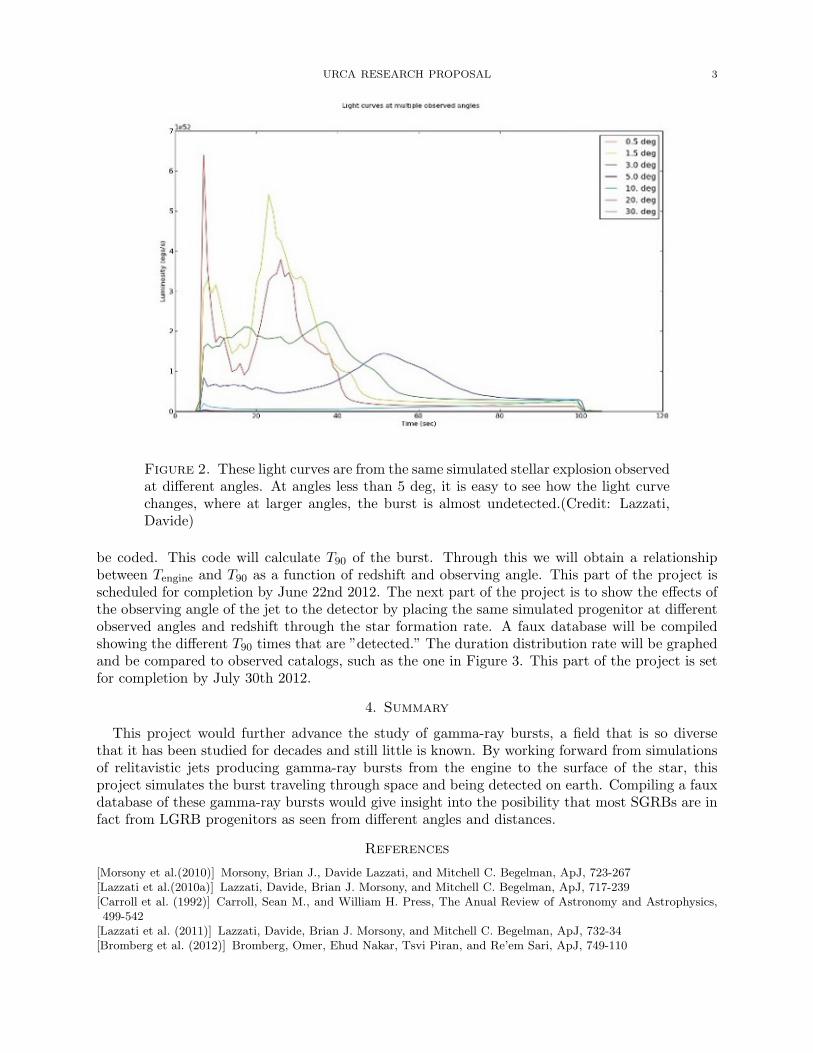
star and breaks through the outer envelope of stellar material. This also suggests that SGRBs arefrom non-Collapsar progenitors. However, Figure 2 shows the effect that the observed angle hason the light curve of a single simulated stellar burst. At least some of the SGRBs detected are dueto progenitors of LGRBs that are observed at large angles of 40-50 degrees (Lazzati et al. 2010a).
3. Technical Plan
The luminosity of a progenitor is converted to flux, as a function of redshift, as seen from adetector. This is because the detector only collects the redshifted version of the burst and fluxdecreases as distance squared, where the distance is a function of redshift, mass distribution and thecosmological constant (Carroll et al. 1992). Random noise is added to the light curve proportionalto the value of z from the redshift. An algorithm to detect the begining and end of the burst will
URCA RESEARCH PROPOSAL 3
Figure 2. These light curves are from the same simulated stellar explosion observedat different angles. At angles less than 5 deg, it is easy to see how the light curvechanges, where at larger angles, the burst is almost undetected.(Credit: Lazzati,Davide)
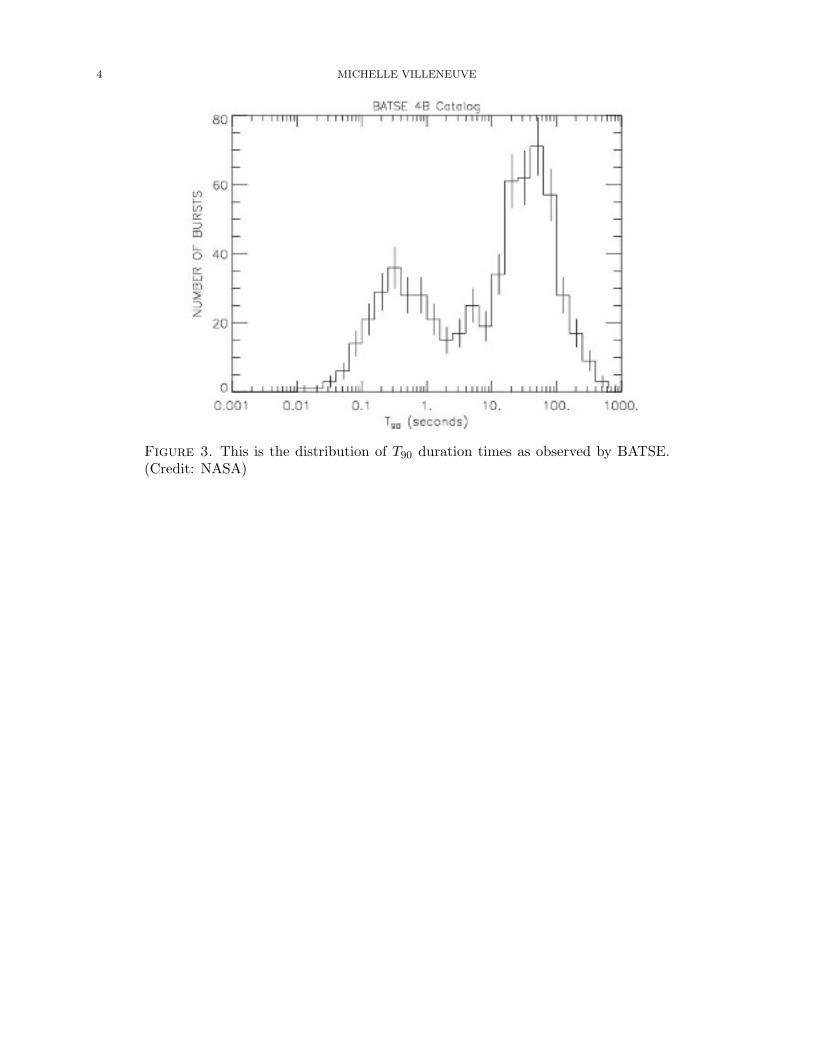
be coded. This code will calculate T90 of the burst. Through this we will obtain a relationshipbetween Tengine and T90 as a function of redshift and observing angle. This part of the project isscheduled for completion by June 22nd 2012. The next part of the project is to show the effects ofthe observing angle of the jet to the detector by placing the same simulated progenitor at differentobserved angles and redshift through the star formation rate. A faux database will be compiledshowing the different T90 times that are ”detected.” The duration distribution rate will be graphedand be compared to observed catalogs, such as the one in Figure 3. This part of the project is setfor completion by July 30th 2012.
4. Summary
This project would further advance the study of gamma-ray bursts, a field that is so diversethat it has been studied for decades and still little is known. By working forward from simulationsof relitavistic jets producing gamma-ray bursts from the engine to the surface of the star, thisproject simulates the burst traveling through space and being detected on earth. Compiling a fauxdatabase of these gamma-ray bursts would give insight into the posibility that most SGRBs are infact from LGRB progenitors as seen from different angles and distances.
References
[Morsony et al.(2010)] Morsony, Brian J., Davide Lazzati, and Mitchell C. Begelman, ApJ, 723-267[Lazzati et al.(2010a)] Lazzati, Davide, Brian J. Morsony, and Mitchell C. Begelman, ApJ, 717-239[Carroll et al. (1992)] Carroll, Sean M., and William H. Press, The Anual Review of Astronomy and Astrophysics,499-542
[Lazzati et al. (2011)] Lazzati, Davide, Brian J. Morsony, and Mitchell C. Begelman, ApJ, 732-34[Bromberg et al. (2012)] Bromberg, Omer, Ehud Nakar, Tsvi Piran, and Re’em Sari, ApJ, 749-110
4 MICHELLE VILLENEUVE
Figure 3. This is the distribution of T90 duration times as observed by BATSE.(Credit: NASA)


![Progenitor constraints on the Type Ia supernova SN 2014J ... · Progenitor constraints on the Type Ia supernova SN 2014J from Hubble Space Telescope H and [OIII] observations Or Graur1;2?yand](https://img.pdfslide.net/doc/110x75/5e17dfd6f1c2460c5945b5d7/progenitor-constraints-on-the-type-ia-supernova-sn-2014j-progenitor-constraints.jpg)