Embed Size (px)
Citation preview
SPWLA 49th Annual Logging Symposium, May 25-28, 2008
1
COMPARISON OF WIRELINE FORMATION-TESTER SAMPLING WITH FOCUSED AND CONVENTIONAL PROBES IN THE PRESENCE
OF OIL-BASE MUD-FILTRATE INVASION
Mayank Malik, Carlos Torres-Verdín, and Kamy Sepehrnoori, The University of Texas at Austin, Richard Jackson, Peter Weinheber, and Oliver C. Mullins, Schlumberger,
Hani Elshahawi, Birol Dindoruk, and Mohamed Hashem, Shell International E&P
Copyright 2008, held jointly by the Society of Petrophysicists and Well Log Analysts (SPWLA) and the submitting authors. This paper was prepared for presentation at the SPWLA 49th Annual Logging Symposium held in Edinburgh, Scotland, May 25-28, 2008. ABSTRACT Acquisition of fluid samples is challenging in the presence of oil-base mud (OBM) filtrate invasion due to its partial or full miscibility with reservoir hydrocarbons. In the course of fluid sampling, varying concentrations of OBM will lead to variations of fluid properties such as viscosity, density, and gas-oil ratio (GOR). Contamination of OBM filtrate in the sampled fluid can drastically affect sample quality and lead to non-representative fluid properties. Fluid pumpout time can be extended to reduce filtrate contamination, although at the expense of increasing overall rig cost. A focused probe can be useful in reducing OBM contamination by diverting flow into different channels without compromising fluid pumpout time. However, it is important to properly quantify the relative performance of focused and conventional probes for a wide range of field conditions. The objective of this paper is to appraise the performance of different probes under the same simulated field conditions and for a comprehensive set of petrophysical and fluid properties. We simulate the process of fluid sampling with a focused probe in a vertical well and compare its performance to that of a one-inch diameter conventional probe in the presence of mud-filtrate invasion. A commercial adaptive-implicit compositional reservoir simulator is used to model both invasion and filtrate-cleanup processes. Comparison between fluid sampling with focused and conventional probes identifies cases in which focused fluid sampling leads to improved sample quality in a shorter period of time. Results indicate that sample quality generally improves when the flow is split between the guard and sample probes, but the specific amount of improvement depends on probe geometry, fluid composition, and formation properties. In addition, because the focused probe withdraws fluids through a larger cross-sectional area, the pressure drop caused by the focused probe is smaller than the pressure drop
associated with a conventional probe. Permeability anisotropy, presence of a shale boundary, and lack of mud-filtrate invasion can help to improve sample quality. In addition, fluid cleanup can be accelerated by altering both the probe design and the flow-rate ratio between the sample and guard fluid streams thereby leading to increased pressure differential between the sample and guard areas. Performance of the focused probe improves with increasing fluid-front dispersion because focusing enhances the “coning” of the mud-filtrate invasion front. Lastly, we perform inversion jointly from transient measurements of GOR and probe pressures to estimate formation permeability, anisotropy, and rate of mud-filtrate invasion. It is shown that, in general, focused fluid sampling provides enhanced degrees of freedom in the pressure and GOR transient measurements to improve both accuracy and reliability of the estimated formation properties. INTRODUCTION Formation testers are widely used for downhole fluid analysis (Dong et al., 2007) to measure real-time fluid properties such as color, viscosity, density, chemical composition, pH, optical refractive index, and GOR (volumetric gas-to-liquid ratio of crude oil measured at standard conditions of 1 atm and 60 ◦F). Wireline formation-tester (WFT) measurements remain influenced by the process of mud-filtrate invasion that takes place prior to measurement acquisition (Malik et al., 2007). Consequently, early-time sampling can give non-representative fluid samples due to excessive OBM contamination. On the other hand, extended duration of the test to render clean fluid samples can escalate rig costs and lead to greater chances of the tool being differentially stuck to the borehole wall. Optimizing the time required to obtain clean fluid samples can be challenging due to a variety of circumstances, including the drilling environment, formation properties, and radial extent of mud-filtrate invasion. Alternatively, focused probe-type formation testers can be used to secure
LL
SPWLA 49th Annual Logging Symposium, May 25-28, 2008
1

SPWLA 49th Annual Logging Symposium, May 25-28, 2008
2
clean fluid samples faster than with a conventional probe. Because there is a rubber sealing between the guard and sample regions of a focused probe, OBM- contaminated fluid tends to flow toward the guard region whereas native formation fluids tend to preferentially flow toward the sample probe. Ideally, the guard flow line withdraws OBM filtrate whereas the sample flow line withdraws clean formation fluids. In theory, the physical design of the focused-sampling probe should help to acquire cleaner fluid samples faster especially in the presence of deep OBM-filtrate invasion. If an appropriate pressure differential is maintained, diversion of the fluid stream to different channels can lead to faster cleanup thereby reducing fluid sampling time. However, it is critical to compare the performance of the probes under a variety of petrophysical, fluid, and field conditions to quantify the time improvement in fluid cleanup. Numerical modeling provides a general, efficient, and consistent method to compare the performance of different fluid probes under the same sampling conditions. Moreover, the outcome of such studies can help to optimize fluid sampling operations. Hrametz et al. (2001) patented the original work on focused fluid sampling. They introduced different geometrical configurations of probes to isolate pressure regions from the borehole fluid. Schlumberger designed the Quicksilver1 probe to achieve higher-purity fluid sampling in shorter times than with a conventional probe (Weinheber and Vasques, 2006). Akkurt et al. (2006) described several field cases of fluid sampling acquired in light-oil formations drilled with OBM and water-base muds (WBM). Results showed that focusing provided better fluid-sample quality. Due to the higher purity of samples acquired with the Quicksilver probe, Akkurt et al. (2006) indicated that many of the samples they collected had levels of contamination that were “too small to measure.” Kumar et al. (2006) compared the performance of the focused probe against that of a conventional formation tester in high-viscosity oil formations where obtaining representative fluid samples was challenging. They concluded that the focused probe enabled the acquisition of low-contamination fluid samples in typically half the time required by conventional fluid sampling. O’Keefe et al. (2006) described applications of the focused probe in wells drilled in the Norwegian continental shelf for four case studies: (a) oil zone drilled with WBM, (b) water zone drilled with WBM, (c) water zone drilled with WBM, and (d) gas-condensate zone drilled with OBM. They also
1 Trademark of Schlumberger
compared the performance of the focused probe to that of a conventional probe in cases (a), (b), and (c) and concluded that focusing led to faster fluid cleanup. In case (d), they observed 2% contamination in the sample flow line even after 10,200 sec of fluid sampling. In addition, they indicated that contamination was higher in case (d) as the environmental conditions were less conducive to WFT sampling. Alpak et al. (2006) modeled a conventional probe with a compositional equation-of-state (EOS) simulator to compare field examples of sampled-fluid GOR to their simulated GOR. We note that GOR is one of the standard metrics to evaluate fluid sample quality (Mullins et al., 2001). Sherwood (2005) documented the first numerical simulation results that modeled the focused probe to assess optimal probe design for withdrawing uncontaminated fluid samples. In order to derive analytical expressions for fluid cleanup, Sherwood (2005) assumed that mud filtrate and formation fluid were identical and neglected gravity segregation effects in the near-probe flow region. These assumptions were useful in designing optimal probe geometries that could provide lower levels of fluid contamination. In this paper, we numerically simulate the process of fluid withdrawal with focused and conventional probes and compare their performance to determine the petrophysical, fluid, and field conditions under which usage of a focused probe can lead to improved fluid cleanup. Fluid properties are modeled in the form of multiple components using a compositional EOS simulator (CMG-GEM2). Our compositional model consists of eight pseudo-components: five formation oil components and three oil-base mud-filtrate components, to model accurately the time-space evolution of miscible flow for both invasion and fluid withdrawal. Hydrocarbon-phase compositions are tracked in time using the Peng-Robinson EOS (Peng and Robinson, 1976). Fluid phase density is calculated from the EOS to account for variations of fluid density due to time-space variations of pressure and composition. Moreover, fluid viscosity is calculated with the Lohrenz-Bray-Clark (Lohrenz et al., 1964) correlation to account for time-space variations of fluid composition. The following section describes our technique for simulating mud-filtrate invasion and formation-tester measurements in the near-wellbore region with a commercial finite-difference compositional simulator. Subsequently, we introduce a base-case light-oil formation model without invasion.
2 Trademark of Computer Modeling Group Limited
SPWLA 49th Annual Logging Symposium, May 25-28, 2008
2
SPWLA 49th Annual Logging Symposium, May 25-28, 2008
3
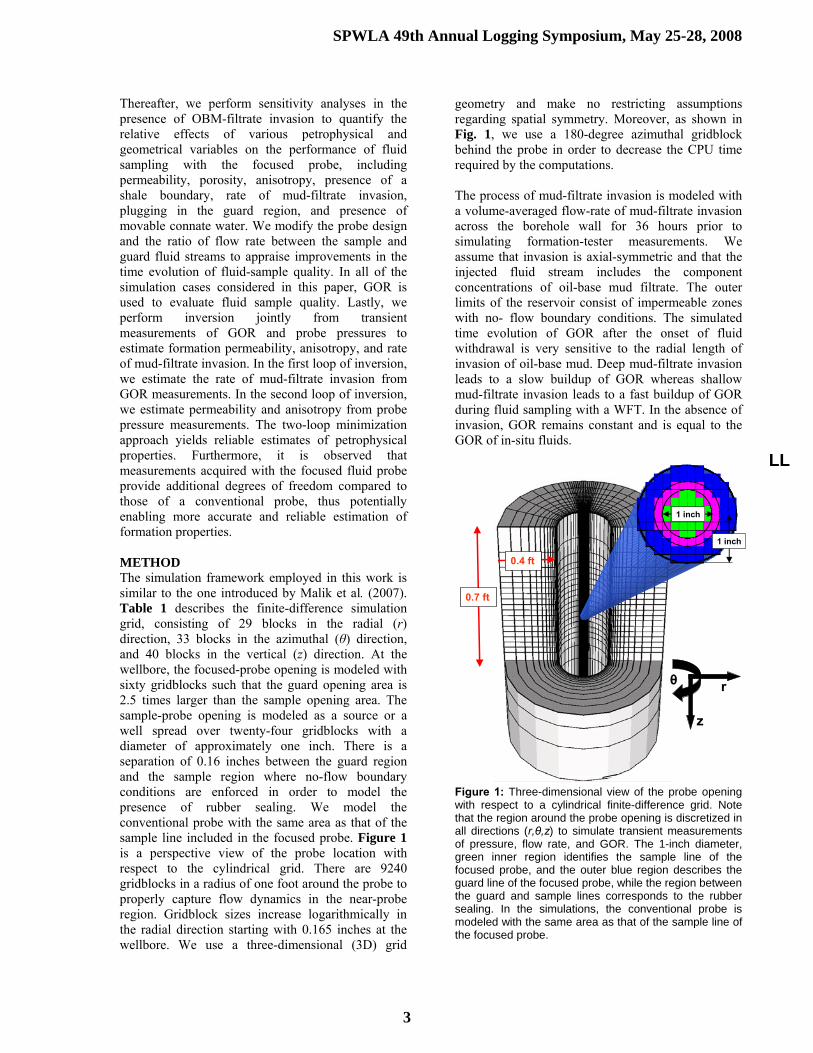
Thereafter, we perform sensitivity analyses in the presence of OBM-filtrate invasion to quantify the relative effects of various petrophysical and geometrical variables on the performance of fluid sampling with the focused probe, including permeability, porosity, anisotropy, presence of a shale boundary, rate of mud-filtrate invasion, plugging in the guard region, and presence of movable connate water. We modify the probe design and the ratio of flow rate between the sample and guard fluid streams to appraise improvements in the time evolution of fluid-sample quality. In all of the simulation cases considered in this paper, GOR is used to evaluate fluid sample quality. Lastly, we perform inversion jointly from transient measurements of GOR and probe pressures to estimate formation permeability, anisotropy, and rate of mud-filtrate invasion. In the first loop of inversion, we estimate the rate of mud-filtrate invasion from GOR measurements. In the second loop of inversion, we estimate permeability and anisotropy from probe pressure measurements. The two-loop minimization approach yields reliable estimates of petrophysical properties. Furthermore, it is observed that measurements acquired with the focused fluid probe provide additional degrees of freedom compared to those of a conventional probe, thus potentially enabling more accurate and reliable estimation of formation properties. METHOD The simulation framework employed in this work is similar to the one introduced by Malik et al. (2007). Table 1 describes the finite-difference simulation grid, consisting of 29 blocks in the radial (r) direction, 33 blocks in the azimuthal (θ) direction, and 40 blocks in the vertical (z) direction. At the wellbore, the focused-probe opening is modeled with sixty gridblocks such that the guard opening area is 2.5 times larger than the sample opening area. The sample-probe opening is modeled as a source or a well spread over twenty-four gridblocks with a diameter of approximately one inch. There is a separation of 0.16 inches between the guard region and the sample region where no-flow boundary conditions are enforced in order to model the presence of rubber sealing. We model the conventional probe with the same area as that of the sample line included in the focused probe. Figure 1 is a perspective view of the probe location with respect to the cylindrical grid. There are 9240 gridblocks in a radius of one foot around the probe to properly capture flow dynamics in the near-probe region. Gridblock sizes increase logarithmically in the radial direction starting with 0.165 inches at the wellbore. We use a three-dimensional (3D) grid
geometry and make no restricting assumptions regarding spatial symmetry. Moreover, as shown in Fig. 1, we use a 180-degree azimuthal gridblock behind the probe in order to decrease the CPU time required by the computations. The process of mud-filtrate invasion is modeled with a volume-averaged flow-rate of mud-filtrate invasion across the borehole wall for 36 hours prior to simulating formation-tester measurements. We assume that invasion is axial-symmetric and that the injected fluid stream includes the component concentrations of oil-base mud filtrate. The outer limits of the reservoir consist of impermeable zones with no- flow boundary conditions. The simulated time evolution of GOR after the onset of fluid withdrawal is very sensitive to the radial length of invasion of oil-base mud. Deep mud-filtrate invasion leads to a slow buildup of GOR whereas shallow mud-filtrate invasion leads to a fast buildup of GOR during fluid sampling with a WFT. In the absence of invasion, GOR remains constant and is equal to the GOR of in-situ fluids.
1 inch
r
z
0.7 ft
0.4 ft
θ
1 inch
Figure 1: Three-dimensional view of the probe opening with respect to a cylindrical finite-difference grid. Note that the region around the probe opening is discretized in all directions (r,θ,z) to simulate transient measurements of pressure, flow rate, and GOR. The 1-inch diameter, green inner region identifies the sample line of the focused probe, and the outer blue region describes the guard line of the focused probe, while the region between the guard and sample lines corresponds to the rubber sealing. In the simulations, the conventional probe is modeled with the same area as that of the sample line of the focused probe.
LL
SPWLA 49th Annual Logging Symposium, May 25-28, 2008
3
SPWLA 49th Annual Logging Symposium, May 25-28, 2008
4
TABLE 1: Summary of geometrical and numerical simulation parameters assumed for all study cases considered in this paper. Parameter Units Value Wellbore radius (rw) ft 0.354 External radius (re) ft 300 Reservoir thickness ft 43.4 Number of nodes – radial axis -- 29 Number of nodes – azimuthal axis
-- 33
Number of nodes – vertical axis -- 40 Grid cell size – r ft Variable Grid cell size – θ degrees Variable Grid cell size – z ft Variable
TABLE 2: Equation-of-state parameters and mole fractions of fluid pseudo-components assumed in this paper to describe the behavior of in-situ fluid. Parameter N2C1 CO2C3 C4C6 C7C18 C19+ Molar Concentration 0.6183 0.0792 0.0875 0.1786 0.0362
Critical Temp. (oF) -125.7 125.9 359.8 656.2 1059.9
Critical Pressure (psi) 653.3 839.4 498.2 322.3 184.4
Acentric Factor 0.0105 0.1458 0.2302 0.4904 0.9192 Molar Weight (lbs/lb-mols) 16.6 36.23 67.73 132.79 303.21
Volume Shift Parameter -0.193 -0.131 -0.056 0.171 0.231
TABLE 3: Equation-of-state parameters and mole fractions of fluid pseudo-components assumed in this paper to describe the behavior of oil-base mud. Parameter MC14 MC16 MC18 Molar Concentration 0.6489 0.2145 0.1364 Critical Temperature (oF) 755.1 822.5 878.1 Critical Pressure (psi) 261.8 240.2 224.4 Acentric Factor 0.6257 0.7118 0.7842 Molar Weight (lbs/ lb-moles) 190 222 251
Volume Shift Parameter 0.0792 0.0666 0.0439
TABLE 4: Summary of the assumed petrophysical and fluid properties for all simulation cases considered in this paper. Property Units Value Initial water saturation Fraction 0.22 Water compressibility 1/psi 3x10⁻⁶ Porosity Fraction 0.275 Horizontal permeability mD 250 Vertical permeability mD 250 Mud-filtrate invasion duration Hours 36 Mud-filtrate viscosity cp 1.8 Mud-filtrate density g/cc 0.8 Formation-test duration Hours 3 Conventional-probe flow rate RB/Day 8 Focused-probe flow rate RB/Day 6 Sample-probe flow rate RB/Day 2 Invasion flow rate ft3/day/ft 0.345 Temperature ◦F 140 Formation pressure psi 6800 Formation compressibility 1/psi 10-8 Light-oil density g/cc 0.60 Light-oil viscosity cp 0.36 Light-oil gas-oil ratio SCF/STB 2200 Heavy-oil density g/cc 0.85 Heavy-oil viscosity cp 8.8 Heavy-oil gas-oil ratio SCF/STB 93
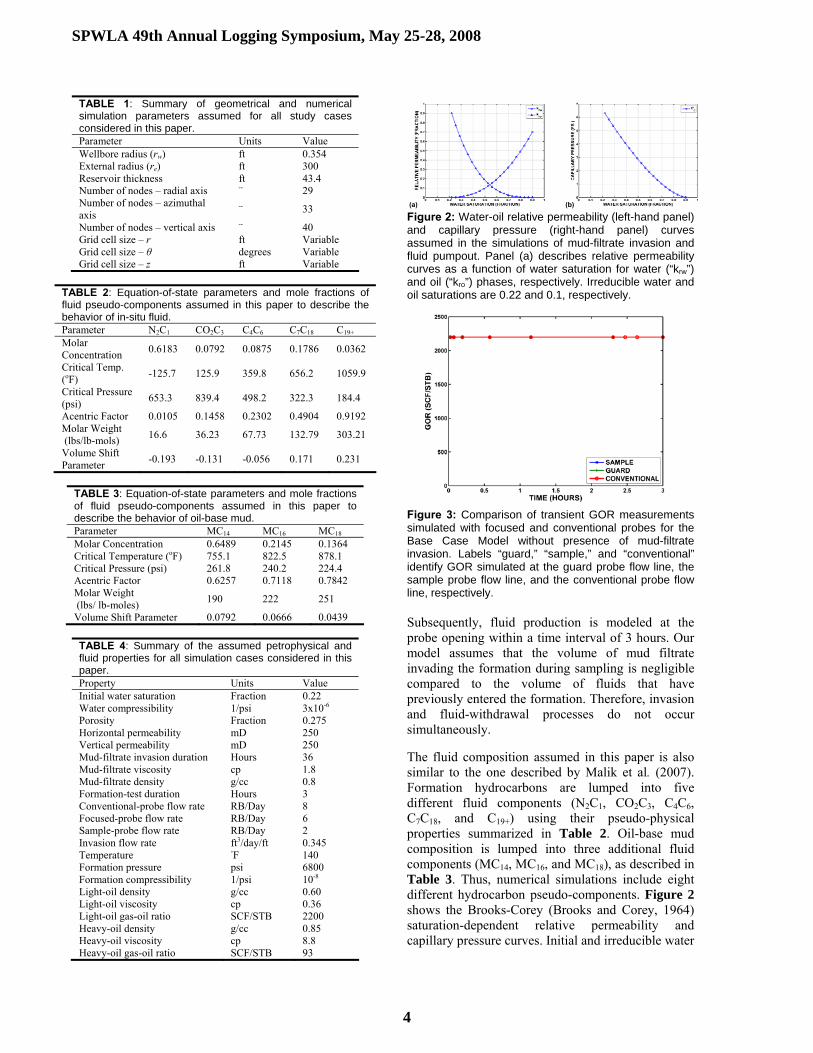
(a) (b) Figure 2: Water-oil relative permeability (left-hand panel) and capillary pressure (right-hand panel) curves assumed in the simulations of mud-filtrate invasion and fluid pumpout. Panel (a) describes relative permeability curves as a function of water saturation for water (“krw”) and oil (“kro”) phases, respectively. Irreducible water and oil saturations are 0.22 and 0.1, respectively.
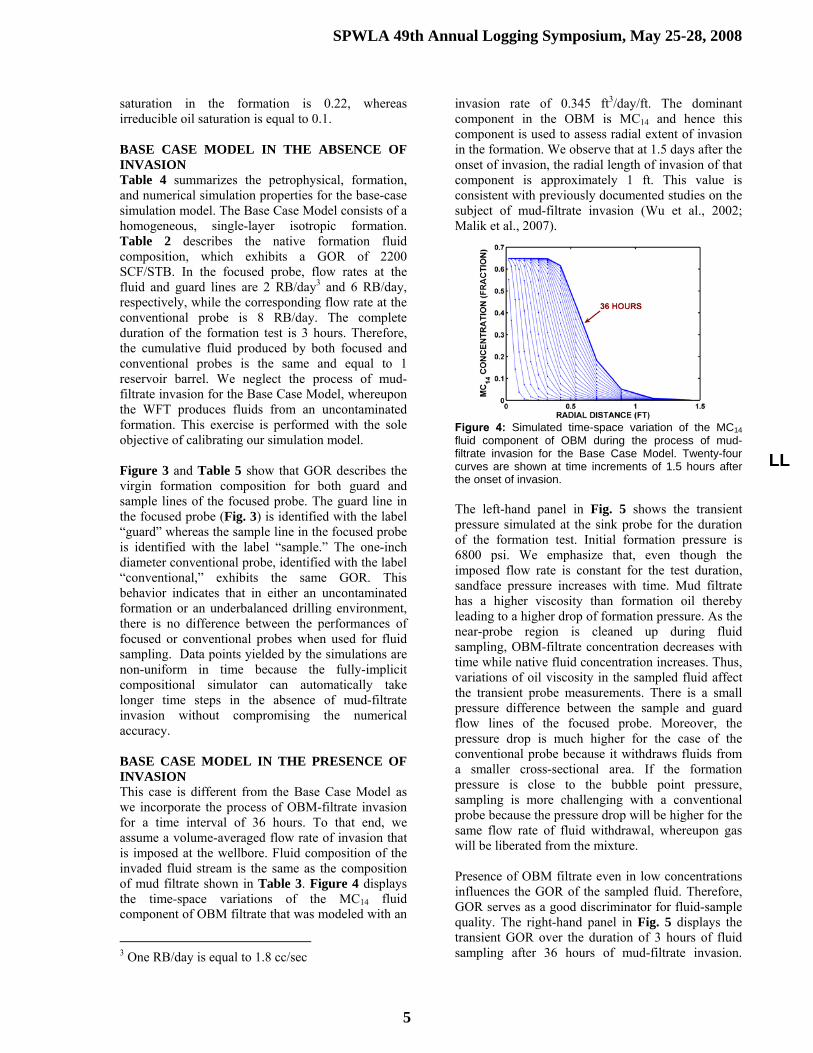
Figure 3: Comparison of transient GOR measurements simulated with focused and conventional probes for the Base Case Model without presence of mud-filtrate invasion. Labels “guard,” “sample,” and “conventional” identify GOR simulated at the guard probe flow line, the sample probe flow line, and the conventional probe flow line, respectively. Subsequently, fluid production is modeled at the probe opening within a time interval of 3 hours. Our model assumes that the volume of mud filtrate invading the formation during sampling is negligible compared to the volume of fluids that have previously entered the formation. Therefore, invasion and fluid-withdrawal processes do not occur simultaneously.
The fluid composition assumed in this paper is also similar to the one described by Malik et al. (2007). Formation hydrocarbons are lumped into five different fluid components (N2C1, CO2C3, C4C6, C7C18, and C19+) using their pseudo-physical properties summarized in Table 2. Oil-base mud composition is lumped into three additional fluid components (MC14, MC16, and MC18), as described in Table 3. Thus, numerical simulations include eight different hydrocarbon pseudo-components. Figure 2 shows the Brooks-Corey (Brooks and Corey, 1964) saturation-dependent relative permeability and capillary pressure curves. Initial and irreducible water
SPWLA 49th Annual Logging Symposium, May 25-28, 2008
4
SPWLA 49th Annual Logging Symposium, May 25-28, 2008
5
saturation in the formation is 0.22, whereas irreducible oil saturation is equal to 0.1.
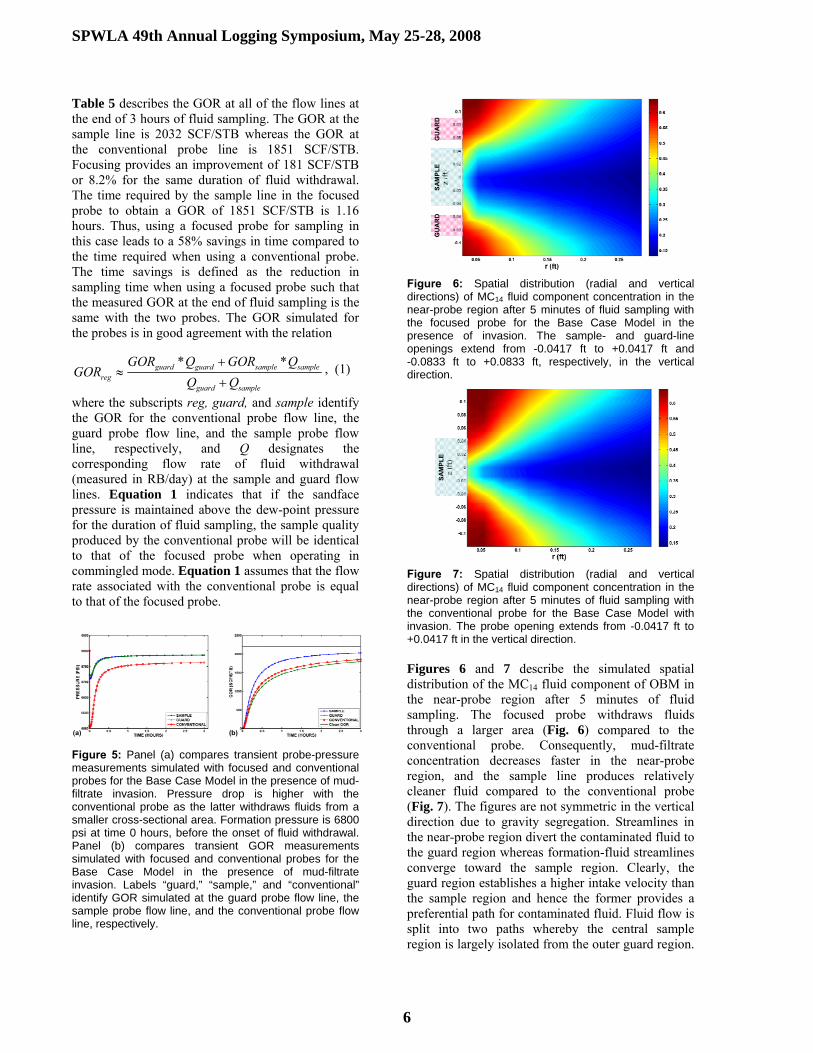
BASE CASE MODEL IN THE ABSENCE OF INVASION Table 4 summarizes the petrophysical, formation, and numerical simulation properties for the base-case simulation model. The Base Case Model consists of a homogeneous, single-layer isotropic formation. Table 2 describes the native formation fluid composition, which exhibits a GOR of 2200 SCF/STB. In the focused probe, flow rates at the fluid and guard lines are 2 RB/day3 and 6 RB/day, respectively, while the corresponding flow rate at the conventional probe is 8 RB/day. The complete duration of the formation test is 3 hours. Therefore, the cumulative fluid produced by both focused and conventional probes is the same and equal to 1 reservoir barrel. We neglect the process of mud-filtrate invasion for the Base Case Model, whereupon the WFT produces fluids from an uncontaminated formation. This exercise is performed with the sole objective of calibrating our simulation model. Figure 3 and Table 5 show that GOR describes the virgin formation composition for both guard and sample lines of the focused probe. The guard line in the focused probe (Fig. 3) is identified with the label “guard” whereas the sample line in the focused probe is identified with the label “sample.” The one-inch diameter conventional probe, identified with the label “conventional,” exhibits the same GOR. This behavior indicates that in either an uncontaminated formation or an underbalanced drilling environment, there is no difference between the performances of focused or conventional probes when used for fluid sampling. Data points yielded by the simulations are non-uniform in time because the fully-implicit compositional simulator can automatically take longer time steps in the absence of mud-filtrate invasion without compromising the numerical accuracy. BASE CASE MODEL IN THE PRESENCE OF INVASION This case is different from the Base Case Model as we incorporate the process of OBM-filtrate invasion for a time interval of 36 hours. To that end, we assume a volume-averaged flow rate of invasion that is imposed at the wellbore. Fluid composition of the invaded fluid stream is the same as the composition of mud filtrate shown in Table 3. Figure 4 displays the time-space variations of the MC14 fluid component of OBM filtrate that was modeled with an
3 One RB/day is equal to 1.8 cc/sec
invasion rate of 0.345 ft3/day/ft. The dominant component in the OBM is MC14 and hence this component is used to assess radial extent of invasion in the formation. We observe that at 1.5 days after the onset of invasion, the radial length of invasion of that component is approximately 1 ft. This value is consistent with previously documented studies on the subject of mud-filtrate invasion (Wu et al., 2002; Malik et al., 2007).
Figure 4: Simulated time-space variation of the MC14 fluid component of OBM during the process of mud-filtrate invasion for the Base Case Model. Twenty-four curves are shown at time increments of 1.5 hours after the onset of invasion. The left-hand panel in Fig. 5 shows the transient pressure simulated at the sink probe for the duration of the formation test. Initial formation pressure is 6800 psi. We emphasize that, even though the imposed flow rate is constant for the test duration, sandface pressure increases with time. Mud filtrate has a higher viscosity than formation oil thereby leading to a higher drop of formation pressure. As the near-probe region is cleaned up during fluid sampling, OBM-filtrate concentration decreases with time while native fluid concentration increases. Thus, variations of oil viscosity in the sampled fluid affect the transient probe measurements. There is a small pressure difference between the sample and guard flow lines of the focused probe. Moreover, the pressure drop is much higher for the case of the conventional probe because it withdraws fluids from a smaller cross-sectional area. If the formation pressure is close to the bubble point pressure, sampling is more challenging with a conventional probe because the pressure drop will be higher for the same flow rate of fluid withdrawal, whereupon gas will be liberated from the mixture. Presence of OBM filtrate even in low concentrations influences the GOR of the sampled fluid. Therefore, GOR serves as a good discriminator for fluid-sample quality. The right-hand panel in Fig. 5 displays the transient GOR over the duration of 3 hours of fluid sampling after 36 hours of mud-filtrate invasion.
LL
SPWLA 49th Annual Logging Symposium, May 25-28, 2008
5
SPWLA 49th Annual Logging Symposium, May 25-28, 2008
6
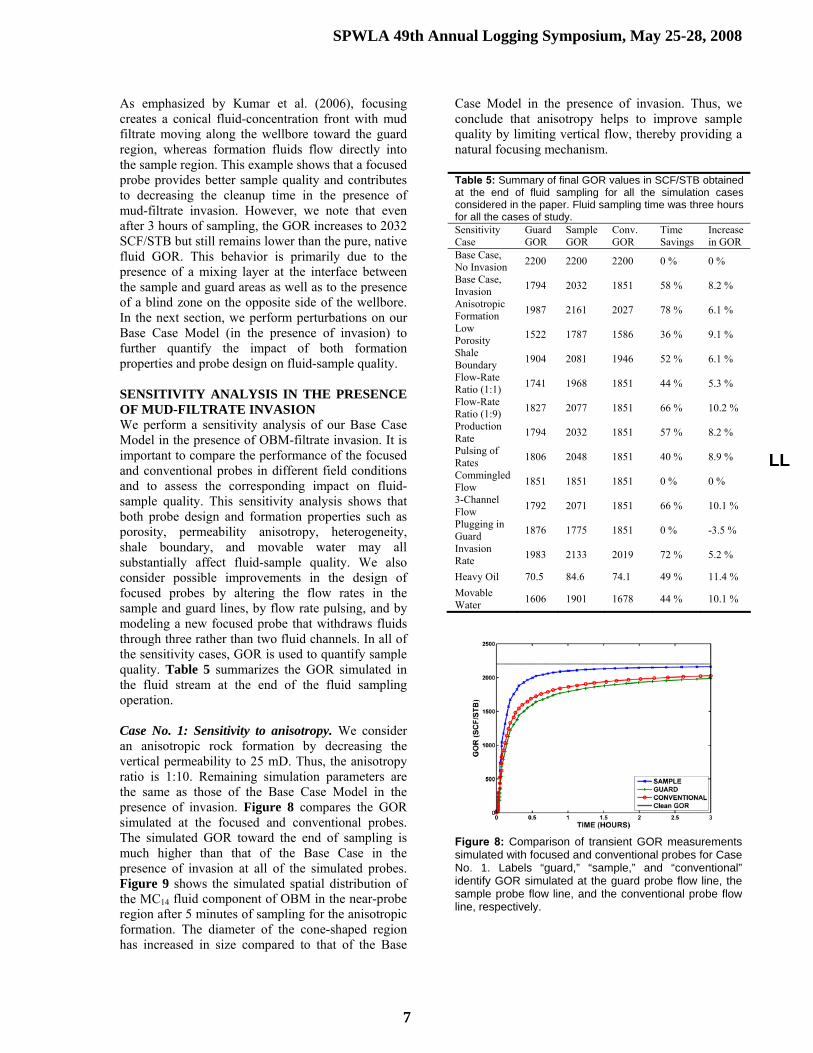
Table 5 describes the GOR at all of the flow lines at the end of 3 hours of fluid sampling. The GOR at the sample line is 2032 SCF/STB whereas the GOR at the conventional probe line is 1851 SCF/STB. Focusing provides an improvement of 181 SCF/STB or 8.2% for the same duration of fluid withdrawal. The time required by the sample line in the focused probe to obtain a GOR of 1851 SCF/STB is 1.16 hours. Thus, using a focused probe for sampling in this case leads to a 58% savings in time compared to the time required when using a conventional probe. The time savings is defined as the reduction in sampling time when using a focused probe such that the measured GOR at the end of fluid sampling is the same with the two probes. The GOR simulated for the probes is in good agreement with the relation
* *guard guard sample samplereg
guard sample
GOR Q GOR QGOR
Q Q+
≈+
, (1)
where the subscripts reg, guard, and sample identify the GOR for the conventional probe flow line, the guard probe flow line, and the sample probe flow line, respectively, and Q designates the corresponding flow rate of fluid withdrawal (measured in RB/day) at the sample and guard flow lines. Equation 1 indicates that if the sandface pressure is maintained above the dew-point pressure for the duration of fluid sampling, the sample quality produced by the conventional probe will be identical to that of the focused probe when operating in commingled mode. Equation 1 assumes that the flow rate associated with the conventional probe is equal to that of the focused probe.
(a) (b)
Figure 5: Panel (a) compares transient probe-pressure measurements simulated with focused and conventional probes for the Base Case Model in the presence of mud-filtrate invasion. Pressure drop is higher with the conventional probe as the latter withdraws fluids from a smaller cross-sectional area. Formation pressure is 6800 psi at time 0 hours, before the onset of fluid withdrawal. Panel (b) compares transient GOR measurements simulated with focused and conventional probes for the Base Case Model in the presence of mud-filtrate invasion. Labels “guard,” “sample,” and “conventional” identify GOR simulated at the guard probe flow line, the sample probe flow line, and the conventional probe flow line, respectively.
SAM
PLE
GU
AR
DG
UA
RD
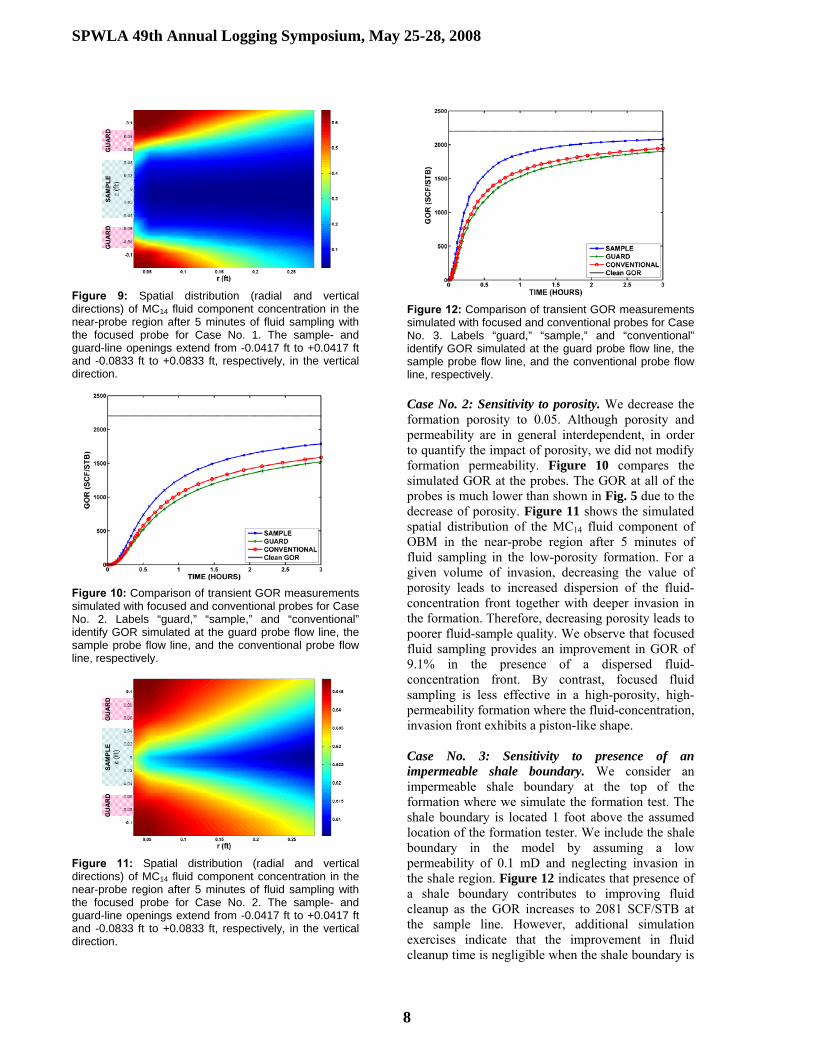
Figure 6: Spatial distribution (radial and vertical directions) of MC14 fluid component concentration in the near-probe region after 5 minutes of fluid sampling with the focused probe for the Base Case Model in the presence of invasion. The sample- and guard-line openings extend from -0.0417 ft to +0.0417 ft and -0.0833 ft to +0.0833 ft, respectively, in the vertical direction.
SAM
PLE
Figure 7: Spatial distribution (radial and vertical directions) of MC14 fluid component concentration in the near-probe region after 5 minutes of fluid sampling with the conventional probe for the Base Case Model with invasion. The probe opening extends from -0.0417 ft to +0.0417 ft in the vertical direction. Figures 6 and 7 describe the simulated spatial distribution of the MC14 fluid component of OBM in the near-probe region after 5 minutes of fluid sampling. The focused probe withdraws fluids through a larger area (Fig. 6) compared to the conventional probe. Consequently, mud-filtrate concentration decreases faster in the near-probe region, and the sample line produces relatively cleaner fluid compared to the conventional probe (Fig. 7). The figures are not symmetric in the vertical direction due to gravity segregation. Streamlines in the near-probe region divert the contaminated fluid to the guard region whereas formation-fluid streamlines converge toward the sample region. Clearly, the guard region establishes a higher intake velocity than the sample region and hence the former provides a preferential path for contaminated fluid. Fluid flow is split into two paths whereby the central sample region is largely isolated from the outer guard region.
SPWLA 49th Annual Logging Symposium, May 25-28, 2008
6
SPWLA 49th Annual Logging Symposium, May 25-28, 2008
7
As emphasized by Kumar et al. (2006), focusing creates a conical fluid-concentration front with mud filtrate moving along the wellbore toward the guard region, whereas formation fluids flow directly into the sample region. This example shows that a focused probe provides better sample quality and contributes to decreasing the cleanup time in the presence of mud-filtrate invasion. However, we note that even after 3 hours of sampling, the GOR increases to 2032 SCF/STB but still remains lower than the pure, native fluid GOR. This behavior is primarily due to the presence of a mixing layer at the interface between the sample and guard areas as well as to the presence of a blind zone on the opposite side of the wellbore. In the next section, we perform perturbations on our Base Case Model (in the presence of invasion) to further quantify the impact of both formation properties and probe design on fluid-sample quality. SENSITIVITY ANALYSIS IN THE PRESENCE OF MUD-FILTRATE INVASION We perform a sensitivity analysis of our Base Case Model in the presence of OBM-filtrate invasion. It is important to compare the performance of the focused and conventional probes in different field conditions and to assess the corresponding impact on fluid-sample quality. This sensitivity analysis shows that both probe design and formation properties such as porosity, permeability anisotropy, heterogeneity, shale boundary, and movable water may all substantially affect fluid-sample quality. We also consider possible improvements in the design of focused probes by altering the flow rates in the sample and guard lines, by flow rate pulsing, and by modeling a new focused probe that withdraws fluids through three rather than two fluid channels. In all of the sensitivity cases, GOR is used to quantify sample quality. Table 5 summarizes the GOR simulated in the fluid stream at the end of the fluid sampling operation. Case No. 1: Sensitivity to anisotropy. We consider an anisotropic rock formation by decreasing the vertical permeability to 25 mD. Thus, the anisotropy ratio is 1:10. Remaining simulation parameters are the same as those of the Base Case Model in the presence of invasion. Figure 8 compares the GOR simulated at the focused and conventional probes. The simulated GOR toward the end of sampling is much higher than that of the Base Case in the presence of invasion at all of the simulated probes. Figure 9 shows the simulated spatial distribution of the MC14 fluid component of OBM in the near-probe region after 5 minutes of sampling for the anisotropic formation. The diameter of the cone-shaped region has increased in size compared to that of the Base
Case Model in the presence of invasion. Thus, we conclude that anisotropy helps to improve sample quality by limiting vertical flow, thereby providing a natural focusing mechanism. Table 5: Summary of final GOR values in SCF/STB obtained at the end of fluid sampling for all the simulation cases considered in the paper. Fluid sampling time was three hours for all the cases of study. Sensitivity Case
Guard GOR
Sample GOR
Conv. GOR
Time Savings
Increase in GOR
Base Case, No Invasion 2200 2200 2200 0 % 0 %
Base Case, Invasion 1794 2032 1851 58 % 8.2 %
Anisotropic Formation 1987 2161 2027 78 % 6.1 %
Low Porosity 1522 1787 1586 36 % 9.1 %
Shale Boundary 1904 2081 1946 52 % 6.1 %
Flow-Rate Ratio (1:1) 1741 1968 1851 44 % 5.3 %
Flow-Rate Ratio (1:9) 1827 2077 1851 66 % 10.2 %
Production Rate 1794 2032 1851 57 % 8.2 %
Pulsing of Rates 1806 2048 1851 40 % 8.9 %
Commingled Flow 1851 1851 1851 0 % 0 %
3-Channel Flow 1792 2071 1851 66 % 10.1 %
Plugging in Guard 1876 1775 1851 0 % -3.5 %
Invasion Rate 1983 2133 2019 72 % 5.2 %
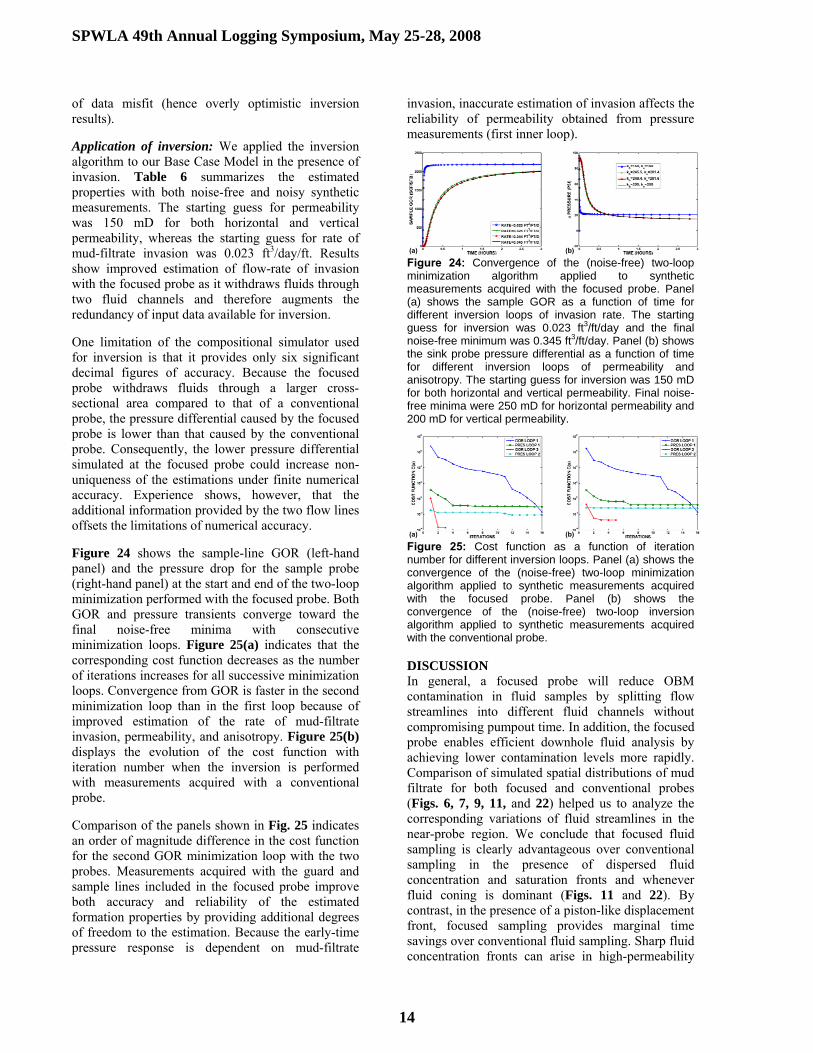
Heavy Oil 70.5 84.6 74.1 49 % 11.4 % Movable Water 1606 1901 1678 44 % 10.1 %
Figure 8: Comparison of transient GOR measurements simulated with focused and conventional probes for Case No. 1. Labels “guard,” “sample,” and “conventional” identify GOR simulated at the guard probe flow line, the sample probe flow line, and the conventional probe flow line, respectively.
LL
SPWLA 49th Annual Logging Symposium, May 25-28, 2008
7
SPWLA 49th Annual Logging Symposium, May 25-28, 2008
8
SAM
PLE
GU
ARD
GU
AR
D
Figure 9: Spatial distribution (radial and vertical directions) of MC14 fluid component concentration in the near-probe region after 5 minutes of fluid sampling with the focused probe for Case No. 1. The sample- and guard-line openings extend from -0.0417 ft to +0.0417 ft and -0.0833 ft to +0.0833 ft, respectively, in the vertical direction.
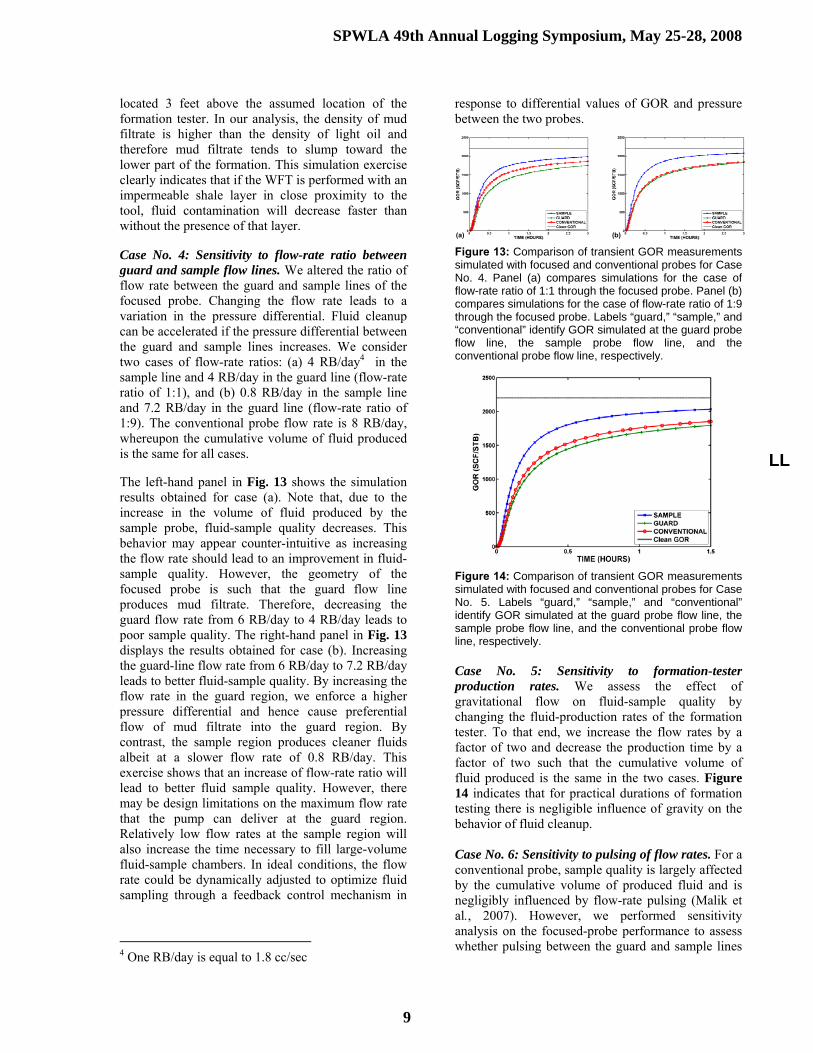
Figure 10: Comparison of transient GOR measurements simulated with focused and conventional probes for Case No. 2. Labels “guard,” “sample,” and “conventional” identify GOR simulated at the guard probe flow line, the sample probe flow line, and the conventional probe flow line, respectively.
SAM
PLE
GU
AR
DG
UA
RD
Figure 11: Spatial distribution (radial and vertical directions) of MC14 fluid component concentration in the near-probe region after 5 minutes of fluid sampling with the focused probe for Case No. 2. The sample- and guard-line openings extend from -0.0417 ft to +0.0417 ft and -0.0833 ft to +0.0833 ft, respectively, in the vertical direction.
Figure 12: Comparison of transient GOR measurements simulated with focused and conventional probes for Case No. 3. Labels “guard,” “sample,” and “conventional” identify GOR simulated at the guard probe flow line, the sample probe flow line, and the conventional probe flow line, respectively. Case No. 2: Sensitivity to porosity. We decrease the formation porosity to 0.05. Although porosity and permeability are in general interdependent, in order to quantify the impact of porosity, we did not modify formation permeability. Figure 10 compares the simulated GOR at the probes. The GOR at all of the probes is much lower than shown in Fig. 5 due to the decrease of porosity. Figure 11 shows the simulated spatial distribution of the MC14 fluid component of OBM in the near-probe region after 5 minutes of fluid sampling in the low-porosity formation. For a given volume of invasion, decreasing the value of porosity leads to increased dispersion of the fluid-concentration front together with deeper invasion in the formation. Therefore, decreasing porosity leads to poorer fluid-sample quality. We observe that focused fluid sampling provides an improvement in GOR of 9.1% in the presence of a dispersed fluid-concentration front. By contrast, focused fluid sampling is less effective in a high-porosity, high-permeability formation where the fluid-concentration, invasion front exhibits a piston-like shape. Case No. 3: Sensitivity to presence of an impermeable shale boundary. We consider an impermeable shale boundary at the top of the formation where we simulate the formation test. The shale boundary is located 1 foot above the assumed location of the formation tester. We include the shale boundary in the model by assuming a low permeability of 0.1 mD and neglecting invasion in the shale region. Figure 12 indicates that presence of a shale boundary contributes to improving fluid cleanup as the GOR increases to 2081 SCF/STB at the sample line. However, additional simulation exercises indicate that the improvement in fluid cleanup time is negligible when the shale boundary is
SPWLA 49th Annual Logging Symposium, May 25-28, 2008
8
SPWLA 49th Annual Logging Symposium, May 25-28, 2008
9
located 3 feet above the assumed location of the formation tester. In our analysis, the density of mud filtrate is higher than the density of light oil and therefore mud filtrate tends to slump toward the lower part of the formation. This simulation exercise clearly indicates that if the WFT is performed with an impermeable shale layer in close proximity to the tool, fluid contamination will decrease faster than without the presence of that layer. Case No. 4: Sensitivity to flow-rate ratio between guard and sample flow lines. We altered the ratio of flow rate between the guard and sample lines of the focused probe. Changing the flow rate leads to a variation in the pressure differential. Fluid cleanup can be accelerated if the pressure differential between the guard and sample lines increases. We consider two cases of flow-rate ratios: (a) 4 RB/day4 in the sample line and 4 RB/day in the guard line (flow-rate ratio of 1:1), and (b) 0.8 RB/day in the sample line and 7.2 RB/day in the guard line (flow-rate ratio of 1:9). The conventional probe flow rate is 8 RB/day, whereupon the cumulative volume of fluid produced is the same for all cases. The left-hand panel in Fig. 13 shows the simulation results obtained for case (a). Note that, due to the increase in the volume of fluid produced by the sample probe, fluid-sample quality decreases. This behavior may appear counter-intuitive as increasing the flow rate should lead to an improvement in fluid-sample quality. However, the geometry of the focused probe is such that the guard flow line produces mud filtrate. Therefore, decreasing the guard flow rate from 6 RB/day to 4 RB/day leads to poor sample quality. The right-hand panel in Fig. 13 displays the results obtained for case (b). Increasing the guard-line flow rate from 6 RB/day to 7.2 RB/day leads to better fluid-sample quality. By increasing the flow rate in the guard region, we enforce a higher pressure differential and hence cause preferential flow of mud filtrate into the guard region. By contrast, the sample region produces cleaner fluids albeit at a slower flow rate of 0.8 RB/day. This exercise shows that an increase of flow-rate ratio will lead to better fluid sample quality. However, there may be design limitations on the maximum flow rate that the pump can deliver at the guard region. Relatively low flow rates at the sample region will also increase the time necessary to fill large-volume fluid-sample chambers. In ideal conditions, the flow rate could be dynamically adjusted to optimize fluid sampling through a feedback control mechanism in
4 One RB/day is equal to 1.8 cc/sec
response to differential values of GOR and pressure between the two probes.
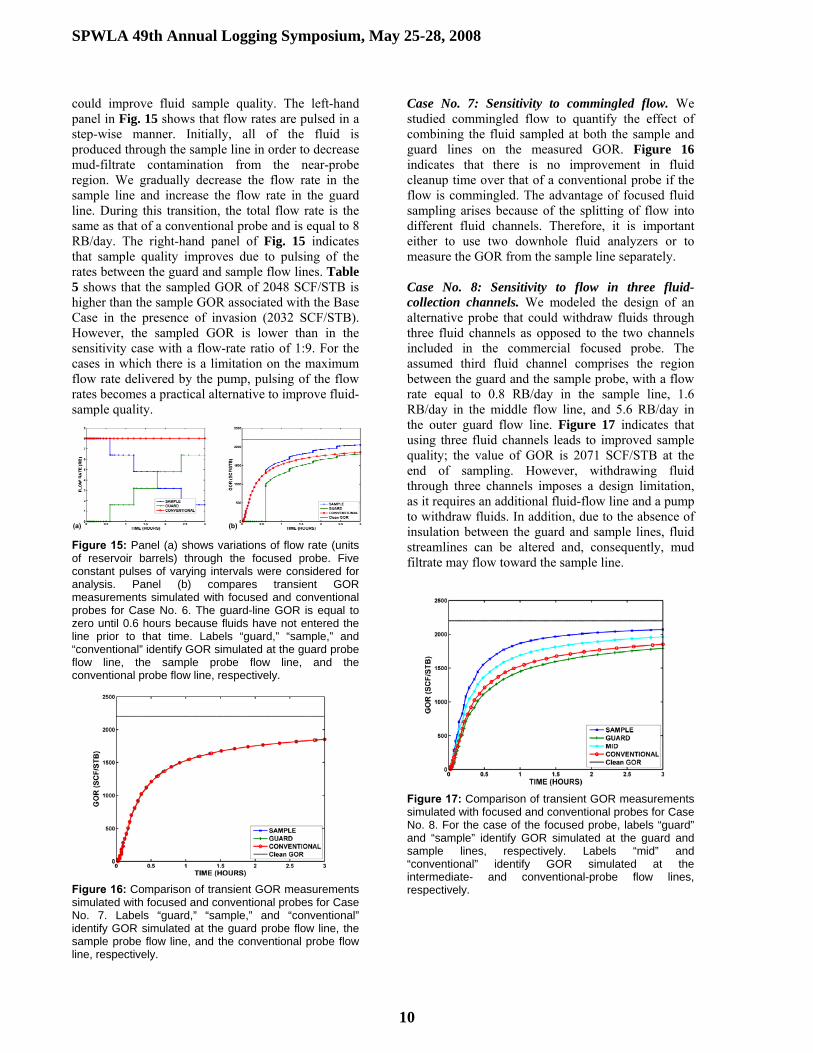
(a) (b) Figure 13: Comparison of transient GOR measurements simulated with focused and conventional probes for Case No. 4. Panel (a) compares simulations for the case of flow-rate ratio of 1:1 through the focused probe. Panel (b) compares simulations for the case of flow-rate ratio of 1:9 through the focused probe. Labels “guard,” “sample,” and “conventional” identify GOR simulated at the guard probe flow line, the sample probe flow line, and the conventional probe flow line, respectively.
Figure 14: Comparison of transient GOR measurements simulated with focused and conventional probes for Case No. 5. Labels “guard,” “sample,” and “conventional” identify GOR simulated at the guard probe flow line, the sample probe flow line, and the conventional probe flow line, respectively. Case No. 5: Sensitivity to formation-tester production rates. We assess the effect of gravitational flow on fluid-sample quality by changing the fluid-production rates of the formation tester. To that end, we increase the flow rates by a factor of two and decrease the production time by a factor of two such that the cumulative volume of fluid produced is the same in the two cases. Figure 14 indicates that for practical durations of formation testing there is negligible influence of gravity on the behavior of fluid cleanup. Case No. 6: Sensitivity to pulsing of flow rates. For a conventional probe, sample quality is largely affected by the cumulative volume of produced fluid and is negligibly influenced by flow-rate pulsing (Malik et al., 2007). However, we performed sensitivity analysis on the focused-probe performance to assess whether pulsing between the guard and sample lines
LL
SPWLA 49th Annual Logging Symposium, May 25-28, 2008
9
SPWLA 49th Annual Logging Symposium, May 25-28, 2008
10
could improve fluid sample quality. The left-hand panel in Fig. 15 shows that flow rates are pulsed in a step-wise manner. Initially, all of the fluid is produced through the sample line in order to decrease mud-filtrate contamination from the near-probe region. We gradually decrease the flow rate in the sample line and increase the flow rate in the guard line. During this transition, the total flow rate is the same as that of a conventional probe and is equal to 8 RB/day. The right-hand panel of Fig. 15 indicates that sample quality improves due to pulsing of the rates between the guard and sample flow lines. Table 5 shows that the sampled GOR of 2048 SCF/STB is higher than the sample GOR associated with the Base Case in the presence of invasion (2032 SCF/STB). However, the sampled GOR is lower than in the sensitivity case with a flow-rate ratio of 1:9. For the cases in which there is a limitation on the maximum flow rate delivered by the pump, pulsing of the flow rates becomes a practical alternative to improve fluid-sample quality.
(a) (b)
Figure 15: Panel (a) shows variations of flow rate (units of reservoir barrels) through the focused probe. Five constant pulses of varying intervals were considered for analysis. Panel (b) compares transient GOR measurements simulated with focused and conventional probes for Case No. 6. The guard-line GOR is equal to zero until 0.6 hours because fluids have not entered the line prior to that time. Labels “guard,” “sample,” and “conventional” identify GOR simulated at the guard probe flow line, the sample probe flow line, and the conventional probe flow line, respectively.
Figure 16: Comparison of transient GOR measurements simulated with focused and conventional probes for Case No. 7. Labels “guard,” “sample,” and “conventional” identify GOR simulated at the guard probe flow line, the sample probe flow line, and the conventional probe flow line, respectively.
Case No. 7: Sensitivity to commingled flow. We studied commingled flow to quantify the effect of combining the fluid sampled at both the sample and guard lines on the measured GOR. Figure 16 indicates that there is no improvement in fluid cleanup time over that of a conventional probe if the flow is commingled. The advantage of focused fluid sampling arises because of the splitting of flow into different fluid channels. Therefore, it is important either to use two downhole fluid analyzers or to measure the GOR from the sample line separately. Case No. 8: Sensitivity to flow in three fluid-collection channels. We modeled the design of an alternative probe that could withdraw fluids through three fluid channels as opposed to the two channels included in the commercial focused probe. The assumed third fluid channel comprises the region between the guard and the sample probe, with a flow rate equal to 0.8 RB/day in the sample line, 1.6 RB/day in the middle flow line, and 5.6 RB/day in the outer guard flow line. Figure 17 indicates that using three fluid channels leads to improved sample quality; the value of GOR is 2071 SCF/STB at the end of sampling. However, withdrawing fluid through three channels imposes a design limitation, as it requires an additional fluid-flow line and a pump to withdraw fluids. In addition, due to the absence of insulation between the guard and sample lines, fluid streamlines can be altered and, consequently, mud filtrate may flow toward the sample line.
Figure 17: Comparison of transient GOR measurements simulated with focused and conventional probes for Case No. 8. For the case of the focused probe, labels “guard” and “sample” identify GOR simulated at the guard and sample lines, respectively. Labels “mid” and “conventional” identify GOR simulated at the intermediate- and conventional-probe flow lines, respectively.
SPWLA 49th Annual Logging Symposium, May 25-28, 2008
10
SPWLA 49th Annual Logging Symposium, May 25-28, 2008
11
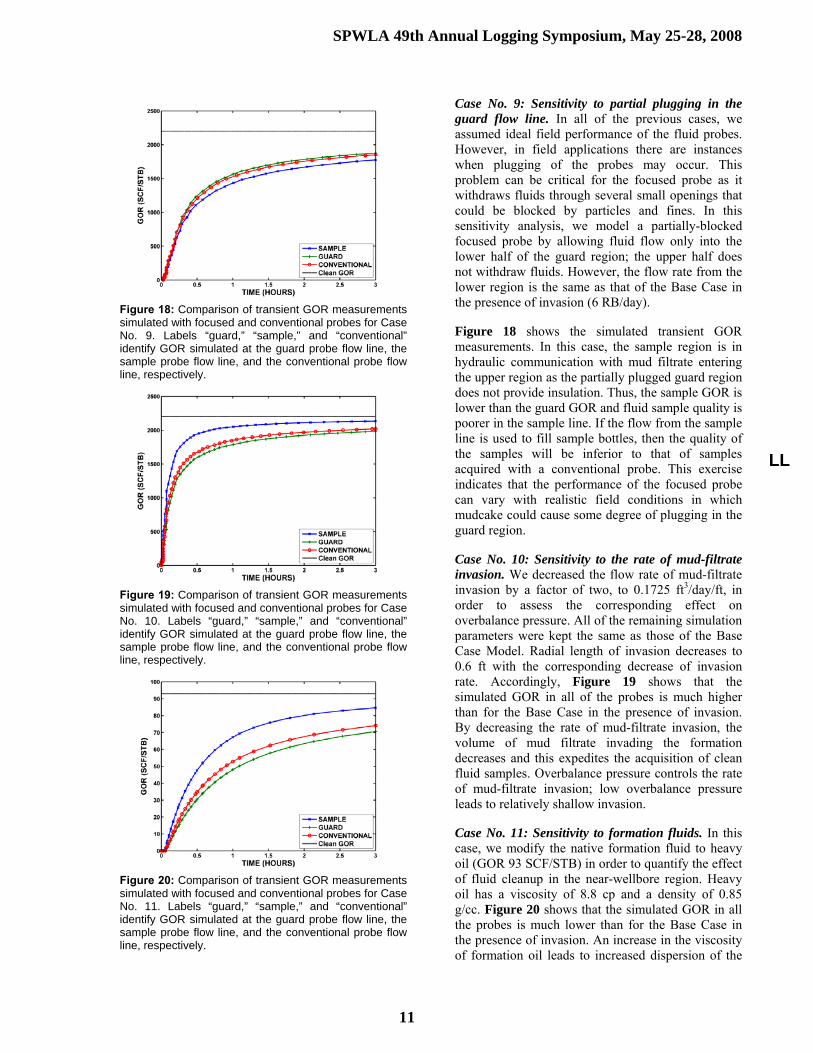
Figure 18: Comparison of transient GOR measurements simulated with focused and conventional probes for Case No. 9. Labels “guard,” “sample,” and “conventional” identify GOR simulated at the guard probe flow line, the sample probe flow line, and the conventional probe flow line, respectively.
Figure 19: Comparison of transient GOR measurements simulated with focused and conventional probes for Case No. 10. Labels “guard,” “sample,” and “conventional” identify GOR simulated at the guard probe flow line, the sample probe flow line, and the conventional probe flow line, respectively.
Figure 20: Comparison of transient GOR measurements simulated with focused and conventional probes for Case No. 11. Labels “guard,” “sample,” and “conventional” identify GOR simulated at the guard probe flow line, the sample probe flow line, and the conventional probe flow line, respectively.
Case No. 9: Sensitivity to partial plugging in the guard flow line. In all of the previous cases, we assumed ideal field performance of the fluid probes. However, in field applications there are instances when plugging of the probes may occur. This problem can be critical for the focused probe as it withdraws fluids through several small openings that could be blocked by particles and fines. In this sensitivity analysis, we model a partially-blocked focused probe by allowing fluid flow only into the lower half of the guard region; the upper half does not withdraw fluids. However, the flow rate from the lower region is the same as that of the Base Case in the presence of invasion (6 RB/day). Figure 18 shows the simulated transient GOR measurements. In this case, the sample region is in hydraulic communication with mud filtrate entering the upper region as the partially plugged guard region does not provide insulation. Thus, the sample GOR is lower than the guard GOR and fluid sample quality is poorer in the sample line. If the flow from the sample line is used to fill sample bottles, then the quality of the samples will be inferior to that of samples acquired with a conventional probe. This exercise indicates that the performance of the focused probe can vary with realistic field conditions in which mudcake could cause some degree of plugging in the guard region. Case No. 10: Sensitivity to the rate of mud-filtrate invasion. We decreased the flow rate of mud-filtrate invasion by a factor of two, to 0.1725 ft3/day/ft, in order to assess the corresponding effect on overbalance pressure. All of the remaining simulation parameters were kept the same as those of the Base Case Model. Radial length of invasion decreases to 0.6 ft with the corresponding decrease of invasion rate. Accordingly, Figure 19 shows that the simulated GOR in all of the probes is much higher than for the Base Case in the presence of invasion. By decreasing the rate of mud-filtrate invasion, the volume of mud filtrate invading the formation decreases and this expedites the acquisition of clean fluid samples. Overbalance pressure controls the rate of mud-filtrate invasion; low overbalance pressure leads to relatively shallow invasion. Case No. 11: Sensitivity to formation fluids. In this case, we modify the native formation fluid to heavy oil (GOR 93 SCF/STB) in order to quantify the effect of fluid cleanup in the near-wellbore region. Heavy oil has a viscosity of 8.8 cp and a density of 0.85 g/cc. Figure 20 shows that the simulated GOR in all the probes is much lower than for the Base Case in the presence of invasion. An increase in the viscosity of formation oil leads to increased dispersion of the
LL
SPWLA 49th Annual Logging Symposium, May 25-28, 2008
11
SPWLA 49th Annual Logging Symposium, May 25-28, 2008
12
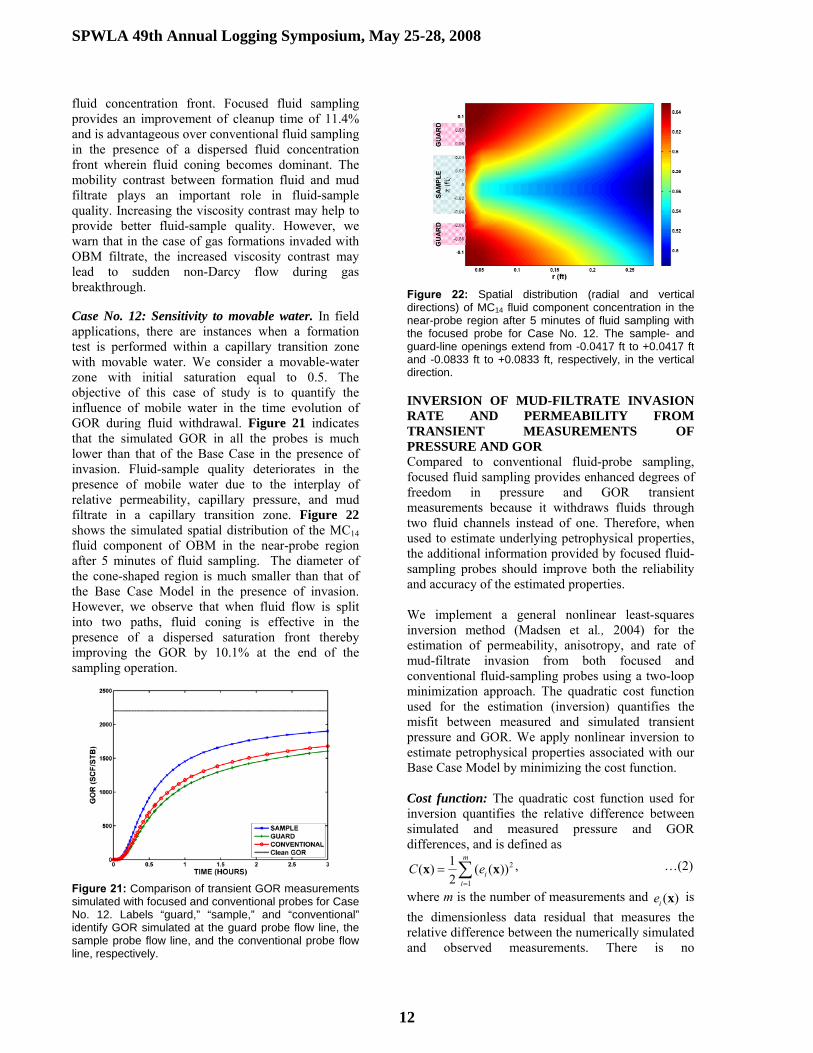
fluid concentration front. Focused fluid sampling provides an improvement of cleanup time of 11.4% and is advantageous over conventional fluid sampling in the presence of a dispersed fluid concentration front wherein fluid coning becomes dominant. The mobility contrast between formation fluid and mud filtrate plays an important role in fluid-sample quality. Increasing the viscosity contrast may help to provide better fluid-sample quality. However, we warn that in the case of gas formations invaded with OBM filtrate, the increased viscosity contrast may lead to sudden non-Darcy flow during gas breakthrough. Case No. 12: Sensitivity to movable water. In field applications, there are instances when a formation test is performed within a capillary transition zone with movable water. We consider a movable-water zone with initial saturation equal to 0.5. The objective of this case of study is to quantify the influence of mobile water in the time evolution of GOR during fluid withdrawal. Figure 21 indicates that the simulated GOR in all the probes is much lower than that of the Base Case in the presence of invasion. Fluid-sample quality deteriorates in the presence of mobile water due to the interplay of relative permeability, capillary pressure, and mud filtrate in a capillary transition zone. Figure 22 shows the simulated spatial distribution of the MC14 fluid component of OBM in the near-probe region after 5 minutes of fluid sampling. The diameter of the cone-shaped region is much smaller than that of the Base Case Model in the presence of invasion. However, we observe that when fluid flow is split into two paths, fluid coning is effective in the presence of a dispersed saturation front thereby improving the GOR by 10.1% at the end of the sampling operation.
Figure 21: Comparison of transient GOR measurements simulated with focused and conventional probes for Case No. 12. Labels “guard,” “sample,” and “conventional” identify GOR simulated at the guard probe flow line, the sample probe flow line, and the conventional probe flow line, respectively.
SAM
PLE
GU
AR
DG
UA
RD
Figure 22: Spatial distribution (radial and vertical directions) of MC14 fluid component concentration in the near-probe region after 5 minutes of fluid sampling with the focused probe for Case No. 12. The sample- and guard-line openings extend from -0.0417 ft to +0.0417 ft and -0.0833 ft to +0.0833 ft, respectively, in the vertical direction. INVERSION OF MUD-FILTRATE INVASION RATE AND PERMEABILITY FROM TRANSIENT MEASUREMENTS OF PRESSURE AND GOR Compared to conventional fluid-probe sampling, focused fluid sampling provides enhanced degrees of freedom in pressure and GOR transient measurements because it withdraws fluids through two fluid channels instead of one. Therefore, when used to estimate underlying petrophysical properties, the additional information provided by focused fluid-sampling probes should improve both the reliability and accuracy of the estimated properties. We implement a general nonlinear least-squares inversion method (Madsen et al., 2004) for the estimation of permeability, anisotropy, and rate of mud-filtrate invasion from both focused and conventional fluid-sampling probes using a two-loop minimization approach. The quadratic cost function used for the estimation (inversion) quantifies the misfit between measured and simulated transient pressure and GOR. We apply nonlinear inversion to estimate petrophysical properties associated with our Base Case Model by minimizing the cost function. Cost function: The quadratic cost function used for inversion quantifies the relative difference between simulated and measured pressure and GOR differences, and is defined as
2
1
1( ) ( ( ))2
m
ii
C e=
= ∑x x , …(2)
where m is the number of measurements and ( )ie x is the dimensionless data residual that measures the relative difference between the numerically simulated and observed measurements. There is no
SPWLA 49th Annual Logging Symposium, May 25-28, 2008
12
SPWLA 49th Annual Logging Symposium, May 25-28, 2008
13
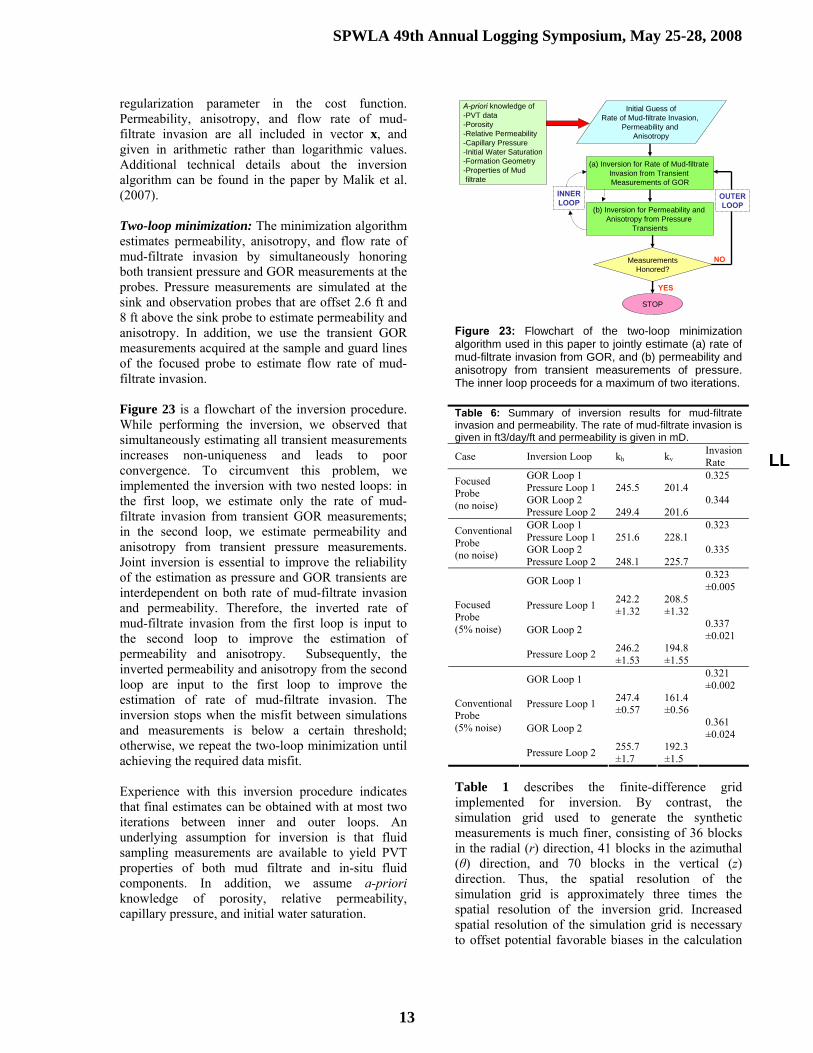
regularization parameter in the cost function. Permeability, anisotropy, and flow rate of mud-filtrate invasion are all included in vector x, and given in arithmetic rather than logarithmic values. Additional technical details about the inversion algorithm can be found in the paper by Malik et al. (2007). Two-loop minimization: The minimization algorithm estimates permeability, anisotropy, and flow rate of mud-filtrate invasion by simultaneously honoring both transient pressure and GOR measurements at the probes. Pressure measurements are simulated at the sink and observation probes that are offset 2.6 ft and 8 ft above the sink probe to estimate permeability and anisotropy. In addition, we use the transient GOR measurements acquired at the sample and guard lines of the focused probe to estimate flow rate of mud-filtrate invasion. Figure 23 is a flowchart of the inversion procedure. While performing the inversion, we observed that simultaneously estimating all transient measurements increases non-uniqueness and leads to poor convergence. To circumvent this problem, we implemented the inversion with two nested loops: in the first loop, we estimate only the rate of mud-filtrate invasion from transient GOR measurements; in the second loop, we estimate permeability and anisotropy from transient pressure measurements. Joint inversion is essential to improve the reliability of the estimation as pressure and GOR transients are interdependent on both rate of mud-filtrate invasion and permeability. Therefore, the inverted rate of mud-filtrate invasion from the first loop is input to the second loop to improve the estimation of permeability and anisotropy. Subsequently, the inverted permeability and anisotropy from the second loop are input to the first loop to improve the estimation of rate of mud-filtrate invasion. The inversion stops when the misfit between simulations and measurements is below a certain threshold; otherwise, we repeat the two-loop minimization until achieving the required data misfit. Experience with this inversion procedure indicates that final estimates can be obtained with at most two iterations between inner and outer loops. An underlying assumption for inversion is that fluid sampling measurements are available to yield PVT properties of both mud filtrate and in-situ fluid components. In addition, we assume a-priori knowledge of porosity, relative permeability, capillary pressure, and initial water saturation.
Initial Guess ofRate of Mud-filtrate Invasion,
Permeability and Anisotropy
(a) Inversion for Rate of Mud-filtrate Invasion from Transient Measurements of GOR
INNERLOOP
(b) Inversion for Permeability and Anisotropy from Pressure
Transients
MeasurementsHonored?
NO
YES
STOP
A-priori knowledge of-PVT data-Porosity-Relative Permeability-Capillary Pressure-Initial Water Saturation-Formation Geometry-Properties of Mud filtrate
OUTERLOOP
Figure 23: Flowchart of the two-loop minimization algorithm used in this paper to jointly estimate (a) rate of mud-filtrate invasion from GOR, and (b) permeability and anisotropy from transient measurements of pressure. The inner loop proceeds for a maximum of two iterations.
Table 6: Summary of inversion results for mud-filtrate invasion and permeability. The rate of mud-filtrate invasion is given in ft3/day/ft and permeability is given in mD.
Case Inversion Loop kh kv Invasion Rate
GOR Loop 1 0.325 Pressure Loop 1 245.5 201.4 GOR Loop 2 0.344
Focused Probe (no noise) Pressure Loop 2 249.4 201.6
GOR Loop 1 0.323 Pressure Loop 1 251.6 228.1 GOR Loop 2 0.335
Conventional Probe (no noise) Pressure Loop 2 248.1 225.7
GOR Loop 1 0.323 ±0.005
Pressure Loop 1 242.2 ±1.32
208.5 ±1.32
GOR Loop 2 0.337 ±0.021
Focused Probe (5% noise)
Pressure Loop 2 246.2 ±1.53
194.8 ±1.55
GOR Loop 1 0.321 ±0.002
Pressure Loop 1 247.4 ±0.57
161.4 ±0.56
GOR Loop 2 0.361 ±0.024
Conventional Probe (5% noise)
Pressure Loop 2 255.7 ±1.7
192.3 ±1.5
Table 1 describes the finite-difference grid implemented for inversion. By contrast, the simulation grid used to generate the synthetic measurements is much finer, consisting of 36 blocks in the radial (r) direction, 41 blocks in the azimuthal (θ) direction, and 70 blocks in the vertical (z) direction. Thus, the spatial resolution of the simulation grid is approximately three times the spatial resolution of the inversion grid. Increased spatial resolution of the simulation grid is necessary to offset potential favorable biases in the calculation
LL
SPWLA 49th Annual Logging Symposium, May 25-28, 2008
13
SPWLA 49th Annual Logging Symposium, May 25-28, 2008
14
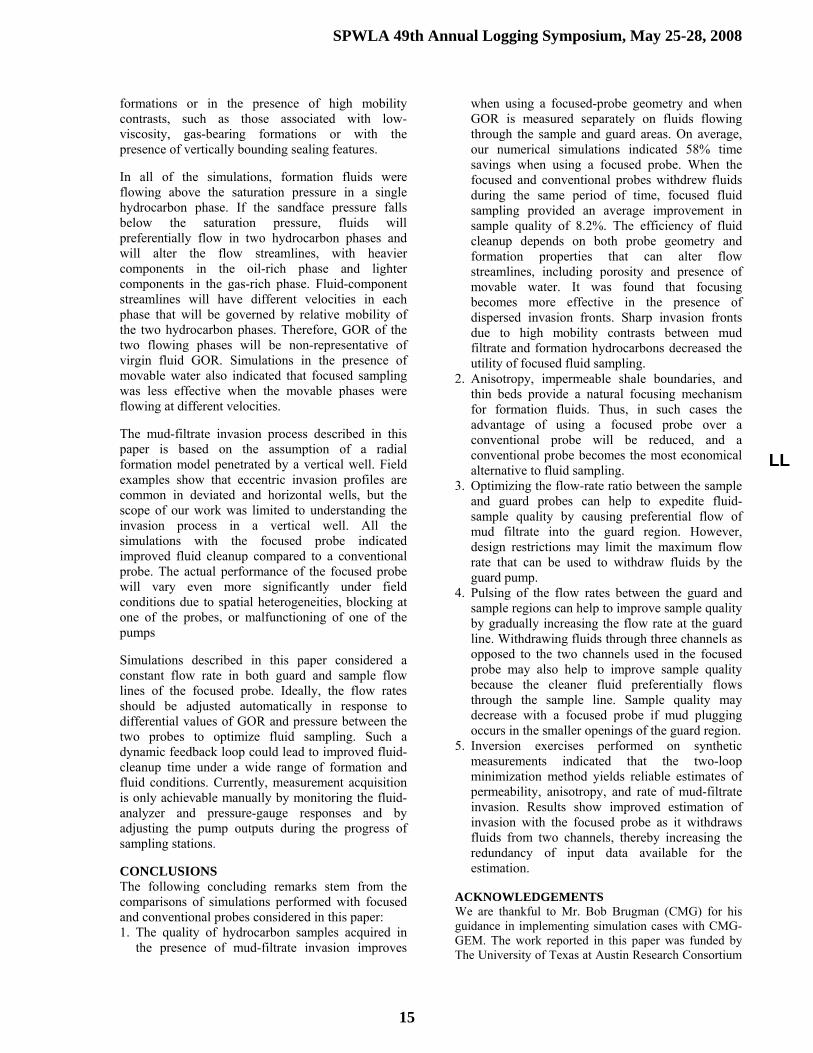
of data misfit (hence overly optimistic inversion results). Application of inversion: We applied the inversion algorithm to our Base Case Model in the presence of invasion. Table 6 summarizes the estimated properties with both noise-free and noisy synthetic measurements. The starting guess for permeability was 150 mD for both horizontal and vertical permeability, whereas the starting guess for rate of mud-filtrate invasion was 0.023 ft3/day/ft. Results show improved estimation of flow-rate of invasion with the focused probe as it withdraws fluids through two fluid channels and therefore augments the redundancy of input data available for inversion. One limitation of the compositional simulator used for inversion is that it provides only six significant decimal figures of accuracy. Because the focused probe withdraws fluids through a larger cross-sectional area compared to that of a conventional probe, the pressure differential caused by the focused probe is lower than that caused by the conventional probe. Consequently, the lower pressure differential simulated at the focused probe could increase non-uniqueness of the estimations under finite numerical accuracy. Experience shows, however, that the additional information provided by the two flow lines offsets the limitations of numerical accuracy. Figure 24 shows the sample-line GOR (left-hand panel) and the pressure drop for the sample probe (right-hand panel) at the start and end of the two-loop minimization performed with the focused probe. Both GOR and pressure transients converge toward the final noise-free minima with consecutive minimization loops. Figure 25(a) indicates that the corresponding cost function decreases as the number of iterations increases for all successive minimization loops. Convergence from GOR is faster in the second minimization loop than in the first loop because of improved estimation of the rate of mud-filtrate invasion, permeability, and anisotropy. Figure 25(b) displays the evolution of the cost function with iteration number when the inversion is performed with measurements acquired with a conventional probe. Comparison of the panels shown in Fig. 25 indicates an order of magnitude difference in the cost function for the second GOR minimization loop with the two probes. Measurements acquired with the guard and sample lines included in the focused probe improve both accuracy and reliability of the estimated formation properties by providing additional degrees of freedom to the estimation. Because the early-time pressure response is dependent on mud-filtrate
invasion, inaccurate estimation of invasion affects the reliability of permeability obtained from pressure measurements (first inner loop).
(a) (b) Figure 24: Convergence of the (noise-free) two-loop minimization algorithm applied to synthetic measurements acquired with the focused probe. Panel (a) shows the sample GOR as a function of time for different inversion loops of invasion rate. The starting guess for inversion was 0.023 ft3/ft/day and the final noise-free minimum was 0.345 ft3/ft/day. Panel (b) shows the sink probe pressure differential as a function of time for different inversion loops of permeability and anisotropy. The starting guess for inversion was 150 mD for both horizontal and vertical permeability. Final noise-free minima were 250 mD for horizontal permeability and 200 mD for vertical permeability.
(a) (b) Figure 25: Cost function as a function of iteration number for different inversion loops. Panel (a) shows the convergence of the (noise-free) two-loop minimization algorithm applied to synthetic measurements acquired with the focused probe. Panel (b) shows the convergence of the (noise-free) two-loop inversion algorithm applied to synthetic measurements acquired with the conventional probe. DISCUSSION In general, a focused probe will reduce OBM contamination in fluid samples by splitting flow streamlines into different fluid channels without compromising pumpout time. In addition, the focused probe enables efficient downhole fluid analysis by achieving lower contamination levels more rapidly. Comparison of simulated spatial distributions of mud filtrate for both focused and conventional probes (Figs. 6, 7, 9, 11, and 22) helped us to analyze the corresponding variations of fluid streamlines in the near-probe region. We conclude that focused fluid sampling is clearly advantageous over conventional sampling in the presence of dispersed fluid concentration and saturation fronts and whenever fluid coning is dominant (Figs. 11 and 22). By contrast, in the presence of a piston-like displacement front, focused sampling provides marginal time savings over conventional fluid sampling. Sharp fluid concentration fronts can arise in high-permeability
SPWLA 49th Annual Logging Symposium, May 25-28, 2008
14
SPWLA 49th Annual Logging Symposium, May 25-28, 2008
15
formations or in the presence of high mobility contrasts, such as those associated with low-viscosity, gas-bearing formations or with the presence of vertically bounding sealing features. In all of the simulations, formation fluids were flowing above the saturation pressure in a single hydrocarbon phase. If the sandface pressure falls below the saturation pressure, fluids will preferentially flow in two hydrocarbon phases and will alter the flow streamlines, with heavier components in the oil-rich phase and lighter components in the gas-rich phase. Fluid-component streamlines will have different velocities in each phase that will be governed by relative mobility of the two hydrocarbon phases. Therefore, GOR of the two flowing phases will be non-representative of virgin fluid GOR. Simulations in the presence of movable water also indicated that focused sampling was less effective when the movable phases were flowing at different velocities. The mud-filtrate invasion process described in this paper is based on the assumption of a radial formation model penetrated by a vertical well. Field examples show that eccentric invasion profiles are common in deviated and horizontal wells, but the scope of our work was limited to understanding the invasion process in a vertical well. All the simulations with the focused probe indicated improved fluid cleanup compared to a conventional probe. The actual performance of the focused probe will vary even more significantly under field conditions due to spatial heterogeneities, blocking at one of the probes, or malfunctioning of one of the pumps Simulations described in this paper considered a constant flow rate in both guard and sample flow lines of the focused probe. Ideally, the flow rates should be adjusted automatically in response to differential values of GOR and pressure between the two probes to optimize fluid sampling. Such a dynamic feedback loop could lead to improved fluid-cleanup time under a wide range of formation and fluid conditions. Currently, measurement acquisition is only achievable manually by monitoring the fluid-analyzer and pressure-gauge responses and by adjusting the pump outputs during the progress of sampling stations. CONCLUSIONS The following concluding remarks stem from the comparisons of simulations performed with focused and conventional probes considered in this paper: 1. The quality of hydrocarbon samples acquired in
the presence of mud-filtrate invasion improves
when using a focused-probe geometry and when GOR is measured separately on fluids flowing through the sample and guard areas. On average, our numerical simulations indicated 58% time savings when using a focused probe. When the focused and conventional probes withdrew fluids during the same period of time, focused fluid sampling provided an average improvement in sample quality of 8.2%. The efficiency of fluid cleanup depends on both probe geometry and formation properties that can alter flow streamlines, including porosity and presence of movable water. It was found that focusing becomes more effective in the presence of dispersed invasion fronts. Sharp invasion fronts due to high mobility contrasts between mud filtrate and formation hydrocarbons decreased the utility of focused fluid sampling.
2. Anisotropy, impermeable shale boundaries, and thin beds provide a natural focusing mechanism for formation fluids. Thus, in such cases the advantage of using a focused probe over a conventional probe will be reduced, and a conventional probe becomes the most economical alternative to fluid sampling.
3. Optimizing the flow-rate ratio between the sample and guard probes can help to expedite fluid-sample quality by causing preferential flow of mud filtrate into the guard region. However, design restrictions may limit the maximum flow rate that can be used to withdraw fluids by the guard pump.
4. Pulsing of the flow rates between the guard and sample regions can help to improve sample quality by gradually increasing the flow rate at the guard line. Withdrawing fluids through three channels as opposed to the two channels used in the focused probe may also help to improve sample quality because the cleaner fluid preferentially flows through the sample line. Sample quality may decrease with a focused probe if mud plugging occurs in the smaller openings of the guard region.
5. Inversion exercises performed on synthetic measurements indicated that the two-loop minimization method yields reliable estimates of permeability, anisotropy, and rate of mud-filtrate invasion. Results show improved estimation of invasion with the focused probe as it withdraws fluids from two channels, thereby increasing the redundancy of input data available for the estimation.
ACKNOWLEDGEMENTS We are thankful to Mr. Bob Brugman (CMG) for his guidance in implementing simulation cases with CMG-GEM. The work reported in this paper was funded by The University of Texas at Austin Research Consortium
LL
SPWLA 49th Annual Logging Symposium, May 25-28, 2008
15
SPWLA 49th Annual Logging Symposium, May 25-28, 2008
16
on Formation Evaluation, jointly sponsored by Anadarko, Aramco, Baker Atlas, BP, British Gas, ConocoPhilips, Chevron, ENI E&P, ExxonMobil, Halliburton Energy Services, Hydro, Marathon Oil Corporation, Mexican Institute for Petroleum, Occidental Petroleum Corporation, Petrobras, Schlumberger, Shell International E&P, Statoil, TOTAL, and Weatherford. REFERENCES Alpak, F.O., Elshahawi, H., Hashem, M., and Mullins, O.C.: “Compositional modeling of oil-based mud-filtrate clean-up during wireline formation tester sampling,” paper SPE 100393, presented at the SPE Annual Technical Conference & Exhibition, San Antonio, Texas, September 24-27, 2006.
Akkurt, R., Bowcock, M., Davies, J., Campo, C.D., Hill, B., Joshi, S., Kundu, D., Kumar, S., O’Keffe, M., Samir, M., Tarvin, J., Weinheber, P., Williams, S., and Zeybek, M.: “Focusing on downhole fluid sampling and analysis,” Oilfield Review, Winter 2006.
Brooks, R.H. and Corey, A.T.: “Hydraulic properties of porous media,” Hydrology Paper 3, Colorado State University, Fort Collins, Colorado, 1964.
Dong, C., Elshahawi, H., Mullins, O.C., Venkataramanan, L., Hows, M., McKinney, D., Flannery, M., and Hashem, M.: “Improved interpretation of reservoir architecture and fluid contacts through the integration of downhole fluid analysis with geochemical and mud gas analyses,” paper SPE 109683, presented at the Asia Pacific Oil and Gas Conference and Exhibition, Jakarta, Indonesia, October 30-November 1, 2007.
Hrametz, A.A., Gardner, C.C., Waid, M.C., and Proett, M.A.: “Focused formation fluid sampling probe,” U.S. Patent No. 6301959 B1, October 2001.
Kumar, S., Wheaton, S., Kundu, D., and Joshi, S.: “Wireline sampling technology enables fluid sampling without contamination,” Journal of Petroleum Technology, September 2006.
Lohrenz, J., Bray, B.G., and Clark, C.R.: “Calculating viscosity of reservoir fluids from their compositions,” Journal of Petroleum Technology, SPE 915, pp. 1171-1176, October 1964.
Madsen, K., Nielsen, H.B., and Tingleff, O.: “Methods for Non-Linear Least Squares Problems,” 2nd Edition IMM, DTU 2004.
Malik, M., Torres-Verdín, C., and Sepehrnoori, K.: “A dual grid minimization technique with application to formation testing in the presence of oil-base muds,” paper SPE 109956, presented at the SPE Annual Technical Conference & Exhibition, Anaheim, November 11-14, 2007.
Malik, M., Torres-Verdín, C., Sepehrnoori, K., Dindoruk, B., Elshahawi, H., and Hashem, M.: “History matching and sensitivity analysis of probe-type formation-tester measurements acquired in the presence of oil-base mud-filtrate invasion,” Petrophysics, v. 48, no. 6, 2007.
Mullins, O.C., Beck, G., Cribbs, M.Y., Terabayshi, T., and Kegasawa, K.: “Downhole determination of gor on single phase fluids by optical spectroscopy,” paper M, presented at the 42nd SPWLA Annual Logging Symposium, Houston, Texas, 2001.
O’Keefe, M., Eriksen, K.O., Williams, S., Stensland, D., Vasques, R.: “Focused sampling of reservoir fluids achieves undetectable levels of contamination,” paper SPE 101084, presented at the SPE Asia Pacific Oil & Gas Conference and Exhibition, Adelaide, Australia, September 11-13, 2006.
Peng, D.Y. and Robinson, D. B.: “A new two-constant equation of state,” Industrial and Engineering Chemistry Fundamentals, v. 15, no. 1, 1976.
Sherwood, J.D.: “Optimal probes for withdrawal of uncontaminated fluid samples,” Physics of Fluids, v. 17, no. 083102, pp. 1-10, 2005.
Weinheber, P. and Vasques, R.: “New formation tester probe design for low-contamination sampling,” paper Q, presented at the SPWLA 47th Annual Logging Symposium, Veracruz, Mexico, June 4-7, 2006.
Wu, J., Torres-Verdín, C., Sepehrnoori, K., and Proett, M.A.: “The influence of water-base mud properties and petrophysical parameters on mudcake growth, filtrate invasion, and formation pressure,” Petrophysics, v. 46, no. 1, pp. 14-32, 2005.
NOMENCLATURE ( )C x : Quadratic cost function, [] ( )e x : Data residual vector, []
GORguard : Guard-line GOR in the focused probe, [SCF/STB]
GORreg : Conventional-probe GOR, [SCF/STB]
GORsample : Sample-line GOR at the focused probe, [SCF/STB]
kh : Horizontal permeability, [mD] kro : Relative permeability to oil phase, [] krw : Relative permeability to water phase, [] kv : Vertical permeability, [mD] Pc : Capillary pressure, [psi]
Qguard : Flow rate at the guard line of the focused probe, [RB/day]
Qsample : Flow rate at the sample line of the focused probe, [RB/day]
r : Radial distance from the wellbore, [ft] t : Time, [hours] x : Minimization variable, [] z : Vertical distance, [ft] θ : Azimuthal direction, [radians]
SPWLA 49th Annual Logging Symposium, May 25-28, 2008
16