Embed Size (px)
Citation preview
ORIGINAL ARTICLE
Compensation for lateral drift due to crosswind in migratingEuropean Bee-eaters
Nir Sapir • Nir Horvitz • Martin Wikelski •
Roni Avissar • Ran Nathan
Received: 1 September 2012 / Revised: 11 April 2013 / Accepted: 26 February 2014
� Dt. Ornithologen-Gesellschaft e.V. 2014
Abstract Billions of seasonally migrating birds and
insects use two principal modes of flight, i.e., flapping and
soaring–gliding. Flight mode is known to have strong
effects on energy expenditure and speed of migration, yet
its influence on the migratory track has rarely been inves-
tigated. Using radio telemetry, we studied the effects of
crosswind on European Bee-eaters (Merops apiaster) dur-
ing their spring migration with respect to different flight
modes. Flapping, soaring–gliding, and mixed flight in
which the birds flapped during gliding were distinguished
by radio signals while the birds were flying en route over
southern Israel. The regional atmospheric modeling system
was applied in high spatial (1 km 9 1 km) and temporal
(5 min) resolution to estimate winds encountered aloft. We
analyzed data from 11 birds that flew over a total distance
of 810 km and found that lateral drift due to side wind did
not differ among birds engaged in different flight modes.
Overall, there was almost no effect of crosswind speed on
bird lateral speed, as the regression slope was 0.31
(indicting mild lateral drift) and the regression’s R2 was
0.01. Therefore, we conclude that migrating bee-eaters
compensated for crosswind during their spring migration
and that this response was not dependent on bird flight
mode.
Keywords Atmospheric modeling � Biotelemetry � Bird
migration � Flight mode � Merops apiaster � Wind drift
Zusammenfassung
Ziehende Bienenfresser kompensieren die durch Sei-
tenwinde verursachte seitliche Abdrift
Milliarden saisonal migrierender Vogel und Insekten be-
nutzen zwei unterschiedliche Flugtechniken, den Ruderflug
und den Segel- und Gleitflug. Es ist bekannt, dass die
Flugtechnik die Energiekosten und die Geschwindigkeit
der Zuges stark beeinflusst. Der Einfluss der Flugtechnik
auf die Migrationsroute wurde bisher jedoch kaum unter-
sucht. Mittels Radiotelemetrie haben wir den Einfluss von
Seitenwinden auf den Fruhjahrszug von Bienenfressern
(Merops apiaster) untersucht. Wahrend die Vogel uber
Sudisrael flogen, konnten Ruderflug, Segel- und Gleitflug
und Flugelschlag wahrend des Gleitfluges aufgrund der
Funksignale unterschieden werden. Das Regional Atmo-
spheric Modeling System wurde mit einer hohen raumli-
chen (250 m 9 250 m) und zeitlichen (5 Minuten)
Auflosung angewandt um die auftretenden Winde zu
N. Sapir � N. Horvitz � R. Nathan
Movement Ecology Laboratory, Department of Ecology,
Evolution and Behavior, Alexander Silberman Institute of Life
Sciences, The Hebrew University of Jerusalem, Edmond J. Safra
campus, 91904 Giv’at Ram, Jerusalem, Israel
Present Address:
N. Sapir (&)
National Natural History Collections, The Hebrew University
of Jerusalem, Edmond J. Safra Campus,
91904 Giv’at Ram, Jerusalem, Israel
e-mail: [email protected]
M. Wikelski
Max Planck Institute for Ornithology, ‘Vogelwarte Radolfzell’
Schlossallee 2, 78315 Radolfzell, Germany
M. Wikelski
Department of Biology, Konstanz University, 78315 Constance,
Germany
R. Avissar
Rosenstiel School of Marine and Atmospheric Science,
University of Miami, 4600 Rickenbacker Causeway, Miami,
FL 33149-1098, USA
123
J Ornithol
DOI 10.1007/s10336-014-1060-x
berechnen. Die Daten von elf Vogeln, die eine Gesamtst-
recke von 810 km geflogen sind, wurden von uns ana-
lysiert. Die seitliche Abdrift durch Seitenwinde unterschied
sich nicht zwischen den unterschiedlichen Flugtechniken.
Es gab insgesamt fast keinen Effekt der Geschwindigkeit
der Seitenwinde auf die Geschwindigkeit der seitlichen
Abdrift der Vogel. Die Steigung der Regressionsgerade
war 0,31 (was nur geringe seitliche Abdrift anzeigt) und R2
der Regression war 0,01. Daraus schließen wir, dass die
migrierenden Bienenfresser wahrend ihres Fruhjahrszugs
Seitenwinde kompensiert haben und dass die Flugtechnik
keinen Einfluss auf diese Kompensation hatte.
Introduction
Billions of birds and insects travel twice a year between
different locations on the globe (Williams 1957; Newton
2007). To accomplish any migratory journey, migrants
must be able to control their flight speed and energy stores
(Alerstam and Lindstrom 1990; Hedenstrom and Alerstam
1995) while progressing towards their destination. Since
their net geographical translocation during flight does not
only depend on their own movement but also on that of the
air through which they are flying, winds may profoundly
affect their flight speed and direction (Alerstam 1979;
Liechti and Bruderer 1998; Liechti 2006). Specifically,
flight in crosswinds may cause migrants to drift sideways
from their intended migration path (Richardson 1978,
1990; Green 2001; Thorup et al. 2003; Liechti 2006; but
see Cochran 1987; Chapman et al. 2008; Karlsson et al.
2010), possibly incurring energy and time costs, as well as
navigational challenges in reaching their end-of-migration
destinations (Alerstam and Hedenstrom 1998; Green
2001). To minimize the degree of lateral drift, flight may
take place only at certain times and altitudes at which the
wind is either weak or blowing from a direction that assists
the migrants in reaching their goal areas (Drake and Farrow
1988; Bruderer and Liechti 1995; Chapman et al. 2008,
2010; but see Gudmundsson et al. 2002; Pennycuick et al.
2011). However, migrating birds of various taxa are com-
monly found flying under strong crosswinds (Alerstam
1975; Richardson 1978, 1990; Cochran 1987; Green 2001;
Thorup et al. 2003; Liechti 2006; Klaassen et al. 2011).
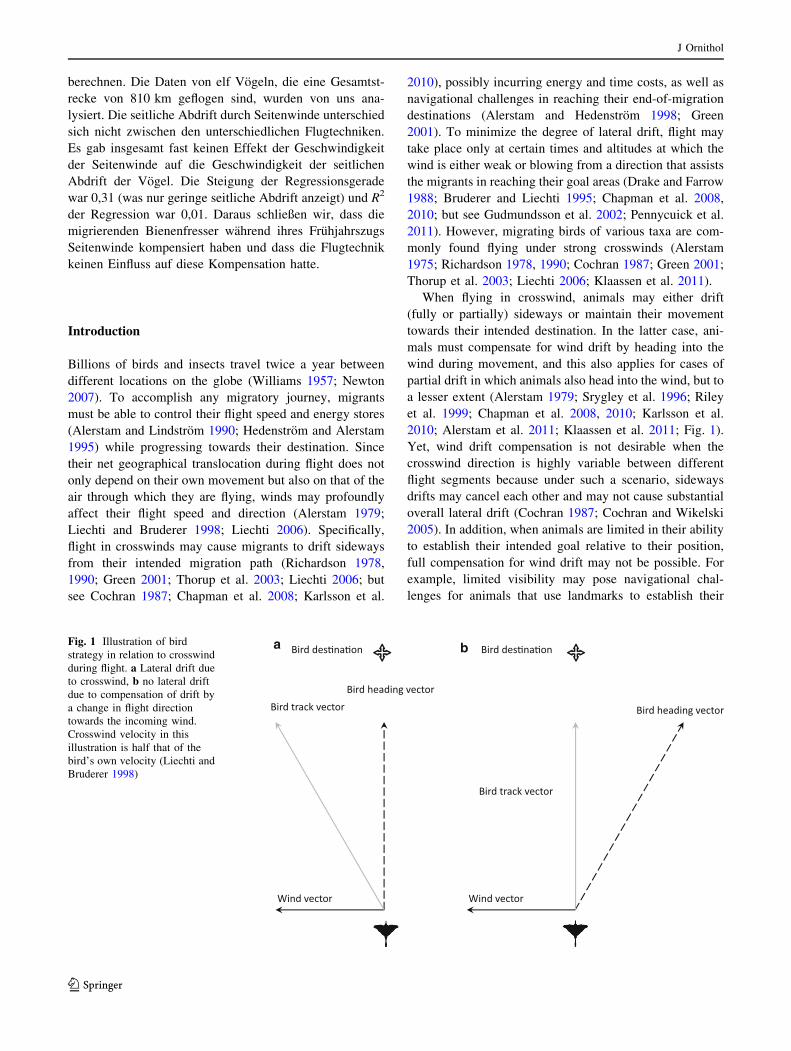
When flying in crosswind, animals may either drift
(fully or partially) sideways or maintain their movement
towards their intended destination. In the latter case, ani-
mals must compensate for wind drift by heading into the
wind during movement, and this also applies for cases of
partial drift in which animals also head into the wind, but to
a lesser extent (Alerstam 1979; Srygley et al. 1996; Riley
et al. 1999; Chapman et al. 2008, 2010; Karlsson et al.
2010; Alerstam et al. 2011; Klaassen et al. 2011; Fig. 1).
Yet, wind drift compensation is not desirable when the
crosswind direction is highly variable between different
flight segments because under such a scenario, sideways
drifts may cancel each other and may not cause substantial
overall lateral drift (Cochran 1987; Cochran and Wikelski
2005). In addition, when animals are limited in their ability
to establish their intended goal relative to their position,
full compensation for wind drift may not be possible. For
example, limited visibility may pose navigational chal-
lenges for animals that use landmarks to establish their
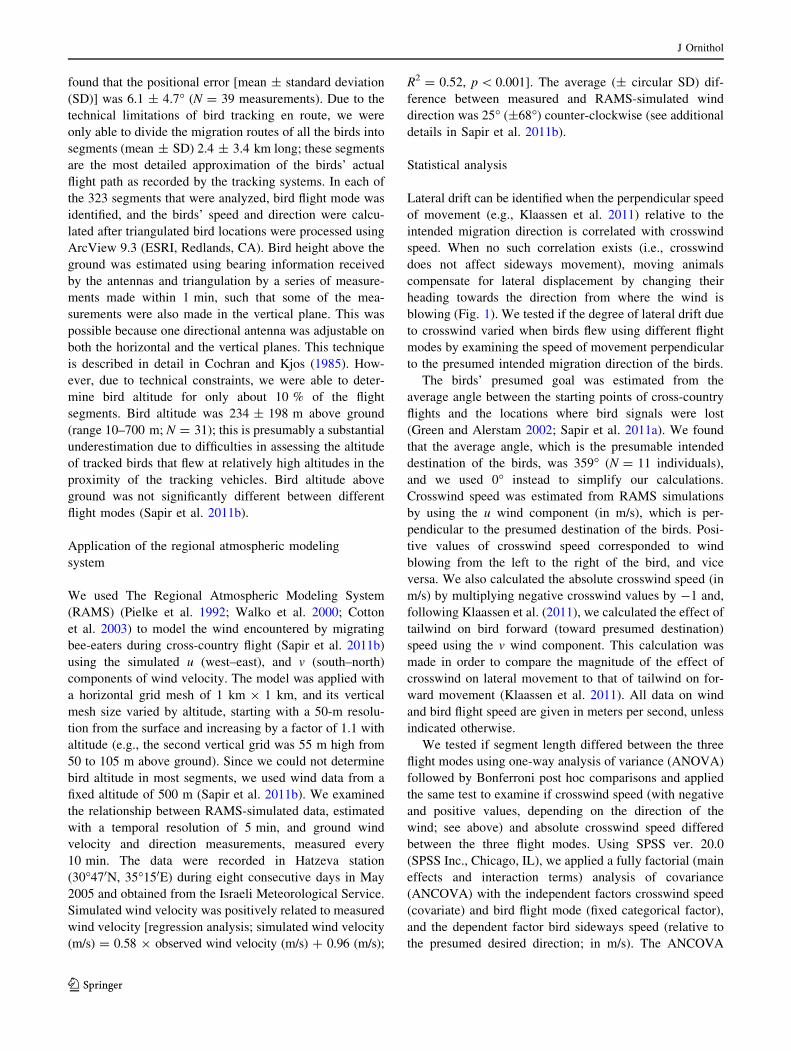
baFig. 1 Illustration of bird
strategy in relation to crosswind
during flight. a Lateral drift due
to crosswind, b no lateral drift
due to compensation of drift by
a change in flight direction
towards the incoming wind.
Crosswind velocity in this
illustration is half that of the
bird’s own velocity (Liechti and
Bruderer 1998)
J Ornithol
123
location (Richardson 1978, 1990). Indeed, flying animals
have been found to substantially drift sideways under a
dearth of landmarks (Alerstam 1975; Srygley 2001; Sryg-
ley and Dudley 2008).
Bird and butterfly migrants are known to use two prin-
cipal modes of flight, i.e., flapping and soaring–gliding
(Gibo and Pallett 1979; Alerstam 1990; Pennycuick 2008).
During flapping, thrust is produced by wing movements,
while during soaring–gliding, horizontal progress is
achieved mostly by descending (i.e., gliding) after the
animal has ascended by exploiting updrafts (i.e., soaring),
such that soaring–gliding can be described as a repeated
cycle which involves circling in a thermal to climb and
then losing height in a straight glide (Pennycuick 1972;
Pennycuick et al. 1979; Shamoun-Baranes and van Loon
2006; Bohrer et al. 2012; Duerr et al. 2012). Empirical
findings suggest that soaring–gliding is energetically less
demanding than flapping (Baudinette and Schmidt-Nielsen
1974; Bevan et al. 1995; Sapir et al. 2010), presumably at
the expense of being overall slower (Pennycuick 1972;
Hedenstrom 1993; but see Sapir et al. 2010). To date, the
influence of animal flight mode on the migratory track has
rarely been investigated (but see Duerr et al. 2012 for a
comparison between soaring–gliding and slope–soaring
flight modes). We suggest that animals engaging in dif-
ferent flight modes may respond differently to crosswind
because different flight modes involve specific flight
mechanisms, altitudinal range (Pennycuick 1972; Sha-
moun-Baranes et al. 2006; Duerr et al. 2012), and direc-
tionality (e.g., soaring flight involves spiral circling while
flight direction is usually constant during flapping).
Moreover, each flight mode usually takes place under
certain atmospheric conditions (Shamoun-Baranes et al.
2006; Sapir et al. 2011b; Bohrer et al. 2012). Specifically
for migrating bird species employing flapping flight, wind
speed was found to negatively affect flight altitude (Sha-
moun-Baranes et al. 2006; Thomas et al. 2011), possibly
because wind speed is lower near the surface due to friction
(Stull 1988), and flapping birds may actively select to
move close to the surface in order to reduce the negative
influence of both headwinds and crosswinds. Indeed, under
strong headwinds and crosswinds, migrating European
Bee-eaters fly very close (approx. 1 m) to the ground using
flapping flight (N. Sapir, personal observation). However,
flight close to the ground may limit visibility of landmarks
during flight, possibly restricting the birds’ ability to
compensate for lateral drift.
To explore the relationship between lateral drift due to
crosswind and bird flight mode, we tracked European Bee-
eaters (Merops apiaster) in southern Israel during their
spring migration. European Bee-eaters are long-distance
migrants that breed in southern Europe and southwestern
Asia and spend the winter in sub-Saharan Africa. Using
portable radio telemetry systems, we were able to distin-
guish between flight modes based on radio signals and to
measure bird movement en route (Cochran 1972, 1975,
1987; Cochran et al. 2008; Sapir et al. 2010, 2011b). To
estimate the wind encountered aloft, we applied a detailed
numerical atmospheric model (Pielke et al. 1992; Sapir
et al. 2011b). We hypothesized that lateral drift due to
crosswind is conditioned by flight mode and predicted that
birds incur a higher degree of drift during flapping com-
pared with soaring–gliding during which bee-eaters may
fully compensate for the effects of crosswind.
Materials and methods
Species and study area
The European Bee-eater (Merops apiaster) is a long-dis-
tance migrant that feeds on flying insects. It is known to
use both flapping and soaring–gliding flight during
migration (Fry 1984; Sapir et al. 2010, 2011a, b). We
trapped migrating bee-eaters (mean body mass 56.3 g)
during the springs of 2005 and 2006 at Eilat (29�340N34�580E) and Grofit (29�560N 34�040E), located 40 km
apart in the southern part of the arid Arava Valley in Israel.
Bird tracking and flight mode determination
Following trapping and ringing, each bird was fitted with a
1-g transmitter (1.8 % of the average body mass of the
birds; model SP2000-HR, Sparrow Systems, Fisher, IL)
according to the procedure described elsewhere (Cochran
and Wikelski 2005; Sapir et al. 2011a). The transmitter
continuously emitted radio signals in the 605-MHz band
that was frequency modulated by flight muscle potentials
(Lord et al. 1962; Cochran et al. 2008; Sapir et al. 2010).
Null reception was evident when the position of the
transmitter was 0� and 180� relative to the receiving
antenna (Cochran 1975; Sapir et al. 2010). We identified
bird flight mode (flapping, mixed flight, or soaring–gliding)
based on wing flap and null reception patterns, as specified
in Sapir et al. (2011b); direct observations of feather-tipped
marked birds during tracking corroborated this distinction.
We followed the birds using two vehicle-mounted radio
telemetry systems, as described in Sapir et al. (2010,
2011a). Triangulation was employed to determine bird
location using the Global Positioning System (GPS) time
stamp that was synchronized between the GPS devices
found in the two vehicles, allowing a maximal time interval
during which location was triangulated of 1 min. We
measured the error of the directional bearing of the tracking
systems using blind measurements to transmitters that were
located 0.5–11 km away from the tracking vehicles and
J Ornithol
123
found that the positional error [mean ± standard deviation
(SD)] was 6.1 ± 4.7� (N = 39 measurements). Due to the
technical limitations of bird tracking en route, we were
only able to divide the migration routes of all the birds into
segments (mean ± SD) 2.4 ± 3.4 km long; these segments
are the most detailed approximation of the birds’ actual
flight path as recorded by the tracking systems. In each of
the 323 segments that were analyzed, bird flight mode was
identified, and the birds’ speed and direction were calcu-
lated after triangulated bird locations were processed using
ArcView 9.3 (ESRI, Redlands, CA). Bird height above the
ground was estimated using bearing information received
by the antennas and triangulation by a series of measure-
ments made within 1 min, such that some of the mea-
surements were also made in the vertical plane. This was
possible because one directional antenna was adjustable on
both the horizontal and the vertical planes. This technique
is described in detail in Cochran and Kjos (1985). How-
ever, due to technical constraints, we were able to deter-
mine bird altitude for only about 10 % of the flight
segments. Bird altitude was 234 ± 198 m above ground
(range 10–700 m; N = 31); this is presumably a substantial
underestimation due to difficulties in assessing the altitude
of tracked birds that flew at relatively high altitudes in the
proximity of the tracking vehicles. Bird altitude above
ground was not significantly different between different
flight modes (Sapir et al. 2011b).
Application of the regional atmospheric modeling
system
We used The Regional Atmospheric Modeling System
(RAMS) (Pielke et al. 1992; Walko et al. 2000; Cotton
et al. 2003) to model the wind encountered by migrating
bee-eaters during cross-country flight (Sapir et al. 2011b)
using the simulated u (west–east), and v (south–north)
components of wind velocity. The model was applied with
a horizontal grid mesh of 1 km 9 1 km, and its vertical
mesh size varied by altitude, starting with a 50-m resolu-
tion from the surface and increasing by a factor of 1.1 with
altitude (e.g., the second vertical grid was 55 m high from
50 to 105 m above ground). Since we could not determine
bird altitude in most segments, we used wind data from a
fixed altitude of 500 m (Sapir et al. 2011b). We examined
the relationship between RAMS-simulated data, estimated
with a temporal resolution of 5 min, and ground wind
velocity and direction measurements, measured every
10 min. The data were recorded in Hatzeva station
(30�470N, 35�150E) during eight consecutive days in May
2005 and obtained from the Israeli Meteorological Service.
Simulated wind velocity was positively related to measured
wind velocity [regression analysis; simulated wind velocity
(m/s) = 0.58 9 observed wind velocity (m/s) ? 0.96 (m/s);
R2 = 0.52, p \ 0.001]. The average (± circular SD) dif-
ference between measured and RAMS-simulated wind
direction was 25� (±68�) counter-clockwise (see additional
details in Sapir et al. 2011b).
Statistical analysis
Lateral drift can be identified when the perpendicular speed
of movement (e.g., Klaassen et al. 2011) relative to the
intended migration direction is correlated with crosswind
speed. When no such correlation exists (i.e., crosswind
does not affect sideways movement), moving animals
compensate for lateral displacement by changing their
heading towards the direction from where the wind is
blowing (Fig. 1). We tested if the degree of lateral drift due
to crosswind varied when birds flew using different flight
modes by examining the speed of movement perpendicular
to the presumed intended migration direction of the birds.
The birds’ presumed goal was estimated from the
average angle between the starting points of cross-country
flights and the locations where bird signals were lost
(Green and Alerstam 2002; Sapir et al. 2011a). We found
that the average angle, which is the presumable intended
destination of the birds, was 359� (N = 11 individuals),
and we used 0� instead to simplify our calculations.
Crosswind speed was estimated from RAMS simulations
by using the u wind component (in m/s), which is per-
pendicular to the presumed destination of the birds. Posi-
tive values of crosswind speed corresponded to wind
blowing from the left to the right of the bird, and vice
versa. We also calculated the absolute crosswind speed (in
m/s) by multiplying negative crosswind values by -1 and,
following Klaassen et al. (2011), we calculated the effect of
tailwind on bird forward (toward presumed destination)
speed using the v wind component. This calculation was
made in order to compare the magnitude of the effect of
crosswind on lateral movement to that of tailwind on for-
ward movement (Klaassen et al. 2011). All data on wind
and bird flight speed are given in meters per second, unless
indicated otherwise.
We tested if segment length differed between the three
flight modes using one-way analysis of variance (ANOVA)
followed by Bonferroni post hoc comparisons and applied
the same test to examine if crosswind speed (with negative
and positive values, depending on the direction of the
wind; see above) and absolute crosswind speed differed
between the three flight modes. Using SPSS ver. 20.0
(SPSS Inc., Chicago, IL), we applied a fully factorial (main
effects and interaction terms) analysis of covariance
(ANCOVA) with the independent factors crosswind speed
(covariate) and bird flight mode (fixed categorical factor),
and the dependent factor bird sideways speed (relative to
the presumed desired direction; in m/s). The ANCOVA
J Ornithol
123
model was followed by a linear regression to estimate the
slope of the relationship between crosswind speed and bird
sideways speed. We similarly applied an ANCOVA with
the independent factors tailwind speed (covariate) and bird
flight-mode (fixed categorical factor) and the dependent
factor bird forward speed. All tests were two sided with
critical a = 0.05. Data are reported as mean ± SD unless
otherwise noted.
Results
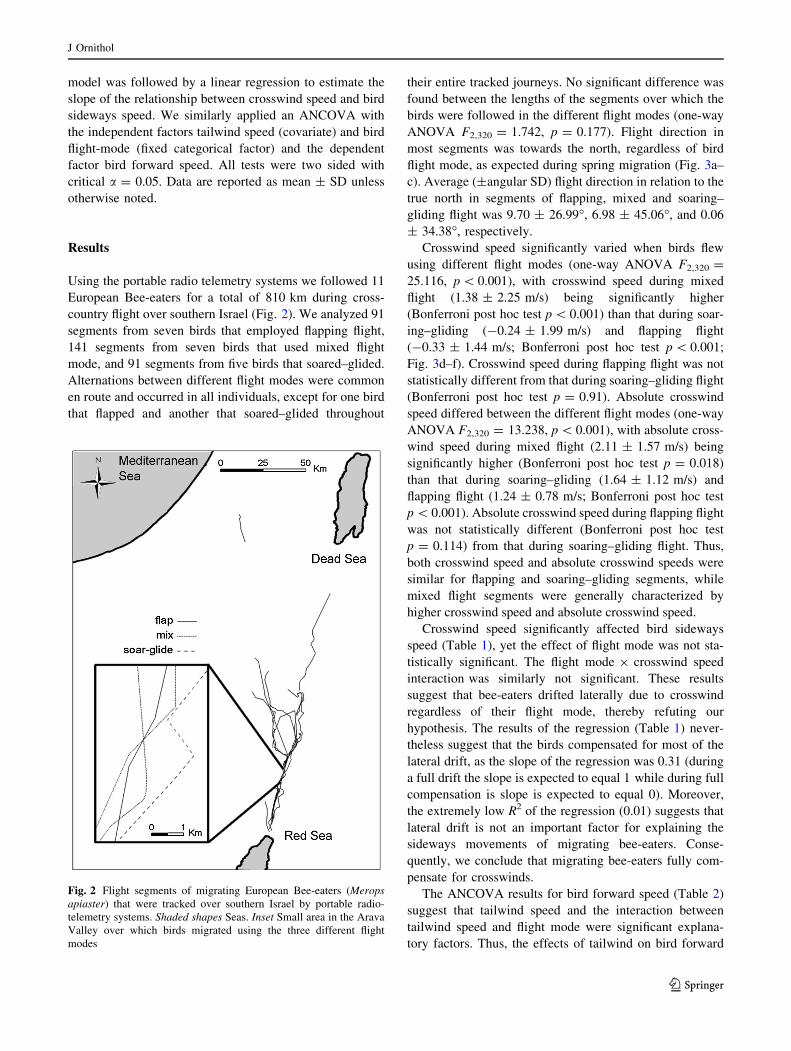
Using the portable radio telemetry systems we followed 11
European Bee-eaters for a total of 810 km during cross-
country flight over southern Israel (Fig. 2). We analyzed 91
segments from seven birds that employed flapping flight,
141 segments from seven birds that used mixed flight
mode, and 91 segments from five birds that soared–glided.
Alternations between different flight modes were common
en route and occurred in all individuals, except for one bird
that flapped and another that soared–glided throughout
their entire tracked journeys. No significant difference was
found between the lengths of the segments over which the
birds were followed in the different flight modes (one-way
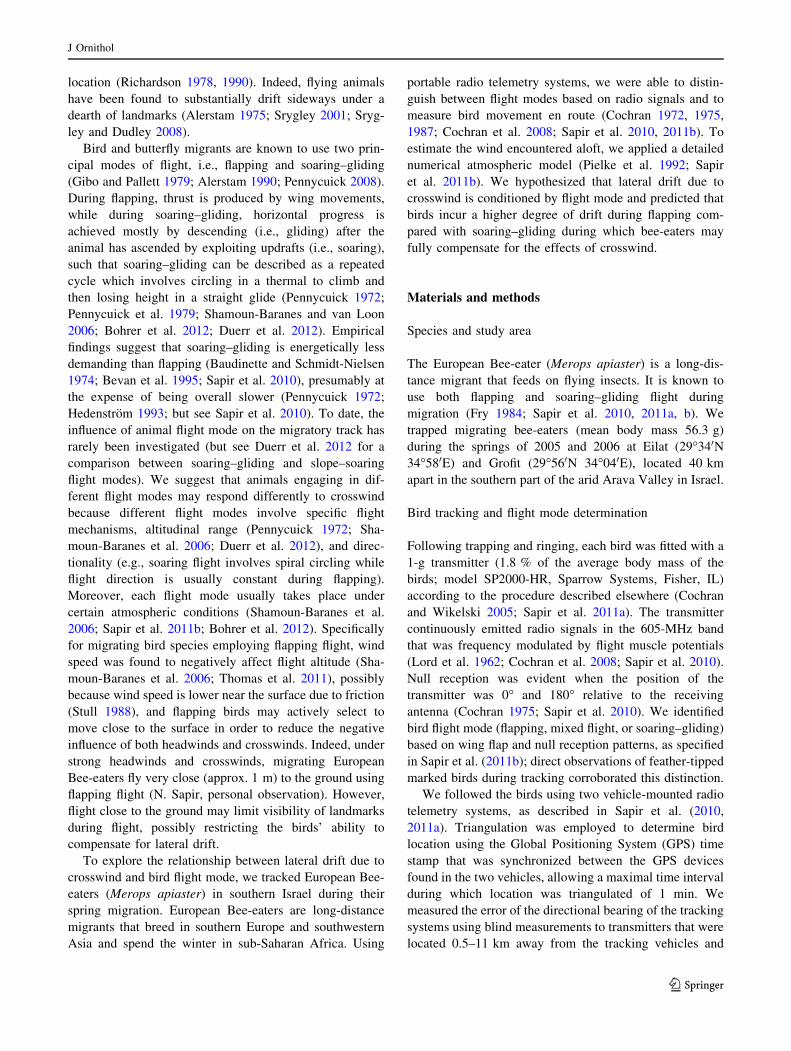
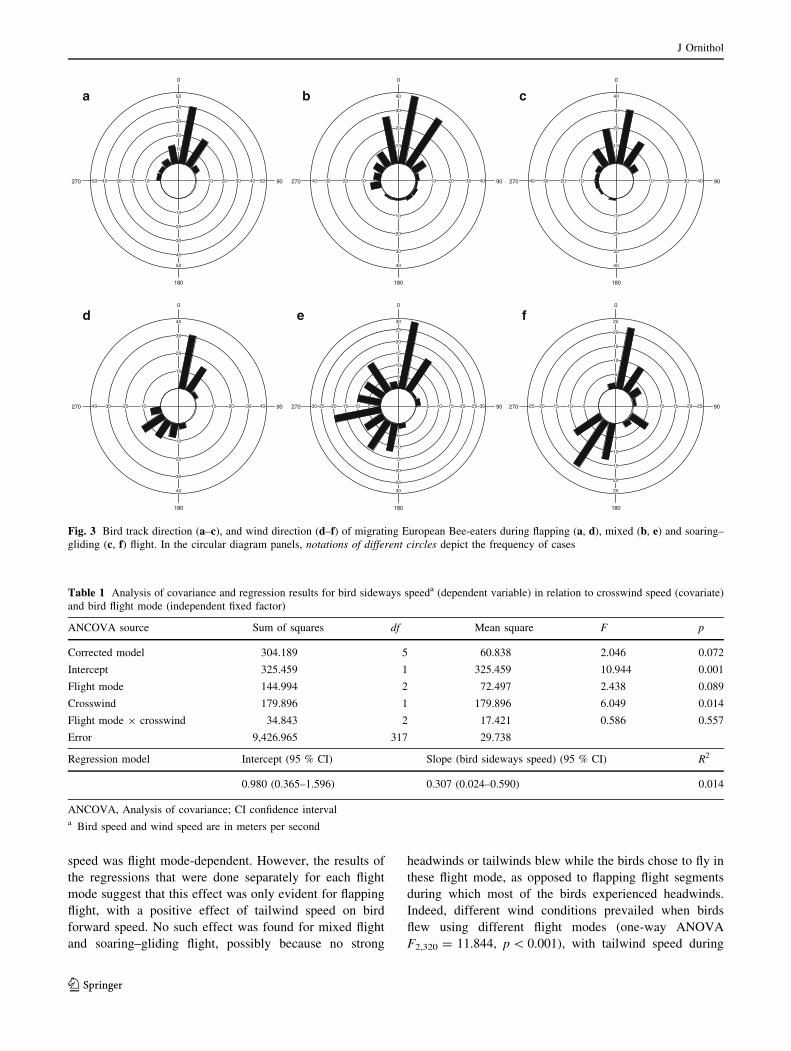
ANOVA F2,320 = 1.742, p = 0.177). Flight direction in
most segments was towards the north, regardless of bird
flight mode, as expected during spring migration (Fig. 3a–
c). Average (±angular SD) flight direction in relation to the
true north in segments of flapping, mixed and soaring–
gliding flight was 9.70 ± 26.99�, 6.98 ± 45.06�, and 0.06
± 34.38�, respectively.
Crosswind speed significantly varied when birds flew
using different flight modes (one-way ANOVA F2,320 =
25.116, p \ 0.001), with crosswind speed during mixed
flight (1.38 ± 2.25 m/s) being significantly higher
(Bonferroni post hoc test p \ 0.001) than that during soar-
ing–gliding (-0.24 ± 1.99 m/s) and flapping flight
(-0.33 ± 1.44 m/s; Bonferroni post hoc test p \ 0.001;
Fig. 3d–f). Crosswind speed during flapping flight was not
statistically different from that during soaring–gliding flight
(Bonferroni post hoc test p = 0.91). Absolute crosswind
speed differed between the different flight modes (one-way
ANOVA F2,320 = 13.238, p \ 0.001), with absolute cross-
wind speed during mixed flight (2.11 ± 1.57 m/s) being
significantly higher (Bonferroni post hoc test p = 0.018)
than that during soaring–gliding (1.64 ± 1.12 m/s) and
flapping flight (1.24 ± 0.78 m/s; Bonferroni post hoc test
p \ 0.001). Absolute crosswind speed during flapping flight
was not statistically different (Bonferroni post hoc test
p = 0.114) from that during soaring–gliding flight. Thus,
both crosswind speed and absolute crosswind speeds were
similar for flapping and soaring–gliding segments, while
mixed flight segments were generally characterized by
higher crosswind speed and absolute crosswind speed.
Crosswind speed significantly affected bird sideways
speed (Table 1), yet the effect of flight mode was not sta-
tistically significant. The flight mode 9 crosswind speed
interaction was similarly not significant. These results
suggest that bee-eaters drifted laterally due to crosswind
regardless of their flight mode, thereby refuting our
hypothesis. The results of the regression (Table 1) never-
theless suggest that the birds compensated for most of the
lateral drift, as the slope of the regression was 0.31 (during
a full drift the slope is expected to equal 1 while during full
compensation is slope is expected to equal 0). Moreover,
the extremely low R2 of the regression (0.01) suggests that
lateral drift is not an important factor for explaining the
sideways movements of migrating bee-eaters. Conse-
quently, we conclude that migrating bee-eaters fully com-
pensate for crosswinds.
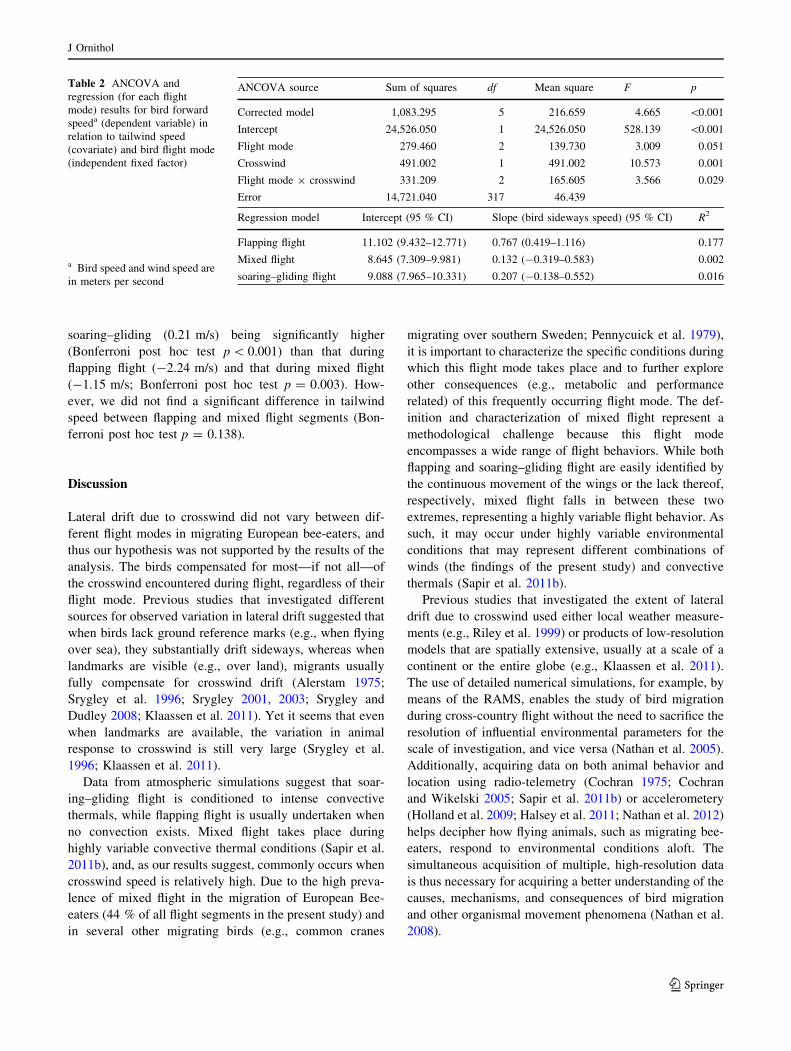
The ANCOVA results for bird forward speed (Table 2)
suggest that tailwind speed and the interaction between
tailwind speed and flight mode were significant explana-
tory factors. Thus, the effects of tailwind on bird forward
Fig. 2 Flight segments of migrating European Bee-eaters (Merops
apiaster) that were tracked over southern Israel by portable radio-
telemetry systems. Shaded shapes Seas. Inset Small area in the Arava
Valley over which birds migrated using the three different flight
modes
J Ornithol
123
speed was flight mode-dependent. However, the results of
the regressions that were done separately for each flight
mode suggest that this effect was only evident for flapping
flight, with a positive effect of tailwind speed on bird
forward speed. No such effect was found for mixed flight
and soaring–gliding flight, possibly because no strong
headwinds or tailwinds blew while the birds chose to fly in
these flight mode, as opposed to flapping flight segments
during which most of the birds experienced headwinds.
Indeed, different wind conditions prevailed when birds
flew using different flight modes (one-way ANOVA
F2,320 = 11.844, p \ 0.001), with tailwind speed during
50 50
50
50
40 40
40
40
30 30
30
30
20 20
20
20
10 10
10
10
0
90
180
270 40 40
40
40
30 30
30
30
20 20
20
20
10 10
10
10
0
90
180
270 40 40
40
40
30 30
30
30
20 20
20
20
10 10
10
10
0
90
180
270
40 40
40
40
30 30
30
30
20 20
20
20
10 10
10
10
0
90
180
270 30 30
30
30
25 25
25
25
20 20
20
20
15 15
15
15
10 10
10
10
5 5
5
5
0
90
180
270 25 25
25
25
20 20
20
20
15 15
15
15
10 10
10
10
5 5
5
5
0
90
180
270
a
d
b
e
c
f
Fig. 3 Bird track direction (a–c), and wind direction (d–f) of migrating European Bee-eaters during flapping (a, d), mixed (b, e) and soaring–
gliding (c, f) flight. In the circular diagram panels, notations of different circles depict the frequency of cases
Table 1 Analysis of covariance and regression results for bird sideways speeda (dependent variable) in relation to crosswind speed (covariate)
and bird flight mode (independent fixed factor)
ANCOVA source Sum of squares df Mean square F p
Corrected model 304.189 5 60.838 2.046 0.072
Intercept 325.459 1 325.459 10.944 0.001
Flight mode 144.994 2 72.497 2.438 0.089
Crosswind 179.896 1 179.896 6.049 0.014
Flight mode 9 crosswind 34.843 2 17.421 0.586 0.557
Error 9,426.965 317 29.738
Regression model Intercept (95 % CI) Slope (bird sideways speed) (95 % CI) R2
0.980 (0.365–1.596) 0.307 (0.024–0.590) 0.014
ANCOVA, Analysis of covariance; CI confidence intervala Bird speed and wind speed are in meters per second
J Ornithol
123
soaring–gliding (0.21 m/s) being significantly higher
(Bonferroni post hoc test p \ 0.001) than that during
flapping flight (-2.24 m/s) and that during mixed flight
(-1.15 m/s; Bonferroni post hoc test p = 0.003). How-
ever, we did not find a significant difference in tailwind
speed between flapping and mixed flight segments (Bon-
ferroni post hoc test p = 0.138).
Discussion
Lateral drift due to crosswind did not vary between dif-
ferent flight modes in migrating European bee-eaters, and
thus our hypothesis was not supported by the results of the
analysis. The birds compensated for most—if not all—of
the crosswind encountered during flight, regardless of their
flight mode. Previous studies that investigated different
sources for observed variation in lateral drift suggested that
when birds lack ground reference marks (e.g., when flying
over sea), they substantially drift sideways, whereas when
landmarks are visible (e.g., over land), migrants usually
fully compensate for crosswind drift (Alerstam 1975;
Srygley et al. 1996; Srygley 2001, 2003; Srygley and
Dudley 2008; Klaassen et al. 2011). Yet it seems that even
when landmarks are available, the variation in animal
response to crosswind is still very large (Srygley et al.
1996; Klaassen et al. 2011).
Data from atmospheric simulations suggest that soar-
ing–gliding flight is conditioned to intense convective
thermals, while flapping flight is usually undertaken when
no convection exists. Mixed flight takes place during
highly variable convective thermal conditions (Sapir et al.
2011b), and, as our results suggest, commonly occurs when
crosswind speed is relatively high. Due to the high preva-
lence of mixed flight in the migration of European Bee-
eaters (44 % of all flight segments in the present study) and
in several other migrating birds (e.g., common cranes
migrating over southern Sweden; Pennycuick et al. 1979),
it is important to characterize the specific conditions during
which this flight mode takes place and to further explore
other consequences (e.g., metabolic and performance
related) of this frequently occurring flight mode. The def-
inition and characterization of mixed flight represent a
methodological challenge because this flight mode
encompasses a wide range of flight behaviors. While both
flapping and soaring–gliding flight are easily identified by
the continuous movement of the wings or the lack thereof,
respectively, mixed flight falls in between these two
extremes, representing a highly variable flight behavior. As
such, it may occur under highly variable environmental
conditions that may represent different combinations of
winds (the findings of the present study) and convective
thermals (Sapir et al. 2011b).
Previous studies that investigated the extent of lateral
drift due to crosswind used either local weather measure-
ments (e.g., Riley et al. 1999) or products of low-resolution
models that are spatially extensive, usually at a scale of a
continent or the entire globe (e.g., Klaassen et al. 2011).
The use of detailed numerical simulations, for example, by
means of the RAMS, enables the study of bird migration
during cross-country flight without the need to sacrifice the
resolution of influential environmental parameters for the
scale of investigation, and vice versa (Nathan et al. 2005).
Additionally, acquiring data on both animal behavior and
location using radio-telemetry (Cochran 1975; Cochran
and Wikelski 2005; Sapir et al. 2011b) or accelerometery
(Holland et al. 2009; Halsey et al. 2011; Nathan et al. 2012)
helps decipher how flying animals, such as migrating bee-
eaters, respond to environmental conditions aloft. The
simultaneous acquisition of multiple, high-resolution data
is thus necessary for acquiring a better understanding of the
causes, mechanisms, and consequences of bird migration
and other organismal movement phenomena (Nathan et al.
2008).
Table 2 ANCOVA and
regression (for each flight
mode) results for bird forward
speeda (dependent variable) in
relation to tailwind speed
(covariate) and bird flight mode
(independent fixed factor)
a Bird speed and wind speed are
in meters per second
ANCOVA source Sum of squares df Mean square F p
Corrected model 1,083.295 5 216.659 4.665 \0.001
Intercept 24,526.050 1 24,526.050 528.139 \0.001
Flight mode 279.460 2 139.730 3.009 0.051
Crosswind 491.002 1 491.002 10.573 0.001
Flight mode 9 crosswind 331.209 2 165.605 3.566 0.029
Error 14,721.040 317 46.439
Regression model Intercept (95 % CI) Slope (bird sideways speed) (95 % CI) R2
Flapping flight 11.102 (9.432–12.771) 0.767 (0.419–1.116) 0.177
Mixed flight 8.645 (7.309–9.981) 0.132 (-0.319–0.583) 0.002
soaring–gliding flight 9.088 (7.965–10.331) 0.207 (-0.138–0.552) 0.016
J Ornithol
123
Acknowledgments We would like to thank Reuven Yosef, Tzadok
Tzemah, William W. Cochran, Itzik Simhayof, Ofir Altstein, David
Troupin, Yitzhak Mahrer, Adi Ben-Nun, Erica Kim, and members of
the tracking teams and Movement Ecology Laboratory for their
assistance. We thank the Israeli Meteorological Service and especially
Amos Porat for providing the meteorological measurements and
related information. We thank Thomas Alerstam for his constructive
comments on a previous version of the manuscript. This work was
supported by the US–Israel Binational Science Foundation (grant no.
229/2002 & 124/2004), the Ring Foundation for Environmental
Research, and the Robert Szold Fund for Applied Science. N.S. was
supported by two Rieger–JNF fellowships and a Fulbright doctoral
dissertation travel fellowship.
Conflict of interest None.
Ethical standard Bird trapping permits were obtained from the
Israeli Nature and Parks Authority (permits 2005/22055,
2006/25555), and the experimental procedure was approved by the
Animal Care and Use Committee of the Hebrew University of Jeru-
salem (permit NS–06–07–2).
References
Alerstam T (1975) Crane Grus grus migration over sea and land. Ibis
117:489–495
Alerstam T (1979) Wind as selective agent in bird migration. Ornis
Scand 10:76–93
Alerstam T (1990) Bird migration. Cambridge University Press,
Cambridge
Alerstam T, Hedenstrom A (1998) The development of bird migration
theory. J Avian Biol 29:343–369
Alerstam T, Lindstrom A (1990) Optimal bird migration: the relative
importance of time, energy, and safety. In: Gwinner E (ed) Bird
migration: the physiology and ecophysiology. Springer, Berlin,
pp 331–351
Alerstam T, Chapman JW, Backman J, Smith AD, Karlsson H,
Nilsson C, Reynolds DR, Klaassen RHG, Hill JK (2011)
Convergent patterns of long-distance nocturnal migration in
noctuid moths and passerine birds. Proc R Soc Lond B
278:1339–1346. doi:10.1098/rspb.2010.2106
Baudinette RV, Schmidt-Nielsen K (1974) Energy cost of gliding
flight in herring gulls. Nature 248:83–84
Bevan RM, Butler PJ, Woakes AJ, Prince PA (1995) The energy
expenditure of free-ranging black-browed albatrosses. Phil Trans
R Soc Lond B 350:119–131
Bohrer G, Brandes D, Mandel JT, Bildstein KL, Miller TA, Lanzone
M, Katzner T, Maisonneuve C, Tremblay JA (2012) Estimating
updraft velocity components over large spatial scales: contrast-
ing migration strategies of golden eagles and turkey vultures.
Ecol Lett 15:96–103
Bruderer B, Liechti F (1995) Variation in density and height
distribution of nocturnal migration in the south of Israel. Isr J
Zool 4:477–487
Chapman JW, Reynolds DR, Mouritsen H, Hill JK, Riley JR, Sivell
D, Smith AD, Woiwod IP (2008) Wind selection and drift
compensation optimize migratory pathways in a high-flying
moth. Curr Biol 18:514–518
Chapman JW, Nesbit RL, Burgin LE, Reynolds DR, Smith AD,
Middleton DR, Hill JK (2010) Flight orientation behaviors
promote optimal migration trajectories in high-flying insects.
Science 327:682–685
Cochran WW (1972) Long-distance tracking of birds. In: Galler SR,
Schmidt-Koenig K, Jacobs GJ, Belleville RE (eds) Animal
orientation and navigation. NASA, Washington, DC, pp 39–59
Cochran WW (1975) Following a migrating peregrine from Wiscon-
sin to Mexico. Hawk Chalk 14:28–37
Cochran WW (1987) Orientation and other migratory behaviors of a
Swainson’s thrush followed for 1500 km. Anim Behav
35:927–929
Cochran WW, Kjos CG (1985) Wind drift and migration of thrushes:
a telemetry study. Ill Nat Hist Surv Bull 33:297–330
Cochran WW, Wikelski M (2005) Individual migratory tactics of New
World Catharus thrushes: current knowledge and future tracking
options from space. In: Marra P, Greenberg R (eds) Birds of two
worlds. Smithsonian Press, Washington DC, pp 274–289
Cochran WW, Bowlin MS, Wikelski M (2008) Wingbeat frequency
and flap-pause ratio during natural migratory flight in thrushes.
Integ Comp Biol 48:134–151
Cotton WR, Pielke RA, Walko RL, Liston GE, Tremback CJ, Jiang
H, McAnelly RL, Harrington JY, Nicholls ME, Carrio GG,
McFadden JP (2003) RAMS 2001: current status and future
directions. Meteorol Atmos Phys 82:5–29
Drake VA, Farrow RA (1988) The influence of atmospheric structure
and motions on insect migration. Annu Rev Entomol 33:183–210
Duerr AE, Miller TA, Lanzone M, Brandes D, Cooper J, O’Malley K,
Maisonneuve C, Tremblay J, Katzner T (2012) Testing an
emerging paradigm in migration ecology shows surprising
differences in efficiency between flight modes. PLoS One
7:e35548
Fry CH (1984) The Bee-eaters. T. and A. D. Poyser, Calton
Gibo DL, Pallett MJ (1979) Soaring flight of monarch butterflies,
Danaus plexippus (Lepidoptera, Danaidae), during the late
summer migration in southern Ontario. Can J Zool
57:1393–1401
Green M (2001) Is wind drift in migrating barnacle and brent geese,
Branta leucopsis and Branta bernica, adaptive or non-adaptive?
Behav Ecol Sociobiol 50:45–54
Green M, Alerstam T (2002) The problem of estimating wind drift in
migrating birds. J Theor Biol 218:485–496
Gudmundsson GA, Alerstam T, Green M, Hedenstrom A (2002)
Radar observations of Arctic bird migration at the Northwest
Passage, Canada. Arctic 55:21–43
Halsey LG, Shepard ELC, Wilson RP (2011) Assessing the devel-
opment and application of the accelerometry technique for
estimating energy expenditure. Comp Biochem Physiol A
158:305–314
Hedenstrom A (1993) Migration by soaring or flapping flight in birds:
the relative importance of energy cost and speed. Phil Trans R
Soc Lond B 342:353–361
Hedenstrom A, Alerstam T (1995) Optimal flight speed of birds. Phil
Trans R Soc Lond B 348:471–487
Holland RA, Wikelski M, Kummeth F, Bosque C (2009) The secret
life of oilbirds: new insights into the movement ecology of a
unique avian frugivore. PLoS One 4:e8264
Karlsson H, Henningsson P, Backman J, Hedenstrom A, Alerstam T
(2010) Compensation for wind drift by migrating swifts. Anim
Behav 80:399–404
Klaassen RHG, Hake M, Strandberg R, Alerstam T (2011) Geo-
graphical and temporal flexibility in the response to crosswinds
by migrating raptors. Proc R Soc Lond B 278:1339–1346
Liechti F (2006) Birds: blowin’ by the wind? J Ornithol 147:202–211
Liechti F, Bruderer B (1998) The relevance of wind for optimal
migration theory. J Avian Biol 29:561–568
Lord RD, Bellrose FC, Cochran WW (1962) Radio telemetry of the
respiration of a flying duck. Science 137:39–40
Nathan R, Sapir N, Trakhtenbrot A, Katul GG, Bohrer G, Otte M,
Avissar R, Soons MB, Horn HS, Wikelski M, Levin SA (2005)
Long-distance biological transport processes through the air: can
nature’s complexity be unfolded in silico? Divers Distrib
11:131–137
J Ornithol
123
Nathan R, Getz WM, Revilla E, Holyoak M, Kadmon R, Saltz D,
Smouse PE (2008) A movement ecology paradigm for unifying
organismal movement research. Proc Natl Acad Sci USA
105:19052–19059
Nathan R, Spiegel O, Fortmann-Roe S, Harel R, Wikelski M, Getz
WM (2012) Using tri-axial acceleration data to identify behav-
ioral modes of free-ranging animals: general concepts and tools
illustrated for griffon vultures. J Exp Biol 215:986–996
Newton I (2007) The migration ecology of birds. Academic Press,
London
Pennycuick CJ (1972) Soaring behaviour and performance of some
East African birds observed from a motorglider. Ibis
114:178–218
Pennycuick CJ (2008) Modelling the flying bird. Elsevier/Academic
Press, Amsterdam
Pennycuick CJ, Alerstam T, Larsson B (1979) Soaring migration of
the common crane Grus grus observed by radar and from an
aircraft. Ornis Scand 10:241–251
Pennycuick CJ, Griffin L, Colhoun K, Angwin R (2011) A trial of a
non-statistical computer program for monitoring fuel reserves,
response to wind and other details from GPS tracks of migrating
geese. J Ornithol 152:87–99
Pielke RA, Cotton WR, Walko RL, Tremback CJ, Lyons WA, Grasso
LD, Nicholls ME, Moran MD, Wesley DA, Lee TJ, Copeland JH
(1992) A comprehensive meteorological modeling system—
RAMS. Meteorol Atmos Phys 49:69–91
Richardson WJ (1978) Timing and amount of bird migration in
relation to weather: a review. Oikos 30:224–272
Richardson WJ (1990) Timing and amount of bird migration in
relation to weather: updated review. In: Gwinner E (ed) Bird
migration: the physiology and ecophysiology. Springer, Berlin,
pp 78–101
Riley JR, Reynolds DR, Smith AD, Edwards AS, Osborne JL,
Williams IH, McCartney HA (1999) Compensation for wind
drift by bumble-bees. Nature 400:126
Sapir N, Wikelski M, McCue MD, Pinshow B, Nathan R (2010)
Flight modes in migrating European Bee-eaters: heart rate may
indicate low metabolic rate during soaring and gliding. PLoS
One 5:e13956
Sapir N, Wikelski M, Avissar R, Nathan R (2011a) Timing and flight
mode of departure in migrating European Bee-eaters in relation
to multi-scale meteorological processes. Behav Ecol Sociobiol
65:1353–1365
Sapir N, Horvitz N, Wikelski M, Avissar R, Mahrer Y, Nathan R
(2011b) Migration by soaring or flapping: numerical atmospheric
simulations reveal that turbulence kinetic energy dictates bee-
eater flight mode. Proc R Soc B 278:3380–3386
Shamoun-Baranes J, van Loon E (2006) Energetic influence on gull
flight strategy selection. J Exp Biol 209:3489–3498
Shamoun-Baranes J, van Loon E, van Gasteren H, van Belle J, Bouten
W, Buurma L (2006) A comparative analysis of the influence of
weather on the flight altitudes of birds. Bull Am Meteorol Soc
87:47–61
Srygley RB (2001) Compensation for fluctuations in crosswind drift
without stationary landmarks in butterflies migrating over seas.
Anim Behav 61:191–203
Srygley RB (2003) Wind drift compensation in migrating dragonflies
Pantala (Odonata : libellulidae). J Insect Behav 16:217–232
Srygley RB, Dudley R (2008) Optimal strategies for insects migrating
in the flight boundary layer: mechanisms and consequences.
Integ Comp Biol 48:119–133
Srygley RB, Oliveira EG, Dudley R (1996) Wind drift compensation,
flyways, and conservation of diurnal, migrant Neotropical
Lepidoptera. Proc R Soc Lond B 263:1351–1357
Stull RB (1988) An introduction to boundary layer meteorology.
Kluwer Academic, Dordrecht
Thomas PJ, Labrosse AK, Pomeroy AC, Otter KA (2011) Effects of
weather on avian migration at proposed ridgeline wind energy
sites. J Wildl Manage 75:805–815
Thorup K, Alerstam T, Hake M, Kjellen N (2003) Bird orientation:
compensation for wind drift in migrating raptors is age
dependent. Proc R Soc Lond B 270:S8–S11
Walko RL, Band LE, Baron J, Kittel TGF, Lammers R, Lee TJ, Ojima
D, Pielke RA, Taylor C, Tague C, Tremback CJ, Vidale PL
(2000) Coupled atmosphere-biophysics-hydrology models for
environmental modeling. J Appl Meteorol 39:931–944
Williams CB (1957) Insect migration. Ann Rev Entomol 2:163–180
J Ornithol
123