Embed Size (px)
Citation preview

J Nondestruct Eval (2016) 35:58DOI 10.1007/s10921-016-0374-4
Compensation of the Skin Effect in Low-Frequency PotentialDrop Measurements
J. Corcoran1 · P. B. Nagy1,2
Received: 3 May 2016 / Accepted: 22 September 2016 / Published online: 6 October 2016© The Author(s) 2016. This article is published with open access at Springerlink.com
Abstract Potential drop measurements are routinely used inthe non-destructive evaluation of component integrity. Poten-tial drop measurements use either direct current (DC) oralternating current (AC), the latter will have superior noiseperformance due to the ability to perform phase sensitivedetection and the reduction of flicker noise. AC measure-ments are however subject to the skin effect where thecurrent is electromagnetically constricted to the surface ofthe component. Unfortunately, the skin effect is a functionof magnetic permeability, which in ferromagnetic materialsis sensitive to a number of parameters including stress andtemperature, and consequently in-situ impedance measure-ments are likely to be unstable. It has been proposed thatquasi-DC measurements, which benefit from superior noiseperformance, but also tend to the skin-effect independentDC measurement, be adopted for in-situ creep measurementsfor power station components. Unfortunately, the quasi-DCmeasurement will only tend to the DC distribution and there-fore some remnant sensitivity to the skin effect will remain.This paper will present a correction for situations where theremnant sensitivity to the skin effect is not adequately sup-pressed by using sufficiently low frequency; the applicationof particular interest being the in-situ monitoring of the creepstrain of power station components. The correction uses themeasured phase angle to approximate the influence of theskin effect and allow recovery of the DC-asymptotic valueof the resistance. The basis of the correction, that poten-
B J. [email protected]
1 Department of Mechanical Engineering, Imperial CollegeLondon, London SW7 2AZ, UK
2 Department of Aerospace Engineering and EngineeringMechanics, University of Cincinnati, Cincinnati,OH 45221-0070, USA
tial drop measurements are minimum phase is presented andillustrated on two cases; the creep strain sensor of practicalinterest and a conducting rod as another common case toillustrate generality. The correction is demonstrated experi-mentally on a component where the skin effect is manipulatedby application of a range of elastic stresses.
Keywords Potential drop · ACPD · DCPD · Skin effect ·Creep monitoring · Minimum phase
1 Introduction
Potential drop (PD) measurements have been in frequentuse for non-destructive evaluation (NDE) inspection [1,2]and for fundamental material studies [3–5] for decades. Fourelectrodes are connected to the surface of a conducting com-ponent, current is injected through two of the electrodes whilethe potential difference is monitored across the remainingtwo electrodes, the electrical transfer impedance is then cal-culated. Usually resistance, the real part of impedance, is usedto infer changes in geometry arising from component strain[6,7] or defect growth [8–10], or less frequently changes inelectrical conductivity [11,12].
Potential drop measurements are broadly categoriseddepending on the use of alternating or direct current (AC andDC respectively), the choice of which depends on the util-isation of the skin-effect. In AC measurements the currentis electromagnetically constricted to the surface of the com-ponent, restricting the region that is interrogated. The skineffect results in an exponentially decreasing current densitywith depth. The electromagnetic skin-depth, δ, the depth atwhich the current density is 1/e (∼37 %) of its surface den-sity, is given by the equation,
123
58 Page 2 of 12 J Nondestruct Eval (2016) 35 :58
δ = 1√σπ f μ
, (1)
where σ is the electrical conduictivity, f is the current fre-quency and μ is the magnetic permeability of the component.
The NDE application of particular interest is the potentialdrop creep strain sensor for use in high-temperature, high-pressure, static power station components [6,7,13]. A squareconfiguration of electrodes is permanently attached to the sur-face of a component. As the electrodes move together with thesurface, when the component strains the changing distancesbetween the electrodes will alter the measured resistance.In ferromagnetic materials, which are very common acrossa wide range of engineering applications, including powerstation pipework, the magnetic permeability is a functionof many different parameters including temperature, stress,thermal history, cold work and alloy composition [14]. Themagnetic permeability is therefore expected to change sig-nificantly during operation, influencing the skin-depth in ACmeasurements and subsequently undermining the stability ofthe impedance.
The skin effect must therefore be suppressed in order toachieve stable measurements in ferromagnetic materials. Fig-ure 1 shows the current distributions for two illustrative casesat a range of frequencies. At very low, quasi-DC frequenciesthe skin depth will be large and therefore the current pene-tration depth will be limited by geometry instead of the skineffect. In the illustrations of Fig. 1, as the skin depth increases,eventually the current penetration will be limited by (a) thecomponent thickness or (b) the electrode separation, the cur-rent distribution will tend to the DC-case. The frequency atwhich the skin depth equals the current limiting dimension,a, will be referred to as the transition frequency, fT .
a ≡ 1√fTπμσ
, (2)
or equivalently,
fT ≡ 1
a2πσμ. (3)
The transition frequency divides the AC and DC-like behav-iour with a transitional regime. At low, ‘quasi-DC’ frequen-cies below the transition frequency the current penetrationwill no longer be dictated by the skin effect but rather geom-etry and therefore tend to the DC current distribution. It willtherefore become increasingly insensitive to the changes inmagnetic permeability that would otherwise undermine themeasurement stability. At high frequencies, above the tran-sition frequency, the current penetration does not penetratedeep enough to be influenced by geometry resulting in ACbehaviour. In order to suppress the skin-effect the inspec-tion frequency should be below the transition frequency; the
lower the frequency the more it will tend to the DC case andthe less remnant sensitivity will remain.
There is a distinct advantage of using very low frequencyAC as opposed to DC, which is inherently insensitive tothe skin effect. For equivalent current magnitudes AC mea-surements have a greater signal-to-noise ratio (SNR) dueto the increase in resistance from the constriction of theavailable cross section to current flow resulting from theskin effect. However, even in the present case where thecurrent distribution is approximately equal to the DC dis-tribution, the SNR is superior due to the ability to utilisephase sensitive detection using lock-in amplifiers. Further,DC measurements are susceptible to spurious thermoelec-tric signals and significant random noise due to flicker, or‘1/f’ noise, which exhibits a noise power density that isinversely proportional to frequency [16]. An example pream-plifier noise density frequency spectrum is shown in Fig.2 to illustrate this issue. The data shown is for a Stan-ford Research SR560, this preamplifier was not used in thisstudy but is included as illustrative of the performance ofa commercially available preamplifier. Typically injectioncurrents of the order of 10 A must be used to produceDC voltage differences that can be measured with a suffi-cient signal-to-noise ratio, especially on larger components[1,17]. An alternative approach has been proposed, wherebylow frequency AC measurements are utilised. AC measure-ments allow phase-sensitive detection and with increasingfrequency a reduction in flicker noise. With reference to Fig.2, in this case increasing the inspection frequency from 1to 10 Hz reduces the noise density from 30 to 5.5 nV/
√Hz.
As the noise is random, a 5.5-fold reduction of the noisedensity permits a 30-fold reduction in measurement energyconsumption (either power or averaging time), illustratingthe benefit of adopting as high a frequency as possible. Typi-cally, at quasi-DC frequencies 100 mA is sufficient to provideadequate SNR’s.
A compromise is a quasi-DC measurement, the inspectionfrequency should be as low as possible in order to suppressthe skin effect, but should also be sufficiently high to reduceflicker noise. Unfortunately, quasi-DC readings will onlytend towards a DC-asymptote and some remnant sensitiv-ity to changes in the skin effect will result.
This paper proposes a correction of the spurious changes inthe resistive real part of impedance by using the phase angle, ausually superfluous by-product of the measurement. There isa unique relationship between magnitude and phase at a givenfrequency which allows for conversion between the two, theincrease in resistance due to the skin effect can thereforebe approximated from the phase measurement allowing forit to be compensated and permitting recovery of the DC-asymptotic resistance.
The correction has been developed for the purpose ofcreep strain measurements; changes in the skin depth will
123

J Nondestruct Eval (2016) 35 :58 Page 3 of 12 58
(a) (b)
i)
vi)
0
0.2
0.4
0.6
0.8
1
0 5 10 15 20
Nor
mal
ised
Cur
rent
Den
sity
Depth Through Component [mm]
Normalised Frequency = 0.1 1 3 10 100
0
0.2
0.4
0.6
0.8
1
0 5 10 15 20
Nor
mal
ised
Cur
rent
Den
sity
Depth Through Component [mm]
Normalised Frequency=0.1 1 3 10 100
Fig. 1 Finite element simulation results obtained using Comsol [15].Current distributions in a 100 mm×100 mm× 20 mm block with rel-ative magnetic permeability of 1 and conductivity of 100 % IACS.Column a current is injected from the centre of one edge to the other.Column b current is injected between two points separated by 10 mm on
the surface of the component. (i) shows an illustration of the two cases.(ii)–(v) Streamlines show the current path for a range of frequencies.(vi) The current density is plotted as a function of distance from bottomof component. The current density is normalised to its maximum (at thehighest inspection frequency)
invariably arise in these ferromagnetic components due tochanges in stress, temperature and thermal ageing. The cor-rection is however potentially more widely applicable, as willbe illustrated by demonstrating its application to the canon-ical case of a conducting rod.
A prerequisite for the correction to be applicable is thatthe system is minimum phase and it is shown that both theconducting rod and a conducting half space (approximat-ing the creep problem) satisfy this requirement. An ad-hocapproximation is then presented which provides a practical
123

58 Page 4 of 12 J Nondestruct Eval (2016) 35 :58
Fig. 2 Noise performance of the Stanford Research Systems SR560low-noise preamplifier [18]. This is not the preamplifier used in theexperimental work of this paper but is included as a representative exam-ple
means of implementing the correction. The correction isdemonstrated experimentally on a room temperature tensiletest component, with the magnetic permeability deliberatelymanipulated by applying elastic strain.
2 Minimum Phase Systems
Two potential drop measurement arrangements are shown inFig. 3, (a) a slender conducting rod and (b) a square electrode
configuration on the surface of a conducting half-space. Theformer is included in this paper for illustrative purposes asa familiar application (the rod behaviour will tend towardsthat of a wire as the normalised diameter decreases) and thelatter is the application of particular interest.
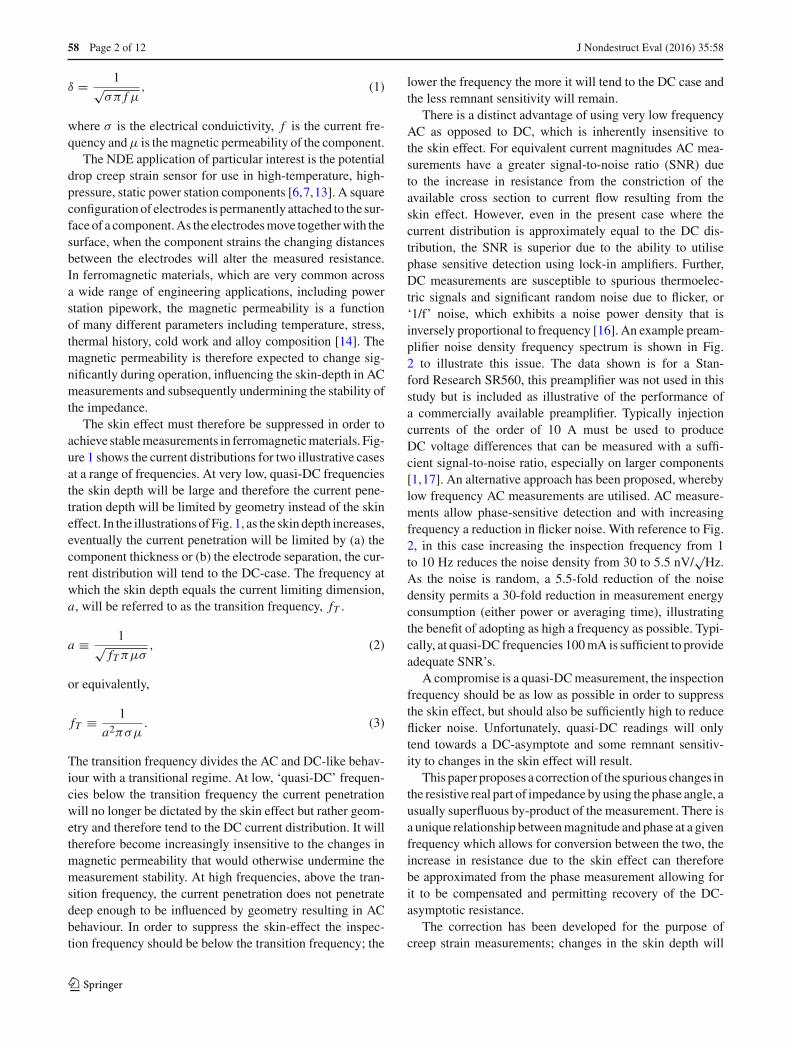
The two configurations shown in Fig. 3 have exactanalytical solutions for the frequency dependent compleximpedance, as will be discussed in more detail in Sect. 2.The magnitude and phase responses are shown in Fig. 4.At quasi-DC frequencies, in the case of the slender rod thecurrent will be distributed uniformly over the whole crosssection of radius, ar , and in the case of the square electrodeconfiguration on a conducting half-space, the current will notpenetrate far beyond half an electrode separation, ae/2. Thelimiting dimensions dictating the transition frequency of Eqs.2 and 3 are therefore ar and ae/2 respectively.
Two distinct regimes are evident, high-frequency AC andlow-frequency DC asymptotic behaviour, joined by a transi-tional regime that is of interest in the present paper. At lowfrequencies the magnitude tends to the DC-asymptotic valueand 0 phase while at high frequencies, the magnitude of thecomplex impedance becomes approximately proportional tothe square root of frequency while the phase asymptoticallyapproaches π/4.
Minimum phase systems are causal and stable [19]. Thefeature of minimum phase systems that will be exploitedin this paper is that the relationship between magnitude and
Fig. 3 Schematics showingtwo potential drop measurementarrangements, a a slender rodand b a square electrodeconfiguration on a conductinghalf-space
123
J Nondestruct Eval (2016) 35 :58 Page 5 of 12 58
Fig. 4 Impedance frequencyresponse of the twomeasurement configurationsshown in Fig. 3
Normalised Frequency [f/f T ]10-2 100 102
Mag
nitu
de [Z
/ZD
C]
100
101
Normalised Frequency [f/f T]100
Phas
e [R
adia
ns]
0
0.2
0.4
0.6
0.8
Giacolletto - Cylindrical Conducting Rod
Bowler - Square configuration of electrodes on conducting half-space
phase provides unique solutions. As quasi-DC potential dropreadings are minimum phase it means that spurious changesin the real part arising from the skin effect can be estimatedand therefore compensated using the phase angle.
A useful property of minimum phase systems is that thephase and the natural logarithm of the magnitude form aHilbert-transform pair [19]
arg [K (ω)] = ϕ (ω) = −H{ln (|K (ω)|)}, (4)
where H is the Hilbert transform and K (ω) is the transferfunction of the system.
The Hilbert transform can be used to show that theimpedance resulting from AC potential drop measurementsare also minimum phase. While this is only shown for twogeometries in this paper the authors believe this is true foralternating current potential drop (ACPD) measurements ingeneral. This feature can be exploited to infer the magnitudechange by using a Hilbert transform of the phase, therebyrecovering the DC-asymptotic value from measurements athigher frequencies. The phase change arising from the skin-effect can therefore be used to quantify and compensatespurious changes in the real, resistive part.
The two potential drop measurement arrangements dis-cussed in the introduction have established analytical solu-tions enabling the numerical demonstration that they areminimum phase using the Hilbert transform. The solutionsalso provide an analytical basis for the validation of the ad-hoc phase based correction.
The frequency response of impedance (without the self-impedance term) in a slender rod conductor is given byGiacoletto [20]
Z (k)
RDC= kar J0 (kar )
2J1(kar ), (5)
where k is equal to (1 − i)/δ and ar is the rod radius. J0 andJ1 are zero- and first-order Bessel function of the first kind,respectively.
The frequency response of a rectangular electrode config-uration on the surface of a conducting half space is derivedfrom the series expansion approximation provided by Bowler[21].
Z (k)
RDC= 1 +
1√1+1/γ 2
∑∞n=1
(−ikae/2γ
√1+1/γ 2
)n+1
n(n+1)! − ∑∞n=1
(−ikae/2γ )n+1
n(n+1)!(
1 − 1√1+1/γ 2
) ,
(6)
where ae is the electrode separation between the currentinjecting electrodes and γ is the aspect ratio of the rectangleformed by the electrodes a2 =ae/γ .
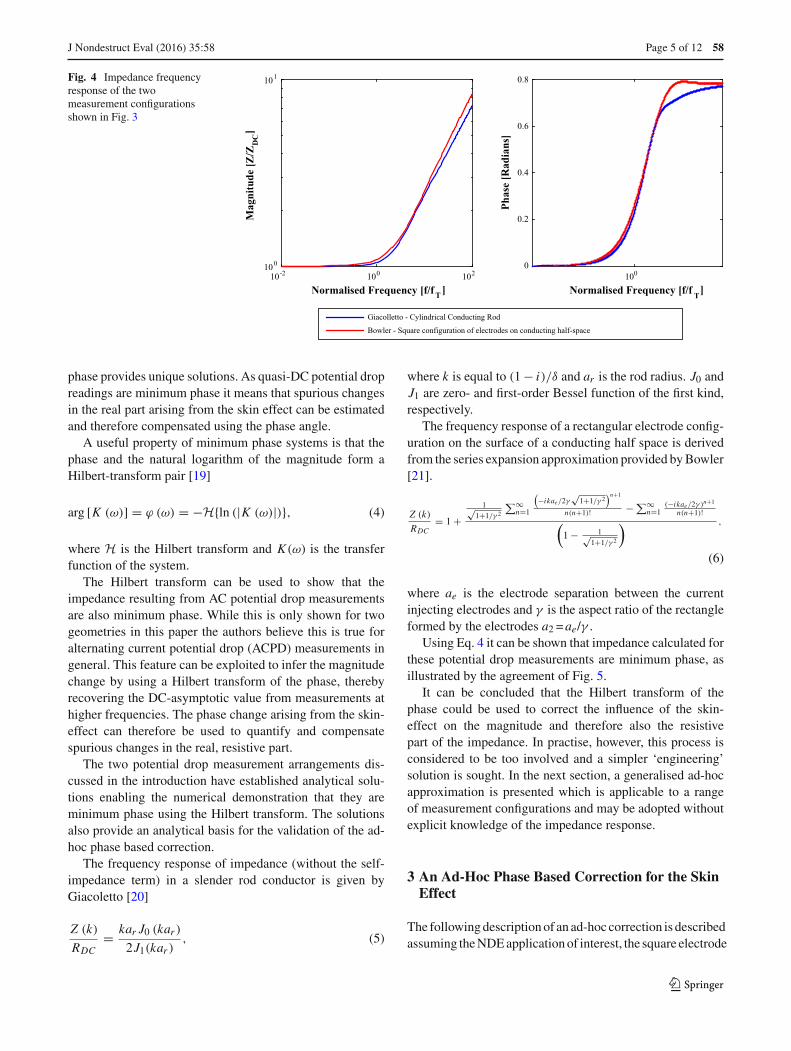
Using Eq. 4 it can be shown that impedance calculated forthese potential drop measurements are minimum phase, asillustrated by the agreement of Fig. 5.
It can be concluded that the Hilbert transform of thephase could be used to correct the influence of the skin-effect on the magnitude and therefore also the resistivepart of the impedance. In practise, however, this process isconsidered to be too involved and a simpler ‘engineering’solution is sought. In the next section, a generalised ad-hocapproximation is presented which is applicable to a rangeof measurement configurations and may be adopted withoutexplicit knowledge of the impedance response.
3 An Ad-Hoc Phase Based Correction for the SkinEffect
The following description of an ad-hoc correction is describedassuming the NDE application of interest, the square electrode
123
58 Page 6 of 12 J Nondestruct Eval (2016) 35 :58
Normalised Frequency [f/f T]
10-2 10-1 100 101Phas
e, H
ilber
t Tra
nsfo
rm A
ppro
xim
atio
n [R
adia
ns]
0
0.1
0.2
0.3
0.4
0.5
0.6
0.7
0.8
0.9
1
Giacoletto - Cylindrical Conducting RodHilbert Transform ApproximationBowler - Square configuration of electrodes on conducting half-spaceHilbert Transform Approximation
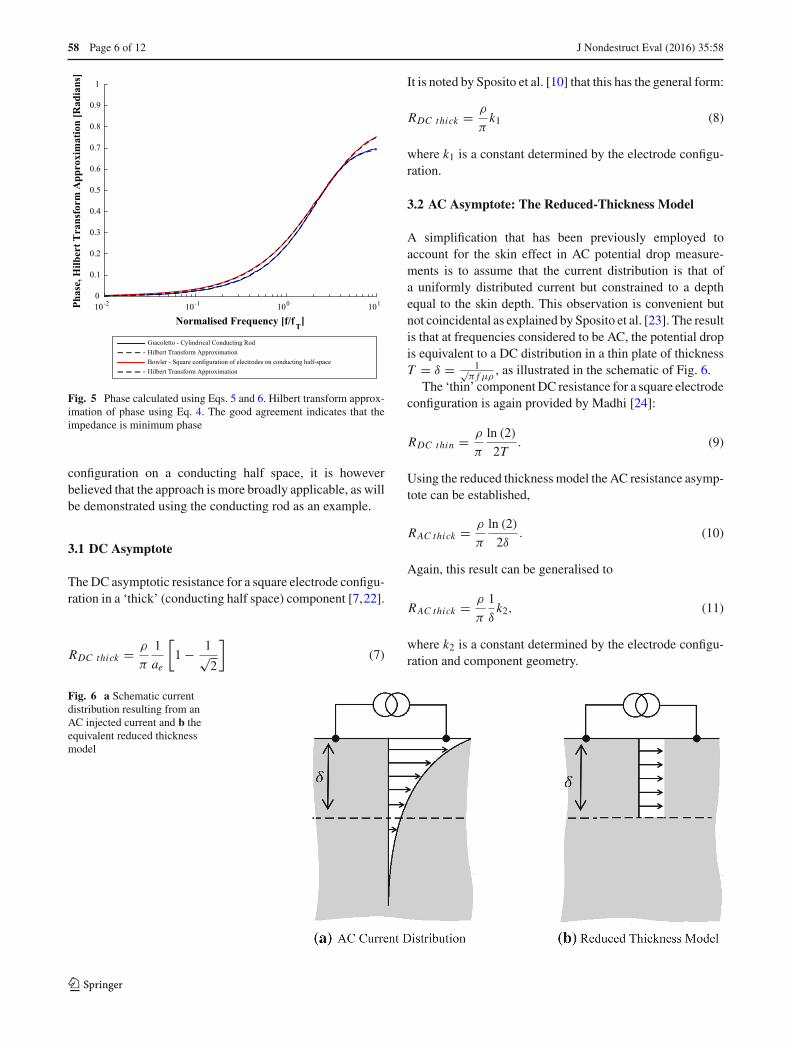
Fig. 5 Phase calculated using Eqs. 5 and 6. Hilbert transform approx-imation of phase using Eq. 4. The good agreement indicates that theimpedance is minimum phase
configuration on a conducting half space, it is howeverbelieved that the approach is more broadly applicable, as willbe demonstrated using the conducting rod as an example.
3.1 DC Asymptote
The DC asymptotic resistance for a square electrode configu-ration in a ‘thick’ (conducting half space) component [7,22].
RDC thick = ρ
π
1
ae
[
1 − 1√2
]
(7)
It is noted by Sposito et al. [10] that this has the general form:
RDC thick = ρ
πk1 (8)
where k1 is a constant determined by the electrode configu-ration.
3.2 AC Asymptote: The Reduced-Thickness Model
A simplification that has been previously employed toaccount for the skin effect in AC potential drop measure-ments is to assume that the current distribution is that ofa uniformly distributed current but constrained to a depthequal to the skin depth. This observation is convenient butnot coincidental as explained by Sposito et al. [23]. The resultis that at frequencies considered to be AC, the potential dropis equivalent to a DC distribution in a thin plate of thicknessT = δ = 1√
π f μρ, as illustrated in the schematic of Fig. 6.
The ‘thin’ component DC resistance for a square electrodeconfiguration is again provided by Madhi [24]:
RDC thin = ρ
π
ln (2)
2T. (9)
Using the reduced thickness model the AC resistance asymp-tote can be established,
RAC thick = ρ
π
ln (2)
2δ. (10)
Again, this result can be generalised to
RAC thick = ρ
π
1
δk2, (11)
where k2 is a constant determined by the electrode configu-ration and component geometry.
Fig. 6 a Schematic currentdistribution resulting from anAC injected current and b theequivalent reduced thicknessmodel
123
J Nondestruct Eval (2016) 35 :58 Page 7 of 12 58
0.1
1
10
0.01 0.1 1 10 100
Nor
mal
ised
Res
ista
nce
[R/R
DC]
Normalised Frequency [f/fT]
DC Asymptote AC Asymptote
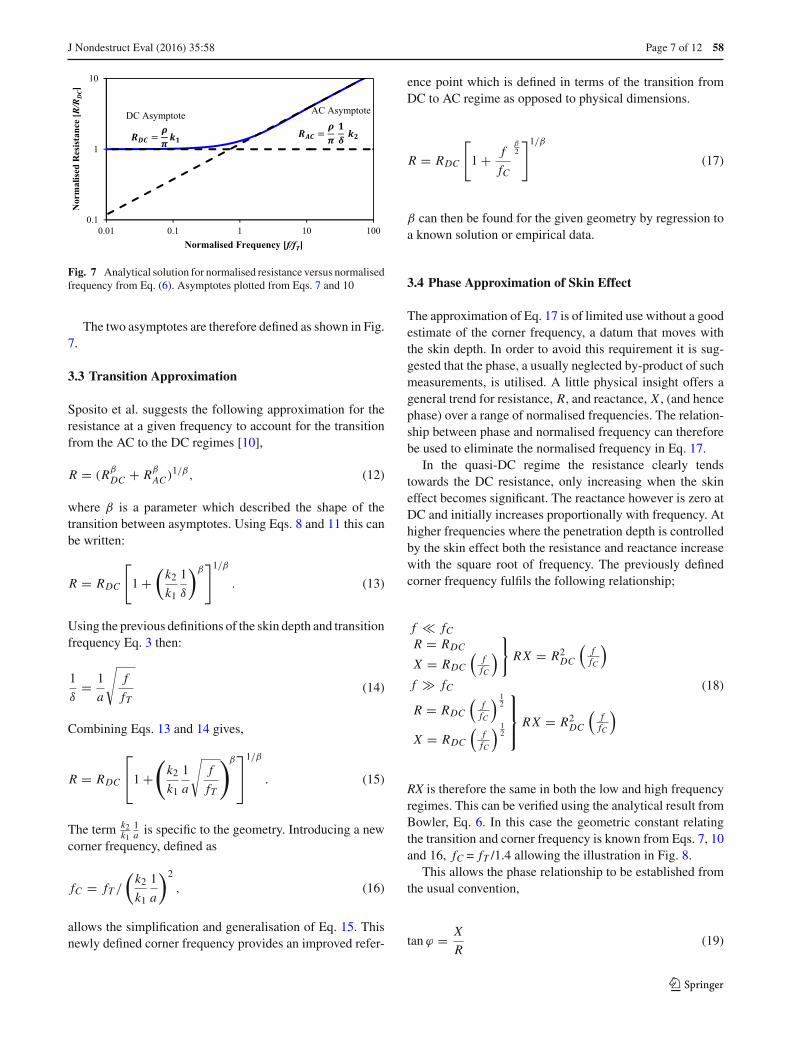
Fig. 7 Analytical solution for normalised resistance versus normalisedfrequency from Eq. (6). Asymptotes plotted from Eqs. 7 and 10
The two asymptotes are therefore defined as shown in Fig.7.
3.3 Transition Approximation
Sposito et al. suggests the following approximation for theresistance at a given frequency to account for the transitionfrom the AC to the DC regimes [10],
R = (RβDC + Rβ
AC )1/β, (12)
where β is a parameter which described the shape of thetransition between asymptotes. Using Eqs. 8 and 11 this canbe written:
R = RDC
[
1 +(k2
k1
1
δ
)β]1/β
. (13)
Using the previous definitions of the skin depth and transitionfrequency Eq. 3 then:
1
δ= 1
a
√f
fT(14)
Combining Eqs. 13 and 14 gives,
R = RDC
⎡
⎣1 +(k2
k1
1
a
√f
fT
)β⎤
⎦
1/β
. (15)
The term k2k1
1a is specific to the geometry. Introducing a new
corner frequency, defined as
fC = fT /
(k2
k1
1
a
)2
, (16)
allows the simplification and generalisation of Eq. 15. Thisnewly defined corner frequency provides an improved refer-
ence point which is defined in terms of the transition fromDC to AC regime as opposed to physical dimensions.
R = RDC
[
1 + f
fC
β2
]1/β
(17)
β can then be found for the given geometry by regression toa known solution or empirical data.
3.4 Phase Approximation of Skin Effect
The approximation of Eq. 17 is of limited use without a goodestimate of the corner frequency, a datum that moves withthe skin depth. In order to avoid this requirement it is sug-gested that the phase, a usually neglected by-product of suchmeasurements, is utilised. A little physical insight offers ageneral trend for resistance, R, and reactance, X , (and hencephase) over a range of normalised frequencies. The relation-ship between phase and normalised frequency can thereforebe used to eliminate the normalised frequency in Eq. 17.
In the quasi-DC regime the resistance clearly tendstowards the DC resistance, only increasing when the skineffect becomes significant. The reactance however is zero atDC and initially increases proportionally with frequency. Athigher frequencies where the penetration depth is controlledby the skin effect both the resistance and reactance increasewith the square root of frequency. The previously definedcorner frequency fulfils the following relationship;
f � fCR = RDC
X = RDC
(ffC
)}
RX = R2DC
(ffC
)
f � fC
R = RDC
(ffC
) 12
X = RDC
(ffC
) 12
⎫⎪⎬
⎪⎭RX = R2
DC
(ffC
)
(18)
RX is therefore the same in both the low and high frequencyregimes. This can be verified using the analytical result fromBowler, Eq. 6. In this case the geometric constant relatingthe transition and corner frequency is known from Eqs. 7, 10and 16, fC = fT /1.4 allowing the illustration in Fig. 8.
This allows the phase relationship to be established fromthe usual convention,
tan ϕ = X
R(19)
123

58 Page 8 of 12 J Nondestruct Eval (2016) 35 :58
0.0
0.2
0.4
0.6
0.8
1.0
1.2
0.0001 0.01 1 100
./R
DC
2 (f/f
C)
Normalised Frequency (f/fC)
Fig. 8 Illustration that the geometric mean of the resistance and thereactance is approximately equal to the sought DC asymptote of theresistance over the whole frequency range
and from Eqs. 17 and 18,
tan ϕ =ffC
[
1 + ffC
β2
]1/β(20)
Combining Eqs. 17 and 20 to eliminate ffC
yields,
R
RDC= 1
(1 − (tan ϕ)
β2
)1/β(21)
β can be found using regression to a known analytical solu-tion or empirical data. The solution of Eq. 6 from Bowler[21] will be used in this case.
3.5 Limitation of a Phase Based Correction
It is important to note that the correction provided hereonly describe the unique relationship between the resis-tance and phase arising from the skin effect. The assumedrelationship may be violated by contributions from otherunaccounted influences, for example from inductive couplingand signal shaping electronics. Inductive coupling betweenthe injection and sensing loops would introduce an additionalreactance that increases proportionally with frequency, andthe additional reactive part would undermine the correction.Fortunately at the near-DC frequencies relevant to the pro-posed correction inductive effects will be minimal providedthat the usual practical measures are enacted to minimiseinductive coupling. A suggested experimental check thatinductive effects are kept below an acceptable threshold isto increase the frequency and ensure that the phase angletends to 45◦. For a more detailed discussion of this effect see[21,25]. Additionally, a practical note is that any phase andmagnitude changes resulting from signal conditioning must
be taken into account. The transfer functions of most filtersare widely known and can be easily found in literature [26].
In order for the methodology outlined in this paper to beof use then it is required that the phase must have reasonablesensitivity to changing frequency in the region where theresistive component of the complex impedance perceivablydeviates from its DC asymptote. As already noted, at higherfrequencies both the reactance and resistance tend to the samevalue and therefore the phase tends to π /4 radians. Plottingthe phase against frequency shows that the sensitive rangeis limited to the close vicinity of the transition frequencyas shown in Fig. 4. This limitation is compounded by theasymptotic behaviour of Eq. 21, as ϕ → π /4, R/RDC → ∞Therefore, when finding best-fitting values of β large errorsin the correction are introduced as ϕ → π /4. To mitigate thislimitation the approximation is adjusted by introducing anarbitrary second parameter, A. The parameter has no phys-ical significance but performs the mathematical function ofchanging the asymptotic behaviour of the correction allow-ing for correction up to ϕ =π /4. While this circumvents themathematical limit of Eq. 21, the physical limitation of sen-sitivity to below π /4 is still present.
R
RDC= 1
(1 − Atan
β2 φ
)1/β(22)
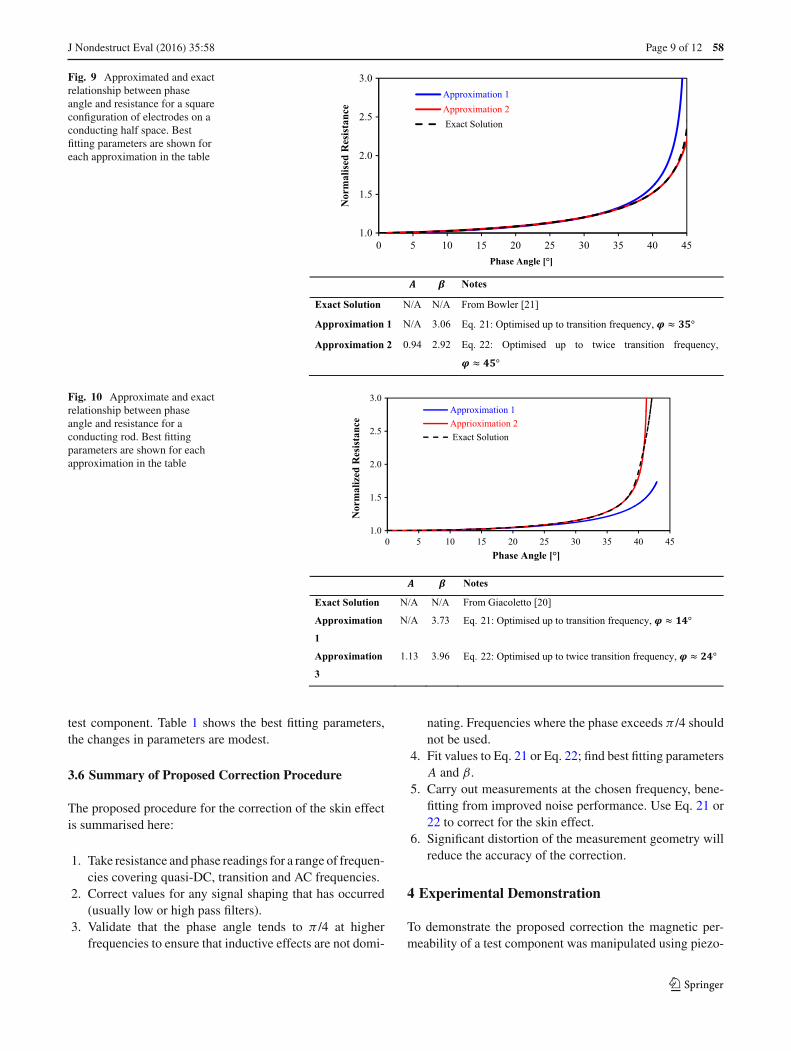
Figure 9 illustrates the varying degrees of success of Eqs.21 and 22. While the simpler formulation of Eq. 21 can beseen to be very good up to approximately 35◦ ( f / fT = 1),its limiting asymptotic behaviour means that it is poor whenfitted up to 45◦. The suggested modification of Eq. 22 is seento have excellent agreement with the analytical solution. Thevalues of β found in Fig. 9 are consistent with the findingsof Sposito et al. at β ≈ 3 [10].
The case of a square electrode configuration on a con-ducting half-space has been assumed to illustrate the process,however, the previous arguments are common to all geome-tries, but the parameters A and β are geometry specific.Figure 10 shows how this process can be applied to the caseof the conducting rod as demonstrated using the solution inEq. 5 provided by Giacoletto [20].
An important consideration for utilising the ad-hoc cor-rection outlined in this paper is the geometry specific fittingparameters. In the case of the square electrode configurationmeasurement the intended application is for strain measure-ment. As the component deforms, changes in the electrodeconfiguration aspect ratio, γ , are expected; with referenceto Eq. 6, an accompanying change in impedance will resultand with it the best fitting parameters. Impedance valueswere calculated from Eq. 6 for two aspect ratios, γ = 1 andγ = 1.1, which may result from strain accumulation in the
123
J Nondestruct Eval (2016) 35 :58 Page 9 of 12 58
Fig. 9 Approximated and exactrelationship between phaseangle and resistance for a squareconfiguration of electrodes on aconducting half space. Bestfitting parameters are shown foreach approximation in the table
Notes
Exact Solution N/A N/A From Bowler [21]
Approximation 1 N/A 3.06 Eq.(21: Optimised up to transition frequency,
Approximation 2 0.94 2.92 Eq.(22: Optimised up to twice transition frequency,
1.0
1.5
2.0
2.5
3.0
0 5 10 15 20 25 30 35 40 45
Nor
mal
ised
Res
ista
nce
Phase Angle [°]
Approximation 1Approximation 2 Exact Solution
Fig. 10 Approximate and exactrelationship between phaseangle and resistance for aconducting rod. Best fittingparameters are shown for eachapproximation in the table
Notes
Exact Solution N/A N/A From Giacoletto [20]
Approximation
1
N/A 3.73 Eq.(21: Optimised up to transition frequency,
Approximation
3
1.13 3.96 Eq.(22: Optimised up to twice transition frequency,
1.0
1.5
2.0
2.5
3.0
0 5 10 15 20 25 30 35 40 45
Nor
mal
ized
Res
ista
nce
Phase Angle [°]
Approximation 1Apprioximation 2 Exact Solution
test component. Table 1 shows the best fitting parameters,the changes in parameters are modest.
3.6 Summary of Proposed Correction Procedure
The proposed procedure for the correction of the skin effectis summarised here:
1. Take resistance and phase readings for a range of frequen-cies covering quasi-DC, transition and AC frequencies.
2. Correct values for any signal shaping that has occurred(usually low or high pass filters).
3. Validate that the phase angle tends to π /4 at higherfrequencies to ensure that inductive effects are not domi-
nating. Frequencies where the phase exceeds π /4 shouldnot be used.
4. Fit values to Eq. 21 or Eq. 22; find best fitting parametersA and β.
5. Carry out measurements at the chosen frequency, bene-fitting from improved noise performance. Use Eq. 21 or22 to correct for the skin effect.
6. Significant distortion of the measurement geometry willreduce the accuracy of the correction.
4 Experimental Demonstration
To demonstrate the proposed correction the magnetic per-meability of a test component was manipulated using piezo-
123
58 Page 10 of 12 J Nondestruct Eval (2016) 35 :58
Table 1 Best fitting parameters are shown for different approximations and for electrode configurations that are square, γ = 1, and rectangular withan aspect ratio of γ = 1.1
γ = 1 γ = 1.1 Notes
A β A β
Approximation 1 N/A 3.06 N/A 3.04 Eq. 21: optimised up to transition frequency, φ ≈ 35◦
Approximation 2 0.94 2.92 0.93 2.85 Eq. 22: optimised up to twice transition frequency
φ ≈ 45◦
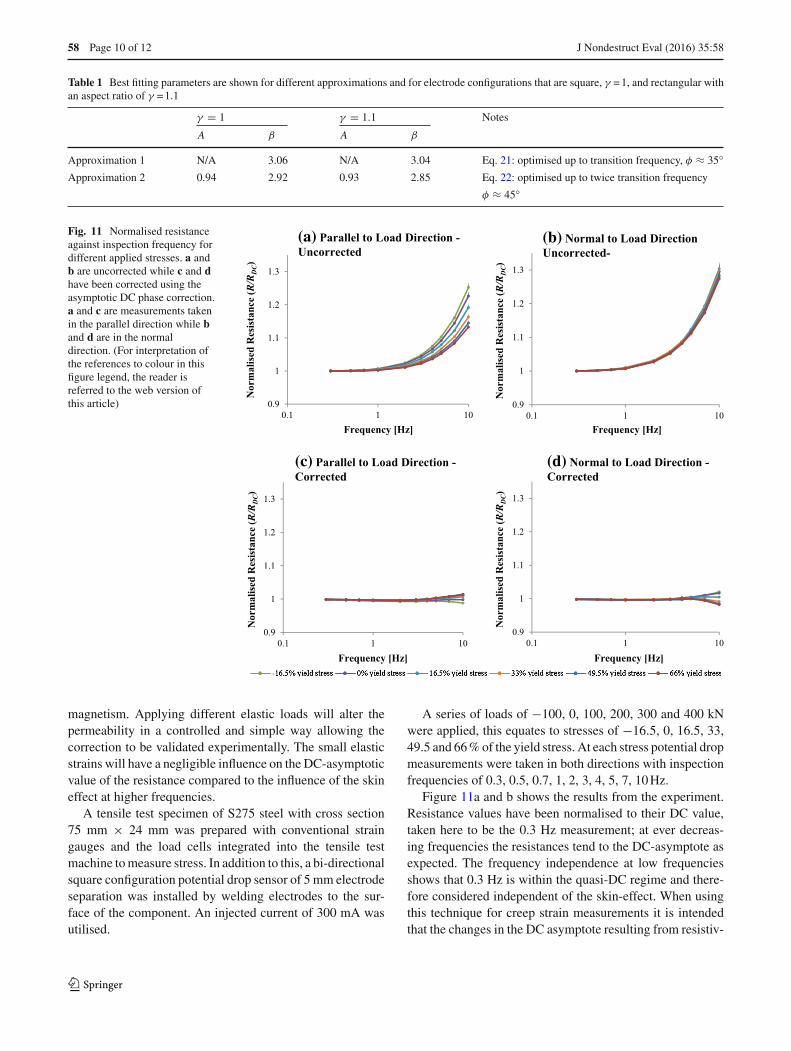
Fig. 11 Normalised resistanceagainst inspection frequency fordifferent applied stresses. a andb are uncorrected while c and dhave been corrected using theasymptotic DC phase correction.a and c are measurements takenin the parallel direction while band d are in the normaldirection. (For interpretation ofthe references to colour in thisfigure legend, the reader isreferred to the web version ofthis article) 0.9
1
1.1
1.2
1.3
0.1 1 10
Nor
mal
ised
Res
ista
nce
(R/R
DC)
Frequency [Hz]
(a) Parallel to Load Direction -Uncorrected
0.9
1
1.1
1.2
1.3
0.1 1 10
Nor
mal
ised
Res
ista
nce
(R/R
DC)
Frequency [Hz]
(b) Normal to Load Direction Uncorrected-
0.9
1
1.1
1.2
1.3
0.1 1 10
Nor
mal
ised
Res
ista
nce
(R/R
DC)
Frequency [Hz]
(c) Parallel to Load Direction -Corrected
0.9
1
1.1
1.2
1.3
0.1 1 10
Nor
mal
ised
Res
ista
nce
(R/R
DC)
Frequency [Hz]
(d) Normal to Load Direction -Corrected
magnetism. Applying different elastic loads will alter thepermeability in a controlled and simple way allowing thecorrection to be validated experimentally. The small elasticstrains will have a negligible influence on the DC-asymptoticvalue of the resistance compared to the influence of the skineffect at higher frequencies.
A tensile test specimen of S275 steel with cross section75 mm × 24 mm was prepared with conventional straingauges and the load cells integrated into the tensile testmachine to measure stress. In addition to this, a bi-directionalsquare configuration potential drop sensor of 5 mm electrodeseparation was installed by welding electrodes to the sur-face of the component. An injected current of 300 mA wasutilised.
A series of loads of −100, 0, 100, 200, 300 and 400 kNwere applied, this equates to stresses of −16.5, 0, 16.5, 33,49.5 and 66 % of the yield stress. At each stress potential dropmeasurements were taken in both directions with inspectionfrequencies of 0.3, 0.5, 0.7, 1, 2, 3, 4, 5, 7, 10 Hz.
Figure 11a and b shows the results from the experiment.Resistance values have been normalised to their DC value,taken here to be the 0.3 Hz measurement; at ever decreas-ing frequencies the resistances tend to the DC-asymptote asexpected. The frequency independence at low frequenciesshows that 0.3 Hz is within the quasi-DC regime and there-fore considered independent of the skin-effect. When usingthis technique for creep strain measurements it is intendedthat the changes in the DC asymptote resulting from resistiv-
123
J Nondestruct Eval (2016) 35 :58 Page 11 of 12 58
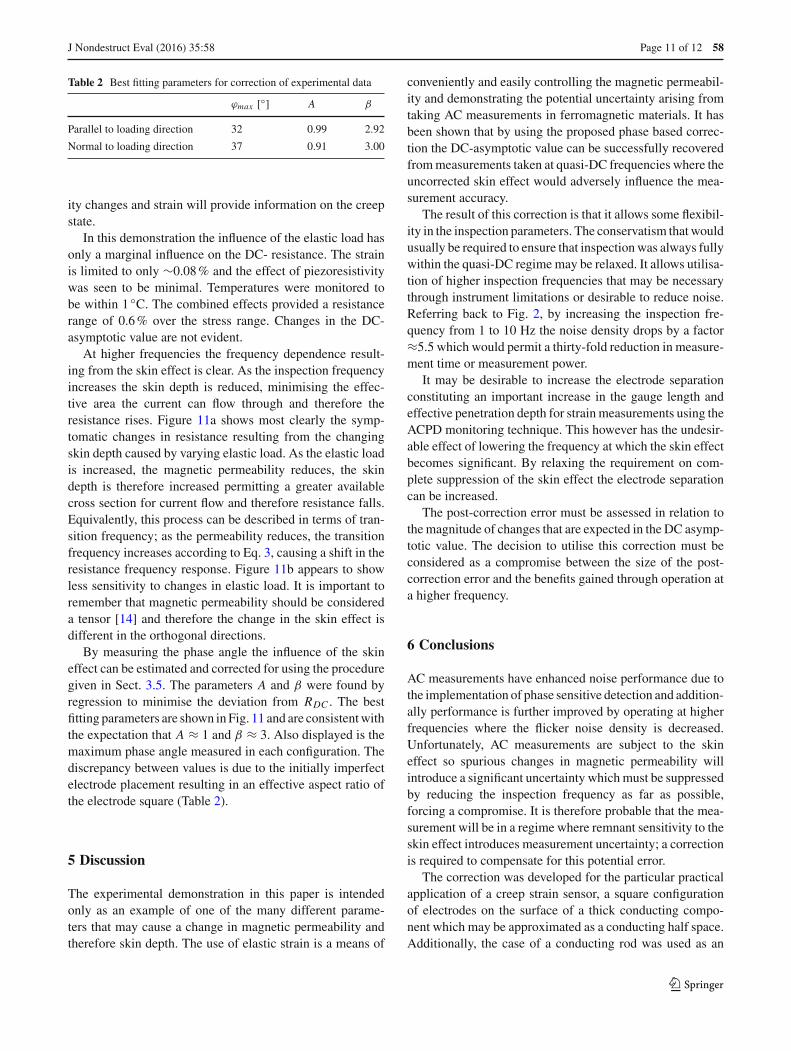
Table 2 Best fitting parameters for correction of experimental data
ϕmax [◦] A β
Parallel to loading direction 32 0.99 2.92
Normal to loading direction 37 0.91 3.00
ity changes and strain will provide information on the creepstate.
In this demonstration the influence of the elastic load hasonly a marginal influence on the DC- resistance. The strainis limited to only ∼0.08 % and the effect of piezoresistivitywas seen to be minimal. Temperatures were monitored tobe within 1 ◦C. The combined effects provided a resistancerange of 0.6 % over the stress range. Changes in the DC-asymptotic value are not evident.
At higher frequencies the frequency dependence result-ing from the skin effect is clear. As the inspection frequencyincreases the skin depth is reduced, minimising the effec-tive area the current can flow through and therefore theresistance rises. Figure 11a shows most clearly the symp-tomatic changes in resistance resulting from the changingskin depth caused by varying elastic load. As the elastic loadis increased, the magnetic permeability reduces, the skindepth is therefore increased permitting a greater availablecross section for current flow and therefore resistance falls.Equivalently, this process can be described in terms of tran-sition frequency; as the permeability reduces, the transitionfrequency increases according to Eq. 3, causing a shift in theresistance frequency response. Figure 11b appears to showless sensitivity to changes in elastic load. It is important toremember that magnetic permeability should be considereda tensor [14] and therefore the change in the skin effect isdifferent in the orthogonal directions.
By measuring the phase angle the influence of the skineffect can be estimated and corrected for using the proceduregiven in Sect. 3.5. The parameters A and β were found byregression to minimise the deviation from RDC . The bestfitting parameters are shown in Fig. 11 and are consistent withthe expectation that A ≈ 1 and β ≈ 3. Also displayed is themaximum phase angle measured in each configuration. Thediscrepancy between values is due to the initially imperfectelectrode placement resulting in an effective aspect ratio ofthe electrode square (Table 2).
5 Discussion
The experimental demonstration in this paper is intendedonly as an example of one of the many different parame-ters that may cause a change in magnetic permeability andtherefore skin depth. The use of elastic strain is a means of
conveniently and easily controlling the magnetic permeabil-ity and demonstrating the potential uncertainty arising fromtaking AC measurements in ferromagnetic materials. It hasbeen shown that by using the proposed phase based correc-tion the DC-asymptotic value can be successfully recoveredfrom measurements taken at quasi-DC frequencies where theuncorrected skin effect would adversely influence the mea-surement accuracy.
The result of this correction is that it allows some flexibil-ity in the inspection parameters. The conservatism that wouldusually be required to ensure that inspection was always fullywithin the quasi-DC regime may be relaxed. It allows utilisa-tion of higher inspection frequencies that may be necessarythrough instrument limitations or desirable to reduce noise.Referring back to Fig. 2, by increasing the inspection fre-quency from 1 to 10 Hz the noise density drops by a factor≈5.5 which would permit a thirty-fold reduction in measure-ment time or measurement power.
It may be desirable to increase the electrode separationconstituting an important increase in the gauge length andeffective penetration depth for strain measurements using theACPD monitoring technique. This however has the undesir-able effect of lowering the frequency at which the skin effectbecomes significant. By relaxing the requirement on com-plete suppression of the skin effect the electrode separationcan be increased.
The post-correction error must be assessed in relation tothe magnitude of changes that are expected in the DC asymp-totic value. The decision to utilise this correction must beconsidered as a compromise between the size of the post-correction error and the benefits gained through operation ata higher frequency.
6 Conclusions
AC measurements have enhanced noise performance due tothe implementation of phase sensitive detection and addition-ally performance is further improved by operating at higherfrequencies where the flicker noise density is decreased.Unfortunately, AC measurements are subject to the skineffect so spurious changes in magnetic permeability willintroduce a significant uncertainty which must be suppressedby reducing the inspection frequency as far as possible,forcing a compromise. It is therefore probable that the mea-surement will be in a regime where remnant sensitivity to theskin effect introduces measurement uncertainty; a correctionis required to compensate for this potential error.
The correction was developed for the particular practicalapplication of a creep strain sensor, a square configurationof electrodes on the surface of a thick conducting compo-nent which may be approximated as a conducting half space.Additionally, the case of a conducting rod was used as an
123
58 Page 12 of 12 J Nondestruct Eval (2016) 35 :58
example with a well-known analytical solution to illustratethe wider applicability of the correction to a range of geome-tries.
A prerequisite condition for the correction is that thesystem is minimum phase. It is demonstrated through theuse of the Hilbert transform that both the conducting rodand conducting half space are minimum phase, providingjustification for the presence of a correction. An ad-hocapproximation to the correction has been described whichprovides a practical procedure for implementing the correc-tion.
The correction has been experimentally demonstrated ona tensile test component where the magnetic permeabilityis purposefully manipulated by applying a range of elasticloads. The wider applicability of this method is additionallydemonstrated using the analytical model of the conductingrod.
Low-frequency AC measurements offer greatly enhancednoise performance over the DC alternative. The correctionpresented in this paper should be adopted in order to makeuse of the quasi-DC technique while suppressing possibleuncertainty due to remnant sensitivity to the skin effect.
Open Access This article is distributed under the terms of the CreativeCommons Attribution 4.0 International License (http://creativecommons.org/licenses/by/4.0/), which permits unrestricted use, distribution,and reproduction in any medium, provided you give appropriate creditto the original author(s) and the source, provide a link to the CreativeCommons license, and indicate if changes were made.
References
1. Nagy, PB.: Electromagnetic nondestructive evaluation. In: Kundu,T. (ed.). Ultrason. Electromagn. NDE Struct. Mater. Charact. Eng.Biomed. Appl. CRC Press, Boca Raton, USA, p. 890 (2012)
2. McMaster, R.C.: Electric current test principles. Nondestruct. Test.Handb. 1st edn. Ronald Press, New York, pp. 35.1–35.11 (1959)
3. Saxena, A.: Electrical potential technique for monitoring subcrit-ical crack growth at elevated temperatures. Eng. Fract. Mech. 13,741–750 (1980). doi:10.1016/0013-7944(80)90005-3
4. Gilbey, D.M., Pearson, S.: Measurement of the length of a cen-tral or edge crack in a sheet of metal by an electrical resistancemethod. Ministry of Aviation, Royal Aircraft Establishment, RAEFarnborough (1966)
5. Dogan, B., Nikbin, K., Petrovski, B., Ceyhan, U., Dean, D.W.:Code of practice for high-temperature testing of weldments. Int. J.Press. Vessel Pip. 83, 784–977 (2006). doi:10.1016/j.ijpvp.2006.08.011
6. Corcoran, J., Hooper, P., Davies, C., Nagy, P.B., Cawley, P.: Creepstrain measurement using a potential drop technique. Int J MechSci 110, 190–200 (2016). doi:10.1016/j.ijmecsci.2016.03.015
7. Corcoran J.: Creep monitoring using permanently installed poten-tial drop sensors. PhD Thesis, Imperial College London (2015)
8. Cerný, I.: The use of DCPD method for measurement of growthof cracks in large components at normal and elevated tem-peratures. Eng. Fract. Mech. 71, 837–848 (2004). doi:10.1016/S0013-7944(03)00012-2
9. Sposito G. Advances in potential drop techniques. PhD Thesis,Imperial College London (2009)
10. Sposito, G., Cawley, P., Nagy, P.B.: Potential drop mapping forthe monitoring of corrosion or erosion. NDT&E Int 43, 394–402(2010). doi:10.1016/j.ndteint.2010.03.005
11. Bowler, N., Huang, Y.: Electrical conductivity measurement ofmetal plates using broadband eddy-current and four-point meth-ods. Meas. Sci. Technol. 16, 2193–2200 (2005). doi:10.1088/0957-0233/16/11/009
12. Byeon, J.W., Kwun, S.I.: Nondestructive evaluation of thermallydegraded 2 . 25Cr–1Mo steel by electrical resistivity measurement.Mater Trans 44:1204–1208 (2003)
13. Corcoran, J., Nagy, P.B., Cawley, P.: Potential drop monitoring ofcreep damage at a weld. Rev. Prog. Quant. Nondestruct. Eval. 35.doi:10.1063/1.4940625
14. Jiles, D.C.: Introduction to Magnetism and Magnetic Materials,2nd edn. CRC Press (1998)
15. Comsol Multiphysics, Comsol Inc. (2015)16. Voss RF. 1/f (Flicker) Noise: A Brief Review. 33rd Annu Symp
Freq Control 1979:40–6. doi:10.1109/FREQ.1979.20029717. McMaster, R.C., McIntire, P., Mester, M.L. (eds.): Nondestruc-
tive Testing Handbook, vol. 4: Electromagnetic Testing, 2nd edn.McGraw-Hill Education (1986)
18. Model SR560, Low-Noise Preamplifier Manual (2013)19. Smith, J.O.: Introduction to Digital Filters: With Audio Applica-
tions. W3K Publishing (2008)20. Giacoletto, L.J.: Frequency- and time-domain analysis of skin
effects. Magn. IEEE Trans. 32, 220–229 (1996)21. Bowler, N.: Theory of four-point alternating current potential drop
measurements on a metal half-space. J. Phys. D. Appl. Phys. 39,584–589 (2006). doi:10.1088/0022-3727/39/3/024
22. Madhi, E., Nagy, P.B.: Sensitivity analysis of a directional potentialdrop sensor for creep monitoring. NDT&E Int 44, 708–17 (2011).doi:10.1016/j.ndteint.2011.08.001
23. Sposito, G., Cawley, P., Nagy, P.B.: An approximate model forthree-dimensional alternating current potential drop analyses usinga commercial finite element code. NDT&E Int 43, 134–40 (2010).doi:10.1016/j.ndteint.2009.10.002
24. Madhi, E.: In-situ creep monitoring using directional potential dropsensors. PhD Thesis, University of Cincinnati (2010)
25. Bowler, N., Bowler, J.R.: Theory of four-point alternating currentpotential drop measurements on conductive plates. Proc R Soc A463, 817–36 (2007). doi:10.1098/rspa.2006.1791
26. Whitaker, J.C.: The Electronics Handbook. CRC Press (1996)
123