Embed Size (px)
Citation preview
Compete (and win) on Kaggle
Lukáš DrápalSenior Data Scientist, Capital One
Sheffield R MeetUp
1st November 2016
Agenda
• Introduction– I do not Kaggle as my day job
• Kaggle.com– How it works?
• Allstate Purchase prediction challenge– Challenge description– Solution overview– Used technique & tools
• Why Kaggle?
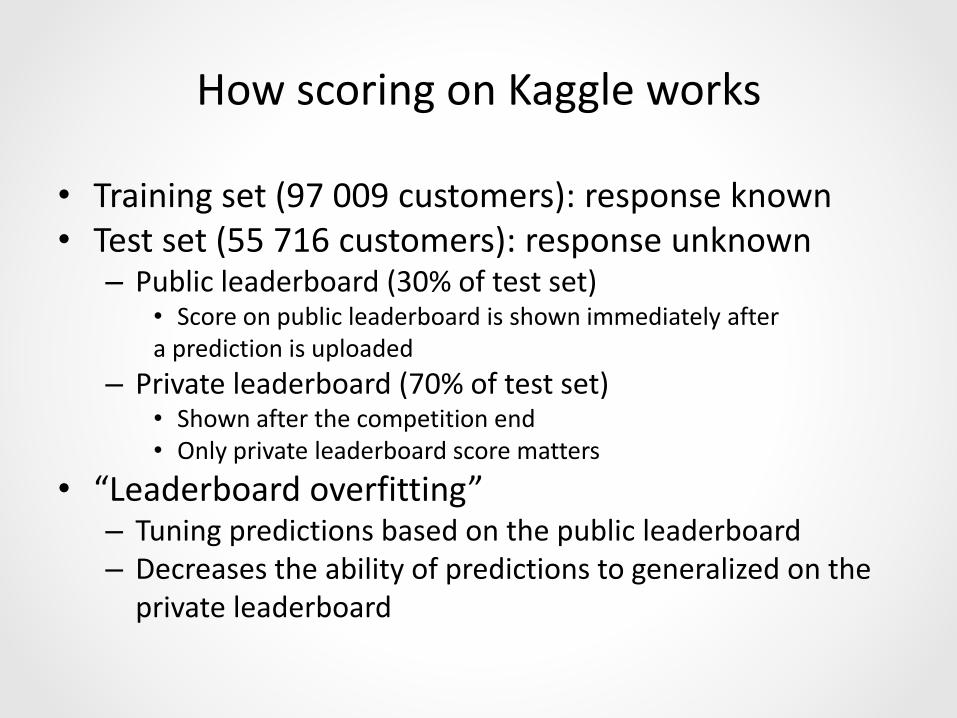
How scoring on Kaggle works
• Training set (97 009 customers): response known• Test set (55 716 customers): response unknown
– Public leaderboard (30% of test set)• Score on public leaderboard is shown immediately after a prediction is uploaded
– Private leaderboard (70% of test set)• Shown after the competition end • Only private leaderboard score matters
• “Leaderboard overfitting” – Tuning predictions based on the public leaderboard– Decreases the ability of predictions to generalized on the
private leaderboard
Business idea
• Business idea: – Recommend insurance policy settings for customers– Shorter quoting process – Better customer experience– A customer does not leave to competition within a tedious
process
Problem description
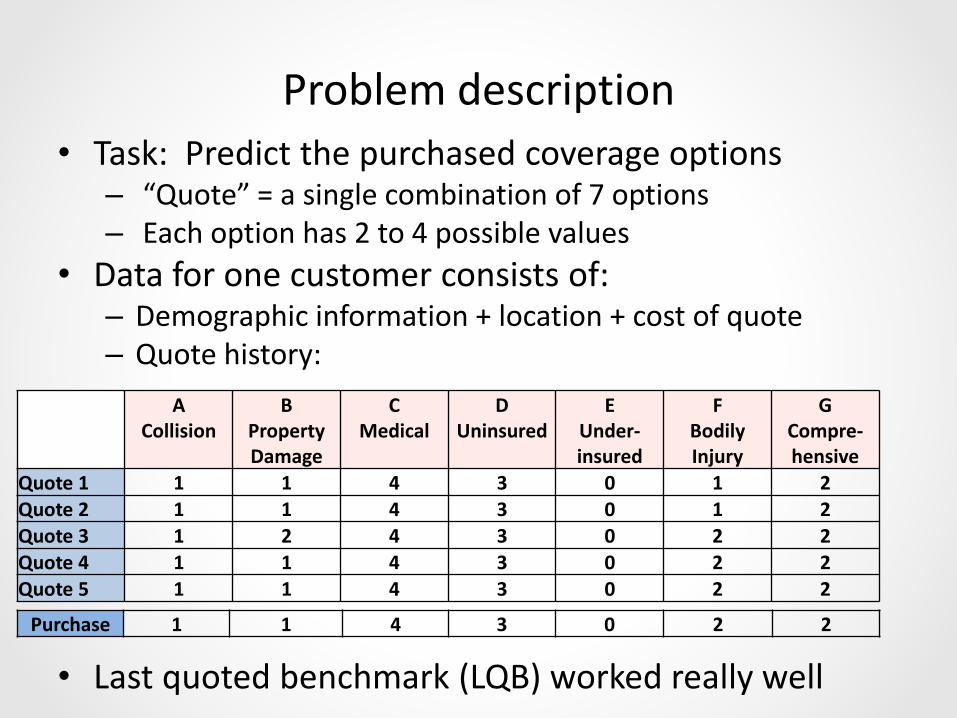
• Task: Predict the purchased coverage options– “Quote” = a single combination of 7 options– Each option has 2 to 4 possible values
• Data for one customer consists of:– Demographic information + location + cost of quote– Quote history:
• Last quoted benchmark (LQB) worked really well
ACollision
BProperty Damage
CMedical
DUninsured
EUnder-insured
FBodily Injury
GCompre-hensive
Quote 1 1 1 4 3 0 1 2Quote 2 1 1 4 3 0 1 2
Quote 3 1 2 4 3 0 2 2Quote 4 1 1 4 3 0 2 2
Quote 5 1 1 4 3 0 2 2
Purchase 1 1 4 3 0 2 2
Modelling
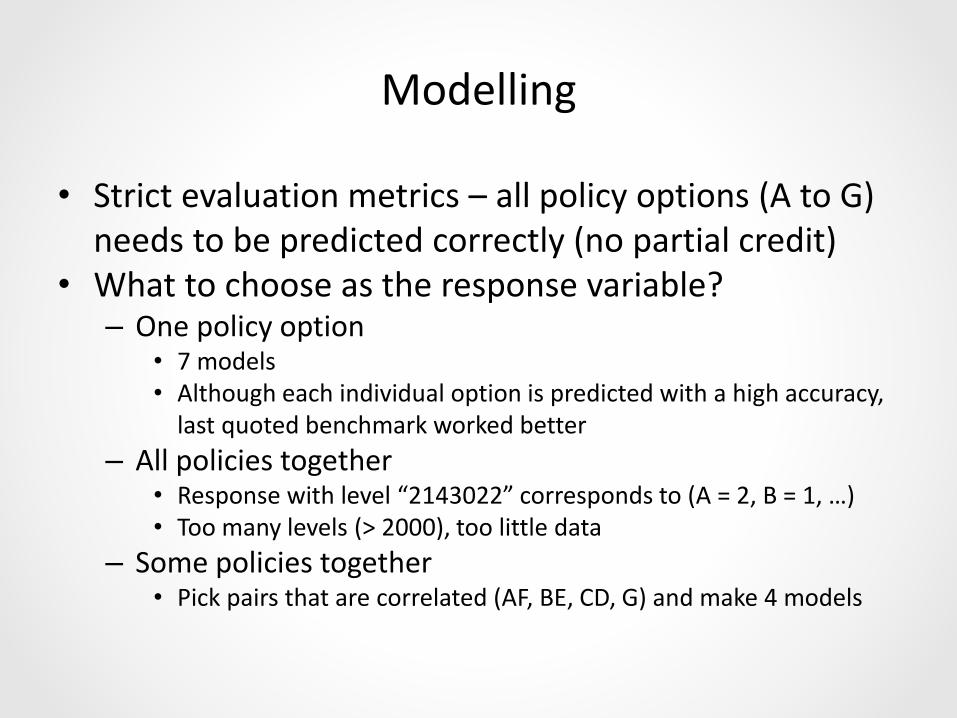
• Strict evaluation metrics – all policy options (A to G) needs to be predicted correctly (no partial credit)
• What to choose as the response variable?– One policy option
• 7 models• Although each individual option is predicted with a high accuracy,
last quoted benchmark worked better
– All policies together • Response with level “2143022” corresponds to (A = 2, B = 1, …)• Too many levels (> 2000), too little data
– Some policies together• Pick pairs that are correlated (AF, BE, CD, G) and make 4 models
Example: model for AF (1/2)
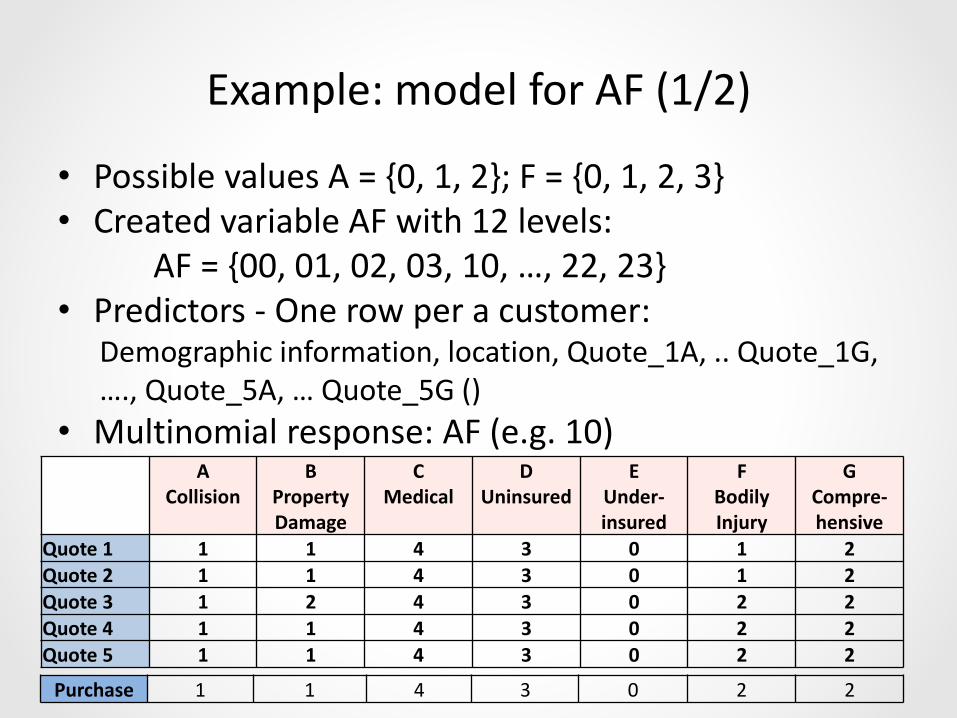
• Possible values A = {0, 1, 2}; F = {0, 1, 2, 3}• Created variable AF with 12 levels:
AF = {00, 01, 02, 03, 10, …, 22, 23}• Predictors - One row per a customer:
Demographic information, location, Quote_1A, .. Quote_1G, …., Quote_5A, … Quote_5G ()
• Multinomial response: AF (e.g. 10) A
CollisionB
Property Damage
CMedical
DUninsured
EUnder-insured
FBodily Injury
GCompre-hensive
Quote 1 1 1 4 3 0 1 2Quote 2 1 1 4 3 0 1 2Quote 3 1 2 4 3 0 2 2Quote 4 1 1 4 3 0 2 2
Quote 5 1 1 4 3 0 2 2
Purchase 1 1 4 3 0 2 2
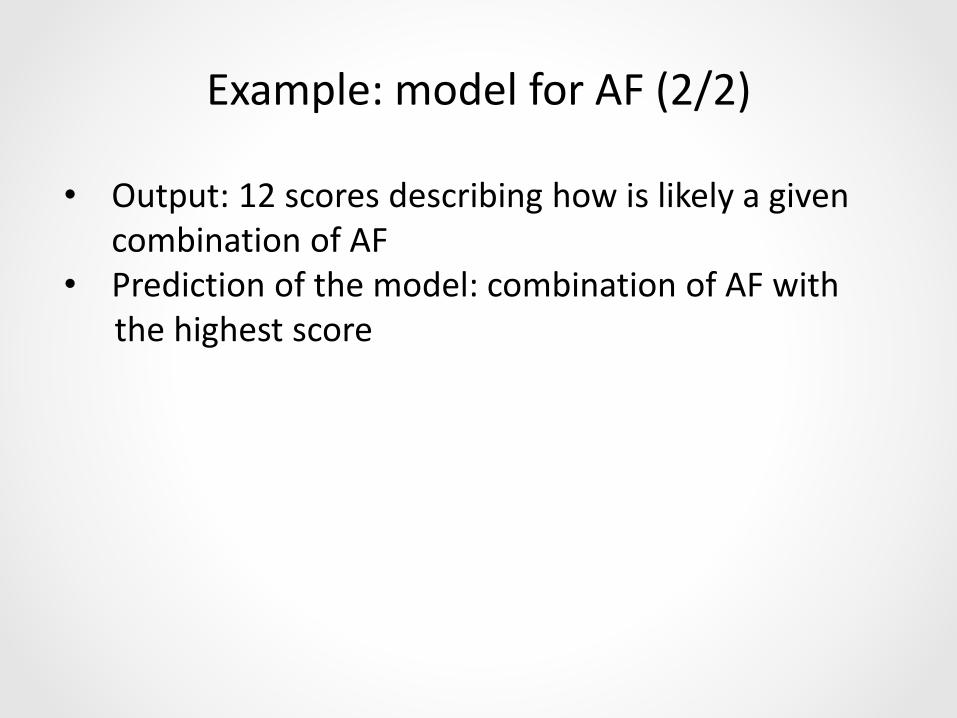
Example: model for AF (2/2)
• Output: 12 scores describing how is likely a given combination of AF
• Prediction of the model: combination of AF withthe highest score
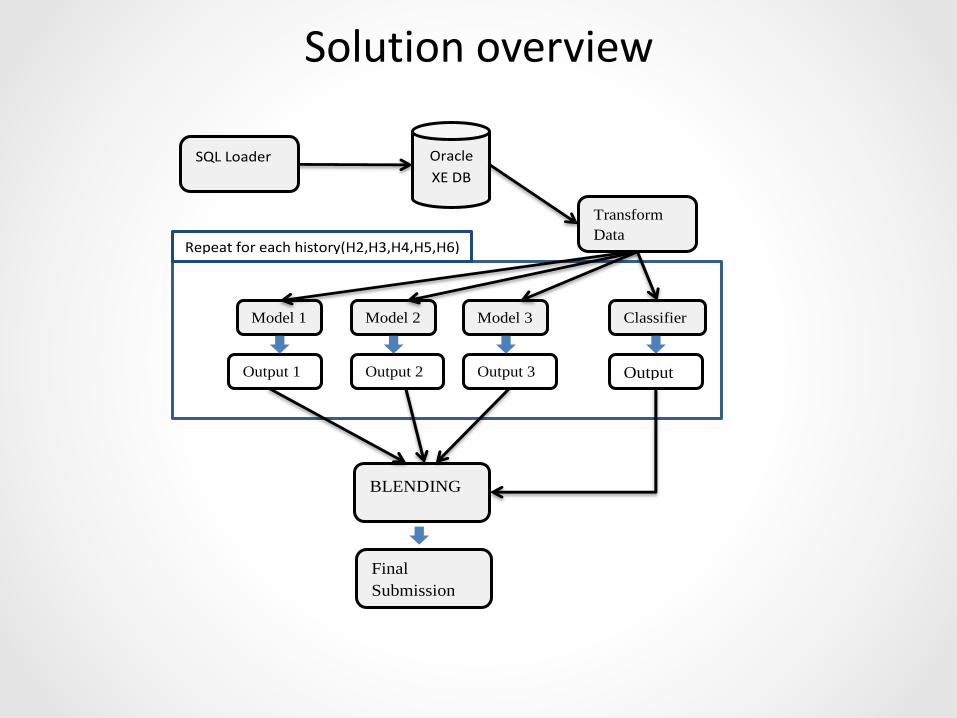
Oracle
XE DB
SQL Loader
Transform
Data
Model 1 Model 2 Model 3 Classifier
er
Output 1
1
Output 2 Output 3
Repeat for each history(H2,H3,H4,H5,H6)
BLENDING
Final
Submission
Output
Solution overview
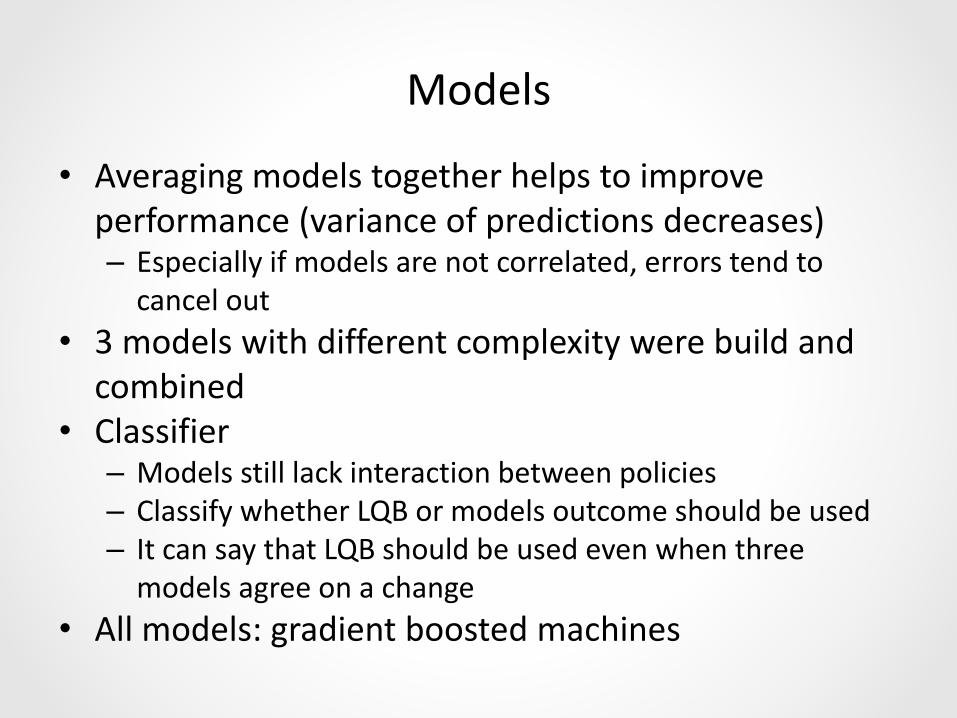
Models
• Averaging models together helps to improve performance (variance of predictions decreases)– Especially if models are not correlated, errors tend to
cancel out
• 3 models with different complexity were build and combined
• Classifier– Models still lack interaction between policies– Classify whether LQB or models outcome should be used– It can say that LQB should be used even when three
models agree on a change
• All models: gradient boosted machines
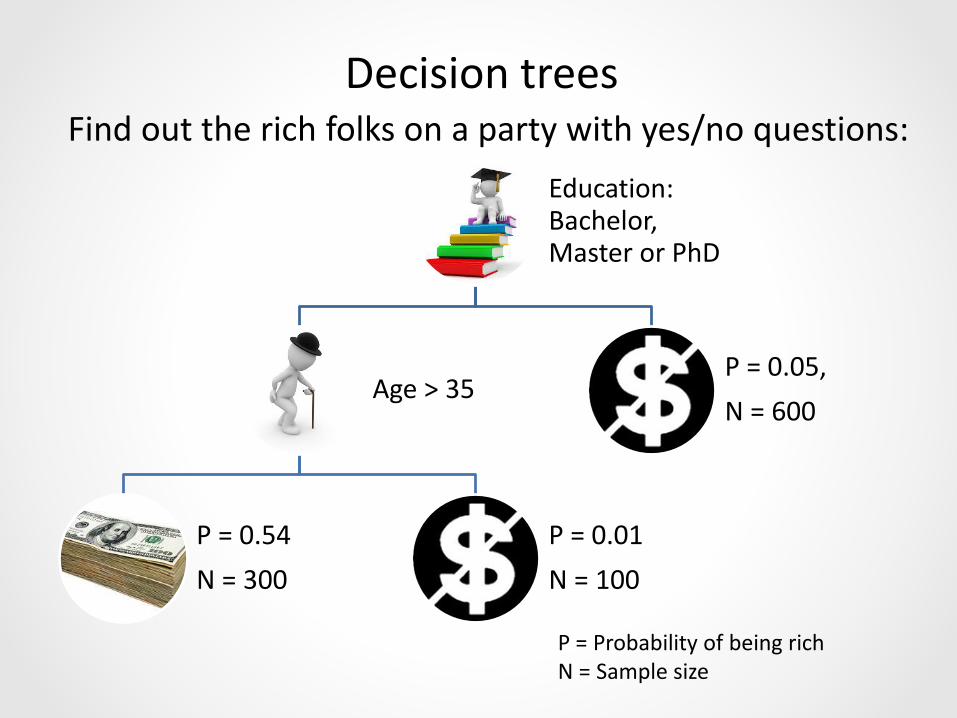
Decision trees
Education: Bachelor, Master or PhD
Age > 35
P = 0.54
N = 300
P = 0.01
N = 100
P = 0.05,
N = 600
P = Probability of being richN = Sample size
Find out the rich folks on a party with yes/no questions:
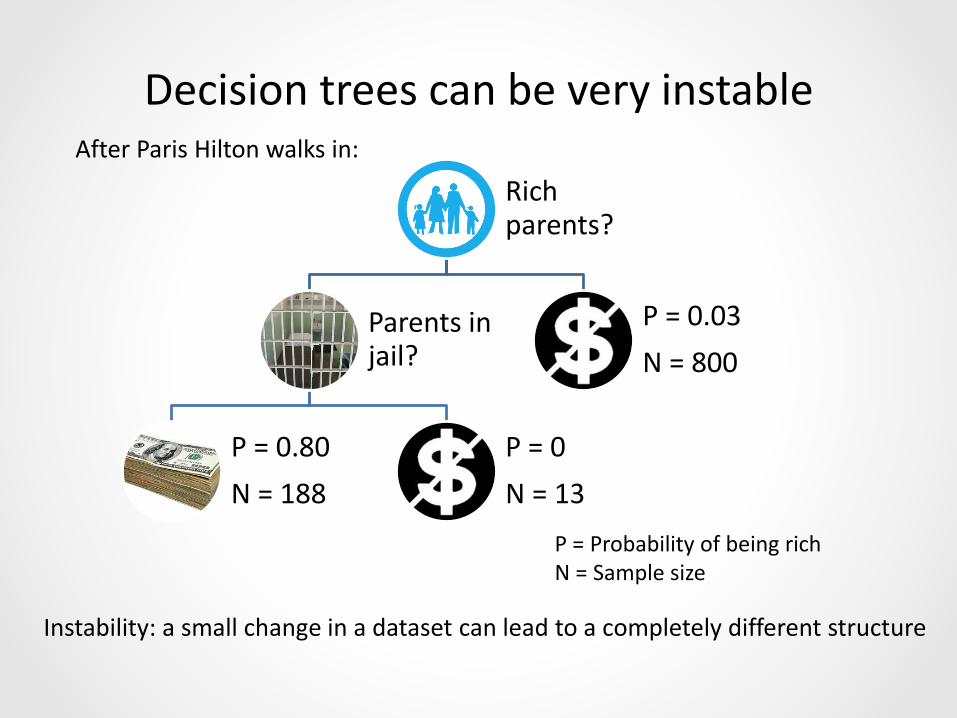
Decision trees can be very instable
Rich parents?
Parents in jail?
P = 0.80
N = 188
P = 0
N = 13
P = 0.03
N = 800
After Paris Hilton walks in:
P = Probability of being richN = Sample size
Instability: a small change in a dataset can lead to a completely different structure
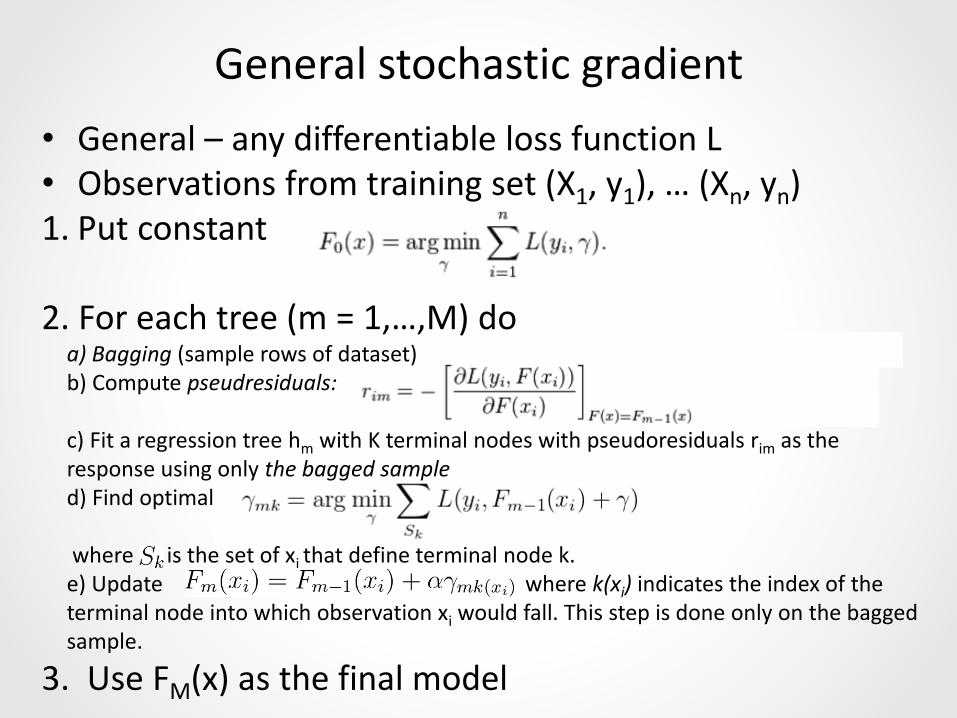
General stochastic gradient
• General – any differentiable loss function L• Observations from training set (X1, y1), … (Xn, yn)1. Put constant
2. For each tree (m = 1,…,M) do a) Bagging (sample rows of dataset)b) Compute pseudresiduals:
c) Fit a regression tree hm with K terminal nodes with pseudoresiduals rim as the response using only the bagged sample d) Find optimal
where is the set of xi that define terminal node k.e) Update where k(xi) indicates the index of the terminal node into which observation xi would fall. This step is done only on the bagged sample.
3. Use FM(x) as the final model
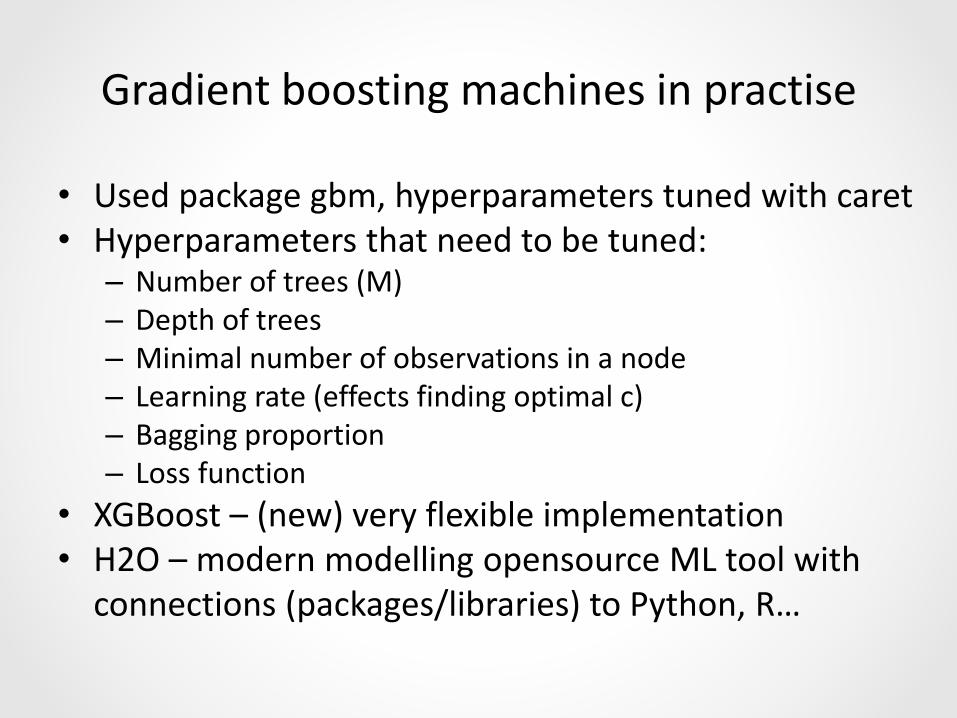
Gradient boosting machines in practise
• Used package gbm, hyperparameters tuned with caret• Hyperparameters that need to be tuned:
– Number of trees (M)– Depth of trees– Minimal number of observations in a node– Learning rate (effects finding optimal c)– Bagging proportion– Loss function
• XGBoost – (new) very flexible implementation• H2O – modern modelling opensource ML tool with
connections (packages/libraries) to Python, R…
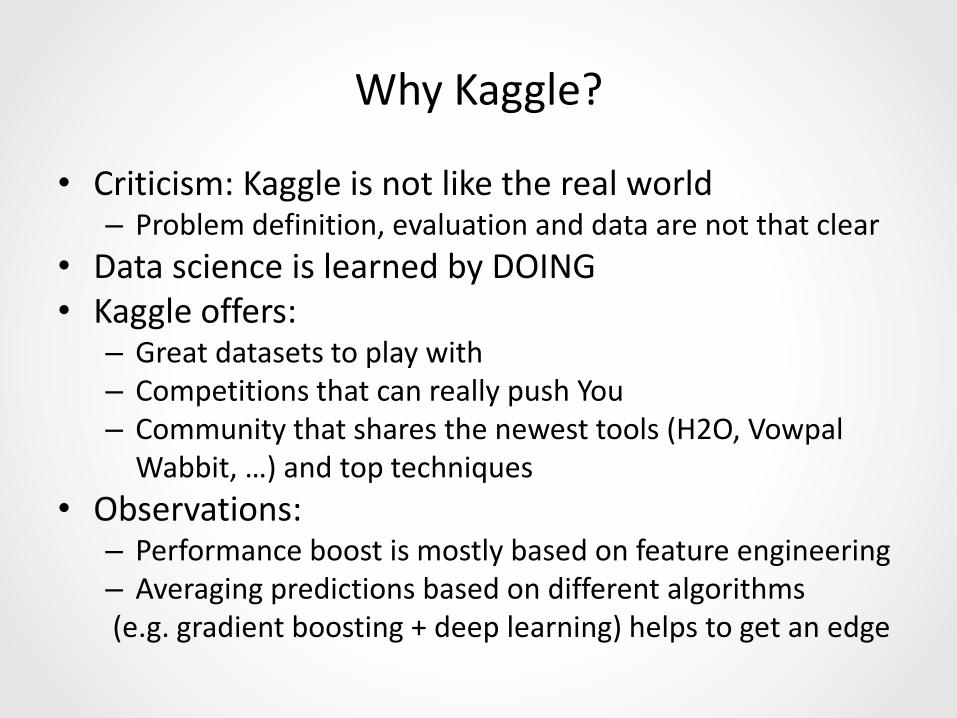
Why Kaggle?
• Criticism: Kaggle is not like the real world – Problem definition, evaluation and data are not that clear
• Data science is learned by DOING• Kaggle offers:
– Great datasets to play with– Competitions that can really push You– Community that shares the newest tools (H2O, Vowpal
Wabbit, …) and top techniques
• Observations:– Performance boost is mostly based on feature engineering– Averaging predictions based on different algorithms(e.g. gradient boosting + deep learning) helps to get an edge
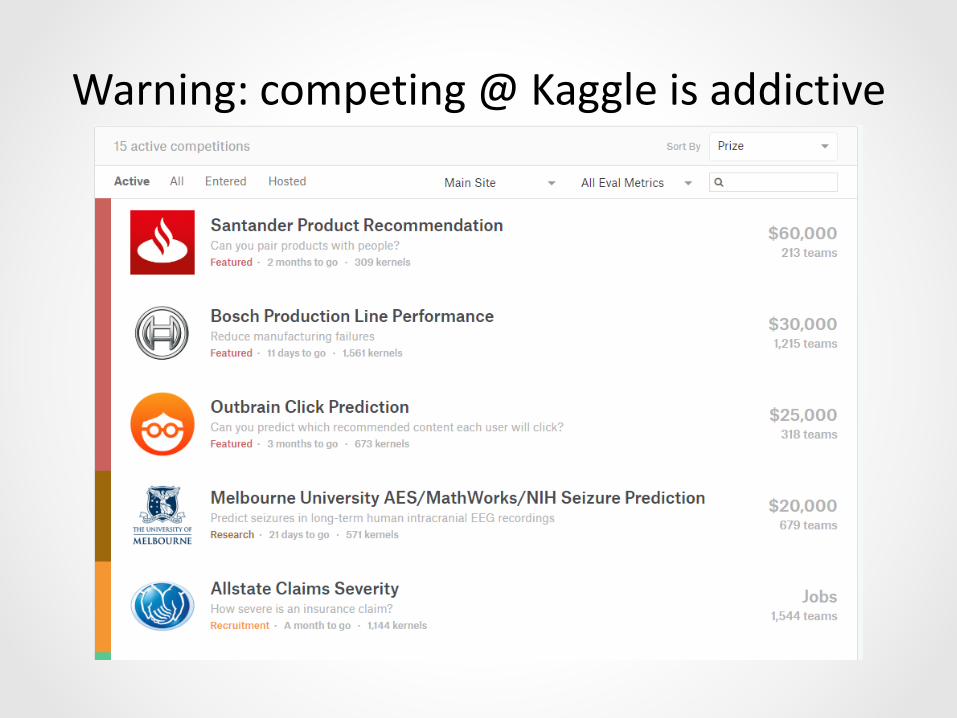
Warning: competing @ Kaggle is addictive

Q&A