Embed Size (px)
Citation preview

Competing in a changing world: A comparison between DSM
and Solvay in the chemical industry, 1970-2010
Arjan van Rooij Radboud University Nijmegen [email protected]
Ernst Homburg Maastricht University [email protected]
Draft, version: 16 August 2013
WORK IN PROGRESS; please do not quote, cite, circulate!
Abstract (194 words)
Throughout the twentieth century the chemical industry has changed profoundly in its competitive
makeup and geographical spread. In this paper we draw comparisons between two multinational
chemical companies, DSM and Solvay, and focus on two bulk chemicals, ammonia and soda ash
respectively. At the group level, both DSM and Solvay have been successful companies but the
strategies they pursued in bulk chemicals were very different. DSM exported ammonia fertilizers
all over the globe until 1970 but competition from Asia and the oil states have confined the large
plants to mainly supplying the agricultural market within a radius of ca. 400 km. Solvay, by
contrast, selectively invested in its soda ash plants located near sea ports, and is still exporting its
products globally. Comparing Solvay and DSM begs the question how this happened and why,
and ultimately how one company survived with bulk chemicals and the other without. We analyze
markets, technologies, feedstocks and strategy to answer these questions. We argue that control
over feedstock and technology is crucial. In addition, the large but slowly growing markets with
their cycles of boom and bust require commitment; business strategy, in other words, plays a
crucial role.
Acknowledgements
Previous versions of this paper were presented in Kyoto (February 2013), Nijmegen (May 2013)

Competing in a changing world: A comparison between DSM
and Solvay in the chemical industry, 1970-2010
An economist looking at the European petrochemical industry in the early 1990s, concluded that
the sector was coping with a "mid-life crisis": it was stuck with modest growth, and modest
prospects; its best days were behind it.1 Indeed, the European chemical industry has changed
profoundly since 1970 with new entrants growing quickly and established companies changing
face completely. Particularly bulk chemical products, produced in large quantities and sold on the
basis of their chemical composition, have been subject to fundamental change and profound
shifts in the geographical focus on production. In this paper, we focus on two companies, Solvay
from Belgium and DSM from the Netherlands, and two bulk chemicals, soda ash and ammonia
respectively, and analyze how these companies coped with these changes. The headquarters, as
well as the origins, of both companies are situated in two small, neighboring countries, with
strongly export oriented economies. It is therefore interesting to investigate the regional dynamics
of these two rather similar cases under the influence of recent global forces.
A long tradition of scholarship focuses on growth, competitiveness and catch-up of
nations; recently regions and industries have also attracted substantial attention.2 In addition, life
cycle models of technologies, firms and industries typically include a phase of maturation and
decline that appears simply an inevitable and automatic consequence of the progression of time;
at some point in time a technology is born and, as fact of life, at some point it dies.3 For
chemicals, several studies have described the competitive and geographic shift from Western
Europe, the United States and Japan to the Middle East and Asia.4 In addition, several industry-
level studies have drawn conclusions on the generic drivers of change.5 The picture that emerges
1 Willem Molle (1993). Oil refineris and petrochemical industries: Coping with the mid-life crisis. Henk W. de
Jong, Ed. The structure of the European industry. Dordrecht: Kluwer Academic Publishers, 43-63: 43, 61-62. 2 For instance: Moses Abramovitz (1986). Catching up, forging ahead, and falling behind. Journal of
Economic History 46(2), 385-406. Terutomo Ozawa (2011). The (Japan-born) ‘Flying-Geese’ theory of economic development revisited - and reformulated from a structuralist perspective. Global Policy 2(3), 272-
285. 3 Angela M. O'Rand & Margaret L. Krecker (1990). Concepts of the life-cycle: Their history, meanings, and
uses in the social sciences. Annual Review of Sociology 16(1), 241-262. 4 Keith Chapman (1991). The international petrochemical industry: Evolution and location. Oxford: Blackwell.
5 Peter H. Spitz, Ed. (2003). The chemical industry at the millennium: Maturity, restructuring, and
globalization. Philadelphia: Chemical Heritage Press. Louis Galambos, Takashi Hikino & Vera Zamagni, Eds. (2007). The global chemical industry in the age of the petrochemical revolution. Cambridge: Cambridge University Press.
3
from these studies is rather bleak; Western chemical companies have sought their business
elsewhere, outside the bulk chemicals sectors or have performed poorly. For instance, a study on
Norsk Hydro, the Norwegian chemicals, metals and energy company, argues that the expansion
of its fertilizer division after 1978, so in the face of tough competition, failed to pay off; Norsk
Hydro struggled to make a profit (at the level it thought necessary) and the results for
shareholders were disappointing. This study argues that Norsk Hydro reacted too late to the
shifting competitive fabric of the industry and, ultimately, made the wrong decision to expand.6
We nuance the macro-level story of maturation and decline by providing case studies of
two chemical firms, DSM from the Netherlands and Solvay from Belgium, and of two products,
ammonia and soda ash respectively. In a nutshell, Solvay and DSM, and the strategies they
pursued, can be considered two extremes of a spectrum of possible strategies firms deployed to
cope with the profound shifts in (the chemical) industry since 1970. Solvay was a first mover in
soda ash in the late nineteenth century and has maintained its leading position up till this day.
DSM was a late mover in ammonia and gradually retreated after 1970, culminating in the sale of
the fertilizer division in 2010.
Studying DSM and Solvay, in other words, provides us with an example of a firm that
seems to conform to the general macro-level picture, and one that does not. In this paper, we ask
how this was possible and why this happened. We focus our analysis on three key dimensions in
bulk chemicals: technologies, feedstocks and markets. In this perspective, keeping control of
technology and feedstock is crucial but often difficult. An extensive market for ammonia
technology developed early in the twentieth century, enabling DSM to enter fertilizers in 1930 but
also the oil states forty years later. The switch from coal-based to hydrocarbon feedstock also
meant a loss of control of feedstocks for DSM. Solvay was able to maintain its technological
leadership and was vertically integrated, keeping tight control over feedstocks.
This paper is a comparative history of important divisions within two chemical companies,
put in the overall frame of the strategies these companies pursued. Most studies on the history of
the chemical industry focus on the industry as a whole or only one company. Although most
studies do attempt to put their case into the context of the industry, some single case studies do
not even attempt to generalize beyond that specific case.7 Single case studies are also
notoriously hard to generalize, particularly in such a diverse and complex industry such as
chemicals.8 Simply doing more case studies does not solve this issue and runs the risk of blurring
into an industry-level study.9 Undisguised industry-level studies often take a thematic approach
6 Einar Lie (2008). Market power and market failure: The decline of the European fertilizer industry and the
expansion of Norsk Hydro. Enterprise and Society 9(1), 70-95. 7 Particularly books. See, for instance, the excellent study of BASF that is only about BASF: Werner
Abelshauser, Ed. Die BASF: eine Unternehmensgeschichte. München: Beck. 8 See for instance the history of the R&D labs: Ernst Homburg (1992). The emergence of research
laboratories in the dyestuffs industry. British Journal for the History of Science 25(1), 91-111. 9 Alfred D. Chandler (2005). Shaping the industrial century. The remarkable story of the modern chemical
and pharmaceutical industries. Cambridge, MA: Harvard University Press.

4
and focus on countries and, consequently, say less about firms and their strategies.10
In this
paper we focus on the firm-level and analyze companies and products that are comparable yet
displayed a different outcome. In this way, we may not only learn how firms responded to the
changing challenges after 1970 (as would be the case in a single case study); we may also learn
what is decisive in shaping that response.11
Consequently, we selected two comparable products: ammonia and soda ash are both
so-called bulk chemicals that are manufactured in high volumes and sold on the basis of their
composition. We also selected two comparable companies. The ownership structure of these two
firms was special, DSM being a fully state-owned firm until 1989 and Solvay being run by
(descendents of) the Solvay family, but the two firms are comparable in size and position in the
chemical industry. Moreover, both firms emerged with two neighboring, export-oriented countries;
so they share the same regional basis. Both companies were substantial by 1970 and continued
to grow over the period under study here, although DSM grew more quickly in the 1970s (Figure
1). Compared to industry leaders, however, both companies were mid-sized.12
This paper proceeds as follows. First, we outline our analytical framework to explain
competition in bulk chemicals. Subsequently, we sketch the history of Solvay and DSM before
1970 and sketch the generic drivers of change in the chemical industry of the 1970s. The next
two sections analyze DSM and Solvay after 1970.
Figure 1: Sales of Solvay and DSM – compared (in million €)
10 Spitz 2003; Galambos et al. 2007.
11 Inspired by: John Gerring (2007). Case study research: Principles and practices. Cambridge: Cambridge
University Press. 12
E.g. ICIS Top 100 Chemical Companies (2011). ICIS Chemical Business, 10-16 September 2011.
5
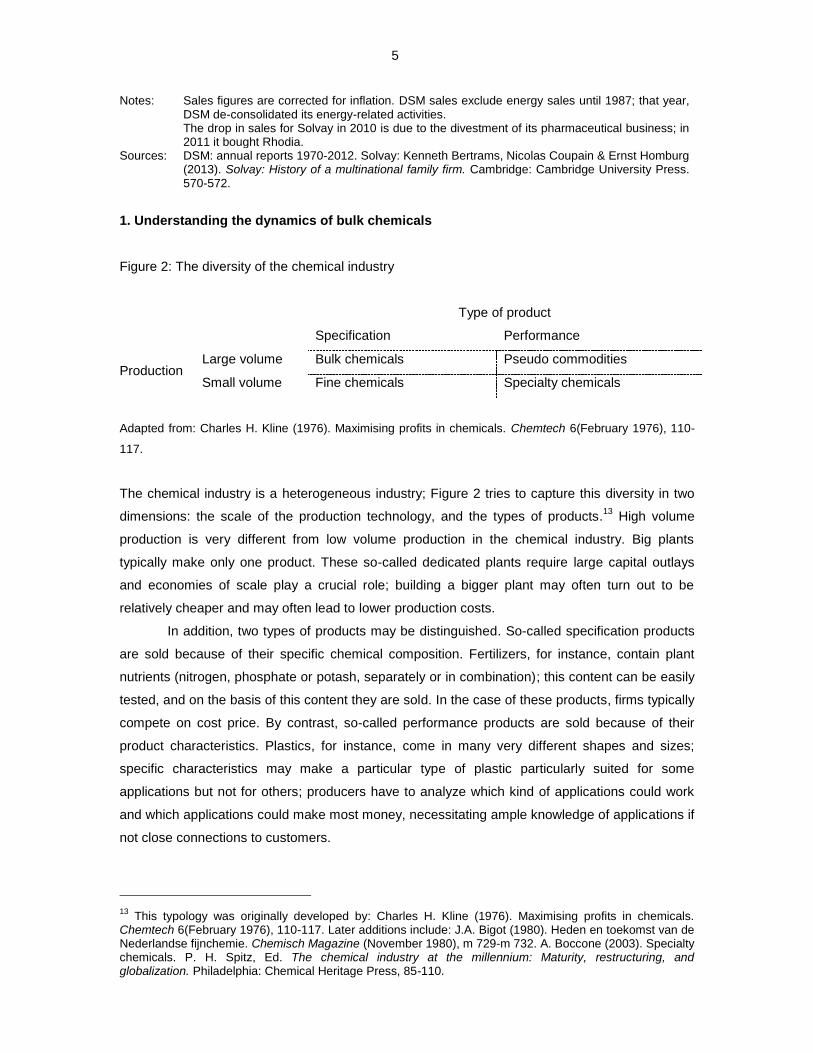
Notes: Sales figures are corrected for inflation. DSM sales exclude energy sales until 1987; that year, DSM de-consolidated its energy-related activities.
The drop in sales for Solvay in 2010 is due to the divestment of its pharmaceutical business; in 2011 it bought Rhodia.
Sources: DSM: annual reports 1970-2012. Solvay: Kenneth Bertrams, Nicolas Coupain & Ernst Homburg (2013). Solvay: History of a multinational family firm. Cambridge: Cambridge University Press. 570-572.
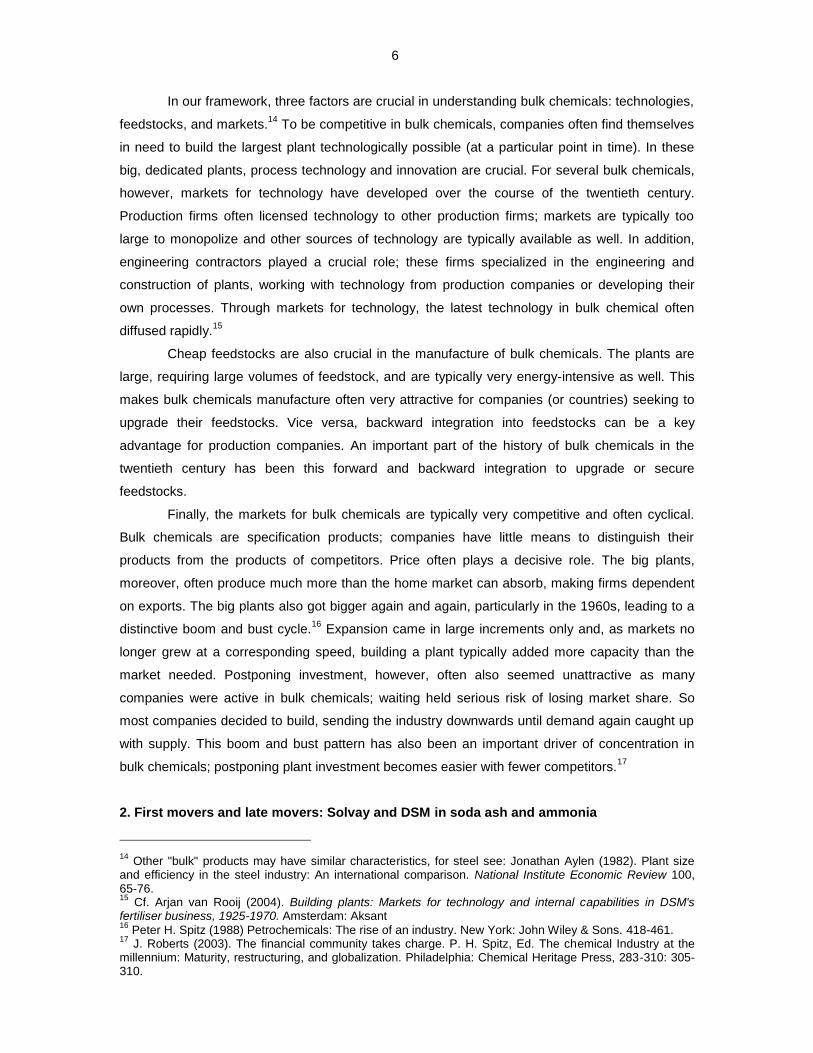
1. Understanding the dynamics of bulk chemicals
Figure 2: The diversity of the chemical industry
Type of product
Specification Performance
Production Large volume Bulk chemicals Pseudo commodities
Small volume Fine chemicals Specialty chemicals
Adapted from: Charles H. Kline (1976). Maximising profits in chemicals. Chemtech 6(February 1976), 110-
117.
The chemical industry is a heterogeneous industry; Figure 2 tries to capture this diversity in two
dimensions: the scale of the production technology, and the types of products.13
High volume
production is very different from low volume production in the chemical industry. Big plants
typically make only one product. These so-called dedicated plants require large capital outlays
and economies of scale play a crucial role; building a bigger plant may often turn out to be
relatively cheaper and may often lead to lower production costs.
In addition, two types of products may be distinguished. So-called specification products
are sold because of their specific chemical composition. Fertilizers, for instance, contain plant
nutrients (nitrogen, phosphate or potash, separately or in combination); this content can be easily
tested, and on the basis of this content they are sold. In the case of these products, firms typically
compete on cost price. By contrast, so-called performance products are sold because of their
product characteristics. Plastics, for instance, come in many very different shapes and sizes;
specific characteristics may make a particular type of plastic particularly suited for some
applications but not for others; producers have to analyze which kind of applications could work
and which applications could make most money, necessitating ample knowledge of applications if
not close connections to customers.
13 This typology was originally developed by: Charles H. Kline (1976). Maximising profits in chemicals.
Chemtech 6(February 1976), 110-117. Later additions include: J.A. Bigot (1980). Heden en toekomst van de Nederlandse fijnchemie. Chemisch Magazine (November 1980), m 729-m 732. A. Boccone (2003). Specialty chemicals. P. H. Spitz, Ed. The chemical industry at the millennium: Maturity, restructuring, and globalization. Philadelphia: Chemical Heritage Press, 85-110.
6
In our framework, three factors are crucial in understanding bulk chemicals: technologies,
feedstocks, and markets.14
To be competitive in bulk chemicals, companies often find themselves
in need to build the largest plant technologically possible (at a particular point in time). In these
big, dedicated plants, process technology and innovation are crucial. For several bulk chemicals,
however, markets for technology have developed over the course of the twentieth century.
Production firms often licensed technology to other production firms; markets are typically too
large to monopolize and other sources of technology are typically available as well. In addition,
engineering contractors played a crucial role; these firms specialized in the engineering and
construction of plants, working with technology from production companies or developing their
own processes. Through markets for technology, the latest technology in bulk chemical often
diffused rapidly.15
Cheap feedstocks are also crucial in the manufacture of bulk chemicals. The plants are
large, requiring large volumes of feedstock, and are typically very energy-intensive as well. This
makes bulk chemicals manufacture often very attractive for companies (or countries) seeking to
upgrade their feedstocks. Vice versa, backward integration into feedstocks can be a key
advantage for production companies. An important part of the history of bulk chemicals in the
twentieth century has been this forward and backward integration to upgrade or secure
feedstocks.
Finally, the markets for bulk chemicals are typically very competitive and often cyclical.
Bulk chemicals are specification products; companies have little means to distinguish their
products from the products of competitors. Price often plays a decisive role. The big plants,
moreover, often produce much more than the home market can absorb, making firms dependent
on exports. The big plants also got bigger again and again, particularly in the 1960s, leading to a
distinctive boom and bust cycle.16
Expansion came in large increments only and, as markets no
longer grew at a corresponding speed, building a plant typically added more capacity than the
market needed. Postponing investment, however, often also seemed unattractive as many
companies were active in bulk chemicals; waiting held serious risk of losing market share. So
most companies decided to build, sending the industry downwards until demand again caught up
with supply. This boom and bust pattern has also been an important driver of concentration in
bulk chemicals; postponing plant investment becomes easier with fewer competitors.17
2. First movers and late movers: Solvay and DSM in soda ash and ammonia
14 Other "bulk" products may have similar characteristics, for steel see: Jonathan Aylen (1982). Plant size
and efficiency in the steel industry: An international comparison. National Institute Economic Review 100, 65-76. 15
Cf. Arjan van Rooij (2004). Building plants: Markets for technology and internal capabilities in DSM's fertiliser business, 1925-1970. Amsterdam: Aksant 16
Peter H. Spitz (1988) Petrochemicals: The rise of an industry. New York: John Wiley & Sons. 418-461. 17
J. Roberts (2003). The financial community takes charge. P. H. Spitz, Ed. The chemical Industry at the millennium: Maturity, restructuring, and globalization. Philadelphia: Chemical Heritage Press, 283-310: 305-310.
7
Solvay: The man, the technology, and the expansion of the business18
Soda ash -- used many in the glass, soap and steel industries -- was produced industrially on a
massive scale already for decades by the so-called Leblanc process, when the young Belgian
self-made chemist Ernest Solvay (1838-1922) patented another process, that produced less
waste and that was potentially more economic. Together with his brother Alfred and his friend
Louis Acheroy they started developing this so-called ammonia-soda process at an industrial
scale. With the help of their family and of local entrepreneurs they set the partnership Solvay &
Cie. at Couillet, Belgium, in December 1863. Situated at the heart of the industrial region around
Charleroi, with its many glass-making firms, and close to coal-mines and limestone quarries (two
of the three crucial raw materials, next to salt), the Couillet plant was built at a good location. By
that time, the Solvay brothers had discovered that their process was not new at all. It had been
patented before, and others had tried unsuccessfully to develop the process on a large scale. The
first few years of the company were very difficult therefore, but Ernest and Alfred Solvay and their
co-workers succeeded in finding several smaller and larger technical improvements, that were all
patented, so that by the end of the 1860s for the first time a small profit could be noted.
From then on the business expanded quickly. As soon as all the technical difficulties had
been overcome, it appeared that the Solvay company could produce soda-ash at a cost price that
was below the competing Leblanc products. As a result, demand grew quickly, and profits grew
accordingly every year. They were reinvested in the expansion of the business. The second pillar
under the company’s success was patenting. One of the silent partners in the firm, Eudore
Pirmez, was a lawyer, and was very good in formulating the patents of the firm, and submitted
them in almost every important industrial country in Europe and North-America. In 1872, Ernest
Solvay was contacted by Ludwig Mond, a German chemist with a strong experience in the British
soda ash industry, who asked for licenses on Solvay’s British patents. After an agreement was
reached, the company Brunner and Mond was founded, a plant was constructed at Northwich in
1873. Solvay received a fixed fee of eight shillings for every ton of soda ash produced. The
quickly expanding British soda ash business soon became an enormous cash-cow for Solvay.
Mond also appeared to be a technical genius, and he contributed significantly to the improvement
of the Solvay process. There improvements were also introduced in other plants of the Solvay
group that would soon be constructed.
The first of these was a large plant at Dombasle, near Nancy in France, constructed in
1873, parallel to the plant at Northwich. One of the disadvantages of the original plant at Couillet
was that rock salt was not found locally, it had to be transported to the plant. In the early 1870s
Solvay therefore searched for locations in northern France where salt deposits, coal mines and
8
lime stone quarries would all be present. Dombasle was such a place. In view of the far larger
French market, as compared to Belgium, a big plant was constructed that included all the
improvements developed at Couillet, as well as by Ludwig Mond. It would become the ‘model
plant’ of the group.
With plants in Belgium, France and Britain, by 1880 large earnings were coming in
uninterruptedly. Often together with local partners, Solvay & Cie. started a process of
international expansion, protected by a network of local patents, and by only selecting sites where
all three feedstocks (salt, limestone, coal) were available. In 1880 the company started its first
plant in Germany, in 1881 in both Russia and the USA, and in 1883 in Austria, Before the First
World War also subsidiaries and plants were established in Rumania, Poland, Bohemia, Spain,
Bosnia and Italy.
In order to coordinate that network a third pillar under Solvay expansion was constructed:
a system of technical reporting, started in a modest way in 1875, and perfected during the 1880s,
when also a central technical department was established inside the Brussels headquarters of the
Group. In this way the technical efficiency of plants was monitored on a monthly basis, and the
improvements and ‘best practices’ of one plant were communicated to the others. With this
system of centralized communication within the Solvay Group, and utmost secrecy towards
outsiders, Solvay succeeded in reaching a global technical supremacy in the field of soda ash
technology.
This technical supremacy was complemented by a careful commercial strategy with two
key ingredients: the conclusion of cartel agreements with almost all the major competitors, and a
price setting of soda ash with a sales price just below the commercial price of Leblanc producers,
despite that fact that Solvay’s cost price was far lower. In that way it was avoided that the Leblanc
producers would panic, and try to imitate the Solvay process. They were killed slowly, but
steadily, while Solvay was gaining huge profits at the same time. By 1886 the world production by
the Solvay process about equaled the production by the Leblanc process, and by about 1920 the
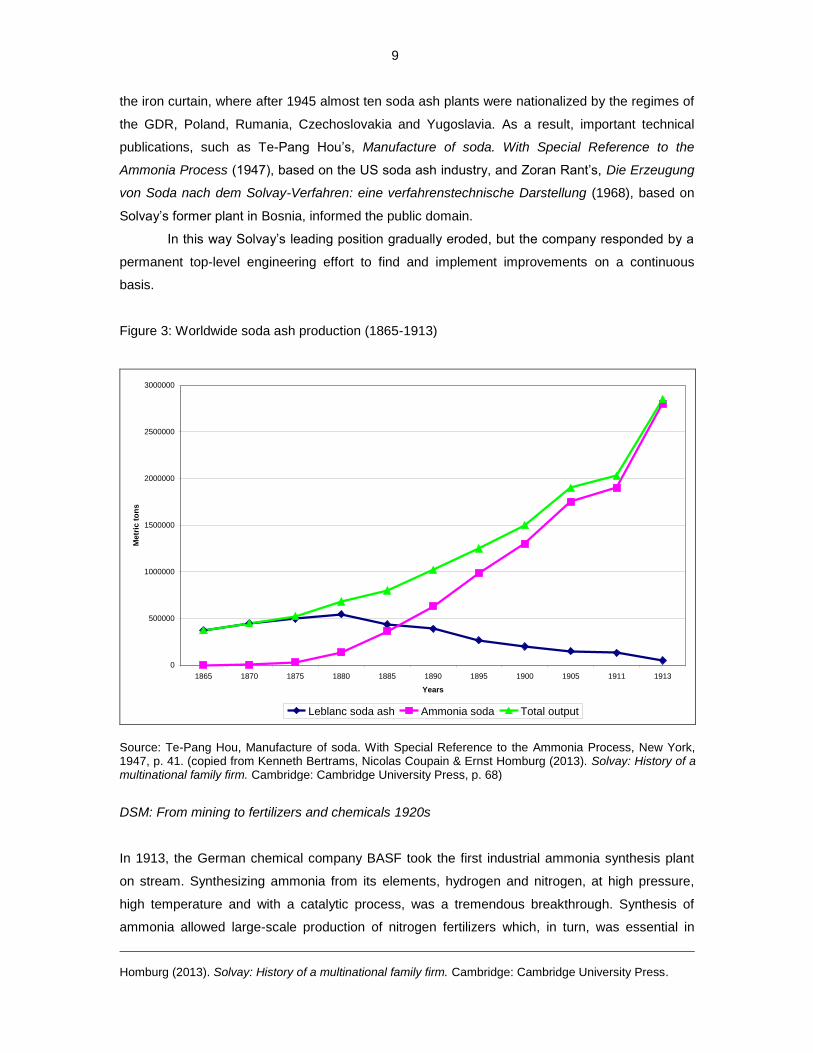
last Leblanc soda ash plant closed its doors. (Figure 3)
The Solvay Group implemented a policy of utmost secrecy in all technical matter, in order
to protect its global technical and commercial monopoly. But in the course of time a few ‘leaks’
emerged through which technical details started to circulate in the outside world. The first of these
was the United States, where labor contracts were less rigid than in Europe. Technical experts
and workmen of the Solvay Process Company at Syracuse left the company and started working
for competitors, such as the Mathieson Alkali Works, founded in 1892, and the Michigan Alkali
Co. starting in 1894. Between 1892 and 1910 five large ammonia-soda plants were established in
the United States. The second leak was Soviet Russia, that nationalized the three Russian plants
of the Solvay Group after 1917. The third major leak, finally, was the Eastern European side or
18 This section is based on: Nicolas Coupain, ‘The pioneering years (1863-1914): The quest for leadership
and the first stages of the internalization,’ pp. 7-147 in: Kenneth Bertrams, Nicolas Coupain & Ernst
9
the iron curtain, where after 1945 almost ten soda ash plants were nationalized by the regimes of
the GDR, Poland, Rumania, Czechoslovakia and Yugoslavia. As a result, important technical
publications, such as Te-Pang Hou’s, Manufacture of soda. With Special Reference to the
Ammonia Process (1947), based on the US soda ash industry, and Zoran Rant’s, Die Erzeugung
von Soda nach dem Solvay-Verfahren: eine verfahrenstechnische Darstellung (1968), based on
Solvay’s former plant in Bosnia, informed the public domain.
In this way Solvay’s leading position gradually eroded, but the company responded by a
permanent top-level engineering effort to find and implement improvements on a continuous
basis.
Figure 3: Worldwide soda ash production (1865-1913)
0
500000
1000000
1500000
2000000
2500000
3000000
1865 1870 1875 1880 1885 1890 1895 1900 1905 1911 1913
Years
Metr
ic t
on
s
Leblanc soda ash Ammonia soda Total output
Source: Te-Pang Hou, Manufacture of soda. With Special Reference to the Ammonia Process, New York, 1947, p. 41. (copied from Kenneth Bertrams, Nicolas Coupain & Ernst Homburg (2013). Solvay: History of a multinational family firm. Cambridge: Cambridge University Press, p. 68)
DSM: From mining to fertilizers and chemicals 1920s
In 1913, the German chemical company BASF took the first industrial ammonia synthesis plant
on stream. Synthesizing ammonia from its elements, hydrogen and nitrogen, at high pressure,
high temperature and with a catalytic process, was a tremendous breakthrough. Synthesis of
ammonia allowed large-scale production of nitrogen fertilizers which, in turn, was essential in
Homburg (2013). Solvay: History of a multinational family firm. Cambridge: Cambridge University Press.
10
boosting the productivity of agriculture. In addition, ammonia opened a path to the production of
explosives and munitions.19
BASF ultimately failed to monopolize ammonia synthesis technology
(although it surely tried); the double attractions of food and war pulled other production
companies, state-subsidized laboratories and engineering contractors to start developing their
own processes. By the mid-1920s, ammonia synthesis processes were widely available and
several engineering contractors were on the market with complete plants. What triggered a
building boom was cheap hydrogen from coke oven gas. Manufacture of coke, an industrial fuel
made from bituminous coal, was an established business, leading to large amounts of coke oven
gas as a by-product. The gas could be sold for heating and lighting purposes but contained
hydrogen as well; that hydrogen, moreover, could be removed relatively simply. Many coking
firms decided to enter fertilizers; there were already 39 ammonia plants in 1927 but by 1936 there
were no less than 105 and capacity had increased almost 6 times.20
DSM was part of this building boom. Established in 1902 as a mining company by the
Dutch state, it built two large coking plants in the 1910s and 1920s and entered large-scale
fertilizer production in 1930.21
The market, however, could not keep up with the jump in
production, and prices dropped amid a generally miserable macro-economic climate. The
nitrogen fertilizer industry, led by European firms in particular, cartelized and stabilized the
market. Until into the 1960s, the industry lived by the principle of "home markets for home
producers"; the shortfall in domestic supply was met by foreign producers and other export
markets, particularly in the Far East, were shared (or divided) as well.22
In the Netherlands, the
three nitrogen fertilizer producers established a central sales office to regulate supply and
demand.
DSM's strategy in the fertilizer industry was one of expansion. Already in 1930, when
prices dropped much further and faster than anticipated, DSM expanded its plants and dwarfed
the other two Dutch nitrogen fertilizer producers. After the Second World War, the company
continued to expand. The coal mining operations flourished but DSM's executive board wanted to
grow a second leg in chemicals and diversified into new business (in fiber intermediates and
plastics in particular) and expanded existing chemical businesses (fertilizers in particular). The
company also invested heavily in R&D, leading to, in fertilizers, a world class production process
for urea, a key export product.23
19 Anthony S. Travis (1998). High pressure industrial chemistry: The first steps, 1909-1913, and the impact.
Anthony S. Travis, Harm G. Schröter, Ernst. Homburg & Peter J. T. Morris, Eds. Determinants in the evolution of the chemical industry, 1900-1939: New technologies, political frameworks, markets and companies. Dordrecht: Kluwer Academic Publishers, 3-21. 20
Arjan van Rooij (2005b). Engineering contractors in the chemical industry: The development of ammonia processes, 1910-1940. History and Technology 21(4), 345-366. 21
Arjan van Rooij (2004). Building plants: Markets for technology and internal capabilities in DSM's fertiliser business, 1925-1970. Amsterdam: Aksant. 61-89. 22
See: G.W. Stocking & M.W. Watkins (1946). Cartels in action. New York: Twentieth Century Fund. 118-130. Th. P. van Berkel (1997). Thirty-five years of Nitrex AG. Zurich: Nitrex AG. 23
Arjan van Rooij (2007). The company that changed itself: R&D and the transformations of DSM. Amsterdam: Amsterdam University Press. 59-136.
11
By the late 1960s, DSM was a very large producer of nitrogen fertilizers. The company
produced about nine thousand tonnes of nitrogen in ammonia in 1930; this grew to almost 430
thousand tonnes forty years later.24
The production site in Geleen (in the south of the
Netherlands) was the third largest in Europe (see Table 1). DSM also focused production on one
site.25
ICI, by comparison, had a very large site in Billingham (where it had opened its first
ammonia plant in 1923) but also operated two much smaller sites. Similarly, in urea, the main
export nitrogen fertilizer, DSM was very large; in 1964, DSM had the second largest production
capacity for urea installed on one site; only Du Pont, a much larger American company, had a
larger site.26
Nitrogen fertilizers were also very important for the company; it was a large business that,
symbolically, marked the entry of the mining company into the chemical industry. Mining and
coking struggled around 1960 to make a profit, partly as a result of the discovery of huge natural
gas deposits in the Netherlands, prompting the Dutch government to decide in 1965 to close
down coal mining altogether, and making further expansion in chemicals a necessity if the
company were to survive and to provide much-needed jobs in the region.27
In its expansion, DSM increasingly relied on exports. Consumption of nitrogen fertilizers
in the Netherlands was relatively high, and continued to grow until the mid-1980s, but DSM and
the Dutch industry also exported large amounts (see Table 2). The principle of "home markets for
home producers" ensured stable prices on the Dutch market but export markets were volatile.
China and India became important importers of fertilizers but central government agencies
bought fertilizers in these countries and got substantial buyer power because of the volumes
involved. Prices were lower than on the Dutch markets and continued to drop in the 1950s and
'60s.28
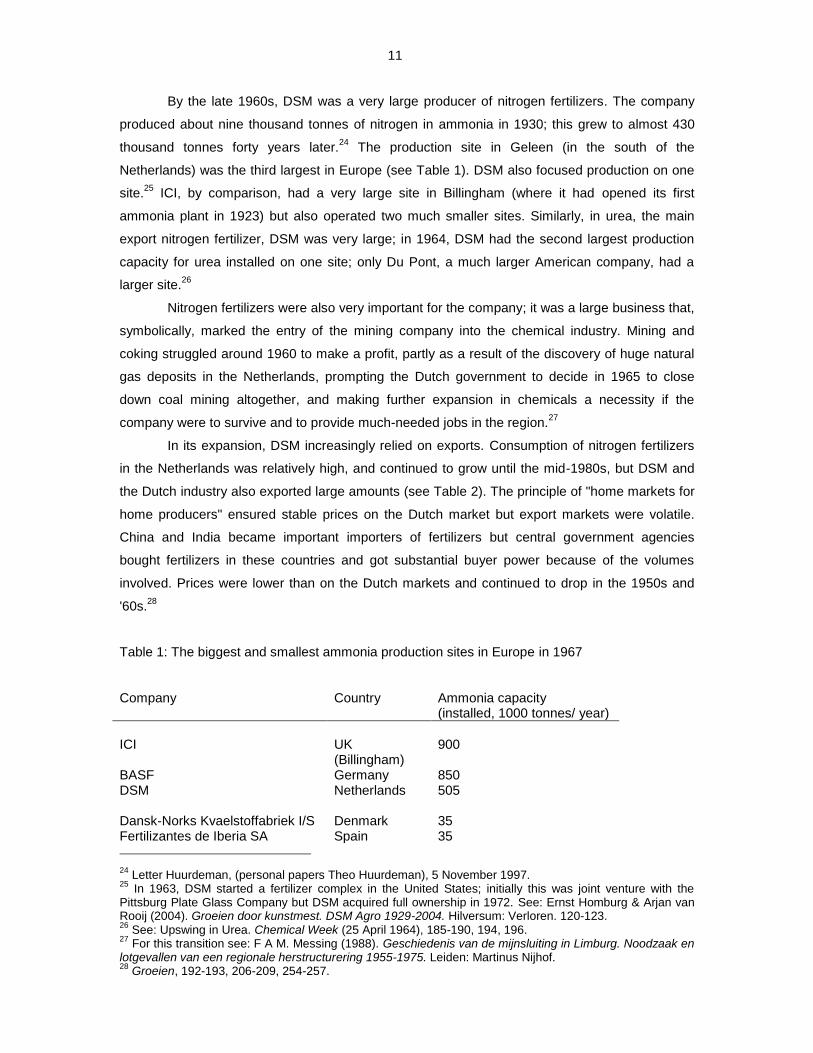
Table 1: The biggest and smallest ammonia production sites in Europe in 1967
Company Country Ammonia capacity (installed, 1000 tonnes/ year)
ICI UK
(Billingham) 900
BASF Germany 850 DSM Netherlands 505 Dansk-Norks Kvaelstoffabriek I/S Denmark 35 Fertilizantes de Iberia SA Spain 35
24 Letter Huurdeman, (personal papers Theo Huurdeman), 5 November 1997.
25 In 1963, DSM started a fertilizer complex in the United States; initially this was joint venture with the
Pittsburg Plate Glass Company but DSM acquired full ownership in 1972. See: Ernst Homburg & Arjan van Rooij (2004). Groeien door kunstmest. DSM Agro 1929-2004. Hilversum: Verloren. 120-123. 26
See: Upswing in Urea. Chemical Week (25 April 1964), 185-190, 194, 196. 27
For this transition see: F A M. Messing (1988). Geschiedenis van de mijnsluiting in Limburg. Noodzaak en lotgevallen van een regionale herstructurering 1955-1975. Leiden: Martinus Nijhof. 28
Groeien, 192-193, 206-209, 254-257.
12
Source: A. Erdely (1968). European petrochemical facts. Park Ridge, NJ: Noyes
Development Corporation. 16-24.
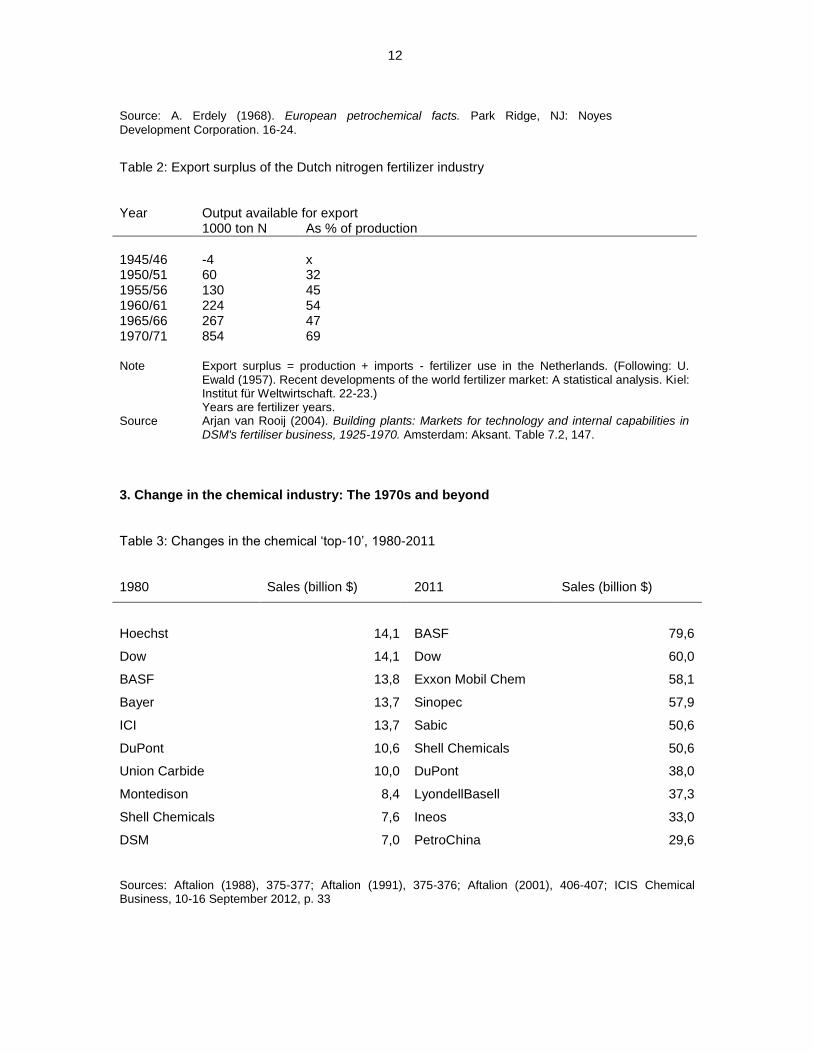
Table 2: Export surplus of the Dutch nitrogen fertilizer industry
Year Output available for export 1000 ton N As % of production
1945/46 -4 x 1950/51 60 32 1955/56 130 45 1960/61 224 54 1965/66 267 47 1970/71 854 69 Note Export surplus = production + imports - fertilizer use in the Netherlands. (Following: U.
Ewald (1957). Recent developments of the world fertilizer market: A statistical analysis. Kiel: Institut für Weltwirtschaft. 22-23.) Years are fertilizer years.
Source Arjan van Rooij (2004). Building plants: Markets for technology and internal capabilities in DSM's fertiliser business, 1925-1970. Amsterdam: Aksant. Table 7.2, 147.
3. Change in the chemical industry: The 1970s and beyond
Table 3: Changes in the chemical ‘top-10’, 1980-2011
1980 Sales (billion $) 2011 Sales (billion $)
Hoechst 14,1 BASF 79,6
Dow 14,1 Dow 60,0
BASF 13,8 Exxon Mobil Chem 58,1
Bayer 13,7 Sinopec 57,9
ICI 13,7 Sabic 50,6
DuPont 10,6 Shell Chemicals 50,6
Union Carbide 10,0 DuPont 38,0
Montedison 8,4 LyondellBasell 37,3
Shell Chemicals 7,6 Ineos 33,0
DSM 7,0 PetroChina 29,6
Sources: Aftalion (1988), 375-377; Aftalion (1991), 375-376; Aftalion (2001), 406-407; ICIS Chemical Business, 10-16 September 2012, p. 33
13
When Alfred D. Chandler published his famous book Scale and Scope: The Dynamics of
Industrial Capitalism in 1990, several large chemical companies, that had emerged during the
Second Industrial Revolution, figured prominently in that book: the three German IG Farben
successors – BASF, Bayer, and Hoechst – the British giant ICI, and American companies such as
DuPont and Union Carbide. Obviously these companies had developed successful organizational
capabilities, so that they could keep their positions as industry leaders for almost a century.
Today though, that situation has changed completely. Between about 1980 and 2010 a
‘revolution’ took place in the chemical industry, and in several other industries as well (Table 3)
Although some companies – BASF, Dow, PuPont and Shell Chemicals – have
successfully kept their positions within the ‘top-10’, others have completely disappeared, and don
not exist anymore (Hoechst, ICI, Union Carbide). They, and companies that dropped out of the
top-10, were replaced the chemical divisions by oil companies (e.g. Exxon Mobil), by companies
from China (Sinopec, PetroChina) and Saudi Arabia (Sabic), or by newly founded companies that
resulted from large scale port-folio rearrangements (LyondellBasell, Ineos).
In order to better understand the dynamics of the industry, it is important to distinguish
between different developments that took place, and analyze the ‘drivers’ behind them.29
The first
of these developments relates to the changing relationship between the chemical and
pharmaceutical industries. After a rapprochement between these two industries during the 1960s,
1970s and early 1980s, then several large chemical companies took over small pharmaceutical
companies, or expanded their existing pharmaceutical businesses (e.g. BASF, Dow, DuPont, ICI,
Hoechst), after about 1990 the trend reversed, and many ‘mixed’ chemical-pharmaceutical
companies were split-up into their chemical and pharmaceutical parts. Major cases in point are
Hoechst, that – apart from divestments to several existing companies -- was dissolved into a
pharmaceutical (Aventis, now part of Sanofi) and a chemical branch (Clariant), and ICI, that was
split-up into a pharmaceutical company (Zeneca), a fertilizer producer (Brunner Mond, now part of
Tata Chemicals), and a coatings company (‘new ICI’, now part of Akzo Nobel); moreover, the
PVC activities were sold to Ineos. The formation of more focused pharmaceutical companies was
followed during the last two decades by numerous mergers in the pharmaceutical field, giving rise
to giants such as Pfizer, Novartis, Merck, Sanofi, AstraZeneca, Roche and GlaxoSmithKline.
Major drivers of these developments are of two different kinds. In the first place, a very
important role has been played by the dynamics of the financial and stock markets during the last
three decades: increased importance of ‘shareholder value’, and the rise of aggressive venture
capitalists and hedge funds that often put strong pressures on the leaders of ‘mixed’ companies
29 This section is mainly based on: Peter H. Spitz, Ed. (2003). The chemical industry at the millennium:
Maturity, restructuring, and globalization. Philadelphia: Chemical Heritage Press. Louis Galambos, Takashi Hikino & Vera Zamagni, Eds. (2007). The global chemical industry in the age of the petrochemical revolution. Cambridge: Cambridge University Press; Ernst Homburg, ‘The years of diversification and globalization (1950-2012), pp. 331-564 in: Kenneth Bertrams, Nicolas Coupain & Ernst Homburg (2013). Solvay: History of a multinational family firm. Cambridge: Cambridge University Press; Dr. Udo Jung (BCG =
14
to spit their firms into a high-profit pharmaceutical company, and a lower profit chemical branch.
In the second place, developments within the pharmaceutical production and sales have played a
major role: rising R&D costs and lower success rates in finding new drugs, increased government
regulation of pharmaceutical markets, growing competition from producers of so-called generic
drug, of which the patents have elapsed, and, as a result, increased world-wide competition
between the major players. Increasingly, mergers proved to be necessary to stay in the
innovation race, in order to spread the growing R&D costs over a larger sales volume.
Although countries such as China, India and Brazil are of increasing importance as
producers of generic drugs, the pharmaceutical ‘majors’ are still predominantly American and
European. The USA is still the largest pharmaceutical market by far, followed by Japan and
Europe.
For the chemical industry the situation was rather different. Of course, the influence of
shareholder value and hedge funds also had its impact here, because the splitting-off of the
pharmaceutical divisions had immediate impact on the company that was left behind. Also the
agrochemicals activities were mostly spun-off for similar reasons, on the basis of their higher
profitability (in the case of crop protection and seeds), or the cyclic nature of their profits (as in the
case of nitrogen fertilizers), or because of their higher risk profile (as in the case of Shell
Chemicals). But other factors played a role as well.
In the first place oil feedstocks had a tremendous impact during the period discussed
here. As a result of the first oil shock (1973-1974) many chemical companies started to diversify
into products with higher value added, such as biotech products, complex ceramic products, high
performance plastics and fibers, etc. The second oil shock (1979-1980) reinforced that tendency,
but had at the same time a stronger impact on the profitability of petrochemical bulk chemicals
(plastics and nitrogen fertilizers in the first place). Chemical companies without in-house
petrochemical feedstock suffered heavy losses. As a result, the chemical division of the oil
companies (Exxon Mobile Chemical, Shell Chemicals, Sabic, PetroChina) were able to expand
their activities considerably within the chemical field.
Parallel to these two oils shocks, the Western economies suffered a severe economic
crisis (stagflation, unemployment, low economic growth), and as a result most of the larger
chemical companies re-oriented part of their sales and production to markets with higher growth
rates: Asia (China, India), but also other emerging economies (Mexico, Brazil, and Russia). This
led to a geographical re-distribution of the chemical industry, from USA and Europe to Asia and
other regions of growth. In table 3 this is reflected the growing importance of companies such as
Sinopec, Sabic, and PetroChina.
As a result of rising feedstock prices and lower growth rates in demand the bulk chemical
industry during the 1980s and, especially, the 1990s heavily suffered from lower margins. The
The Boston Consulting Group), ‘The Future of Value Creation in the German Chemical & Pharmaceutical Industry.’ Frankfurt, 19 June 2012. (Achema 2012).
15
classic answer to such situations had been the formation of cartels that could stop the erosion of
market prices. After the US had taken the lead with their anti-cartel policies, the European Union
followed slowly but steadily from about 1980 onwards, when the implementation of already
existing law became increasingly stringent. The answer developed by the industry, as well as by
management consultants, now became: focus on core activities, where your company as a
leading position. During the last two decades this has been a dominant policy followed by most
major chemical companies. Lesser positions were spun-off and sold to companies that were
leaders in those field. Next to that the creation of joint-ventures became a means to enlarge
market power. Typical examples of these trends are the creation in 2000 of Basell by BASF and
Shell Chemical, in 2007 followed by the creation of LyondellBasell, with world dominance in
polypropylene and other polyolefins; and Ineos, established in 1998 by venture capitalists, which
is now one of the major players in vinyls.
As a result of these changing roles of shareholders, feedstock prices and supply, regional
re-distributed growth of consumption, and, finally, mechanisms to gain market power, the
organization of the chemical industry changed completely during the last 20 to 30 years. Contrary
to the 1960s, when diversification was king, now most companies drastically reduced the width of
their product portfolio’s. Only very few companies, BASF in the first place, stuck to the ‘Verbund’
concept of a vertically ànd horizontally integrated company.
4. DSM and ammonia
The changing tide in fertilizers
Around 1970, DSM was faced with a challenging environment in nitrogen fertilizers; technologies,
feedstocks and markets all changed radically. Around 1960 it was clear that the days of the coal-
based chemical industry were numbered. American industry was advancing fast, an expansion
fuelled by oil and natural gas, and in 1959 natural gas was discovered in the Netherlands. DSM
introduced natural gas gradually. After the last coke oven plant closed in 1968, fertilizer
production was completely based on natural gas.30
The switch in feedstocks coincided with a technological change. Ammonia production
consisted of several steps; production of hydrogen and nitrogen was separate from ammonia
synthesis, and a compressor plant was wedged in-between to get the gas mixture at the desired
pressure. Expanding production meant building an additional unit to the plant; in 1966, for
instance, the 11th unit of DSM's synthesis plant started. In the early 1960s, however, M.W.
Kellogg, an American engineering contractor working in close cooperation with the British
chemical company ICI, devised a way to integrate the separate parts of ammonia production and
scale it up at the same time: the so-called single train plant was born; natural gas was fed into it,
16
and ammonia came out of it (as well as carbon dioxide that could be used in urea manufacture).31
Together with ethylene, ammonia was the first product in which this type of scale-up was
achieved.32
Single train ammonia plants came in two flavors only - large (680 tonnes of nitrogen in
ammonia per day) and extra large (1.000 tonnes) - complicating decision-making: the smaller
plant provided only just enough ammonia to replace coal-based ammonia production but the
larger plant provided too much. However, the economies of scale were attractive: ammonia from
the largest plant cost 10% per tonne less than a smaller big plant, a very substantial difference;
compared to the old plant, the big plant was almost 30% cheaper. DSM took the plunge in and
hired an engineering contractor to build largest possible singe-train plant; it started in 1971.33
The fertilizer market changed profoundly as well. On export markets, the balance of
power shifted because feedstock-rich nations entered the fertilizer industry. After the first oil
shock, fertilizer prices rose sharply and countries around the Persian Gulf in the Middle East, but
also Russia (then the Soviet Union) and Trinidad, wanted to upgrade their natural resources by
producing ammonia (and using the ammonia to produce urea). In ammonia and fertilizers,
particularly Western-European producers lost ground; many were landlocked (like DSM) and paid
relatively high prices for natural gas (again like DSM). Although Dutch nitrogen fertilizer producers
typically got the lowest prices of all Dutch consumers, they still struggled to compete with the
prices vertically integrated companies could work with.34
Markets for technology played a crucial role in this shift in the nitrogen fertilizer industry.
Engineering contractors quickly diffused state-of-the-art single-train ammonia plants. Like DSM,
other established producers feared to be left behind their competitors. Engineering contractors
also facilitated resource-rich nations to start producing fertilizers. DSM, however, also supplied
this market. Its R&D department developed a leading urea production process in the 1960s. DSM
licensed this process widely, because monopolizing this technology was impossible; the urea
market was simply too large and alternative technologies were already available. The ready
availability of state-of-the-art technology, however, added further to the fierce competition
between firms.35
A second crucial development on the fertilizer markets was the gradual crumbling of the
national and international cartels. An important external source of pressure was tightening cartel
regulation instigated by European economic integration. Western-European producers also re-
discovered their neighbor's markets as exporting to places such as India and China got
30 Van Rooij 2004, 203-215.
31 Robert H. Multhaup & Gunther P. Eschenbrenner (1996). Technology's harvest: Feeding a growing world
population. Houston: Gulf Publishing. 32
Spitz 1988: 426-437. 33
Van Rooij 2004, 224-227; cost prices: table 9.5, 225. 34
Hans Heerings & Wicher Smit (1986). Internationale herstrukturering in de kunstmestsektor. Amsterdam: SOMO. Chapman 2000, particularly figures 2 and 3, 376. 35
Van Rooij 2004, 137-172.
17
increasingly difficult. This put "home markets for home producers" under further pressure; the
central sales office of the Dutch nitrogen fertilizer producers finally collapsed in 1979.36
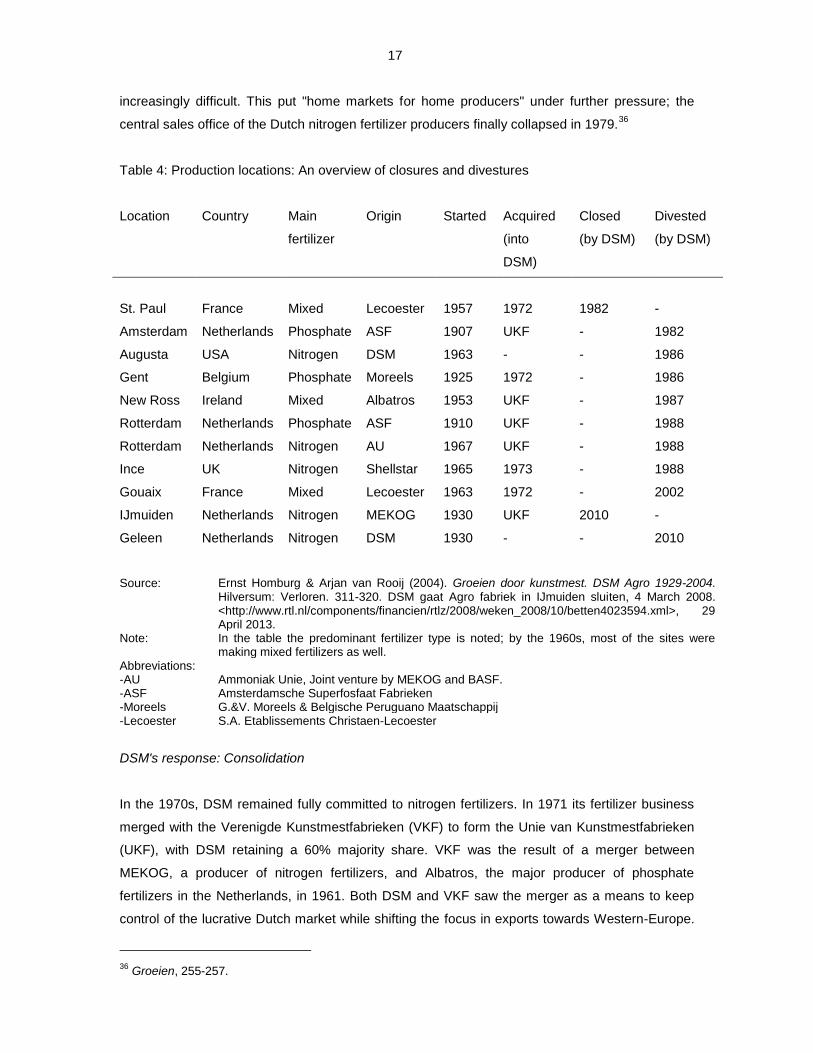
Table 4: Production locations: An overview of closures and divestures
Location Country Main
fertilizer
Origin Started Acquired
(into
DSM)
Closed
(by DSM)
Divested
(by DSM)
St. Paul France Mixed Lecoester 1957 1972 1982 -
Amsterdam Netherlands Phosphate ASF 1907 UKF - 1982
Augusta USA Nitrogen DSM 1963 - - 1986
Gent Belgium Phosphate Moreels 1925 1972 - 1986
New Ross Ireland Mixed Albatros 1953 UKF - 1987
Rotterdam Netherlands Phosphate ASF 1910 UKF - 1988
Rotterdam Netherlands Nitrogen AU 1967 UKF - 1988
Ince UK Nitrogen Shellstar 1965 1973 - 1988
Gouaix France Mixed Lecoester 1963 1972 - 2002
IJmuiden Netherlands Nitrogen MEKOG 1930 UKF 2010 -
Geleen Netherlands Nitrogen DSM 1930 - - 2010
Source: Ernst Homburg & Arjan van Rooij (2004). Groeien door kunstmest. DSM Agro 1929-2004. Hilversum: Verloren. 311-320. DSM gaat Agro fabriek in IJmuiden sluiten, 4 March 2008. <http://www.rtl.nl/components/financien/rtlz/2008/weken_2008/10/betten4023594.xml>, 29 April 2013.
Note: In the table the predominant fertilizer type is noted; by the 1960s, most of the sites were making mixed fertilizers as well.
Abbreviations: -AU Ammoniak Unie, Joint venture by MEKOG and BASF. -ASF Amsterdamsche Superfosfaat Fabrieken -Moreels G.&V. Moreels & Belgische Peruguano Maatschappij -Lecoester S.A. Etablissements Christaen-Lecoester
DSM's response: Consolidation
In the 1970s, DSM remained fully committed to nitrogen fertilizers. In 1971 its fertilizer business
merged with the Verenigde Kunstmestfabrieken (VKF) to form the Unie van Kunstmestfabrieken
(UKF), with DSM retaining a 60% majority share. VKF was the result of a merger between
MEKOG, a producer of nitrogen fertilizers, and Albatros, the major producer of phosphate
fertilizers in the Netherlands, in 1961. Both DSM and VKF saw the merger as a means to keep
control of the lucrative Dutch market while shifting the focus in exports towards Western-Europe.
36
Groeien, 255-257.
18
UKF promptly started to build a position on European markets, in particular through acquisitions
in the United Kingdom, Belgium and France (see Table 4), and the opening of a sales office in
Germany. In 1973, with a total capacity of 1.4 million tonnes of nitrogen in fertilizers, DSM-
controlled UKF was the largest fertilizer company in Western-Europe.37
By buying out Hoogovens, a steel company, and AKZO, a diversified chemical company,
DSM raised its interest in UKF to 75 percent in 1973, and by buying out the remaining
shareholder Royal Dutch/ Shell in 1980, it became the sole owner UKF remained important to
DSM but the nitrogen fertilizer industry was consolidating rapidly. UKF repeatedly got the
opportunity to acquire other fertilizer companies. DSM's board, however, rejected several deals
because the company did not have the money and did not believe the acquired companies would
be profitable enough; some possible acquisitions also fitted poorly with a focus on the Western-
European market.38
In addition, DSM was shifting its course. The company had expanded
tremendously in bulk chemicals in the 1970s but the results were rather mixed; the company grew
in size but not that much in profitability. As a result of these developments, and of the first and
second oil shocks especially, the profitability of existing businesses and of investments got
scrutinized closely. In turn, this led to a deeper change: DSM gradually shifted its course from
high-volume but low-margin bulk chemicals towards innovative products with higher value-added.
Fertilizers lost a lot of their strategic importance in the first half of the 1980s. Meanwhile the
fertilizer industry consolidated and UKF lost its leading position to Norsk Hydro.39
Still, DSM invested in its fertilizer business, renamed DSM Agro in 1986, but the
motivation for these investments changed. UKF built a third ammonia plant in Geleen, but,
underlining how much the industry had changed since the 1950s, this third plant was not primarily
aimed at expanding capacity but at cutting costs. DSM's collage-like first ammonia plant from
1930 was too expensive but replacing this capacity was not straightforward. Building a large plant
would lead to an excess of ammonia but building a smaller plant would make production costs too
high. In 1980, however, DSM interested the Belgian company Carbochimique to participate in a
large plant. The plant went on stream in August 1984.40
DSM's response - continued: Retrenchment and divestment
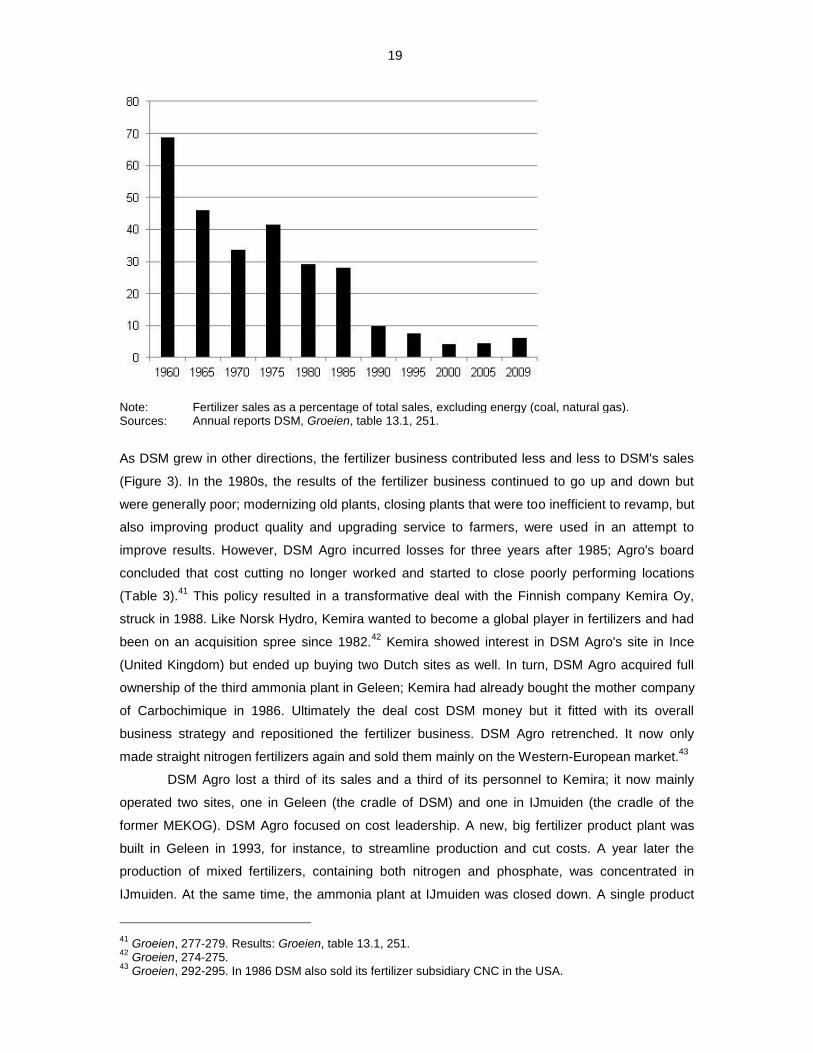
Figure 3: The declining importance of the fertilizer business for DSM’s total sales (in percent)
37 Groeien, 239-248.
38 Groeien, 274-276.
39 Van Rooij 2007, 138-141; 195-201.
40 Groeien, 270-273.
19
Note: Fertilizer sales as a percentage of total sales, excluding energy (coal, natural gas). Sources: Annual reports DSM, Groeien, table 13.1, 251.
As DSM grew in other directions, the fertilizer business contributed less and less to DSM's sales
(Figure 3). In the 1980s, the results of the fertilizer business continued to go up and down but
were generally poor; modernizing old plants, closing plants that were too inefficient to revamp, but
also improving product quality and upgrading service to farmers, were used in an attempt to
improve results. However, DSM Agro incurred losses for three years after 1985; Agro's board
concluded that cost cutting no longer worked and started to close poorly performing locations
(Table 3).41
This policy resulted in a transformative deal with the Finnish company Kemira Oy,
struck in 1988. Like Norsk Hydro, Kemira wanted to become a global player in fertilizers and had
been on an acquisition spree since 1982.42
Kemira showed interest in DSM Agro's site in Ince
(United Kingdom) but ended up buying two Dutch sites as well. In turn, DSM Agro acquired full
ownership of the third ammonia plant in Geleen; Kemira had already bought the mother company
of Carbochimique in 1986. Ultimately the deal cost DSM money but it fitted with its overall
business strategy and repositioned the fertilizer business. DSM Agro retrenched. It now only
made straight nitrogen fertilizers again and sold them mainly on the Western-European market.43
DSM Agro lost a third of its sales and a third of its personnel to Kemira; it now mainly
operated two sites, one in Geleen (the cradle of DSM) and one in IJmuiden (the cradle of the
former MEKOG). DSM Agro focused on cost leadership. A new, big fertilizer product plant was
built in Geleen in 1993, for instance, to streamline production and cut costs. A year later the
production of mixed fertilizers, containing both nitrogen and phosphate, was concentrated in
IJmuiden. At the same time, the ammonia plant at IJmuiden was closed down. A single product
41 Groeien, 277-279. Results: Groeien, table 13.1, 251.
42 Groeien, 274-275.
43 Groeien, 292-295. In 1986 DSM also sold its fertilizer subsidiary CNC in the USA.
20
was now made in Geleen, maximizing economies of scale and simplifying logistics. Further cost-
cutting and rationalization measures were repeatedly necessary but were successful in
maintaining profitability.44
However, DSM continued to change and fertilizers fitted less and less
well within the company. In 2010, the site in IJmuiden was closed. The site in Geleen was sold to
Orascom Construction Industries (OCI) from Egypt; OCI bought the tightly integrated ammonia,
nitrogen fertilizer production plant, and urea and melamine plants.45
A history of more than eighty
years of fertilizer manufacture at DSM had come to an end.
5. Solvay
During decades soda ash was one of the most important cash cows of the Solvay Group.46
Next
to being the largest soda ash producer in the world – with a global market share of more than
sixteen percent in the 1960s – Solvay especially had an extremely strong position in Western
Europe, with market shares ranging from sixty percent in France and Germany to almost 100
percent in Belgium, Austria, Italy, and Spain.47
Since about 1975 that situation gradually started to change. Market conditions in
Europe, the USA and Japan deteriorated due to a slowing down of economic growth, but also
because of specific causes, such as the growing recycling of glass, changing laundry practices,
the partial substitution of soda ash by caustic soda, and, last but not least, the growing global
power of Solvay’s major customers in glass manufacture (Saint-Gobain; Asahi, etc.) and
detergents (Procter and Gamble; Unilever; etc.). Growing imports from Central and Eastern
Europe, often from former Solvay plants, as well as from the USA, made the situation worse.
Stimulated by overcapacity in the USA and helped by a low dollar rate, American producers of
natural soda entered the European market in 1978 and had become by 1980 a dangerous threat.
Soda ash prices in Europe went down and several of the smaller Solvay plants were producing
with losses.48
To defend its leading position Solvay did all it could to reduce its production costs,
mainly by improving the energy efficiency of the plants, as well as by closing down the smallest
plants and concentrating the production capacity in the larger ones. Those at Sarralbe (1983)
44 Groeien, 295-298.
45 Annual report DSM 2010; Patrick Marx, ‘Egyptisch bedrijf runt Nedrlandse kunstmestfabriek,’
Chemisch2Weekblad, 12 April 2013, pp. 34-35. 46
This section is (provisionally) taken from Kenneth Bertrams, Nicolas Coupain & Ernst Homburg (2013). Solvay: History of a multinational family firm. Cambridge: Cambridge University Press, pp. 507-510.
47 ACS, CdG, 24 Sept. 1958; “Parlons produits: Le carbonate de soude (Na2CO3), matière
fondamentale,” Revue Solvay (March-April 1969): 5-8.
48 ACS, 1010-10, presentation Mr. Vinçotte, 12 May 1980; E. Coppens and H. Dessart, “Adapting to the new
conditions of the sodium carbonate market,” Revue Solvay, (1983) (2): 17-19; ACS, 1001-26-1, “Note au Comité Exécutif – Proposition de strategie carbonate 1995-2000,” 2 May 1994.
21
and Zurzach (1987) were closed, whereas the soda ash plants at Rosignano and Torrelavega,
both close to the sea, were enlarged.49
Due to these measures, to a higher dollar rate, and to special contracts with large
customers, for which the company later was fined by the European Commission, Solvay
succeeded in improving its results in soda ash considerably during the second part of the 1980s.
When the rate of the dollar again began to fall though, Solvay from 1988 onwards was
increasingly threatened by imports from natural soda ash from the USA, in a declining market.
Imports into the EC from the USA and from Central Europe grew from four percent of the market
in 1990, to fourteen percent in 1992. As a result Solvay’s soda ash position deteriorated
sensitively within a few years, especially in Northern Europe, and Solvay’s ROI in soda ash and
its derivatives declined from 34.3 percent in 1990 to a mere 3.5 percent in 1993.50
This time, Solvay’s answer to these attacks on its leadership was not only defensive,
such as the closing down of Couillet and Heilbronn; it was also offensive. New technology (gas
turbines with cogeneration) was introduced to reduce the energy costs, prices of soda ash were
lowered in Northern Europe – a great departure from usual practices – in order to compete with
Akzo and Brunner Mond, and, most importantly, three new large-scale soda ash plants were
acquired: at Bernburg in Germany (1991), at Green River in the USA (1992), and at Devnya in
Bulgaria (1997). The strategic significance of these three acquisitions was great. Bernburg was
well situated in relation to the Central European markets, but it first had a difficult time, due to
overproduction in Western Europe and the collapse of the Eastern economies. The acquisition of
the large Green River plant of Tenneco was the culmination of many efforts to get a foothold in
soda ash in the USA. Despite the very high price of $ 500 million it greatly improved Solvay’s
global position in soda ash. It not only helped to reduce the import pressure on Solvay’s
European home market, but it also proved to be a bridge head for the markets of Asia and Latin
America. Within a few years the capacity of the Green River plant was enlarged from 1.8 Mt/y to
2.4 Mt/y.51
With the acquisition of the modern soda ash plant at Devnya – with a capacity of 1.2
Mt/y the largest single unit plant in Europe – Solvay had similar aims than with Green River:
reducing the pressure on its home market, and gaining market share elsewhere in the world.
Since the start of the dramatic changes in the former communist countries, Solvay tried hard to
49 ACS, 1020-10, “Reflexions sur l’actuelle situation de crise,” 19 Oct. 1981; PR, “The European Community
lifts antidumping rights applicable to soda ash imports from the U.S. – Solvay’s viewpoint,” 16 Oct. 1990; ACS, MoE, 5 Nov. 1991. 50
ACS, MoB, 28 Nov. 1988, 29 Nov. 1993; PR, “Soda ash: The EC Commission fines Solvay for ECUs 30 million,” 19 Dec. 1990; ACS, 1001-26, presentation Mr. Loutrel, 30 Jan. 1991; ACS, MoE, 25 Nov. 1992; PR, “Memorandum: Solvay’s soda ash market,” 14 Dec. 1993; ACS, MES meetings, B. de Laguiche, “Evolution des resultats et ROI sur 10 ans,” 20 May 1997. 51
ACS, MoB, 27 July 1987, 30 Jan. 1990, 29 Jan. 1992, 27 Nov. 1995; ACS, MoE, 28 July 1987, 4 July 1989, 17 Dec. 1991; ACS, 1001-26, “Politique générale du groupe,” 14 March 1988; ACS, 1059-2-6, “Le carbonate de soude en Europe – Situation début 1992,” 11 Febr. 1992; PR, “Solvay Minerals, Inc.: Capacity expansion,” 12 July 1995; PR, “Solvay Minerals expands soda ash in Wyoming, USA to 3,5 million short tons/year,” 24 July 1996; O. Montfort, “Solvay, soda ash and trona…,” Solvay Live, (Autumn 1996): 10-11.
22
acquire again one of its former Polish plants at Podgorze and Inowrocław, but unsuccessfully. A
new option opened up when early 1996, following high inflation in Bulgaria and pressed by the
IMF, Bulgarian government decided to privatize the gigantic “Sodi” soda ash plant at Devnya, one
of the few soda ash plants in the world with a harbor that could receive large seaborne vessels.
Despite the risks involved – the plant was performing badly – Solvay decided to acquire sixty
percent of the shares, the rest being reserved for local shareholders. In April 1997 a final
agreement was reached, and the name of the new company was changed to Solvay Sodi. One
quarter of the product was marketed by Sisecam in Turkey; the remaining three quarters were
sold by Solvay to Eastern Europe, Central Asia, the Middle East and elsewhere. Devnya, located
close to the Black Sea, was an excellent location for export. Solvay decided to invest heavily in
the plant, as well as in securing its supply of raw materials (salt, limestone, steam, electricity).52
By these acquisitions and large investments Solvay succeeded in raising its
competitiveness in soda ash within a few years. With a growth of its production capacity from 4.6
Mt to 7.5 Mt between 1991 and 1997, despite the closure of two plants, Solvay remained the
undisputed global leader in soda ash. When early 1998 the incoming chairman of the ExCom,
Aloïs Michielsen, looked back on what had been achieved, he called Solvay’s European soda ash
strategy a model on how to become as competitive as its American peers In the twenty-first
century, Solvay entered into alliances and joint ventures in soda ash in China and acquired the
Alexandria Sodium Carbonate company in Egypt (2008). An attempt to regain control, after
almost a century, over Solvay’s “good old” plant at Berezniki, Russia, could not be realized
though.53
6. Changing in a competitive world: The dynamics of bulk chemicals after 1970 - and what
we can learn from that
DSM and Solvay, and ammonia and soda ash, are broadly comparable yet the geographical and
competitive patterns before and after 1970 differ significantly. DSM exported ammonia fertilizers
all over the globe before 1970 but, forty years later, increasing competition has confined it to a
much smaller market. DSM's plant are still producing but are currently owned by an Egyptian firm.
52 ACS, MoE, 25 Nov. 1992, 26 Sept. 1995, 27 Febr. 1996; ACS, 1001-26-1, “Note au Comité Exécutif –
Proposition de strategie carbonate 1995-2000,” 2 May 1994; ACS, MoB, 12 Dec. 1996, 31 July 1997, 23 March 2000; PR, “Solvay signs a preliminary agreement with Bulgarian authorities on acquisition of 60 percent of Sodi shares,” 19 Dec. 1996; PR, “Solvay Group finalises deal with Bulgarian authorities on the acquisition of Sodi Devnya,” 15 April 1997; O. Monfort, “Solvay-Sodi, in Bulgaria, on the Black Sea – Solvay moves Eastward,” Solvay Live, (Summer 1997): 16-17; PR, “Solvay Sodi takes control of three Bulgarian suppliers,” 3 Aug. 2000. 53
ARS 1997: 5-9; O. Monfort, “Soda ash and derivatives SBU: Strategy of world leader,” Solvay Live, 63 (Spring-Summer 1999): 20-1; PR, Press release, alliance with NCI, Sinopec in China, 13 May 2004; PR, acquisition of Alexandria Sodium Carbonate company in Egypt, 17 Oct. 2008; PR, Acquisition of Berezniki Soda Ash plant cannot be finalized, 10 June 2010.

23
Solvay, by contrast, moved its soda ash plants to sea ports, and it still exporting its products to a
large geographical area. How can this be explained?
The optimum economic size of ammonia and soda ash plants quickly outgrew the size of
the home market, making the profitability of those plants strongly dependent on export markets.
Scale-up also steadily continued, leading to extremely large plants by the 1960s. As market
growth slowed down after 1970, this led to severe boom-and-bust cycles in bulk chemicals;
production capacity could only be expanded in big bumps that outstripped demand at least for
some time to come, squeezing the profitability out of the industry. The cartels also crumbled. The
gradual emergence of a more integrated European market toughened up relations among
chemical companies. Stricter regulation, moreover, outlawed the very tools that had been so
effective before to deal with competition: market sharing arrangements, production quota deals,
and price fixing.
In addition, both soda ash and ammonia are strongly dependent on the cheap supply of
energy (and in the case of soda ash on the supply of salt and limestone as well). In this sense,
vertically and backwardly integrated companies have a strong advantage over competitors. An
important part of the explanation for Solvay's continued leadership can be found here. In
ammonia, on the other hand, the switch to natural gas during the 1950s and '60s was an
important watershed; it sowed the seeds of the advantage of hydrocarbon feedstock-rich
locations, i.e. locations typically not found in the traditional mainstays of the industry in Western-
Europe and, to a lesser extent, in the United States.
Large scale plants and the need for cheap feedstocks tilted the playing field to the
disadvantage of companies like DSM: landlocked and with little control over feedstock prices.
Solvay, however, remained vertically integrated. In addition, the Belgian company managed to
keep control of soda ash technology. Patents but, above all, secrecy and continuous
improvement proved effective in maintaining the technological lead the company captured as first
mover in the late nineteenth century. In ammonia, by contrast, technology was widely and readily
available since the mid-1920s. As the entry of DSM into the fertilizer industry shows, companies
with some technological capability, money and entrepreneurial spirit could start making ammonia
- and many did.
Business strategy and corporate identity also played an important role. At Solvay, soda
ash retained an unassailable position in the group regardless of the erosion of profitability (when
compared to the levels of the early twentieth century). At DSM, in contrast, lower margins put
ammonia under pressure and discussion, ultimately resulting in the sale of the fertilizer division in
2010. Even so, the plants remain in operation; this can only be considered a stark reminder of the
dynamics of bulk chemicals. The plants remain competitive, yet not at the same level and in the
same region as the plants were in the late 1960s. As the comparison of DSM and Solvay shows,
the much smaller growth, when compared to the past and to other products, has become a poor
fit with the strategies of some companies and, consequently, they have put their focus elsewhere.

24
The contrasting examples of DSM and Solvay ultimately show that industry evolution is
not a deterministic process (although, of course, it can be described in this way). This is an
important conclusion in a time when far too often the changes in industry geography are simply
presented as such; industry re-location is not caused by the gales of low cost competition only
(be it low labor cost or cheap feedstocks).