Embed Size (px)
Citation preview

Competition and Mobile Communications in Former
Socialist Countries
Mircea Marcu*
Department of Economics, University of Florida, 304 Matherly Hall P.O. Box 117140, Gainesville, FL 32601, (352) 846-1988, [email protected]
ABSTRACT
I estimate a logistic model of mobile communications diffusion to examine the impact of competition on cellular penetration in former socialist countries in Eastern Europe and Central Asia. Not surprisingly, I find that the introduction of competition led to a higher speed of adoption of mobile technology. Perhaps more surprisingly, sequential competition had a greater impact than simultaneous competition. Larger and richer countries introduced competition earlier, and tended to award more than one digital mobile license initially. Failure to account for this selectivity leads to upward biased estimates of the effect of competition on cellular penetration.
JEL classification: L1; L96; O3; P2 Keywords: Technology diffusion; Entry regulation; Network externalities; Mobile telecommunications; Transition
* I am grateful to Chunrong Ai, Sanford Berg, Vanessa Cruz, David Figlio, Troy Quast, David Sappington, James Seale, and Burcin Unel for their help.

1. Introduction
Recent studies suggest that a priority for developing countries seeking to catch up
with the developed world is to develop their infrastructure rapidly1. Given their history of
underinvestment in telecommunications and given the rapid pace of technological change in
recent decades, former socialist countries in Eastern Europe and Central Asia2 have probably
more to gain by investing in telecommunications than in any other utility sector.
Technological innovation, in particular the development of mobile communications, has
made it possible for these countries to make up for time lost, and develop their
communications infrastructure rapidly and at relatively low cost.
Less than fifteen years after the first of these former socialist countries adopted
mobile technology, the countries exhibit a wide array of cellular penetration levels, ranging
from less than 10% in most former Soviet Union republics to more than 80% in the Czech
Republic at the end of 2002. During this short time span, cellular penetration has far
outgrown fixed line communications in some of these countries. It seems important then to
explain the success of leading countries and the inability of other countries to capitalize on
this opportunity.
The purpose of this study is to analyze the determinants of cellular technology
diffusion in the former socialist countries. To the best of my knowledge, this is the first
econometric study of mobile communications diffusion focused solely on former socialist
countries in Eastern Europe and Central Asia. While more extensive in coverage, the studies
by Gruber and Verboven (2001b), and Dekimpe et al. (1998) used worldwide data available
1 See Poot (2000) for a synthesis of empirical research on the impact of government on long-run growth, including the impact of public infrastructure investment. 2 I will hereafter refer to these countries as former socialist countries.
prior to 1998, when these countries typically had limited mobile communications experience.
The present study spans the entire history of mobile communications in former socialist
countries, from 1990 to 2002. The focus solely on former socialist countries implies some
limitations, but also provides some advantages. In particular, the relative homogeneity of
these countries compared to other studies is better suited for the customary assumption of
common parameters of interest across all countries.
Socioeconomic factors, such as the level of economic development of each country,
certainly played an important role in determining the relative success of the countries. But
part of the success may be due to government policies affecting the adoption of cellular
technology. These countries faced several important decisions, from the adoption of a
particular technological standard to the timing and number of mobile licenses awarded to
producers. Among these decisions, the introduction of competition and the timing of licenses
had a particularly important impact on the level and speed of mobile communication
diffusion.3 I find that the introduction of competition accelerated rates of cellular adoption
significantly. Sequential competition had a more pronounced impact than simultaneous
competition, perhaps due to more aggressive pricing by later entrants in order to establish
themselves on the market. Countries with a higher income per capita had more cellular
subscribers initially, but this advantage declined over time as mobile services became less
expensive. Countries with a higher number of fixed lines per capita experienced lower initial
levels of cellular adoption, but higher subsequent growth. The higher speed of adoption could
be the result of supply increases due to increased rivalry between the two technologies.
Alternatively, it could be that the two technologies are not rivalrous and positive direct
3 With very few exceptions, the former socialist countries adopted GSM as their digital technological standard. Therefore, it is unlikely that technological standards contributed significantly to the difference in outcomes between countries.
1

network effects dominate. Countries with a higher fraction of people waiting for a fixed line
connection had a lower initial number of subscribers, but faster subsequent growth.
The present study employs instrumental variables estimation to improve on existing
studies by addressing the endogenous nature of the relationship between wireline and
wireless communications. More importantly, it takes into account the fact that countries
make key decisions such as the timing of the introduction of competition, or the nature of
competition (simultaneous versus sequential).4 If countries that introduced competition
simultaneously are also those that would have benefited the most from doing so for example,
then simple least squares techniques would overstate the effect of competition on the speed
of cellular communications adoption.
The rest of the paper proceeds as follows. Section 2 presents the logistic model of
cellular technology diffusion employed. Section 3 presents the data and the empirical
specification. Section 4 presents and discusses the results. Section 5 concludes.
2. Modeling Mobile Technology Diffusion
When analyzing the adoption of new technologies, it is essential to account explicitly
for the prevailing stages of adoption (Dekimpe et al. 1998). For a variety of cultural and
socioeconomic reasons, some countries adopt new technologies earlier than others. If leading
countries are also the ones to first adopt certain policy decisions, such as the introduction of
competition, then a simple cross sectional analysis would attribute the higher level of cellular
4 For the purposes of this paper, simultaneous competition means the entry of two or more digital mobile communications operators during the first calendar year of digital mobile communications presence in a country. Sequential competition refers to entry occurring during a subsequent calendar year, after only one digital cellular communications provider was initially present in the market. Due to capacity limitations, none of the former socialist countries introduced competition during the analog era, with the possible exception of Russia, which was excluded from the analysis due to its relative size compared to all other countries in the region.
2
penetration in early adopting countries inappropriately to the implementation of the
respective policy decision.
Following Gruber and Verboven (2001b), I use a logistic function to model the
diffusion of mobile technology in order to account for its dynamic nature. Widely used in
medical studies of contagion, the logistic specification is appealing because it provides a
means of capturing the existence of network externalities in mobile telephony. The flow of
new adopters is related to the stock of existing subscribers in a way similar to that of
epidemic models. Initially, the flow of adopters is small. As the stock of cellular subscribers
increases, more and more people adopt the technology, leading to an exponential increase in
the number of adopters. However, the flow of subscribers declines as the stock approaches
the total number of potential adopters in the market. The diffusion of the new technology
thus follows the classic S shaped pattern, as depicted in Figure 1.
Letting denote the total number of individuals in country i that adopted cellular
technology by time t, and letting denote the total number of potential adopters, the
standard logistic diffusion equation is:
ity
*ity
)exp(1
*
tbay
yitit
itit −−+= , (1)
where and are parameters, as discussed below. The shape of this function is determined
by three elements: the number of potential adopters, the timing of initial adoption, and the
speed of adoption.
ita itb
A. The number of potential adopters *ity
Not all individuals in a country adopt a new technology, such as mobile telephony.
Regardless of how inexpensive mobile telephony might become, some individuals never
3
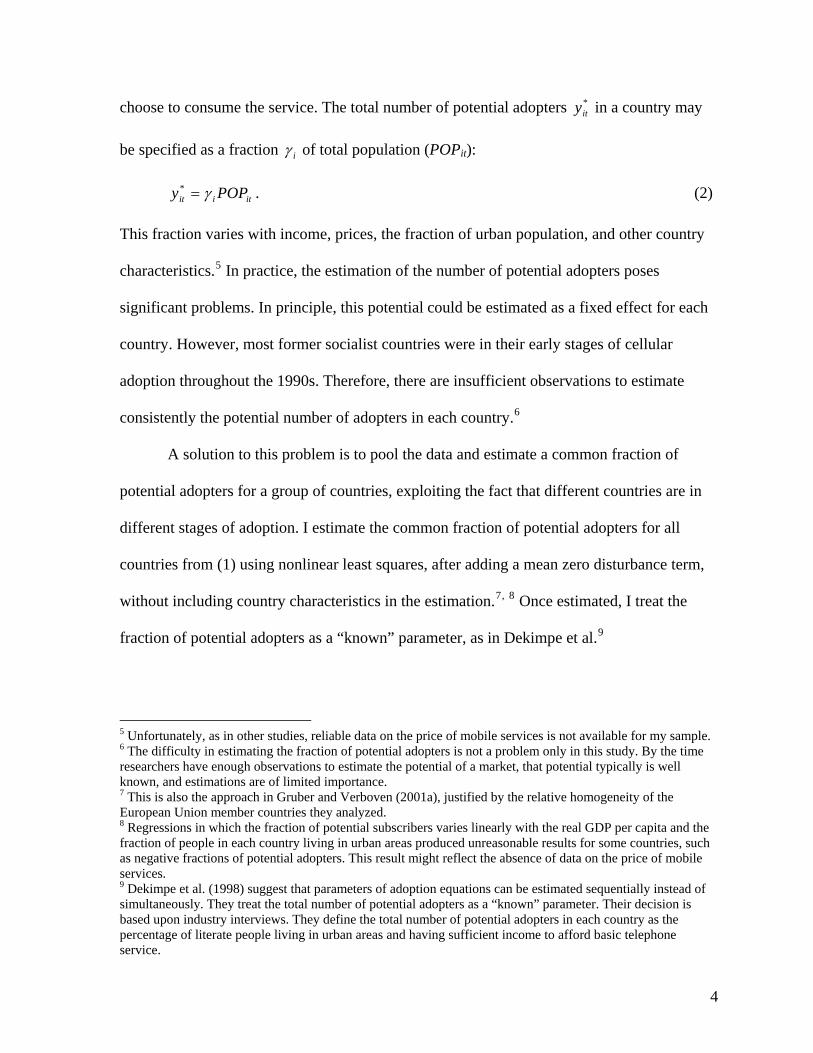
choose to consume the service. The total number of potential adopters in a country may
be specified as a fraction
*ity
iγ of total population (POPit):
itiit POPy γ=* . (2)
This fraction varies with income, prices, the fraction of urban population, and other country
characteristics.5 In practice, the estimation of the number of potential adopters poses
significant problems. In principle, this potential could be estimated as a fixed effect for each
country. However, most former socialist countries were in their early stages of cellular
adoption throughout the 1990s. Therefore, there are insufficient observations to estimate
consistently the potential number of adopters in each country.6
A solution to this problem is to pool the data and estimate a common fraction of
potential adopters for a group of countries, exploiting the fact that different countries are in
different stages of adoption. I estimate the common fraction of potential adopters for all
countries from (1) using nonlinear least squares, after adding a mean zero disturbance term,
without including country characteristics in the estimation.7, 8 Once estimated, I treat the
fraction of potential adopters as a “known” parameter, as in Dekimpe et al.9
5 Unfortunately, as in other studies, reliable data on the price of mobile services is not available for my sample. 6 The difficulty in estimating the fraction of potential adopters is not a problem only in this study. By the time researchers have enough observations to estimate the potential of a market, that potential typically is well known, and estimations are of limited importance. 7 This is also the approach in Gruber and Verboven (2001a), justified by the relative homogeneity of the European Union member countries they analyzed. 8 Regressions in which the fraction of potential subscribers varies linearly with the real GDP per capita and the fraction of people in each country living in urban areas produced unreasonable results for some countries, such as negative fractions of potential adopters. This result might reflect the absence of data on the price of mobile services. 9 Dekimpe et al. (1998) suggest that parameters of adoption equations can be estimated sequentially instead of simultaneously. They treat the total number of potential adopters as a “known” parameter. Their decision is based upon industry interviews. They define the total number of potential adopters in each country as the percentage of literate people living in urban areas and having sufficient income to afford basic telephone service.
4
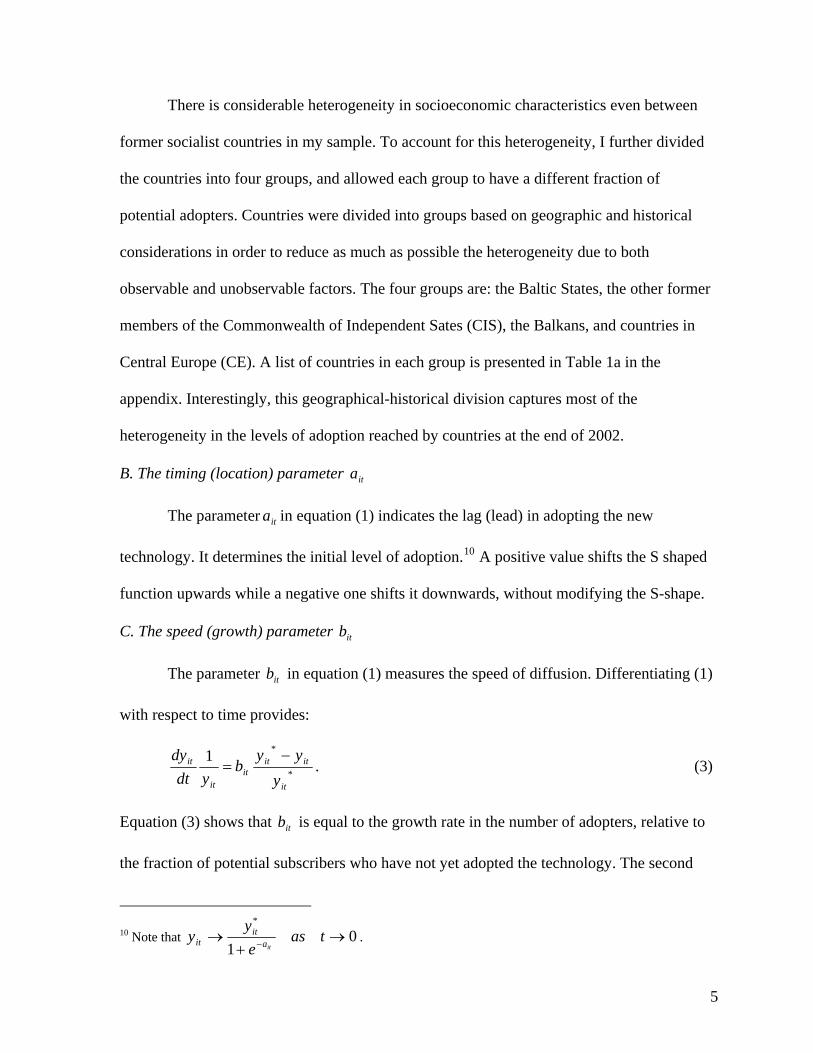
There is considerable heterogeneity in socioeconomic characteristics even between
former socialist countries in my sample. To account for this heterogeneity, I further divided
the countries into four groups, and allowed each group to have a different fraction of
potential adopters. Countries were divided into groups based on geographic and historical
considerations in order to reduce as much as possible the heterogeneity due to both
observable and unobservable factors. The four groups are: the Baltic States, the other former
members of the Commonwealth of Independent Sates (CIS), the Balkans, and countries in
Central Europe (CE). A list of countries in each group is presented in Table 1a in the
appendix. Interestingly, this geographical-historical division captures most of the
heterogeneity in the levels of adoption reached by countries at the end of 2002.
B. The timing (location) parameter ita
The parameter in equation (1) indicates the lag (lead) in adopting the new
technology. It determines the initial level of adoption.
ita
10 A positive value shifts the S shaped
function upwards while a negative one shifts it downwards, without modifying the S-shape.
C. The speed (growth) parameter itb
The parameter in equation (1) measures the speed of diffusion. Differentiating (1)
with respect to time provides:
itb
*
*1
it
ititit
it
it
yyy
bydt
dy −= . (3)
Equation (3) shows that is equal to the growth rate in the number of adopters, relative to
the fraction of potential subscribers who have not yet adopted the technology. The second
itb
10 Note that 0
1
*
→+
→ − tasey
yita
itit .
5
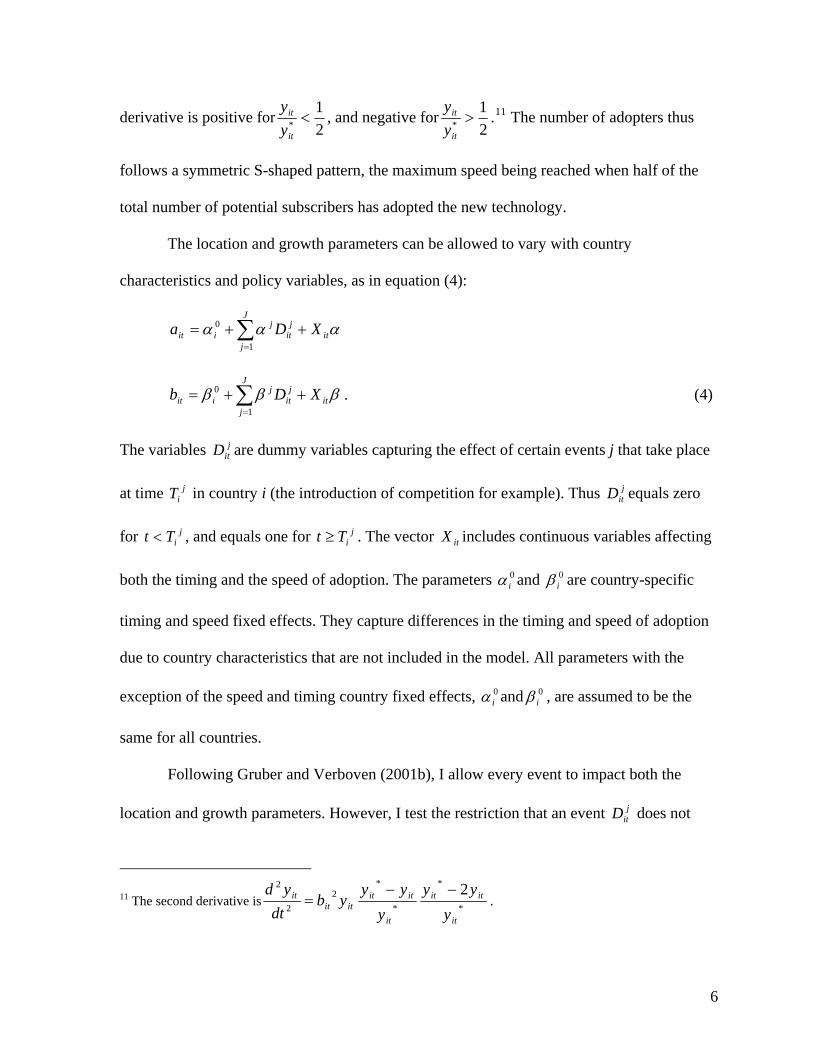
derivative is positive for21
* <it
it
yy
, and negative for21
* >it
it
yy
.11 The number of adopters thus
follows a symmetric S-shaped pattern, the maximum speed being reached when half of the
total number of potential subscribers has adopted the new technology.
The location and growth parameters can be allowed to vary with country
characteristics and policy variables, as in equation (4):
ααα it
J
j
jit
jiit XDa ++= ∑
=1
0
βββ it
J
j
jit
jiit XDb ++= ∑
=1
0 . (4)
The variables are dummy variables capturing the effect of certain events j that take place
at time in country i (the introduction of competition for example). Thus equals zero
for , and equals one for . The vector includes continuous variables affecting
both the timing and the speed of adoption. The parameters and are country-specific
timing and speed fixed effects. They capture differences in the timing and speed of adoption
due to country characteristics that are not included in the model. All parameters with the
exception of the speed and timing country fixed effects, and , are assumed to be the
same for all countries.
jitD
jiT j
itD
jiTt < j
iTt ≥ itX
0iα 0
iβ
0iα 0
iβ
Following Gruber and Verboven (2001b), I allow every event to impact both the
location and growth parameters. However, I test the restriction that an event does not jitD
11 The second derivative is *
*
*
*2
2
2 2
it
itit
it
itititit
it
yyy
yyy
ybdt
yd −−= .
6
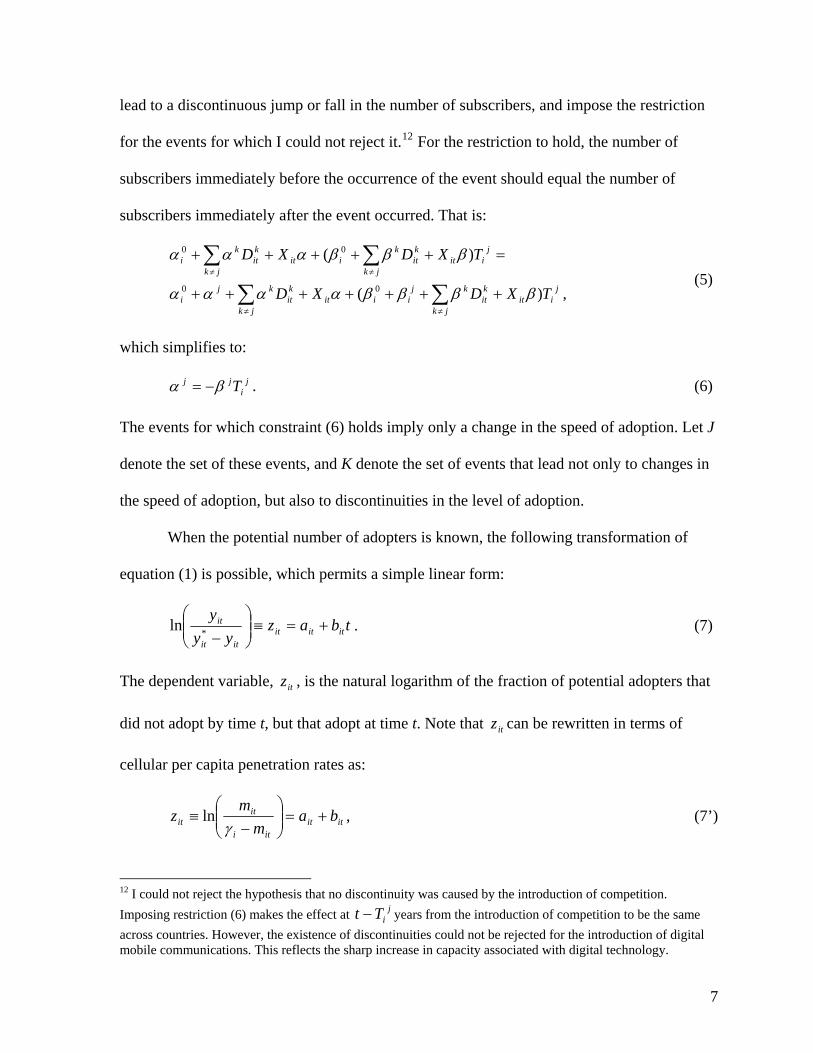
lead to a discontinuous jump or fall in the number of subscribers, and impose the restriction
for the events for which I could not reject it.12 For the restriction to hold, the number of
subscribers immediately before the occurrence of the event should equal the number of
subscribers immediately after the event occurred. That is:
,)(
)(
00
00
jiit
jk
kit
kjiiit
jk
kit
kji
jiit
jk
kit
kiit
jk
kit
ki
TXDXD
TXDXD
ββββαααα
βββααα
+++++++
=+++++
∑∑
∑∑
≠≠
≠≠ (5)
which simplifies to:
ji
jj Tβα −= . (6)
The events for which constraint (6) holds imply only a change in the speed of adoption. Let J
denote the set of these events, and K denote the set of events that lead not only to changes in
the speed of adoption, but also to discontinuities in the level of adoption.
When the potential number of adopters is known, the following transformation of
equation (1) is possible, which permits a simple linear form:
tbazyy
yititit
itit
it +=≡⎟⎟⎠
⎞⎜⎜⎝
⎛−*ln . (7)
The dependent variable, , is the natural logarithm of the fraction of potential adopters that
did not adopt by time t, but that adopt at time t. Note that can be rewritten in terms of
cellular per capita penetration rates as:
itz
itz
itititi
itit ba
mm
z +=⎟⎟⎠
⎞⎜⎜⎝
⎛−
≡γ
ln , (7’)
12 I could not reject the hypothesis that no discontinuity was caused by the introduction of competition. Imposing restriction (6) makes the effect at years from the introduction of competition to be the same across countries. However, the existence of discontinuities could not be rejected for the introduction of digital mobile communications. This reflects the sharp increase in capacity associated with digital technology.
jiTt −
7
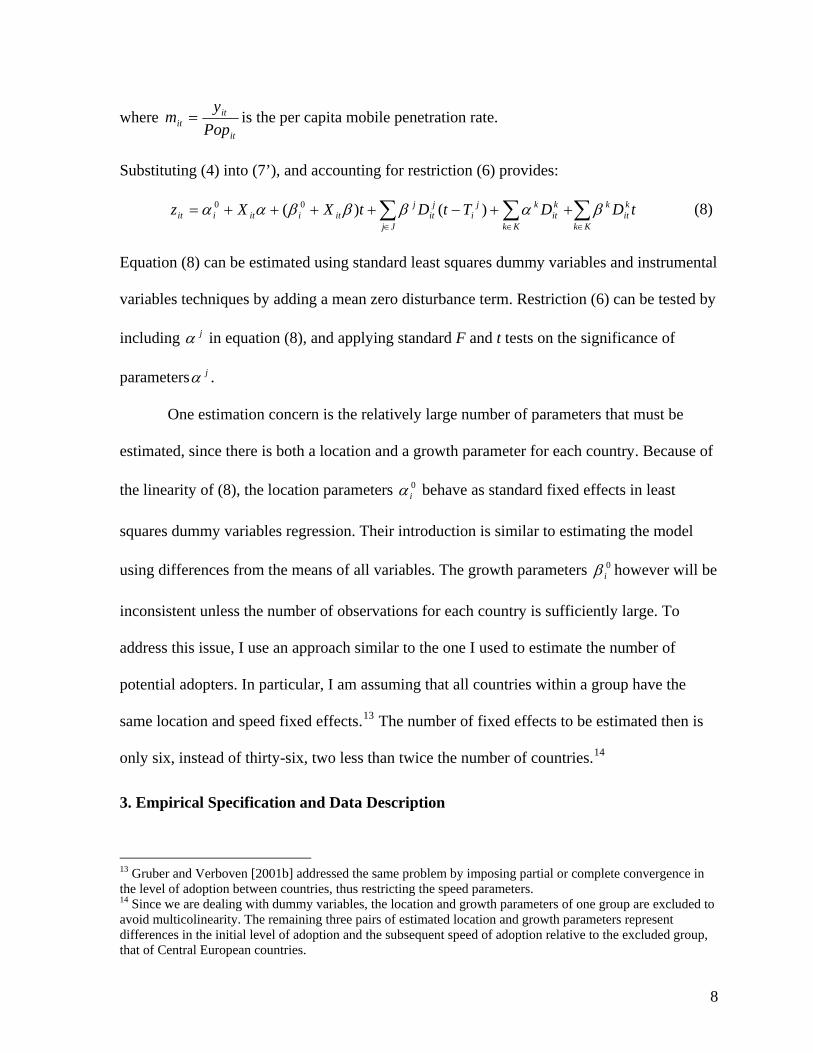
where it
itit Pop
ym = is the per capita mobile penetration rate.
Substituting (4) into (7’), and accounting for restriction (6) provides:
∑∑∑∈∈∈
++−++++=Kk
kit
k
Kk
kit
kji
Jj
jit
jitiitiit tDDTtDtXXz βαβββαα )()( 00 (8)
Equation (8) can be estimated using standard least squares dummy variables and instrumental
variables techniques by adding a mean zero disturbance term. Restriction (6) can be tested by
including in equation (8), and applying standard F and t tests on the significance of
parameters .
jα
jα
One estimation concern is the relatively large number of parameters that must be
estimated, since there is both a location and a growth parameter for each country. Because of
the linearity of (8), the location parameters behave as standard fixed effects in least
squares dummy variables regression. Their introduction is similar to estimating the model
using differences from the means of all variables. The growth parameters however will be
inconsistent unless the number of observations for each country is sufficiently large. To
address this issue, I use an approach similar to the one I used to estimate the number of
potential adopters. In particular, I am assuming that all countries within a group have the
same location and speed fixed effects.
0iα
0iβ
13 The number of fixed effects to be estimated then is
only six, instead of thirty-six, two less than twice the number of countries.14
3. Empirical Specification and Data Description
13 Gruber and Verboven [2001b] addressed the same problem by imposing partial or complete convergence in the level of adoption between countries, thus restricting the speed parameters. 14 Since we are dealing with dummy variables, the location and growth parameters of one group are excluded to avoid multicolinearity. The remaining three pairs of estimated location and growth parameters represent differences in the initial level of adoption and the subsequent speed of adoption relative to the excluded group, that of Central European countries.
8
I analyze 19 of the 27 former socialist countries in Eastern Europe and Central Asia
between 1990 and 2002. I excluded several countries from the analysis because of missing
data (Bosnia and Herzegovina, Belarus, Macedonia, Tajikistan, Turkmenistan, and
Yugoslavia).15 Slovenia was excluded because it had a much higher level of GDP per capita
than all other former socialist countries, and my empirical methodology presumes
homogeneity between groups of countries.16 Russia was excluded because it is an outlier
among former socialist countries both in terms of population and land area. Russia can be
considered as having several telecommunication markets. It would be inappropriate to assess
the competitiveness of these individual markets based on aggregate data for all of Russia.
The level of adoption and speed of adoption vary with country socioeconomic
characteristics (see equation (8)). The country characteristics included in are real GDP
per capita expressed in constant 1995 USD (GDPCAP), the number of mainlines
itX
17 per capita
(MNLCAP), and the ratio between registered applications for a fixed line and the number of
mainlines in service (WAITLIST).18, 19 Descriptive statistics are presented in Table 2a in the
appendix.20
On the assumption that mobile communications is a normal good, countries with
higher per capita income should have a higher initial level of cellular penetration, other 15 Some of these countries experienced armed conflicts during the period of study. 16 Slovenia was the only former socialist country to be classified in the high-income category by the International Telecommunications Union during this period. 17 Main lines are fixed telephone lines connecting the subscriber’s terminal equipment to the public switched network. Throughout the paper I use the terms main lines, fixed lines, and wirelines interchangeably. 18 Data for 2002 was unavailable for WAITLIST and was replaced by data for 2001. This could potentially bias the coefficients. However, the bias is likely to be relatively small, as changes in WAITLIST from one year to another are relatively small. The 2001 data will be replaced with the 2002 data as soon as it becomes available. 19 The length of the waiting list is affected positively by unmet demand, and negatively by the frustration of joining a waitlist without hope of receiving service. Ideally, one would also like to account for the effect of the average waiting time for the installation of a fixed line on cellular penetration. However, data on average waiting time is scarce. 20 An additional measure of countries’ political instability proved insignificant in the estimations. The measure is the political constraint variable POLCON V constructed by Henisz (2000) on the basis of a spatial model of political interaction.
9
things equal. In theory, fixed line penetration may have a positive or a negative effect on
fixed network expansion, depending whether adopters view mobile communications as a
complement or a substitute for fixed communications.
The telecommunications market in socialist countries has long been characterized by
significant excess demand for fixed lines. The situation persisted even after the fall of
communism, as building communications infrastructure required time and a considerable
amount of investment. Low and unbalanced tariffs that favored residential customers
aggravated the problem of excess demand for wireline services. One would expect countries
with a higher fraction of people waiting for the installation of a fixed line to adopt cellular
technology faster.
Several countries started adopting cellular technology during the analog era, before
the advent of digital mobile communications. Digital technology brought a sharp increase in
capacity and in the number of cellular subscribers. I use a dummy variable (ANALOG) to
account for the possible differences in the level and speed of adoption between the two
technologies. An additional dummy variable (SINGLE_D) accounts for the possibility that
countries which only adopted the digital technology may have a different level and speed of
adoption than countries which started with analog technology. Tests of restriction (6) on
these variables rejected the hypothesis of no discontinuity.
All former socialist countries in Eastern Europe and Central Asia introduced
competition in digital mobile communications by the end of 2002, with the exception of
Armenia, Macedonia and Turkmenistan. Table 1a in the appendix shows the number of
digital cellular operators in each country, and the years when these operators entered the
10
market.21
In principle, the introduction of competition could have either a positive or a negative
effect on the speed of adoption of cellular technology. The introduction of competition may
lead to lower prices and increased demand for mobile services. More firms may also have
more resources available for investment. But more resources do not necessary mean more
investment. Because of demand uncertainty, competing firms might wait a relatively long
time to invest (Armstrong and Vickers (1996)). The competitors might free ride on each
other’s information gathering. Although a monopolist cannot free ride, it typically will find it
profitable to raise prices and restrict output. Competing firms might also collude and raise
prices. In the extreme case the price they charge could be the monopoly price. There is ample
theoretical literature that analyzes competition between interconnecting networks (see
Armstrong (1998), Laffont, Rey, and Tirole (1998a,b) for example). Whether competition
leads to faster cellular technology adoption is therefore an empirical question. Parker and
Roller (1997) find that duopolies in US mobile communications markets behaved much less
competitively than expected. Gruber and Verboven (2001b) find that the introduction of
competition had a positive effect on the speed of adoption of cellular technology.
I use three variables to capture the effect of competition on mobile communications
diffusion: a dummy variable for the introduction of digital communications competition
(COMPD), and two other dummy variables that make it possible to compare the relative
effect of introducing competition simultaneously (SIMULTANEOUS) versus sequentially
(SEQUENTIAL). Tests of restriction (6) could not reject the hypothesis of no discontinuity
for any of the competition variables.
21 The dates of entry reflect actual launch dates for the provision of services, rather than dates when licenses were awarded. Entry dates, as well as the number of subscribers of each company, were collected by the author from various issues of the Global Mobile and Global Wireless publications.
11
An analysis of the patterns of entry in former socialist countries reveals that richer
countries and more populous countries introduced competition earlier than smaller, poorer
countries. Low initial demand for mobile communications in poorer and less populous
countries did not allow more than one profitable firm in the market. Richer and more
populous countries also tended to introduce competition simultaneously. It is important,
therefore, to account for the endogeneity of such decisions.
4. Estimation Results
I estimate the model using instrumental variables, after adding a mean zero error term
to equation (8).22 The results from estimations in which the four groups of countries were
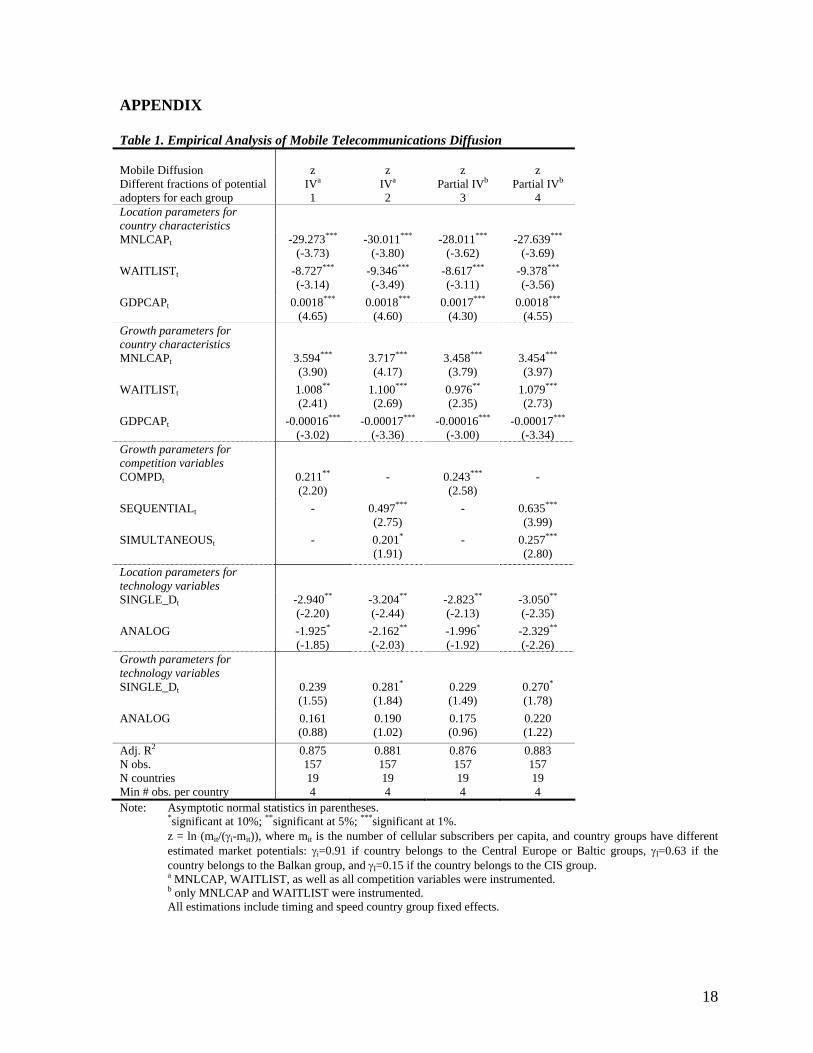
allowed to have different fractions of potential adopters are presented in Table 1. The results
were very similar when all groups were assumed to have the same fraction of potential
adopters. They are presented in the appendix (Table 3a). The robustness of the results with
respect to different assumptions regarding the total number of potential adopters is
comforting and helps validate the treatment of the fractions of potential adopters as “known”
parameters.
The first two columns in Table 1 present results in which MNLCAP and WAITLIST,
as well as all competition variables, were instrumented (see the appendix for a detailed
account of the estimating procedure and instruments used). As expected, countries with a
higher level of income per capita had higher initial adoption levels, all other things equal.
However, their advantage seems to diminish over time, probably because of decreasing
prices of mobile services.
22 Gruber and Verboven estimated their model using nonlinear least squares. However, the number of main lines per capita and the fraction of people on a waiting list are endogenous to cellular penetration. Furthermore, the introduction and type of competition also appear to have been endogenous decisions.
12

Countries with higher wireline penetration had fewer mobile subscribers per capita
initially, but had higher subsequent growth.23 This finding may reflect the fact that former
socialist countries were relatively poor in the early 1990s, and most people who owned a
fixed line did not acquire mobile services. As prices declined, perhaps driven by supply
increases due to lower costs and increased rivalry between the two technologies, more people
started buying mobile services. Alternatively, the higher rate of growth could be the result of
positive direct network effects between technologies. Many customers in these countries
bought prepaid phone cards and used mobile phones only as a means of being contacted,
rather than to make calls. Most people who adopted cellular technology did not give up their
fixed lines due to high tariffs for mobile-to-fixed and fixed-to-mobile calls.
The relative poverty of these countries also explains the lower initial level of adoption
in countries with a higher fraction of the population waiting for fixed lines. Generally, people
waiting for main lines had modest or little income.24 These people could not afford a mobile
phone initially. However, as prices decreased, these people started to buy cellular phones,
and countries with more people on waiting lists experienced relatively rapid growth in
mobile adoption.
Technological factors had an important impact on mobile technology diffusion. The
level of adoption was significantly lower during the analog era due to capacity constraints
and relatively high prices, although countries that had more years of analog technology
experienced a smaller increase in the number of subscribers when digital technology was
23 This finding is contrary to that of Gruber and Verboven (2001b), who find that countries with higher fixed line penetration also had a higher initial fraction of cellular subscribers. However, the difference in results is not due to the difference in estimating techniques between the two studies. In the present study, least squares dummy variables estimation produced the same qualitative results as instrumental variables. 24 Bribes were not uncommon in these countries. Rich or influent people did not have to wait in line for a connection.
13

introduced. Countries that started adopting cellular communications only during the digital
era had lower initial levels of adoption relative to countries that started adoption with analog
technology. However, they also experienced higher levels of growth, as people who valued
mobile communications highly, and would have bought the services had they been available
during the analog era, bought the services when digital mobile communications were
introduced.
The introduction of competition increased the speed of adoption of cellular
technology. The effect was particularly pronounced when competition was introduced
sequentially. The greater impact of sequential competition could reflect the fact that countries
which introduced competition sequentially often introduced competition later than countries
which introduced competition simultaneously. To the extent there is a catching up effect
caused by technological progress, decreases in the cost of mobile services, or international
learning, it would be reflected in the difference between the effect of sequential entry and
that of simultaneous entry. Another possibility is that with sequential entry the new
competitor has to price more aggressively to establish itself on the market. A t test based on
the Herfindahl index of market concentration revealed that sequential entry led indeed to
higher industry concentration at the end of 2002.25, 26
The third and fourth columns in Table 1 present results of estimations in which
competition variables were not instrumented. The comparison with the corresponding results
in the first two columns shows the importance of accounting for self-selection on behalf of
25 The average value of the Herfindahl index at the end of 2002 was 4150 for countries that introduced competition simultaneously, and 5600 for countries that introduced competition sequentially. The difference is statistically significant at 1% level of significance. 26 The Herfindahl index was employed in alternative specifications of the diffusion model instead of the competition variables described above. The coefficient on the Herfindahl index variable turned out to be marginally insignificant. This is due to the reduction in sample size caused by missing values in the number of subscribers of each telecommunications operator.
14

countries. The coefficients from the instrumented specifications are smaller. The difference
between the coefficients on simultaneous competition is significantly different from zero at
5% level of significance, and so is the difference between the coefficients on sequential
competition obtained from the two estimations. The difference between the coefficients on
competition from columns 1 and 3 is significant at 10%. These differences translate into
sizeable differences in predicted adoption levels, as is evident from the results in Table 2.
Simulation results in Table 2 were computed using the specifications in table 3a
columns 2 and 4, and are based on average and standard deviation values of variables for the
year 2002. All countries are assumed to have the same market potential of 59%. The average
country was considered to be a member of the third group of countries, the Balkans, for the
purposes of these simulations. The last two columns present the effect of separate changes in
each variable.27 The predicted effect of sequential competition is the total effect on the
cellular penetration level at the end of 2002, assuming that competition was introduced
sequentially in 1999. The predicted effect of simultaneous competition is the total effect on
the cellular penetration level at the end of 2002 resulting from the introduction of two or
more digital operators in 1996.28
Table 2 demonstrates the importance of accounting for the endogeneity of policy
decisions. When the endogeneity of competition policy is not accounted for, the model
predicts there would be 23 to 24 more cellular subscribers per 100 individuals as a result of
sequential competition, and 20 to 21 more cellular subscribers as a result of simultaneous
27 The total effect on cellular penetration from changing more variables at the same time does not equal the sum of the effects of separate changes in each variable due to the nonlinear functional form. 28 The negative effect of a one standard error increase in GDP per capita does not necessarily mean that richer countries will have lower penetration levels than poorer ones. Richer countries generally also have higher levels of fixed line penetration, which is associated with reduced mobile adoption. A higher GDP per capita has a positive effect on cellular penetration rates roughly through 2000, after which the effect becomes negative.
15
competition. In contrast, the corresponding increases when accounting for the endogeneity of
policy decisions are only 19 and 18 subscribers per 100 individuals, respectively.
5. Conclusion
I have analyzed the determinants of mobile communications adoption in the former
socialist countries from Eastern Europe and Central Asia. The socioeconomic characteristics
of these countries played an important role in determining the level and speed of mobile
communications diffusion. Countries with a higher level of real per capita income had higher
initial levels of cellular penetration, although their advantage diminished over time.
Countries with a higher number of fixed lines per capita and countries with higher waiting
lists for fixed lines experienced lower initial levels of cellular adoption, but higher
subsequent growth.
The main finding of the paper is that the introduction of competition led to a
substantial acceleration in the speed of adoption of cellular communications. Furthermore,
and perhaps more surprisingly, sequential competition led to higher growth in the number of
subscribers than simultaneous competition.
This research also demonstrates the importance of accounting for the endogeneity of
key policy decisions, such as the timing of the introduction of competition. Failure to account
for this endogeneity leads to upward biased estimates of the effect of competition on cellular
adoption rates.
Future research would benefit from reliable data on the prices of mobile services.
Advertising and competitive strategies (including the use of prepaid phone cards) should also
be analyzed. It would also be valuable to assess the effects of different regulatory
16
frameworks on the adoption of cellular technology, particularly the effect of alternative
interconnection regulation.
17
APPENDIX
Table 1. Empirical Analysis of Mobile Telecommunications Diffusion Mobile Diffusion Different fractions of potential
z IVa
z IVa
z Partial IVb
z Partial IVb
adopters for each group 1 2 3 4 Location parameters for country characteristics
MNLCAPt -29.273***
(-3.73) -30.011***
(-3.80) -28.011***
(-3.62) -27.639***
(-3.69) WAITLISTt -8.727***
(-3.14) -9.346***
(-3.49) -8.617***
(-3.11) -9.378***
(-3.56) GDPCAPt 0.0018***
(4.65) 0.0018***
(4.60) 0.0017***
(4.30) 0.0018***
(4.55) Growth parameters for country characteristics
MNLCAPt 3.594***
(3.90) 3.717***
(4.17) 3.458***
(3.79) 3.454***
(3.97) WAITLISTt 1.008**
(2.41) 1.100***
(2.69) 0.976**
(2.35) 1.079***
(2.73) GDPCAPt -0.00016***
(-3.02) -0.00017***
(-3.36) -0.00016***
(-3.00) -0.00017***
(-3.34) Growth parameters for competition variables
COMPDt 0.211**
(2.20) - 0.243***
(2.58) -
SEQUENTIALt - 0.497***
(2.75) - 0.635***
(3.99) SIMULTANEOUSt - 0.201*
(1.91) - 0.257***
(2.80) Location parameters for technology variables
SINGLE_Dt -2.940**
(-2.20) -3.204**
(-2.44) -2.823**
(-2.13) -3.050**
(-2.35) ANALOG -1.925*
(-1.85) -2.162**
(-2.03) -1.996*
(-1.92) -2.329**
(-2.26) Growth parameters for technology variables
SINGLE_Dt 0.239
(1.55) 0.281*
(1.84) 0.229 (1.49)
0.270*
(1.78) ANALOG 0.161
(0.88) 0.190 (1.02)
0.175 (0.96)
0.220 (1.22)
Adj. R2
N obs. N countries Min # obs. per country
0.875 157 19 4
0.881 157 19 4
0.876 157 19 4
0.883 157 19 4
Note: Asymptotic normal statistics in parentheses. *significant at 10%; **significant at 5%; ***significant at 1%. z = ln (mit/(γi-mit)), where mit is the number of cellular subscribers per capita, and country groups have different estimated market potentials: γi=0.91 if country belongs to the Central Europe or Baltic groups, γI=0.63 if the country belongs to the Balkan group, and γI=0.15 if the country belongs to the CIS group. a MNLCAP, WAITLIST, as well as all competition variables were instrumented. b only MNLCAP and WAITLIST were instrumented. All estimations include timing and speed country group fixed effects.
18
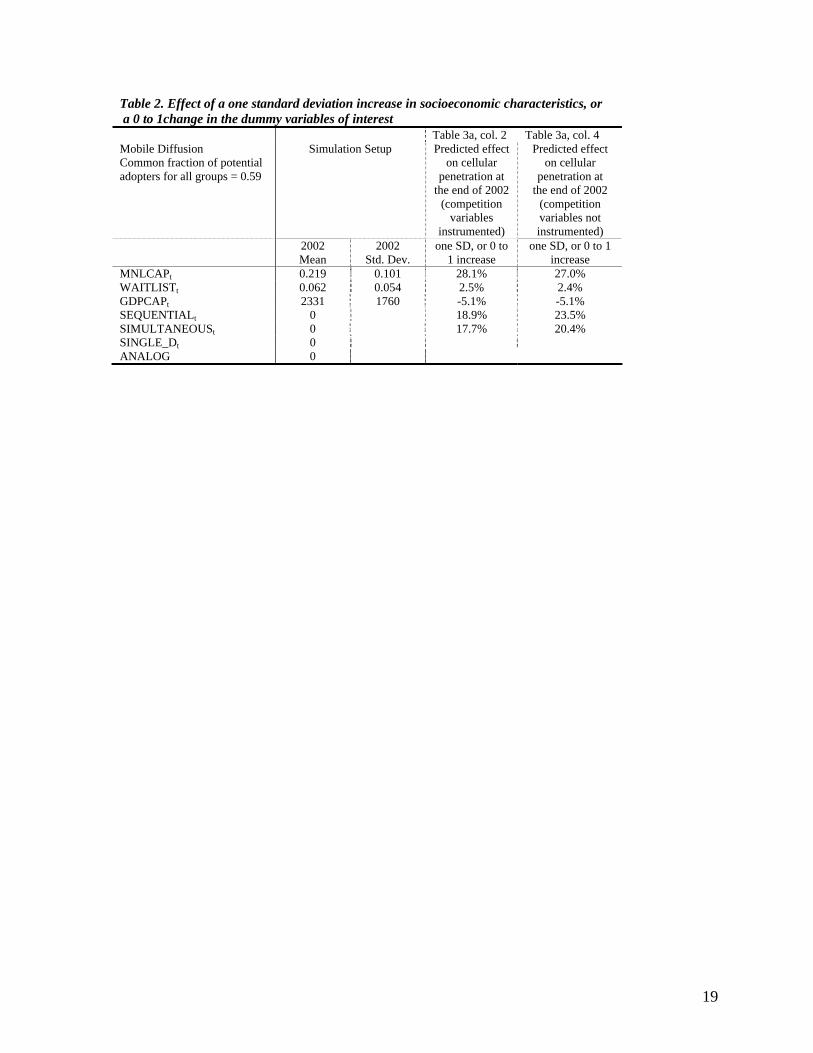
Table 2. Effect of a one standard deviation increase in socioeconomic characteristics, or a 0 to 1change in the dummy variables of interest Table 3a, col. 2 Table 3a, col. 4 Mobile Diffusion Common fraction of potential adopters for all groups = 0.59
Simulation Setup Predicted effect on cellular
penetration at the end of 2002
(competition variables
instrumented)
Predicted effect on cellular
penetration at the end of 2002
(competition variables not instrumented)
2002 Mean
2002 Std. Dev.
one SD, or 0 to 1 increase
one SD, or 0 to 1 increase
MNLCAPt 0.219 0.101 28.1% 27.0% WAITLISTt 0.062 0.054 2.5% 2.4% GDPCAPt 2331 1760 -5.1% -5.1% SEQUENTIALt 0 18.9% 23.5% SIMULTANEOUSt 0 17.7% 20.4% SINGLE_Dt 0 ANALOG 0
19

Table 1a. Former Socialist Countries – Number of Digital Mobile Operators Number of Digital Mobile Operators Analog since Country Name Group 1994 1995 1996 1997 1998 1999 2000 2001 2002
Albania Balkan 1* 2 Armenia CIS 1*
1994 Azerbaijan CIS 1* 2 1993* Bulgaria Balkan 1 2
Bosnia and Herzegovinaa CE 1 2 3*
1993* BelarusaCIS 1* 2
1991 Czech Republic CE 2* 3 1991* Estonia Baltic 1 2 3*
Georgia CIS 2 1990* Croatia CE 1* 2 1990 Hungary CE 2* 3 1994 Kazakhstan CIS 2* 3
Kyrgyzstan CIS 1* 2 1992* Lithuania Baltic 2* 3 1992* Latvia Baltic 1* 2 1995* Moldova CIS 1* 2 3
MacedoniaaBalkan 1*
1992* Poland CE 2 3* 1993* Romania CE 2 3* 4 1991 Russiaa
CIS 1991* Slovakia CE 2* 3 1996* Tajikistana
CIS 1 2 Turkmenistana
CIS 1 1993* Ukraine CIS 4* 5 1993 Uzbekistan CIS 2* 5
YugoslaviaaBalkan
Notes: * indicates entry by the incumbent fixed line operator into the mobile market. a indicates that the country is not part of estimations. The grouping of countries reflects both historical and geographical considerations in order to minimize the heterogeneity between group members. A first division is that between former Soviet Union republics and the other former socialist countries. This division reflects the common history of the former Soviet Union Republics, and the fact that most of the republics are still in the sphere of influence of the Russian Federation. Among former Soviet Union Republics, the Baltic States have slightly different cultural and historical background. They are closer in this respect to the former socialist countries that were not part of the Soviet Union. The Baltic States are also the only former Soviet Union countries that have been invited to attend the negotiations for future European Union enlargement.
Countries that were not members of the Soviet Union were further divided into those in Central Europe, and those in the Balkan Peninsula. This is not only a geographical division. It also reflects the fact that countries in the Balkan Peninsula were for a long period of time under the occupation of the Ottoman Empire, while the other countries were (at least partially) under Austro-Hungarian occupation. The two empires left their mark not only on the culture, but also on the economic institutions of these countries.
20
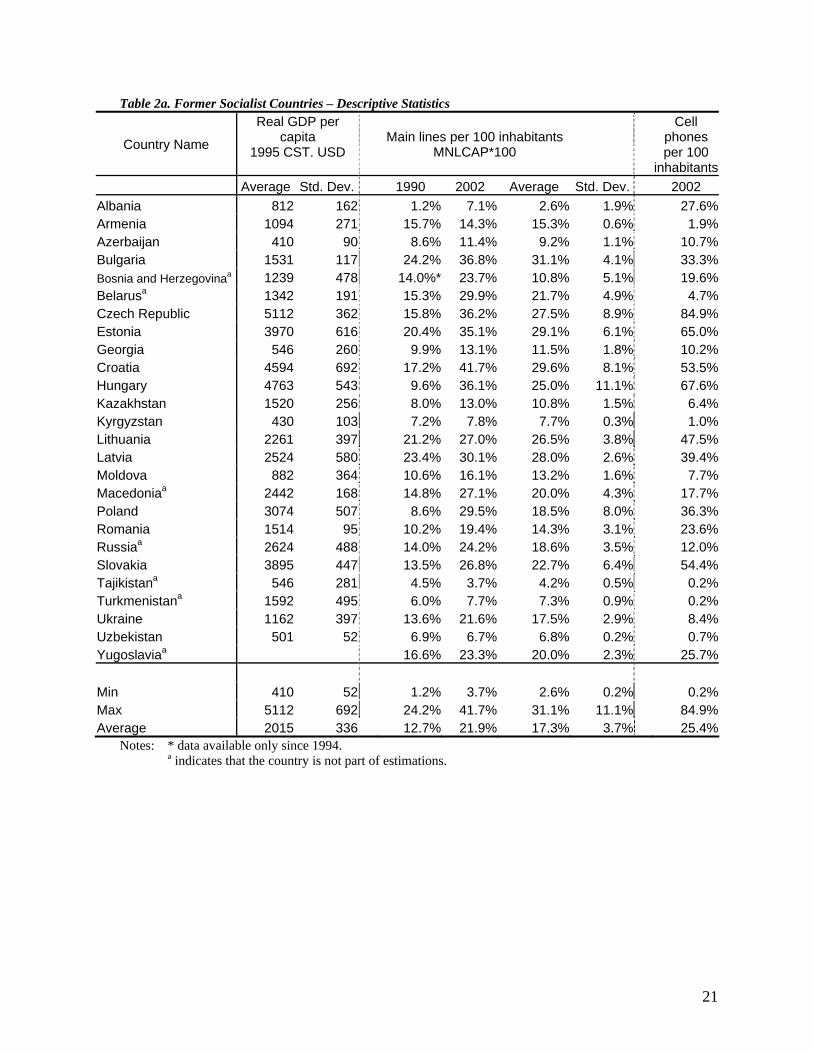
Table 2a. Former Socialist Countries – Descriptive Statistics
Country Name
Real GDP per capita
1995 CST. USD
Main lines per 100 inhabitants MNLCAP*100
Cell phones per 100
inhabitants Average Std. Dev. 1990 2002 Average Std. Dev. 2002 Albania 812 162 1.2% 7.1% 2.6% 1.9% 27.6%Armenia 1094 271 15.7% 14.3% 15.3% 0.6% 1.9%Azerbaijan 410 90 8.6% 11.4% 9.2% 1.1% 10.7%Bulgaria 1531 117 24.2% 36.8% 31.1% 4.1% 33.3%Bosnia and Herzegovinaa 1239 478 14.0%* 23.7% 10.8% 5.1% 19.6%Belarusa 1342 191 15.3% 29.9% 21.7% 4.9% 4.7%Czech Republic 5112 362 15.8% 36.2% 27.5% 8.9% 84.9%Estonia 3970 616 20.4% 35.1% 29.1% 6.1% 65.0%Georgia 546 260 9.9% 13.1% 11.5% 1.8% 10.2%Croatia 4594 692 17.2% 41.7% 29.6% 8.1% 53.5%Hungary 4763 543 9.6% 36.1% 25.0% 11.1% 67.6%Kazakhstan 1520 256 8.0% 13.0% 10.8% 1.5% 6.4%Kyrgyzstan 430 103 7.2% 7.8% 7.7% 0.3% 1.0%Lithuania 2261 397 21.2% 27.0% 26.5% 3.8% 47.5%Latvia 2524 580 23.4% 30.1% 28.0% 2.6% 39.4%Moldova 882 364 10.6% 16.1% 13.2% 1.6% 7.7%Macedoniaa 2442 168 14.8% 27.1% 20.0% 4.3% 17.7%Poland 3074 507 8.6% 29.5% 18.5% 8.0% 36.3%Romania 1514 95 10.2% 19.4% 14.3% 3.1% 23.6%Russiaa 2624 488 14.0% 24.2% 18.6% 3.5% 12.0%Slovakia 3895 447 13.5% 26.8% 22.7% 6.4% 54.4%Tajikistana 546 281 4.5% 3.7% 4.2% 0.5% 0.2%Turkmenistana 1592 495 6.0% 7.7% 7.3% 0.9% 0.2%Ukraine 1162 397 13.6% 21.6% 17.5% 2.9% 8.4%Uzbekistan 501 52 6.9% 6.7% 6.8% 0.2% 0.7%Yugoslaviaa 16.6% 23.3% 20.0% 2.3% 25.7% Min 410 52 1.2% 3.7% 2.6% 0.2% 0.2%Max 5112 692 24.2% 41.7% 31.1% 11.1% 84.9%Average 2015 336 12.7% 21.9% 17.3% 3.7% 25.4%
Notes: * data available only since 1994. a indicates that the country is not part of estimations.
21
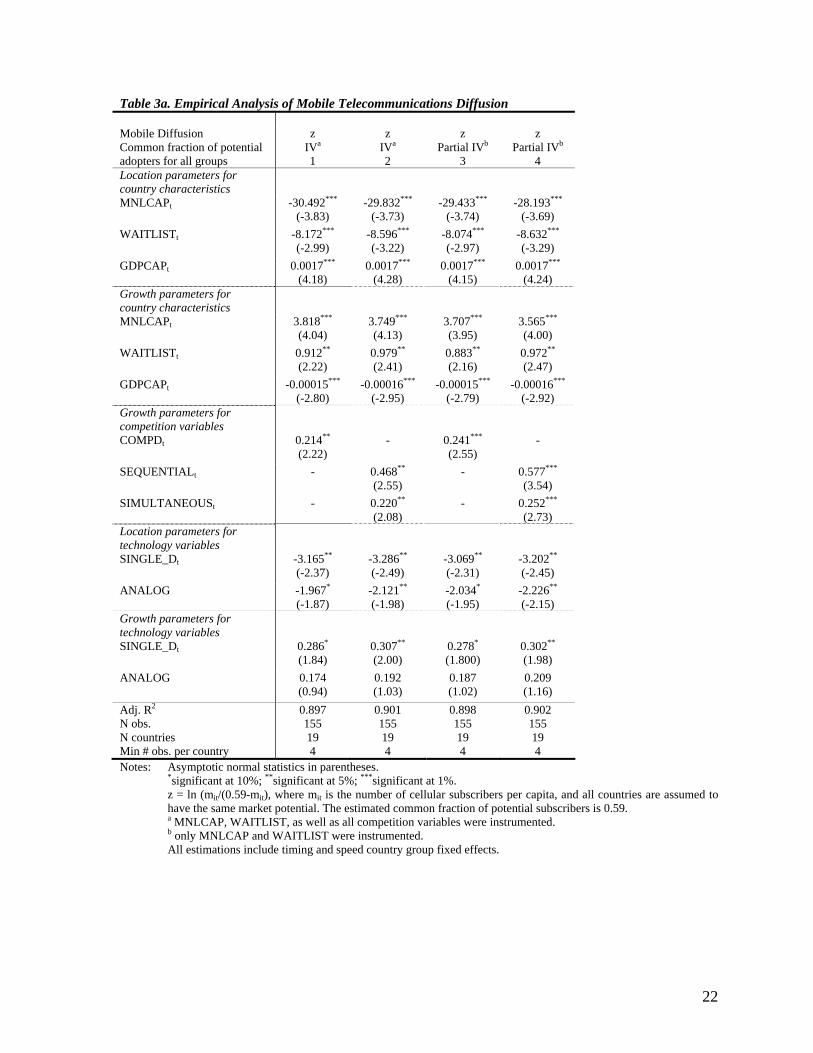
Table 3a. Empirical Analysis of Mobile Telecommunications Diffusion Mobile Diffusion Common fraction of potential
z IVa
z IVa
z Partial IVb
z Partial IVb
adopters for all groups 1 2 3 4 Location parameters for country characteristics
MNLCAPt -30.492***
(-3.83) -29.832***
(-3.73) -29.433***
(-3.74) -28.193***
(-3.69) WAITLISTt -8.172***
(-2.99) -8.596***
(-3.22) -8.074***
(-2.97) -8.632***
(-3.29) GDPCAPt 0.0017***
(4.18) 0.0017***
(4.28) 0.0017***
(4.15) 0.0017***
(4.24) Growth parameters for country characteristics
MNLCAPt 3.818***
(4.04) 3.749***
(4.13) 3.707***
(3.95) 3.565***
(4.00) WAITLISTt 0.912**
(2.22) 0.979**
(2.41) 0.883**
(2.16) 0.972**
(2.47) GDPCAPt -0.00015***
(-2.80) -0.00016***
(-2.95) -0.00015***
(-2.79) -0.00016***
(-2.92) Growth parameters for competition variables
COMPDt 0.214**
(2.22) - 0.241***
(2.55) -
SEQUENTIALt - 0.468**
(2.55) - 0.577***
(3.54) SIMULTANEOUSt - 0.220**
(2.08) - 0.252***
(2.73) Location parameters for technology variables
SINGLE_Dt -3.165**
(-2.37) -3.286**
(-2.49) -3.069**
(-2.31) -3.202**
(-2.45) ANALOG -1.967*
(-1.87) -2.121**
(-1.98) -2.034*
(-1.95) -2.226**
(-2.15) Growth parameters for technology variables
SINGLE_Dt 0.286*
(1.84) 0.307**
(2.00) 0.278*
(1.800) 0.302**
(1.98) ANALOG 0.174
(0.94) 0.192 (1.03)
0.187 (1.02)
0.209 (1.16)
Adj. R2
N obs. N countries Min # obs. per country
0.897 155 19 4
0.901 155 19 4
0.898 155 19 4
0.902 155 19 4
Notes: Asymptotic normal statistics in parentheses. *significant at 10%; **significant at 5%; ***significant at 1%. z = ln (mit/(0.59-mit), where mit is the number of cellular subscribers per capita, and all countries are assumed to have the same market potential. The estimated common fraction of potential subscribers is 0.59. a MNLCAP, WAITLIST, as well as all competition variables were instrumented. b only MNLCAP and WAITLIST were instrumented. All estimations include timing and speed country group fixed effects.
22

Data Description and Sources
GDPCAP real per capita GDP expressed in 1995 constant USD (WDI)29
MNLCAP number of main lines per capita (ITU)30
WAITLIST ratio between registered applications for a main line and the number of main lines in operation (ITU)
COMP_D dummy = 1 every year after the introduction of two or more digital mobile communications operators (GM and GW)31
SEQUENTIAL dummy = 1 every year after the introduction of competition, if a single digital mobile operator was present in the market from the beginning of digital communications adoption (GM and GW)
SIMULTANEOUS dummy = 1 every year after the introduction of competition, if two or more digital mobile operators were present in the market from the beginning of digital communications adoption (GM and GW)
ANALOG dummy = 1 if only analog technology was introduced in the country (GM and GW)
SINGLE_D dummy = 1 every year after the introduction of digital mobile communications, if country did not start adopting mobile communications with analog technology (GM and GW)
Instruments
TIME number of years since 1989. In general, competition was more likely to be introduced during the latter years. This instrument also captures the trend in the number of fixed lines per capita and in the fraction of people waiting for a fixed line.
POP country population (WDI). More populous countries were more likely to introduce competition earlier, and tended to introduce competition simultaneously.
TVCAP number of television receivers per capita (ITU). This variable is a good instrument for the number of fixed lines per capita. Former socialist countries had relatively low numbers of television receivers per capita when communism fell. The number of television receivers increased considerably afterwards, much like the number of fixed telephone lines.
TDSGNI total debt service as a fraction of GNI (WDI). This variable serves as a proxy for the natural resources of each country. For richer countries, total debt service represents a lower fraction of GNI, and richer countries tended to introduce competition earlier, and simultaneously.
GVTEXP government expenditure as a fraction of GDP (WDI). A higher fraction of government spending in GDP is characteristic for countries in which reforms and the privatization process did not work
29 WDI: World Bank, World Development Indicators Database 30 ITU: International Telecommunication Union, World Telecommunication Indicators Database 31GM and GW: Informa UK Ltd., Global Mobile; Crain Communications Inc., Global Wireless
23
well, and the public sector played an important role. These countries were generally less attractive to foreign investors.
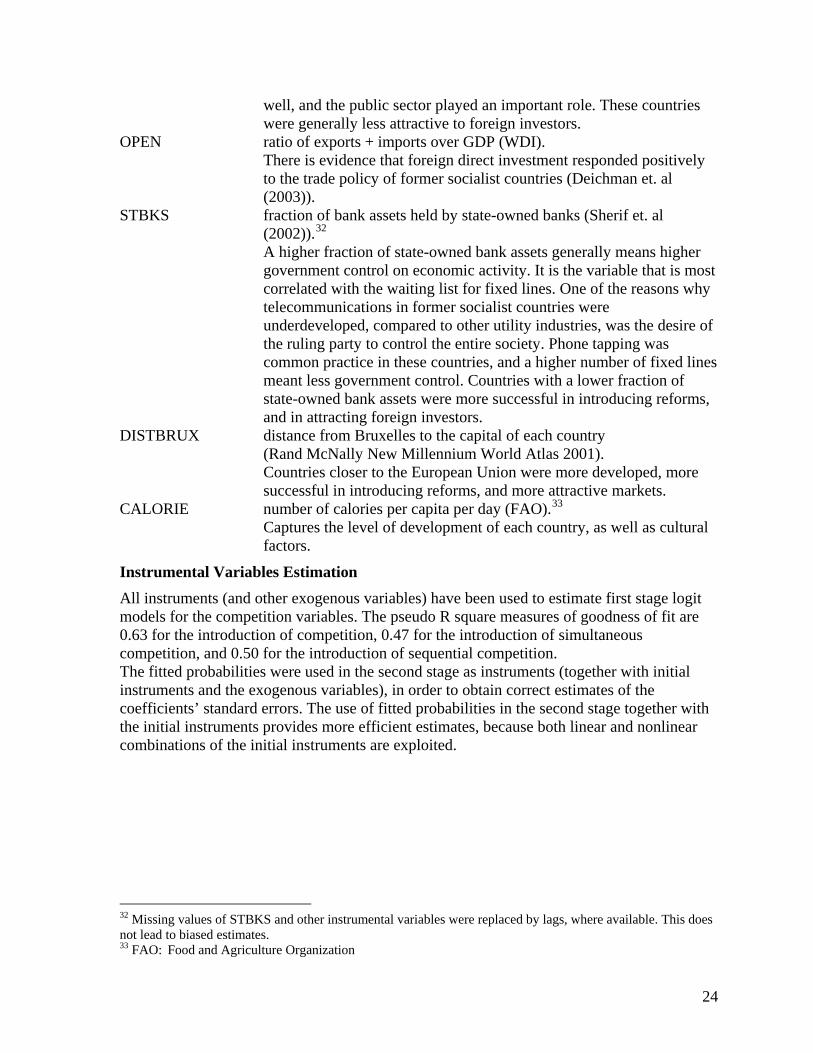
OPEN ratio of exports + imports over GDP (WDI). There is evidence that foreign direct investment responded positively to the trade policy of former socialist countries (Deichman et. al (2003)).
STBKS fraction of bank assets held by state-owned banks (Sherif et. al (2002)).32
A higher fraction of state-owned bank assets generally means higher government control on economic activity. It is the variable that is most correlated with the waiting list for fixed lines. One of the reasons why telecommunications in former socialist countries were underdeveloped, compared to other utility industries, was the desire of the ruling party to control the entire society. Phone tapping was common practice in these countries, and a higher number of fixed lines meant less government control. Countries with a lower fraction of state-owned bank assets were more successful in introducing reforms, and in attracting foreign investors.
DISTBRUX distance from Bruxelles to the capital of each country (Rand McNally New Millennium World Atlas 2001). Countries closer to the European Union were more developed, more successful in introducing reforms, and more attractive markets.
CALORIE number of calories per capita per day (FAO).33
Captures the level of development of each country, as well as cultural factors.
Instrumental Variables Estimation All instruments (and other exogenous variables) have been used to estimate first stage logit models for the competition variables. The pseudo R square measures of goodness of fit are 0.63 for the introduction of competition, 0.47 for the introduction of simultaneous competition, and 0.50 for the introduction of sequential competition. The fitted probabilities were used in the second stage as instruments (together with initial instruments and the exogenous variables), in order to obtain correct estimates of the coefficients’ standard errors. The use of fitted probabilities in the second stage together with the initial instruments provides more efficient estimates, because both linear and nonlinear combinations of the initial instruments are exploited.
32 Missing values of STBKS and other instrumental variables were replaced by lags, where available. This does not lead to biased estimates. 33 FAO: Food and Agriculture Organization
24
References
Armstrong, M., 1998, Network Interconnection in Telecommunications, The Economic Journal, 108, 545-564.
Armstrong, M. and J. Vickers, 1996, Regulatory Reform in Telecommunications in Central and Eastern Europe, Economics of Transition, 4, 295-314.
Deichman, J., A. Eshghi, D. Haughton, S. Sayek, and N. Teebagy, 2003, Foreign Direct Investment in the Eurasion Transition States, Eastern European Economics, 41, 5-34.
Dekimpe, M., P. Parker, and M. Sarvary, 1998, Staged Estimation of International Diffusion Models: An Application to Global Cellular Telephone Adoption, Technological Forecasting and Social Change, 57, 105-132.
Informa UK Ltd., Global Mobile, various issues.
Crain Communications Inc., Global Wireless, various issues.
Food and Agriculture Organization, 2003, FAOSTAT Database.
Gruber, F. and H. Verboven, 2001a, The Diffusion of Mobile Telecommunications Services in the European Union, European Economic Review, 25, 577-588.
Gruber, F. and H. Verboven, 2001b, The Evolution of Markets under Entry and Standards Regulation – The Case of Global Mobile Telecommunications, International Journal of Industrial Organization, 19, 1189-1212.
Henisz, W., 2000, The Institutional Environment for Economic Growth, Economics and Politics, 12(1), 1-31.
International Telecommunication Union, 2002, World Telecommunication Indicators Database, 5th edition.
World Bank, 2003, World Development Indicators Online.
Laffont, J., P. Rey, and J. Tirole, 1998a, Network Competition. I. Overview and Nondiscriminatory Pricing, RAND Journal of Economics, 29 (1), 1-38.
Laffont, J., P. Rey, and J. Tirole, 1998b, Network Competition. II. Price Discrimination, RAND Journal of Economics, 29 (1), 38-57.
Parker, P. and L. Röller, 1997, Collusive Conduct in Duopolies: Multimarket Contact and Cross-Ownership in the Mobile Telephone Industry, RAND Journal of Economics, 28, 304-322.
Poot, J., 2000, A Synthesis of Empirical Research on the Impact of Government on Long-Run Growth, Growth and Change, 31, 516-546.
Rand McNally, 2001, New Millennium World Atlas.
Sherif, K., M. Borish, and A. Gross, 2002, State-Owned Banks in the Transition: Origin, Evolution, and Policy Responses, World Bank Publication, 022803.
25