Embed Size (px)
Citation preview

1
Competition and Profitability in the Chinese banking industry: new evidence from
different ownership types
Abstract
This paper tests the competition in different banking markets in China (deposit market, loan market,
and non-interest income market) using a sample of Chinese commercial banks (state-owned banks,
joint-stock banks and city commercial banks) over the period 2003-2013 and further examines the
impact of competition on bank profitability for the whole sample and also for different ownership
types. The results show that non-interest income market in the Chinese banking industry has a
higher level of competition compared to the other two markets during early years of the examined
period. The findings further report that in a higher competitive deposit market, Chinese
commercial banks have lower levels of profitability. Finally, the results suggest that a higher
competitive loan market leads to higher profitability of all these three types of banks while the
impact of deposit market competition is significant and negative.
Keywords: Bank profitability, Bank competition, GMM, China
JEL classification: G21, C23
2
1. Introduction
The Chinese banking sector has undergone sustainable and healthy development through several
rounds of banking reforms initiated by the government since 1978. The main purpose of these
banking reforms has been to increase competitive conditions, enhance stability and improve the
performance of the Chinese banking sector. With regards to the competitive condition in the
Chinese banking industry, it is noticed that the state-owned commercial banks (SOCBs)1 still
dominate the industry. However, according to statistics from the China Banking Regulatory
Commission (CBRC), the share of SOCB assets in total banking sector assets decreased between
2003 and 2013 to a low point of 43.3%. On the other hand, the joint-stock commercial banks
(JSCBs) and city commercial banks (CCBs) have kept increasing in size and in 2013 they held
17.8% and 10.03% of total banking sector assets. Therefore, the statistic shows that the competitive
condition is still quite low under the consideration that five largest banks hold more than 40% of
total banking sector assets. Table 1 summarizes the assets of SOCBs, JSCBs, CCBs and total
banking institutions in China over the period 2003-2013.
<<Table 1---about here>>
The impact of competition on profitability in the banking industry has been documented in the
traditional structure-conduct-performance (SCP) paradigm, which mainly argues that in a higher
concentrated industry with a lower level of competition, firms tend to collude with each other to
obtain higher profit. In addition, there is a large number of literature investigating the impact of
1 There are five state-owned commercial banks in China now including Bank of China, Industrial
and Commercial Bank of China, China Construction Bank, Agricultural Bank of China and Bank
of Communication.
3
competition on profitability in the banking industry (Smirlock, 1985; Bourke, 1989; Goldberg and
Rai, 1996; Demirguc-Kunt and Huizinga, 1999; Maudos and Fernandez de Guevara, 2004;
Athanasoglou et al., 2008; Tan and Floros, 2014; Tan, 2016; among others). In comparison to the
traditional SCP hypothesis discussed above, the efficient-structure hypothesis (ES) argues that it
is the superior efficiency rather than the collusive behavior that actually leads to an improvement
in bank profitability. Accounting cost-income ratio or parametric stochastic frontier estimation is
used to derive the bank efficiency. The empirical literature has different findings with regard to
the impact of efficiency on bank profitability (Berger, 1995a, Garcia-Herrero et al., 2009; among
others). Recently, Tan (2017) investigates the joint impact of competition in different banking
markets (deposit market, loan market and non-interest income market) and shadow banking using
a sample of Chinese commercial banks over the period 2003-2013. This study contributes to the
empirical banking literature, in particular to Tan (2017) by examining the impacts of competition
in different banking markets on profitability of different ownership types of Chinese commercial
banks (state-owned commercial banks, joint-stock commercial banks and city commercial banks),
the evaluation of this would be very important for the financial regulatory authorities to make
different policies for different banks. In addition, the current study uses stability inefficiency rather
than Z-score to measure the insolvency risk in the Chinese banking industry, which is supposed to
provide more accurate results.
The results of the current paper show that in general, there is a higher level of competition in the
non-interest income market compared to the ones in deposit market and loan market. Furthermore,
it is found that in a higher competitive deposit market, Chinese commercial banks have lower
levels of profitability. With regard to the impact of competition on the profitability of different
ownership types of Chinese commercial banks, the findings suggest that a higher competitive loan
4
market leads to higher bank profitability while Chinese commercial banks have lower levels of
profitability in a more competitive deposit market for state-owned, joint-stock and city commercial
banks. In particular, we find that in a higher competitive non-interest income market, joint-stock
commercial banks have lower levels of net interest margin (NIM).
This paper will be structured as follows: Relevant literature investigating bank profitability will be
reviewed in section 2; section 3 presents the data and methodology, which is followed by section
4 describing and discussing the findings and section 5 provides a summary and conclusion of the
whole paper.
2. Literature review on bank profitability
2.1 Literature review on bank profitability
The empirical literature of bank profitability focuses on the US banking industry, European
banking industry, Asian economies as well as Chinese banking industry, most of the studies find
that the bank profitability is significantly affected by bank size, bank liquidity, bank capitalization,
bank credit risk, bank efficiency, bank diversification as well as GDP. Table 2 provides a summary
of the empirical studies focuses on countries except China.
<<Table 2---about here>>
2.2 literature review on investigating profitability in the Chinese banking industry
The profitability in the Chinese banking sector has been extensively tested by the empirical
literature. Shih et al. (2007) evaluated the performance of a sample of Chinese commercial banks
in 2002 under a principal component analysis. The results indicate that joint-stock commercial
5
banks have better performance compared to state-owned commercial banks and city commercial
banks. Their findings further suggest that bank size does not have any significant impact on bank
performance in China.
Rather than using the principal component analysis, few studies used the fixed or random effort
estimator to evaluate the profitability of Chinese commercial banks (Sufian and Habibullah, 2009
and Sufian, 2009; among others).The results of Sufian and Habihullah (2009) suggest that credit
risk has a significant and positive impact on the profitability of Chinese state-owned commercial
banks and joint-stock commercial banks. In addition, Sufian (2009) uses four state-owned
commercial banks and twelve joint-stock commercial banks during 2000-2007 to examine the
determinants of bank profitability in China. The results show that Chinese commercial banks with
higher levels of credit risk and higher levels of liquidity have higher profitability.
The fixed or random effect estimator is unable to deal with the issue of profit persistence,
endogeneity as well as autocorrelation when estimating the determinants of bank profitability, thus,
a growing number of recent literature used the Generalized Method of Moments (GMM) estimator
to test the profitability in the Chinese banking industry (Tan and Floros, 2012a, 2012b, 2012c). In
particular, these studies examined the impact of competition on Chinese bank profitability using
3-bank or 5-bank concentration ratio. The results of these studies do not find any significant impact
of competition on bank profitability.
The GMM estimator was also used by Garcia-Herrero et al. (2009) to jointly test the impact of
efficiency and competition on bank profitability in China over the period 1997-2004. Rather than
using the 3-bank or 5-bank concentration ratio as the competition indicator, they used the
Hirfindahl-Hirschman index. The results show that Chinese commercial banks with higher levels
6
of efficiency have higher profitability and there is no clear impact of competition on bank
profitability in China.
More recently, Tan (2016) examined the impacts of risk and competition on bank profitability in
China over the period 2003-2011 under a GMM estimation. This study contributed to the previous
studies by using the Lerner index to measure the competitive conditions. This indicator has the
advantages of measuring the competition of different ownership types of Chinese banks from the
perspective of market power. The results show that there are no clear impacts of risk and
competition on bank profitability in China.
Using a sample of Chinese commercial banks over the period 2003-2009, Tan and Floros (2014)
investigated the inter-relationships between risk, profitability and competition in the Chinese
banking industry, two types of risk are considered which are credit risk and insolvency risk while
the competitive condition is measured by the Lerner index. They used the Seemingly Unrelated
Regression to analyze the inter-relationships. The results show that there is a negative impact of
competition on bank profitability in China while there is no robust impact of different types of risk
on bank profitability in China.
Tan (2017) use a sample of Chinese commercial banks over the period 2003-2017 to test the impact
of competition in different banking market and shadow banking on bank profitability. The results
from Boone indicator show that non-interest income market has a higher level of competition
compared to the deposit market and loan market, while the findings from a GMM estimation report
that a lower level of competition in the deposit market improves the profitability of Chinese banks
and shadow banking also improves the bank profitability in China.
7
3. Data and Methodology
3.1 Data
Our sample consists of data from five SOCBs, twelve JSCBs, and eighty-three CCBs. The sample
covers the period 2003-2013 and the bank-specific data is collected from Bankscope database
produced by Bureau Van Dijk (www.bvdinfo.com). The industry-specific and macroeconomic
variables are retrieved from the website of China Banking Regulatory Commission
(www.cbrc.gov.cn) and the World Bank database (data.worldbank.org). Due to the fact that not all
the banks have available information for all the years, we opt for an unbalance panel dataset not
to lose degrees of freedom. We use two different profit measures which are ROA and NIM. The
bank-specific determinants of profitability include credit risk, liquidity, capital, insolvency risk,
bank size, bank diversification and overhead cost. All the bank-specific variables are measured by
relevant accounting ratios except the insolvency risk, which is measured by stability inefficiency
(see methodology for detail). The industry-specific variables include competition, banking sector
development and stock market development. With regards to the macroeconomic determinants,
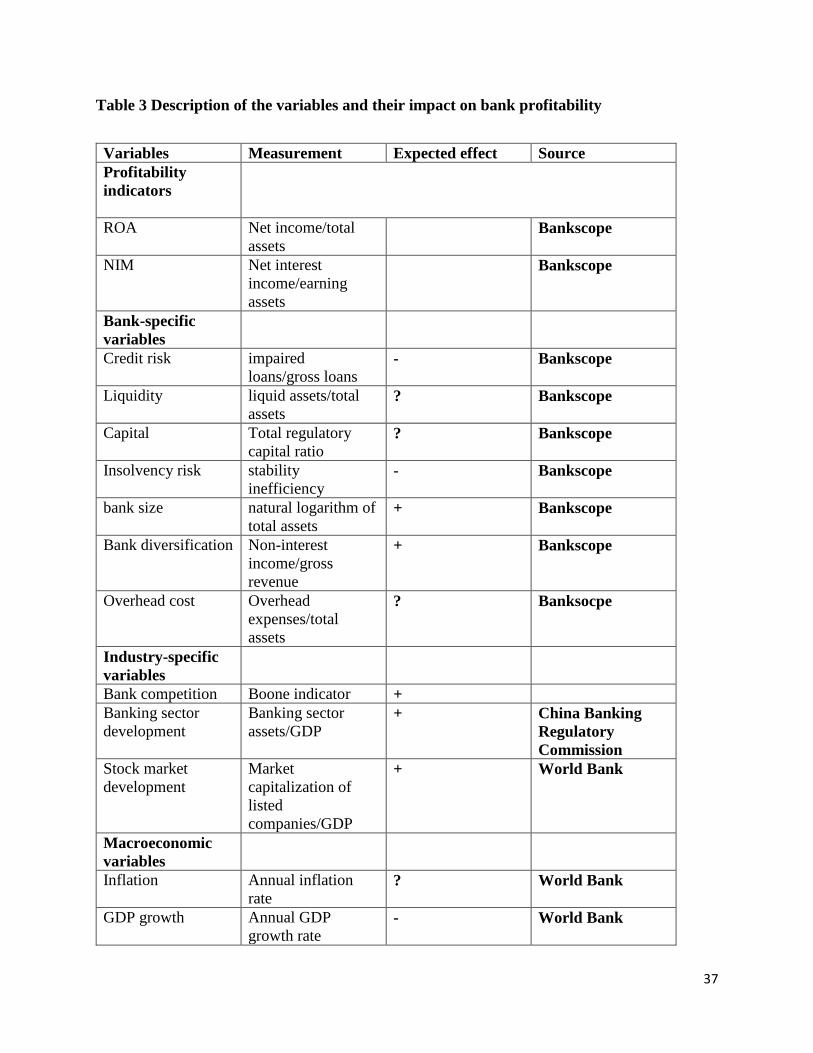
we include both annual inflation rate and annual GDP growth rate. Table 3 provides a summary of
the variables used in the current study and their expected effects on bank profitability.
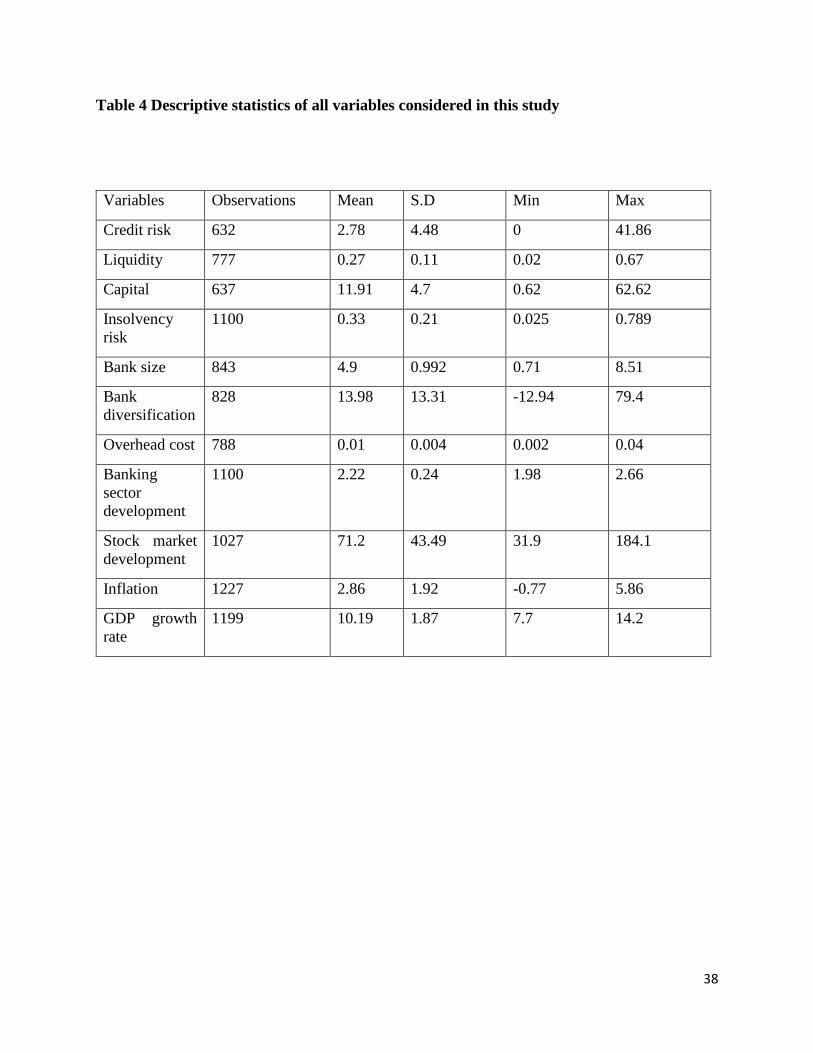
Table 4 shows the summary statistics of the independent variables used in the current study. The
table shows that the difference in liquidity level of Chinese commercial banks is smaller than the
ones for credit risk and capital, while the higher levels of credit risk undertaken by Chinese
commercial banks are attributed to the fact that during 2003-2006, there are large volumes of non-
performing loans in SOCBs, especially in the Agricultural Bank of China. Further, the large
difference in the levels of capital is attributed to the opening of one joint-stock commercial bank;
8
namely, the China Bohai Bank in 2006 which had a total regulatory capital ratio of over 60%. The
data indicates that Chinese banks have big differences in the degree of diversified activities
engaged in. The difference in bank size is attributed to the fact that SOCBs are bigger than JSCBs,
while CCBs are the smallest. The statistics show further that there is a stronger volatility with
regard to the development of the stock market than of the banking sector and the macroeconomic
environment. The stronger volatility of stock market development can be attributed mainly to the
segregation reform initiated by the Chinese government in 2005 which led to a substantial amount
of companies being listed on the stock exchange. By the end of 2007, there were 1550 listed
companies on the Shanghai and Hong Kong Stock Exchanges, the value of which reached RMB
32.71 billion, accounting for 132.6% of GDP in that year.
<<Table 3--about here>>
<<Table 4---about here>>
3.2 Methodology
3.2.1 Measurement of competition in different banking markets in China
The current study uses the method proposed by Boone (2008) to measure the competition. The
Bonne indicator holds the idea that the performance of efficient firms is improved and the
performance of inefficient firms is weakened by competition. The basic logic of Boone indicator
is in line with the argument of efficiency structure hypothesis as developed by Demsetz (1973)
which links the influence of efficiency on performance. The performance can be measured by
profit or market share. The stronger effect will lead to a more negative Boone indicator. The Boone
indicator for bank i can be defined by the simplest equation as follows:
9
)()( kiki MCLNMSLN (1)
Where i represents the specific bank, k stands for a specific bank output, MS is the market share
while MC measures the marginal cost. denotes the Boone indicator. In this paper, we focus on
the analysis of competition in different markets reflecting interest income activities as well as non-
interest generating business, this significantly contributes to the empirical banking literature which
just focuses on the examination of the whole banking market or only the loan market. Thus,
K=loans, deposits, non-interest income.
The marginal cost is estimated on the basis of a translog cost function with four outputs (total loans,
total deposits, securities and non-interest income) and two input prices (price of labour, price of
capital). The specification of the translog cost function is shown as below (Tabak et al., 2012):
j
ititjitjitit
j j k
itkitjitjkjitjitW
WLNLNY
W
WLN
W
WLN
W
WLNLNYLNYLNY
W
CLN )()()(
2
1)(
2
1)(
2
1
2
1
2
111
2
110
2
(2)
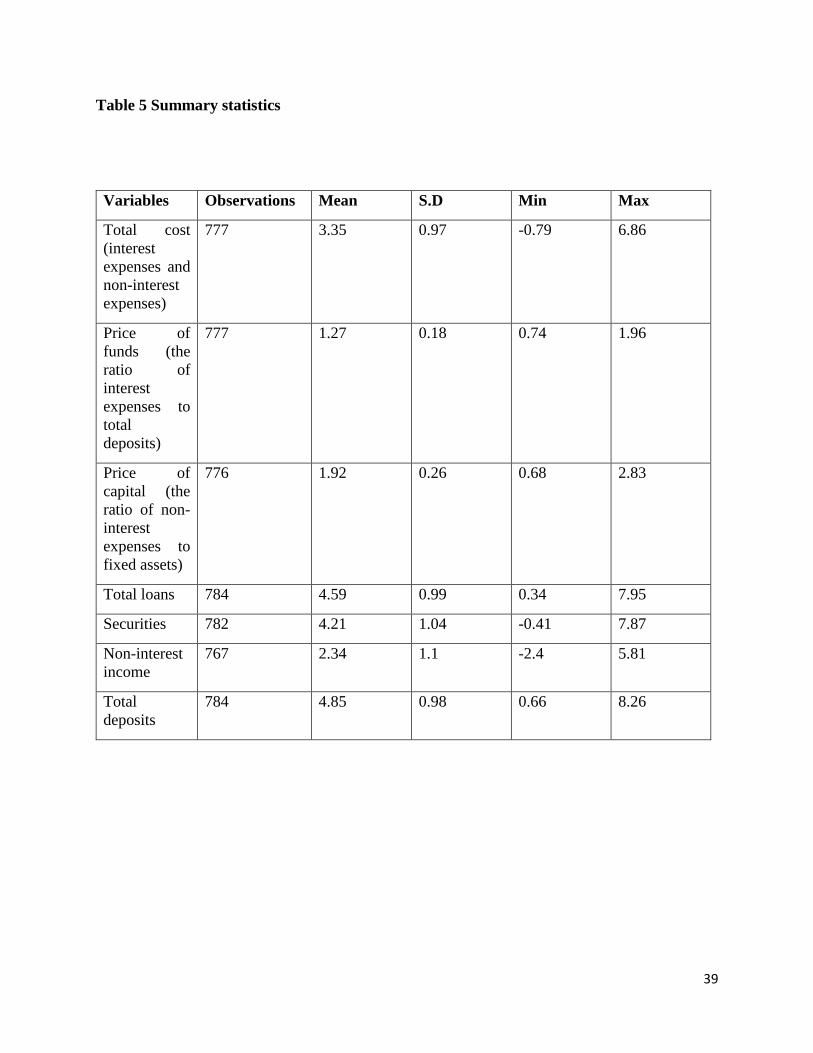
where C represents total cost of the bank, Y represents four outputs including total deposits, total
loans, non-interest income and securities, W stands for two input prices with W1 representing the
price of funds which is measured by the ratio of interest expenses to total deposits, W2 represents
the price of capital, which is measured by the ratio of non-interest expenses to fixed assets, two
input prices are considered due to the fact that non-interest expenses include the labour cost as
well (Hasan and Morton, 2003). In other words, the price of capital considers the factors relating
to the price of physical capital as well as the price of human capital. The linear homogeneity is
ensured by normalizing the dependent variable and W1 by anther input price W2. The summary
statistics of the variables are reported in Table 5.
10
<<Table 5---about here>>
The marginal cost of loans can be obtained by taking the first derivative of the dependent variable
in the above equation in relationship to the output loans as follows:
lkkk
liktlkiltlllj
ilt
itilt
W
WLNLNYLNY
Y
WCMC
,....1 2
12 ))(2)(/
( (3)
The marginal cost of deposit and non-interest income can be obtained similarly by taking the first
derivative of the dependent variable in the above equation in relationship to the outputs deposits
and non-interest income as below:
dkkk
liktdkidtdddj
idt
itidt
W
WLNLNYLNY
Y
WCMC
,....1 2
12 ))(2)(/
( (4)
nkkk
liktnknnnjit
W
WLNLNYLNY
Y
WCMC
,....1 2
1int
int
2
int ))(2)(/
( (5)
3.2.2 Estimation of stability in the Chinese banking sector-Stability inefficiency
The current study follows Tan (2016) to estimate the insolvency risk in the Chinese banking
industry under the stability inefficiency rather than the Z-score by providing a translog frontier
specification as follows:
(6)
itit
itj
jitj
it
j k
itkitjitjk
j
jitjit
W
WLnLnY
W
WLn
W
WLnLnYLnYLnY
W
scoreZLn
)(
)(2
1)(
2
1)(
2
1
2
12
2
110
2
11
Where W represents input prices, there are two input prices which are price of funds (the ratio of
interest expenses to total deposits) and price of capital (the ratio of non-interest expenses to fixed
assets). Y represents four outputs which are total loans, total deposits, other earning assets and
non-interest income. The sub-index i and t represent bank i operates at time t while j and k represent
different outputs. The error term equals . The first term captures the random
disturbance, which is assumed to be normally distributed and represents the measurement errors
and other uncontrolled factors, i.e. ~N (0, ). The second term captures the technical and
allocative inefficiency, both under managerial control, and it is assumed to be half-normally
distributed, i. e. ~ ( ). Higher stability inefficiency indicates higher risk while lower
stability inefficiency means the risk is lower.
3.2.3 Estimation on the determinants of bank profitability
In general, there are two groups of Generalized Method of Moments (GMM) estimators used to
estimate a dynamic model of bank profitability, they are System GMM estimator and difference
GMM estimator. Comparing between these two different estimators, the current study prefers the
former due to the fact that system GMM estimator is able to address the issue of unit root and
produce more robust and accurate results (Bond, 2002). In addition, rather than using a two-step
estimator by Ahamed (2017), the one-step GMM estimator is chosen in the current study to
investigate the profitability in the Chinese banking industry following Athanasglou et al. (2008).
Besides using the one period lag of profitability indicators, through the Sargan over-identifying
test, we confirm that the capital will be treated as endogenous variable, while credit risk will be
treated as predetermined variable, other variables do not suffer any endogenous issue. In order to
make sure there is no second order autocorrelation in the estimation, the predetermined variable is
it itit it
it2
it
itN ,it 2
12
instrumented using levels lagged by one year period, while the endogenous variable is
instrumented using levels lagged by two years periods. In terms of the choice between first-
difference transformation and orthogonal deviation, the current study follows Yao et al. (2018)
and applies the orthogonal deviation. Arellano and Bover (1995) argue that in an unbalance panel
data, the average of future available observations of a variable in the transformed data is subtracted
by the orthogonal deviation, which means that the gap is not magnified by the method. This study
follows and expands the specification proposed by Athanasoglou et al. (2008), which can be
expressed as follows:
𝐼𝐼𝑖𝑡 = C + δ𝐼𝐼𝑖,𝑡−1 + ∑ 𝛽𝑗𝑋𝑖𝑡𝑗+∑ 𝛽𝑙𝑋𝑖𝑡
𝑙 + ∑ 𝛽𝑚𝑋𝑖𝑡𝑚 + 𝑣𝑖𝑡 + 𝜇𝑖𝑡
𝑚𝑚=1
𝑙𝑙=1
𝑗𝑗=1
(7)
Where i refers to year and t refers to an individual bank, itII represents the profitability indicator
for the specific bank at a specific year, C is the constant term, 1, tiII is one period lagged
profitability. itX are determinants of bank profitability. They are grouped into bank-specific
determinants including credit risk, liquidity, capital, insolvency risk, bank size, overhead cost and
bank diversificationj
itX ; industry-specific determinants including competition in different
banking markets, stock market development and banking sector development l
itX ; and
macroeconomic determinants including inflation and GDP growth m
itX . The unobserved bank-
specific effect and the idiosyncratic error are represented by it and it , respectively. j , ,l and
m are coefficients to be estimated, while represents the speed of adjustment to equilibrium. Its
value ranges from 0 to 1, with a higher figure representing slower adjustment and less competitive
13
structure, while a lower figure indicates that there is a stronger competitive condition and a higher
speed of adjustment.
4. Empirical results
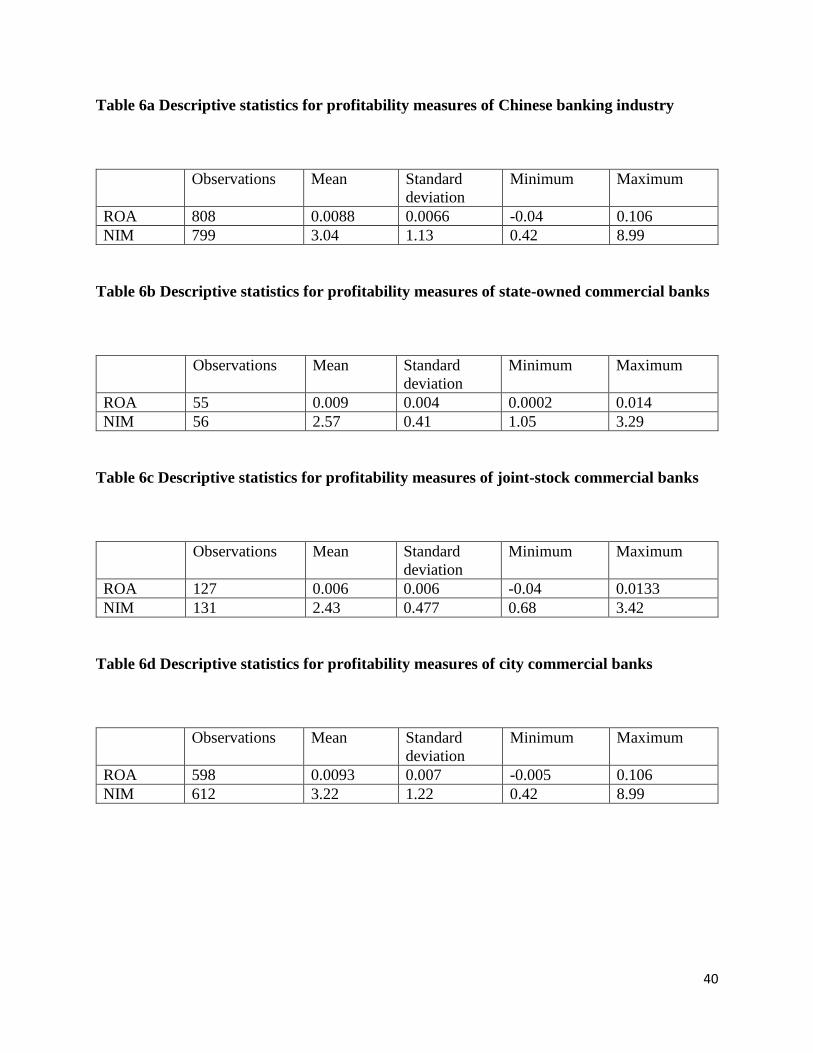
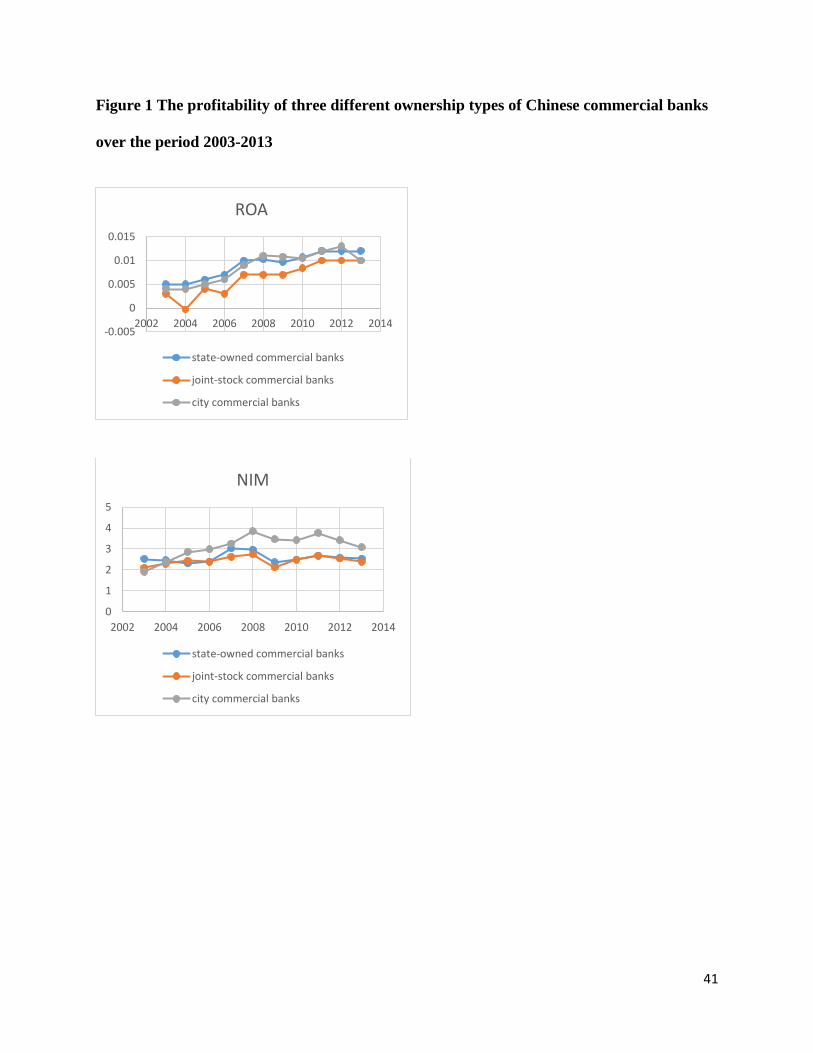
Tables 6a-6d present the descriptive statistics of the two different profitability measures (ROA and
NIM) for the whole Chinese banking industry as well as for different ownership types. The table
shows that the profitability of CCBs is the highest over the examined period which is followed by
SOCBs while the profitability of JSCBs is the lowest. When looking at the profitability of different
ownership types of Chinese commercial banks on a year by year basis, Figure 1 shows that, in
general, SOCBs and CCBs have higher profitability than JSCBs.
<<Tables 6a to 6d---about here>>
<<Figure 1---about here>>
4.1 The competitive condition in the Chinese banking industry---Boone indicator
Compared to the competitive condition among the above three different banking markets, it is
noticed that over the period 2006-2013, the competitive condition in these three different markets
was the same, the main difference is noticed during the period 2003-2005. Figure 2 shows that
the competitive condition in the non-interest income market is the highest in general between
2003-2005 compared to the other two markets while the competitive condition in the loan market
and the deposit market were the same over the same period.
<<Figure 2---about here>>
14
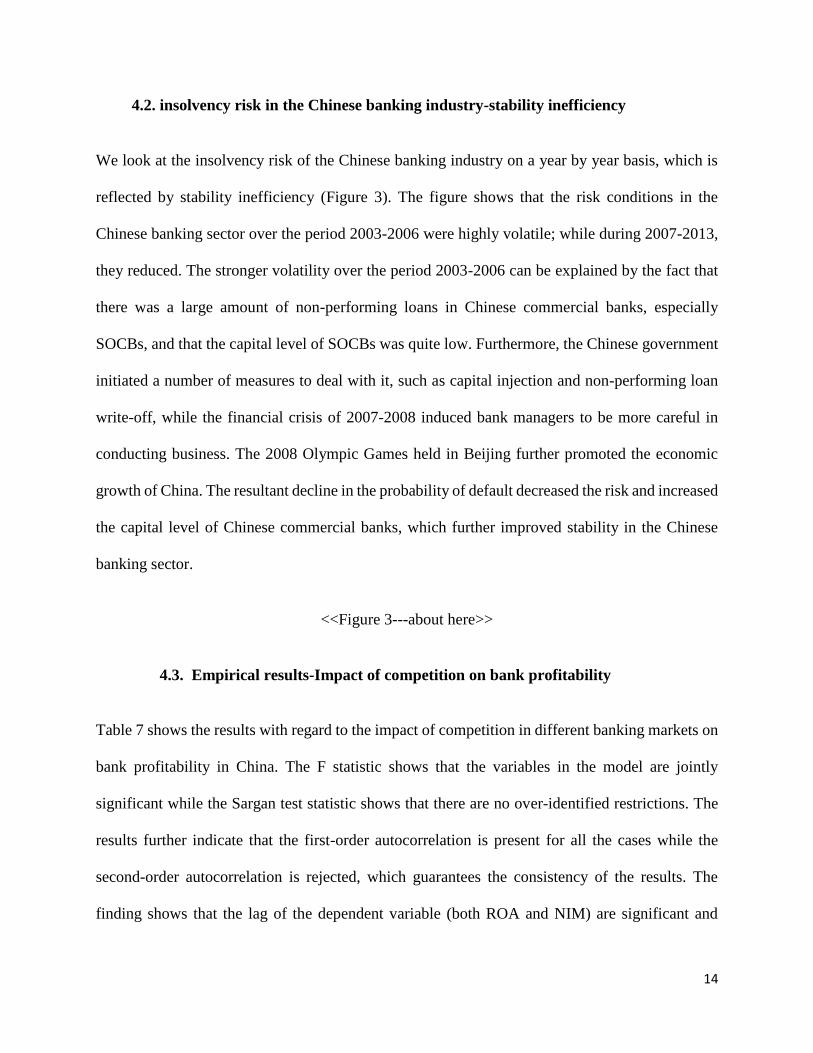
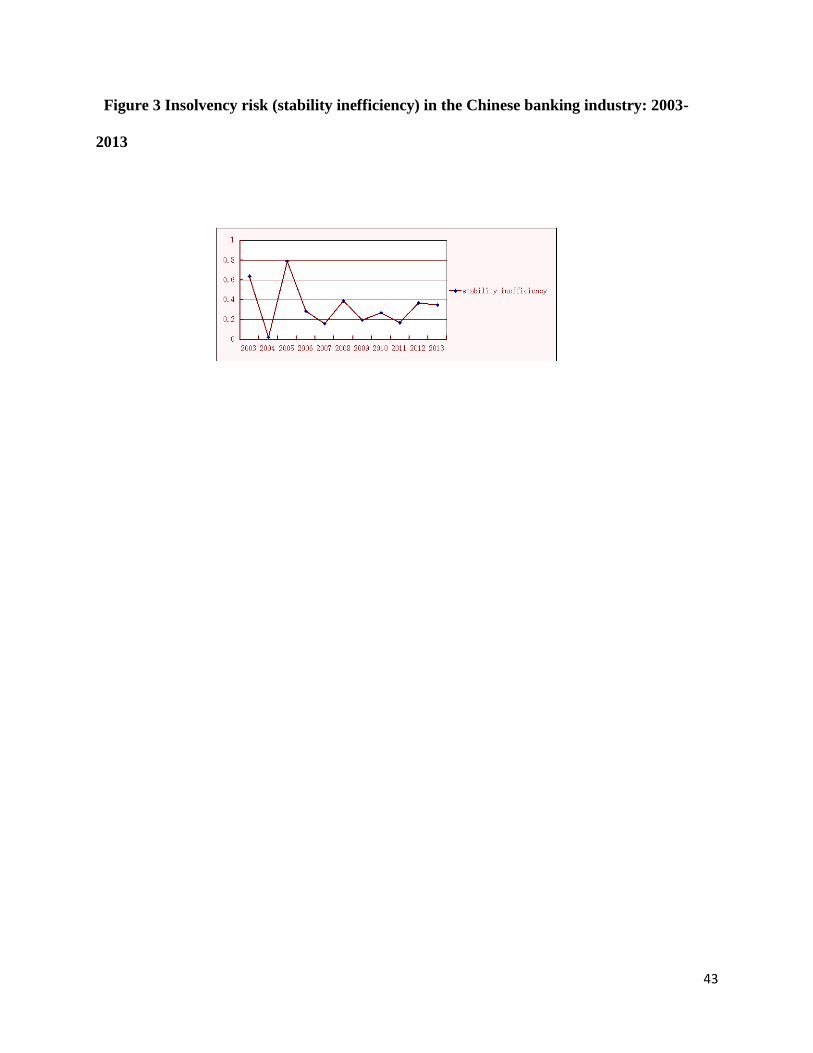
4.2. insolvency risk in the Chinese banking industry-stability inefficiency
We look at the insolvency risk of the Chinese banking industry on a year by year basis, which is
reflected by stability inefficiency (Figure 3). The figure shows that the risk conditions in the
Chinese banking sector over the period 2003-2006 were highly volatile; while during 2007-2013,
they reduced. The stronger volatility over the period 2003-2006 can be explained by the fact that
there was a large amount of non-performing loans in Chinese commercial banks, especially
SOCBs, and that the capital level of SOCBs was quite low. Furthermore, the Chinese government
initiated a number of measures to deal with it, such as capital injection and non-performing loan
write-off, while the financial crisis of 2007-2008 induced bank managers to be more careful in
conducting business. The 2008 Olympic Games held in Beijing further promoted the economic
growth of China. The resultant decline in the probability of default decreased the risk and increased
the capital level of Chinese commercial banks, which further improved stability in the Chinese
banking sector.
<<Figure 3---about here>>
4.3. Empirical results-Impact of competition on bank profitability
Table 7 shows the results with regard to the impact of competition in different banking markets on
bank profitability in China. The F statistic shows that the variables in the model are jointly
significant while the Sargan test statistic shows that there are no over-identified restrictions. The
results further indicate that the first-order autocorrelation is present for all the cases while the
second-order autocorrelation is rejected, which guarantees the consistency of the results. The
finding shows that the lag of the dependent variable (both ROA and NIM) are significant and
15
positive, which indicates that the dynamic specification of the model is correct, while the
significant and positive signs of the lagged dependent variables further suggest that the profitability
of Chinese commercial banks in the current year is significantly and positively affected by its
previous year's profitability. The values of both of these two coefficients are less than 0.4, which
means that the profitability of Chinese commercial banks does not persist to a large extent. This
result is in line with the findings of Tan (2016).
With regard to the bank-specific determinant of profitability, the results report that liquidity is
significantly and negatively related to ROA and NIM of Chinese commercial banks, indicating
that Chinese commercial banks with higher levels of liquidity have higher profitability. This is in
contrast with the findings of Molyneux and Thornton (1992). Our results can be explained by the
fact that higher liquidity reduces the borrowing cost for banks, which further proceeds an
improvement in bank profitability.
The table further suggests that Chinese commercial banks with lower levels of capital have higher
bank profitability in terms of ROA. This result is in accordance with Berger (1995b). Chinese
commercial banks have lower levels of capital to some extent can be explained by putting certain
amount of capital in engaging in traditional and non-traditional banking activities, a larger amount
of business leads to an improvement in bank profitability.
The results indicate that bank size is significantly and negatively related to Chinese bank
profitability, as reflected by the significant and negative signs of the variable. This result is in
accordance with the finding of Goddard to al. (2001). The negative impact of size on bank
profitability can be explained by the fact that large banks are difficult to be managed (Tan and

16
Floros, 2012a), which induces a larger amount of efforts and the resulted increase in the cost leads
to a decline in bank profitability.
Overhead cost is found to be significantly and positively related to bank profitability in China,
indicating that Chinese commercial banks with higher levels of overhead cost have higher
profitability. This result is different from the finding reported by Tan and Floros (2012b). however,
our results can be explained by the efficiency wage theory, which argues that higher cost derived
from higher wage/salary to bank staff is supposed to significantly increase the labor productivity,
the resulted improvement in revenue exceeds the labor cost. Therefore, higher overhead cost leads
to higher bank profitability.
Our results show that bank diversification is significantly related to bank profitability in China,
however, the sign of the variable is different between ROA and NIM. To be more specific, the
findings suggest that Chinese commercial banks with a higher degree of business diversification
have higher ROA but lower NIM. Due to the fact that ROA focuses on bank's ability to generate
income from total assets, which considers both the interest generating business as well as non-
interest income activities, on the other hand, NIM concentrates on interest-generating activities
only. Our results underline that Chinese commercial banks with more diversified business can
generate higher income while more resources/funds used in engaging in non-interest generating
business reduces the volumes of traditional loan business, which further proceeds a decrease in
NIM of Chinese commercial banks.
In terms of the industry-specific determinants of bank profitability, in particular, the impacts of
competition in different banking markets on bank profitability, the results show that higher levels
of competition in loan market lead to higher ROA of Chinese commercial banks. This is attributed
17
to the fact that a higher competitive loan market can be an indicator that there is a business boom
in the economy, and different companies seeking the loans have lower default risk while the
reduction in the cost of monitoring the loans leads to an increase in bank profitability. In
comparison, the findings suggest that a higher competitive deposit market leads to a decline in
bank profitability (ROA and NIM). This can be mainly explained by the fact that in a higher
competitive deposit market, banks will try to increase the deposit interest rate, the resulted increase
in the interest expenses leads to a decline in NIM. Furthermore, more effort and resources will be
given by the bank to attract more deposit in the market, the resulted increase in the cost leads to a
decline in ROA.
Banking sector development is found to be significantly and positively related to bank profitability
(ROA). This can be explained by the fact that in a higher developed banking market, there will be
a higher volume of demand for banking products (Tan and Floros, 2012a). This result indicates
that there will be a significant increase in the demand of non-interest generating business in a
higher developed banking market, which proceeds a significant increase in ROA but not NIM. The
stock market development is found to be significantly and negatively related to ROA and NIM of
Chinese commercial banks, indicating that Chinese commercial banks have lower profitability in
a higher developed stock market. In a higher developed banking market, rather than investing the
money in purchasing the non-interest generating products, the investors are more likely to invest
the money in the stock market, which leads to a decline in ROA. Furthermore, for different
companies, they will also go to the stock market rather than the banks to raise funds for their
operation under the environment of higher developed stock market, this will proceed a decline in
the volumes of loan granted by the banks and further result in a decrease in NIM of Chinese
commercial banks.
18
Finally, with regard to the macroeconomic determinants of bank profitability, the findings suggest
that Chinese commercial banks have higher profitability in terms of ROA and NIM in a higher
inflationary environment. The Higher inflationary environment is associated with higher loan
interest rate, which will increase the bank profitability (Tan and Floros, 2012a). In theory, this
result indicates that Chinese commercial banks have the ability to anticipate the interest rate and
adjust the interest rate accordingly (Perry, 1992). Finally, the results suggest that in a higher
economic growth period, Chinese commercial banks have higher NIM. This is in line with the
findings of Demirguc-Kunt and Huizinga (1999) and can be explained by the fact that the demand
for lending increases during cyclical upswings.
<<Table 7---about here>>
In order to check the robustness of the results, we estimate the impact of competition on bank
profitability by using just one specific competition indicator for a specific banking market in the
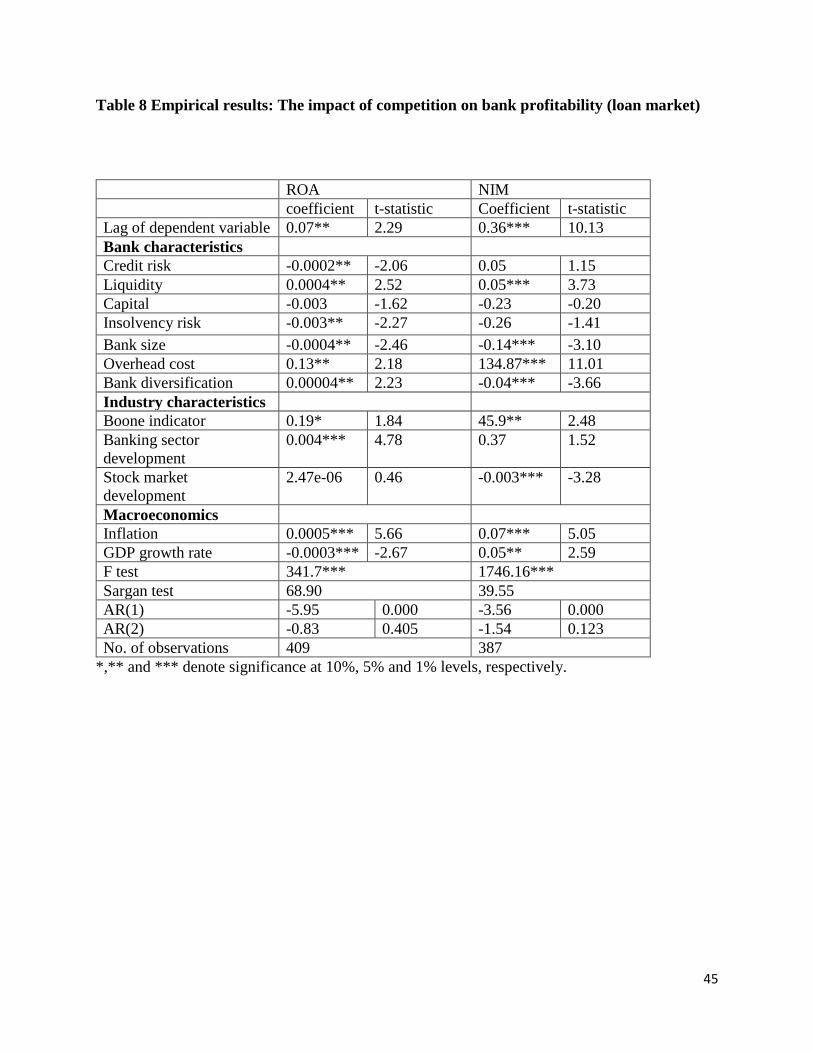
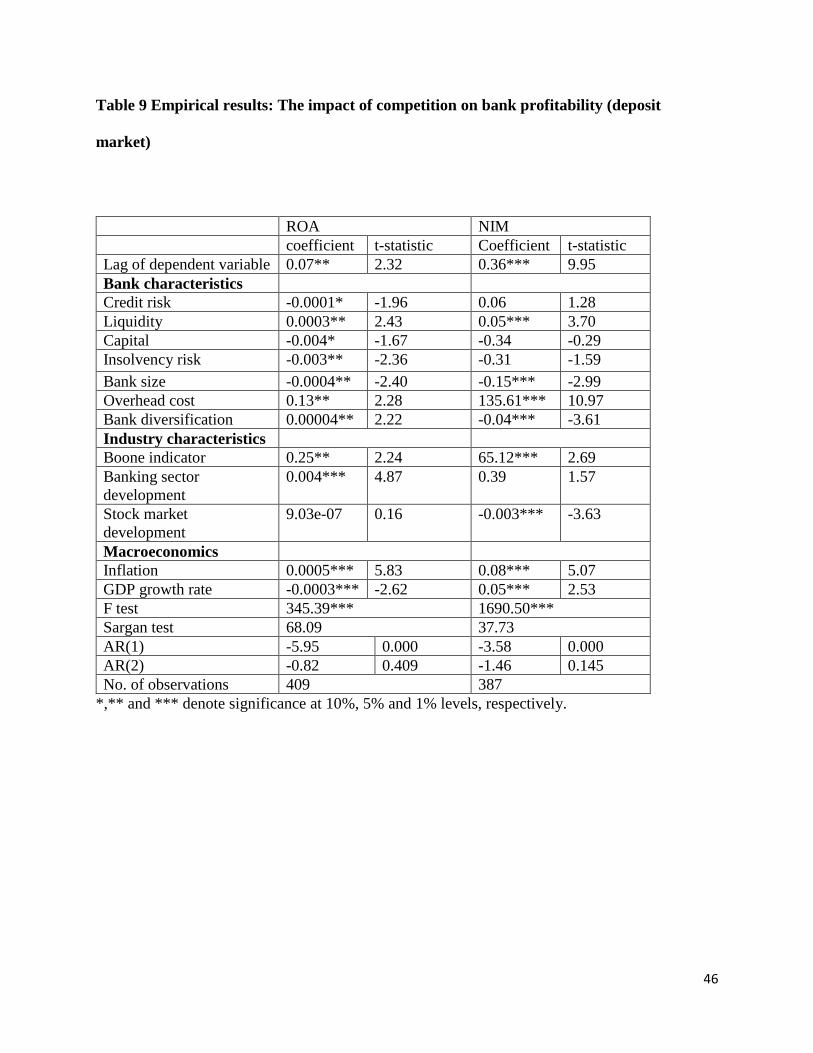
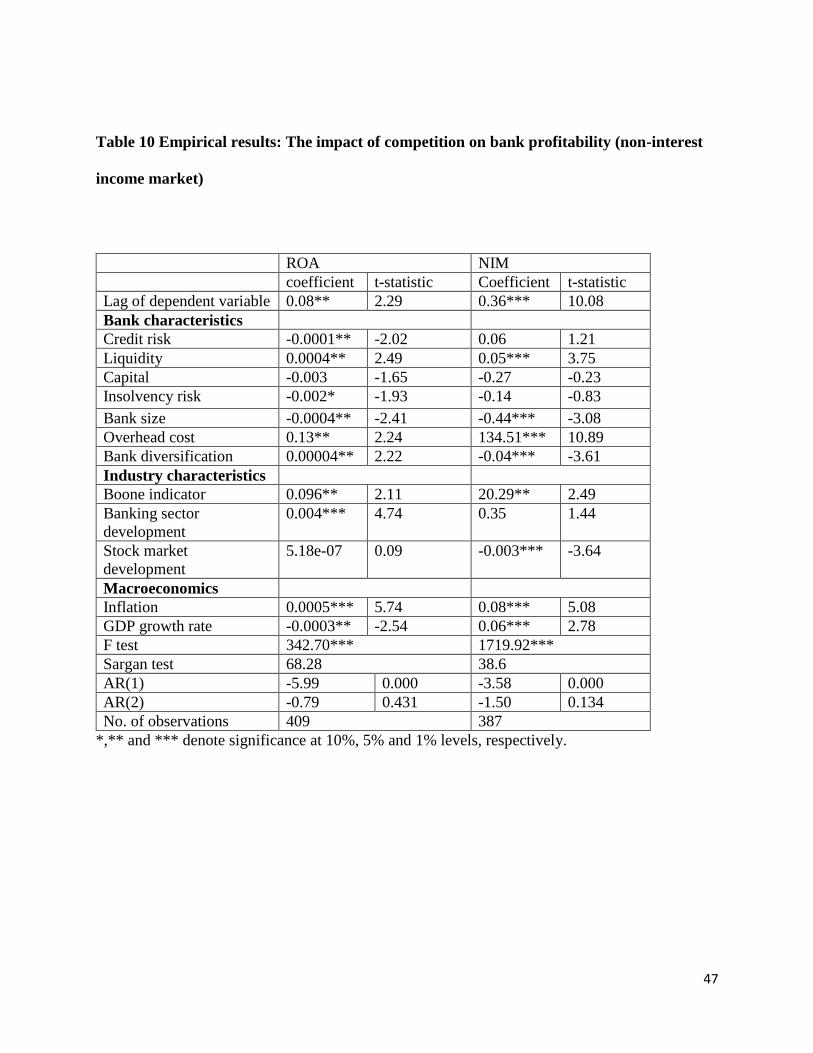
model. To be more specific, Table 8, Table 9 and Table 10 test the impact of competition in the
loan market, deposit market and non-interest market on bank profitability while controlling for
other bank profitability determinants. We confirm some of the findings reported from Table 7 as
follows: 1) bank profitability in terms of ROA and NIM is significantly and positively affected by
the past year’s profitability; 2) liquidity is significantly and positively related to the profitability
of Chinese commercial banks; 3) large Chinese commercial banks have lower levels of ROA and
NIM; 4) Chinese commercial banks with higher levels of business diversification have higher
levels of ROA but lower levels of NIM; 5) higher developed banking sector leads to higher levels
of ROA of Chinese commercial banks; 6) higher developed stock market leads to lower levels of
NIM; 7) Chinese commercial banks have higher levels of ROA and NIM during the periods of
19
higher inflation; 8) during the periods of economic boom, Chinese commercial banks have higher
levels of NIM; 9) Chinese commercial banks have higher levels of profitability in a lower
competitive deposit market.
<<Table 8—about here>>
<<Table 9---about here>>
<<Table 10---about here>>
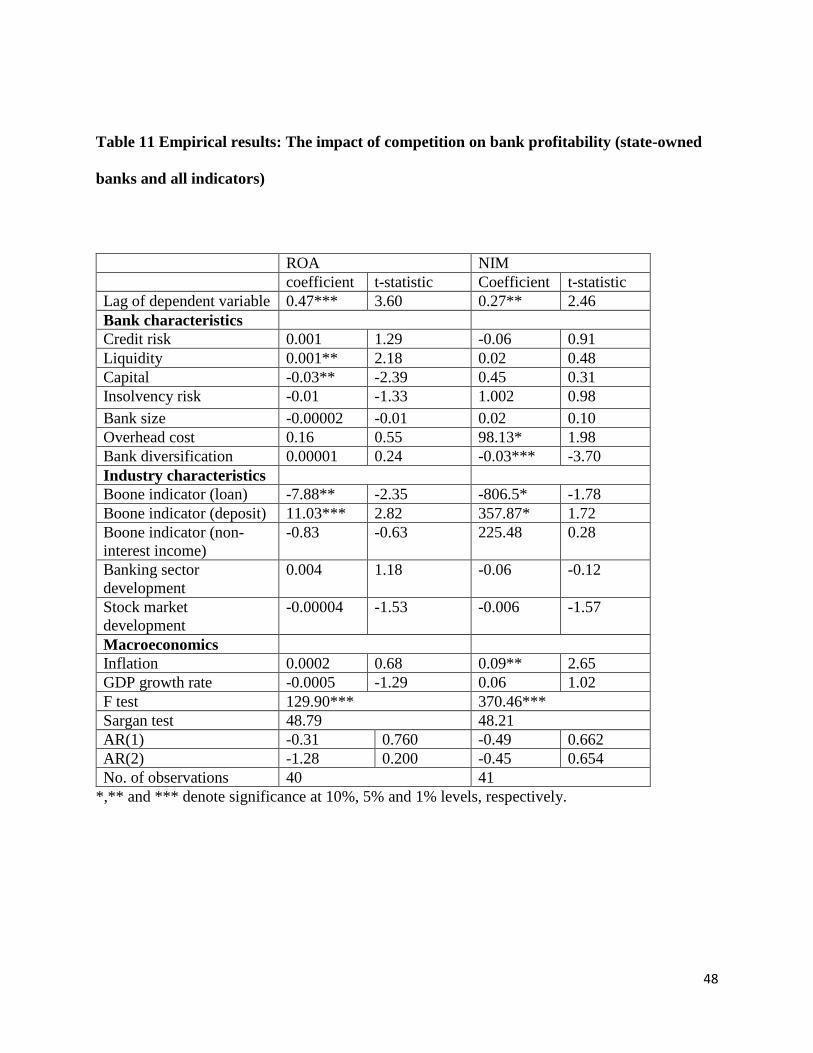
Not only for the whole sample but more importantly, we test the impacts of competition in different
banking markets on bank profitability for each different ownership types. To be more specific, we
test the impact of competition in the different markets on bank profitability for state-owned
commercial banks, joint-stock commercial banks as well as city commercial banks, the results of
which are reported in Table 11, Table 12, and Table 13, respectively. With regard to the state-
owned commercial banks, Table 11 shows that the profitability in the current year is significantly
affected by previous year's profitability and state-owned commercial banks with higher levels of
liquidity have higher levels of ROA. In addition, the results report that state-owned commercial
banks with higher levels of capital have lower levels of ROA. State-owned commercial banks with
higher levels of overhead cost are found to have higher levels of NIM. Finally, it is shown from
the table that state-owned commercial banks engaging in more diversified business have lower
NIM, while the coefficient of this variable is insignificant for ROA, indicating that for Chinese
state-owned commercial banks, the traditional interest generating activities contribute more to the
overall profitability compared to non-interest generating activities. It is further argued that in a
higher competitive loan market, state-owned commercial banks have higher ROA and NIM while

20
a higher competitive deposit market leads to lower profitability of Chinese state-owned
commercial banks. Finally, it is found that Chinese state-owned commercial banks have higher
profitability (NIM) in a higher inflationary environment.
In terms of the joint-stock commercial banks, which is reported from Table 12, the findings suggest
that the NIM in the current year is significantly affected by the previous year's NIM, while the
lagged ROA is not significant for joint-stock commercial banks. This finding to some extent
reflects the fact that joint-stock commercial banks' profitability from non-interest generating
business does not persistent, while in comparison, the profitability of traditional interest generating
business tends to persist for joint-stock commercial banks. This can be explained by the fact that
compared to state-owned commercial banks, joint-stock commercial banks have higher
competition in terms of different types of non-interest generating business. Liquidity is found to
be significantly and positively related to ROA of joint-stock commercial banks. The results report
that larger joint-stock commercial banks have higher levels of NIM, this is attributed to the fact
that large joint-stock commercial banks engage in larger volumes of loan business, the resulted
reduction in cost from economies of scale leads to higher NIM. Different from the state-owned
commercial banks, the findings show that joint-stock commercial banks with higher levels of
insolvency risk have higher NIM. This can be explained by the fact that during the time with lower
levels of capital and lower levels of liquidity, joint-stock commercial banks have more incentive
and take more effort to monitor the loan business, the reduction in the volume of non-performing
loans leads to an improvement in NIM. Same as the results reported for state-owned commercial
banks, joint-stock commercial banks with higher levels of overhead cost have higher NIM.
Compared to state-owned commercial banks, it is found that joint-stock commercial banks
engaging in more diversified business have higher profitability while the impact is negative for
21
NIM. These results reflect the fact that compared to state-owned commercial banks, non-interest
generating activities contribute more than the traditional interest generating business to the overall
bank profitability. It is found that a higher competitive loan market leads to higher ROA and NIM
of joint-stock commercial banks while joint-stock commercial banks have higher ROA in a lower
competitive deposit market. We find that in a lower competitive non-interest income market, joint-
stock commercial banks have higher levels of NIM. This can be explained by the fact that for joint-
stock commercial banks, a lower competitive non-interest income market induces bank managers
to put more effort in the loan business, and more importantly, more funds will be available and
transferred from the non-interest income generating business to loan business, higher volumes of
loan business engaged in by joint-stock commercial banks together with better risk monitoring and
management leads to an improvement in NIM. Higher developed banking sector leads to a decline
in NIM of joint-stock commercial banks. As argued previously, there will be a higher volume of
demand for banking business when there is a higher developed banking sector, these results
indicate that joint-stock commercial banks have less effort in monitoring the loan business, which
leads to a decline in NIM. The results further show that the stock market development has a
significant and negative impact on NIM of joint-stock commercial banks. Finally, it is found that
both inflation and GDP growth rate have significant and positive impacts on NIM for joint-stock
commercial banks.
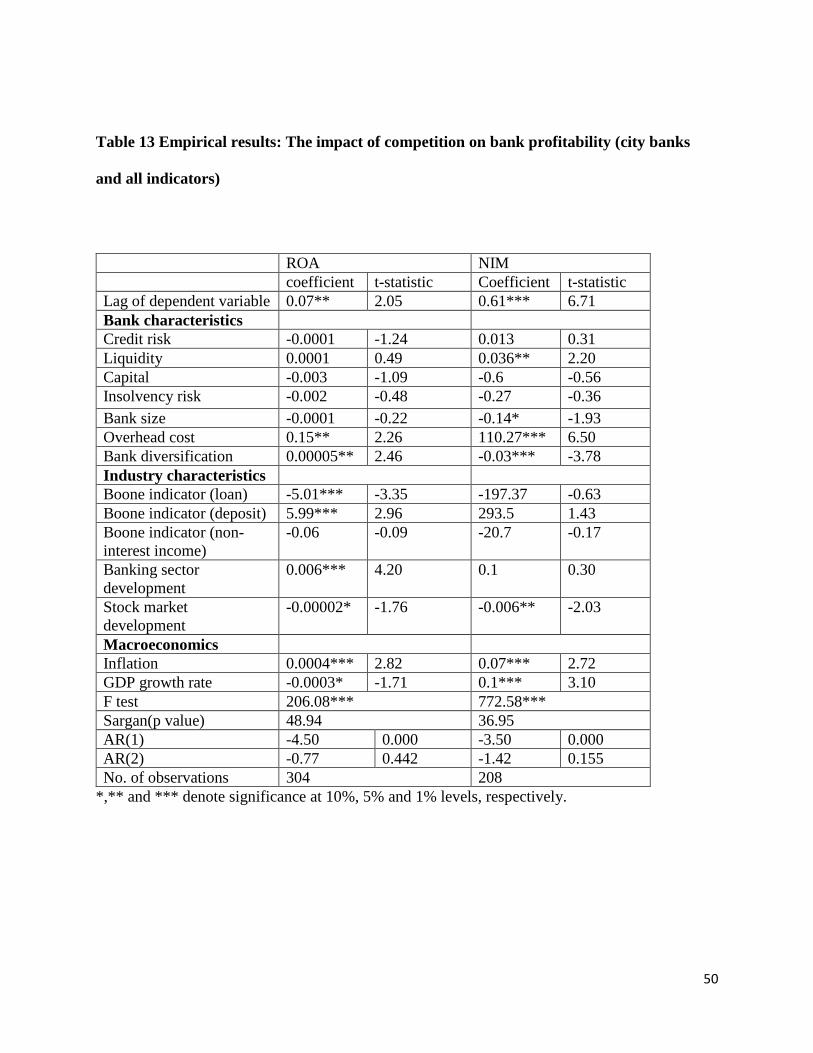
Table 13 reports the results with regard to the impact of competition in different banking market
on bank profitability for city commercial banks. The findings suggest that the profitability of city
commercial banks in the current year is significantly and positively affected by previous year's
profitability. The profitability of interest generating business (loan business) tends to be persisted
to a larger extent compared to the overall bank profitability as reflected by the coefficients, this
22
reflects the fact that there is stronger competition in the non-interest activities compared to loan
business for city commercial banks. Liquidity is found to be significantly and positively related to
NIM of city commercial banks. Bank size is found to be significantly and negatively related to
NIM of city commercial banks, this can be explained by the fact that larger city commercial banks
take more effort and resources to engage in non-interest generating activities, less amount of funds
available for the traditional loan business reduces the banks' NIM. Overhead cost is found to be
significantly and positively related to the profitability of city commercial banks, which is in line
with the efficiency wage theory. It is further reported from the table that city commercial banks
with more diversified business have higher ROA but lower NIM, this finding reflects the fact that
non-interest generating activities contribute more to the overall profitability of city commercial
banks.
With regard to the industry-specific and macroeconomic determinants of profitability, the results
show that a higher competitive loan market leads to higher ROA of city commercial banks, while
a higher competitive deposit market reduces the banks' ROA. The results further report that in a
higher developed banking sector, ROA of city commercial banks increases but with no significant
impact on NIM. We explain this finding by the fact that higher demand for banking services
derived from higher developed banking sector focuses on non-interest generating products.
Because individual investors as well as different companies are more likely to invest their funds
or raise money from stock market rather than the banking market, the reduction in the volumes of
traditional interest generating business as well as non-interest generating activities decreases the
bank profitability, as reflected by the significant and negative coefficient of stock market
development. Same as the findings reported previously, inflation is found to be significantly and
positively related to the profitability of city commercial banks. Finally, GDP is found to be
23
significantly and positively related to NIM of city commercial banks, but significantly and
negatively related to ROA. This finding can be explained by the fact that during the periods of
economic boom, city commercial banks mainly concentrate on traditional interest-generating
business, as discussed previously, non-interest generating activity contributes more to the overall
profitability of city commercial banks, and the reduction in the volumes of non-interest generating
business reduces the overall profitability of city commercial banks.
<<Table 11---about here>>
<<Table 12---about here>>
<<Table 13—about here>>
5. Conclusion
This study uses a sample of Chinese commercial banks (state-owned commercial banks, joint-
stock commercial banks, and city commercial banks) over the period 2003-2013 to test the impact
of competition in different banking markets on bank profitability. Three different banking markets
are analyzed which include the deposit market, loan market as well as the non-interest income
market. This paper contributes to the empirical banking literature, in particular, fills in the gap of
Tan (2017) by investigating the impacts of competition in different banking markets on
profitability of three different ownership types of Chinese commercial banks and also stability
inefficiency rather than the traditional Z-score is used to measure the insolvency risk in the Chinese
banking industry, which is supposed to provide more accurate results.

24
The findings suggest that for the whole bank sample being examined, the profitability of Chinese
commercial banks tend to persist, although the extent is not very large. In other words, the
profitability of Chinese commercial banks in the current year is significantly affected by the
previous year's profitability. The results further suggest that Chinese commercial banks with
higher levels of liquidity have higher levels of profitability. It is found that bank size has a
significant and negative impact on profitability of Chinese commercial banks, and Chinese
commercial banks with more diversified business have levels of ROA but lower levels of NIM.
Higher developed banking sector is found to increase the banks’ ROA while higher developed
stock market has a significant and negative impact on NIM of Chinese commercial banks. The
findings show that bank profitability in China is significantly and positively affected by inflation
and GDP growth rate. Finally, a higher competitive deposit market leads to lower profitability of
Chinese commercial banks.
With regard to the impact of competition on profitability for different ownership types of
commercial banks, the results suggest that a higher competitive loan market leads to higher
profitability of all these three types of banks while the impact of deposit market competition is
significant and negative. The difference or special characteristics with regard to the determinants
of profitability among these three different types of banks can be summarized as follows: 1) state-
owned commercial banks with higher levels of capital have lower levels of profitability; 2)
insolvency risk has a significant and positive impact on profitability for joint-stock commercial
banks; 3) banking sector development has no impact on state-owned commercial banks, while
different impacts have been exhibited for joint-stock commercial banks and city commercial banks;
4) stock market development has a significant impact on the profitability of joint-stock and city
25
commercial banks, while the impact is insignificant for state-owned commercial banks; 5) higher
levels of GDP growth rate lead to higher NIM but lower ROA of city commercial banks.
The results of the current paper provides important implications to Chinese government as well as
banking regulatory authorities to make relevant policies to reform the banking sector and further
improve the bank performance as follows: 1) Chinese commercial banks should be required to
hold higher levels of liquidity; 2) relevant policy should be established and implemented to attract
people with higher levels of professional knowledge and experience through higher salaries and
also the staff should be better and more motivated through bonus to improve their productivity; 3)
Chinese commercial banks should further explore the business areas in terms of non-interest
generating activities; 4) relevant monetary policy should be implemented to increase the
competition in the loan market while better regulation of deposit market is needed to reduce its
competition; 5) relevant policy should be introduced to balance the inflation and bank profitability.
More specifically, with regard to different ownerships of Chinese commercial banks, the following
policies can be made: 1) state-owned commercial banks can adjust the capital levels in a more
appropriate way, i.e. reduce the capital level to a certain extent; 2) liquidity and capital levels of
joint-stock commercial banks can be reduced to a certain extent to balance the increase in the level
of risk and the increase in the level of profitability.
The current paper suffers from a number of limitations: 1) although the current study uses a more
advance method (i.e Boone indicator) to examine the competitive conditions in different banking
markets in China and also use different bank samples as well as separate boone indicator in a
specific market to check the accuracy of the results, single competition measurement (i.e only use
Boone indicator) does not provide a very robustness analysis; 2) the current study use a sample of
26
Chinese commercial banks with three different ownership types (state-owned banks, joint-stock
banks and city banks) and does not consider other types of commercial banks in China, for example,
foreign banks and private banks, which are also very important component in the Chinese banking
industry. Therefore, in the future, the current study can be extended in the following ways: 1) an
alternative competition indicator (i.e. Hirfindahl-hirschman index) can be used to estimate the
competitive conditions in different banking markets in China and further test the impact of this on
bank profitability in China; 2) foreign banks as well as private banks can be included in the analysis
to see whether the impact of competition on profitability for these two types of banks is similar to
or different from the ones for state-owned, joint-stock and city banks.

27
References:
Ahamed, M. M. 2017. Asset quality, non-interest income, and bank profitability: Evidence from
Indian Banks. Economic Modelling, vol. 63, 1-14.
Athanasoglou, P.P., Brissimis, S.N. and Delis, M.D. 2008. Bank-Specific, Industry-Specific and
Macroeconomic Determinants of Bank Profitability. Journal of International Financial Markets,
Institutions and Money, vol. 18, no. 2, 121-136.
Arellano, M., and Bover, O. 1995. Another look at the instrumental variable estimation of error-
components models. Journal of Econometrics, vol. 68, no. 1, 29-51.
Berger, A.N. 1995a. The Profit-Structure Relationship in Banking-Test of Market-Power and
Efficient-Structure Hypotheses. Journal of Money, Credit and Banking, vol. 27, no. 2, 404-431.
Berger, A. N. 1995b. The relationship between capital and earnings in banking. Journal of
Money, Credit and Banking, vol. 27, no. 2, 432–456.
Bond, S. 2002. Dynamic panel data models: a guide to micro data methods and practice.
Portuguese Economic Journal, vol. 1, no. 2. 141-162.
Boone, J. 2008. A new way to measure competition. The Economic Journal, vol. 118, no. 531,
1245-1261.
Bourke, P. 1989. Concentration and other determinants of bank profitability in Europe, North
America and Australia. Journal of Banking and Finance, vol. 13, no. 1, 65-79.
28
Demirguc-Kunt, A. and Huizinga, H. 1999. Determinants of commercial bank interest margins
and profitability: some international evidence. World Bank Economic Review, vol. 13, no. 2, 379-
408.
Demsetz, H. 1973. Industry structure, market rivalry and public policy. Journal of Law and
Economics, vol. 16, no. 1, 1-19.
Dietrich, A. and Wanzenried, G. 2011.Determinants of bank profitability before and during the
crisis: evidence from Switzerland. Journal of International Financial Markets, Institutions and
Money, vol. 21, no. 3, 307-327.
Garcia, M.T.M. and Guerreiro, J.P.S.M. 2016. Internal and external determinants of banks’
profitability: The Portuguese case. Journal of Economic Studies, vol. 43, no. 1, 90-117.
Garcia-Herrero, A., Gavila, S. and Santabarbara, D. 2009. What explains the low profitability of
Chinese banks? Journal of Banking and Finance, vol. 33, no. 11, 2080-2092.
Goddard, J. A., Molyneux, P. M. and Wilson, J.O.S. 2001. European banking: efficiency,
technology and growth, Chichester, Wiley.
Goddard, J., Molyneux, P. and Wilson, J. O. S. 2004a. Dynamic of growth and profitability in
banking. Journal of Money, Credit and Banking, vol. 36, no. 6, 1069-1090.
Goddard, J., Molyneux, P. and Wilson, J. O. S. 2004b. The profitability of European banks: a
cross-sectional and dynamic panel analysis. The Manchester School, vol. 72, no. 3, 363-381.

29
Goddard, J., Molyneux, P., Liu, H. and Wilson, J.O.S. 2013. Do bank profits converge? European
Financial Management, vol. 19, no. 2, 345-365.
Goldberg, L. G. and Rai, A. 1996. The Structure-Performance Relationship for European Banking.
Journal of Banking and Finance, vol. 20, no. 4, 617-645.
Hasan, I. and Morton, K. 2003. Development and efficiency of the banking sector in a transitional
economy: Hungarian experience. Journal of Banking and Finance, vol. 27, no. 12, 2249-2271.
Hoffmann, P. S. 2011. Determinants of the profitability of the US Banking Industry. International
Journal of Business and Social Science, vol. 2, no. 22, 255-269.
Kutan, A. M., Ozsoz, E. and Rengifo, E. W. 2012. Cross-sectional determinants of bank
performance under deposit dollarization in Emerging markets. Emerging Markets Review, vol. 13,
no. 4, 478-492.
Lee, C. and Hsieh, M. 2013. The impact of bank capital on profitability and risk in Asian banking.
Journal of International Money and Finance, vol. 32, 251-281.
Maudos, J. and Fenandez de Guevara, J. 2004. Factors explaining the interest margin in the
banking sectors of the European Union. Journal of Banking and Finance, vol. 28, no. 9, 2259-
2281.
Mirzaei, A., Moore, T. and Liu, G. 2013. Does market structure matter on banks’ p0rofitability
and stability? Emerging vs. advanced economies. Journal of Banking and Finance, vol. 37, no. 8,
2920-2937.
30
Molyneux, P. and Thornton, J. 1992. Determinants of European bank profitability: A Note.
Journal of Banking and Finance, vol. 16, no. 6, 1173-1178.
Perry, P. 1992. Do banks gain or lose from inflation? Journal of Retail Banking, vol. 14, no. 2, 25-
30.
Rhoades, S. A. 1985. Market share as a source of market power: Implications and some
evidence. Journal of Economics and Business, vol. 37, no. 4, 343-363.
Shih, V., Zhang, Q. and Liu, M. 2007. Comparing the performance of Chinese banks: a principle
component approach. China Economic Review, vol. 18, no. 1, 15–34.
Smirlock, M. 1985. Evidence on the (non) relationship between concentration and profitability in
banking. Journal of Money, Credit, and Banking, vol. 17, no. 1, 69–83.
Staikouras, C. and Wood, G. 2004. The determinants of bank profitability in Europe.
International Business and Economic Research Journal, vol. 3, no. 6, 57-68.
Sufian, S. and Chong, R. R. 2008. Determinants of Bank Profitability in a Developing Economy:
empirical evidence from Philippines. Asian Academy of management Journal of Accounting and
Finance, vol. 4, no. 2, 91-112.
Sufian, F. 2009. Determinants of Bank profitability in a Developing Economy: Empirical
evidence from the China Banking Sector. Journal of Asia-Pacific Business, vol. 10, no. 4, 201-
307.
31
Sufian, F. and Habibullah, M. S. 2009. Bank specific and macroeconomic determinants of bank
profitability: Empirical evidence from the China Banking Sector. Frontier of Economics in
China, vol. 4, no. 2, 274-291.
Tabak, B. M., Fazio, D. M. and Cajueiro, D. O. 2012. The relationship between banking market
competition and risk-taking: Do bank size and capitalization matter? Journal of Banking and
Finance, vol. 36, no. 12, 3366-3381.
Tan, Y. and Floros, C. 2012a. Bank profitability and inflation: the case of China. Journal of
Economic Studies, vol. 39, no. 6, 675-696.
Tan, Y. and Floros, C. 2012b. Bank profitability and GPD growth in China: a note. Journal of
Chinese Economics and Business Studies, vol. 10, no. 3, 267-273.
Tan, Y. and Floros, C. 2012c. Stock market volatility and bank performance in China. Studies in
Economics and Finance, vol. 29, no. 3, 211-228.
Tan, Y. 2016. The impacts of risk and competition on bank profitability in China. Journal of
International Financial Markets, Institutions and Money, vol. 40, 85-110.
Tan, Y. and Floros, C. 2014. Risk, profitability and competition: evidence from the Chinese
banking. Journal of Developing Areas, vol. 48, no. 3, 303-319.
Tan, Y. 2017. The impacts of competition and shadow banking on profitability: Evidence from
the Chinese banking industry. The North American Journal of Economics and Finance, vol. 42,
89-106.
32
Tregenna, F. 2009. The fat years: the structure and profitability of the US banking sector in the
pre-crisis period. Cambridge Journal of Economics, vol. 33, no. 4, 609-632.
Trujillo-Ponce, A. 2012. What determines the profitability of banks? Evidence from Spain.
Accounting and Finance, vol. 53, no. 2, 561-586.
Yao, H., Haris, M., and Tariq, G. 2018. Profitability determinants of financial institutions:
Evidence from Banks in Pakistan. International Journal of Financial Studies, vol. 6, 53.

33
Table 1 Summary of the assets of SOCBs, JSCBs, CCBs and total banking institutions in China over the period 2003-2013
2003 2004 2005 2006 2007 2008 2009 2010 2011 2012 2013
SOCBs 160512
(58.03%)
179817
(56.9%)
210050
(56.1%)
242364
(55.2%)
285000
(53.7%)
325751
(51.59%)
407998
(51.31%)
468943
(49.2%)
536336
(47.34%)
600401
(52.84%)
656005
(43.34%)
JSCBs 29599
(10.7%)
36476
(11.5%)
44655
(11.92%)
54446
(12.4%)
72742
(13.69%)
88337
(13.99%)
118181
(14.86%)
149037
(15.64%)
183794
(16.22%)
235271
(20.71%)
269361
(17.8%)
CCBs 14622
(5.3%)
17056
(5.4%)
20367
(5.44%)
25938
(5.9%)
33405
(6.29%)
41320
(6.54%)
56800
(7.14%)
78526
(8.24%)
99845
(8.81%)
123469
(10.87%)
151778
(10.03%)
Banking
institutions
276584 315990 374697 439500 531160 631515 795146 953053 1132873 1136224 1513547

34
Table 2
References
Banking sector
investigated
Data period
Methodology
Empirical results
Smirlock (1985) US banking
industry
1973-1978 Ordinary least
square estimator
Size is significantly and negatively related to bank
profitability
Rhoades (1985) US banking
industry
1969-1978 Ordinary least
square estimator
There is a significant and negative impact of risk on bank
profitability
Molyneux and
Thornton (1992)
European
banking
industry
1986-1989 Ordinary least
square estimator
Liquidity is significantly and negative related to bank
profitability
Berger (1995a) US banking
industry
Ten years of 1980s Ordinary least
square estimator
Banks with larger market share and differentiate product
have higher profitability
Berger (1995b) US banking
industry
1983-1989 Grainger Causality
test
There is a significant and positive relationship between
capitalization and bank profitability
Goddard et al.
(2001)
European
banking
industry
1989-1996 Ordinary least
square estimator
Scale economies and productive efficiency are positively
related to profitability, while bank size has negative
impact on profitability.
Staikouras and
Wood (2004)
European
banking
industry
1994-1998 Fixed effect
estimator
There is a negative impact of risk on bank profitability
35
Goddard et al.
(2004a)
European
banking
industry
1992-1998 GMM There is a positive impact of diversification on bank
profitability
Goddard et al.
(2004b)
European
banking
industry
1992-1998 OLS and GMM Capital-asset ratio has a significant and positive impact
on bank profitability
Sufian and Chong
(2008)
Philippine
banking
industry
1990-2005 Fixed effect
estimator
Risk is significantly and negatively related to bank
profitability
Athanasoglou et
al. (2008)
Greek banking
industry
1985-2001 GMM There is no evidence in support of structure-conduct-
performance paradigm in Greek banking industry
Tregenna (2009) US banking
industry
1994-2005 OLS and GMM Bank concentration increases bank profitability
Dietrich and
Wanzenried
(2011)
Switzerland
banking
industry
1999-2009 GMM Banks with more diversified activities have higher
profitability
Hoffmann (2011) US banking
industry
1995-2007 GMM There is a significant impact of capital ratio on bank
profitability
Kutan et al.
(2012)
A sample of
banks from 36
dollarized
banking system
1991-2006 Fixed effect and
GMM
Credit risk has a significant and negative impact on bank
profitability
Goddard et al.
(2013)
European
banking
industry
1992-2007 GMM Profitability is higher for banks that are efficient and
diversified, while low for those that are higher capitalized
36
Mirzaei et al.
(2013)
A sample of
banks from
advanced and
emerging
economies
1999-2008 Fixed effect
estimation
Lower competitive condition leads to higher bank
profitability for advanced economies, however, this is not
the case for emerging economies.
Trujillo-Ponce
(2013)
Spain banking
industry
1999-2009 GMM Liquidity, capital and credit risk are significantly related
to bank profitability
Lee and Hsieh
(2014)
A sample of
commercial
banks from
Asian
Economies
1994-2008 GMM Capital has a significant impact on bank profitability.
Garcia and
Guerreiro (2016)
Portuguese
banking system
2002-2011 Fixed effect
estimator
Capital and credit risk has a significant and negative
impact on bank profitability
37
Table 3 Description of the variables and their impact on bank profitability
Variables Measurement Expected effect Source
Profitability
indicators
ROA Net income/total
assets Bankscope
NIM Net interest
income/earning
assets
Bankscope
Bank-specific
variables
Credit risk impaired
loans/gross loans - Bankscope
Liquidity liquid assets/total
assets ? Bankscope
Capital Total regulatory
capital ratio ? Bankscope
Insolvency risk stability
inefficiency - Bankscope
bank size natural logarithm of
total assets + Bankscope
Bank diversification Non-interest
income/gross
revenue
+ Bankscope
Overhead cost Overhead
expenses/total
assets
? Banksocpe
Industry-specific
variables
Bank competition Boone indicator +
Banking sector
development
Banking sector
assets/GDP + China Banking
Regulatory
Commission
Stock market
development
Market
capitalization of
listed
companies/GDP
+ World Bank
Macroeconomic
variables
Inflation Annual inflation
rate ? World Bank
GDP growth Annual GDP
growth rate - World Bank
38
Table 4 Descriptive statistics of all variables considered in this study
Variables Observations Mean S.D Min Max
Credit risk 632 2.78 4.48 0 41.86
Liquidity 777 0.27 0.11 0.02 0.67
Capital 637 11.91 4.7 0.62 62.62
Insolvency
risk
1100 0.33 0.21 0.025 0.789
Bank size 843 4.9 0.992 0.71 8.51
Bank
diversification
828 13.98 13.31 -12.94 79.4
Overhead cost 788 0.01 0.004 0.002 0.04
Banking
sector
development
1100 2.22 0.24 1.98 2.66
Stock market
development
1027 71.2 43.49 31.9 184.1
Inflation 1227 2.86 1.92 -0.77 5.86
GDP growth
rate
1199 10.19 1.87 7.7 14.2
39
Table 5 Summary statistics
Variables Observations Mean S.D Min Max
Total cost
(interest
expenses and
non-interest
expenses)
777 3.35 0.97 -0.79 6.86
Price of
funds (the
ratio of
interest
expenses to
total
deposits)
777 1.27 0.18 0.74 1.96
Price of
capital (the
ratio of non-
interest
expenses to
fixed assets)
776 1.92 0.26 0.68 2.83
Total loans 784 4.59 0.99 0.34 7.95
Securities 782 4.21 1.04 -0.41 7.87
Non-interest
income
767 2.34 1.1 -2.4 5.81
Total
deposits
784 4.85 0.98 0.66 8.26
40
Table 6a Descriptive statistics for profitability measures of Chinese banking industry
Observations Mean Standard
deviation
Minimum Maximum
ROA 808 0.0088 0.0066 -0.04 0.106
NIM 799 3.04 1.13 0.42 8.99
Table 6b Descriptive statistics for profitability measures of state-owned commercial banks
Observations Mean Standard
deviation
Minimum Maximum
ROA 55 0.009 0.004 0.0002 0.014
NIM 56 2.57 0.41 1.05 3.29
Table 6c Descriptive statistics for profitability measures of joint-stock commercial banks
Observations Mean Standard
deviation
Minimum Maximum
ROA 127 0.006 0.006 -0.04 0.0133
NIM 131 2.43 0.477 0.68 3.42
Table 6d Descriptive statistics for profitability measures of city commercial banks
Observations Mean Standard
deviation
Minimum Maximum
ROA 598 0.0093 0.007 -0.005 0.106
NIM 612 3.22 1.22 0.42 8.99
41
Figure 1 The profitability of three different ownership types of Chinese commercial banks
over the period 2003-2013
-0.005
0
0.005
0.01
0.015
2002 2004 2006 2008 2010 2012 2014
ROA
state-owned commercial banks
joint-stock commercial banks
city commercial banks
0
1
2
3
4
5
2002 2004 2006 2008 2010 2012 2014
NIM
state-owned commercial banks
joint-stock commercial banks
city commercial banks

42
Figure 2 Competitive condition in different banking markets in China over 2003-2013
-0.06
-0.04
-0.02
0
0.02
2003 2004 2005 2006 2007 2008 2009 2010 2011 2012 2013
competitive condition in different banking markets
Boone indicator (loan market )
Boone indicator (non-interest income)
Boone indicator (deposit market)
43
Figure 3 Insolvency risk (stability inefficiency) in the Chinese banking industry: 2003-
2013

44
Table 7 Empirical results: The impact of competition on bank profitability (whole sample)
ROA NIM
coefficient t-statistic Coefficient t-statistic
Lag of dependent variable 0.08** 2.53 0.36*** 9.34
Bank characteristics
Credit risk -0.0001 -1.40 0.09* 1.72
Liquidity 0.0003** 2.06 0.05*** 3.57
Capital -0.005** -2.24 -0.92 -0.68
Insolvency risk -0.001 -0.37 -0.05 -0.09
Bank size -0.0003** -2.10 -0.13*** -2.73
Overhead cost 0.18*** 3.05 136.76*** 10.28
Bank diversification 0.00003** 2.14 -0.04*** -3.35
Industry characteristics
Boone indicator (loan) -4.91*** -4.19 -365.23 -1.48
Boone indicator (deposit) 5.38*** 3.63 310.61** 2.60
Boone indicator (non-
interest income)
0.1 0.19 75.4 0.80
Banking sector
development
0.005*** 4.59 0.41 1.44
Stock market
development
-
0.00003**
*
-2.66 -0.006*** -2.68
Macroeconomics
Inflation 0.0004*** 3.29 0.1*** 4.47
GDP growth rate -0.0001 -0.88 0.06*** 2.64
F test 339.02*** 1275.24***
Sargan test 57.73 30.95
AR(1) -5.68 0.000 -3.63 0.000
AR(2) -1.01 0.312 -1.16 0.248
No. of observations 409 387
*,** and *** denote significance at 10%, 5% and 1% levels, respectively.
45
Table 8 Empirical results: The impact of competition on bank profitability (loan market)
ROA NIM
coefficient t-statistic Coefficient t-statistic
Lag of dependent variable 0.07** 2.29 0.36*** 10.13
Bank characteristics
Credit risk -0.0002** -2.06 0.05 1.15
Liquidity 0.0004** 2.52 0.05*** 3.73
Capital -0.003 -1.62 -0.23 -0.20
Insolvency risk -0.003** -2.27 -0.26 -1.41
Bank size -0.0004** -2.46 -0.14*** -3.10
Overhead cost 0.13** 2.18 134.87*** 11.01
Bank diversification 0.00004** 2.23 -0.04*** -3.66
Industry characteristics
Boone indicator 0.19* 1.84 45.9** 2.48
Banking sector
development
0.004*** 4.78 0.37 1.52
Stock market
development
2.47e-06 0.46 -0.003*** -3.28
Macroeconomics
Inflation 0.0005*** 5.66 0.07*** 5.05
GDP growth rate -0.0003*** -2.67 0.05** 2.59
F test 341.7*** 1746.16***
Sargan test 68.90 39.55
AR(1) -5.95 0.000 -3.56 0.000
AR(2) -0.83 0.405 -1.54 0.123
No. of observations 409 387
*,** and *** denote significance at 10%, 5% and 1% levels, respectively.
46
Table 9 Empirical results: The impact of competition on bank profitability (deposit
market)
ROA NIM
coefficient t-statistic Coefficient t-statistic
Lag of dependent variable 0.07** 2.32 0.36*** 9.95
Bank characteristics
Credit risk -0.0001* -1.96 0.06 1.28
Liquidity 0.0003** 2.43 0.05*** 3.70
Capital -0.004* -1.67 -0.34 -0.29
Insolvency risk -0.003** -2.36 -0.31 -1.59
Bank size -0.0004** -2.40 -0.15*** -2.99
Overhead cost 0.13** 2.28 135.61*** 10.97
Bank diversification 0.00004** 2.22 -0.04*** -3.61
Industry characteristics
Boone indicator 0.25** 2.24 65.12*** 2.69
Banking sector
development
0.004*** 4.87 0.39 1.57
Stock market
development
9.03e-07 0.16 -0.003*** -3.63
Macroeconomics
Inflation 0.0005*** 5.83 0.08*** 5.07
GDP growth rate -0.0003*** -2.62 0.05*** 2.53
F test 345.39*** 1690.50***
Sargan test 68.09 37.73
AR(1) -5.95 0.000 -3.58 0.000
AR(2) -0.82 0.409 -1.46 0.145
No. of observations 409 387
*,** and *** denote significance at 10%, 5% and 1% levels, respectively.
47
Table 10 Empirical results: The impact of competition on bank profitability (non-interest
income market)
ROA NIM
coefficient t-statistic Coefficient t-statistic
Lag of dependent variable 0.08** 2.29 0.36*** 10.08
Bank characteristics
Credit risk -0.0001** -2.02 0.06 1.21
Liquidity 0.0004** 2.49 0.05*** 3.75
Capital -0.003 -1.65 -0.27 -0.23
Insolvency risk -0.002* -1.93 -0.14 -0.83
Bank size -0.0004** -2.41 -0.44*** -3.08
Overhead cost 0.13** 2.24 134.51*** 10.89
Bank diversification 0.00004** 2.22 -0.04*** -3.61
Industry characteristics
Boone indicator 0.096** 2.11 20.29** 2.49
Banking sector
development
0.004*** 4.74 0.35 1.44
Stock market
development
5.18e-07 0.09 -0.003*** -3.64
Macroeconomics
Inflation 0.0005*** 5.74 0.08*** 5.08
GDP growth rate -0.0003** -2.54 0.06*** 2.78
F test 342.70*** 1719.92***
Sargan test 68.28 38.6
AR(1) -5.99 0.000 -3.58 0.000
AR(2) -0.79 0.431 -1.50 0.134
No. of observations 409 387
*,** and *** denote significance at 10%, 5% and 1% levels, respectively.
48
Table 11 Empirical results: The impact of competition on bank profitability (state-owned
banks and all indicators)
ROA NIM
coefficient t-statistic Coefficient t-statistic
Lag of dependent variable 0.47*** 3.60 0.27** 2.46
Bank characteristics
Credit risk 0.001 1.29 -0.06 0.91
Liquidity 0.001** 2.18 0.02 0.48
Capital -0.03** -2.39 0.45 0.31
Insolvency risk -0.01 -1.33 1.002 0.98
Bank size -0.00002 -0.01 0.02 0.10
Overhead cost 0.16 0.55 98.13* 1.98
Bank diversification 0.00001 0.24 -0.03*** -3.70
Industry characteristics
Boone indicator (loan) -7.88** -2.35 -806.5* -1.78
Boone indicator (deposit) 11.03*** 2.82 357.87* 1.72
Boone indicator (non-
interest income)
-0.83 -0.63 225.48 0.28
Banking sector
development
0.004 1.18 -0.06 -0.12
Stock market
development
-0.00004 -1.53 -0.006 -1.57
Macroeconomics
Inflation 0.0002 0.68 0.09** 2.65
GDP growth rate -0.0005 -1.29 0.06 1.02
F test 129.90*** 370.46***
Sargan test 48.79 48.21
AR(1) -0.31 0.760 -0.49 0.662
AR(2) -1.28 0.200 -0.45 0.654
No. of observations 40 41
*,** and *** denote significance at 10%, 5% and 1% levels, respectively.
49
Table 12 Empirical results: The impact of competition on bank profitability (joint-stock
banks and all indicators)
ROA NIM
coefficient t-statistic Coefficient t-statistic
Lag of dependent variable 0.16 1.12 0.29*** 3.59
Bank characteristics
Credit risk 0.0002 0.69 0.013 0.71
Liquidity 0.0004** 2.40 0.03 1.62
Capital 0.0004 0.08 0.14 0.25
Insolvency risk -0.00005 -0.01 1.28* 1.95
Bank size 0.01 1.36 0.22** 2.86
Overhead cost 0.16 0.91 107.13*** 5.54
Bank diversification 0.0001* 1.87 -0.01** -2.04
Industry characteristics
Boone indicator (loan) -4.75* -1.71 -752.22** -2.66
Boone indicator (deposit) 4.43* 1.70 114.66 1.26
Boone indicator (non-
interest income)
0.43 0.36 292.5** 2.67
Banking sector
development
-0.002 -0.91 -0.66*** -3.10
Stock market
development
-0.00004 -1.57 -0.009*** -3.50
Macroeconomics
Inflation 0.0001 0.72 0.11*** 6.39
GDP growth rate 0.00004 0.15 0.09*** 3.42
F test 84.44*** 776.77***
Sargan (p value) 42.84 94.98
AR(1) -2.47 0.013 -2.14 0.032
AR(2) -0.98 0.329 0.57 0.570
No. of observations 65 66
*,** and *** denote significance at 10%, 5% and 1% levels, respectively.
50
Table 13 Empirical results: The impact of competition on bank profitability (city banks
and all indicators)
ROA NIM
coefficient t-statistic Coefficient t-statistic
Lag of dependent variable 0.07** 2.05 0.61*** 6.71
Bank characteristics
Credit risk -0.0001 -1.24 0.013 0.31
Liquidity 0.0001 0.49 0.036** 2.20
Capital -0.003 -1.09 -0.6 -0.56
Insolvency risk -0.002 -0.48 -0.27 -0.36
Bank size -0.0001 -0.22 -0.14* -1.93
Overhead cost 0.15** 2.26 110.27*** 6.50
Bank diversification 0.00005** 2.46 -0.03*** -3.78
Industry characteristics
Boone indicator (loan) -5.01*** -3.35 -197.37 -0.63
Boone indicator (deposit) 5.99*** 2.96 293.5 1.43
Boone indicator (non-
interest income)
-0.06 -0.09 -20.7 -0.17
Banking sector
development
0.006*** 4.20 0.1 0.30
Stock market
development
-0.00002* -1.76 -0.006** -2.03
Macroeconomics
Inflation 0.0004*** 2.82 0.07*** 2.72
GDP growth rate -0.0003* -1.71 0.1*** 3.10
F test 206.08*** 772.58***
Sargan(p value) 48.94 36.95
AR(1) -4.50 0.000 -3.50 0.000
AR(2) -0.77 0.442 -1.42 0.155
No. of observations 304 208
*,** and *** denote significance at 10%, 5% and 1% levels, respectively.