Embed Size (px)
Citation preview

Competition in Aviationand the role of Airports
Peter van Laarhoven
DGAC-CSAC ConferenceParis, 4 May 2015
1

2
Outline
1. Schiphol Group Introduction
2. Competition – facts and figures
3. Relevance of competition
4. Airport response
3
Our mission:
To connect the Netherlands with all
important economic, political and cultural
cities and centres of the world
Connecting to compete & Connecting to complete
Our mission:
To connect the Netherlands with all
important economic, political and cultural
cities and centres of the world
Connecting to compete & Connecting to complete

4
319 destinations directly connected
> 55 million passengers, 1,6 million tonnes freight
> 415.000 air traffic movements
170.000 jobs in the region, 60.000 jobs at location Schiphol
650.000 m2 terminal area, 6 runways at 2.787 hectares
5,8 billion Euro value of fixed assets (1,6 billion of real estate)
>500 companies based at Schiphol
26 billion Euro contribution aviation sector to Dutch GDP
����
€€€
Amsterdam Airport Schiphol – facts and figures

5
Outline
1. Schiphol Group Introduction
2. Competition – facts and figures
3. Relevance of competition
4. Airport response

6 6
Exponential growth of Middle-East HubsTransfer passengers (in millions, single counting)
1 Atlanta 27,1 1 Atlanta 24,2 1 Atlanta 26,9
2 Chicago 17,8 2 Chicago 16,5 2 Dubai 16,3
3 Dallas 15,3 3 Dallas 16,3 3 Dallas 15,6
4 Frankfurt 12,8 4 Frankfurt 14,2 4 Charlotte 14,4
5 Houston 10,1 5 Denver 11,7 5 Frankfurt 14,0
6 London Heathrow 9,1 6 Houston 11,5 6 Chicago 12,8
7 Detroit 9,0 7 Charlotte 11,1 7 Istanbul 10,0
8 Paris CDG 8,9 8 Paris CDG 10,8 8 Amsterdam 9,7
9 Minneapolis 8,9 9 London Heathrow 10,3 9 London Heathrow 9,5
10 Charlotte 8,5 10 Amsterdam 10,3 10 Denver 9,1
11 Phoenix 8,4 11 Madrid 9,0 11 Paris CDG 9,1
12 Cinicinnati 8,3 12 Phoenix 8,0 12 Houston 8,5
13 Denver 8,2 13 Hong Kong 7,8 13 Hong Kong 8,4
14 Amsterdam 8,1 14 Dubai 7,6 14 Doha 7,6
15 Los Angeles 7,9 15 Los Angeles 7,5 15 Phoenix 7,6
... ...
32 Dubai 3,7 30 Istanbul 4,6
55 Istanbul 1,8 39 Doha 3,6
77 Doha 1,0
2003 2008 2013
7
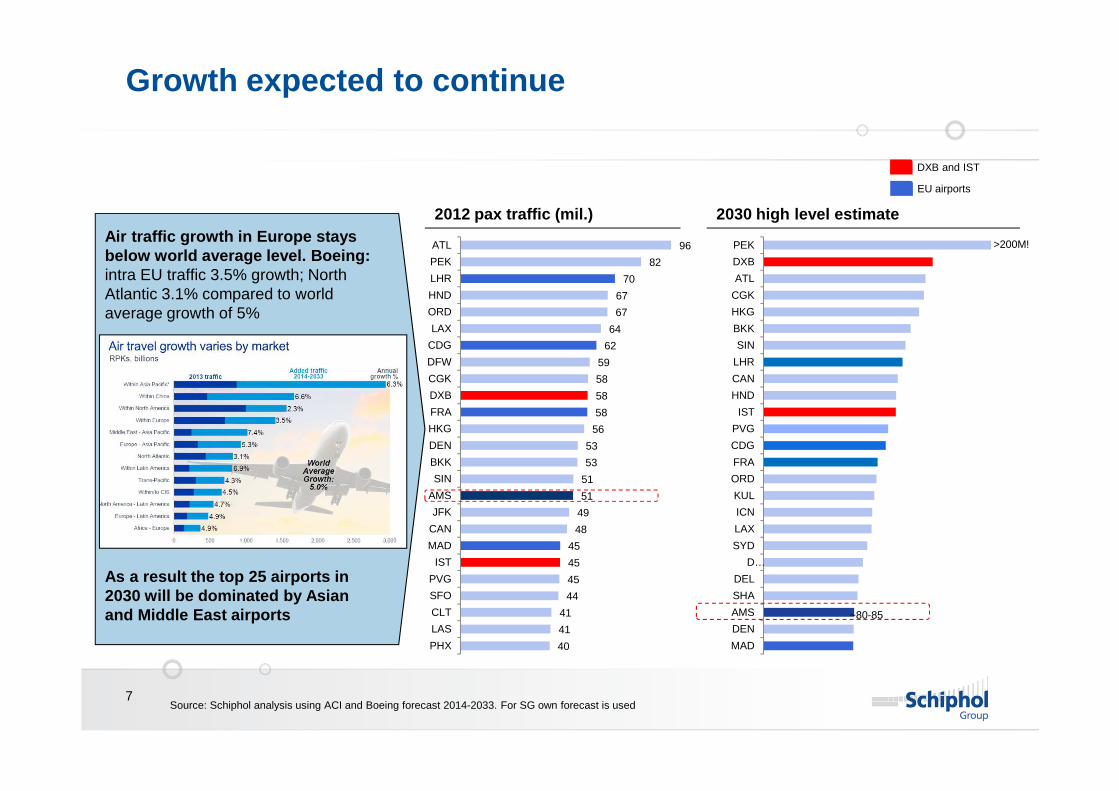
Growth expected to continue
40
41
41
44
45
45
45
48
49
51
51
53
53
56
58
58
58
59
62
64
67
67
70
82
96
PHX
LAS
CLT
SFO
PVG
IST
MAD
CAN
JFK
AMS
SIN
BKK
DEN
HKG
FRA
DXB
CGK
DFW
CDG
LAX
ORD
HND
LHR
PEK
ATL
2012 pax traffic (mil.) 2030 high level estimate
Source: Schiphol analysis using ACI and Boeing forecast 2014-2033. For SG own forecast is used
MAD
DEN
AMS
SHA
DEL
D…
SYD
LAX
ICN
KUL
ORD
FRA
CDG
PVG
IST
HND
CAN
LHR
SIN
BKK
HKG
CGK
ATL
DXB
PEK
~80-85
>200M!Air traffic growth in Europe stays below world average level. Boeing : intra EU traffic 3.5% growth; North Atlantic 3.1% compared to world average growth of 5%
As a result the top 25 airports in 2030 will be dominated by Asian and Middle East airports
EU airports
DXB and IST

8
Gulf carriers adding more destinations in Europe leading to bypassing of the mains hubs
# destinations served in Europe
8
16
18
14
20
24
19
29
38
Etihad
Qatar
Emirates
2014
2010
2006
Source: Schiphol analysis using Innovata
Share of top 5 EU hubs of total ICA
capacity ex Europe declined from 60%in 2006 to 54% in
2014
9
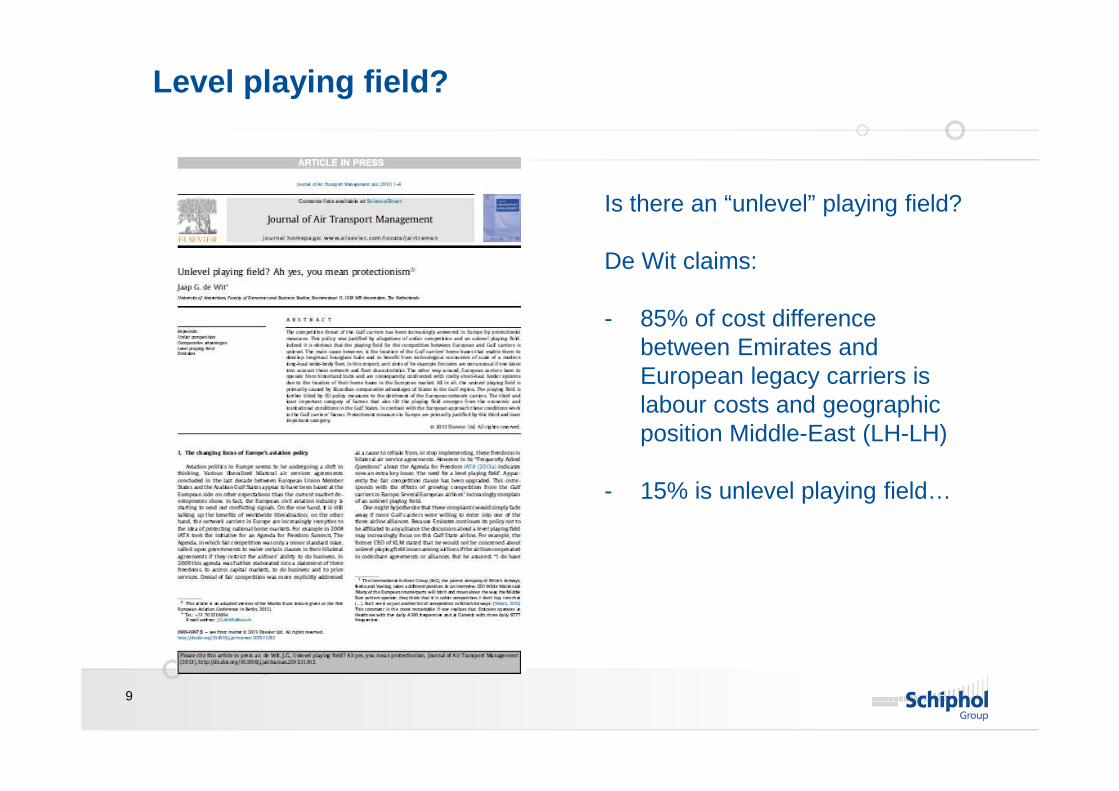
Level playing field?
Is there an “unlevel” playing field?
De Wit claims:
- 85% of cost differencebetween Emirates andEuropean legacy carriers is labour costs and geographicposition Middle-East (LH-LH)
- 15% is unlevel playing field…

10
For internal use only
Unit costs major airlines
Source: CAPA analysis of company accounts and traffic data

11
For internal use only
Recent white paper AA, Delta, United

12
For internal use only
Outline
1. Schiphol Group Introduction
2. Competition – facts and figures
3. Relevance of competition
4. Airport response
13
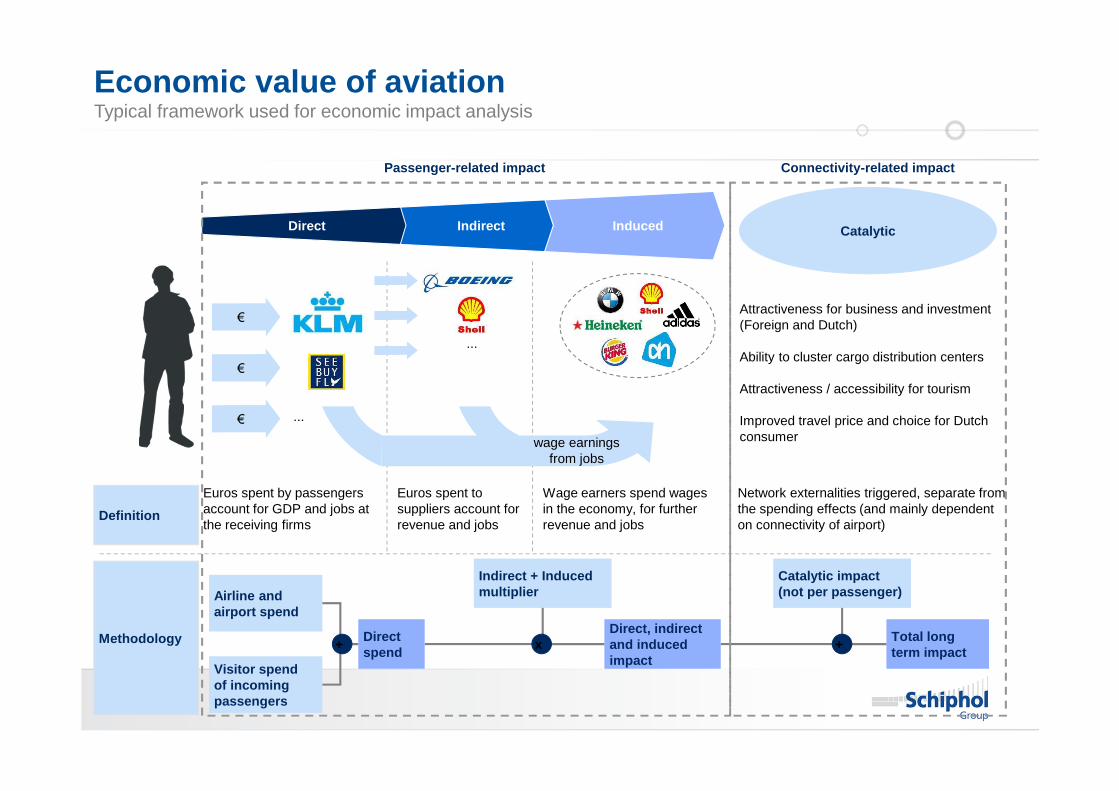
Economic value of aviation
Direct Indirect Induced
Euros spent by passengers account for GDP and jobs at the receiving firms
Euros spent to suppliers account for revenue and jobs
Wage earners spend wages in the economy, for further revenue and jobs
Network externalities triggered, separate from the spending effects (and mainly dependent on connectivity of airport)
Attractiveness for business and investment (Foreign and Dutch)
Ability to cluster cargo distribution centers
Attractiveness / accessibility for tourism
Improved travel price and choice for Dutch consumer
...
wage earningsfrom jobs
...
Definition
Methodology
Airline and airport spend
Visitor spend of incoming passengers
Indirect + Induced multiplier
Catalytic impact (not per passenger)
Direct spend
+Direct, indirect and induced impact
xTotal long term impact
+
Catalytic
Passenger-related impact Connectivity-related impact
Typical framework used for economic impact analysis
14
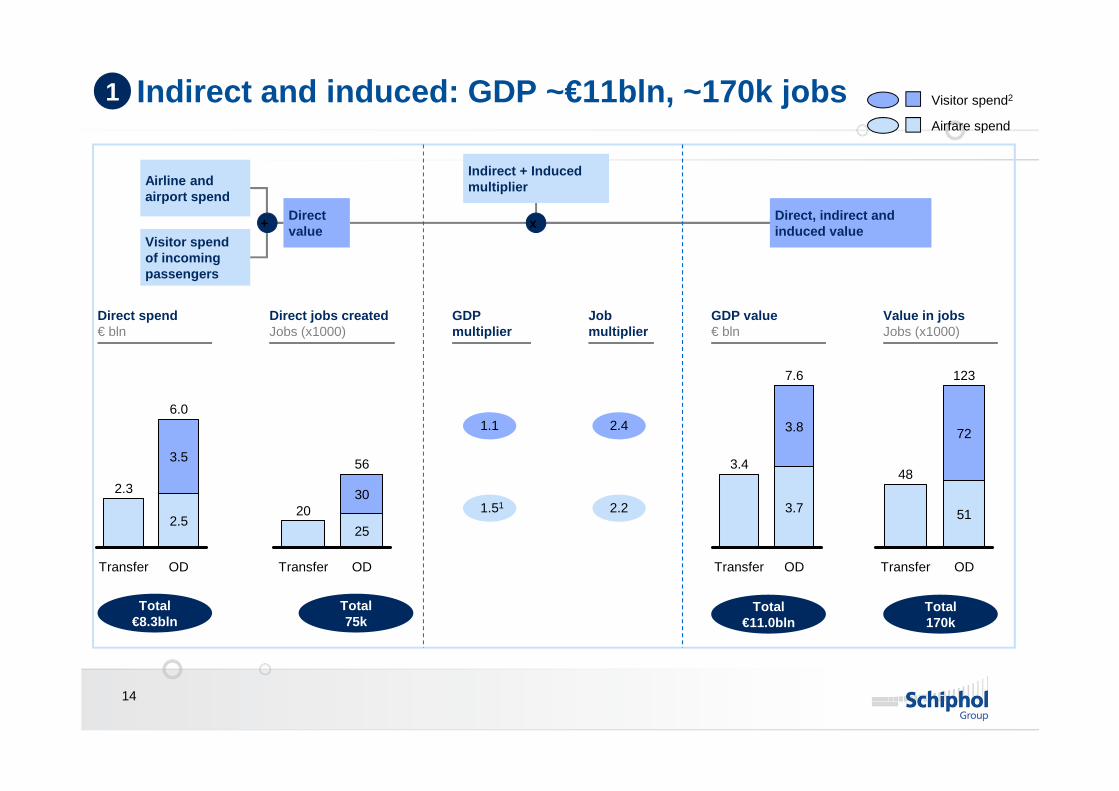
Indirect and induced: GDP ~€11bln, ~170k jobs
OD
7.6
3.7
3.8
Transfer
3.4
51
OD
48
Transfer
72
123
Total €11.0bln
Total 170k
OD
6.0
2.5
3.5
Transfer
2.3
25
OD
20
Transfer
30
56
Visitor spend2
Airfare spend
Airline and airport spend
Visitor spend of incoming passengers
Indirect + Induced multiplier
Direct value
+Direct, indirect and induced value
x
Total €8.3bln
Total 75k
1.1
1.51
2.4
2.2
1
Direct spend€ bln
Direct jobs createdJobs (x1000)
GDP multiplier
Job multiplier
GDP value€ bln
Value in jobsJobs (x1000)

15
Total estimated value of all passengers(including catalytic effects)
Catalytic: GDP ~€26bln, ~287k jobs
15
11
7
4Visitorspend
Catalytic
26
Airfare7
4
287
73
117
170
9797
73
% of NL pop.
1.0% 1.7%
% of NL GDP
1.4% 3.3%
GDP (€ bln)Jobs (1000s)
External reports catalytic impacts
Direct +Indirect +Induced
Catalytic
1.0
2.0
BCC 2009UK
GDP
OEF 2005EU
GDP
ATAG 2006EU
GDP
1.0
Ø 2.1
1.0
2.8
ATAG 2008WW GDP
1.0
1.7 1.9
2.1x1.2x
Total value as multiple of direct,indirect and induced impacts1
5
4
3
2
1
0ATAG 2008WW jobs
1.0
1.2
Jobs GDP
2
16
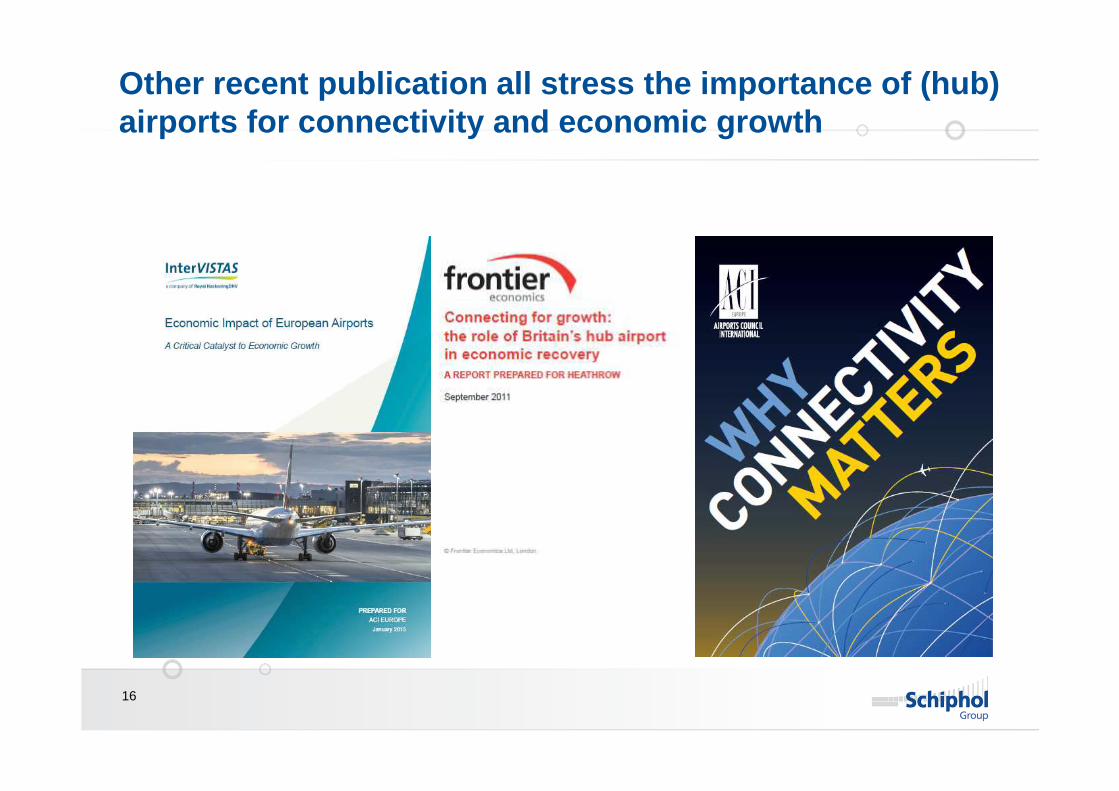
Other recent publication all stress the importance of ( hub) airports for connectivity and economic growth
17
Outline
1. Schiphol Group Introduction
2. Competition – facts and figures
3. Relevance of competition
4. Airport/sector response

18
Increase competitive position of aviation
AVIATION
POLICY
• Selectivity: create capacity for mainport related traffic
• Licence to operate and licence to grow
• Sufficient air and ground capacity
• Ground connectivity
• Single European Sky (SES)
LEVEL PLAYING
FIELD
• Pax rights EU vs. non-EU carriers
• Stringent EU policy towards state subsidized carriers
SECTOR
COOPERATION• “Mainport” philosophy
AIRPORT• Focus on cost, Europe’s lowest cost hub
• Invest in quality and capacity

19
Competitive hub airport Visit costs, reliable & fast handling and accessibility
Competitive regionto live and work
Accessibility and strengthening of Amsterdam region
Internationally competing business climateDevelopment of infrastructure
and area development
Strong hub network
KLM / SkyTeam
KLM/SG shared vision: ‘Essential elements Mainport Schiphol’
20
See you at Amsterdam Airport Schiphol
20