Embed Size (px)
Citation preview

Competition in Telecom Competition in Telecom Market for Voice TelephonyMarket for Voice Telephony
Note: The views expressed in this presentation are those of the author and do not necessarily reflect the opinions of the ITU or its membership.
Saburo TANAKACouncellor,
Seminar on Economic and Market Analysis for CEEC and Baltic States
Prague, 9 – 11 September 2003

2Competition in Voice TelephonyCompetition in Voice Telephony
AgendaAgenda
l Status of competitionð Competition in Voice Telephonyð How traffic flow in the competitive market
l Role of Regulatorsl Importance of Interconnectionð Regulatory and technical issuesð Economic issues
l Importance of tariff rebalancing
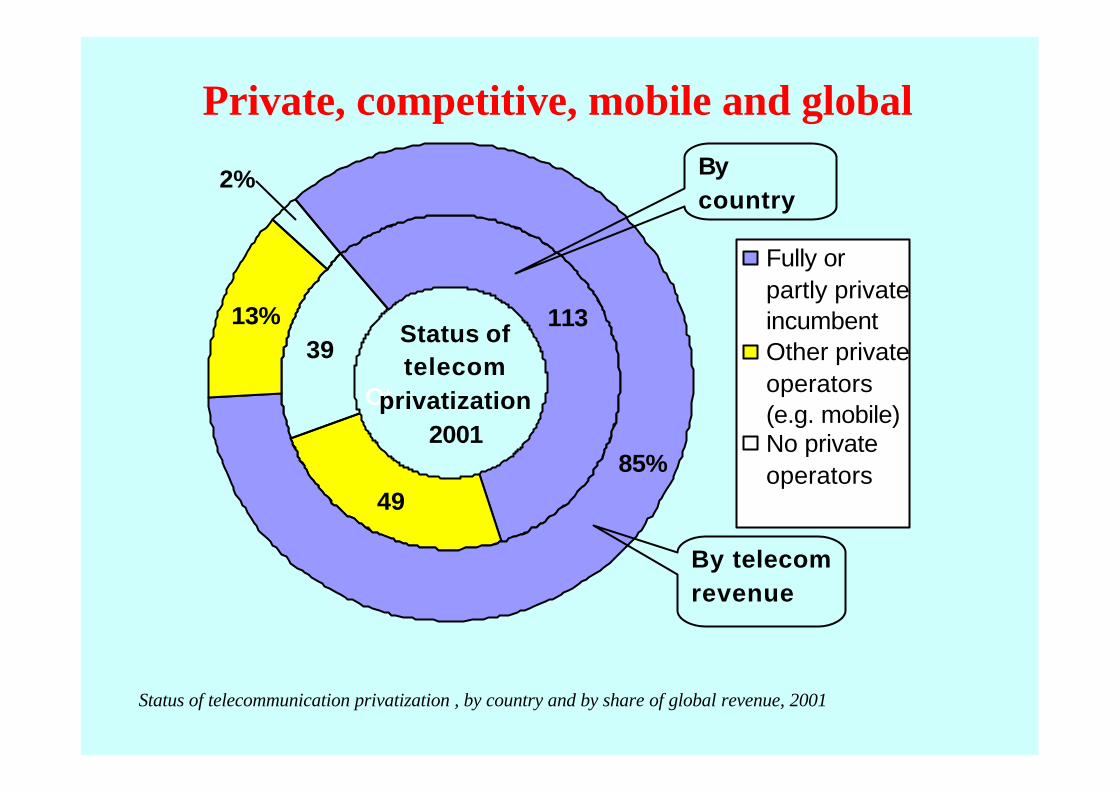
85%
13% 113
49
39
2%
Fully orpartly privateincumbentOther privateoperators(e.g. mobile)No privateoperators
Oth
By telecom revenue
By country
Status oftelecom
privatization2001
Private, competitive, mobile and global
Status of telecommunication privatization , by country and by share of global revenue, 2001

Percentage of countries with competition Percentage of countries with competition for selected services, 2001for selected services, 2001
0
10
20
30
40
50
60
70
80
90
100
Basic services Leased lines Wireless localloop
Cellular Cable TV VSAT ISPs
In %
Monopoly Competition
Source: ITU World Telecommunication Regulatory Database, 2001
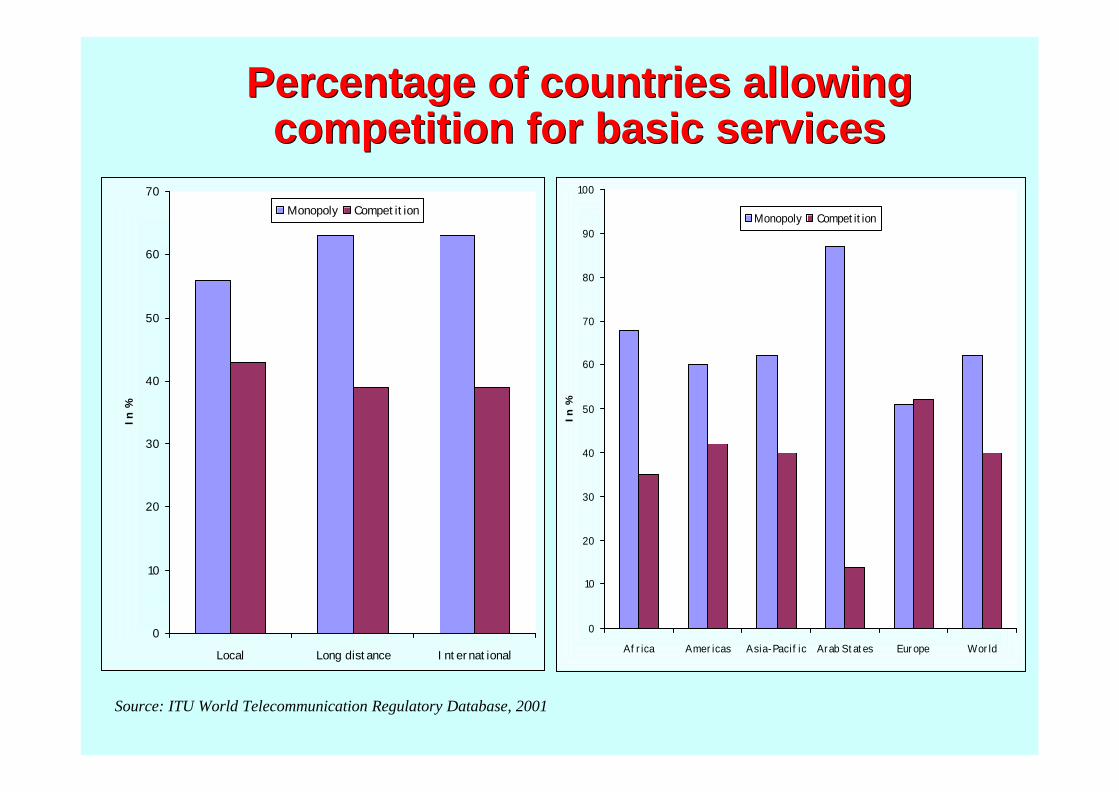
Percentage of countries allowing Percentage of countries allowing competition for basic servicescompetition for basic services
0
10
20
30
40
50
60
70
Local Long distance International
In %
Monopoly Competition
0
10
20
30
40
50
60
70
80
90
100
Africa Americas Asia-Pacific Arab States Europe World
In %
Monopoly Competition
Source: ITU World Telecommunication Regulatory Database, 2001
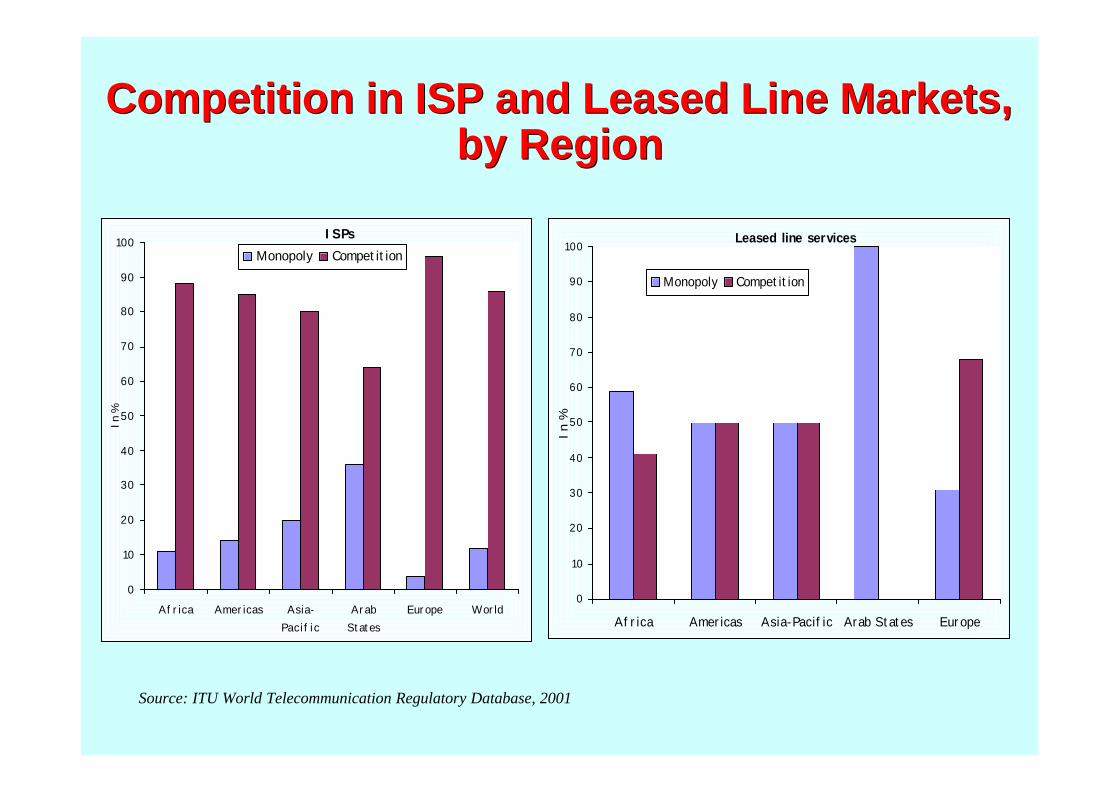
Competition in ISP and Leased Line Markets, Competition in ISP and Leased Line Markets, by Regionby Region
ISPs
0
10
20
30
40
50
60
70
80
90
100
Africa Americas Asia-Pacific
ArabStates
Europe World
In %
Monopoly CompetitionLeased line services
0
10
20
30
40
50
60
70
80
90
100
Africa Americas Asia-Pacific Arab States Europe
In %
Monopoly Competition
Source: ITU World Telecommunication Regulatory Database, 2001

Competition in Mobile Cellular ServicesCompetition in Mobile Cellular Services
Source: ITU World Telecommunication Regulatory Database, 2001
0
10
20
30
40
50
60
70
80
90
100
Africa Americas Asia-Pacific Arab States Europe
In %
Monopoly Competition
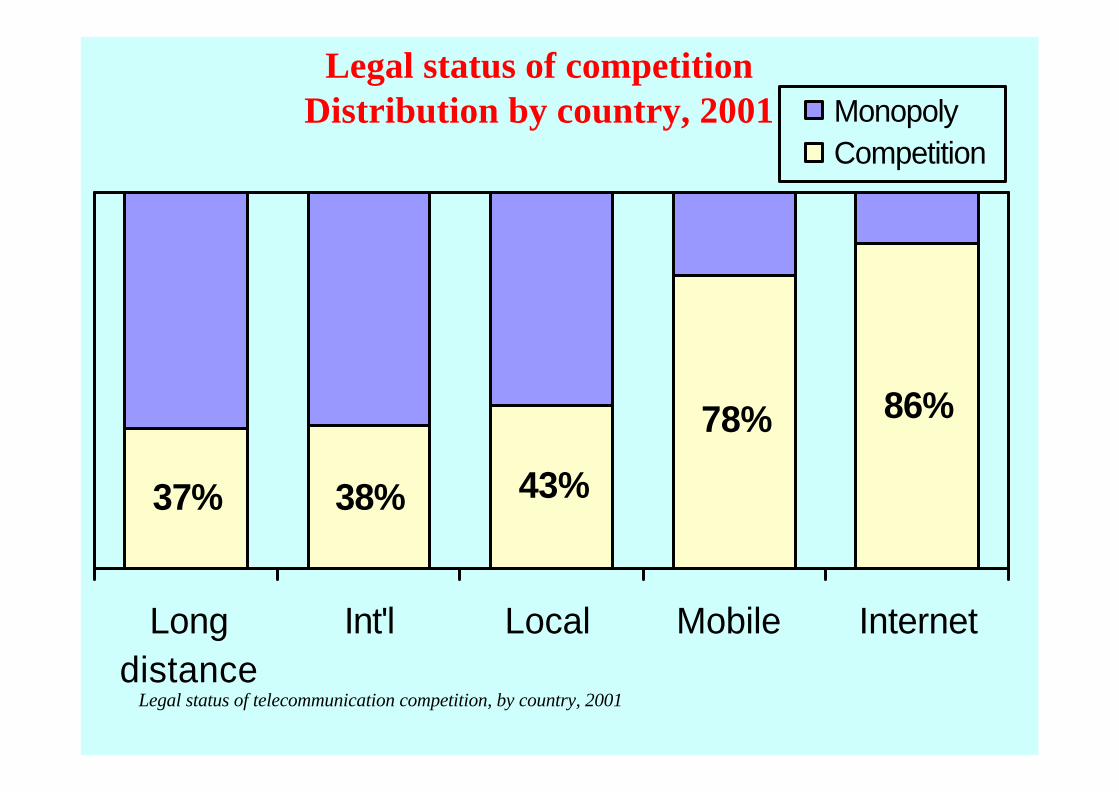
37% 38% 43%
78% 86%
Longdistance
Int'l Local Mobile Internet
MonopolyCompetition
Legal status of telecommunication competition, by country, 2001
Legal status of competitionDistribution by country, 2001


10Competition in Voice TelephonyCompetition in Voice Telephony
0
5
10
15
20
25
1986 1988 1990 1992 1994 1996 1998 2000
1988: Privatization and competition in Chile
1990: Privatization w ith 7-year exclusivity in Argentina
Exclusivity extended by 3 years in Argentina
Teledensity, in Chile and Argentina
Growth in fixed line teledensity, Chile and Argentina, 1986-2000

11Competition in Voice TelephonyCompetition in Voice Telephony
0
10
20
30
40
50
60
70
80
90
1988 1990 1992 1994 1996 1998 2000
Singapore: Mobile
competition delayed until
April 1997
Hongkong SAR: Mobile competition introduced in 1988 for analogue
Additional competition introduced w ith digital mobile in 1993
Six additional PCS licences awarded in 1996
Mobile penetration rate, per 100 inhabitants
Growth in mobile teledensity, Hong Kong SAR and Singapore, 1988-2000

Teledensity with rising rank
Country 2000 1990Rank 2000
Rank 1990 Change
China 17.8 0.6 95 159 64
V iet Nam 4.2 0.1 141 189 48
Botsw ana 21.6 2.1 91 129 38
El Salvador 21.8 2.4 90 125 35
Jamaica 34.1 4.5 71 106 35
Hungary 67.4 9.6 43 78 35
Mauritius 38.6 5.4 67 100 33
Chile 44.4 6.7 61 93 32
Philippines 12.4 1.0 112 143 31
Morocco 13.3 1.6 107 136 29
Paraguay 20.7 2.7 92 120 28
Cambodia 1.2 0.0 167 194 27
Cape Verde 17.2 2.4 98 125 27
Taiw an, China 137.0 31.4 5 31 26
Poland 45.6 8.6 60 85 25

Teledensity with falling rank
Country 2000 1990Rank 2000
Rank 1990 Change
Armenia 15.6 15.7 102 60 -42
Iraq 2.9 3.9 149 109 -40
Tajikistan 3.6 4.5 143 105 -38
Uzbekistan 6.9 6.9 128 92 -36
Kyrgyzstan 7.9 7.2 125 90 -35
Angola 0.7 0.8 177 146 -31
Liberia 0.2 0.4 190 162 -28
DPR Korea 4.6 3.8 138 111 -27
Canada 96.1 58.6 33 6 -27
Turkmenistan 8.4 6.0 123 97 -26
Cuba 4.4 3.1 140 115 -25
Moldova 16.5 10.6 99 74 -25
Kazakhstan 12.5 8.0 111 87 -24
Comoros 1.0 0.8 171 149 -22
Ukraine 22.7 13.6 87 66 -21

X X
Traditional regime:Traditional regime:Joint provision of serviceJoint provision of service
Country A Country B
14

X
Emerging regime:Emerging regime:Market entry and interconnectionMarket entry and interconnection
XXCountry A Country B
Jointly provided circuit
Circuit provided by operator B
15

Country A Country B
Operator A Operator BPSTN
IWF
Interconnect
Leased lines
International simple resale (ISR)(By-passing accounting rate)
Once a foreign carrier accepts the benchmark rate, it can negotiate ISR arrangements with US carriers

Country A Country B
Telephone service using data transmission(By-passing accounting rate)
Operator A
PSTN
Voice is packetized = data transmissionTelephone regulations do not apply
VSAT
Inter-connection
É

T 0 2 0 8 5 0 0 - 0 0( 1 0 6 1 4 7 )
I P N e t w o r k
IW F
T e r m i n a t i n gN e t w o r k
L o c a l o r d i s t r i b u t e df u n c t i o n C a l l i n i t i a t e d f r o m P S T N / I S D N / P L M N
t o P S T N / I S D N / P L M N
P S T N / I S D N/ P L M N
IW F
P S T N / I S D N/ P L M N
L o c a l o r d i s t r i b u t e df u n c t i o n
O r i g i n a t i n gN e t w o r k
Call from International Telecommunication Network (ITN) to another ITN via IP-based Network
IP Telephony (by-passing accounting rate)

7Alternative calling proceduresAlternative calling procedures
Country A
Country B Country C4.5 $
3.5$
2.0$
Call-Back
1.2$
0.8$1.0$1.5$
Interconnection of two outgoing calls in country A
Call-Back
Using ARCALL BACK using Accounting Rates
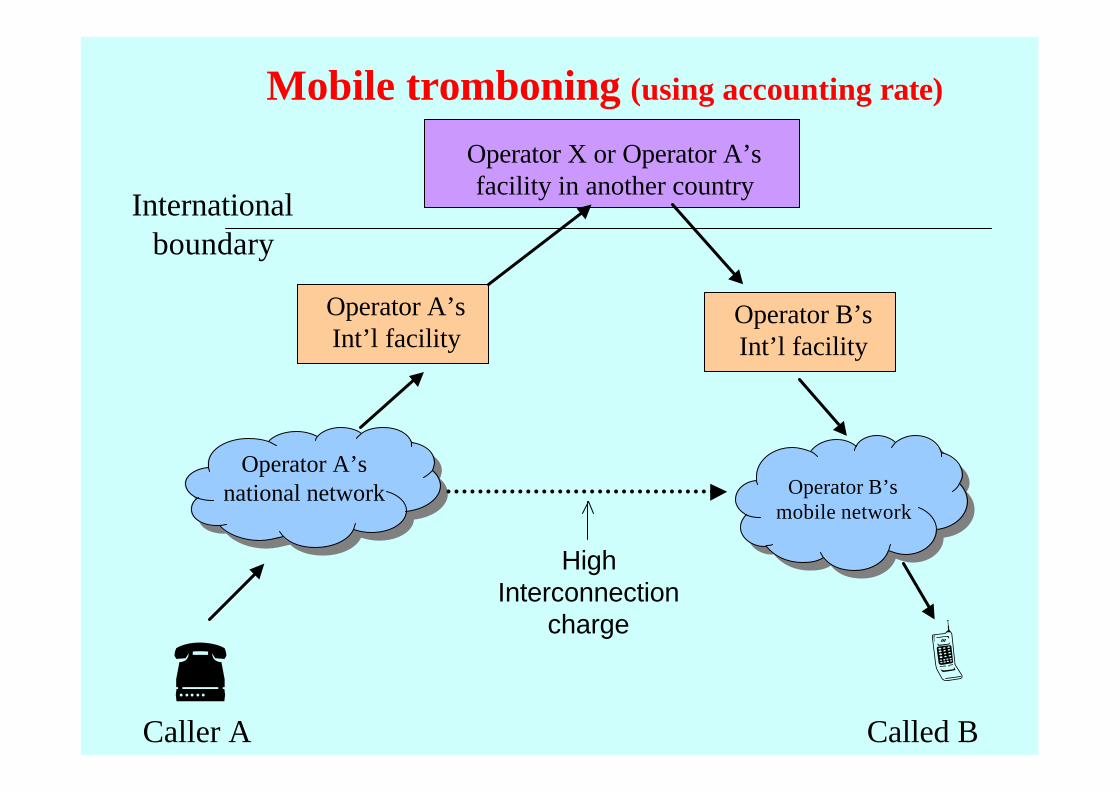
Mobile tromboning (using accounting rate)
É ÈCalled BCaller A
Operator A’s national network Operator B’s
mobile network
Operator A’s Int’l facility
Operator B’s Int’l facility
Operator X or Operator A’s facility in another country
International boundary
High Interconnection
charge

A
C
B
C
B
A
Operator in A sends traffic tooperator in C under anarrangement of exclusivity
• Operator in A is a partnerof operator in C
• Settlement rates A/B > C/B
Origin A
Destination B Origin
C
Destinati
on B
Operator in C declares traffic to B on transit through A
Operator in B receives traffic at settlement rate C/B instead of A/B
Operator in C “re-labels” the traffic as originated in C
1
2
3
4
Refile and other practices using accounting rate system

Calling opportunity in the worldCalling opportunity in the world
89.7%
5.0%5.0% 0.3%
199352.7%
19.9%
19.9%
7.5%
1998
23.4%
25.0%25.0%
26.7%
2003
Fixed-to-fixed
Fixed-to-mobile
Mobile-to-fixed
Mobile-to-mobile
Source: ITU Fixed-Mobile Interconnect website: http://www.itu.int/interconnect
More than 75% of calls involve mobile
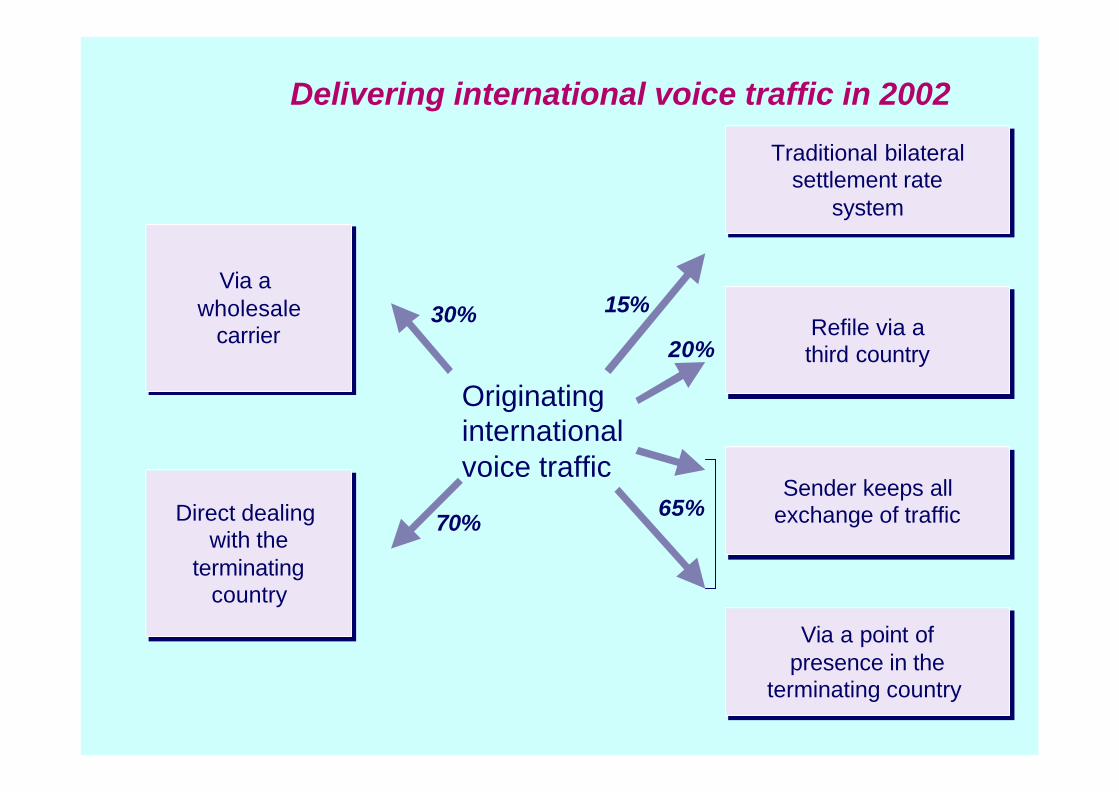
Originating internationalvoice traffic
Traditional bilateralsettlement rate
system
Traditional bilateralsettlement rate
system
Refile via athird countryRefile via athird country
Sender keeps allexchange of trafficSender keeps all
exchange of traffic
Via a point ofpresence in the
terminating country
Via a point ofpresence in the
terminating country
Via a wholesale
carrier
Via a wholesale
carrier
Direct dealing with the
terminatingcountry
Direct dealing with the
terminatingcountry
30%
20%
15%
70%65%
Delivering international voice traffic in 2002

24Competition in Voice TelephonyCompetition in Voice Telephony
So, what’s the problem?So, what’s the problem?l Competition is everywhere but..
ð Incumbents, New-comers and Regulators are not ready
l Accounting rates are the traditional way of sharing revenues from int’l servicesð BUT, creates incentives among recipient countries to
sustain rates at high levelð Accounting rate system not well-adapted to competitive
market environment
l Strong pressure to move towards a cost-oriented systemð BUT, a cost-oriented system would be asymmetricð US want cost-oriented but reject asymmetric charges for
call termination
l How to calculate cost ?ð How interconnection charge should be determined
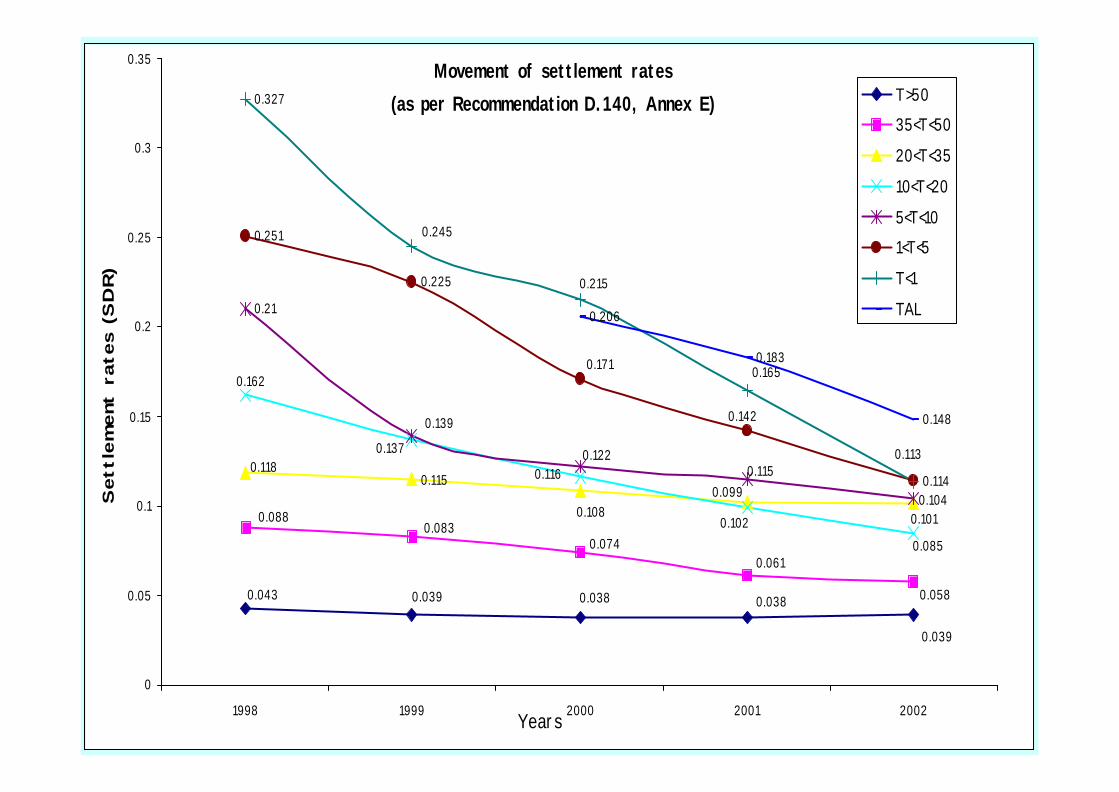
Movement of settlement rates(as per Recommendation D.140, Annex E)
0.115
0.21
0.251
0.225
0.114
0.327
0.206
0.183
0.148
0.039
0.0380.0380.0390.043 0.058
0.0880.083
0.0740.061
0.102 0.1010.108
0.1180.137
0.162
0.085
0.0990.116
0.104
0.1150.122
0.139 0.142
0.171 0.165
0.215
0.245
0.113
0
0.05
0.1
0.15
0.2
0.25
0.3
0.35
1998 1999 2000 2001 2002Years
Sett
lement
rate
s (S
DR)
T>5035<T<5020<T<3510<T<205<T<101<T<5T<1TAL
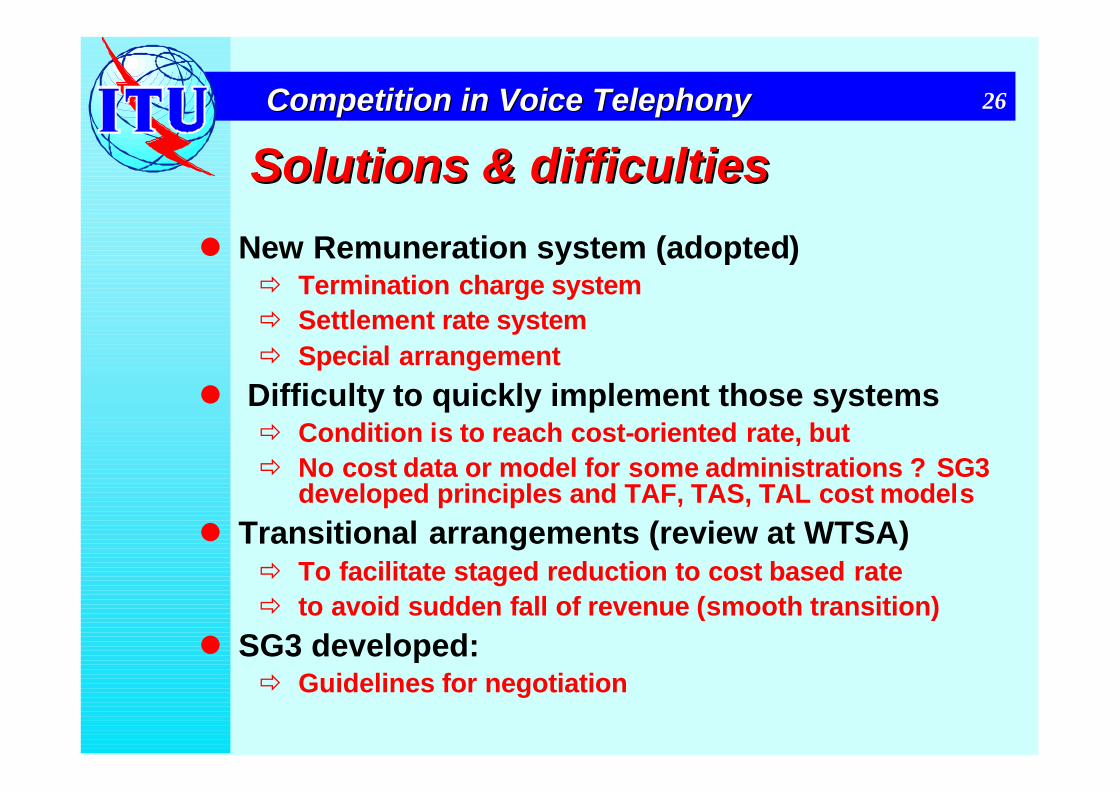
26Competition in Voice TelephonyCompetition in Voice Telephony
Solutions & difficulties Solutions & difficulties
l New Remuneration system (adopted)ð Termination charge systemð Settlement rate systemð Special arrangement
l Difficulty to quickly implement those systemsð Condition is to reach cost-oriented rate, butð No cost data or model for some administrations ? SG3
developed principles and TAF, TAS, TAL cost models
l Transitional arrangements (review at WTSA)ð To facilitate staged reduction to cost based rateð to avoid sudden fall of revenue (smooth transition)
l SG3 developed: ð Guidelines for negotiation

AnnexAnnex E to E to RecommendationRecommendation D.140 D.140 “indicative “indicative targettarget rates” by rates” by TeledensityTeledensity (T) (T) BandBand, in SDR (, in SDR (andand US cents) US cents) perper minute.minute.
T<1 1<T<5 5<T<10 10<T<20 20<T<35 35<T<50 T>50
0.327 SDR
0.251 SDR
0.210 SDR
0.162 SDR
0.118 SDR
0.088 SDR
0.043 SDR
43.7¢ 33.5¢ 28.0¢ 21.6¢ 15.8¢ 11.8¢ 5.7¢
Low income Lower middle Upper middle
High income
Note: The correspondence between teledensity band and income group shown in the bottom row is intended to be approximate, not precise. Source: ITU-T SG3 Report. 1 SDR = US$1.39.
27
FCC : 23 ¢(January2002/2003)
FCC : 19 ¢(January2001) 19 ¢(J.2000)
FCC : 15 ¢(January1999)
(end 2001) (end 2001) (end 2001) (end 2001)
(
end 2001) (end 2001) (end 2001)

The following non-binding guidelines could be applied when negotiating accounting rates and accounting rates share in the international service:1 Each party should ensure that; i.e., all information to be given to the other party should be credible in order to lead the negotiations into right direction.2 The parties should negotiate freely and make agreements voluntary, any kind of coercion should be avoided.Each party should act constructively, any offer, proposal, action, etc. should be directed towards reaching an agreement. Complex concepts should be simplified as much as possible.4 Each party should act time-saving, any delay should be avoided.5 Regular re-negotiations and future amendments should be possible.6 Until such time as an appropriate dispute settlement arrangement may be approved by the ITU with respect to accounting rates, both parties should have the possibility to consult a person or institution for mediation.
Guidelines to facilitate the negotiation

Addition to Recommendation D.140Addition to Recommendation D.140
1 accountingnrates for international telephone services should be cost-orientated and should take into account relevant cost trends;
2 each Administration should apply the above principle to all relations on a non-discriminatory basis; Accordingly, international calls should not be treated any less favorably than comparable national calls.
Alternative proposal from Vietnam:Accordingly, under normal circumstances (where tariff rebalancing has been effectively achieved) international calls should be treated any less….

The The importance of importance of interconnectioninterconnectionl Key to developing competitive markets
ð Interconnection is the main driver of growth and innovation in telecom market, it promote efficient infrastructure development
ð But constructing a sound interconnection framework is no easy task
l Approaches to Interconnection Policyð National approach – by 2000 101 countries had established
interconnection regulatory frameworkð Regional Approach – European Union (interconnection directive),
CITEL (Guidelines and Practices for Interconnection Regulation), APEC (Recommended Principles for interconnection), TRASA(proposed interconnection guidelines)
l WTO Reference Paper on Regulatory Issuesð Puts forward a series of interconnection commitments:
- provide interconnection at any technically feasible point- non discrimunatory terms, conditions and rates- in a sufficiently unbundled and timely fashion- calls for transparency

Key Interconnection Rules in Key Interconnection Rules in the WTO Reference Paperthe WTO Reference Paper
An independent entity (which may be the regulator) must be available to resolve interconnection dispute within a reasonable time frame
Dispute resolution
Agreements of major suppliers’ model interconnection offers must be made public
Transparency
Procedures for interconnection to major suppliers must be made public
Procedure
- At any technical feasible point in the network- In a timely fashion- At cost orientated rates- On non discriminatory and transparent terms- On an unbundled basis - At non-traditional interconnection points if requester pays charges
Interconnection with “Major Supplies”must be available

32Competition in Voice TelephonyCompetition in Voice Telephony
Regulatory and technical issuesRegulatory and technical issuesl Policy makers must resolve such basic questions as:
ð which carriers are required interconnectionð How the costs will be calculated and recovered, and ð At what points in the PSTN interconnection should occur
l Regulatory issues ð Establishing guidelines in Advance (without it, interconnection
negotiation are frequently protracted, delaying the introductionof competition)
ð Introducing competition require “dominant carriers” to interconnect with other carriers
ð Cost orientation: excessive prices deter market entry, hinder competition, end user suffer and can provide a pool of revenue
l Technical issuesð Points of interconnection: incumbent operators permit inter-
connection with their networks at any technically feasible pointð Dialling Parity and Pre-selection: Call-by-call customer
selection or Operator pre-selection by pre-subscriptionð Quality of Interconnection Service
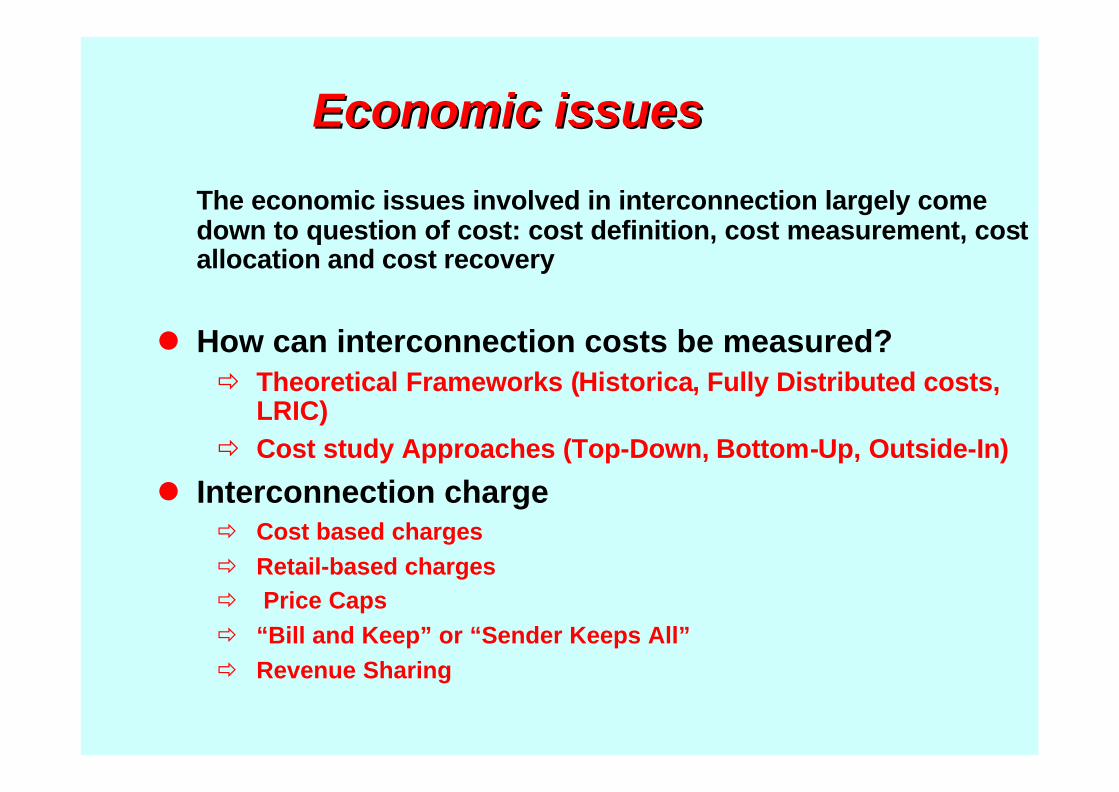
Economic issuesEconomic issues
The economic issues involved in interconnection largely come down to question of cost: cost definition, cost measurement, cost allocation and cost recovery
l How can interconnection costs be measured?ð Theoretical Frameworks (Historica, Fully Distributed costs,
LRIC)ð Cost study Approaches (Top-Down, Bottom-Up, Outside-In)
l Interconnection chargeð Cost based chargesð Retail-based chargesð Price Capsð “Bill and Keep” or “Sender Keeps All”ð Revenue Sharing
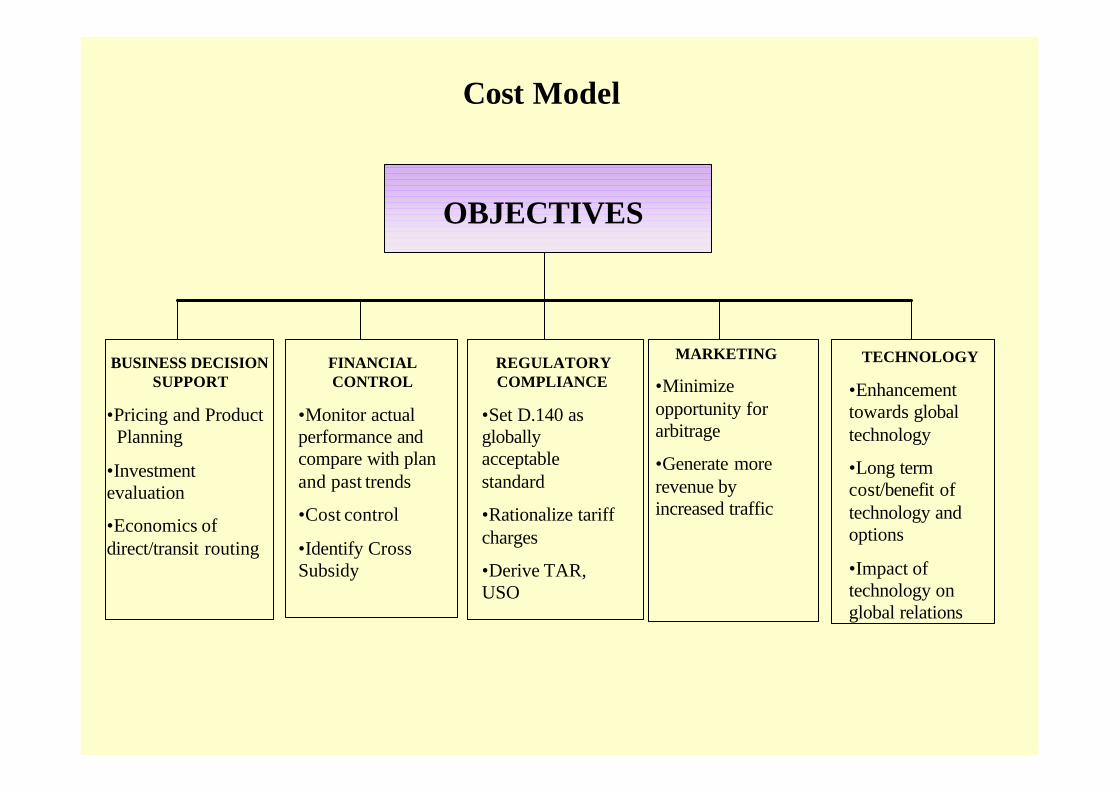
OBJECTIVES
BUSINESS DECISIONSUPPORT
•Pricing and ProductPlanning
•Investment evaluation
•Economics of direct/transit routing
FINANCIAL CONTROL
•Monitor actualperformance andcompare with plan and past trends
•Cost control
•Identify Cross Subsidy
REGULATORYCOMPLIANCE
•Set D.140 as globallyacceptable standard
•Rationalize tariffcharges
•Derive TAR, USO
MARKETING
•Minimize opportunity for arbitrage
•Generate more revenue by increased traffic
TECHNOLOGY
•Enhancement towards global technology
•Long term cost/benefit of technology andoptions
•Impact of technology on global relations
Cost Model

Costing Methodologies
METHODOLOGIES
ACCOUNTING CONVENTION COSTING APPROACH
HISTORICALCOST
ACCOUNTING
CURRENTCOST
ACCOUNTING
FULLYDISTRIBUTED
COST APPROACH
INCREMENTALCOST
APPROACH
•Actual costs incurred
•Cost of today of providing service
•Mirrors competitorspotential cost
•All costs areallocated to services
•Incremental costs only
•Often long-run incremental costs only

36Competition in Voice TelephonyCompetition in Voice Telephony
No much differences if…No much differences if…l Current cost accounting is used ð FDC=Historical Cost is no more relevant
l Costs of efficient services provision is used ð this should be the aim of all operatorsð spare capacity (legitimate if transparency)ð Disagreement on time horizon to achieve this
l Principle of cost causality is applied (ABC) ð Common cost must be attributed to the service
on the basis of the causality priniple ð However an exhaustive application of an ABC
approach may be very costlyl Need for cost recovery realised appropriatelyð IC approach should contain a markup

l Principle of transparency : The open availability of information used in the cost deviation process in order to allow comprehension of the final rate from the vantage point of an external analyst
l Principle of practicability : The ability to implement a costing methodology with reasonable demands being placed on data availability anddata processing in order to keep the costing exercise economical, yet still useful
l Principle of cost causality : The demonstration of clear cause-and-effect relationship between service delivery on the one hand and the network element and other resources used to provide it on the other hand, taking into account the relevant underlying cost determinants (cost drivers)
l Principle of reasonable contribution to common costs : Costing methodologies should provide for a reasonable contribution to common costs
l Principle of efficiency : The provision of a forecast of cost reductions that result from a more efficient combination of resources
Agreed General principles
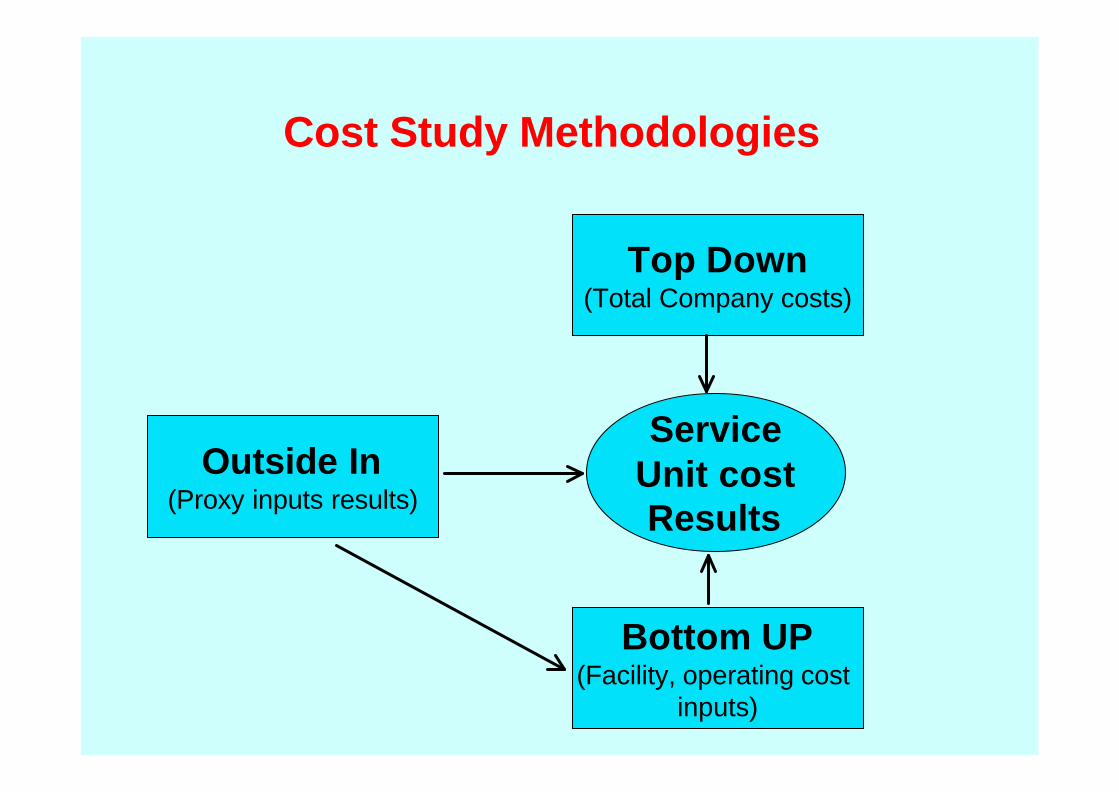
Top Down(Total Company costs)
Bottom UP(Facility, operating cost
inputs)
Outside In(Proxy inputs results)
ServiceUnit cost Results
Cost Study Methodologies

0.30
0.24
0.23
0.23
0.22
0.21
0.20
0.20
0.18
0.18
0.17
0.16
0.156
Sw itzerland
Germany
Italy
Austria
Sweden
Finland
France
Spain
Belgium
Netherlands
Denmark
UK
Norway
European fixed-to-mobile interconnect charges, (US$/min)
0 5 10 15 20 25 30
Mobile-to-fixed LOCAL
Mobile-to-fixed SINGLE
TRANSIT
Mobile-to-fixed DOUBLE
TRANSIT
Fixed-to-mobile
Lowest
Best-practice(20%) guideline
Highest
EU, range of interconnect rates, (US cents per min.)
Interconnection Rates in Selected European Countries
Calling Party Pays (CPP). In US $ per minute.

0.105
0.005
0.020
0.056
0.010
0.020
0.009
0.008
0.008
0.007
0.0012
0.000
0.000
0.008
0.000
0.0096
CPP
RPP
USA
Sri Lanka
Singapore
HK SAR
Canada
China
Mobile-to-fixedinterconnect rate
Fixed-to-mobileinterconnect rate
RPP countries
Average
0.293
0.208
0.205
0.078
0.070
0.20
0.047
0.034
0.017
0.293
0.052
0.051
0.042
0.050
0.026
0.047
0.034
0.017
Antigua
Botswana
Philippines
Dom. Rep.
Cambodia
Mexico
Guatemala
Malaysia
Costa Rica
Mobile-to-fixedinterconnect rate
Fixed-to-mobileinterconnect rate
CPP countries
Interconnection rates in selected non-European countries
Calling Party Pays (CPP) vs. Receiving Party Pays (RPP). In US$ per minute.
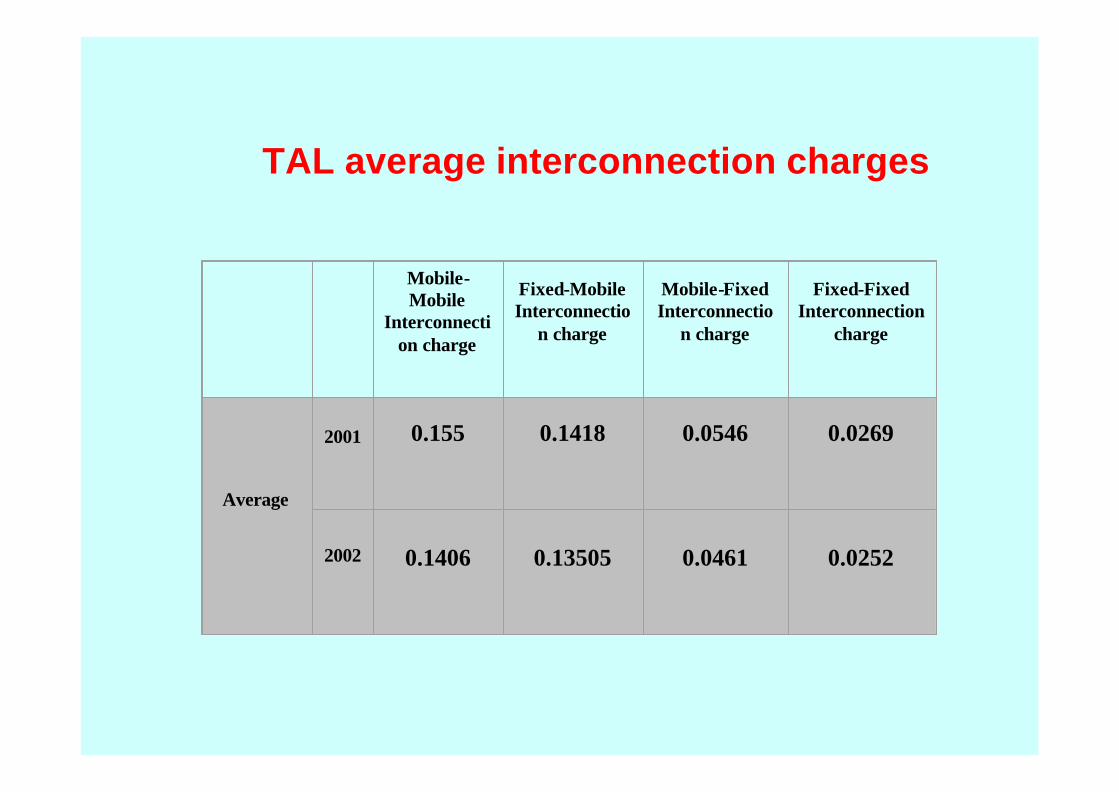
TAL average interconnection charges
Mobile-Mobile
Interconnection charge
Fixed-MobileInterconnectio
n charge
Mobile-FixedInterconnectio
n charge
Fixed-FixedInterconnection
charge
Average
2001 0.155 0.1418 0.0546 0.0269
2002 0.1406 0.13505 0.0461 0.0252

Fixed to Mobile Interconnect
charge
Mobile to fixed Interconnect
chargeLocal
Mobile to fixed Interconnect
chargeSingle transit
Mobile to Fixed Interconnect
chargeDouble transit
Average 0.167 0.078 0.096 0.150
TAF average interconnection charges
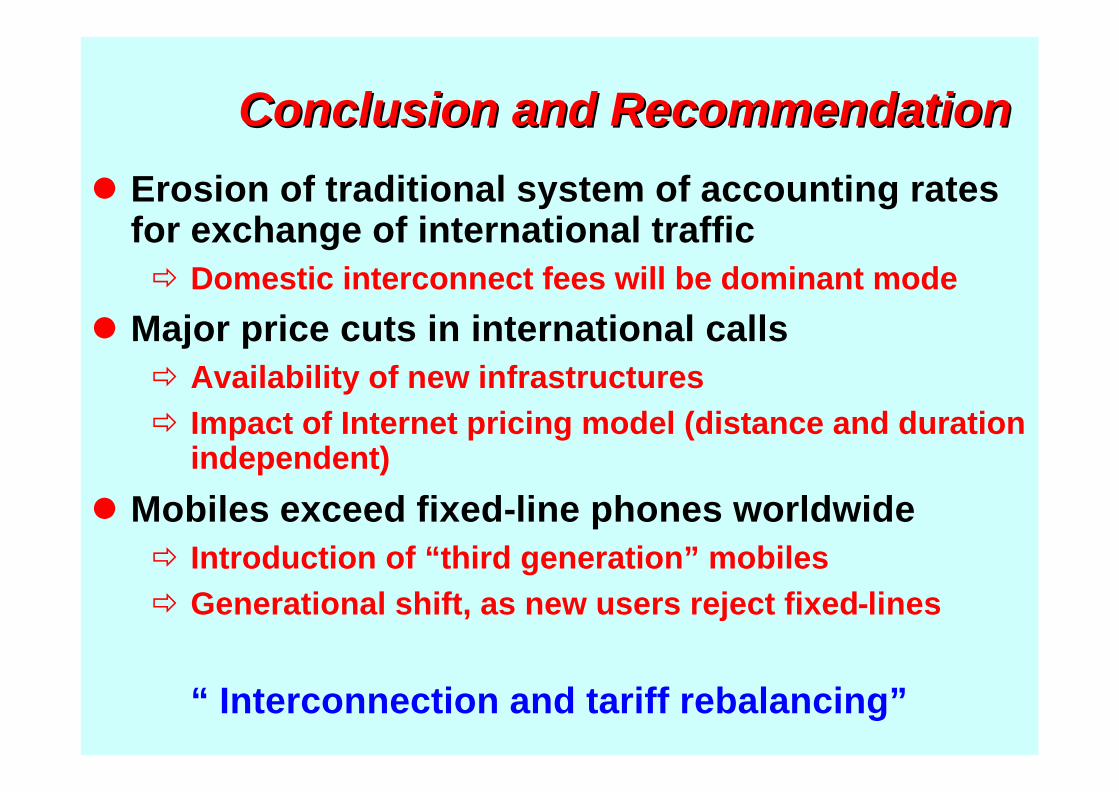
Conclusion and Recommendation Conclusion and Recommendation
l Erosion of traditional system of accounting rates for exchange of international trafficð Domestic interconnect fees will be dominant mode
l Major price cuts in international calls ð Availability of new infrastructuresð Impact of Internet pricing model (distance and duration
independent)
l Mobiles exceed fixed-line phones worldwide ð Introduction of “third generation” mobiles ð Generational shift, as new users reject fixed-lines
“ Interconnection and tariff rebalancing”