Embed Size (px)
Citation preview

284 Acta Chim. Slov. 2006, 53, 284–291
Lah et al. Competition of Some Minor Groove Binders for ...
Abstract
Scientific Paper
Competition of Some Minor Groove Binders for a Single DNA Binding Site†
Jurij Lah*, Nejc Carl, Igor Drobnak, Boštjan Šumiga and Gorazd Vesnaver*University of Ljubljana, Faculty of Chemistry and Chemical Technology, Askerceva 5, 1000 Ljubljana, Slovenia.
Received 16-05-2006† Dedicated to the memory of Prof. Dr. Davorin Dolar
We employed circular dichroism (CD) and isothermal titration calorimetry (ITC) to characterize binding of netropsin (NET) and distamycin A (DST) to the hairpin (D) formed from the 5′-CGAATTGACGTCTCCGTCAATTCG-3′ oligonucleotide. From fitting the appropriate model to the CD titration curves describing NET and DST binding to the D and CD and ITC titration curves describing the displacement of NET bound to D by the added DST and vice versa we were able to determine the corresponding binding and displacement constants at 25 °C. The displacement constant (K12) determined for 2DST + NET-D ↔ DST2-D + NET process is in good agreement with the corresponding value calculated from the individual binding events (NET + D ↔NET-D, k1 = 1.6 106 M-1; DST + D ↔DST-D, k1 = 1.0 107 M-1 and DST + DST-D ↔DST2-D, k2 = 0.9 104 M-1). ITC results reveal that the free energy of displacement ∆G12° = -29 kJ mol-1 in combination with the enthalpy of displacement ∆H12° = -74 kJ mol-1 results in the corresponding entropy contribution T∆S12° = -45 kJ mol-1. Evidently, the 2DST + NET-D ↔DST2-D + NET displacement is a strongly enthalpy driven process. What we find important with the displacement studies is the observation that NET entirely displaces DST from one half of its 1:1 complexes with the hairpin in spite of the fact that the 1:1 binding constant of NET is about one order of magnitude lower than the corresponding 1:1 constant of DST. We propose that the driving force of this displacement is strong binding of DST molecules that are displaced as a result of the overall NET-DST-D equilibrium to the available DST-hairpin 1:1 complexes.
Key words: DNA, drug binding, netropsin, distamycin, isothermal titration calorimetry, thermodynamics, circular dichroism
1. Introduction
A large number of pharmacologically active ligands (drugs) are believed to exert their biochemical influences bybinding to DNA. This possibility has stimulated numerous research efforts designed to elucidate the molecular basis for the sequence specific recognition of DNA by smallmolecules.1,2 A typical example of such studies are binding studies performed with two natural antibiotics, the singly charged distamycin A (DST) and the doubly charged netropsin (NET).3-7 For NET binding these studies have shown that it exhibits a high affinity 1:1 binding to sitesthat consist of at least four consecutive AT base pairs. If one of these AT base pairs is replaced by the GC base pair a substantial drop in the NET binding constant is observed presumably due to the steric hindrance by the guanine NH2 group located in the minor groove.8 Due to the electrostatic repulsion between the charged ends of NET molecules
that prevents binding of two drug molecules to the same binding site NET binding to DNA occurs always in a 1:1 manner. By contrast, investigations of DST binding have shown that DNA binding sites consisting of five AT or fourAT and one GC base pairs can accommodate two DST molecules either in a single 2:1 step or in two successive 1:1 steps.7,9 They are stacked in head to tail orientation and the cooperativity of this process depends strongly on the sequence of the base pairs within the binding site (Fig. 1). In five AT base pair sequences characterized by a narrowminor groove the 1:1 binding is favored while in those 5 AT sites that possess wider minor grooves the single step 2:1 motif prevails. In line with this qualitative explanation is also the observed high affinity binding of DST to some4AT·GC sites. It seems that in these sites the replacement of one AT by one GC base pair locally widens the minor groove and thus makes possible simultaneous binding of two DST molecules.
285Acta Chim. Slov. 2006, 53, 284–291
Lah et al. Competition of Some Minor Groove Binders for ...
It has been generally recognized that in spite of numerous studies on ligand binding to DNA there is no simple general code available that would explain the observed binding affinity and specificity of minor grooveligands. Therefore, any new information on factors that govern ligand binding to DNA will make an important contribution to a better understanding of these complex processes. In this work we used spectroscopic (CD) and calorimetric (ITC) techniques to study the affinity andspecificity of NET and DST binding to the hairpin formedfrom the 5′-CGAATTGACGTCTCCGTCAATTCG-3′ oligonucleotide (Fig. 6). In addition, we tried to get some information on the rules that govern displacement of one bound drug with another. Our results demonstrate that NET binds to the double helical part of the hairpin that contains 4AT sites in a high affinity 1:1 mode. Furthermore, theyshow that DST binds to one of available 4AT·GC sites in two successive 1:1 steps. The first step is characterized witha binding constant that is for about one order of magnitude higher than the one of NET while the binding constant for the second step is lower for several orders of magnitude. The additional question we are trying to answer in this work is the mechanism of the competitive binding of NET and DST to the hairpin. In other words, we would like to know at what conditions NET displaces DST or vice versa, what are the binding modes of both ligands involved in such binding competitions, how effective is the observed displacement of one drug with the other and how it depends on the temperature.
2. Experimental
2.1. MaterialsOligonucleotide 5’-CGAATTGACGTCTCC
GTCAATTCG-3’ was purchased from Invitrogen Co., Germany. Its concentrations in solution were determined spectrophotometrically at 25 °C using the extinction coefficient of the hairpin form in 10 mM phosphate buffer of ε260 = 2.00·105 M-1cm-1. This ε value was determined from the extinction coefficient of the oligonuceotide unfolded form calculated using the nearest-neighbor values of Cantor et al.10
Netropsin-HCl (NET) from Boehringer Mannheim GmbH and DistamycinA-HCl (DST) from Sigma were used without further purification. Their concentrations in solution were determined spectrophotometrically at 25 °C using the extinction coefficients of ε(NET)296 = 21500 M-1cm-1 and ε(DST)303 = 34000 M-1cm-1. The buffer solutions used in all our experiments consisted of 10 mM phosphate buffer, 100 mM NaCl and 1 mM Na2EDTA adjusted to pH = 7.00.
2.2 MethodsUV-absorbtion spectrophotometry. Absorbance
measurements were performed in a Cary 1 UV
a)
b)
c)
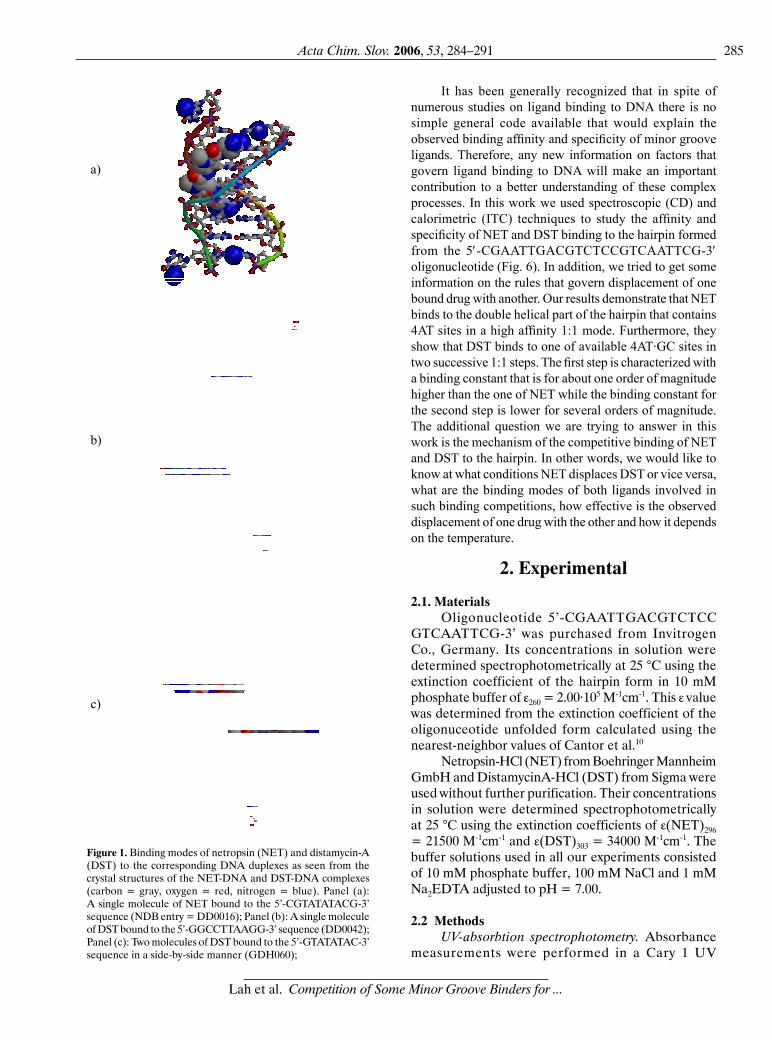
Figure 1. Binding modes of netropsin (NET) and distamycin-A (DST) to the corresponding DNA duplexes as seen from the crystal structures of the NET-DNA and DST-DNA complexes (carbon = gray, oxygen = red, nitrogen = blue). Panel (a): A single molecule of NET bound to the 5’-CGTATATACG-3’ sequence (NDB entry = DD0016); Panel (b): A single molecule of DST bound to the 5’-GGCCTTAAGG-3’ sequence (DD0042); Panel (c): Two molecules of DST bound to the 5’-GTATATAC-3’ sequence in a side-by-side manner (GDH060);

286 Acta Chim. Slov. 2006, 53, 284–291
Lah et al. Competition of Some Minor Groove Binders for ...
spectrophotometer equipped with a thermoelectrically controlled cell holder and a cell path length of 0.1-1.0 cm. UV melting curves were measured at 260 nm at a heating rate of 0.5 °C min-1; the total DNA strand concentration was between 2 µM and 28 µM.
Circular dichroism (CD) spectropolarimetry. CD spectra were measured in an AVIV model 62A DS spectropolarimeter equipped with a thermoelectrically controlled cell holder in a cuvette with a path length of 1 cm. CD titrations were performed at 15 °C, 25 °C, 35 °C and 45 °C by incrementally injecting 5-20 µL aliquots of 100-500 µM NET or DST solution into 2 mL of about 5 µM DNA solution. After each injection the CD spectrum was measured between 220 and 400 nm and normalized to the 1M DNA concentration. In competition experiments in which NET bound to the hairpin in the 1:1 manner was displaced by the added DST the NET:DNA = 4:1 solution (hairpin saturated with NET) was titrated with DST while in the reverse experiment DST:DNA = 1:1 and 2:1 solutions were titrated with NET.
Isothermal titration calorimetry (ITC). The ITC displacement titrations of the bound NET by the added DST were performed at 25 °C in the VP ITC MicroCal microcalorimeter. In each experiment about 1.4 mL of 13 µM DNA solution containing a 4:1 excess of NET was titrated incrementally (∆V = 20 µL) with about 600 µM solution of DST. The area under the raw signal accompanying each injection corrected for the titrant dilution is proportional to the heat of displacement of NET by DST.
2.3 Analysis of the Signals Accompanying Titration Experiments
Generally speaking, a competition titration experiment in which a given DNA complexed with mo molecules of ligand M is titrated with another ligand N may be presented as7
( )
( )
[ ][ ][ ][ ]
mn
o
o
o
Km m n o
m mm n
mn nm
M D nN M N D m m M
M N D MKM D N
−
→+ + −←
= (1)
where MmNnD is the complex consisting of n molecules of N and m molecules of M bound to the same molecule D, n is the stoichiometric factor for the overall binding of ligand N, (mo-m) is the number of the displaced molecules of M and Kmn is the corresponding equilibrium constant. When discussing binding of ligand N to the molecule D in the absence of another ligand M a simplified version of eq. 1 is used in which mo = m = 0 and the equilibrium constant takes the form mn n n
n
K K k= = ∏ where kn is the binding constant for each 1:1 step
1nk
n nN N D N D−→+ ← in the overall
binding of N.
Based on the general expression describing the competition titration (eq. 1) the total concentrations of D, M and N at every titration point can be expressed as
, ,[ ] [ ] [ ]T m n T mn
m n m nD M N D D α= =� � (2)
, ,[ ] [ ] [ ] [ ]T m n T M M mn
m n m nM M m M N D D r mα α
� �= + = +� �
� �� � (3)
, ,[ ] [ ] [ ] [ ]T m n T N N mn
m n m nN N n M N D D r nα α
� �= + = +� �
� �� � (4)
where αmn, αM and αN are the molar fractions of MmNnD, M and N, respectively, and r is the ligand/DNA molar ratio (rM = [M]T/[D]T, rN = [N]T/[D]T). By solving the system of eqs. 1-4 one can express αM, αN and αmn at any titration point in terms of [D]T, [M]T, [N]T and the corresponding values of Kmn. According to the experimental observation that at each titration step two DST molecules displace only one molecule of bound NET we used in our displacement studies n = 2 for DST and mo = 1 and m = 0 for NET. For binding of one type of ligand in the absence of the other, however, we used mo = m = 0 and n = 1 (for NET) or n = 1 and 2 (for DST).
Assuming that some measurable physical property F of a solution can be expressed as a sum of individual contributions of species of the type MmNnD present in the solution which all show linear dependence on concentration one can define the so called difference physical property, ∆F, as the difference between the measured F and its value that would be contributed by the corresponding [D]T, [M]T and [N]T normalized to [D]T
7:
{ },
[ ] [ ] [ ] [ ]D T M T N T T mn mnm n
F F f D f M f N D f α∆ = − − − = ∆� (5)
The concentration independent quantities fD, fM, fN and fmn are the molar F values of pure D, M, N and MmNnD, respectively and αmn is the fraction of [D]T in the MmNnD form. ∆F as presented by eq. 5 describes competitive binding of M and N, however, as mentioned earlier, by putting mo = m = 0 it can be easily transformed into a form that describes binding of only one ligand.
As shown by eq. 5 the quantity ∆F may be determined experimentally as ∆F = {F - fD[D]T - fM[M]T
- fN[N]T}/[D]T or calculated from the corresponding model function
,mn mn
m nF f α∆ = ∆� which contains adjustable
parameters ∆fmn and Kmn (hidden in αmn). When performing the so called CD titrations the measured physical property is the ellipticity Θ, the quantities fD, fM, fN and fmn are the molar ellipticities of D, M, N and
mn mn D M Nf f f mf nf∆ = − − −where: [ ] [ ]mn m n TM N D Dα =and

287Acta Chim. Slov. 2006, 53, 284–291
Lah et al. Competition of Some Minor Groove Binders for ...
MmNnD multiplied by the path length. According to eq. 5 the experimental ∆FCD value at each titration point is obtained using the measured Θ value and known values of [D]T, [M]T and [N]T together with their molar ellipticities and the corresponding titration curve is constructed by presenting ∆FCD as a function of the ratio [N]T/[D]T (Figs. 2, 3 and 5). When conducting ITC titrations the experimental ∆FITC is measured directly as the cummulative heat effect at a given titration point, ∆H, expressed per mole of DNA molecules (eq. 5) while ∆fmn is the standard enthalpy of the MmNnD complex formation ∆Hmn°.
7 Thus, the ITC titration curve is simply the ∆H vs. [N]T/[D]T curve (Fig. 7).
Both, CD and ITC, experimental titration curves can be described only in terms of adjustable parameters ∆fmn and Kmn. Their values can be obtained, in principle, from fitting the model function (eq. 5) to the corresponding titration curve using non-linear minimization of the corresponding χ2 function defined as11
2mod2
( )i i
i i
F FF
χ� �∆ − ∆= � �∆ ∆� �
� (6)
where ∆Fi is the experimental ∆F at the i-th titration point, ∆Fi
mod is the corresponding value calculated from the model function (eq. 5) and ∆(∆Fi) is the absolute error with experimental ∆Fi. The Kmn and ∆fmn values at the global minimum of χ2 are considered as the best descriptors of the experimental titation curve. Unfortunately, in case of very tight binding the described fitting procedure fails to produce reliable binding constants.12-18 Namely, the concentration of the titrated solution required for a successful fitting of the titration curve is so low that a safe experimental titration curve cannot be determined. A simple way to avoid this problem is to employ a displacement titration and use the described fitting procedure to determine the constant Kmn that describes the displacement of some ligand M of known, relatively high, binding constant KM with the studied ligand N characterized by extremely high binding constant KN. Since concentrations of the titrated solution required for a safe determination of the displacement constant Kmn are much higher than those required for the determination of extremely high KN values of a single ligand N reliable experimental displacement titration curves can easily be determined. Thus, the fitting procedure will provide safe Kmn values and since Kmn = KN/KM and KM is known this leads to reliable KN values.
3. Results and Discussion
UV-melting curves. To check if upon gradual cooling of preheated oligonucleotide solutions single-stranded
hairpin molecules were formed the UV-melting curves of cooled down samples were measured as a function of the total strand concentration (Tm (2 µM) = 72 ± 1 °C, Tm (7.5 µM) = 72 ± 1 °C, Tm (27.5 µM) = 70 ± 1 °C). Monophasic transitions were observed with transition temperature, Tm, independent of the total strand concentration which is consistent with the unimolecular melting of single-stranded hairpin19 presented in Fig. 6b. Evidently, the double-helical part of this hairpin contains one binding site of four successive AT base pairs known for high affinity 1:1binding of NET or DST and three potential binding sites of four AT and one GC base pairs to one of which DST may bind in a 2:1 binding mode.
0
0.4
0.8
(a)
���� 31
0·10 -
3 / de
gM
-1 c
m -1
T = 25 °C
0
0.4
0.8
0 1 2 3r
NET
(b)
�i
i = D
i = DNET
1
Figure 2. Analysis of the CD titration curve accompanying netropsin (NET) binding to the hairpin at 25 °C in 10 mM Na-phosphate buffer (pH = 7, [NaCl] = 100 mM). Panel (a): The measured signal is plotted against the NET/DNA molar ratio, rNET. Full lines represent the best fit of the model-binding isotherm (eq. 5). Panel(b): The corresponding fractions of NET-DNA complex and ligand free DNA calculated using the best-fit (panel a) binding constant k1 = 1.6 (±0.2)·106 M-1.
CD titrations. In Figs. 2 and 3 are presented CD titration curves obtained for NET and DST binding to the hairpin. Analysis of these curves shows that NET binds to the hairpin only in a 1:1 binding mode. Fitting of the corresponding model function (eq. 5) to the experimental

288 Acta Chim. Slov. 2006, 53, 284–291
Lah et al. Competition of Some Minor Groove Binders for ...
titration curve results in a relatively safe value of binding constant KNET = k1 = 1.6·106 M-1 which is consistent with KNET values reported for NET binding to AATT site.20 By contrast, the analysis of the DST titration curves suggests that DST binds to the hairpin in a 2:1 binding mode characterized with different binding constants k1 (N + D → ND) and k2 (N + ND → N2D), respectively. Fitting of appropriate model function (eq. 5) to the experimental titration curve gives good agreement for k1 = 1.0·107 M-1 and k2 = 9.0·103 M-1 thus suggesting that the overall binding constant for DST, KDST = k1·k2, is about 1011 M-2. Since k1 and k2 differ for about three orders of magnitude one may conclude that DST binding to the hairpin occurs in two successive 1:1 steps.
0
1
2
3
(a)
���� 33
0·10 -
3 / de
gM
-1 c
m -1
T = 25 °C
0
0.4
0.8
0 2 4 6r
DST
(b)
�i
i = D
i = DDST
i = DDST2
1
Figure 3. Analysis of the CD titration curve accompanying distamycin-A (DST) binding to the hairpin at 25 °C in 10 mM Na-phosphate buffer (pH = 7, [NaCl] = 100 mM). Panel (a): The measured signal is plotted against the DST/DNA molar ratio, rDST. Full lines represent the best fit of the model-binding isotherm (eq.5). Panel (b): The corresponding fractions of the two DST-DNA complexes and ligand free DNA calculated using the best-fit (panel a)binding constants k1 = 1.0 (±0.9)·107 M-1 and k2 = 0.9 (±0.4)·104 M-1.
The CD spectra that describe displacement of NET bound to the hairpin by the added DST and the corresponding titration curves constructed at 330 nm are presented in Figs. 4 and 5a, respectively. Fitting of the appropriate model function (eq. 5) to these experimental
Figure 4. Raw CD spectra (panel a) and normalized induced CD spectra (panel b) accompanying the competition titration (25 °C, 10 mM Na-phosphate buffer, pH = 7, [NaCl] = 100 mM) of the solution containing netropsin and DNA in the molar ratio, rNET = 4, with distamycin-A up to the distamycin/DNA ratio rDST = 11.
curves leads to reliable estimates of K12 values at the specified temperatures.According to these results the addedDST displaces in a high efficiency 2:1 binding mode NETmolecules that are strongly bound within the minor groove of the four AT sites in the hairpin. It seems that the highly cooperative binding of two DST molecules to one of the 4AT·GC sites in the hairpin overcomes the guanine NH2 group steric hindrance8 in the 4AT·GC minor groove and makes side by side binding of two DST molecules within this site more favorable than is the 1:1 binding of NET within the 4AT sites. The K12 value of 1.1 105 M-1 determined at 25 °C agrees well with the corresponding K12 = KDST/KNET = 6.0 104 M-1 value calculated from the single ligand binding experiments which additionally suggests that the proposed model for NET and DST binding to the studied hairpin is reasonable. From the measured temperature dependence of K12 and the general relation ΔG12° = - RT lnK12 we obtained the corresponding temperature dependence of the standard free energy of displacement, ΔG12°, from which the van’t Hoff enthalpy of displacement (ΔH12°)vH ≈ -20 kJ mol-1 was determined (Fig. 5b ).
-20
0
20
C
�/ m
deg
(a)
rNET
= 4, rDST
= 0
T = 25 °C rNET
= 4 , rDST
= 12
-5
0
5
280 320 360
C
� / nm
(b)
rNET
= 4, rDST
= 0
rNET
= 4, rDST
= 12
����·1
0 - 3 /
deg
M -1
cm
-1
1

289Acta Chim. Slov. 2006, 53, 284–291
Lah et al. Competition of Some Minor Groove Binders for ...
Figure 5. Analysis of the competition CD titration curves that were constructed from the induced CD spectra (Fig. 4b) measured at various temperatures. Panel (a): The corresponding experimental curve is plotted against the distamycin/DNA molar ratio, rDST. Full lines represent the best fits of the model-displacement isotherm (eq.5) at different temperatures from which the corresponding K12 values were estimated. Panel (b): The corresponding ∆G12°/T versus 1/T plots (∆G12° = -RTln K12) from which (ΔH12°)vH ≈ -20 kJ mol-1 was estimated.
0
2
4
0 2 4 6 8 10
15253545
rDST
(a)
���� 33
0·10 -
3 / de
gM
-1 c
m -1
T / °C
-9.8
-9.4
-9.0
3.1 3.2 3.3 3.4 3.5
�G
12°·1
02 /T /
kJK
-1
T -1·103 / K-1
(b)
1Figure 6. Displacement of distamycin-A (DST) bound to the hairpin by netropsin (NET). Panel (a): DST-DNA + NET titration followed by CD (25 °C, 10 mM Na-phosphate buffer, pH = 7, [NaCl] = 100 mM); Panel (b): The corresponding scheme representing DST displacement from the DST-DNA 1:1 complex by NET and its simultaneous rebinding to the remaining DST-DNA molecules to form the complex characterized by two DST molecules bound at the 4AT·GC site in a side-by-side manner.
The reverse CD titrations in which DST-hairpin 2:1 complexes were titrated with NET produced no observable changes in the measured CD spectra. Such behavior is expected since the overall 2:1 binding constant for DST, KDST, is several orders of magnitude higher than KNET. By contrast, if solutions containing DST and the hairpin in a 1:1 molar ratio are titrated with NET the CD titrations show that up to rNET ≈ 0.5 the added NET entirely displaces DST molecules despite the fact that KNET is about one order of magnitude lower than k1 that describes binding of the firstDST molecule to the hairpin. These results suggest that the described reverse titration is completed when in one half of the available DST-hairpin 1:1 complexes DST is displaced by NET while the other half reacts with the displaced DST to form DST-hairpin 2:1 complexes (Fig. 6b). It seems that DST molecules that are displaced according to the overall NET-DST-hairpin dynamic equilibrium strongly bind to the available DST-hairpin 1:1 complex molecules and this is the driving force of the observed displacement reaction. In other words, the DST-hairpin 1:1 complexes act as a “pump” for the free DST molecules participating in the overall NET-DST-hairpin equilibrium. As the result of such “pumping” action the displacement of DST from the DST-hairpin 1:1 complexes by the added NET is completed when one half of the available hairpins is occupied by a single NET molecule while the other half is complexed by two DST molecules. This explanation is consistent with our earlier conclusion based on the fitting of the CD titration curves that DSTbinds to the hairpin in two successive steps, characterized with k1 and k2, respectively, and that the binding constant for NET, KNET, is slightly lower than k1 and for several orders of magnitude lower than the constant KDST = k1k2 that describes the overall 2:1 binding of DST to the hairpin.
1
0.7
0.8
0 1 2r
NET
(a)
310
0/ d
M c
m
T = 25 °C
DST = , R =
NET = , R =
N
O
H
NH2
NH2
NCH3
NCH3
N
O
H
RN O
H
NCH3
H
N OH
N
NH2
NH2
H
(b)
5’-
3’-
CG
GC
A
T
A
T
T
A
TGA
ACT
CG
GC
TCT
C
5’-
3’-
CG
GC
A
T
A
T
T
A
TGA
ACT
CG
GC
TCT
C
5’-
3’-
CG
GC
A
T
A
T
T
A
TGA
ACT
CG
GC
TCT
C
DST = , R =
NET = , R =
N
O
H
NH2
NH2
NCH3
NCH3
N
O
H
RN O
H
NCH3
H
N OH
N
NH2
NH2
H
DST = , R =
NET = , R =
N
O
H
NH2
NH2
NCH3
NCH3
N
O
H
RN O
H
NCH3
H
N OH
N
NH2
NH2
H
(b)
5’-
3’-
CG
GC
A
T
A
T
T
A
TGA
ACT
CG
GC
TCT
C
5’-
3’-
CG
GC
A
T
A
T
T
A
TGA
ACT
CG
GC
TCT
C
5’-
3’-
CG
GC
A
T
A
T
T
A
TGA
ACT
CG
GC
TCT
C
5’-
3’-
CG
GC
A
T
A
T
T
A
TGA
ACT
CG
GC
TCT
C
5’-
3’-
CG
GC
A
T
A
T
T
A
TGA
ACT
CG
GC
TCT
C
5’-
3’-
CG
GC
A
T
A
T
T
A
TGA
ACT
CG
GC
TCT
C
CG
GC
A
T
A
T
T
A
TGA
ACT
CG
GC
TCT
C
-1 -1
eg -
3·1
����

290 Acta Chim. Slov. 2006, 53, 284–291
Lah et al. Competition of Some Minor Groove Binders for ...
ITC titration. In Fig. 7 is presented the ITC displacement titration curve describing the titration of the NET-hairpin 1:1 complex with DST. Fitting of the corresponding model function (eq. 5) to this titration curve results in a reasonable estimate of two important quantities: K12 = 1.4 105 M-1 and ΔH12° = -74 kJ/mol). Comparison of this K12 value with the one obtained from the CD displacement titration curve and the one calculated from single ligand binding constants shows good agreement which supports the model we use to describe binding of NET and DST to the double-helical part of the hairpin molecules. By contrast, the exothermic model-independent ΔH12° determined directly from the ITC titration curve (Fig. 7a) is much higher than the corresponding model-dependent van’t Hoff value, (ΔH12°)vH, calculated from the temperature dependence of K12 determined from CD displacement titrations (Fig. 5b). Such significant discrepancies betweenvan’t Hoff and calorimetric enthalpies that cannot be explained in any quantitative way have been observed with a number of other systems.21-23 Qualitatively, one can ascribe them either to the use of inadequate binding models, to the temperature dependence of ΔH12° or to the large errors in the temperature derivatives of binding constants determined from the optical titration performed at different temperatures. Estimation of errors in K12 values determined from fitting the model to the CD titration curves at differenttemperatures indicates that the observed large difference between (ΔH12°)ITC and (ΔH12°)vH is very likely due to the large errors in the temperature derivatives of K12. This conclusion is supported also by the fact that the observed (ΔH12°)ITC value agrees well with the coresponding values reported for similar systems.7
4. Acknowledgment
This work was supported by the Ministry of Higher Education, Science and Technology and by the Agency for Research of Republic of Slovenia through the Grants No. P1-0201 and J1-6653.
Figure 7. Analysis of the ITC competition titration (25 °C, 10 mM Na-phosphate buffer, pH = 7, [NaCl] = 100 mM). The solution containing netropsin and DNA in the molar ratio, rNET = 4, was titrated with distamycin-A up to the distamycin/DNA ratio rDST = 11. Panel (a): Experimentally measured cumulative heat effects given per mol of hairpin in the measuring cell, ΔH, plotted against rDST. Full line represents the best fit of the model-displacement isotherm(eq. 5) that result in the estimates of the displacement constant K12 = 1.4 (±0.2)·105 M-1 and the enthalpy of displacement ΔH12° = -74 (±1) kJ mol-1. Panel (b): The corresponding fractions of DST-DNA and NET-DNA complexes calculated using the best-fit displacementconstant (panel a).
0
20
40
60
80
-�H
/ kJ
mol
-1
(a)
0
0.4
0.8
0 2 4 6 8 10r
DST
�i
(b)
i = DDST2
i = DNET
1
5. References
1. S. White, J. W. Szewczyk, J. M. Turner, E. E.Baird and P. B. Dervan, Nature 1998, 391, 468–471.
2. D. E. Wemmer, Annu. Rev. Biophys. Biomol. Struct. 2000, 29, 439–461.
3. L. A. Marky, and K. J. Breslauer, Proc. Natl. Acad. Sci. USA 1987, 84, 4359-4363.
4. K. J Breslauer, D. P Remeta, W.-Y. Chou, R. Ferrante, J. Curry, D. Zaunczkowski, J.G. Snyder, and L.A. Marky, Proc. Natl. Acad. Sci. USA 1987, 84, 8922–8926.
5. D. Rentzeperis, J. Ho and L. A. Marky, Biochemistry 1993, 32, 2564–2572.
6. J. Lah and G. Vesnaver, Biochemistry 2000, 39, 9317–9326.
7. J. Lah and G. Vesnaver, J. Mol. Biol. 2004, 342, 73–89.8. M. L. Kopka, C. Yoon, D. Goodsell, P. Pjura, and R.
E. Dickerson, Proc. Natl. Acad. Sci. USA 1985, 82, 1376–1380.
9. F. M. Chen and F. Sha, Biochemistry 1998 , 37 , 11143–11151.
10. C. R. Cantor, M. M. Warshow and H. Shapiro, Biopolymers 1970, 9, 1059–1077.
11. W. H. Press, B. P. Flannery, S. A. Teukolsky and W. T. Vetterling, Numerical Recepies, Cambridge University Press, Cambridge, 1989.

291Acta Chim. Slov. 2006, 53, 284–291
Lah et al. Competition of Some Minor Groove Binders for ...
12. J. B. Chaires, Methods Enzymol., 2001, 340, 3–22.13. T. Wiseman, S. Williston, J. F. Brandts and L. N. Lin, Anal.
Biochemistry 1989, 179, 131–137.14. D. Hallen, Pure & Appl. Chem. 1993, 65, 1527-1532.15. M. M. Lopez and G. I. Makhatadze, Methods Mol. Biol.
2002, 173, 121–126.16. J. Lah, I. Marianovsky, G. Glaser, H. Engelberg-Kulka, J.
Kinne, L. Wyns and R. Loris (2003). J. Biol. Chem. 2003, 278, 14101–14111.
17. J. Lah, N. M. Maier, W Lindner and G. Vesnaver, J. Phys. Chem. B 2001, 105, 1670–1678.
18. J. Lah, C. Pohar and G. Vesnaver, J. Phys. Chem. B 2000, 104, 2522–2526.
19. L. A. Marky and K. J. Breslauer, Biopolymers 1987, 26, 1601–1620.
20. I. Haq, Arch. Biochem. Biophys. 2002, 403, 1–15.21. H. Naghibi, A. Tamura and J. M. Sturtevant, Proc. Natl.
Acad. Sci. USA 1995, 92, 5597–5599.22. J. R. Horn, D. Russell, E. A. Lewis and K. P. Murphy,
Biochemistry 2001, 40, 1774–1778.23. J. B. Chaires, Biophys. Chem. 1997, 64, 15–23.
Povzetek Za karakterizacijo vezave netropsina (NET) in distamicina A (DST) na lasnico (D), ki se tvori iz oligonukleotida 5′-CGAATTGACGTCTCCGTCAATTCG-3′ smo uporabili cirkularni dikroizem (CD) in izotermno titracijsko kalorimetrijo (ITC). S prilagajanjem primernih modelnih funkcij k CD titracijskim krivuljam, ki popisujejo vezavo NET in DST na lasnico D in ITC titracijskim krivuljam, ki popisujejo izpodrivanje na lasnico vezanega NET z dodanim DST in obratno, smo uspeli določiti ustrezne konstante vezanja in izpodrivanja pri 25 °C. Konstanta izpodrivanja K12 določena za proces 2DST + NET-D ↔ DST2-D + NET se dobro ujema z vrednostjo K12 izračunano s pomočjo konstant vezanja določenih za ustrezna posamična vezanja (NET + D ↔NET-D, k1 = 1.6 106 M-1; DST + D ↔DST-D, k1 = 1.0 107 M-1 and DST + DST-D ↔DST2-D, k2 = 0.9 104 M-1). ITC rezultati pokažejo, da vodi prosta entalpija izpodrivanja ∆G12° = -29 kJ mol-1 v kombinaciji z entalpijo izpodrivanja ∆H12° = -74 kJ mol-1 do ustreznega entropijskega prispevka T∆S12° = -45 kJ mol-1, kar pomeni, da je izpodrivanje 2DST + NET-D ↔DST2-D + NET močno entalpijsko voden proces. Rezultat tega dela, ki se nam zdi še posebej pomemben je ugotovitev, da NET popolnoma izpodrine DST iz ene polovice njegovih 1 : 1 kompleksov z lasnico kljub temu, da je 1 : 1 konstanta vezanja za NET približno za en velikostni red nižja od ustrezne 1 : 1 konstante vezanja za DST. Razlaga, ki jo predlagamo je, da je gonilna sila omenjenega izpodrivanja močno vezanje prostih molekul DST določenih s celotnim NET-DST-D ravnotežjem na DST:D = 1 : 1 komplekse prisotne v raztopini.

![Synthesis of Amide-Linked Minor Groove Binders (MGBs) to … Abu... · 2014-01-02 · letters G, A, T and C [2-4]. Accordingly, Watson and Crick concluded that adenine must be matched](https://img.pdfslide.net/doc/110x75/5f416320108a11787938e50a/synthesis-of-amide-linked-minor-groove-binders-mgbs-to-abu-2014-01-02-letters.jpg)