Embed Size (px)
Citation preview
Product Market Competition and Human Resource Practices: An Analysis of the Retail Food Sector
Elizabeth Davisa
Matthew Freedmanb
Julia Lanec
Brian McCalla
Nicole Nestoriakd Timothy Parke
aUniversity of Minnesota, b University of Maryland, cNational Science Foundation, dBureau of Economic Analysis, eUniversity of Georgia The paper has benefited from helpful comments from Charlie Brown, Erica Groshen, James Hertel, Jean Kinsey, Anne Russell, and Scott Scheuler. This research uses confidential data from the Census Bureau’s Longitudinal Employer-Household Dynamics Program (LEHD), which is partially supported by the National Science Foundation Grant SES-9978093 to Cornell University (Cornell Institute for Social and Economic Research), the National Institute on Aging, and the Alfred P. Sloan Foundation. The Census Bureau is preparing to support external researchers’ use of these data; please consult http://lehd.dsd.census.gov. Corresponding author: Julia Lane ([email protected])
1
Abstract
The rise of super-centers and the entry of Wal-Mart into food retailing have dramatically altered the competitive environment in the industry. This paper explores the impact of such changes on the labor market practices of traditional food retailers. We use longitudinal data on workers and firms to construct new measures of compensation and employment, and examine how these measures evolve within and across firms in response to changes in product market structure. An additional feature of the analysis is to combine rich case study knowledge about the retail food industry with the new matched employer-employee data from the Census Bureau.
2
Introduction
“Whereas Wal-Mart employees start at the same salary as unionized employees in similar lines of work, they make 25 percent less than their unionized counterparts after two years at the job. The rapid turnover - 70 percent of employees leave within the first year - is attributed to a lack of recognition and inadequate pay, according to a survey Wal-Mart conducted." PBS, "Store Wars: When Wal-Mart Comes to Town," http://www.pbs.org/itvs/storewars/stores3.html (February 2, 2004)
There is abundant evidence that the entry of Wal-Mart and “big box” stores into retailing
has forced retail firms to rethink the way in which they do business – not only in terms of
pricing, marketing and distribution strategies, but also in terms of their human resource practices.
Although quotes like the one above suggest that Wal-Mart and similar companies have very
different ways of treating workers than do more traditional retailers, and although case study
evidence suggests that the proliferation of big-box stores has had a substantial impact on the
labor market, the empirical evidence is not clear. How does an industry’s labor market adjust in
response to such competitive shocks? Do existing firms revamp the way in which they hire,
promote, and compensate employees? Or do firms with older ways of doing business simply
contract and exit, and get replaced by entering firms that adopt the new way of doing business?
The retail food industry is fertile ground for studying these questions. Firms in the
industry have traditionally operated with hierarchical and centralized human resources practices.
However, traditional food retailers have encountered increasing competition from non-traditional
food sellers, with many resorting to consolidation and mergers as well as changes in marketing,
pricing, and employment and compensation strategies. The case study literature has already
provided a rich understanding of how some firms in the industry have adjusted their human
resources strategies in response to the competitive entry in retail food. This paper combines the
insights gained from case study work with a large-scale longitudinal employer-employee dataset
to examine the adjustment of firms in response to competitive entry over a five-year period.
3
The paper is organized as follows. In the next section, we describe the supermarket
industry, including recent trends in consolidation, technological adoption, and competitive
structure. We also summarize the relevant literature about retail firms’ survival and adjustment
patterns and the dynamic elements that influence human resource practices. In the third section
we develop a simple model of the firm that describes the interplay between changes in
competitive structure and the choice of human resource practices. This is followed in the fourth
section by a description of the Longitudinal Employer-Household Dynamics (LEHD) program
data, and in particular the development of new establishment-level geographic measures of
concentration as well as new firm-level measures of promotion, hiring, and wage-setting
practices. We also describe how the robustness of these measures is validated with external
industry and firm specific information on detailed human resource practices. The results of the
empirical analysis are provided in section five, and section six concludes.
2. Background
2.1. Developments in the Retail Food Industry
The retail food industry has undergone significant changes in recent decades. Increased
competition from alternative retail formats, such as warehouse clubs, mass merchandisers, and
other supercenters, in combination with substantial technological change and declining
unionization, has transformed the industry. Supermarkets have evolved from small,
independently owned full-service establishments to large, administratively centralized,
horizontally and sometimes even vertically integrated self-service chains.
Wal-Mart’s encroachment into food retailing has posed a significant challenge to
traditional grocery firms. Close to 80% of supermarket managers identified the supercenter
format used by Wal-Mart as the major threat to traditional grocery chains (National Grocers
4
Association 2003).Indeed, Wal-Mart has become the leading firm in the grocery industry, and it
continues to garner market share as it builds new stores and expands its product selection. From
a base of only ten supercenters in 1993, Wal-Mart grew to over 1,400 supercenters by the start of
2005. Company plans indicate that it intends to expand by 200 new stores every year for the next
five years.
The retail food industry has also undergone substantial changes in business practices due
to the emergence of new information technologies operations. Technological changes, including
scanning technologies, computerized inventory-control methods, and systematic tracking of
customers’ buying habits, have eliminated the need for some manual tasks within stores while
also “up-skilling” some positions by requiring a greater degree of computer literacy and
technical knowledge (Walsh 1993). Sieling et al. (2001) comment on the wide range of new
technologies and work processes designed to improve customer service that employees are
expected to master. The introduction of continuous replenishment programs to control
inventories, electronic data interchange, computer assisted ordering, and standard bar codes have
increased productivity. In addition, food retailers continue to experiment with an expanded range
of specialized services that are more labor intensive and make additional demands on internal
training and expertise of employees.
Unions traditionally held substantial sway in the retail food industry. Partly due to union
protection, supermarket jobs were among the most highly paid and highly coveted retail jobs
only several decades ago (Hughes 1999). However, since the 1980s, unions have become
substantially less important as two-tier wage agreements have proliferated in the industry. These
agreements have generally resulting in new hires being paid much less than more tenured
workers. Belman and Voos (2004) document a decline in the union wage differential of 26
5
percentage points, apparently due to increased competition from Wal-Mart and other nonunion
discounters.
2.2. Firm Adjustment in the Retail Industry
Research on adjustment patterns of firms in the retail sector has examined entry and exit
and their impact on productivity dynamics. Jarmin et al. (2001) detailed firm entry and exit
outcomes in the U.S. retail sector from 1977 to 1997 using the Longitudinal Research Database
at the U.S. Census Bureau. They highlight two interesting trends for the retail sector. The
driving force behind the growth of retail employment and the total number of retail
establishments is growth by multi-unit retail firms. Stores in multi-unit chains have significant
advantages over independent rivals as they are better positioned to make investments in modern
information and supply chain management technology. The multi-unit chains invest more in
employee training programs and provide more extensive employee benefits and incentives. A
general conclusion is that patterns of entry and exit in retail trade mimic those evident in the
manufacturing sector with new plants accounting for the overwhelming proportion of all new
employment. Firms that enter with new plant construction represent the most productive
entrants, attaining the largest relative size among entrants, the highest survival rates, and the
most stable employment shares.
Foster et al. (2002) develop productivity decompositions for the retail sector using the
Census of Retail Trade. They find that reallocation effects, which reflect shifts of inputs and
outputs away from less productive to more productive establishments, dominate productivity
growth in the retail sector. Net entry accounts for virtually all of labor productivity growth in
retail trade so that absent churning, retail trade would not exhibit any productivity growth.
Exiting establishments are substantially less productive than incumbents while entering
6
establishments initially attain about the same productivity as incumbents. They acknowledge
that organizational and structural changes in retail trade are driving the pace of entry and exit. A
key contribution of this analysis is to identify the role of evolving firm managerial techniques
and industry competitive conditions in influencing entry and exit patterns.
The effect of changing product market competition on employment in retailing has also
been examined. Basker (2005) finds that the entry of Wal-Mart into an area has a positive short-
run effect on retail industry employment at the county level that diminishes over time while
remaining positive. Wholesale employment falls slightly in the aftermath of a Wal-Mart entry,
which was attributed to Wal-Mart’s vertical integration.
2.3. Adjustments in Human Resource Practices by Food Retailers
Our objective is to examine how human resource practices of food retailers shift in
response to changing product market competition and new store formats, but summarizing such
practices empirically is a challenge. Some guidance is provided by Lazear and Oyer (2004), who
use measures of promotion, hiring, and wage setting to capture key aspects of human resource
practices – which they and we refer to as internal labor markets (ILMs). This provides a useful
construct in which to frame the analysis.
ILMs are generally characterized by long-term employment relationships, with most
hiring done from within the firm for positions other than low-level “port-of entry” jobs. In firms
with ILMs, wages are related to job characteristics and are relatively unresponsive to changes in
the external labor market. Evidence supporting (though not proving) the existence of ILMs
includes the persistence of firm wage differentials over time, the extent of upward mobility and
returns to seniority within firms, and limited external hiring other than at ports of entry.
7
Lazear and Oyer (2004) identify “ex post fluidity” as a key feature of internal labor
markets where workers make decisions on employment and firms follow by adjusting internal
human resource practices and organizational structure. The critical element is that firms adjust
human resource practices and may change their ILM status in response to competitive
conditions. Fairris (2004) suggests that firms choose their ILM status and these choices
influence workforce quality at the firm, including the quit rate. The ILM status of a firm is
measured by indicators such as reliance on internal promotion, hiring by seniority, job ladder
length, and pay growth.
There is some case study evidence that suggests that two types of human resource
strategies exist in the retail food industry: ILM and non-ILM.. More broadly speaking, though,
the nature of employer-employee relations in retail food has changed dramatically over time.
Although many retail food jobs are low-wage, part-time, and offer little opportunity for
advancement, supermarkets historically provided a subset of retail jobs that were better paid than
most and provided some upward mobility, particularly in locations with more unionized stores.
However, the predominant type of job in the supermarket industry has changed from a full-time,
relatively well paid position to a job with irregular and part time hours, low pay, and few options
for training and career advancement (Hughes 1999). The change has taken place at a slower pace
than in most industries, however; Ben-Ner et al. (1999) note that even though a higher
percentage of food than nonfood firms utilized employee participation in decision-making in
1980, the pace of adoption of these practices in the 1980s and 1990s by non-food firms was
much more rapid than for food firms. Similarly, the rate of adoption of financial incentives was
more rapid in non-food than food firms.
8
Thus, the limited evidence available suggests that there is heterogeneity in the wage and
ILM structure in the retail food industry, and that individual firms may respond only sluggishly
to changes in the external market. The next section develops a model that describes ways in
which firms might adjust to changing competitive forces.
3. Model
This section develops a simple model of skill acquisition and turnover to show what may
happen to the internal labor market of an existing firm when a new competitor enters the
industry. For simplicity, we restrict attention to a two period time horizon and ignore
discounting. Also, the model characterizes internal labor markets by a firm’s choice to engage in
firm-specific training, a costly activity that will increase the productivity of the worker within the
firm but only if the worker remains at the firm that provides the training. Clearly, internal labor
markets entail much more than training, but this single dimension of internal labor markets
serves as an indicator of a more general set of policies by the firm.
Suppose that a worker’s initial productivity in a firm is x and that after one period there is
a firm-specific exogenous change in productivity of either +β or -β, where the former occurs
with probability p. Let the worker’s outside alternative be y per period. Finally, assume that a
firm can train a worker at cost c and training increases a worker’s productivity at the firm in the
second period by v.1 In the absence of training, and assuming that x ≥ y but x - β < y, a worker
will stay with the firm with probability p. Thus, it will be optimal for a worker to work at a firm
in period one if
( ) (1 ) 2x p x p y yβ+ + + − > or
1 For simplicity, it is assumed that both training and individual productivity shocks are firm specific. Some examples of endogenous training models that allow for training spillovers across firms are Stevens (1994), Acemoglu and Pischke (1998), and Owan (2004).

9
0))(1( >+−+ βpyxp .
With training, a worker’s second period productivity in the firm is either x + v + β (with
probability p) or x + v - β (with probability (1-p)). In the former case, the worker will remain
with the firm in period two, given the assumption earlier that x + β > y. In the latter case, the
worker will leave the firm if x + v - β < y, or if
( ) ( )x y v 0β− + − < . (1)
The value of training will depend on whether a worker chooses to stay in period two after
receiving a negative productivity shock. This decision hinges on whether or not equation (1) is
satisfied. If equation (1) is not satisfied, then the net value of training is
])1()([])1(2[ ypxpxppcvx −+++−−−+−+ βββ ,
which reduces to
cvyxp −+−−− ))(1( β . (2)
If equation (1) is satisfied, the net value of training is then
])1()([])1()([ ypxpxcypvxpx −+++−−−++++ ββ ,
which simplifies to
pv c− . (3)
Thus, depending on the costs and benefits of training we have three possibilities: (a) a firm does
not train workers and has a turnover rate of (1-p), (b) a firm trains workers and has a turnover
rate of (1-p) (equation (1) is not satisfied), (c) or a firm trains workers and has a turnover rate of
0 (equation (1) is satisfied).
To model the impact of a new entrant, assumptions are required about how the values of
the parameters in the model are impacted by the new entrant. We shall assume that the values of
10
y and c are unaffected by the new entrant while those of x, v and β are reduced in a proportionate
fashion by a factor α. Thus, after entry we have αx, αv, and αβ, where α<1. This would be a
situation where the costs of training and value of worker’s next best alternative are unaffected by
a new entrant but the worker’s nominal productivity at the firm is uniformly reduced by the
factor α (perhaps because of a drop in the price of output due to increased competition).
It is clear that since y is unaffected by entry, the firm’s optimal strategy is to shut down
for α sufficiently close to zero. The question that remains is whether firms who continue to
operate in the post-entry regime change the amount of training they provide workers and whether
turnover rates are altered. Equation (1) above becomes ( )x v y 0α β+ − − < after entry. The
value of training to a firm, conditional on no turnover, becomes cvpyx −+−−− αβα )1]()([ ,
while the value of training to a firm, conditional on turnover rate of (1-p), becomes pv cα − .
Obviously, when α is sufficiently close to one, entry has no impact on the firm’s training
decisions and turnover rates. However, for lower values of α, a firm whose pre-entry strategy
consisted of training workers, with a result of zero turnover rates, may post-entry continue to
train workers yet see a rise in turnover rates to p. For other values of α, the firm may discontinue
training workers with a rise in turnover rates to p. Finally, as mentioned above, for values of α
close to zero the firm may go out of business.
To summarize, the impact of entry on an incumbent firm may result in no change in the
firm’s internal labor market structure (in terms of training) but lead to an increase in turnover
rates. Alternatively, a firm may eliminate training and also see a rise in turnover rates. In some
circumstances the firm may go out of business. An incumbent firm’s response to entry depends
on α which represents an index of competitive pressure exerted by the new entrant.
11
Determinants of the index of competitive pressure could include the size of the new entrant and
the distance the new entrant locates from the incumbent firm.
4. Data and Measurement
4.1 Data
Constructing a dataset that permits the analysis of the effects of changes in the product
market on firm specific compensation policies requires three sets of variables. The first set
describes the product market within which firms operate using both industry and geographic
variables together with the characteristics of firms. The second set provides the link between
workers and firms while the third component describes the characteristics, earnings, and mobility
of workers within each firm. In this section we describe the source of each of these measures in
turn.
In order to examine the product market and firm characteristics, we need data on detailed
industry category, address and geography variables, total revenues, employment, payroll, and
age. These measures are all available in the Economic Census, which is conducted in years
ending in “2” and “7.” In these universal surveys, which capture nearly all economic activity in
the U.S., the Census collects highly detailed information at the establishment level regarding
business operations. Geographic information is derived from the Geographic Address List
(GAL), a data set containing unique commercial and residential addresses in a state,
geographically coded to the Census Block and latitude/longitude coordinates. The file
encompasses addresses from several source files: the state ES-202 data, the Business Register,
the Census Bureau’s Master Address File (MAF), the American Community Survey (ACS), and
others.
12
The link between firms and workers is made possible because of a new LEHD database
that enables us to match workers with employers (Abowd, Lane, and Prevost 2000). This
database consists of quarterly records of the employment and earnings of almost all individuals
from the unemployment insurance systems of 37 US states in the 1990s and early 2000s.2 In this
dataset, we only use a subset of seven states (CA, ID, IL, MD, NC, OR, and WA) that have
historical data stretching back sufficiently far and that agreed to participate in the project from its
inception. These type of data have been extensively described elsewhere (e.g. Haltiwanger et al.
2000).
LEHD data permit the construction of the requisite measures of characteristics, earnings,
and mobility of workers within firms. Since the scope of the data is virtually the full universe of
employers and workers3, movements of workers across earnings categories and across employers
can be accurately tracked. New measures of promotion, hiring, and wage setting practices can be
created for each firm in the dataset. In addition, the Unemployment Insurance records have been
matched to internal administrative records containing information on date of birth, place of birth,
race, and sex for all workers.
Because these data are administrative in nature, both the employment and earnings
measures are different from those usually found in surveys. The information in each wage
record is simply the total earnings for each individual in a given quarter with a given employer.
2 As of March 2005, the partner states whose data were being processed were: AL, AR, CA, CO, DE, FL, ID, IL, IN, IA, KS, KY, ME, MD, MN, MO, MT, NJ, NM, NC, , OK, OR, PA, SC, TN, TX, VA, VT, WA, WI, and WV. Additional partner states include GA, MI, NV, ND, OH, and UT. This is an ongoing project and additional states are expected to join this program. Because of the sensitivity of these data it is worth noting that the data are anonymized before they are used in any Census Bureau projects; all standard identifiers and names are stripped and replaced by a unique “Protected Identification Key.” Only Census Bureau employees or individuals who have Special Sworn Status are permitted to work with the data, and there are serious penalties for disclosing the identity of an individual or business. Any research must be for statistical purposes only, and must be reviewed by the Census Bureau and other data custodians. Under Title 13 of the U.S. code, any breach of confidentiality can result in prosecution in which violators are subject to a $250,000 fine and/or 5 years in jail.
13
There is no information on hours or weeks worked, or indeed the duration of employment within
the quarter. This has led to the construction of two sets of employment measures. Flow
employment accounts for all workers employed by the employer at any time during the quarter,
while full quarter employment measures all workers who were employed on either a part time or
full time basis by the employer for the full quarter. The earnings similarly reflect quarterly
earnings without any adjustment for the number of hours worked during the quarter.
It is worth noting that while both the Economic Census and LEHD data are available at
an establishment level, the common identifier available on both datasets is the Employer
Identification Number (EIN), which is sometimes more highly aggregated than the
establishment. In order to provide a correspondence between the two files, data from both
datasets are aggregated to the EIN-county level, which corresponds to an establishment except
where a firm has more than one establishment within a county. We refer to the unit of analysis as
an establishment in this paper, keeping in mind that in some cases, there may be more than one
establishment owned by the same firm in a county.
4.2 Definitions and Measurement
In order to investigate the effect of product market competition on firm human resource
practices, we first define the relevant sample and develop measures of geographic concentration
and competition together with variables describing firms’ human resources practices.
In choosing the basic unit of analysis, we balanced the need to have establishments with
sufficiently large employee bases to support internal labor markets against the need for a
sufficient number of observations at the county level to make meaningful inferences. The unit
of analysis is establishments classified as grocery stores (SIC 54111) that have at least 15 full-
3 Stevens’ “Employment that is not covered by state unemployment insurance laws” LEHD TP 2002-16 describes coverage issues related to the LEHD database.
14
quarter workers and 30 flow workers. Only full-quarter earnings are considered in the analysis,
as information on the number of weeks worked in a quarter is lacking.
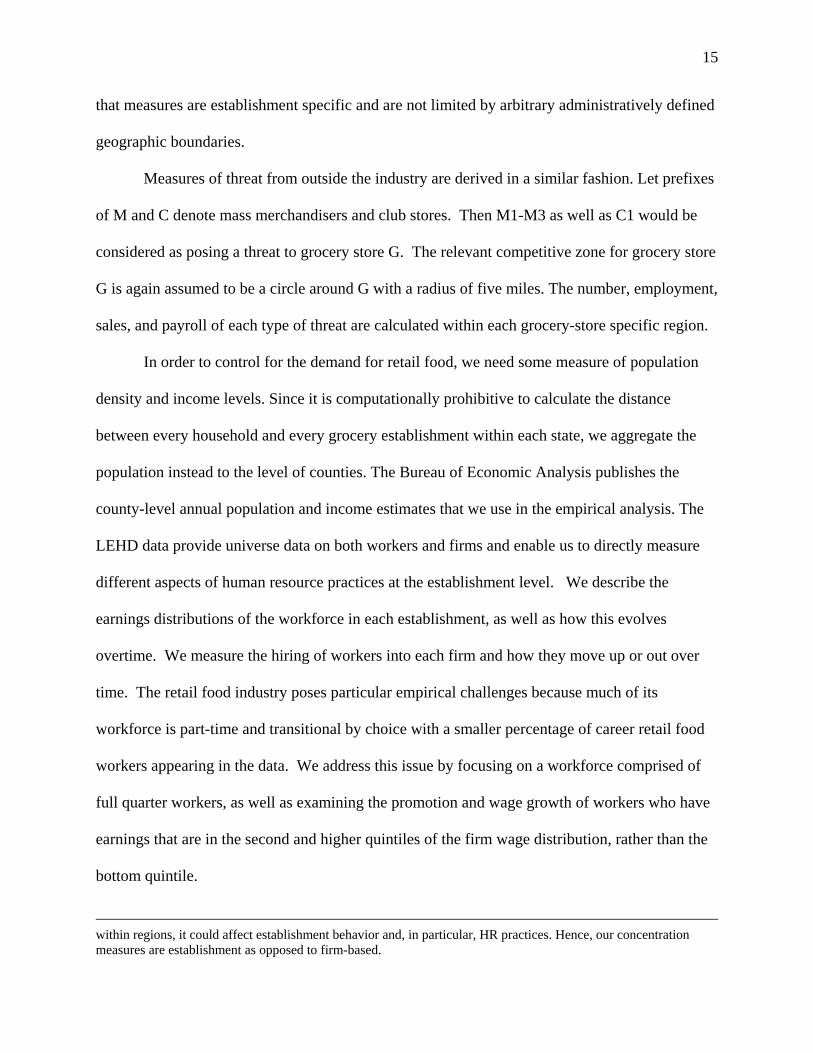
The rich geographic detail permits us to construct highly detailed measures of
concentration and competition for the retail food industry. In order to explain the construction of
these measures, consider Figure 1.
Figure 1
Suppose G is the grocery establishment of interest. Because the geographic coding of our dataset
is to the latitude and longitude of each establishment, we draw a circle of five-mile radius around
G and use sales at G and stores within this radius to construct concentration and competition
measures for G. Within this framework, we can calculate sales-based four firm concentration
ratios (CR-4) and Herfindahl indices on an establishment-specific basis. The CR-4 in this case
represents the share of sales in a given region, all of which have area 25*π, accounted for by the
top four firms in that area (excluding the sales of G itself). The Herfindahl index represents the
sum of the squares of sales shares in each region. The CR-4 and Herfindahl in this case capture
competition/concentration in the same way as the traditional measures would.4 A key advance is
4 We can also calculate concentration measures taking into account that one firm may own many establishments in one region and therefore exercise more market power. However, in this paper, we are interested in competition between establishments, and to the extent that even establishments within the same firm compete with one another
15
that measures are establishment specific and are not limited by arbitrary administratively defined
geographic boundaries.
Measures of threat from outside the industry are derived in a similar fashion. Let prefixes
of M and C denote mass merchandisers and club stores. Then M1-M3 as well as C1 would be
considered as posing a threat to grocery store G. The relevant competitive zone for grocery store
G is again assumed to be a circle around G with a radius of five miles. The number, employment,
sales, and payroll of each type of threat are calculated within each grocery-store specific region.
In order to control for the demand for retail food, we need some measure of population
density and income levels. Since it is computationally prohibitive to calculate the distance
between every household and every grocery establishment within each state, we aggregate the
population instead to the level of counties. The Bureau of Economic Analysis publishes the
county-level annual population and income estimates that we use in the empirical analysis. The
LEHD data provide universe data on both workers and firms and enable us to directly measure
different aspects of human resource practices at the establishment level. We describe the
earnings distributions of the workforce in each establishment, as well as how this evolves
overtime. We measure the hiring of workers into each firm and how they move up or out over
time. The retail food industry poses particular empirical challenges because much of its
workforce is part-time and transitional by choice with a smaller percentage of career retail food
workers appearing in the data. We address this issue by focusing on a workforce comprised of
full quarter workers, as well as examining the promotion and wage growth of workers who have
earnings that are in the second and higher quintiles of the firm wage distribution, rather than the
bottom quintile.
within regions, it could affect establishment behavior and, in particular, HR practices. Hence, our concentration measures are establishment as opposed to firm-based.
16
The measures related to promotion, hiring, and the pattern of wage setting that are created
have been identified as key aspects of ILMs (Lazear and Oyer, 2004). The ILM concept
encapsulates a set of human resource practices that are highly correlated and provides a useful
construct in which to frame the analysis. Promotion practices are measured in two ways. The
proportion of workers hired into the second quintile that move to a higher quintile in five years
are calculated along with the wage growth of workers starting in the second quintile over the
five-year time span. Worker hiring patterns are captured by the churning rates5 of all full-quarter
workers in the establishment as well as by the proportion of accessions in the fifth and fourth
earnings quintile within the firm. The pattern of wage setting is captured by the mean and
standard deviation of log real earnings for full quarter workers in the firm, as well as by
measures of earnings dispersion for full quarter workers.
A simple analysis of the correlation of these measures across establishment reveals that
the measures (with the exception of worker wage growth) are substantially correlated with each
other. The major research question this paper addresses is whether the advent of mass
merchandisers affected human resource strategies in the retail food industry. This issue leads us
to examine whether the multiple measures described above can be summarized into one variable
for all retail food firms in 1997 and 2002. Cluster analysis is employed to classify firms into one
of two groups, which for convenience we call ILM and non-ILM.
The clustering strategy uses non-hierarchical clustering based upon the median value of
the measures in each of the groups. The measures capture hiring, wage setting, and promotion
practices and include measures of worker churning, mean earnings, the standard deviation of
earnings, and the ratio of flow to full quarter workers. The clustering is done on pooled 1997
and 2002 data. The data are first demeaned by year by comparing the values of these measures
5 Churning is defined as accessions plus separations minus net job flows divided by employment.
17
for the sample of firms in retail food to measures averaged over an economy-wide random
sample of firms and then standardized into an index.
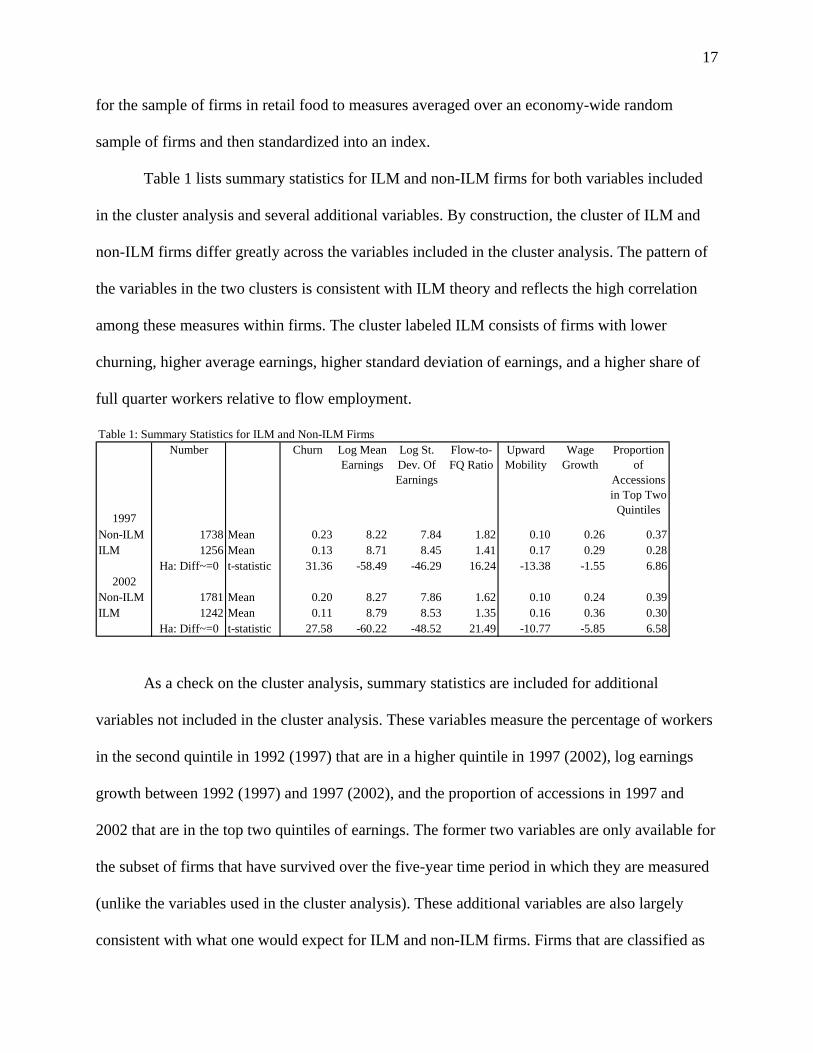
Table 1 lists summary statistics for ILM and non-ILM firms for both variables included
in the cluster analysis and several additional variables. By construction, the cluster of ILM and
non-ILM firms differ greatly across the variables included in the cluster analysis. The pattern of
the variables in the two clusters is consistent with ILM theory and reflects the high correlation
among these measures within firms. The cluster labeled ILM consists of firms with lower
churning, higher average earnings, higher standard deviation of earnings, and a higher share of
full quarter workers relative to flow employment.
Table 1: Summary Statistics for ILM and Non-ILM Firms
1997
Number Churn Log Mean Earnings
Log St. Dev. Of Earnings
Flow-to-FQ Ratio
Upward Mobility
Wage Growth
Proportion of
Accessions in Top Two
Quintiles
Non-ILM 1738 Mean 0.23 8.22 7.84 1.82 0.10 0.26 0.37ILM 1256 Mean 0.13 8.71 8.45 1.41 0.17 0.29 0.28
Ha: Diff~=0 t-statistic 31.36 -58.49 -46.29 16.24 -13.38 -1.55 6.862002
Non-ILM 1781 Mean 0.20 8.27 7.86 1.62 0.10 0.24 0.39ILM 1242 Mean 0.11 8.79 8.53 1.35 0.16 0.36 0.30
Ha: Diff~=0 t-statistic 27.58 -60.22 -48.52 21.49 -10.77 -5.85 6.58
As a check on the cluster analysis, summary statistics are included for additional
variables not included in the cluster analysis. These variables measure the percentage of workers
in the second quintile in 1992 (1997) that are in a higher quintile in 1997 (2002), log earnings
growth between 1992 (1997) and 1997 (2002), and the proportion of accessions in 1997 and
2002 that are in the top two quintiles of earnings. The former two variables are only available for
the subset of firms that have survived over the five-year time period in which they are measured
(unlike the variables used in the cluster analysis). These additional variables are also largely
consistent with what one would expect for ILM and non-ILM firms. Firms that are classified as
18
ILM based on the four clustering variables also promote a larger portion of their workers into
higher earnings quintiles, have stronger average within-firm earnings growth, and tend to
promote from within rather than hire outside the firm to fill higher-earning positions.
In order to validate the summary index, information from external industry sources is
incorporated in the analysis. The Food Industry Center conducts a Supermarket Panel, which is
an annual survey of a random sample of food retailers throughout the United States. Industry
experts used case study knowledge to choose several variables from the Supermarket Panel
Survey (described in the Appendix) to categorize the human resource practices of a subset of the
firms in the LEHD dataset. Each supermarket chain with sufficient observations was categorized
into having high, medium, or low HR practices based on the Supermarket Panel information.
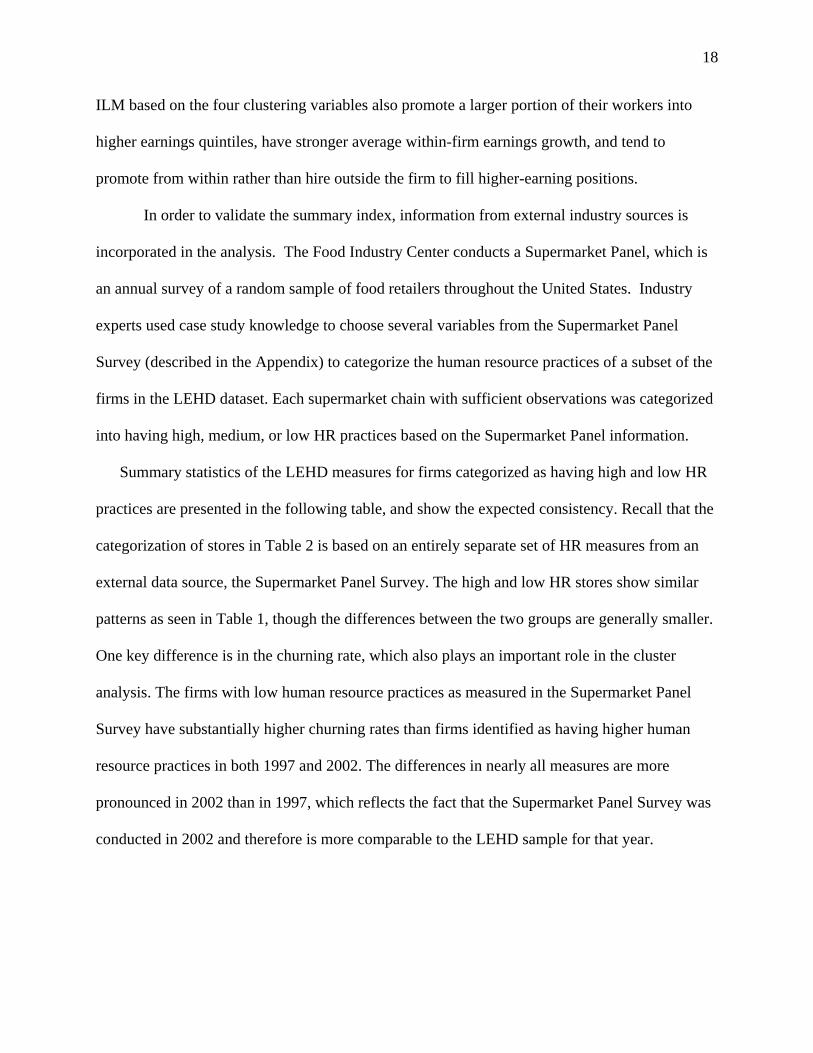
Summary statistics of the LEHD measures for firms categorized as having high and low HR
practices are presented in the following table, and show the expected consistency. Recall that the
categorization of stores in Table 2 is based on an entirely separate set of HR measures from an
external data source, the Supermarket Panel Survey. The high and low HR stores show similar
patterns as seen in Table 1, though the differences between the two groups are generally smaller.
One key difference is in the churning rate, which also plays an important role in the cluster
analysis. The firms with low human resource practices as measured in the Supermarket Panel
Survey have substantially higher churning rates than firms identified as having higher human
resource practices in both 1997 and 2002. The differences in nearly all measures are more
pronounced in 2002 than in 1997, which reflects the fact that the Supermarket Panel Survey was
conducted in 2002 and therefore is more comparable to the LEHD sample for that year.
19
Table 2: ILM Measures for High and Low HR Based on the Supermarket Panel
1997
Number Churn Log Mean Earnings
Log St. Dev. Of Earnings
Flow-to-FQ Ratio
Upward Mobility
Wage Growth
Proportion of
Accessions in Top Two
Quintiles
Low HR 82 Mean 0.18 8.50 8.23 1.58 0.12 0.38 0.30High HR 178 Mean 0.16 8.50 8.24 1.49 0.12 0.42 0.31
Ha: Diff~=0 t-statistic 1.64 -0.15 -0.10 2.08 0.31 -0.59 -0.432002
Low HR 82 Mean 0.14 8.50 8.28 1.36 0.24 0.32 0.26High HR 188 Mean 0.10 8.70 8.47 1.37 0.11 0.36 0.41
Ha: Diff~=0 t-statistic 5.39 -4.31 -3.79 -0.24 6.80 -0.72 -3.09
We conducted two additional consistency checks of our index. First, we corroborated
these comparisons by means of simple correlations and probit regressions. Second, we
compared the high and low rankings based on the Supermarket Panel categorization (medium
were ignored for this purpose) to the ranking of these stores based on the LEHD measures of
ILMs. In 2002, 77% of firms identified as having high HR practices based on the Supermarket
survey for that year were identified as being ILM firms using the cluster analysis. Close to 60%
of those firms marked as having low HR practices were designated as non-ILMs based on the
cluster analysis in 2002. These results increase our confidence that the LEHD measures of ILMs
are capturing important differences in store HR policies and practices.
4. Basic Facts
What do these new data reveal about the basic trends in product market competition and
human resource practices in retail food? There are essentially three ways in which human
resource (HR) practices can adjust in a labor market. Continuing firms can adjust their personnel
practices, new firms with a different set of HR practices can replace old firms, or firms with one
set of HR practices can expand faster than do firms with another set. We use the measures
developed above to first describe basic trends and then examine each of these possibilities.
4.1 Trends in Competition and Concentration
20
As in much of the retail industry, growth in employment and establishments in retail food
has been largely driven by expansion among multi-unit firms. Rising competition from non-
traditional food retailers, though, has presented new challenges to even the larger grocery chains.
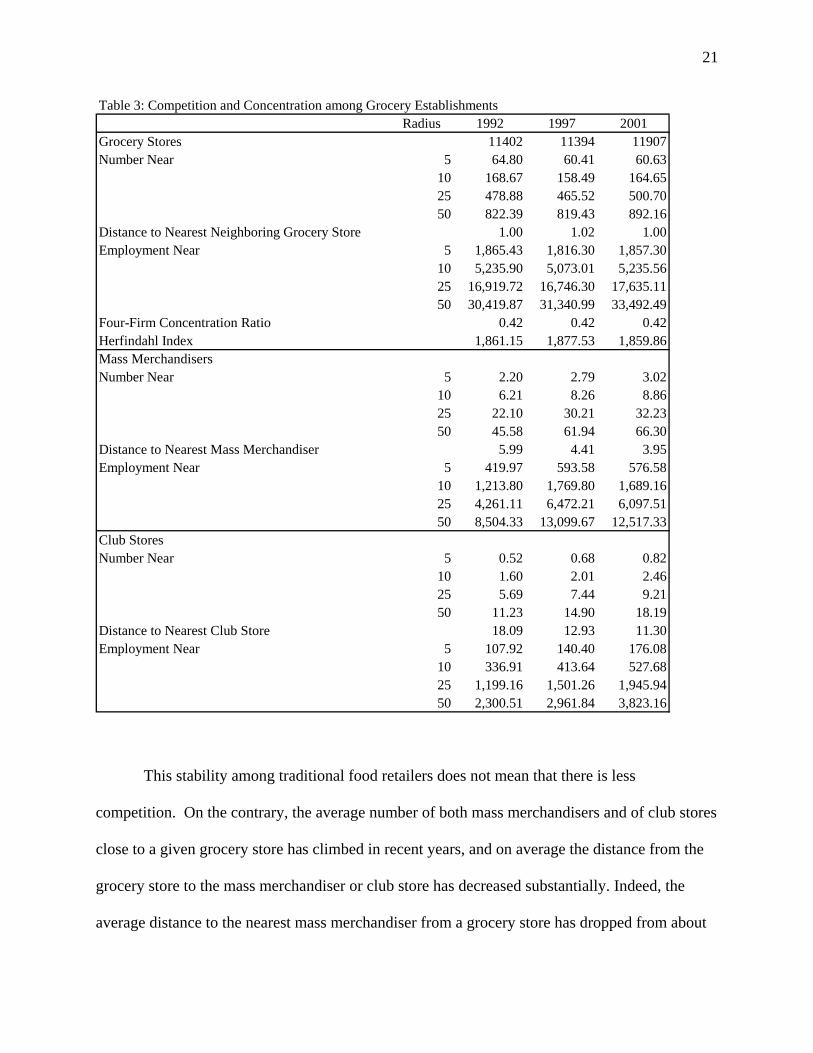
As the descriptive statistics in Table 3 reveal, the average number of grocery establishments
located within a five, ten, or even a fifty mile radius of a given grocery store has remained
roughly constant over the past decade even in the face of steady consolidation in the food
retailing industry. The average four-firm concentration ratio, which here is measured at the
establishment level and excludes own-establishment sales, has remained remarkably stable, as
has the Herfindahl index. Average local concentration ratios measured at the firm level in the
grocery store industry have, meanwhile, been inching higher over time in our seven-state sample.
21
Table 3: Competition and Concentration among Grocery EstablishmentsRadius 1992 1997 2001
Grocery Stores 11402 11394 11907Number Near 5 64.80 60.41 60.63
10 168.67 158.49 164.6525 478.88 465.52 500.7050 822.39 819.43 892.16
Distance to Nearest Neighboring Grocery Store 1.00 1.02 1.00Employment Near 5 1,865.43 1,816.30 1,857.30
10 5,235.90 5,073.01 5,235.5625 16,919.72 16,746.30 17,635.1150 30,419.87 31,340.99 33,492.49
Four-Firm Concentration Ratio 0.42 0.42 0.42Herfindahl Index 1,861.15 1,877.53 1,859.86Mass MerchandisersNumber Near 5 2.20 2.79 3
10 6.21 8.26 8.8625 22.10 30.21 32.2350 45.58 61.94 66.30
Distance to Nearest Mass Merchandiser 5.99 4.41 3.95Employment Near 5 419.97 593.58 576.58
10 1,213.80 1,769.80 1,689.1625 4,261.11 6,472.21 6,097.5150 8,504.33 13,099.67 12,517.33
Club StoresNumber Near 5 0.52 0.68 0
10 1.60 2.01 2.4625 5.69 7.44 9.2150 11.23 14.90 18.19
Distance to Nearest Club Store 18.09 12.93 11.30Employment Near 5 107.92 140.40 176.08
10 336.91 413.64 527.6825 1,199.16 1,501.26 1,945.9450 2,300.51 2,961.84 3,823.16
.02
.82
This stability among traditional food retailers does not mean that there is less
competition. On the contrary, the average number of both mass merchandisers and of club stores
close to a given grocery store has climbed in recent years, and on average the distance from the
grocery store to the mass merchandiser or club store has decreased substantially. Indeed, the
average distance to the nearest mass merchandiser from a grocery store has dropped from about
22
six miles in 1992 to fewer than four miles in 2001. Other measures reinforce these findings. The
share of grocery stores facing no immediate competition from mass merchandisers (i.e. there
were no mass merchandisers within five miles of the grocery establishment)) has dropped from
about one-fourth to roughly one-sixth over the past decade. The share of grocery stores facing
five or more has climbed from one in ten to over one in five.
4.2 Trends in Human Resource Practices
When we examine establishment level data, it is clear that individual establishments in
the retail food industry do not appear to be adjusting human resource practices notwithstanding
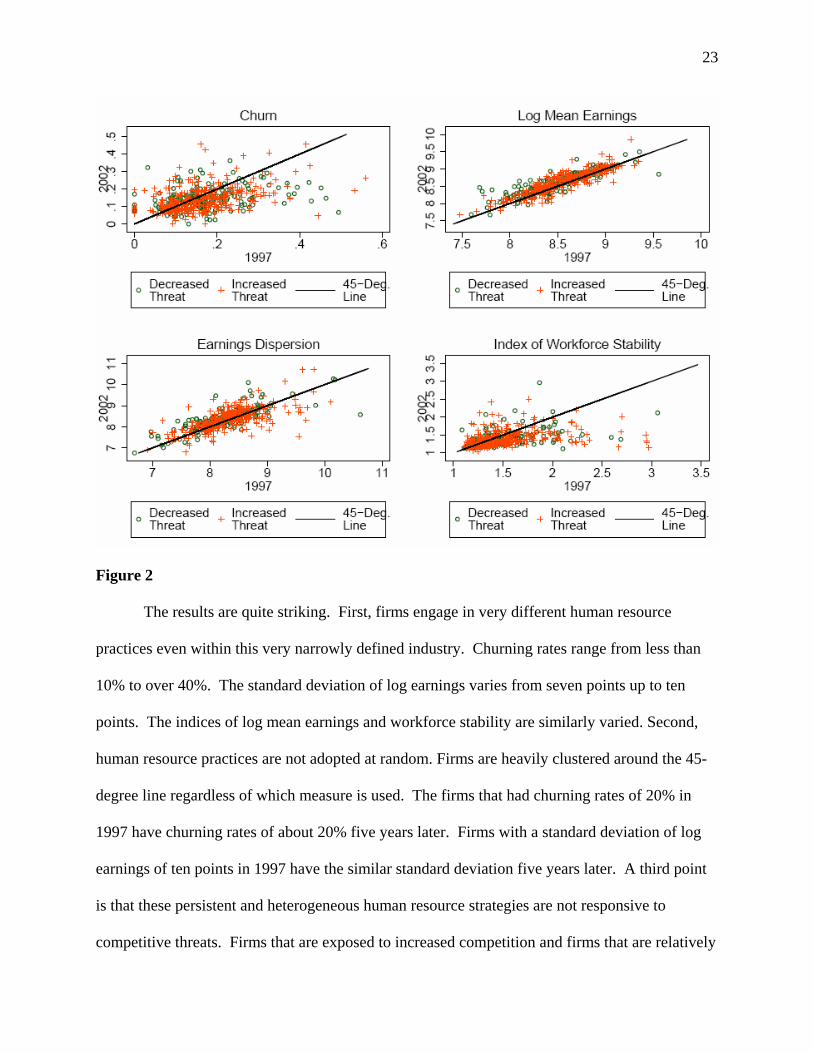
changes in the external environment. In order to examine the relationship graphically, we
created a dummy variable coded “1” if there was an increase in the number of mass
merchandisers within five miles of a given establishment between 1997 and 2001, and coded “0”
if the number declined (establishments for which the number of mass merchandisers nearby did
not change were not considered). The four sets of 1997 establishment level statistics – the
churning rate, mean earnings, earnings dispersion, and workforce stability – that were used in
creating the summary ILM measure were plotted against the same measures for the same
establishment in 2002. Firms in markets that face a mounting competitive threat are denoted with
a “+” while those facing a declining competitive threat with a “0”. The reference point 45-
degree line represents firms that did not change any practices at all over the period.
23
Figure 2
The results are quite striking. First, firms engage in very different human resource
practices even within this very narrowly defined industry. Churning rates range from less than
10% to over 40%. The standard deviation of log earnings varies from seven points up to ten
points. The indices of log mean earnings and workforce stability are similarly varied. Second,
human resource practices are not adopted at random. Firms are heavily clustered around the 45-
degree line regardless of which measure is used. The firms that had churning rates of 20% in
1997 have churning rates of about 20% five years later. Firms with a standard deviation of log
earnings of ten points in 1997 have the similar standard deviation five years later. A third point
is that these persistent and heterogeneous human resource strategies are not responsive to
competitive threats. Firms that are exposed to increased competition and firms that are relatively
24
insulated from competition are equally likely to be either above or below the line. In sum, these
results suggest that continuing firms prefer to maintain existing human resource practices, and
they highlight the stability of human resource strategies in food retailing.
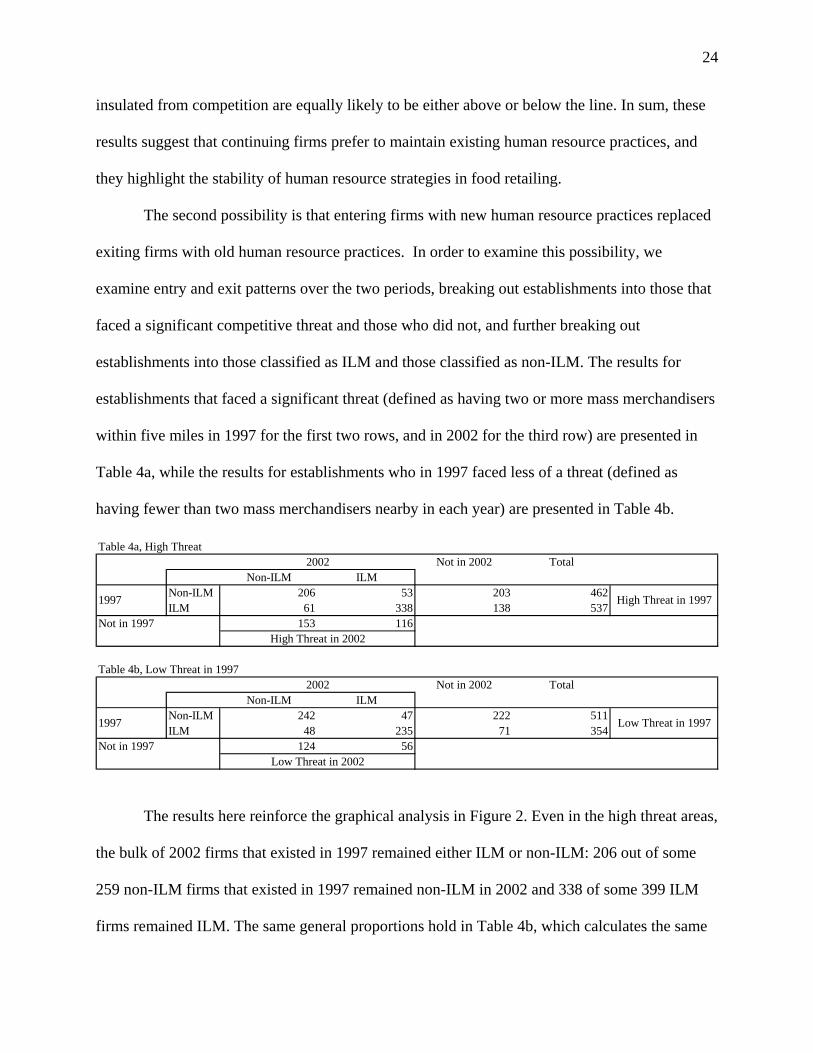
The second possibility is that entering firms with new human resource practices replaced
exiting firms with old human resource practices. In order to examine this possibility, we
examine entry and exit patterns over the two periods, breaking out establishments into those that
faced a significant competitive threat and those who did not, and further breaking out
establishments into those classified as ILM and those classified as non-ILM. The results for
establishments that faced a significant threat (defined as having two or more mass merchandisers
within five miles in 1997 for the first two rows, and in 2002 for the third row) are presented in
Table 4a, while the results for establishments who in 1997 faced less of a threat (defined as
having fewer than two mass merchandisers nearby in each year) are presented in Table 4b.
Table 4a, High ThreatNot in 2002 Total
Non-ILM ILMNon-ILM 206 53 203 462ILM 61 338 138 537
Not in 1997 153 116
Table 4b, Low Threat in 1997Not in 2002 Total
Non-ILM ILMNon-ILM 242 47 222 511ILM 48 235 71 354
Not in 1997 124 56
High Threat in 1997
High Threat in 2002
2002
Low Threat in 2002
Low Threat in 19971997
1997
2002
The results here reinforce the graphical analysis in Figure 2. Even in the high threat areas,
the bulk of 2002 firms that existed in 1997 remained either ILM or non-ILM: 206 out of some
259 non-ILM firms that existed in 1997 remained non-ILM in 2002 and 338 of some 399 ILM
firms remained ILM. The same general proportions hold in Table 4b, which calculates the same
25
transitions for low-threat areas. Any differential response appears to have occurred on the
entry/exit margin. In the high threat areas, 341 firms exited, of which 40% were ILM, and 269
entered, of which 43% were ILM. In the low threat areas, a lower percentage of exiting
establishments were ILM; of the 293 firms that exited in low threat areas between 1997 and
2002, only 24% were ILM. Meanwhile, of the 180 that entered in low threat areas, 31% were
ILM.
While both ILM and non-ILM firms are more likely to exit the industry than change
human resource practices, non-ILM firms pursue an exit rather than change strategy at a much
higher rate than ILM firms – and this is particularly true in high threat areas. In high threat
areas, non-ILM firms are more than four times more likely to exit than change while ILM firms
are just over twice as likely to record this outcome. In low threat areas, by contrast, non-ILM
firms are still more than four times likely to exit than change while ILM firms are 1.5 times as
likely to record this outcome. Given that an establishment does survive, the propensity to
maintain the same HR policy over time is about the same for both ILM firms and non-ILM firms
(near 80%).
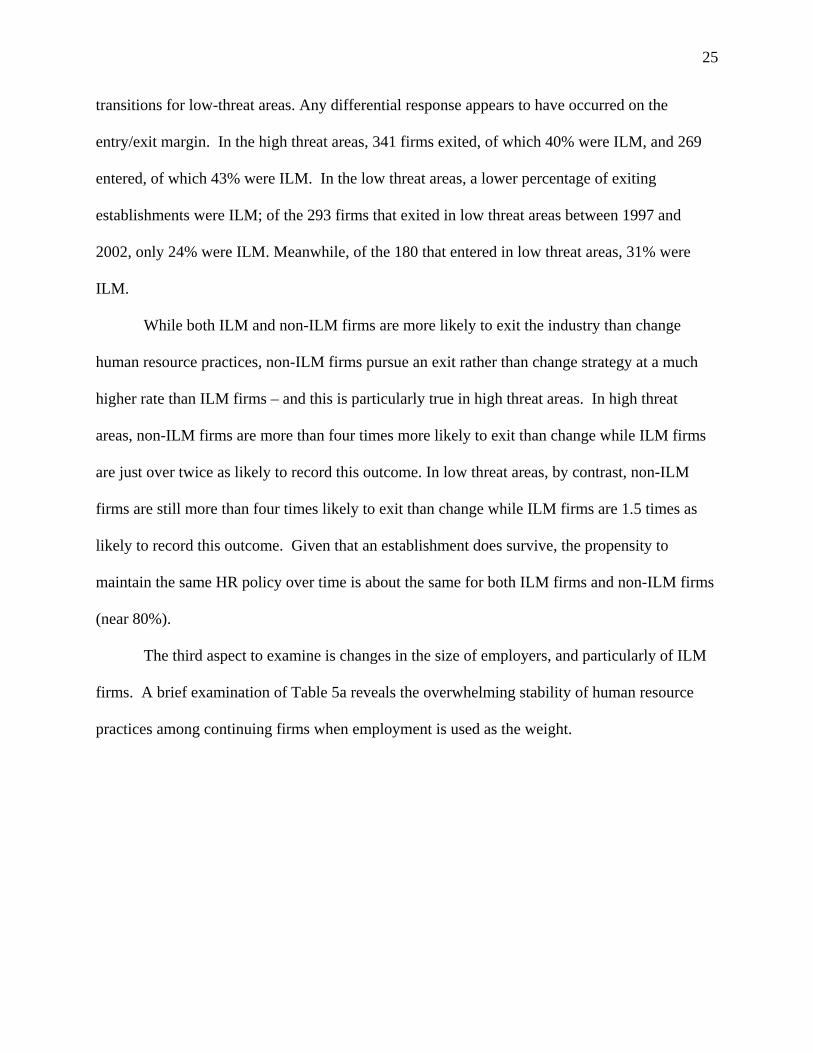
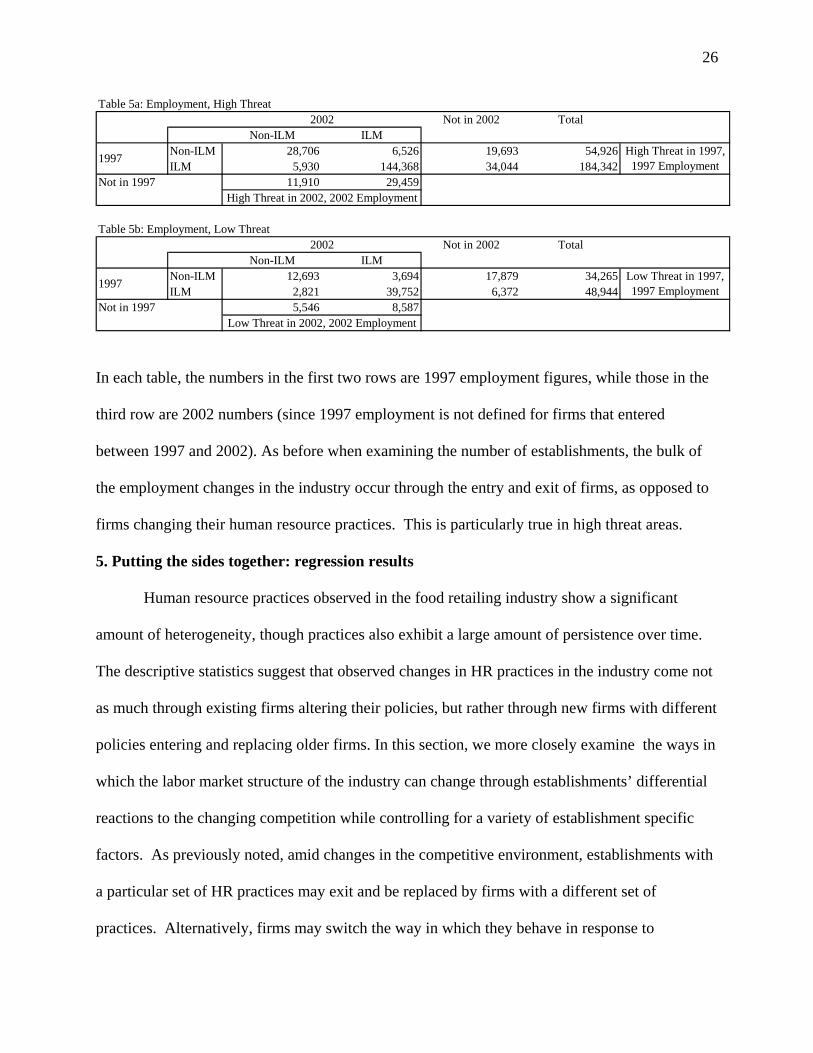
The third aspect to examine is changes in the size of employers, and particularly of ILM
firms. A brief examination of Table 5a reveals the overwhelming stability of human resource
practices among continuing firms when employment is used as the weight.
26
Table 5a: Employment, High ThreatNot in 2002 Total
Non-ILM ILMNon-ILM 28,706 6,526 19,693 54,926ILM 5,930 144,368 34,044 184,342
Not in 1997 11,910 29,459
Table 5b: Employment, Low ThreatNot in 2002 Total
Non-ILM ILMNon-ILM 12,693 3,694 17,879 34,265ILM 2,821 39,752 6,372 48,944
Not in 1997 5,546 8,587
Low Threat in 1997, 1997 Employment
High Threat in 1997, 1997 Employment
1997
1997
2002
2002
Low Threat in 2002, 2002 Employment
High Threat in 2002, 2002 Employment
In each table, the numbers in the first two rows are 1997 employment figures, while those in the
third row are 2002 numbers (since 1997 employment is not defined for firms that entered
between 1997 and 2002). As before when examining the number of establishments, the bulk of
the employment changes in the industry occur through the entry and exit of firms, as opposed to
firms changing their human resource practices. This is particularly true in high threat areas.
5. Putting the sides together: regression results
Human resource practices observed in the food retailing industry show a significant
amount of heterogeneity, though practices also exhibit a large amount of persistence over time.
The descriptive statistics suggest that observed changes in HR practices in the industry come not
as much through existing firms altering their policies, but rather through new firms with different
policies entering and replacing older firms. In this section, we more closely examine the ways in
which the labor market structure of the industry can change through establishments’ differential
reactions to the changing competition while controlling for a variety of establishment specific
factors. As previously noted, amid changes in the competitive environment, establishments with
a particular set of HR practices may exit and be replaced by firms with a different set of
practices. Alternatively, firms may switch the way in which they behave in response to
27
Table 6: Probits on the Likelihood of ExitMarginal Effects
(1) (2) (3) (4) (5) (6) (7)Number of Mass Merchandisers Nearby 0.0132 0.0043 0.0057 0.0074 0.0087 0.0095 0.0100
(0.0048)*** (0.0062) (0.0062) (0.0064) (0.0073) (0.0074) (0.0076)ILM -0.2080 -0.2586 -0.2594 -0.2559 -0.2544 -0.2624 -0.2172
(0.0214)*** (0.0306)*** (0.0307)*** (0.0309)*** (0.0311)*** (0.0346)*** (0.0365)***ILM * Number of Mass Merchandisers Nearby 0.0168 0.0169 0.0162 0.0155 0.0186 0.0166
(0.0090)* (0.0090)* (0.0091)* (0.0093)* (0.0094)** (0.0093)*Four-Firm Concentration Ratio 0.0792 0.0719 0.0675 0.0500 0.0465
(0.0449)* (0.0453) (0.0468) (0.0475) (0.0479)Log Per Capita Income -0.0637 -0.0532 -0.0531 -0.1161
(0.0565) (0.0630) (0.0646) (0.0680)*Log Population -0.0034 0.0044 0.0188
(0.0089) (0.0106) (0.0114)*No No No No No Yes Yes
Controls for State No No No No No No Yes
Observations 1864 1864 1864 1864 1864 1864 1864Standard errors in parentheses; Corrected marginal effects on interaction terms* significant at 10%; ** significant at 5%; *** significant at 1%
All Firms
Controls for Firm Size and Composition of Workforce with Respect to Sex, Age, Education, and Citizenship
competitive threats and devise a new set of human resource practices. The regressions in this
section are aimed at shedding more light on the degree to which threats affect establishment exit
and choice of HR practices. We examine the effect of changing competitive conditions on firm
entry and exit by means of a probit model for the probability that an establishment observed in
1997 exits by 2002. Information is available on the exit patterns of both ILM and non-ILM
establishments located in areas with varying degrees of competition from mass merchandisers.
The impacts of mass merchandisers on grocery store exit and the differential effect of mass
merchandisers on ILM versus non-ILM grocery store establishments can be identified.
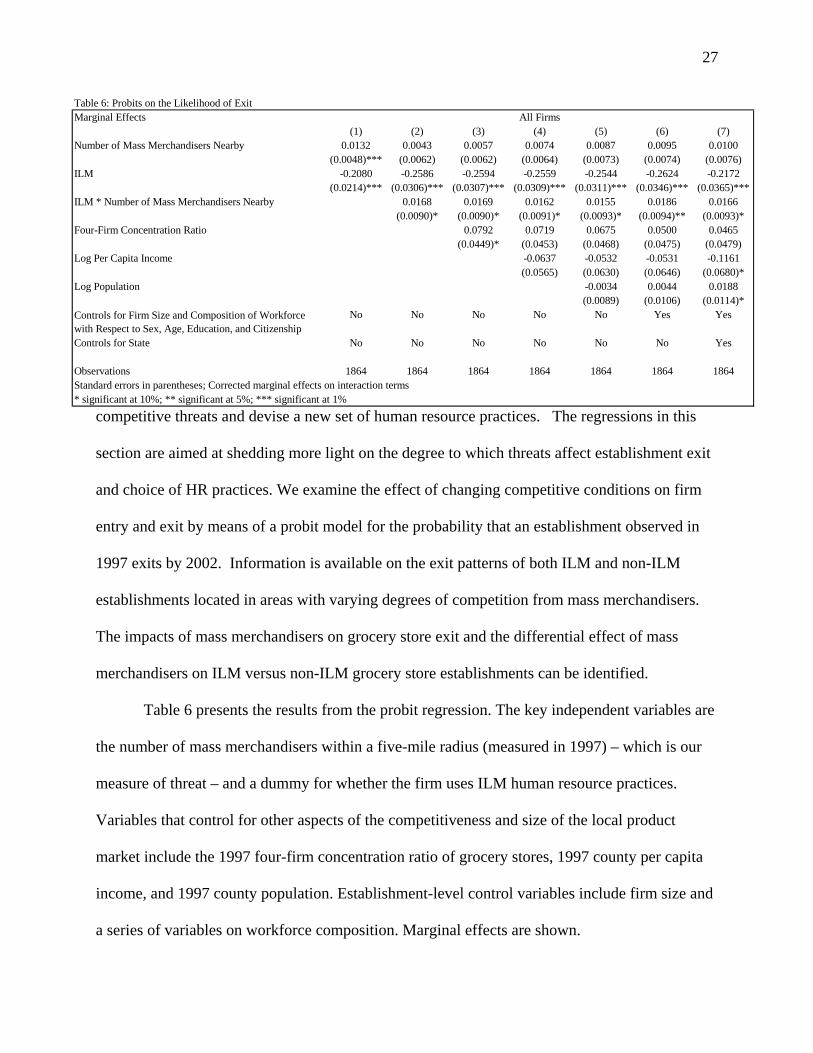
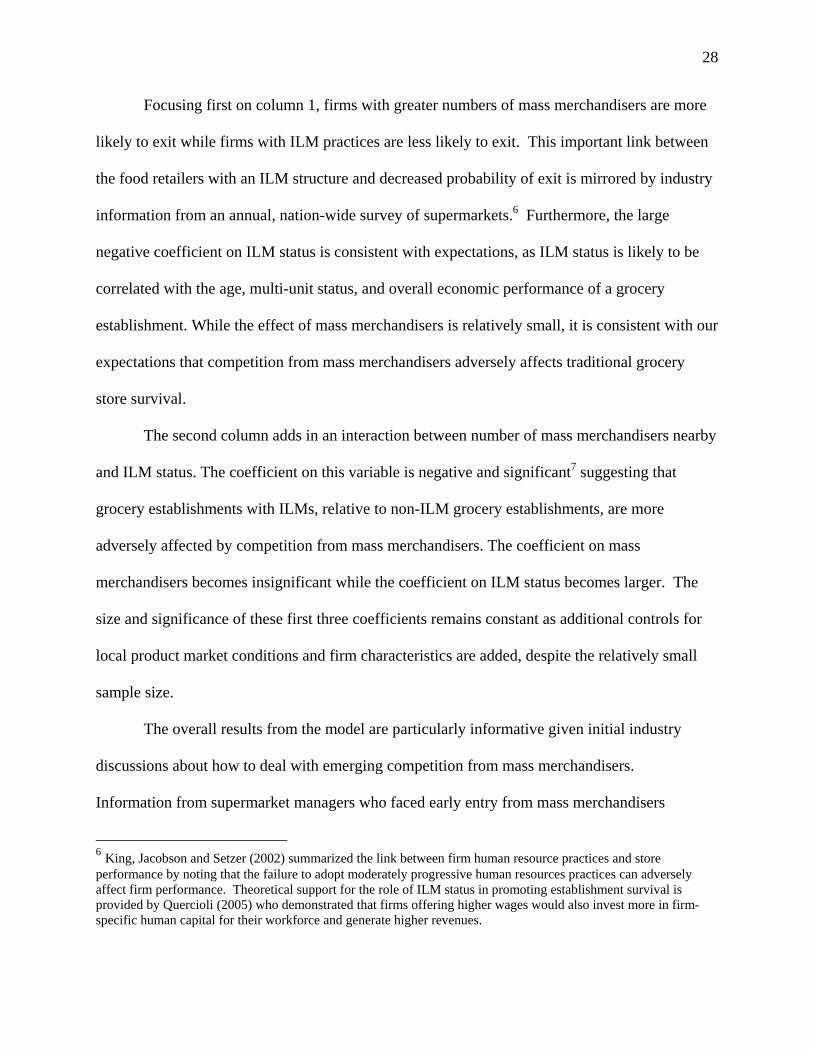
Table 6 presents the results from the probit regression. The key independent variables are
the number of mass merchandisers within a five-mile radius (measured in 1997) – which is our
measure of threat – and a dummy for whether the firm uses ILM human resource practices.
Variables that control for other aspects of the competitiveness and size of the local product
market include the 1997 four-firm concentration ratio of grocery stores, 1997 county per capita
income, and 1997 county population. Establishment-level control variables include firm size and
a series of variables on workforce composition. Marginal effects are shown.
28
Focusing first on column 1, firms with greater numbers of mass merchandisers are more
likely to exit while firms with ILM practices are less likely to exit. This important link between
the food retailers with an ILM structure and decreased probability of exit is mirrored by industry
information from an annual, nation-wide survey of supermarkets.6 Furthermore, the large
negative coefficient on ILM status is consistent with expectations, as ILM status is likely to be
correlated with the age, multi-unit status, and overall economic performance of a grocery
establishment. While the effect of mass merchandisers is relatively small, it is consistent with our
expectations that competition from mass merchandisers adversely affects traditional grocery
store survival.
The second column adds in an interaction between number of mass merchandisers nearby
and ILM status. The coefficient on this variable is negative and significant7 suggesting that
grocery establishments with ILMs, relative to non-ILM grocery establishments, are more
adversely affected by competition from mass merchandisers. The coefficient on mass
merchandisers becomes insignificant while the coefficient on ILM status becomes larger. The
size and significance of these first three coefficients remains constant as additional controls for
local product market conditions and firm characteristics are added, despite the relatively small
sample size.
The overall results from the model are particularly informative given initial industry
discussions about how to deal with emerging competition from mass merchandisers.
Information from supermarket managers who faced early entry from mass merchandisers
6 King, Jacobson and Setzer (2002) summarized the link between firm human resource practices and store performance by noting that the failure to adopt moderately progressive human resources practices can adversely affect firm performance. Theoretical support for the role of ILM status in promoting establishment survival is provided by Quercioli (2005) who demonstrated that firms offering higher wages would also invest more in firm-specific human capital for their workforce and generate higher revenues.
29
suggested a conservative strategy in adjusting labor practices. The Progressive Grocer (1993)
noted that grocers who are “doing battle with supercenters tend to rely on tried-and-true weapons
such as service and perishables.” Competitive tactics such as expanding service departments,
focusing on strong customer service, and putting more emphasis on the quality of perishables
were mentioned by store managers as the best methods for competing against mass
merchandisers and supercenters. These strategies rely on dedicated, long-term employees who
are familiar with the longtime customers and have a commitment to service and are most
effectively implemented with an ILM workforce.
The marginal effect of the interaction between the number of mass merchandisers nearby
and ILM status is on average two percentage points, regardless of the specification considered.
ILM establishments are less likely to exit overall but are more likely to exit in response to a large
threat from mass merchandisers than are non-ILM establishments, even after controlling for size
and workforce characteristics. The effect of club stores on the probability of exit was found to be
negligible in an alternative specification not included in the current version of the paper.
Membership club stores are fewer in number and typically sell fewer food items, and therefore
pose relatively little threat to traditional grocery stores in most markets. In contrast, mass
merchandisers favor a supercenter format that contains a full-line supermarket.
A second issue is to identify factors that influence changes in the internal labor structure
of food retailers, restricting attention to establishments who remain in business from 1997
through 2002. The first specification is restricted to food retailers identified as having an internal
labor market in 1997 and investigates switches from ILM to non-ILM status. Conversely, the
second specification is restricted to food retailers without an internal labor market in 1997 and
7 Table 6 reports the results including the Ai-Norton (2003) correction for the standard errors on interaction terms. This substantially increased the estimates of the standard errors relative to standard STATA output.
30
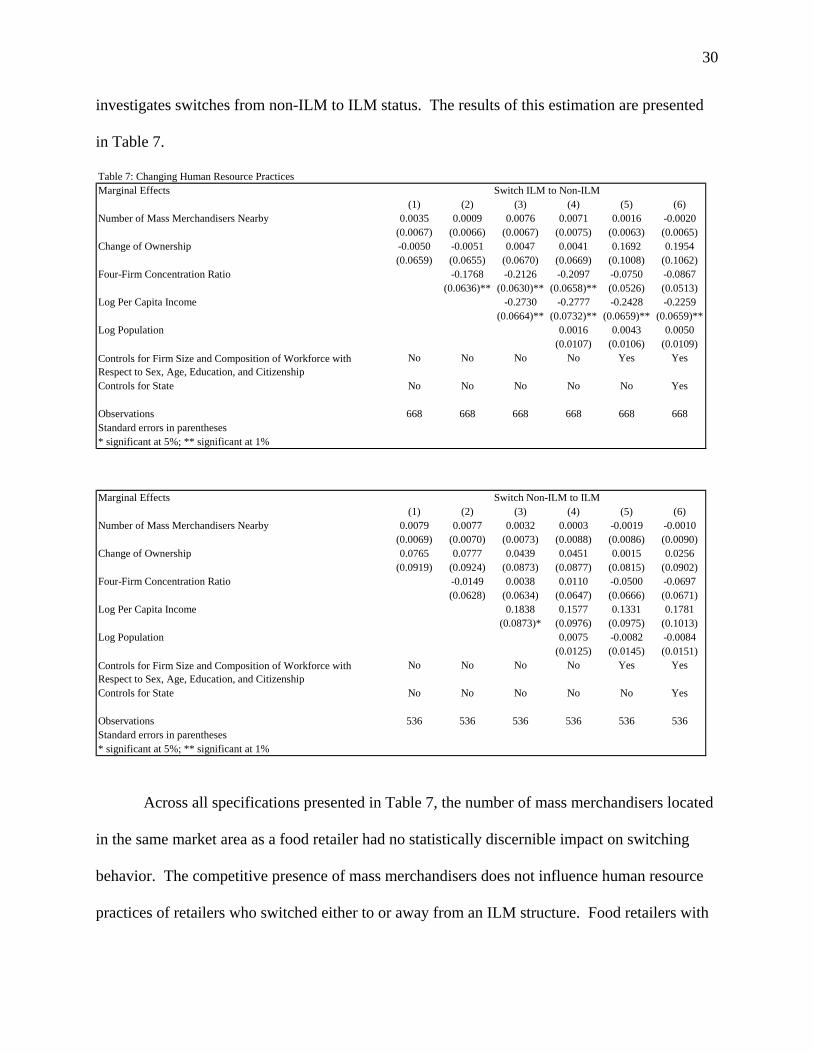
investigates switches from non-ILM to ILM status. The results of this estimation are presented
in Table 7.
Table 7: Changing Human Resource PracticesMarginal Effects
(1) (2) (3) (4) (5) (6)Number of Mass Merchandisers Nearby 0.0035 0.0009 0.0076 0.0071 0.0016 -0.0020
(0.0067) (0.0066) (0.0067) (0.0075) (0.0063) (0.0065)Change of Ownership -0.0050 -0.0051 0.0047 0.0041 0.1692 0.1954
(0.0659) (0.0655) (0.0670) (0.0669) (0.1008) (0.1062)Four-Firm Concentration Ratio -0.1768 -0.2126 -0.2097 -0.0750 -0.0867
(0.0636)** (0.0630)** (0.0658)** (0.0526) (0.0513)Log Per Capita Income -0.2730 -0.2777 -0.2428 -0.2259
(0.0664)** (0.0732)** (0.0659)** (0.0659)**Log Population 0.0016 0.0043 0.0050
(0.0107) (0.0106) (0.0109)No No No No Yes Yes
Controls for State No No No No No Yes
Observations 668 668 668 668 668 668Standard errors in parentheses* significant at 5%; ** significant at 1%
Marginal Effects(1) (2) (3) (4) (5) (6)
Number of Mass Merchandisers Nearby 0.0079 0.0077 0.0032 0.0003 -0.0019 -0.0010(0.0069) (0.0070) (0.0073) (0.0088) (0.0086) (0.0090)
Change of Ownership 0.0765 0.0777 0.0439 0.0451 0.0015 0.0256(0.0919) (0.0924) (0.0873) (0.0877) (0.0815) (0.0902)
Four-Firm Concentration Ratio -0.0149 0.0038 0.0110 -0.0500 -0.0697(0.0628) (0.0634) (0.0647) (0.0666) (0.0671)
Log Per Capita Income 0.1838 0.1577 0.1331 0.1781(0.0873)* (0.0976) (0.0975) (0.1013)
Log Population 0.0075 -0.0082 -0.0084(0.0125) (0.0145) (0.0151)
No No No No Yes Yes
Controls for State No No No No No Yes
Observations 536 536 536 536 536 536Standard errors in parentheses* significant at 5%; ** significant at 1%
Controls for Firm Size and Composition of Workforce with Respect to Sex, Age, Education, and Citizenship
Switch ILM to Non-ILM
Switch Non-ILM to ILM
Controls for Firm Size and Composition of Workforce with Respect to Sex, Age, Education, and Citizenship
Across all specifications presented in Table 7, the number of mass merchandisers located
in the same market area as a food retailer had no statistically discernible impact on switching
behavior. The competitive presence of mass merchandisers does not influence human resource
practices of retailers who switched either to or away from an ILM structure. Food retailers with
31
an ILM structure were significantly less likely to switch to a non-ILM structure when operated in
a region with a high concentration ratio than if it operated in a region with a low concentration
ratio. A ten-percentage point increase in the CR-4 ratio is associated with a decrease in the
probability of switching from ILM to non-ILM status of about four percentage points. This
effect is apparent even when grocery store size is controlled for in the model, although the point
estimate is reduced and statistical significance is at the 10% significance level. This result
suggests that increases in the concentration ratio of grocery sales in a given region provide an
insulating factor for food retailers to retain high performance human resource practices. These
results are consistent with the model developed in section 3, which demonstrated that when
incumbent food retailing establishments face entry from firms which offer lower training values
for employees, the incumbent firms may switch from ILM to non-ILM status.
Brown and Medoff (2003) examine the factors influencing wages paid by established
firms, which is just one component of the ILM index for food retailers. Higher wages paid by
established firms are almost completely explained by observable worker characteristics. In a
sense these results provide a useful contrast to their findings. Even after controlling for
workforce characteristics, ILM status of food retailing establishments is influenced by local
market conditions.
The skill acquisition and training model does not yield clear predictions on the factors
that influence decisions of firms to switch to an ILM structure for their workforce. An
implication of the model is that firms who did not train prior to entry will not train in the post
entry regime. In a sense, the probit results for the switch from ILM to non-ILM status support
the implications of the theoretical model. We find that the switch to ILM status cannot be
explained by any of the factors that influence the switch away from ILM status. The switch
32
away from ILM and switch to ILM status are driven by different economic factors and a
common model specification does not fit these decisions.
6. Conclusions
Despite rapid changes in the competitive landscape of food retailing in recent years,
supermarkets and grocery stores do not appear to have made rapid adjustments in their human
resource policies. While we find evidence of considerable heterogeneity in human resource
practices across retail food establishments, these practices are quite persistent even in the face of
new external competition. Technology, changing consumer preferences, and competition from
non-traditional food retailers have led to major changes in supermarket operations, pricing and
supply chain strategies over the past decade. Yet, in terms of human resource practices, these
firms seem slow to respond to external forces. Our analysis of employer-employee matched data
supports the conclusions of case studies that find that, while human resources practices vary
among food retailers, these practices are quite persistent over time.
The margin of change in the industry appears to be through entry and exit.
Establishments with ILMs, which are likely to be larger, more established firms, appear to
respond differently to competition than those without ILMs. While ILM establishments as a
whole are less likely to exit, ILMs are more likely than non-ILM establishments to exit in areas
with increased competition from mass merchandisers. Neither group of stores seems to adjust
employment levels in response to mass merchandisers, suggesting that marginal changes do not
improve a store’s viability in the face of competition from non-traditional food retailers. The data
do not permit us to examine whether total employee hours change, which is another avenue of
potential adjustment. Further, the effect of competitive threats on changes in ILM status of
continuing firms is ambiguous.
33
In the future, we hope to augment the research here by exploring the mechanisms through
which mass merchandisers affect the exit probabilities of ILM firms and why this effect is not
found for non-ILM firms. By incorporating data from the 1997 and 2002 Retail Censuses, we
can examine the grocery sales of mass merchandisers as well as the sales of ILM and non-ILM
establishments. One hypothesis to explore is whether the product lines of ILM and non-ILM
grocery stores differ, and whether they differ within ILM category. Differences in pricing
strategies (everyday low pricing versus promotional pricing, for example), product lines, and
services may be help to explain the differential impact of mass merchandisers on traditional food
retailers.
34
Appendix 1: The Supermarket Panel Survey
We use the Supermarket Panel Survey to construct an HR practices index, which in turn
permits us to classify firms into categories based on their HR practices. The Supermarket Panel
Survey is conducted at the store level and typically completed by the store manager (King et al.
2002). In the survey, store managers are asked a number of questions covering various aspects of
business operation. To begin with, managers are asked to report the number of hours of training
in classroom settings or one-on-one supervision given to new hires in cashier positions and
elsewhere in the store during the first week and during the first 26 weeks of employment. The
survey also asks for the number of training hours in the past 12 months for key employees such
as the store manager, grocery department manager, and pricing coordinator. Stores in the 2002
survey varied considerably in the hours of training, particularly in the training provided to key
managerial employees.
The Supermarket Panel also contains information on total labor hours per week at each
store, with breakdowns for full-time hours and part-time labor hours. The proportion of labor
hours that are full-time is included as one component of the HR practices index. Data collected
from the Supermarket Panel describes the availability of incentive based and non-cash types of
compensation to store employees. There are nine indicators of such compensation in the survey,
including the issuance of annual bonuses, individual performance incentive pay, incentive pay
based on product or category performance, an employee stock ownership plan, individual health
insurance, family health insurance, disability insurance, a company funded pension plan, and a
401(k) plan. From the survey, we count the number of indicators that are typically part of the
compensation of both full-time personnel and part-time personnel. This is consistent with the
definition of an ILM in which benefits accrue to jobs and not individuals within the firm.
35
The impact of workforce quality and composition on retail performance can be measured
by the store’s use of full-time and part-time workers. Oi (1992) emphasized the reliance on part-
time workers as an indicator of the skill mix of the work force at a retailer. Increases in the ratio
of part-time to full-time employees are driven partly by larger store sizes and larger stores must
pay higher wages because their employees supply more work effort. Larger stores must hire
more clerks and these employees are more productive because they waste less time in waiting for
customers. Higher wages are paid to more productive employees, leading Oi (1992) to conclude
that productivity gains associated with sales volumes in food retailing are relatively greater for
part-time employees.
Store-level organizational factors, such as membership in a self-distributing chain and
unionization, are linked to the HR measure. An important organizational descriptor in the survey
indicates whether the store is wholesaler supplied or if the store is part of a self-distributing
group. Stores and distribution centers are under common ownership in self-distributing chains.
This facilitates coordination between these two segments of the retail supply chain and so may
yield productivity gains. Stores in self-distributing groups report a value added figure that is over
2.5 times higher than that from wholesaler supplied stores and sales per square foot measures
that are about 25% higher ($8.92 vs. $7.19). About 35% of the stores in the Supermarket Panel
are part of self-distributing chains. Self-distributing stores score higher on the HR index than
wholesaler supplied stores. Close to 50% of self-distributing stores are high HR establishments
while only 38% of wholesaler supplied stores pursue this strategy.
Unionization is another organizational factor that may affect productivity if having a
unionized workforce is associated with significant differences in worker skills and/or workforce
stability. A binary variable equal to one if at least 25% of the workforce is covered by a
36
collective bargaining agreement and zero otherwise is also included in the empirical model,
resulting in about 24% of the stores identified as unionized. Unionized stores register high
performance for the value added measure, with a dollar amount that is over twice as high as in
non-unionized stores. The HR measure is not closely associated with union status, as both the
index and the proportion of high HR stores are very similar across union and non-union stores.
Using these data from the 2002 Supermarket Panel, we created an index to measure the
presence of an internal labor market (ILM) for each store in the panel. The HR index is based on
five store level indicators: training hours for new hires in cashiers and other positions; hours of
training for store managers, grocery department managers, and scanning coordinators; the
proportion of full-time employees hired at the store; and two measures of the use of incentive-
based compensation and non-cash compensation at the store. These kinds of practices (more
training, more full-time employment, and more incentive-based compensation) suggest a human
resources environment emphasizing the development of firm-specific human capital and
designed to reduce turnover.
To create the index, each store was ranked as to whether it was above or below the mean
(calculated from the survey data) for each of the five measures. If the store was above the mean
on at least three of the measures, it was coded as a high HR store. About one-third of the stores
in the Supermarket Panel survey were ranked “high” according to this index. Using this index as
a guide, we then categorized major supermarket chains into three groups: those at the high end of
the HR scale, those at the low end, and those that exhibited a high range of variability from one
store location to another. While there was a degree of subjectivity in this categorization, use of
case study and industry knowledge helped to inform the process.
37
References
Acemoglu, Daron and Jorn-Steffen Pischke. “Why do Firms Train? Theory and Evidence,” Quarterly Journal of Economics. 113: 79-119. 1998.
Abowd, John, Julia Lane, and Ron Prevost. “Design and Conceptual Issues in Realizing Analytical Enhancements through Data Linkages of Employer and Employee Data.” Proceedings of the Federal Committee on Statistical Methodology. November 2000.
Ai, Chunrong and Edward C. Norton. “Interaction Terms in Logit and Probit Models.” Economics Letters. 80: 123-29. 2003.
Bailey, Thomas and Annette Bernhardt. “In Search of the High Road in a Low-Wage Service Industry.” Politics and Society. 25: 179-201. 1997.
Basker, Emek. “Job Creation or Destruction? Labor-Market Effects of Wal-Mart Expansion.” Review of Economics and Statistics. 87: forthcoming. 2005.
Belman, Dale and Paula B. Voos. “Changes in Union Wage Effects by Industry: A Fresh Look at the Evidence.” Industrial Relations. 43: 491-519. 2004.
Ben-Ner, Avner, Fanmin Kong, and Stacie Bosley. “Workplace Organization and Human Resource Practices: The Retail Food Industry.” St. Paul, MN: University of Minnesota, The Retail Food Industry Center. http://agecon.lib.umn.edu/cgi-bin/pdf_view.pl?paperid=2140&ftype=.pdf. 1999.
Brown, C. and J.L. Medoff. “Firm Ages and Wages” Journal of Labor Economics. 21: 677-697. 2003.
Fairris, D. “Internal Labor Markets and Worker Quits.” Industrial Relations. 43: 573-594. 2004. Foster, L., J. Haltiwanger, and C.J. Krizan. “The Link between Aggregate and Micro
Productivity Growth: Evidence from Retail Trade.” NBER Working Paper 9120. August 2002.
Garry, Michael. “Showdown! Standing up to Supercenters.” Progressive Grocer. 72: 44-50. Februrary 1993.
Groshen, Erica and David Levine. 1998. “The Rise and Decline (?) of U.S. Internal Labor Markets.” Federal Reserve Bank of New York, Research Paper Number 9819. July 1998.
Haltiwanger, John, Julia Lane, and James Spletzer. “Wage, Productivity and the Dynamic Interaction of Businesses and Workers.” NBER Working Paper No. 7994. November 2000.
Hughes, Katherine L. “Supermarket Employment: Good Jobs at Good Wages?” IEE Working Paper No. 11. April 1999.
Jarmin, Ronald.S. S.D. Klimek, and J. Miranda. “Firm Entry and Exit in the U.S. Retail Sector, 1977-1997.” Center for Economic Studies, U.S. Census Bureau. December 2001.
King, R.P., E.M. Jacobson, and J.M. Setzer. 2002. The 2002 Supermarket Panel: Annual Report. The Food Industry Center, Department of Applied Economics, University of Minnesota. http://agecon.lib.umn.edu/mn/tr02supa.pdf.
Lazear, Edward P., and Paul Oyer. “Internal and External Labor Markets: A Personnel Economics Approach.” Labour Economics. 11: 527-524. 2004.
National Grocers Association. Points of Impact, 2002-2003 Retail Operations Survey. http://www.nationalgrocers.org/nga.art/FinSur2003-Mar.PDF. 2003.
Owan, Hideo. “Promotion, Turnover, Earnings and Firm-sponsored Training,” Journal of Labor Economics. 22: 955-978. 2004.
38
Oi, W.Y. “Productivity in the Distributive Trades: the Shopper and the Economies of Massed Reserves.” Griliches, Z. (ed.), Output Measurement in the Service Sector. Chicago: University of Chicago Press. 1992.
Quercioli, E. “Training, Turnover, and Search.” International Economic Review. 46: 133-143. 2005.
Sieling, M., B. Friedman, and M. Dumas. “Labor Productivity in the Retail Trade Industry, 1987-99.” Monthly Labor Review. 3-14. December 2001.
Seth, Andrew and Geoffrey Randall. The Grocers: The Rise and Rise of the Supermarket Chains. Dover, NH: Kogan Page. 1999.
Stevens, David W. “Employment That Is Not Covered by State Unemployment.” LEHD Technical Paper No. TP-2002-16. January 2002.
Stevens, Margaret. “A Theoretical Model of On-the-job Training with Imperfect Competition,” Oxford Economic Papers. 46: 537-562. 1994.
Walsh, John P. Supermarkets Transformed: Understanding Organizational and Technological Innovations. New Brunswick, NJ: Rutgers UP. 1993.