Embed Size (px)
Citation preview
CERI Breakfast Overview
Allan Fogwill, President & CEO
Sept 19, 2018
COMPETITIVE ANALYSIS OF
CANADIAN LNG
Canadian Energy Research Institute Overview Founded in 1975, the Canadian Energy Research Institute (CERI) is an independent, registered charitable organization specializing in the analysis of energy economics and related environmental policy issues in the energy production, transportation, and consumption sectors. Our mission is to provide relevant, independent, and objective economic research of energy and environmental issues to benefit business, government, academia and the public. CERI publications include:
•Market specific studies •Geopolitical analyses •Commodity reports (crude oil, electricity and natural gas)
In addition, CERI hosts an annual Petrochemical Conference.
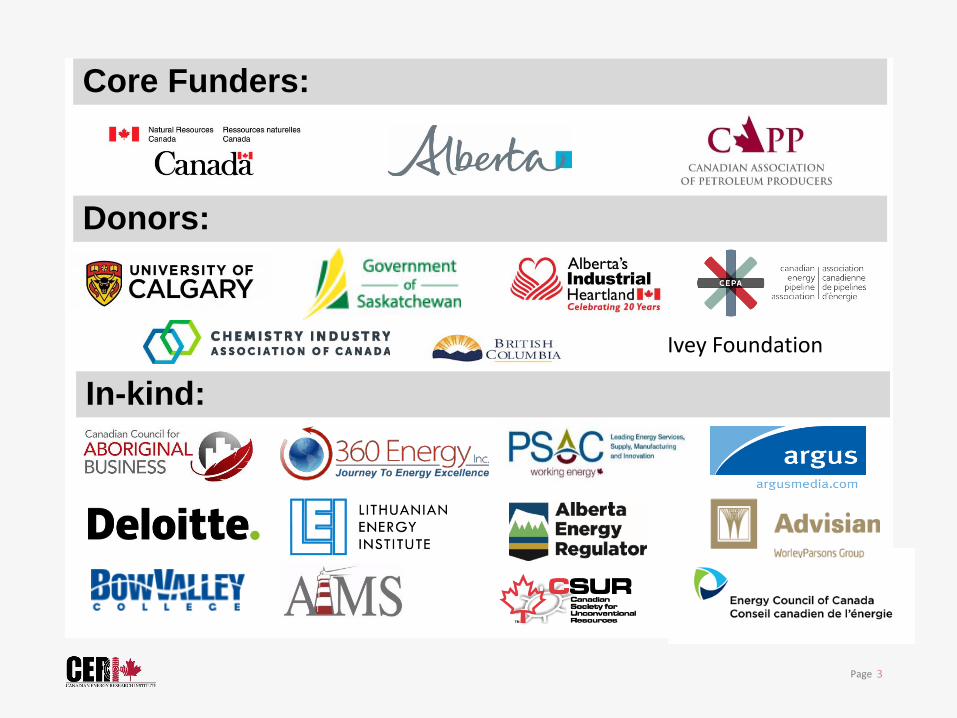
Core Funders:
Donors:
In-kind: Ivey Foundation
Presentation Outline Market Overview
Methodology and Assumptions
Supply Costs
Competitive Analysis
Conversion factor ------ 1 BCF/d = 7.6 MTPA
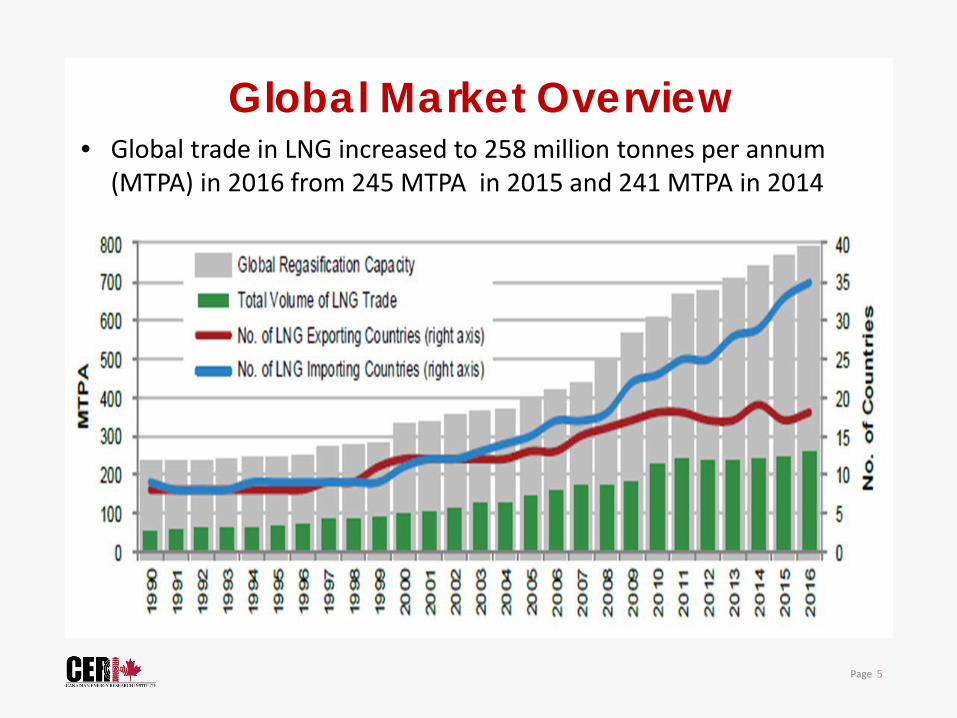
Global Market Overview • Global trade in LNG increased to 258 million tonnes per annum
(MTPA) in 2016 from 245 MTPA in 2015 and 241 MTPA in 2014
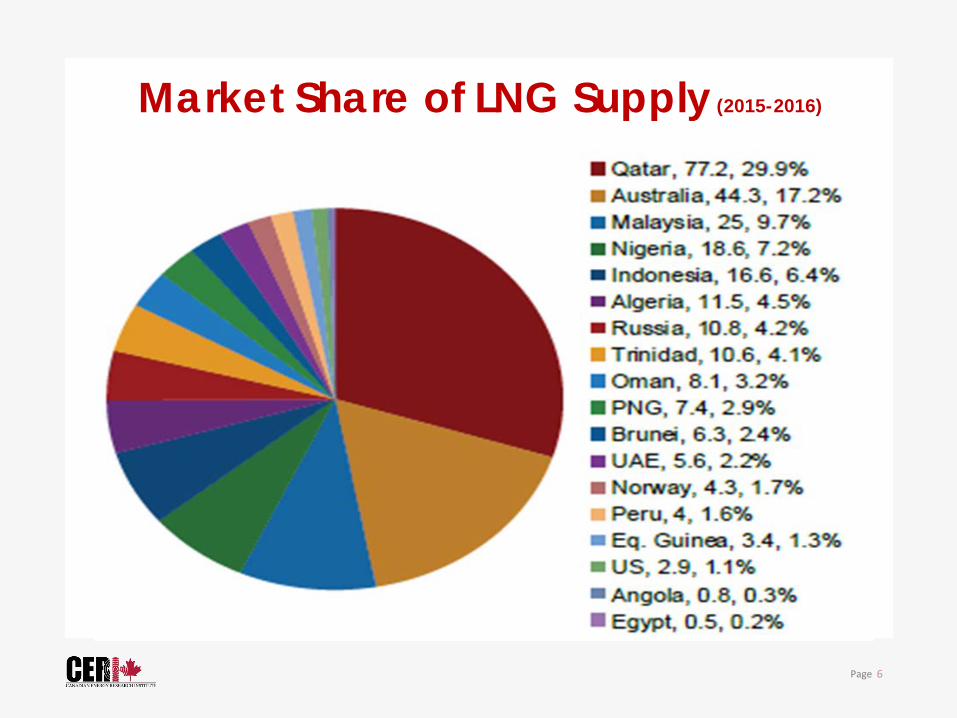
Market Share of LNG Supply (2015-2016)
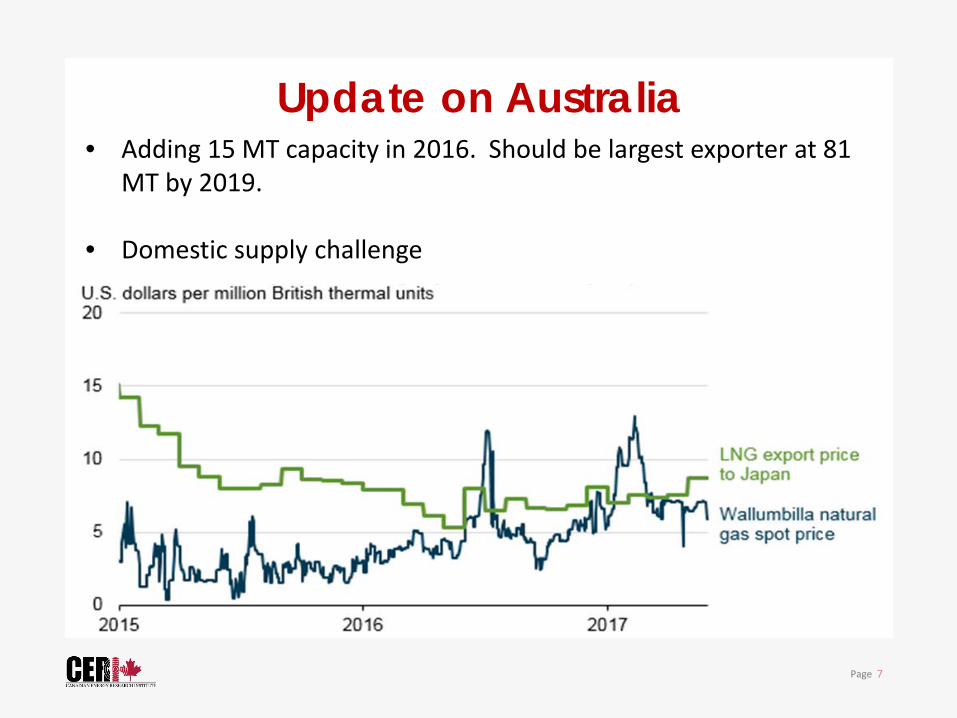
Update on Australia • Adding 15 MT capacity in 2016. Should be largest exporter at 81
MT by 2019.
• Domestic supply challenge
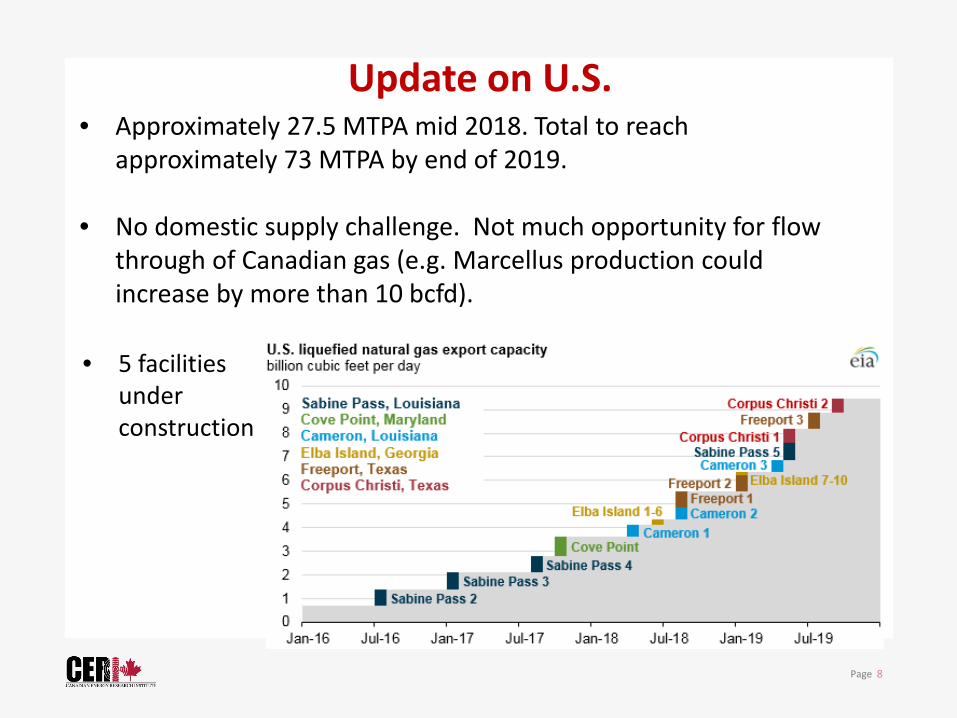
Update on U.S. • Approximately 27.5 MTPA mid 2018. Total to reach
approximately 73 MTPA by end of 2019.
• No domestic supply challenge. Not much opportunity for flow through of Canadian gas (e.g. Marcellus production could increase by more than 10 bcfd).
• 5 facilities under construction
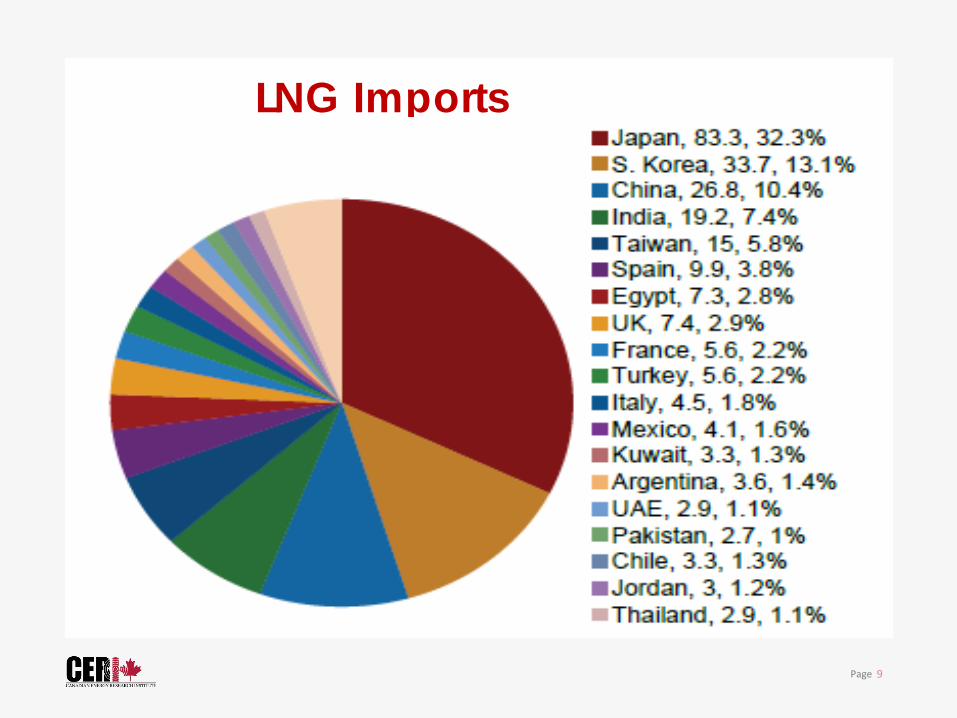
LNG Imports
Significant Trends 1. Increase in Demand from lower credit worthy customers
2. Increase in Natural Gas Supply from Unconventional Sources
3. Changes in the Business model (70/30)
• Fragmentation of projects
• Redirection of shipments and profit sharing
• Changes in reference pricing, time periods and use of tolling
4. Technological changes
• Offshore regasification
• Offshore liquefaction
5. Carbon Management – substitution of LNG for coal in electricity markets

Canadian Projects • 35 LNG export licenses issued
• 28 in BC • 3 in QC • 3 in NS • 1 in NB
• Key projects • Goldboro LNG NS – 5-10 MTPA, integrated, 2018 FID • Bearhead LNG NS – 8-12 MTPA, tolling, 2018 FID • Woodfibre LNG BC – 2 MTPA, merchant, active • LNG Canada BC – 13 - 26 MTPA, integrated, 2018 FID • Kitimat LNG BC – 10 MTPA, integrated, n/a
Methodology • Supply cost model – 6 projects in 5 jurisdictions (2 in CA,
1 in AU, 3 in the US)
• Cases: a) liquefaction added to regasification, b) another train added to an existing project and c) a greenfield project
• Feedstock costs - multiple supply basins
• Pipeline cost model – for projects lacking pipeline capacity (long distance mainly for CA and AU)
• Shipping cost model – includes distance, charter rates, cost of fuel and destination LNG spot price
• Sensitivity analysis
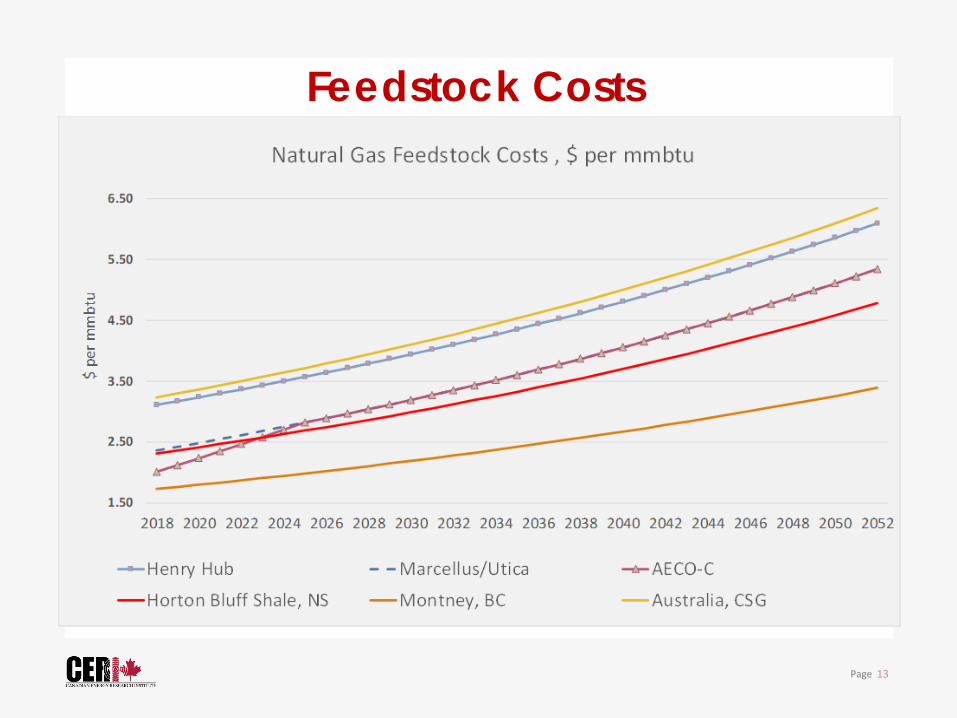
Feedstock Costs
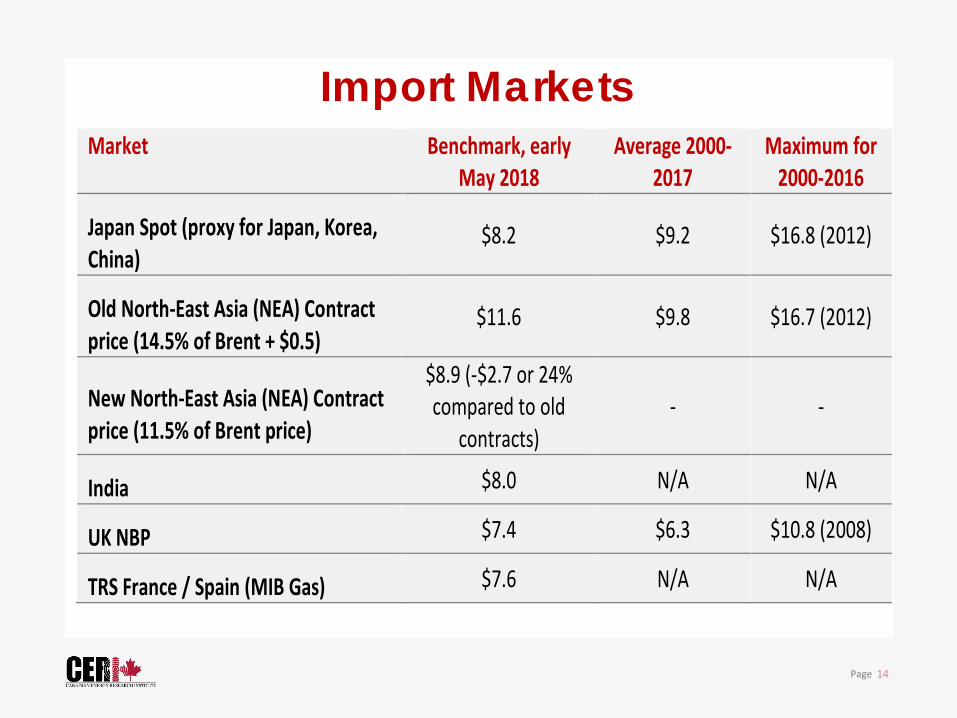
Import Markets Market Benchmark, early
May 2018 Average 2000-
2017 Maximum for
2000-2016
Japan Spot (proxy for Japan, Korea, China)
$8.2 $9.2 $16.8 (2012)
Old North-East Asia (NEA) Contract price (14.5% of Brent + $0.5)
$11.6 $9.8 $16.7 (2012)
New North-East Asia (NEA) Contract price (11.5% of Brent price)
$8.9 (-$2.7 or 24% compared to old
contracts) - -
India $8.0 N/A N/A
UK NBP $7.4 $6.3 $10.8 (2008)
TRS France / Spain (MIB Gas) $7.6 N/A N/A
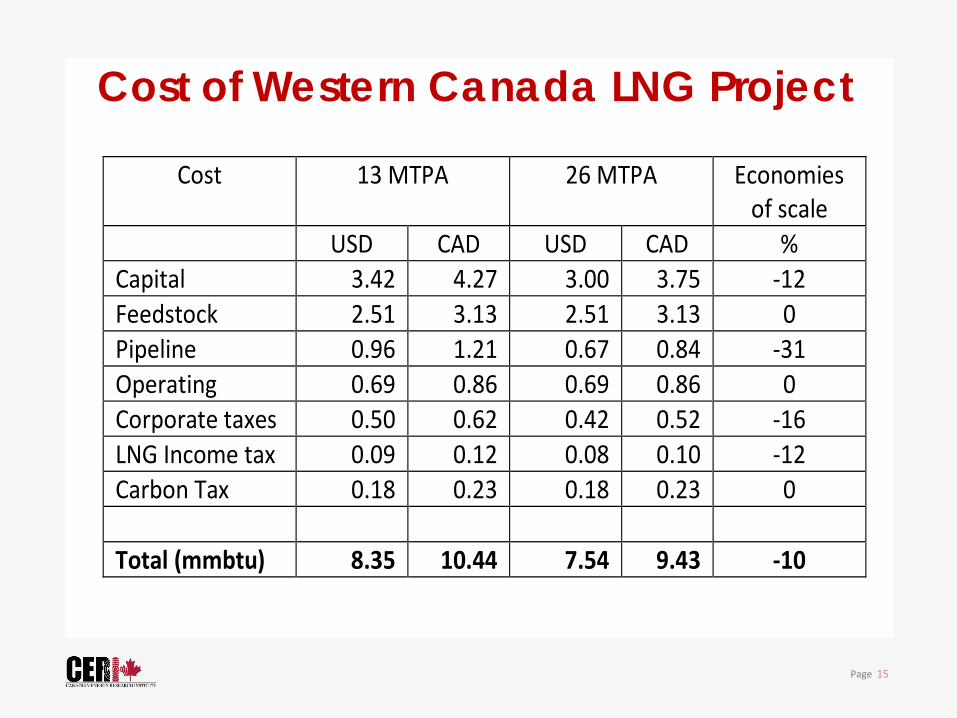
Cost of Western Canada LNG Project
Cost 13 MTPA 26 MTPA Economies of scale
USD CAD USD CAD % Capital 3.42 4.27 3.00 3.75 -12 Feedstock 2.51 3.13 2.51 3.13 0 Pipeline 0.96 1.21 0.67 0.84 -31 Operating 0.69 0.86 0.69 0.86 0 Corporate taxes 0.50 0.62 0.42 0.52 -16 LNG Income tax 0.09 0.12 0.08 0.10 -12 Carbon Tax 0.18 0.23 0.18 0.23 0 Total (mmbtu) 8.35 10.44 7.54 9.43 -10
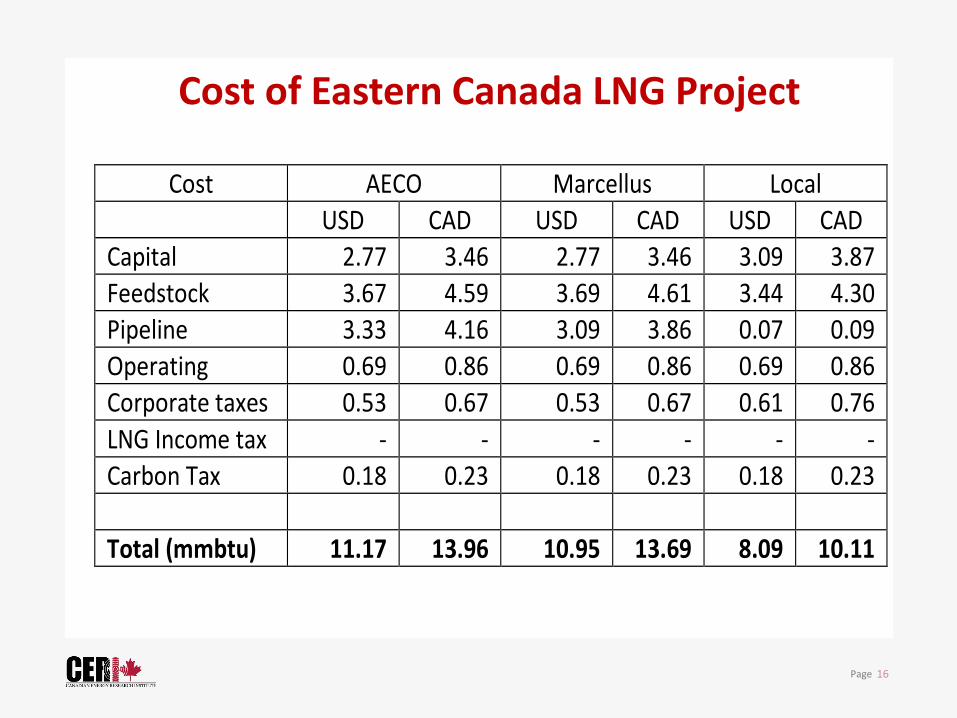
Cost of Eastern Canada LNG Project
Cost AECO Marcellus Local USD CAD USD CAD USD CAD
Capital 2.77 3.46 2.77 3.46 3.09 3.87 Feedstock 3.67 4.59 3.69 4.61 3.44 4.30 Pipeline 3.33 4.16 3.09 3.86 0.07 0.09 Operating 0.69 0.86 0.69 0.86 0.69 0.86 Corporate taxes 0.53 0.67 0.53 0.67 0.61 0.76 LNG Income tax - - - - - - Carbon Tax 0.18 0.23 0.18 0.23 0.18 0.23 Total (mmbtu) 11.17 13.96 10.95 13.69 8.09 10.11
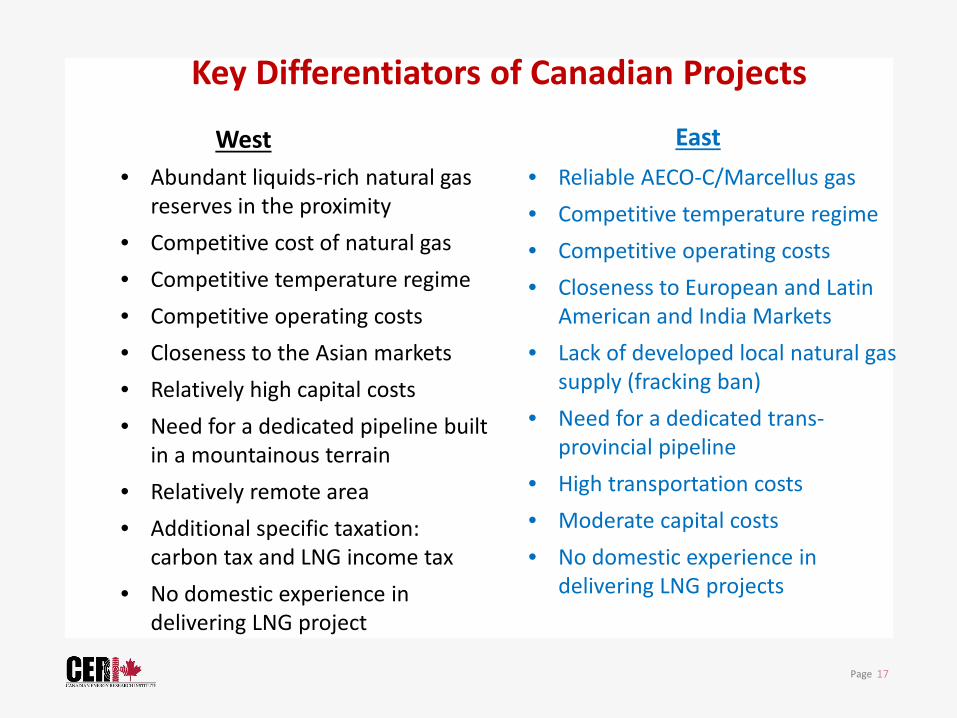
Key Differentiators of Canadian Projects
West East • Reliable AECO-C/Marcellus gas • Competitive temperature regime • Competitive operating costs • Closeness to European and Latin
American and India Markets • Lack of developed local natural gas
supply (fracking ban) • Need for a dedicated trans-
provincial pipeline • High transportation costs • Moderate capital costs • No domestic experience in
delivering LNG projects
• Abundant liquids-rich natural gas reserves in the proximity
• Competitive cost of natural gas • Competitive temperature regime • Competitive operating costs • Closeness to the Asian markets • Relatively high capital costs • Need for a dedicated pipeline built
in a mountainous terrain • Relatively remote area • Additional specific taxation:
carbon tax and LNG income tax • No domestic experience in
delivering LNG project
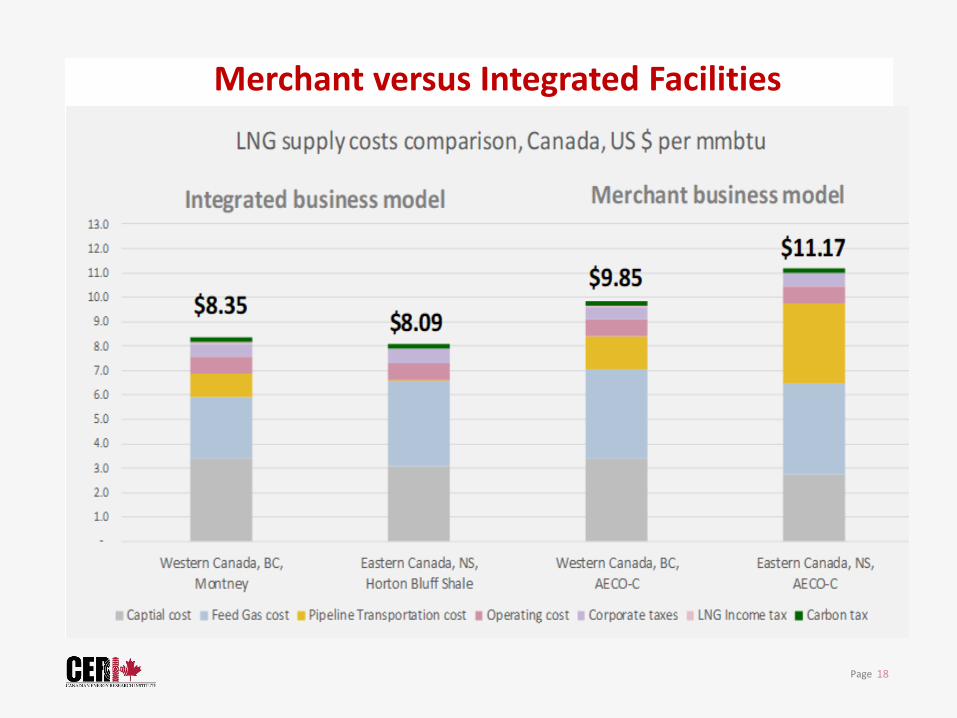
Merchant versus Integrated Facilities
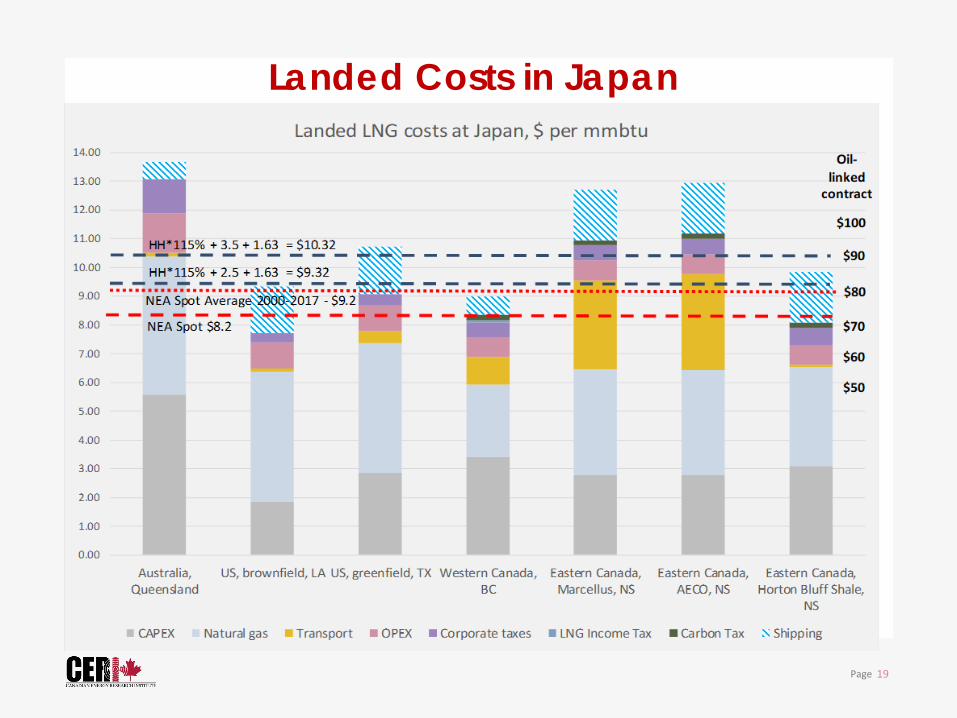
Landed Costs in Japan
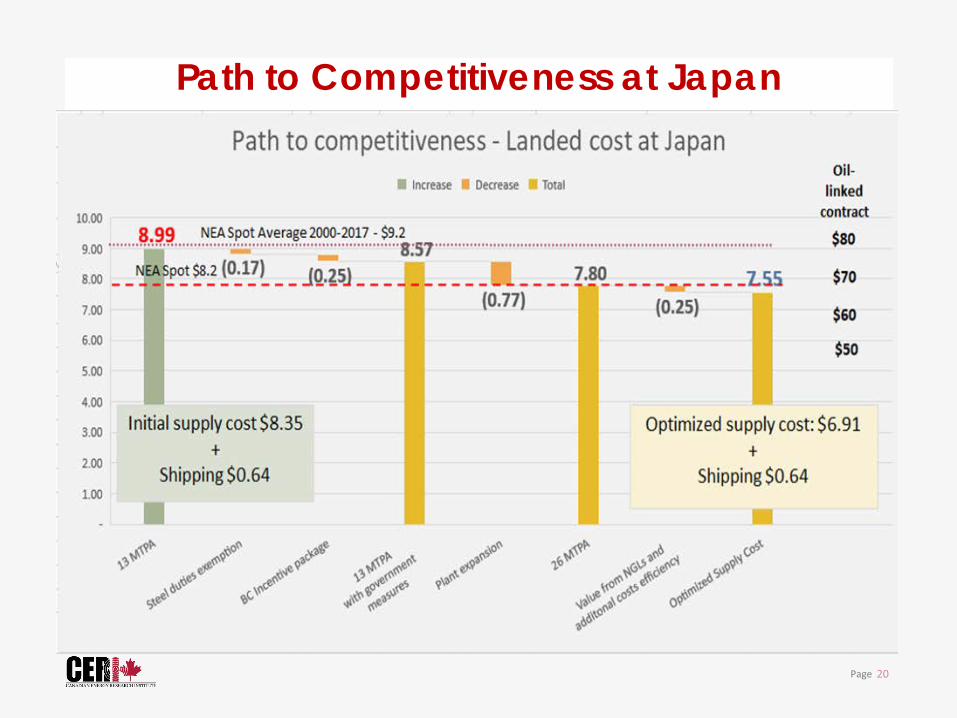
Path to Competitiveness at Japan
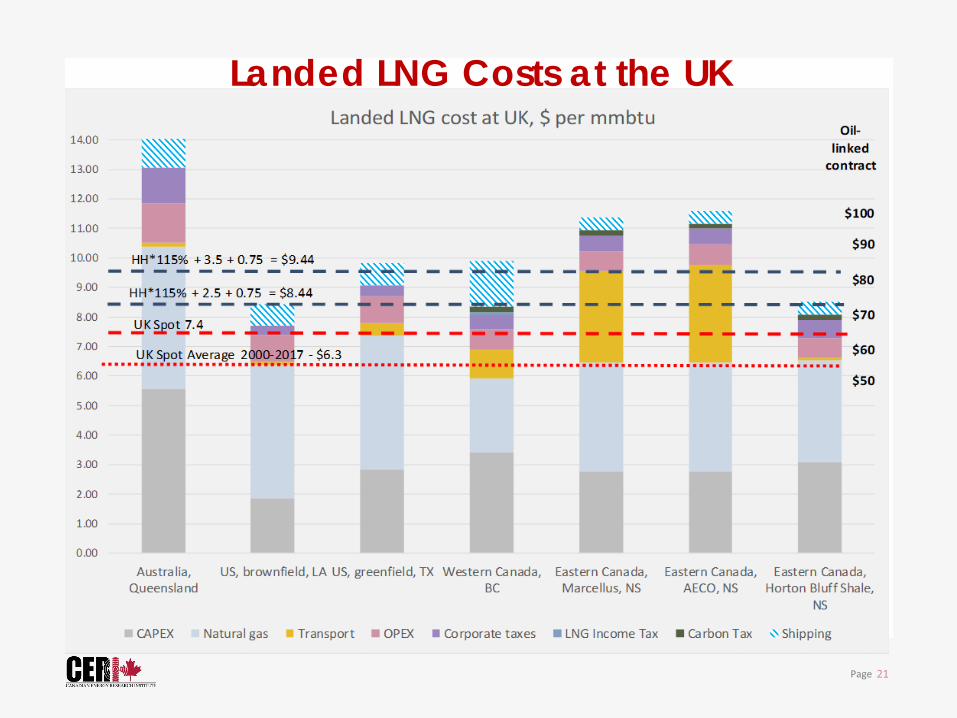
Landed LNG Costs at the UK
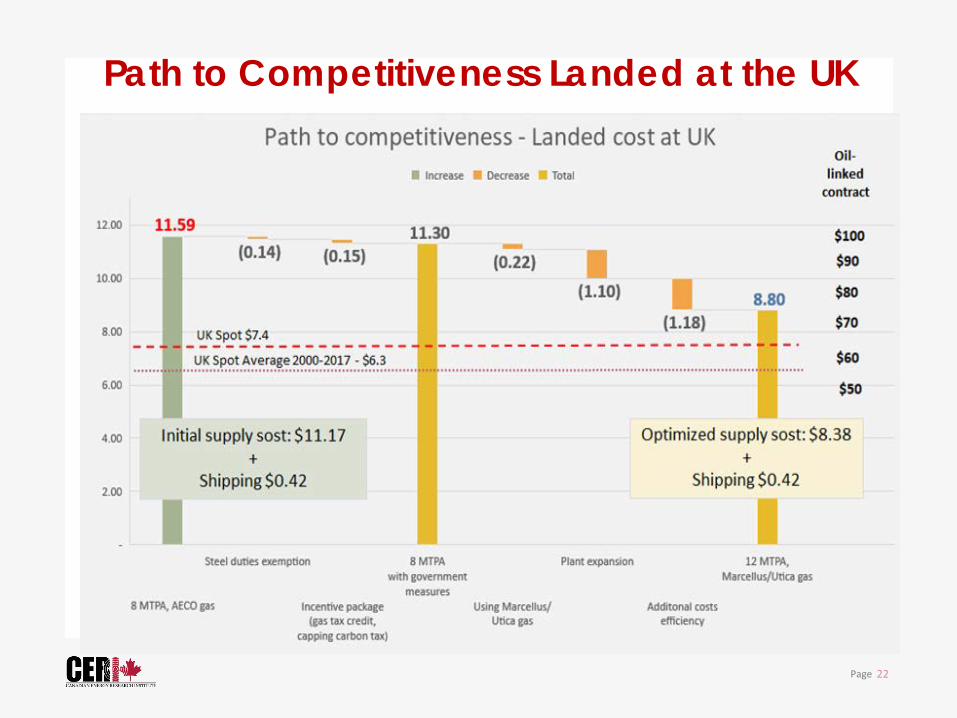
Path to Competitiveness Landed at the UK
Conclusion • Global trade is increasing faster than expectations –
mostly in Asia
• Domestic Competitiveness • Eastern integrated projects (if local gas was available)
slightly more competitive than western projects • Merchant projects in the west more competitive
mainly due to proximity to AECO • Incentives a factor in project FIDs (steel tariff
exemption, LNG tax exemption)
Conclusion - continued • Asian Markets
• CA projects more expensive than Japan spot • Western CA market more competitive than AU and US • Breakeven price is $8.99 in Japan • Oil price needed = $80
• European Markets • CA projects more expensive than UK spot • US projects more competitive than Eastern CA
projects • Breakeven price is $11.4 in the UK • Oil price needed = $100 • Market dynamic uncertainty = Gazprom
Thank You for Your Time WWW.CERI.CA
CANADIAN ENERGY RESEARCH INSTITUTE @CERI_CANADA
UPCOMING STUDIES: Natural Gas Liquids Market and Pricing Urban Energy Systems and Transportation Methane Emissions and Controls for the Natural Gas System