Embed Size (px)
Citation preview
Competitive AnAlysis of virginiA’s AviAtion industryJanuary 2012
Revised edition 1: FebRuaRy 10, 2012
AcknowledgementsThe Performance Management Group in the L. Douglas Wilder School of Government and Public Affairs at Virginia Commonwealth University would like to acknowledge the following for their advice and consultation:
Atlantic AirwaysDelegate Joe May, Virginia House of DelegatesLiberty UniversityNational Air and Space Museum Steven F. Udvar-Hazy CenterNational Association of State Aviation Officials (NASAO)National Business Aviation Association (NBAA)New Kent County AirportVirginia Aviation Board (VAB)Virginia Aviation Business Association (VABA)Virginia Airport Operators Council (VAOC)Virginia Airport Owners Association (VAOA)Virginia Department of Aviation (DOAV) Virginia Economic Development Partnership (VEDP)Virginia Helicopter Association (VHA)Virginia National Defense Industrial Authority (VNDIA)Virginia’s Region 2000 PartnershipWashington Airports Task Force (WATF)
This project could not have happened without the commitment of the excellent individuals who are members of the aforementioned groups. We all share a commitment to obtaining quality data to understand the present and to guide us as we look toward the future.
Note: The opinions stated in this report are those of the Performance Management Group and do not necessarily reflect those of all entities and individuals who contributed to the report.
Photo Credit: Front cover, pages 1, 5, 22, 32, 44, 45: Zhiela Ashtianipour, Performance Management Group (PMG) at Virginia Commonwealth University/Courtesy of the National Air and Space Museum Steven F. Udvar-Hazy CenterPages 7, 16, 17, 19, 21, 30, 39, 46, 47: Washington Airports Task ForcePages 37, 38: Liberty University School of AeronauticsPage 40, 41: iStockPhoto.com
Graphic Design by Zhiela Ashtianipour, Performance Management Group (PMG) at Virginia Commonwealth University

Competitive Analysis of Virginia’s Aviation Industry | 1
2 | January 2012
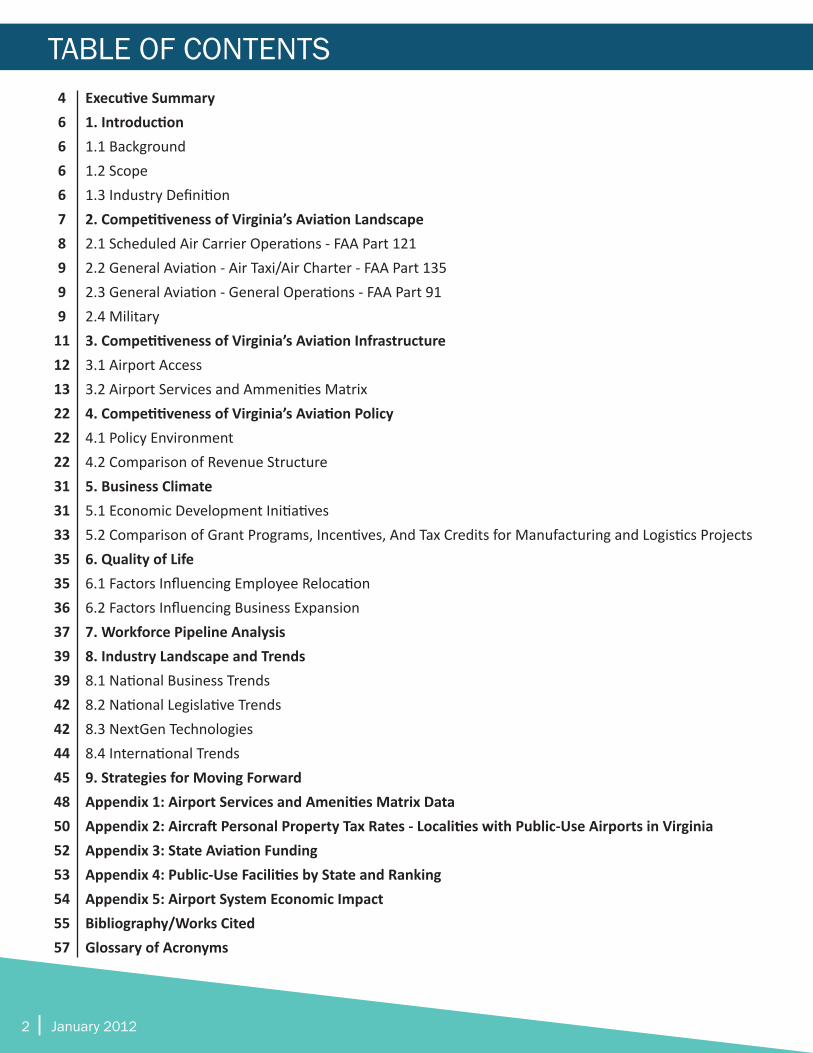
Executive Summary1. Introduction1.1 Background1.2 Scope1.3 Industry Definition2. Competitiveness of Virginia’s Aviation Landscape2.1 Scheduled Air Carrier Operations - FAA Part 1212.2 General Aviation - Air Taxi/Air Charter - FAA Part 1352.3 General Aviation - General Operations - FAA Part 912.4 Military3. Competitiveness of Virginia’s Aviation Infrastructure3.1 Airport Access3.2 Airport Services and Ammenities Matrix4. Competitiveness of Virginia’s Aviation Policy4.1 Policy Environment4.2 Comparison of Revenue Structure5. Business Climate5.1 Economic Development Initiatives5.2 Comparison of Grant Programs, Incentives, And Tax Credits for Manufacturing and Logistics Projects6. Quality of Life6.1 Factors Influencing Employee Relocation6.2 Factors Influencing Business Expansion7. Workforce Pipeline Analysis8. Industry Landscape and Trends8.1 National Business Trends8.2 National Legislative Trends8.3 NextGen Technologies8.4 International Trends9. Strategies for Moving ForwardAppendix 1: Airport Services and Amenities Matrix DataAppendix 2: Aircraft Personal Property Tax Rates - Localities with Public-Use Airports in VirginiaAppendix 3: State Aviation FundingAppendix 4: Public-Use Facilities by State and RankingAppendix 5: Airport System Economic ImpactBibliography/Works CitedGlossary of Acronyms
4666678999
1112132222223131333535363739394242444548505253545557
TABLE OF CONTENTS
Competitive Analysis of Virginia’s Aviation Industry | 3
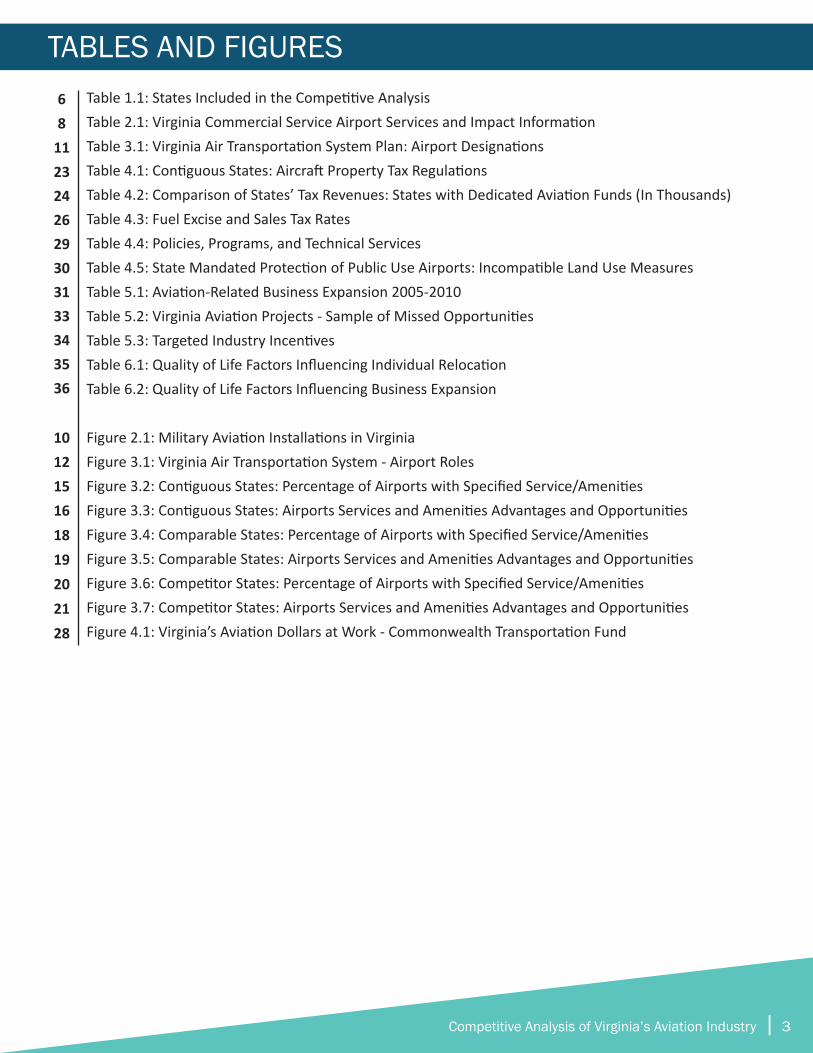
TABLES AND FIGURESTable 1.1: States Included in the Competitive AnalysisTable 2.1: Virginia Commercial Service Airport Services and Impact InformationTable 3.1: Virginia Air Transportation System Plan: Airport DesignationsTable 4.1: Contiguous States: Aircraft Property Tax RegulationsTable 4.2: Comparison of States’ Tax Revenues: States with Dedicated Aviation Funds (In Thousands)Table 4.3: Fuel Excise and Sales Tax RatesTable 4.4: Policies, Programs, and Technical ServicesTable 4.5: State Mandated Protection of Public Use Airports: Incompatible Land Use MeasuresTable 5.1: Aviation-Related Business Expansion 2005-2010Table 5.2: Virginia Aviation Projects - Sample of Missed OpportunitiesTable 5.3: Targeted Industry IncentivesTable 6.1: Quality of Life Factors Influencing Individual RelocationTable 6.2: Quality of Life Factors Influencing Business Expansion
Figure 2.1: Military Aviation Installations in VirginiaFigure 3.1: Virginia Air Transportation System - Airport RolesFigure 3.2: Contiguous States: Percentage of Airports with Specified Service/AmenitiesFigure 3.3: Contiguous States: Airports Services and Amenities Advantages and OpportunitiesFigure 3.4: Comparable States: Percentage of Airports with Specified Service/AmenitiesFigure 3.5: Comparable States: Airports Services and Amenities Advantages and OpportunitiesFigure 3.6: Competitor States: Percentage of Airports with Specified Service/AmenitiesFigure 3.7: Competitor States: Airports Services and Amenities Advantages and OpportunitiesFigure 4.1: Virginia’s Aviation Dollars at Work - Commonwealth Transportation Fund
68
1123242629303133343536
101215161819202128
4 | January 2012
EXECUTIVE SUMMARYVirginia’s Air Transportation System is a network of 66 public-use airports supporting a range of commercial and general aviation services. Virginia’s airports are economic engines, technology magnets, and tourism gateways. They generate over $28.8 Billion in economic activity, support over 259,000 jobs, and provide access to more than 8.5 million visitors annually. The Competitive Analysis of Virginia’s Aviation In-dustry looks for ways to be even more competitive and grow the Virginia Commonwealth’s aviation industry by compar-ing Virginia’s Air Transportation System with its counterparts in key states to identify areas of achievement, risk, and po-tential improvement.
The Federal Aviation Administration (FAA) primarily defines the United States’ aviation operations by three regulatory codes: FAA Part 121, Part 135, and Part 91. FAA Part 121 regulates all scheduled air carrier services, FAA Part 135 regulates general operations relating to air charter and air taxi services, and FAA Part 91 encompasses the remainder of general aviation operations that are not covered by the previous two classifications.
This study represents a collaborative effort between the Performance Management Group (PMG) at Virginia Com-monwealth University, industry associations, and individual industry experts. Coordination and support was also pro-vided by the Virginia Department of Aviation (DOAV). The report focuses heavily on thirteen states, classified into three categories for comparison – contiguous, comparable, and competitor. Virginia holds a number of competitive ad-vantages over the study states including distinct advantages in the following areas:
• Weather reporting systems• Integrated approach procedures• General aviation terminals• Paved aircraft aprons• Stable, diversified and dedicated special funding for
the aviation system
These services and amenities have a substantial effect on aircraft operator safety and security, and are main factors in deciding where to base aircraft and aviation businesses.
Virginia lags behind a number of the key states in the fol-lowing areas:
• Land use protection for airports• Percentage of airports equipped with 5,000-foot
runways• Readily available commercial hangars• Availability of 100LL and Jet A fuel at airports
Strategies for Moving Forward
The following recommendations are intended to guide in-vestment in Virginia’s Air Transportation System and are based upon the analysis contained within this study. The strategies are listed in order of priority.
1. Aviation Program Funding - Ensure adequate aviation program funding by maintaining the Airport Capital Pro-gram and Aviation Special Fund to provide and maintain robust statewide aviation infrastructure and support busi-ness development and expansion.
A. Runways – Explore with the FAA the potential for further development of the runway infrastructure at appropriate airports lacking 5,000-foot runways. Surpassing the 5,000 foot runway threshold opens the airport to enhanced Part 135 business aviation, providing better access and services, while boost-ing a community’s economic potential.
B. Hangars – Work with airport sponsors and locali-ties to increase awareness of the opportunities and funding available to construct hangars at the remaining six airports without such facilities.
C. Fuel – Work with airport sponsers to promote and equip public-use airports with 24-hour or call out Avgas fueling stations, while increasing jet fuel availability at those airports with the capabilities to support jet operations.
D. Terminals – While Virginia has an advantage in this area, advanced aviation technologies such as NextGen will provide more business opportunities for the Commonwealth’s airports and communi-ties. Facilities such as conference rooms, Wi-Fi and a business atmosphere should be promoted at Virginia airports. Virginia airports may represent a first and last impression of the Commonwealth and a deciding factor when determining if a busi-

Competitive Analysis of Virginia’s Aviation Industry | 5
ness is going to invest in the state. Virginia should continue to construct and refurbish terminals to encourage business growth.
2. Aviation Technology - Establish Virginia as a leader in NextGen and new aviation technologies.
A. NextGen
I. Early implementation of mature technologies –Pursue Virginia as an early adopter of technologies that improve airport throughput and access to pro-vide communities more opportunities for business and economic development.
II. Test bed for maturing technologies – Continue to work with the FAA to develop NextGen testing pro-grams and demonstrations in the Commonwealth.
III. Research consortium – Collaborate with the aviation and space community, universities, and industry to establish a Virginia Aviation and Space Research Consortium to promote Virginia in the re-search of emerging technologies.
B. Unmanned Aerial Systems (UAS) – Incorporate UAS development, manufacturing, testing and support into Virginia’s aviation and space portfolio. UAS are a growing component of military aviation and Next-Gen research, and Virginia should support this re-search as part of its strategy to become a leader in emerging technology testing and implementation.
3. Promotion - Promote the benefits and competitive stand-ing of Virginia’s Air Transportation System in its support for airports, businesses, and tourism. Virginia airports are economic engines, technology magnets, and tourism gate-ways for the Commonwealth.
A. Business Charter and Air Taxi Services – Highlight DOAV’s user-based funding programs and technical services to Part 135 and Fixed Base Operators alike.
B. High-Technology Business – Continue to embark on an enhanced business aviation campaign to raise awareness of the capabilities of air charter and air taxi to provide businesses and residents increased mobility and efficiency in traversing the state. The
message should center on the airports’ capacity as technology magnets and economic engines that drive economic development in the surrounding re-gions.
C. Tourism – Promotional efforts should also address the role that Virginia’s Air Transportation System plays in advancing the Commonwealth’s tourism in-dustry, a major component of Virginia’s economic vitality.
D. Land Use Protection – Promote compatible land use around airports and ensure adequate land use reg-ulations are in place to protect airport operations and infrastructure investments from the threat of encroachment by incompatible uses.
4. Continuing Analysis - Conduct further research and anal-ysis in the effort to better position Virginia’s Air Transpor-tation System as a preferred transportation choice among Virginia businesses and citizens.
In addition to the land use protection, hangar, terminal, run-way, and fueling facility analysis outlined in earlier recom-mendations, research should be conducted in the following subject areas:
A. Education – Promote an implementation plan for the recommendations outlined in the Virginia Avia-tion and Space Workforce Analysis and Strategy De-velopment report.
B. Access – DOAV should continue to explore airport access issues through the multimodal planning ef-fort. Work should begin to relieve existing access problems and to prevent future airport access prob-lems. A thorough transportation analysis with the goal to remediate ground access issues at the Com-monwealth’s commercial service airports is neces-sary in ensuring that these airports continue to offer businesses and residents convenient and timely ac-cess to domestic and international locations.
C. Cargo – Virginia should explore ways in which the Commonwealth can better accommodate domestic and international cargo shipments within its major commercial hubs.
6 | January 2012
1. INTRODUCTION1.1 BACKGROUND
Aviation in the Commonwealth is a key provider of econom-ic opportunities for Virginia’s communities. The Virginia Airport System Economic Impact Study of 2011 showed that Virginia’s Airport System supports $28.8 billion in economic activity in the Commonwealth and over 259,000 jobs. The Federal Aviation Administration (FAA) forecasts significant growth in the aviation industry over the next 20 years and it is important that the Commonwealth be a leader, providing well-paying jobs to support the growing workforce and the communities in which these workers live.1 A strong aviation system can provide the infrastructure for a prosperous Com-monwealth.
The Virginia Department of Aviation (DOAV) contracted the Performance Management Group (PMG) at Virginia Com-monwealth University, a full-service, public consulting firm within the L. Douglas Wilder School of Government and Public Affairs, to perform a competitive analysis of the Vir-ginia aviation industry.
This report is the fifth installment in the DOAV’s compre-hensive analysis of the Commonwealth’s aviation and space industry. The four previous reports are:
1. Virginia’s Aerospace Industry: An Economic Impact Analysis (2010)
2. Virginia Airport System Economic Impact Study (2011)
3. Competitive Analysis of Virginia’s Space Industry (2012)
4. Virginia Aviation and Space Workforce Analysis and Strategy Development (2012)2
1.2 SCOPE
This report explores Virginia’s legislative and tax policies, incentive measures, and workforce and educational devel-opment efforts as they relate to aviation business retention and expansion. PMG compared these against other key states’ aviation incentive policies, legislative policies, and occupational and industrial structures. This analysis pro-
1 “FAA Forecast Fiscal Years 2011-2031,” Retrieved from http://www.faa.gov/about/office_org/headquarters_offices/apl/aviation_forecasts/aerospace_fore-casts/2011-2031/media/2011%20Forecast%20Doc.pdf2 All reports can be accessed at the Performance Management Group’s web-site: http://www.pmg.vcu.edu.
vides the basis for recommendations to equip Virginia to become even more nationally competitive for future public and private-sector investment in jobs to support the Com-monwealth’s citizens and communities.
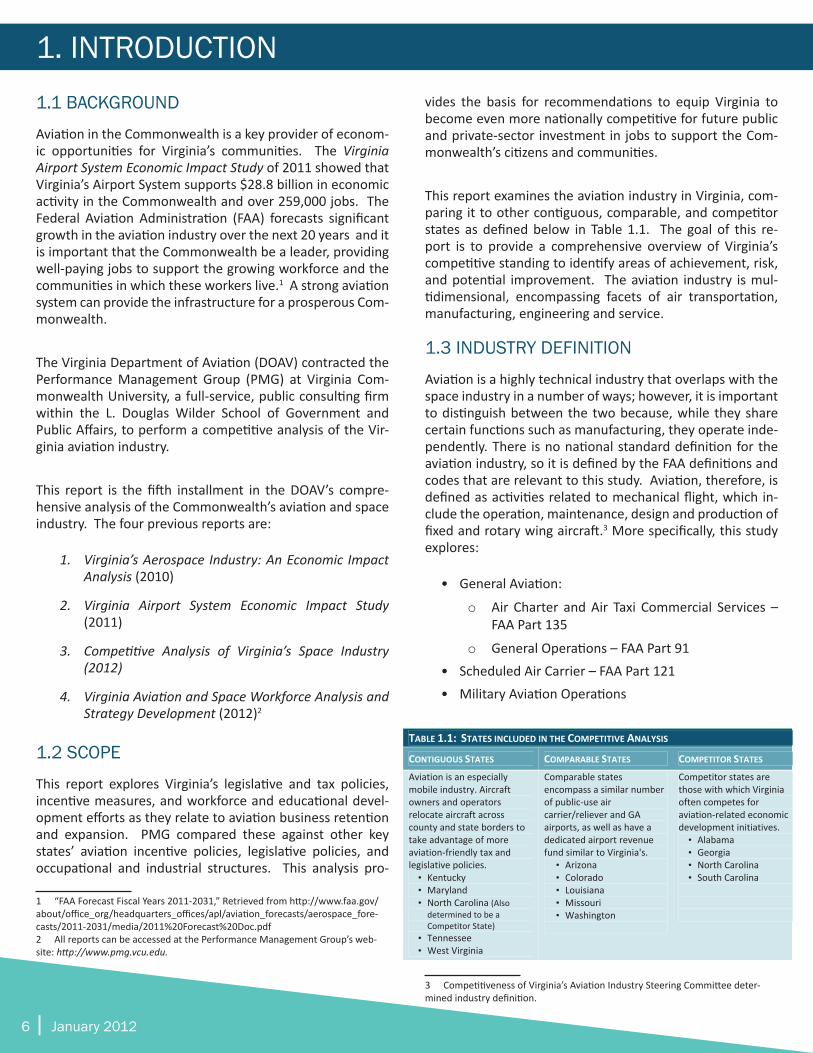
This report examines the aviation industry in Virginia, com-paring it to other contiguous, comparable, and competitor states as defined below in Table 1.1. The goal of this re-port is to provide a comprehensive overview of Virginia’s competitive standing to identify areas of achievement, risk, and potential improvement. The aviation industry is mul-tidimensional, encompassing facets of air transportation, manufacturing, engineering and service.
1.3 INDUSTRY DEFINITION
Aviation is a highly technical industry that overlaps with the space industry in a number of ways; however, it is important to distinguish between the two because, while they share certain functions such as manufacturing, they operate inde-pendently. There is no national standard definition for the aviation industry, so it is defined by the FAA definitions and codes that are relevant to this study. Aviation, therefore, is defined as activities related to mechanical flight, which in-clude the operation, maintenance, design and production of fixed and rotary wing aircraft.3 More specifically, this study explores:
• General Aviation:
o Air Charter and Air Taxi Commercial Services – FAA Part 135
o General Operations – FAA Part 91 • Scheduled Air Carrier – FAA Part 121 • Military Aviation Operations
3 Competitiveness of Virginia’s Aviation Industry Steering Committee deter-mined industry definition.
TABLE 1.1: STATES INCLUDED IN THE COMPETITIVE ANALYSIS
CONTIGUOUS STATES COMPARABLE STATES COMPETITOR STATES Aviation is an especially mobile industry. Aircraft owners and operators relocate aircraft across county and state borders to take advantage of more aviation‐friendly tax and legislative policies. • Kentucky • Maryland • North Carolina (Also determined to be a Competitor State)
• Tennessee • West Virginia
Comparable states encompass a similar number of public‐use air carrier/reliever and GA airports, as well as have a dedicated airport revenue fund similar to Virginia's.
• Arizona • Colorado • Louisiana • Missouri • Washington
Competitor states are those with which Virginia often competes for aviation‐related economic development initiatives. • Alabama • Georgia • North Carolina • South Carolina
2. COMPETITIVENESS OF VIRGINIA’S AVIATION LANDSCAPE
Competitive Analysis of Virginia’s Aviation Industry | 7
Virginia’s aviation industry is divided into three overarching categories: Scheduled Air Carrier (FAA Part 121), General Aviation - Air Charter/Air Taxi (FAA Part 135) and General Aviation - General Operations (FAA Part 91) that, when an-alyzed concurrently, constitute the bulk of aviation opera-tions.
Scheduled Air Carrier Service (FAA Part 121) – Virginia has nine airports that are designated by the Virginia Air Trans-portation System Plan (VATSP) as Commercial Service. These airports provide travelers with regularly scheduled airline service to domestic and international locations. Due to the role they serve, these airports are certified by the FAA to Part 139 airport standards, which entail the highest level of safety, including on-site crash, fire, & rescue capabilities.4
General aviation (GA) – General aviation refers to all civil aviation outside of scheduled passenger airlines and mili-tary aviation.5 General Aviation for the purposes of this re-port is broken down into two major categories, FAA Part 135 refers to air charter/air taxi operations, and FAA Part 91 to all other general operations.
General Aviation - Air Charter/Air Taxi (FAA Part 135) – All 66 of Virginia’s public-use airports provide access to the Na-tional Airspace System (NAS) and communities throughout the Commonwealth. FAA Part 135 regulated aircraft opera-tors offer nonscheduled commercial air services referred to as air charters or air taxis. Charter and air taxi services are typically offered in aircraft with as few as four seats, but are often flown in business aircraft that usually have a six to ten seat configuration. This type of service allows a traveler to conduct trips on a point-to-point basis thereby providing
4 For all specifications, see the FAA’s “14 CFR Part 121 Air Carrier Certification,” available at http://www.faa.gov/about/initiatives/atos/air_carrier [accessed December 7, 2011]5 “Report to Congress: Improving General Aviation Security,” December 2011 Noise Pollution Clearinghouse, http://www.nonoise.org/library/generalav/ (ac-cessed 13 January 2012).
air access to all public-use airports and most communities within the Commonwealth. It also provides the capability to access multiple locations in the Commonwealth in a single day that, due to time constraints, may otherwise be impos-sible by automobile.
General Aviation - General Operations (FAA Part 91) – Gen-eral operations represent the broadest category of aviation activities. Part 91 operations include business aircraft op-erations not covered by FAA Part 135, as well as recreational flight.6 Furthermore, Part 91 includes all police, Medevac, traffic reporting, crop dusting, aerial photogrammetric ser-vices, and other forms of business activities not pertaining to fees for passenger carriage.7 VATSP designates 57 GA air-ports in Virginia, allowing over 99% of the population to be within a thirty-minute drive of this caliber airport.
Department of Defense/Military Aviation Operations – The final category that is especially relevant to Virginia’s aviation industry is defense and military-related aviation. Virginia supports roughly 26,000 uniformed, civilian, and contract employees with functions relating to military aerospace.8 The Commonwealth encompasses 11 installations with mili-tary aviation operations. These installations are discussed in more detail in Section 2.4.
The following subsections provide a snapshot of Virginia’s aviation industry landscape through the analysis of each of the industry facets. This snapshot sets the foundation for subsequent analysis of the parameters that measure the industry’s competitiveness – nationally and internationally.
6 Federal Aviation Administration, Certification Information for Operating Un-der Part 135 (PDF file), n.d., available at http://www.faa.gov/licenses_certificates/airline_certification/media/n135toc.pdf [accessed December 7,2011]7 For complete information about Part 91, visit FAA website, “Title 14, Part 91: General Operating and Flight Rules”: http://ecfr.gpoaccess.gov/cgi/t/text/text-idx?c=ecfr&sid=3efaad1b0a259d4e48f1150a34d1aa77&rgn=div5&view=text&node=14:2.0.1.3.10&idno=14 [December 8, 2011]8 PMG, “Virginia’s Aerospace Industry: An Economic Impact Analysis,” Novem-ber 2010. Available on DOAV website.
8 | January 2012
2.1 SCHEDULED AIR CARRIER OPERATIONS - FAA PART 121
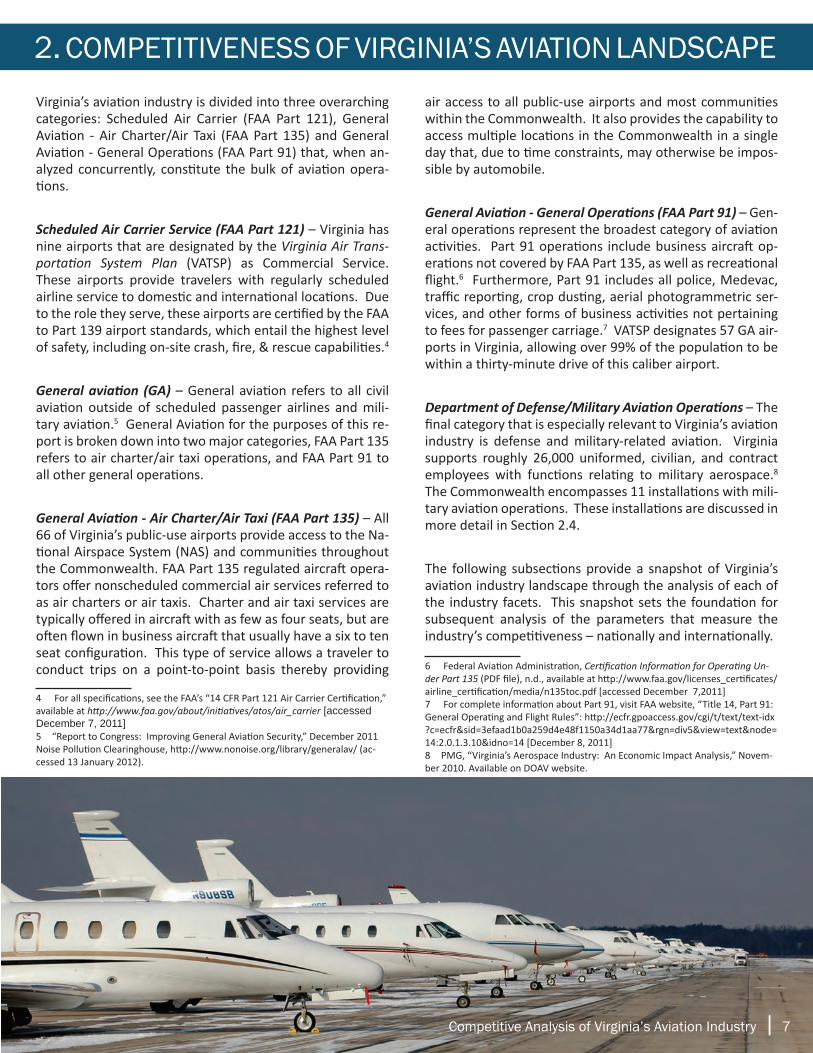
Scheduled air carrier operations, FAA Part 121, regulates all commercial airlines offering scheduled passenger services out of the United States’ various commercial airport classifications. Aircraft and airport operations regulated under Part 121 repre-sent the largest facet of the aviation industry in the United States and Virginia. Virginia’s commercial airport hubs contributed $20.5 billion in economic activity in 2010.9 As shown in table 2.1, Part 121 aircraft operate out of nine airports – Charlottesville-Albemarle, Lynchburg Regional, Newport News-Williamsburg International, Norfolk International, Richmond International, Ronald Reagan Washington National, Roanoke Regional, Shenandoah Valley Regional, and Washington-Dulles International.
910, 1011, 1112, 1213, 1314, 1415, 1516, 1617, 1718, 1819, 1920
9 Virginia Department of Aviation (DOAV), Virginia Airport System Economic Impact Study: Technical Report (PDF file), p. 14, report prepared by ICF SH&E, 2011, available online at http://tinyurl.com/7usgrfl [accessed December 2, 2011] 10 DOAV, Virginia Airport System Economic Impact Study: Technical Report (PDF file), Appendix E: Airport Economic Impact Summaries.11 Charlottesville-Albemarle website for more information: http://www.gocho.com/index.php/general_aviation 12 See Lynchburg Regional Airport website for more information: http://www.lynchburgva.gov/index.aspx?page=8513 DOAV, Virginia Airport System Economic Impact Study: Technical Report (PDF file), p. 56.14 Norfolk International Airport, Master Plan Update (PDF file), para. 2, prepared by Jacobs Consultancy, December 2008, available at http://www.norfolkairport.com/images/stories/airport-information/master-plan-update/ORFMasterPlanUpdate2008.pdf [accessed December 2, 2011]15 Ibid.16 DOAV, Virginia Airport System Economic Impact Study: Technical Report (PDF file), p. 56.17 Richmond International Airport, Master Plan (PDF file), Chapter 1: p. 2, n.d., prepared by Kutchins & Groh, L.L.C., http://www.flyrichmond.com/Site_Downloads/Mas-ter_Plan_Downloads/01_Introduction.pdf [accessed December 2, 2011]18 Ronald Reagan Washington International, “Flight information,” http://www.metwashairports.com/reagan/1261.htm [accessed December 7, 2011]19 DOAV, Virginia Airport System Economic Impact Study: Technical Report (PDF file), p. 14.20 Ibid.
TABLE 2.1: VIRGINIA COMMERCIAL SERVICE AIRPORT SERVICES AND IMPACT INFORMATION Airport Economic
Impact # of Jobs Supported
Regional National Internat. Services # of Daily Departures(2010)10
Charlottesville‐Albemarle (CHO)11
$128.7M 1,267 √ 4 regional carriers, 6 destinations
18
Lynchburg Regional (LYH)12
$109.2M 911 √ 1 regional carrier 7
Newport News‐Williamsburg International (PHF)13
$373.6M 3,382 √ √ 6 national carriers 26
Norfolk International (ORF)14
$1.07B 10,269 √ √ √ 7 major carriers15 83
Richmond International (RIC)16
$1.08B 10,910 √ √ √ 7 domestic airlines, 2 international providers, 21 destinations17
82
Roanoke Regional (ROA)
$216.1M 2,189 √ 4 regional carriers, 9 destinations
26
Ronald Reagan Washington National (DCA)18
$7.3B 82,675 √ √ 77 destinations 365*
Shenandoah Valley Regional (SHD)19
$26.2M 252 √ 1 regional 3
Washington Dulles International (IAD)20
$10.1B 96,980 √ √ √ 82 nonstop U.S. destinations, 48 nonstop international destinations
400*
Economic Impact and Job Figures sourced to, ICF SH&E, “Virginia Airport System Economic Impact Study.”
*Denotes figures from Metropolitan Washington Airport Authority (MWAA) website, http://www.mwaa.com
10 DOAV, Virginia Airport System Economic Impact Study: Technical Report (PDF file), Appendix E: Airport Economic Impact Summaries. 11 Charlottesville‐Albemarle website for more information: http://www.gocho.com/index.php/general_aviation 12 DOAV, Virginia Airport System Economic Impact Study: Technical Report (PDF file), p. 14 13 DOAV, Virginia Airport System Economic Impact Study: Technical Report (PDF file), p. 56. 14 Ibid 15 15 Norfolk International Airport, Master Plan Update (PDF file), para. 2, prepared by Jacobs Consultancy, December 2008, available at http://www.norfolkairport.com/images/stories/airport-information/master-plan-update/ORFMasterPlanUpdate2008.pdf [accessed December 2, 2011] 16 DOAV, Virginia Airport System Economic Impact Study: Technical Report (PDF file), p. 56. 17 Richmond International Airport, Master Plan (PDF file), Chapter 1: p. 2, n.d., prepared by Kutchins & Groh, L.L.C., http://www.flyrichmond.com/Site_Downloads/Master_Plan_Downloads/01_Introduction.pdf [accessed December 2, 2011] 18 Ronald Reagan Washington International, “Flight information,” http://www.metwashairports.com/reagan/1261.htm [accessed December 7, 2011] 19
DOAV, Virginia Airport System Economic Impact Study: Technical Report (PDF file), p. 14. 20 Ibid.
Competitive Analysis of Virginia’s Aviation Industry | 9
2.2 GENERAL AVIATION—AIR TAXI/AIR CHARTER—FAA PART 135FAA Part 135 regulated aircraft are at the foundation of busi-ness development throughout much of the Commonwealth. In recent years, the connections between Part 135 aircraft service and business operations have become more of a fo-cal point in policymakers’ economic development efforts. Virginia, via a program pursued by the Virginia SATSLab, Inc. (VSATS), has in place the first iteration of an internet-accessed customer reservations tool for air taxi and charter services.
VirginiaAirTaxi.com is a web portal that provides a user-friendly interface enabling travelers to price and book air travel via Part 135 service providers from any of the over 5,000 GA airports in the nation. In 2011, the Air Taxi/Air Charter Association (ATXA) introduced for “beta testing” a booking service via one of the world’s largest Global Dis-tribution Systems (GDS) connecting to thousands of travel agents and on-line travel agents.21 This provides easier ac-cess for businesses and individuals to schedule air taxi flights from local airports.22
Originally designed for the emerging air taxi industry, Vir-giniaAirTaxi.com also seeks the participation of long-time established small aircraft charter services. The web portal will be able to handle inquiries from all types of business in the nonscheduled air service sector. VSATS is monitor-ing the testing of this system and if successful, DOAV will be hosting a Part 135/air taxi summit in 2012, to promote this option of air travel in the business community.
2.3 GENERAL AVIATION—GENERAL OPERATIONS—FAA PART 91
FAA Part 91 regulates the operation of all aircraft, but most specifically all aviation activity outside of scheduled air car-rier and military operations. Virginia benefits from 66 air-ports offering services to the public, 57 of which are general aviation airports supporting Virginia’s business, personal, and recreational needs.
Virginia’s general aviation airports contributed $728 million in economic activity to the state economy in 2010.23 At the heart of this activity is the business-related aviation made possible by the Commonwealth’s network of public-use air-ports. As the National Business Aviation Association (NBAA) reports:
“Business aviation reaches 10 times the number of U.S. air-ports (over 5,000 public-use facilities) than the airlines do. The majority of U.S. airline flights only go to and from 70 major airports, and the total number of U.S. destinations 21 See Air Taxi / Air Charter Association (ATXA) website for more information: <http://www.atxa.com> 22 Ibid.23 DOAV, Virginia Airport System Economic Impact Study: Executive Summary (PDF file), p. 3.
served by air carriers has declined.”24
In some cases, general-use airports provide the only means for businesses to conduct operations in a cost-effective and efficient manner. In recent years, Virginia, in line with a number of other states, has begun to approach investment in public-use, GA airports as a driver to entice business development throughout the Commonwealth. Virginia’s efforts to equip all public-use airports with instrument ap-proach procedures (IAPs) and weather reporting are two such examples of this.
Helicopter Operations - Beyond the network of general aviation airports, Virginia’s Air Transportation System offers substantial infrastructure to support helicopter operations throughout the state. The Commonwealth encompasses 65 hospital heliports, evidence of the strong public benefit associated with Medevac and general helicopter operation. Virginia was also the first to create a statewide helicopter as-sociation, Virginia Helicopter Association (VHA), to promote helicopter operations, training and safety according to He-licopter Association International (HAI). VHA was also one of the first organizations to join the Virginia Volunteer Pilots Group to provide helicopter transport to Virginians during emergencies.
Aside from operations within the Northern Virginia Special Flight Rules Area (SFRA), an area which restricts helicop-ter operations for security purposes, Virginia as a whole is not restrictive in its rotary aircraft policy and acknowledges these benefits in its support for helicopter operators. It is noted however, that a number of Virginia localities have ad-opted or are considering zoning ordinances that may inhibit helicopter operations beyond the regulations and guidance provided by the FAA. Members of the Virginia General As-sembly are considering legislation that will ensure safe he-licopter operations in accordance with the FAA guidelines and thereby expand services to Virginia citizens and oppor-tunities for helicopter businesses.
2.4 MILITARY
Virginia hosts a variety of military aviation assets belonging to all four branches of service under the Department of De-fense, and the Coast Guard under the Department of Home-land Security. Although these assets include Army and Marine Corps helicopter units, the presence of Air Combat Command and the First Fighter Wing at Joint Base Langley-Eustis and the Master Jet Base at Naval Air Station Oceana make combat aviation the primary focal point of military aviation in the Commonwealth.
24 National Business Aviation Association, “Business Aviation: Just the Facts,” 2010 NBAA Business Aviation Fact Book, bullet #7, available at http://www.nbaa.org/business-aviation/fact-book/facts/ [accessed December 5, 2011]
10 | January 2012
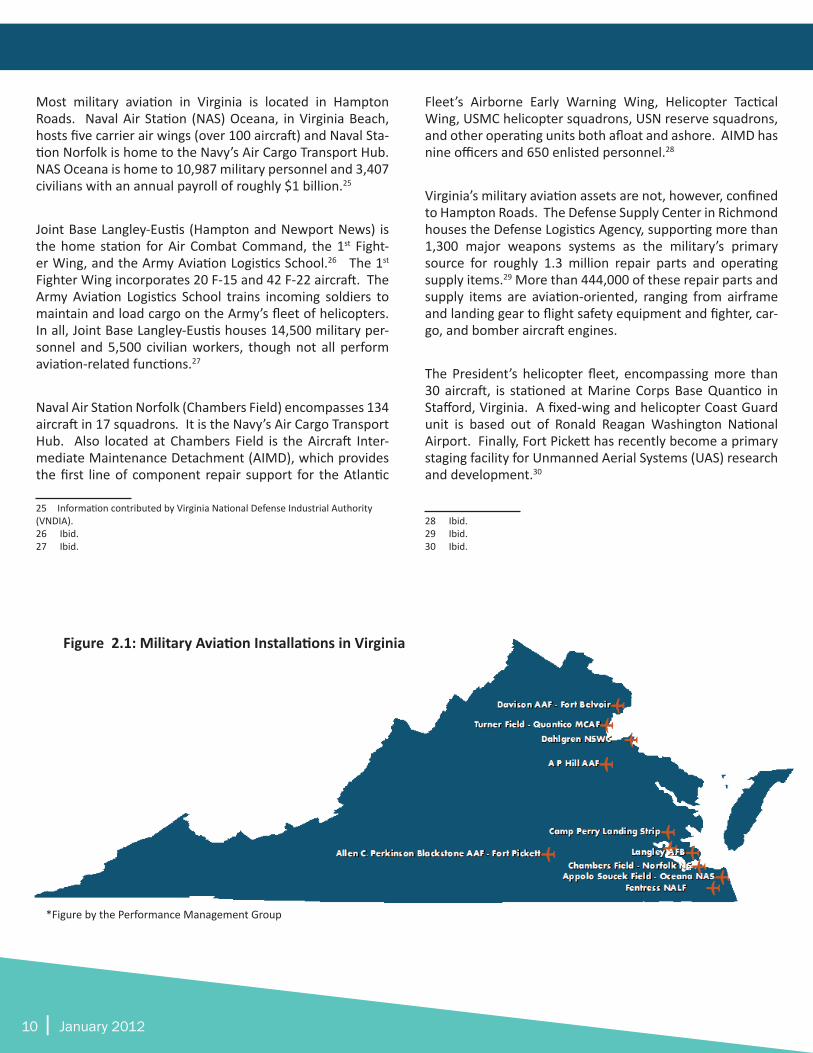
Most military aviation in Virginia is located in Hampton Roads. Naval Air Station (NAS) Oceana, in Virginia Beach, hosts five carrier air wings (over 100 aircraft) and Naval Sta-tion Norfolk is home to the Navy’s Air Cargo Transport Hub. NAS Oceana is home to 10,987 military personnel and 3,407 civilians with an annual payroll of roughly $1 billion.25
Joint Base Langley-Eustis (Hampton and Newport News) is the home station for Air Combat Command, the 1st Fight-er Wing, and the Army Aviation Logistics School.26 The 1st Fighter Wing incorporates 20 F-15 and 42 F-22 aircraft. The Army Aviation Logistics School trains incoming soldiers to maintain and load cargo on the Army’s fleet of helicopters. In all, Joint Base Langley-Eustis houses 14,500 military per-sonnel and 5,500 civilian workers, though not all perform aviation-related functions.27
Naval Air Station Norfolk (Chambers Field) encompasses 134 aircraft in 17 squadrons. It is the Navy’s Air Cargo Transport Hub. Also located at Chambers Field is the Aircraft Inter-mediate Maintenance Detachment (AIMD), which provides the first line of component repair support for the Atlantic
25 Information contributed by Virginia National Defense Industrial Authority (VNDIA). 26 Ibid.27 Ibid.
Fleet’s Airborne Early Warning Wing, Helicopter Tactical Wing, USMC helicopter squadrons, USN reserve squadrons, and other operating units both afloat and ashore. AIMD has nine officers and 650 enlisted personnel.28
Virginia’s military aviation assets are not, however, confined to Hampton Roads. The Defense Supply Center in Richmond houses the Defense Logistics Agency, supporting more than 1,300 major weapons systems as the military’s primary source for roughly 1.3 million repair parts and operating supply items.29 More than 444,000 of these repair parts and supply items are aviation-oriented, ranging from airframe and landing gear to flight safety equipment and fighter, car-go, and bomber aircraft engines.
The President’s helicopter fleet, encompassing more than 30 aircraft, is stationed at Marine Corps Base Quantico in Stafford, Virginia. A fixed-wing and helicopter Coast Guard unit is based out of Ronald Reagan Washington National Airport. Finally, Fort Pickett has recently become a primary staging facility for Unmanned Aerial Systems (UAS) research and development.30
28 Ibid.29 Ibid.30 Ibid.
Figure 2.1: Military Aviation Installations in Virginia
*Figure by the Performance Management Group
Competitive Analysis of Virginia’s Aviation Industry | 11Competitive Analysis of Virginia’s Aviation Industry | 11
3. COMPETITIVENESS OF VIRGINIA’S AVIATION INFRASTRUCTURE
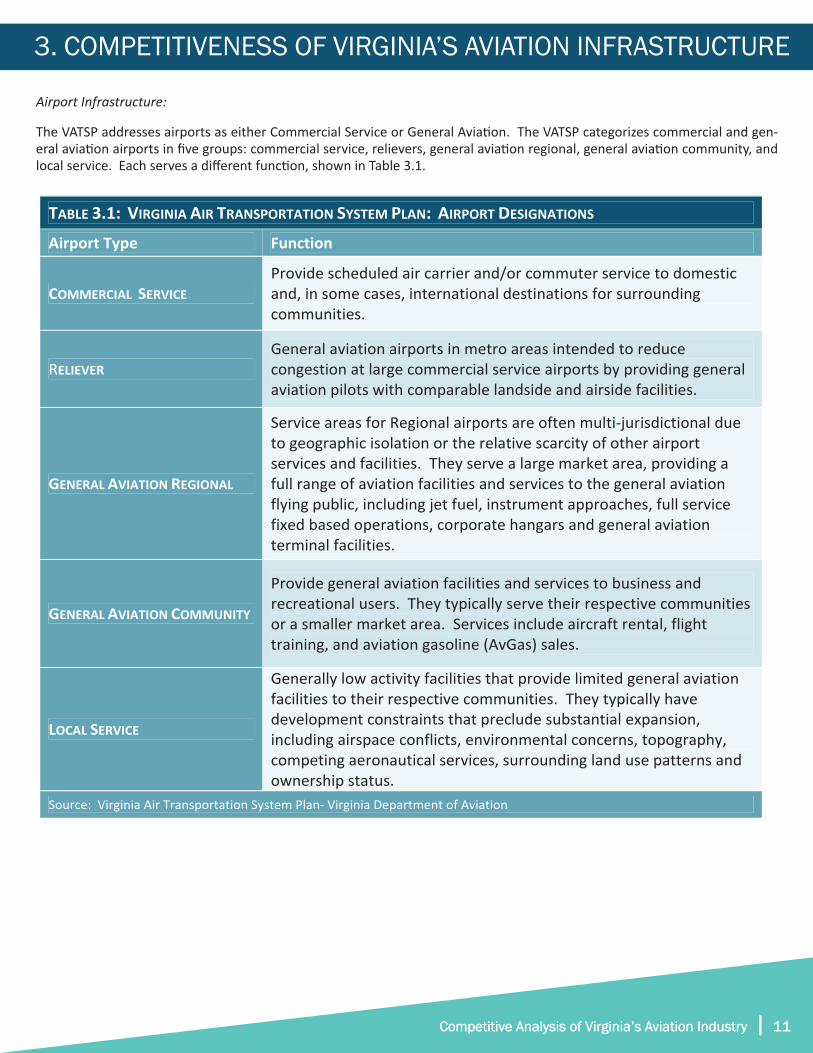
TABLE 3.1: VIRGINIA AIR TRANSPORTATION SYSTEM PLAN: AIRPORT DESIGNATIONS
Airport Type Function
COMMERCIAL SERVICE Provide scheduled air carrier and/or commuter service to domestic and, in some cases, international destinations for surrounding communities.
RELIEVER General aviation airports in metro areas intended to reduce congestion at large commercial service airports by providing general aviation pilots with comparable landside and airside facilities.
GENERAL AVIATION REGIONAL
Service areas for Regional airports are often multi‐jurisdictional due to geographic isolation or the relative scarcity of other airport services and facilities. They serve a large market area, providing a full range of aviation facilities and services to the general aviation flying public, including jet fuel, instrument approaches, full service fixed based operations, corporate hangars and general aviation terminal facilities.
GENERAL AVIATION COMMUNITY
Provide general aviation facilities and services to business and recreational users. They typically serve their respective communities or a smaller market area. Services include aircraft rental, flight training, and aviation gasoline (AvGas) sales.
LOCAL SERVICE
Generally low activity facilities that provide limited general aviation facilities to their respective communities. They typically have development constraints that preclude substantial expansion, including airspace conflicts, environmental concerns, topography, competing aeronautical services, surrounding land use patterns and ownership status.
Source: Virginia Air Transportation System Plan‐ Virginia Department of Aviation
Airport Infrastructure:
The VATSP addresses airports as either Commercial Service or General Aviation. The VATSP categorizes commercial and gen-eral aviation airports in five groups: commercial service, relievers, general aviation regional, general aviation community, and local service. Each serves a different function, shown in Table 3.1.
12 | January 2012
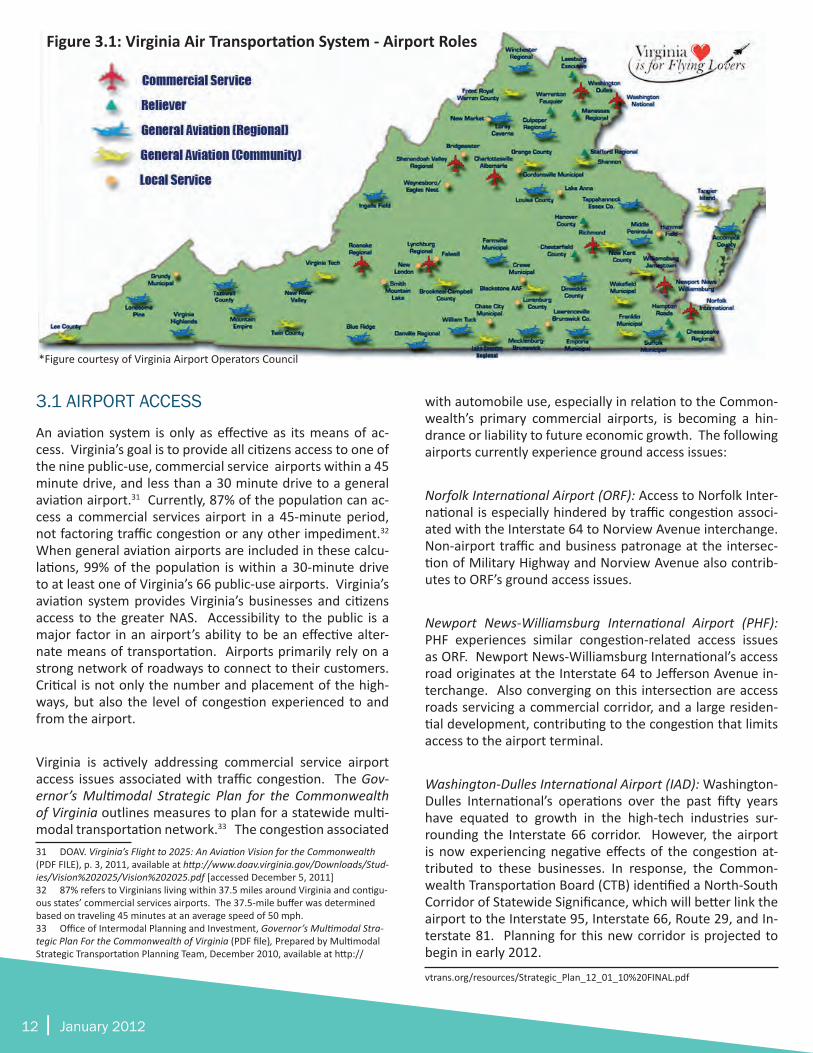
Figure 3.1: Virginia Air Transportation System - Airport Roles
*Figure courtesy of Virginia Airport Operators Council
3.1 AIRPORT ACCESS
An aviation system is only as effective as its means of ac-cess. Virginia’s goal is to provide all citizens access to one of the nine public-use, commercial service airports within a 45 minute drive, and less than a 30 minute drive to a general aviation airport.31 Currently, 87% of the population can ac-cess a commercial services airport in a 45-minute period, not factoring traffic congestion or any other impediment.32 When general aviation airports are included in these calcu-lations, 99% of the population is within a 30-minute drive to at least one of Virginia’s 66 public-use airports. Virginia’s aviation system provides Virginia’s businesses and citizens access to the greater NAS. Accessibility to the public is a major factor in an airport’s ability to be an effective alter-nate means of transportation. Airports primarily rely on a strong network of roadways to connect to their customers. Critical is not only the number and placement of the high-ways, but also the level of congestion experienced to and from the airport.
Virginia is actively addressing commercial service airport access issues associated with traffic congestion. The Gov-ernor’s Multimodal Strategic Plan for the Commonwealth of Virginia outlines measures to plan for a statewide multi-modal transportation network.33 The congestion associated 31 DOAV. Virginia’s Flight to 2025: An Aviation Vision for the Commonwealth (PDF FILE), p. 3, 2011, available at http://www.doav.virginia.gov/Downloads/Stud-ies/Vision%202025/Vision%202025.pdf [accessed December 5, 2011]32 87% refers to Virginians living within 37.5 miles around Virginia and contigu-ous states’ commercial services airports. The 37.5-mile buffer was determined based on traveling 45 minutes at an average speed of 50 mph.33 Office of Intermodal Planning and Investment, Governor’s Multimodal Stra-tegic Plan For the Commonwealth of Virginia (PDF file), Prepared by Multimodal Strategic Transportation Planning Team, December 2010, available at http://
with automobile use, especially in relation to the Common-wealth’s primary commercial airports, is becoming a hin-drance or liability to future economic growth. The following airports currently experience ground access issues:
Norfolk International Airport (ORF): Access to Norfolk Inter-national is especially hindered by traffic congestion associ-ated with the Interstate 64 to Norview Avenue interchange. Non-airport traffic and business patronage at the intersec-tion of Military Highway and Norview Avenue also contrib-utes to ORF’s ground access issues.
Newport News-Williamsburg International Airport (PHF): PHF experiences similar congestion-related access issues as ORF. Newport News-Williamsburg International’s access road originates at the Interstate 64 to Jefferson Avenue in-terchange. Also converging on this intersection are access roads servicing a commercial corridor, and a large residen-tial development, contributing to the congestion that limits access to the airport terminal.
Washington-Dulles International Airport (IAD): Washington-Dulles International’s operations over the past fifty years have equated to growth in the high-tech industries sur-rounding the Interstate 66 corridor. However, the airport is now experiencing negative effects of the congestion at-tributed to these businesses. In response, the Common-wealth Transportation Board (CTB) identified a North-South Corridor of Statewide Significance, which will better link the airport to the Interstate 95, Interstate 66, Route 29, and In-terstate 81. Planning for this new corridor is projected to begin in early 2012.
vtrans.org/resources/Strategic_Plan_12_01_10%20FINAL.pdf
Competitive Analysis of Virginia’s Aviation Industry | 13
Virginia’s Air Transportation System accessibility issues are not confined to the previous three airports. Efforts to im-prove access to the Commonwealth’s national and interna-tional hubs, as well as the corridors immediately surround-ing them, are at the heart of ensuring that these airports remain a preferred option for international travel and cargo shipping, providing Virginia’s high-technology businesses the opportunities to expand in an ever-globalizing market-place. The ultimate goal for these access improvements is a multimodal system that enables people and freight to move door-to-door between any Virginia locality and any world market in a 24-hour period.
3.2 AIRPORT SERVICES AND AMMENITIES MATRIX
Amenities, as described for the purposes of this study, are airport features and services that can influence the use and success of a particular facility. Representatives within Virgin-ia’s aviation industry determined the following services and amenities to be significant when considering how an airport facility competes against other desired facilities.
Runway Length of 5,000-Feet or Greater
A 5,000-foot runway is a “threshold” attribute that allows many corporate/business aircraft to consider aircraft opera-tions at that facility. The ability to support business jet traf-fic can greatly enhance the utilization and success of an air-port and the surrounding community. According to a recent study by the National Business Aviation Association (NBAA), business aviation contributes $150 billion to U.S. economic output and employs more than 1.2 million people.34 Pilots consider many factors when determining an aircraft’s suit-ability for operation at particular airports. These include the aircraft’s operation handbook, insurance requirements, air-port elevation, wind velocity, etc., but runway length is often the determining factor for corporate and business aircraft.
Instrument Approach Procedures (IAPs)
Instrument approach procedures are published for the utilization of either ground-based or satellite navigational equipment and enable aircraft to operate at an airport un-der hazardous weather conditions, or Instrument Meteoro-logical Conditions (IMC). Pilots are often required to file an Instrument Flight Rules (IFR) plan, even when conditions are better than IMC, due to insurance or flight management re-quirements. IAPs offer pilots an airport-specific navigational guide for more efficient IFR flight plan development, thus enhancing the use of an airport in all weather conditions.
34 NBAA, 2010 NBAA Business Aviation Fact Book, bullet #1: http://www.nbaa.org/business-aviation/fact-book/facts/ [accessed December 12, 2011]
Precision Instrument Approach Procedures (PIR’s)
While IAPs allow greater use of an airport, the availability of a precision instrument approach procedure further enhanc-es the utilization of any given airport. Precision approach procedures enable pilots to fly at the lowest of IFR mini-mums, allowing pilots to utilize a facility under extremely poor weather conditions.
Weather Reporting
Due to safety and insurance policy considerations, on-site weather reporting is often a major factor in deciding to use a particular airport. The business aircraft community also prefers to have weather reporting capabilities at airports that they utilize. Therefore, the services and amenities ma-trix in Appendix 1 includes a count of airports with weather reporting capability from an on-site automated weather ob-serving station (i.e., Automated Weather Observing System AWOS III or better). The National Airspace Data Interchange Network (NADIN) only acknowledges AWOS III or better fa-cilities, making them the only weather reporting systems available to aircraft in flight when the aircraft are equipped with modern avionics. Having an FAA-certified weather sta-tion on the field enables the lowest possible IAP minimums for that facility. In addition, an on-field weather station pro-vides airport users the enhanced safety benefit of knowing the weather conditions at that particular field.
General Aviation Terminals
Terminal buildings provide the benefits of shelter, flight planning areas, and rest facilities for pilots and passengers. They also provide a valuable first impression of the commu-nity that frequently influences business decisions and the perceptions of the community. Terminals also provide addi-tional necessities such as fueling, maintenance, and locality information for services such as car rental, hotel, business, tourist and restaurant locations.
Paved Aircraft Aprons
Paved aircraft aprons provide a solid, stable surface for the maneuvering of both transient and based aircraft. Having adequate paved parking apron space also allows for fuel-ing operations, tie-downs, and taxiing operations to occur under all weather conditions. The size of the aircraft parking apron is always a consideration for larger business aircraft operators.
14 | January 2012
Hangars
Hangars allow for aircraft storage at a particular airport. Hangars provide private/corporate operators with another degree of safety, security, and protection from the elements when storing aircraft. Many businesses often look for the security and safety provided by hangar facilities, even on short stays. Having the ability to provide storage to both based, as well as “transient” aircraft, is an added feature of hangars on the field. Aircraft owners will often evacuate air-craft to airports with hangar facilities in preparation for bad weather conditions. The Virginia Economic Development Partnership (VEDP) explained that the availability of corpo-rate hangars is a key factor in encouraging businesses and flight departments to locate within the Commonwealth.35
100 LL and Jet Fuel
Most piston-driven GA aircraft use 100 low lead (100LL) aviation fuel. Turboprop and jet aircraft utilize variations of “jet” fuel. Fuel availability is always considered when mak-ing flight plans, as aircraft operators determine the nearest airports with fueling facilities. Those without fueling facili-ties are often not considered proper rest stops for meals, lodging, or to wait out weather delays.
Weight-Bearing Capacity
In addition to runway length, runway weight-bearing capac-ity (maximum repetitive aircraft loading capability) is an im-portant factor when pilots consider the use of any particular airport. Runways that are undersized for the aircraft fre-quently using them will likely experience premature runway pavement failure. Weight-bearing capacity tabulations for airports range from the upper-end of the FAA’s designation of “small aircraft” (12,500 lbs.), single-wheel-configuration, to those having a dual-tandem wheel configuration capacity greater than 300,000 pounds. 36 37
Analysis of Services and Amenities
This section displays Virginia’s ranking in the categories outlined above compared to three preselected comparison groups: contiguous states, comparable states, and competi-tor states. To reiterate, these groups are defined as follows:
35 Virginia Department of Economic Development input as part of the study’s steering and technical committees. 36 All state-by-state data is located in Appendix 1.37 Due to the complexity of the weight-bearing capacity data, it was not included in the state-by-state services and amenities analysis. Raw state-by-state data is available in Appendix 1.
Contiguous states – States adjoining the Commonwealth that are competitive for aircraft housing and stopovers due to proximity. These include:
• Kentucky
• Maryland
• North Carolina
• Tennessee
• West Virginia
Comparable states – States chosen for their similarity in the number of public-use airports and aviation system rev-enues. These include:
• Arizona
• Colorado
• Louisiana
• Missouri
• Washington
Competitor states – States identified as competitors in avia-tion specific economic development opportunities. These include:
• Alabama
• Georgia
• North Carolina
• South Carolina
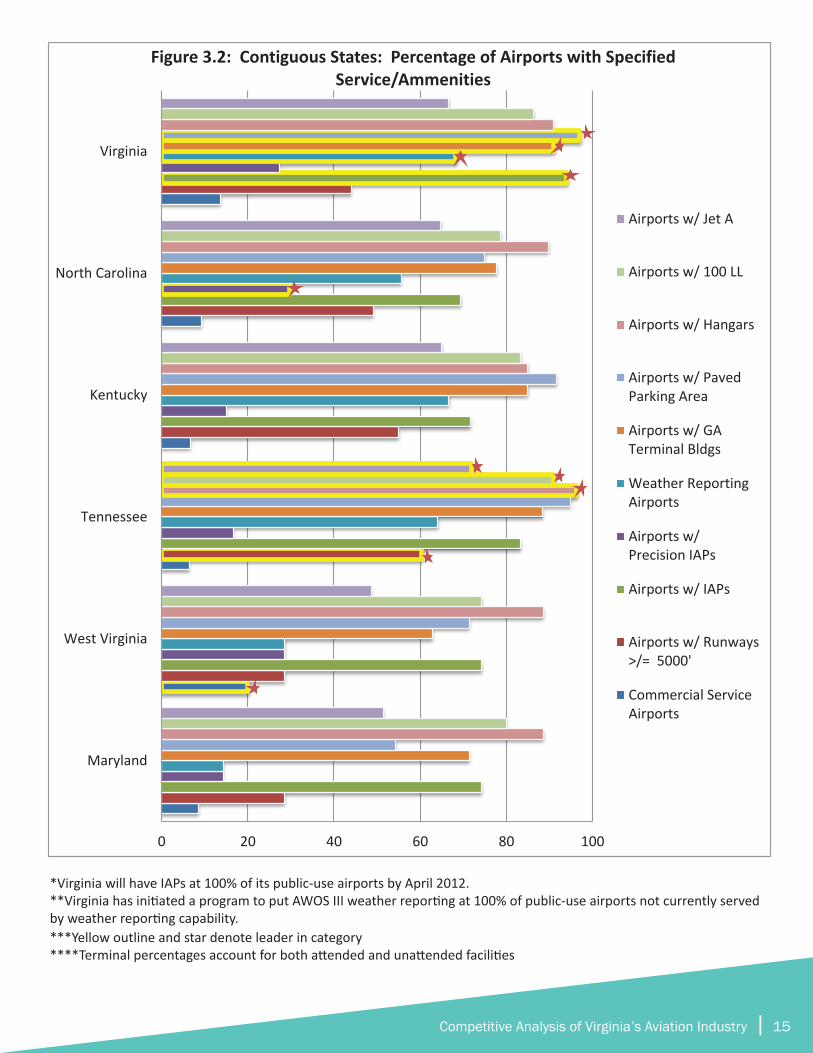
Contiguous States: Services and Amenities Competitive Standing
Figure 3.2 graphically illustrates Virginia’s standings in the categories discussed relative to its contiguous states.
Virginia’s relative strengths lie in the infrastructure designed to enhance safety, providing pilots the highest level of infor-mation available to guide flight plans, especially in prepara-tion for hazardous flying conditions. These safety precau-tions provide pilots and the charters employing these pilots a higher degree of confidence in flying during IMC weath-er conditions. At 93.9% and 68.2%, respectively, Virginia equips the highest percentage of its public-use airports with IAPs and AWOS III, or better, weather reporting systems.
Competitive Analysis of Virginia’s Aviation Industry | 15
*Virginia will have IAPs at 100% of its public-use airports by February 2012. **Virginia has initiated a program to put AWOS III weather reporting at 100% of public-use airports not currently served by weather reporting capability. ***Yellow outline and star denote leader in category
0 20 40 60 80 100
Maryland
West Virginia
Tennessee
Kentucky
North Carolina
Virginia
Figure 3.2: Contiguous States: Percentage of Airports with Specified Service/Ammenities
Airports w/ Jet A
Airports w/ 100 LL
Airports w/ Hangars
Airports w/ PavedParking Area
Airports w/ GATerminal Bldgs
Weather ReportingAirports
Airports w/Precision IAPs
Airports w/ IAPs
Airports w/ Runways>/= 5000'
Commercial ServiceAirports
*Virginia will have IAPs at 100% of its public-use airports by April 2012.**Virginia has initiated a program to put AWOS III weather reporting at 100% of public-use airports not currently served by weather reporting capability.***Yellow outline and star denote leader in category****Terminal percentages account for both attended and unattended facilities
16 | January 2012
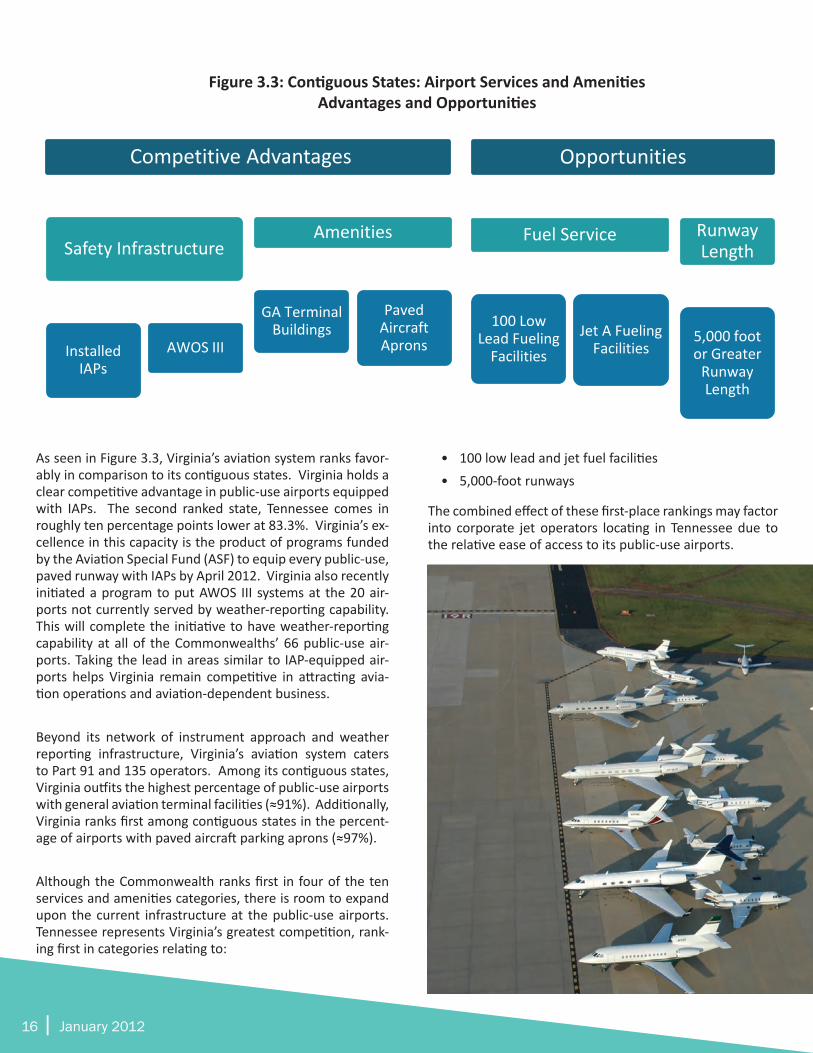
Figure 3.3: Contiguous States: Airports Services and Amenities
Advantages and Opportunities
Competitive Advantages
Safety Infrastructure
Installed IAPs
AWOS III
Amenities
GA Terminal Buildings
Paved Aircraft Aprons
Opportunities
Fuel Service
100 Low Lead Fueling
Facilities
Jet A Fueling Facilities
Runway Length
5,000 foot or Greater
Runway Length
Figure 3.3: Contiguous States: Airport Services and Amenities Advantages and Opportunities
As seen in Figure 3.3, Virginia’s aviation system ranks favor-ably in comparison to its contiguous states. Virginia holds a clear competitive advantage in public-use airports equipped with IAPs. The second ranked state, Tennessee comes in roughly ten percentage points lower at 83.3%. Virginia’s ex-cellence in this capacity is the product of programs funded by the Aviation Special Fund (ASF) to equip every public-use, paved runway with IAPs by April 2012. Virginia also recently initiated a program to put AWOS III systems at the 20 air-ports not currently served by weather-reporting capability. This will complete the initiative to have weather-reporting capability at all of the Commonwealths’ 66 public-use air-ports. Taking the lead in areas similar to IAP-equipped air-ports helps Virginia remain competitive in attracting avia-tion operations and aviation-dependent business.
Beyond its network of instrument approach and weather reporting infrastructure, Virginia’s aviation system caters to Part 91 and 135 operators. Among its contiguous states, Virginia outfits the highest percentage of public-use airports with general aviation terminal facilities (≈91%). Additionally, Virginia ranks first among contiguous states in the percent-age of airports with paved aircraft parking aprons (≈97%).
Although the Commonwealth ranks first in four of the ten services and amenities categories, there is room to expand upon the current infrastructure at the public-use airports. Tennessee represents Virginia’s greatest competition, rank-ing first in categories relating to:
• 100 low lead and jet fuel facilities• 5,000-foot runways
The combined effect of these first-place rankings may factor into corporate jet operators locating in Tennessee due to the relative ease of access to its public-use airports.
Competitive Analysis of Virginia’s Aviation Industry | 17
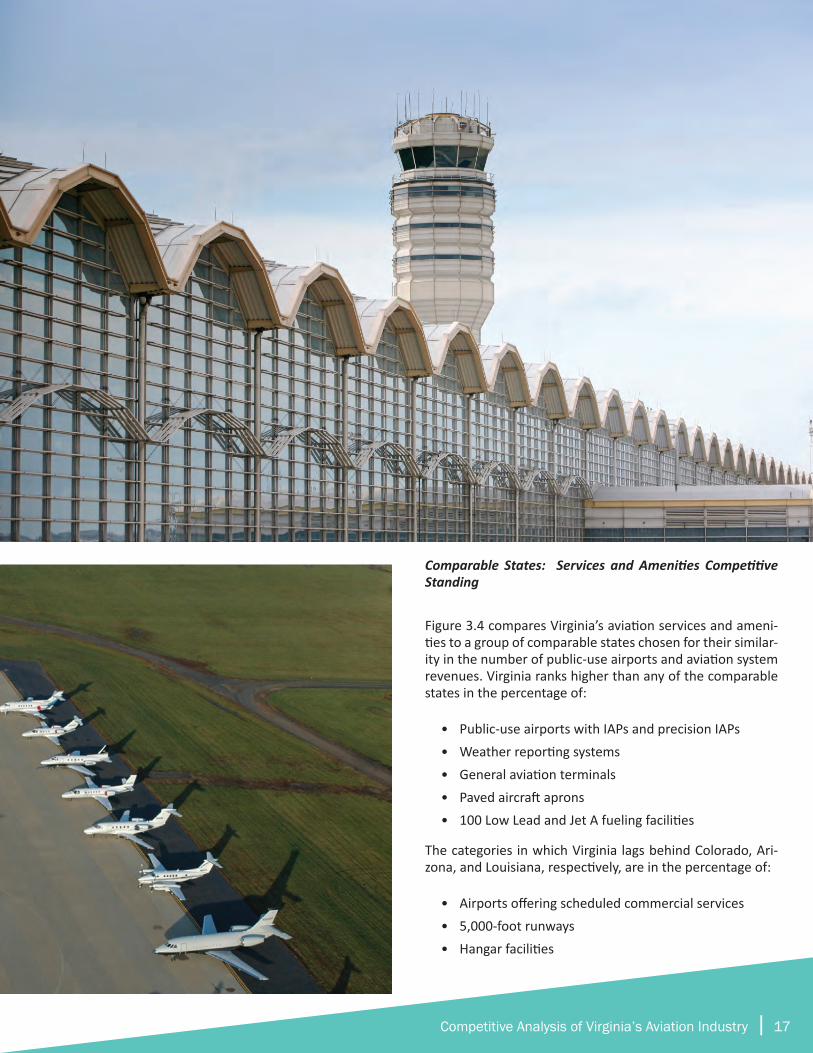
Comparable States: Services and Amenities Competitive Standing
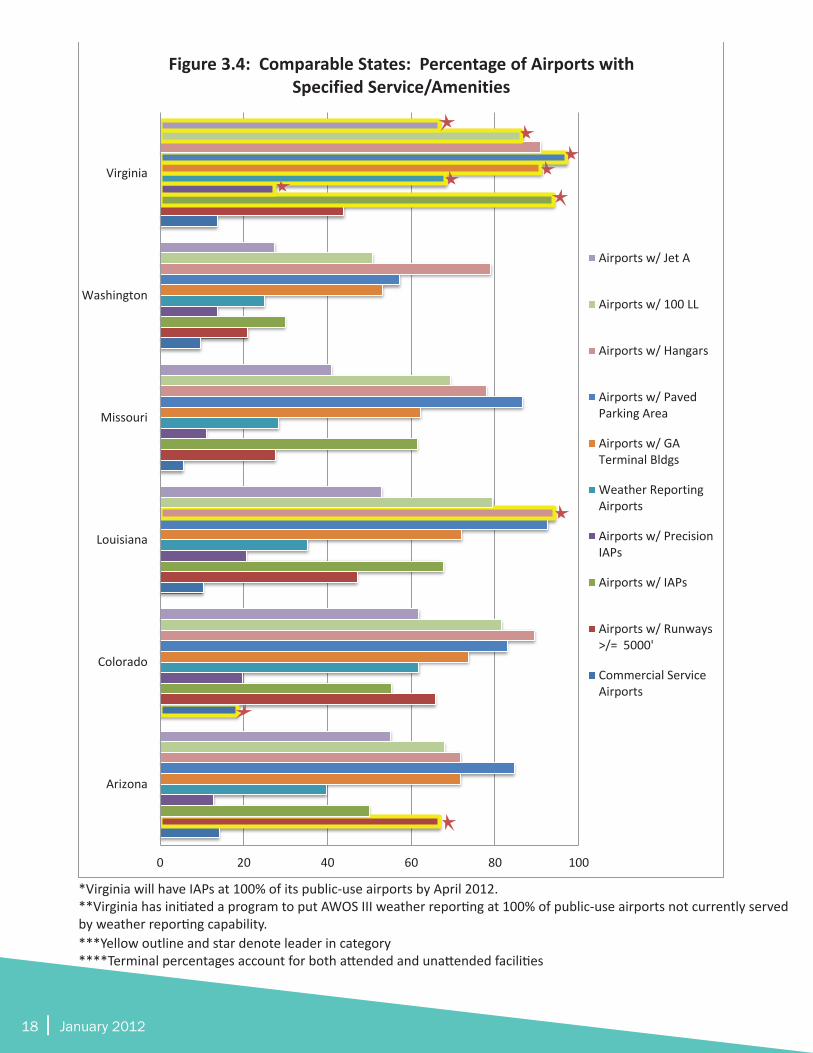
Figure 3.4 compares Virginia’s aviation services and ameni-ties to a group of comparable states chosen for their similar-ity in the number of public-use airports and aviation system revenues. Virginia ranks higher than any of the comparable states in the percentage of:
• Public-use airports with IAPs and precision IAPs • Weather reporting systems• General aviation terminals• Paved aircraft aprons• 100 Low Lead and Jet A fueling facilities
The categories in which Virginia lags behind Colorado, Ari-zona, and Louisiana, respectively, are in the percentage of:
• Airports offering scheduled commercial services• 5,000-foot runways• Hangar facilities
18 | January 2012
0 20 40 60 80 100
Arizona
Colorado
Louisiana
Missouri
Washington
Virginia
Figure 3.4: Comparable States: Percentage of Airports with Specified Service/Amenities
Airports w/ Jet A
Airports w/ 100 LL
Airports w/ Hangars
Airports w/ PavedParking Area
Airports w/ GATerminal Bldgs
Weather ReportingAirports
Airports w/ PrecisionIAPs
Airports w/ IAPs
Airports w/ Runways>/= 5000'
Commercial ServiceAirports
*Virginia will have IAPs at 100% of its public-use airports by April 2012.**Virginia has initiated a program to put AWOS III weather reporting at 100% of public-use airports not currently served by weather reporting capability.***Yellow outline and star denote leader in category****Terminal percentages account for both attended and unattended facilities
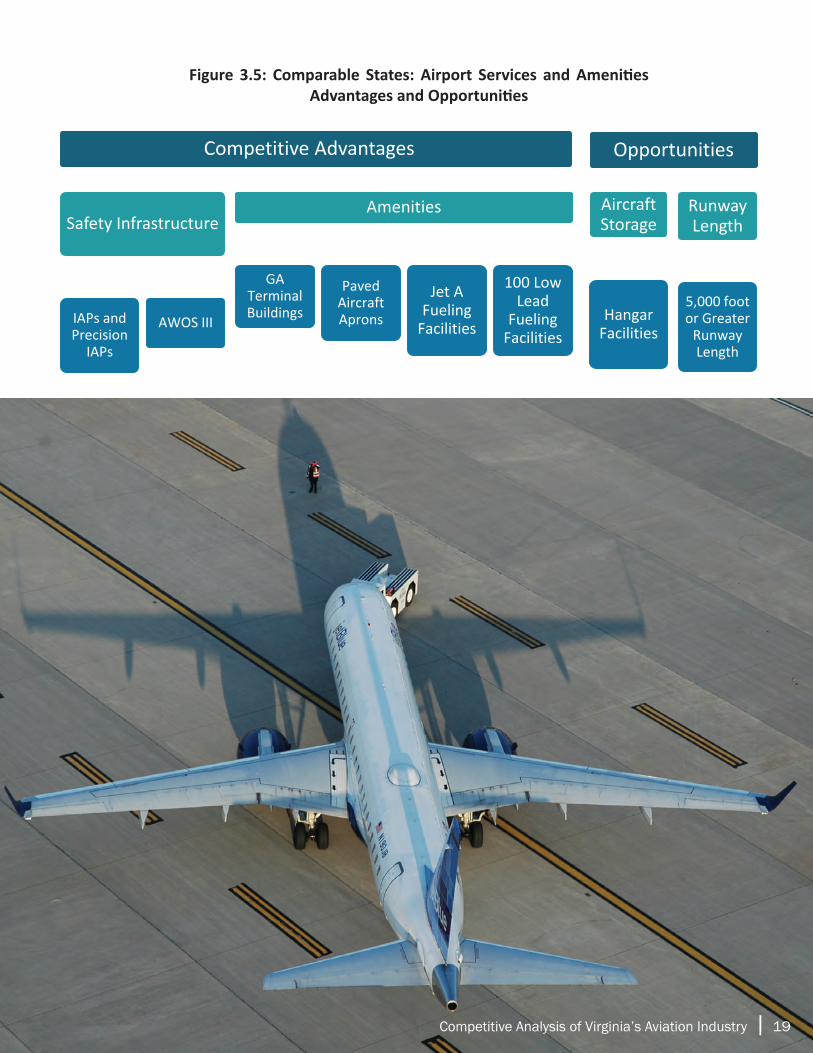
Figure 3.5: Comparable States: Percentage of Airports with Specified Service/Amenities
Competitive Advantages
Safety Infrastructure
IAPs and Precision
IAPs
AWOS III
Amenities
GA Terminal Buildings
Paved Aircraft Aprons
Jet A Fueling
Facilities
100 Low Lead
Fueling Facilities
Opportunities
Aircraft Storage
Hangar Facilities
Runway Length
5,000 foot or Greater
Runway Length
Competitive Analysis of Virginia’s Aviation Industry | 19
Figure 3.5: Comparable States: Airport Services and Amenities Advantages and Opportunities

20 | January 2012
0 10 20 30 40 50 60 70 80 90 100
North Carolina
South Carolina
Georgia
Alabama
Virginia
Figure 3.6: Competitor States: Percentage of Airports with Specified Service/Amenities
Airports w/ Jet A
Airports w/ 100 LL
Airports w/Hangars
Airports w/ PavedParking Area
Airports w/ GATerminal Bldgs
Weather ReportingAirports
Airports w/Precision IAPs
Airports w/ IAPs
Airports w/Runways >/= 5000'
Commercial ServiceAirports
Competitor States: Services and Amenities Competitive Standing
According to the VEDP, Virginia often competes with North Carolina, South Carolina, Georgia, and Alabama for aviation-re-lated economic development opportunities. Figure 3.6 shows how Virginia compares to these states in aviation services and amenities.
*Virginia will have IAPs at 100% of its public-use airports by April 2012.**Virginia has initiated a program to put AWOS III weather reporting at 100% of public-use airports not currently served by weather reporting capability.***Yellow outline and star denote leader in category****Terminal percentages account for both attended and unattended facilities
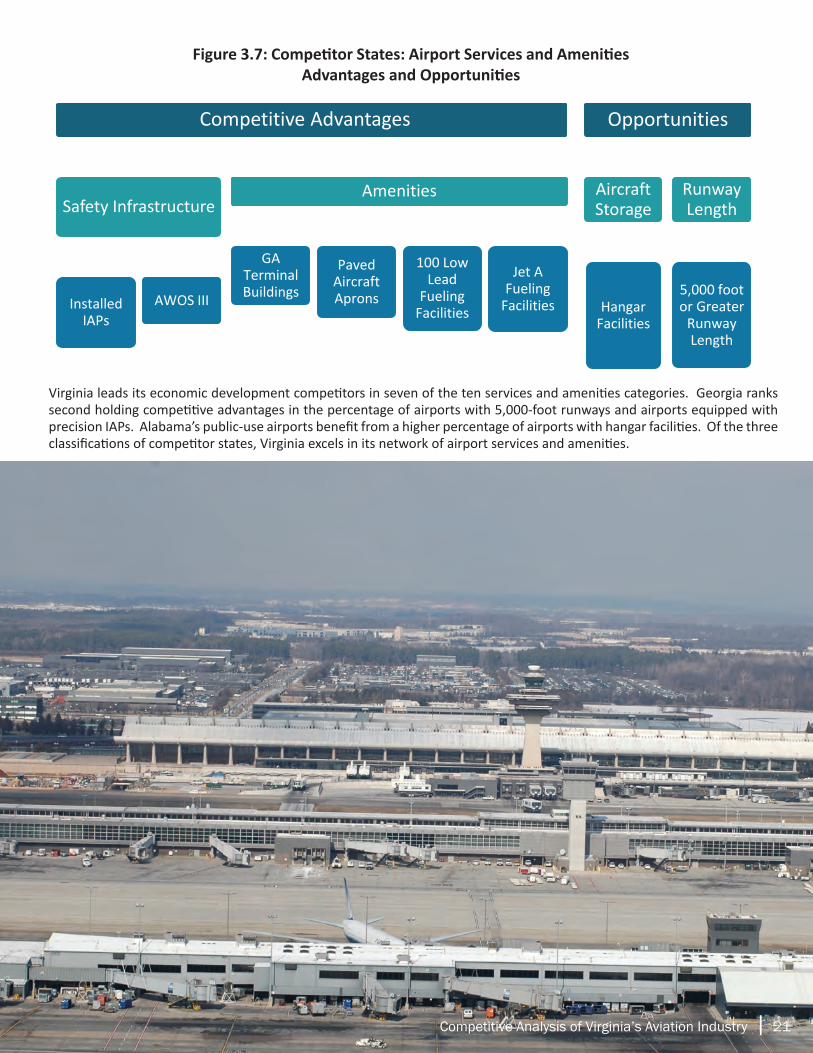
Figure 3.7: Competitor States: Percentage of Airports with Specified Service/Amenities
Competitive Advantages
Safety Infrastructure
Installed IAPs
AWOS III
Amenities
GA Terminal Buildings
Paved Aircraft Aprons
100 Low Lead
Fueling Facilities
Jet A Fueling
Facilities
Opportunities
Aircraft Storage
Hangar Facilities
Runway Length
5,000 foot or Greater
Runway Length
Competitive Analysis of Virginia’s Aviation Industry | 21
Figure 3.7: Competitor States: Airport Services and Amenities Advantages and Opportunities
Virginia leads its economic development competitors in seven of the ten services and amenities categories. Georgia ranks second holding competitive advantages in the percentage of airports with 5,000-foot runways and airports equipped with precision IAPs. Alabama’s public-use airports benefit from a higher percentage of airports with hangar facilities. Of the three classifications of competitor states, Virginia excels in its network of airport services and amenities.
22 | January 2012
4. COMPETITIVENESS OF VIRGINIA’S AVIATION POLICY
4.1 POLICY ENVIRONMENTCommercial Aviation
Regulations governing commercial aircraft and air carrier airport operations are largely federal and do not, therefore, vary greatly from state-to-state. Many of the policies and regulations dictating commercial aviation originate with the FAA and are administered with little state input. The FAA regulates the various types and uses of aircraft, air-port safety and security, airport environmental impact, and also administers various airport improvement grants and funds. Federal dollars are allocated to eligible public-use airports to guide airport planning, design, and construction of aviation infrastructure and facilities.38 In order to meet eligibility, airports must serve a role in the National Plan of Integrated Airport Systems (NPIAS). NPIAS airports are also determined to have a significant impact on national air travel and warrant federal dollars to ensure that they oper-ate at elevated standards. The majority of the key states analyzed within this study, including Virginia, provide NPIAS airports varying levels of funding to assist in their develop-ment. However, while aviation regulations are administered from a federal top-down approach, states retain the ability to influence their air transportation system’s competitive-ness in their taxing and program funding policies.
General Aviation
The FAA centrally regulates general aviation activity at the federal level, though many states have recently taken the initiative to enact promotions and policies that increase awareness of its functions and benefits. Virginia leaders are advertising the connections between a strong network of general aviation airports and economic vitality in the private industry. Acknowledging these connections is not a principle that is confined to Virginia, as shown by recent promotional and policy initiatives in states with comparable general aviation infrastructure. Business growth through general aviation stands as a top trend in the industry. Virgin-ia became the most recent state to call for aviation-related awareness when Governor Bob McDonnell declared August 2011 “Virginia Aviation Month.”39 With this proclamation, Virginia joins the majority of the other contiguous, compa-rable, and competitor states that have formally allocated
38 DOAV, Airport Program Manual (PDF file), p. 4, August 2011, available at http://tinyurl.com/72uznma [accessed December 5, 2011]39 Aviation Across America. “Certificate of Recognition: Virginia Aviation Month”. Available at http://www.aviationacrossamerica.org/uploadedFiles/News/Press_Releases/VA%20Certificate%20of%20Recognition%202011.pdf [ac-cessed 7 December 2011]
dates to acknowledge the jobs and economic benefit pro-vided by the state’s aviation system. Of the three categories of key states, only Louisiana, Arizona, and Alabama have not formally recognized the job growth and economic benefits of the state’s aviation system.40
4.2 COMPARISON OF REVENUE STRUCTURE
While airport and aircraft regulations originate at the federal level, funding policy and programs vary from state-to-state. The revenue structure of a state’s public aviation operation is a critical factor in determining the success and competi-tiveness of the aviation industry. Tax revenue structure is an especially salient factor for the industry due to the high costs and numerous regulations associated with aviation ac-tivity. To determine a state’s competitive standing relating to its revenue structure, analyses must include an examina-tion of the state administered programs funded through tax revenues. The following section highlights Conklin and de Decker’s State Aviation Tax and Funding Study contracted as a part of this overall study, to help determine Virginia’s standing among the various classifications of competitors regarding tax structure and levels of annual revenue.
40 “Alliance for Aviation Across America Proclamation-Signing Celebration with Georgia Governor Sonny Perdue Recognizing the Value of General Aviation,” AAAA press release, October 7, 2009, on AAAA website, <http://www.aviation-acrossamerica.org/Press_Release_Detail.aspx?id=21347>
Competitive Analysis of Virginia’s Aviation Industry | 23
29
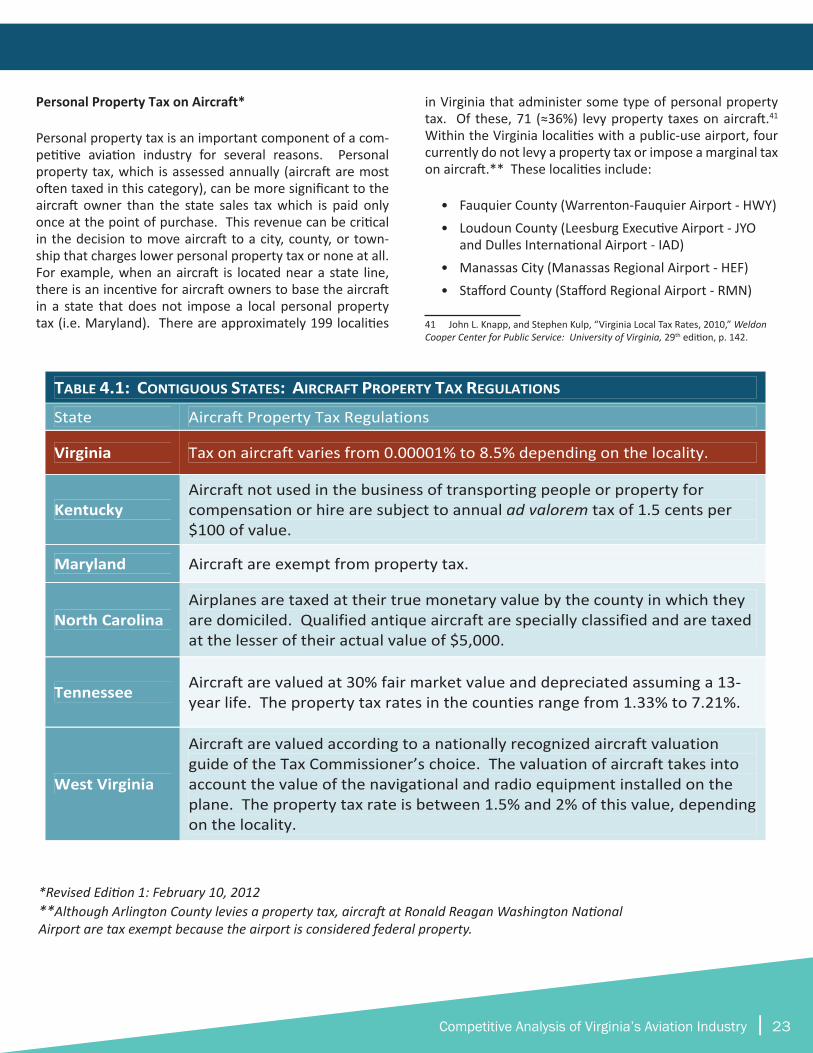
TABLE 4.1: CONTIGUOUS STATES: AIRCRAFT PROPERTY TAX REGULATIONS
State Aircraft Property Tax Regulations
Virginia Tax on aircraft varies from 0.00001% to 8.5% depending on the locality.
Kentucky Aircraft not used in the business of transporting people or property for compensation or hire are subject to annual ad valorem tax of 1.5 cents per $100 of value.
Maryland Aircraft are exempt from property tax.
North Carolina Airplanes are taxed at their true monetary value by the county in which they are domiciled. Qualified antique aircraft are specially classified and are taxed at the lesser of their actual value of $5,000.
Tennessee Aircraft are valued at 30% fair market value and depreciated assuming a 13‐year life. The property tax rates in the counties range from 1.33% to 7.21%.
West Virginia
Aircraft are valued according to a nationally recognized aircraft valuation guide of the Tax Commissioner’s choice. The valuation of aircraft takes into account the value of the navigational and radio equipment installed on the plane. The property tax rate is between 1.5% and 2% of this value, depending on the locality.
Personal Property Tax on Aircraft*
Personal property tax is an important component of a com-petitive aviation industry for several reasons. Personal property tax, which is assessed annually (aircraft are most often taxed in this category), can be more significant to the aircraft owner than the state sales tax which is paid only once at the point of purchase. This revenue can be critical in the decision to move aircraft to a city, county, or town-ship that charges lower personal property tax or none at all. For example, when an aircraft is located near a state line, there is an incentive for aircraft owners to base the aircraft in a state that does not impose a local personal property tax (i.e. Maryland). There are approximately 199 localities
in Virginia that administer some type of personal property tax. Of these, 71 (≈36%) levy property taxes on aircraft.41 Within the Virginia localities with a public-use airport, four currently do not levy a property tax or impose a marginal tax on aircraft.** These localities include:
• Fauquier County (Warrenton-Fauquier Airport - HWY)• Loudoun County (Leesburg Executive Airport - JYO
and Dulles International Airport - IAD)• Manassas City (Manassas Regional Airport - HEF)• Stafford County (Stafford Regional Airport - RMN)
41 John L. Knapp, and Stephen Kulp, “Virginia Local Tax Rates, 2010,” Weldon Cooper Center for Public Service: University of Virginia, 29th edition, p. 142.
*Revised Edition 1: February 10, 2012**Although Arlington County levies a property tax, aircraft at Ronald Reagan Washington National Airport are tax exempt because the airport is considered federal property.
24 | January 2012
1
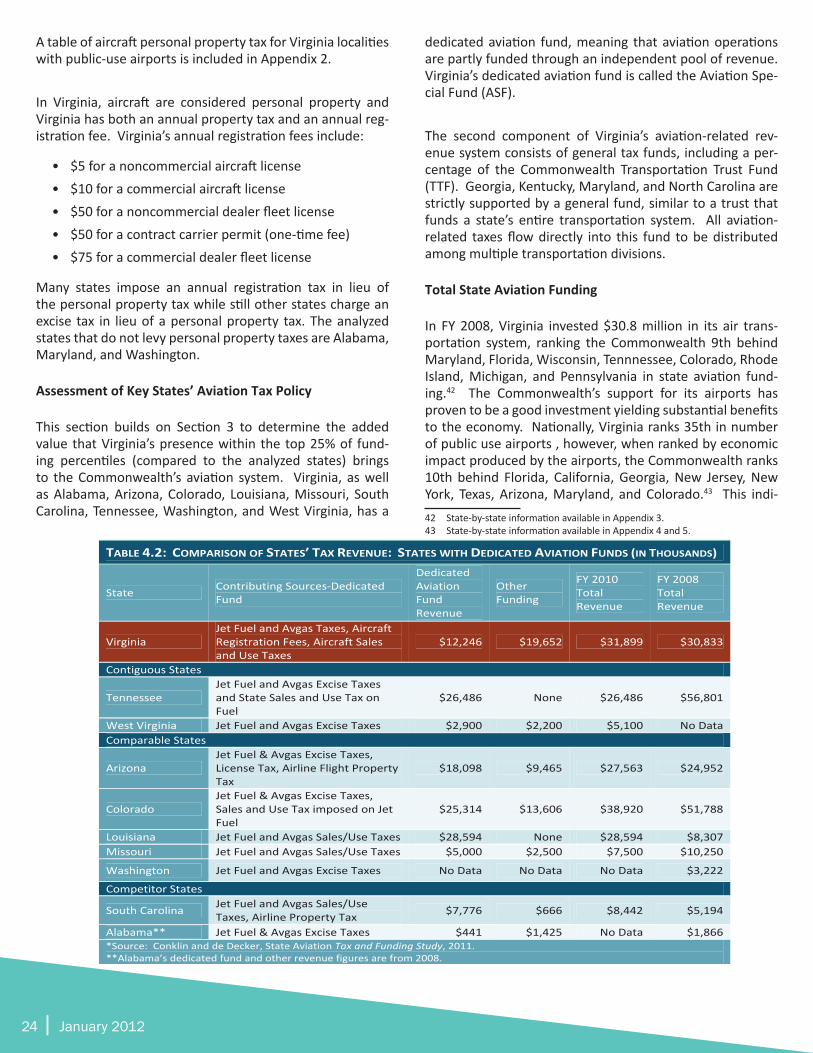
TABLE 4.2: COMPARISON OF STATES’ TAX REVENUE: STATES WITH DEDICATED AVIATION FUNDS (IN THOUSANDS)
State Contributing Sources‐Dedicated Fund
Dedicated Aviation Fund Revenue
Other Funding
FY 2010 Total Revenue
FY 2008 Total Revenue
Virginia Jet Fuel and Avgas Taxes, Aircraft Registration Fees, Aircraft Sales and Use Taxes
$12,246 $19,652 $31,899 $30,833
Contiguous States
Tennessee Jet Fuel and Avgas Excise Taxes and State Sales and Use Tax on Fuel
$26,486 None $26,486 $56,801
West Virginia Jet Fuel and Avgas Excise Taxes $2,900 $2,200 $5,100 No Data Comparable States
Arizona Jet Fuel & Avgas Excise Taxes, License Tax, Airline Flight Property Tax
$18,098 $9,465 $27,563 $24,952
Colorado Jet Fuel & Avgas Excise Taxes, Sales and Use Tax imposed on Jet Fuel
$25,314 $13,606 $38,920 $51,788
Louisiana Jet Fuel and Avgas Sales/Use Taxes $28,594 None $28,594 $8,307 Missouri Jet Fuel and Avgas Sales/Use Taxes $5,000 $2,500 $7,500 $10,250
Washington Jet Fuel and Avgas Excise Taxes No Data No Data No Data $3,222
Competitor States
South Carolina Jet Fuel and Avgas Sales/Use Taxes, Airline Property Tax $7,776 $666 $8,442 $5,194
Alabama** Jet Fuel & Avgas Excise Taxes $441 $1,425 No Data $1,866 *Source: Conklin and de Decker, State Aviation Tax and Funding Study, 2011. **Alabama’s dedicated fund and other revenue figures are from 2008.
A table of aircraft personal property tax for Virginia localities with public-use airports is included in Appendix 2.
In Virginia, aircraft are considered personal property and Virginia has both an annual property tax and an annual reg-istration fee. Virginia’s annual registration fees include:
• $5 for a noncommercial aircraft license • $10 for a commercial aircraft license• $50 for a noncommercial dealer fleet license • $50 for a contract carrier permit (one-time fee)• $75 for a commercial dealer fleet license
Many states impose an annual registration tax in lieu of the personal property tax while still other states charge an excise tax in lieu of a personal property tax. The analyzed states that do not levy personal property taxes are Alabama, Maryland, and Washington.
Assessment of Key States’ Aviation Tax Policy
This section builds on Section 3 to determine the added value that Virginia’s presence within the top 25% of fund-ing percentiles (compared to the analyzed states) brings to the Commonwealth’s aviation system. Virginia, as well as Alabama, Arizona, Colorado, Louisiana, Missouri, South Carolina, Tennessee, Washington, and West Virginia, has a
dedicated aviation fund, meaning that aviation operations are partly funded through an independent pool of revenue. Virginia’s dedicated aviation fund is called the Aviation Spe-cial Fund (ASF).
The second component of Virginia’s aviation-related rev-enue system consists of general tax funds, including a per-centage of the Commonwealth Transportation Trust Fund (TTF). Georgia, Kentucky, Maryland, and North Carolina are strictly supported by a general fund, similar to a trust that funds a state’s entire transportation system. All aviation-related taxes flow directly into this fund to be distributed among multiple transportation divisions.
Total State Aviation Funding
In FY 2008, Virginia invested $30.8 million in its air trans-portation system, ranking the Commonwealth 9th behind Maryland, Florida, Wisconsin, Tennnessee, Colorado, Rhode Island, Michigan, and Pennsylvania in state aviation fund-ing.42 The Commonwealth’s support for its airports has proven to be a good investment yielding substantial benefits to the economy. Nationally, Virginia ranks 35th in number of public use airports , however, when ranked by economic impact produced by the airports, the Commonwealth ranks 10th behind Florida, California, Georgia, New Jersey, New York, Texas, Arizona, Maryland, and Colorado.43 This indi-42 State-by-state information available in Appendix 3.43 State-by-state information available in Appendix 4 and 5.
Competitive Analysis of Virginia’s Aviation Industry | 25
cates that the value of Virginia’s Air Transportation System is especially high.
Virginia is ranked third when compared to contiguous, comparable, and competitor states in total, state aviation-related revenue levied in FY 2010 collecting roughly $31 million.44 Maryland topped the list of 14 states, drawing $193.8 million from its transportation trust fund. Colora-do ranked second with $38.9 million in total state revenue. While Virginia received $71 million in federal funding in FY 2010, these figures, as is the case with the remainder of the key study states, are not included when ranking according to state-specific revenue.45
Dedicated Aviation Funding
Conklin and de Decker’s State Aviation Tax and Funding Study explains that of the states included in this competi-tive analysis, typically those operating under dedicated avia-tion funds are fed through fuel taxes and aircraft registration fees. As 4.2 shows, Virginia follows this trend while also em-ploying a one-time, 2% sales and use tax on aircraft levied upon purchase or registration within the Commonwealth. This segment of the ASF amounted to roughly 68% of the fund’s revenue and 31% of the total aviation system revenue in 2010. The bulk of Virginia’s total revenue came from the Commonwealth’s Transportation Trust Fund (TTF) at $18.7 million in FY 2010. The Virginia aviation fuel sales tax con-tributes $.015 per gallon of fuel sold in Virginia to the Com-monwealth’s TTF. 2.4% of the TTF is then allocated to DOAV in operation of the Commonwealth’s aviation system.46
Although Virginia ranks third in total revenue compared to all of the states analyzed, it ranks second behind Colorado when compared to states with dedicated aviation funds.
Important to note are the differences in the components that constitute Virginia and Colorado’s dedicated aviation funds. Virginia’s ASF revenue structure is more diversified, encompassing three sources of tax funding. They are:
• Aircraft sales and use tax• Aircraft registration fees• Jet fuel and Avgas excise taxes
Colorado on the other hand is strictly dependent on the amount of aviation fuel purchased within the state. Fluctu-ating market trends therefore heavily influence the opera-tion of Colorado’s aviation system. While the discovery of a one-time lump sum artificially inflated Colorado’s FY 2008 total revenue, commercial service cutbacks and rising fuel
44 Nel Stubbs, “State Aviation Tax and Funding Study,” performed for the Virginia Department of Aviation by Conklin and de Decker45 DOAV, “Finance and Administration,”mhttp://www.doav.virginia.gov/fi-nance_admin_division.htm [accessed December 12, 2011]46 Virginia Department of Aviation
prices helped to contribute to the nearly 25% decrease in total revenue for 2010.
Tennessee provides another example of the effect that fluctuating market trends can have on an aviation system funded strictly through fuel taxes. From FY 2008 to FY 2010, Tennessee’s total aviation system revenue dropped 53%. Tennessee’s dedicated fund inherently double-taxes avia-tion fuel through excise and sales and use levies. When the commercial air services market contracted between 2008 and 2010, fuel consumption dropped, causing Tennessee’s aviation system to take a major revenue loss. Over the same period, Virginia’s revenues grew 9.5%, while aviation fuel tax revenue grew at 6%.47
Sales and Use Tax
Virginia compares favorably with the three classifications of competitor states in the various facets of tax policy re-lating to aviation system operation. At 2% of the value of the aircraft, Virginia’s sales and use tax rate is tied with Ala-bama for being the lowest of all fourteen states included in the analysis. Nationally, only four states and the District of Columbia do not levy this tax. These states are Alaska, Montana, New Hampshire, and Oregon.48 Of those states taxing aircraft sales and use, only Delaware levies a lower percentage than Virginia and Alabama at .384% of the air-craft value. Important to note, however, is that North and South Carolina place a $1,500 and $300 respective cap on the tax, which may result in a lower tax overall.49
“Fly Away” Exemption
In 2011, Virginia enacted a “Fly Away” exemption, allow-ing aircraft purchased by a “nonresident” to be removed within 60 days of purchase to forego registration and sales and use taxes.50 Virginia is one of seven states included in the study to grant this exemption, and aside from Tennes-see, the only among the contiguous states. Virginia is also one of ten states to exempt certain aircraft labor costs. In most cases, Virginia, Alabama, Arizona, Colorado, Georgia, Kentucky, Maryland, Missouri, North Carolina, and South Carolina exempt labor costs on aircraft if the labor is stated separately on the work invoice, and given that the labor is not of a manufacturing or fabrication nature.51
47 Virginia Department of Aviation, “Monthly Revenue Collections-Major Revenue Sources-Fund.”48 Virginia Department of Aviation, “Public Facilities by State and Ranking,” See the entire list in Appendix 3.49 Nel Stubbs, “Tax and Funding Study,” completed for the Virginia Department of Aviation by Conklin and de Decker50 Virginia Department of Aviation, “Aircraft Licensing,” http://www.doav.virginia.gov/licensing_aircraft.htm [accessed December 12, 2011]51 Nel Stubbs, “Tax and Funding Study,” completed for the Virginia Department of Aviation by Conklin and de Decker.
26 | January 2012
TABLE 4.3: FUEL EXCISE AND SALES TAX RATES Jet Fuel Taxes Avgas Taxes
Excise Tax (per gallon) Sales Tax
$5 Gallon – Tax Added
Excise Tax (per gallon) Sales Tax
$5 Gallon – Tax Added
Virginia $0.050 0.00% $5.05 $0.050 0.00% $5.05 Contiguous States Kentucky $0.000 6.00% $5.30 $0.218 0.00% $5.22 Maryland $0.070 0.00% $5.07 $0.070 0.00% $5.07 North Carolina $0.000 4.75% $5.24 $0.000 4.75% $5.24 Tennessee $0.014 4.50% $5.24 $0.014 4.50% $5.24 West Virginia $0.120 0.00% $5.12 $0.120 0.00% $5.12 Comparable States Arizona $0.031 0.00% $5.03 $0.050 0.00% $5.05 Colorado $0.040 2.90% $5.18 $0.060 0.00% $5.06 Louisiana $0.000 4.00% $5.20 $0.200 4.00% $5.40 Missouri $0.000 4.23% $5.22 $0.090 0.00% $5.09 Washington $0.110 6.50% $5.44 $0.110 6.50% $5.44 Competitor States Alabama $0.009 0.00% $5.01 $0.030 0.00% $5.03 Georgia $0.000 4.00% $5.20 $0.010 4.00% $5.21 South Carolina $0.000 6.00% $5.30 $0.000 6.00% $5.30 *Source: Conklin and de Decker, Tax and Funding Study, 2011.
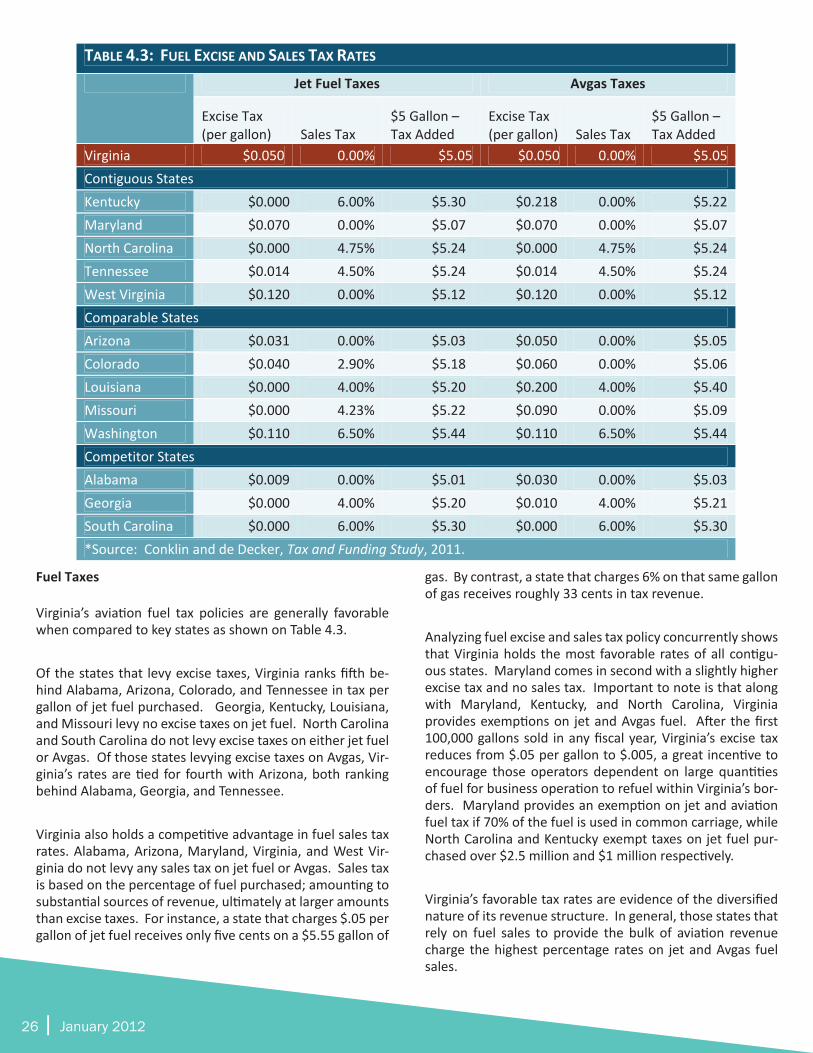
Fuel Taxes
Virginia’s aviation fuel tax policies are generally favorable when compared to key states as shown on Table 4.3.
Of the states that levy excise taxes, Virginia ranks fifth be-hind Alabama, Arizona, Colorado, and Tennessee in tax per gallon of jet fuel purchased. Georgia, Kentucky, Louisiana, and Missouri levy no excise taxes on jet fuel. North Carolina and South Carolina do not levy excise taxes on either jet fuel or Avgas. Of those states levying excise taxes on Avgas, Vir-ginia’s rates are tied for fourth with Arizona, both ranking behind Alabama, Georgia, and Tennessee.
Virginia also holds a competitive advantage in fuel sales tax rates. Alabama, Arizona, Maryland, Virginia, and West Vir-ginia do not levy any sales tax on jet fuel or Avgas. Sales tax is based on the percentage of fuel purchased; amounting to substantial sources of revenue, ultimately at larger amounts than excise taxes. For instance, a state that charges $.05 per gallon of jet fuel receives only five cents on a $5.55 gallon of
gas. By contrast, a state that charges 6% on that same gallon of gas receives roughly 33 cents in tax revenue.
Analyzing fuel excise and sales tax policy concurrently shows that Virginia holds the most favorable rates of all contigu-ous states. Maryland comes in second with a slightly higher excise tax and no sales tax. Important to note is that along with Maryland, Kentucky, and North Carolina, Virginia provides exemptions on jet and Avgas fuel. After the first 100,000 gallons sold in any fiscal year, Virginia’s excise tax reduces from $.05 per gallon to $.005, a great incentive to encourage those operators dependent on large quantities of fuel for business operation to refuel within Virginia’s bor-ders. Maryland provides an exemption on jet and aviation fuel tax if 70% of the fuel is used in common carriage, while North Carolina and Kentucky exempt taxes on jet fuel pur-chased over $2.5 million and $1 million respectively.
Virginia’s favorable tax rates are evidence of the diversified nature of its revenue structure. In general, those states that rely on fuel sales to provide the bulk of aviation revenue charge the highest percentage rates on jet and Avgas fuel sales.
Competitive Analysis of Virginia’s Aviation Industry | 27
Common Carrier Sales and Use Tax Exemption
There are a number of areas in which Virginia does not com-pete as closely with the three classifications of competitor states. First, all contiguous states offer common carrier sales and use tax exemptions for Part 135 aircraft. These states either exempt Part 135 aircraft operating in the conveyance of persons or property, interstate, or foreign commerce, or in North Carolina’s case, make no distinction between Part 135 and 121 and merely cap the tax at $1,500.52 Maryland is the most lenient of all states analyzed by not requiring aircraft to be commercially certified, only that the aircraft be used “principally in interstate commerce,” be it Part 121, 135, or 91.53
Of the 14 states analyzed, Virginia, Alabama, and Arizona only exempt airline (Part 121) operators from paying any sales and use tax on aircraft. South Carolina does not ex-empt any aircraft, but caps its sales and use tax at $300 per aircraft. Finally, the remaining states exempt Part 135 air-craft operating “principally” or “exclusively” in interstate or foreign commerce. Missouri is the only exception, making a distinction between common carriers (Part 121) and con-tract carriers (Part 135). It offers the exemption to common carrier aircraft and non contract carriers.54
Over the six-year period, from 2005-2010, Virginia brought in $2,109,104 in sales taxes, ranging from $1,362 in FY 2008, a slow year in aircraft sales and registrations, to $1,448,490 in FY 2009. These taxes were levied from ten of the 35 Part 135 certified companies registered with DOAV.55
DOAV’s sales and use tax figures represent those aircraft that are owned by the Part 135 charter operation companies; they do not factor in aircraft that are leased by the charter companies. Because many aircraft charter companies also perform aircraft management functions, a large percent-age use their fleet for on-demand charter services. In most cases, other individuals and businesses own aircraft in the management fleet. These operators arrange lease agree-ments with the management companies to share charter revenues, offsetting ownership expenses.
One challenge of enacting and enforcing a Part 135 sales and use tax exemption is that many of the Part 91 companies can potentially attain Part 135 certification that might result in a significant decrease in the amount of (ASF) revenue to be invested back into Virginia’s aviation system. A large rev-enue reduction in the 2% sales and use tax would negatively impact the Commonwealth’s ability to provide funding for its airport programs, as it accounts for 68% of the ASF.56
52 Ibid.53 Ibid.54 Ibid.55 Data provided by the Virginia Department of Aviation.56 Nel Stubbs, “Tax and Funding Study,” completed for the Virginia Department of Aviation by Conklin and de Decker Associates, Inc.
Resale/Lessor Exception
A second area in which Virginia’s tax policy does not align with the thirteen states examined for this study is in a re-sale/lessor exception. Virginia is the only state not to offer a blanket resale/lessor exception, which states that a single entity can purchase an aircraft for lease or resale and collect and remit the sales and use tax on the lease payments. Vir-ginia does, however, offer this exception for registered deal-ers, which includes those in the regular business of selling aircraft. Registered dealers must own five or more aircraft at any time during the calendar year for which the exception is employed. The exception is one that benefits the lessor/lessee in that the lessor, the single purpose entity, leases the aircraft to an operating entity for their use and collects and remits the use tax on the lease payments. This option ben-efits the lessee by enabling them to spread the sales/use tax out over a period of time, allowing both to manage costs.57
In consulting with Virginia’s Taxation Department, DOAV found that the statute is currently written in a way that re-duces the propensity for single entities to abuse their ben-efits. Allowing an entity to purchase a single aircraft, ex-empt for resale, and collect the 2% aircraft tax on the lease payments creates a loophole to essentially avoid the tax. Creating a leasing company is a commonly used technique to defer payment of sales and use tax. This allows for a tax deferral, as the sale of the aircraft to the leasing company is exempt from initial sales tax. Sales tax is then charged on the lease payments.58
Programs and Services Funded Through Tax Revenue
Virginia’s ASF is a user-pay, user-benefit system. The ASF is entirely based on taxes levied on aircraft operators’ uti-lization of the Commonwealth’s Air Transportation System. The ASF, in its entirety, then returns to operators in the form of programs and technical services to the benefit of all that utilize the Commonwealth’s public-use airports. In FY 2010, Virginia’s ASF provided $12.2 million in collected fuel tax, aircraft sales and use tax, and aircraft registration fees to fund the program categories described in Figure 4.1.
Programs made possible by the ASF include:
• The Facilities and Equipment (F&E) Program; • Maintenance Program;• Security Program; • Aviation Promotion Program;• And the Air Service Development and Enhancement
Program57 Nel Stubbs, “Tax and Funding Study,” performed for the Virginia Department of Aviation by Conklin and de Decker Associates, Inc.58 Information provided by DOAV Aircraft Licensing Manager.
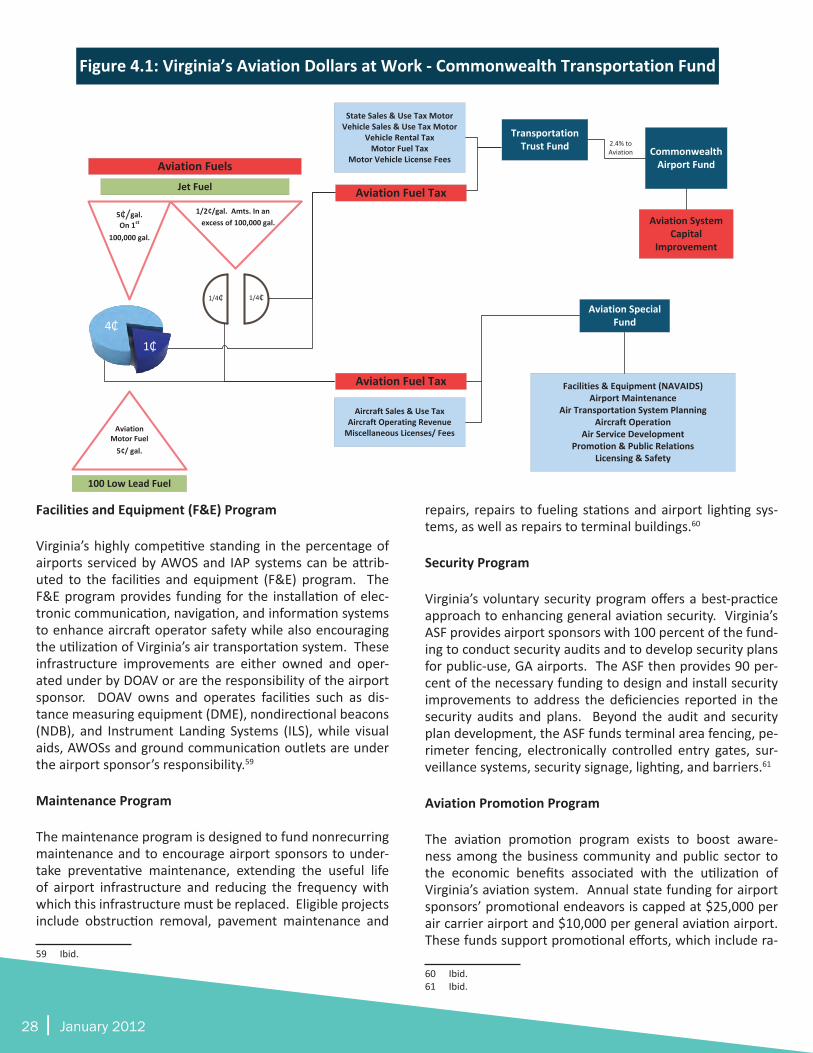
28 | January 2012
Figure 4.1: Virginia’s Aviation Dollars at Work - Commonwealth Transportation Fund
Aviation Fuels
State Sales & Use Tax Motor Vehicle Sales & Use Tax Motor
Vehicle Rental TaxMotor Fuel Tax
Motor Vehicle License Fees
Aviation Fuel Tax
Aircraft Sales & Use TaxAircraft Operating Revenue
Miscellaneous Licenses/ Fees
Commonwealth Airport Fund
Aviation System Capital
Improvement
Aviation Special Fund
Facilities & Equipment (NAVAIDS)Airport Maintenance
Air Transportation System PlanningAircraft Operation
Air Service DevelopmentPromotion & Public Relations
Licensing & Safety
5 gal.On 1st
100,000 gal.
1/2¢/gal. Amts. In an excess of 100,000 gal.
1/4 1/4
Transportation Trust Fund
Aviation Fuel Tax
2.4% to Aviation
4₵
1₵
Aviation Motor Fuel
5¢/ gal.
Jet Fuel
100 Low Lead Fuel
Facilities and Equipment (F&E) Program
Virginia’s highly competitive standing in the percentage of airports serviced by AWOS and IAP systems can be attrib-uted to the facilities and equipment (F&E) program. The F&E program provides funding for the installation of elec-tronic communication, navigation, and information systems to enhance aircraft operator safety while also encouraging the utilization of Virginia’s air transportation system. These infrastructure improvements are either owned and oper-ated under by DOAV or are the responsibility of the airport sponsor. DOAV owns and operates facilities such as dis-tance measuring equipment (DME), nondirectional beacons (NDB), and Instrument Landing Systems (ILS), while visual aids, AWOSs and ground communication outlets are under the airport sponsor’s responsibility.59
Maintenance Program
The maintenance program is designed to fund nonrecurring maintenance and to encourage airport sponsors to under-take preventative maintenance, extending the useful life of airport infrastructure and reducing the frequency with which this infrastructure must be replaced. Eligible projects include obstruction removal, pavement maintenance and
59 Ibid.
repairs, repairs to fueling stations and airport lighting sys-tems, as well as repairs to terminal buildings.60
Security Program
Virginia’s voluntary security program offers a best-practice approach to enhancing general aviation security. Virginia’s ASF provides airport sponsors with 100 percent of the fund-ing to conduct security audits and to develop security plans for public-use, GA airports. The ASF then provides 90 per-cent of the necessary funding to design and install security improvements to address the deficiencies reported in the security audits and plans. Beyond the audit and security plan development, the ASF funds terminal area fencing, pe-rimeter fencing, electronically controlled entry gates, sur-veillance systems, security signage, lighting, and barriers.61
Aviation Promotion Program
The aviation promotion program exists to boost aware-ness among the business community and public sector to the economic benefits associated with the utilization of Virginia’s aviation system. Annual state funding for airport sponsors’ promotional endeavors is capped at $25,000 per air carrier airport and $10,000 per general aviation airport. These funds support promotional efforts, which include ra-
60 Ibid.61 Ibid.
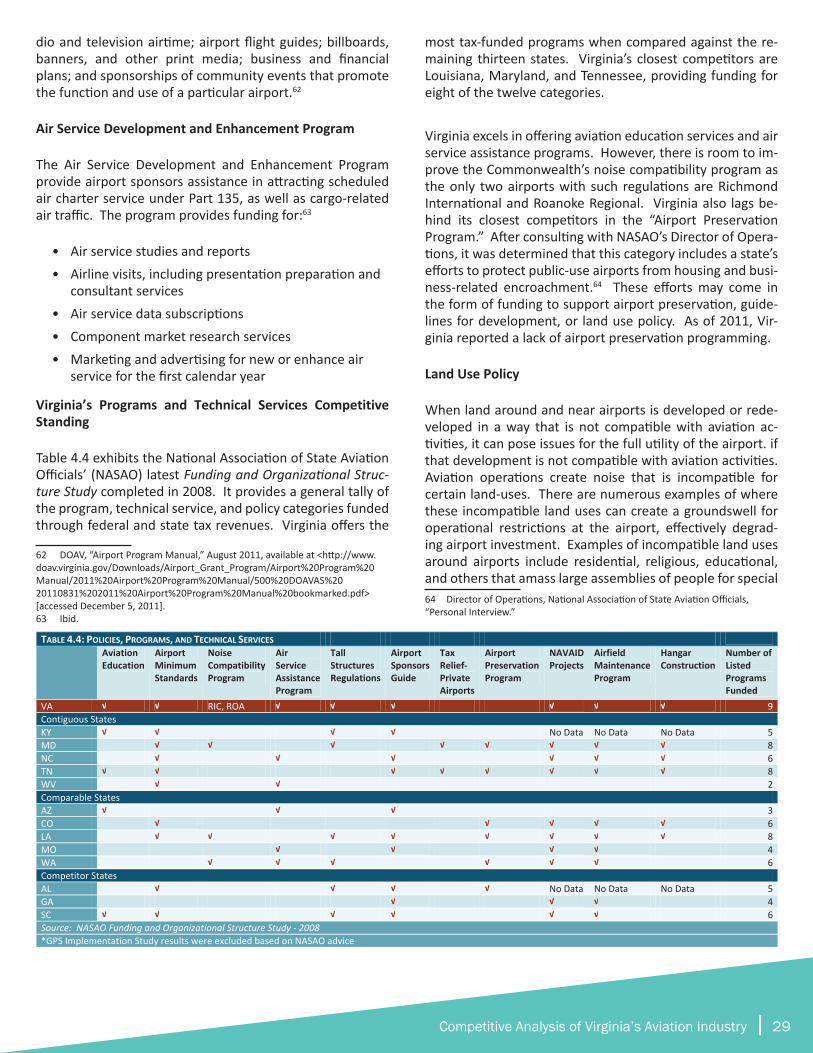
Competitive Analysis of Virginia’s Aviation Industry | 29
TABLE 4.4: POLICIES, PROGRAMS, AND TECHNICAL SERVICES Aviation
Education Airport Minimum Standards
Noise Compatibility Program
Air Service Assistance Program
Tall Structures Regulations
Airport Sponsors Guide
Tax Relief‐ Private Airports
Airport Preservation Program
NAVAID Projects
Airfield Maintenance Program
Hangar Construction
Number of Listed Programs Funded
VA √ √ RIC, ROA √ √ √ √ √ √ 9 Contiguous States KY √ √ √ √ No Data No Data No Data 5 MD √ √ √ √ √ √ √ √ 8 NC √ √ √ √ √ √ 6 TN √ √ √ √ √ √ √ √ 8 WV √ √ 2 Comparable States AZ √ √ √ 3 CO √ √ √ √ √ 6 LA √ √ √ √ √ √ √ √ 8 MO √ √ √ √ 4 WA √ √ √ √ √ √ 6 Competitor States AL √ √ √ √ No Data No Data No Data 5 GA √ √ √ 4 SC √ √ √ √ √ √ 6 Source: NASAO Funding and Organizational Structure Study ‐ 2008 *GPS Implementation Study results were excluded based on NASAO advice
dio and television airtime; airport flight guides; billboards, banners, and other print media; business and financial plans; and sponsorships of community events that promote the function and use of a particular airport.62
Air Service Development and Enhancement Program
The Air Service Development and Enhancement Program provide airport sponsors assistance in attracting scheduled air charter service under Part 135, as well as cargo-related air traffic. The program provides funding for:63
• Air service studies and reports• Airline visits, including presentation preparation and
consultant services• Air service data subscriptions• Component market research services• Marketing and advertising for new or enhance air
service for the first calendar year
Virginia’s Programs and Technical Services Competitive Standing
Table 4.4 exhibits the National Association of State Aviation Officials’ (NASAO) latest Funding and Organizational Struc-ture Study completed in 2008. It provides a general tally of the program, technical service, and policy categories funded through federal and state tax revenues. Virginia offers the
62 DOAV, “Airport Program Manual,” August 2011, available at <http://www.doav.virginia.gov/Downloads/Airport_Grant_Program/Airport%20Program%20Manual/2011%20Airport%20Program%20Manual/500%20DOAVAS%2020110831%202011%20Airport%20Program%20Manual%20bookmarked.pdf> [accessed December 5, 2011].63 Ibid.
most tax-funded programs when compared against the re-maining thirteen states. Virginia’s closest competitors are Louisiana, Maryland, and Tennessee, providing funding for eight of the twelve categories.
Virginia excels in offering aviation education services and air service assistance programs. However, there is room to im-prove the Commonwealth’s noise compatibility program as the only two airports with such regulations are Richmond International and Roanoke Regional. Virginia also lags be-hind its closest competitors in the “Airport Preservation Program.” After consulting with NASAO’s Director of Opera-tions, it was determined that this category includes a state’s efforts to protect public-use airports from housing and busi-ness-related encroachment.64 These efforts may come in the form of funding to support airport preservation, guide-lines for development, or land use policy. As of 2011, Vir-ginia reported a lack of airport preservation programming.
Land Use Policy
When land around and near airports is developed or rede-veloped in a way that is not compatible with aviation ac-tivities, it can pose issues for the full utility of the airport. if that development is not compatible with aviation activities. Aviation operations create noise that is incompatible for certain land-uses. There are numerous examples of where these incompatible land uses can create a groundswell for operational restrictions at the airport, effectively degrad-ing airport investment. Examples of incompatible land uses around airports include residential, religious, educational, and others that amass large assemblies of people for special 64 Director of Operations, National Association of State Aviation Officials, “Personal Interview.”

30 | January 2012
TABLE 4.5: STATE MANDATED PROTECTION OF PUBLIC USE AIRPORTS: INCOMPATIBLE LAND USE MEASURES State State Mandate Comments Virginia No Advisory land‐use guidance is available from DOAV Contiguous States Kentucky Yes State airport zoning commission established Maryland No Localities encouraged to adopt local zoning ‐ most have North Carolina No Blocked in the past by special interests Tennessee No Discussed, never proposed West Virginia No Discussed internally, but never attempted Comparable States Arizona No State supplies "Airport Disclosure Maps" to real estate firms Colorado No Require "adherence" to Part 77, but not land use Louisiana No Response No Response Missouri No Never advanced by state
Washington Yes Localities must adopt comprehensive plans that follow state land‐use checklist
Competitor States Alabama No State mandate discussed internally, but not advanced Georgia No Never advanced by state South Carolina No Response No Response *Survey conducted by Virginia Department of Aviation, November, 2011
events. Noise and safety issues are paramount in trying to segregate these uses from negatively impacting the airport’s ability to serve the surrounding communities. When land use is not properly addressed, the negative impacts include restricted hours of operation, difficult approach and depar-ture procedures, caps on the number of operations, restric-tions on the type of aircraft that can use the facilities, and in some cases, poor land use policy has been a major contribu-tor in airport closure.
To ensure that the taxpayers’ substantial investment in pub-lic-use airport infrastructure is protected and that the trans-
portation asset remains viable, regulatory action is neces-sary to guide compatible land-uses near airports.
Table 4.5 indicates the regulatory measures that are in place for the 14 states examined in this report. One can easily see that these states have not had much success regarding the regulatory approach to land use compatibility, and have thus far relied upon the marketplace to ensure proper com-patibility. The record indicates that this method often lacks seeking the proper assignment of uses of properties in the airport environs.
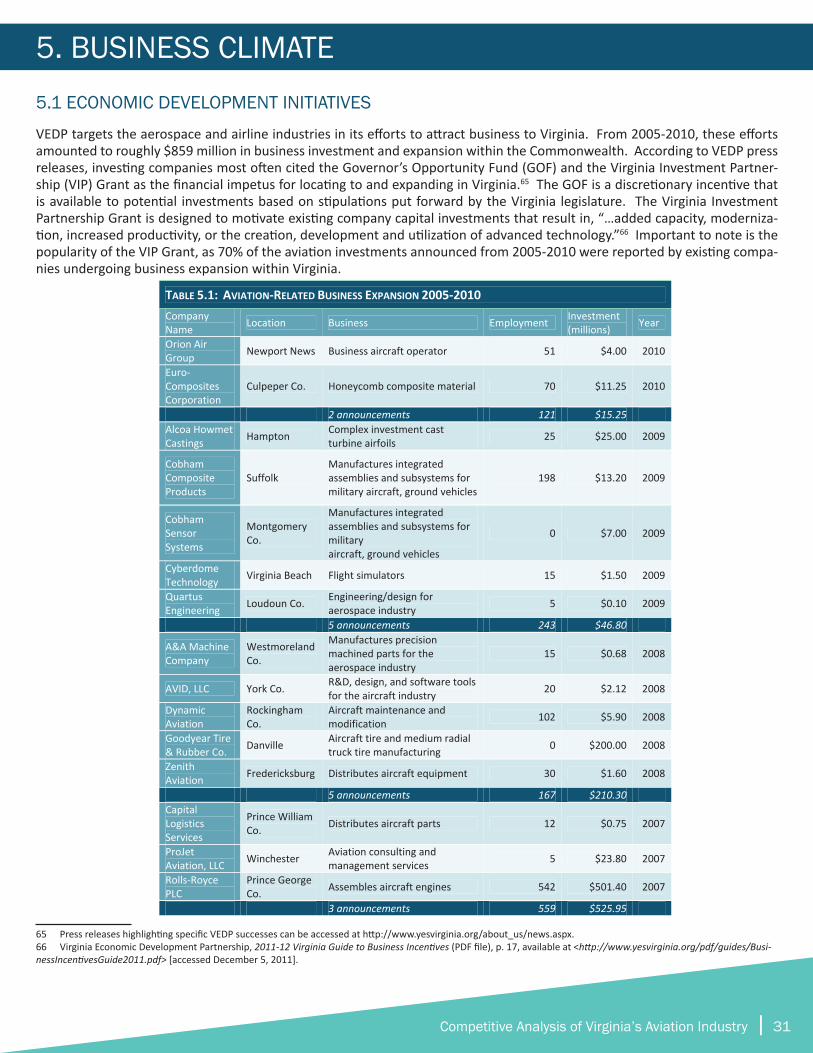
Competitive Analysis of Virginia’s Aviation Industry | 31
5.1 ECONOMIC DEVELOPMENT INITIATIVES
VEDP targets the aerospace and airline industries in its efforts to attract business to Virginia. From 2005-2010, these efforts amounted to roughly $859 million in business investment and expansion within the Commonwealth. According to VEDP press releases, investing companies most often cited the Governor’s Opportunity Fund (GOF) and the Virginia Investment Partner-ship (VIP) Grant as the financial impetus for locating to and expanding in Virginia.65 The GOF is a discretionary incentive that is available to potential investments based on stipulations put forward by the Virginia legislature. The Virginia Investment Partnership Grant is designed to motivate existing company capital investments that result in, “…added capacity, moderniza-tion, increased productivity, or the creation, development and utilization of advanced technology.”66 Important to note is the popularity of the VIP Grant, as 70% of the aviation investments announced from 2005-2010 were reported by existing compa-nies undergoing business expansion within Virginia.
65 Press releases highlighting specific VEDP successes can be accessed at http://www.yesvirginia.org/about_us/news.aspx. 66 Virginia Economic Development Partnership, 2011-12 Virginia Guide to Business Incentives (PDF file), p. 17, available at <http://www.yesvirginia.org/pdf/guides/Busi-nessIncentivesGuide2011.pdf> [accessed December 5, 2011].
5. BUSINESS CLIMATE
6
TABLE 5.1: AVIATION‐RELATED BUSINESS EXPANSION 2005‐2010 Company Name Location Business Employment Investment
(millions) Year
Orion Air Group Newport News Business aircraft operator 51 $4.00 2010
Euro‐Composites Corporation
Culpeper Co. Honeycomb composite material 70 $11.25 2010
2 announcements 121 $15.25 Alcoa Howmet Castings Hampton Complex investment cast
turbine airfoils 25 $25.00 2009
Cobham Composite Products
Suffolk Manufactures integrated assemblies and subsystems for military aircraft, ground vehicles
198 $13.20 2009
Cobham Sensor Systems
Montgomery Co.
Manufactures integrated assemblies and subsystems for military aircraft, ground vehicles
0 $7.00 2009
Cyberdome Technology Virginia Beach Flight simulators 15 $1.50 2009
Quartus Engineering Loudoun Co. Engineering/design for
aerospace industry 5 $0.10 2009
5 announcements 243 $46.80
A&A Machine Company
Westmoreland Co.
Manufactures precision machined parts for the aerospace industry
15 $0.68 2008
AVID, LLC York Co. R&D, design, and software tools for the aircraft industry 20 $2.12 2008
Dynamic Aviation
Rockingham Co.
Aircraft maintenance and modification 102 $5.90 2008
Goodyear Tire & Rubber Co. Danville Aircraft tire and medium radial
truck tire manufacturing 0 $200.00 2008
Zenith Aviation Fredericksburg Distributes aircraft equipment 30 $1.60 2008
5 announcements 167 $210.30 Capital Logistics Services
Prince William Co. Distributes aircraft parts 12 $0.75 2007
ProJet Aviation, LLC Winchester Aviation consulting and
management services 5 $23.80 2007
Rolls‐Royce PLC
Prince George Co. Assembles aircraft engines 542 $501.40 2007
3 announcements 559 $525.95
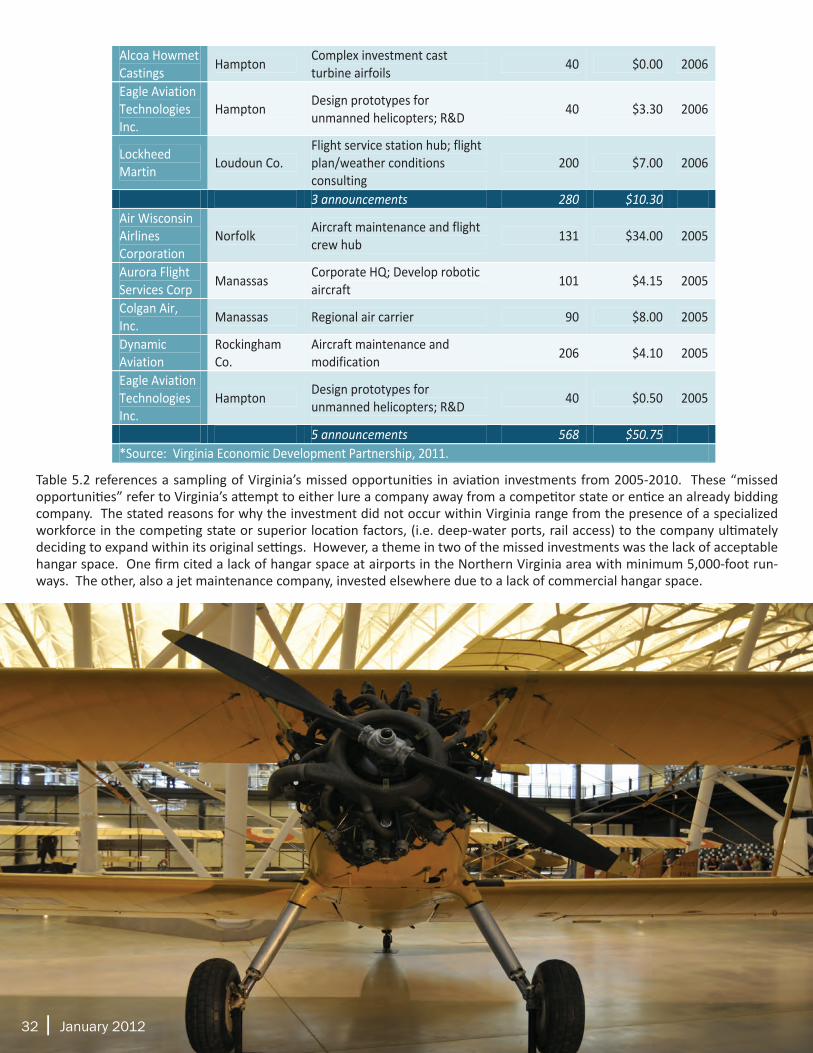
32 | January 2012 32 | January 2012
6
Alcoa Howmet Castings Hampton Complex investment cast
turbine airfoils 40 $0.00 2006
Eagle Aviation Technologies Inc.
Hampton Design prototypes for unmanned helicopters; R&D 40 $3.30 2006
Lockheed Martin Loudoun Co.
Flight service station hub; flight plan/weather conditions consulting
200 $7.00 2006
3 announcements 280 $10.30 Air Wisconsin Airlines Corporation
Norfolk Aircraft maintenance and flight crew hub 131 $34.00 2005
Aurora Flight Services Corp Manassas Corporate HQ; Develop robotic
aircraft 101 $4.15 2005
Colgan Air, Inc. Manassas Regional air carrier 90 $8.00 2005
Dynamic Aviation
Rockingham Co.
Aircraft maintenance and modification 206 $4.10 2005
Eagle Aviation Technologies Inc.
Hampton Design prototypes for unmanned helicopters; R&D 40 $0.50 2005
5 announcements 568 $50.75 *Source: Virginia Economic Development Partnership, 2011.
Table 5.2 references a sampling of Virginia’s missed opportunities in aviation investments from 2005-2010. These “missed opportunities” refer to Virginia’s attempt to either lure a company away from a competitor state or entice an already bidding company. The stated reasons for why the investment did not occur within Virginia range from the presence of a specialized workforce in the competing state or superior location factors, (i.e. deep-water ports, rail access) to the company ultimately deciding to expand within its original settings. However, a theme in two of the missed investments was the lack of acceptable hangar space. One firm cited a lack of hangar space at airports in the Northern Virginia area with minimum 5,000-foot run-ways. The other, also a jet maintenance company, invested elsewhere due to a lack of commercial hangar space.
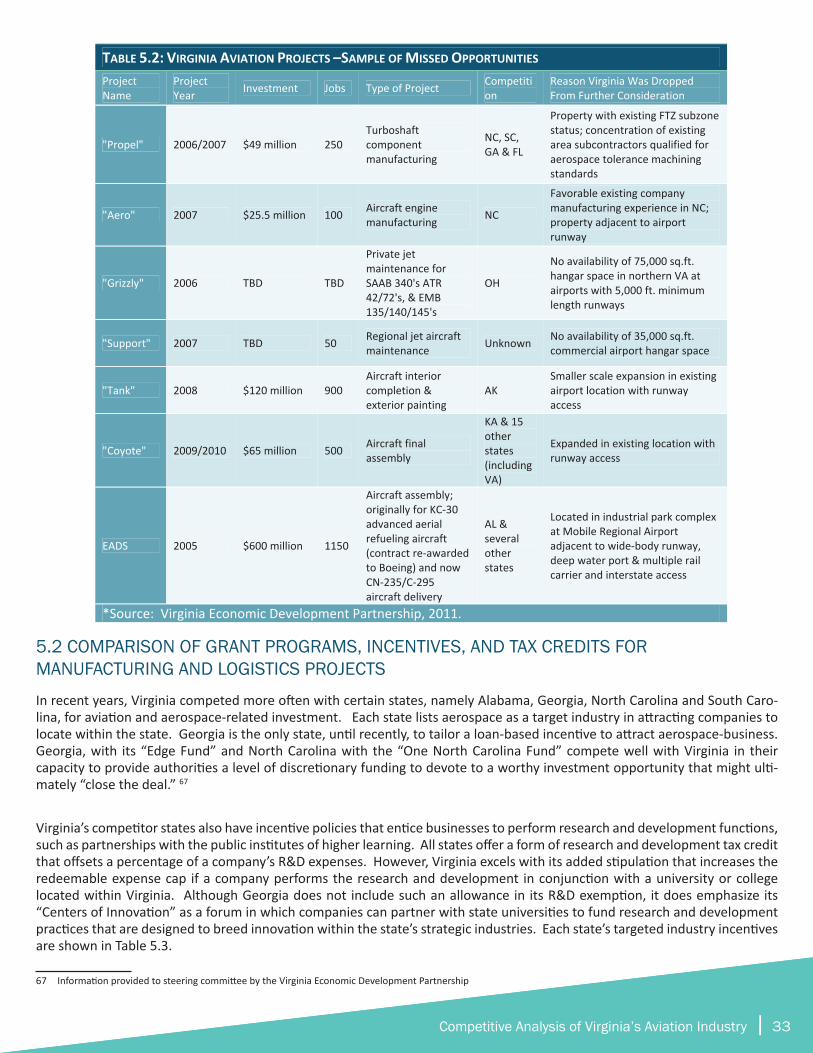
Competitive Analysis of Virginia’s Aviation Industry | 33
TABLE 5.2: VIRGINIA AVIATION PROJECTS –SAMPLE OF MISSED OPPORTUNITIES Project Name
Project Year Investment Jobs Type of Project Competiti
on Reason Virginia Was Dropped From Further Consideration
"Propel" 2006/2007 $49 million 250 Turboshaft component manufacturing
NC, SC, GA & FL
Property with existing FTZ subzone status; concentration of existing area subcontractors qualified for aerospace tolerance machining standards
"Aero" 2007 $25.5 million 100 Aircraft engine manufacturing NC
Favorable existing company manufacturing experience in NC; property adjacent to airport runway
"Grizzly" 2006 TBD TBD
Private jet maintenance for SAAB 340's ATR 42/72's, & EMB 135/140/145's
OH
No availability of 75,000 sq.ft. hangar space in northern VA at airports with 5,000 ft. minimum length runways
"Support" 2007 TBD 50 Regional jet aircraft maintenance Unknown No availability of 35,000 sq.ft.
commercial airport hangar space
"Tank" 2008 $120 million 900 Aircraft interior completion & exterior painting
AK Smaller scale expansion in existing airport location with runway access
"Coyote" 2009/2010 $65 million 500 Aircraft final assembly
KA & 15 other states (including VA)
Expanded in existing location with runway access
EADS 2005 $600 million 1150
Aircraft assembly; originally for KC‐30 advanced aerial refueling aircraft (contract re‐awarded to Boeing) and now CN‐235/C‐295 aircraft delivery
AL & several other states
Located in industrial park complex at Mobile Regional Airport adjacent to wide‐body runway, deep water port & multiple rail carrier and interstate access
*Source: Virginia Economic Development Partnership, 2011.
5.2 COMPARISON OF GRANT PROGRAMS, INCENTIVES, AND TAX CREDITS FOR MANUFACTURING AND LOGISTICS PROJECTS
In recent years, Virginia competed more often with certain states, namely Alabama, Georgia, North Carolina and South Caro-lina, for aviation and aerospace-related investment. Each state lists aerospace as a target industry in attracting companies to locate within the state. Georgia is the only state, until recently, to tailor a loan-based incentive to attract aerospace-business. Georgia, with its “Edge Fund” and North Carolina with the “One North Carolina Fund” compete well with Virginia in their capacity to provide authorities a level of discretionary funding to devote to a worthy investment opportunity that might ulti-mately “close the deal.” 67
Virginia’s competitor states also have incentive policies that entice businesses to perform research and development functions, such as partnerships with the public institutes of higher learning. All states offer a form of research and development tax credit that offsets a percentage of a company’s R&D expenses. However, Virginia excels with its added stipulation that increases the redeemable expense cap if a company performs the research and development in conjunction with a university or college located within Virginia. Although Georgia does not include such an allowance in its R&D exemption, it does emphasize its “Centers of Innovation” as a forum in which companies can partner with state universities to fund research and development practices that are designed to breed innovation within the state’s strategic industries. Each state’s targeted industry incentives are shown in Table 5.3.
67 Information provided to steering committee by the Virginia Economic Development Partnership
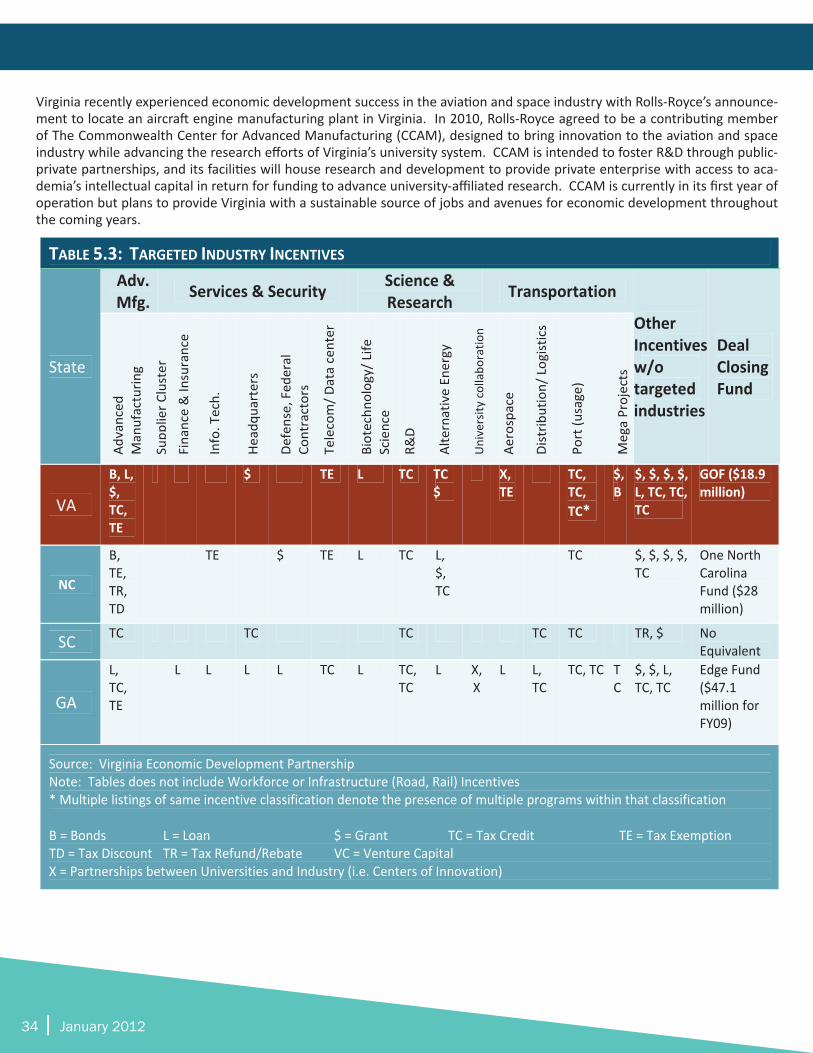
34 | January 2012
2
TABLE 5.3: TARGETED INDUSTRY INCENTIVES
State
Adv. Mfg. Services & Security Science &
Research Transportation
Other Incentives w/o targeted industries
Deal Closing Fund
Advanced
Manufacturin
g
Supp
lier C
luster
Finance & Insurance
Info. Tech.
Headq
uarters
Defense, Fed
eral
Contractors
Telecom/ D
ata center
Biotechn
ology/ Life
Science
R&D
Alternative En
ergy
University
collabo
ratio
n
Aerospace
Distrib
ution/ Logistics
Port (u
sage)
Mega Projects
VA
B, L, $, TC, TE
$ TE L TC TC $
X, TE
TC, TC, TC*
$,B
$, $, $, $, L, TC, TC, TC
GOF ($18.9 million)
NC
B, TE, TR, TD
TE $ TE L TC L, $, TC
TC $, $, $, $, TC
One North Carolina Fund ($28 million)
SC TC TC TC TC TC TR, $ No Equivalent
GA
L, TC, TE
L L L L TC L TC, TC
L X, X
L L, TC
TC, TC TC
$, $, L, TC, TC
Edge Fund ($47.1 million for FY09)
Source: Virginia Economic Development Partnership Note: Tables does not include Workforce or Infrastructure (Road, Rail) Incentives * Multiple listings of same incentive classification denote the presence of multiple programs within that classification B = Bonds L = Loan $ = Grant TC = Tax Credit TE = Tax Exemption TD = Tax Discount TR = Tax Refund/Rebate VC = Venture Capital X = Partnerships between Universities and Industry (i.e. Centers of Innovation)
Virginia recently experienced economic development success in the aviation and space industry with Rolls-Royce’s announce-ment to locate an aircraft engine manufacturing plant in Virginia. In 2010, Rolls-Royce agreed to be a contributing member of The Commonwealth Center for Advanced Manufacturing (CCAM), designed to bring innovation to the aviation and space industry while advancing the research efforts of Virginia’s university system. CCAM is intended to foster R&D through public-private partnerships, and its facilities will house research and development to provide private enterprise with access to aca-demia’s intellectual capital in return for funding to advance university-affiliated research. CCAM is currently in its first year of operation but plans to provide Virginia with a sustainable source of jobs and avenues for economic development throughout the coming years.
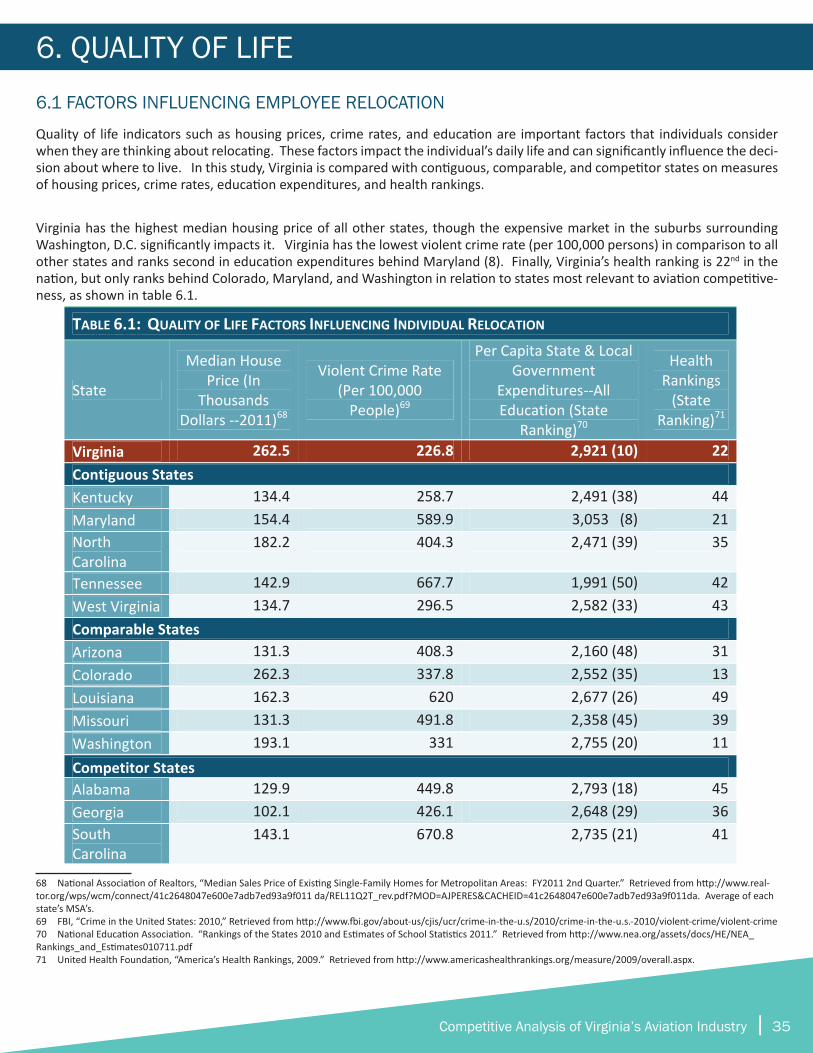
Competitive Analysis of Virginia’s Aviation Industry | 35
6.1 FACTORS INFLUENCING EMPLOYEE RELOCATION
Quality of life indicators such as housing prices, crime rates, and education are important factors that individuals consider when they are thinking about relocating. These factors impact the individual’s daily life and can significantly influence the deci-sion about where to live. In this study, Virginia is compared with contiguous, comparable, and competitor states on measures of housing prices, crime rates, education expenditures, and health rankings.
Virginia has the highest median housing price of all other states, though the expensive market in the suburbs surrounding Washington, D.C. significantly impacts it. Virginia has the lowest violent crime rate (per 100,000 persons) in comparison to all other states and ranks second in education expenditures behind Maryland (8). Finally, Virginia’s health ranking is 22nd in the nation, but only ranks behind Colorado, Maryland, and Washington in relation to states most relevant to aviation competitive-ness, as shown in table 6.1.
68, 69, 70,71
68 National Association of Realtors, “Median Sales Price of Existing Single-Family Homes for Metropolitan Areas: FY2011 2nd Quarter.” Retrieved from http://www.real-tor.org/wps/wcm/connect/41c2648047e600e7adb7ed93a9f011 da/REL11Q2T_rev.pdf?MOD=AJPERES&CACHEID=41c2648047e600e7adb7ed93a9f011da. Average of each state’s MSA’s.69 FBI, “Crime in the United States: 2010,” Retrieved from http://www.fbi.gov/about-us/cjis/ucr/crime-in-the-u.s/2010/crime-in-the-u.s.-2010/violent-crime/violent-crime70 National Education Association. “Rankings of the States 2010 and Estimates of School Statistics 2011.” Retrieved from http://www.nea.org/assets/docs/HE/NEA_Rankings_and_Estimates010711.pdf71 United Health Foundation, “America’s Health Rankings, 2009.” Retrieved from http://www.americashealthrankings.org/measure/2009/overall.aspx.
6. QUALITY OF LIFE
3
TABLE 6.1: QUALITY OF LIFE FACTORS INFLUENCING INDIVIDUAL RELOCATION
State
Median House Price (In
Thousands Dollars ‐‐2011)68
Violent Crime Rate (Per 100,000 People)69
Per Capita State & Local Government
Expenditures‐‐All Education (State
Ranking)70
Health Rankings (State
Ranking)71
Virginia 262.5 226.8 2,921 (10) 22Contiguous States Kentucky 134.4 258.7 2,491 (38) 44Maryland 154.4 589.9 3,053 (8) 21North Carolina
182.2 404.3 2,471 (39) 35
Tennessee 142.9 667.7 1,991 (50) 42West Virginia 134.7 296.5 2,582 (33) 43Comparable States Arizona 131.3 408.3 2,160 (48) 31Colorado 262.3 337.8 2,552 (35) 13Louisiana 162.3 620 2,677 (26) 49Missouri 131.3 491.8 2,358 (45) 39Washington 193.1 331 2,755 (20) 11Competitor States Alabama 129.9 449.8 2,793 (18) 45Georgia 102.1 426.1 2,648 (29) 36South Carolina
143.1 670.8 2,735 (21) 41
68 National Association of Realtors, “Median Sales Price of Existing Single-Family Homes for Metropolitan Areas: FY2011 2nd Quarter.” Retrieved from http://www.realtor.org/wps/wcm/connect/41c2648047e600e7adb7ed93a9f011 da/REL11Q2T_rev.pdf?MOD=AJPERES&CACHEID=41c2648047e600e7adb7ed93a9f011da. Average of each state’s MSA’s.69 FBI, “Crime in the United States: 2010,” Retrieved from http://www.fbi.gov/about-us/cjis/ucr/crime-in-the-u.s/2010/crime-in-the-u.s.-2010/violent-crime/violent-crime 70 National Education Association. “Rankings of the States 2010 and Estimates of School Statistics 2011.” Retrieved from http://www.nea.org/assets/docs/HE/NEA_Rankings_and_Estimates010711.pdf 71 United Health Foundation, “America’s Health Rankings, 2009.” Retrieved from http://www.americashealthrankings.org/measure/2009/overall.aspx. “Health Rankings” include factors such as, prevalence of cancer, heart disease, levels of obesity, hypertension, mortality rate, smoking habits, children in poverty, and numbers of people with health insurance.
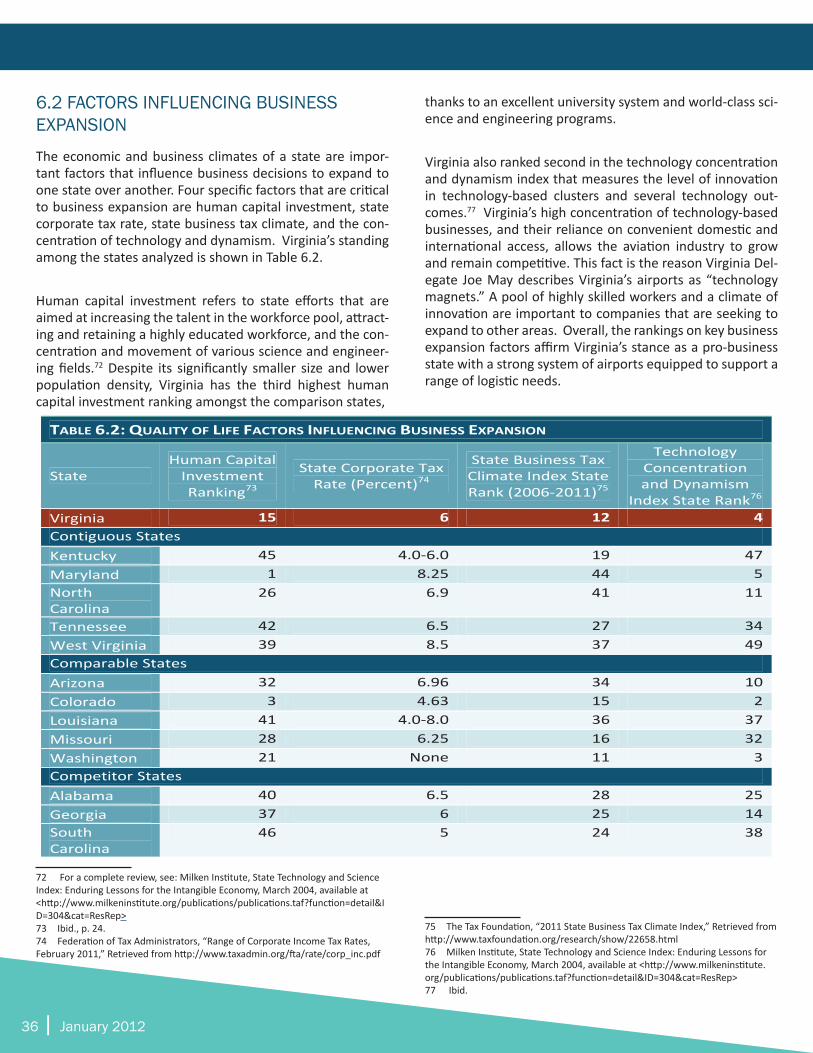
36 | January 2012
6.2 FACTORS INFLUENCING BUSINESS EXPANSION
The economic and business climates of a state are impor-tant factors that influence business decisions to expand to one state over another. Four specific factors that are critical to business expansion are human capital investment, state corporate tax rate, state business tax climate, and the con-centration of technology and dynamism. Virginia’s standing among the states analyzed is shown in Table 6.2.
Human capital investment refers to state efforts that are aimed at increasing the talent in the workforce pool, attract-ing and retaining a highly educated workforce, and the con-centration and movement of various science and engineer-ing fields.72 Despite its significantly smaller size and lower population density, Virginia has the third highest human capital investment ranking amongst the comparison states,
7374
72 For a complete review, see: Milken Institute, State Technology and Science Index: Enduring Lessons for the Intangible Economy, March 2004, available at <http://www.milkeninstitute.org/publications/publications.taf?function=detail&ID=304&cat=ResRep>73 Ibid., p. 24.74 Federation of Tax Administrators, “Range of Corporate Income Tax Rates, February 2011,” Retrieved from http://www.taxadmin.org/fta/rate/corp_inc.pdf
thanks to an excellent university system and world-class sci-ence and engineering programs.
Virginia also ranked second in the technology concentration and dynamism index that measures the level of innovation in technology-based clusters and several technology out-comes.77 Virginia’s high concentration of technology-based businesses, and their reliance on convenient domestic and international access, allows the aviation industry to grow and remain competitive. This fact is the reason Virginia Del-egate Joe May describes Virginia’s airports as “technology magnets.” A pool of highly skilled workers and a climate of innovation are important to companies that are seeking to expand to other areas. Overall, the rankings on key business expansion factors affirm Virginia’s stance as a pro-business state with a strong system of airports equipped to support a range of logistic needs.
75 The Tax Foundation, “2011 State Business Tax Climate Index,” Retrieved from http://www.taxfoundation.org/research/show/22658.html 76 Milken Institute, State Technology and Science Index: Enduring Lessons for the Intangible Economy, March 2004, available at <http://www.milkeninstitute.org/publications/publications.taf?function=detail&ID=304&cat=ResRep>77 Ibid.
3
TABLE 6.2: QUALITY OF LIFE FACTORS INFLUENCING BUSINESS EXPANSION
State Human Capital Investment Ranking73
State Corporate Tax Rate (Percent)74
State Business Tax Climate Index State Rank (2006‐2011)75
Technology Concentration and Dynamism
Index State Rank76 Virginia 15 6 12 4Contiguous States Kentucky 45 4.0‐6.0 19 47Maryland 1 8.25 44 5North Carolina
26 6.9 41 11
Tennessee 42 6.5 27 34West Virginia 39 8.5 37 49Comparable States Arizona 32 6.96 34 10Colorado 3 4.63 15 2Louisiana 41 4.0‐8.0 36 37Missouri 28 6.25 16 32Washington 21 None 11 3Competitor States Alabama 40 6.5 28 25Georgia 37 6 25 14South Carolina
46 5 24 38
73 Ibid., p. 24. 74 Federation of Tax Administrators, “Range of Corporate Income Tax Rates, February 2011,” Retrieved from http://www.taxadmin.org/fta/rate/corp_inc.pdf75 The Tax Foundation, “2011 State Business Tax Climate Index,” Retrieved from http://www.taxfoundation.org/research/show/22658.html 76 Milken Institute, State Technology and Science Index: Enduring Lessons for the Intangible Economy, March 2004,available at <http://www.milkeninstitute.org/publications/publications.taf?function=detail&ID=304&cat=ResRep>

Competitive Analysis of Virginia’s Aviation Industry | 37
7. WORKFORCE PIPELINE ANALYSIS
Competitive Analysis of Virginia’s Aviation Industry | 37
Current Workforce
The aviation and space industry have significant economic development potential for the communities and citizens of the Commonwealth. This is a point made apparent in Virginia’s Aerospace Industry: An Economic Impact Analy-sis (2010), and the Virginia Airport System Economic Impact Study (2011). The latest aviation and space-related im-pact studies show that Virginia directly employs more than 28,000 employees and contributes $7.6 billion in direct annual economic output. 78 Additionally, Virginia’s airports have a profound effect on the Commonwealth’s economic vitality, accounting for 4.4% of the state’s total economic output. Virginia ranked 11th in the nation in aviation and aerospace employment in 2009 and increased to 10th in 2010. According to the FAA industry growth projections, this impact is destined to grow in the next 20 years. To take advantage of aviation and space growth potential, Virginia must ensure a ready and trained workforce is there to meet the industry. With its world-renowned centers for aviation and space education and “who’s who” list of companies, it is important to obtain detailed information on Virginia’s cur-rent workforce landscape and identify any changes needed in the education system and workforce training programs to ensure that Virginia remains competitive into the next de-cade and beyond.78 Virginia Department of Aviation (DOAV), Virginia Airport System Economic Impact Study: Technical Report (PDF file), p. 1, report prepared by ICF SH&E, 2011, available online at http://tinyurl.com/7usgrfl [accessed December 2, 2011].
Future Workforce
Retirements among aging baby boomers are expected to be significant in the coming years. The impact will be slight-ly alleviated as more of the population aged 65 and over is projected to remain in the workforce. Workers aged 65 and older accounted for an estimated 4.3% of workers in the state in the second quarter of 2010 and is expected to grow to 7.3% in 2020. The number of workers under the age of 25 is forecast to decrease over the next ten years, from 469,362 to 431,849.
Another significant trend is that the average educational attainment of the workforce is expected to increase. The number of employed workers in Virginia with a high school diploma or less is expected to drop over the next ten years by 4.4%, while over the same period, the number of workers with some college is expected to grow 14.9%. Even larger in-creases are expected for other attainment levels: associate’s degrees (+36.3%), bachelor’s degrees (+16.9%), and gradu-ate degrees (+34.0%).
Aviation Workforce Shortage
A number of aviation-specific technical occupations were cited as critical to the success of the aviation industry in a 2011 survey conducted by Chmura Economics & Analytics that targeted businesses in the aviation and space indus-
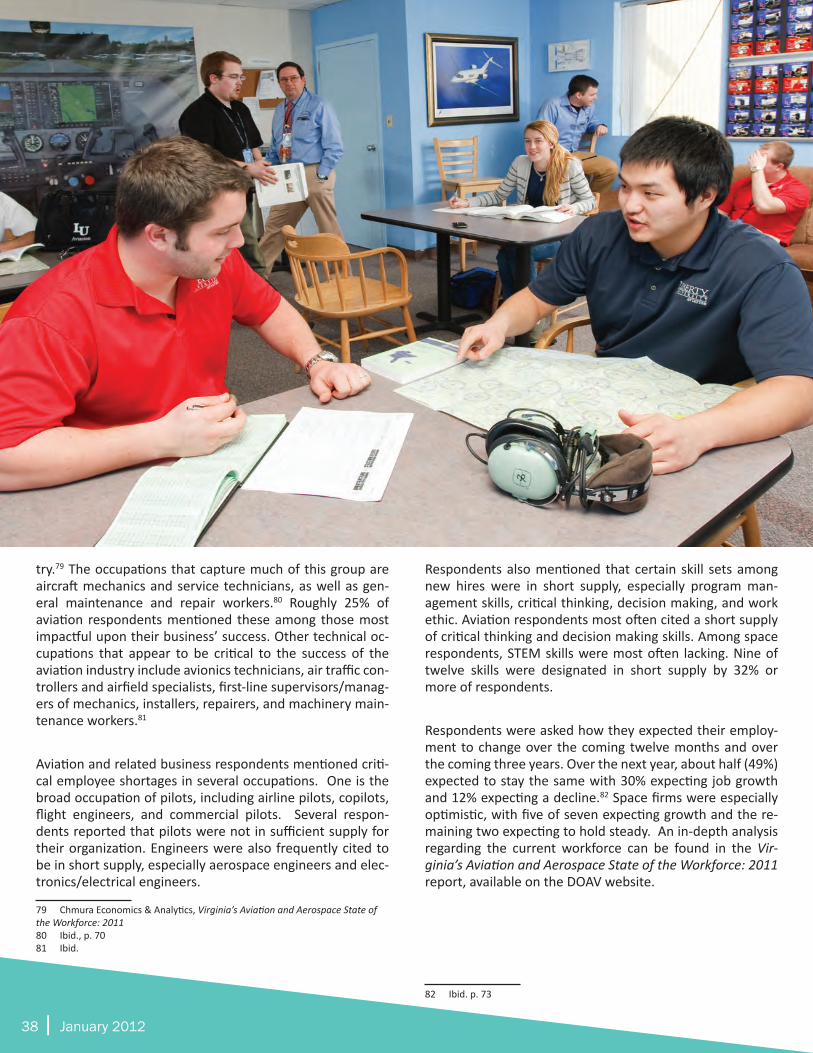
38 | January 2012
try.79 The occupations that capture much of this group are aircraft mechanics and service technicians, as well as gen-eral maintenance and repair workers.80 Roughly 25% of aviation respondents mentioned these among those most impactful upon their business’ success. Other technical oc-cupations that appear to be critical to the success of the aviation industry include avionics technicians, air traffic con-trollers and airfield specialists, first-line supervisors/manag-ers of mechanics, installers, repairers, and machinery main-tenance workers.81
Aviation and related business respondents mentioned criti-cal employee shortages in several occupations. One is the broad occupation of pilots, including airline pilots, copilots, flight engineers, and commercial pilots. Several respon-dents reported that pilots were not in sufficient supply for their organization. Engineers were also frequently cited to be in short supply, especially aerospace engineers and elec-tronics/electrical engineers.
79 Chmura Economics & Analytics, Virginia’s Aviation and Aerospace State of the Workforce: 201180 Ibid., p. 7081 Ibid.
Respondents also mentioned that certain skill sets among new hires were in short supply, especially program man-agement skills, critical thinking, decision making, and work ethic. Aviation respondents most often cited a short supply of critical thinking and decision making skills. Among space respondents, STEM skills were most often lacking. Nine of twelve skills were designated in short supply by 32% or more of respondents.
Respondents were asked how they expected their employ-ment to change over the coming twelve months and over the coming three years. Over the next year, about half (49%) expected to stay the same with 30% expecting job growth and 12% expecting a decline.82 Space firms were especially optimistic, with five of seven expecting growth and the re-maining two expecting to hold steady. An in-depth analysis regarding the current workforce can be found in the Vir-ginia’s Aviation and Aerospace State of the Workforce: 2011 report, available on the DOAV website.
82 Ibid. p. 73
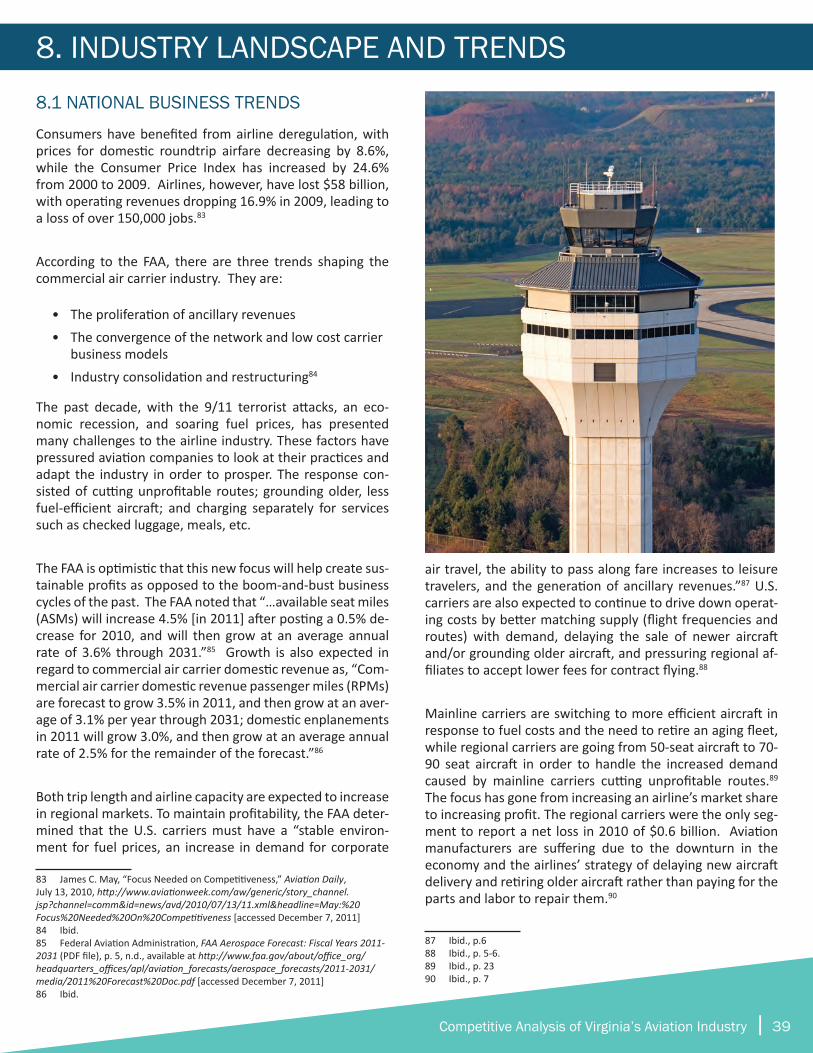
Competitive Analysis of Virginia’s Aviation Industry | 39
8. INDUSTRY LANDSCAPE AND TRENDS8.1 NATIONAL BUSINESS TRENDS
Consumers have benefited from airline deregulation, with prices for domestic roundtrip airfare decreasing by 8.6%, while the Consumer Price Index has increased by 24.6% from 2000 to 2009. Airlines, however, have lost $58 billion, with operating revenues dropping 16.9% in 2009, leading to a loss of over 150,000 jobs.83
According to the FAA, there are three trends shaping the commercial air carrier industry. They are:
• The proliferation of ancillary revenues• The convergence of the network and low cost carrier
business models• Industry consolidation and restructuring84
The past decade, with the 9/11 terrorist attacks, an eco-nomic recession, and soaring fuel prices, has presented many challenges to the airline industry. These factors have pressured aviation companies to look at their practices and adapt the industry in order to prosper. The response con-sisted of cutting unprofitable routes; grounding older, less fuel-efficient aircraft; and charging separately for services such as checked luggage, meals, etc.
The FAA is optimistic that this new focus will help create sus-tainable profits as opposed to the boom-and-bust business cycles of the past. The FAA noted that “…available seat miles (ASMs) will increase 4.5% [in 2011] after posting a 0.5% de-crease for 2010, and will then grow at an average annual rate of 3.6% through 2031.”85 Growth is also expected in regard to commercial air carrier domestic revenue as, “Com-mercial air carrier domestic revenue passenger miles (RPMs) are forecast to grow 3.5% in 2011, and then grow at an aver-age of 3.1% per year through 2031; domestic enplanements in 2011 will grow 3.0%, and then grow at an average annual rate of 2.5% for the remainder of the forecast.”86
Both trip length and airline capacity are expected to increase in regional markets. To maintain profitability, the FAA deter-mined that the U.S. carriers must have a “stable environ-ment for fuel prices, an increase in demand for corporate
83 James C. May, “Focus Needed on Competitiveness,” Aviation Daily, July 13, 2010, http://www.aviationweek.com/aw/generic/story_channel.jsp?channel=comm&id=news/avd/2010/07/13/11.xml&headline=May:%20Focus%20Needed%20On%20Competitiveness [accessed December 7, 2011] 84 Ibid.85 Federal Aviation Administration, FAA Aerospace Forecast: Fiscal Years 2011-2031 (PDF file), p. 5, n.d., available at http://www.faa.gov/about/office_org/headquarters_offices/apl/aviation_forecasts/aerospace_forecasts/2011-2031/media/2011%20Forecast%20Doc.pdf [accessed December 7, 2011]86 Ibid.
air travel, the ability to pass along fare increases to leisure travelers, and the generation of ancillary revenues.”87 U.S. carriers are also expected to continue to drive down operat-ing costs by better matching supply (flight frequencies and routes) with demand, delaying the sale of newer aircraft and/or grounding older aircraft, and pressuring regional af-filiates to accept lower fees for contract flying.88
Mainline carriers are switching to more efficient aircraft in response to fuel costs and the need to retire an aging fleet, while regional carriers are going from 50-seat aircraft to 70-90 seat aircraft in order to handle the increased demand caused by mainline carriers cutting unprofitable routes.89 The focus has gone from increasing an airline’s market share to increasing profit. The regional carriers were the only seg-ment to report a net loss in 2010 of $0.6 billion. Aviation manufacturers are suffering due to the downturn in the economy and the airlines’ strategy of delaying new aircraft delivery and retiring older aircraft rather than paying for the parts and labor to repair them.90
87 Ibid., p.688 Ibid., p. 5-6.89 Ibid., p. 2390 Ibid., p. 7
40 | January 2012
The latest effort to improve efficiency comes in the use of biofuels in a number of Continental and Alaska Airline flights. In early November 2011, Continental Airlines and Alaska Airlines became the first major airlines to fuel a flight using biofuels; algae in the case of Continental, and used cooking oil in Alaska Airlines.91 The move to introduce biofuel capa-bilities within the U.S. airline industry comes in response to the industry’s effort to increase operational efficiency while reducing emissions. However, current biofuels only reduce emissions by 10% over conventional jet fuel, and the infra-structure to support the bulk of the airlines’ fueling needs is at least 15 years away.92 Additionally, biofuels are currently six times the price of conventional fuels.
Representative of a greater trend in the industry, the capac-ity of regional carriers has grown 150% since 2000. Over the same period mainline carrier capacity has fallen 15.5%. This increase can be attributed to the switch from turboprop planes to regional jets, permitting regional carriers to fly lon-ger routes. In addition, mainline carriers have been cutting low-demand routes, freeing up demand from travelers to regional carriers.93 The move toward larger regional aircraft is a factor for airports to monitor when considering which infrastructure improvements might need to be made to con-tinue to serve, or become a player in, the market. Larger regional jets that can hold around 90 passengers are replac-ing older turboprop and 50-seat aircraft; this speaks to the more expansive consolidation trend affecting the scheduled air services market.
91 Bellamy Pailthrop, “Biofuels Start to Take Off in the Airline Industry,” NPR.com. November 9, 2011. Accessed 12/5/2011. < http://www.npr.org/2011/11/09/142129847/biofuels-start-to-take-off-in-the-airline-industry>92 Ibid.93 FAA Aerospace Forecast, Fiscal Years 2011-2031, p. 15
2010 saw a lot of action in consolidation and restructuring with operations at Northwest Airlines folding into Delta Air-lines, and operations at Midwest Airlines folding into Fron-tier Airlines. Among regional carriers, “Delta Airlines sold its subsidiaries, Compass and Mesaba, to Trans States and Pinnacle, respectively, and Arctic Circle Air merged with ERA Aviation.”94 The merger of Continental Airlines with United Airlines, and Southwest Airlines with Air Tran, as well as the acquisition of ExpressJet by SkyWest Airlines were also an-nounced in 2010.
Virginia is not immune to such airline consolidation and the overall effect that it has on business and personal travel out of the state. Lynchburg Regional Airport (LYH) provides an example of a case in which airline consolidation is adverse-ly affecting business travel. Lynchburg supports a growing high-technology cluster, including a number of established nuclear engineering and wireless communication firms. Crucial to these businesses’ operation in the “new econo-my” is having scheduled air access to international airports. Lynchburg currently offers scheduled regional flight servic-es through U.S. Airways Express to Charlotte International Airport in North Carolina. Charlotte, however, does not of-fer the degree of international ingress and egress to ade-quately support the Lynchburg-based businesses. Addition-ally, Lynchburg Regional has been experiencing the effects of regional carrier consolidation since January 2011, when Delta discontinued regional services from Lynchburg to At-lanta. The Virginia Department of Transportation recently awarded LYH a $700,000 federal grant via the small com-munity air service development program to entice AirTran to commence regional commercial service to and from the airport.95 While this will assist in expanding LYH’s operating
94 Ibid.95 Tabitha, Cassidy, “Lynchburg airport receives grant money to lure new airline,” November 1, 2011. Available at <http://www.libertychampion.
Competitive Analysis of Virginia’s Aviation Industry | 41
area, the grant can only be extended to AirTran airlines and its regional service network. As a result, airport manage-ment is in negotiations with United Airlines in the attempt to extend service from Lynchburg to Dallas, an internation-al airport that, like Atlanta, can adequately accommodate high-technology business needs for international access.96 97
Industry consolidation will continue to manifest itself in reduced service levels offered from other airports beyond Lynchburg. Southwest Airlines announced, after their acqui-sition of AirTran, that Newport News/Williamsburg Airport (PHF) would not remain a part of their newly consolidated network. In addition to LYH and PHF, Shenandoah Valley Regional Airport (SHD) is also struggling to withstand the market pressures of airline consolidation. The net result is that smaller markets are more vulnerable to these changes in the airline business model.
Aviation Manufacturing
U.S. firms manufacture a wide range of products for civil and defense purposes and, in 2010, the value of civil aircraft and aircraft parts accounted for over half of the estimated $171 billion in U.S. aerospace shipments.98 In 2010, $67 billion in civil aircraft, engines, equipment, and parts were exported. Aerospace employment totaled 477,000 workers. Of these, 228,400 were engaged in the manufacturing of aircraft, 76,400 in engines and engine parts, and 97,600 in other parts and equipment.99 com/2011/11/01/lynchburg-airport-receives-grant-money-to-lure-new-airline/ > [Accessed December 20, 2011]. 96 Ibid.97 David Bryan, Executive Director of Region 2000 Economic Development Council. Telephone Interview by Hunter Snellings. 29 September, 2011.98 Glennon J. Harrison, Challenge to the Boeing-Airbus Duopoly in Civil Aircraft: Issues for Competitiveness (PDF file), para. 1 under “Summary,” July 25, 2011. Bethesda, MD: Congressional Research Service. Available at <http://www.speed-news.com/speednews_files/data/2001.pdf> [accessed December 2011]99 Ibid., para. 4.
Boeing, the only U.S. manufacturer of large civil aircraft, and its main competitor, Airbus, are expected to see increased competition with numerous foreign firms entering the small commercial jet aircraft manufacturing market. This segment currently accounts for nearly half of all U.S. commercial air-craft revenues and 60% of commercial aircraft deliveries. The competition is coming from “government-owned and subsidized firms in Russia and China, as well as companies in Canada, Brazil, and Japan.”100 There are several important competitive factors such as, “the openness of markets to foreign commercial aircraft and aircraft engines and parts; whether state-owned aircraft manufacturers continue to re-ceive substantial government subsidies; whether the chal-lengers to Boeing and Airbus achieve their goal of building innovative, efficient aircraft that establish excellent safety and service records; whether airlines will buy aircraft from companies that have no track record; and the effect of col-laborative partnerships with other aircraft manufacturers and suppliers as a strategy for success.”101
Growing markets in Asia and Latin America and the expect-ed retirement of older aircraft drives demand in the narrow-body aircraft market.102 Breaking into the market can be difficult for new aircraft manufacturers because of the high financial barriers to entry. Companies will often succeed or fail based on the results of their first attempt.103 Addition-ally, airlines are often set up to use certain models of planes to decrease risks that come along with fleet complexity, so they might not want to begin purchasing a different model if they can maintain continuity at a comparable cost. The newer firms also lack the history and reputation of success that Boeing and Airbus have developed, making it less likely 100 Ibid.101 Ibid., p.4.102 Ibid.103 Ibid.
42 | January 2012
that an airline would risk their own reputation on an un-proven manufacturer’s first attempt. Boeing and Airbus may also be able to produce more efficient models during the time it takes their challengers to get up and running.104
In late 2007, Rolls-Royce and the Commonwealth of Vir-ginia announced the creation of Rolls-Royce Crosspointe, a 1,000-acre campus in Prince George County that will sup-port the UK-based company’s future growth in aerospace. Rolls-Royce developed this campus to increase manufactur-ing and supply chain capacity in order to fulfill an $80 billion order book. Crosspointe provides Rolls-Royce a state-of-the-art manufacturing facility and a supply chain technol-ogy park that fosters a competitive R&D landscape and le-verages Virginia’s skilled aerospace workforce. The first Rolls-Royce facility at Crosspointe, which opened in 2010, produces advanced engineered rotative disk and turbofan components for the Trent series jet engines. This first in-vestment approached $180 million and employs a team of 140 professionals. The second Rolls-Royce facility to be con-structed at Crosspointe is under final review and is sched-uled to be announced in the near future. Rolls-Royce execu-tive management teams in Reston and the United Kingdom are actively targeting Virginia to locate future supply chain manufacturing facilities.105
In regard to R&D, Crosspointe is home to the new Com-monwealth Center for Advanced Manufacturing (CCAM). As discussed earlier, CCAM provides an arena where global industrial companies join together as members and share in the benefits of innovation and intellectual property. This game-changing R&D facility is based on a British model of collaborative industrial R&D launched by Rolls-Royce a de-cade ago that has grown into a global network of applied R&D centers. CCAM’s membership continues to grow and currently includes the University of Virginia, Virginia State University, Virginia Tech, and eight industrial corporations that include Canon, Chromalloy, Huntington Ingalls Indus-tries, Sandvik, Siemens, Rolls-Royce, and others.106
A second R&D operation that launched in May 2009 is the Commonwealth Center for Aerospace Propulsion Systems (CCAPS). CCAPS was created by the Commonwealth of Vir-ginia, Rolls-Royce, UVA and Virginia Tech as a closed center to benefit the innovation strategy of Rolls-Royce. CCAPS functions at the basic research level of discovery as a virtual center that leverages the laboratories and faculty of UVA and Virginia Tech engineering schools with the scientists and engineers of Rolls-Royce.107
104 Ibid.105 Information provided by Rolls-Royce Project Team at Virginia Economic Development Partnership.106 Ibid.107 Ibid.
8.2 NATIONAL LEGISLATIVE TRENDSThe August 2011 FAA shutdown cost 4,000 workers almost two weeks of pay and depleted the U.S. Treasury by almost $300 million. While the compromise did put workers back to work, it did not settle the differences that caused the shut-down in the first place, which was the result of members of Congress refusing to accept a House bill that included a $16.5 million cut in subsidies to 13 rural communities.108 In addition, there was a “standoff between the GOP-controlled House and the Democratic-controlled Senate over a provi-sion in long-term funding legislation for the FAA that would make it more difficult for airline and railroad workers to unionize.”109 The FAA has been operating on short-term ex-tensions since long-term funding expired in 2007, an issue associated with ambiguities in the long-term funding bill. Another issue was about $200 million in air service subsidies to rural communities that were created during deregulation in 1978 to ensure continued air service on less profitable routes to isolated communities. The House wanted to elimi-nate the program except in Alaska, while the Senate would eliminate service to 13 communities that are “either less than 90 miles from a hub airport or where subsidies total more than $1,000 per passenger.”110 This language was add-ed to the Senate extension bill.111
The Senate passed a second extension to avoid another shutdown on September 15, 2011 that extended the FAA’s financing for four months.112 The House reauthorization bill also contains language to allow more long-distance flights to Reagan National. Some legislators in Virginia and Maryland oppose this language out of protection for other airports’ business, and to protect constituents from increased jet noise.113
8.3 NEXT GENERATION AIR TRANSPORTATION SYSTEM (NEXTGEN) TECHNOLOGIES
NextGen is the term used by the FAA to designate the shift from ground based navigation and communications services to those based upon satellite and GPS technologies. Next-Gen is designed to allow air traffic control to use more direct routing on segments, and will result in more dependable travel while also saving fuel and reducing noise and carbon
108 Ashley Halsey III, “Congress reaches deal on FAA shutdown,” The Washing-ton Post, August 4, 2011, http://www.washingtonpost.com/local/congress-reach-es-deal-on-faa-shutdown/2011/08/04/gIQAsTQkuI_story.html?nav=emailpage
[accessed December 7, 2011]. 109 Ashley Halsey III, “Impasses lead to shutdown of FAA,” The Washington Post, July 22, 2011, http://www.westhawaiitoday.com/sections/news/nation-and-world-news/impasses-lead-shutdown-faa.html [accessed December 2011.110 Ibid. 111 Ibid.112 “New F.A.A. Shutdown is Averted,” via Bloomberg LP, September 16, 2011, http://www.nytimes.com/2011/09/16/business/senate-passes-bill-to-avert-faa-shutdown.html?_r=1.113 Dylan Matthews, “Everything you need to know about the FAA shutdown in one post,” Ezra Klein’s WONKBLOG (blog), The Washington Post, August 3, 2011, http://www.washingtonpost.com/blogs/ezra-klein/post/everything-you-need-to-know-about-the-faa-shutdown-in-one-post/2011/07/11/gIQAfatTsI_blog.html [accessed December 8, 2011].
Competitive Analysis of Virginia’s Aviation Industry | 43
pollution. Among other benefits, NextGen will help reduce wait times by getting real-time data in the hands of the air-craft crew. NextGen’s benefits rely upon aircraft operators and other stakeholders investing the resources needed to exploit the infrastructure put in place by the FAA. Howev-er, stakeholders have shown reluctance to invest in these resources, especially given the state of the economy, the fact that the industry is just recovering from a decade of losses, and the concern that the value of equipage may not offset the significant cost to equip resulting in short term losses. Simulation and other models do indicate that a well-equipped fleet with the programmed NextGen infrastruc-ture will positively affect corporate finances over the long term.
In early 2011, DOAV published a document entitled, Vir-ginia’s Flight to 2025: An Aviation Vision for the Common-wealth (Vision 2025). The document captures a strategic plan for the future, especially as it relates to NextGen de-velopment in Virginia. Vision 2025 is the first of its kind in the United States as it outlines three pillars of the Virginia plan, being (1) early implementation of NextGen ready tech-nologies, (2) test bed activities for maturing technologies, and (3) aviation research for emerging technologies. The report is intended to leverage the deployment of NextGen in the Commonwealth sooner than later. The goal for early implementation of NextGen technologies is to give Virginia an advantage in a critical aspect of an extremely competitive economic development landscape.114
Virginia’s participation in NextGen is the logical sequence of the state’s involvement in advancing evolving technologies for use in the NAS. The Commonwealth has been a partner with NASA, FAA, universities and corporate entities since 1999, when it decided to allocate staff and resources to the Small Aircraft Transportation System (SATS) program. SATS was a national effort primarily funded by NASA to boost the utility of small aircraft and GA airports through accelerating the testing and deployment of technologies, which increas-es safety and efficiency at these airports.115
Furthermore, Virginia has assumed a national leadership role as a result of SATS. Through the Virginia SATSLab, Inc. (VSATS), a non-profit public-private research corporation, Virginia led the national organization that managed this re-search program, and ultimately hosted the national demon-stration of SATS in Danville in June 2005.116
The evolution of SATS concepts has taken root in NextGen, and thus the state through VSATS. VSATS has again assumed an aggressive posture in seeking to demonstrate NextGen capabilities in the Commonwealth. Virginia sees opportu-nities for attracting businesses, both in aviation as well as 114 Virginia Department of Aviation, Virginia’s Flight to 2025: An Aviation Vi-sion for the Commonwealth (PDF file), 2011, available online at http://www.doav.virginia.gov/Downloads/Studies/Vision%202025/Vision%202025.pdf (accessed 30 January 2012).115 Ibid.116 Ibid.
from those businesses that use aviation services, through its early deployment of NextGen technologies.117
Examples of this most recent pursuit of NextGen participa-tion is the consideration given by the FAA to place an Early Implementation Project (EIP) in the state, deployment of ADS-B ground transmitters in Virginia at the outset of that national deployment schedule, and the potential use of Leesburg Municipal Airport in a demonstration of how to increase the acceptance rate of instrument flight plan (IFR) aircraft to non-towered GA airports.118
In 2010, the FAA approved the national deployment of the Automatic Dependent Surveillance Broadcast (ADS-B). The ADS-B system will update data for air traffic controllers with more frequency and accuracy allowing controllers to use the airspace more efficiently and will provide coverage to areas that are not currently covered by radar. The system also gives pilots access to weather and flight information servic-es. The increased accuracy provides for reduced separation between airplanes and greater predictability in arrival and departure times. The ground infrastructure for the ADS-B is expected to be completed in 2013. This still requires NAS users to upgrade equipment, and the current deadline to allow for upgrades during regular maintenance schedules is January 1, 2020. The role of ADS-B is still being determined in adding UAS to the NAS, and to improving capacity on closely spaced runways.119
Another aspect of NextGen is using Performance Based Navigation (PBN) routes and procedures to better fit the capabilities of today’s aircraft. For example, landing proce-dures typically call for stepping down at different levels with a change in power settings at each level, while aircraft that are properly equipped can use Optimized Profile Descent (OPD), which decreases the number of levels, allowing for fuel savings, reduced emissions, and lower noise levels. The FAA noted, “Especially beneficial for smaller airports, where general aviation aircraft often operate, are the area naviga-tion (RNAV) Wide Area Augmentation System (WAAS) Lo-calizer Performance with Vertical Guidance (LPV) approach procedures.”120 LPVs allow aircraft to land in lower visibility conditions, providing more reliable access to smaller air-ports throughout the year. The WAAS LPVs primarily benefit the smaller airports by providing satellite-based approaches where no ground-based landing system exists.121
117 Ibid.118 Ibid.119 Ibid.120 FAA. “Next Gen.” http://www.faa.gov/nextgen/ [accessed December 8, 2011].121 Virginia Department of Aviation, “Communications and Education Divi-sion.”
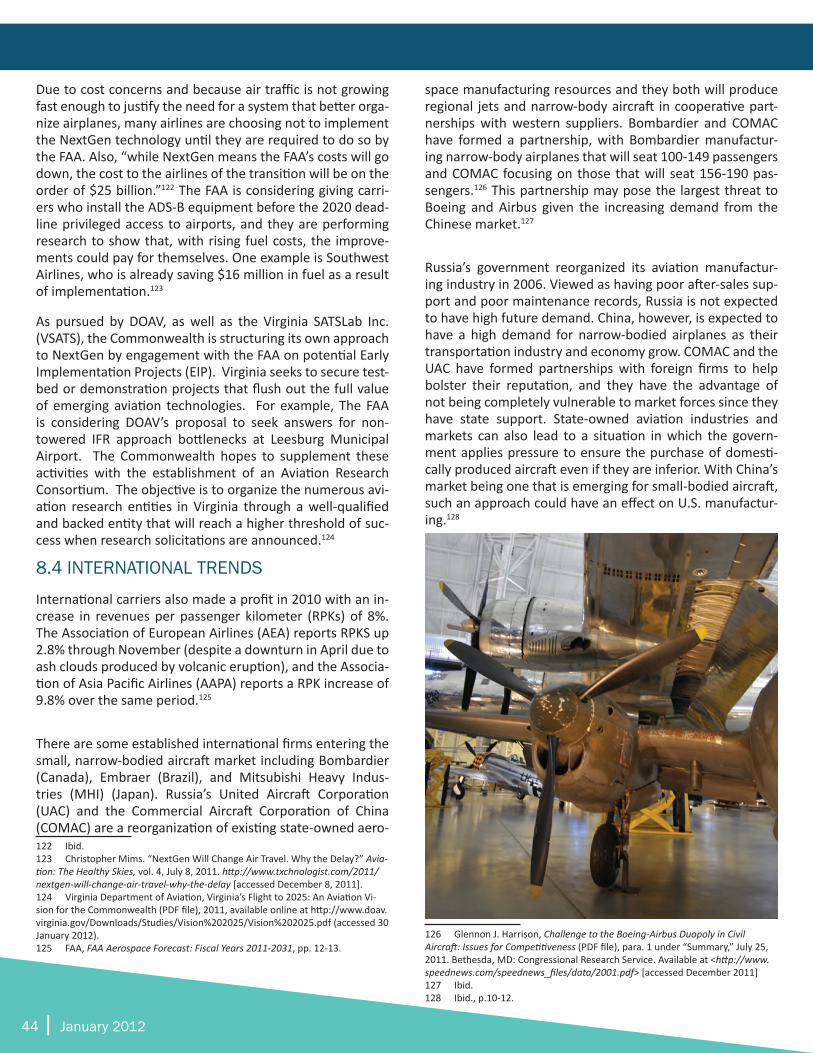
44 | January 2012
Due to cost concerns and because air traffic is not growing fast enough to justify the need for a system that better orga-nize airplanes, many airlines are choosing not to implement the NextGen technology until they are required to do so by the FAA. Also, “while NextGen means the FAA’s costs will go down, the cost to the airlines of the transition will be on the order of $25 billion.”122 The FAA is considering giving carri-ers who install the ADS-B equipment before the 2020 dead-line privileged access to airports, and they are performing research to show that, with rising fuel costs, the improve-ments could pay for themselves. One example is Southwest Airlines, who is already saving $16 million in fuel as a result of implementation.123
As pursued by DOAV, as well as the Virginia SATSLab Inc. (VSATS), the Commonwealth is structuring its own approach to NextGen by engagement with the FAA on potential Early Implementation Projects (EIP). Virginia seeks to secure test-bed or demonstration projects that flush out the full value of emerging aviation technologies. For example, The FAA is considering DOAV’s proposal to seek answers for non-towered IFR approach bottlenecks at Leesburg Municipal Airport. The Commonwealth hopes to supplement these activities with the establishment of an Aviation Research Consortium. The objective is to organize the numerous avi-ation research entities in Virginia through a well-qualified and backed entity that will reach a higher threshold of suc-cess when research solicitations are announced.124
8.4 INTERNATIONAL TRENDS
International carriers also made a profit in 2010 with an in-crease in revenues per passenger kilometer (RPKs) of 8%. The Association of European Airlines (AEA) reports RPKS up 2.8% through November (despite a downturn in April due to ash clouds produced by volcanic eruption), and the Associa-tion of Asia Pacific Airlines (AAPA) reports a RPK increase of 9.8% over the same period.125
There are some established international firms entering the small, narrow-bodied aircraft market including Bombardier (Canada), Embraer (Brazil), and Mitsubishi Heavy Indus-tries (MHI) (Japan). Russia’s United Aircraft Corporation (UAC) and the Commercial Aircraft Corporation of China (COMAC) are a reorganization of existing state-owned aero-122 Ibid.123 Christopher Mims. “NextGen Will Change Air Travel. Why the Delay?” Avia-tion: The Healthy Skies, vol. 4, July 8, 2011. http://www.txchnologist.com/2011/nextgen-will-change-air-travel-why-the-delay [accessed December 8, 2011]. 124 Virginia Department of Aviation, Virginia’s Flight to 2025: An Aviation Vi-sion for the Commonwealth (PDF file), 2011, available online at http://www.doav.virginia.gov/Downloads/Studies/Vision%202025/Vision%202025.pdf (accessed 30 January 2012).125 FAA, FAA Aerospace Forecast: Fiscal Years 2011-2031, pp. 12-13.
space manufacturing resources and they both will produce regional jets and narrow-body aircraft in cooperative part-nerships with western suppliers. Bombardier and COMAC have formed a partnership, with Bombardier manufactur-ing narrow-body airplanes that will seat 100-149 passengers and COMAC focusing on those that will seat 156-190 pas-sengers.126 This partnership may pose the largest threat to Boeing and Airbus given the increasing demand from the Chinese market.127
Russia’s government reorganized its aviation manufactur-ing industry in 2006. Viewed as having poor after-sales sup-port and poor maintenance records, Russia is not expected to have high future demand. China, however, is expected to have a high demand for narrow-bodied airplanes as their transportation industry and economy grow. COMAC and the UAC have formed partnerships with foreign firms to help bolster their reputation, and they have the advantage of not being completely vulnerable to market forces since they have state support. State-owned aviation industries and markets can also lead to a situation in which the govern-ment applies pressure to ensure the purchase of domesti-cally produced aircraft even if they are inferior. With China’s market being one that is emerging for small-bodied aircraft, such an approach could have an effect on U.S. manufactur-ing.128
126 Glennon J. Harrison, Challenge to the Boeing-Airbus Duopoly in Civil Aircraft: Issues for Competitiveness (PDF file), para. 1 under “Summary,” July 25, 2011. Bethesda, MD: Congressional Research Service. Available at <http://www.speednews.com/speednews_files/data/2001.pdf> [accessed December 2011]127 Ibid.128 Ibid., p.10-12.
Competitive Analysis of Virginia’s Aviation Industry | 45
9. STRATEGIES FOR MOVING FORWARD1. Aviation Program Funding - Ensure adequate aviation program funding to provide for robust statewide aviation infrastructure, supporting business development and expansion.
The analysis contained within the Services and Amenities section of this report shows that Virginia holds a competi-tive advantage in the percentage of airports equipped with safety enhancing infrastructure, such as automated weather reporting and instrument approach procedures. The Com-monwealth is also among the elite in security program fund-ing and procedures at its 57 general aviation airports. Such assets to the Virginia Air Transportation System must now be complemented with further infrastructure enhancement programs aimed at boosting the Commonwealth’s econom-ic development potential in attracting Part 135 air charter/air taxi business. Strategic investments and policy advance-ments in the following categories will provide the means for such advancement:
A. Runways – Virginia in partnership with the FAA, should explore the potential for further develop-ment of the runway infrastructure at appropriate airports without 5,000 foot runways. Surpassing the 5,000 foot runway threshold opens the airport to enhanced Part 135 business aviation, providing better access and services while boosting a commu-nity’s economic potential. Virginia should conduct a runway review/study in cooperation with the FAA
to determine which airports may qualify for FAA and state funding to lengthen the runways to encourage more business utilization.
B. Hangars – Virginia should work with airport spon-sors and localities to increase awareness of the opportunities and funding available to construct hangars at the remaining six airports without such facilities.
C. Fuel – DOAV should work with airport sponsors to promote and equip airports with 24-hour Avgas fueling stations or call out capability, while also in-creasing the availability of jet fuel at those airports with the capabilities to support jet operations.
D. Terminals – In order for Virginia to elevate air char-ter/air taxi service, it must implement the necessary infrastructure improvements to attract business and travelers to more of the Commonwealth’s public-use airports. Virginia terminals must be constructed to support aspects of business operation and pres-ent a good first impression of Virginia’s communi-ties. Virginia should conduct a terminal review and create a plan to identify and prioritize airports for terminal construction and rehabilitation. Priority should go to those airports that don’t have a ter-minal, and then remaining terminal rehabilitations based on need.
Competitive Analysis of Virginia’s Aviation Industry | 45
46 | January 2012
2. Aviation Technology - Establish Virginia as a leader in NextGen and new aviation technologies.
Virginia’s Flight to 2025: An Aviation Vision for the Com-monwealth (Vision 2025) provides a path forward for the Commonwealth to be a leader in NextGen. It identifies the technologies that provide the most promise for new busi-nesses and economic opportunity for the Commonwealth.
A. NextGen I. Early implementation of ready technologies – DOAV should continue to pursue being an early adopter of technologies that improve the airport throughput and access to provide more opportuni-ties for business and more economic development for the communities.
II. Test bed for maturing technologies – DOAV should continue to work with the FAA to hold dem-onstrations and testing of NextGen programs in the Commonwealth.
III. Research consortium for emerging technologies DOAV should work with the aerospace community, universities, and industry to establish a Virginia Avi-ation and Space Research Consortium to promote Virginia in the research of emerging technologies. Virginia’s institutions of higher learning are some of the Commonwealth’s strongest aviation and space industry assets. Virginia’s universities are world re-nown for the quality and competitiveness of their engineering programs. Consequently, Virginia has the highest number of engineers as a percentage of its workforce than any other state in the nation.129 As a result of its excellent aviation and space re-search track record, as well as strong leadership in the federal government, Virginia has the potential to become a leader in the next generation of avia-tion research. According to a September 2011 ar-ticle, NASA is looking to Hampton Roads, Virginia as a hub for green aviation research and develop-ment.130 Virginia must capitalize on this opportunity, and future research opportunities, by developing an aviation and space research consortium to promote these initiatives.
129 Robert D. Atkinson and Scott Andes, The 2010 State New Economy Index: Benchmarking Economic Transformation in the States (PDF file), p. 8, The Infor-mation Technology and Innovation Foundation, available at http://www.itif.org/files/2010-state-new-economy-index.pdf130 Cory Nealson, “NASA chief: Hampton Roads could be leader in green avia-tion,” Dailypress.com, September 22, 2011, http://articles.dailypress.com/2011-09-22/news/dp-nws-nasa-rocket-20110922_1_green-aviation-nasa-langley-research-center -aviation-conference [accessed December 2011].
B. Unmanned Aerial Systems (UAS) - Virginia should work to incorporate UAS development, manufactur-ing, testing and support into its aerospace portfolio. UAS is a growing component of military aviation and NextGen research, and Virginia should support this research as part of its strategy to become a leader in emerging technology testing and implementation
3. Promotion - Promote the benefits and competitive standing of Virginia’s Air Transportation System in its support for airports, businesses, and tourism. Virginia airports are economic engines, technology magnets, & tourism gateways for the Commonwealth.
A. Business Charter and Air Taxi Services - Use this re-port, and the dashboard tables and figures provided within, to promote Virginia’s excellent general avia-tion infrastructure. Highlight DOAV’s user-based fund-ing programs and technical services to Part 135 op-erators and Fixed Base Operators alike. Finally, work with the Virginia Economic Development Partnership to actively approach Part 135 companies encouraging their relocation and expansion in Virginia.
B. High-Technology Business - Virginia’s prominence in business charter and air taxi services should be pro-moted to provide enhanced economic opportunity in more communities serviced by a public-use air-port. Virginia is host to 35 business charter and air taxi companies offering services to many of the Com-monwealth’s general aviation airports. DOAV should continue to embark on an enhanced business avia-tion campaign to raise awareness of the capabilities of air charter and air taxi to provide businesses and residents increased mobility and efficiency in travers-ing the state. The message should center on the air-ports’ capacity as technology magnets and economic engines that drive economic development in the sur-rounding regions.
C. Tourism - Promotional efforts should also address the role that Virginia’s Air Transportation System plays in the proliferation of the Commonwealth’s tourism in-dustry, a major component of Virginia’s economic vi-tality.
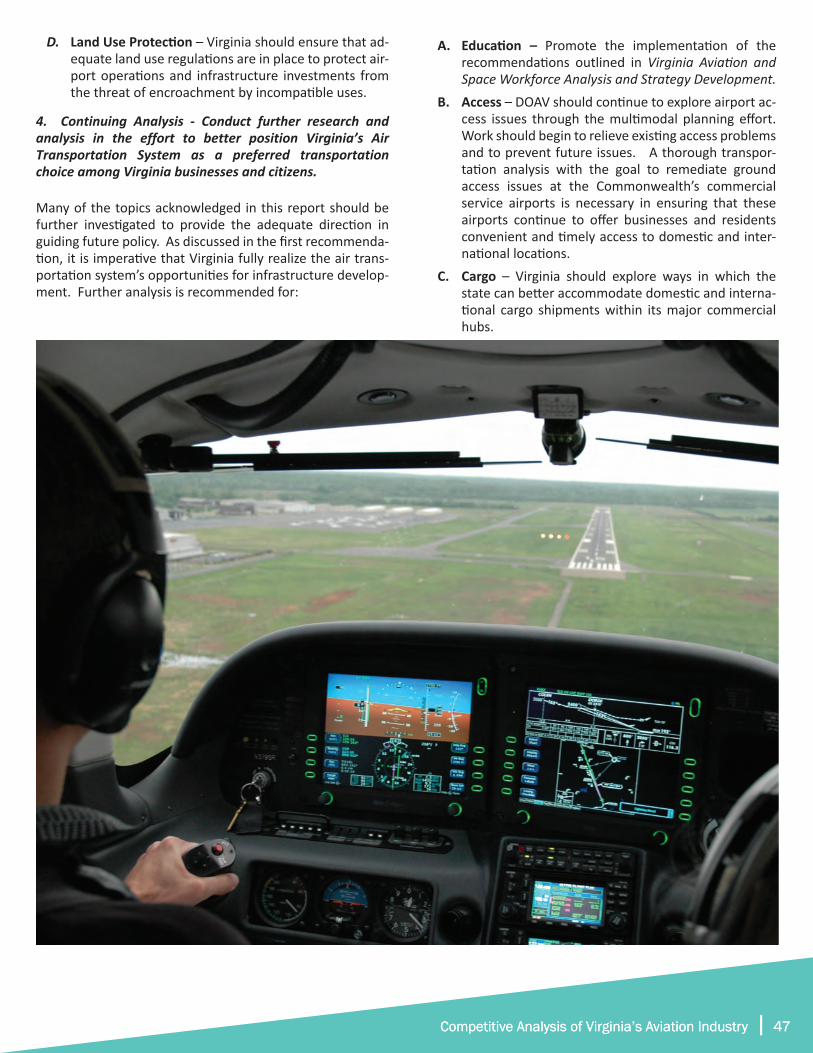
Competitive Analysis of Virginia’s Aviation Industry | 47
A. Education – Promote the implementation of the recommendations outlined in Virginia Aviation and Space Workforce Analysis and Strategy Development.
B. Access – DOAV should continue to explore airport ac-cess issues through the multimodal planning effort. Work should begin to relieve existing access problems and to prevent future issues. A thorough transpor-tation analysis with the goal to remediate ground access issues at the Commonwealth’s commercial service airports is necessary in ensuring that these airports continue to offer businesses and residents convenient and timely access to domestic and inter-national locations.
C. Cargo – Virginia should explore ways in which the state can better accommodate domestic and interna-tional cargo shipments within its major commercial hubs.
Competitive Analysis of Virginia’s Aviation Industry | 47
D. Land Use Protection – Virginia should ensure that ad-equate land use regulations are in place to protect air-port operations and infrastructure investments from the threat of encroachment by incompatible uses.
4. Continuing Analysis - Conduct further research and analysis in the effort to better position Virginia’s Air Transportation System as a preferred transportation choice among Virginia businesses and citizens.
Many of the topics acknowledged in this report should be further investigated to provide the adequate direction in guiding future policy. As discussed in the first recommenda-tion, it is imperative that Virginia fully realize the air trans-portation system’s opportunities for infrastructure develop-ment. Further analysis is recommended for:
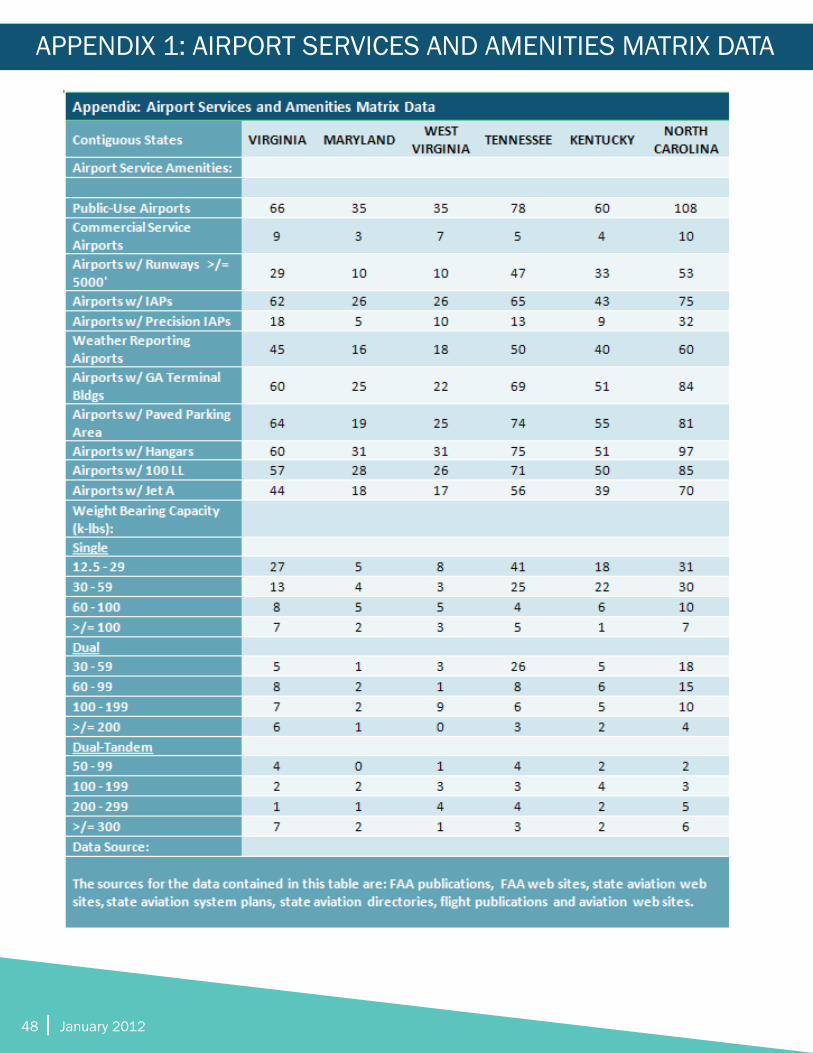
48 | January 2012
APPENDIX 1: AIRPORT SERVICES AND AMENITIES MATRIX DATA
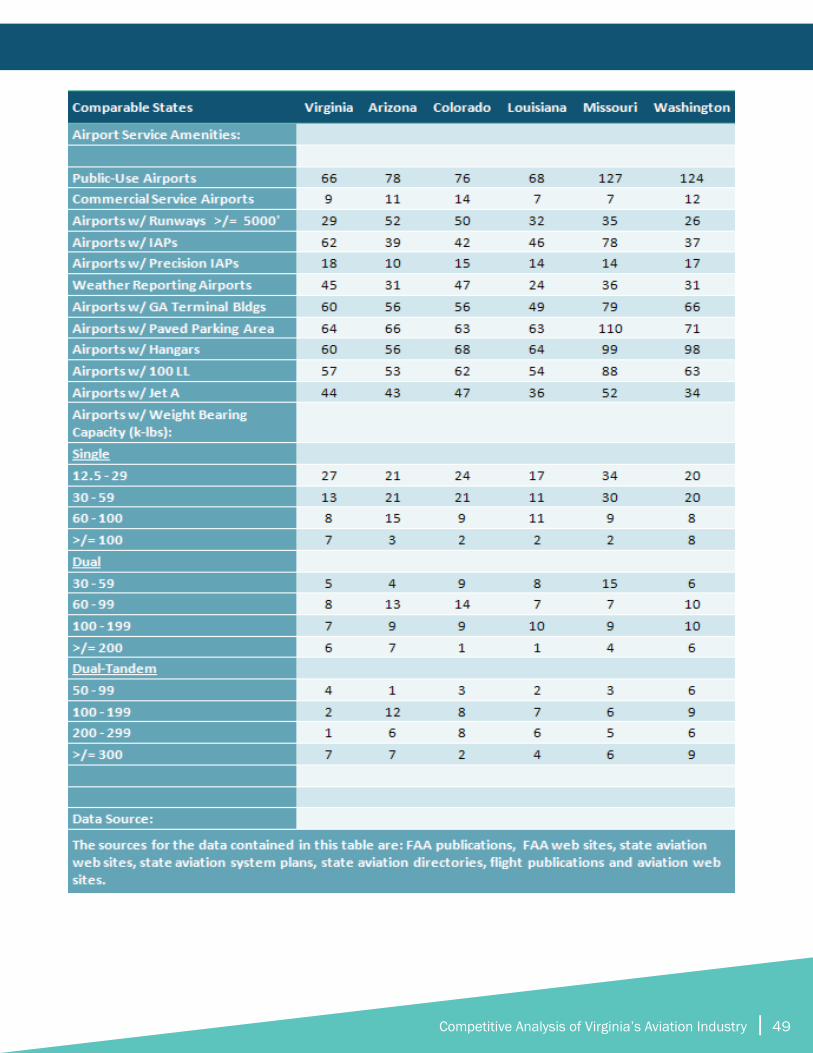
Competitive Analysis of Virginia’s Aviation Industry | 49
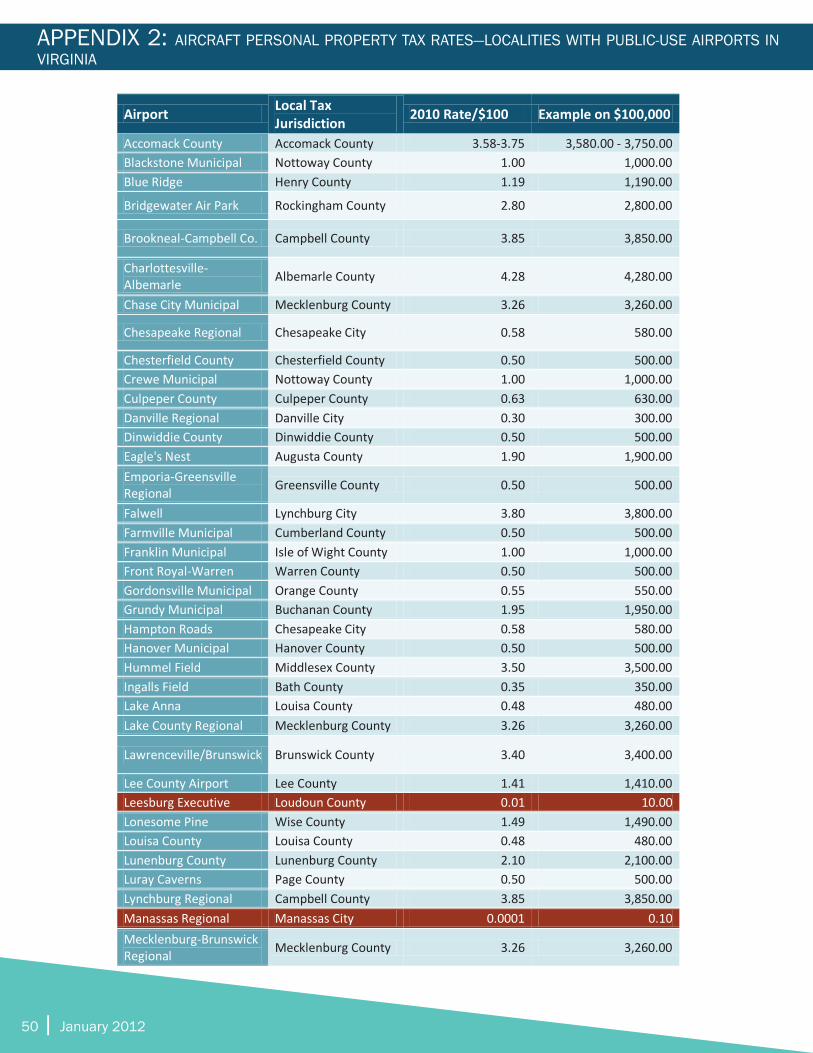
50 | January 2012
APPENDIX 2: AIRCRAFT PERSONAL PROPERTY TAX RATES—LOCALITIES WITH PUBLIC-USE AIRPORTS IN VIRGINIA
Airport Local Tax Jurisdiction 2010 Rate/$100 Example on $100,000
Accomack County Accomack County 3.58-3.75 3,580.00 - 3,750.00 Blackstone Municipal Nottoway County 1.00 1,000.00 Blue Ridge Henry County 1.19 1,190.00
Bridgewater Air Park Rockingham County 2.80 2,800.00
Brookneal-Campbell Co. Campbell County 3.85 3,850.00
Charlottesville-Albemarle Albemarle County 4.28 4,280.00
Chase City Municipal Mecklenburg County 3.26 3,260.00
Chesapeake Regional Chesapeake City 0.58 580.00
Chesterfield County Chesterfield County 0.50 500.00 Crewe Municipal Nottoway County 1.00 1,000.00 Culpeper County Culpeper County 0.63 630.00 Danville Regional Danville City 0.30 300.00 Dinwiddie County Dinwiddie County 0.50 500.00 Eagle's Nest Augusta County 1.90 1,900.00 Emporia-Greensville Regional Greensville County 0.50 500.00
Falwell Lynchburg City 3.80 3,800.00 Farmville Municipal Cumberland County 0.50 500.00 Franklin Municipal Isle of Wight County 1.00 1,000.00 Front Royal-Warren Warren County 0.50 500.00 Gordonsville Municipal Orange County 0.55 550.00 Grundy Municipal Buchanan County 1.95 1,950.00 Hampton Roads Chesapeake City 0.58 580.00 Hanover Municipal Hanover County 0.50 500.00 Hummel Field Middlesex County 3.50 3,500.00 Ingalls Field Bath County 0.35 350.00 Lake Anna Louisa County 0.48 480.00 Lake County Regional Mecklenburg County 3.26 3,260.00
Lawrenceville/Brunswick Brunswick County 3.40 3,400.00
Lee County Airport Lee County 1.41 1,410.00 Leesburg Executive Loudoun County 0.01 10.00 Lonesome Pine Wise County 1.49 1,490.00 Louisa County Louisa County 0.48 480.00 Lunenburg County Lunenburg County 2.10 2,100.00 Luray Caverns Page County 0.50 500.00 Lynchburg Regional Campbell County 3.85 3,850.00 Manassas Regional Manassas City 0.0001 0.10 Mecklenburg-Brunswick Regional Mecklenburg County 3.26 3,260.00
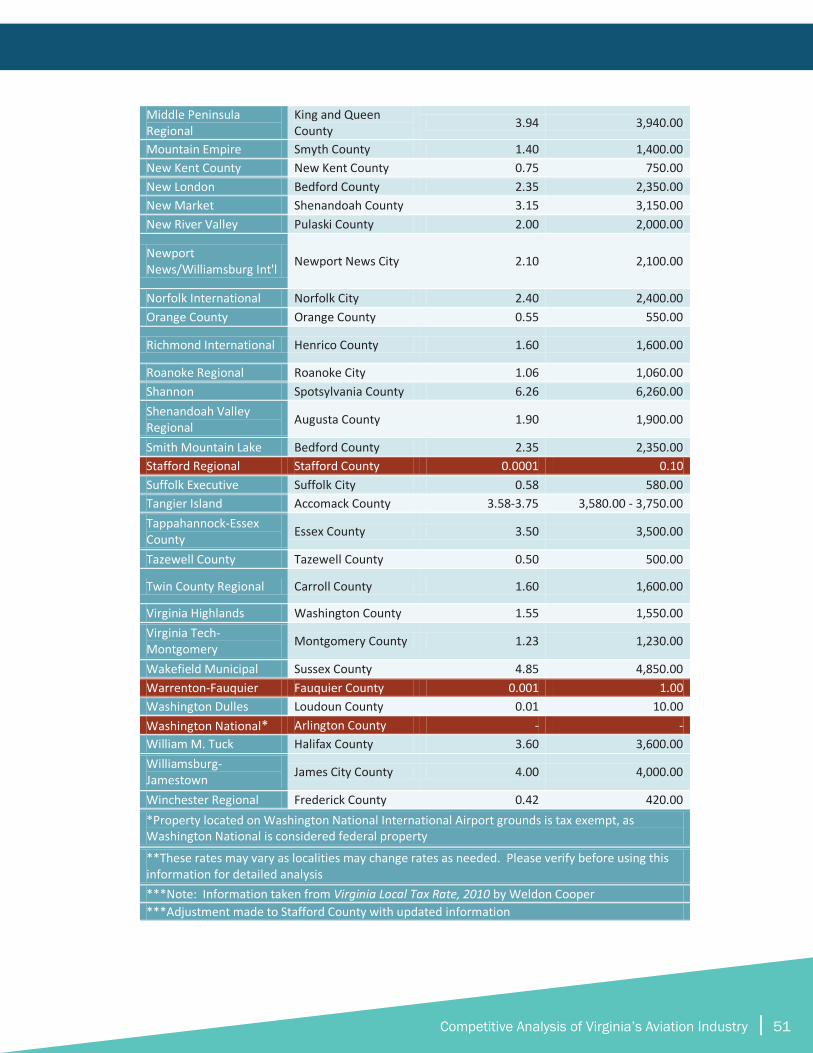
Competitive Analysis of Virginia’s Aviation Industry | 51
Middle Peninsula Regional
King and Queen County 3.94 3,940.00
Mountain Empire Smyth County 1.40 1,400.00 New Kent County New Kent County 0.75 750.00 New London Bedford County 2.35 2,350.00 New Market Shenandoah County 3.15 3,150.00 New River Valley Pulaski County 2.00 2,000.00
Newport News/Williamsburg Int'l Newport News City 2.10 2,100.00
Norfolk International Norfolk City 2.40 2,400.00 Orange County Orange County 0.55 550.00
Richmond International Henrico County 1.60 1,600.00
Roanoke Regional Roanoke City 1.06 1,060.00 Shannon Spotsylvania County 6.26 6,260.00 Shenandoah Valley Regional Augusta County 1.90 1,900.00
Smith Mountain Lake Bedford County 2.35 2,350.00 Stafford Regional Stafford County 0.0001 0.10 Suffolk Executive Suffolk City 0.58 580.00 Tangier Island Accomack County 3.58-3.75 3,580.00 - 3,750.00 Tappahannock-Essex County Essex County 3.50 3,500.00
Tazewell County Tazewell County 0.50 500.00
Twin County Regional Carroll County 1.60 1,600.00
Virginia Highlands Washington County 1.55 1,550.00 Virginia Tech-Montgomery Montgomery County 1.23 1,230.00
Wakefield Municipal Sussex County 4.85 4,850.00 Warrenton-Fauquier Fauquier County 0.001 1.00 Washington Dulles Loudoun County 0.01 10.00 Washington National* Arlington County - - William M. Tuck Halifax County 3.60 3,600.00 Williamsburg-Jamestown James City County 4.00 4,000.00
Winchester Regional Frederick County 0.42 420.00 *Property located on Washington National International Airport grounds is tax exempt, as Washington National is considered federal property
**These rates may vary as localities may change rates as needed. Please verify before using this information for detailed analysis ***Note: Information taken from Virginia Local Tax Rate, 2010 by Weldon Cooper***Adjustment made to Stafford County with updated information
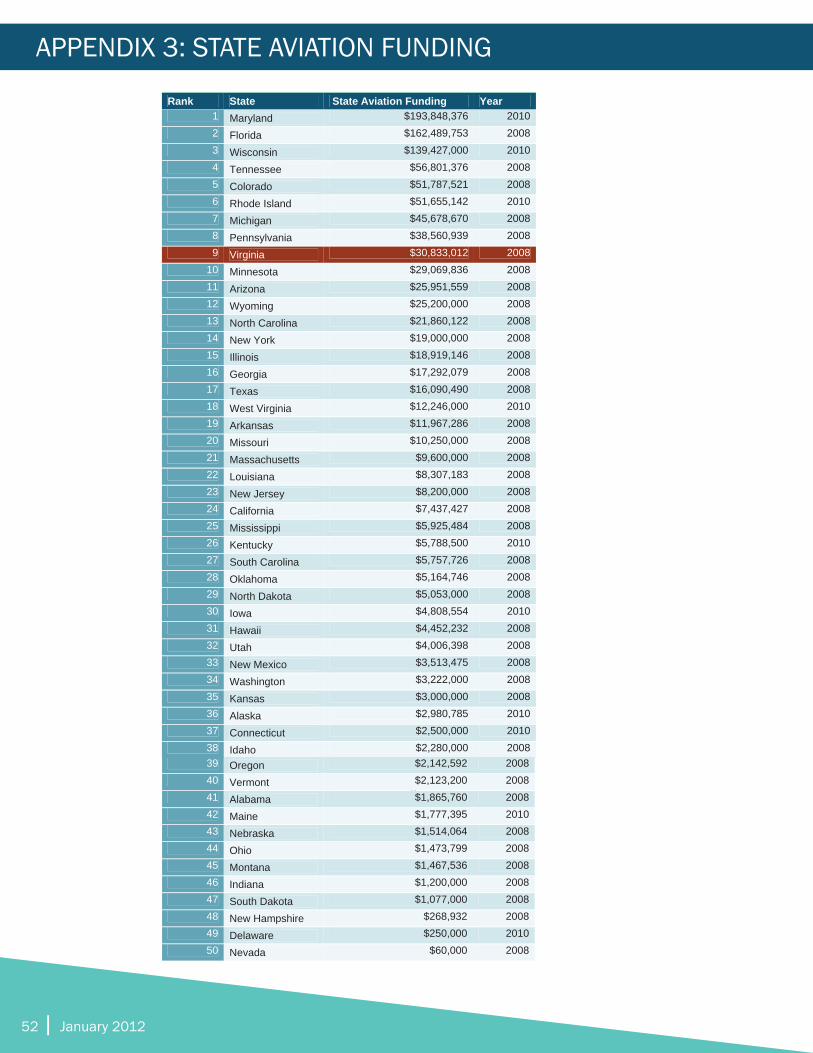
52 | January 2012
APPENDIX 3: STATE AVIATION FUNDING
6
Rank State State Aviation Funding Year 1 Maryland $193,848,376 20102 Florida $162,489,753 20083 Wisconsin $139,427,000 20104 Tennessee $56,801,376 20085 Colorado $51,787,521 20086 Rhode Island $51,655,142 20107 Michigan $45,678,670 20088 Pennsylvania $38,560,939 20089 Virginia $30,833,012 2008
10 Minnesota $29,069,836 200811 Arizona $25,951,559 200812 Wyoming $25,200,000 200813 North Carolina $21,860,122 200814 New York $19,000,000 200815 Illinois $18,919,146 200816 Georgia $17,292,079 200817 Texas $16,090,490 200818 West Virginia $12,246,000 201019 Arkansas $11,967,286 200820 Missouri $10,250,000 200821 Massachusetts $9,600,000 200822 Louisiana $8,307,183 200823 New Jersey $8,200,000 200824 California $7,437,427 200825 Mississippi $5,925,484 200826 Kentucky $5,788,500 201027 South Carolina $5,757,726 200828 Oklahoma $5,164,746 200829 North Dakota $5,053,000 200830 Iowa $4,808,554 201031 Hawaii $4,452,232 200832 Utah $4,006,398 200833 New Mexico $3,513,475 200834 Washington $3,222,000 200835 Kansas $3,000,000 200836 Alaska $2,980,785 201037 Connecticut $2,500,000 201038 Idaho $2,280,000 2008
7
39 Oregon $2,142,592 200840 Vermont $2,123,200 200841 Alabama $1,865,760 200842 Maine $1,777,395 201043 Nebraska $1,514,064 200844 Ohio $1,473,799 200845 Montana $1,467,536 200846 Indiana $1,200,000 200847 South Dakota $1,077,000 200848 New Hampshire $268,932 200849 Delaware $250,000 201050 Nevada $60,000 2008
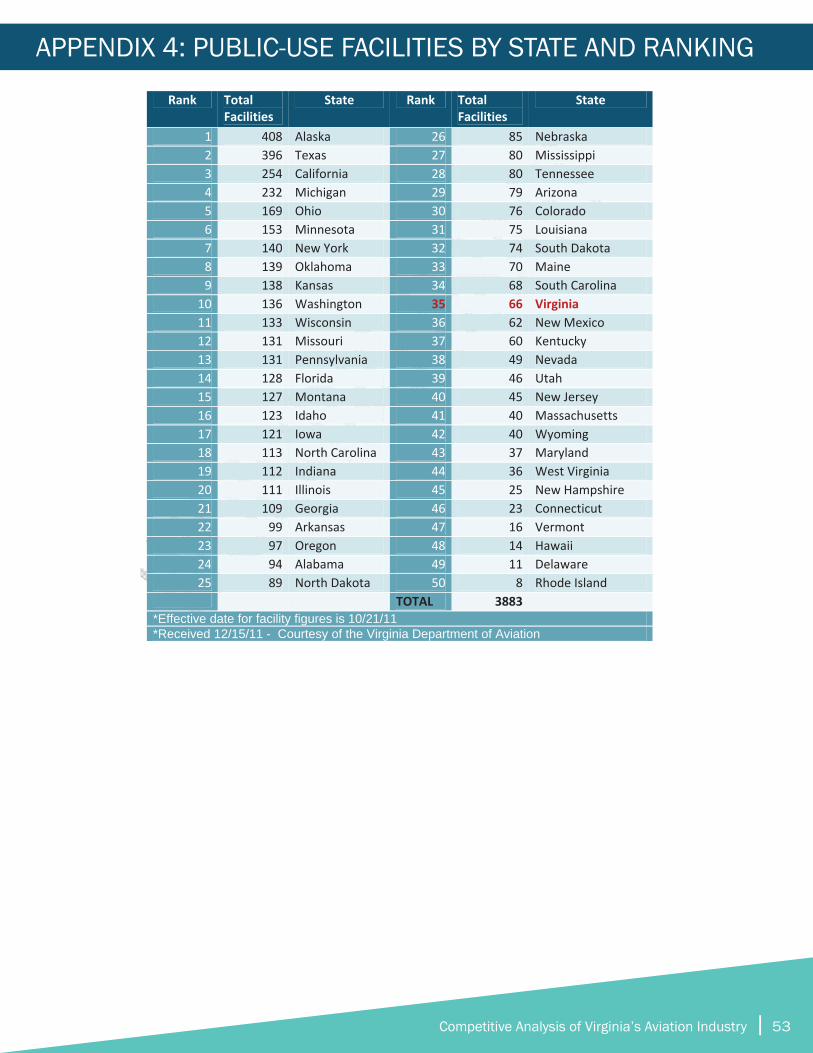
Competitive Analysis of Virginia’s Aviation Industry | 53
APPENDIX 4: PUBLIC-USE FACILITIES BY STATE AND RANKING
C o m p e t i t i v e A n a l y s i s o f V i r g i n i a ’ s A v i a t i o n I n d u s t r y | 68
68
Rank Total Facilities
State Rank Total Facilities
State
1 408 Alaska 26 85 Nebraska 2 396 Texas 27 80 Mississippi 3 254 California 28 80 Tennessee 4 232 Michigan 29 79 Arizona 5 169 Ohio 30 76 Colorado 6 153 Minnesota 31 75 Louisiana 7 140 New York 32 74 South Dakota 8 139 Oklahoma 33 70 Maine 9 138 Kansas 34 68 South Carolina
10 136 Washington 35 66 Virginia 11 133 Wisconsin 36 62 New Mexico 12 131 Missouri 37 60 Kentucky 13 131 Pennsylvania 38 49 Nevada 14 128 Florida 39 46 Utah 15 127 Montana 40 45 New Jersey 16 123 Idaho 41 40 Massachusetts 17 121 Iowa 42 40 Wyoming 18 113 North Carolina 43 37 Maryland 19 112 Indiana 44 36 West Virginia 20 111 Illinois 45 25 New Hampshire 21 109 Georgia 46 23 Connecticut 22 99 Arkansas 47 16 Vermont 23 97 Oregon 48 14 Hawaii 24 94 Alabama 49 11 Delaware 25 89 North Dakota 50 8 Rhode Island
TOTAL 3883 *Effective date for facility figures is 10/21/11 *Received 12/15/11 - Courtesy of the Virginia Department of Aviation
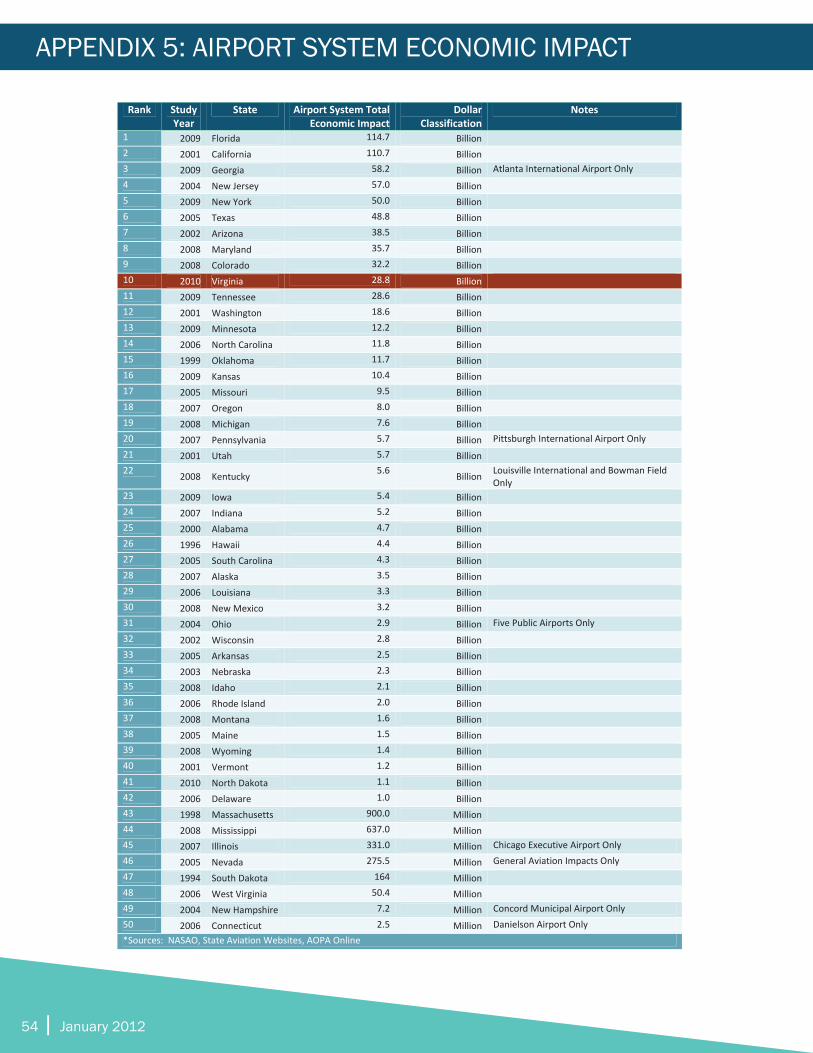
54 | January 2012
APPENDIX 5: AIRPORT SYSTEM ECONOMIC IMPACT
Rank Study Year
State Airport System Total Economic Impact
Dollar Classification
Notes
1 2009 Florida 114.7 Billion 2 2001 California 110.7 Billion 3 2009 Georgia 58.2 Billion Atlanta International Airport Only4 2004 New Jersey 57.0 Billion 5 2009 New York 50.0 Billion 6 2005 Texas 48.8 Billion 7 2002 Arizona 38.5 Billion 8 2008 Maryland 35.7 Billion 9 2008 Colorado 32.2 Billion 10 2010 Virginia 28.8 Billion 11 2009 Tennessee 28.6 Billion 12 2001 Washington 18.6 Billion 13 2009 Minnesota 12.2 Billion 14 2006 North Carolina 11.8 Billion 15 1999 Oklahoma 11.7 Billion 16 2009 Kansas 10.4 Billion 17 2005 Missouri 9.5 Billion 18 2007 Oregon 8.0 Billion 19 2008 Michigan 7.6 Billion 20 2007 Pennsylvania 5.7 Billion Pittsburgh International Airport Only 21 2001 Utah 5.7 Billion 22 2008 Kentucky 5.6 Billion Louisville International and Bowman Field
Only 23 2009 Iowa 5.4 Billion 24 2007 Indiana 5.2 Billion 25 2000 Alabama 4.7 Billion 26 1996 Hawaii 4.4 Billion 27 2005 South Carolina 4.3 Billion 28 2007 Alaska 3.5 Billion 29 2006 Louisiana 3.3 Billion 30 2008 New Mexico 3.2 Billion 31 2004 Ohio 2.9 Billion Five Public Airports Only32 2002 Wisconsin 2.8 Billion 33 2005 Arkansas 2.5 Billion 34 2003 Nebraska 2.3 Billion 35 2008 Idaho 2.1 Billion 36 2006 Rhode Island 2.0 Billion 37 2008 Montana 1.6 Billion 38 2005 Maine 1.5 Billion 39 2008 Wyoming 1.4 Billion 40 2001 Vermont 1.2 Billion 41 2010 North Dakota 1.1 Billion 42 2006 Delaware 1.0 Billion 43 1998 Massachusetts 900.0 Million 44 2008 Mississippi 637.0 Million 45 2007 Illinois 331.0 Million Chicago Executive Airport Only46 2005 Nevada 275.5 Million General Aviation Impacts Only47 1994 South Dakota 164 Million 48 2006 West Virginia 50.4 Million 49 2004 New Hampshire 7.2 Million Concord Municipal Airport Only50 2006 Connecticut 2.5 Million Danielson Airport Only *Sources: NASAO, State Aviation Websites, AOPA Online
Rank State State Aviation Funding Year 1 Maryland $193,848,376 20102 Florida $162,489,753 20083 Wisconsin $139,427,000 20104 Tennessee $56,801,376 20085 Colorado $51,787,521 20086 Rhode Island $51,655,142 20107 Michigan $45,678,670 20088 Pennsylvania $38,560,939 20089 Virginia $30,833,012 2008
10 Minnesota $29,069,836 200811 Arizona $25,951,559 2008

Competitive Analysis of Virginia’s Aviation Industry | 55
BIBLIOGRAPHY AND WORKS CITEDAlliance for Aviation Across America (AAAA). “Alliance for Aviation Across America Proclamation-Signing Celebration with Geor-gia Governor Sonny Perdue Recognizing the Value of General Aviation.” AAAA press release, October 7, 2009. <http://www.aviationacrossamerica.org/Press_Release_Detail.aspx?id=21347> [December 2011]
Bryan, David. Executive Director – Region 2000 Economic Development Council. Telephone Interview by Hunter Snellings. Sep-tember 30, 2011.
Cassidy, Tabitha. “Lynchburg airport receives grant money to lure new airline.” Liberty Champion, November 1, 2011. Available at <http://www.libertychampion.com/2011/11/01/lynchburg-airport-receives-grant-money-to-lure-new-airline/ > [Accessed December 20, 2011].
Charlottesville-Albemarle Airport website. “General Information.” <http://www.gocho.com/index.php/general_aviation> [ac-cessed December 2, 2011]
DeVol, Ross, Anita Charuworn, and Soojung Kim. State Technology and Science Index: Enduring Lessons for an Intangible Econo-my. Milken Institute: June 2008. <http://www.milkeninstitute.org/pdf/StateTechScienceIndex.pdf>
Federal Aviation Administration. FAA Aerospace Forecast: 2011-2031 (PDF file). N.d. Available at <http://www.faa.gov/about/of-fice_org/headquarters_offices/apl/aviation_forecasts/aerospace_forecasts/2011-2031/media/2011%20Forecast%20Doc.pdf>
Federal Aviation Administration. Certification Information for Operating Under Part 135 (PDF file). N.d. Available at <http://www.faa.gov/licenses_certificates/airline_certification/media/n135toc.pdf> [accessed December 7, 2011]
Federal Aviation Administration. FAA Data Communications: “How We Want To Fly” (PDF file). N.d. <http://www.faa gov/about/office_org/headquarters_offices/ato/service_units/techops/atc_comms_services/datacomm/documentation/me-dia/brochures/09818_DataComm_Broch_PRINT2.1.pdf> [accessed December 2011]
Federal Aviation Administration. “FAA Part 139 Standards.” <http://www.faa.gov/airports/airport_safety/part139_cert/>
Federal Aviation Administration. “NextGen.” <http://www.faa.gov/nextgen/>
Federal Aviation Administration. “Title 14, Part 91: General Operating and Flight Rules.” <http://ecfr.gpoaccess.gov/cgi/t/text/text-idx?c=ecfr&sid=3efaad1b0a259d4e48f1150a34d1aa77&rgn=div5&view=text&node=14:2.0.1.3.10&idno=14> [December 8, 2011]
Halsey, Ashley III. “Congress reaches deal on FAA shutdown.” The Washington Post, August 4, 2011. <http://www.washing-tonpost.com/local/congress-reaches-deal-on-faa-shutdown/2011/08/04/gIQAsTQkuI_story.html?nav=emailpage> [accessed December 2011]
Halsey, Ashley III. “Impasses lead to shutdown of FAA.” The Washington Post, July 22, 2011. <http://www.westhawaiitoday.com/sections/news/nation-and-world-news/impasses-lead-shutdown-faa.html> [accessed December 2011]
Harrison, Glennon J. Challenge to the Boeing-Airbus Duopoly in Civil Aircraft: Issues for Competitiveness. July 25, 2011. Betheda, MD: Congressional Research Service. Available at <http://www.speednews.com/speednews_files/data/2001.pdf>
Lynchburg Regional Airport. <http://www.lynchburgva.gov/index.aspx?page=85> [accessed December 2, 2011]
Matthews, Dylan. “Everything you need to know about the FAA shutdown in one post.” Ezra Klein’s WONKBLOG (blog), The Washington Post, August 3, 2011. <http://www.washingtonpost.com/blogs/ezra-klein/post/everything-you-need-to-know-about-the-faa-shutdown-in-one-post/2011/07/11/gIQAfatTsI_blog.html> [accessed December 8, 2011]
May, James C. “Focus Needed on Competitiveness.” Aviation Daily, July 13, 2010. <http://www.aviationweek.com/aw/generic/story_channel.jsp?channel=comm&id=news/avd/2010/07/13/11.xml&headline=May:%20Focus%20Needed%20On%20Competi-tiveness> [accessed December 2011]
56 | January 2012
Mims, Christopher. “NextGen Will Change Air Travel. Why the Delay?” Aviation: The Healthy Skies, vol. 4: July 8, 2011. <http://www.txchnologist.com/2011/nextgen-will-change-air-travel-why-the-delay>
National Business Aviation Association (NBAA). “Business Aviation: Just the Facts.” 2010 Business Aviation Fact Book. Available at <http://www.nbaa.org/business-aviation/fact-book/facts/> [accessed December 2011]
“New F.A.A. Shutdown is Averted.” Via Bloomberg LP. September 16, 2011. <http://www.nytimes.com/2011/09/16/business/senate-passes-bill-to-avert-faa-shutdown.html?_r=1> [accessed December 2011]
Norfolk International Airport. Master Plan Update. Prepared by Jacobs Consultancy, et al. December 2008. Available online at <http://www.norfolkairport.com/images/stories/airport-information/master-plan-update/ORFMasterPlanUpdate2008.pdf> [December 2011]
Office of Intermodal Planning and Investment. Governor’s Multimodal Strategic Plan for the Commonwealth of Virginia (PDF file). December 2010. Prepared by Multimodal Strategic Transportation Planning Team. Available at <http://vtrans.org/resourc-es/Strategic_Plan_12_01_10%20FINAL.pdf>
Pailthorp, Bethany. “Biofuels start to take off in the airline industry.” NPR.org, November 9, 2011. <http://www.npr.org/2011/11/09/142129847/biofuels-start-to-take-off-in-the-airline-industry> [accessed December 15, 2011]
Richmond International Airport. Master Plan. Not dated. Prepared by Kutchins & Groh, L.L.C. Available at <http://www.flyrich-mond.com/Site_Downloads/Master_Plan_Downloads/01_Introduction.pdf> [accessed December 2, 2011]
Ronald Reagan Washington National Airport. “Flight Information.” <http://www.metwashairports.com/reagan/1261.htm>
Stubbs, Nel. Tax and Funding Study. N.d. Prepared for DOAV by Conklin and de Decker.
Virginia Department of Aviation (DOAV). Airport Program Manual. August 2011. Available at <http://tinyurl.com/72uznma> [ac-cessed December 2011]
Virginia Department of Aviation. “Aircraft Licensing.” <http://www.doav.virginia.gov/licensing_aircraft.htm> [accessed Decem-ber 12, 2011]
Virginia Department of Aviation. “Communication and Education Division.” <http://www.doav.virginia.gov/comm_ed_division.htm> [accessed December 15, 2011]
Virginia Department of Aviation. “Finance and Administration.” <http://www.doav.virginia.gov/finance_admin_division.htm> [December 12, 2011]
Virginia Department of Aviation. Virginia Airport System Economic Impact Study: Executive Summary. 2011. Summary prepared by ICF SH&E, et al. Available online at <http://tinyurl.com/7ajws6a> [accessed December 2, 2011]
Virginia Department of Aviation. Virginia Airport System Economic Impact Study: Technical Report. 2011. Report prepared by ICF SH&E, et al. Available online at <http://tinyurl.com/7usgrfl> [accessed December 2, 2011]
Virginia Department of Aviation. Virginia’s Aviation and Aerospace State of the Workforce: 2011. Prepared by Chmura Econom-ics and Analytics.
Virginia Department of Aviation. Virginia’s Flight to 2025: An Aviation Vision for the Commonwealth (PDF file). 2011. Available online at <http://www.doav.virginia.gov/Downloads/Studies/Vision%202025/Vision%202025.pdf>
Virginia Economic Development Partnership. 2011-12 Virginia Guide to Business Incentives (PDF file). Available at <http://www.yesvirginia.org/pdf/guides/BusinessIncentivesGuide2011.pdf> [accessed December 2011]
Competitive Analysis of Virginia’s Aviation Industry | 57
GLOSSARY OF ACRONYMSAAPA – Association of Asia Pacific AirlinesADS-B – Automatic Dependent Surveillance BroadcastAEA – Association of European AirlinesAIMD – Aircraft Intermediate Maintenance DetachmentASF – Aviation Special FundASM – Available Seat MilesATXA – Air Taxi/Air Charter AssociationAWOS – Automated Weather Observing SystemAVC – Mecklenburg-Brunswick AirportCCAM – Commonwealth Center for Advanced ManufacturingCCAPS – Commonwealth Center for Aerospace Propulsion SystemsCHO – Charlottesville-Albemarle Regional AirportCOMAC – Commercial Aircraft Corporation of ChinaCTB – Commonwealth Transportation BoardDCA – Ronald Reagan Washington National AirportDME – Distance Measuring EquipmentDOAV – Virginia Department of AviationEIP – Early Implementation ProjectFAA – Federal Aviation AdministrationF&E – Facilities and EquipmentFYJ – Middle Peninsula Regional AirportGA – General AviationGDS – Global Distribution SystemsGOF – Governor’s Opportunity FundHAI – Helicopter Association InternationalHEF – Manassas Regional AirportHWY – Warrenton-Fauquier AirportIAD – Washington-Dulles International AirportIAP – Instrument Approach ProcedureIFR – Instrument Flight RulesILS – Instrument Landing SystemsIMC – Instrument Meteorological ConditionsJYO – Leesburg Executive AirportLYH – Lynchburg Regional AirportLPV – Localizer Performance with Vertical GuidanceMHI – Mitsubishi Heavy IndustriesMTV – Blue Ridge Airport
NADIN – National Airspace Data Interchange NetworkNAS – National Air StationNAS – National Airspace SystemNASAO – National Association of State Aviation OfficialsNBAA – National Business Aviation AssociationNDB – Non-directional beaconsNPIAS – National Plan of Integrated Airport SystemsOPD – Optimized Profile DescentORF – Norfolk International AirportPBN – Performance Based NavigationPHF – Newport News-Williamsburg International AirportPIR – Precision Instrument Approach ProcedureRIC – Richmond International AirportROA – Roanoke Regional AirportRMN - Stafford Regional AirportRNAV – Area NavigationRPK – Revenue Passenger KilometersRPM – Revenue Passenger MilesSFRA – Special Flight Rules AreaSHD – Shenandoah Valley Regional AirportTTF – Transportation Trust FundUAC – United Aircraft CorporationUAS – Unmanned Aircraft SystemsVAB – Virginia Aviation BoardVABA – Virginia Aviation Business AssociationVAOC – Virginia Airport Operators CouncilVAOA – Virginia Airport Owners AssociationVATSP – Virginia Air Transportation System PlanVEDP – Virginia Economic Development PartnershipVHA – Virginia Helicopter AssociationVIP – Virginia Investment PartnershipVNDIA – Virginia National Defense Industrial AuthorityVSATS – Virginia SATSLab, Inc.W78 – William M. Tuck AirportWAAS – Wide Area Augmentation SystemWATF – Washington Airports Task Force
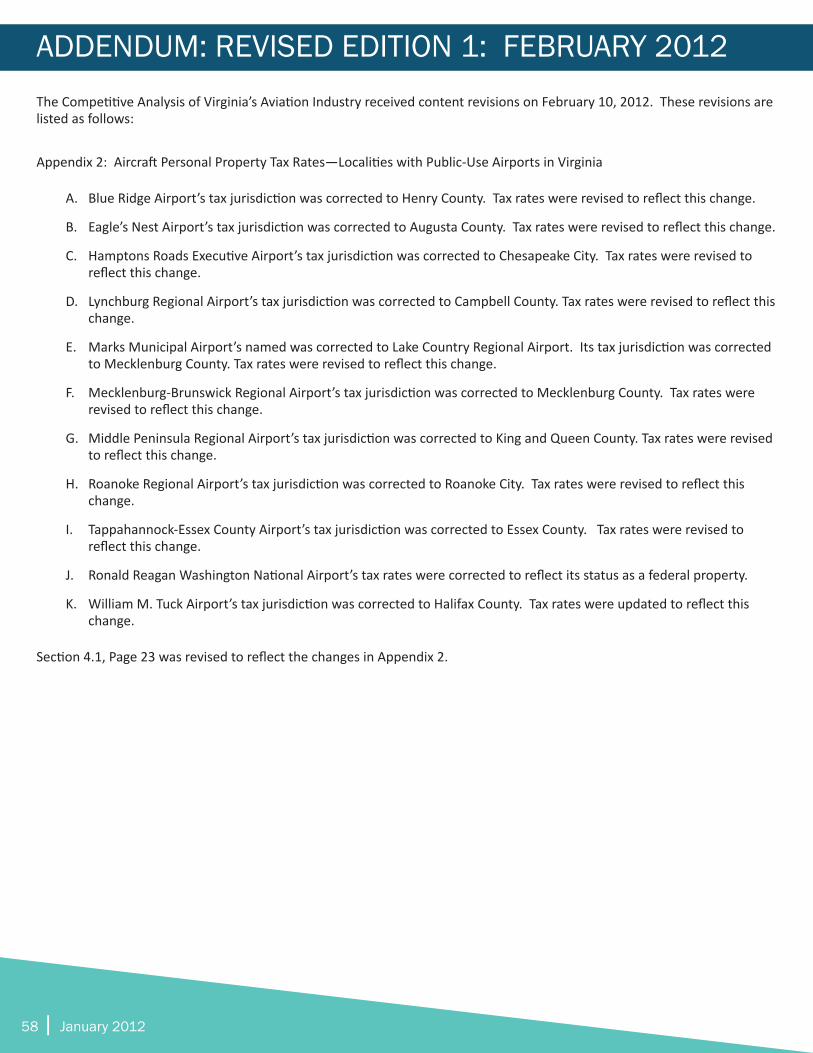
58 | January 2012
ADDENDUM: REVISED EDITION 1: FEBRUARY 2012The Competitive Analysis of Virginia’s Aviation Industry received content revisions on February 10, 2012. These revisions are listed as follows:
Appendix 2: Aircraft Personal Property Tax Rates—Localities with Public-Use Airports in Virginia
A. Blue Ridge Airport’s tax jurisdiction was corrected to Henry County. Tax rates were revised to reflect this change.
B. Eagle’s Nest Airport’s tax jurisdiction was corrected to Augusta County. Tax rates were revised to reflect this change.
C. Hamptons Roads Executive Airport’s tax jurisdiction was corrected to Chesapeake City. Tax rates were revised to reflect this change.
D. Lynchburg Regional Airport’s tax jurisdiction was corrected to Campbell County. Tax rates were revised to reflect this change.
E. Marks Municipal Airport’s named was corrected to Lake Country Regional Airport. Its tax jurisdiction was corrected to Mecklenburg County. Tax rates were revised to reflect this change.
F. Mecklenburg-Brunswick Regional Airport’s tax jurisdiction was corrected to Mecklenburg County. Tax rates were revised to reflect this change.
G. Middle Peninsula Regional Airport’s tax jurisdiction was corrected to King and Queen County. Tax rates were revised to reflect this change.
H. Roanoke Regional Airport’s tax jurisdiction was corrected to Roanoke City. Tax rates were revised to reflect this change.
I. Tappahannock-Essex County Airport’s tax jurisdiction was corrected to Essex County. Tax rates were revised to reflect this change.
J. Ronald Reagan Washington National Airport’s tax rates were corrected to reflect its status as a federal property.
K. William M. Tuck Airport’s tax jurisdiction was corrected to Halifax County. Tax rates were updated to reflect this change.
Section 4.1, Page 23 was revised to reflect the changes in Appendix 2.


Performance Management Group ● Virginia Commonwealth UniversityP.O. Box 843024 ● 1014 W. Franklin Street ● Richmond, VA 23284 ● 804.828.8845 ● www.pmg.vcu.edu