Embed Size (px)
Citation preview

Competitive Position of the Competitive Position of the
Tasmanian Dairy Industry Tasmanian Dairy Industry
-Farmers Key to Success--Farmers Key to Success-
David Beca – Red Sky Agricultural Pty LtdDavid Beca – Red Sky Agricultural Pty Ltd

AgendaAgenda
Background to dataBackground to data
How Tassie comparesHow Tassie compares
Profit drivers in pasture-based dairyingProfit drivers in pasture-based dairying
Opportunities for Tassie DairyOpportunities for Tassie Dairy
Finalists from TassieFinalists from Tassie
““Cleaning up” at the awardsCleaning up” at the awards
How do “the winners” do itHow do “the winners” do it

Database ContentDatabase Content Comparisons provided across Aus & NZComparisons provided across Aus & NZ
Strong data integrityStrong data integrity
Similar bias across all data groupsSimilar bias across all data groups
There have been no statistics completed on There have been no statistics completed on
individual data setsindividual data sets
Some of presentation based on queries of the Some of presentation based on queries of the
Australia-wide Red Sky databaseAustralia-wide Red Sky database
286 sets of data for 2005/06286 sets of data for 2005/06
Data across 5 statesData across 5 states
Wide range of farm systemsWide range of farm systems
Processed by Red Sky or rural professionalsProcessed by Red Sky or rural professionals

Return on AssetsReturn on Assets
Tas-Tas-maniamania
South South West West VICVIC
Gipps- Gipps- land land VICVIC
North North Irr’n Irr’n VICVIC
West West AusAus
South South AusAus
New New Zea-Zea-landland
2006 2006 AvgAvg 6.8%6.8% 6.8%6.8% 6.3%6.3% 6.2%6.2% 2.4%2.4% 3.4%3.4% 2.0%2.0%
2007 2007 AvgAvg 4.4%4.4% 2.1%2.1% 2.4%2.4% -1.0%-1.0% 2.0%2.0% -0.6%-0.6% 2.3%2.3%
2006 2006 T10%T10% 13.0%13.0% 12.4%12.4% 12.7%12.7% 11.7%11.7% 4.5%4.5% 7.8%7.8% 5.1%5.1%
2007 2007 T10%T10% 8.5%8.5% 6.9%6.9% 7.3%7.3% 4.6%4.6% 4.8%4.8% 5.3%5.3% 5.0%5.0%

Profit per HectareProfit per Hectare
Tas-Tas-maniamania
South South West West VICVIC
Gipps- Gipps- land land VICVIC
North North Irr’n Irr’n VICVIC
West West AusAus
South South AusAus
New New Zea-Zea-
land**land**
2006 2006 AvgAvg $ 1045$ 1045 $ 917$ 917 $ 1176$ 1176 $ 1169$ 1169 $ 382$ 382 $ 447$ 447 $ 621$ 621
2007 2007 AvgAvg $ 800$ 800 $ 301$ 301 $ 484$ 484 -$ 330-$ 330 $ 369$ 369 -$ 211-$ 211 $ 949$ 949
2006 2006 T10%T10% $ 2059$ 2059 $ 1771$ 1771 $ 2204$ 2204 $ 2377$ 2377 $ 718$ 718 $ 1484$ 1484 $ 1701$ 1701
2007 2007 T10%T10% $ 1594$ 1594 $ 1142$ 1142 $ 1489$ 1489 $ 965$ 965 $ 920$ 920 $ 996$ 996 $ 2171$ 2171
** AU$ based on AU$1.00 = NZ$1.12** AU$ based on AU$1.00 = NZ$1.12

Milk PriceMilk Price
Tas-Tas-maniamania
South South West West VICVIC
Gipps- Gipps- land land VICVIC
North North Irr’n Irr’n VICVIC
West West AusAus
South South AusAus
New New Zea-Zea-
land**land**
2006 2006 AvgAvg
35.13 35.13
$4.45$4.45
33.06 33.06
$4.42$4.42
33.42 33.42
$4.42$4.42
33.70 33.70
$4.40$4.40
26.87 26.87
$3.77$3.77
32.80 32.80
$4.65$4.65
31.08 31.08
$3.66$3.66
2007 2007 AvgAvg
35.09 35.09
$4.44$4.44
32.24 32.24
$4.27$4.27
32.30 32.30
$4.29$4.29
32.32 32.32
$4.23$4.23
31.49 31.49
$4.47$4.47
32.49 32.49
$4.55$4.55
33.88 33.88
$3.98$3.98
2006 2006 T10%T10%
36.59 36.59
$4.64$4.64
32.01 32.01
$4.44$4.44
33.33 33.33
$4.48$4.48
33.83 33.83
$4.47$4.47
28.13 28.13
$3.93$3.93
34.39 34.39
$4.62$4.62
31.04 31.04
$3.66$3.66
2007 2007 T10%T10%
36.64 36.64
$4.43$4.43
31.57 31.57
$4.29$4.29
32.20 32.20
$4.34$4.34
32.60 32.60
$4.29$4.29
33.15 33.15
$4.79$4.79
32.79 32.79
$4.64$4.64
33.69 33.69
$3.98$3.98
** AU$ based on AU$1.00 = NZ$1.12** AU$ based on AU$1.00 = NZ$1.12
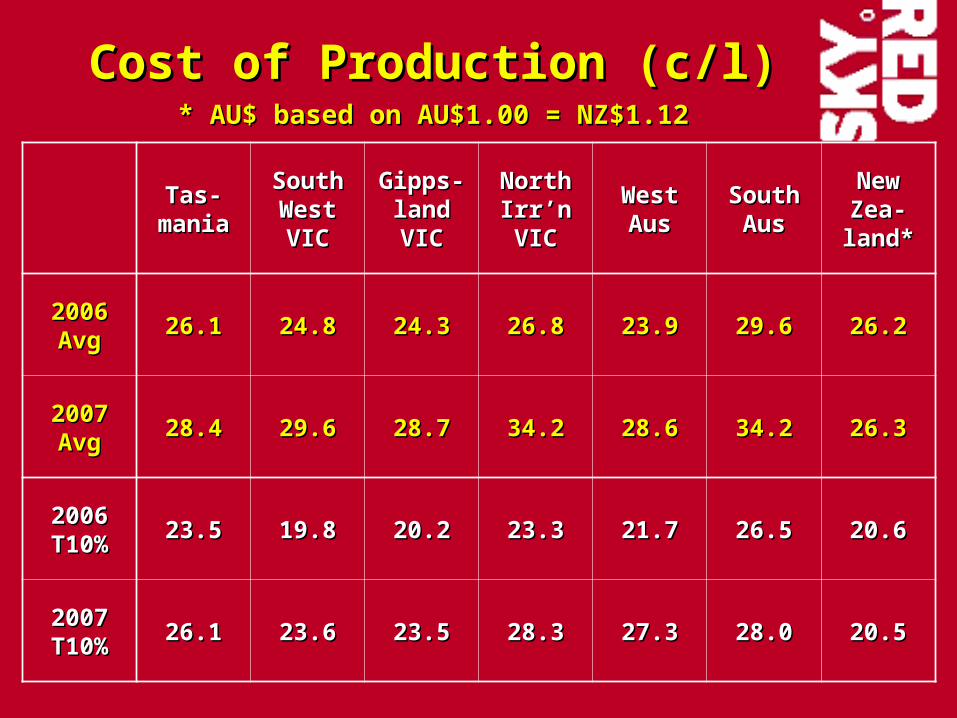
Cost of Production (c/l)Cost of Production (c/l)
Tas-Tas-maniamania
South South West West VICVIC
Gipps- Gipps- land land VICVIC
North North Irr’n Irr’n VICVIC
West West AusAus
South South AusAus
New New Zea-Zea-land*land*
2006 2006 AvgAvg 26.126.1 24.824.8 24.324.3 26.826.8 23.923.9 29.629.6 26.226.2
2007 2007 AvgAvg 28.428.4 29.629.6 28.728.7 34.234.2 28.628.6 34.234.2 26.326.3
2006 2006 T10%T10% 23.523.5 19.819.8 20.220.2 23.323.3 21.721.7 26.526.5 20.620.6
2007 2007 T10%T10% 26.126.1 23.623.6 23.523.5 28.328.3 27.327.3 28.028.0 20.520.5
* AU$ based on AU$1.00 = NZ$1.12* AU$ based on AU$1.00 = NZ$1.12

Cost of Production ($/kgMS)Cost of Production ($/kgMS)
Tas-Tas-maniamania
South South West West VICVIC
Gipps- Gipps- land land VICVIC
North North Irr’n Irr’n VICVIC
West West AusAus
South South AusAus
New New Zea-Zea-land*land*
2006 2006 AvgAvg $ 3.30$ 3.30 $ 3.31$ 3.31 $ 3.22$ 3.22 $ 3.51$ 3.51 $ 3.36$ 3.36 $ 4.20$ 4.20 $ 3.08$ 3.08
2007 2007 AvgAvg $ 3.60$ 3.60 $ 3.92$ 3.92 $ 3.81$ 3.81 $ 4.48$ 4.48 $ 4.06$ 4.06 $ 4.79$ 4.79 $ 3.10$ 3.10
2006 2006 T10%T10% $ 2.98$ 2.98 $ 2.74$ 2.74 $ 2.72$ 2.72 $ 3.08$ 3.08 $ 3.05$ 3.05 $ 3.56$ 3.56 $ 2.43$ 2.43
2007 2007 T10%T10% $ 3.16$ 3.16 $ 3.21$ 3.21 $ 3.17$ 3.17 $ 3.72$ 3.72 $ 3.94$ 3.94 $ 3.96$ 3.96 $ 2.52$ 2.52
* AU$ based on AU$1.00 = NZ$1.12* AU$ based on AU$1.00 = NZ$1.12

Pasture Harvest - DrylandPasture Harvest - Dryland
Tas-Tas-maniamania
South South West West VICVIC
Gipps- Gipps- land land VICVIC
North North Irr’n Irr’n VICVIC
West West AusAus
South South AusAus
New New Zea-Zea-landland
2006 2006 AvgAvg 9.19.1 6.46.4 7.47.4 2.52.5 5.15.1 4.54.5 11.511.5
2007 2007 AvgAvg 8.78.7 5.95.9 7.47.4 1.91.9 5.25.2 3.83.8 11.611.6
2006 2006 T10%T10% 11.111.1 7.87.8 9.39.3 3.13.1 5.35.3 5.55.5 13.913.9
2007 2007 T10%T10% 11.111.1 7.37.3 9.19.1 2.72.7 5.95.9 4.24.2 14.214.2

Pasture Harvest - IrrigatedPasture Harvest - Irrigated
Tas-Tas-maniamania
South South West West VICVIC
Gipps- Gipps- land land VICVIC
North North Irr’n Irr’n VICVIC
West West AusAus
South South AusAus
New New Zea-Zea-landland
2006 2006 AvgAvg 11.711.7 10.910.9 11.911.9 9.29.2 8.38.3 10.610.6 16.116.1
2007 2007 AvgAvg 12.512.5 10.110.1 9.99.9 7.47.4 9.79.7 7.47.4 16.316.3
2006 2006 T10%T10% 12.512.5 13.313.3 14.814.8 11.511.5 8.78.7 12.212.2 17.317.3
2007 2007 T10%T10% 15.815.8 12.412.4 12.312.3 10.610.6 11.011.0 10.910.9 17.717.7
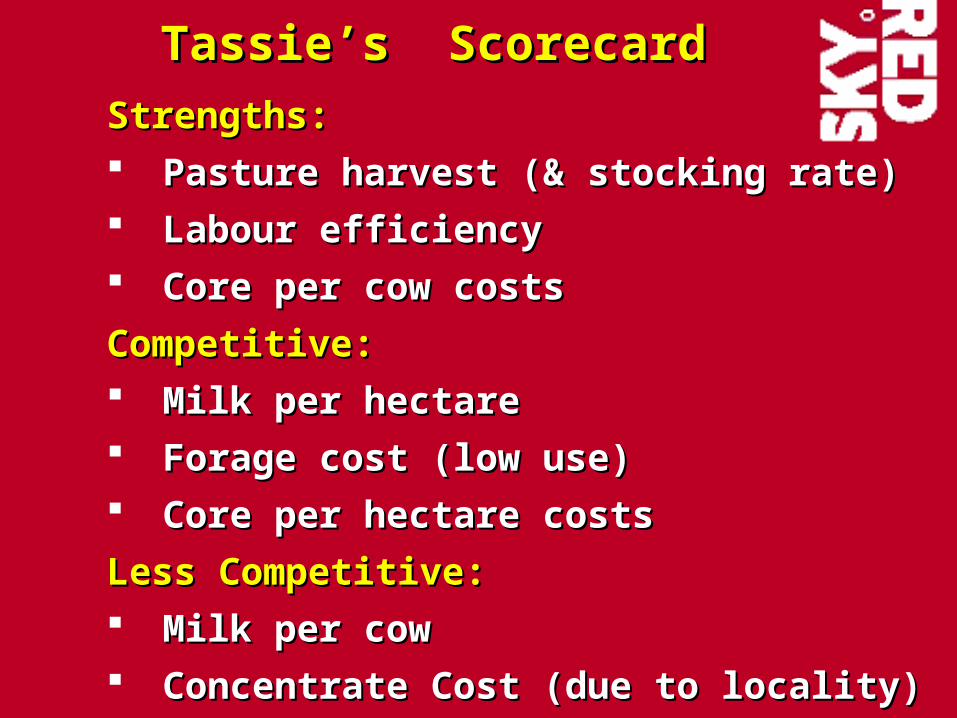
Tassie’s ScorecardTassie’s Scorecard
Strengths:Strengths: Pasture harvest (& stocking rate)Pasture harvest (& stocking rate) Labour efficiencyLabour efficiency Core per cow costsCore per cow costs
Competitive:Competitive: Milk per hectareMilk per hectare Forage cost (low use)Forage cost (low use) Core per hectare costsCore per hectare costs
Less Competitive:Less Competitive: Milk per cowMilk per cow Concentrate Cost (due to locality)Concentrate Cost (due to locality)

Hypothesis No.1Hypothesis No.1
Milk production per cow is a primary driver of Milk production per cow is a primary driver of
profitability in pasture-based dairyingprofitability in pasture-based dairying
Given cows need a set amount of energy for Given cows need a set amount of energy for
maintenance…if we can feed them better then maintenance…if we can feed them better then
more energy will go into milk production which more energy will go into milk production which
must be more efficientmust be more efficient
Tasmanians & New Zealanders have been Tasmanians & New Zealanders have been
chastised over their low level of milk chastised over their low level of milk
production per cow for many years…well…production per cow for many years…well…

ROA vs Litres per CowROA vs Litres per Cow
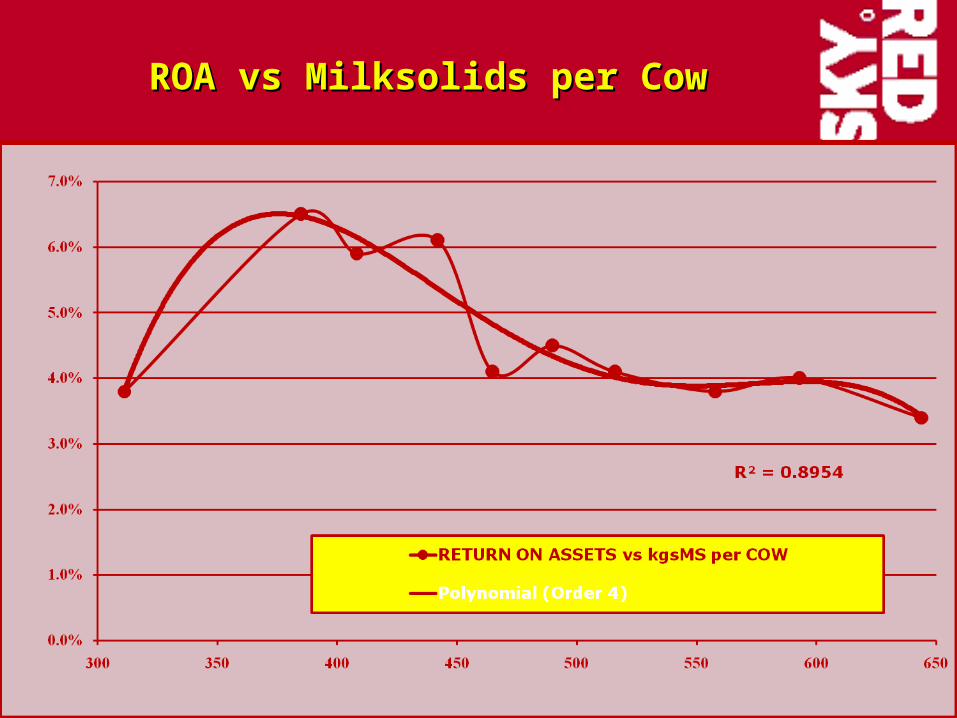
ROA vs Milksolids per CowROA vs Milksolids per Cow

COP per kgMS vs Litres per CowCOP per kgMS vs Litres per Cow

COP per Litre vs Litres per CowCOP per Litre vs Litres per Cow
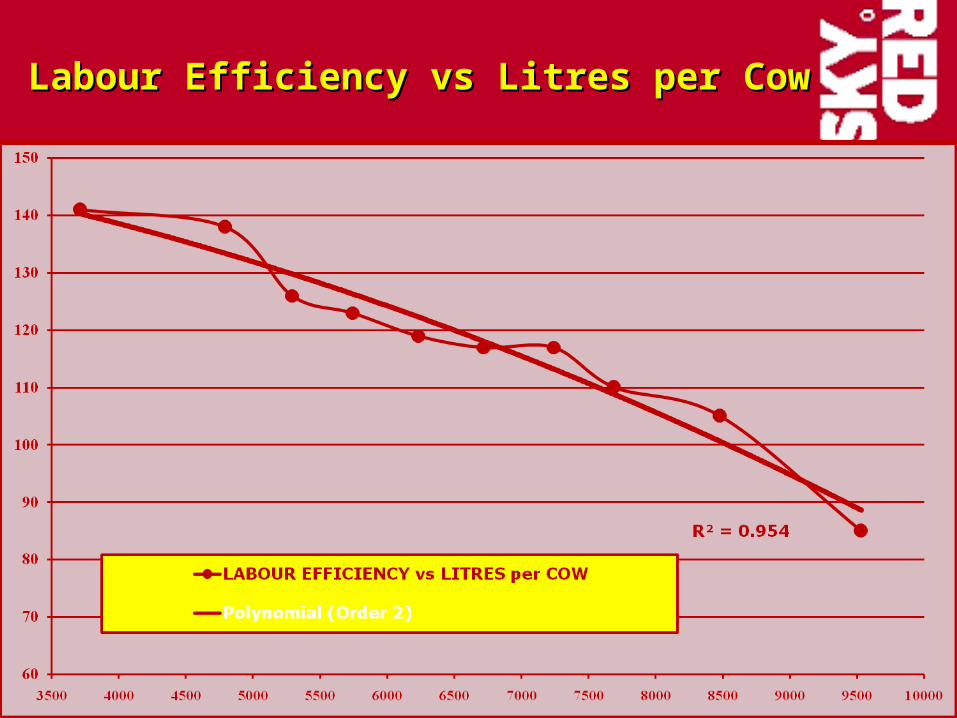
Labour Efficiency vs Litres per CowLabour Efficiency vs Litres per Cow

Core per Cow Cost vs Litres per CowCore per Cow Cost vs Litres per Cow

ConclusionConclusion
Given cows need a set amount of energy for Given cows need a set amount of energy for
maintenance…if we can feed them better then maintenance…if we can feed them better then
more energy will go into milk production which more energy will go into milk production which
must be more efficientmust be more efficient
There is not a positive correlation between milk There is not a positive correlation between milk
production per cow and profitproduction per cow and profit
So more milk per cow in itself will just as likely So more milk per cow in itself will just as likely
lose money as make moneylose money as make money
To make more money from more milk per cow, To make more money from more milk per cow,
the critical components to master are the critical components to master are pasture pasture
harvestharvest, , labour efficiencylabour efficiency and and core per cow costscore per cow costs

Hypothesis No.2Hypothesis No.2
With the high cost of land and/or water it will be With the high cost of land and/or water it will be
important to generate more revenue from important to generate more revenue from
this…so more supplementation and use of high this…so more supplementation and use of high
yielding cropsyielding crops
Would irrigation water be better utilised on Would irrigation water be better utilised on
much higher yielding crops than ryegrass?much higher yielding crops than ryegrass?
Substantial lifts in stocking rate along with Substantial lifts in stocking rate along with
higher yields per cow have the potential to higher yields per cow have the potential to
produce dramatically more milk per hectareproduce dramatically more milk per hectare
One impact is that pasture decreases as a One impact is that pasture decreases as a
percentage of dietpercentage of diet
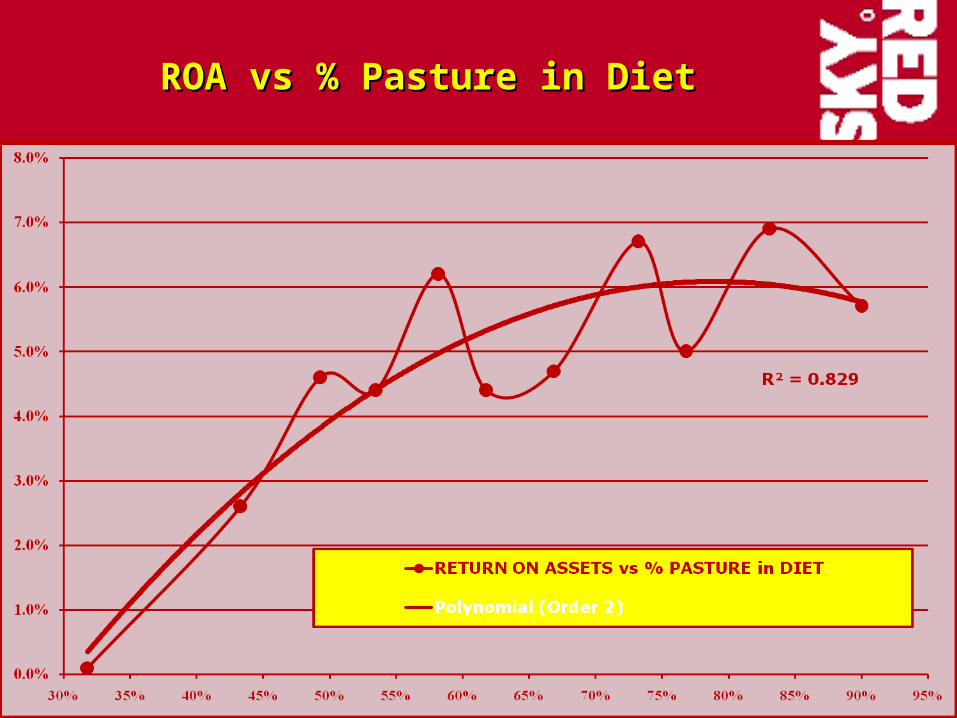
ROA vs % Pasture in DietROA vs % Pasture in Diet

COP per kgMS vs % Pasture in DietCOP per kgMS vs % Pasture in Diet

Pasture Harvest vs % Pasture in DietPasture Harvest vs % Pasture in Diet

Core per Cow Cost vs % Pasture in DietCore per Cow Cost vs % Pasture in Diet

ConclusionConclusion
With the high cost of land and/or water it will be With the high cost of land and/or water it will be
important to generate more revenue from important to generate more revenue from
this…so more supplementation and use of high this…so more supplementation and use of high
yielding cropsyielding crops
There is not a positive correlation between There is not a positive correlation between
increasing supplement use and profitincreasing supplement use and profit
So increasing supplement use in itself will just So increasing supplement use in itself will just
as likely lose money as make moneyas likely lose money as make money
To make more money from higher supplement To make more money from higher supplement
use, the critical components to master are use, the critical components to master are
pasture harvestpasture harvest and and core per cow costscore per cow costs

Hypothesis No.3Hypothesis No.3
Stocking rate is a primary driver of Stocking rate is a primary driver of
profitability in pasture-based dairyingprofitability in pasture-based dairying
Given milk per cow does not appear to be a Given milk per cow does not appear to be a
primary driver then stocking rate had better primary driver then stocking rate had better
be…or are we not in the business of producing be…or are we not in the business of producing
milk?milk?
And if stocking rate is a primary driver then is And if stocking rate is a primary driver then is
there a ‘right’ stocking rate or is it just that there a ‘right’ stocking rate or is it just that
‘higher is better’‘higher is better’
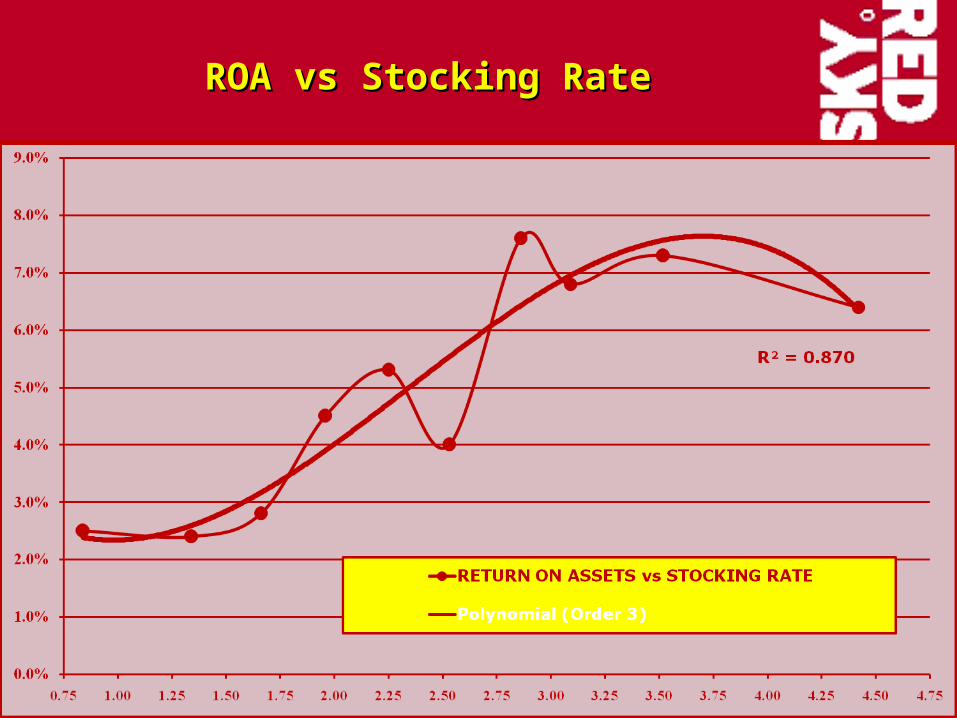
ROA vs Stocking RateROA vs Stocking Rate

COP per kgMS vs Stocking RateCOP per kgMS vs Stocking Rate

Pasture Harvest vs Stocking RatePasture Harvest vs Stocking Rate
ConclusionConclusion
Given milk per cow does not appear to be a Given milk per cow does not appear to be a
primary driver then stocking rate had better primary driver then stocking rate had better
be…or are we not in the business of producing be…or are we not in the business of producing
milk?milk?
Stocking rate does positively correlate with Stocking rate does positively correlate with
profitabilityprofitability
The link to pasture harvest appears criticalThe link to pasture harvest appears critical
Potentially a ‘sweet spot’ that optimises profit Potentially a ‘sweet spot’ that optimises profit
depending on productive capacity of landdepending on productive capacity of land

Hypothesis No.4Hypothesis No.4
Pasture is the primary driver of pasture-based Pasture is the primary driver of pasture-based
dairying profitabilitydairying profitability
Is more pasture simply better for business?Is more pasture simply better for business?
Where does it rate compared to alternative Where does it rate compared to alternative
feeds and farming systems?feeds and farming systems?

ROA vs Pasture HarvestROA vs Pasture Harvest

COP per kgMS vs Pasture HarvestCOP per kgMS vs Pasture Harvest

Labour Efficiency vs Pasture HarvestLabour Efficiency vs Pasture Harvest

SummarySummary Pasture IS Pasture IS the primary driver of profitabilitythe primary driver of profitability
IF increases in milk production per hectare IF increases in milk production per hectare
result in more profit then stocking rate is result in more profit then stocking rate is
likely to be the primary driverlikely to be the primary driver
To make more money from more milk and To make more money from more milk and
supplements, the critical components to supplements, the critical components to
master are master are pasture harvestpasture harvest, , labour efficiencylabour efficiency
and and core per cow costscore per cow costs
Maintaining a low cost of production is at the Maintaining a low cost of production is at the
heart of our international competitiveness – heart of our international competitiveness –
we lose this at our perilwe lose this at our peril
The Opportunity in TassieThe Opportunity in Tassie
To keep improving in the areas of strengthTo keep improving in the areas of strength
To further increase performance in the To further increase performance in the
areas of:areas of:
Pasture harvestPasture harvest
Stocking rate (more milk per ha)Stocking rate (more milk per ha)
Labour efficiencyLabour efficiency
Core per cow costsCore per cow costs
Lower cost of productionLower cost of production

And the winners were…And the winners were…
Sharefarmer;Sharefarmer; Wayne & Angela Huisman Wayne & Angela Huisman
Irrigated;Irrigated; Paul & Nadine Lambert Paul & Nadine Lambert
Low Concentrate;Low Concentrate; Paul & Nadine Lambert Paul & Nadine Lambert
Medium Concentrate;Medium Concentrate; Stephen & Karen Stephen & Karen
FisherFisher
Tasmania;Tasmania; Stephen & Karen Fisher Stephen & Karen Fisher
Supreme (dryland);Supreme (dryland); Stephen & Karen Fisher Stephen & Karen Fisher
Trans-Tasman;Trans-Tasman; Stephen & Karen Fisher Stephen & Karen Fisher

Tassie FinalistsTassie Finalists
ROCROC Profit Profit per Haper Ha
Cost of Cost of Prod’nProd’n
Milk Milk Prod’n -Prod’n -MS/haMS/ha
Pasture Pasture Harvest Harvest –DM/ha–DM/ha
Labour Labour Effic-Effic-iencyiency
Core Core per Cow per Cow
CostCost
FisherFisher 9.7%9.7% $2,011$2,011 $3.14$3.14 1,3521,352 12.612.6 168168 $430$430
LambertLambert 9.5%9.5% $2,719$2,719 $3.02$3.02 1,6821,682 15.415.4 125125 $361$361
Huisman Huisman & Camp-& Camp-
bellbell9.1%9.1% $1,853$1,853 $3.14$3.14 1,5051,505 13.313.3 156156 $409$409
Huisman Huisman (Sharef)(Sharef) 13.6%13.6% $710$710 $1.69$1.69 1,5051,505 13.313.3 156156 $232$232
RogersRogers 8.8%8.8% $1,630$1,630 $3.03$3.03 1,1261,126 12.612.6 135135 $308$308

So how do you do it…So how do you do it… Farming philosophy summarised in a few wordsFarming philosophy summarised in a few words
How do you judge successHow do you judge success
Thoughts on the following:Thoughts on the following:
Milk productionMilk production
Stocking rateStocking rate
Pasture productionPasture production
Feed purchasingFeed purchasing
Labour efficiencyLabour efficiency
Cost controlCost control
Where to from here…Where to from here…

Tasmania DairyTasmania Dairy
www.redskyagri.comwww.redskyagri.com