Embed Size (px)
Citation preview
The American Association of Petroleum Geologists Bulletin
V. 63, No. 12 (December 1979), P. 2128-2144, 2 Figs.
Compilation and Correlation of Major Thermal Maturation Indicators'
W O N H £ R 0 U X , A N D R £ C H A G M O N , and RUDOLF BERTRANO^
Abetrad It is important in hydrocartran exploration to interpret accurately the thermal maturation stage of sedimentary rocks. A compilation and correlation chart shows the relations of tfie most commonly used organic and mineral thermal Indicators with respect to the degree of maturation. The chart and \he discussion of the limitations of each technique are based on the results published by other workers and on the writers' ot>servatk>ns.
INTRODUCnON There is no infallible analytic technique to
quantify the degree of transformation of organic matter into hydrocarbons. This is particularly true for lower and middle Paleozoic materials. The absence of, and urgent need for, such an analytic tool for hydrocarbon exploration have led to a proliferation of both thermal maturation parameters and publications dealing with their correlation. Despite all of the research, correlations of equivalent numerical values for the various parameters are still uncertain (Hood et al, 1975, p. 988).
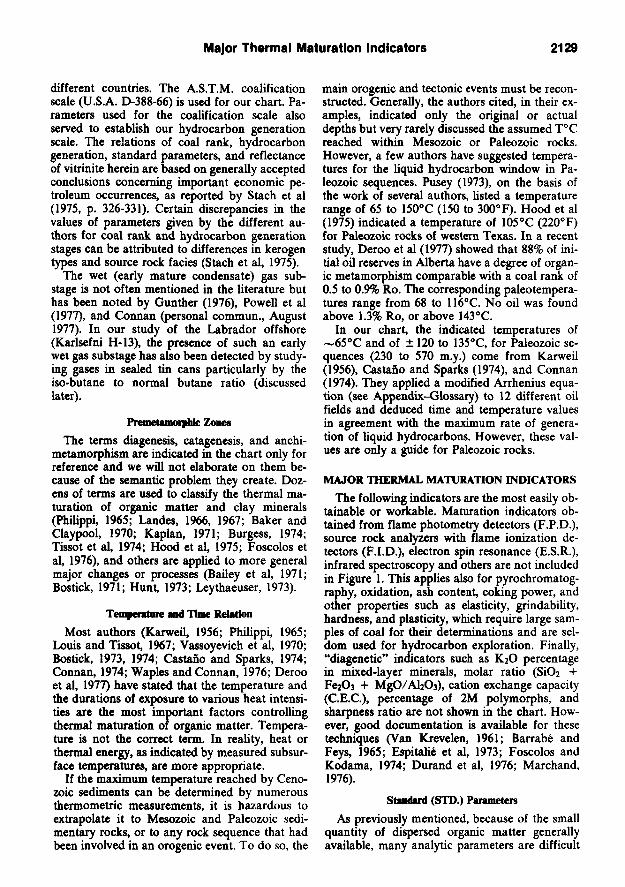
This work provides a short guide to the correlation and significance of some of the most important thermal maturity indicators, based on dispersed organic matter (D.O.M: see Appendix-Glossary) and on mineralogy. This guide should allow petroleum geologists to interpret hydrocarbon generation stages without a time-consuming bibliographic search. Some of the curves for hydrocarbon gas scales shown on Figure 1 are from our work. All other parameters shown on this chart have been discussed in the literature (Fig. 2).
Numerical values of orgamc geochemical parameters are dependent on time, thermal energy, and type of or^tnic matter (Mclver, 1967; Tissot et al, 1971; Van Dorsselaer and Albrecht, 1976; Weber and Maximov, 1976). The values indicated on the chart are, unless otherwise noted, relevant to sapropelic-type organic matter (kerogen type II of Van Krevelen, 1961).
The naphthabitumen parameter values are influenced by the effects of migration or the presence of alteration products such as impregnations and surface indexes (Connan, 1973; Van Dorsselaer et al, 197S). Thus, an idealized source rock system is represented on the chart.
The "birtii zone" and "dead zone" of gaseous and liquid hydrocarbons should be considered as gradationaL The iqtparent widths of these zones depend on the ansdytic techniques as well as on
the type of organic matter. For these reasons, lower and upper boundaries of these major vertical divisions must be considered as variable. To avoid ambiguity, selected references are given for each scale on the chart. The chart scale values and boundaries are a consensus of the most recent publications among these selected references (Fig. 2).
The evolution of clays and other index minerals is controlled mainly by the temperattire and by chemical and petrologic properties. The patterns shown on the chart apply to fine-grained (peUtic) detrital sequences.
To minimize semantic problems, a glossary of terms is presented in the Appendix. This glossary also serves as a legend for the chart.
MATURATION RANK
As defined by the International Committee for Coal Petrology, "rank" means degree of coalifica-tion. This term is herein extended to hydrocarbon generation and premetamorphic transformation stages. Thus, it applies to the thermal maturation attained by a given organic or mineral phase in the rock.
CoaMBcattmi and HyAocariton GeneratioD Stages
Alpem (1976a, p. 178) presented a correlation of coalification scales used by several authors in
©Copyright 1978. The American Association of Petroleum Geologists. All rights reserved.
AAPG grants permission for a single photocopy of this article for research purposes. Other photocopying not allowed by the 1978 Copyright Law is prohibited. For more than one photocopy of this article, users should send request, article identification number (see below), and $3.00 per copy to Copyright Clearance Center, Inc., One Park Ave., New York, NY 10006.
IManuscript received, November 10, 1977; accepted, December 27, 1978.
2Institut National de la Recherche Scienlifique ONRS-Pitrole), Universite du Quibec, Province de Quibec, Canada.
The work leading to this paper was financed by the National Research Council of Canada (grant A-42S1), by the Ministire de r Education du Quebec (FCAC individual grant EQ-1124) and by the Institui National de la Recherche Sdentifique. The writers thank B. Kubler who stimulated this project at INRS-Pitrole, 1. Connan who kindly read and criticized a first draft of this paper, and M. Desjardins for in-house translation of the manuscript (RD-149).
Article UentHlcatioa Number 0149-1423/79/B012-O0OI$03.O0/0
2128
Major Thermal Maturation Indicators 2129
different countries. The A.S.T.M. coalification scale (U.S.A. D-388-66) is used for our chart. Parameters used for the coalification scale also served to establish our hydrocarbon generation scale. The relations of coal rank, hydrocarbon generation, standard parameters, and reflectance of vitrinite herein are based on generally accepted conclusions concerning important economic petroleum occurrences, as reported by Stach et al (1975, p. 326-331). Certain discrepancies in the values of parameters given by the different authors for coal rank and hydrocarbon generation stages can be attributed to differences in kerogen types and source rock facies (Stach et al, 1975).
The wet (early mature condensate) gas sub-stage is not often mentioned in the literature but has been noted by Gunther (1976), Powell et al (1977), and Connan (personal commun., August 1977). In our study of the Labrador offshore (Karlsefni H-13), the presence of such an early wet gas substage has also been detected by studying gases in sealed tin cans particularly by the iso-butane to normal butane ratio (discussed later).
Premetamoiplik Zones The terms diagenesis, catagenesis, and anchi-
metamorphism are indicated in the chart only for reference and we will not elaborate on them because of the semantic problem they create. E>oz-ens of terms are used to classify the thermal maturation of organic matter and clay minerals (Philippi, 1965; Landes, 1966, 1967; Baker and Claypool, 1970; Kaplan, 1971; Burgess, 1974; Tissot et al, 1974; Hood et al, 1975; Foscolos et al, 1976), and others are appUed to more general major changes or processes (Bailey et al, 1971; Bostick, 1971; Hunt, 1973; Leythaeuser, 1973).
Temperatare and Time Relation Most authors (Karweil, 1956; Philippi, 1965
Louis and Tissot, 1967; Vassoyevich et al, 1970; Bostick, 1973, 1974; Castano and Sparks, 1974 Connan, 1974; Waples and Connan, 1976; Deroo et al, 1977) have stated that the temperature and the durations of exposure to various heat intensities are the most important factors controlling thermal maturation of organic matter. Temperature is not the correct term. In reality, heat or thermal energy, as indicated by measured subsurface temperatures, are more appropriate.
If the maximum temperature reached by Ceno-zoic sediments can be determined by numerous thermometric measurements, it is hazardous to extrapolate it to Mesozoic and Paleozoic sedimentary rocks, or to any rock sequence that had been involved in an orogenic event. To do so, the
main orogenic and tectonic events must be reconstructed. Generally, the authors cited, in their examples, indicated only the original or actual depths but very rarely discussed the assumed T°C reached within Mesozoic or Paleozoic rocks. However, a few authors have suggested temperatures for the liquid hydrocarbon window in Paleozoic sequences. Pusey (1973), on the basis of the work of several authors, listed a temperature range of 65 to 150°C (150 to 300°F). Hood et al (1975) indicated a temperature of 105°C (220"'F) for Paleozoic rocks of western Texas. In a recent study, Deroo et al (1977) showed that 88% of initial oil reserves in Alberta have a degree of organic metamorphism comparable with a coal raiik of 0.5 to 0.9% Ro. The corresponding paleotempera-tures range from 68 to 116°C. No oil was found above 1.3% Ro, or above 143°C.
In our chart, the indicated temperatures of ~65*'C and of ± 120 to BS'C, for Paleozoic sequences (230 to 570 m.y.) come from Karweil (1956), Castano and Sparks (1974), and Connan (1974). They applied a modified Arrhenius equation (see Appendix-Glossary) to 12 different oil fields and deduced time and temperature values in agreement with the maximum rate of generation of liquid hydrocarbons. However, these values are only a guide for Paleozoic rocks.
MAJOR THERMAL MATURATION INDICATORS The following indicators are the most easily ob
tainable or workable. Maturation indicators obtained from flame photometry detectors (F.P.D.), source rock analyzers with flame ionization detectors (F.I.D.), electron spin resonance (E.S.R.), infrared spectroscopy and others are not included in Figure 1. This appUes also for pyrochromatog-raphy, oxidation, ash content, coking power, and otiier properties such as elasticity, grindabihty, hardness, and plasticity, which require large samples of coal for their determinations and are seldom used for hydrocarbon exploration. Finally, "diagenetic" incUcators such as K2O percentage in mixed-layer minerals, molar ratio (Si02 + Fe203 + MgO/Al203), cation exchange capacity (C.E.C.), percentage of 2M polymorphs, and sharpness ratio are not shown in the chart. However, good documentation is available for these techniques (Van Krevelen, 1961; Barrabe and Feys, 1965; Espitali6 et al, 1973; Foscolos and Kodama, 1974; Durand et al, 1976; Marchand, 1976).
StawUnI (STD.) Parameters As previously mentioned, because of the small
quantity of dispersed organic matter generally available, many analytic parameters are difficult
2130 Yvon Heroux et al
COMPILATION AND CORRELATION CHART OF SOME MATURATION RANK
STD CLASSIFIC.
z o t -
< s <-> 1 -
E 3 < O
R E F .
< a.
< o
o z U (A ^ »- o — oc z o o ____
a
< X
SUB-
BITUMIN.
o
X
X
2 z ! ffl 5 l -5 < z?-" _
o
o
( s UJ
y-
o ^~' < D: X 1
z
"sTuiT-"" GRAPHITE
| z So a i -<<
< 1 S2 i_ 1 D K (A 1 V) (/)
T A B L E 2
UJ
a. 3 1 -
<
—
BIO, G A S
>-IT
< > o
< liJ
<
W UJ
N j j
l a o >.
UJ Q: a.
\'k»
M(b)
w UJ
u
< o t
1 I 1
1 = 6 5
1
O R G A N O C L A S T S | N A P H T H A
S T D . P A R A M E T E R S
V I T R I N I T E
DrvMh fr«t
2!; o z >
%
UJ
>
%
O T H E R S
z Ul
o: 10 UJ o
X
%
in\
K O _l < u
a.f.
2
- T O -
- S O
- s s
— 5 0
- 6 0
- 6 8
- 7 0
7 S
UJ
< 3 0
2 0
10
3500
eioo
; t . ' : : , : / . - • • • • : ' ; ; , . : • ' ; ? ; ; ' ••,:•
• ' • • • • " ' • • > , ^ • • ' '
'!'• •'• ' '. ' ' 'i*/ I I I - ' :'':''
1 ^ ''r!" •'•
OPT. P A R A M E T E R S
R E F L E C T E D
L I G H T
UJ b z (£ h-> %
£ a:
•5 0
Xi, 6> .15
. 2
. 3
~
. 4
7
. 5
1 §8 n «> 1 1
T R A N .
L IGHT
Q: _J 0 J
0
u
4(oto(d)
VaH (c) (d) » 0 _j _i UJ
X (A UJ
Ik
2.0
SI
2,5
ORGANIC GEOCHEMISTRY PARAMETERS (OIL
KEROGEN (INSOLUBLE O.M.)
y 0
is " 5 2 " 10 00 0 cj d -1 1 1^
5
K E R O G E N
T Y P E
n
m
1 / 1
- S o
T . 6 . A % ID in W N
I I I e
'</A V/ -vv / / / Z / ^ 1 V v
II^K^I^ "SHS
B I T U M E N
( S O L U B L E O . M . )
C A R B O N R A T I O
F . C . / T . O . C .
A S P . * - K E R O G E N
CM 10 h-
o d d
1 1 1 7 ( a ) . ( b )
KEROGEN TYPE
a t
t—n
x \
\ \ \ \
/ / / / /
»\VJ
\ 1,
4 0 (J
X u
1 'n 1 I • 1 i i _
'< t ' u ^
' '' l-'ik 1 MSH—k'.'> V ' I ^ H ^ H H I r ' I H H
0 6
d % in nj
I I1
iv"
« * nil
U
+
< %
<M r
I I I 7 ( a ) . ( c )
lO.Eiy
H
UJ CL >-J
5/-
' zs i^
'11'II ' ' ••'1« 1" ^1' ••' l »
\ iiMwMKJfc' *••< j M W ^ M l i . f • Ji p H M l ^ ^ K '
1 flHHI"Sil^Hi'' W H H i ii^^^^^^^mm'^^mm-mmMBMmmwmam^^:, v I^^H^^B^^BI^B3^^^BF ffll^^BiT'cV.'lB^BHa^EE «>T J ilj««KHIir^^^B'' i> I^H^H^HuB^^^HiHi^BiS- l t l^HHK' . .V '^ zF!i»ffi'^•B,< r BWlil iyMli i i lMl 1—11 • i M T O i II iT l i fMU 'S i - J If-' 1 Aw \ 'SB r
CL'
d
d —w
111 8(<])<'(bl
1
1
Hb)
j7
" '^f*"
' ' 1 • . 1
•
• v
1
1
.
i , T
. ! • • «
| i r nn
J in 1 1 II It 1 1 n I I 1 !| 1 1 I'S 1 l U S P l . - . l 1 L - l - ' . l l l 3L0| 1 1 1 1 1 •>! 1 1 1 1
FOR ABBREVIATIONS, SEE THE G L O S S A R Y IN A P P E N D I X
FIG. 1—Compilation and correlation chart of major thermal maturation indicators. For abbreviations, see Appendix-Glossary.

Major Thermal Maturation Indicators 2131
2132 Yvon Heroux et al
:D m
i 1 ^ 00
= °.? - _ 10
•
•
•
-i
a>
m
m
•
•
> 3
IS
1?
1
O
-< m < o X
I S
IP
(0 - J
Ol
•
• • •
•
• a
•
•
a
•
> z
m
< r m z
^
Ol
•
• a
• •
• a
•
• •
£1 M m r-
•
•
•
• •
-Ul
3 IP
i > L
to
^
•
•
•
• •
•
•
^ VI
\:
1?
i
0>
•
•
•
• •
•
• •
H m
n X z c r
OJ
Ol
•
•
• • • • • • • •
•
H
B
•
•
- 1
l
1
•
• •
(/> H
O I
IS
1
(0
Ol
N
•
• • • • • • • •
•
•
•
z
1
1
•
•
•
• •
z o C o o z
z O
o {/) (A > Z
(5 -J
U7
•
•
(A
> <
1
1
1
•
31 O 00 m 3) H
(0
(»
•
X
-< z x> c o
9
o
m X H
0>
•
•
•
•
• •
T> T
-L
5
1
• • •
•
•
a
a
•
T) m
10
< 9 X o
m 3)
K
•
• D
T) PI 3) 31
-<
I o « m 31
O
•
•
o H
> Z z
15 l o
^
?
•
•
•
n
n
> 3) H Z
-< 0
m
o I
c
m 3)
Ol
•
•
r
o r
ID
• • •
•
• • a
a
• • • •
r-m
3) > Z
IS
1?
Ol
o
•
•
•
•
•
•
Tf. C
r m 73
<5
Ul
oi
a
a
a
a
a
• • • •
35 r
r m 31
(0
Ol
•
35
r CD
n i X
10
QD
a
•
X t>
m
r
2
^
•
•
• •
• •
X t> X
N
< IS
1
to
o"
• • •
a
a
•
^ > r
z
Q
• • •
•
a
•
•
•
«-" •*
IS
1?
1
S
•
•
•
55
z x < I >
z
C O
> r
N
•
a
I c z - 1
o
• •
•
•
X
o o •
IS
1?
i 2
•
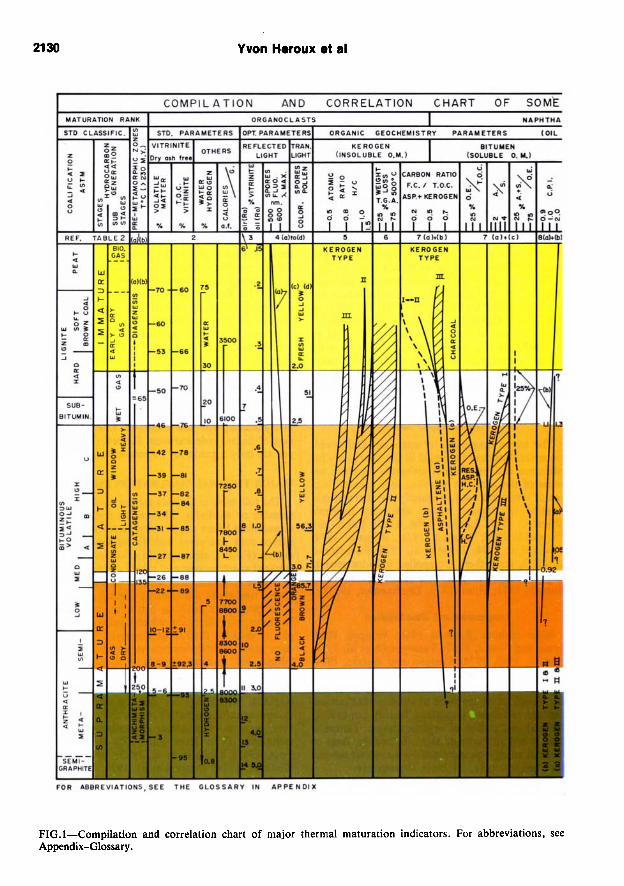
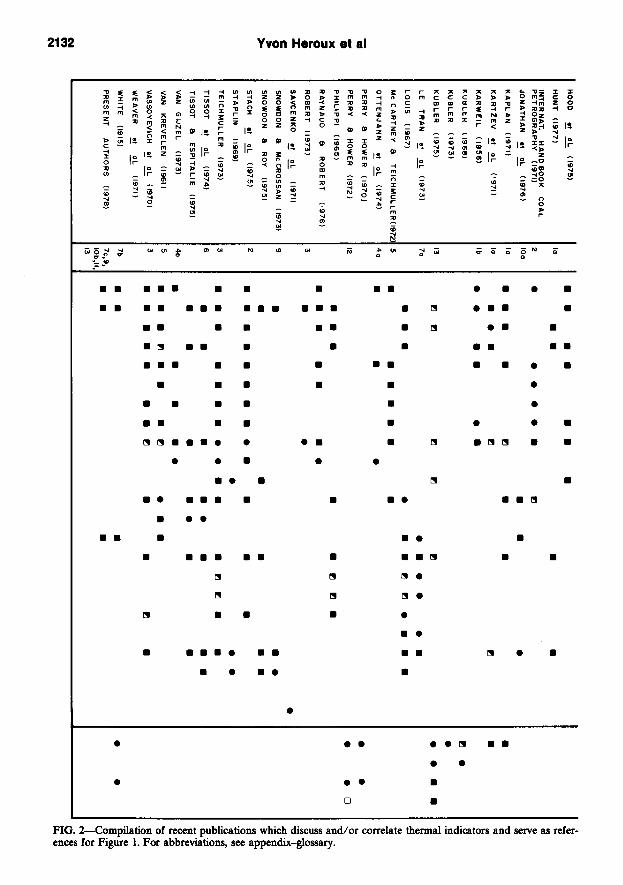
FIG. 2—Compilation of recent publications which discuss and/or correlate thermal indicators and serve as references for Figure 1. For abbreviations, see appendix-glossary.
Major Thermal Maturation Indicators 2133
I > o o c m CD > X
g>
o o z J> r
o z
3
CI c H c_ 1 * I X
W
01
a
•
•
•
•
•
•
•
• •
O c z H T m 31
(D - J
•
•
•
a
•Tl o UI o o I -o w
(0
(P
o
•
•
•
• •
•
D
•
•
•
•
•
-n o VI D o r o
9>
(0 N U
N
•
•
•
s W o o r-o (A
g>
o o
z
> IE - J
N
•
•
•
• n m c o n * X
r»i
OP
o X > X
o
D
o c z o -< m X
m
(/) fTl o o z N >
S
a
a
a
•
•
D
D
o o X X m >
0) -J
•u
•
•
•
o o z z I> z
o
•
a
•
•
•
•
•
o > t/}
z . o
g>
</) TJ > X
c
•
•
•
1 -i
1
M
•
•
a
m X > -< 9
m
< z w
at
m
•
> X X
> m
g>
- n m -< (/)
0)
•
•
•
00 > X
X
ui -J M
•
•
> m X
V o r > < X o o
3 o
•
•
> > r r-X "0 m m X X z z
i -(0
• •
• •
• •
• •
•
• •
a •
•
a
> r -u m X z
(0 1>J
•
•
•
•
•
•
a
> r -D m X z
to ro
•
• •
•
• •
•
> > z
9
o o c CI
>
-J
a
•
•
•
•
H > / I y / O / ^
ui > /
^ / T H E R M A L
y^ M A T U R A T I O N
y^ IN D 1 CA T O R S
/ / a ZONATION
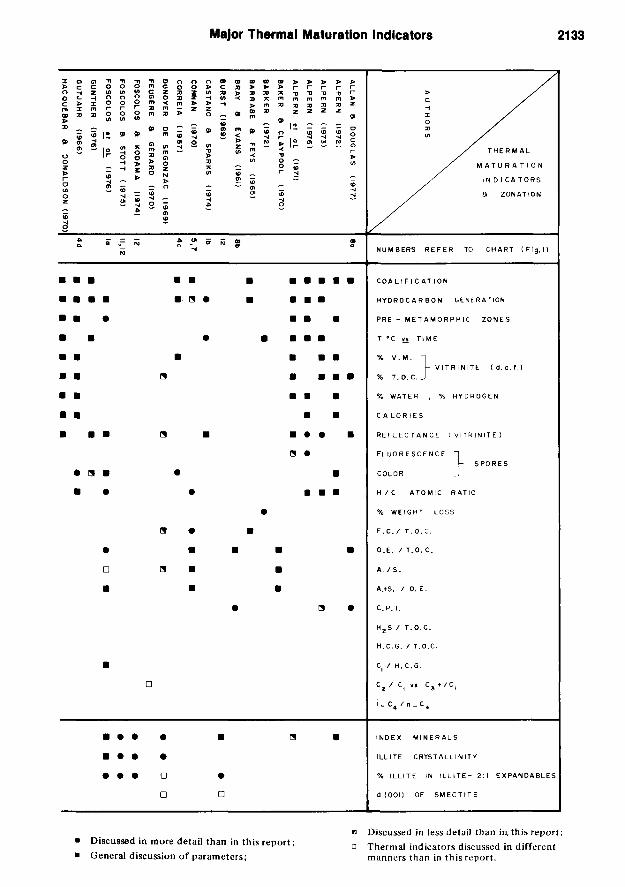
NUMBERS R E F E R TO CHART ( F i g . l )
C O A L I F I C A T I O N
H Y D R O C A R B O N GENERATION
PRE - M E T A M O R P H I C ZONES
T °C vs T I M E
% V . M . ^
% T . O . C . _ - V I T R I N I T E ( d. a. f. )
% WATER , % H y D R O G E N
C A L O R I E S
R E F L E C T A N C E I V I T R I N I T E )
F L U O R E S C E N C E "
COLOR
- SPORES
H / C A T O M I C RATIO
% WEIGHT LOSS
F . C . / T . O . C .
O.E , / T . O . C .
A. / S .
A.*S. / 0 . E.
C.P. 1.
H j S / T . O . C .
H .C.G. / T .O .C .
C| / H . C . G .
C^ / C| v» C j t / C ,
i . C , / n _ C ,
INDEX M I N E R A L S
ILL ITE CRYSTALL IN ITY
% I L L I T E IN I L L I T E - 2:1 E X P A N D A B L E S
d (001) OF S M E C T I T E
Discussed in more detail than in this report; General discussion of parameters;
Discussed in less detail than in.this report; Thermal indicators discussed in different manners than in this report.
2134 Yvon Heroux et al
to measure, as for the analytic parameters grouped in the chart under the headline "Std. Parameters." They are standard parameters for determining coal rank, together with reflectance and the ultimate or elemental analysis (atomic ratio H/C) of vitrinite (International Committee for Coal Petrology, 1963). Patteisky and Teichmuller (1958) discussed the Umitations of analytic techniques and the range of application of the standard parameters. The numerical values shown in the chart are from the International Committee for Coal Petrology (1963, Figs. 3-5), and from Stach et al (1975, p. 34).
Vitrinite reflectance and elemental analysis currently being used in petroleum exploration usually serve as the basic scales for establishing equivalence between coal ranks and hydrocarbon generation stages. Although they could be grouped under the "Std. Parameters" headline in the chart, they are, like other indicators, arbitrarily categorized to outline the type of organic materials (soluble or not) or the analytic methods used (physical: optical, combustion, etc; chemical: chromatography, extract, etc).
Optical (OPT.) Panuneten From these parameters, three scales are estab
lished: vitrinite reflectance in oil immersion (Ro), sporinite microspectrofluorescence (Fluo.) and spores and pollen coloration (color) scales. The vitrinite reflectance in air (Ra) sc^le is shown on the chart for comparison with results obtained before 1970 and is correlated with that of Ro according to Vassoyevich et al (1970). It will not be discussed further.
Ro percentage—Most scientists, working to es-tabUsh a hydrocarbon maturation scale, use this parameter as a correlation base. The Ro scale in our chart is logarithmic to emphasize the most interesting range (0.35 to 2.50%). The values for that scale are from Kotter's curves (1960, in International Conmiittee for Coal Petrology, 1971) and from data reported in Stach et al (1975, p. 326-331).
This technique has the following limitations: (a) lack of references on macerals other than vitrinite; (b) absence of vitrinite in pre-Carbonifer-ous series; (c) low reliability of the vitrinite reflectance technique for values less than 0.3% Ro; (d) identification of vitrinite from other macerals having intermediate characteristics (morphology and reflectance) between vitrinite and inertinite; (e) reworked organic matter that affects reflectance (% Ro) histograms; (f) influence of litholo-gy on reflectance values (at the same maturation stage, reflectance of vitrinite increases from sandstone to siltstone to shale to coal); (g) the reflectance (% Ro) increases with the thickness of coal
beds; (h) oxidation reduces vitrinite reflectance, but has a smaller effect than the preceding factors.
Limitations d to h were discussed by Kubler et al (1979).
Some authors (Robert, 1973; Sikander and Pit-tion, 1976, 1978) tried to establish a Ro scale on asphaltic pyrobitumen. They assumed that the evolution of the reflectance values from pyrobitumen and from vitrinite was the same with increasing temperature and time, although the values from pyrobitumen show a greater scatter than those from vitrinite of equal rank. We consider these results as preliminary because they do not show the influence of each asphaltic pyrobitumen type (elaterite, wurtzilite, albertite, impsomite, and anthraxolite) or "asphaltic pyrobitumen-like" fragments (acritarchs, chitinozoans, etc) on the parameter Ro behavior (research in progress at INRS).
In low-maturity sequences, where vitrinite reflectance values are less than 0.3% Ro, fluorescence and coloration measurements are better indicators of thermal alteration.
Fluorescence (Fluo.)—The fluorescence curves shown on the chart are from Van Gijzel (1973) and Ottenjann et al (1974). The sj>ectral maximum numerical values are in nanometer units of wave length (1 nm = 1 m/x = 10 A).
Fluorescence and reflectance are complementary: fluorescence intensity and reflectance are inversely proportional (Jacob, 1963, in International Committee for Coal Petrology, 1975, p. 1). The fluorescence intensity is one of the most useful parameters when vitrinite reflectance values are low (less than 0.3% Ro) and less reUable. However, it cannot be used in the supramature zone (below 25% volatile matter), for sporinite is not fluorescent at this maturation stage.
The fluorescence intensity depends on both the type of organic matter and palynomorph species. The discrepancy between curves a and b shown on the chart is probably the result of measurements done on different species of angiosperm pollen grains and microspores. Another but less significant source of variation may be the use of different methods in calculating A max. For these reasons spectrofluorometry values must be carefully standardized to obtain valuable diagnosis.
Finally, quoting from the International Committee for Coal Petrology (1975, p. 2): "The fluorescence of organic materials in particular can change as a result of the illumination; this effect is called 'fading effect' . . . or 'alteration' . . . Changes of both the spectrum and the intensity are observed. The possibility of such changes should be kept in mind in all studies of fluorescence." For this reason, the determination of all
Major Thermal Maturation Indicators 2135
characteristics of the entire spectrum is recommended (Van Gijzel, 1973).
Color—The coloration of spores and pollens has been described in several pubUcations and several types of scales have been proposed, as pointed out by Hood et al (1975, p. 988): (1) the "yellow through brown to black color scale" of Gutjahr (1966); (2) the "thermal alteration index" of Staplin (1969), based on microscopic observations of both color and structural alteration of organic debris; (3) the "state of preservation" of palynomorphs reported by Correia (1967).
The divisions shown on the chart for that parameter are from Gutjahr (1966) and Correia (1967). The numerical values from Correia (1967), scale C on the chart, are ordinal divisions of a qualitative evaluation of the light adsorption. Those from Gutjahr (1966) are given in 10-' pA on psilate trilete spores.
Organic Geochemistry Parameters of Kerogen
H/C, T.G.A., F.C./T.O.C—The atomic ratio (H/C), elemental analysis, the percent weight loss or thermogravimetric analysis (T.G.A. at 5(X)°C), and the carbon ratio (Cr/Ct = F.C./T.O.C.) on kerogen are global techniques as are proximate analysis, electron spin resonance (ESR), and infrared spectroscopy. For a better understanding of the behavior of the H/C ratio by combustion and F.C./T.O.C. by pyrolysis with increasing temperature, the carbon in the H/C parameter, which is equal to T.O.C. on kerogen, must be considered as the summation of F.C. plus volatile carbon. Thus, these parameters indicate the quantity of volatile matter (cf. fixed carbon) remaining in the organic material. This loss in volatile components from organic matter is confirmed by the decrease in the H/C ratio, the percent weight loss (T.G.A.), and the increase in carbon ratio (F. C/T.O.C).
However, the mentioned parameters depend also on the type of dispersed organic matter. Indeed, organic matter derived from invertebrates, plankton, spores, pollen, and microscopic algae originally contains fewer aromatic components than lignin from continental plant material (Jonathan et al, 1976; Tissot, 1976; Van Dorsselaer and Albrecht, 1976; Welte, 1976). Moreover, sporin-ites show greater overall yields of total alkanes and straight chain alkanes than do the corresponding vitrinites at all ranks (Allan and Douglas, 1977). Hence, kerogen types I and II will give Cr/Ct ratios lower than 0.4 to 0.5 for freshly sedi-mented organic matter, indicating low aromatici-ty (high T.G.A. and H/C values). For freshly sed-imented kerogen type III, the Cr/Ct ratios are in the range of 0.6 to 0.7 with low T.G.A. and H/C
values. Usually, varied proportions of all these types of dispersed organic matter are found.
For these reasons a single scale cannot be established for these parameters. Thus, in the chart, we have indicated for each scale the kerogen type for which the curve is vaUd. Moreover, considering that this chart is mainly for petroleum geologists, the 0/C atomic ratio has been omitted because it undergoes minor changes with increasing temperature for kerogen types I and II in the mature zone.
The foregoing parameters cannot be used alone because they are dependent upon temperature and type of organic matter. When enough organic extract is available, the Cr/Ct ratio can give indications of both the predominant type of dispersed organic matter and its maturation. Therefore, this ratio must be measured on both the asphaltene and kerogen fractions in the same sample (Con-nan, 1972, in Jonathan et al, 1976, p. 98, Fig. 5). Finally, according to Hunt (1978, p. 302): "By plotting the H/C ratio, which indicates differences in maturation, versus the (N-l-S)/0 ratio, which shows differences in organic starting material, it is possible to distinguish most bitumens from coals."
Organic Geochemistry Parameters of Bitumen
Each of the following parameters was discussed in great detail by Le Tran et al (1973).
O.E./T.O.C.—This ratio, expressed in percent of the organic extract (O.E.) over the total organic carbon (T.O.C), allows the evaluation of a rock "yield." This "yield" is very weak for immature organic matter. It starts increasing at the intense thermal cracking level (birth zone of oil) and then decreases when the organic matter gasification stage is reached (condensate gas or ~ 1.0% Ro) with a maximum yield between 0.8 to 1.0% Ro.
This ratio is also a function of the quantity and type of organic detritus and the alteration or migration effects of the accumulated extracts. Consequently, for type II kerogen, the numerical values shown in the chart are only an indication of a good source rock. Thus, for a mixture of type II (sporinite) and type III (vitrinite) organic matter, the maximum yield of n-alkanes might be at 1% Ro (Allan and Douglas, 1977). So, for the diagnosis of the "oil window" the general trend of the curves is more significant than the numerical values.
A./S. and A.+ S./O.E.—The extract composition is generally expressed in percent of hydrocarbons (H.C.), resins (res.) and asphaltene (asp.). The hydrocarbons are subdivided into aromatic (A.) and saturated (S.) components. From these

2136 Yvon Heroux et al
percentages, the ratio A./S. and the hydrocarbons "yield" A. + S./O.E. are calculated.
In general, for a sedimentary sequence where the organic matter is homogeneous, the A./S. ratio tends to decrease wi£ increasing thermal cracking. However, in certain cases, the decrease is hardly detectable because an inverse behavior may occur, as in biologic alterations of liquid hydrocarbons associated with incoming meteoric waters (Connan et al, 1975). Unfortimately, homogeneous organic detritus in sediment^ sequences is not common. So, the nature of extracts is also dependent on the type organic detritus, the environment of deposition, the level of microbial activity (Connan et al, 1975), and the subsequent geologic history (Allan and Douglas, 1977).
Conversely, the A. + S./O.E. and especially the S./O.E. ratio tend to increase with thermal maturation, particularly at thermal maturation stages compatible with the presence of liquid hydrocarbons.
These two parameters, being only a more detailed expression of the O.E./T.O.C. ratio, have the same limitations. However, the loss of hydrocarbons during migration does not affect the A./S. and A.-I-S./O.E. ratios of remaining "in situ" hydrocarbons, although the migrated product shows some variations in these ratios. With some exceptions, the numerical values for these two parameters are more significant than those of the O.E./T.O.C. ratio in evaluating the maturation degree reached by the sequence. Thus, for a sequence where the organic fraction is sapropelic, a hydrocarbon yield (A.-I-S./O.E.) greater than 25% strongly suggests that the "oil window" has been reached.
C.P.I.—The carbon preference index (C.P.I.) is one of the parameters relevant to gas chromatographic (GC) analysis of total alkanes, and gives iht nature of the n-alkanes extracted from a given rock sample. The n-alkanes distribution has been found to change with thermal maturation of a sedimentary basin and hence has long been used as a clue to crude oil source beds (Bray and Evans, 1961, in Allan and Douglas, 1977).
According to Bray and Evans (1961), C.P.I, values (scale b on the chart) range from 2.5 to 5.3 for recent muds, from 0.98 to 2.3 for sedimentary rocks, and from 0.92 to 1.13 for crude oil. Thus, values greater than 1.13 indicate immature sequences, from 0.92 to 1.13 mature zones, and less than 0.92 supramature zones. However, scale a from Allan and Douglas (1977, Fig. 4) shows the mature zone between 1 and 1.35. This last scale was derived from C.P.I, determinations on vitrin-ite and sporinite (kerogen types II and III) for subbituminous to high-volatile bituminous b coal stages (0.4 < Ro% < 1.20).
The C.P.I, scale from Bray and Evans (b on the chart) seems to cover a wider range of coalifica-tion stages and results of measurements on sapro-peUc (kerogen type I or II or a mixture of both types) organic matter and also on organic matter from recent sediments including freshwater and saline-lake sediments and soils.
Scales a and b on the chart show decreasing C.P.I, with increasing thermal maturation. However, there are discrepancies between them. The different C.P.I, values at same coalification stages between scales a and b on the chart might be explained by variability both in the source of organic matter and in lithologies, as reported by Allan and Douglas (1977). Differences in slopes of curves are explained by Allan and Douglas (1977, p. 1228) by the following process: "fragmentation of the already soluble longer chain compounds to shorter chain constituents occurred at a greater rate than the rate of release of new longer chain structures from the parent material."
Organic Geochemistry Parameters of Gas
Mechanically extractable (adsorbed) gases and chemically extractable (sorbed: occluded) gases are discussed herein. Experimental methods are described for the former in Snowdon and Mc-Crossan (1973, p. 3, 4) and for the latter in Le Tran (1971, p. 324).
H2S/T.O.C.—^The hydrogen sulfide parameter shown on the chart is restricted to sorbed and adsorbed occurrences of H2S in sediments or sedimentary rocks; free or dissolved H2S is excluded.
The yield of H2S from organic matter increases with thermal maturation, l^ere are other sources of H2S, for example, bacterial reduction of sulfates and catalytic reaction of sulfate with hydrocarbons (Orr, 1974). However, for H2S trapped in ancient rocks, when the trapping is not due to bacterial activities, Le Tran (1971) proposed two reasons: (1) the nature of the organic matter (e.g., algae, annelids, coelenterates, and moUusks constitute an original organic matter rich in sulfur; thus, there is a relation between the sediment fades and the sulfur content because the components are more concentrated in confined pelitic and micritic environments, such as swamps or lagoons); (2) the maturation degree of organic matter.
/f.C.G./r.O.C—The total content of mechanically and/or chemically extractable gases permits the calculation of the "yield" in gaseous hydrocarbons (H.C.G). This "yield" (H.C.G./T.O.C.) varies with the degree of thermal maturation and is a way to visualize the evolution from an early dry gas to the oil zone and finally to a late dry gas zone. Moreover, according to Snowdon and Mc-
Major Thermal Maturation Indicators 2137
Crossan (1973, p. 2), the epigenetic or syngenetic nature of the H.C.G. can be evaluated by the slope of the regression curve of H.C.G./T.O.C. versus burial depth. If the slope of the regression line is high, migration has occurred; if it is low, the H.C.G. have been retained in their source rocks.
Curve a in the chart is from Le Tran et al (1973). Data used to establish this curve were obtained from gases in 65 core samples of Upper Triassic dolomites and Lower Cretaceous limestones crushed and dissolved in acid solutions. Curve c in the chart is from our work on the Labrador offshore basin (in progress). Data compiled for curve c came from 1,000 measurements of adsorbed gases performed by the analytic method described by Snowdon and McCrossan (1973). The cuttings are mainly fine-grained, terrigenous lower Paleocene through Holocene rocks, and the sampling is fairly dense (30 to 60 ft or 9 to 18 m intervals).
The numerical values of curve a range from zero to 200 mL of H.C.G. per gram of rock. On curve c, this ratio, the percent of gas over the percent of carbon ranges from 0.01 to 0.25.
So far, no comparison can be made between scales a and c in the chart. They need to be extended up and down within the hydrocarbon generation stages using the same analytic method, on the same lithologic sequences.
Ci/H.C.G.—The generation of methane either biochemically during early diagenesis or physico-chemicaUy (by thermal cracking) during late catagenesis, is a well-known phenomenon.
The curve shown on the chart is from Snowdon and McCrossan (1973) and from our study of seven boreholes of the Labrador offshore. For thermal maturation interpretations, this scale should be used together with curve c of H.C.G./T.O.C, curve b of C2/C3 +, and the i - C4/n — C4 curve.
G/CjH—The presence of the ethane-butane series in the commonly called "early" and "late" condensate stages is very controversial. The low sensitivity of the analytic technique (Weber and Maximov, 1976, p. 288), together with our poor knowledge of the relation of condensate or wet gas constituents to the type of organic matter, considerably reduces the reliabihty of interpretations concerning gas evolution and especially the isomers ( i - Q / n —Q). Curve b of C2/C3-f- column on the chart should be used with caution because the content of adsorbed light hydrocarbon gases is sensitive to the Uthology of sedimentary rocks (Feug^re and Gerard, 1970, p. 38-39); this is corroborated by our Labrador offshore basin study.
Curve a for this scale is modified from Figure 3 of Feug^re and G6rard (1970) and from Figure 15 of Jonathan et al (1976). Curve b of C2/C3-I- on the chart is from our study of the Labrador offshore. The positions of the C2/C3+ and the i —Q/n —C4 curves with respect to the hydrocarbon generation stage are supported by exhaustive studies of major diermal maturation indicators (work in prep.).
Discrepancies between curves a and b occur only in the upper part of the condensate gas (early wet gas) zone. These curves coincide in the early wet gas zone and the uppermost part of the oil window. Unfortunately, we have no data from the lower part of the condensate and late dry gas zones, and it would be hazardous to vaakt a downward extension of curve b with curve a for C2/C3+ in the chart.
i—C4/n — C4—^The only publication that we have seen concerning these light hydrocarbon isomers is by Sav5enko et al (1971), who mention the work of several authors. SavSenJco et al (1971) concluded that this ratio is dependent on the oil-gas contact in time and space. The ratio is <0.8 if gas is dissolved in oil, extracted from oil, or is or was in contact with oil. The ratio is >0.9 if gas was never in contact with oil. Sav£enko et al (1971) also stated that the ratio is independent of stratigraphic level, burial depth, and temperature.
In our Labrador offshore study, with a very dense sampling (30 to 60 ft or 9 to 18 m interval), the isomer concentration ratio log (i—C4/n-C4) shows the following variations: Ae beginning of the early wet gas zone (Ro = 0.35%) is characterized by relatively high values (> 1.0) of the ratio, which thereafter decreases to a relatively constant value (0.7 to 0.8) down to the beginning of the oil window. There, the i-C4/n-C4 ratio is not affected by T.O.C. variations.
In potential source rocks from offshore Labrador, we observed that the i —C4/n—C4 ratio reaches values of 0.8 in the upper wet gas zone but higher values for the ratio were obtained from more immature sedimentary rocks at shallower depths. As both the type and the quantity of organic matter are favorable for oil generation and migration effects are not significant, the question arises: for sequences above the oil window, are i —C4/n —C4 ratio values greater than 0.9 owing to the absence of oil or to insufficient maturation to generate the oil?
Although the basic principle ruUng the butane isomer and its thermal maturation relation is still relatively unknown, our work on the Labrador offshore shows that there is a relation between the isomer concentration ratio curve shape and thermal maturation.
2138 Yvon Heroux et a I
Mineralogic Parameters The temperature and the chemical properties,
in the diagenetic environments, control mineral evolution during early and late diagenesis. On the chart (first draft by Kubler, 1976, unpublished, copyright INRS), the mineralogic variations with depth and the index minerals are shown for three types of Uthofacies: (a) normal shaly mudstones, (b) fine-grained volcanic detritus, (c) sodium-rich dark shales.
Data from carbonates and sandstones were not included. In these later facies, the significance of index minerals might not be the same as in pelitic sequences.
Normal shaly mudstones are the best documented Uthofacies. The diagenetic indicators shown on the chart are the mineral assemblages, the position of the (001) reflection of smectite, the percent of illite layers in the mixed-layer illite -2:1 expandable (smectite of low or high charges), and the illite crystallinity index.
Clay mineralogy—The evolution of smectite toward well-crystallized mica and chlorite and the behavior of kaolinite and dickite, as illustrated on the chart, come from our own observations and from the work of such authors as Weaver (1960), Kubler (1964, 1975), Powers (1967), Burst (1969), Dunoyer de Segonzac (1969), Perry and Hower (1970, 1972), Weaver et al (1971), Johns and Shi-moyama (1972), Foscolos and Kodama (1974), and Foscolos et al (1976). The development and transformation of chloritic minerals are less documented and the correlation of this series with other mineralogic and organic parameters is not very reliable at present. Therefore, data pertaining to these minerals are not on the chart.
D (001) of smectite—In the Cenozoic and Me-sozoic sedimentary rocks from the Labrador and Nova Scotia Shelves, we observed that the (001) reflection at 14.5 A of smectite moved to 12.5 A to 13 A within the first diagenetic stages. Foscolos (1977, personal commun.) also reported the same observation. This peak displacement corresponds to the first loss of interlayer water in smectites and is correlated with the beginning of stage II as defined by Perry and Hower (1972).
Percent illite in illite —2:1 expandable—There are two methods for calculating the percent of expandable layers in interstratified minerals: the MacEwan et al (1961) method and the Reynolds and Hower (1970) method. The second one should give better results, but each has its advantages.
The iUitic to expandable layers ratio was correlated with temperature by Burst (1969) and Foscolos and Kodama (1974). In the chart, this parameter was correlated with other thermal
indicators on the basis of temperatures. We also took into account the work of Powers (1967), Perry and Hower (1970, 1972), Johns and Shomoya-ma (1972), and Foscolos et al (1976). On the chart, the upper inflection point of the "% illite in illite —2:1 expandables" curve corresponds to the beginning of Perry and Hower's (1972) stage II and the lower inflection point to stage III of the same authors.
Illite crystallinity index—^The term illite crystallinity index, as used herein, is the width at half hei^t of the peak located around 10 A on a dif-fractogram. As stated by Kubler (1968), the index values are comparable between laboratories only if instruments are calibrated with the same standards.
As already mentioned, the temperature and the chemical conditions (Kiibler, 1968), of the burial environment, control the evolution of this mineral. Moreover, in this situation, a great difficulty arises in data interpretation because of the possible inherited characteristics of illite. Thus, these characteristics must be differentiated from the ones acquired after burial. Mineralogic studies on several granulometric fractions « 0.2 ju, 0.2-2.0 /i and 2-20 /t) must be performed routinely as a first step in solving the inherited or acquired characteristic problem. It is also important to consider the vertical trends based on systematic dense sampling on a sufficiently thick sequence (thousands of feet), and not only the numerical values as such.
On the chart, the I.A.G. ("indice d'aigiie glycol^," Kubler, 1968) curve represents index values obtained from glycolated fractions smaller than 2/jt, whereas the I.A.N, ("indice d'aigiie natu-rel") is for unglycolated ones. The I.A.N. values may represent the total width of overlapping peaks. The I.A.G. curve deviation toward higher index (lower crystallinity) results from the appearance of disordered illite, which has wider diffraction peaks and does not swell with glycol.
The curves derived from coarser fractions treated with glycol (> Ifi; not on the chart) show few variations and are used to confirm changes that occurred in incoming material at the time of sedimentation.
For fine-grained volcanic detritus, the index minerals shown in the chart are zeolites such as sodium (Na) and calcium (Ca) clinoptilolite, anal-cite, and laumontite together with other minerals such as pumpellyite, prehnite, smectite, and cor-rensite. In this facies, smectite evolves diageneti-cally to corrensite and then toward chlorite. The minerals Usted also may be present in evaporitic sequences, limestones, or low-pressure hydrother-mal deposits. However, their diagenetic signifi-
Major Thermal Maturation Indicators 2139
cance may not be the same as in the fine-grained volcanic detritus shown in the chart. The zona-tion shown is mainly from the work of Kubler et al (1974) and Kubler (1975).
In the sodium (Na) dark shale fades, where the sodium and organic matter concentrations are both higher than in "normal shale," the main indicators are kaolinite, allevardite (rectorite), pyro-phyllite, phengite, and paragonite. The data used here are from Dunoyer de Segonzac (1969) and Kubler (1975).
CONCLUSIONS To use the accompanying charts presented here
it should be kept in mind Siat, for most parameters, the curve shape is more significant than the numerical values. Moreover, at present, no known thermal parameter is self-sufficient in hydrocarbon exploration.
The confidence level of some parameters needs to be improved both in terms of analytic precision and relations between the measured values and hydrocarbon generation stages.
Other parameters such as those mentioned in the introduction could eventually be added to the chart to improve its usefulness and reliability.
APPENDIX-GLOSSARY This glossary defines and/or discusses the terms and abbrevi
ations which have been used in the text and figures to characterize thermal maturation in sedimentary rocks and in their analytic methods and which do not appear in the Glossary of Geology (Gary et al, 1973) or for which there are differences of usage. The listing of terms and abbreviations is alphabetic.
A.: aromatic. A./S.: aromatic to saturate ratio. A. + S./O.E.: (aromatic -I- saturate) to organic extract ratio; yield in hydrocarbons. Alkane: see Saturate. Anchimetamorphism: indicates changes in mineral and organic matter content of rocks under physico-chemical conditions prevailing between catagenesis and true metamorphism (green-schist facies). This term, introduced by Harrassowitz in 1927 (Gary et al, 1973) had an initial definition which encompassed both diagenetic and catagenetic zones, and was restricted to changes in the mineral content of rocks. Aromatic (A.); aromatic hydrocarbons. Arrhenius equation: K — Ae~E/RT_ equation used to establish a relation between chemical reaction rate (K) and temperature (T). The equation can be sUghtly modified (Connan, 1974) to establish temperature and time relation for O.M. maturation: ln(t) - (E/RT)-A, where E = activation energy (Kcal/mole); A — frequency factor; R — gas constant; T =• absolute temperature; and t - time in million years. Asp.: asphaltene. Biomonomers: originally formed from bipolymers which are converted to sugars, amino acids, fatty acids, and phenols while incorporated in the sediments under the action of microbes through the use of enzymes. This biodegradation process is confined to the first meter of sediments (Hunt, 1973). Biopolymers: principal components of living organisms which group carbohydrates, proteins, lipids, Ugnin, and subgroups such as chitin, glycosides, pigments, fats, and essential oils (Hunt, 1973).
Birth zone of oil: designates the range in which physico-chemical processes begin to generate naphthabitumen from thermal cracking of organic matter. It is the upper boundary of petroleum generation (Stach et al, 1975, p. 327). Bitumen: herein restricted to liquid phase of naphthabitumen, synonymous with O.E. as opposed to pyrobitumen or kerabitu-men which are insoluble in CSi-Cj/H.C.G.: methane to total hydrocarbon gas ratio. O / C j +: ethane to propane plus butane isomers ratio. i-C4/n-C4: iso-butane to normal butane ratio. Cal./gr. (Cal./g.): calorific value per gram ( -1 .8 Btu/lb). Carbon preference index (C.P.I.): expression of the odd-even predominance in the n-alkanes spectrum (C.P.I.> 1) = odd predominance, (C.P.I.<I) - even predominance, (C.P.I.-1) = no predominance. It is calculated by taking the intensity ratio of the odd to even peaks (area under the curves) for n-paraffins of 25 to 32 carbon atoms. Three ways of calculating this C.P.I, are:
1) Bray and Evans (1961) C.P.I. =
s i s n-C odd S f i n-C odd + •
S i , n-C even £ ' « n-C even
2) Hunt (1973) C.P.I. =
2 i J n-C odd S | | n-C odd +
S i S n-C even Xll n-C even
3) approximation (Louis, 1967) , C.P.I.
2n-C,„
n - C , . + n-C,
Carbon ratio (Cr/Ct) or (F.C./T.O.C): parameter applied to kerogen characterization after pyrolysis at 500 or 900°C. It is the ratio of residual carbon (Cr) or fixed carbon (F.C.) to the total organic carbon (T.O.C. or Ct); the carbon ratio is never established from total organic matter, but only from either kerogen or asphaltene. Catagenesis (katagenesis): in this report, the catagenetic zone is considered equivalent to the stage of generation and destruction of hydrocarbons by thermal cracking and, therefore, follows definition given by Fersman in 1922 (Gary et al, 1973). In the modem interpretation of Soviet authors, catagenesis includes stages of primary change in rock whereas many American scientists consider it to be equivalent to "late diagenesis" (after Weber and Maximov, 1976). In terms of O.M. transformation, this stage corresponds to geomonomers formation or generation of naphthabitumen or bituminous coal from thermal transformation of kerogen. Cation exchange capacity: (C.E.C.) the amount of negative charges compensated for by exchangeable cations (Fripiat et al, 1971); expressed in milliequivalent per gram, or per 100 grams. Caustobiolith (kaustobiolite): rocks which contain an important quantity of organic compounds, or even pure carbon if the latter is of organic origin. Coloration (color): color of spore and pollen observed in transmitted light microscopy. This parameter gives a clue to the degree of carbonization of the least altered constituents of a paly-nologic assemblage in a given rock (Allan and Douglas, 1977). C.P.L: see carbon preference index. Death zone of oil: limit of occurrence of in-situ-generated liquid hydrocarbons. It is the lower boundary of petroleum occurrence (Stach et al, 1975, p. 326). Degree of organic metamorphism: equivalent to many other ex-

2140 Yvon Heroux et al
pressions to indicate stages of organic transformation or alteration. This scale is based on the rank of humic coal. Diagenesis: this term as employed in this report and by Soviet authors, is equivalent to early diagenesis (sediment diagenesis) of American scientists. In terms of organic-matter transformation it corresponds to the formation of kerogen from freshly sedimented organic matter, a process which is most effective from surface to 1,000 m (50°C; Hunt, 1973). Dilatation: analytic parameter for testing the degree of carbonization of coal (coalification) and then the coking power of that coal. Dilatation, in percent, indicates the remaining amount of volatile matter in coal. For more details, see Stach et al (1975, p. 342-344). Dispersed organic mailer: this term is equivalent to organoclast and is sometimes extended to include kerogen. D.O.M.: this abbreviation should be avoided because it could bring confusion of "dispersed organic matter," "degree of organic metamorphism," and "diagenesis of organic matter" (Tis-sot et al, 1974), these last two expressions being quite similar. Exudatinile: this term was defined by Teichmuller (1974) as a secondary bitumen which is a maceral of the liptinite group. F.C.: fixed carbon. F.C./T.O.C: see carbon ratio. F.I.D.: see flame ionization detector. Flame ionization detector (F.I.D.): specific detector used in gas chromatography techniques to record hydrocarbons (Barker, 1972; Claypool and Reed, 1976). Flame photometry detector (F.P.D.): specific detector used in gas chromatography techniques to record sulfur (especially informative in aromatic hydrocarbon analysis to examine compounds containing sulfur thiophenic compounds). FLVO.: fluorescence. Fluorinite: liptinite group maceral formed by oil secretion of plants. This maceral is highly transparent in transmitted light with very weak Ro and is the most fluorescent among macerals of the liptinite group. F.P.D.: see flame photometry detector. FVS.: fusinite. Geomonomers: low molecular weight hydrocarbons and organic compounds that are formed by a thermal-alteration-depen-dent process involving cracking of large molecules to form small compounds; they occur mainly in the 50°C (1,000 m) to I75°C (6,000 m) temperature interval. Geopofymers: derived from condensation of biomonomers in the first meter of sediment to form organic matter complexes (Hunt, 1973). H/C: hydrogen to carbon atomic ratio, see ultimate analysis. H.C.: hydrocarbons (aromatic -t- saturate). H.C.G.: low molecular hydrocarbon gases ranging from methane (C|) to butane (Q) . I.A.G. ("Indice d'Aigue des illiies Gfycolees"): the width at half height of the ± 10 A reflection of illite, on ethylene glycol saturated samples (Kiibler, 1968). I.A.N. ("Indice d'Aigue des illites Naturelles"): same as the I.A. C , but on untreated samples (Kiibler, 1968). Insoluble organic matter: see organoclast. Kerogen: equivalent to organoclast or geopolymers of Hunt (1973). Kerabilumen: equivalent to organoclast. Liquid window concept: see oil window. Metamorphism: to avoid confusion with the definition of metamorphism accepted by hard-rock petrologists, we suggest that use of this term be avoided when qualifying the transformation degree of dispersed organic matter in sedimentary rocks and recommend the use of the term be restricted to the definition given by Turner and Verhoogen (1960, in Gary et al, 1973). Naphthabitumen: the natural gas, liquid, and sohd mixture of hydrocarbons and hydrocarbonlike compounds derived from caustobioliths. They are soluble in CS2 and include principally gas, crude oil (O.E.), maltha, asphalt, asphaltite, ozocerite, as-phaltoide (Louis, 1967). 0/C: oxygen to carbon atomic ratio. See ultimate analysis.
O.E.: organic extract. Liquid phase of naphthabitumen. Commonly used in oil exploration geochemistry to indicate oily components (hydrocarbons sensu stricto: A. -I- S.), asphaltenes, resin, carbenes, and carbenoids. These two last components, present in sediments, quickly disappear during diagenesis. Moreover, they are insoluble in CCI4. The solubility of the different phases in some conventional organic solvents was indicated by Louis (1967). O.E./T.O.C: organic extract to total organic carbon ratio. This analytic parameter indicates the organic extract yield of a sedimentary rock. Oi7 window: stage of hydrocarbon generation and preservation where crude oil exists. Also see birth and death zones of oil. O.M.: organic matter. Organoclast: the fraction of the dispersed organic matter in the sediment or sedimentary rocks that is insoluble in organic solvents (CCI4, CHCI3, QHe, and CH3OH, etc). This insoluble organic matter is called organolite or organoclast (Alpern, 1970), kerogen (Brown, 1912, in Burgess, 1974, p. 21), or kerabi-tumen (Louis, 1967). Peaks (001/001) 10/17 A. (002/003) 10/17 A, etc: on a diffrac-togram, a peak resulting from a combination of the first reflection (001) of illitic layers at 10 A and the first one of the glyco-lated smectitic layers at 17 A (001/001) 10/17 A, or of the second reflection (002) of illite and the third (003) of smectite (002/002) 10/17 A, etc. The position of these peaks is a function of the relative proportion of each type of layer in a mixed-layer mineral. Phytol: an isoprenoid unsaturated alcohol with 20 carbon atoms. During its transformation, chlorophyll loses the phytol group as isoprenoid carbides (pristane-phytane). These isopre-noids are biologic markers (Louis, 1967, p. 20). Polymorph 2M: 2 is for 2 layers in the unit cell and M means monoclinic. One way of stacking ideal mica layers in an ordered manner in which the rotation is alternatively -•- 120° and -120°. Pyrobitumen: as opposed to bitumen (see this last term). For asphaltic and nonasphaltic pyrobitumen classifications, refer to Abraham (1960), Bell and Hunt (1963), and Hunt et al (1954). Ra%: reflectance in air. Reflectance: "The ratio of reflected radiant flux to incident radiant flux" (Gary et al, 1973). The reflectance (R) of a particle is related to its refraction index (n), the adsorption index (K), and the refraction index (N) of the immersion field (air = a and oil - O). The relation is given by the Fresned-Beer equation: R - (n -N)2 -I- n2K2/(n-HN)2 -t- n2K2. Res.: resinite: exinite group maceral. Ro%: reflectance in oil. S.: saturated hydrocarbons: open chain (straight - n-al-kane or paraffinic; branched = iso-alkane) or cyclic-type (cy-clo-alkanes = naphthenic) organic structure that contains only single bonds between carbon atoms. Sharpness ratio: the ratio of the total height of the 10 A reflection over the height of the flank of the same peak at 10.5 A (Weaver, 1960). T.G.A.: thermogravimetric analysis. Thermal alteration index (T.A.I.): analytic parameter commonly used to characterize the degree of alteration of organic matter by measuring pollen and spore color in transmitted light. T.O.C.: total organic carbon. Ultimate analysis: elemental analytic techniques that record parameters such as carbon, hydrogen, nitrogen, sulfur, and iron content of kerogen. The difference from (100 —[C-^-H-^N]) is reported as oxygen if the analysis is performed on dry, ash-free organic matter (usually vitrinite). From ultimate (elemental) analysis, one may establish the H/C and O/C atomic ratio. H/C is less than 1.0 for ligneous organic matter. O/C is less than 0.1 for sapropelic organic matter. H/C versus N + S/O atomic ratios of kerogen should differentiate many coals from bitumens (Hunt, 1978). Vi.: vitrinite. KM..- volatile matter.
Major Thermal Maturation Indicators 2141
REFERENCES CITED
Abraham, H., 1960, Asphalts and allied substances, v. 1: New York, D. Van Nostrand, 326 p.
Allan, J., and A. G. Douglas, 1977, Variations in the content and distribution of n-alkanes in a series of Carboniferous vitrinites and sporinites of bituminous rank: Geochim. et Cosmochim. Acta, v. 41, p. 1223-1230.
Alpem, B., 1970, Classification petrographique des constituants organiques fossiles des roches sidimentaires: Inst. Francois du P6trole Rev., v. 29, p. 1233-1267.
1972, Pitrographie des charbons—bilan des progris acquis de 1967 i 1971: 7th Cong. Intemat. Stratigraphie et Giologie Carbonifire, Krefeld, 1971, Compte Rendu, v. 1, p. 91-126.
1973, Introduction— indices optiques de la matiire organique des s6diments, relations avec la paltotempirature et le potentiel petrolier, in B. Alpem, ed., Pitrographie organique et potentiel petroUer: Paris, Editions Centre Natl. Recherche Sci., p. 191-193.
1976a, Les combustibles fossiles: Rev. Sciences EncyclopMie Alpha, fasc. 106, p. 169-198.
' 1976b, Fluorescence et reflectance de la matiere organique dispersie et Evolution des sediments (fluorescence and reflectance of dispersed organic matter and evolution of the sediments): Centre Recherche Pau Bull., v. 10, p. 201-220.
' et al, 1971, Localisation, caract^sation et classification pitrographique des substances organiques sidimentaires fossiles, in Advances in organic geochemistry, 1971: Intemat. Ser. Mon. Earth Sci., v. 33, p. 1-28.
Bailey, N. J. L., C. R. Evans, and M. A. Rogers, 1971, Evolution and alteration of petroleum in western Canada: Chem. Geology, v. 8, p. 147-170.
Baker, D. R., and G. E. Claypool, 1970, Effects of incipient metamorphism on organic matter in mudrock: AAPG Bull., v. 54, p. 456-468.
Barker, C, 1972, Pyrolysis techniques for source rock evaluation (abs.): Geol. Soc. America Abs., v. 4, p. 443.
Barrabe, L., and R. Feys, 1965, Geologic du charbon et des bassins houillers: Paris, Masson et Cie, 229 p.
BeU, K. G., and J. M. Hunt, 1963, Native bitumens associated with oil shales: Intemat. Ser. Mon. Earth Sci., V. 16, p. 333-366.
Bostick, N. H., 1971, Thermal alteration of clastic organic particles as an indicator of contact and burial metamorphism in sedimentary rocks: Geoscience and Man, V. 3, p. 83-92.
1973, Time as a factor in thermal metamorphism of phytoclasts (coaly particles): 7th Cong. Intemat. Stratigraphie et Gtologie Carbonifire, Krefeld, 1971, Compte Rendu, v. 2, p. 183-193.
1974, Phytoclasts as indicators of thermal metamorphism, Franciscan assemblage and Great Valley sequence (upper Mesozoic), California, in Carbonaceous materials as indicators of metamorphism: Geol. Soc. America Spec. Paper 153, p. 1-17.
Bray, E. E., and E. D. Evans, 1961, Distribution of n-
paraffins as a clue to recognition of source beds: Geochim. et Cosmochim Acta, v. 22, p. 2-15.
Burgess, J. D., 1974, Microscopic examination of kero-gen (dispersed organic matter) in petroleum exploration, in Carbonaceous materials as indicators of metamorphism: Geol. Soc. America Spec. Paper 153, p. 19-30.
Burst, J. F., 1969, Diagenesis of Gulf Coast clayey sediments and its possible relation to petroleum migration: AAPG BuU., v. 53, p. 73-93.
Castafio, J. R., and D. M. Sparks, 1974, Interpretation of vitrinite reflectance measurements in sedimentary rocks and determination of burial history using vitrinite reflectance and authigenic minerals, in Carbonaceous materials as indicators of metamorphism: Geol. Soc. America Spec. Paper 153, p. 31-52.
Claypool, G. E., and P. R. Reed, 1976, Thermal-analysis technique for source-rock evaluation; quantitative estimate of organic richness and effects of lithologic variation: AAPG Bull., v. 60, p. 608-612.
Connan, J., 1970, Contribution i la connaissance de la matiire organique de quelques sediments marins et lacustres: PhD thesis, Univ. Strasbourg, 75 p.
1973, Diagenise naturelle et diagenise artific-ielle de la matiire organique i Elements v£g6taux pridominants (abs.), in Advances in organic geochemistry, 1973: Intemat. Mtg. Organic Geochemistry Program Abs., no. 6, p. 73-94.
1974, Time-temperature relation in oil genesis: AAPG BuU., v. 58, p. 2516-2521.
• K. Le Tran, and B. Van Eter Weide, 1975, Alteration of petroleum in reservoirs: 9th World Petroleum Cong. Tokyo, Proc., v. 2, p. 171-178.
Correia, M., 1967, Relations possibles entre I'^tat de conservation des il6ments figures de la matiire organique (microfossiles palynoplanctonologiques) et I'ex-istence de gisements d'hydrocarbures: Inst. Fran9ais Pitrole Rev., v. 22, p. 1285-1306.
Deroo, G., et al, 1977, The origin and migration of petroleum in the Westem Canadian sedimentary basin. Alberta. A geochemical and thermal maturation study: Canada Geol. Survey Bull. 262, 136 p.
Dunoyer de Segonzac, G., 1969, Les miniraux argileux dans la diagenise. Passage au m6tamorphisme: Thesis, Univ. Strasbourg, 339 p.
Durand, B., et al, 1976, Etude de kirogtoes par r6sonnance paramagn6tique ilectronique (Study of kerogens by means of electron paramagnetic resonance; abs.): Centre Recherche Pau BuU., v. 10, p. 267-269.
EspitaUi, J., et al, 1973, Etude de la matiire organique insoluble (k^rogdne) des argiles du Toarcien du Bas-sin de Paris. Pt. 2, Etudes en spectroscopic infrar-ouge, en analyse thermique diff^rentieUe et en analyse thermogravimitrique: Inst. Franks P^trole Rev., v. 28, p. 37-67.
Feugire, G., and R. E. Gerard, 1970, Geochemical logging—a new exploration tod: World Oil, v. 170, no. 2, p. 37-40.
Foscolos, A. E., and H. Kodama, 1974, Diagenesis of clay minerals from Lower Cretaceous shales of north eastem British Columbia: Clays and Clay Minerals, V. 22, p. 319-335.
2142 Yvon Heroux et al
and D. F. Stott, 1975, Degree of diagenesis, stratigraphic correlations and potential sediment sources of Lower Cretaceous shale of northeastern British Columbia: Canada Geol. Survey Bull. 250, 46 P-
- T. G. Powell, and P. R. Gunther, 1976, The use of clay minerals and inorganic and organic geochemi-cal indicators for evaluating the degree of diagenesis and oil generating potentiaJ of shales: Geochim. et Cosmochim. Acta, v. 40, p. 953-966.
Fripiat, J., J. Chaussidon, and A. Jelli, 1971, Chimie-physique des phinom&nes de surface. Application aux oxydes et aux silicates: Paris, Masson et Cie, 387
P-Gary, M., R. McAfee, Jr., and C. L. Wolf, eds., 1973,
Glossary of geology, 2d printing: Am. Geol. Inst., 805 P-
Gimther, P. R., 1976, Palynomorph color and dispersed coal particle reflectance from three MacKenzie delta boreholes: Geoscience and Man, v. 15, p. 35-39.
Gutjahr, C. C. M., 1966, Carbonization of pollen grains and spores and their application: Leidse Geol. Med-ed., V. 38, p. 1-30.
Hacquebard, P. A., and J. R. Donaldson, 1970, Coal metamorphism and hydrocarbon potential in the upper Paleozoic of the Atlantic provinces, Canada: Canadian Jour. Earth Sci., v. 7, p. 1139-1163.
Hood, A., C. C. M. Gutjahr, and R. L. Heacock, 1975, Organic metamorphism and the generation of petroleum: AAPG Bull., V. 59, p. 986-996.
Hunt, J. M., 1973, Organic geochemistry of the marine environment (abs.): in Advances in organic geochemistry, 1973: Intemat. Mtg. Organic Geochemistry Program Abs., no. 6, p. 593-605.
1977, Distribution of carbon as hydrocarbons and asphaltlc compounds in sedimentary rocks: AAPG Bull., v. 61, p. 100-104.
1978, Characterization of bitumens and coals: AAPG Bull., V. 62, p. 301-302.
F. Stewart, and P. A. Dickey, 1954, Origin of hydrocarbons of Uinta basin, Utah: AAPG Bull., v. 38, p. 1671-1698.
International Committee for Coal Petrology, 1963, 1971, 1975, International handbook of coal petrography, 2d ed. (1963); supp. to 2d ed. (1971): Paris, Centre Natl. Recherche Sci., 1 vol. (variously paged); suppl. 1975: Intemat. Carboniferous Cong., Moscow, 1975.
Johns, W. D., and A. Shimoyama, 1972, Clay minerals and petroleum-forming reactions dtiring burial and diagenesis: AAPG Bull., v. 56, p. 2160-2167.
Jonathan, D., et al, 1976, Les mithodes d'etude physico-chimiques de la matiire organique (physico-chemical study methods of the organic matter; abs.): Centre Recherche Pau Bull., v. 10, p. 89-108.
Kaplan, M. Ye., 1971, Criteria for determining zones of catagenesis in terrigenous deposits: Intemat. Geology Rev., V. 13, p. 1365-1376.
Kartzev, A. A., et al, 1971, The principal stage in the formation of petroleum: 8th World Petroleum Cong., Moscow, Proc., v. 2, p. 3-11.
Karweil, J., 1956, Die Metamorphose der Kohlen vom Standpunkt der physikalischen Chemie: Deutsch Geol. Gesell. Zeitschr., v. 107, p. 132-139.
Kiibler, B., 1964, Les argiles indicateurs de mdtamorphisme: Inst. Fran9ais P6trole Rev., v. 19, p. 1093-1112.
1968, Evaluation quantitative du mitamorphisme par la cristalliniti de I'illite. Etat des progris rialisis ces demiires ann6es: Centre Recherche Pau Bull., v. 2, p. 385-397.
1973, La corrensite, indicateur possible de milieu de sMimentation et du degri de transformation d'un s6diment (Corrensite, a possible guide to the environment of sedimentation and degree of transformation of a sediment): Centre Recherche Pau Bull., v. 7, p. 543-556.
1975, Diagen^e-anchimetamorphisme et mitamorphisme: Quebec, Inst. Natl. Recherche Sci., impublished course notes and tables, 84 p.
J. Martini, and M. Vuagnat, 1974, Very low grade metamorphism in the westem Alps: Schweizer. Mineral, u. Petrog. Mitt., v. 54, p. 461-469.
• et al, 1979, Sur le pouvoir rfiflecteur de la vitrin-ite dans quelques roches du Jura, de la molasse et des nappes pr6alpines, helvitiques et penniques (Suisse occidentale et Haute-Savoie): Eclogae Geol. Helveti-ae (in press).
Landes, K. K., 1966, Eometamorphism can determine oil floor: Oil and Gas Jour., v. 64, no. 18, p. 172-177.
1967, Eometamorphism, and oil and gas in time and space: AAPG Bull., v. 51, p. 828-841.
Le Tran, K., 1971, Etude giochimique de lliydrogene sulfuri adsorbi dans les sMiments (Geochemical study of hydrogen sulfide adsorbed in sediments): Centre Recherche Pau Bull., v. 5, p. 321-332.
J. Connan, and B. Van Der Weide, 1973, Probldmes relatifs i la formation dliydrocarbures et d*hydrogine sulfuri dans le bassin sud-ouest aquitain (abs,), in Advances in organic geochemistry, 1973: Intemat. Mtg. Organic Geochemistry Program Abs., no. 6, p. 761-789.
Leythaeuser, D., 1973, Effects of weathering on organic matter in shales: Geochim. et Cosmochkn. Acta, v. 37, p. 113-120.
Louis, M., 1967, Cours de gtochimie du petrole; cours de I'Ecole Nationale Superieure du Pitrole et des Moteurs: Paris, Inst. Franfais Petrole, Editions Tech-nip, 295 p.
and B. Tissot, 1967, Influence de la temperature et de la pression sur la formation des hydrocarbures dans les argiles k kirogine: 7th World Petroleum Cong., Mexico City, Proc., v. 2, p. 47-60.
MacEwan, D. M. C , A. Ruiz Amil, and G. Brown, 1961, Interstratified clay minerals, in G. Brown, ed.. X-ray identification and crystal structure of clay minerals: Mineral. Soc. London, p. 393-424.
Marchand, A., 1976, La r6sonnance paramagn6tique electronique (R.P.E.). Sa mise en oeuvre pour I'itude des kirogines (Electron spin resonance [E.S.R.] and its utilization in the study of kerogen): Centre Recherche Pau Bull., V. 10, p. 253-266.
McCartney, J. T., and M. TeichmuUer, 1972, Classification of coals according to degree of coalif ication by reflectance of the vitrinite component: Fuel, v. 51, p. 64-68.
Mclver, R. D., 1967, Composition of kerogen—clue to its role in the origin of petroleum: 7th World Petro-
Major Thermal Maturation Indicators 2143
leum Cong., Mexico City, Proc., v. 2, p. 25-36. Orr, W. L., 1974, Changes in sulfur content and isotopic
ratios of sulfur during petroleum maturation—Study of Big Horn basin Paleozoic oils: AAPG Bull., v. 58, p. 2295-2318.
Ottenjann, K., M. TeichmuUer, and M. Wolf, 1974, Spectral fluorescence measurements of sporinites in reflected light and their applicability for coalification studies, in B. Alpem, 1975, ed., Pitrographie de la matiere organique des sediments, relations avec la pa-leotemperature et le potentiel petrolier: Paris, Centre National Recherche Sci., p. 49-65.
Patteisky, K., and M. Teichmiiller, 1958, Examen des possibilitis d' emploi de diverses £chelles pour la me-sure du rang des charbons et propositions pour la d61imitation des principaux stades de houillification: Rev. Industrie Minirale, no. spic, p. 121-137.
Perry, E. A., Jr., and J. Hower, 1970, Burial diagenesis in Gulf Coast pelitic sediments: Qays and Clay Minerals, V. 18, p. 165-177.
1972, Late-stage dehydration in deeply buried pelitic sediments: AAPG Bull., v. 56, p. 2013-2121.
Philippi, G. T., 1965, On the depth, time and mechanism of petroleum generation: Geochim. et Cosmo-chim. Acta, v. 29, p. 1021-1049.
Powell, T. G., et al, 1977: Paper presented by Foscolos at INRS-P6trole, March 29, 1977.
Powers, M. C , 1967, Fluid-release mechanisms in compacting marine mudrocks and their importance in oil exploration: AAPG Bull., v. 51, p. 1240-1254.
Pusey, W. C , 1973, The ERS method: a new technique of estimating the organic maturity of sedimentary rocks: Petroleum Times, January 12, p. 21-24, 32.
Raynaud, J. F., and P. Robert, 1976, Les methodes d'itude optique de la mati^e organique (Optical methods of studying organic matter): Centre Recherche Pau Bull., v. 10, p. 109-127.
Reynolds, R. C , and J. Hower, 1970, the nature of in-terlayering in mixed-layer iUite-montmorillonites: Clays and Qay Minerals, v. 18, p. 25-36.
Robert, P., 1973, Analyse microscopique des charbons et des bitumes disperses dans les roches et mesure de leur pouvoir riflecteur. Application a I'^tude de la paliogiothermie des ' bassins sedimentaires et de la genise des hydrocarbures (abs.), in Advances in organic geochemistry, 1973: Intemat. Mtg. Organic Geochemistry Program Abs., no. 6, p. 549-569.
Savienko, J. P., A. K. Kaipar, and Ja. A. Bereto, 1971, De I'intirdt en prospection, de la valeur du rapport de I'isobutane au butane normal dans les gaz d'hydro-carbures: Centre Recherche Pau, Gas. Prom., no. 4, p. 2-5 (French transl.).
Sikander, A. H., and J. L. Pittion, 1976, Reflectance studies on organic matter in lower Paleozoic sediments: Comm. 4th Mtg. Canadian Coal Petrogra-phers Group (CCPG), 12 p.
1978, Reflectance studies on organic matter in Lower Pdeozoic sediments of Quebec: Bull. Canadian Petroleum Geology, v. 26, p. 132-151.
Snowdon, L. R., and R. G. McCrossan, 1973, Identification of petroleum source rocks using hydrocarbon gas and organic carbon content: Canada Geol. Survey Paper 72-36, 12 p.
and K. H. Roy, 1975, Regional organic meta-morphism in the Mesozoic strata of the Sverdrup basin: Bull. Canadian Petroleum Geology, v. 23, p. 131-148.
Stach, E., et al, 1975, Stach's textbook of coal petrology, 2d ed.: Berlin, Gebriider Bomtraeger, 428 p.
Staplin, F. L., 1%9, Sedimentary organic matter, organic metamorphism, and oil and gas occurrence: Bull. Canadian Petroleum Geolo^, v. 17, p. 47-66.
Teichmiiller, M., 1973, Generation of petroleum-like substances in coal seams as seen under the microscope (abs.), in Advances in organic geochemistry, 1973: Intemat. Mtg. Organic Geochemistry Program Abs., no. 6, p. 379-393.
1974, Formation et transformation des matieres bitumineuses dans les charbons en relation avec la genise et revolution des hydrocarbures: Fortschr. Geol. Rheinland Westfalen, v. 24, p. 65-112 (in German); French transl. by P. Robert, 1977, in Houillification et pdtrole—contribution de la petrologie des charbons a I'exploration de I'huile et du gaz naturel: BRGM, no. 5477, p. 79-138.
Tissot, B., 1976, La transformation de la matiere organique (transformation of organic matter; abs.): Centre Recherche Pau Bull., v. 10, p. 87.
J. Espitalie, 1975, L'evolution thermique de la matiere organique des sediments: application d'une simulation mathematique—potentiel petrolier des bassins s6dimentaires et reconstitution de I'histoire thermique des sediments: Inst. Fran9ais Petrole Rev., V. 30, p. 743-775 (Enghsh abs.).
J. L. Oudin, and R. Pelet, 1971, Criteres d'ori-gine et d'^volution des petroles. Application a I'etude gtochimique des bassins sedimentaires, in Advances in organic geochemistry (1971): Intemat. Ser. Mon. Earth Sci., V. 33, p. 113-134.
- et al, 1974, Influence of nature and diagenesis of organic matter in formation of petroleum: AAPG BuU., V. 58, p. 499-506.
Van Dorsselaer, A., and P. Albrecht, 1976, Marquers biologiques: origine, evolution et applications (Biological markers: origin,, evolution and applications): Centre Recherche Pau Bull., v. 10, p. 193-200.
and J. Connan, 1975, Changes in composition of polycycUc alkanes by thermal maturation (Yalloum lignite, Australia): Advances in Organic Geochemistry, p. 53-59.
Van Gijzel, P., 1973, Polychromatic UV-fluorescence microphotometry of fresh and fossil plant substances with special references to the location and identification of dispersed organic matter in rocks, in B. Alpem, ed., Petrographie de la matiere organique des sediments, relations avec la paleotemperature et le potentiel petrolier: Editions Centre Natl. Recherche Sci., p. 67-91.
Van Krevelen, D. W., 1961, Coal-typology, chemistry, physics, constitution: New York, Elsevier Pub. Co., 514 p.
Vassoyevich, N. B., et al, 1970, Principal phase of oil formation: Moskov Univ. Vestnik 1969, no. 6, p. 3-27 (in Russian); English transl.: Intemat. Geology Rev., v. 12, p. 1276-1296.
Waples, D., and J. Connan, 1976, Time-tempyerature re-
2144 Yvon Heroux et al
lation in oil genesis: discussion and reply: AAPG BuU., V. 60, p. 884-887.
Weaver, C. E., 1960, Possible uses of clay minerals in search for oil: AAPG BuU., v. 44, p. 1505-1518.
K. C. Beck, and C. O. Pollard, 1971, Clay water diagenesis during burial: How mud becomes gneiss: Geol. Soc. America Spec. Paper 134, 96 p.
Weber, V. V., and S. P. Maximov, 1976, Early diagenet-
ic generation of hydrocarbon gases and their variations dependent on initial organic composition: AAPG BuU., V. 60, p. 287-293.
Welte, D. H., 1976, The nature of organic matter in sediments (abs.): Centre Recherche Pau BuU., v. 10, p. 85.
White, D., 1915, Some relations in the origin between coal and petroleum: Jour. Wash. Acad. Sci., v. 5, p. 189-213.