Embed Size (px)
Citation preview

Discussion PaperDeutsche BundesbankNo 25/2020
Compilation of commercial property price indicesfor Germany tailored for policy use
Thomas A. Knetsch
Discussion Papers represent the authors‘ personal opinions and do notnecessarily reflect the views of the Deutsche Bundesbank or the Eurosystem.

Editorial Board: Daniel Foos Stephan Jank Thomas Kick Malte Knüppel Vivien Lewis Christoph Memmel Panagiota Tzamourani
Deutsche Bundesbank, Wilhelm-Epstein-Straße 14, 60431 Frankfurt am Main, Postfach 10 06 02, 60006 Frankfurt am Main
Tel +49 69 9566-0
Please address all orders in writing to: Deutsche Bundesbank, Press and Public Relations Division, at the above address or via fax +49 69 9566-3077
Internet http://www.bundesbank.de
Reproduction permitted only if source is stated.
ISBN 978–3–95729–708–2 (Printversion) ISBN 978–3–95729–709–9 (Internetversion)

Non-technical summary
Research Question
The monitoring of commercial real estate markets has become more important for prudential policymakers since the financial crisis, not least because the financial sector has a large exposure to commercial real estate. However, official statistics reveal substantive data gaps, making it difficult to analyse commercial real estate markets.
Contribution
Experimental commercial property price indices (CPPIs) for Germany are presented. The data are annual, cover 127 German towns and cities (including all large cities) and run from 1995 to 2018. The CPPIs are compiled for various definitions of commercial real estate such as the definition proposed by the European Systemic Risk Board (ESRB) and the one found in the Capital Requirements Regulation (CRR). In addition, a breakdown into three city groups – namely into the seven largest German cities, into the large cities excluding the seven largest, and into medium-sized towns – is provided. These experimental CPPIs might be regarded as useful for financial stability analysis and other policy areas, at least until the gap is filled by official statistics.
Results
The CPPIs for different definitions of commercial real estate are derived from a coherent database. On the one hand, this database consists of price information for office buildings, retail space, multi-family dwellings as well as houses and apartments in 127 German towns and cities, which are collected by bulwiengesa AG, a real estate consulting company. On the other hand, stock weighting schemes are constructed using floor space data from the 2011 census of the dwellings stock, from bulwiengesa AG on office buildings in 127 towns and cities, and from an estimation building on official retail space data for German government regions. The main empirical conclusion is that, while the CPPIs partly exhibit trends of somewhat different strength, they are very similar in terms of their general time series properties referring, for instance, to the timing of turning points and the indication with regard to the direction of change or the change in momentum.

Nichttechnische Zusammenfassung
Fragestellung
Die Beobachtung der Gewerbeimmobilienmärkte hat für die prudenziellen Entscheidungsträger seit der Finanzkrise größere Bedeutung erlangt, nicht zuletzt da von den Gewerbeimmobilienmärkten Gefährdungspotenziale für das Finanzwesen ausgehen. Die amtliche Statistik weist indessen beträchtliche Lücken auf, was es schwierig macht, Gewerbeimmobilienmärkte zu analysieren.
Beitrag
Preisindizes von Gewerbeimmobilien in Deutschland werden vorgestellt. Es handelt sich um jährliche Daten, die 127 deutsche Städte (darunter alle Großstädte) abdecken und sich über den Zeitraum von 1995 bis 2018 erstrecken. Die Preisindizes werden für verschiedene Abgrenzungen von Gewerbeimmobilien berechnet, darunter die Definition des Europäischen Ausschusses für Systemrisiken (ESRB) und die Definition der Regulierung zur Eigenkapitalunterlegung von Kreditinstituten (CRR). Darüber hinaus werden die Indizes in drei Städtegruppen untergliedert, d.h. in die sieben größten deutschen Städte, in die Großstädte ohne die sieben größten und in die Mittelstädte. Die experimentellen Gewerbeimmobilienpreisindizes können die Finanzstabilitätsanalyse und andere Politikbereiche zumindest solange unterstützen, bis die Lücke durch die amtliche Statistik geschlossen wird.
Ergebnisse
Die Preisindizes für Gewerbeimmobilien nach verschiedenen Abgrenzungen werden von einer kohärenten Datenbasis abgeleitet. Hierbei handelt es sich zum einen um die Preisinformationen für Büro, Handel, Mehrfamilienhäuser sowie Häuser und Wohnungen in 127 deutschen Städten, die von der bulwiengesa AG, einer Immobilienberatungsfirma, zusammengetragen werden. Die Bestandsgewichtungen werden zum anderen aus der amtlichen Wohngebäudezählung des Jahres 2011 abgeleitet. Hinzu kommen Informationen der bulwiengesa AG über Büroflächen in 127 Städten und eine Schätzung städtischer Handelsflächen aus amtlichen Angaben für die Regierungsbezirke. Den empirischen Analysen zufolge weisen die Gewerbeimmobilienpreisindizes – auch wenn bei ihnen teilweise gewisse Unterschiede mit Blick auf die Stärke der Trends zu beobachten sind – insgesamt sehr ähnliche Zeitreiheneigenschaften auf. Dies betrifft zum Beispiel die Lage der Wendepunkte und die Indikation bezüglich der Bewegungsrichtung und der Tempoveränderung.
DEUTSCHE BUNDESBANK DISCUSSION PAPER NO 25/2020
Compilation of Commercial Property Price Indices for Germany Tailored for Policy Use1
Thomas A. Knetsch
Deutsche Bundesbank
Abstract
The compilation of commercial property price indices is a big challenge. In Germany, substantive data gaps prevent the calculation of official figures by the national statistical authority. By contrast, policymakers urge for timely, reliable and comprehensive data. In this paper, proposals are made as to how to aggregate and classify individual price information in order to best serve the intended policy uses. Experimental price indices according to various definitions of commercial real estate are constructed on the basis of two components: (i) the appraisals for transaction prices of houses, apartments, multi-family dwellings, office buildings and retail space in 127 German towns and cities provided by bulwiengesa, a real estate consulting company; and (ii) corresponding data on floor space which make it possible to derive coherent weighting schemes. The overall price developments revealed by the various indices are rather similar in terms of central time series characteristics, while differences in detail can be explained by their specific compositions. Analysts may find these indices helpful to better understand price developments in German commercial real estate markets. Statisticians may acquire from this exercise further knowledge about measurement practices, as official statistics are encouraged to take steps towards establishing thorough reporting on commercial real estate markets.
Keywords: Commercial property price indices, private data, stock weighting, policy use
JEL-Classification: C43, E31, R33
1 Contact address: Deutsche Bundesbank, Directorate General Statistics, Wilhelm-Epstein-Str. 14, 60431 Frankfurt am Main. Phone: +49 69 9566-3417. E-Mail: [email protected]. The author thanks Julian Barnikol, Alexandra Hock, Mario Schimmelpfennig and Patrick Schwind for excellent research assistance. The paper benefitted from discussions with Christine Schlitzer. Comments by Edgar Brandt, Andrew Kanutin and Malte Knüppel are gratefully acknowledged. Of course, all remaining errors are mine. The views expressed in this paper are solely mine and should not be interpreted as reflecting the views of the Deutsche Bundesbank and the Eurosystem.

1 Introduction The demand for commercial property price statistics has increased in the aftermath of the global
financial crisis as both policymakers and academic scholars urge for timely, reliable and
comprehensive data to study economic, macroprudential and supervisory issues related to this
segment of the real estate market. Price information is of high interest in financial stability
analysis because it helps identify vulnerabilities in commercial real estate markets.2 In concrete
terms, price indicators are crucial to quantify the phenomenon known as the collateral stretch
in risk analysis, namely the impact of a significant price reversal on the balance sheet of banks
through a revaluation of collaterals.
Official statistics are called on to provide inter alia commercial property price indices (CPPIs).
These are meant to track the transaction values of commercial real estate over time, with the
properties being representative and unchanged as far as characteristics are concerned, i.e.
comparing like with like. However, as stated by Diewert and Shimizu (2015), for instance, the
development of CPPIs is “one of the fields in statistics that has perhaps lagged the furthest
behind” (p. 131). Silver (2013) summarised the statistical challenges of CPPI compilation and
what these imply for policy use. In addition, he reviewed existing CPPIs in Europe and the US.
A recent study published by the Bank of International Settlements (BIS, 2019) can be seen as
an update, reporting inter alia on recent attempts in several countries to compile CPPIs. From a
global perspective, some important milestones were reached. International statistical
institutions agreed on a document providing information about source data, conceptual
frameworks and methodologies to compile CPPIs (Eurostat, 2017). The collection and
dissemination of price indicators available for the G-20 countries were institutionalised within
the G-20 Data Gaps Initiative (DGI), with the BIS serving as the data hub and a concrete short-
term target being formulated in DGI Recommendation II.18.3 To date, the BIS dataset
comprises CPPIs of 14 countries and the euro area.
In Germany, CPPIs are currently available only from private data providers. Among them, the
research unit of the Association of German Pfandbrief Banks (Verband deutscher
Pfandbriefbanken, vdp) and bulwiengesa AG, a real estate consulting company, publish CPPIs
with a broad regional coverage. The transaction-based, quarterly vdp indices are currently
2 For instance, the European Systemic Risk Board has published two reports on the EU commercial real estate sector and its impact on financial stability in recent years; see ESRB (2015, 2018). 3 The target is formulated as follows: “Provide available Commercial Property Price Indicators (data and associated metadata, including descriptions of data source(s) and compilation procedures) to BIS, from private sources or sourced from official statistics, the latter being the preferred option” (IMF and FSB, 2019, p.7)
1

deemed most useful for analysts. The merits of the annual appraisal data from bulwiengesa are
not only confined to cross-checks. Rather, as the data are available in the breakdown of 127
German towns and cities as well as for several real estate types such as office buildings, retail
space, multi-family dwellings, houses and apartments, it is also a valuable source for compiling
CPPIs according to several definitions of commercial real estate. The multi-definition approach
is a consequence of lively discussions among producers and users of real estate statistics as well
as scholars on how to delineate residential and commercial real estate and the present outcome
that it may depend on the specific policy use as to which definition should be taken.
Although commercial real estate is an important asset class, research on asset price
developments and rates of return has mostly focused only on the housing part of the real estate
stock (see Knoll et al., 2017; Jordà et al., 2019, for prominent examples). The availability of
CPPIs would be a prerequisite for the greater consideration of this asset class. However, the
compilation of CPPIs lags significantly behind. Already in 2003, residential property price
indices (RPPIs) on the basis of bulwiengesa data were released in Germany for the first time
(Deutsche Bundesbank, 2003; Leifer, 2003). While the vdp followed in 2010, official statistics
started the publication of a house price index only about ten years later (Dechent, 2011; Dechent
and Ritzheim, 2012).4 The Deutsche Bundesbank has recommended the CPPIs provided by
both vdp and bulwiengesa for quite some time.5 Nonetheless, an own CPPI compilation was
put forward in order to implement the prevailing definitions of commercial real estate on the
basis of a coherent weighting scheme. Indeed, the major value added of this exercise may lie in
the composition of a data set on the floor space of commercial real estate including office
buildings, retail space and rental housing stemming from various public and private sources.
As official statistics will conceptualise potential CPPI production on the basis of definitions
agreed by users, the work is preparatory in the sense that it highlights what is already available
in official statistics for the derivation of weighting schemes and what has to be developed
further.
The experimental CPPIs date back to 1995. One advantage of these relatively long time series
is that trend and cycle characteristics of commercial property prices in Germany can be studied.
For instance, the ongoing upswing started in 2005 and, thus, five years earlier than the surge of
residential property prices. Multi-family dwellings have experienced the strongest price
4 In contrast to the RPPIs based on bulwiengesa data, both the vdp indices and the official indices measure price developments at quarterly periodicity. 5 See, for instance, the dashboard “German commercial property market” on the Deutsche Bundesbank’s website: www.bundesbank.de/commercial_property
2
increase since then, followed by office buildings, while the prices of retail space as well as of
houses and apartments have risen less dynamically. The object types more concentrated on
large cities such as office buildings and multi-family dwellings generally feature price cycles
of a shorter duration and higher amplitude. The financial crisis induced a mini-cycle only in the
office segment. The exercise makes clear that the CPPIs do not vary substantively according to
the chosen definition of commercial real estate.
The paper is organised as follows. In the following section, the most common definitions of
commercial real estate are introduced. In Section 3, the data sources used are presented. This
includes an explanation of the choices and assumptions made to derive a coherent weighting
scheme for the several definitions of commercial real estate in policy use. Section 4 is devoted
to index compilation. The resulting price indices for commercial real estate are shown not only
for the total aggregate of 127 towns and cities. In addition, it is illustrated how a city-group
breakdown can be tailored to supplement the set of price information along the spatial
dimension. Finally, conclusions are drawn and potential further work in this field is sketched.
2 Definitions of commercial real estate in policy use Commercial real estate is not uniformly defined. While office buildings and retail space as well
as logistics, industrial structures and other types of property used for conducting business are
unanimously considered commercial real estate, there are alternative views on whether rental
housing should be classified as residential or commercial real estate. Rental housing is
quantitatively important in Germany given that almost half of the population are tenants.6
In general, the classification of rental housing may not be decided universally, as the purpose
of the analysis matters. Of crucial importance is, on the one hand, the question as to whether
real estate is classified according to the user or the owner perspective (e.g. Deutsche
Bundesbank, 2013a). Among the definitions in use, the one laid down in the Capital
Requirements Regulation (CRR) implements the user concept and thus considers rental housing
as a part of residential real estate (European Union, 2013). The user concept also comprises the
delineation between dwellings and buildings other than dwellings made by the European system
of accounts (ESA 2010). If, by contrast, the owner perspective is taken in its pure form, only
owner-occupied housing should be regarded as residential real estate, implying that commercial
real estate – as it includes rental housing in its entirety – is understood in the broadest sense
(Eurostat, 2017). On the other hand, for classification, it can further make a difference whether
6 See, for instance, ECB (2009), Box 3, for reasons as to why the rental housing market is so broad in Germany.
3

dwellings rented out to tenants are owned by natural persons (henceforth households) or legal
entities (henceforth enterprises). In the residential-commercial delineation proposed by the
European Systemic Risk Board (ESRB, 2016, 2019), the former – labelled buy-to-let property
– is considered residential property because, from a macroprudential point of view, it more
closely resembles owner-occupied housing than other commercial property in terms of credit
risks.
Residential-commercial split according to several definitions in use
Definition Houses and apartments Multi-family dwellings Office Retail
owned by enterprises
owned by households owned by households
owned by enterprises
rented out owner- occupied
Capital Requirements Regulation (CRR) residential commercial
ESRB recommendation on closing real estate data gaps commercial residential commercial
Broadest definition of commercial real estate in Eurostat (2017)
commercial residential commercial
This illustration does not cover the complete stock of real estate properties. For instance, social housing as well as industrial and logistics properties are excluded. The illustration also abstracts from buildings under construction.
Figure 1
Fig. 1 displays the residential-commercial splits underlying several definitions in use. Note that
commercial real estate does not extend to more object types than office, retail and (some part
of) rental housing.7 This is because these types are analysts’ primary interest and price data turn
out to be of the highest quality thanks to comparatively high turnover and transparency. Price
information on industrial and logistics buildings, albeit provided by bulwiengesa, is ignored
because of limited reliability and missing stock data for deriving weights. Social housing, real
estate used by the owners of the property for conducting their business and buildings under
7 See ZIA (2016, 2019) for reports on a joint effort of several German institutions aimed at classifying the total commercial real estate stock at a very detailed level.
4

construction are not considered owing to lacking data, a distortionary impact on measurement
or even conceptual flaws in the context of price statistics.8
While the CRR definition of commercial real estate enables CPPI weights to be based on both
stock and take-up of space, it is impossible to implement a transaction weighting for the ESRB
delineation and the broadest-level concept without making arbitrary choices regarding the
assignment of transactions from enterprises to households and vice versa. In addition,
transactions in commercial real estate markets are available only incompletely. By contrast, the
real estate stock in Germany is – at least to the extent needed for the CPPI compilation intended
here – recorded to a sufficient degree. In particular, the dwellings stock was completely
registered by a census in 2011, making it possible to identify and extract rental housing with
the highest precision. For office buildings and retail space, the compilation relies on less precise
sources. Data on office floor space in towns and cities are provided by bulwiengesa. For retail
space, there is official NUTS 2 level information,9 i.e. for the government regions
(Regierungsbezirke).10 Using these data and population figures, estimates for towns and cities
are performed.
3 Data sources for price trends and weighting schemes The price indices for commercial real estate in 127 German towns and cities are compiled on
the basis of two major components. These are, first, the price trends for office buildings, retail
space, multi-family dwellings as well as houses and apartments in each of these towns and cities
and, second, the city-level data on floor space which are needed to construct weighting schemes
according to the definitions of commercial real estate under consideration.
8 According to the ESRB recommendation, for instance, these categories are part of commercial real estate. The ESRB recommendation also applies to credits where the inclusion of the categories is justified. 9 NUTS is the acronym for Nomenclature des unités territoriales statistiques (nomenclature of territorial units for statistics). 10 Four Bundesländer (North Rhine-Westphalia, Bavaria, Baden-Wurttemberg, Hesse) are divided into Regierungsbezirke due to administrative reasons. Until the early 2000s, Saxony, Rhineland-Palatinate and Lower Saxony were divided into Regierungsbezirke as well. The 19 current and 10 former administrative units, together with the remaining 9 Bundesländer, form the NUTS 2 level in Germany.
5

3.1 Price data for 127 German towns and cities The RIWIS11 database maintained by bulwiengesa comprises the information needed to
calculate prices for office buildings, retail space and multi-family dwellings following an
income approach. According to this, the market value of commercial real estate is inferred
using the valuation equation:
=where is (annual) rental income less operating costs (including maintenance,
administration etc.) and vacancy costs, and is the capitalisation rate.
The data are stratified in the sense that the pricing information is available for each of the
relevant object types (office buildings, retail space, multi-family dwellings) and for the each of
the 127 German towns and cities considered. It results from intensive market observations
consisting of surveys among realtors, investors, owners and lessees in the context of actual
sales12 and a careful validation by bulwiengesa experts. The information is of an appraisal
nature, as the raw data for individual objects are adjusted by expert judgment in order to fit the
reference of prime-segment objects. The valuations thus refer to objects of constant quality over
time, implying that their percentage changes can be interpreted as price changes.
Rental housing does not only comprise multi-family dwellings but also extends in part to houses
or individual apartments in condominiums. The prices of (detached) houses, terraced houses
and apartments in 127 towns and cities are collected by bulwiengesa using a detailed and
structured annual questionnaire among local contact persons (e.g. real estate agents, real estate
experts at banks, project developers, investors etc.). The outcome of the survey is valuations
for typical objects, which are characterised in terms of size, location, age, fixtures and fittings,
and other price-determining factors. The bulwiengesa experts ensure a careful data validation
and form valuations which are representative for houses, terraced houses and apartments in the
127 towns and cities. As characteristics are kept constant over time, the valuations refer to
objects of a constant quality and can thus be interpreted as appraisal prices.
11 RIWIS is the acronym for Regionales Immobilienwirtschaftliches Informationssystem meaning regional real estate information system. 12 Although the transaction price may not be known in each and every case, the pricing information (prices, rents and/or yields) collected by bulwiengesa is considered transaction-related, as it generally refers to objects which are actually transacted. In other words, the dataset should exclude notional appraisals and the risk of stale appraisals should be reduced.
6

3.2 Data on the floor space of commercial real estate in 127 German towns and cities
The data on the floor space of commercial real estate are composed from three sources. For
rental housing, the 2011 census information is used. Office space is taken from bulwiengesa,
and retail space in the 127 towns and cities results from estimates on the basis of official
country-level data.
The stock of dwellings as on 9 May 2011 – the reporting date of the census – is recorded in
great detail. The tabulated information can be used to form the aggregates needed for the
derivation of weighting schemes. One crucial breakdown is into the number of housing units in
dwellings. This piece of information makes it possible to distinguish between houses (i.e.
dwellings with one unit or two) and multi-family dwellings (i.e. three and more units). With the
additional information about whether multi-family dwellings are condominiums or owned by a
single legal entity, it is possible to separate out the number of apartments which can be
transacted individually. Information about the legal status of the owner helps distinguish
between dwellings which are, following the ESRB terminology, in the hands of either natural
persons or legal entities. The former is proxied by the census category “households”, the latter
by the categories “private enterprises” and “housing cooperatives”. Dwellings owned by the
public sector are not considered in the calculations here due to the supposition that this could
be social housing to a large extent. The census also provides information about the primary use
of dwellings, yielding a distinction between owner-occupied housing and buy-to-let.13 A
categorisation of housing units in dwellings according to their floor space finally enables to
account for the fact that average apartment sizes tend to be smaller the larger the number of
units in the dwelling.
For Laspeyres-type CPPIs, a base year must be determined. It seems appropriate to choose 2011
owing to the full recording of the dwellings stock in the census year. This choice is not at odds
with corresponding information available for the office and retail segments. For the floor space
of office buildings in 127 towns and cities, annual time series are provided by bulwiengesa.
Hence, the 2011 figures can simply be taken from this source. The floor space of retail structures
in 2011 can be estimated using the following official publications: retail space in 2014 broken
down into 38 government regions, the inhabitants of these government regions and of the 127
towns and cities in 2011 and 2014. The estimates are obtained by imposing the assumptions
13 Additional categories of minor relevance are holiday homes and vacant homes. While the former are split fifty-fifty between owner-occupied and rented out, the latter are assigned completely to rental housing as the owners of vacant homes are assumed to live somewhere else.
7

that the retail space per inhabitant in a town or city is equal to the retail space per inhabitant in
the government region the town or city belongs to and that these per-capita figures do not
change over time. An assessment of the quality of these estimates is possible for those towns
and cities for which bulwiengesa data on retailers’ floor space in the period between 2010 and
2012 are available. As shown in Fig. 2, this cross-check reveals excellent performance in terms
of regression fit.14
Figure 2
By summing up all categories of real estate under consideration, the floor space in the 127
towns and cities in 2011 amounts to 1.3 billion square metres. As displayed in Fig. 3, houses
and apartments make up almost one-half, multi-family dwellings about one-third and office and
retail more or less one-sixth. Comprising only office and retail structures, the smallest concept
of commercial real estate (according to CRR) totals 0.2 billion square metres. On the basis of
floor space data, office space is given a weight that is three times higher than retail.15 The
inclusion of residential real estate which is rented out by enterprises doubles the floor space of
commercial real estate. Hence, the ESRB definition of commercial real estate includes rental
housing with a share of just over one-half. In the broadest concept of commercial real estate
which includes rental housing, regardless of whether it is owned by enterprises or households,
14 If the three observations towards the top-right corner of the figure are ignored in the regression, the estimated slope is 0.82 and the adjusted R2 is 0.92. 15 In the vdp CPPI, office is given a weight of 60 per cent using information about the outstanding loans granted by mortgage banks. In the bulwiengesa CPPI, office makes up only one-quarter and retail three-quarters, representing the shares of the object types in tradable assets. See also Knetsch, Schlitzer and Triebskorn (2019).
8

the floor space of commercial real estate is 0.9 billion square metres, with multi-family
dwellings contributing almost one-half, buy-to-let houses and apartments a little more and
office and retail a little less than one-quarter.
Figure 3
4 Index compilation CPPIs are compiled on the basis of town-specific price trends and weighting schemes. The price
index according to definition in period , = 1995,… , 2018, satisfies the difference equation = 1 ∆
with = 100. Hence, the reference year (i.e. the year which anchors the price index
series) does not coincide with the base year, which is 2011.
9
The percentage change of the index is calculated using the formula
∆ = 1∙ ∆
where is the weight of object type , = 1,… , , in the town or city , = 1,… , , according
to definition , and ∆ is the percentage change in the price for object type in town or city
in period .
The legal status of the owner is usually no determining factor of the transaction prices of multi-
family dwellings. The same is true of houses and apartments; and it generally makes no
difference to the price whether the seller lived in the dwelling or rented it out and what the
buyer plans to. Hence, the same town-specific price changes are used for multi-family dwellings
owned by enterprises and households, and the same town-specific price changes are used for
houses and apartments in the three subgroups required to make distinctions for CPPI
compilation.
In the next section, the price indices for the aggregate of 127 German towns and cities are
reported. The second section is devoted to the results of a city-group breakdown.
4.1 CPPIs for the aggregate of 127 German towns and cities The aggregate price trend of commercial property in German towns and cities does not vary
substantively according to the chosen definition (see Fig. 4). Some minor differences can be
detected by analysing key descriptive statistics of the CPPI series and relating them to those of
the components. The price indices for office, retail, multi-family dwellings as well as houses
and apartments are shown in Fig. 5 for comparison.
Averaged over the whole period from 1995 to 2018, the price change is 2.1 per cent per year in
the case of the CRR definition.16 This is the lowest because multi-family dwellings, which
experienced the strongest price increase amongst all object types (4.0 per cent per year), are
completely excluded. The CPPI according to the ESRB definition rose by 3.0 per cent per year
on average. This is exactly the same rate as in the case where the broadest definition of
commercial real estate is chosen. This similarity can be explained by recalling that the share of
multi-family dwellings is uniformly one-half in both definitions and noting that the price trends
of the remaining components (which are, in the ESRB, office and retail for the most part and,
16 Average annual percentage changes and standard deviations for the CPPIs of various definitions and breakdowns are tabulated in Table 1 of the Appendix.
10

in the broadest concept, office and retail as well as houses and apartments in roughly equal
parts) shared more or less the same long-run price trends.
Figure 4
The volatility of the CPPI is higher the narrower the concept. In particular, the standard
deviation of the commercial property price changes measured according to the CRR and the
ESRB definitions is 6.1 percentage points, while it is 5.4 percentage points in the case of the
broadest-level CPPI. The turning points of the three CPPI series coincide almost completely. A
formal detection method building on Harding and Pagan (2002) unambiguously finds that the
last trough was in 2005 after commercial property prices had peaked in 2001.17 Before the
millennium changeover, there was another trough − in 1997 according to the CRR series and in
1998 following the alternative definitions. Declining commercial property prices seem to occur
in the context of economic recessions.18
The CPPIs of the various definitions point to the same direction of change in more than 90 per
cent of the years under consideration. The signals regarding the change in momentum are
uniform in almost 80 per cent of the cases.19
17 Harding and Pagan (2002) formalise the Bry and Boschan approach to business cycle dating. In general, the algorithm identifies peaks as local maxima and troughs as local minima requiring that they emerge in alternating order. For the application to annual price series, it appears appropriate to predetermine that the minimum phase is two years and the minimum cycle four years. Exact dates for peaks and troughs are found in Table 2 of the Appendix. 18 The dates of economic recessions in Germany are taken from the “consensus business cycle chronology” suggested by Schirwitz (2009). The “Great Recession”, which forced German gross domestic product (GDP) to decline from the second quarter of 2008 to the first quarter of 2009, is added to this chronology. 19 The change in momentum is positive when the price change increases from one year to the next. It is negative when the price change decreases.
11

Figure 5
Looking at the components in Fig. 5, the more pronounced fluctuations of the narrower CPPIs
are due mainly to the stronger cyclicality of office prices. In this series, the 2005 trough is
markedly deeper than in the prices for retail and the dwellings types. In addition, only office
prices visibly reacted to the financial crisis, creating a mini-cycle peaking in 2007 and
bottoming out in 2009. By contrast, in the second half of the 2000s, the prices for retail and
12

multi-family dwellings only decelerated along an upward movement, while the prices for
houses and apartments remained flat. Especially the latter component followed a noticeably
smooth trend overall.
From both the CPPIs in Fig. 4 and the components in Fig. 5, the conclusion can be drawn that
the current upswing in commercial property prices is extraordinary in both length and strength.
It started in 2005 and, thus, five years earlier than the surge of residential property prices.20
Since 2005, the CPPI in the CRR version has risen at an annual rate of 5.4 per cent on average.
In the ESRB version, the annual percentage change is 6.5 per cent and, in the broadest concept
of commercial real estate, it is 6.0 per cent. Steeply rising prices for multi-family dwellings
(7.6 per cent per year) have fuelled this upswing most strongly, followed by office prices
(5.7 per cent per year) and retail prices (4.2 per cent per year), whereas the prices of houses and
apartments have risen the least dynamically since 2005 (3.6 per cent per year).
4.2 Breakdown into city groups Real estate analysis usually benefits from the availability of regional disaggregated data. The
sub-aggregate most commonly used in Germany is the group of the seven largest cities.21 By
supplementing this, it seems appropriate to form additional city groups. Following an official
categorisation proposed by the Federal Institute for Research on Building, Urban Affairs and
Spatial Development (Bundesinstitut für Bau-, Stadt- und Raumforschung, BBSR), the 127
towns and cities under consideration can be broken down into the group of 72 large cities with
a population of 100,000 and above but excluding the 7 largest ones, and the group of 48
medium-sized towns with a population between 20,000 and 100,000. The BBSR category
“small towns” is not covered at all by bulwiengesa price data. The bottom end of the group of
127 towns and cities in terms of population is a town of just under 40,000. As shown in Fig. 6,
full coverage by bulwiengesa price data is ensured in the case of large cities, while medium-
size towns are covered to about one-sixth in terms of population.
20 See, for instance, Deutsche Bundesbank (2013b) for an overview of price developments in the German residential property market since 2010. 21 Berlin, Düsseldorf, Frankfurt am Main, Hamburg, Cologne, Munich and Stuttgart.
13

Figure 6
The distribution of the commercial real estate stock across towns and cities is not proportionate
to population. The Lorenz curves in Fig. 7 help gain an impression of how the stocks of the
several types of real estate are concentrated relative to population.22 Houses and apartments are
systematically less concentrated on the large cities than population. This pattern is also found
for retail space, albeit in a milder form. By contrast, multi-family dwellings tend to be more
concentrated the larger the town or city. For office buildings, the Lorenz curve is shaped in a
non-standard fashion. At the origin, the slope is less than unity, implying that the share of Berlin
is smaller in office space than in population. As some of the subsequent largest German cities
are commercial centres (e.g. Munich, Frankfurt, Düsseldorf and Stuttgart), the Lorenz curve
steepens significantly, intersecting not only the 45° line but also the Lorenz curve of multi-
family dwellings.
The evidence on coverage and concentration may raise doubts as to whether CPPIs based on
the prices of 127 towns and cities represent developments in the whole country. This is all the
more relevant for those definitions of commercial real estate according to which houses and
apartments are given a high weight. As neither office buildings nor multi-family dwellings are
distinctively concentrated on the populated areas, it is far from obvious to conclude that, even
22 The approach was originally proposed by Lorenz (1905) and is widely applied to the measurement of income and wealth inequality. It is adopted here to illustrate the concentration of the real estate stock in relation to population.
14
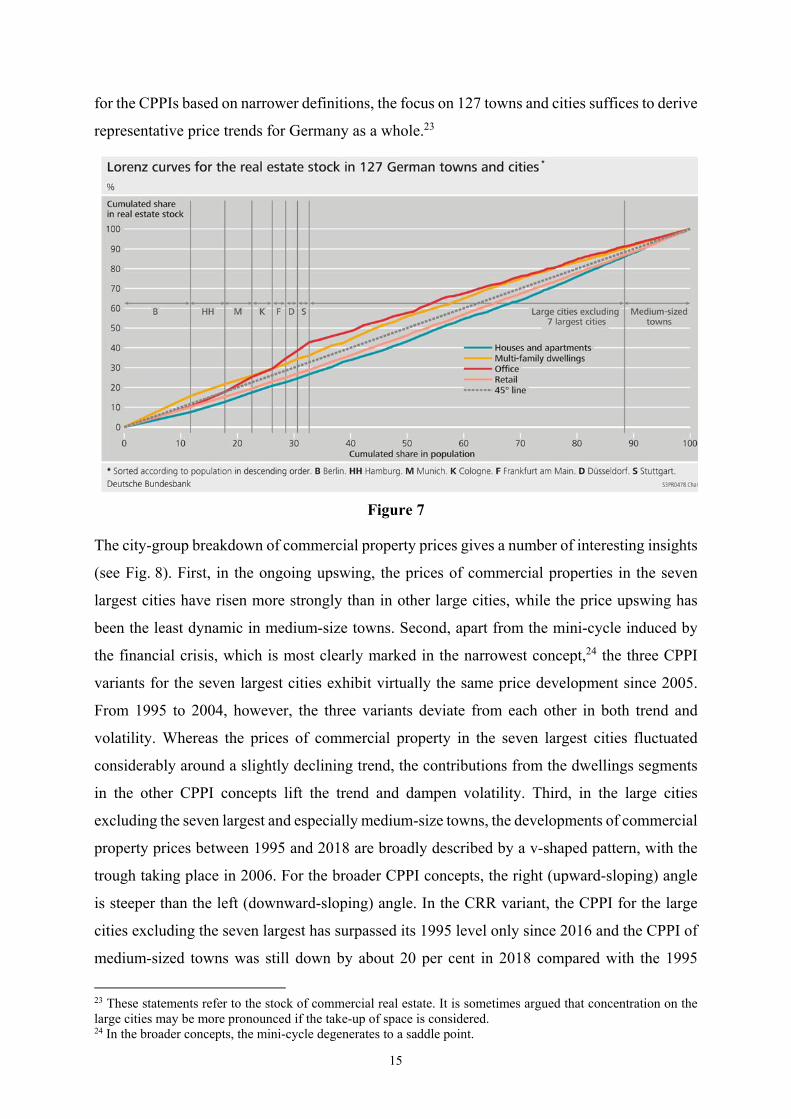
for the CPPIs based on narrower definitions, the focus on 127 towns and cities suffices to derive
representative price trends for Germany as a whole.23
Figure 7
The city-group breakdown of commercial property prices gives a number of interesting insights
(see Fig. 8). First, in the ongoing upswing, the prices of commercial properties in the seven
largest cities have risen more strongly than in other large cities, while the price upswing has
been the least dynamic in medium-size towns. Second, apart from the mini-cycle induced by
the financial crisis, which is most clearly marked in the narrowest concept,24 the three CPPI
variants for the seven largest cities exhibit virtually the same price development since 2005.
From 1995 to 2004, however, the three variants deviate from each other in both trend and
volatility. Whereas the prices of commercial property in the seven largest cities fluctuated
considerably around a slightly declining trend, the contributions from the dwellings segments
in the other CPPI concepts lift the trend and dampen volatility. Third, in the large cities
excluding the seven largest and especially medium-size towns, the developments of commercial
property prices between 1995 and 2018 are broadly described by a v-shaped pattern, with the
trough taking place in 2006. For the broader CPPI concepts, the right (upward-sloping) angle
is steeper than the left (downward-sloping) angle. In the CRR variant, the CPPI for the large
cities excluding the seven largest has surpassed its 1995 level only since 2016 and the CPPI of
medium-sized towns was still down by about 20 per cent in 2018 compared with the 1995
23 These statements refer to the stock of commercial real estate. It is sometimes argued that concentration on the large cities may be more pronounced if the take-up of space is considered. 24 In the broader concepts, the mini-cycle degenerates to a saddle point.
15

figure. Fourth, at least by looking at the dates of cyclical turning points, it turns out that the
price developments in the large cities have a lead of about one year compared with the
remaining towns and cities. This lead appears to be most visible in the office and retail
segments.
Figure 8
16

5 Conclusions In the paper, experimental price indices for German commercial real estate are presented and
compared. The virtue of the compilation here is that the CPPIs, reflecting different definitions
of commercial real estate, are coherent in terms of source data for prices and weighting schemes.
In particular, the appraisals of transaction prices for office and retail structures as well as rental
housing in 127 towns and cities are taken from bulwiengesa and the weighting schemes are
derived from data on the floor space of these object types in 2011. With respect to the various
definitions in use, the main conclusion is that while the CPPIs partly exhibit trends of somewhat
different strength, they are very similar in terms of their general time series properties referring,
for instance, to the timing of turning points and indications with regard to the direction of
change or the change in momentum. In addition, a breakdown into city groups is provided.
From this, it can be concluded that, regardless of which definition is used, cyclical fluctuations
in CPPIs are more pronounced in large cities than in medium-sized towns.
The experimental price indices help users analyse commercial real estate markets in Germany.
However, some caveats have to be mentioned. First, the price data do not cover Germany as a
whole but only 127 towns and cities. The reduced regional coverage is a shortcoming because
the real estate stock is concentrated on large cities to a rather moderate degree and the price
developments of the various object types systematically alter between the more populated and
the rural areas of Germany. Second, with office buildings, retail space and rental housing, the
most important object types are covered. However, at least to some extent, the industrial and
logistics building stock as well as hospitals, hotels, leisure facilities and other structures serving
for business may also be marketable and, thus, to be included in CPPI measurement. Third, the
appraisals collected by bulwiengesa are a second-best solution. Of course, actual transaction
prices would be preferred. However, disaggregate transaction-based price data are not
available.25 Fourth, prices are measured at annual periodicity, while analysts desire price
indices, at least, at a quarterly frequency.
With floor-space data, a stock-based weighting scheme is implemented. With regard to
definitions of commercial real estate which require properties to be distinguished according to
use and legal status of the owner, price indices can only be based on stock weights. The 2011
census provides an optimal source to derive city-level floor space of rental housing. The city-
level floor space of office buildings is taken from a private source and the city-level floor space
25 The vdp CPPIs are compiled on the basis of granular transaction prices. The source data, however, are exclusive to those who construct the price indices.
17

is estimated using official NUTS 2 level data and population figures. Hence, the quality of the
stock weighting schemes would be improved if the census were to be extended to non-
residential real estate. A transaction-based weighting, which is often regarded as the first-best
solution, is currently not implementable because the data available on the number of non-
residential transactions cannot be broken down to a sufficient degree.
By disclosing the current data limits for CPPI compilation, the paper may be of interest for
those people who work on establishing a framework for enhancing the source data for official
CPPI measurement. Given that macroprudential monitoring demands data of the highest
quality, this is the ultimate target that should be pursued despite the short-run and medium-run
efforts which are aimed at bridging the information gap with pragmatic intermediate solutions.
18

References Bank for International Settlements (2019) Mind the data gap: commercial property prices for
policy, IFC Report, March 2019.
Dechent, J. (2011) Preisindizes für Wohnimmobilien: Neues Lieferprogramm,
Wägungsschema und Ergebnisse für 2010, Wirtschaft und Statistik, November 2011, 1126-
1134.
Dechent, J. and S. Ritzheim (2012) Preisindizes für Wohnimmobilien: Ergebnisse für 2011 und
Einführung eines Online-Erhebungsverfahrens, Wirtschaft und Statistik, Oktober 2012, 891-
897.
Deutsche Bundesbank (2003) Price indicators for the housing market, Monthly Report,
September 2003, 45-58.
Deutsche Bundesbank (2013a) Commercial property prices in Germany: conceptual
considerations and statistical status quo, Monthly Report, May 2013, 53-55.
Deutsche Bundesbank (2013b) The determinants and regional dependencies of house price
increases since 2010, Monthly Report, October 2013, 13-29.
Diewert, W. E. and C. Shimizu (2015) A conceptual framework for commercial property price
indexes, Journal of Statistical Science and Application 3, 9-10, 131-152.
European Central Bank (2009) Housing finance in the euro area, Occasional Paper 101, March
2009.
European Union (2013) European system of accounts ESA 2010, Luxembourg: Publication
Service of the European Union.
European Union (2013) Regulation (EU) No 575/2013 of the European Parliament and of the
Council on prudential requirements for credit institutions and investment firms and
amending Regulation (EU) No 648/2012 (“Capital Requirements Regulation”, CRR).
European Systemic Risk Board (2015) Report on commercial real estate and financial stability
in the EU, December 2015.
European Systemic Risk Board (2016) Recommendation of the European Systemic Risk Board
on closing real estate data gaps (ESRB/2016/14), 31 October 2016 (“ESRB
Recommendation”).
19
European Systemic Risk Board (2018) Report on vulnerabilities in the EU commercial real
estate sector, November 2018.
European Systemic Risk Board (2019) Recommendation of the European Systemic Risk Board
amending Recommendation ESRB/2016/14 on closing real estate data gaps (ESRB/2019/3),
21 March 2019.
Eurostat (2017) Commercial property price indicators: sources, methods and issues, 2017
edition, Luxembourg: Publication Service of the European Union.
Harding, D. and A. Pagan (2002) Dissecting the cycle: A methodological investigation, Journal
of Monetary Economics 49, 2, 365-381.
International Monetary Fund and Financial Stability Board (2019) G20 Data Gaps Initiative
(DGI-2) The Fourth Progress Report – Countdown to 2021, October 2019.
Jordà, O., K. Knoll, D. Kuvshinov, M. Schularick and A. M. Taylor (2019) The rate of return
on everything, 1870-2015, Quarterly Journal of Economics 134, 3, 1225-1298.
Knetsch, T. A., C. Schlitzer and E. Triebskorn (2019) The rationale behind a multi-indicator
approach to real estate price analysis, mimeo.
Knoll, K., M. Schularick and T. M. Steger (2017) No prices like home: Global house prices,
1870-2012, American Economic Review 107, 331-352.
Leifer, H.-A. (2004) Preisindikatoren für Wohnimmobilien in Deutschland, Allgemeines
Statistisches Archiv 88, 435-450.
Lorenz, M. O. (1905) Methods of measuring the concentration of wealth, Publications of the
American Statistical Association 9, 209-219.
Schirwitz, B. (2009) A comprehensive German business cycle chronology, Empirical
Economics 37, 287-301.
Silver, M. (2013) Understanding commercial property price indexes, World Economics 14, 3,
October 2013.
Zentraler Immobilien Ausschuss (2016) Strukturierung des sachlichen Teilmarktes
wirtschaftlich genutzter Immobilien für die Zwecke der Marktbeobachtung und
Wertermittlung, 1. Ergebnisbericht, August 2016.
20

Zentraler Immobilien Ausschuss (2019) Strukturierung des sachlichen Teilmarktes
wirtschaftlich genutzter Immobilien für die Zwecke der Marktbeobachtung und
Wertermittlung, 2. Ergebnisbericht, September 2019.
21

Appendix Table 1: Annual CPPI changes
22

Table 2: Peaks and troughs in CPPIs using the detection method building on Harding and Pagan (2002)
23