Embed Size (px)
Citation preview
COMPILATION OF WATER RESOURCES DEVELOPMENT AND
HYDROLOGIC DATA OF SAIPAN, MARIANA ISLANDS
By Otto van der Brug
U.S. GEOLOGICAL SURVEY
Water-Resources Investigations Report
Prepared in cooperation with the
COMMONWEALTH OF THE NORTHERN MARIANA ISLANDS
Honolulu, Hawaii
March 1985
UNITED STATES DEPARTMENT OF THE INTERIOR
WILLIAM P. CLARK, Secretary
GEOLOGICAL SURVEY
Dallas L. Peck, Director
For additional information
write to:
Distr ict Chief
U.S. Geological Survey, WRD
Rm. 6110, 300 Ala Moana Blvd.
Honolulu, Hawaii 96850
Copies of this report
can be purchased from:
Open-File Services Section
Western Distribution Branch
U.S. Geological Survey
Box 25425, Federal Center
Denver, Colorado 80225
(Telephone: [303] 234-5888)
CONTENTS
Page
MDstract _________________ « iIntroduction ------- -___-____-____-____-____- ____ ___ _______ 2
Cooperation - 2Purpose and scope ------- _--___--_ ____________ ______ __ 2Geographic setting - - - 3Historical development --- ---- ---- --- --- ___________ 3fQQ (J | £} ^ lOn "- » " " " " » " "' " » " " - » " " " » "' - -» ' Q
Previous investigations ---- _-__-_--_-_--_ __________________ 7Acknowledgments - -- -- ------------------------------------ 7
£Anora1 _-____________ _______..__..________________________________ ftoci i c I a i uRaln-Fal1 _________________________________________________________ ftr\o i 11 I a I I uEvaporation ------ - -- --- __________ ___________ _______ -j -j
Water resources - - -- 15f_* __l "% A » O I _»M_»«»_»_»_»_»«»_»_»-»_»_»_»_-i_»M-»_»-H _»MM-H _-i_»-H M-H -H _»MM-H -H _-i-H M-H -H -H -H M-HW -H -H M-H -H _»-H M_»-H _»-H 1Cocncra i -.-.-.-.-.-.-.-.-. * * ~~ ~ ~ ~ * + * ~> * | pSurface water - - 15
General --------- -__-_-____-__ -___ _ ___ ____ ___ 15Streamflow characteristics - --- -- _-____--_-_--_-- 20
Runoff-rainfal1 comparison ---- _-_________-____-__-- 20Flow-duration curves - 20Low-flow frequency curves -- ------ _--_-_-__-- _-- 23High-flow frequency curves - 23
Correlation between partial-record and continuous-record 23Lake Susupe - - - - 23^ Q f~ | f|Q5 « "« « "-» "-» *-»« « «»« -» -»«-'« « « « « « « « .JO
Ground water - 39*ar=s 1 __________ __ _ ____ ____________ ___ __ ____________ 3Qtf O I J^j
ie _____________________________________ _ __ ____________ L.9I o "t.
Water quality ---- ________ ________._._- _______________ __ 5-)Water production -------- ______ __________ _____________ _ _. 55
Production wells -------- - _____________ _ ________________ 55Reservoirs ------------ ________ _ ______ ___ _ ___________ 50Water distribution ---------------- ___________ _________________ 53
We I I Q3 co " " " " * " -» " » « " " »-» " " " » "« "-»« « O /
Southern Saipan ------- _____________________ ________________ 53I 5 I GV i I c I Q « » " " "-»« "« « « « « « "« « « « « « -»« /i
Kobler Field 138Dandan and San Vicente-Papago area - 201
L/ a llQ a M « » * » " " » "» " " » "« "« « «»» "« « « « _uU^
San Vicente-Papago - - - - 234rt|\yclK. " "" " "- " " " " " " - " - - " - - - - - -^ £-5 I
Chacha, Hakmang ----------------------------------------- ___-_West coast areas ---- ______ __ ______ _.__ _ ______
I onopoO " - " " " " - " " " ""-' "" "" "-'" " " -»«^ _5*rO
Puerto Rico - - 356iiou i i v «"«" "«"«"«"«««»«" »«"« «" » »« « « « -»« « « -»* -»
V3 (J Ci I U I\Q| """ """ -»-»-»-» WH_ H_ H_ M(H_ H_ H_ H_ M(H_ H_ H_ H_ M(H_ im -» _, « - ^g, ._ _, ._, _, (l_)(_a(_a<_a(_a(l_)<_, (_a<_a(_a(l_)(_a
Northern Saipan ---- --_-__-_ _______________ _______________Miscellaneous sites --------------------------- _______________ 462
i i i
CONTENTS
Page
Other hydrologic data 484Rainfall data 486Streamflow records --- - - - ---- ------ __________ 522
Gaging stations - - - --- -- - - --- ------- 522Low-flow partial-record stations - -- -- ----- - 539Miscellaneous discharge measurements 545
Springs 546Chemical analyses of ground water ---- - -- - 567
References 575
ILLUSTRATIONS
Figure
1. Map showing location of Saipan - - -- --- - - 42. Map of the island of Saipan -- --- - -- - - -- 53. Map showing location of rain gages -- - - -- 104. Graph showing comparison of streamflow, springflow,
and rainfall on Saipan and pan evaporation on Guam 135. Map showing location of surface-water and spring-water
data-collection sites ---- _ - - --- - - 176. Graph showing flow-duration curves for
continuous-record stations -- - --- _______ 227.-9. Graphs showing magnitudes and frequencies of
lowest mean discharges for duration indicated of the following streams:7. Denni Spring, 1972-79 248. South Fork Talufofo Stream, 1972-79 259. Middle Fork Talufofo Stream, 1972-79 26
10.-11. Graphs showing magnitudes and frequencies ofhighest mean discharges for duration indicated of the following streams:10. South Fork Talufofo Stream 2711. Middle Fork Talufofo Stream 28
12.-13. Graphs showing correlations between discharges at the following locations:12. Hasngot Stream and Middle Fork Talufofo Stream 3013. Talufofo Stream and Middle Fork Talufofo Stream 31
14. Graph showing water level of Lake Susupe andrainfall at Isley Field 34
15. Map showing the location of major springs 3816. Map showing areas shown by figures 19, 21-23, 26, 29,
30, 32-34 - - - - - - - 4417. Map showing locations where chemical analyses
of water were made - ---- --- ----- ______ _______ 5418. Map showing the location of water storage reservoirs ---- - 62
IV
LLUSTRATIONS
Figure Page
19. Map showing the location of wells at Isley and Kobler Field 6920. Graph showing chloride concentration of wells at
Kobler Field and rainfall at Isley Field 70 21.-23. Maps showing the location of wells in:
21. Dandan area 20222. San Vicente-Papago area - - - 235 23- Akgak area 252
24.-25. Graph showing water levels in:.24. Well 45, January 1981 to April 1982 25525. Well 31, December 1982 to September 1983 256
26. Map showing the location of wells in Hakmang area ----- --- 31527.-28. Graphs showing water levels in well 78:
27. 1973-75, 1978 - 31628. 1981-83 317
29.-30. Maps showing location of wells in:29. Tanapag area ------------------- ____________ __ 3^930. Puerto Rico and Mau i IV areas 357
31. Graph showing the chloride concentration of wells in theMaui IV area and rainfall at the 9~Mgal reservoir 396
32.-35. Maps showing the location of wells:32. In Gualo Rai area 43533. At Marpi Point 44734. In Northwest Saipan 44835. At miscellaneous sites - - - - 464
TABLES
Table
1. Rainfall records of Saipan - 92. Monthly and annual mean rainfall -- - - 123. Monthly and annual evaporation data for Guam 144. List of surface-water, springflow, and lake-level stations - 165. Average monthly and annual mean discharge in cubic feet
per second and in percentage of total - 196. Runoff-rainfall comparison --------- __-__ ________-__-__- 217. Correlation between discharges at low-flow partial-record
and continuous-record stations - - 298. Chloride concentration and specific conductance of water
from Lake Susupe - - - 329. Monthly and annual maximum, minimum, and mean water
levels of Lake Susupe - - - - - 3310. Chemical analyses of water from Lake Susupe 3511. List of the major springs on Saipan - - 3712. Summary of wells drilled during 1944-45 - - 4513. Summary of wells drilled during 1956-62 47
TABLES
Table Page
14.-16. Summary of testholes and wells drilled during:14. 1969-71 4715. 1977 4816. 1979-80 49
17. Summary of exploratory holes and wells drilled during1981-83 50
18. Summary of chemical analyses of spring, ground,and surface water 52
.19. World Health Organization drinking-water standards 5520. Pumping rates and chloride concentrations of
the water from production wells 5721. Summary of water storage reservoirs - -- 6122. Chloride concentrations of water from reservoirs ---- 64
23.-24. Pumping rates and chloride concentrations of:23. Isley Field wells 7124. Kobler Field wells 73
25.-30. Testholes and wells drilled in the following areas:25. Isley Field 7426. Kobler Field 13827. Dandan 20328. San Vicente-Papago - - - -- 23429. Akgak - 25330. Hakmang 318
31.-33. Wells drilled in the following areas:31. Tanapag -- - ----- - -- 34832. Puerto Rico and As Rapugao 35633. Maui IV 395
34.-36. Wells drilled in the following areas:34. Gualo Rai 43435. Northern Saipan 44536. Garapan 462
37. Wells drilled at miscellaneous sites ;- 463 38.-40. Monthly and annual rainfall at:
38. Garapan, from German sources (1901-12) - 48639. Tanapag, from Japanese sources (1926-41) 48740. Garapan, from Japanese sources (1927-42) 488
41. Monthly rainfall at miscellaneous sites 489 42.-44. Weekly rainfall at:
42. Maui I (1948) 49043. Well 3 (1948) 49144. Capitol Hill (1948) 492
45.-48. Monthly and annual rainfall:45. From U.S. Navy (1954-63) 49346. At U.S. Coast Guard LORAN station (1963-76) 49447. At Agriculture Station (1976-83) 49548. At Communication Center (1968-83) 497
49. Daily rainfall at Communication Center (1976-83) 49850. Monthly and annual rainfall at Isley Field (1977-83) - 50651. Daily rainfall at Isley Field (1977-83) 507
vi
TABLES
Table Page
52. Monthly and annual rainfall at 9-Mgal reservoir (1977-83) 51453. Daily rainfall at 9-Mgal reservoir (1977-83) 51554. Streamflow records for South Fork Talufofo Stream
A. Discharge measurements made prior to beginning ofcontinuous discharge record ___________ --- 522
B. Annual maximum discharge and peak dischargesabove base ----------------- ________________ 523
C. Annual minimum discharges ------- __-- __________ 524D. Monthly and annual discharges 525
55. Instantaneous discharge with water and air temperaturesat South Fork Talufofo Stream 527
56. Streamflow records for Middle Fork Talufofo StreamA. Annual maximum discharge and peak discharges
above base ------------- -- - ----- _____ 531B. Annual minimum discharges -____ _-____-_ - _____ 532C. Monthly and annual discharges ------------------ - 533
57. Instantaneous discharge with water and air temperaturesat Middle Fork Talufofo Stream -- 535
58. Chemical analyses of water from Talufofo Stream ---------- 53859.-61. Discharge measurements and water temperatures:
59. At Hasngot Stream 53960. At North Fork Talufofo Stream 54261. At Talufofo Stream 543
62. Miscellaneous discharge measurements made for floodingof April 12, 1978 5^5
63. Springflow records for Denni SpringA. Annual maximum daily discharges ------------ _____ 545B. Annual minimum daily discharges -- ------------- 550C. Instantaneous discharge with water temperature -- 550 D. Monthly and annual discharges 551
64. Chloride concentration of water from Denni Spring 55465. Chemical analyses of water from Denni Spring ----------- -- 55566. Analysis of water from Denni Spring for metals and pesticides 556
67.-68. Discharge measurements and water temperatures at:67. East Achugao Spring ---------------------------- 56068. West Achugao Spring ---- --------- _______________ 562
69.-73. Chemical analyses of:69. Spring water (1944-45) 56670. Ground water (1944-52) 56771. Maui-type wells (1945-67) 56872. Water from wells 3, 31, 76 (1967) 56973. Water from U.S. Coast Guard well (1971) 570
74. Analyses of ground water for metals and pesticides (1977) 571 75.-77. Chemical analyses of water from wells:
75. 103 and 111 (1982) 57276. 76, 144, 164, 171, (1983) 57377. 148, 149, 150 (1983) 574
VI I
CONVERSION TABLE
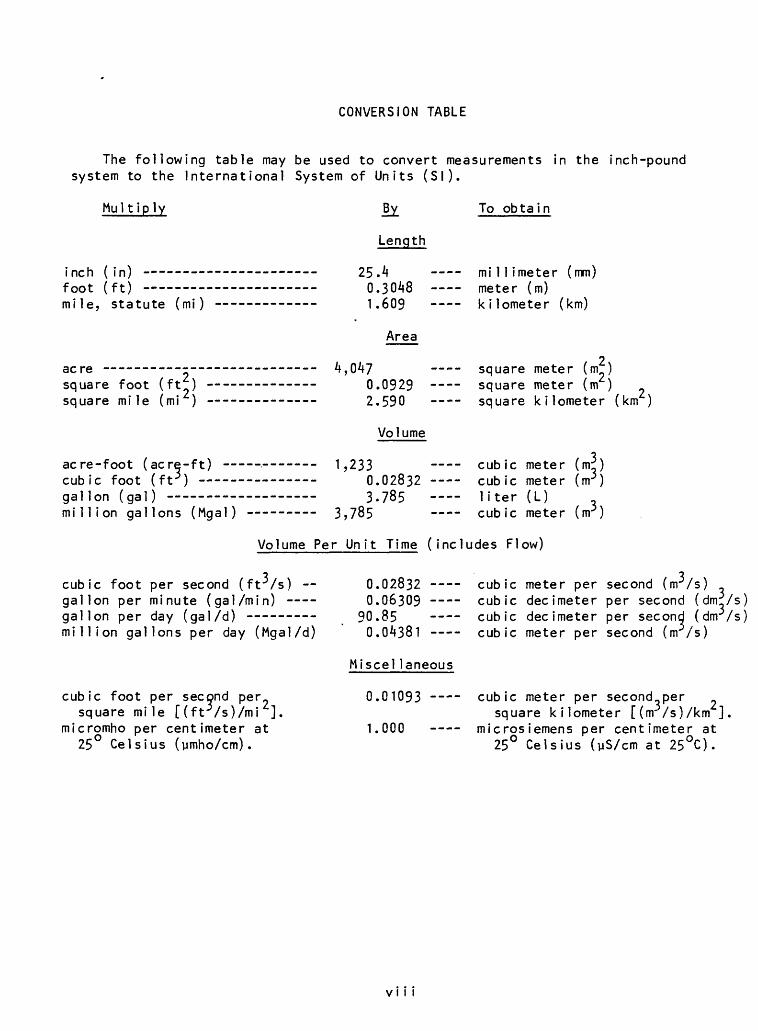
The following table may be used to convert measurements in the inch-pound system to the International System of Units (Si).
Multip ly
inch (in) foot (ft) mile, statute (mi)
Length
25.40.3048 1.609
To obtain
millimeter (mm) meter (m) kilometer (km)
Area
acresquare foot (ft) square mile (mi )
cubic foot (ft gallon (gal)
4,0470.09292.590
Volume
2 -~ square meter (m )
re-ft) .- t 3 ) -
r>e (Mr,*] \ -.
------ 1 ?771 1*-JJ
O n oQ "3 o.UZo3-<i ----
3 "7Q P.705 ______ 7 7ftC
cubic meter cubic meter liter (L)/ iiK I f mc* + ctir
square meter (m) - square kilometer (km )
(nr)
(nr)
Volume Per Unit Time (includes Flow)
cubic foot per second (ffvs) gallon per minute (gal/min) - gallon per day (gal/d) -------million gallons per day (Mgal/d)
cubic foot per second per.square mile [(ft /s)/mi
micromho per centimeter at25 Celsius (umho/cm).
0.02832 0.06309 --
90.85 ----0.04381 -
-3
cubic meter per second (nr/s) cubic decimeter per second (dirc/s) cubic decimeter per second (dm /s) cubic meter per second (m /s)
Miscellaneous
0.01093
1.000
cubic meter per second,per square kilometer [(m/s)/km ]
microsiemens per centimeter at 25° Celsius (yS/cm at 25°C).
VIM
DEFINITION OF TERMS
Water Resources
Acre-foot (acre-ft) is the quantity of water required to cover one acre to a depth of one foot and is equivalent to A3,560 cubic feet or 325,851 gallons.
Contro1 designates a feature downstream from the gage that determines the stage- discharge relation at the gage. This feature may be a natural constriction of the channel, an artificial structure, or a uniform cross section over a long reach of the channel.
-3
Cubic foot per second (ftvs) is the rate of discharge representing a volume of one cubic foot passing a given point during one second and is equivalent to 7.48 gallons per second or 448.8 gallons per minute.
Cubic foot per second day [(ft /s)-d] is the volume of water represented by a flow of one cubic foot per second for 24 hours. It is equivalent to 86,AGO cubic feet, 1.9835 acre-feet, or 646,317 gallons.
Discharge is the volume of water that passes a given point within a given period of time.
Mean discharge (mean) is the arithmetic average of individual daily mean discharges during a specified period.
Instantaneous discharge is the discharge at a particular instant of time. If this discharge is reported instead of the daily mean, the heading of the discharge column in the table is "Discharge".
Dissolved is that material in a representative water sample which passes through a 0.45-um membrane filter.
Dra inage area of a stream at a specific location is that area, measured in a horizontal plane, enclosed by a topographic divide from which direct surface runoff from precipitation normally drains by gravity into the river above the specified point.
Gage height is the water-surface altitude referred to some arbitrary gage datum.
Gaging station is a particular site on a stream where systematic observations of hydrologic data are obtained.
Hardness of water is a physical-chemical characteristic that is commonly recognized by the increased quantity of soap required to produce lather, due to the presence of alkaline earths (principally calcium and magnesium) and is expressed as equivalent calcium carbonate (CaCO?).
Micrograms per liter (ug/L) is a unit expressing the concentration of chemical constituents in solution as mass (micrograms) of solute per unit volume (liter) of water. One thousand micrograms per liter is equivalent to one mi 11igram per 1 i ter.
ix
Mi 11igrams per 1i ter (mg/L) is a unit expressing the concentration of chemical constituents in solution as mass (milligrams) of solute per unit volume (1i ter) of water.
Partial-record station is a particular site where limited streamflow and (or) water-quality data are collected systematically over a period of years for use in hydrologic analyses.
Recurrence interval is the average interval of time within which an event will be equaled or exceeded once.
Runoff in inches is the depth to which the drainage area would be covered if all of the runoff for a given time period were uniformly distributed on it.
Sediment is solid material that originates mostly from disintegrated rocks and is transported by, suspended in, or deposited from water; it includes chemical and biochemical precipitates and decomposed organic material, such as humus. The quantity, characteristics, and cause of the occurrence of sediment in streams are influenced by environmental factors. Some major factors are degree of slope, length of slope, soil characteristics, land usage, and quantity and intensity of precipitation.
Specific conductance is a measure of the ability of water to conduct an electrical current. It is expressed in micromhos per centimeter at 25 C. Specific conductance is related to the type and concentration of ions in solution and can be used for approximating the dissolved-solids content of the water. Commonly, the concentration of dissolved solids (in milligrams per liter) is about 65 percent of the specific conductance (in micromhos). This relationship is not constant from stream to stream, and it may vary in the same source with changes in the composition of the water.
Stage is the water-surface altitude referred to some arbitrary gage datum (gage height).
Stage-discharge relation is the relation between gage height (stage) and volume of water per unit of time, flowing in a channel.
Streamflow is the discharge that occurs in a natural channel. Although the term "discharge" can be applied to the flow of a canal, the word "streamflow" uniquely describes the discharge in a surface stream course. The term "streamflow" is more general than "runoff" as streamflow may be applied to discharge whether or not it is affected by diversion or regulation.
COMPILATION OF WATER RESOURCES DEVELOPMENT AND HYDROLOGIC DATA OF SAIPAN, MARIANA ISLANDS
By Otto van der Brug
ABSTRACT
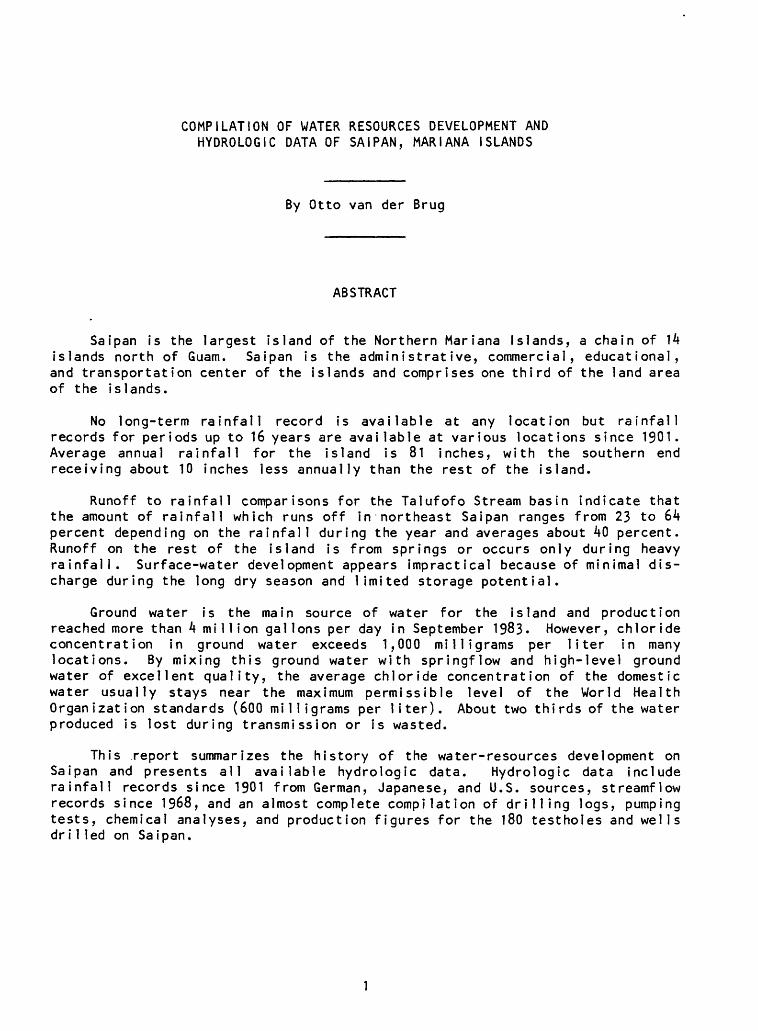
Saipan is the largest island of the Northern Mariana Islands, a chain of 14 islands north of Guam. Saipan is the administrative, commercial, educational, and transportation center of the islands and comprises one third of the land area of the islands.
No long-term rainfall record is available at any location but rainfall records for periods up to 16 years are available at various locations since 1901. Average annual rainfall for the island is 81 inches, with the southern end receiving about 10 inches less annually than the rest of the island.
Runoff to rainfall comparisons for the Talufofo Stream basin indicate that the amount of rainfall which runs off in northeast Saipan ranges from 23 to 64 percent depending on the rainfall during the year and averages about 40 percent. Runoff on the rest of the island is from springs or occurs only during heavy rainfall. Surface-water development appears impractical because of minimal dis charge during the long dry season and limited storage potential.
Ground water is the main source of water for the island and production reached more than 4 million gallons per day in September 1983. However, chloride concentration in ground water exceeds 1,000 milligrams per liter in many locations. By mixing this ground water with springflow and high-level ground water of excellent quality, the average chloride concentration of the domestic water usually stays near the maximum permissible level of the World Health Organization standards (600 milligrams per liter). About two thirds of the water produced is lost during transmission or is wasted.
This report summarizes the history of the water-resources development on Saipan and presents all available hydrologic data. Hydrologic data include rainfall records since 1901 from German, Japanese, and U.S. sources, streamflow records since 1968, and an almost complete compilation of drilling logs, pumping tests, chemical analyses, and production figures for the 180 testholes and wells dri1 led on Saipan.
NTRODUCTION
Cooperat ion
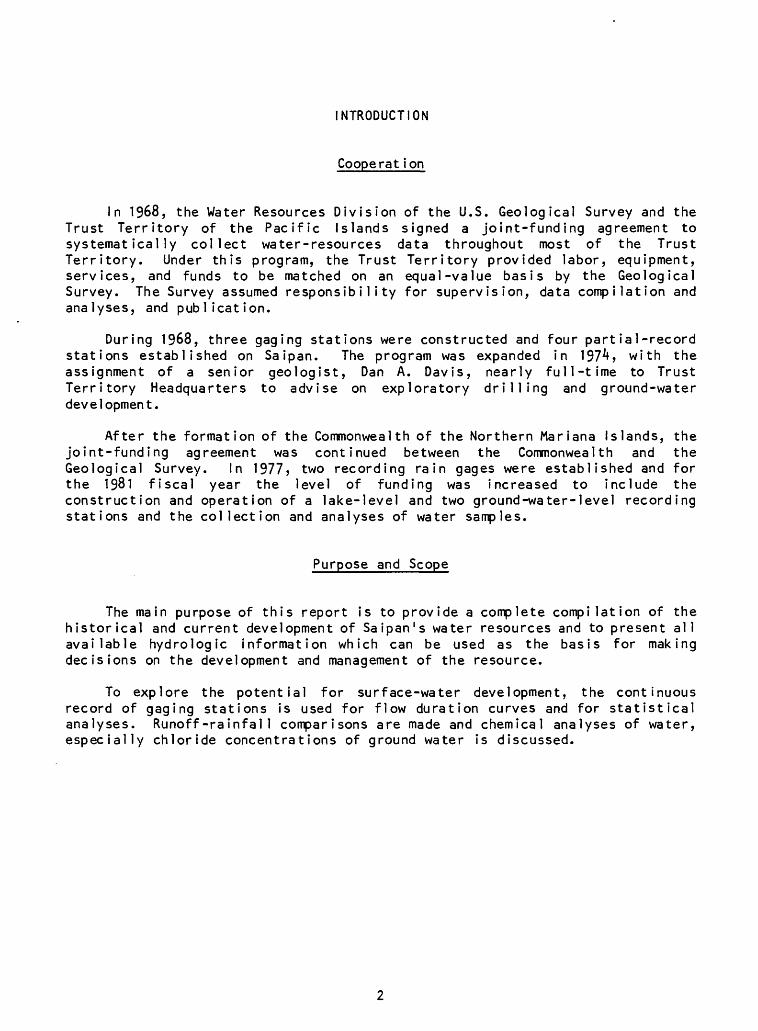
In 1968, the Water Resources Division of the U.S. Geological Survey and the Trust Territory of the Pacific Islands signed a joint-funding agreement to systematically collect water-resources data throughout most of the Trust Territory. Under this program, the Trust Territory provided labor, equipment, services, and funds to be matched on an equal-value basis by the Geological Survey. The Survey assumed responsibility for supervision, data compilation and analyses, and publication.
During 1968, three gaging stations were constructed and four partial-record stations established on Saipan. The program was expanded in 197^? with the assignment of a senior geologist, Dan A. Davis, nearly full-time to Trust Territory Headquarters to advise on exploratory drilling and ground-water development.
After the formation of the Commonwealth of the Northern Mariana Islands, the joint-funding agreement was continued between the Commonwealth and the Geological Survey. In 1977, two recording rain gages were established and for the 1981 fiscal year the level of funding was increased to include the construction and operation of a lake-level and two ground-water-level recording stations and the collection and analyses of water samples.
Purpose and Scope
The main purpose of this report is to provide a complete compilation of the historical and current development of Saipan's water resources and to present all available hydrologic information which can be used as the basis for making decisions on the development and management of the resource.
To explore the potential for surface-water development, the continuous record of gaging stations is used for flow duration curves and for statistical analyses. Runoff-rainfal1 comparisons are made and chemical analyses of water, especially chloride concentrations of ground water is discussed.
Geographic Setting
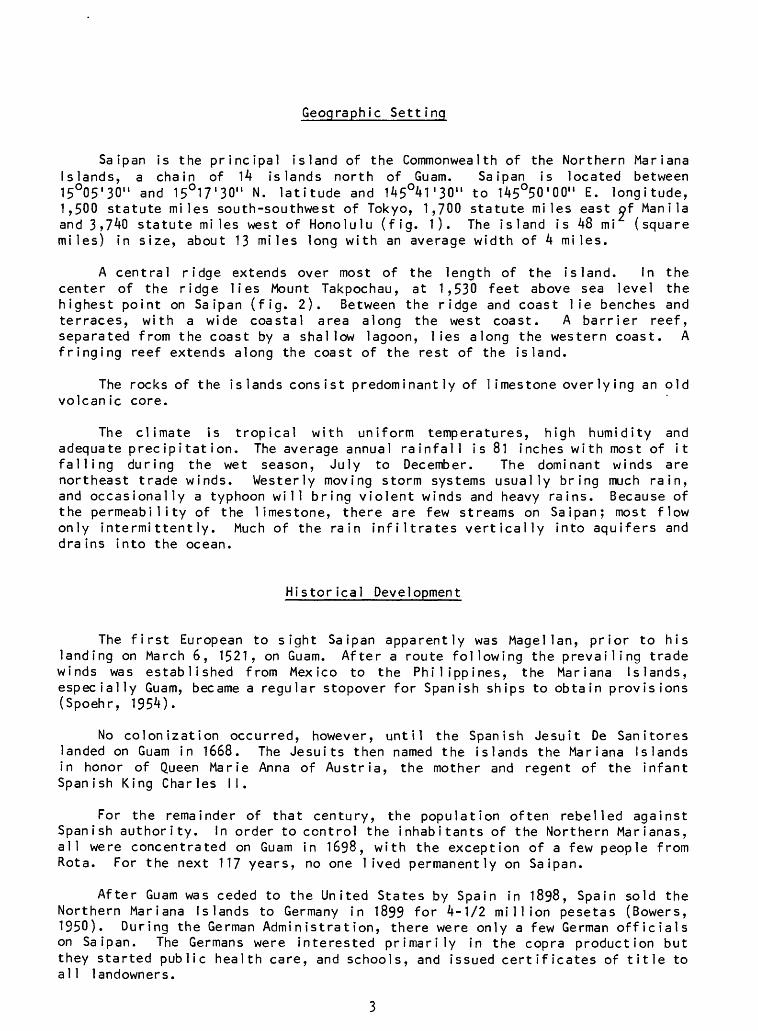
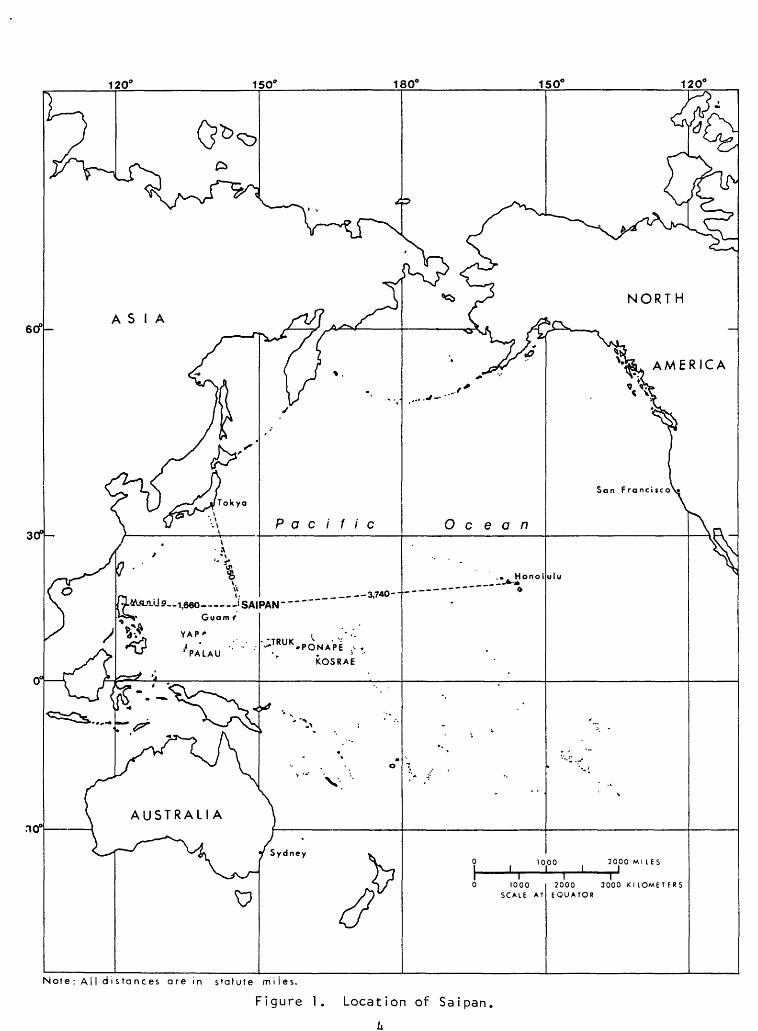
Saipan is the principal island of the Commonwealth of the Northern Mariana Islands, a chain of 14 islands north of Guam. Saipan is located between 15°05'30" and 15°17'30" N. latitude and 145°^1'30" to 145°50'00" E. longitude, 1,500 statute miles south-southwest of Tokyo, 1,700 statute miles east of Manila and 3>740 statute miles west of Honolulu (fig. 1). The island is 48 mi (square miles) in size, about 13 miles long with an average width of 4 miles.
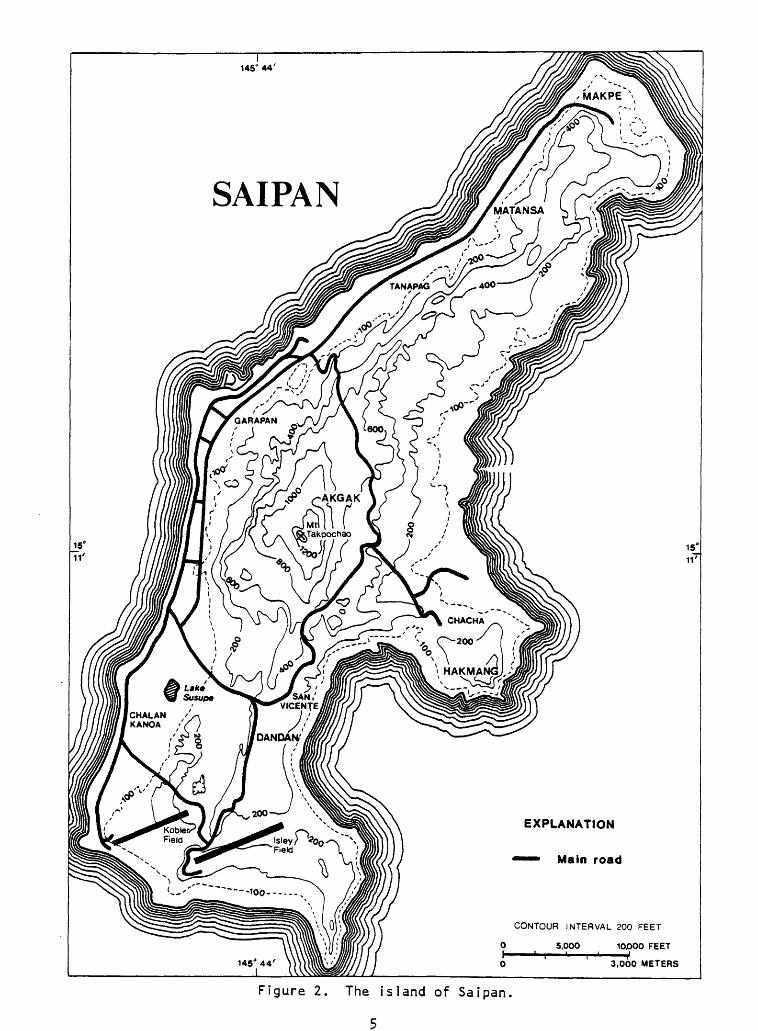
A central ridge extends over most of the length of the island. In the center of the ridge lies Mount Takpochau, at 1,530 feet above sea level the highest point on Saipan (fig. 2). Between the ridge and coast lie benches and terraces, with a wide coastal area along the west coast. A barrier reef, separated from the coast by a shallow lagoon, lies along the western coast. A fringing reef extends along the coast of the rest of the island.
The rocks of the is lands cons i st predominantly of 1imestone overly ing an old volcanic core.
The climate is tropical with uniform temperatures, high humidity and adequate precipitation. The average annual rainfall is 81 inches with most of it falling during the wet season, July to December. The dominant winds are northeast trade winds. Westerly moving storm systems usually bring much rain, and occasionally a typhoon will bring violent winds and heavy rains. Because of the permeability of the limestone, there are few streams on Saipan; most flow only intermittently. Much of the rain infiltrates vertically into aquifers and drains into the ocean.
Historical Development
The first European to sight Saipan apparently was Magellan, prior to his landing on March 6, 1521, on Guam. After a route following the prevailing trade winds was established from Mexico to the Philippines, the Mariana Islands, especially Guam, became a regular stopover for Spanish ships to obtain provisions (Spoehr, 195*0-
No colonization occurred, however, until the Spanish Jesuit De Sanitores landed on Guam in 1668. The Jesuits then named the islands the Mariana Islands in honor of Queen Marie Anna of Austria, the mother and regent of the infant Spanish King Charles II.
For the remainder of that century, the population often rebelled against Spanish authority. In order to control the inhabitants of the Northern Marianas, all were concentrated on Guam in 1698, with the exception of a few people from Rota. For the next 117 years, no one lived permanently on Saipan.
After Guam was ceded to the United States by Spain in 1898, Spain sold the Northern Mariana Islands to Germany in 1899 for 4-1/2 million pesetas (Bowers, 1950). During the German Administration, there were only a few German officials on Saipan. The Germans were interested primarily in the copra production but they started public health care, and schools, and issued certificates of title to al1 landowners.
3
120fl 150° 180° 150° 120°
I I I1000 2000 3000 KILOMETERS
SCALE AT EQUATOR
Note: All distances are in statute miles.
Figure 1. Location of Saipan.
Zi
CONTOUR INTERVAL 200 FEET
0 5,000 10,000 FEET
Figure 2. The island of Saipan.
5
Shortly after the outbreak of World War I, the Japanese Navy occupied all German-held islands and after the end of the war, Japan received a mandate over the islands from the League of Nations. On Saipan, the Japanese cleared most of the arable land for agriculture, mainly sugarcane. Many Japanese settled on Saipan and when the American Forces landed during World War II, there were about 29,000 Japanese troops stationed on Saipan. During the fighting, 3,426 Americans and about 25,000 Japanese soldiers lost their lives (Pacific Island yearbook, 1978).
After the end of World War II, all Japanese were repatriated. The island was administered by the U.S. Navy from 1946 to 1961, except for 1951-52, when the Department of the Interior was the Administrator. After 1961, the administration was resumed by the Interior Department until the Commonwealth of the Northern Mariana Islands was established in 1978.
Population
An estimate of the population of Saipan in 1521, when the first Europeans landed on Guam, was 11,000 (Hawaii Architects and Engineers, 1968). In 1668, the population of all the Mariana Islands was estimated at 100,000 by De Savitores. This figure seems high and 50,000 appears more likely (Spoehr, 1954). Von Kotzebue (1821) estimated the population at 40,000. The first census in 1710, after all of the Chamorros had been moved to Guam in 1698, listed a total Chamorro population of 3,197 to 3,678, depending on the source of information. In 1790, only 1,639 full-blooded Chamoros and 1,825 Chamorros of mixed blood were reported (Oliver, 1961). In 1815, about 200 Carolinians from the Truk District sailed to Guam after their islands had been devastated by a typhoon and were given permission to settle on Saipan (U.S. Navy Department, 1944). More migrated later and in the middle of the 19th century, the Spaniards allowed Chamorros from Guam to move to the Northern Mariana Islands. In 1889, 849 people were reported living in Saipan's only town, Garapan, two-thirds of them Carolinians (Spoehr, 1954).
During the German administration, the population increased from 2,102 (1,330 Chamorros) to 3,110 (1,920 Chamorros) owing to a high birth rate and migration from Guam. Soon after the Japanese occupied the islands, the local population was outnumbered by Japanese settlers. In 1936, the local population numbered 3,222 and the Japanese, 20,293, with almost all of the local population and almost half of the Japanese residing in Garapan (Reyes, undated). After the Japanese were repatriated following the end of World War II, 4,462 people remained on Saipan with more than half under the age of 15 (Bryan, 1946). Since then, the population increased rapidly; 6,654 in 1958, 9,035 in 1967, 11,833 in 1973 (Trust Territory Census, in M. and E. Pacific, 1978), and 14,585 in 1980 (U.S. Army Corps of Engineers, 1981). At present, in 1983, there are more than 15,000 people living on Saipan and the population is expected to continue growing at an annual rate of 3-4 percent.
Previous Investigations
A large number of scientific studies and observations have been made on Saipan, starting with a Spanish expedition in 1792. A complete listing of all studies made on the island, prior to 1956, is given in U.S. Geological Survey Professional Paper 280A (Cloud and others, 1956, p. 9-15).
Probably the major scientific publication since 1956 is the Military Geology of Saipan in three volumes. Volume 2 discusses the water resources of Saipan (Davis, 1958).
Since 1956, a dozen consultant firms have studied various aspects of the water problems of Saipan. Their publications are listed under "References".
Acknowledgments
Throughout the years of joint funding of the program beginning in 1968, the cooperation from officials of the Trust Territory of the Pacific and the Commonwealth of the Northern Mariana Islands has been invaluable.
Special acknowledgments are made to Governors Carlos S. Camacho and Pedro P. Tenorio and their staffs, Lt. Governor Pedro A. Tenorio, the Directors of Public Works, especially Antonio C. Tenorio, David M. Atalig, and John C. Pangelinan, and the personnel of Public Works, especially Gregorio G. Demapan and Epi Cabrera. Most of the field work on Saipan has been done by Leonardo D. L. G. Camacho, 1968-72; Jose R. Lizama, 1972-80; and Antony B. Camacho, 1980- 83.
CLIMATE
General
The climate of Saipan is uniformly warm and humid throughout most of the year. Afternoon temperatures are normally about 30°C and nighttime temperatures are around 20°C. Relative humidity is usually about 70 percent in the afternoon and 90 percent at night.
There are two main seasons on Saipan and these are defined by the amount of rainfall. The dry season normally lasts from December to June, the wet season from July to November. Mean annual rainfall is 81 inches, with two-thirds of the rain falling during July to November.
Saipan lies in the path of typhoons spawned in the Western Pacific and moving west or northwest towards the Philippines or Japan. On April 30, 1963, typhoon Olive moved directly over Saipan, damaging 95 percent of the homes. The most destructive typhoon to hit Saipan since World War II was typhoon Jean, which passed directly over the island on April 11, 1968. At the U.S. Coast Guard weather station, winds of 115 mi/h (miles per hour) were recorded until the instruments failed and the Loran tower, designed to withstand 200 mi/h winds, was toppled. Ninety percent of the homes were destroyed.
The largest amount of rainfall recorded on Saipan occurred during typhoon Carmen, when 44-1/2 inches of rain were recorded at the Hakmang (Kagman) rain gage in 48 hours during August 10-12, 1978.
The dominant winds on Saipan are trade winds blowing from the east or northeast.
Rainfal1
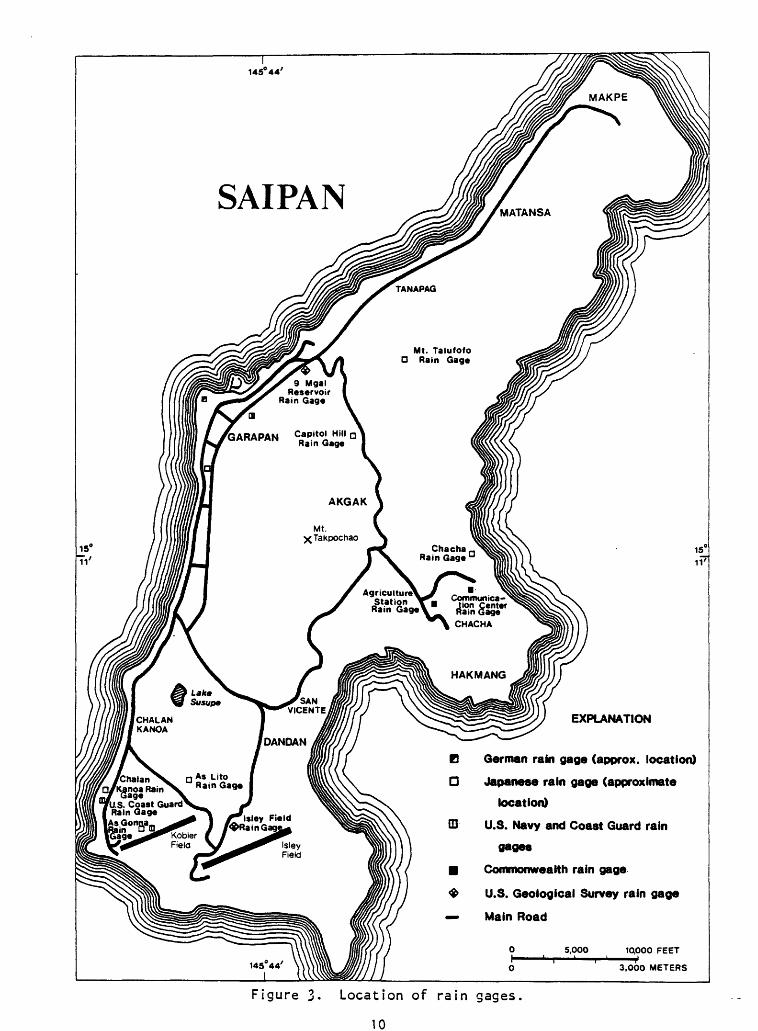
Rainfall records for Saipan are available for most of the years since 1901 from German, Japanese, and U.S. sources (table 1, fig. 3). During the German Administration, rainfall data were collected from 1901-12 and the Japanese collected rainfall records at seven locations during 1924-42. Apparently there is some confusion about their locations. The location of the Japanese station at Garapan, for instance, was called Southwest Lowlands by Cloud (1956) and Garapan by Cox (1956) and Taylor (1973), but Taylor gives a latitude and a longitude of Kobler Field (As Gonna).
After World War II, some rainfall data were collected for short periods prior to 1954. The U.S. Weather Bureau published rainfall records collected by the U.S. Navy during 1954-63 and records collected by the U.S. Coast Guard during 1963-76. Taylor (1973), gives a rainfall table for 1927-72 but the table is a combination of rainfall from different sources at several locations.
Since 1968, daily rainfall data have been collected by the Commonwealth of the Mariana Islands at Hakmang Communication Center and since 1976, at the nearby Agriculture Station. The U.S. Geological Survey has collected continuous records of rainfall since 1977 at the 9-Mgal (million gallon) reservoir and at I siey Field.
8
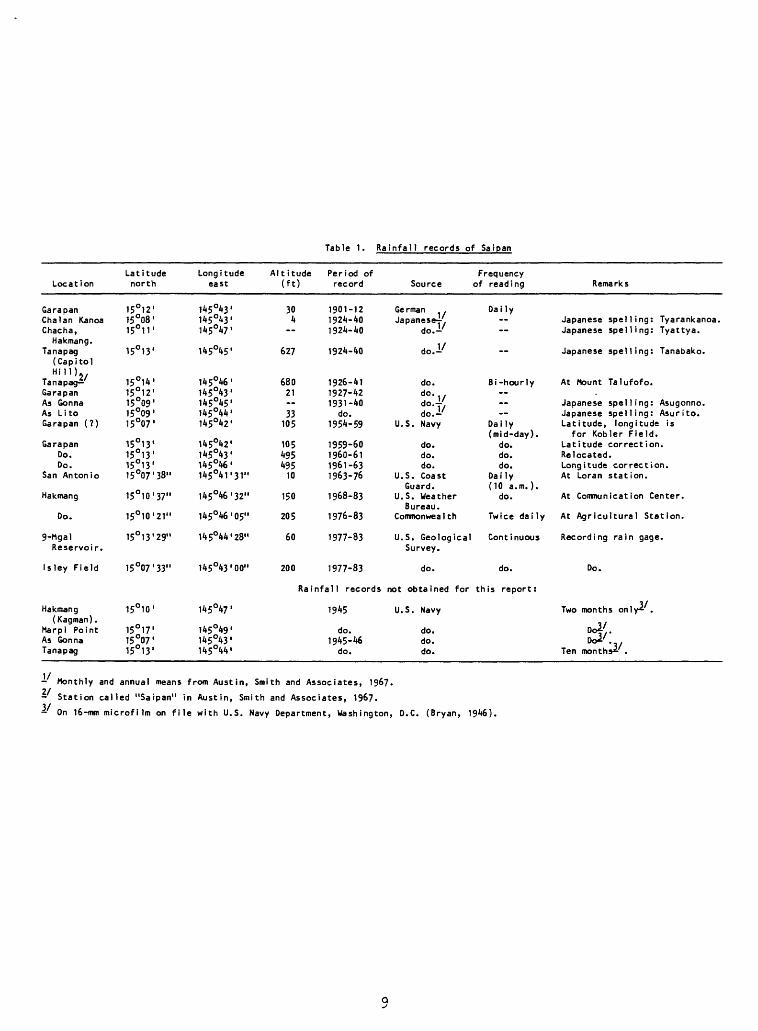
Table 1. Rainfall records of Saipan
Location
GarapanChalan KanoaChacha,
Hakmang.Tanapag
(CapitolHill)*.
Tanapag GarapanAs GonnaAs Li toGarapan (?)
GarapanDo.Do.
San Antonio
Hakmang
Do.
9-MgalReservoir.
Isley Field
Latitude north
15°12'15°08'15°11'
15°13'
15°14'15°12'15°09'15°09'15°07'
15°13'15°13'15°13'
15 07 '38"
15 0 10'37"
15 0 10'21"
15°13'29"
15°07'33"
Longitude east
145°43'145°43'145°47'
145°45'
145°46'145°43'145°45'145°44'145°42'
145°42'145°43'145°46'145°4T31JI
145°46'32"
145°46'05"
145044'28"
145°43'00"
Altitude (ft)
304
62?
68021--
33105
105495495
10
150
205
60
200
Period of record
1901-121924-401924-40
1924-40
1926-411927-421931-40
do.1954-59
1959-601960-611961-631963-76
1968-83
1976-83
1977-83
1977-83
Rainfall records
Hakmang(Kagman) .
Marpi PointAs GonnaTanapag
15°10'
15°17'I5°07'15°13'
145°47 '
,45049.145°43*145°44'
1945
do.1945-46
do.
Source
German .Japanese-^
do.-!-'
do.l/
do.dodo-T/do.-'
U.S. Navy
do.do.do.
U.S. CoastGuard.
U.S. WeatherBureau.
Commonwealth
U.S. GeologicalSurvey.
do.
not obtained for
U.S. Navy
do.do.do.
Frequency of reading
Dai ly «
Bi-hourly «
Daily(mid-day).
do.do.do.
Daily(10 a.m.).
do.
Twice daily
Cont inuous
do.
this report:
Remarks
Japanese spelling: Tyarankanoa.Japanese spelling: Tyattya.
Japanese spelling: Tanabako.
At Mount Talufofo.
Japanese spelling: Asugonno.Japanese spelling: Asurito.Latitude, longitude is
for Kobler Field.Latitude correction.Relocated.Longitude correction.At Loran station.
At Communication Center.
At Agricultural Station.
Recording rain gage.
Do.
Two months only*- .
Hoi'.** »
Ten months^ .
- Monthly and annual means from Austin, Smith and Associates, 1967.
- Station called "Saipan" in Austin, Smith and Associates, 1967.
- On 16-mm microfilm on file with U.S. Navy Department, Washington, D.C. (Bryan, 1946).
Mt. Talufofo 0 Rain Gage
9 Mgal Reservoir
Rain Gage
Capitol Hill Rain Gage
Chacha _ Rain Gage u
Agriculture Station Rain Gage
Communica- ion Cent* ain Gage
CHACHA
EXPLANATION
German rain gage (approx. location)
Japanese rain gage (approximate
location)
U.S. Navy and Coast Guard rain
gages
Commonwealth rain gage
U.S. Geological Survey rain gage
Main Road
n As Lito Rain Gage
ChalanKanoa Rain Gage
.S. Coast Guard Gage
Figure 3« Location of rain gages.
10
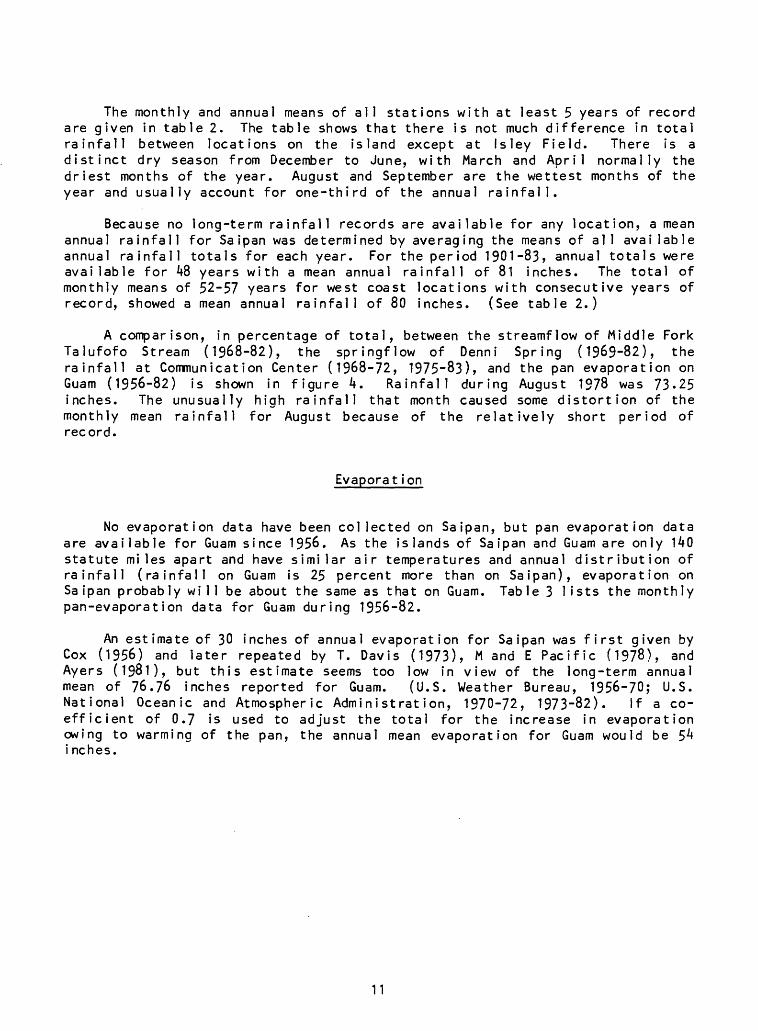
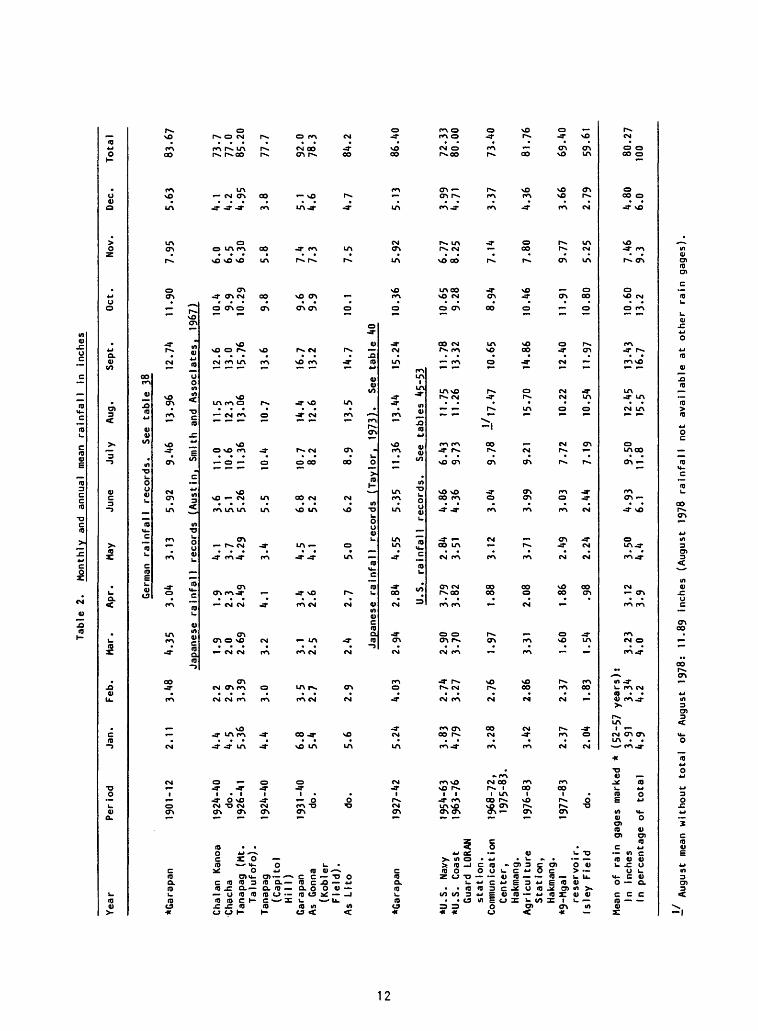
The monthly and annual means of all stations with at least 5 years of record are given in table 2. The table shows that there is not much difference in total rainfall between locations on the island except at Isley Field. There is a distinct dry season from December to June, with March and April normally the driest months of the year. August and September are the wettest months of the year and usually account for one-third of the annual rainfall.
Because no long-term rainfall records are available for any location, a mean annual rainfall for Saipan was determined by averaging the means of all available annual rainfall totals for each year. For the period 1901-83, annual totals were available for 48 years with a mean annual rainfall of 81 inches. The total of monthly means of 52-57 years for west coast locations with consecutive years of record, showed a mean annual rainfall of 80 inches. (See table 2.)
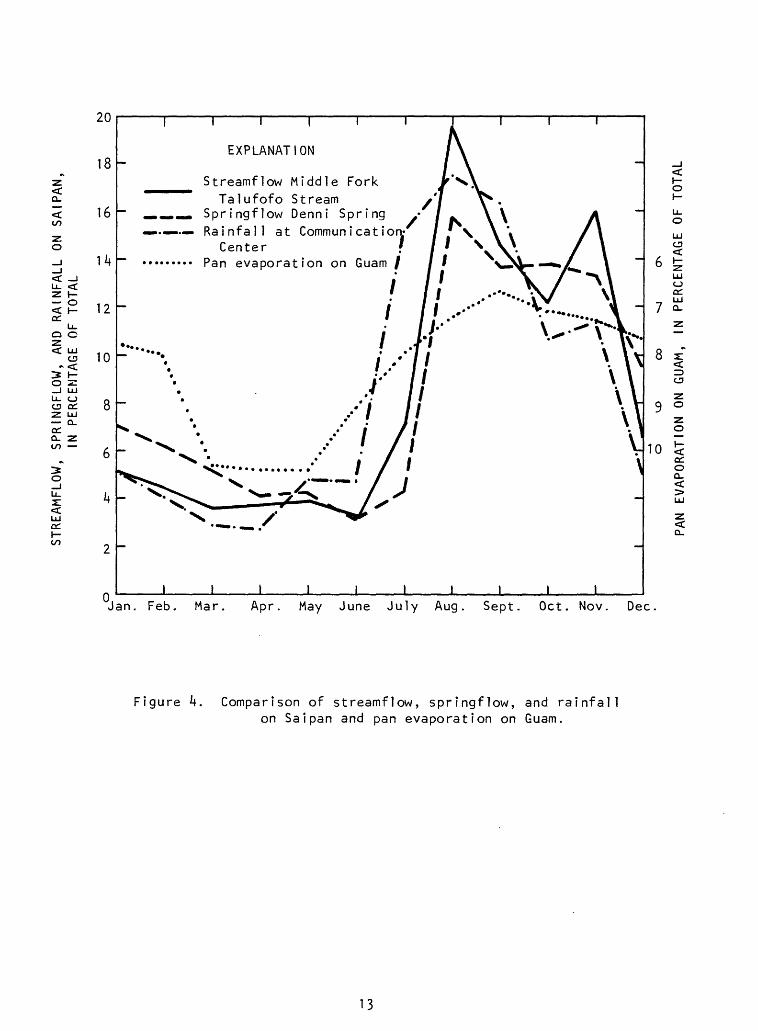
A comparison, in percentage of total, between the streamflow of Middle Fork Talufofo Stream (1968-82), the springflow of Denni Spring (1969-82), the rainfall at Communication Center (1968-72, 1975-83), and the pan evaporation on Guam (1956-82) is shown in figure 4. Rainfall during August 1978 was 73.25 inches. The unusually high rainfall that month caused some distortion of the monthly mean rainfall for August because of the relatively short period of record.
Evaporat ion
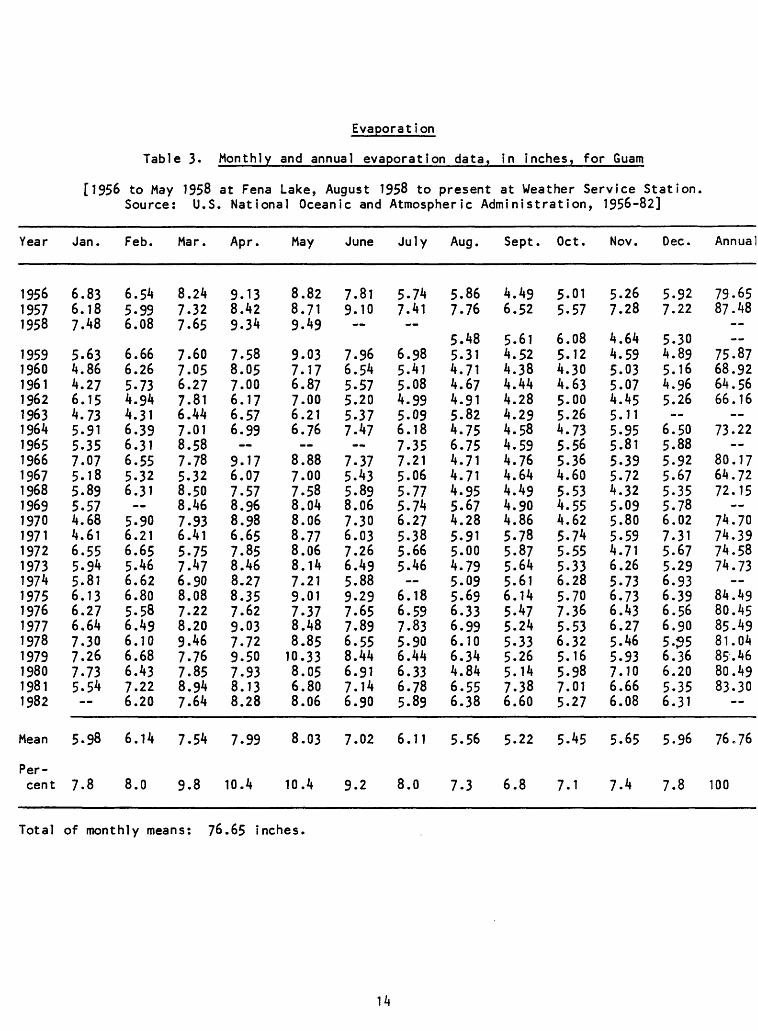
No evaporation data have been collected on Saipan, but pan evaporation data are available for Guam since 1956. As the islands of Saipan and Guam are only 140 statute miles apart and have similar air temperatures and annual distribution of rainfall (rainfall on Guam is 25 percent more than on Saipan), evaporation on Sa ipan probab ly wi 11 be about the same as that on Guam. Tab le 3 1 ists the month ly pan-evaporation data for Guam during 1956-82.
An estimate of 30 inches of annual evaporation for Saipan was first given by Cox (1956) and later repeated by T. Davis (1973), M and E Pacific (1978), and Ayers (1981), but this estimate seems too low in view of the long-term annual mean of 76.76 inches reported for Guam. (U.S. Weather Bureau, 1956-70; U.S. National Oceanic and Atmospheric Administration, 1970-72, 1973-82). If a co efficient of 0.7 is used to adjust the total for the increase in evaporation owing to warming of the pan, the annual mean evaporation for Guam would be 54 inches.
11
Tabl
e 2.
Monthly
and
annual me
an rainfall
in inches
Year
*Garapan
Chalan Kano
aChacha
Tanapag
(Mt.
Taluf ofo) .
Tanapag
(Cap
itol
Hill
)Garapan
As Gonna
(Kobler
Field).
As Li
to
Peri
od
1901-12
1924-40
do.
1926
-1*1
1924-40
1931-40
do.
do.
Jan.
2.11
4.4
4.5
5.36
4.4
6.8
5.4
5.6
Feb.
3.48
2.2
2.9
3.39
3.0
3.5
2.7
2.9
Mar.
4.35
Japa
nese
1.9
2.0
2.69
3.2
3.1
2.5
2.4
Apr. Germ
an
3.04
rainfall
1.9
2.3
2.49
4.1
3.4
2.6
2.7
May
June
July
Aug.
Sept
.Oct.
Nov.
Dec.
Tota
l
rainfall re
cord
s.
See
tabl
e 38
3.13
records
4.1
3.7
4.29
3.4
4.5
4.1
5.0
5.92
9.
46
13.9
6 12.74
(Austin, Smith
and
Asso
ciat
es,
3.6
11.0
11.5
12.6
5.1
10.6
12.3
13.0
5.26
11.36
13.06
15.76
5.5
10.4
10.7
13-6
6.8
10.7
14.4
16.7
5.2
8.2
12.6
13.2
6.2
8.9
13.5
14.7
Japa
nese
rainfall records
(Taylor, 19
73).
Se
e ta
ble
*Garapan
1927-42
5.24
4.03
2.94
2.84
4.55
U.S. rainfall
*U.S
. Navy
*U.S
. Co
ast
Guard
LORA
Nstation.
Conm
unic
at ion
Center,
Hakm
ang.
Agr ic
ul ture
Stat
ion,
Hakm
ang.
*9-Mgal
reservoi r.
Isle
y Field
1954-63
1963-76
1968-72,
1975
-83.
1976
-83
1977-83
do.
Mean of rain ga
ges
marked
In inches
In pe
rcen
tage
of to
tal
3.83
4.79
3.28
3.42
2.37
2.04
* (5
2-57
3.91
4.9
2.74
3.27
2.76
2.86
2.37
1.83
year
s)3.
344.2
2.90
3.70
1.97
3.31
1.60
1.54
.3.
234.
0
3.79
3.82
1.88
2.08
1.86 .98
3.12
3.9
2.84
3.51
3.12
3.71
2.49
2.24
3.50
4.4
5.35
11.36
13.44
15.24
reco
rds.
See
tabl
es 45
-53
4.86
6.43
11.75
11.7
84.
36
9.73
11.26
13.32
3.04
9.78
-'17.47
10.65
3.99
9.21
15.70
14.86
3.03
7.72
10.2
2 12.40
2.44
7.19
10.54
11.97
4.93
9-50
12.45
13.43
6.1
11.8
15
.5
16.7
11.9
0
1967
) 10.4 9.9
10.29
9.8
9.6
9.9
10.1
40
10.3
6
10.6
59.28
8.94
10.4
6
11.9
1
10.8
0
10.6
013
.2
7.95
6.0
6.5
6.30
5.8
7.4
7.3
7.5
5.92
6.77
8.25
7.14
7.80
9.77
5.25
7.46
9.3
5.63
4.1
4.2
4.95
3.8
5.1
4.6
4.7
5.13
3.99
4.71
3.37
4.36
3.66
2.79
4.80
6.0
83-67
73.7
77-0
85.20
77.7
92.0
78.3
84.2
86.40
72.33
80.00
73.40
81.76
69.40
59.61
80.27
100
Augu
st me
an without
tota
l of Au
gust
19
78:
11.89
inches (August
1978 rainfall no
t av
aila
ble
at ot
her
rain ga
ges)
.
Q_
< CO z.o
2 h- O< I-cc
u_Q C
< UJ 1n C5 10
o zr_l LUU- OC5 OCZ LU CL OCCL 2CO
I I
EXPLANATION
Streamflow Middle ForkTalufofo Stream y
Springflow Denni SpringRainfall at Communicatio
CenterPan evaporation on Guam /
Jan. Feb. Mar. Apr. May June July Aug. Sept. Oct. Nov. Dec
Figure k. Comparison of streamflow, springflow, and rainfall on Saipan and pan evaporation on Guam.
13
Evaporation
Table 3- Monthly and annual evaporation data, in inches, for Guam
[1956 to May 1958 at Fena Lake, August 1958 to present at Weather Service Station. Source: U.S. National Oceanic and Atmospheric Administration, 1956-82]
Year
195619571958
1959I9601961196219631964196519661967196819691970197119721973197419751976197719781979198019811982
Mean
Percent
Jan.
6.836.187.48
5.634.864.276.154.735.915.357.075.185.895.574.684.616.555.945.816.136.276.647.307.267.735.54
5.98
7.8
Feb.
6.545.996.08
6.666.265.734.944.316.396.316.555.326.31--
5.906.216.655.466.626.805.586.496.106.686.437.226.20
6.14
8.0
Mar.
8.247.327.65
7.607.056.277.816.447.018.587.785.328.508.467.936.415.757.476.908.087.228.209.467.767.858.947.64
7.54
9.8
Apr.
9.138.429.34
7.588.057.006.176.576.99
9.176.077.578.968.986.657.858.468.278.357.629.037.729.507.938.138.28
7.99
10.4
May
8.828.719.49
9.037.176.877.006.216.76
8.887.007.588.048.068.778.068.147.219.017.378.488.8510.338.056.808.06
8.03
10.4
June
7.819.10
7.966.545.575.205.377.47
7.375.435.898.067.306.037.266.495.889.297.657.896.558.446.917.146.90
7.02
9.2
July
5.747.41
6.985.415.084.995.096.187.357.215.065.775.746.275.385.665.46
6.186.597.835.906.446.336.785.89
6.11
8.0
Aug.
5.867.76
5.485.314.714.674.915.824.756.754.714.714.955.674.285.915.004.795.095.696.336.996.106.344.846.556.38
5.56
7.3
Sept.
4.496.52
5.614.524.384.444.284.294.584.594.764.644.494.904.865.785.875.645.616.145.475.245.335.265.147.386.60
5.22
6.8
Oct.
5.015-57
6.085.124.304.635.005.264.735.565.364.605.534.554.625.745.555.336.285.707.365.536.325.165.987.015.27
5.45
7.1
Nov.
5.267.28
4.644.595.035.074.455.115.955.815.395.724.325.095.805.594.716.265.736.736.436.275.465.937.106.666.08
5.65
7.4
Dec.
5.927.22
5.304.895.164.965.26
6.505.885.925.675.355.786.027.315.675.296.936.396.566.905.^56.366.205.356.31
5.96
7.8
Annual
79.6587.48
75.8768.9264.5666.16
73.22--
80.1764.7272.15
74.7074.3974.5874.73
84.4980.4585.4981.0485.4680.4983.30
76.76
100
Total of monthly means: 76.65 inches.
14
WATER RESOURCES
General
are
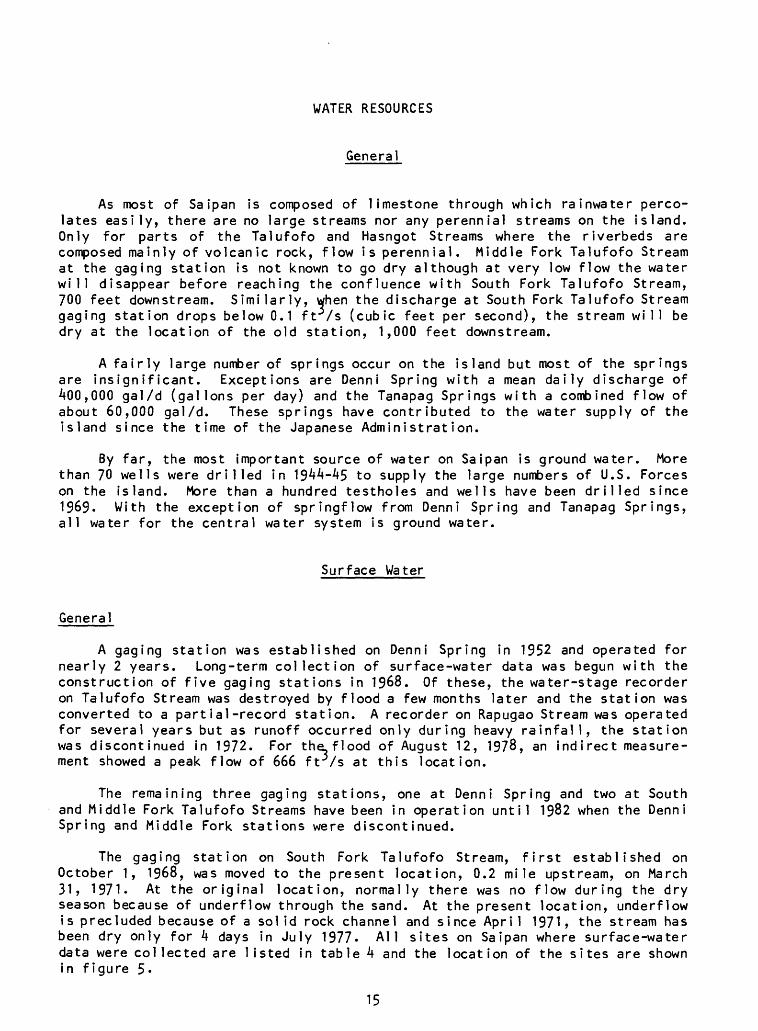
As most of Saipan is composed of limestone through which rainwater perco lates easily, there are no large streams nor any perennial streams on the island. Only for parts of the Talufofo and Hasngot Streams where the riverbeds are composed mainly of volcanic rock, flow is perennial. Middle Fork Talufofo Stream at the gaging station is not known to go dry although at very low flow the water will disappear before reaching the confluence with South Fork Talufofo Stream, 700 feet downstream. Similarly, when the discharge at South Fork Talufofo Stream gaging station drops below 0.1 ft /s (cubic feet per second), the stream will be dry at the location of the old station, 1,000 feet downstream.
A fairly large number of springs occur on the island but most of the springs w.s. insignificant. Exceptions are Denni Spring with a mean daily discharge of 400,000 gal/d (gallons per day) and the Tanapag Springs with a combined flow of about 60,000 gal/d. These springs have contributed to the water supply of the island since the time of the Japanese Administration.
By far, the most important source of water on Saipan is ground water. More than 70 wells were drilled in 19^4-45 to supply the large numbers of U.S. Forces on the island. More than a hundred testholes and wells have been drilled since 1969. With the exception of springflow from Denni Spring and Tanapag Springs, all water for the central water system is ground water.
Surface Water
General
A gaging station was established on Denni Spring in 1952 and operated for nearly 2 years. Long-term collection of surface-water data was begun with the construction of five gaging stations in 1968. Of these, the water-stage recorder on Talufofo Stream was destroyed by flood a few months later and the station was converted to a partial-record station. A recorder on Rapugao Stream was operated for several years but as runoff occurred only during heavy rainfall, the station was discontinued in 1972. For the_flood of August 12, 1978, an indirect measure ment showed a peak flow of 666 ft /s at this location.
The remaining three gaging stations, one at Denni Spring and two at South and Middle Fork Talufofo Streams have been in operation until 1982 when the Denni Spring and Middle Fork stations were discontinued.
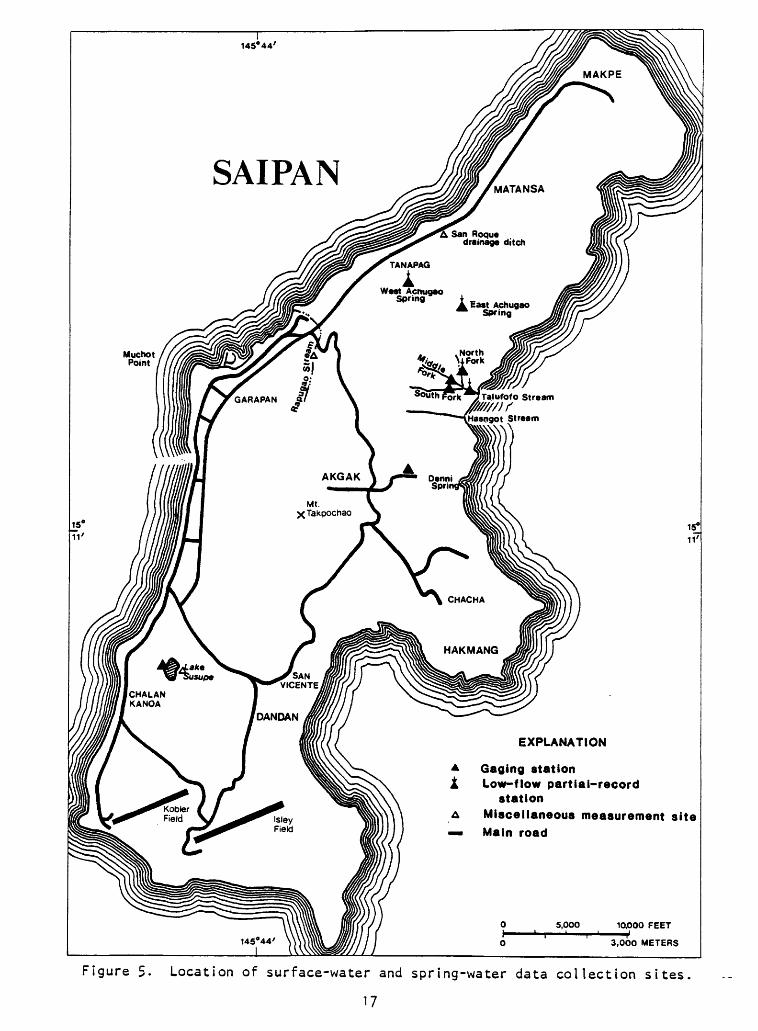
The gaging station on South Fork Talufofo Stream, first established on October 1, 1968, was moved to the present location, 0.2 mile upstream, on March 31, 1971. At the original location, normally there was no flow during the dry season because of underflow through the sand. At the present location, underflow is precluded because of a solid rock channel and since April 1971, the stream has been dry only for 4 days in July 1977. All sites on Saipan where surface-water data were collected are listed in table k and the location of the sites are shown in figure 5-
15
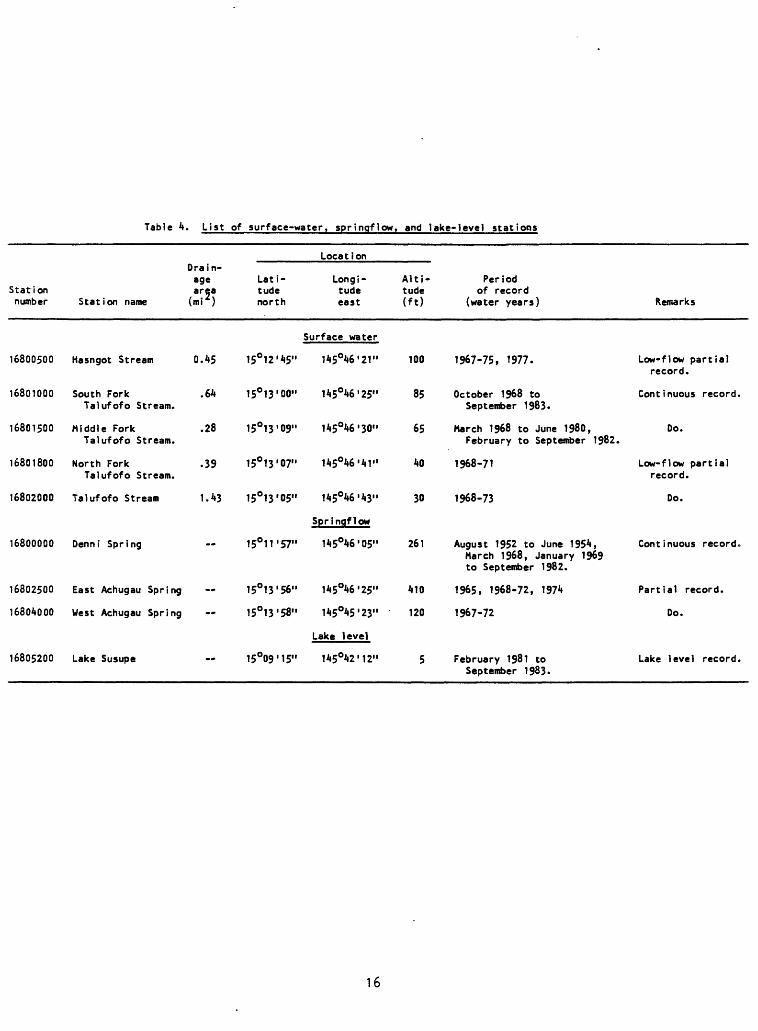
Table 4. List of surface-water, springflow, and lake-level stations
Station number
16800500
16801000
16801500
16801800
16802000
16800000
16802500
16804000
16805200
Drain age area
Station name (mi )
Hasngot Stream 0.45
South Fork .64 Talufofo Stream.
Middle Fork .28 Talufofo Stream.
North Fork .39 Talufofo Stream.
Talufofo Stream 1.43
Denni Spring
East Achugau Spring
West Achugau Spring
Lake Susupe
Lati tude north
15°12'45"
15°13'00"
15°13'09"
15°13'07"
15013'05"
15°11'57"
15°13'56"
15°13'58"
15°09'15"
Location
Longi tude east
Surface water
145°46'21"
145°46'25"
145°46'30"
145°46'41"
145°46'43"
Sprinqflow
145°46'05"
145°46'25"
145°45'23"
Lake level
145°42'12"
Alti tude (ft)
100
85
65
40
30
261
410
120
5
Period of record
(water years)
1967-75, 1977.
October 1968 to September 1983.
March 1968 to June 1980, February to September 1982.
1968-71
1968-73
August 1952 to June 1954, March 1968, January 1969 to September 1982.
1965, 1968-72, 1974
1967-72
February 1981 to September 1983.
Remarks
Low-flow partial record.
Continuous record.
Do.
Low-flow partial record.
Do.
Continuous record.
Partial record.
Do.
Lake level record.
16
San Roque drainage ditch
West Acnugao Spflnfl
South Pork"7Talufofo Stream''/////)f
Hasngot Stream
EXPLANATION
Gaging station Low-flow partial-record
stationMiscellaneous measurement site
Main road
Figure 5. Location of surface-water and spring-water data collection sites
17
Data collected at a gaging station consist of records of stage and measure ments of discharge. Records of stage are obtained from a water-stage recorder that produces a continuous graph of stream fluctuations. Measurements of stream discharge are made with a current meter. From records of stage and discharge, stage-discharge relationship curves are derived. The relation is used to compute daily mean discharges from which the monthly and annual mean discharges are computed. Tables with monthly and annual totals, annual maximums and minimums, and means are presented in the Hydrologic Data section. Also, peak discharges, their time of occurrence and corresponding stage, are listed for all peaks above a selected base discharge. Time is expressed in 24-hour local standard time. Daily discharges are not given in this report but are published in the annual U.S. Geological Survey report "Water Resources Data for Hawaii and other Pacific Areas" for water years 1968 to 1982. Daily discharges for Denni Spring for 1952 to 1954 were published in "Surface Water Supply of Mariana, Caroline and Samoa Islands through June 1960" (U.S. Geological Survey, 1962).
Partial-record stations are sites where discharge measurements are made on a systematic basis over a period of years usually during a period of low flow where streamflow is primarily from ground-water storage. When these measurements are correlated with the simultaneous discharge of a nearby stream for which continuous record is available, the low-flow potential can be predicted. On Saipan, the only correlations made were between Hasngot and Middle Fork Talufofo Streams and between Talufofo and Middle Fork Talufofo Streams.
A comparison of monthly yield from the gaged streams and Denni Spring is shown in table 5» The difference in percentages between the stations is caused by the amount of retention of rainfall in the basins. For the same reason, the flow-duration curves show different shapes. (See fig. 6.)
Discharge measurements made at sites not included in the partial-record program are called measurements at miscellaneous sites. For the flooding of August 12, 1978, three determinations of peak flow were made at miscellaneous si tes.
As a means of identification, station numbers have been assigned to each of the gaging stations, partial-record stations, and the lake level-station. On Saipan, station numbers were assigned in counterclockwise sequence beginning at Denni Spring.
All records were collected in English (and American) units of length, area, and volume, and are published as such. Surface-water data are published by water year, the year beginning on October 1 and ending on September 30.
Drainage areas and the locations (latitude, longitude, and altitude) of all stations differ from those used in "Water Resources Data of Hawaii and other Pacific Areas, 1968-81" (U.S. Geological Survey, 1968-74, 1975-76, 1977-80, 1981). These were based on the 1953 U.S. Army Map Service W843 maps with a scale of 1:25,000 (International Spheroid), whereas the revised figures are based on the 1981 U.S. Geological Survey maps with 1:10,000 scale (Clarke Spheroid of 1866).
18
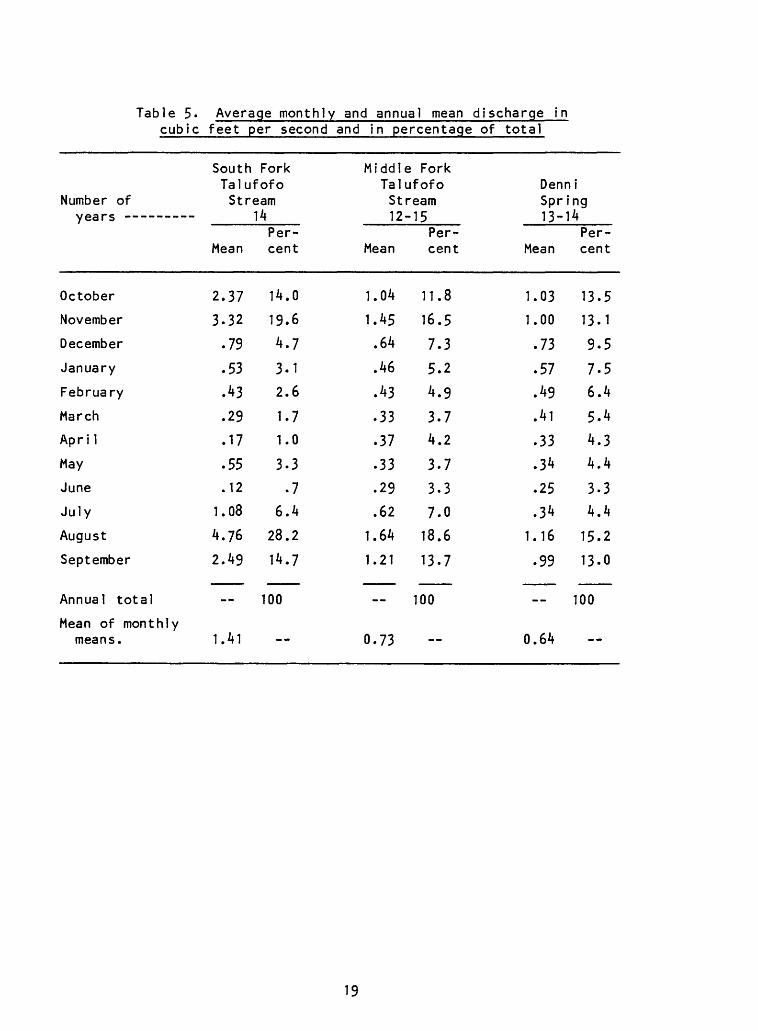
Table 5» Average monthly and annual mean discharge incubic feet per second and in percentage of total
Number ofyears
October
November
December
January
February
March
Apri 1
May
June
July
August
September
South Taluf Stre
Mean
2.37
3.32
.79
.53
.A3
.29
.17
.55
.12
1.08
4.76
2.49
Fork : ofo >am 14Percent
14.0
19.6
4.7
3.1
2.6
1.7
1.0
3.3
.7
6.4
28.2
14.7
Middle Fork Talufofo Stream 12-15
Mean
1.04
1.45
.64
.46
.43
.33
.37
.33
.29
.62
1.64
1.21
Percent
11.8
16.5
7.3
5.2
4.9
3.7
4.2
3.7
3.3
7.0
18.6
13.7
Denni Spring 13-14
Mean
1.03
1.00
.73
.57
.49
.41
.33
.34
.25
.34
1.16
.99
Percent
13.5
13.1
9.5
7.5
6.4
5.4
4.3
4.4
3.3
4.4
15.2
13.0
Annual total
Mean of monthly means.
100 100 100
1.41 0.73 0.64
19
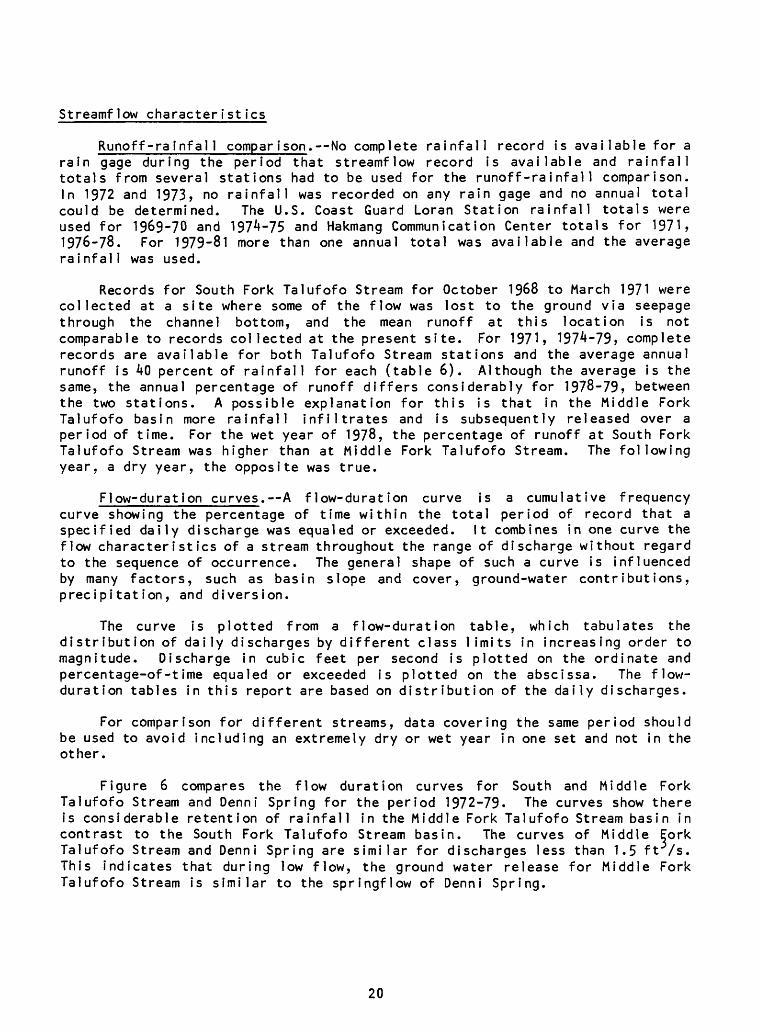
Streamflow characteristics
Runoff-rainfal1 comparison. No complete rainfall record is available for a rain gage during the period that streamflow record is available and rainfall totals from several stations had to be used for the runoff-rainfall comparison. In 1972 and 1973, no rainfall was recorded on any rain gage and no annual total could be determined. The U.S. Coast Guard Loran Station rainfall totals were used for 1969-70 and 1974-75 and Hakmang Communication Center totals for 1971, 1976-78. For 1979-81 more than one annual total was available and the average rainfall was used.
Records for South Fork Talufofo Stream for October 1968 to March 1971 were collected at a site where some of the flow was lost to the ground via seepage through the channel bottom, and the mean runoff at this location is not comparable to records collected at the present site. For 1971, 1974-79, complete records are available for both Talufofo Stream stations and the average annual runoff is 40 percent of rainfall for each (table 6). Although the average is the same, the annual percentage of runoff differs considerably for 1978-79, between the two stations. A possible explanation for this is that in the Middle Fork Talufofo basin more rainfall infiltrates and is subsequently released over a period of time. For the wet year of 1978, the percentage of runoff at South Fork Talufofo Stream was higher than at Middle Fork Talufofo Stream. The following year, a dry year, the opposite was true.
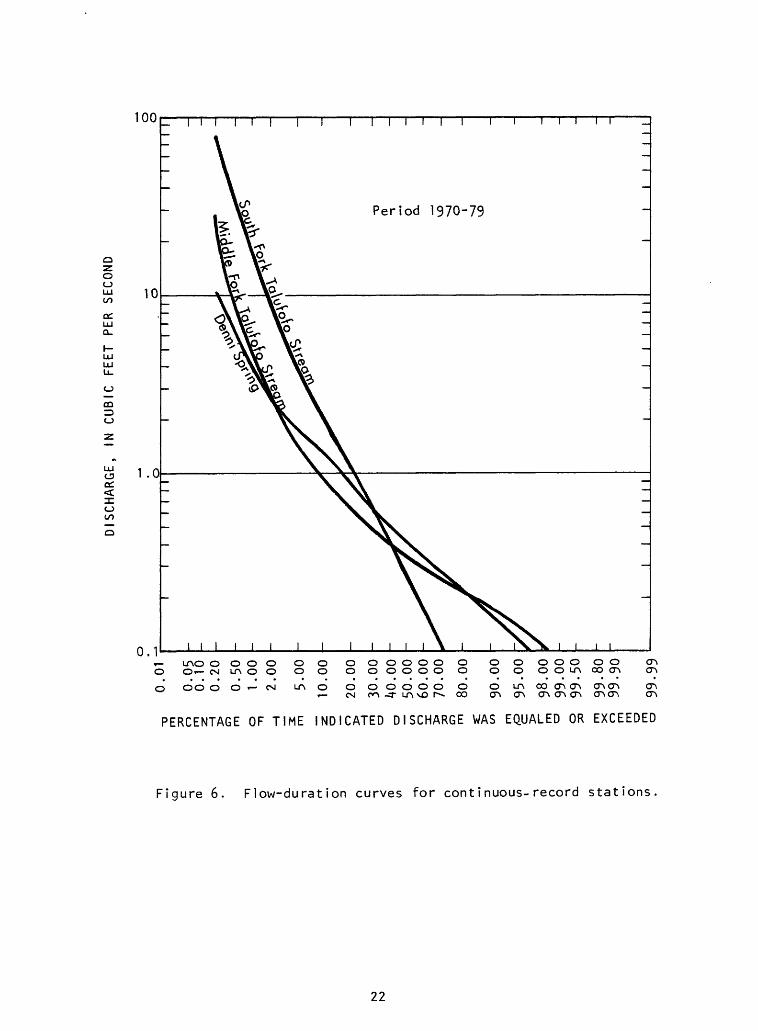
Flow-duration curves. A flow-duration curve is a cumulative frequency curve showing the percentage of time within the total period of record that a specified daily discharge was equaled or exceeded. It combines in one curve the flow characteristics of a stream throughout the range of discharge without regard to the sequence of occurrence. The general shape of such a curve is influenced by many factors, such as basin slope and cover, ground-water contributions, precipitation, and diversion.
The curve is plotted from a flow-duration table, which tabulates the distribution of daily discharges by different class limits in increasing order to magnitude. Discharge in cubic feet per second is plotted on the ordinate and percentage-of-time equaled or exceeded is plotted on the abscissa. The flow- duration tables in this report are based on distribution of the daily discharges.
For comparison for different streams, data covering the same period should be used to avoid including an extremely dry or wet year in one set and not in the other.
Figure 6 compares the flow duration curves for South and Middle Fork Talufofo Stream and Denni Spring for the period 1972-79- The curves show there is considerable retention of rainfall in the Middle Fork Talufofo Stream basin in contrast to the South Fork Talufofo Stream basin. The curves of Middle Eork Talufofo Stream and Denni Spring are similar for discharges less than 1.5 ft /s. This indicates that during low flow, the ground water release for Middle Fork Talufofo Stream is similar to the springflow of Denni Spring.
20
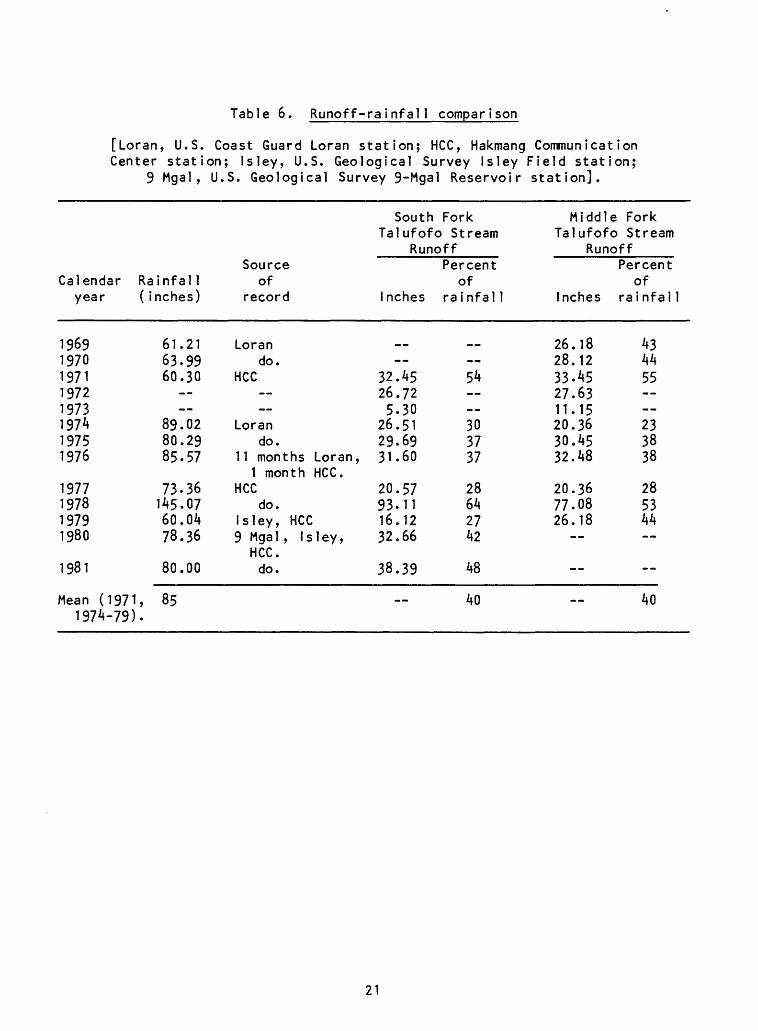
Table 6. Runoff-rainfall comparison
[Loran, U.S. Coast Guard Loran station; HCC, Hakmang CommunicationCenter station; Isley, U.S. Geological Survey Isley Field station;
9 Mgal, U.S. Geological Survey 9-Mgal Reservoir station].
South Fork Talufofo Stream
Runoff
Calendaryear
19691970197119721973197419751976
1977197819791980
1981
Mean (19711974-79)
Rainfal 1( inches)
61.2163-9960.30
89.0280.2985.57
73-36145.0760.0478.36
80.00
, 85*
Sourceof
record
Lorando.
HCC
Lorando.
11 months Loran,1 month HCC.
HCCdo.
Isley, HCC9 Mgal , Isley,
HCC.do.
Inches
32.4526.725.30
26.5129.6931.60
20.5793.1116.1232.66
38.39
__
Percentof
rainfal 1
54 --303737
28642742
48
40
Middle Fork Talufofo Stream
Runoff
Inches
26.1828.1233.4527.6311.1520.3630.4532.48
20.3677.0826.18
__
Percentof
ra infal 1
434455 233838
285344
--
40
21
DISCHARGE,
IN CU
BIC
FEET PER
SECO
ND
o
to
c "1 O Q.
C
-1
QJ -h
O -1 O O O O -t Q.
TJ m >
£75
O > m
a CO o 30
CD m > CO m m
a o 73 x o
0.0
1
0.0
50.1
00
.20
0.5
01
.00
2.0
0
5.0
0
10
.00
20.0
0
30.0
040
.00
50.0
06
0.0
070
.00
80.0
0
90
.00
95
.00
98.0
099
.00
99.5
0
99.8
09
9.9
0
o
o
3
99.9
9
I T
T \\\\
I I
I I
I I
I I
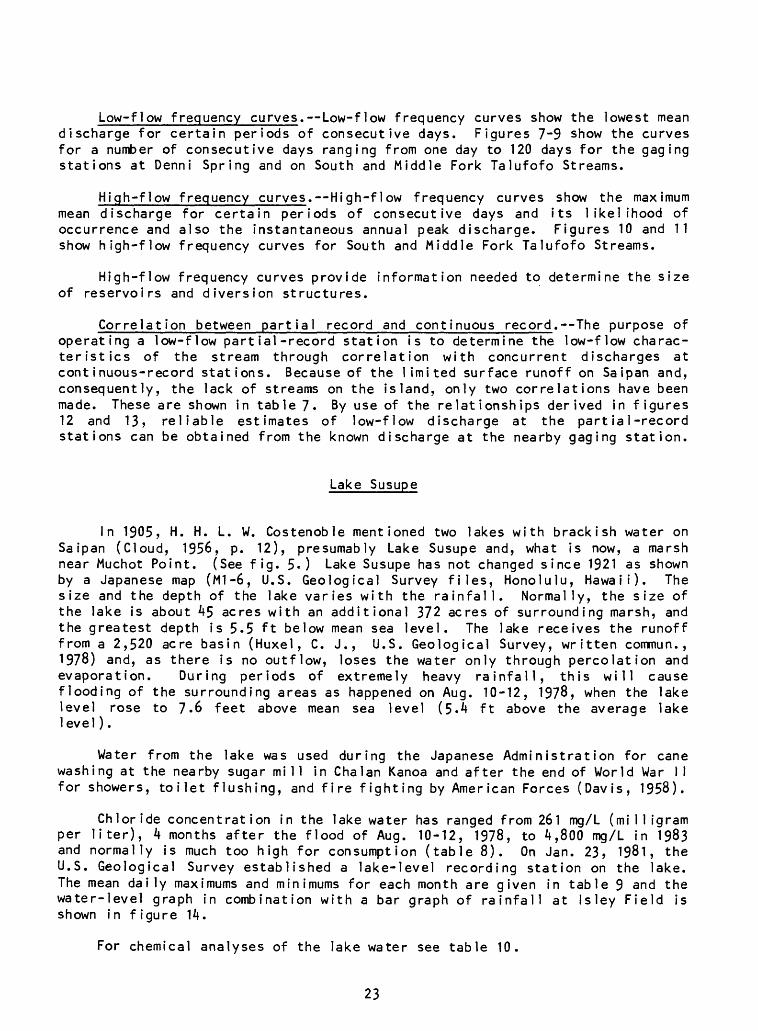
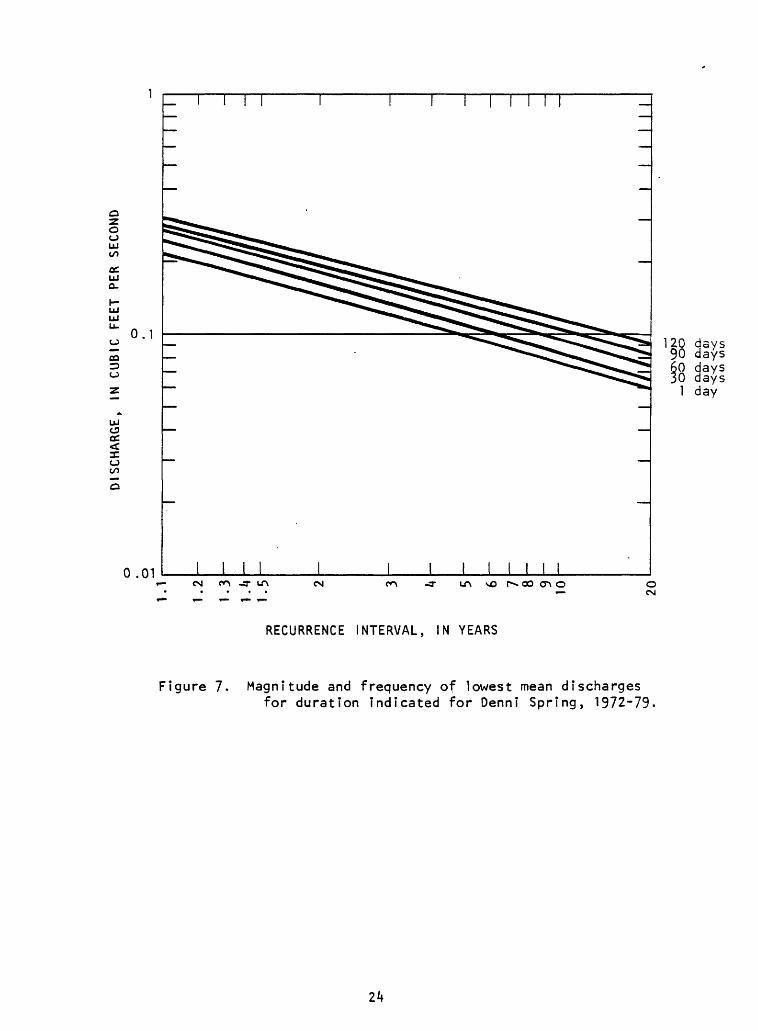
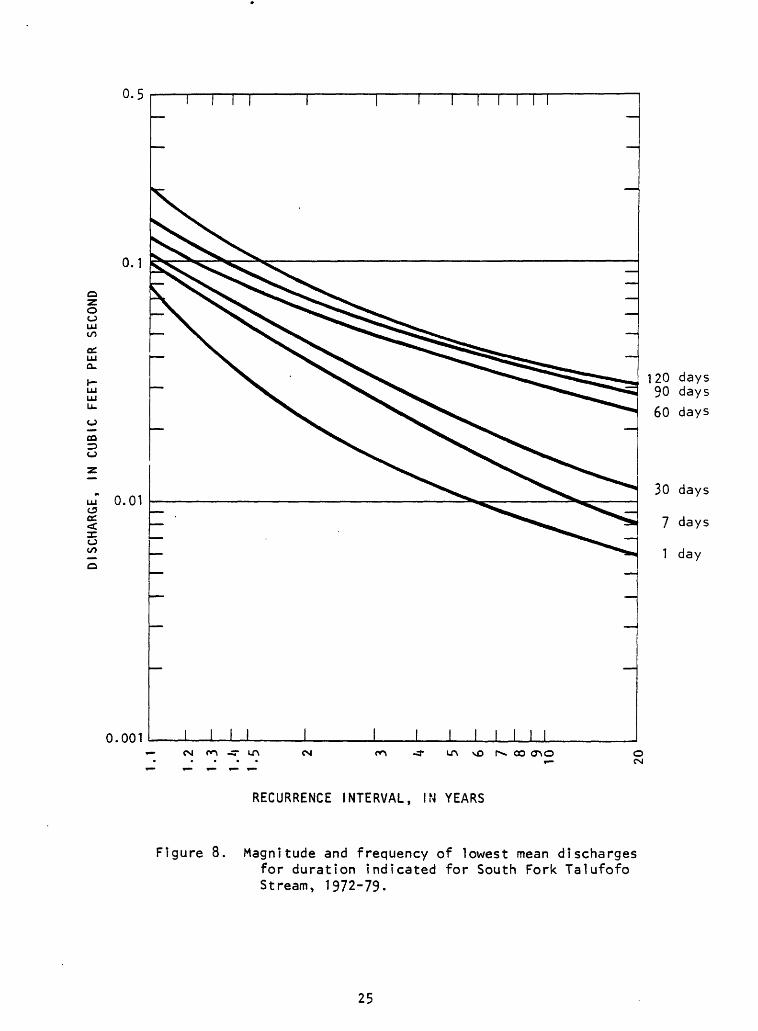
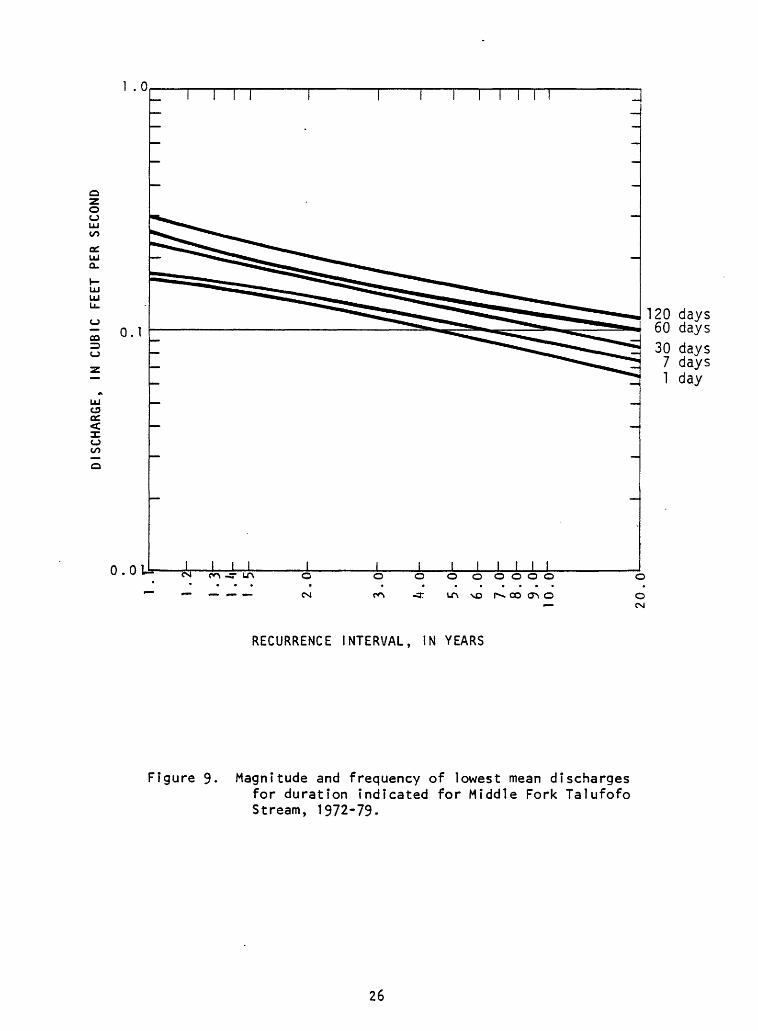
Low-flow frequency curves. Low-flow frequency curves show the lowest mean discharge for certain periods of consecutive days. Figures 7-9 show the curves for a number of consecutive days ranging from one day to 120 days for the gaging stations at Denni Spring and on South and Middle Fork Talufofo Streams.
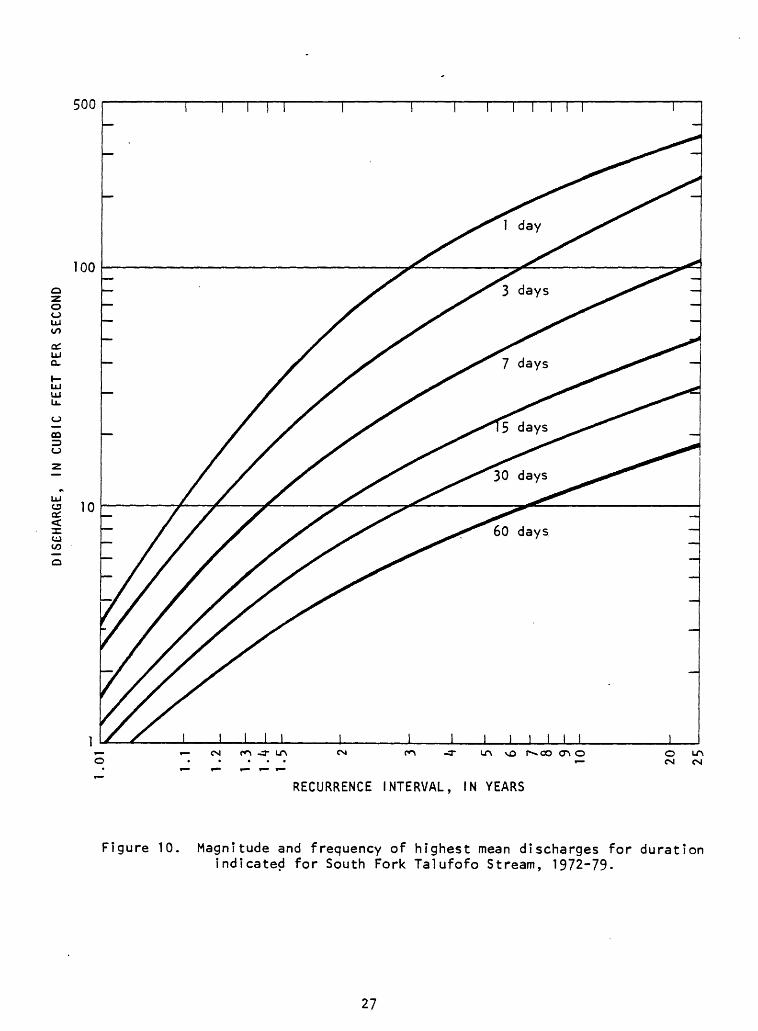
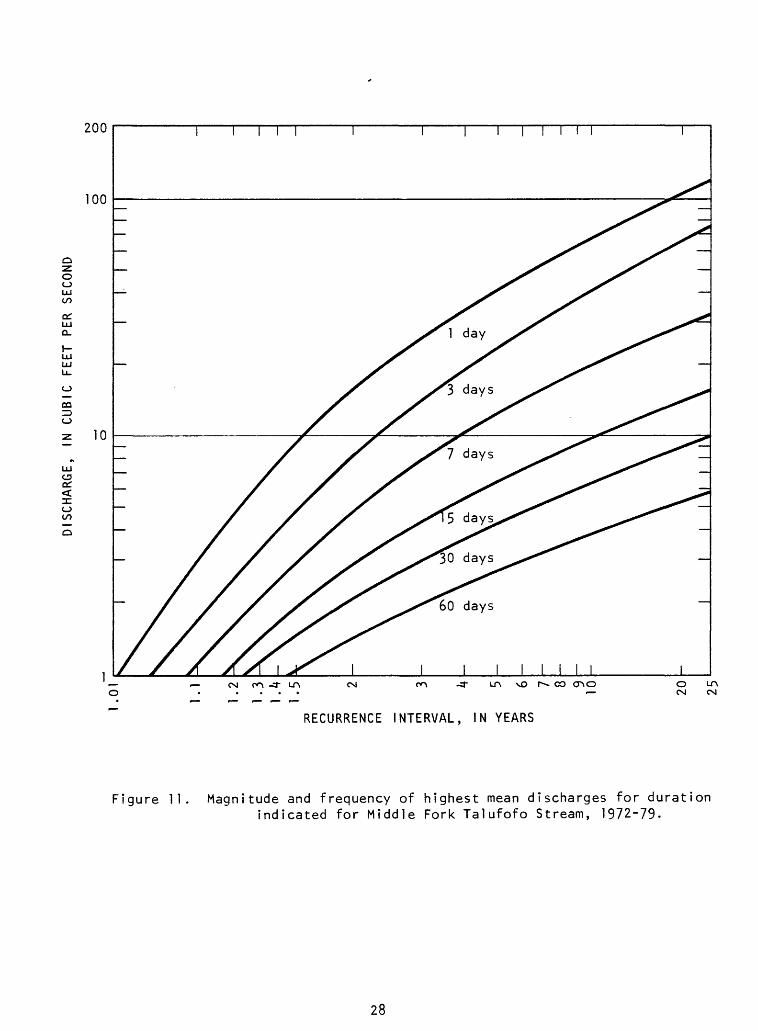
High-flow frequency curves. High-flow frequency curves show the maximum mean discharge for certain periods of consecutive days and its likelihood of occurrence and also the instantaneous annual peak discharge. Figures 10 and 11 show high-flow frequency curves for South and Middle Fork Talufofo Streams.
High-flow frequency curves provide information needed to determine the size of reservoirs and diversion structures.
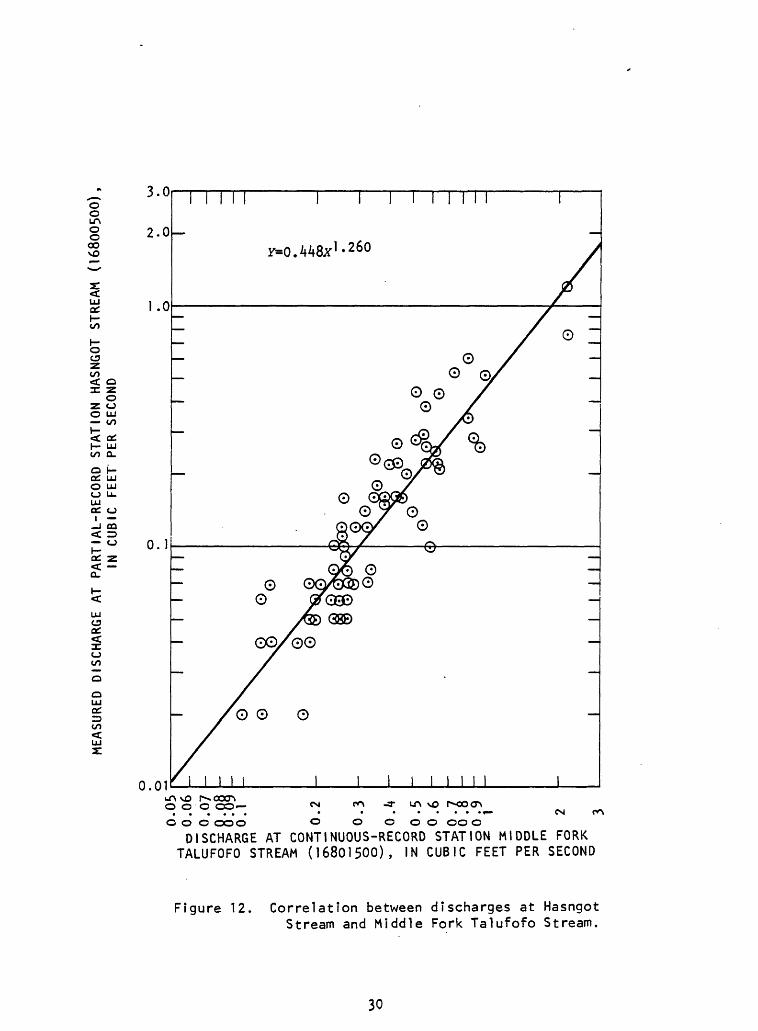
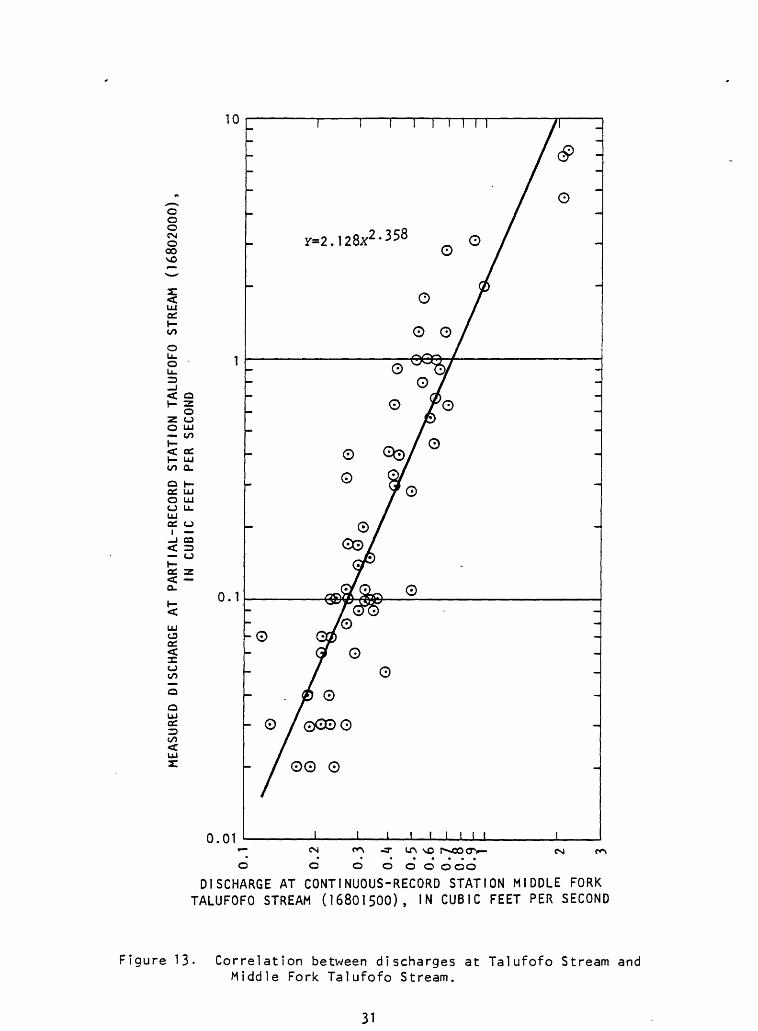
Correlation between partial record and continuous record. The purpose of operating a low-flow partial-record station is to determine the low-flow charac teristics of the stream through correlation with concurrent discharges at continuous-record stations. Because of the limited surface runoff on Saipan and, consequently, the lack of streams on the island, only two correlations have been made. These are shown in table 7. By use of the relationships derived in figures 12 and 13, reliable estimates of low-flow discharge at the partial-record stations can be obtained from the known discharge at the nearby gaging station.
Lake Susupe
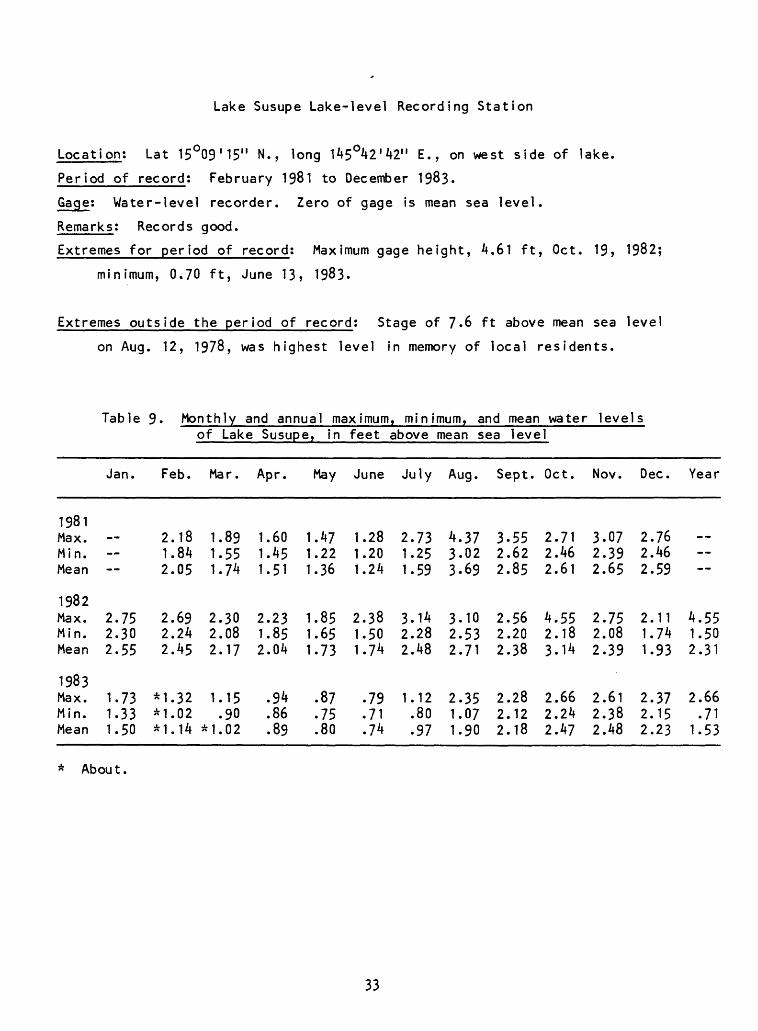
In 1905, H. H. L. W. Costenoble mentioned two lakes with brackish water on Saipan (Cloud, 1956, p. 12), presumably Lake Susupe and, what is now, a marsh near Muchot Point. (See fig. 5.) Lake Susupe has not changed since 1921 as shown by a Japanese map (M1-6, U.S. Geological Survey files, Honolulu, Hawaii). The size and the depth of the lake varies with the rainfall. Normally, the size of the lake is about 45 acres with an additional 372 acres of surrounding marsh, and the greatest depth is 5.5 ft below mean sea level. The lake receives the runoff from a 2,520 acre basin (Huxel, C. J., U.S. Geological Survey, written commun., 1978) and, as there is no outflow, loses the water only through percolation and evaporation. During periods of extremely heavy rainfall, this will cause flooding of the surrounding areas as happened on Aug. 10-12, 1978, when the lake level rose to 7.6 feet above mean sea level (5.4 ft above the average lake level).
Water from the lake was used during the Japanese Administration for cane washing at the nearby sugar mill in Chalan Kanoa and after the end of World War II for showers, toilet flushing, and fire fighting by American Forces (Davis, 1958).
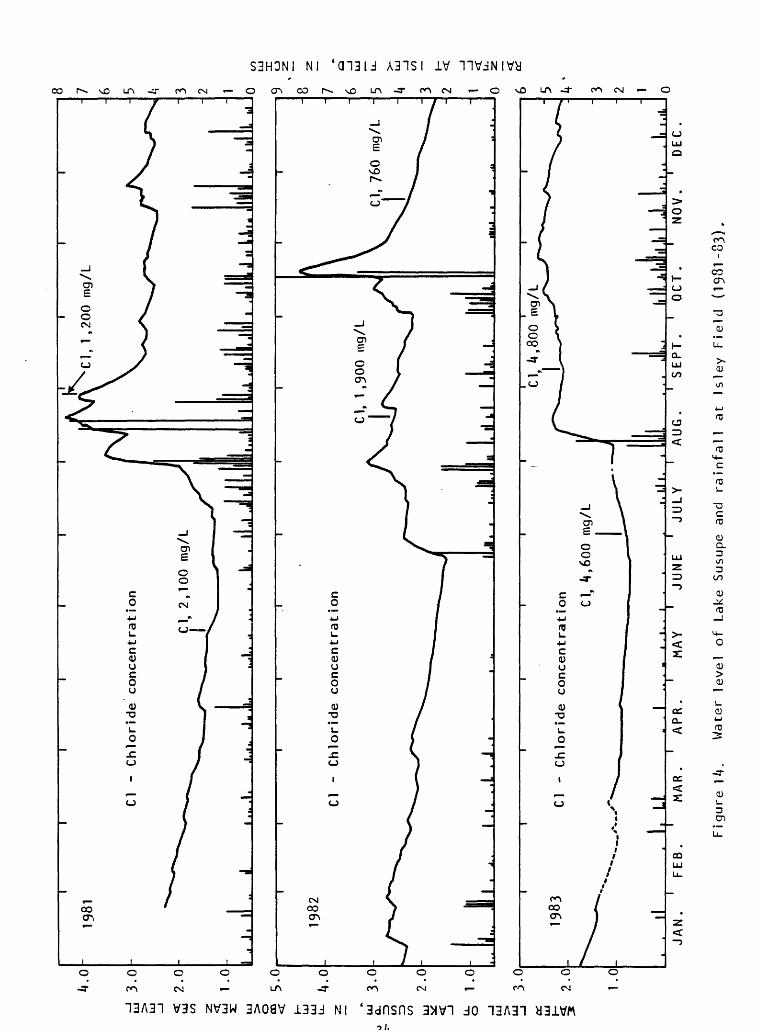
Chloride concentration in the lake water has ranged from 261 mg/L (milligram per liter), 4 months after the flood of Aug. 10-12, 1978, to 4,800 mg/L in 1983 and normally is much too high for consumption (table 8). On Jan. 23, 1981, the U.S. Geological Survey established a lake-level recording station on the lake. The mean daily max!mums and mini mums for each month are given in table 9 and the water-level graph in combination with a bar graph of rainfall at Isley Field is shown in figure 14.
For chemical analyses of the lake water see table 10.
23
1 TT
oCJ LUen
UJo.
UJ UJ
CJ
CO
CJ
UJo a:
0.1
0 .01 I I I I
120 days90 days60 days30 days
1 day
CM -3- urv oo
RECURRENCE INTERVAL, IN YEARS
Figure 7. Magnitude and frequency of lowest mean dischargesfor duration Indicated for Dennl Spring, 1972-79.
0.5
0.1
oz oLU 00
LU Q_
O
03=> O
C3 C£
X
00
o
0.01
0.001 I I I I
120 days90 days60 days
30 days
7 days
1 day
\o r-. oo <r\o oCM
RECURRENCE INTERVAL, IN YEARS
Figure 8. Magnitude and frequency of lowest mean discharges for duration Indicated for South Fork Talufofo Stream, 1972-79.
25
1 .0 I I I IT
o oLU
QC UJ O.
LU
O
Ooe<Xo to
o.ou- I t l 1 1 1
120 days60 days30 days7 days1 day
-3- LT\ OOOOO
oCM
RECURRENCE INTERVAL, IN YEARS
Figure 9. Magnitude and frequency of lowest mean discharges for duration indicated for Middle Fork Talufofo Stream, 1972-79.
26
» CM CO -3- LA
RECURRENCE INTERVAL, IN YEARS
Figure 10. Magnitude and frequency of highest mean discharges for duration indicated for South Fork Talufofo Stream, 1972-79.
27
DISCHARGE,
IN CUBIC
FEET PER
SECO
ND
1 .0
1
ho CO
-
C
3
CL
Q. n
> o
QJQ
) 2
ft
CL
CD Q-
-h
-l-h
CD
O
-Q
-I
C CD2 3
-
O
CL
-<
CL-
O
CD
-h-n
a-
o
-I
Id7T
3
-CD
H
w
Q)
rt
cT 3
-h C
DO
CU
rt
in-i
O
CD
3-
Q)
Q)3
-I<*
IQ CD
in
ho
O
I -i Q
. C
m
o -<
m >o
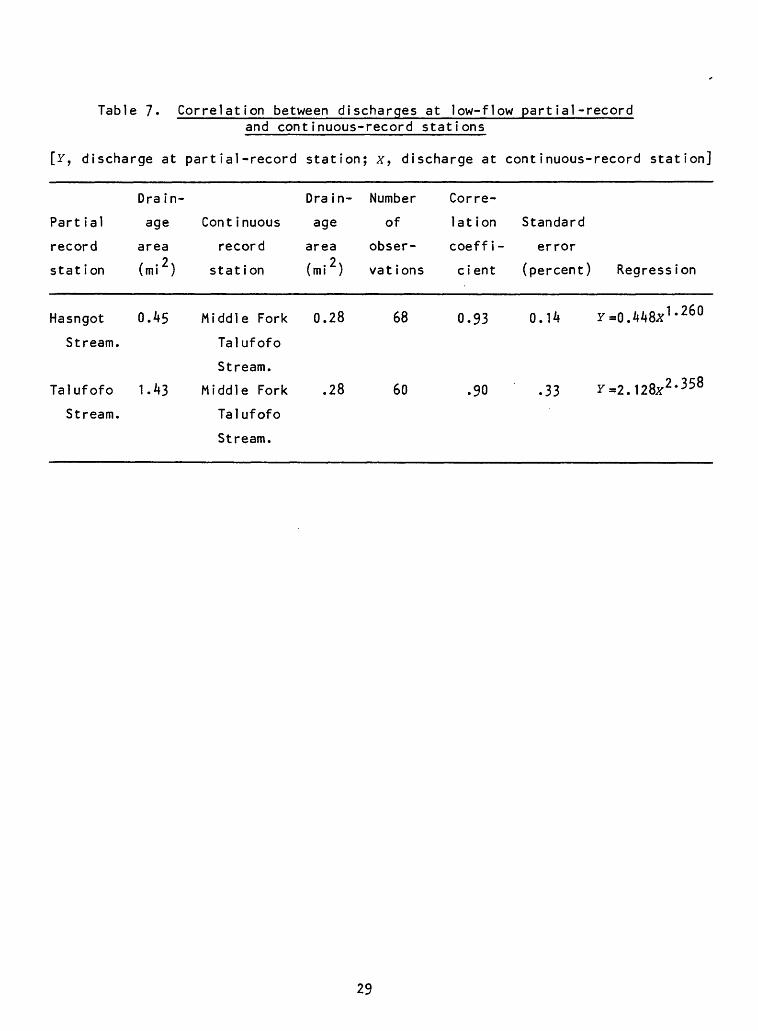
Table 7. Correlation between discharges at low-flow partial-recordand continuous-record stations
[Y , discharge at partial-record station; x, discharge at continuous-record station]
Partial
record
station
Dra in-
age
area
(mi 2 )
Cont inuous
record
station
Dra in-
age
area
(mi 2 )
Number
ofobser-
vat ions
Corre
lation
coeffi
cient
Standard
error
(percent) Regression
Hasngot 0.45
Stream.
Talufofo 1.43
Stream.
Middle Fork
Talufofo
Stream.
Middle Fork
Talufofo
Stream.
0.28
.28
68
60
0.93
.90
0.14
.33 r-2. 128*
1.260
2.358
29
o o un o o oo
UJa:CO
oCJzCO< oX Zo z o
O LU CO
CO O-
o i- a: LUO UJo u-UJ C£. o
1 00 < =5 o
Q_
C3 (£.
CO
aaUJ
=5 CO
0.01o o o oo o o o ooo o o o o o oo o
DISCHARGE AT CONTINUOUS-RECORD STATION MIDDLE FORK TALUFOFO STREAM (16801500), IN CUBIC FEET PER SECOND
Figure 12. Correlation between discharges at Hasngot Stream and Middle Fork Talufofo Stream.
30
o ooCNo oovO
LU {£.h- co
O LL. O
OZ O O LU
< KC/)
Oa: OoLUa:
i
ac.< a.
CJa:
o
o o
LU
0.01
O O O O O O O OO
DISCHARGE AT CONTINUOUS-RECORD STATION MIDDLE FORK TALUFOFO STREAM (16801500), IN CUBIC FEET PER SECOND
Figure 13- Correlation between discharges at Talufofo Stream and Middle Fork Talufofo Stream.
31
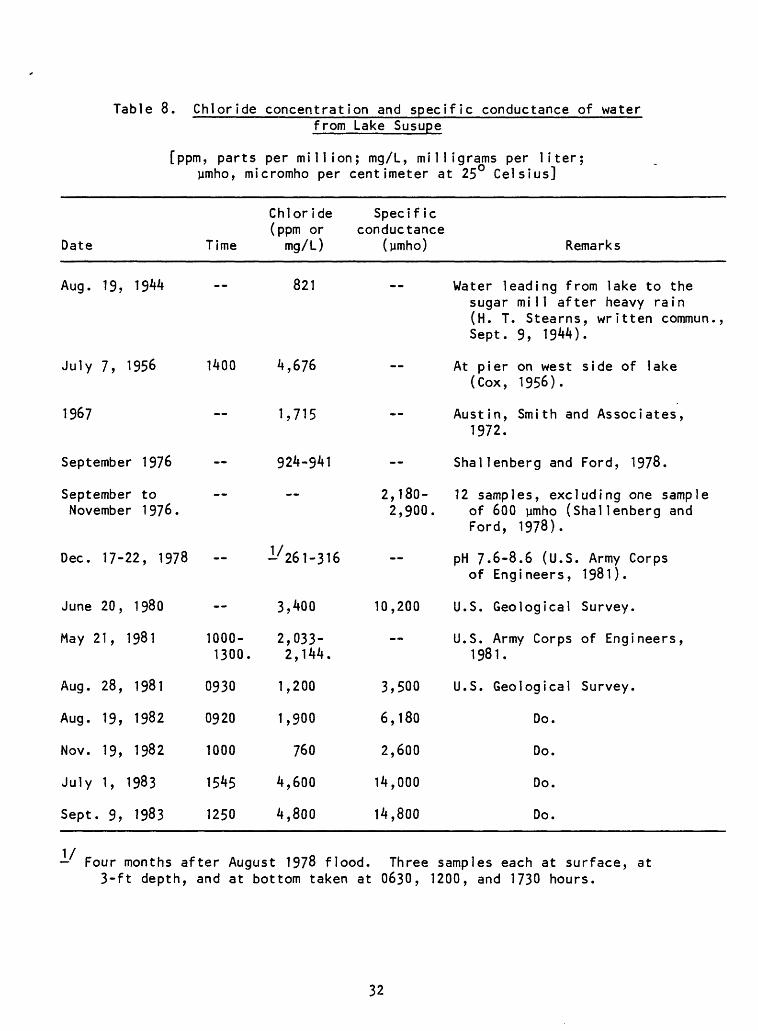
Table 8. Chloride concentration and specific conductance of waterfrom Lake Susupe
[ppm, parts per million; mg/L, milligrams per liter; yrnho, micromho per centimeter at 25 Celsius]
Date
Chloride(ppm or
Time mg/L)
Specificconductance
(yrnho) Remarks
Aug. 19,
July 7, 1956
1967
September 1976
September toNovember 1976.
821
1400 4,676
1,715
924-941
2,180- 2,900
Water leading from lake to the sugar mill after heavy rain (H. T. Stearns, written commun., Sept. 9, 1944).
At pier on west side of lake (Cox, 1956).
Austin, Smith and Associates, 1972.
Shallenberg and Ford, 1978.
12 samples, excluding one sample of 600 ymho (Shallenberg and Ford, 1978).
Dec.
June
May
Aug.
Aug.
Nov.
July
Sept
17-22, 1978 -
20,
21,
28,
19,
19,
1,
- 9,
1980
1981
1981
1982
1982
1983
1983
1000- 1300.
0930
0920
1000
1545
1250
1/261-316
3
2
1
1
4
4
,400
,033- 2,144.
,200
,900
760
,600
,800
10
3
6
2
14
14
,200
,500
,180
,600
,000
,800
pH 7.6-8.6 (U.S. Army Corps of Engineers, 1981).
U.S. Geological Survey.
U.S. Army Corps of Engineers, 1981.
U.S. Geological Survey.
Do.
Do.
Do.
Do.
Four months after August 1978 flood. Three samples each at surface, at 3-ft depth, and at bottom taken at 0630, 1200, and 1730 hours.
32
Lake Susupe Lake-level Recording Station
Location: Lat 15°09'15" N., long 145 O42'42" E., on west side of lake.
Period of record: February 1981 to December 1983.
Gage; Water-level recorder. Zero of gage is mean sea level.
Remarks: Records good.
Extremes for period of record; Maximum gage height, 4.61 ft, Oct. 19, 1982;
minimum, 0.70 ft, June 13, 1983.
Extremes outside the period of record; Stage of 7.6 ft above mean sea level
on Aug. 12, 1978, was highest level in memory of local residents.
Table 9. Monthly and annual maximum, minimum, and mean water levelsof Lake Susupe, in
1981Max.Min.Mean
1982Max.Min.Mean
1983Max.Min.Mean
Jan.
2.752.302.55
1.731.331.50
Feb.
2.181.842.05
2.692.242.45
*1.32*1.02*1.14
Mar.
1.891.551.74
2.302.082.17
1.15.90
*1.02
Apr.
1.601.451.51
2.231.852.04
.94
.86
.89
May
1.471.221.36
1.851.651.73
.87
.75
.80
feet above mean sea level
June
1.281.201.24
2.381.501.74
.79
.71
.74
July
2.731.251.59
3.142.282.48
1.12.80.97
Aug.
4.373.023.69
3.102.532.71
2.351.071.90
Sept.
3.552.622.85
2.562.202.38
2.282.122.18
Oct.
2.712.462.61
4.552.183.14
2.662.242.47
Nov.
3.072.392.65
2.752.082.39
2.612.382.48
Dec.
2.762.462.59
2.111.741.93
2.372.152.23
Year
__ --
4.551.502.31
2.66.71
1.53
* About.
33
1981
C1
- Chloride co
ncen
trat
ion
. J.
ll ..
il i.
...I
. .1.
....
.J...IL
...I..
..
...
.. h.
Cl, 2,
100
mg/L . iLi
..jli.
Jlil
I..J 1
1 L JilLlli
l. .
J.ll
j.. IL«
..1...
.1.1
I. hi
re o
1982
Cl
- Chloride co
ncen
trat
ion
Cl,
760
mg
/L
-
J...
.Ill
. ...
i.i.
..I.
..J
. i..ui
i.l... i
LU _J to h-
_J
_J
< u_ z <
Cl,
4,8
00
m
g/L
1983
Cl
- Chloride co
ncen
trat
ion Cl, 4,
600
mg/L
li..
JL
iiiU
lJlilJ
il 1
Li.,
. I,
,.,..
JAN
. F
EB
. M
AR
. A
PR
. M
AY
JU
NE
JU
LY
A
UG
. S
EP
T.
OC
T.
NO
V.
DE
C.
Figure 1
4.
Wate
r level
of La
ke Su
supe
and
rain
fall
at
Isley
Fiel
d (1981-83).
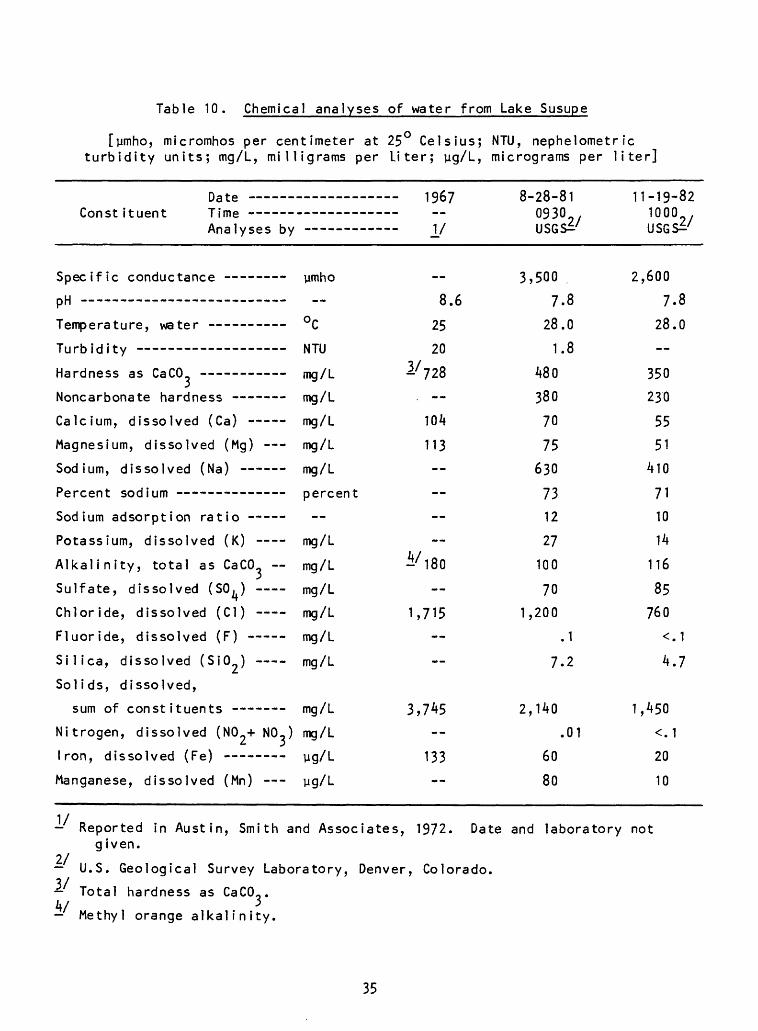
Table 10. Chemical analyses of water from Lake Susupe
[vimho, micromhos per centimeter at 25 Celsius; NTU, nephelometric turbidity units; mg/L, milligrams per Liter; yg/L, micrograms per liter]
Date 1967 8-28-81 11-19-82Constituent Time °93°o/ 1000.
Analyses by \J USGS^' USGS^'
Specific conductance - vimho 3,500 2,600
pH 8.6 7.8 7.8
Temperature, water °C 25 28.0 28.0
Turbidity NTU 20 1.8
Hardness as CaCO mg/L ^728 480 350
Noncarbonate hardness mg/L 380 230
Calcium, dissolved (Ca) mg/L 104 70 55
Magnesium, dissolved (Mg) mg/L 113 75 51
Sodium, dissolved (Na) mg/L -- 630 410
Percent sodium percent 73 71
Sodium adsorption ratio 12 10
Potassium, dissolved (K) mg/L 27 14
Alkalinity, total as CaCO mg/L -/180 100 116
Sulfate, dissolved (SO^) mg/L 70 85
Chloride, dissolved (Cl) mg/L 1,715 1,200 760
Fluoride, dissolved (F) mg/L .1 <.1
Silica, dissolved (Si02 ) mg/L 7.2 4.7
Solids, dissolved,
sum of constituents mg/L 3,745 2,140 1,450
Nitrogen, dissolved (NO + NO-) mg/L -- .01 <.1
Iron, dissolved (Fe) ug/L 133 60 20
Manganese, dissolved (Mn) ug/L 80 10
- Reported in Austin, Smith and Associates, 1972. Date and laboratory not given.
2/- U.S. Geological Survey Laboratory, Denver, Colorado.
- Total hardness as CaCO,.4/ 3- Methyl orange alkalinity.
35
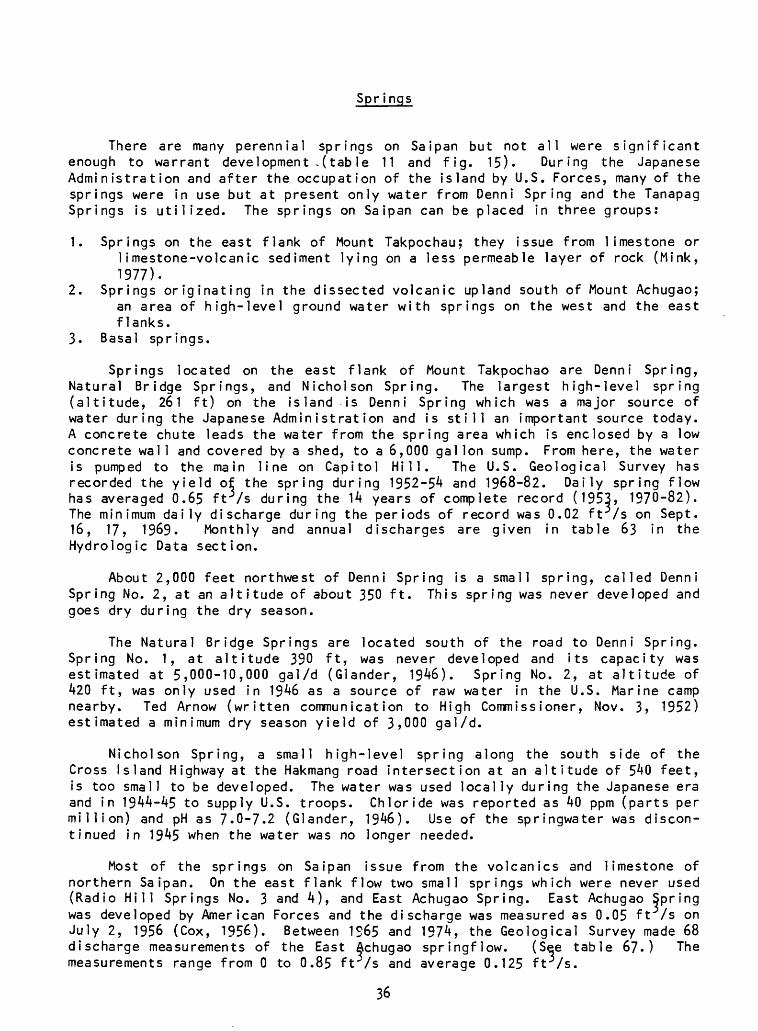
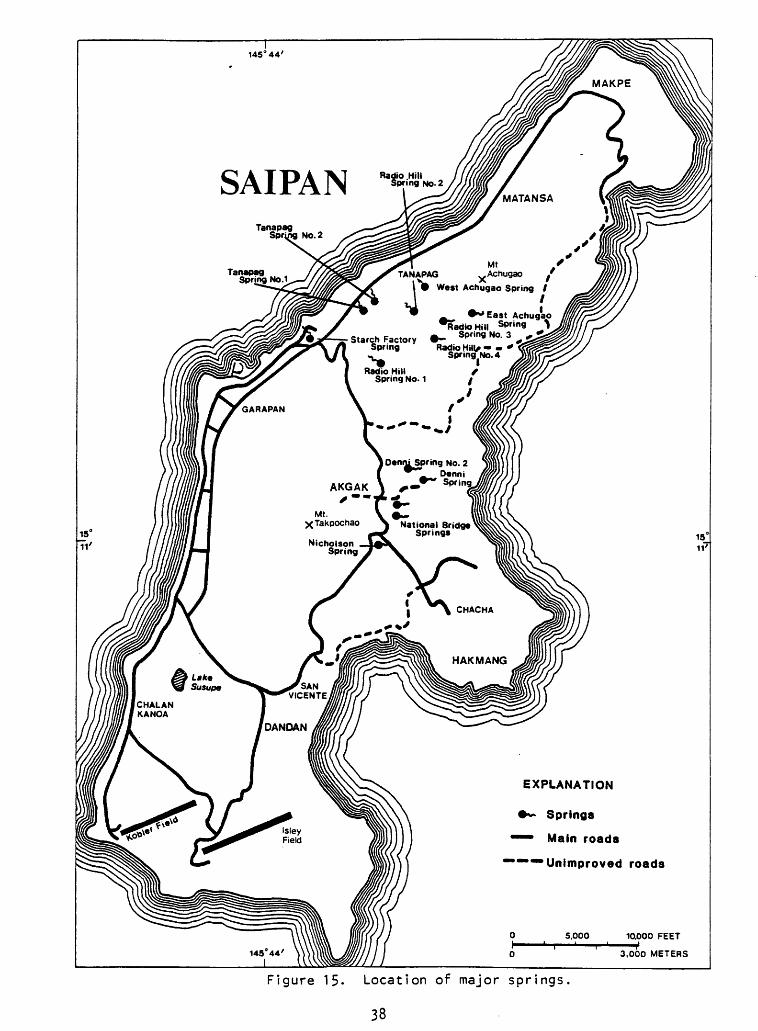
Springs
There are many perennial springs on Saipan but not all were significant enough to warrant development-(table 11 and fig. 15)- During the Japanese Administration and after the occupation of the island by U.S. Forces, many of the springs were in use but at present only water from Denni Spring and the Tanapag Springs is utilized. The springs on Saipan can be placed in three groups:
1. Springs on the east flank of Mount Takpochau; they issue from limestone or limestone-volcanic sediment lying on a less permeable layer of rock (Mink, 1977).
2. Springs originating in the dissected volcanic upland south of Mount Achugao; an area of high-level ground water with springs on the west and the east flanks.
3. Basal springs.
Springs located on the east flank of Mount Takpochao are Denni Spring, Natural Bridge Springs, and Nicholson Spring. The largest high-level spring (altitude, 261 ft) on the island is Denni Spring which was a major source of water during the Japanese Administration and is still an important source today. A concrete chute leads the water from the spring area which is enclosed by a low concrete wall and covered by a shed, to a 6,000 gallon sump. From here, the water is pumped to the main line on Capitol Hill. The U.S. Geological Survey has recorded the yield of the spring during 1952-54 and 1968-82. Daily spring flow has averaged 0.65 ftvs during the 14 years of complete record (1953, 1970-82). The minimum daily discharge during the periods of record was 0.02 ft /s on Sept. 16, 17, 1969. Monthly and annual discharges are given in table 63 in the Hydrologic Data section.
About 2,000 feet northwest of Denni Spring is a small spring, called Denni Spring No. 2, at an altitude of about 350 ft. This spring was never developed and goes dry during the dry season.
The Natural Bridge Springs are located south of the road to Denni Spring. Spring No. 1, at altitude 390 ft, was never developed and its capacity was estimated at 5,000-10,000 gal/d (Glander, 1946). Spring No. 2, at altitude of 420 ft, was only used in 1946 as a source of raw water in the U.S. Marine camp nearby. Ted Arnow (written communication to High Commissioner, Nov. 3, 1952) estimated a minimum dry season yield of 3,000 gal/d.
Nicholson Spring, a small high-level spring along the south side of the Cross Island Highway at the Hakmang road intersection at an altitude of 540 feet, is too small to be developed. The water was used locally during the Japanese era and in 1944-45 to supply U.S. troops. Chloride was reported as 40 ppm (parts per million) and pH as 7.0-7.2 (Glander, 1946). Use of the springwater was discon tinued in 1945 when the water was no longer needed.
Most of the springs on Saipan issue from the volcanics and limestone of northern Saipan. On the east flank flow two small springs which were never used (Radio Hill Springs No. 3 and 4), and East Achugao Spring. East Achugao Spring was developed by American Forces and the discharge was measured as 0.05 ft /s on July 2, 1956 (Cox, 1956). Between 1S65 and 1974, the Geological Survey made 68 discharge measurements of the East Achugao springflow. (See table 67.) The measurements range from 0 to 0.85 ftvs and average 0.125 ffvs.
36
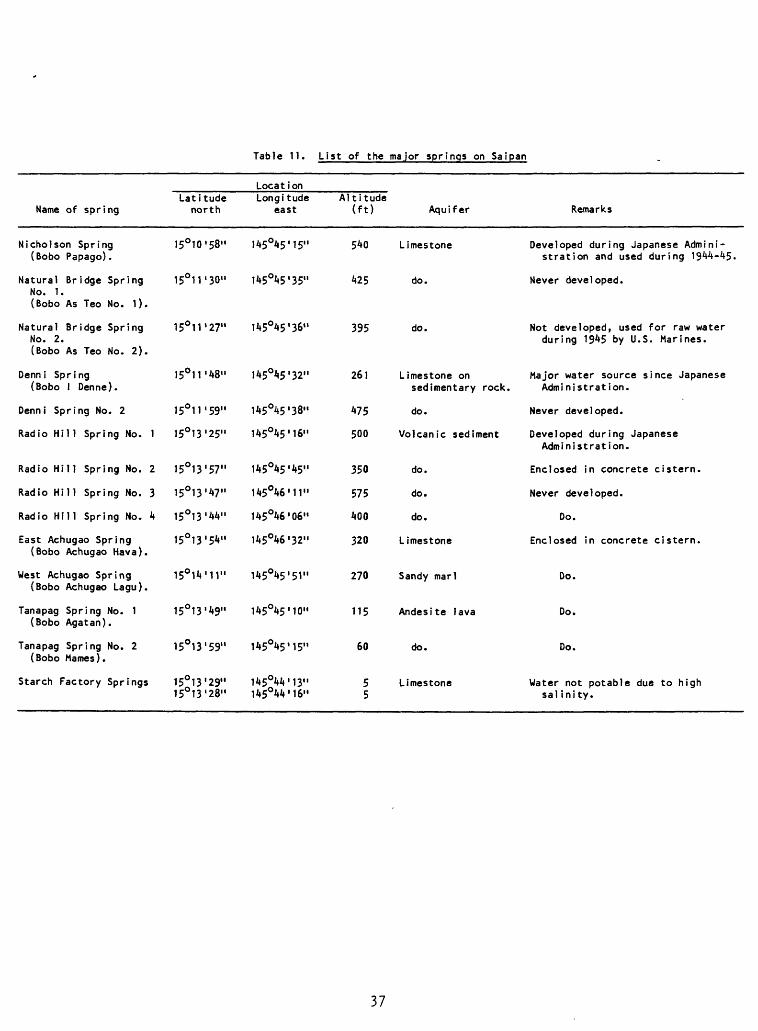
Table 11. List of the major springs on Saipan
Name of spring
Nicholson Spring (Bobo Papago).
Natural Bridge SpringNo. 1.(Bobo As Teo No. 1).
Natural Bridge Spring No. 2. (Bobo As Teo No. 2).
Denn i Spring (Bobo 1 Denne).
Denn i Spring No. 2
Radio Nil 1 Spring No. 1
Radio Hill Spring No. 2
Radio Nil 1 Spring No. 3
Radio Hill Spring No. 4
East Achugao Spring (Bobo Achugao Hava).
West Achugao Spring (Bobo Achugao Lagu).
Tanapag Spring No. 1 (Bobo Agatan).
Tanapag Spring No. 2 (Bobo Mames).
Starch Factory Springs
Latitude north
15°10'58"
150 11'30"
15°11 I 27"
15°11'48"
150 11'59"
150 13'25"
150 13'57"
150 13'47"
15°13'J|Ji"
15°13'5V'
15°1V11"
150 13'49"
15°13'59"
15°13'29" 15°13'28"
LocationLongitude
east
145°45'15"
145045'35"
145045'36"
1 i»5°A5 l 32"
H,5°45i38"
145°45'16"
145045'45"
145046'11"
145°46'06"
145°46'32"
I^S^S'SI"
I^S^S'IO"
}k^°^S t ]Sn
145044'13" 145°44'16"
Altitude (ft)
540
425
395
261
A75
500
350
575
400
320
270
115
60
5 5
Aquifer
Limestone
do.
do.
Limestone on sedimentary rock.
do.
Volcanic sediment
do.
do.
do.
Limestone
Sandy marl
Andes ite lava
do.
Limestone
Remarks
Developed during Japanese Admini stration and used during 1944-45.
Never developed.
Not developed, used for raw water during 19^5 by U.S. Marines.
Major water source since Japanese Admi nistrat ion.
Never developed.
Developed during JapaneseAdministrat ion.
Enclosed in concrete cistern.
Never developed.
Do.
Enclosed in concrete cistern.
Do.
Do.
Do.
Water not potable due to high sal ini ty.
37
D«nnj Spring No. 2 Oenni Spri
** Springs
~~ Main roads
" ""Unimproved roads
Figure 15- Location of major springs.
38
On the west flank several springs occur. The largest are Tanapag Springs No. 1 and 2, which continue to contribute to the water-supply system. Prior to the drilling of wells 8a and 8b, the yield of Spring No. 2 was measured on July 20, 1944, as 54,000 gal/d and of Spring No. 1 on Aug. 18, 1944, as 36,000 gal/d. Spring No. 1 (Mink, 1977, calls it Spring No. 2) now is mostly artesian water flowing from old well 8a since the well was drilled in the spring in September 1944. Piper (1946-47) estimated the flow from the springs to be 40,000 to 100,000 gal/d. The spring water is pumped to the 200,000 gallon As Mahettok (Tanapag or Tasa) reservoir at altitude 225 ft.
The water of West Achugao Spring, at altitude 265 ft, was stored in a 20,000 gallon reservoir at altitude 233 ft before entering the central water system. Between 1967 and 1972, the Geological Survey made 57 discharge jneasurements of the spring yield. The measurements varied from a low of 0.01 ft /s on Sept. 19, 1969 to a high of 0.43 ft 3 /s on Feb. 6, 1970. (See table 68.) Mean of measurements made during the 1969 water year was 0.05 ft^/s; during 197Q, 0.15 ft-Vs; and during 1972, 0.18 ft-Vs. Mean of all measurements was 0.14 ftvs and the median 0.09 ft-Vs. The spring water is no longer used.
Also on the west flank two minor spring occur, Radio Hill Spring No. 1 and 2. Spring No. 1 was used during the Japanese Administration and Spring No. 2 during the early years of the American Administration. Maximum yield of each spring was estimated at 30,000 gal/d (Piper, 1946-47).
The only significant basal springs on Saipan are the Starch Factory Springs. The yield of the springs has never been measured as the springs discharge at several places and only slightly above sea level in a swampy area. During the Japanese Administration, some of the spring water was piped to a starch factory in an industrial area where the Tanapag docks are now located. The water has not been used since because of the high chloride concentration of the water: 1,200 ppm, June 16, 1980 and Sept. 27, 1982 (discharge about 2 Mgal/d, Nance, 1982).
For more data of the springs, see the Hydrologic Data section.
Ground Water
General
In "Military Resources", Dan A. follows:
Geology of Davis (1959)
Saipan, Mariana Islands, Volume II, Water describes the occurrence of ground water as
In an island of uniform and favorable permeability, some of the rain water moves downward to the water table and accumulates as basal ground water forming a buoyant though not static mass floating on the sea water in the rocks below sea level. Ideally this fresh-water body has the shape of a double-convex lens, the edge approximating the shoreline of the island. The upper surface of the water is only slightly above sea level but the lower surface extends below sea level several times the height of the upper surface above sea level. Recharge of fresh water from rainfall takes place uniformly over the top surface of the lens; discharge occurs only in a relatively narrow zone around the shore.
39
If the rate of recharge were constant the height of a lens above sea level, the thickness, and the rate of discharge would be constant except for variation caused by sea-level fluctuations. An increase in recharge rate would cause a rise in head, or height, followed by increases in thickness of the lens and rate of discharge. If the rate of recharge should drop, head, thickness, and discharge rate also would drop to new conditions of stability. If recharge should cease, discharge would continue at a diminishing rate and the lens would decay. Actually, the rate of recharge fluctuates with variations in rainfall; consequently, a basal lens is never at rest, and head, thickness, and discharge continually react to changes in the rate of recharge.
Tidal fluctuations in sea level and fluctuations in the thickness of a lens cause movement and mixing at the interface between fresh and salt waters and the formation of a brackish transition zone. The thickness of the zone depends, to a considerable degree, on the perme ability of the rock. For example, in highly permeable material, even though fluctuations are moderate, the zone of transition may grow until it extends throughout the thickness of the lens, making the entire 'fresh water 1 lens brackish.
In Saipan rock permeability is far from uniform. The volcanic rocks and the sedimentary rocks derived from them, which form the bulk of the island, have generally low permeability but variations are common. Limestones, the most widespread rocks on the surface, have generally high permeabilities, but permeabilities vary greatly in short distances. In places, sandstone and tuffaceous members and limestone facies of low permeability act as confining members rather than aquifers.
Because of their low permeability the volcanic rocks and associated sedimentary rocks, as a whole, are not good water-bearing materials even though they probably contain large quantities of high- level ground water in small pores and cracks. In places the volcanic rocks supply springs, seeps, and a few wells, but in general little water is available to any single installation. These rocks, in one locality, act as a perching member under permeable limestone and hold up a considerable quantity of recoverable high-level ground water.
Large quantities of ground water occur as basal water in limestones that extend below sea level. The quality of the water is variable, however, and much of it is too saline for human consumption. The best quality water is in rubbly unconsolidated limestone which transmits water equally well in all directions. In dense consolidated limestones the principal openings transmitting water are solution channels or fissures which are large compared with intergranular openings in the rubbly rocks. The length of these openings is usually many times greater than the width and many of them are so deep that they form conduits through which considerable sea water can move laterally and upward in response to small head differences.
Ocean tides apparently are felt throughout the basal ground-water bodies in the limestone, and, because of high permeabilities, these tidal fluctuations have produced wide zones of transition between fresh and salt waters. In limestone having deep fissures, the transition zone commonly extends throughout the basal-water body, and water at the top of the lens is generally too salty for drinking although it may be considerably less salty than sea water. In much of the rubbly limestone the zone of mixing does not extend as high and ordinarily the water at and near the top is of fair to good quality.
Areal and vertical variations in permeability in the limestones, and accompanying variations of sea-water intrusion, produce irregular and usually unpredictable patterns of salinity in the basal-water bodies of Saipan. Probably the most nearly consistent feature is a generally increasing freshness of water with distance inland from the shore; however this is not invariable and in places may consist only of a change from highly saline to slightly less saline water.
In the Chacha area of east central Saipan dipping permeable lime stone beds are overlain above and below sea level by less permeable facies of the same formation. The confining effect of the beds of low permeability has produced artesian conditions, and because the escape of water from the permeable rock is retarded, the basal-water body has greater height above and depth below sea level than the basal water in unconfined rocks.
Near the shore of the island, beaches and coastal flats are under lain by calcareous sands and detrital deposits which generally have moderate to high and rather uniform permeabilities. These materials contain basal ground water, but generally of high salinity.
When undisturbed by removal of water from wells and tunnels, the basal ground-water bodies are in a state of dynamic equilibrium with prevailing conditions of recharge, permeability, and sea-level fluctu ation. When pumping begins, the effect is equivalent to a decrease in the rate of recharge and the lens tends to adjust itself to the new set of conditions. If the artificial removal of water could be uniform over the surface of the basal water, the adjustment would consist of generally uniform reduction in head and thickness of the fresh-water body and decline in rate of natural discharge. In practice however, much of the disturbance created by pumping is concentrated in a relatively small area at the well or tunnel, and, although general adaptation to new conditions takes place, local changes in the flow pattern of the water are the major problem. It is these local changes that cause the rapid and sometimes ruinous encroachment of sea water into wells and tunnels.
Experience has shown that, for a given rate of pumping, the most rapid and intense salt-water encroachment occurs when the pumping is concentrated at a point such as a drilled well. Encroachment is least serious when the removal of water is spread over a wide area by means of tunnels having inverts just below the water table.
Wells
About 75 percent of Saipan is covered by limestone (Mink, 1969), where a basal lens of freshwater floats on ocean water near sea level. Of the wells drilled on the island most try to obtain water from this lens without drawing in the ocean water. On Saipan the height of the water table in the basal lens is less than 2 feet above sea level (Mink, 1977), thus the freshwater is easily contaminated by the underlying seawater. The chloride in one percent of seawater mixed with the freshwater, will be sufficient to reach the upper limit of the desirable range of chloride in drinking water.
As far as known, no wells were drilled on Saipan during the Japanese Admini stration. Although the island was an agricultural and light commercial center and supported a fairly large Japanese population (in excess of 20,000) besides the much smaller original population (about 4,000), the water supply depended on water from springs, rain catchments, and shallow dug wells. Tayama (1939) listed 1,125 shallow wells, most of them supplying individual homes. The chloride concentration of many wells exceeded 1,000 mg/L.
Two large dug wells, As Gonna A and B, were continued in use by U.S. Forces at first, but only As Gonna B was used for any length of time, contributing water to the Is ley Reservoir until about 1950.
After the military occupation of the island by American Forces, more than 70 wells were drilled in 1944-45 to supply water for a large number of American troops stationed on Saipan. The majority of these wells were drilled in limestone aquifers to tap the basal lens; only two of these were still in use in 1956 and both were still in use in 1983 (Maui I and IV). Some wells encountered impermeable rock and were not completed and some were abandoned when no longer needed for their specific use. Often, the wells were pumped until the chloride concentration of the water rose to unacceptable levels after which the wells were abandoned. The main exception was the Akgak well field where high-level water of good qual i ty was found. (See fig. 23.) Thi s wel 1 field is st i 1 1 being used today although the old wells were replaced by new ones of the same designation in 1969- 71, and most of these, in turn, were replaced in 1977.
Maui I and IV were the two most successful wells on Saipan. Maui-type wells consist of a shaft with infiltration tunnels at the base. Water from the tunnels drain into a sump at the base of the shaft.
During 1945-46, U.S. Military Forces constructed four of these Maui wells. Of the four wells, Maui I and IV have been in use since they were constructed although Maui I was dry during January to June 1983. Maui II was dug trying to intercept the Starch Factory Spring source before the water mixed with saltwater. The well was used from October 1945 until March 1950 when the tunnel caved in. The chloride concentration averaged about 400 mg/L. Maui III was constructed to intercept artesian flow in the Hakmang area, but no water was encountered and the shaft was abandoned before the tunnels were dug.
42
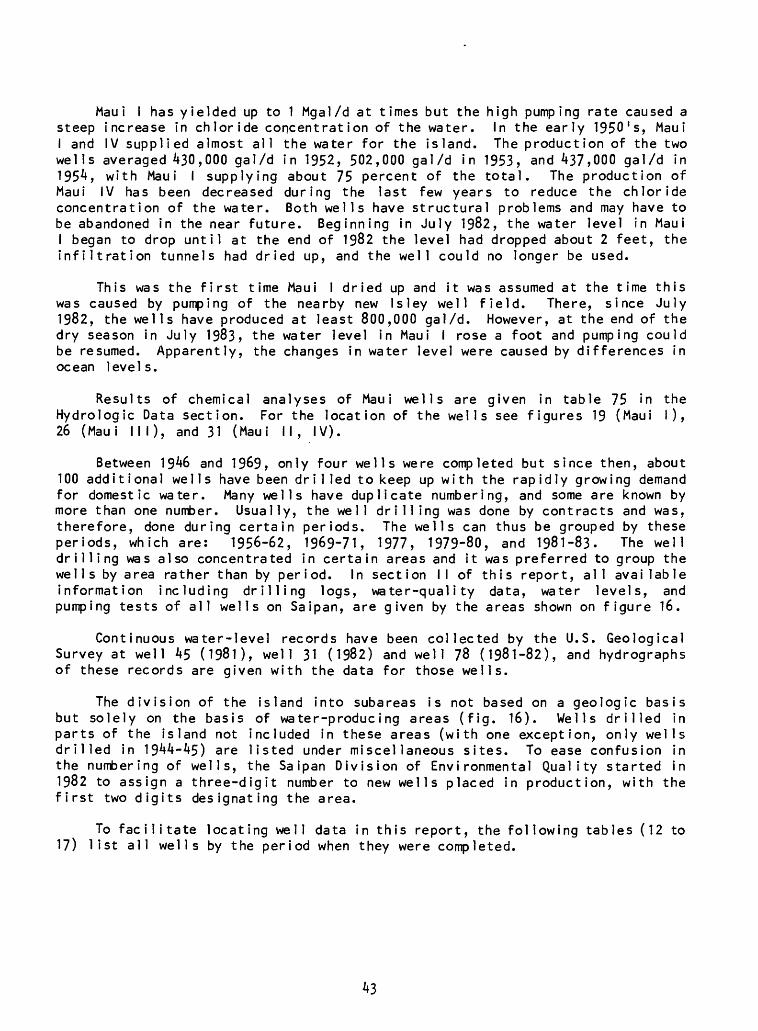
Mau i I has yielded up to 1 Mgal/d at times but the high pumping rate caused a steep increase in chloride concentration of the water. In the early 1950's, Maui I and IV supplied almost all the water for the island. The production of the two wells averaged 430,000 gal/d in 1952, 502,000 gal/d in 1953, and 437,000 gal/d in 1954, with Maui I supplying about 75 percent of the total. The production of Maui IV has been decreased during the last few years to reduce the chloride concentration of the water. Both wells have structural problems and may have to be abandoned in the near future. Beginning in July 1982, the water level in Maui I began to drop until at the end of 1982 the level had dropped about 2 feet, the infiltration tunnels had dried up, and the well could no longer be used.
This was the first time Maui I dried up and it was assumed at the time this was caused by pumping of the nearby new Isley well field. There, since July 1982, the wells have produced at least 800,000 gal/d. However, at the end of the dry season in July 1983, the water level in Maui I rose a foot and pumping could be resumed. Apparently, the changes in water level were caused by differences in ocean levels.
Results of chemical analyses of Maui wells are given in table 75 in the Hydrologic Data section. For the location of the wells see figures 19 (Maui I), 26 (Maui III), and 31 (Maui II, IV).
Between 1946 and 1969, only four wells were completed but since then, about 100 add it ional welIs have been dri1 led to keep up with the rap idly growing demand for domestic water. Many wells have duplicate numbering, and some are known by more than one number. Usually, the well drilling was done by contracts and was, therefore, done during certain periods. The wells can thus be grouped by these periods, which are: 1956-62, 1969-71, 1977, 1979-80, and 1981-83. The well drilling was also concentrated in certain areas and it was preferred to group the wel Is by area rather than by period. In section II of this report, all available information including drilling logs, water-quality data, water levels, and pumping tests of all wells on Saipan, are given by the areas shown on figure 16.
Continuous water-level records have been collected by the U.S. Geological Survey at well 45 (1981), well 31 (1982) and well 78 (1981-82), and hydrographs of these records are given with the data for those wells.
The division of the island into subareas is not based on a geologic basis but solely on the basis of water-producing areas (fig. 16). Wells drilled in parts of the island not included in these areas (with one exception, only wells drilled in 1944-45) are listed under miscellaneous sites. To ease confusion in the numbering of wells, the Saipan Division of Environmental Quality started in 1982 to assign a three-digit number to new wells placed in production, with the first two digits designating the area.
To facilitate locating well data in this report, the following tables (12 to 17) list all wells by the period when they were completed.
43
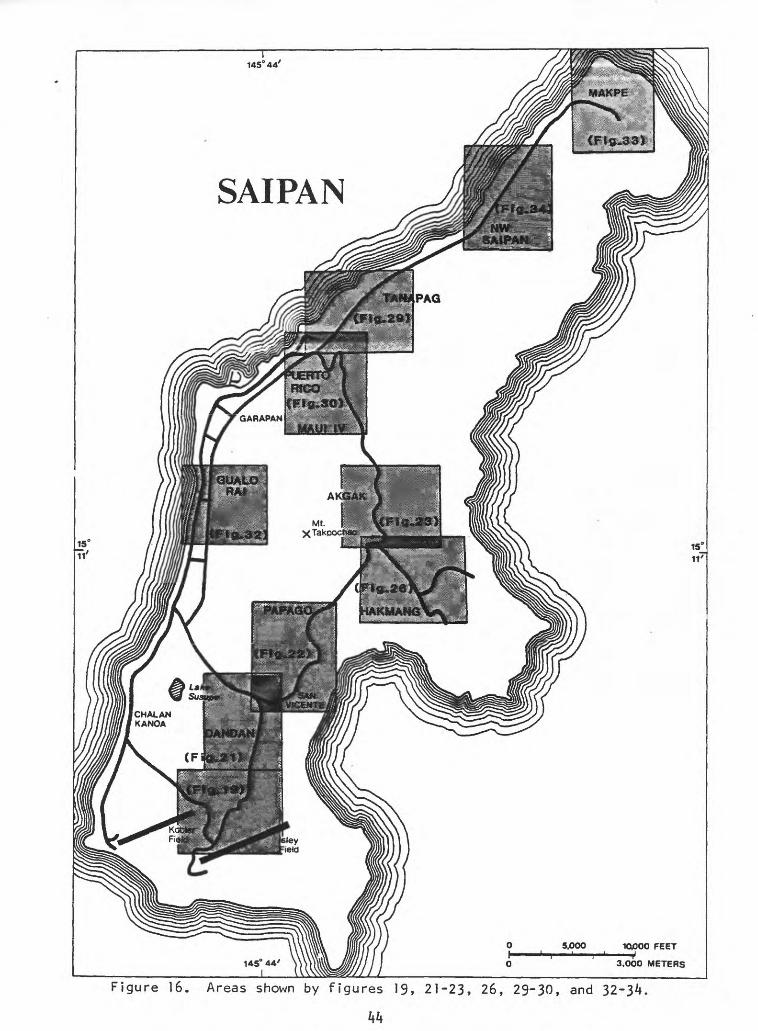
145° 44'
SAIPAN
Figure 16. Areas shown by figures 19, 21-23, 26, 29~30, and 32-34.
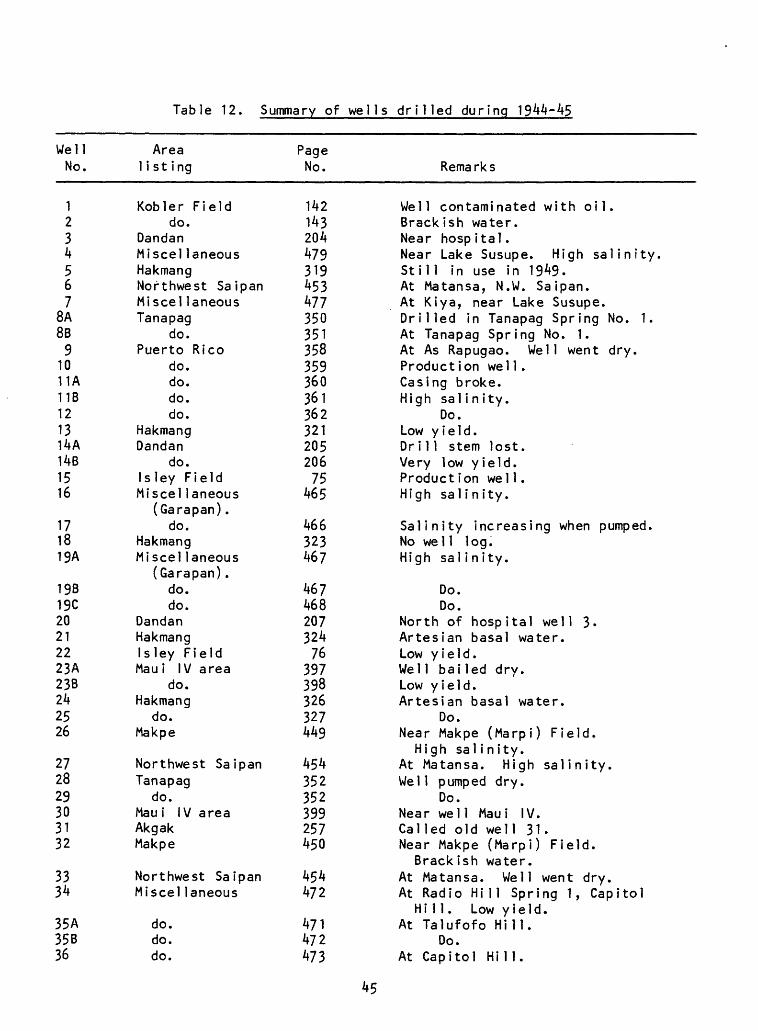
Table 12. Summary of wells drilled during 1944-45
Well No.
1234567
8ASB9
1011A11B121314A14B1516
171819A
19B19C20212223A23B242526
272829303132
3334
35A35B36
Area 1 i st ing
Kobler Fielddo.
DandanMiscel laneousHakmangNorthwest SaipanMiscel laneousTanapag
do.Puerto Rico
do.do.do.do.
HakmangDandan
do.Is ley FieldMiscel laneous
(Garapan) .do.
HakmangMiscel laneous
(Garapan) .do.do.
DandanHakmangIsley FieldMau i IV area
do.Hakmang
do.Makpe
Northwest SaipanTanapag
do.Mau i IV areaAkgakMakpe
Northwest SaipanMiscel laneous
do.do.do.
Page No.
14214320447931945347735035135835936036136232120520675
465
466323467
46746820732476
397398326327449
454352352399257450
454472
471472473
Rema rk s
Well contaminated with oil.Brack ish water.Near hospital.Near Lake Susupe. High salinity.Sti 1 1 in use in 1949.At Matansa, N.W. Saipan.At Kiya, near Lake Susupe.Drilled in Tanapag Spring No. 1.At Tanapag Spring No. 1.At As Rapugao. Well went dry.Production wel 1 .Casing broke.High salinity.
Do.Low yield.Dr i 1 1 stem lost.Very low yield.Production wel 1 .High salinity.
Salinity increasing when pumped.No wel 1 log.High salinity.
Do.Do.
North of hospital well 3.Artesian basal water.Low yield.Wel 1 bai led dry.Low yield.Artesian basal water.
Do.Near Makpe (Marpi) Field.
High salinity.At Matansa. High salinity.Wel 1 pumped dry.
Do.Near wel 1 Mau i IV.Called old well 31.Near Makpe (Marpi) Field.Brackish water.
At Matansa. Well went dry.At Radio Hill Spring 1, Capitol
Hill. Low yield.At Talufofo Hi 11.
Do.At Capitol Hi 1 1.
45
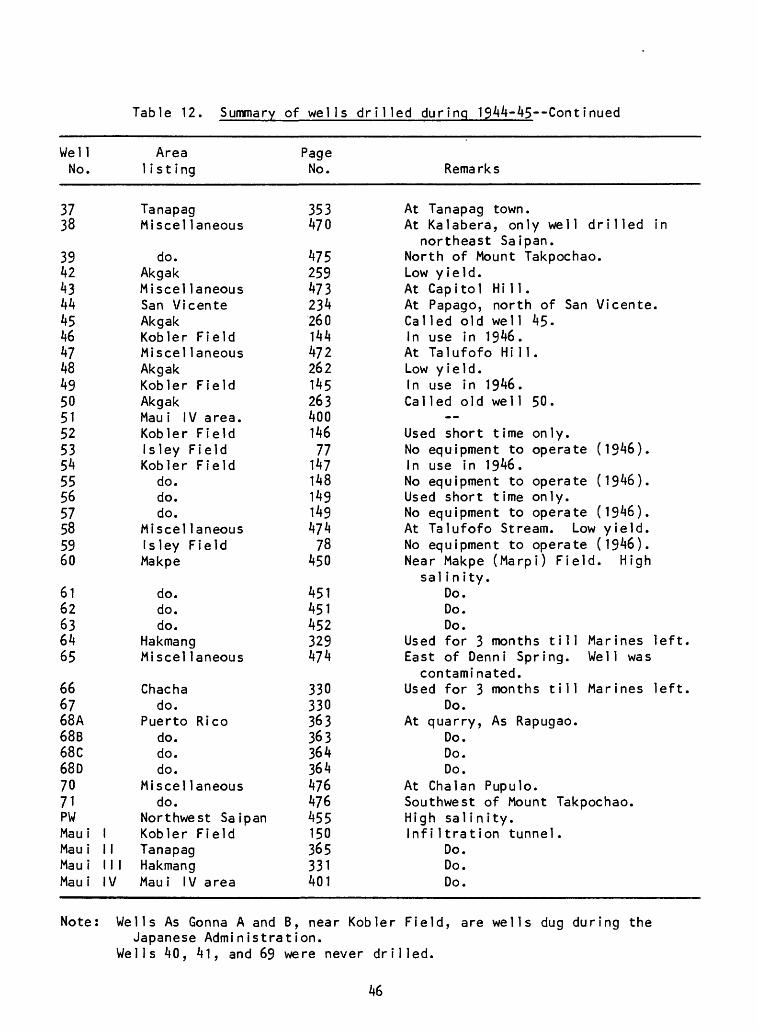
Table 12. Summary of wells drilled during 1944-45~"Continued
Well No.
3738
3942A34445464748495051525354555657585960
6162636465
666768A68668C68D7071PWMau iMau iMau iMau i
Area 1 1st ing
TanapagMiscel laneous
do.AkgakMiscel laneousSan VicenteAkgakKobler FieldMiscel laneousAkgakKobler FieldAkgakMau i IV area.Kobler Field1 s ley FieldKobler Field
do.do.do.
Miscel laneousIs ley FieldMakpe
do.do.do.
HakmangMiscel laneous
Chachado.
Puerto Ricodo.do.do.
Miscel laneousdo.
Northwest Saipan1 Kobler Field1 1 Tanapag1 1 1 HakmangIV Maui IV area
Page No.
353470
4752594732342601444722621452634001467714714814914947478
450
451451452329474
330330363363364364476476455150365331401
Remarks
At Tanapag town.At Kalabera, only well drilled in
northeast Saipan.North of Mount Takpochao.Low yield.At Capitol Hi 1 1 .At Papago, north of San Vicente.Called old well 45.In use in 1946.At Talufofo Hi 11.Low yield.In use in 1946.Called old well 50.
Used short time only.No equipment to operate (1946).In use in 1946.No equipment to operate (1946).Used short time only.No equipment to operate (1946).At Talufofo Stream. Low yield.No equipment to operate (1946).Near Makpe (Marpi) Field. High
sal i n ity.Do.Do.Do.
Used for 3 months till Marines left.East of Denni Spring. Well was
contami nated.Used for 3 months till Marines left.
Do.At quarry, As Rapugao.
Do.Do.Do.
At Chalan Pupulo.Southwest of Mount Takpochao.High salinity.Infiltration tunnel.
Do.Do.Do.
Note: Wells As Gonna A and B, near Kobler Field, are wells dug during theJapanese Administration.
Wells 40, 41, and 69 were never drilled.
46
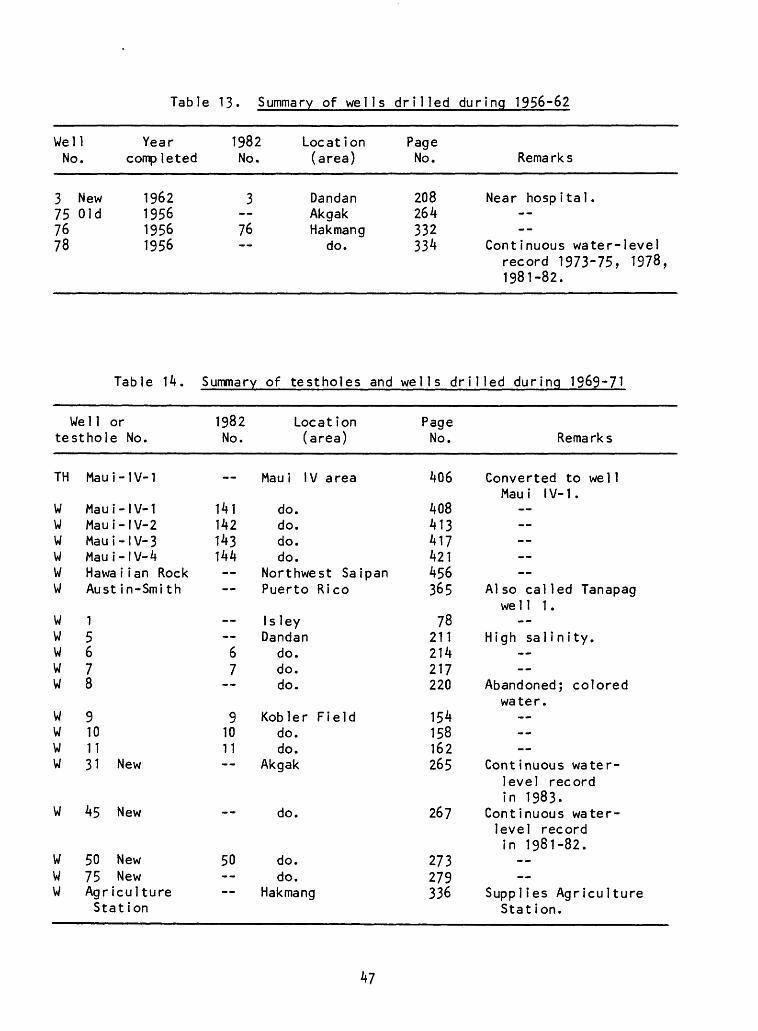
Table 13. Summary of wells drilled during 1956-62
Well YearNo. completed
3 New 196275 Old 195676 195678 1956
Table 14.
Well ortesthole No.
TH Maui-IV-1
W Maui-IV-1W Maui-IV-2W Maui-IV-3W Maui-IV-4W Hawa i ian RockW Austin-Smith
W 1W 5W 6W 7W 8
W 9W 10W 11W 31 New
W 45 New
W 50 NewW 75 NewW Agriculture
Stat ion
1982 LocationNo.
3 76
Summary
1982No.
_
141142143144
67
91011
50
(area)
OandanAkgakHakmang
do.
of testholes and
Location(area)
Mau i IV area
do.do.do.do.
Northwest SaipanPuerto Rico
Is leyOandan
do.do.do.
Kobler Fielddo.do.
Akgak
do.
do.do.
Hakmang
PageNo.
208264332334
wel 1 s dr i 1
PageNo.
406
408413417421456365
78211214217220
154158162265
267
273279336
Remarks
Near hospital. __
Continuous water-levelrecord 1973-75, 1978,1981-82.
led during 1969-71
Remarks
Converted to wel 1Maui IV-1.
Also called Tanapagwell 1.
High sal i n ity.
Abandoned; coloredwater.
Continuous water-level recordin 1983.
Continuous water-level recordin 1981-82.
----
Supplies AgricultureStat ion.
47
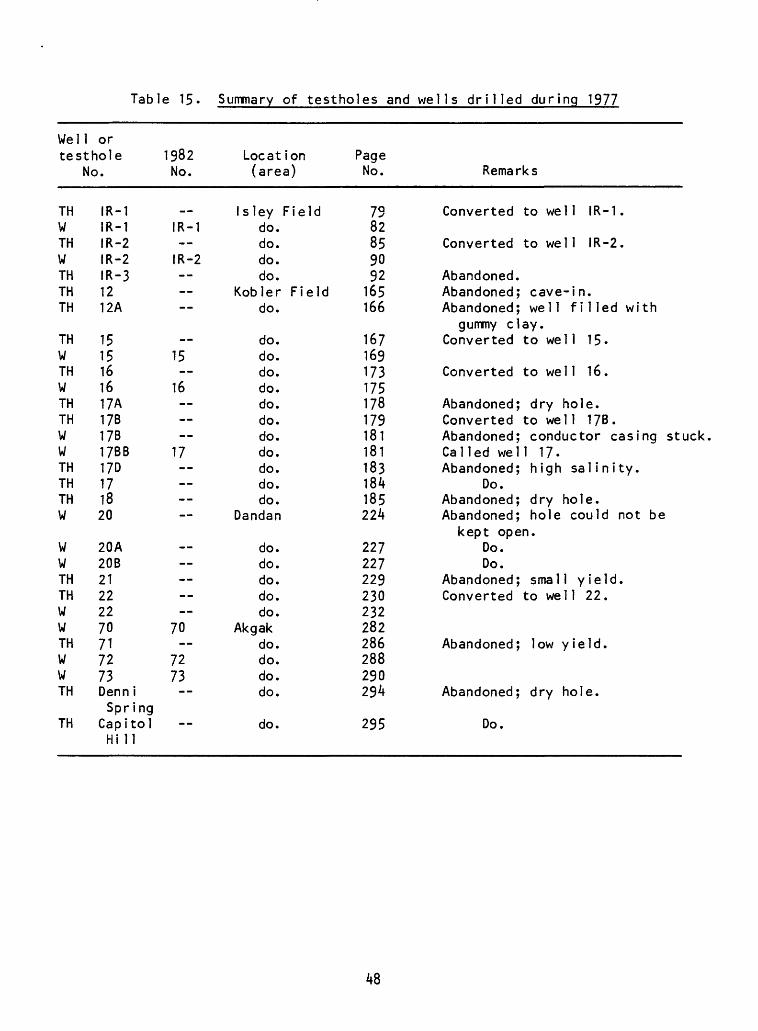
Table 15. Summary of testholes and wells drilled during 1977
Well or testhole
No.
THWTHWTHTHTH
THWTHWTHTHWWTHTHTHW
WWTHTHWWTHWWTH
TH
IR-1IR-1IR-2IR-2IR-31212A
1515161617A17B17B17BB170171820
20A20B21222270717273Denn iSpring
CapitolHi 11
1982 No.
__IR-1--IR-2
15
16
17
70
7273
Location (area)
Is ley Fielddo.do.do.do.
Kobler Fielddo.
do.do.do.do.do.do.do.do.do.do.do.
Dandan
do.do.do.do.do.
Akgakdo.do.do.do.
do.
Page No.
7382859092165166
167169173175178179181181183184185224
227227229230232282286288290294
295
Remarks
Converted to wel 1 IR-1.
Converted to well IR-2.
Abandoned.Abandoned; cave-in.Abandoned; well filled with
gummy clay.Converted to well 15.
Converted to well 16.
Abandoned; dry hole.Converted to wel 1 17B.Abandoned; conductor casing stuckCalled well 17.Abandoned; high salinity.
Do.Abandoned; dry hole.Abandoned; hole could not be
kept open.Do.Do.
Abandoned; small yield.Converted to well 22.
Abandoned; low yield.
Abandoned; dry hole.
Do.
48
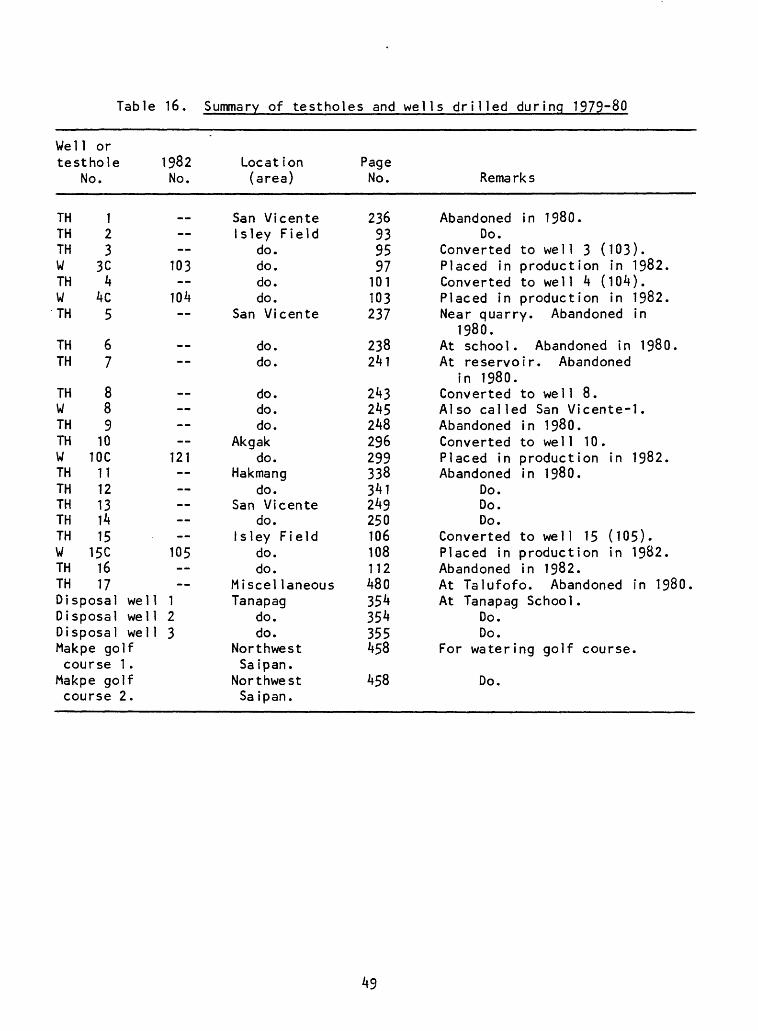
Table 16. Summary of testholes and wells drilled during 1979~80
Well or testhole 1982
No. No.
TH 1TH 2TH 3W 3C 103TH 4W 4C 104TH 5
TH 6TH 7
TH 8W 8TH 9TH 10W 10C 121TH 1 1TH 12TH 13TH 14TH 15W 15C 105TH 16TH 17Disposal well 1Disposal well 2Disposal well 3Makpe golfcourse 1 .
Makpe golfcourse 2.
Locat ion (area)
San VicenteIs ley Field
do.do.do.do.
San Vicente
do.do.
do.do.do.
Akgakdo.
Hakmangdo.
San Vicentedo.
Is ley Fielddo.do.
Miscel laneousTanapag
do.do.
NorthwestSa ipan.
NorthwestSa ipan.
Page No.
236939597
101103237
238241
243245248296299338341249250106108112480354354355458
458
Remarks
Abandoned in 1980.Do.
Converted to well 3 (103).Placed in production in 1982.Converted to well 4 (104).Placed in production in 1982.Near quarry. Abandoned in
1980.At school. Abandoned in 1980.At reservoir. Abandoned
in 1980.Converted to we 1 1 8.Also called San Vicente-1.Abandoned in 1980.Converted to well 10.Placed in production in 1982.Abandoned in 1980.
Do.Do.Do.
Converted to well 15 (105).Placed in production in 1982.Abandoned in 1982.At Talufofo. Abandoned in 1980.At Tanapag School.
Do.Do.
For watering golf course.
Do.
49
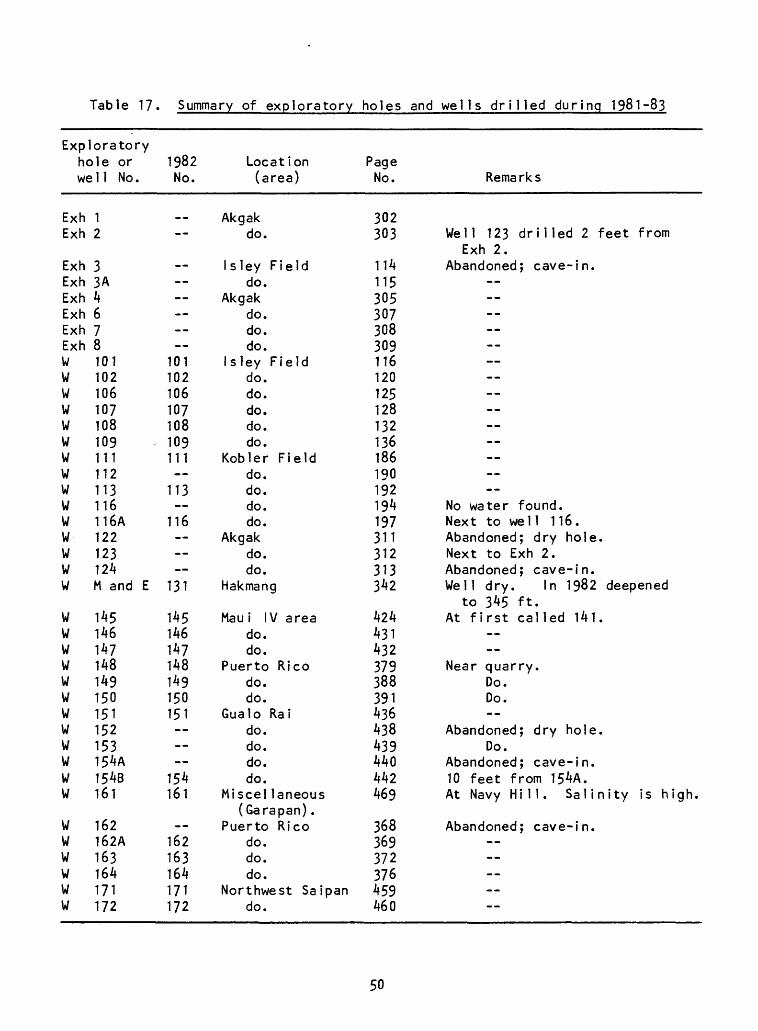
Table 17. Summary of exploratory holes and wells drilled during 1981-83
Exploratory hole or we 1 1 No .
Exh 1Exh 2
Exh 3Exh 3AExh 4Exh 6Exh 7Exh 8W 101W 102W 106W 107W 108W 109W 111W 112W 113W 116W 116AW 122W 123W 124W M and E
W 145W 146W 147W 148W 149W 150W 151W 152W 153W 154AW 154BW 161
W 162W 162AW 163W 164W 171W 172
1982 No.
101102106107108109111
113
116
131
145146147148149150151
154161
162163164171172
Location (area)
Akgakdo.
Isley Fielddo.
Akgakdo.do.do.
Isley Fielddo.do.do.do.do.
Kobler Fielddo.do.do.do.
Akgakdo.do.
Hakmang
Mau i IV areado.do.
Puerto Ricodo.do.
Gualo Raido.do.do.do.
Miscel laneous(Garapan) .
Puerto Ricodo.do.do.
Northwest Saipando.
Page No.
302303
114115305307308309116120125128132136186190192194197311312313342
424431432379388391436438439440442469
368369372376459460
Remarks
Well 123 drilled 2 feet fromExh 2.
Abandoned; cave-in.
No water found.Next to well 1 16.Abandoned; dry hole.Next to Exh 2.Abandoned; cave-in.Well dry. In 1982 deepened
to 345 ft.At first called 141.
Near quarry.Do.Do.
Abandoned; dry hole.Do.
Abandoned; cave-in.10 feet from 154A.At Navy Hill. Salinity is high.
Abandoned; cave-in. --
50
Water Quali ty
Except for chloride concentrations of wells in the western coastal area given by Tayama (1939)» no record of analyses of water from Saipan prior to the American Administration have been found. During the period 19^-^6, when large numbers of American Forces were on the island, much attention was paid to the water supply. The only chemical analyses available for some of the small springs and old wells date from this period. Although the units are now normally given in milligrams per liter, for these analyses they are presented as reported. Parts per million can be considered to be the same as milligrams per liter where the density is 1.000. Normally water has a density of 1.0. Table 18 lists the analyses of spring, lake, stream, and ground water presented in this publication, and figure 17 shows the location of the sampling sites. Results of the analyses are given in the respective section.
All major springs except the Starch Factory Springs, are high-level springs with water of good quality although the level of dissolved iron and bicarbonate are fairly high. Dissolved iron varied from 310 to kS2 yg/L (microgram per liter). The World Health Organization (1971) recommends a desirable level of 100 yg/L and a maximum permissible level of 1,000 yg/L (table 19)- Iron is a minor element in water but can cause problems where the concentration exceeds 300 yg/L. It can affect the taste, color, turbidity and can sustain the growth of iron bacteria. A high level of bicarbonate normally is caused by contact with limestone and then shows also high levels of calcium.
Starch Factory Springs are basal springs and the spring water has a high chloride concentration which makes the water unfit for consumption. Although they are the largest springs on the island, the water is not used.
Ground water from the basal lens also tends to have a high concentration of chloride. This concentration often depends on the pumping. Heavy pumping leads to a steep increase in chloride concentration which often causes wells to be abandoned. In contrast, water from high-level perched sources normally is of good quality as there is no underlying saline water which can be drawn in.
The specific conductance of water from the basal lens on Saipan generally is high, at times in excess of 5*000 ymho at some wells. Specific conductance is expressed in micromhos per centimeter at 25°C. It is a measure of the ability of water to transmit an electric current and is used as an indicator of the concen tration of dissolved solids in water; the more dissolved solids, the greater the conductance. The high specific conductance of most well-water samples was mainly caused by the high chloride concentration.
pH is a measure of acidity or basicity, and depends on hydrogen-ion concen tration. Generally the pH values for ground water on Saipan ranged between 7 and 8, within the recommended range for public water supply (World Health Organization, 1971).
The most important chemical constituent of the ground water on Saipan is chloride. It is the chloride concentration of the water which limits the produc tion and the use of ground water. As chloride concentration depends on the amount of pumpage and varies by area, it is discussed in the sections on Water Production and Ground Water Production Areas.
51
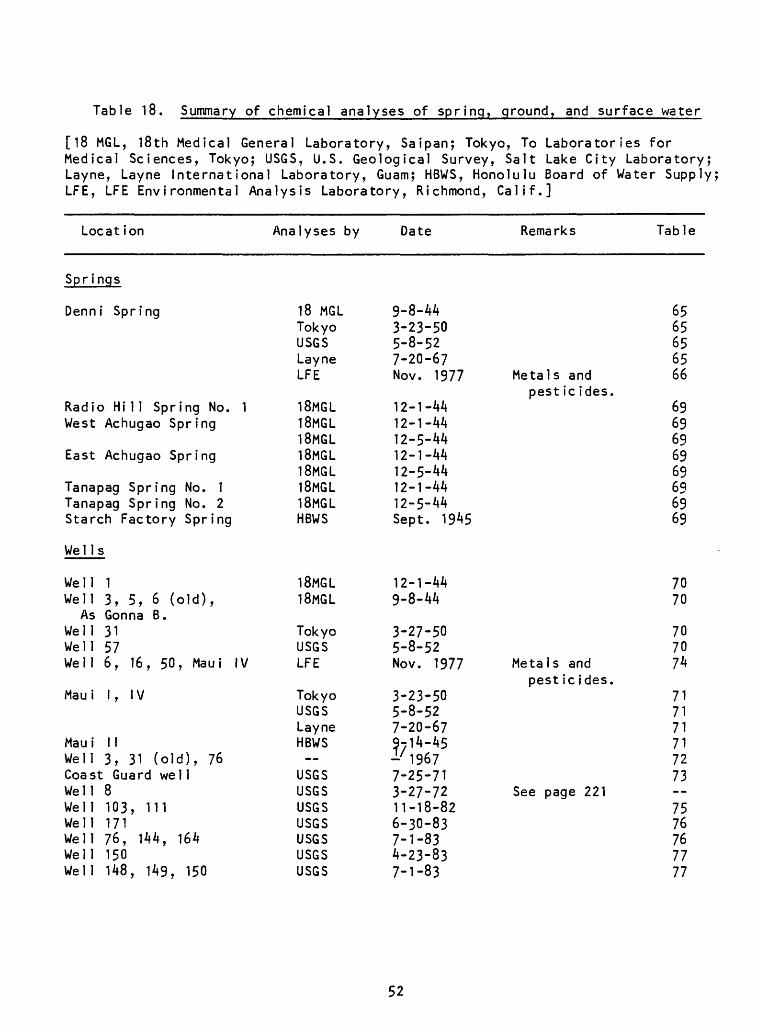
Table 18. Summary of chemical analyses of spring, ground, and surface water
[18 MGL, 18th Medical General Laboratory, Saipan; Tokyo, To Medical Sciences, Tokyo; USGS, U.S. Geological Survey, Salt Layne, Layne International Laboratory, Guam; HBWS, HonoluluLFE, LFE Environmental Analysis Laboratory, Richmond, Calif.]
Laboratories for Lake City Laboratory; Board of Water Supply;
Locat ion Analyses by Date Remarks Table
Springs
Denni Spring
Radio Hi 11 Spring No. West Achugao Spring
East Achugao Spring
Tanapag Spring No. Tanapag Spring No. Starch Factory Spr
Wells
WellWell
AsWellWellWell
Mau i
Mau iWellCoastWellWellWellWellWellWell
13, 5, 6 (old)Gonna B.3157
1 2 ing
9
6, 16, 50, Maui
I, IV
II3, 31 (old),Guard wel 1
8103, 11117176, 144, 164150148, 149, 150
76
18 MGLTokyoUSGSLayneLFE
18MGL18MGL18MGL18MGL18MGL18MGL18MGLHBWS
9-8-443-23-505-8-527-20-67Nov. 1977
12-1-4412-1-4412-5-4412-1-4412-5-4412-1-4412-5-44Sept. 1945
IV
18MGL18MGL
TokyoUSGSLFE
TokyoUSGSLayneHBWS
USGSUSGSUSGSUSGSUSGSUSGSUSGS
12-1-449-8-44
3-27-505-8-52Nov. 1977
3-23-505-8-527-20-6797 l4-45i/19677-25-713-27-7211-18-826-30-837-1-834-23-837-1-83
Metals and pest ic ides,
Metals and pest ic ides
See page 221
6565656566
6969696969696969
7070
707074
717171717273
7576767777
52
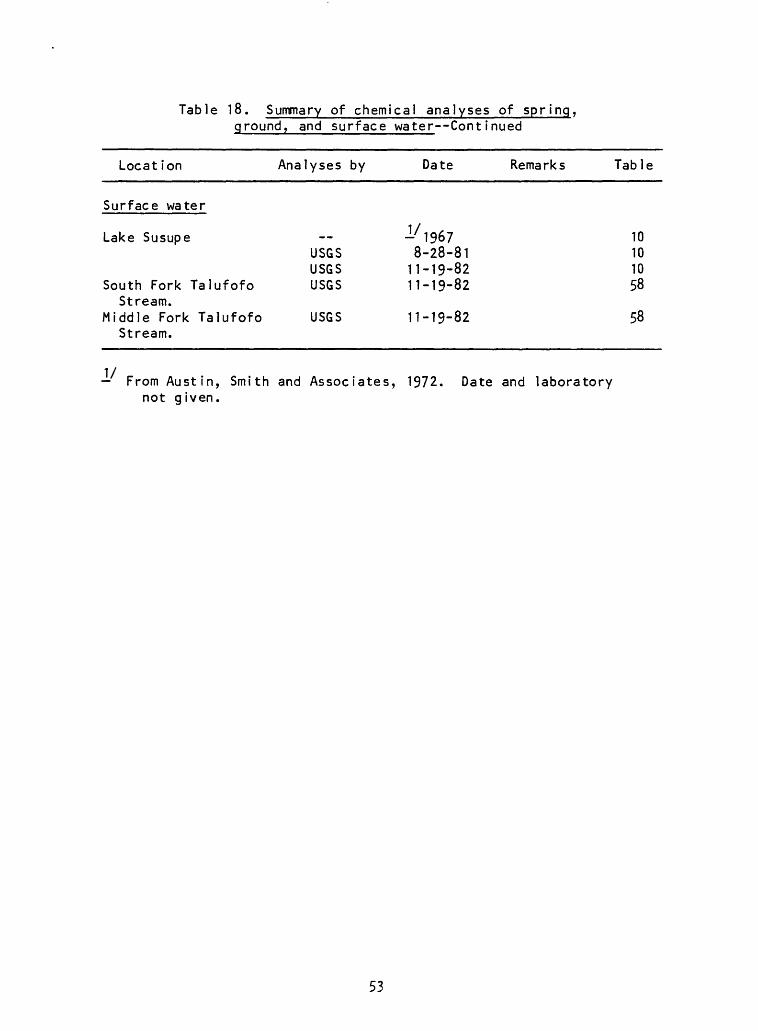
Table 18. Summary of chemical analyses of spring,
Location
ground, and surface
Analyses by
water--Cont inued
Date Remarks Table
Surface water
Lake Susupe
South ForkStream.
Middle ForkStream.
usesuses
Talufofo USGS
Talufofo USGS
1/1967 8-28-81
11-19-82 11-19-82
11-19-82
10 1010 58
58
From Austin, Smith and Associates, 1972. Date and laboratory not given.
53
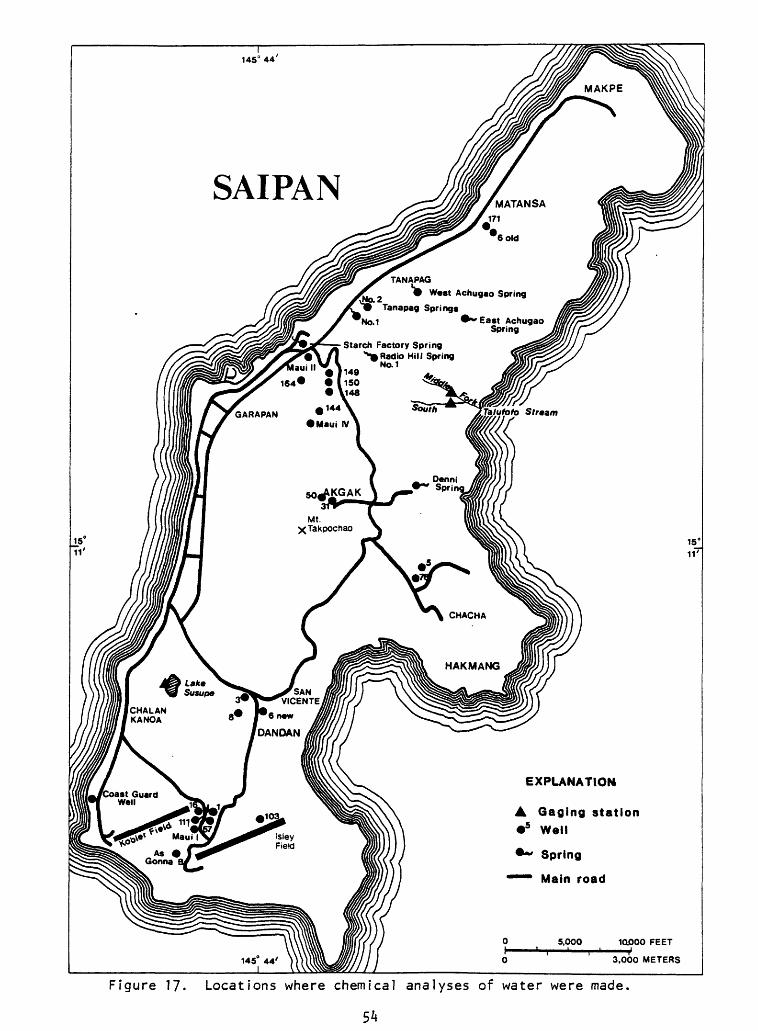
TANAPAG
W«st Achugao Spring
Tanapag Springs
No.1 '"East Achugao
Starch Factory Spring ^ Radio Hill Spring
EXPLANATION
Gaging stationWell
Spring
Main road
Figure 17. Locations where chemical analyses of water were made.
54
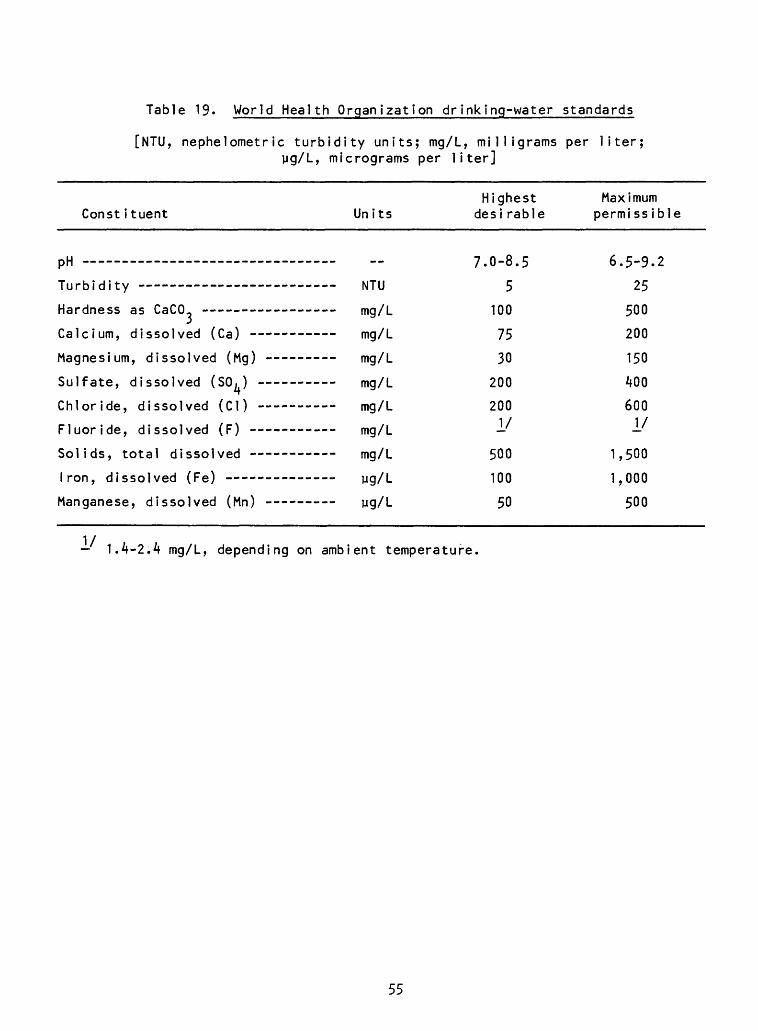
Table 19. World Health Organization drinking-water standards
[NTU, nephelometric turbidity units; mg/L, milligrams per liter;pg/L, micrograms per liter]
Const i tuent
_. LIpH
Turbidity -
Hardness as CaCO,
Calcium, dissolved (Ca) --
Magnesium, dissolved (Mg) ---
Sulfate, dissolved (SO.)
Chloride, dissolved (Cl) Fluoride, dissolved (F)
Solids, total dissolved -
Iron, dissolved (Fe) - -
Manganese, dissolved (Mn)
Units
NTU
mg/L
mg/L
mg/L
mg/L
mg/L
- mg/L mg/L
yg/L
yg/L
Highest desi rable
7.0-8.5
5
100
75
30
200
200 M
500
100
50
Maximum permi ss ible
6.5-9.2
25
500
200
150
400
600 1/
1,500
1,000
500
1.4-2.4 mg/L, depending on ambient temperature.
55
WATER PRODUCTION
After the end of World War II, when most of the U.S. troops had departed, approximately 20,000 military personnel and dependents in addition to about 5,000 local people remained on the island. Water production was about 2.6 Mgal/d, with 2.3 Mgal/d coming from ground-water sources (Glander, 1946). During 1948, water production averaged 2.2 Mgal/d and supplied a population of only about 6,500 people. However, it was estimated that as much as two-thirds of the water was being lost (Curione, 1949).
In 1951, production had dropped to 463,000 gal/d and in 1952 to 384,000 gal/d, all from ground water sources. After the U.S. Navy took over the adminis tration of the Northern Mariana Islands from the Department of the Interior on Jan. 1, 1953, production was boosted to 851,000 gal/d. Most of this water came from Maui I.
In 1956, production had dropped to 700,000 gal/d with 600,000 gal/d from ground water sources, mainly Maui I and IV and Akgak well field (Cox, 1956). Leakage had been reduced through replacement of some old pipe lines and wooden tanks, but was still considered to be a problem.
Between 1956 and 1978, ground-water production increased to 2.4 Mgal/d due to the drilling of new wells in 1956, 1962, 1969-71 and 1977- Although more wells were drilled in 1979-80, production did not increase until 1982 when many more wells were placed in production. In 1982, the amount of ground water produced almost doubled from that of 1980 while the mean weighted chloride concentration remained about the same (690 mg/L). The sharp increase in the chloride concentration of water from the Maui IV area, mainly due to the increased pumping of Maui IV and well 145, was offset by lower chloride water from the new Isley Field wells (table 20). With the increased springflow during the wet season, total water production reached a peak of 4.6 Mgal/d in August 1982. Ground-water production dropped to 3-1/4 Mgal/d in January 1983 due to the closing of Maui I and the reduction of pumpage of Maui IV. In mid 1983, Maui I could be placed back in operation and the new wells 148-150 started to produce more than 300 gal/min. Ground-water production reached 4.1 Mgal/d in September 1983- However, owing to minimal recharge of the aquifers during the prolonged 1983 dry season, the average chloride concentration of the produced ground water increased by more than 25 percent between August 1982 and September 1983-
56
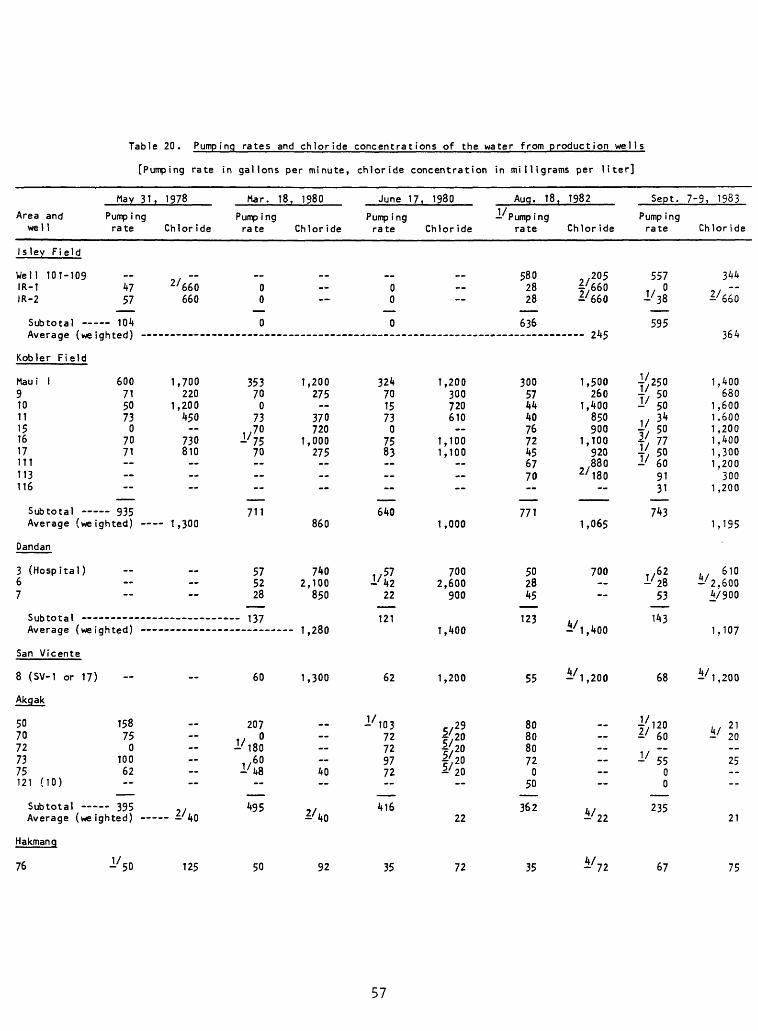
Table 20. Pumping rates and chloride concentrations of the water from production wells
[Pumping rate in gallons per minute, chloride concentration in milligrams per liter]
Area andwell
Isley Field
Well 101-109IR-1 IR-2
Subtotal Average (wei
Kobler Field
Maui i91011151617111113116
Subtotal
May 31, 1978
Pump ingrate Chloride
47 2/660 57 660
104ghted)
600 1,70071 22050 1,20073 450
070 73071 810
~ 935
Mar. 18,
Pump ingrate
0 0
0
35370
073
1/ 7°1/75
70
711Average (weighted) T,300
Dandan
3 (Hospital) 67
Subtotal
Average (wei
San Vicente
8 (SV-1 or 17)
Akqak
5070727375121 (10)
Subtotal Average (wei
Hakmang
76
ghted)
15875
010062
- 395 ,, ghted) 40
1/50 125
57 5228
137
60
2070
1/1801/ 601/48
495
50
1980
Chloride
1,200275
370720
1,000275
860
740 2,100
850
1,280
1,300
40
^/40
92
June 17
Pump ingrate
0 0
0
324701573
07583 ~
640
I/ 57 1/42
22
121
62
1/10372729772
416
35
, 1980
Chloride
1,200300720610
1,1001,100
1,000
700 2,600
900
1,400
1,200
795/20|/20
5/ 2°2/20
22
72
Auq. 18,
Pumpingrate
58028 28
636
3005744407672456770
771
50 2845
123
55
80808072
050
362
35
1982
Chloride
2/205|/660 i/660
.... 245
1,500260
1,400850900
1,100920880
2/l8o~
1,065
700
"
-/I, 400
-/I, 200
..
*/22
V72
Sept.
Pump ingrate
557
1/38
595
j/250T/ 501' 50
T/ 50I/ 77T/ 50!' 60
9131
743
I/ 62 1/28
53
143
68
1/120-' 60
5500
235
67
7-9, 1983
Chloride
3442 /66~o"
364
1,400680
1,6001.6001,2001,4001,3001,200
3001,200
1,195
^/2,600V900
1,107
^/1,200
4/ 21-' 20
25----
21
75
57
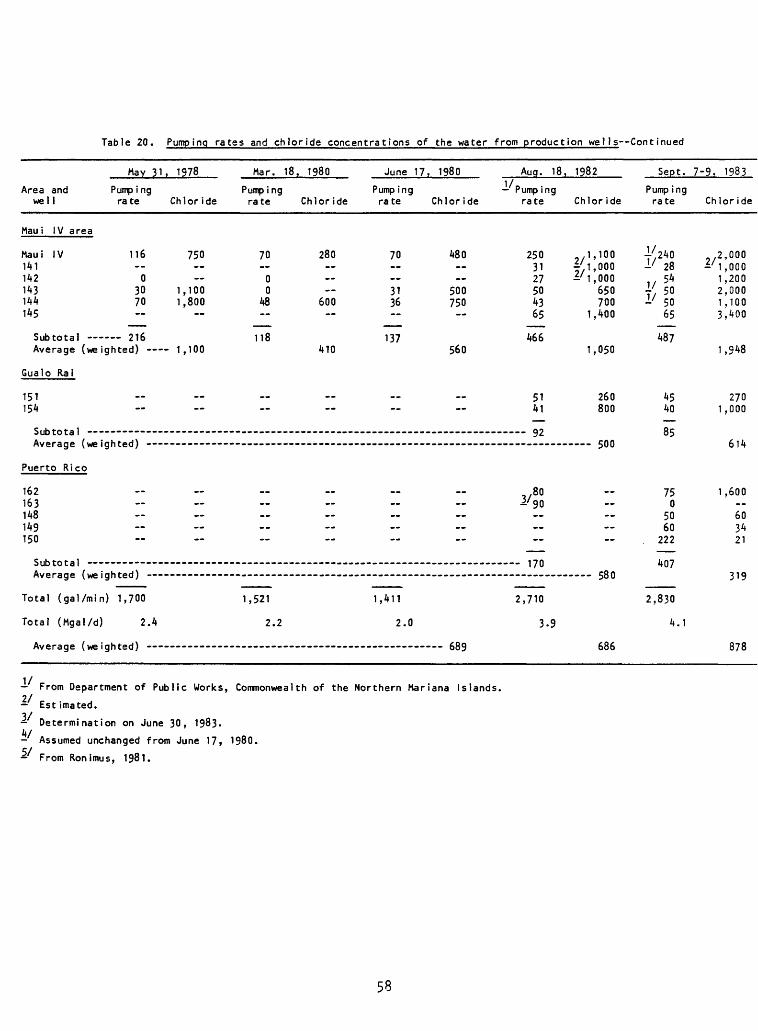
Table 20. Pumping rates and chloride concentrations of the water from production wells Continued
May 31, 1978
Area and Pump i ng well rate Chloride
Mau i IV area
Mau i IV 116 750 141 142 0 143 30 1,100 144 70 1,800 145
Subtotal 216Average (weighted) 1,100
Gualo Rai
151 154
Subtota 1
Puerto Rico
162 163 148 149 150
Subtotal
Total (gal/min) 1,700
Total (Mgal/d) 2.4
From Department of Public Works,2/ - Estimated.
Mar. 18, 1980
Pumping rate Chloride
70 280
0 0
48 600
118 410
__
1,521
2.2
Commonwealth of the
June 17, 1980 Aug. 18,
Pumping Pumping rate Chloride rate
70 480 250 31 27
31 500 50 36 750 43
65
137 466 560
51 41
92
. 170
1,411 2,710
2.0 3.9
(TOO
Northern Mariana Islands.
1982
Chloride
2/MOO f 1,000 £'1,000
650 700
1,400
1,050
260 800
500
rQ f\
686
Sept.
Pump ing rate
|/.240 1' 28
T/ 50 ±' 50
65
487
45 40
85
75 0
50 60
222
407
2,830
4.1
7-9, 1983
Chloride
2/2,000 -'1,000
1,200 2,000 1,100 3,400
1,948
270 1,000
614
1,600
60 34 21
319
878
Determination on June 30, 1983.4/ Assumed unchanged from June 17, 1980.
From Ronimus, 1981.
58
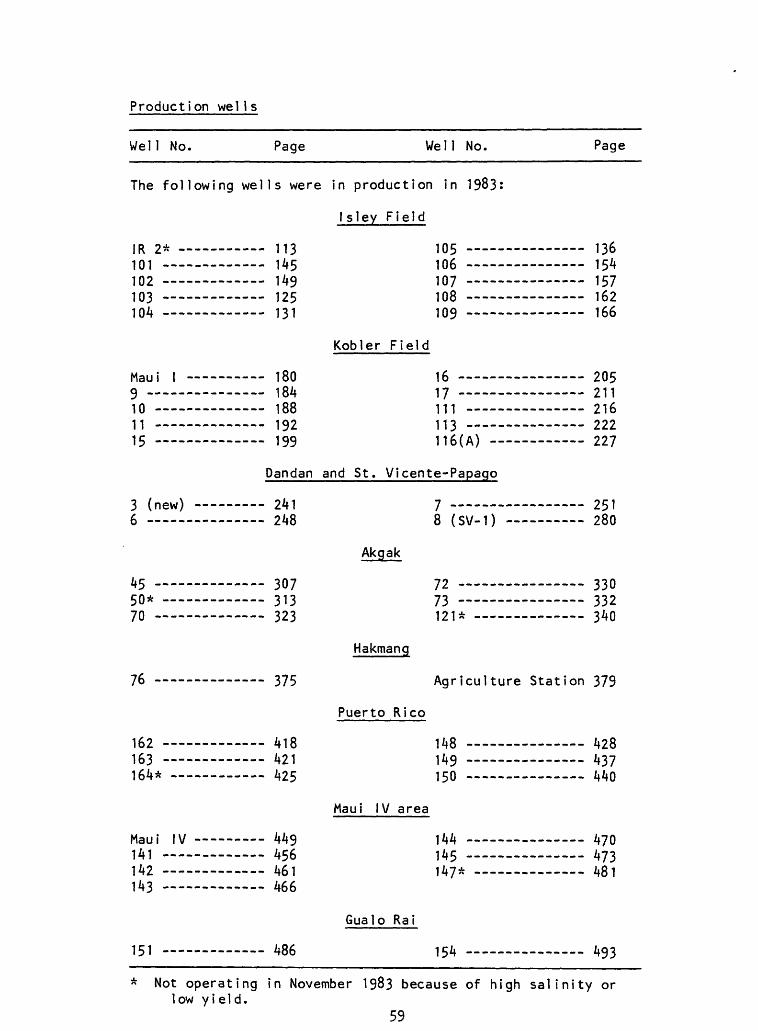
Production wel1s
Well No.
The following
ID 0£ ______..
101 -102 -103 -104 -
Maui 1 -
9 10 -11 -15 -
\ 1 ICW/
6 .
45 _.__ _._.en* __________70
76 -
t£0
163 -164* -
Maui IV -141 . _.._..142 -143
151 -
Page
wel 1 s were
- 113- 145- 149 - 125 - 131
1 fin1 fill1 00
- 192- 199
Dandan
- 241 3/.O
- 307._ __ -21-3
J 1 J 323
._ __ -27CJ 1 J
418. 421. 425
. _ _ 440t**:? - 456- 461- 466
hOf.
Well No.
in production in 1983:
1 sley Field
105 -106 -107 -1 nQ109 -
Kobler Field
1617 111 -113 116(A)
and St. Vicente-Papago
7 _.8 (SV-1)
Akgak
72 -73 ._...191* _--.-_-.
Hakmang
Agr icul ture
Puerto Rico
!48 -149 .150 -
Maui IV area
!44 .145 - 1^7* _-__ _
Gualo Rai
154
Page
. - 136
.... . . 154 - 157
1 1*\. 166
- 205 - 211
O 1 £-------- zib - 222 227
----- 251o fin----- - /oU
._ _ _ _ _ 7-3f|j j°"i "i o 332
- 340
Station 379
/.oO
. . 437
. 440
- 470- - 473 ........ 481
493
Not operating in November 1983 because of high salinity or low yield.
59
RESERVOIRS
The water storage reservoirs on Saipan are listed in table 21 and their location shown in figure 18. The Isley Field reservoir, the As Mahettok reservoirs and the Fleet tanks were constructed during the Japanese Administration. The first two are still in use today.
Isley Field Reservoir - The two adjacent underground concrete reservoirs were built by the Japanese to store runoff from their airfield (Piper, 1946-47). Originally they had wooden roofs which were removed sometime between 1949 and 1956, and were replaced at a later date by concrete roofs. The capacity of the reservoirs is 500,000 gallons each and they are connected by dual 15-inch transite pipes. The maximum water level is at altitude 193.4 ft and the bottom is at altitude 183.4 ft (Curione, 1949).
As Mahettok Reservoirs - The Japanese constructed two underground concrete reservoirs at Tanapag. The upper reservoir was used as a sedimentation basin and has a capacity of about 100,000 gallons; the lower, where the water was chlorinated, has a 200,000 gallon capacity. Altitude of the maximum water level of the upper reservoir is 207 ft, and the bottom altitude is 196.1 ft. The lower reservoir has a concrete roof, a maximum water-level altitude of 185 ft, and a bottom altitude of 174.8 ft (Curione, 1949). In 1945, the upper reservoir received water from Tanapag Springs and well 10 for treatment and filtration, after which the water was stored in the lower reservoir combined with already treated water from the Hakmang wells (5» 21, 24, 25) and Denni Spring (Boniface, 19^5). The supply of water of well 10 to the reservoir was discontinued in 1946 (Glander, 1946). At that time, the reservoirs were receiving water from Tanapag Springs, Radio Hill Spring No. 1, some of the flow of the Akgak wells (31? 45, 75), and Denni Spring (Cox, 1956). In 1967, the upper reservoir and filtration units located between the reservoirs were still in use, but they have since been abandoned. The upper reservoir appears to be still in good condition although the corrugated iron roof is rusting away. The lower reservoir now receives water from Tanapag Springs and, by gravity, water from the Maui IV area, which includes water from Denni Spring and excess Akgak-wel1-field water from Capitol Hill.
Fleet Tanks - The Japanese built three circular concrete underground tanks of about 9-Mgal capacity each with wooden roofs supported by steel H beams. In 1970, the most northern reservoir was cleaned and used to store excess water and to collect water from an adjacent small catchment area. The diameter of this reservoir is 216 ft and the depth from the top of the concrete walls to the invert of the outlet is 33 ft. The invert is 26 inches above the concrete bottom. Altitude of the bottom is 20.2 ft (Curione, 1949). Near this reservoir is a 3- Mgal-capacity, underground tank with steel plate walls and concrete bottom and roof. The diameter is 131 ft and the depth is 31.2 ft from the top of the walls to the invert of the outlet pipe 20 inches above the bottom of the tank. Altitude of the bottom of the tank is also 20.2 ft (Curione, 1949). In 1949, the 3-Mgal reservoir was used to store water from Maui IV well but by 1956 the reservoir was no longer in service. At present, none of the Fleet Tanks (so called because they supplied water to the ships) are in use.
60
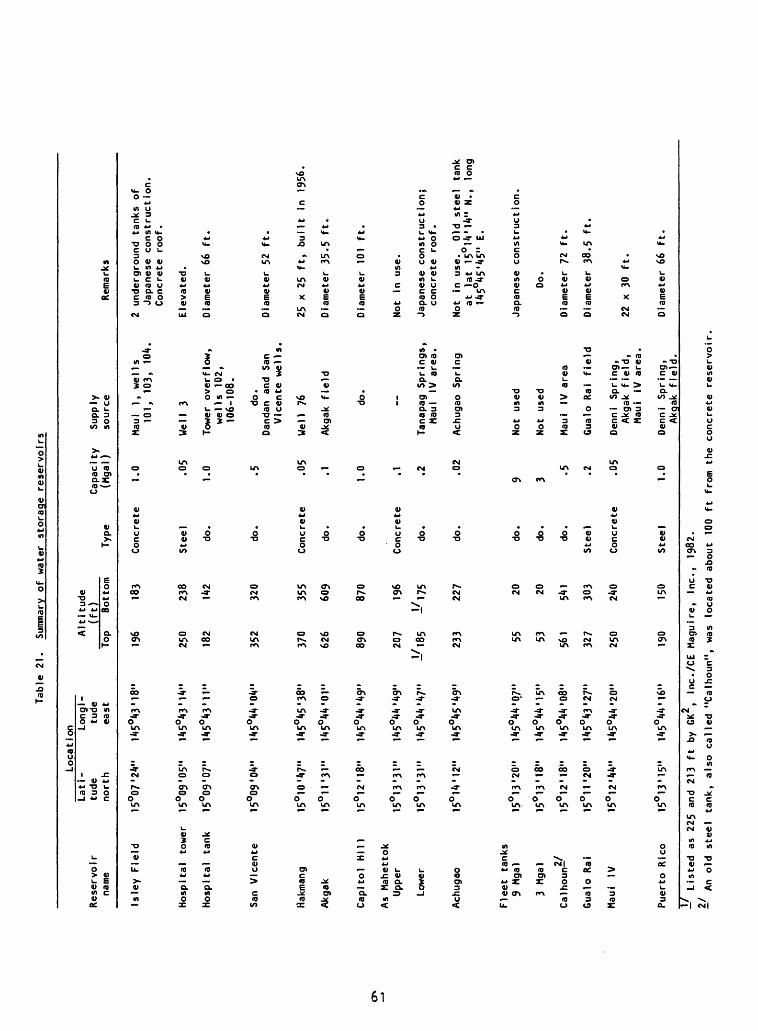
Table
21.
Summary
of water
stor
age
reservoirs
Loca
tion
Lati
- Longi-
Rese
rvoi
r tu
de
tude
na
me
north
east
Isle
y Field
15°07'24"
145°43'18"
Hosp
ital
to
wer
15°09'05"
145°
43'1
4"
Hospital ta
nk
15°09'07"
145°
43'1
1"
San
Vice
nte
15°09'04"
145°
** '04"
Hakmang
15°10'47"
145°
45'3
8"
Akgak
15OH'
31"
145°
44'0
1"
Capi
tol
Hill
15°12'18"
145°
44'4
9"
As Ma
hett
okUpper
15°13'31"
145°
44'4
9"
Lowe
r 15O13'31"
145°44'47"
Achu
gao
15°l4'12"
145°45'49"
Fleet
tank
s9
Mgal
15
°13'
20»
145°
** '07"
3 Mg
al
15°13'18"
145°
44'1
5"O /
f\
f\Ca
lhou
n-
15 12
' 18"
145
44 '08"
Gualo
Rai
15°11'20"
145°43'27M
Maui
IV
15°12'44"
145°44 '20"
Puer
to R
ico
15°13'15"
145°44'16"
Altitude
(ft)
Top
196
250
182
352
370
626
890
207
1/18
5
233 55 53 561
327
250
190
Bott
om
183
238
142
320
355
609
870
196
1/17
5
227 20 20 541
303
240
150
Type
Conc
rete
Stee
l
do.
do.
Conc
rete
do.
do.
Conc
rete
do.
do.
do.
do.
do.
Stee
l
Concrete
Steel
Capa
city
(M
gal)
1.0 .05
1.0 .5 .05
.1 1.0 .1 .2 .02
9 3 .5 .2 .05
1.0
Supply
source
Maui
1, we
lls
101,
10
3, 10
4.
Well
3
Tower
overflow,
wells
102,
106-108.
do.
Dand
an and
San
Vicente
we)
1 s.
Well
76
Akga
k field
do.
Tanapag
Springs,
Maui
IV a
rea.
Achugao
Spring
Not
used
Not
used
Maui
IV a
rea
Gual
o Rai
field
Denni
Spring,
Akga
k fi
eld,
Maui
IV a
rea.
Denn
i Sp
ring
,Akgak
fiel
d.
Rema
rks
2 underground
tank
s of
Japa
nese
con
stru
ctio
n.Co
ncre
te roof.
Elevated.
Diameter 66 ft.
Diameter 52
ft.
25 x
25 ft,
buil
t in 1956.
Diameter 35.5 ft.
Diameter 101
ft.
Not
in use.
Japa
nese
con
stru
ctio
n;concrete roof.
Not
in use.
Old
steel
tank
at lat
15°1
4'14
" N.,
long
Japanese c
onstruction.
Do.
Diam
eter
72
ft
.
Diameter 38.5 ft
.
22 x
30 ft.
Diam
eter
66
ft.
!/ Listed as
22
5 and
213
ft by GK
2,
Inc.
/CE
Maguire, Inc.,
1982.
2/ -
An old
stee
l tank,
also
cal
led
"Cal
houn
", wa
s lo
cate
d about
100
ft from th
e co
ncre
te reservoir.
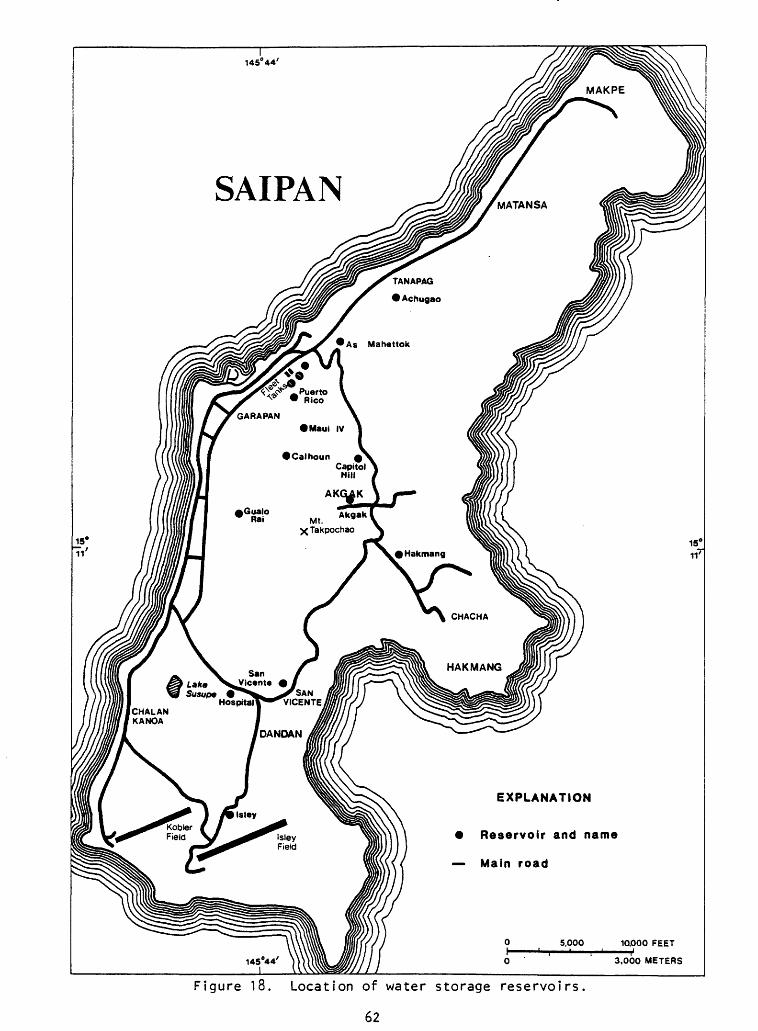
Reservoir and name
Main road
Figure 18. Location of water storage reservoirs.
62
During the first year after the occupation of Saipan by U.S. Forces, a large number of wooden and steel tanks were constructed, but after the troops left, almost all were abandoned. The Calhoun tank, a bolted steel tank on a concrete slab at altitude 555 ft with a capacity of 425,000 gal Ions (Nettleman, 1953), was constructed in about 1948. Ted Arnow (written communication to D. A. Davis, May 11, 1953) reported in 1953 that the tank was badly rusted and leaking at the bottom and was only supplying the powerplant. In 1956, the steel tank was replaced by a 0.5-Mgal concrete tank located about a hundred feet from the old tank. The tank at present receives the water from Maui IV well field, which includes water from Akgak well field and Denni Spring, for distribution in Garapan and to the 12-inch west-coast pipeline.
Other concrete reservoirs constructed in 1956 were the 1-Mgal tank on Capitol Hill, the 100,000-galIon tank near well 31 in Akgak, the 50,000-galIon Hakmang tank, and a 20,000-galIon tank at Achugao Spring. About 1970, 1-Mgal steel tanks were constructed at the Hospital and at Puerto Rico, and a 0.5-Mgal steel tank at San Vicente.
At present (1984) the total useable reservoir storage on Saipan is 5-65 Mgal.
Chloride concentrations of water of some of the reservoirs during April to October 1983, are given in table 22.
WATER DISTRIBUTION
Prior to the Japanese Administration, the local population depended mainly on rainwater caught from trees and roofs and water from some shallow wells for its water supply.
The large influx of Japanese with their agriculture and light industry necessitated a better supply. Springs were developed, concrete cisterns to hold rainwater were constructed, more than 1,100 shallow wells were dug, and a rain catchment at Isley Field was built. Storage was provided by Isley and As Mahettok reservoirs and by large underground concrete storage tanks of 3~ and 9- Mgal capacity, called the Fleet tanks.
After the American occupation of Saipan in 1944, more than 70 wells were dri1 led and in 1946, a water distribution system was built which distr ibuted wel 1 and spring water island wide. Owing to broken lines and the increased salinity of most of the wells, the system had been reduced to two sections by 1953, supplied only with water from Mau i I and IV. Water from Mau i I was pumped to the Isley Field reservoir which supplied the southern end of the island. Two miles of 12-inch steel pipe brought water from the reservoir to the west coast with a1-1/2-mile-long, 6-inch line going south to the Coast Guard LORAN station and a2-mile long, 8-inch line going north to the Public Works area.
Water from Maui IV was pumped to As Mahettok reservoir, the Fleet tanks and the Calhoun tank, and distributed through a 12-inch transite pipeline of about 3,500 feet length.
63
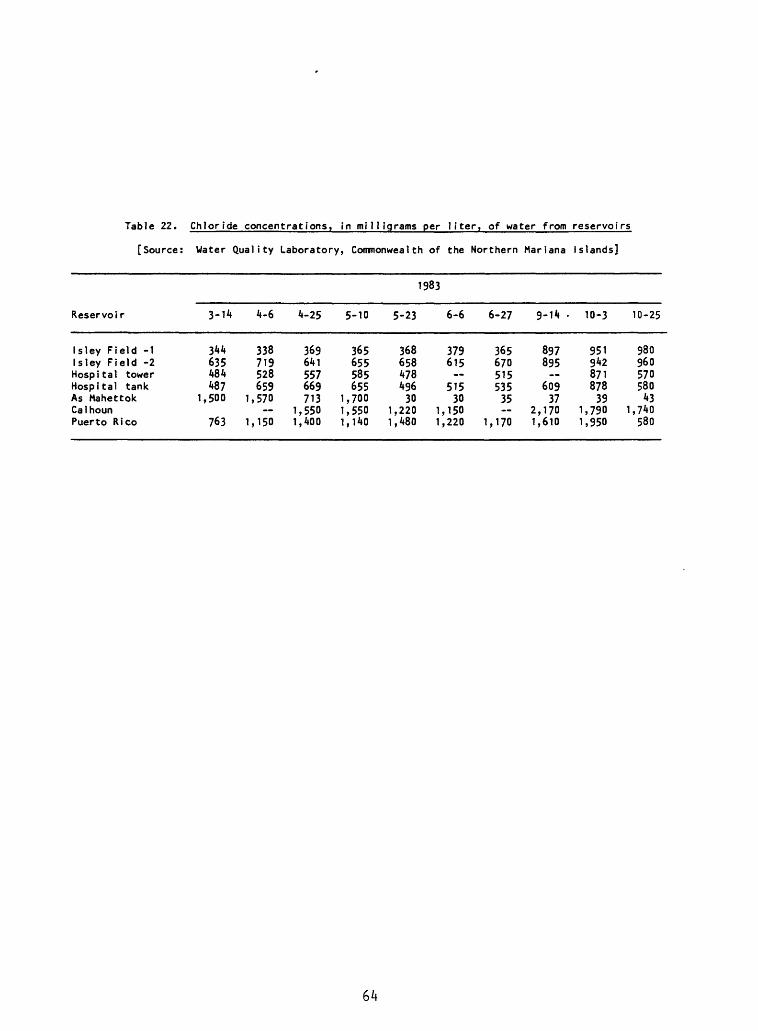
Table 22. Chloride concentrations, in milligrams per liter, of water from reservoirs
[Source: Water Quality Laboratory, Commonwealth of the Northern Mariana Islands]
1983
Reservoir
Isley Field -1Isley Field -2Hospital towerHospital tankAs MahettokCalhounPuerto Rico
3-14
344635484487
1,500
763
4-6
338719528659
1,570
1,150
4-25
369641557669713
1,5501,400
5-10
365655585655
1,7001,5501,140
5-23
36865847849630
1,2201,480
6-6
379615
51530
1,1501,220
6-27
36567051553535
1,170
9-14
897895
60937
2,1701,610
10-3
95194287187839
1,7901,950
10-25
98096057058043
1,740580
In February 1953, leakage was calculated to be 296,000 gal/d out of a production of 572,000 gal/d (52 percent) for the Maui I system, and 25,000 gal/d out of a production of 192,000 gal/d (13 percent) for the Maui IV system (Nettleman, 1953).
Shortly after 1953, water from Denni Spring and the Akgak well field (wells 31, 45, 50) was again included in the water distribution system. The average yield of Denni Spring during 13 years of continuous record (1970-82) was 400,000 gal/d, and the production of wells 31, 45, and 50 during 41 weeks from April 1947 to February 1948 ranged between 135,000-225,000 gal/d.
The main lines of the present distribution system are described in the sections dealing with the separate water-producing areas and are shown in figures 19, 21-23, 26, 29, 30 and 32. Basically, it is a West Coast distribution system receiving water from Kobler Field and part of Isley Field, from Akgak and Denni Spring by way of Capitol Hill, and from West Coast sources contributing directly to the system. Water from part of Isley Field and from Dandan serves the San Vicente-Dandan areas and well 76 serves the Hakmang area.
65
CONCLUSIONS
Water production almost doubled from 1980 to 1982. This was accomplished through the drilling of new wells, reactivating some previously drilled wells, and pumping the wells to near the maximum which the aquifer could sustain. In August 1982, k.6 Mgal/d was produced, about 300 gallons per person per day, three times the demand which normally can be expected. As much as two-thirds of the produced water is wasted through leakage of the distribution pipes and by users. Efforts have been made to keep the water distribution system in operation around the clock rather than restricting the operation to a few hours a day as was the common practice until 1982. It will be difficult to continue this service as long as the waste of water continues. Although new wells are being drilled, the population is growing at a rate of 3-4 percent annually and more tourists are being attracted to the island. Thus, the need for water keeps increasing. The mean chloride concentration of all pumped ground water was 686 mg/L in August 1982 and 879 mg/L in September 1983. The chloride concentration of water produced in some areas has exceeded 1,000 mg/L. Water levels in the Akgak area have been declining. This means that the amount of low-chloride water is 1imited.
In August 1982, the production total included 670,000 gal/d from Denni Spring. The yield of the spring decreases to 150,000 gal/d or less during the dry season.
It is, therefore, essential that leakage and waste are reduced and new wells are drilled to replace wells of which the water has become brackish. Development of surface water appears uneconomical due to the small supply during periods of greatest need for water and limited storage potential.
66
WELL DATA
Drilling logs, water quality data, water levels, and pumping testsof wells located in the following areas: Page
Southern Saipan 68Isley Field IkKobler Field 138
Dandan and San Vicente-Papago - ----- - 201Dandan 203 San Vicente-Papago 23^
Akgak 251 Hakmang . West coast areas
Tanapag Puerto Rico 356 Maui IV 395 Gualo Rai ~
Northern Saipan - - - -- -- -- - ----Miscellaneous sites - -- - - - ---- -
67
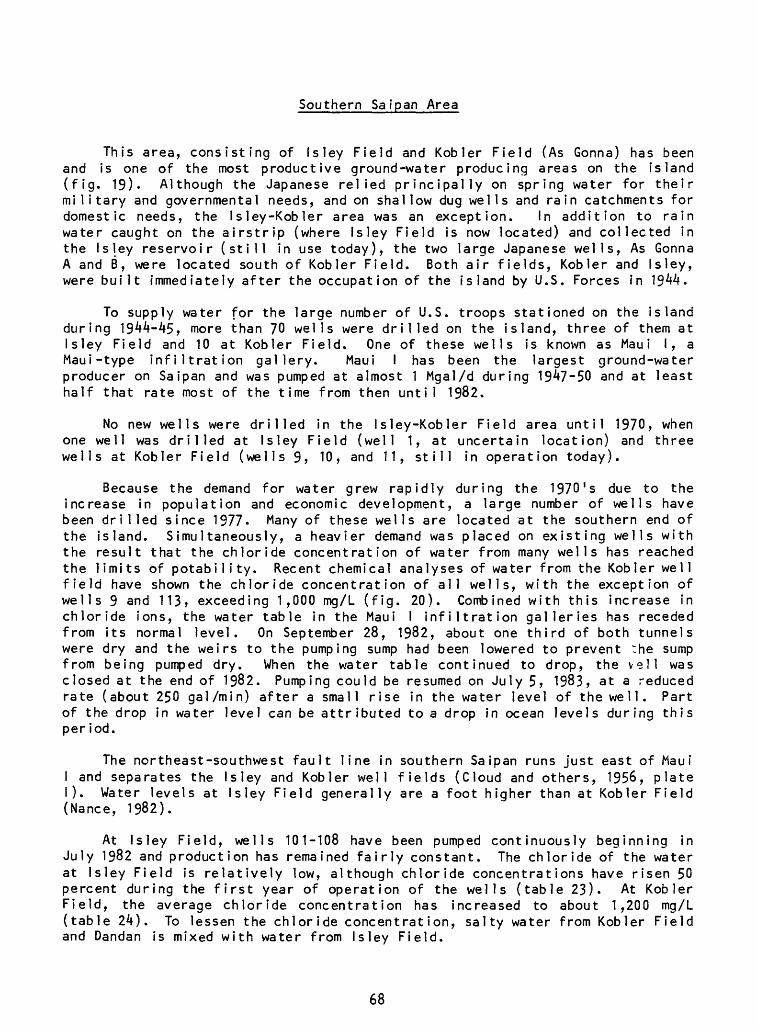
Southern Saipan Area
This area, consisting of Isley Field and Kobler Field (As Gonna) has been and is one of the most productive ground-water producing areas on the island (fig. 19). Although the Japanese relied principally on spring water for their military and governmental needs, and on shallow dug wells and rain catchments for domestic needs, the Isley-Kobler area was an exception. In addition to rain water caught on the airstrip (where Isley Field is now located) and collected in the Isley reservoir (still in use today), the two large Japanese wells, As Gonna A and B, were located south of Kobler Field. Both air fields, Kobler and Isley, were built immediately after the occupation of the island by U.S. Forces in
To supply water for the large number of U.S. troops stationed on the island during 1944-45, more than 70 wells were drilled on the island, three of them at Isley Field and 10 at Kobler Field. One of these wells is known as Maui I, a Maui-type infiltration gallery. Maui I has been the largest ground-water producer on Saipan and was pumped at almost 1 Mgal/d during 1947-50 and at least half that rate most of the time from then until 1982.
No new wells were drilled in the Isley-Kobler Field area until 1970, when one well was drilled at Isley Field (well 1, at uncertain location) and three wells at Kobler Field (wells 9, 10, and 11, still in operation today).
Because the demand for water grew rapidly during the 1970's due to the increase in population and economic development, a large number of wells have been drilled since 1977. Many of these wells are located at the southern end of the island. Simultaneously, a heavier demand was placed on existing wells with the result that the chloride concentration of water from many wells has reached the limits of potability. Recent chemical analyses of water from the Kobler well field have shown the chloride concentration of all wells, with the exception of wells 9 and 113* exceeding 1,000 mg/L (fig. 20). Combined with this increase in chloride ions, the water table in the Maui I infiltration galleries has receded from its normal level. On September 28, 1982, about one third of both tunnels were dry and the weirs to the pumping sump had been lowered to prevent the sump from being pumped dry. When the water table continued to drop, the veil was closed at the end of 1982. Pumping could be resumed on July 5, 1983, at a reduced rate (about 250 gal /mi n) after a small rise in the water level of the well. Part of the drop in water level can be attributed to a drop in ocean levels during this period.
The northeast-southwest fault line in southern Saipan runs just east of Maui I and separates the Isley and Kobler well fields (Cloud and others, 1956, plate I). Water levels at Isley Field generally are a foot higher than at Kobler Field (Nance, 1982).
At Isley Field, wells 101-108 have been pumped continuously beginning in July 1982 and production has remained fairly constant. The chloride of the water at Isley Field is relatively low, although chloride concentrations have risen 50 percent during the first year of operation of the wells (table 23). At Kobler Field, the average chloride concentration has increased to about 1,200 mg/L (table 24). To lessen the chloride concentration, salty water from Kobler Field and Dandan is mixed with water from Isley Field.
68
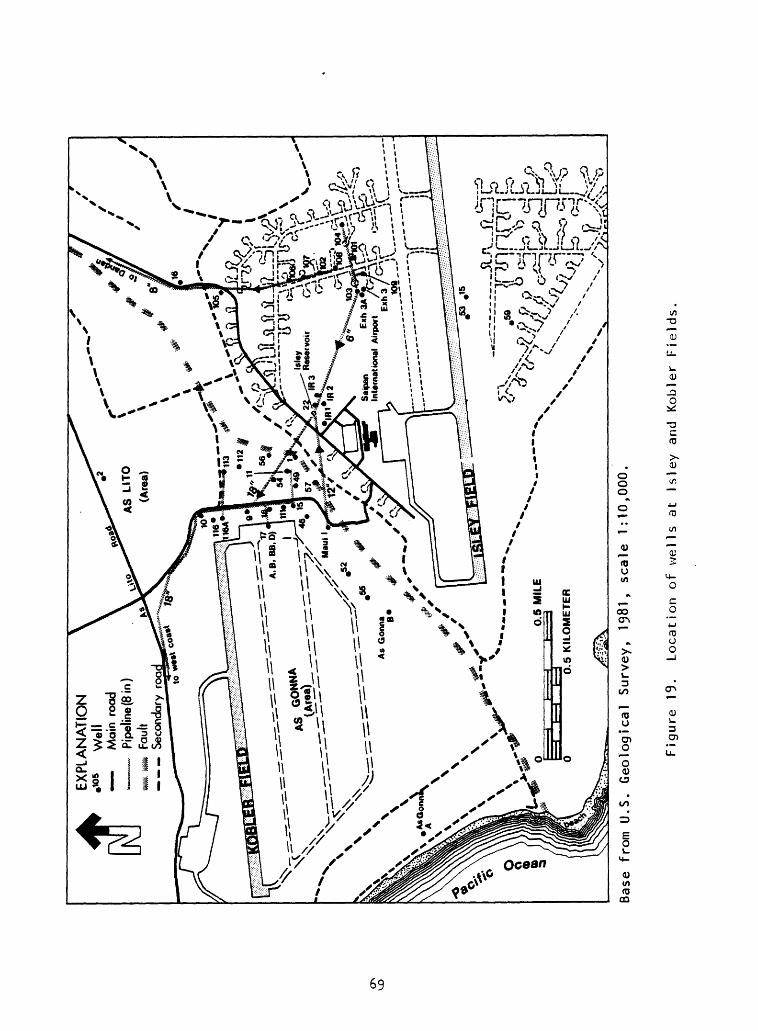
UJ
EX
PLA
NA
TIO
NW
ell
Ma
in r
oad
Pip
elin
e (8
in)
Faul
t _-.
_
Sec
onda
ry r
oa
Saip
an
Exh
3A
Inte
rnat
iona
l A
irpo
rtEx
h 3
0.5
KIL
OM
ET
ER
Base
from U.S. Ge
olog
ical
Su
rvey,
1981,
scal
e 1:
10,0
00
Figu
re 19.
Loca
tion
of we
lls
at Is
ley
arid
Kobler Fields.
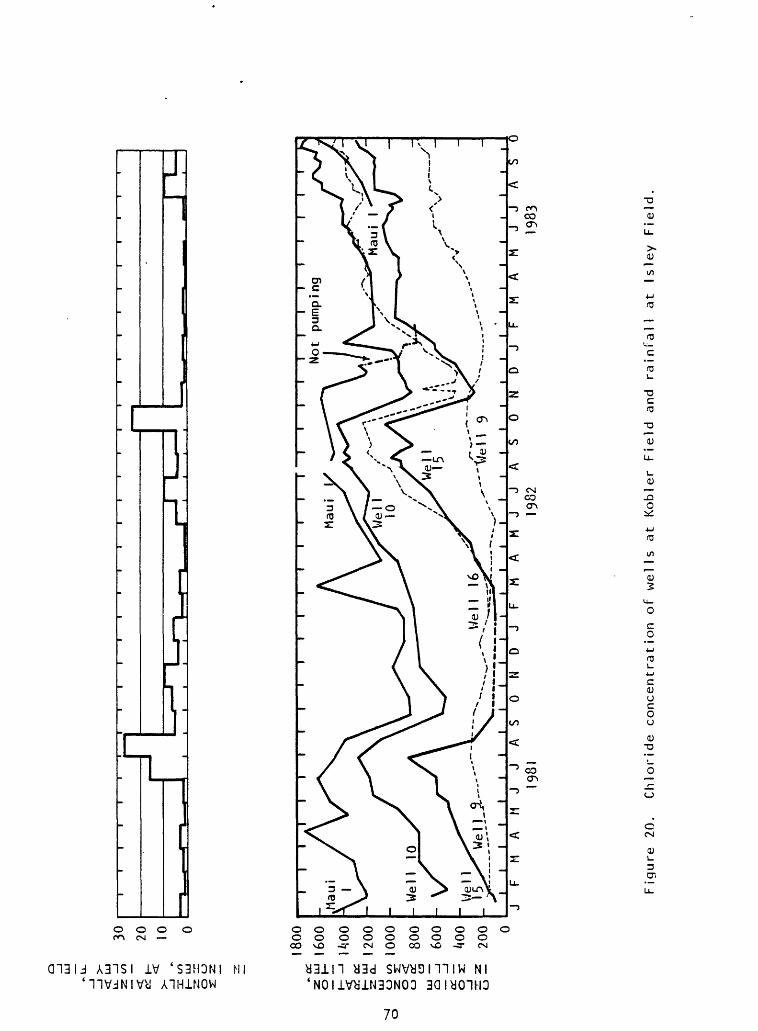
CHLORIDE CONCENTRATION, IN MILLIGRAMS PER LITER
MONTHLY RAINFALL, N INCHES, AT ISLEY FIELD
ro-c-cr^Go oro .e-o^ooooooooo o o
oooooooo oo NJ UO
o o o o
IDc
NJ o
orr
O_ fD
O -h
Ocr
-n
fD
Q.
O)Do_
fD
Q.
CO
CO N)
00 VjO
I
1
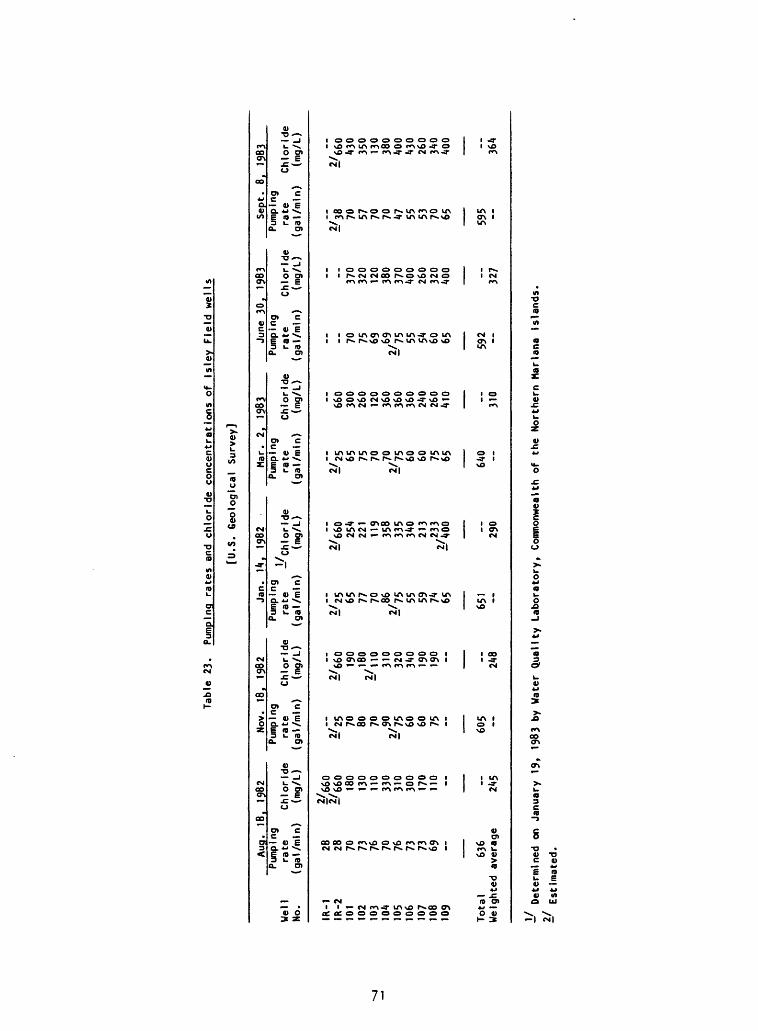
Tabl
e 23.
Pumping
rate
s an
d ch
lori
de co
ncen
trat
ions
of Is
ley Fi
eld
wells
[U.S
. Geological Survey]
Aug.
18,
1982
Pump
ing
Well
ra
teNo
. (gal/min)
IR-1
28
1R-2
28
101
7010
2 73
103
7610
4 70
105
7610
6 73
107
7310
8 69
109
Total
636
Weighted average
Determined on
I/ Estimated.
Chloride
(mg/
L)
1/66
01/
660
180
130
110
330
310
300
170
110 -- T 245
January
19,
Nov.
18
Pumping
rate
(gal/min)
!/2~5 70 80 70
2/9°
1/75 60 60 75 605 --
, 19
82
Chlo
ride
(mg/
L)
!/66~~0
190
2/l8
01/
110
310
320
340
190
190 -- 248
1983
by
Water
Qual
ity
Jan. 14,
Pumping
.rate
-(gal/min)
1/25 65 77 70
2/86
1/75 55 59 65 651
Laboratory,
1982
Chloride
(mg/
L)
1/660* 254
221
119
358
335
340
213
,,23
31/
400
"I
290
Mar.
2
Pump
ing
rate
(gal/min)
1/25 65 75 70
2/7°
1/75 60 60 75 65 640
Comm
onwe
alth
of
the
, 19
83
Chloride
(mg/
L)
660
300
260
120
360
360
360
240
260
410~ 31
0
June 30
Pump
ing
rate
(gal
/min
)
__ 70 75 692/
69-'is 55 54 60 65 592 --
, 1983
Chloride
(mg/
L)
__ 370
320
120
380
370
400
260
320
400~ 32
7
Sept.
Pump i ng
rate
(gal
/min
)
!/3~
8 70 57 70 70 47 55 53 70 65 595 -
8, 19
83
Chlo
ride
(mg/L)
!/66~o"
430
350
130
380
400
430
260
340
400~ 36
4
Nort
hern
Mar
iana
is
land
s.
The only storage facility in the area is the 1-Mgal Isley Reservoir, a concrete underground storage of pre-World War II construction with post-war concrete roofing. The reservoir receives the production of Mau i I, (when pumped) and wells IR-2, 101, 103, 104, 109 and delivers the water through an 18-inch cast-iron pipe (installed In 1962) by way of the Kobler well field to the populated west coast of Saipan. The remaining Isley wells deliver their water to the San Vicente and Hospital reservoirs. (See chapter covering the Dandan-San Vicente-Papago areas.)
All test holes and wells drilled at Isley Field are listed in table 25; those drilled at Kobler Field in table 26 (p. 138) preceding the data of the Kob1e r we 11s.
72
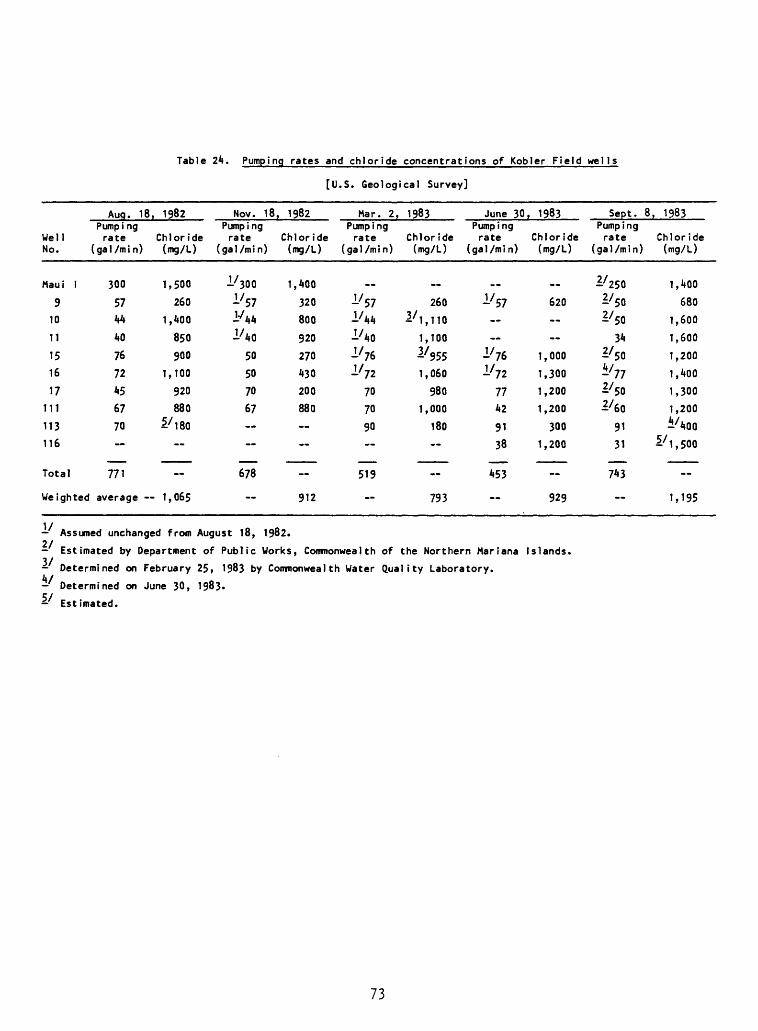
Table 2k. Pumping rates and chloride concentrations of Kobler Field wells
Auq. 18, 1982Pumpi ng
Well rateNo. (gal/min)
Maui 1 300
9
10
11
151617
111113116
5744
40
7672456770
Nov.
[U.
18, 1982Pump i ng
Chloride rate(mg/L)
1,500
260
1,400
850
900
1,100
920
880i'180~
Total 771
Weighted average
I/
~ 1,065
Assumed unchanged from
Estimated by Department3/
V5/
Determined on
Determined on
Estimated.
February
June 30,
Chloride(gal/min) (mg/L)
1/3001/571/441/40
50507067-.
678
~
August 18,
of Pub I i c
25, 1983 by
1983.
1,400
320
800
920
270
430
200
880
912
1982.
.S. Geological Survey]
Mar. 2,Pump i ngrate
(gal/min)
..1/571/441/401/761/72
707090~
519
1983
Chloride(mg/L)
_
260 2/1, 110
1,1001/955
1,060980
1,000180~
793
June 30, 1983Pump i ngrate
(gal/min)
_^57_-
..
1/761/72
77429138
453
Works, Commonwealth of the Northern Mariana
Commonweal th Water Qua!
Chloride(mg/L)
..
620
1,000
1,300
1,200
1,200
300
1,200
929
Islands.
Sept. 8Pumpingrate
(gal/min)
2/250
1/50
1/50
342/50
4/772/502/60
9131
743
~
, 1983
CM or ide(mg/L)
1,400
680
1,600
1,600
1,200
1,400
1,300
1,2004/400
1/1,500
~
1,195
ity Laboratory.
73
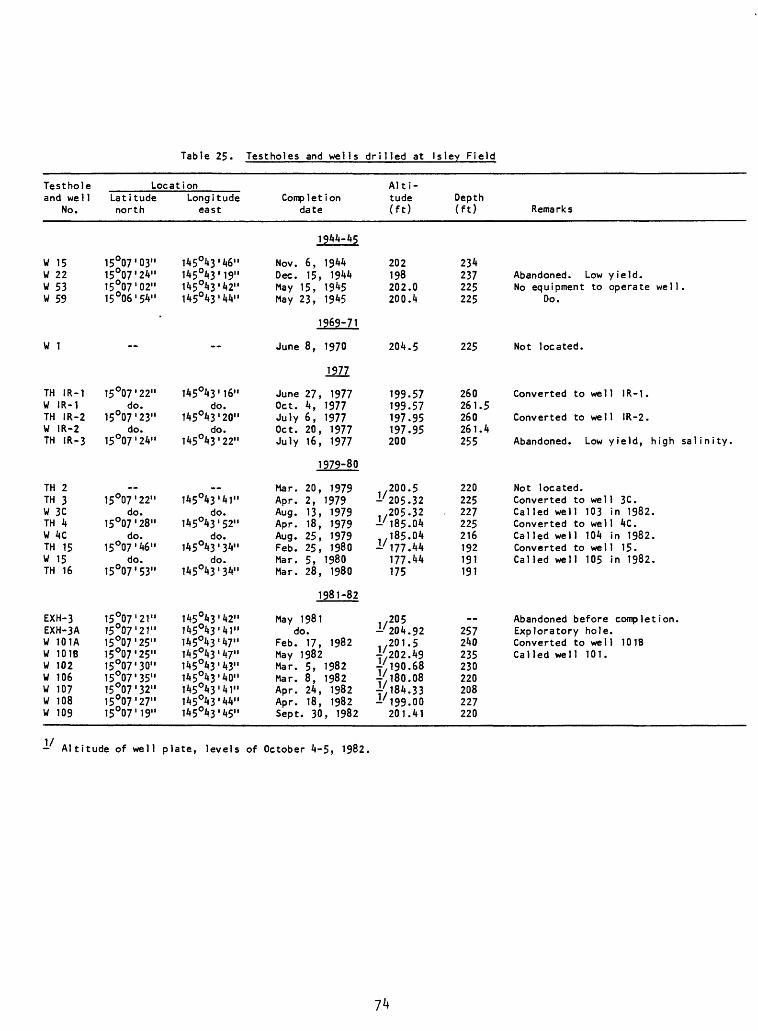
Table 25. Testholes and wells drilled at Isley Field
Testhole and we! ]
No.
W 15W 22W 53W 59
W 1
TH IR-1W IR-1TH IR-2W IR-2TH IR-3
TH 2TH 3W 3CTH 4W 4CTH 15W 15TH 16
EXH-3EXH-3AW 101AW 101BW 102W 106W 107W 108W 109
LocationLatitude north
15°07'03"15°07'24"15°07'02"15°06'54"
"
15°07'22"do.
15°07'23"do.
15°07'24"
15°07'22"
do.15°07'28"
do.15°07'46"
do.15°07'53"
15°07'21'15 007'21'15°07'25'15°07'25'15°07'30'15°07'35'15 07 '32'15°07'27'15 07 '19'
Longitude east
145°43'46"145°43'19"145°43'42"145°43'44"
145°43'16"do.
145°43'20"do.
145°43'22"
..145°43'41"
do.145°43'52"
do.145°43'34"
do.145°43'34"
145°43'42"145°43'41"145°43'47"145°43'47"145°43'43"1i»5°i»3'40"145°43'41"1i»5°43'44"145°43'45"
Completion date
1944-45
Nov. 6, 1944Dec. 15, 1944May 15, 1945May 23, 19*6
1969-71
June 8, 1970
1977
June 27, 1977Oct. 4, 1977July 6, 1977Oct. 20, 1977July 16, 1977
1979-80
Mar. 20, 1979Apr. 2, 1979Aug. 13, 1979Apr. 18, 1979Aug. 25, 1979Feb. 25, 1980Mar. 5, 1980Mar. 28, 1980
1981-82
May 1981do.
Feb. 17, 1982May 1982Mar. 5, 1982Mar. 8, 1982Apr. 24, 1982Apr. 18, 1982Sept. 30, 1982
Alti tude (ft)
202198202.0200.4
204.5
199.57199.57197.95197.95200
200.5-I-7 205. 32,,205.32-1/185.04,185.04
^177.44177.44175
1/ 205-204.92
201.5f, 20 2. 49|7 190.6847, 180. 084;i84.33-199.00
201.41
Depth (ft)
234237225225
225
260261.5260261.4255
220225
. 227225216192191191
**
257240235230220208227220
Remarks
Abandoned. Low yield.No equipment to operate well.
Do.
Not located.
Converted to well IR-1.
Converted to well IR-2.
Abandoned. Low yield, high salinity.
Not located.Converted to well 3C.Called well 103 in 1982.Converted to well 4C.Called well 104 in 1982.Converted to well 15.Called well 105 in 1982.
Abandoned before completion.Exploratory hole.Converted to well 10 IBCalled well 101.
- Altitude of well plate, levels of October 4-5, 1982.
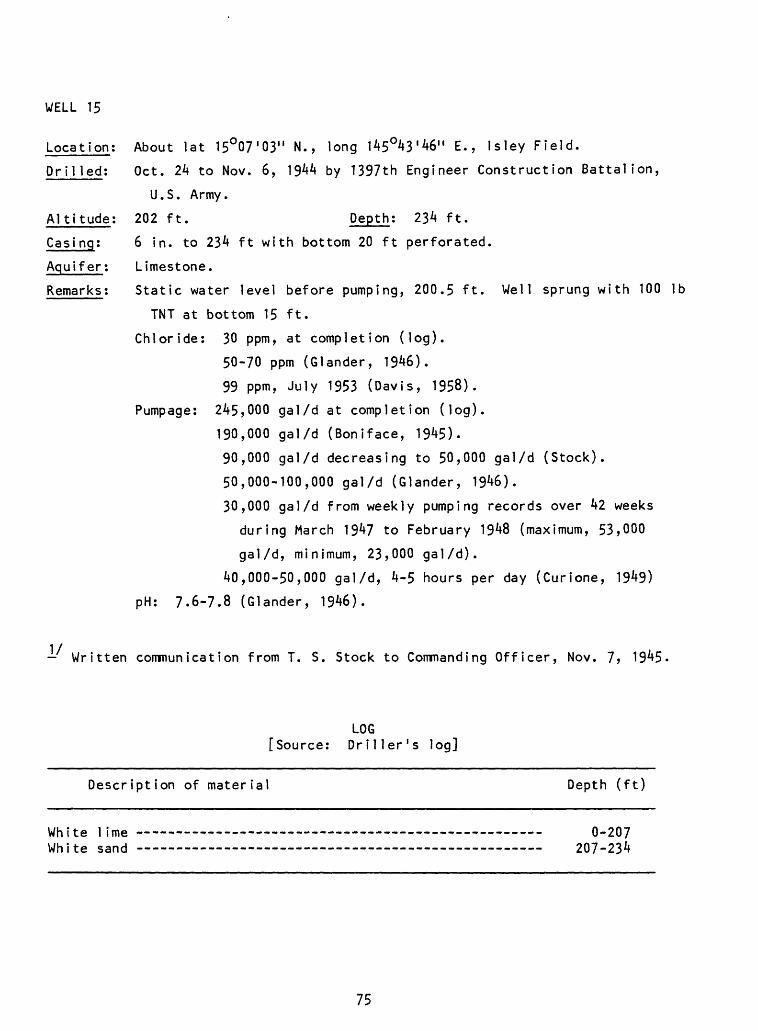
WELL 15
Location; About lat 15°07'03" N., long 145°43'46" E., Isley Field.
Drilled; Oct. 2k to Nov. 6, 1944 by 1397th Engineer Construction Battalion,
U.S. Army.
Altitude; 202 ft. Depth; 234 ft.
Casing; 6 in. to 234 ft with bottom 20 ft perforated.
Aquifer; Limestone.
Remarks; Static water level before pumping, 200.5 ft. Well sprung with 100 1b
TNT at bottom 15 ft.
Chloride; 30 ppm, at completion (log).
50-70 ppm (Glander, 1946).
99 ppm, July 1953 (Davis, 1958).
Pumpage; 245,000 gal/d at completion (log).
190,000 gal/d (Boniface, 1945).
90,000 gal/d decreasing to 50,000 gal/d (Stock).
50,000-100,000 gal/d (Glander, 1946).
30,000 gal/d from weekly pumping records over 42 weeks
during March 1947 to February 1948 (maximum, 53,000
gal/d, minimum, 23,000 gal/d).
40,000-50,000 gal/d, 4-5 hours per day (Curione, 1949)
pH; 7.6-7.8 (Glander, 1946).
Written communication from T. S. Stock to Commanding Officer, Nov. 7> 1945-
LOG [Source; Driller's log]
Description of material Depth (ft)
White lime --- 0-207 White sand -- -- 207-234
75
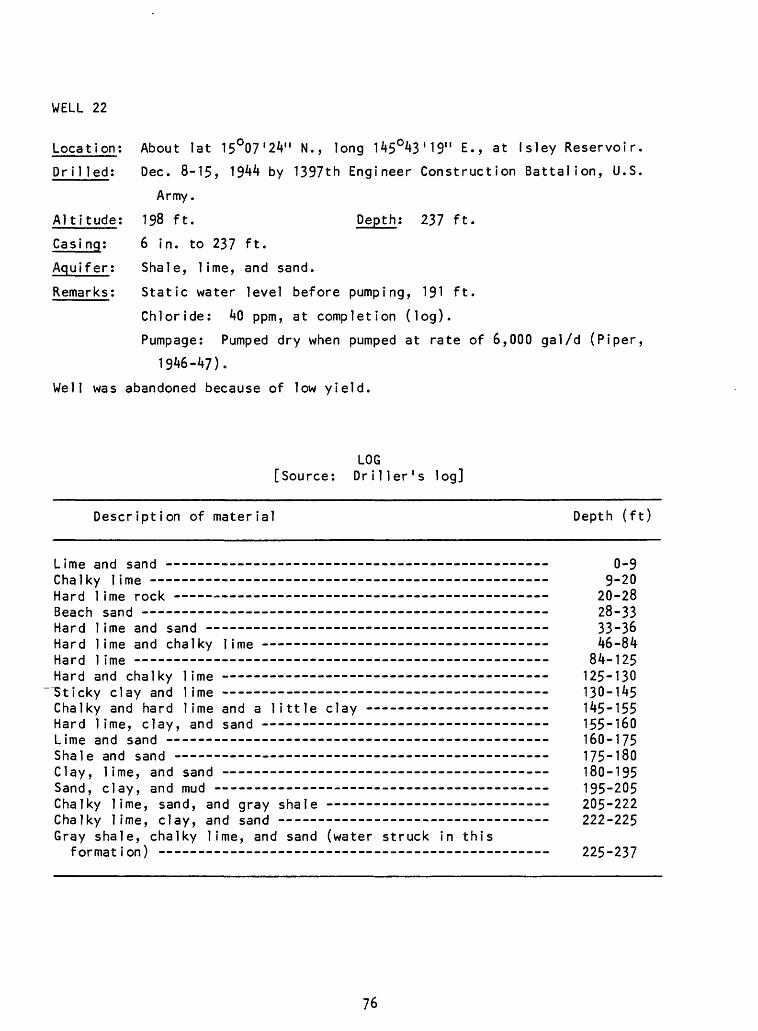
WELL 22
Location; About lat 15°07'24" N., long 145°43'19" E., at Isley Reservoir.
Drilled; Dec. 8-15, 1944 by 1397th Engineer Construction Battalion, U.S.
Army.
Altitude; 198 ft. Depth; 237 ft.
Casi ng; 6 in. to 237 ft.
Aquifer; Shale, lime, and sand.
Remarks; Static water level before pumping, 191 ft.
Chloride; 40 ppm, at completion (log).
Pumpage; Pumped dry when pumped at rate of 6,000 gal/d (Piper,
1946-47).
Well was abandoned because of low yield.
LOG [Source; Driller's log]
Description of material Depth (ft)
Lime and sand 0-9Chalky lime 9-20Hard lime rock 20-28Beach sand 28-33Hard 1 ime and sand 33-36Hard lime and chalky lime 46-84Hard lime 84-125Hard and chalky lime 125-130
"Sticky clay and lime 130-145Chalky and hard lime and a little clay 145-155Hard lime, clay, and sand - - - - -- - 155-160Lime and sand 160-175Shale and sand 175-180Clay, lime, and sand 180-195Sand, clay, and mud 195-205Chalky lime, sand, and gray shale 205-222Chalky lime, clay, and sand -- 222-225 Gray shale, chalky lime, and sand (water struck in this
format ion) 225-237
76
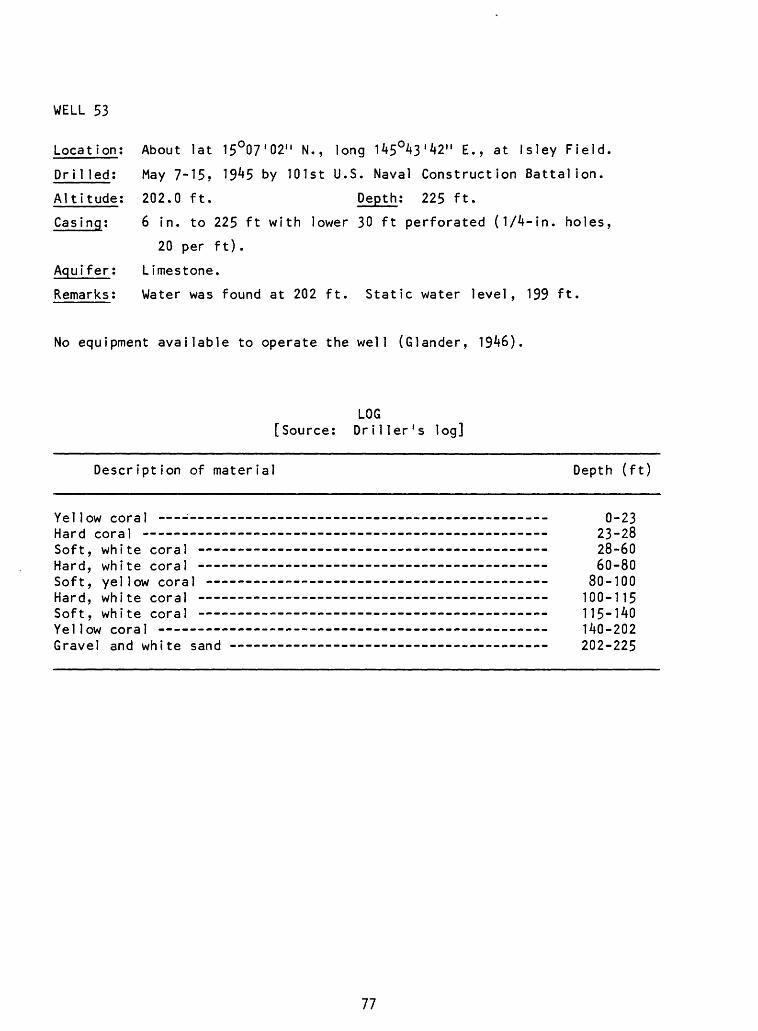
WELL 53
Location: About lat 15°07'02" N., long 145O43'42" E., at Isley Field.
Dri1 led; May 7-15, 19^5 by 101st U.S. Naval Construction Battalion.
Altitude; 202.0 ft. Depth; 225 ft.
Casing; 6 in. to 225 ft with lower 30 ft perforated (1/4-in. holes,
20 per ft).
Aquifer; Limestone.
Remarks; Water was found at 202 ft. Static water level, 199 ft.
No equipment available to operate the well (Glander, 1946).
[Source:LOG Driller 1 log]
Description of material Depth (ft)
Yel low coral : - Hard coral Soft, white coral
white coral yellow coral white coral white coral coral
Hard,Soft,Hard,Soft,YellowGravel and white sand
0-2323-2828-6060-80
80-100100-115115-140140-202202-225
77
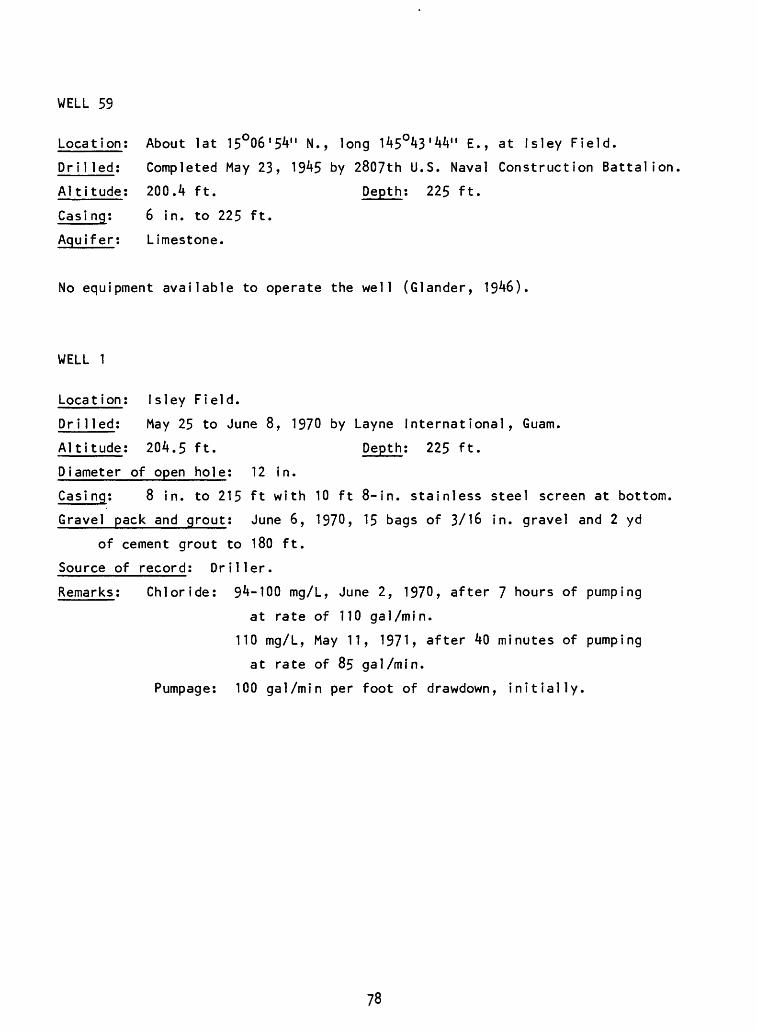
WELL 59
Location:
Drilled;
Altitude;
Casi ng;
Aquifer;
About lat 15°06'54" N., long 145°43'44" E., at Isley Field.
Completed May 23, 19^5 by 2807th U.S. Naval Construction Battalion
200.4 ft. Depth; 225 ft.
6 in. to 225 ft.
Limestone.
No equipment available to operate the well (Glander, 1946).
WELL 1
Location; Isley Field.
Dr ilied; May 25 to June 8, 1970 by Layne International, Guam.
Altitude; 204.5 ft. Depth; 225 ft.
Diameter of open hole; 12 in.
Casi ng; 8 in. to 215 ft with 10 ft 8-in. stainless steel screen at bottom,
Gravel pack and grout; June 6, 1970, 15 bags of 3/16 in. gravel and 2 yd
of cement grout to 180 ft.
Source of record; Driller.
Remarks; Chloride: 94-100 mg/L, June 2, 1970, after 7 hours of pumping
at rate of 110 gal/min.
110 mg/L, May 11, 1971, after 40 minutes of pumping
at rate of 85 gal/min.
Pumpage: 100 gal/min per foot of drawdown, initially.
78
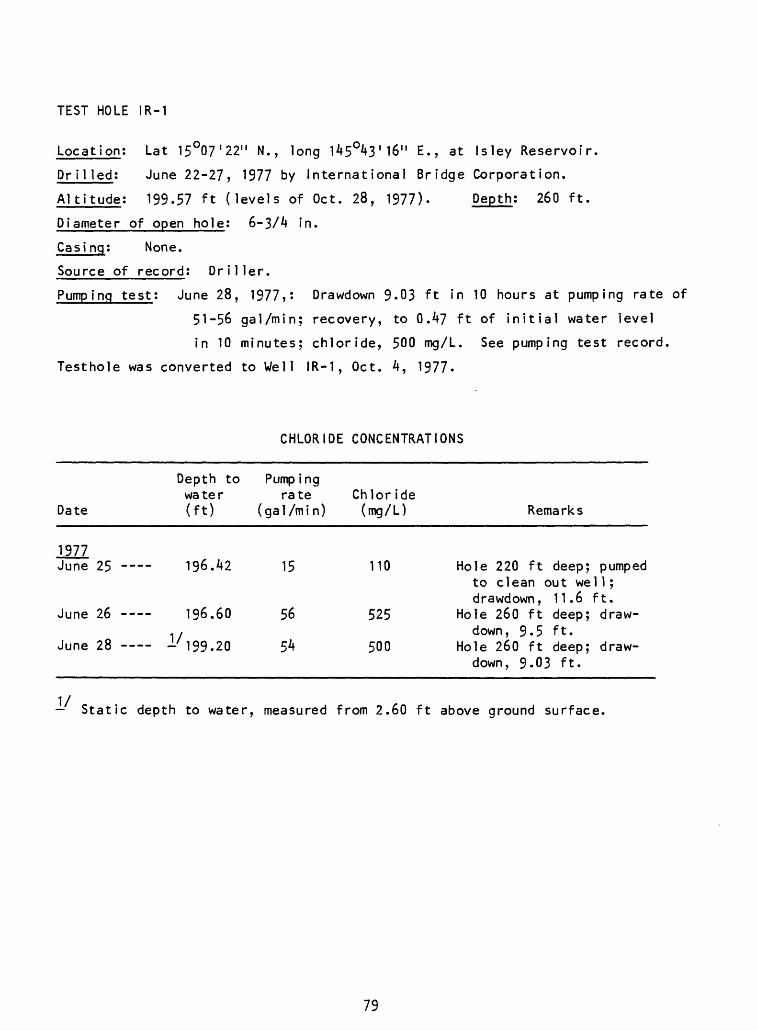
TEST HOLE IR-1
Location; Lat 15°07'22" N., long 145°43'16" E., at Isley Reservoir.
Dr i1 led; June 22-27, 1977 by International Bridge Corporation.
Altitude; 199.57 ft (levels of Oct. 28, 1977). Depth; 260 ft.
Diameter of open hole; 6-3/4 in.
Casing; None.
Source of record; Driller.
Pumping test; June 28, 1977,; Drawdown 9.03 ft in 10 hours at pumping rate of
51-56 gal/min; recovery, to 0.47 ft of initial water level
in 10 minutes; chloride, 500 mg/L. See pumping test record.
Testhole was converted to Well IR-1, Oct. 4, 1977.
CHLORIDE CONCENTRATIONS
Date
Depth to Pumpingwater rate Chloride(ft) (gal/min) (mg/L) Rema rk s
1977June 25 -
June 26 -
June 28
196.42
196.60
-199.20
15
56
54
110
525
500
Hole 220 ft deep; pumpedto clean out wel 1 ;drawdown, 11.6 ft.
Hole 260 ft deep; drawdown, 9.5 ft.
Hole 260 ft deep; drawdown, 9-03 ft.
Static depth to water, measured from 2.60 ft above ground surface.
79
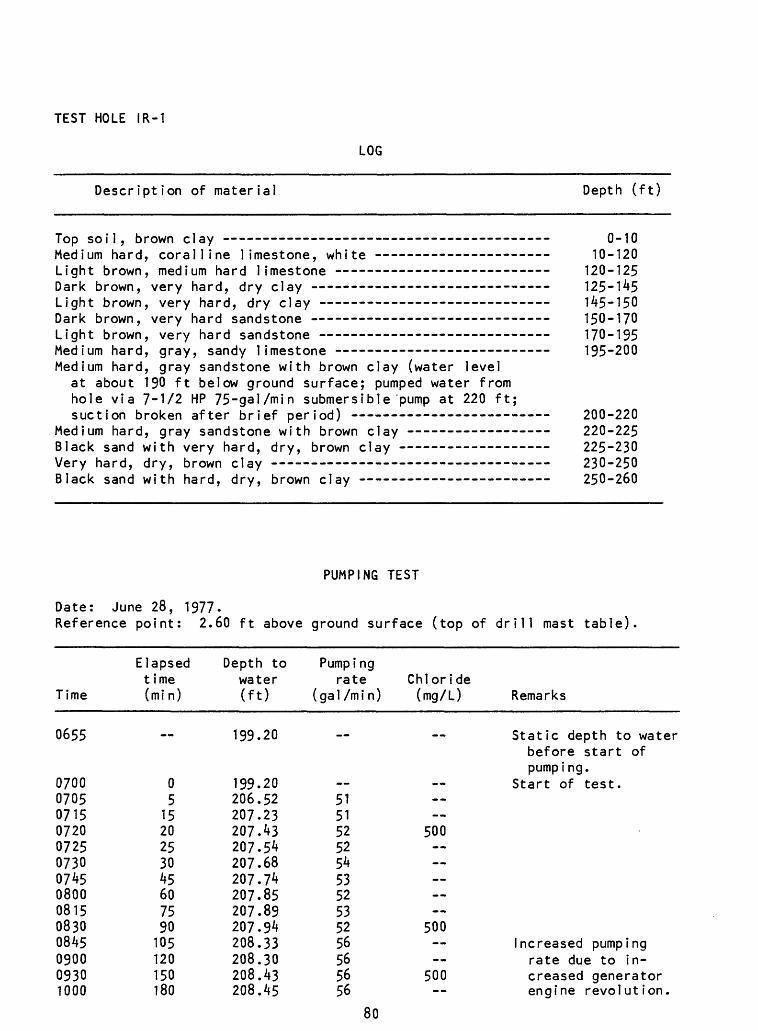
TEST HOLE IR-1
LOG
Description of material Depth (ft)
Top soil, brown clay - - - Medium hard, coralline limestone, white Light brown, medium hard limestone - - - Dark brown, very hard, dry clay -- - Light brown, very hard, dry clay Dark brown, very hard sandstone - -Light brown, very hard sandstone Medium hard, gray, sandy limestone Medium hard, gray sandstone with brown clay (water level
at about 190 ft below ground surface; pumped water from hole via 7-1/2 HP 75-gal/min submersible "pump at 220 ft; suction broken after brief period)
Medium hard, gray sandstone with brown clay - - Black sand with very hard, dry, brown clay Very hard, dry, brown clay Black sand with hard, dry, brown clay
0-10 10-120
120-125 125-1^5 145-150 150-170170-195 195-200
200-220 220-225 225-230 230-250 250-260
PUMPING TEST
Date: June 28, 1977.Reference point: 2.60 ft above ground surface (top of drill mast table).
Time
Elapsed time (mi n)
Depth to water (ft)
Pumpingrate
(gal/min)Chloride (mg/L) Remarks
0655
07000705071507200725073007450800081508300845090009301000
05
1520253045607590105120150180
199.20
199.20206.52207.23207.43207.54207.68207.74207.85207.89207.94208.33208.30208.43208.45
51515252545352535256565656
Static depth to water before start of pumpi ng.
Start of test.
500
500
500
Increased pumping rate due to in creased generator engine revolution.
80
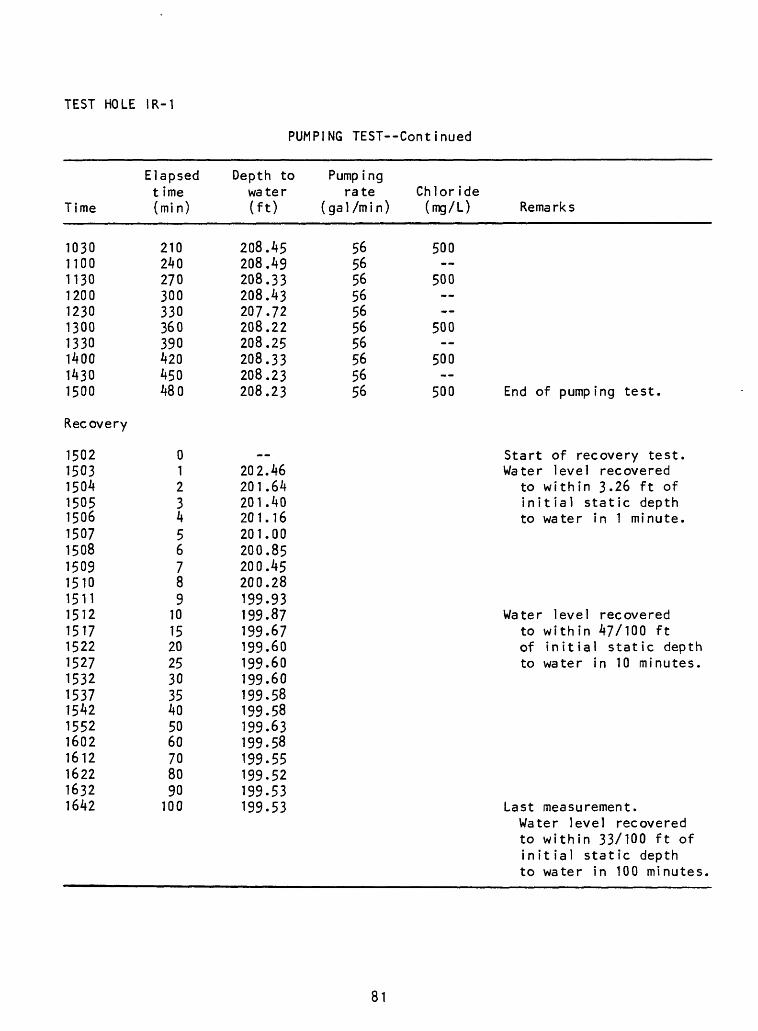
TEST HOLE IR-1
PUMPING TEST--Continued
Time
1030110011301200123013001330140014301500
Recovery
15021503150415051506150715081509151015111512151715221527153215371542155216021612162216321642
Elapsed t ime (min)
210240270300330360390420450480
0123456789
101520253035405060708090
100
Depth to water (ft)
208.45208.49208.33208.43207.72208.22208.25208.33208.23208.23
202.46201.64201.40201.16201.00200.85200.45200.28199.93199.87199.67199.60199.60199.60199.58199.58199.63199.58199.55199.52199.53199.53
Pump i ng rate
( ga 1 /m i n )
56565656565656565656
Chlor ide (mg/L) Remarks
500
500
500
500
500 End of pumping test.
Start of recovery test.Water level recovered
to within 3.26 ft ofinitial static depthto water in 1 minute.
Water level recoveredto within 47/100 ftof initial static depthto water in 10 minutes.
Last measurement.Water level recoveredto within 33/100 ft ofinitial static depthto water in 100 minutes.
81
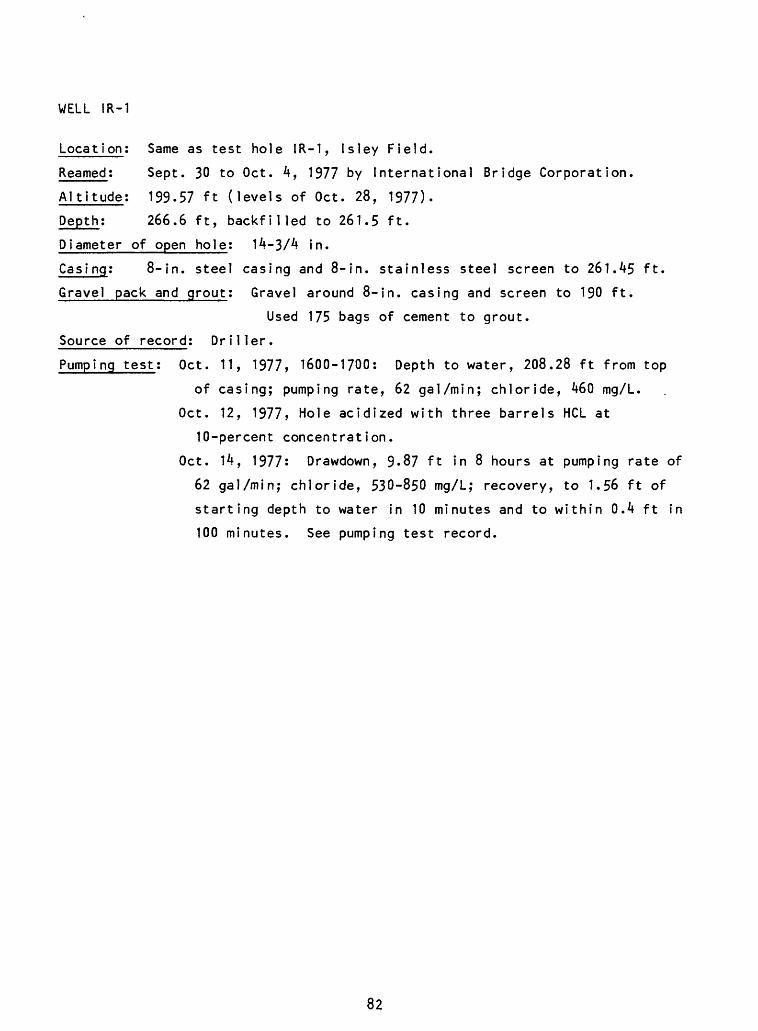
WELL IR-1
Location; Same as test hole IR-1, Isley Field.
Reamed: Sept. 30 to Oct. 4, 1977 by International Bridge Corporation.
Altitude; 199.57 ft (levels of Oct. 28, 1977).
Depth; 266.6 ft, backfilled to 261.5 ft.
Diameter of open hole; 14-3/4 in.
Casi ng; 8-in. steel casing and 8-in. stainless steel screen to 261.45 ft.
Gravel pack and grout; Gravel around 8-in. casing and screen to 190 ft.
Used 175 bags of cement to grout.
Source of record; Driller.
Pumping test; Oct. 11, 1977, 1600-1700: Depth to water, 208.28 ft from top
of casing; pumping rate, 62 gal/min; chloride, 460 mg/L.
Oct. 12, 1977, Hole acidized with three barrels HCL at
10-percent concentration.
Oct. 14, 1977: Drawdown, 9.87 ft in 8 hours at pumping rate of
62 gal/min; chloride, 530-850 mg/L; recovery, to 1.56 ft of
starting depth to water in 10 minutes and to within 0.4 ft in
100 minutes. See pumping test record.
82
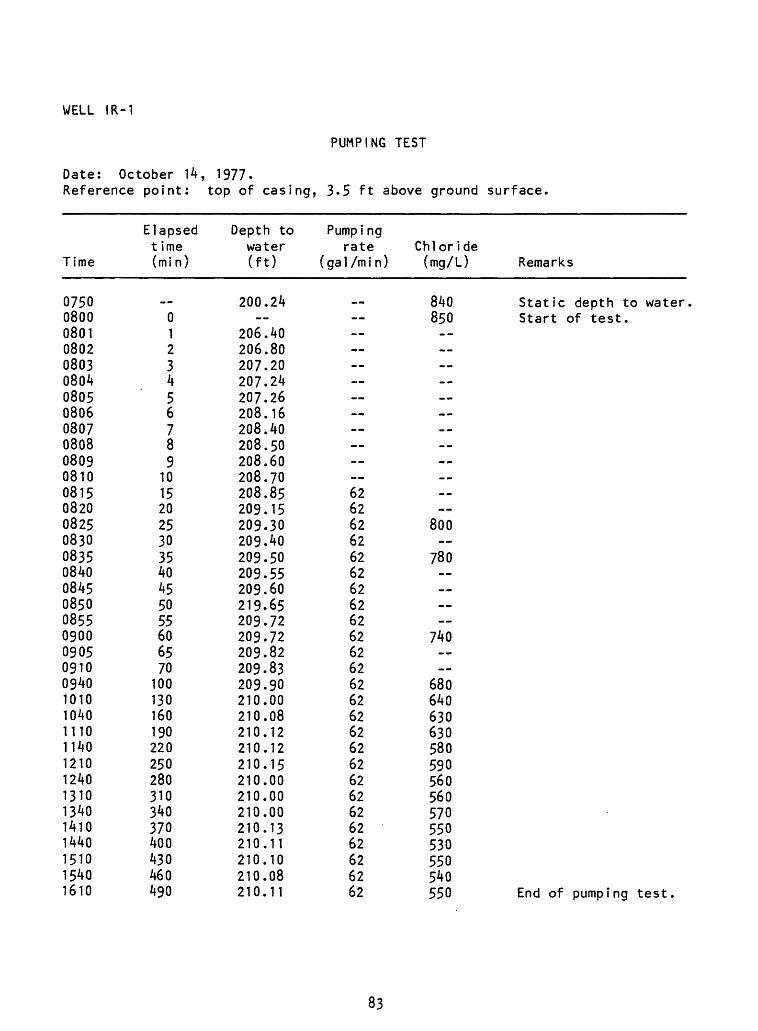
WELL IR-1
PUMPING TEST
Date: October 14, 1977.Reference point: top of casing, 3.5 ft above ground surface.
Time
07500800080108020803080408050806080708080809081008150820082508300835084008450850085509000905091009401010104011101140121012401310134014101440151015401610
Elapsed t ime (mi n)
0123456789
10152025303540455055606570
100130160190220250280310340370400430460490
Depth to water (ft)
200.24
206.40206.80207.20207.24207.26208.16208.40208.50208.60208.70208.85209.15209.30209.40209.50209.55209.60219.65209.72209.72209.82209.83209.90210.00210.08210.12210.12210.15210.00210.00210.00210.13210.11210.10210.08210.11
Pumping rate
( ga 1 /m i n )
M
--
--
.
6262626262626262626262626262626262626262626262626262
Chloride (mg/L) Remarks
840 Static depth to water850 Start of test.-------------- ------
800--
780---- .
740--
680640630630580590560560570550530550540550 End of pumping test.
83
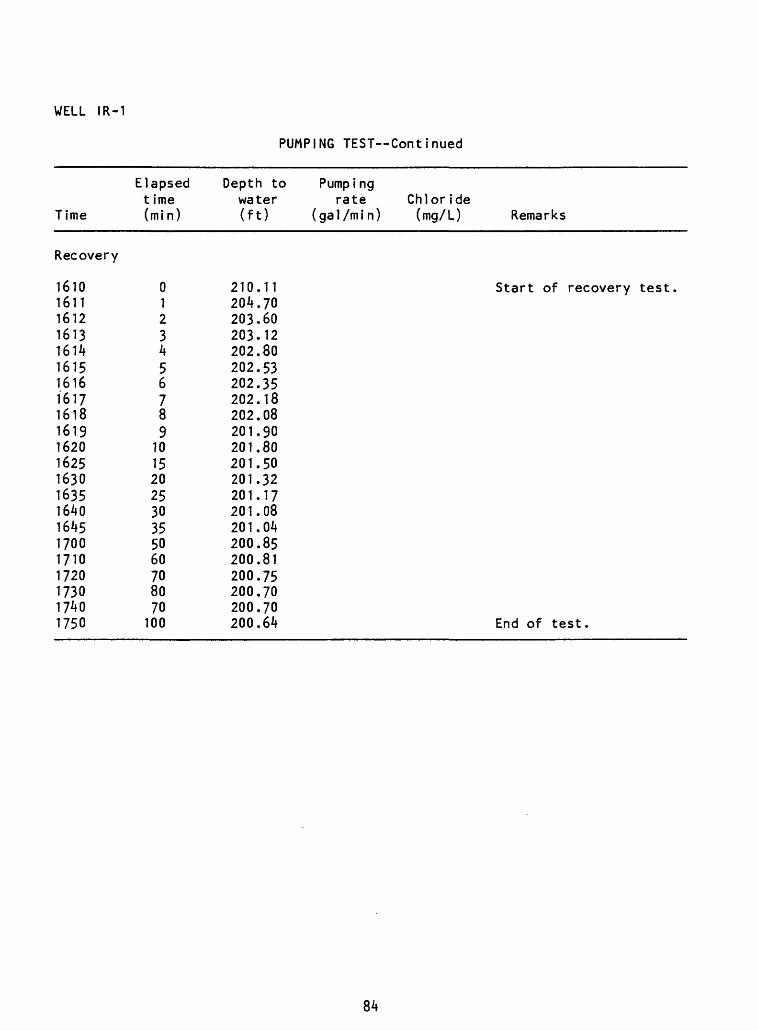
WELL IR-1
PUMPING TEST Continued
Time
Recovery
1610161116121613161416151616161716181619162016251630163516401645170017101720173017401750
Elapsed t ime (min)
0123456789
1015202530355060708070100
Depth to Pumping water rate Chloride (ft) (gal/min) (mg/L) Remarks
210.11 Start of recovery test.204.70203.60203.12202.80202.53202.35202.18202.08201.90201.80201.50201.32201.17201.08201.04200.85200.81200.75200.70200.70200.64 End of test.
84
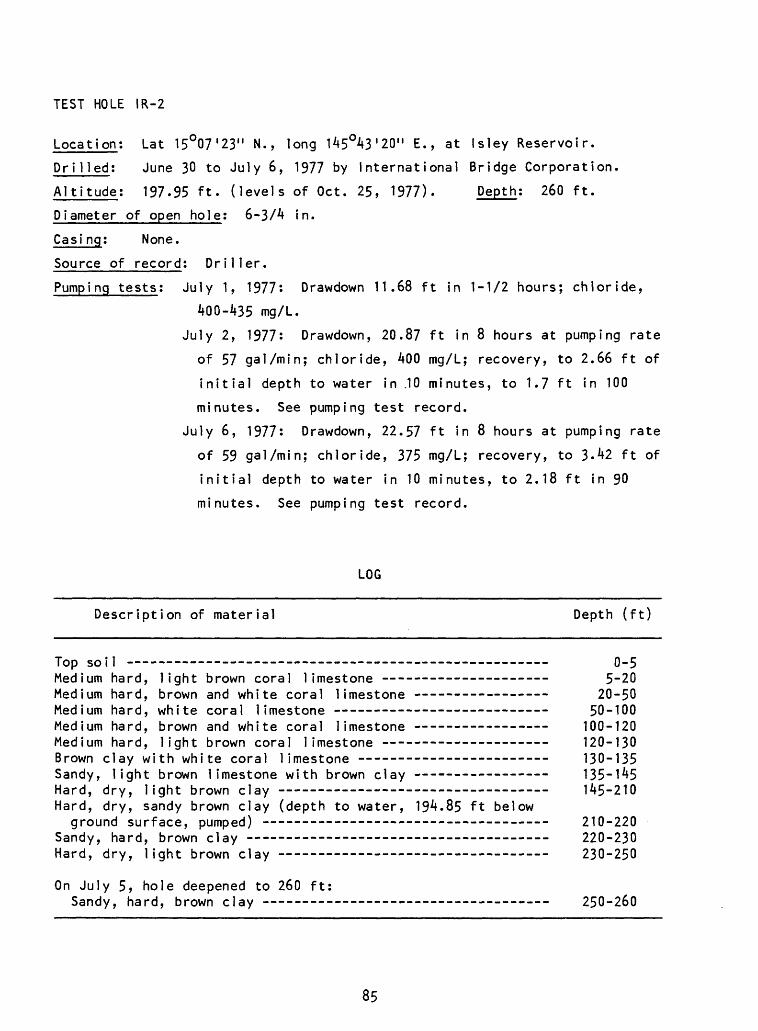
TEST HOLE IR-2
Location; Lat 15°07'23" N., long 145°43'20" E., at Isley Reservoir.
Dr i1 led; June 30 to July 6, 1977 by International Bridge Corporation.
Altitude; 197.95 ft. (levels of Oct. 25, 1977). Depth; 260 ft.
Diameter of open hole; 6-3/4 in.
Casi ng; None.
Source of record; Driller.
Pumping tests; July 1, 1977; Drawdown 11.68 ft in 1-1/2 hours; chloride,
400-435 mg/L.
July 2, 1977: Drawdown, 20.87 ft in 8 hours at pumping rate
of 57 gal/min; chloride, 400 mg/L; recovery, to 2.66 ft of
initial depth to water in .10 minutes, to 1.7 ft in 100
minutes. See pumping test record.
July 6, 1977: Drawdown, 22.57 ft in 8 hours at pumping rate
of 59 gal/min; chloride, 375 mg/L; recovery, to 3-42 ft of
initial depth to water in 10 minutes, to 2.18 ft in 90
minutes. See pumping test record.
LOG
Description of material Depth (ft)
Top soil _ _ _ __ ______ « 0 5Medium hard, light brown coral limestone -- ------- --- - 5-20Medium hard, brown and white coral limestone - --- ------ 20-50Medium hard, white coral limestone ------------------ _____ 50-100Medium hard, brown and white coral limestone _____ ---_ - 100-120Medium hard, light brown coral limestone - - - 120-130Brown clay with white coral limestone - - - 130-135Sandy, light brown limestone with brown clay - ---- ------ 135-145Hard, dry, light brown clay 145-210 Hard, dry, sandy brown clay (depth to water, 194.85 ft below
ground surface, pumped) - - - - 210-220Sandy, hard, brown clay -- 220-230Hard, dry, light brown clay 230-250
On July 5, hole deepened to 260 ft;Sandy, hard, brown clay - - - - - 250-260
85
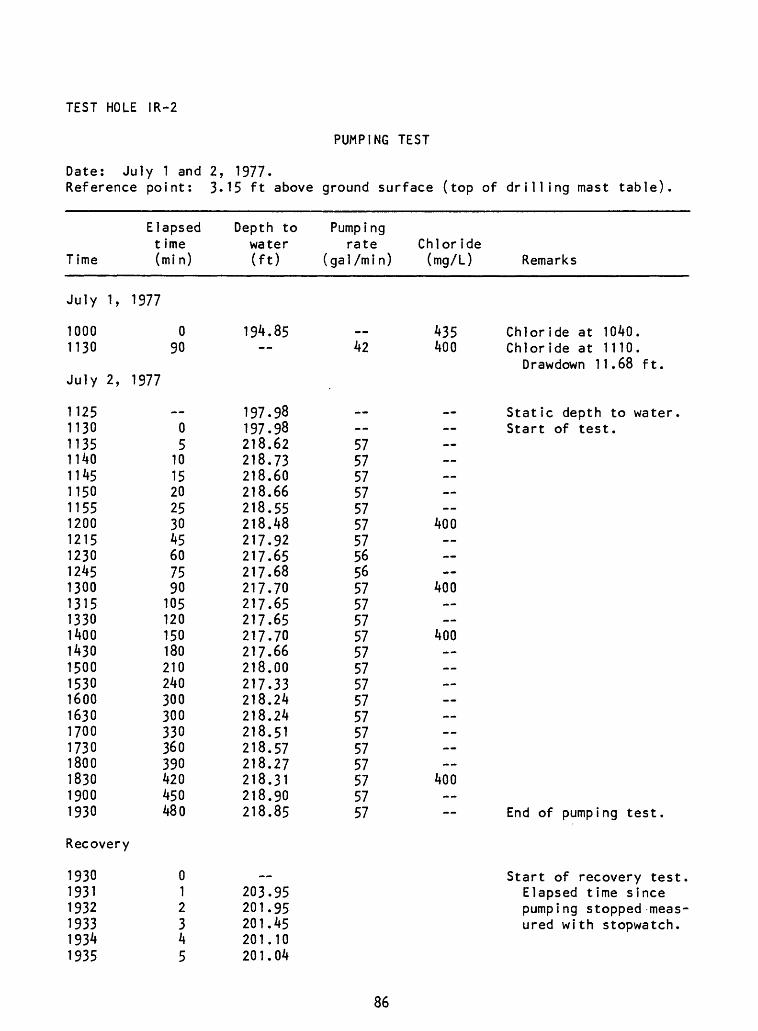
TEST HOLE IR-2
PUMPING TEST
Date: July 1 and 2, 1977.Reference point: 3-15 ft above ground surface (top of drilling mast table)
Time
Elapsedt ime(mi n)
Depth towater(ft)
Pumpingrate
(gal/min)Chloride(mg/L) Remarks
July 1, 1977
1000 01130 90
July 2, 1977
11251130113511401145115011551200121512301245130013151330140014301500153016001630170017301800183019001930
Recovery
1930 01931 11932 21933 31934 41935 5
194.85
05
101520253045607590105120150180210240300300330360390420450480
197.98197.98218.62218.73218.60218.66218.55218.48217.92217.65217.68217.70217.65217.65217.70217.66218.00217.33218.24218.24218.51218.57218.27218.31218.90218.85
203.95201.95201.45201.10201.04
42
575757575757575656575757575757575757575757575757
435400
Chloride at 1040. Chloride at 1110.
Drawdown 11.68 ft.
Static depth to water Start of test.
400
400
400
400
End of pumping test.
Start of recovery test Elapsed time since pumping stopped meas ured with stopwatch.
86
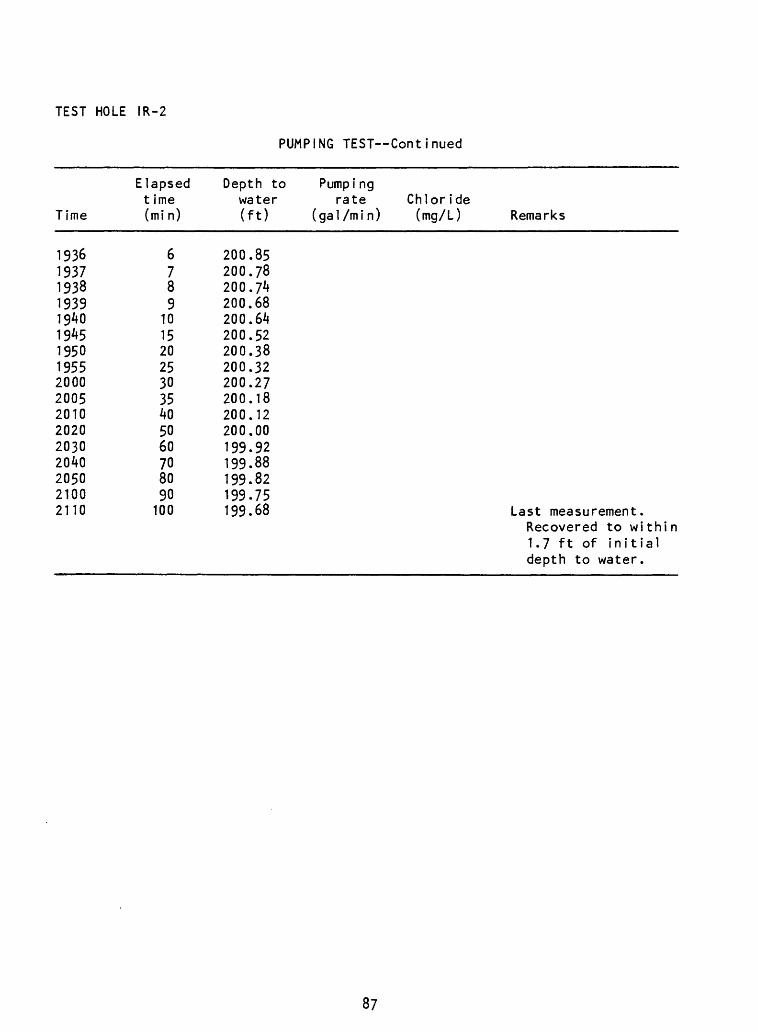
TEST HOLE IR-2
PUMPING TEST Continued
Elapsed Depth to Pumpingtime water rate Chloride
Time (min) (ft) (gal/min) (mg/L) Remarks
1936 6 200.851937 7 200.781938 8 200.7**1939 9 200.681940 10 200.641945 15 200.521950 20 200.381955 25 200.322000 30 200.272005 35 200.182010 40 200.122020 50 200.002030 60 199.922040 70 199.882050 80 199.822100 90 199.752110 100 199.68 Last measurement.
Recovered to within 1.7 ft of initial depth to water.
87
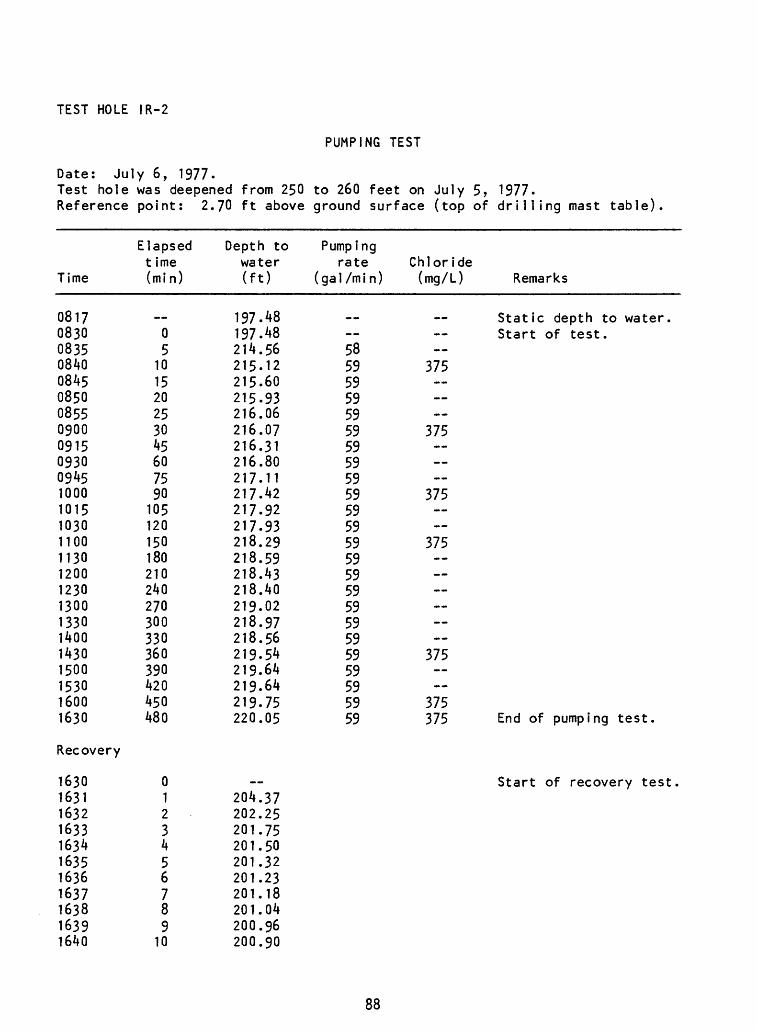
TEST HOLE IR-2
PUMPING TEST
Date: July 6, 1977.Test hole was deepened from 250 to 260 feet on July 5, 1977.Reference point: 2.70 ft above ground surface (top of drilling mast table)
Time
081708300835084008450850085509000915093009^5100010151030110011301200123013001330140014301500153016001630
Recovery
16301631163216331634163516361637163816391640
Elapsed t ime (min)
05
101520253045607590105120150180210240270300330360390420450480
0123456789
10
Depth to water (ft)
197.48197.48214.56215.12215.60215.93216.06216.07216.31216.80217.11217.42217.92217.93218.29218.59218.43218.40219.02218.97218.56219.54219.64219.64219.75220.05
--204.37202.25201.75201.50201.32201.23201.18201.04200.96200.90
Pumping rate
(gal /min)
w> w>
585959595959595959595959595959595959595959595959
Chloride (mg/L) Remarks
Static depth to water.Start of test.
375
375
375
375
375
375375 End of pumping test.
Start of recovery test.
88
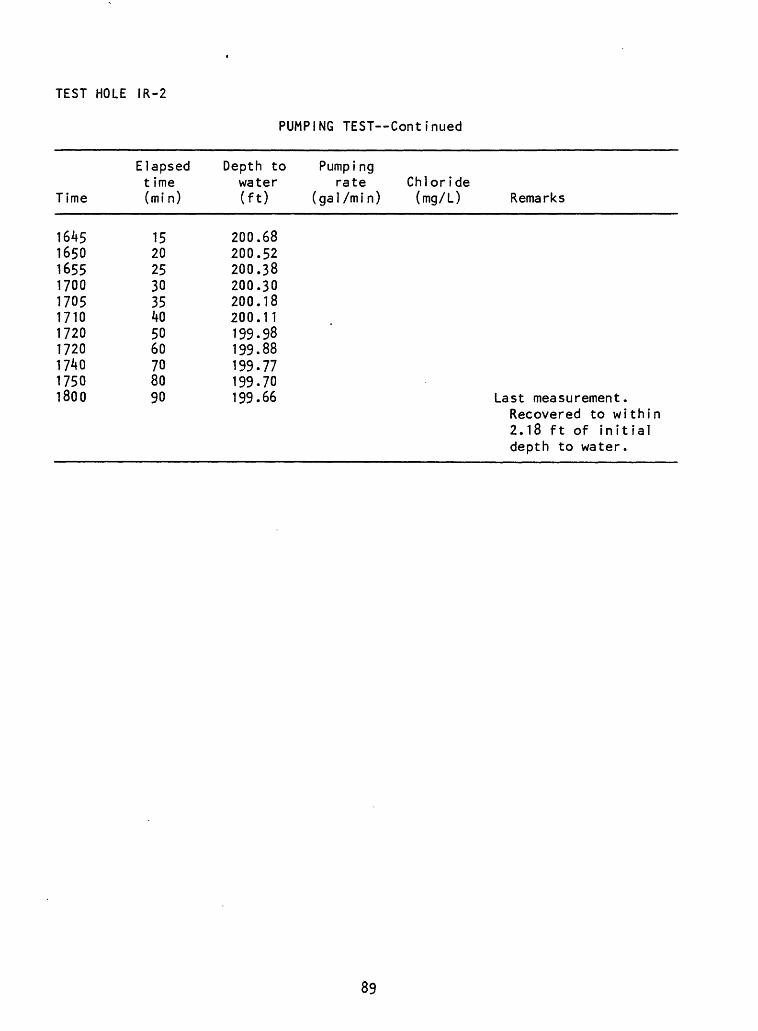
TEST HOLE IR-2
PUMPING TEST Continued
Elapsed Depth to Pumpingtime water rate Chloride
Time (min) (ft) (gal/min) (mg/L) Remarks
1645 15 200.681650 20 200.521655 25 200.381700 30 200.301705 35 200.181710 40 200.111720 50 199.981720 60 199.881740 70 199.771750 80 199.701800 90 199.66 Last measurement.
Recovered to within 2.18 ft of initial depth to water.
89
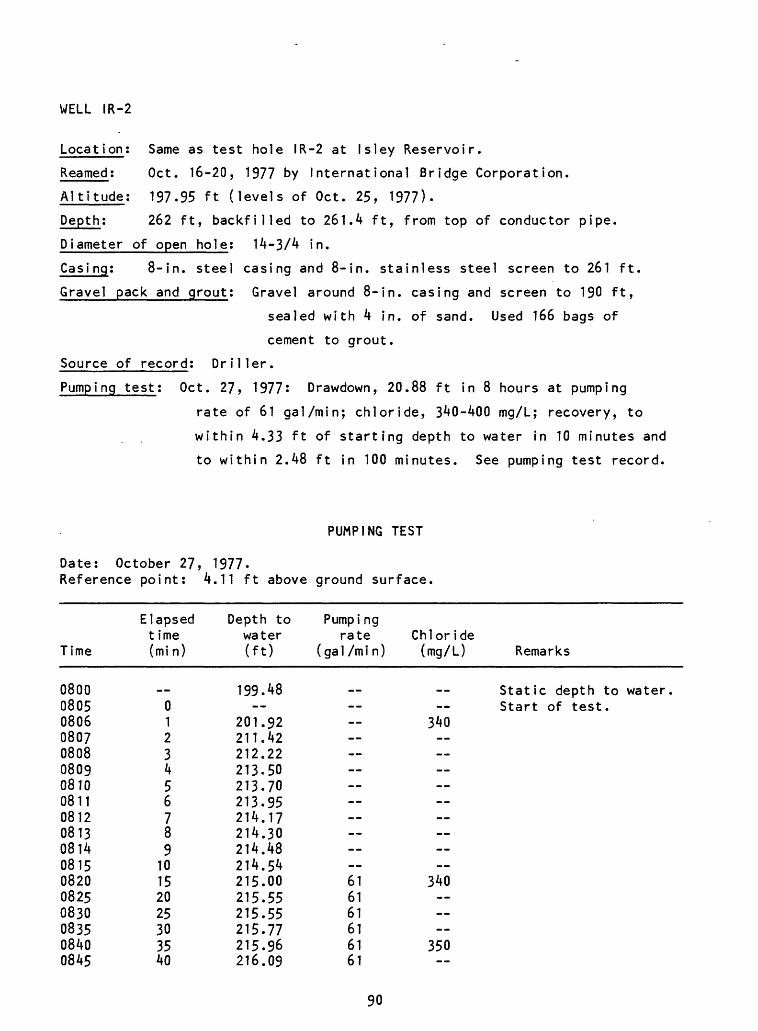
WELL IR-2
Location: Same as test hole IR-2 at Isley Reservoir.
Reamed: Oct. 16-20, 1977 by International Bridge Corporation.
Altitude; 197-95 ft (levels of Oct. 25, 1977).
Depth; 262 ft, backfilled to 261.4 ft, from top of conductor pipe.
Diameter of open hole; 14-3/4 in.
Casing; 8-in. steel casing and 8-in. stainless steel screen to 261 ft.
Gravel pack and grout; Gravel around 8-in. casing and screen to 190 ft,
sealed with 4 in. of sand. Used 166 bags of
cement to grout.
Source of record; Driller.
Pumping test; Oct. 27, 1977: Drawdown, 20.88 ft in 8 hours at pumping
rate of 61 gal/min; chloride, 340-400 mg/L; recovery, to
within 4.33 ft of starting depth to water in 10 minutes and
to within 2.48 ft in 100 minutes. See pumping test record.
PUMPING TEST
Date: October 27, 1977.Reference point: 4.11 ft above ground surface.
Time
080008050806080708080809081008110812081308140815082008250830083508400845
Elapsed time (min)
_ 0123456789
10152025303540
Depth to water (ft)
199.48
201.92211.42212.22213.50213.70213.95214.17214.30214.48214.54215.00215.55215.55215.77215.96216.09
Pumpi ng rate
(gal/min)
__ 616161616161
Chloride (mg/L) Remarks
Static depth to water.Start of test.
340 --
340
350
90
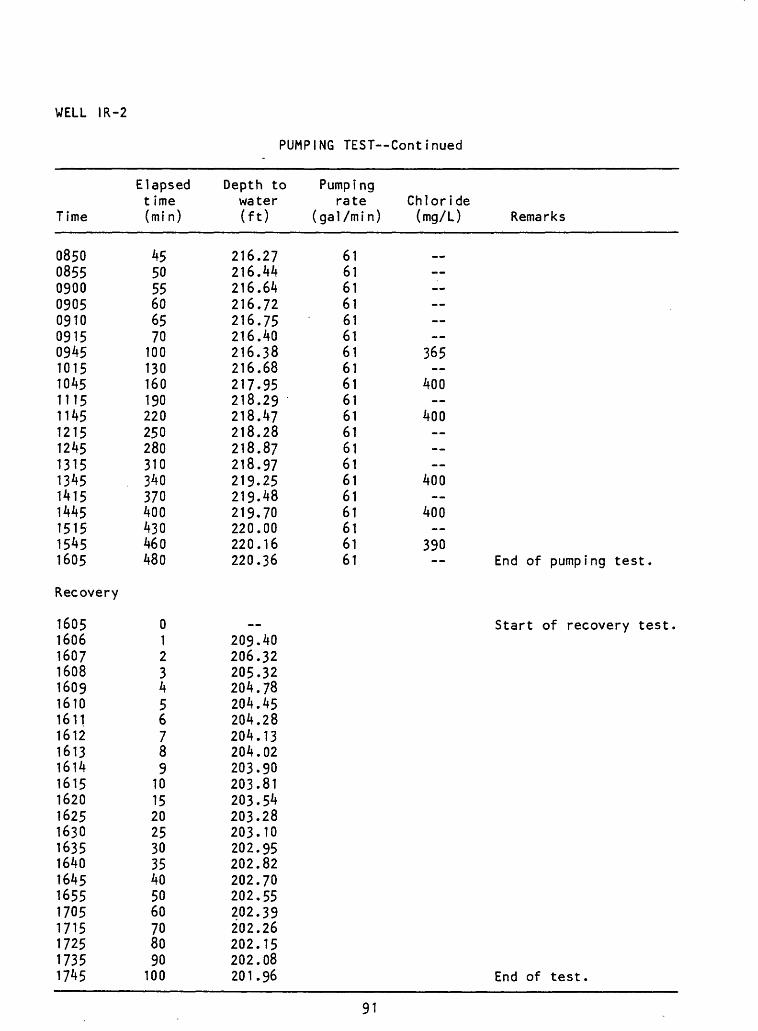
WELL IR-2
PUMPING TEST Continued
Time
08500855090009050910091509451015104511151145121512451315134514151445151515451605
Recovery
16051606160716081609161016111612161316141615162016251630163516401645165517051715172517351745
Elapsed t ime (mi n)
455055606570100130160190220250280310340370400430460480
0123456789
101520253035405060708090
100
Depth to water (ft)
216.27216.44216.64216.72216.75216.40216.38216.68217.95218.29218.47218.28218.87218.97219.25219.48219.70220.00220.16220.36
__209.40206.32205.32204.78204.45204.28204.13204.02203.90203.81203.54203.28203.10202.95202.82202.70202.55202.39202.26202.15202.08201.96
Pumping rate Chloride
(gal/min) (mg/L) Remarks
61616161616161 3656161 4006161 40061616161 4006161 4006161 39061 End of pumping test.
Start of recovery test.
End of test.
91
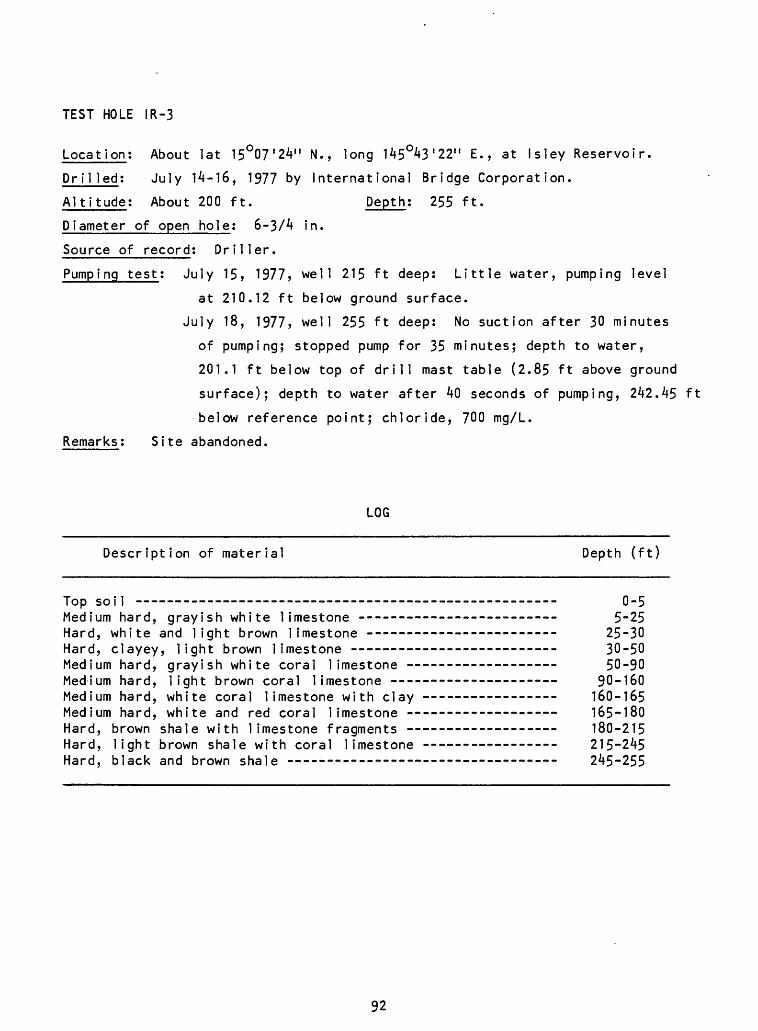
TEST HOLE IR-3
Location: About lat 15°07'2V' N., long U5O/*3'22" E., at Isley Reservoir.
Dr i1 led: July 14-16, 1977 by International Bridge Corporation.
Altitude: About 200 ft. Depth; 255 ft.
Diameter of open hole: 6-3A in.
Source of record: Driller.
Pumping test; July 15, 1977, well 215 ft deep: Little water, pumping level
at 210.12 ft below ground surface.
July 18, 1977, well 255 ft deep: No suction after 30 minutes
of pumping; stopped pump for 35 minutes; depth to water,
201.1 ft below top of drill mast table (2.85 ft above ground
surface); depth to water after 40 seconds of pumping, 2^2.^5 ft
below reference point; chloride, 700 mg/L.
Remarks: Site abandoned.
LOG
Description of material Depth (ft)
Top soil - - -- -- ---- --- -- ------------ 0-5Medium hard, grayish white limestone 5-25Hard, white and light brown limestone - - - 25-30Hard, clayey, light brown limestone - 30-50Medium hard, grayish white coral limestone ---- - --- - 50-90Medium hard, light brown coral limestone -- ------ ------- 90-160Medium hard, white coral limestone with clay - 160-165Medium hard, white and red coral limestone - 165-180Hard, brown shale with limestone fragments - 180-215Hard, light brown shale with coral limestone - 215-2^5Hard, black and brown shale 2^5-255
92
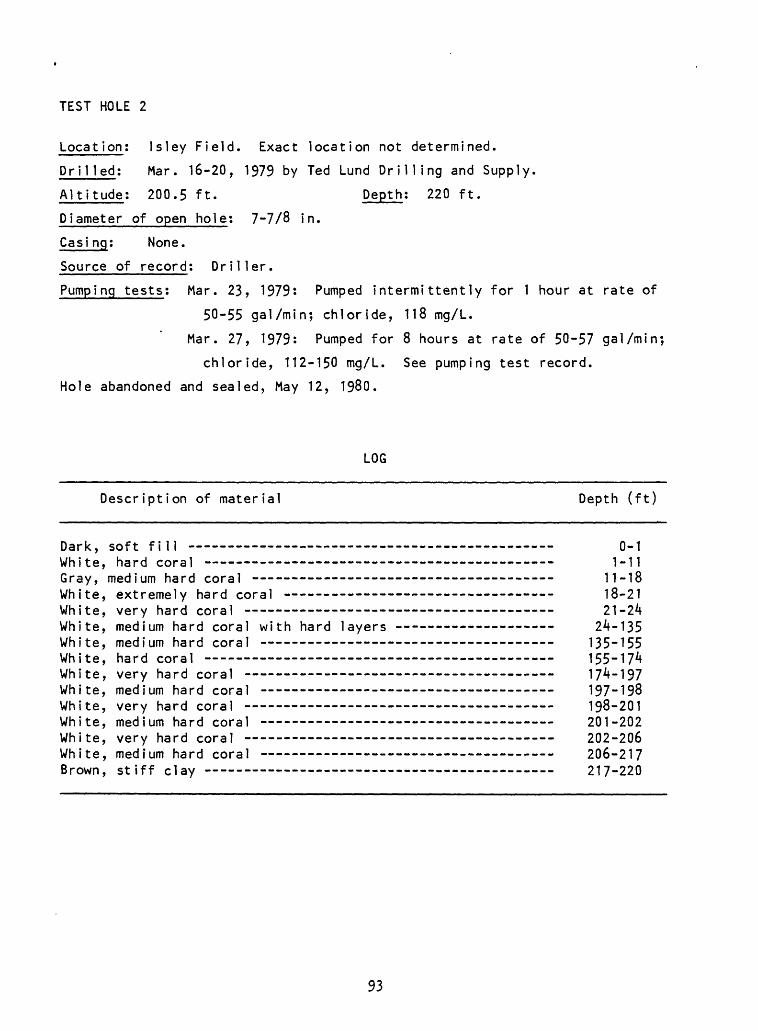
TEST HOLE 2
Locat ion: Isley Field. Exact location not determined.
Drilled; Mar. 16-20, 1979 by Ted Lund Drilling and Supply.
Altitude; 200.5 ft. Depth; 220 ft.
Diameter of open hole; 7-7/8 in.
Casi ng; None.
Source of record; Driller.
Pumping tests; Mar. 23, 1979; Pumped intermittently for 1 hour at rate of
50-55 gal/min; chloride, 118 mg/L.
Mar. 27, 1979: Pumped for 8 hours at rate of 50-57 gal/min;
chloride, 112-150 mg/L. See pumping test record.
Hole abandoned and sealed, May 12, 1980.
LOG
Description of material Depth (ft)
Dark, soft fill 0-1White, hard coral - - 1-11Gray, medium hard coral - - 11-18White, extremely hard coral --- - 18-21White, very hard coral 21-24White, medium hard coral with hard layers 24-135White, medium hard coral - 135-155White, hard coral 155-174White, very hard coral -- 174-197White, medium hard coral 197-198White, very hard coral 198-201White, medium hard coral 201-202White, very hard coral -- - -- 202-206White, medium hard coral - -- 206-217Brown, stiff clay - - - -- 217-220
93
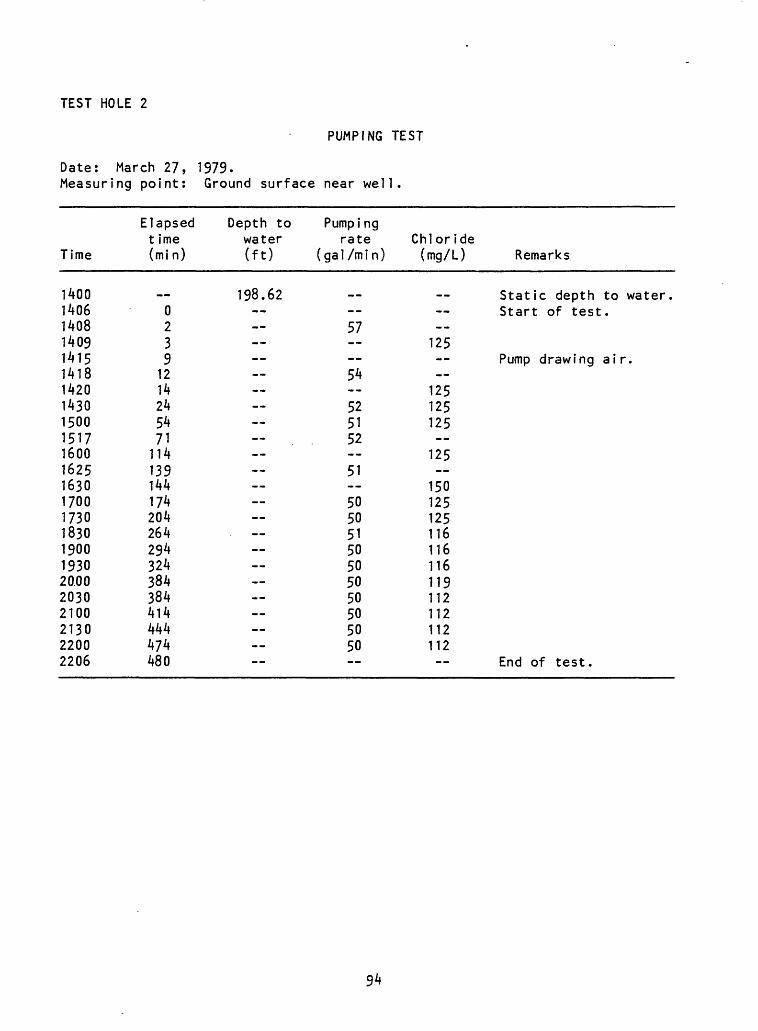
TEST HOLE 2
PUMPING TEST
Date: March 27, 1979.Measuring point: Ground surface near well.
Time
140014061408140914151418142014301500151716001625163017001730183019001930200020302100213022002206
Elapsed t ime (mi n)
_0239
1214245471114139144174204264294324384384414444474480
Depth to water (ft)
198.62
.
Pumpi ng rate
( ga 1 /m i n )
57 54 525152 51 50505150505050505050--
Chloride (mg/L) Remarks
Static depth to water.Start of test.
--125
Pump drawing air.
125125125
125
150125125116116116119112112112112
End of test.
94
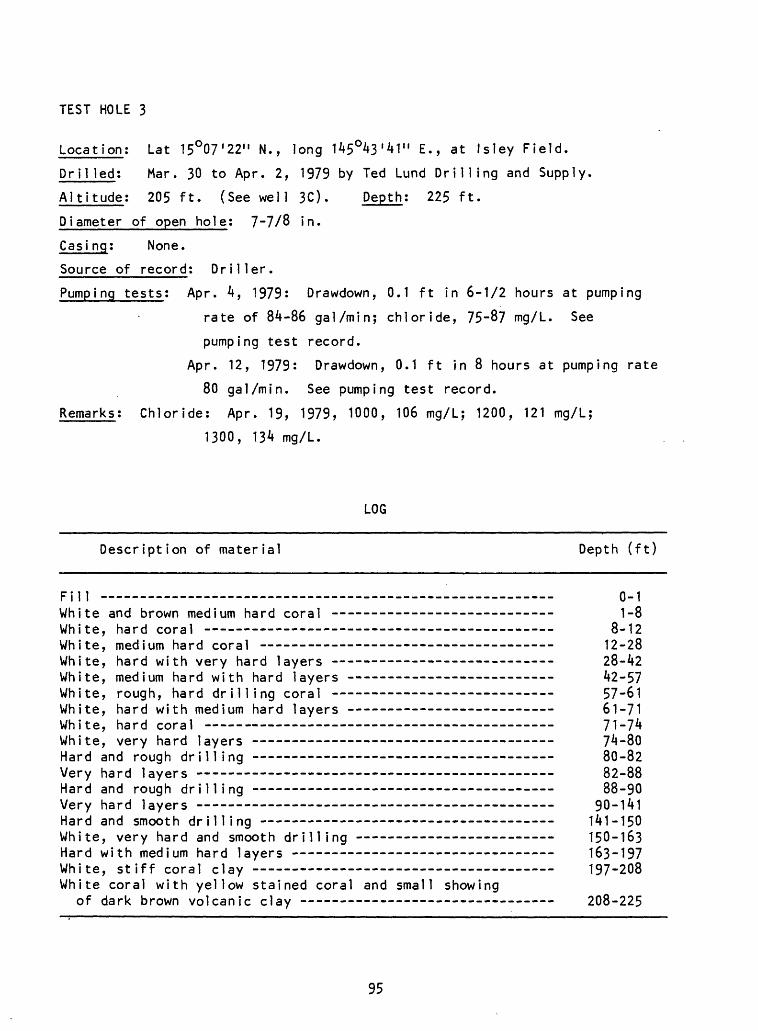
TEST HOLE 3
Location: Lat 15°07'22" N., long 145°43'41" E., at Isley Field.
Drilled: Mar. 30 to Apr. 2, 1979 by Ted Lund Drilling and Supply.
Altitude; 205 ft. (See well 3C). Depth: 225 ft.
Diameter of open hole: 7~7/8 in.
Casi ng: None.
Source of record: Driller.
Pumping tests: Apr. 4, 1979: Drawdown, 0.1 ft in 6-1/2 hours at pumping
rate of 84-86 gal/min; chloride, 75-87 mg/L. See
pumping test record.
Apr. 12, 1979: Drawdown, 0.1 ft in 8 hours at pumping rate
80 gal/min. See pumping test record.
Remarks; Chloride: Apr. 19, 1979, 1000, 106 mg/L; 1200, 121 mg/L;
1300, 134 mg/L.
LOG
Description of material Depth (ft)
Fill 0-1White and brown medium hard coral _____________________ _ -|_8White, hard coral 8-12White, medium hard coral - - - - 12-28White, hard with very hard layers - - - - 28-42White, medium hard with hard layers - - - 42-57White, rough, hard drilling coral - 57-61White, hard with medium hard layers -- - - 61-71White, hard coral 71-74White, very hard layers - -- - - 74-80Hard and rough drilling - - - 80-82Very hard layers 82-88Hard and rough drilling - 88-90Very hard layers -- 90-141Hard and smooth drilling 141-150White, very hard and smooth drilling - - 150-163Hard with medium hard layers - - - - - 163-197White, stiff coral clay 197-208 White coral with yellow stained coral and small showing
of dark brown volcanic clay - - 208-225
95
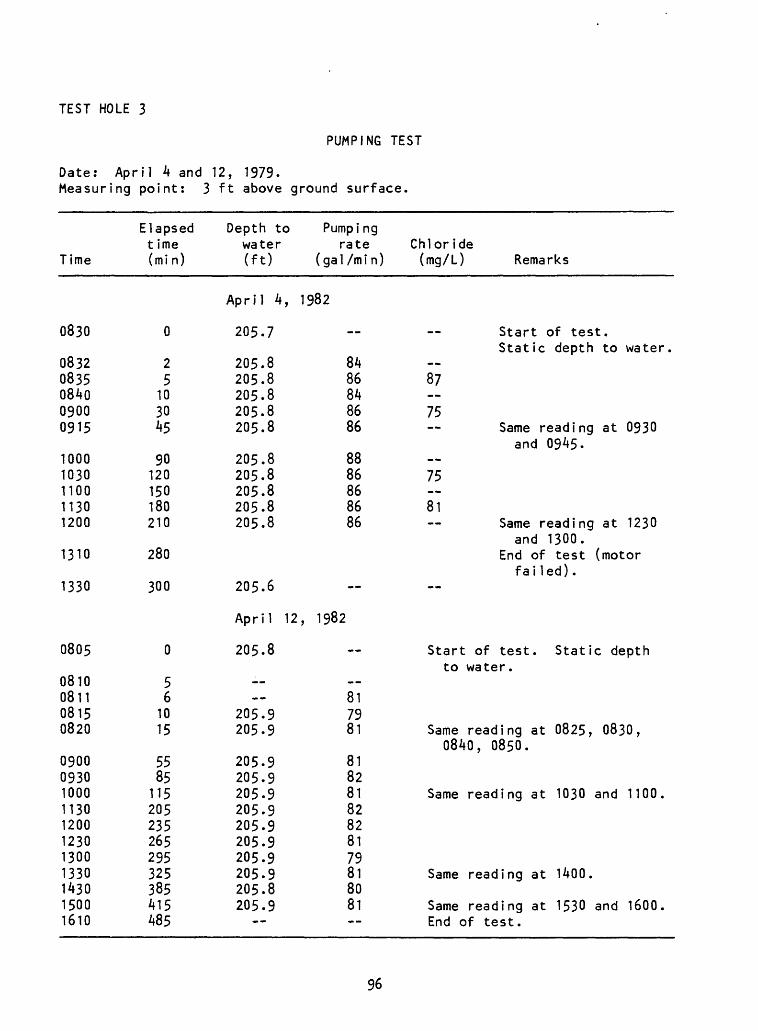
TEST HOLE 3
PUMPING TEST
Date: April 4 and 12, 1979.Measuring point: 3 ft above ground surface.
Time
Elapsedtime(min)
Depth towater(ft)
Pumpi ngrate
(gal /mi n)Chloride(mg/L) Remarks
April 4, 1982
0830 0 205.7 ~ Start of test.Static depth to water
08320835084009000915
10001030110011301200
1310
1330
0805
0810081108150820
25
103045
90120150180210
280
300
0
56
1015
205.8205.8205.8205.8205.8
205.8205.8205.8205.8205.8
205.6
April 12,
205.8
--
205.9205.9
8486848686
8886868686
1982
817981
87 75
75 81
Startto
Same
Same reading at 0930and 0945.
Same reading at 1230and 1300.
End of test (motorfailed).
of test. Static depthwater.
reading at 0825, 0830,0840, 0850.
09000930100011301200123013001330143015001610
5585115205235265295325385415485
205.9205.9205.9205.9205.9205.9205.9205-9205.8205.9
81828182828179818081
Same
Same
Same
reading at 1030 and 1100.
reading at 1400.
reading at 1530 and 1600.End of test.
96
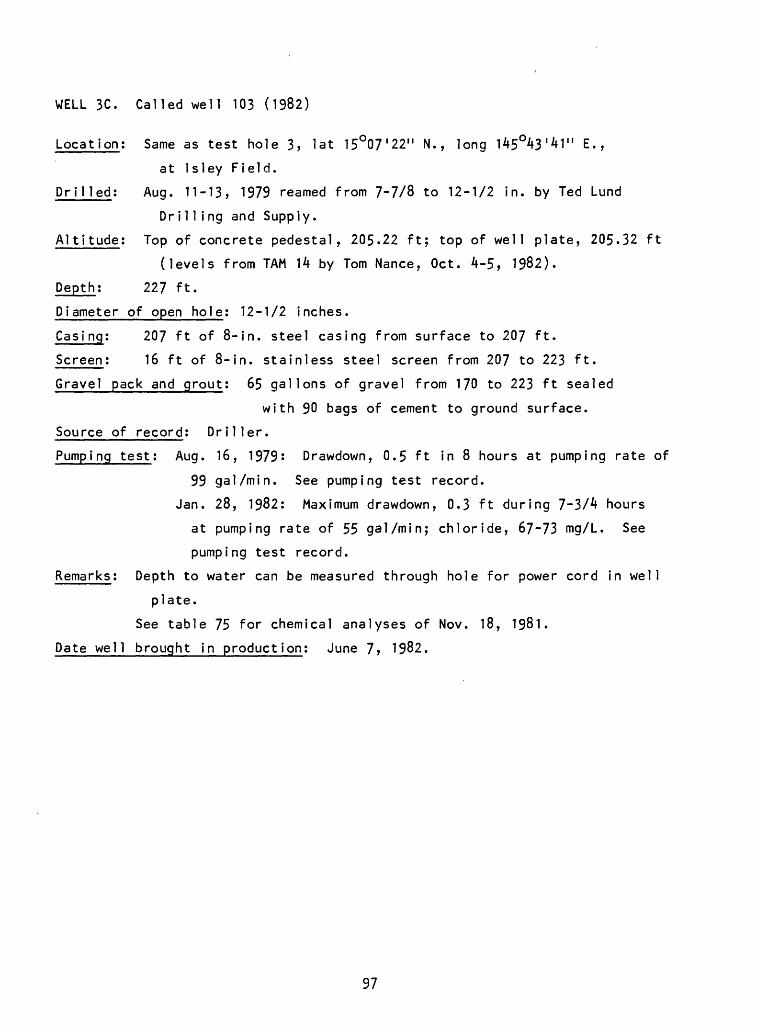
WELL 3C. Called well 103 (1982)
Location; Same as test hole 3, lat 15°07'22" N., long 145°43'41" E.,
at Isley Field.
Drilled: Aug. 11-13, 1979 reamed from 7-7/8 to 12-1/2 in. by Ted Lund
Dr i11 ing and Supply.
Altitude; Top of concrete pedestal, 205.22 ft; top of well plate, 205.32 ft
(levels from TAM 14 by Tom Nance, Oct. 4-5, 1982).
Depth; 227 ft.
Diameter of open hole; 12-1/2 inches.
Casi ng; 207 ft of 8-in. steel casing from surface to 207 ft.
Screen; 16 ft of 8-in. stainless steel screen from 207 to 223 ft.
Gravel pack and grout; 65 gallons of gravel from 170 to 223 ft sealed
with 90 bags of cement to ground surface.
Source of record; Driller.
Pumping test; Aug. 16, 1979: Drawdown, 0.5 ft in 8 hours at pumping rate of
99 gal/min. See pumping test record.
Jan. 28, 1982; Maximum drawdown, 0.3 ft during 7-3/4 hours
at pumping rate of 55 gal/min; chloride, 67-73 mg/L. See
pumping test record.
Remarks; Depth to water can be measured through hole for power cord in well
plate.
See table 75 for chemical analyses of Nov. 18, 1981.
Date well brought in production; June 7, 1982.
97
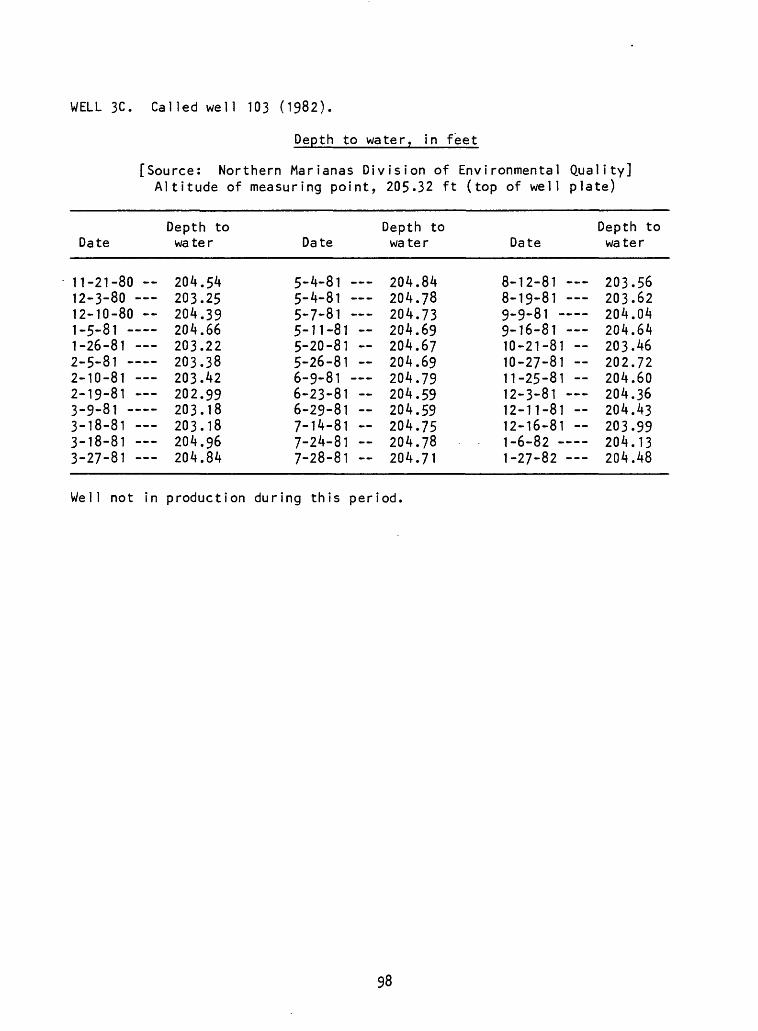
WELL 3C. Called well 103 (1982).
Depth to water, in feet
[Source: Northern Marianas Division of Environmental Quality] Altitude of measuring point, 205.32 ft (top of well plate)
Date
11-21-80 12-3-80 12-10-80 1-5-81 1-26-81 2-5-81 2-10-81 2-19-81 3-9-81 - 3-18-81 3-18-81 3-27-81
Depth to water
204.54203.25204.39204.66203.22203.38203.42202.99203.18203.18204.96204.84
Date
5-4-81 5-4-81 5-7-81 5-11-81 5-20-81 5-26-81 6-9-81 6-23-81 6-29-81 7-14-81 7-24-81 7-28-81
Depth to water
204.84204.78204.73204.69204.67204.69204.79204.59204.59204.75204.78204.71
Date
8-12-81 8-19-81 9-9-81 9-16-81 10-21-81 ~10-27-81 11-25-81 12-3-81 12-11-81 12-16-81 1-6-821-27-82
Depth to water
203.56203.62204.04204.64203.46202.72204.60204.36204.43203.99204.13204.48
Well not in production during this period.
98
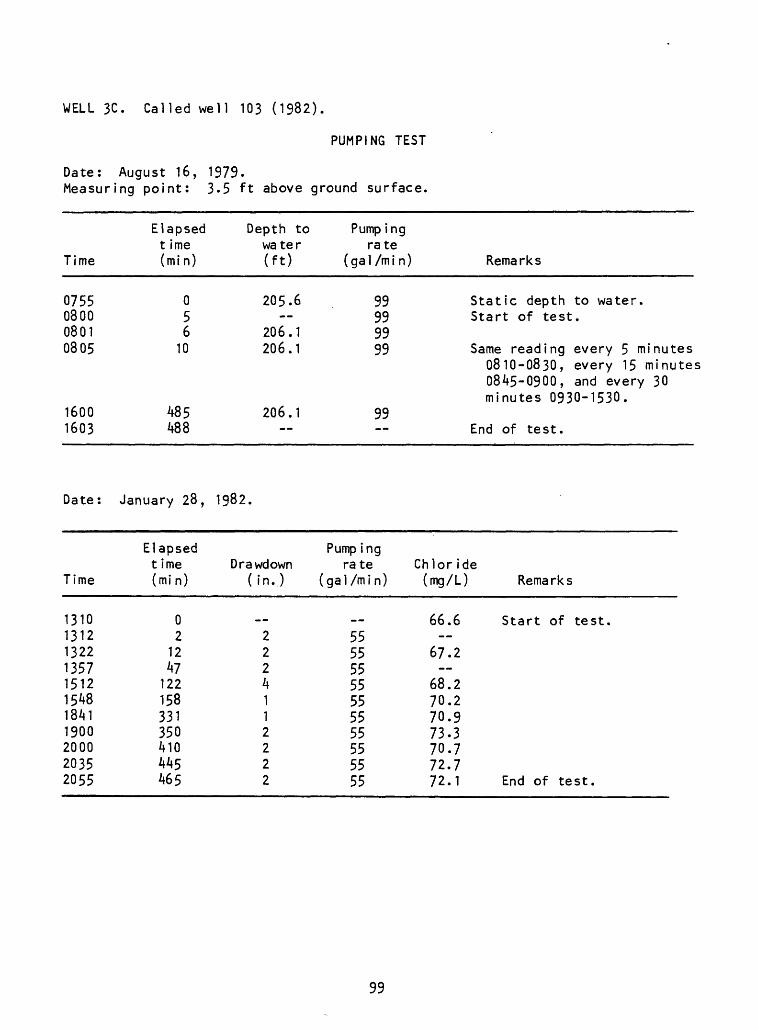
WELL 3C. Called well 103 (1982).
PUMPING TEST
Date: August 16, 1979.Measuring point: 3.5 ft above ground surface,
Time
0755080008010805
Elapsedt ime(min)
056
10
Depth towater(ft)
205.6
206.1206.1
Pump ingrate
( ga 1 /m i n )
99999999
Remarks
Static depth to water.Start of test.
Same reading every 5 mi nutes0810-0830, every 15 minutes
16001603
485488
206.1
99--
0845-0900, and everyminutes 0930-1530.
End of test.
30
Date: January 28, 1982.
Time
13101312132213571512154818411900200020352055
Elapsed t ime (min)
02
1247122158331350410445465
Drawdown (in.)
w
2224112222
Pump ing rate
(gal /min)
_
55555555555555555555
Chloride (mg/L) Remarks
66.6 Start of test.
67.2
68.270.270.973.370.772.772.1 End of test.
99
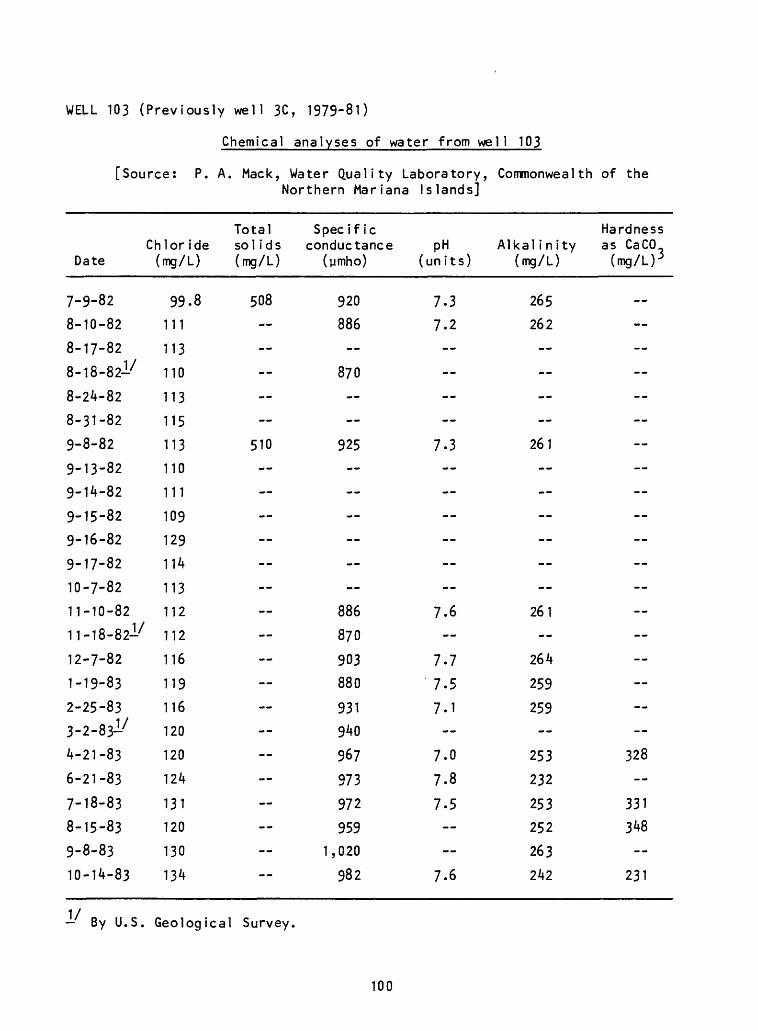
WELL 103 (Previously well 3C, 1979-81)
Chemical analyses of water from well 103
[Source: P. A. Mack, Water Quality Laboratory, Northern Mariana Islands]
Total Chloride solids
Date (mg/L) (mg/L)
7-9-82
8-10-82
8-17-82
8-18-82-7
8-24-82
8-31-82
9-8-82
9-13-82
9-14-82
9-15-82
9-16-82
9-17-82
10-7-82
11-10-82
11-18-82-7
12-7-82
1-19-83
2-25-83
3-2-S3-7
4-21-83
6-21-83
7-18-83
8-15-83
9-8-83
10-14-83
99.8 508
111
113
110
113
115
113 510
110
111
109
129
114
113
112
112
116
119
116
120
120
124
131
120
130
134
Spec if ic conductance
(vimho)
920
886
870
925
886
870
903
880
931940
967
973972
9591,020
982
pH (units)
7.3
7.2
7.3
7.6
7.7
7.5
7.1
7.0
7.8
7.5
7.6
Commonwealth of the
Alkalinity (mg/L)
265
262
261
261
264
259
259
253
232
253
252
263
242
Hardness as CaCO (mg/L) 3
328
331348
231
By U.S. Geological Survey.
100
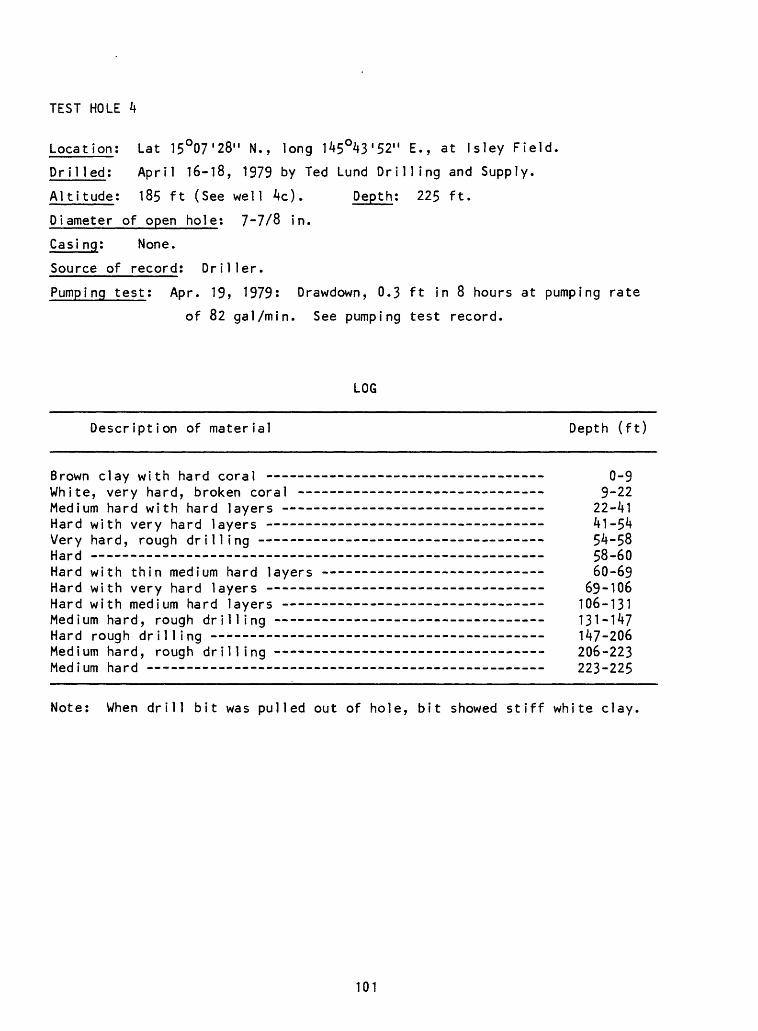
TEST HOLE 4
Location: Lat 15°07'28" N., long 145°43'52" E., at Isley Field.
Drilled; April 16-18, 1979 by Ted Lund Drilling and Supply.
Altitude; 185 ft (See well Ac). Depth; 225 ft.
Diameter of open hole; 7-7/8 in.
Casi ng; None.
Source of record; Driller.
Pumping test; Apr. 19> 1979: Drawdown, 0.3 ft in 8 hours at pumping rate
of 82 gal/min. See pumping test record.
LOG
Description of material Depth (ft)
Brown clay with hard coral - 0-9White, very hard, broken coral -- ------------ - __-____- 9-22Medium hard with hard layers - - - 22-41Hard with very hard layers ------------ __________ _ __-_ 41-54Very hard, rough drilling - - 54-58Hard 58-60Hard with thin medium hard layers -- ------ ________ 60-69Hard with very hard layers 69-106Hard with medium hard layers 106-131Medium hard, rough drilling - 131-147Hard rough drilling - 147-206Medium hard, rough drilling 206-223Medium hard 223-225
Note: When drill bit was pulled out of hole, bit showed stiff white clay,
101
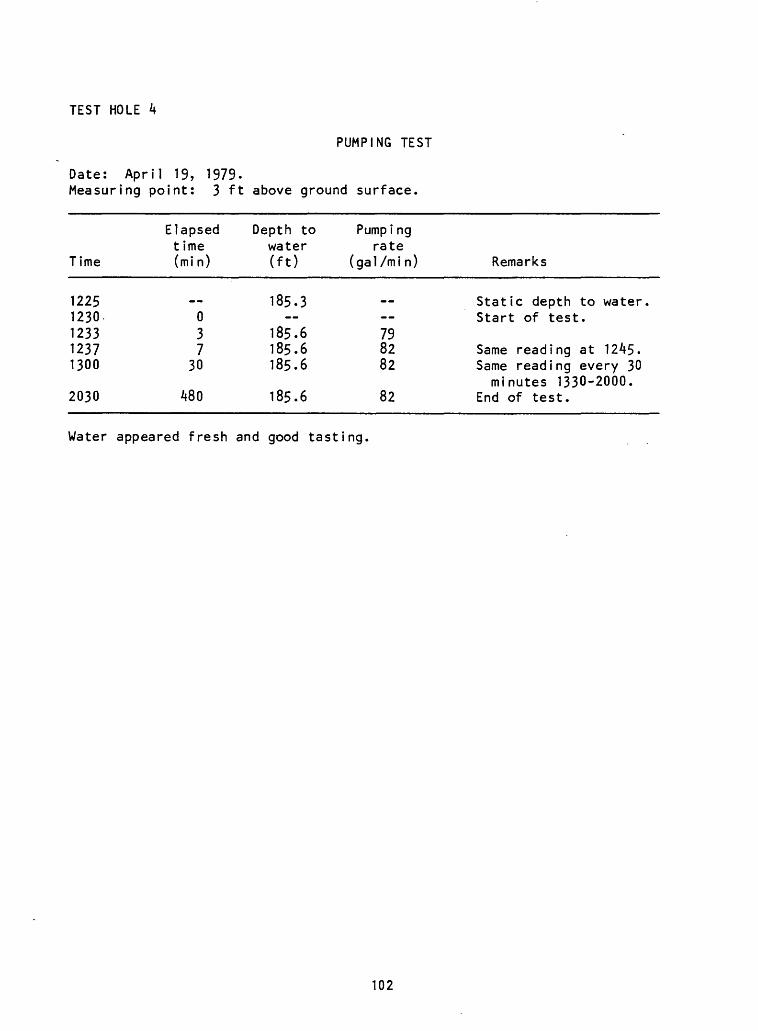
TEST HOLE 4
PUMPING TEST
Date: April 19, 1979.Measuring point: 3 ft above ground surface.
Time
12251230123312371300
Elapsedtime(mi n)
__037
30
Depth towater(ft)
185.3
185.6185.6185.6
Pumpingrate
( ga 1 /m i n )
__ 798282
Remarks
Static depth toStart of test.
Same reading atSame reading eve
water.
1245.Jry 30
minutes 1330-2000. 2030 480 185.6 82 End of test.
Water appeared fresh and good tasting.
102
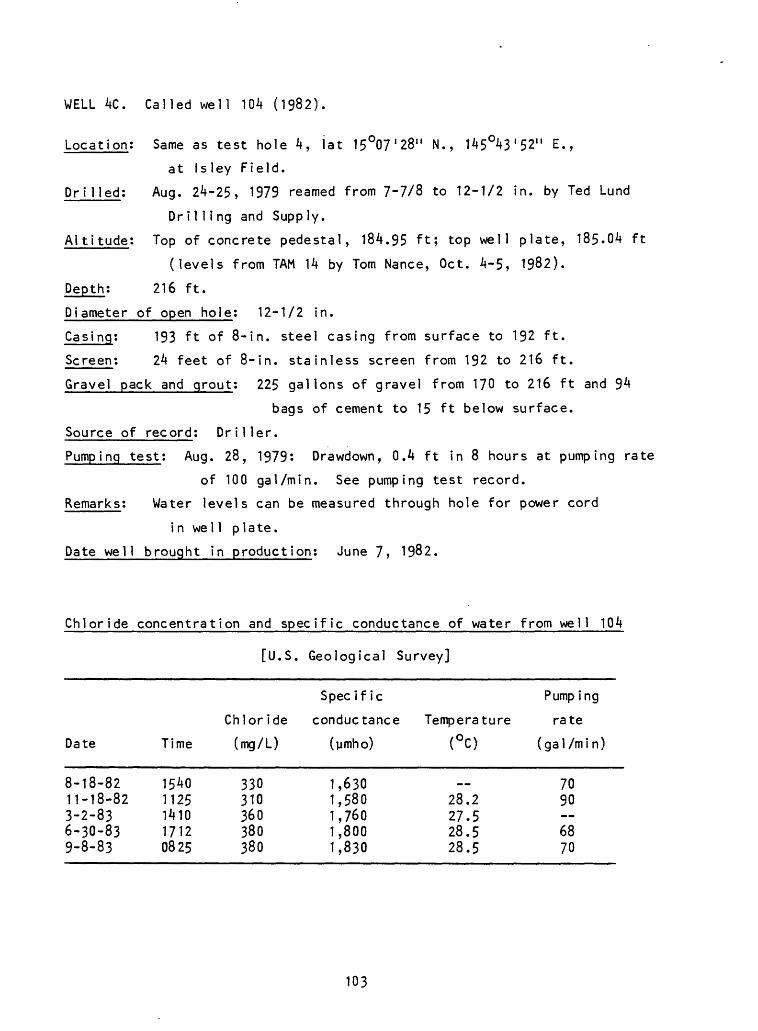
WELL 4C. Called well 104 (1982).
Location: Same as test hole 4, lat 15°07'28" N., 145°43'52" E.,
at Isley Field.
Dri lied; Aug. 24-25, 1979 reamed from 7-7/8 to 12-1/2 in. by Ted Lund
Dr i11i ng and Supply.
Altitude: Top of concrete pedestal, 184.95 ft; top well plate, 185-04 ft
(levels from TAM 14 by Tom Nance, Oct. 4-5, 1982).
Depth; 216 ft.
Diameter of open hole; 12-1/2 in.
Casing; 193 ft of 8-in. steel casing from surface to 192 ft.
Screen; 24 feet of 8-in. stainless screen from 192 to 216 ft.
Gravel pack and grout; 225 gallons of gravel from 170 to 216 ft and 94
bags of cement to 15 ft below surface.
Source of record; Driller.
Pumping test; Aug. 28, 1979: Drawdown, 0.4 ft in 8 hours at pumping rate
of 100 gal/min. See pumping test record.
Remarks: Water levels can be measured through hole for power cord
in we 11 plate.
Date well brought in production; June 7, 1982.
Chloride concentration and specific conductance of water from well 104
Date
8-18-82
11-18-82 3-2-83 6-30-83 9-8-83
Time
1540 1125 1410 1712 0825
[U.S.
Chlor ide
(mg/L)
330 310 360 380 380
Geological
Spec if ic
Survey]
conductance Temperature
(ymho)
1,630 1,580 1,760 1,800 1,830
<°«
28.2 27.5 28.5 28.5
Pump ing
rate
(gal/min)
70 90
68 70
103
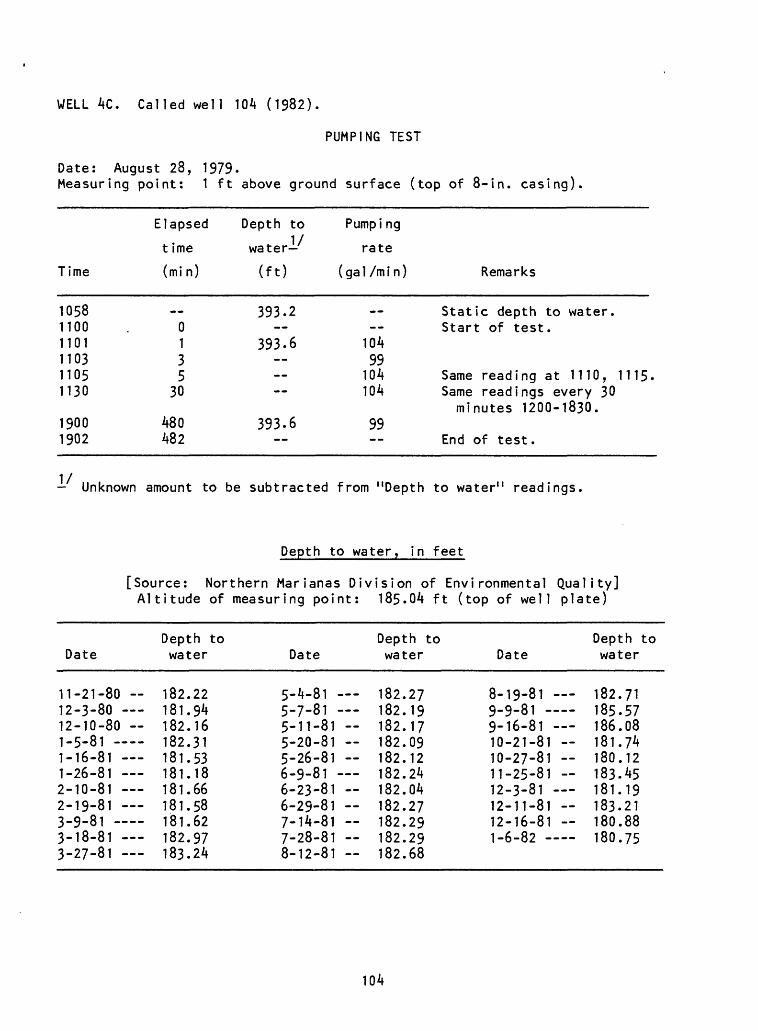
WELL 4C. Called well 104 (1982).
PUMPING TEST
Date: August 28, 1979.Measuring point: 1 ft above ground surface (top of 8-in. casing)
Time
10581100110111031105 1130
19001902
Elapsed
t ime
(mi n)
0135
30
480482
Depth to
water-
(ft)
393.2
393.6
393.6
Pumpi ng
rate
(gal/min)
10499104 104
99--
Remarks
Static depth to water.Start of test.
Same reading at 1110, 1115. Same readings every 30 minutes 1200-1830.
End of test.
- Unknown amount to be subtracted from "Depth to water" readings.
Depth to water, in feet
[Source: Northern Marianas Division of Environmental Quality] Altitude of measuring point: 185.04 ft (top of well plate)
DateDepth to water Date
Depth to water Date
Depth to water
11-21-80 -12-3-80 12-10-80 - 1-5-81 1-16-81 1-26-81 2-10-81 2-19-81 3-9-81 3-18-81 3-27-81
182.22181.94182.16182.31181.53181.18181.66181.58181.62182.97183.24
5-4-81 5-7-81 5-11-81 - 5-20-81 -5-26-81 -6-9-81 6-23-81 -6-29-81 -7-14-81 -7-28-81 -8-12-81 -
182.27182.19182.17182.09182.12182.24182.04182.27182.29182.29182.68
8-19-81 9-9-81 9-16-81 10-21-81 -10-27-81 -11-25-81 -12-3-81 12-11-81 - 12-16-81 - 1-6-82
182.71185.57186.08181.74180.12183.45181.19183.21180.88180.75
104
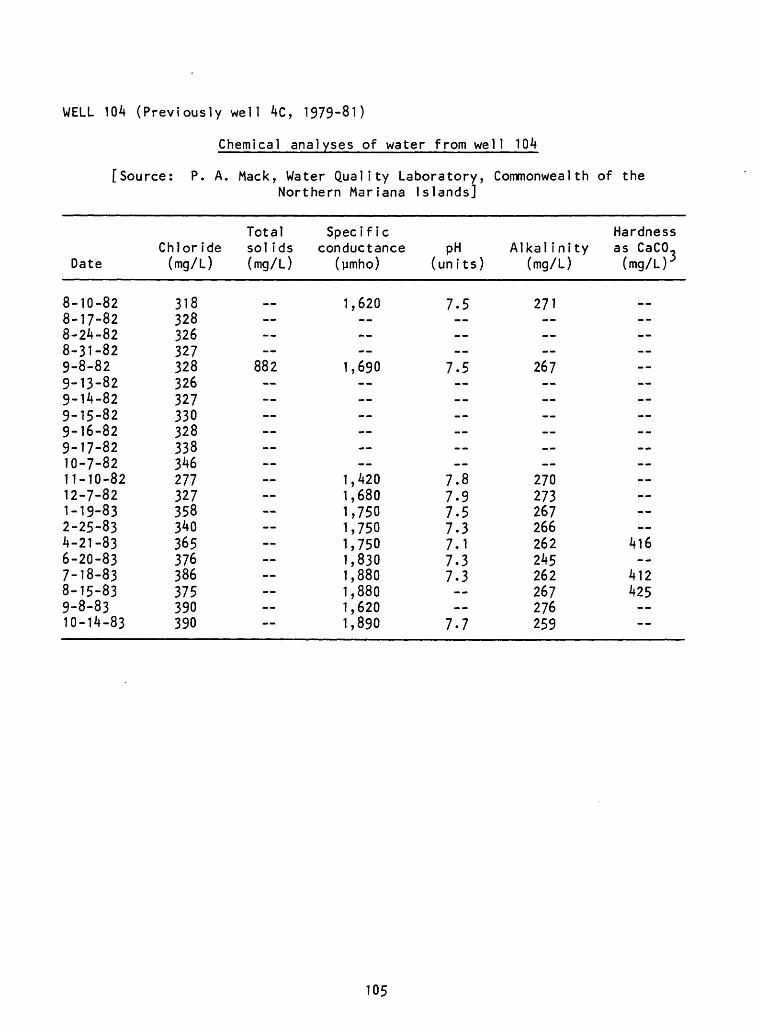
WELL 104 (Previously well 4C, 1979-81)
Chemical analyses of water from well 104
[Source: P. A.
Date
8-10-828-17-828-24-828-31-829-8-829-13-829-14-829-15-829-16-829-17-8210-7-8211-10-8212-7-821-19-832-25-834-21-836-20-837-18-838-15-839-8-8310-14-83
Chloride(mg/L)
318328326327328326327330328338346277327358340365376386375390390
Mack, Water Quality Laboratory, Commonwealth of theNorthern Mariana I
Total Specificsol ids conductance(mg/L) (ymho)
1,620
882 1,690
1,4201,6801,7501,7501,7501,8301,8801,8801,6201,890
! slands]
pH(units)
7.5 __
7.5 -- ----
7.87.97.57.37.17.37.3----
7.7
Alkal ini ty(mg/L)
271
267 ----
270273267266262245262267276259
Hardnessas CaCO,(mg/L^
-- ---- -------- --
416--
412425 --
105
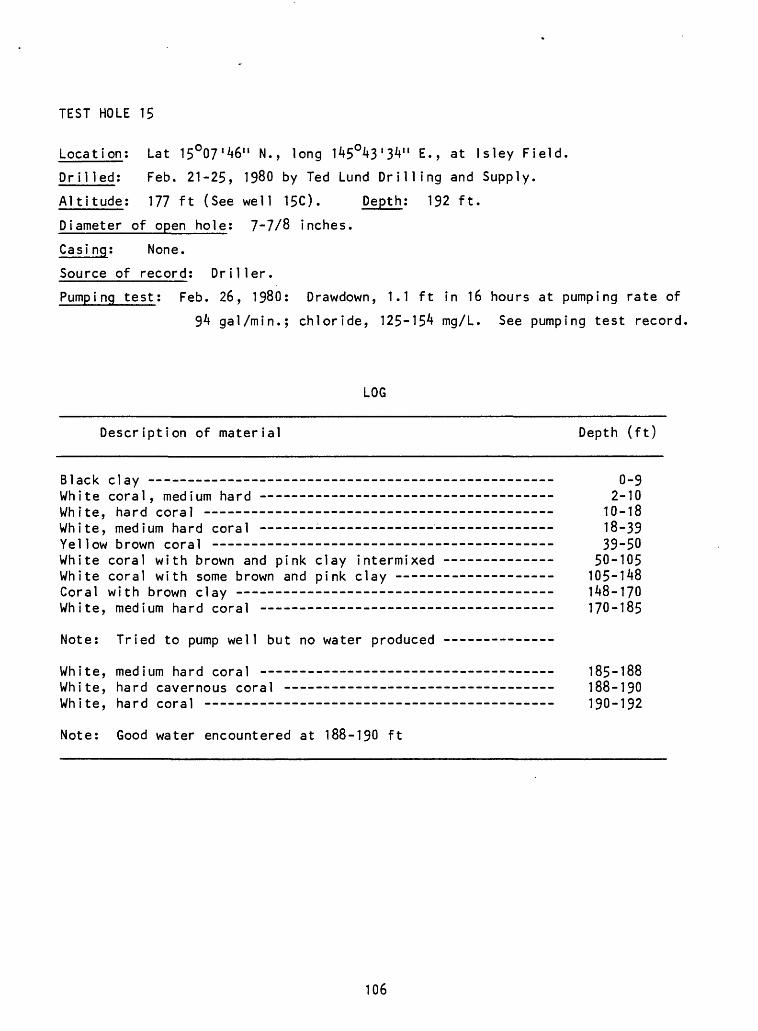
TEST HOLE 15
Location: Lat 15°07'^6" N., long 145°43'3V' E., at Isley Field.
Drilled: Feb. 21-25, 1980 by Ted Lund Drilling and Supply.
Altitude; 177 ft (See well 15C). Depth: 192 ft.
Diameter of open hole; 7-7/8 inches.
Casi ng; None.
Source of record; Driller.
Pumping test; Feb. 26, 1980: Drawdown, 1.1 ft in 16 hours at pumping rate of
9^ gal/min.; chloride, 125-15^ mg/L. See pumping test record
LOG
Description of material Depth (ft)
Black clay 0-9White coral, medium hard - -- ___________ _____________ 2-10White, hard coral 10-18White, medium hard coral ------------------ -- - -- ____ 18-39Yellow brown coral - - - - - - 39-50White coral with brown and pink clay intermixed -- - ---- 50-105White coral with some brown and pink clay ----- ------ __ 105-1^8Coral with brown clay 148-170White, medium hard coral - - - 170-185
Note: Tried to pump well but no water produced
White, medium hard coral -- - - - 185-188White, hard cavernous coral - - - - 188-190White, hard coral 190-192
Note: Good water encountered at 188-190 ft
106
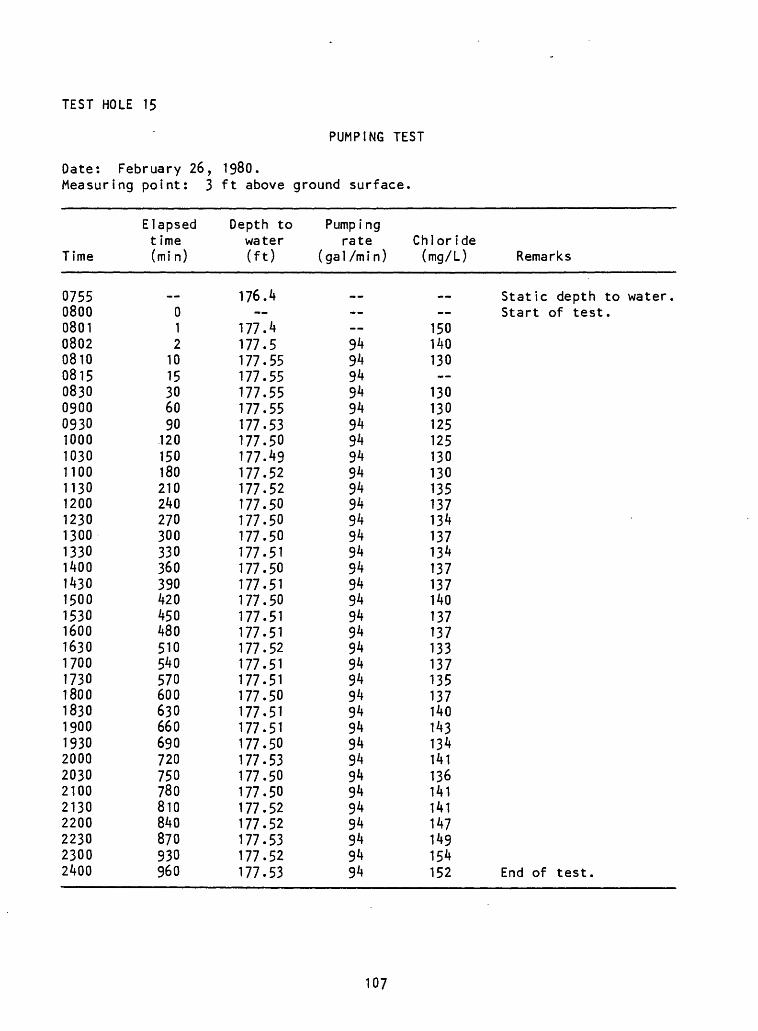
TEST HOLE 15
PUMPING TEST
Date: February 26, 1980.Measuring point: 3 ft above ground surface.
Time
0755080008010802081008150830090009301000103011001130120012301300133014001430150015301600163017001730180018301900193020002030210021302200223023002400
Elapsed t ime (mi n)
012
1015306090120150180210240270300330360390420450480510540570600630660690720750780810840870930960
Depth to water (ft)
176.4
177.4177.5177.55177.55177.55177.55177.53177.50177.49177.52177.52177.50177.50177.50177.51177.50177.51177.50177.51177.51177.52177.51177.51177.50177.51177.51177.50177.53177.50177.50177.52177.52177.53177.52177.53
Pump i ng rate
( ga 1 /m i n )
94949494949494949494949494949494949494949494949494949494949494949494
Chloride (mg/L) Remarks
Static depth to water.Start of test.
150140130
130130125125130130135137134137134137137140137137133137135137140143134141136141141147149154152 End of test.
107
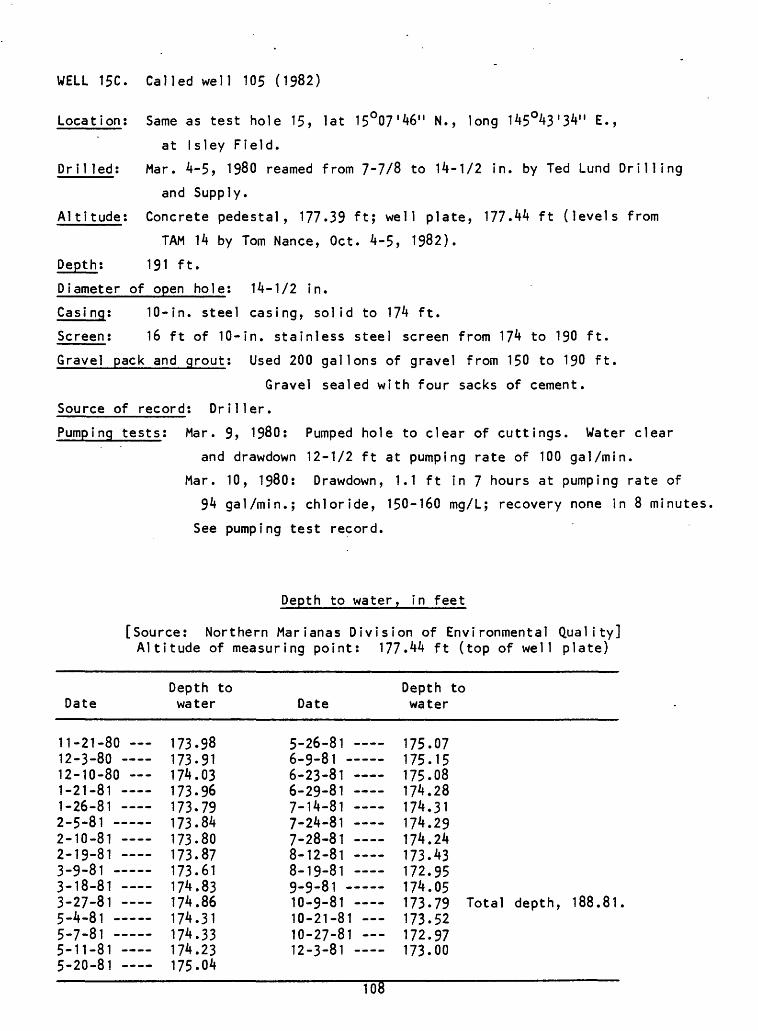
WELL 15C. Called well 105 (1982)
Location; Same as test hole 15, lat 15°07'46" N., long 145°43'34" E.,
at Isley Field.
Drilled; Mar. 4-5, 1980 reamed from 7-7/8 to 14-1/2 in. by Ted Lund Drilling
and Supply.
Altitude; Concrete pedestal, 177.39 ft; well plate, 177.44 ft (levels from
TAM 14 by Tom Nance, Oct. 4-5, 1982).
Depth; 191 ft.
Diameter of open hole; 14-1/2 in.
Casi nq; 10-in. steel casing, solid to 174 ft.
Screen; 16 ft of 10-in. stainless steel screen from 174 to 190 ft.
Gravel pack and grout; Used 200 gallons of gravel from 150 to 190 ft.
Gravel sealed with four sacks of cement.
Source of record; Driller.
Pumping tests; Mar. 9, 1980; Pumped hole to clear of cuttings. Water clear
and drawdown 12-1/2 ft at pumping rate of 100 gal/min.
Mar. 10, 1980; Drawdown, 1.1 ft in 7 hours at pumping rate of
94 gal/min.; chloride, 150-160 mg/L; recovery none in 8 minutes
See pumping test record.
Depth to water, in feet
[Source; Northern Marianas Division of Environmental Quality] Altitude of measuring point; 177.44 ft (top of well plate)
Date
11-21-80 12-3-80 12-10-80 1-21-81 1-26-81 2 C Q 1
2-10-81 2-19-81 30 fl 1-y-ol 3-18-81 3-27-81 5.4-81 5 "7 fl 1-/-ol - 5-11-81 5-20-81
Depth to water
173-98 173.91 174.03 173-96 173.79 173.84 173.80 173.87 173.61 174.83 174.86 174.31 174.33 174.23 175.04
Date
5-26-81 6-9-81 6-23-81 6-29-81 7-14-81 7-24-81 7-28-81 8-12-81 8-19-81 9-9-81 -----10-9-81 10-21-81 10-27-81 12-3-81 -
Depth to water
175.07 175.15 175.08 174.28 174.31 174.29 174.24 173.43 172.95 174.05 173-79 Total depth, 188.81 173.52172.97 173.00
108
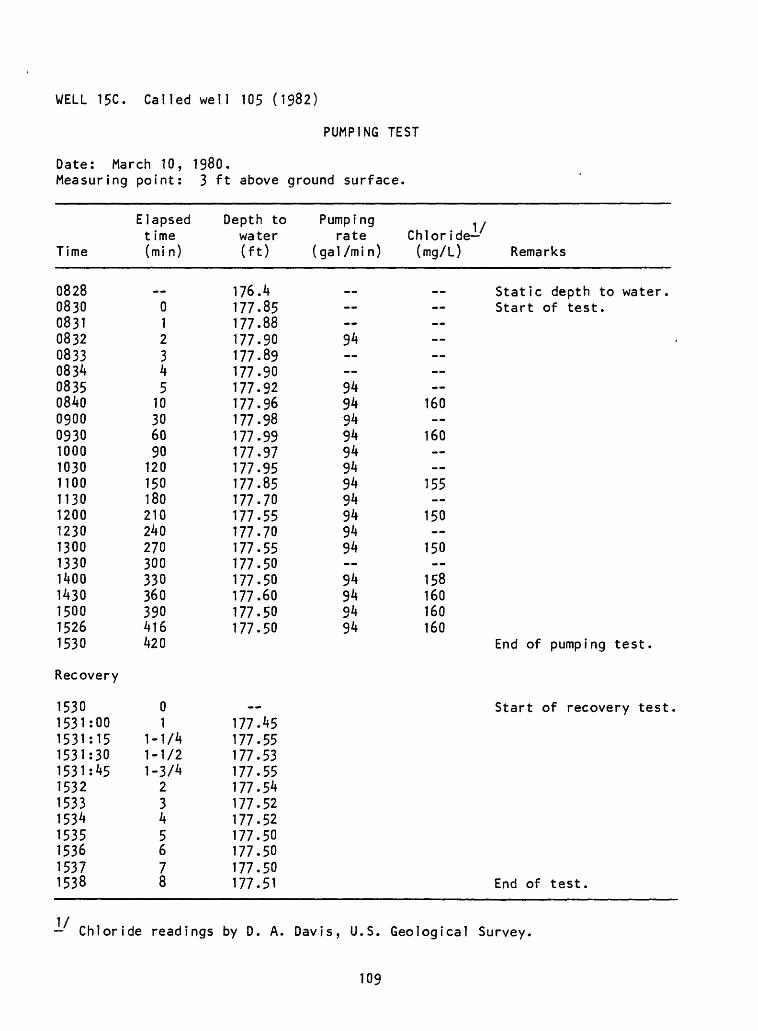
WELL 15C. Called well 105 (1982)
PUMPING TEST
Date: March 10, 1980.Measuring point: 3 ft above ground surface.
Time
08280830083108320833083408350840090009301000103011001130120012301300133014001430150015261530
Recovery
15301531:001531:151531:301531:451532153315341535153615371538
Elapsed time (min)
012345
10306090120150180210240270300330360390416420
01
1-1/41-1/21-3/4
2345678
Depth to water (ft)
176.4177.85177.88177.90177.89177.90177.92177.96177.98177.99177.97177.95177.85177.70177.55177.70177.55177.50177.50177.60177.50177.50
177.45177.55177.53177.55177.54177.52177.52177.50177.50177.50177.51
Pumping rate
( ga 1 /m i n )
94 9494949494949494949494 94949494
Chloride-''
(mg/L) Remarks
Static depth to water.Start of test.
160
160
155
150
150
158160160160
End of pumping test.
Start of recovery test.
End of test.
Chloride readings by D. A. Davis, U.S. Geological Survey
109
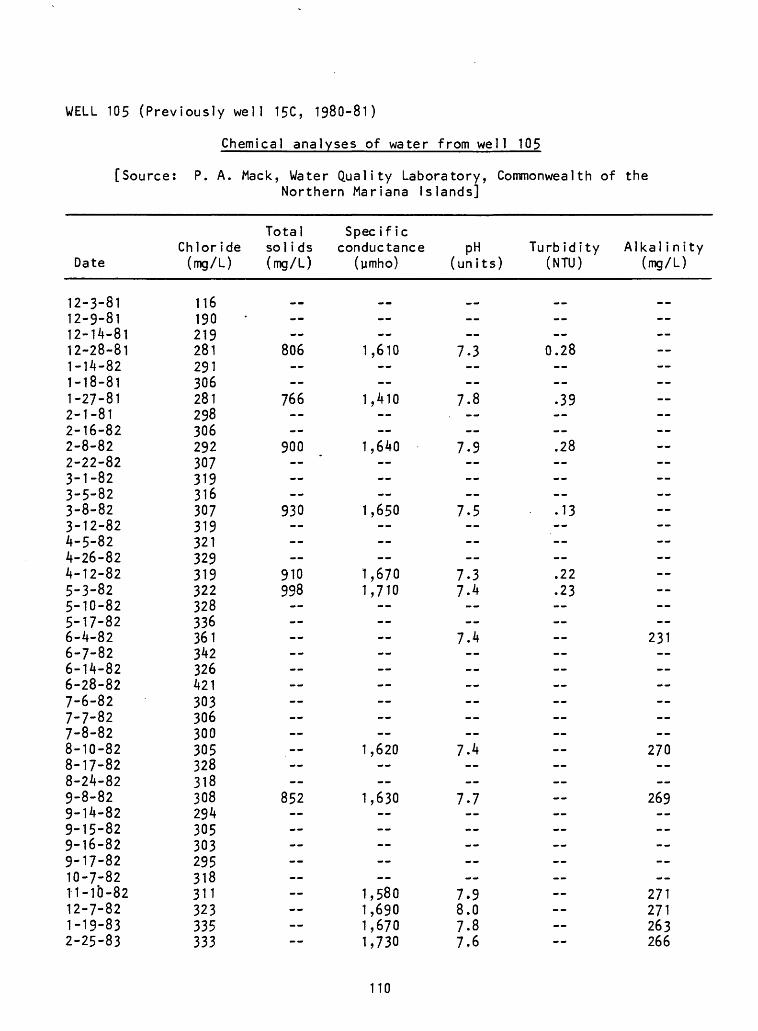
WELL 105 (Previously well 15C, 1980-81)
Chemical analyses of water from well 105
[Source: P. A. Mack, Water Quality Laboratory, Conmonweal th of the Northern Mariana Islands]
Date
12-3-81 12-9-8112-14-8112-28-811-14-821-18-811-27-812-1-812-16-822-8-822-22-823-1-823-5-823-8-823-12-824-5-824-26-824-12-825-3-825-10-825-17-826-4-826-7-826-14-826-28-827-6-827-7-827-8-828-10-828-17-828-24-829-8-829-14-829-15-829-16-829-17-8210-7-82T1-lb-8212-7-821-19-832-25-83
Chloride (mg/L)
116 190219281291306281298306292307319316307319321329319322328336361342326421303306300305328318308294305303295318311323335333
Total Specific solids conductance (mg/L) (pmho)
806
766
900
930
910998
852
1,610
1,410
1,640
1,650
1,6701,710
1,620
1,630
1,5801,6901,6701,730
pH (units)
7.3
7.8.
7.9
7.5
7.37.4
7.4
7.4
7.7
7.98.07.87.6
Turbidity (NTU)
0.28 .39 .28 .13 .22.23 --
Alkal i nity (mg/L)
-- --
231
270
269 -- --
271271263266
110
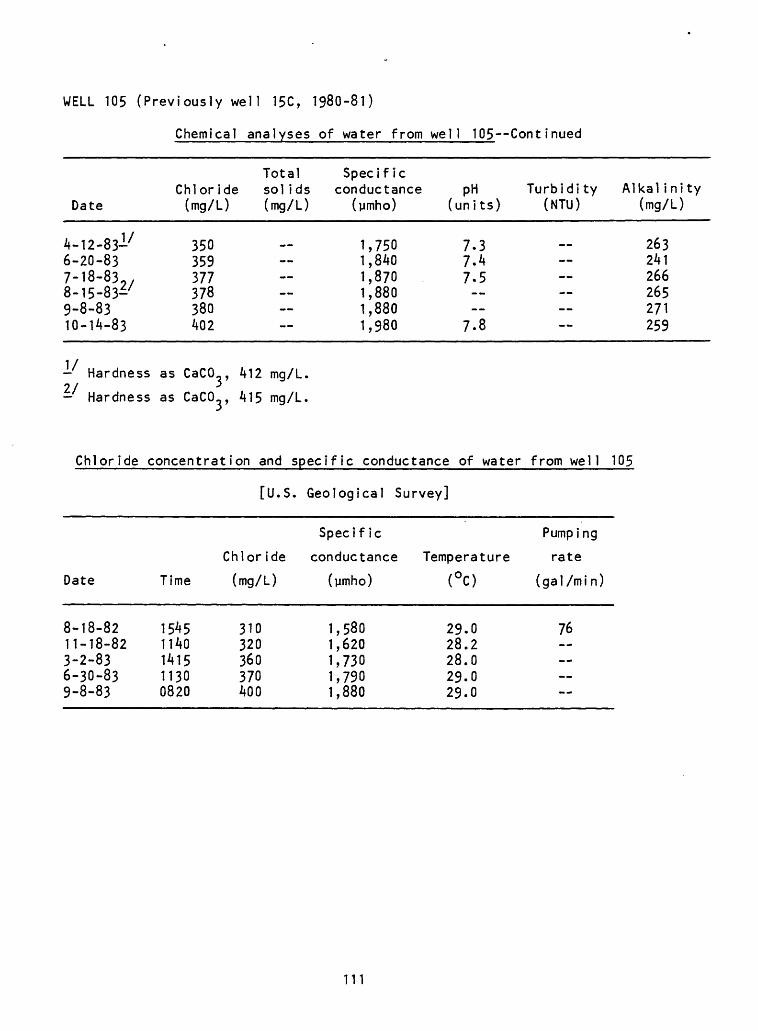
WELL 105 (Previously well 15C, 1980-81)
Chemical analyses of water from well 105 Cont inued
Date
4-12-831'6-20-837-18-838-15-83^9-8-8310-14-83
Chloride(mg/L)
350359377378380402
Total Specificsol ids conductance(mg/L) (ymho)
1,7501,8401,8701,8801,8801,980
pH(units)
7.37.47.5
7.8
Turbidi ty Alkal ini ty(NTU) (mg/L)
263241266265271259
- Hardness as CaCO,, 412 mg/L.
Hardness as CaCO-, 415 mg/L.2/
Chloride concentration and specific conductance of water from well 105
[U.S. Geological Survey]
Specific Pumping
Chloride conductance Temperature rate
Date Time (mg/L) (ymho) (°C) (gal/min)
8-18-82 1545 310 1,580 29.0 7611-18-82 1140 320 1,620 28.23-2-83 1415 360 1,730 28.06-30-83 1130 370 1,790 29.09-8-83 0820 400 1,880 29.0
111
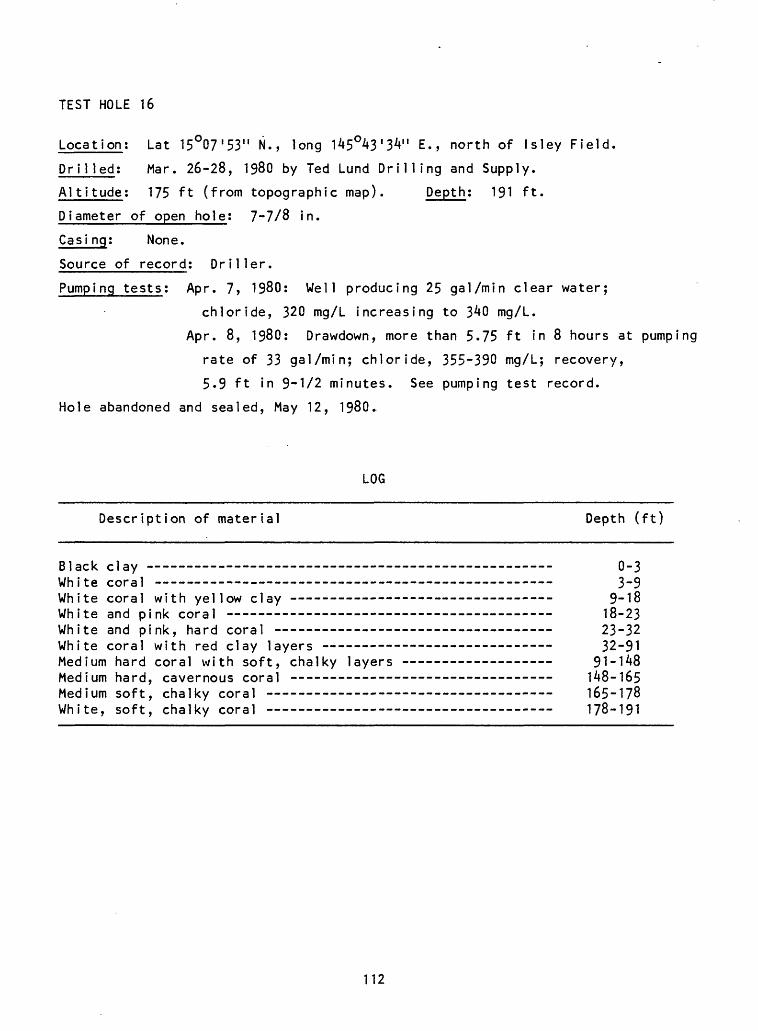
TEST HOLE 16
Location; Lat 15°07'53" N., long 145°43'3V' E., north of Isley Field.
Drilled: Mar. 26-28, 1980 by Ted Lund Drilling and Supply.
Altitude; 175 ft (from topographic map). Depth: 191 ft.
Diameter of open hole: 7-7/8 in.
Casi ng; None.
Source of record: Driller.
Pumping tests: Apr. 7, 1980: Well producing 25 gal/min clear water;
chloride, 320 mg/L increasing to 3^0 mg/L.
Apr. 8, 1980: Drawdown, more than 5.75 ft in 8 hours at pumping
rate of 33 gal/min; chloride, 355-390 mg/L; recovery,
5.9 ft in 9-1/2 minutes. See pumping test record.
Hole abandoned and sealed, May 12, 1980»
LOG
Description of material Depth (ft)
Black clay 0-3White coral -- 3-9White coral with yellow clay --- ----- - - - _ 9-18White and pink coral 18-23White and pink, hard coral 23-32White coral with red clay layers - -- 32-91Medium hard coral with soft, chalky layers 91-1^8Medium hard, cavernous coral - -- --- 1^8-165Medium soft, chalky coral -- - --- - - - 165-178White, soft, chalky coral 178-191
112
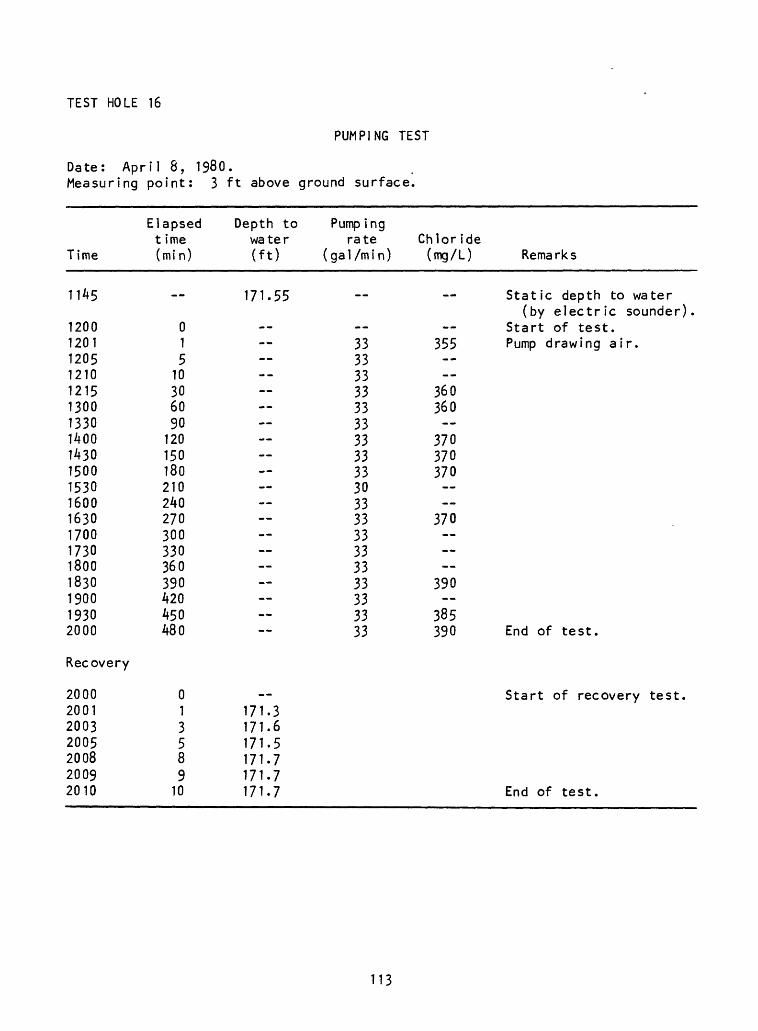
TEST HOLE 16
PUMPING TEST
Date: April 8, 1980.Measuring point: 3 ft above ground surface.
Time
1145
12001201120512101215130013301400143015001530160016301700173018001830190019302000
Recovery
2000200120032005200820092010
Elapsed t ime (min)
_
015
10306090
120150180210240270300330360390420450480
013589
10
Depth to water (ft)
171.55
--
171.3171.6171.5171.7171.7171.7
Pump ing rate
( ga 1 /m i n )
__
33333333333333333330333333333333333333
Chlor ide (mg/L) Remarks
Static depth to water(by electric sounder).
Start of test.355 Pump drawing air.
360360
370370370
370
390
385390 End of test.
Start of recovery test.
End of test.
113
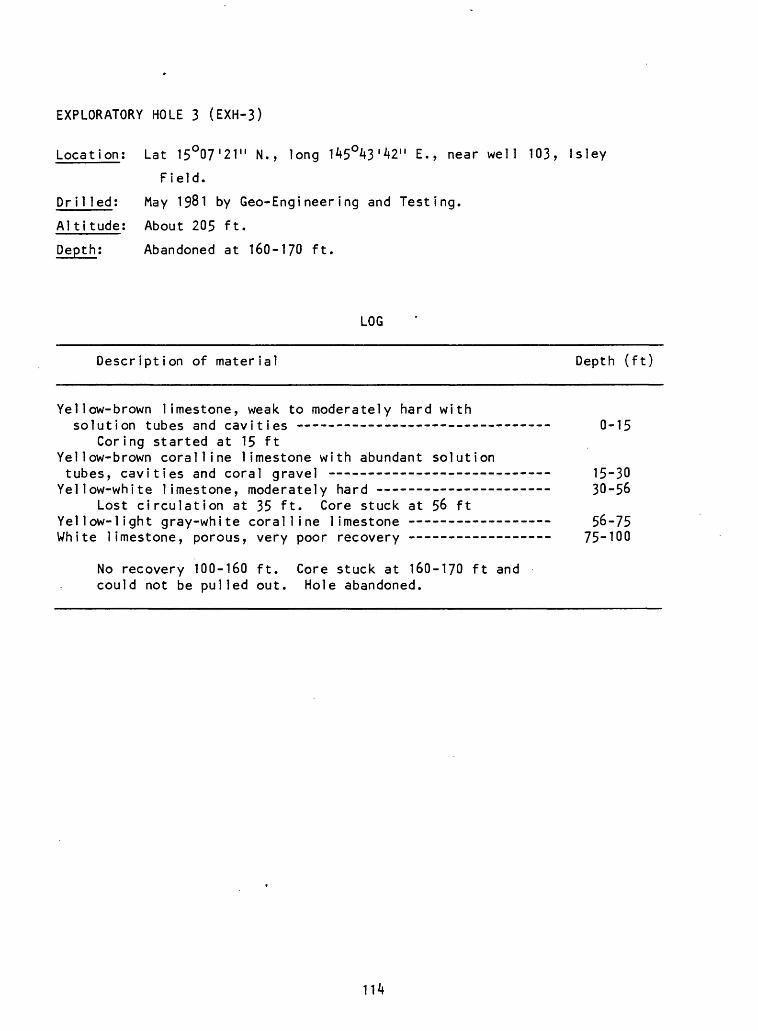
EXPLORATORY HOLE 3 (EXH-3)
Location; Lat 15O07'21" N., long 145°43'42" E., near well 103, Isley
Field.
Dr i1 led; May 1981 by Geo-Engineering and Testing.
Altitude; About 205 ft.
Depth: Abandoned at 160-170 ft.
LOG
Description of material Depth (ft)
Yellow-brown limestone, weak to moderately hard withsolution tubes and cavities - - 0-15
Coring started at 15 ft Yellow-brown coralline limestone with abundant solutiontubes, cavities and coral gravel ---- ----- --- --- --- 15-30
Yellow-white limestone, moderately hard - 30-56Lost circulation at 35 ft. Core stuck at 56 ft
Yellow-light gray-white coralline limestone - - 56-75 White limestone, porous, very poor recovery -------- ------ 75-100
No recovery 100-160 ft. Core stuck at 160-170 ft and could not be pulled out. Hole abandoned.
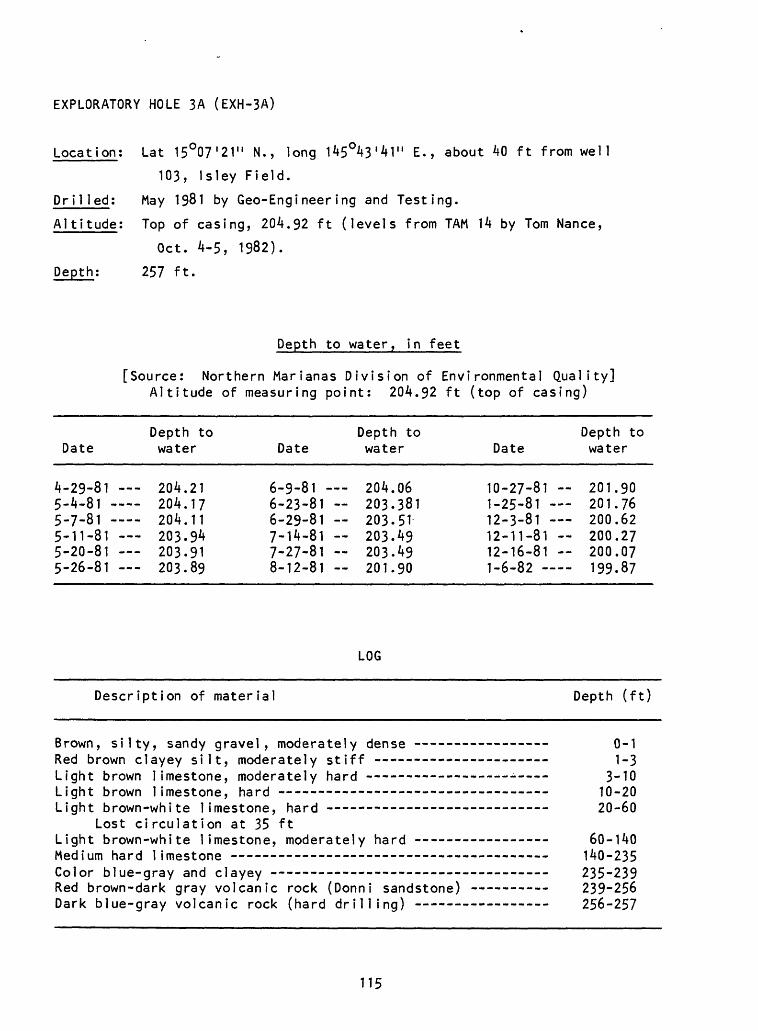
EXPLORATORY HOLE 3A (EXH-3A)
Location; Lat 15°07'21" N., long 145°43'41" E., about 40 ft from well
103, Isley Field.
Drilled: May 1981 by Geo-Engineering and Testing.
Altitude; Top of casing, 204.92 ft (levels from TAM 14 by Tom Nance,
Oct. 4-5, 1982).
Depth: 257 ft.
Depth to water, in feet
[Source: Northern Marianas Division of Environmental Quality] Altitude of measuring point: 204.92 ft (top of casing)
Date
4-29-81 5.4.815.7.81 ....5-11-81 5-20-81 5-26-81
Depth to water
204.21204.17204.11203.94203.91203.89
Date
6-9-81 6-23-81 6-29-81 7-14-81 7-27-81 -8-12-81
Depth to water
204.06203.381203.51203.49203.49201.90
Date
10-27-81 1-25-81 12-3-81 12-11-81 12-16-81 T.6-82
Depth to water
201.90201.76200.62200.27200.07199.87
LOG
Description of material Depth (ft)
Brown, silty, sandy gravel, moderately dense -- 0-1Red brown clayey silt, moderately stiff 1-3Light brown limestone, moderately hard --------------- ------ 3-10Light brown limestone, hard ------------------- __.--. ... 10-20Light brown-white limestone, hard - 20-60
Lost circulation at 35 ftLight brown-white limestone, moderately hard ------------- 60-140Medium hard limestone 140-235Color blue-gray and clayey 235-239Red brown-dark gray volcanic rock (Donni sandstone) 239-256Dark blue-gray volcanic rock (hard drilling) 256-257
115
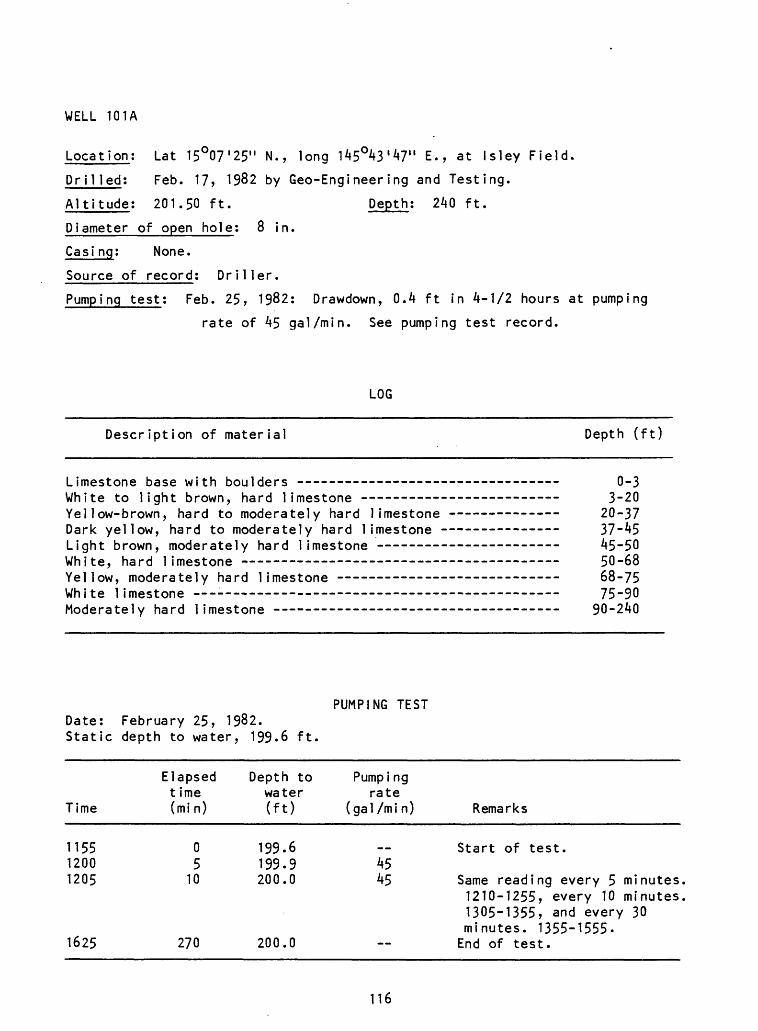
WELL 101A
Location: Lat 15°07'25" N., long 145°43'47" E., at Isley Field.
Dr i1 led; Feb. 17, 1982 by Geo-Engineering and Testing.
Altitude: 201.50 ft. Depth; 240 ft.
Diameter of open hole; 8 in.
Casi ng; None.
Source of record; Driller.
Pumping test; Feb. 25, 1982: Drawdown, 0.4 ft in 4-1/2 hours at pumping
rate of 45 gal/min. See pumping test record.
LOG
Description of material Depth (ft)
Limestone base with boulders - -- ---- --- White to light brown, hard limestone Yellow-brown, hard to moderately hard limestone Dark yellow, hard to moderately hard limestone Light brown, moderately hard limestone -- White, hard limestone Yellow, moderately hard limestone - - -- White limestone --- ______ - ____ ___-.Moderately hard limestone - --
0-3 3-20
20-37 37-45 45-50 50-68 68-75 75-90
90-240
Date: February 25, 1982. Static depth to water, 199.6 ft.
PUMPING TEST
Time
115512001205
Elapsedt ime(mi n)
05
10
Depth towater(ft)
199.6199.9200.0
Pumpi ngrate
(gal /mi n)
M» __
4545
Remarks
Start of test.
Same reading evei-y 5 minutes
1625 270 200.0
1210-1255, every 10 minutes 1305-1355, and every 30 minutes. 1355-1555- End of test.
116
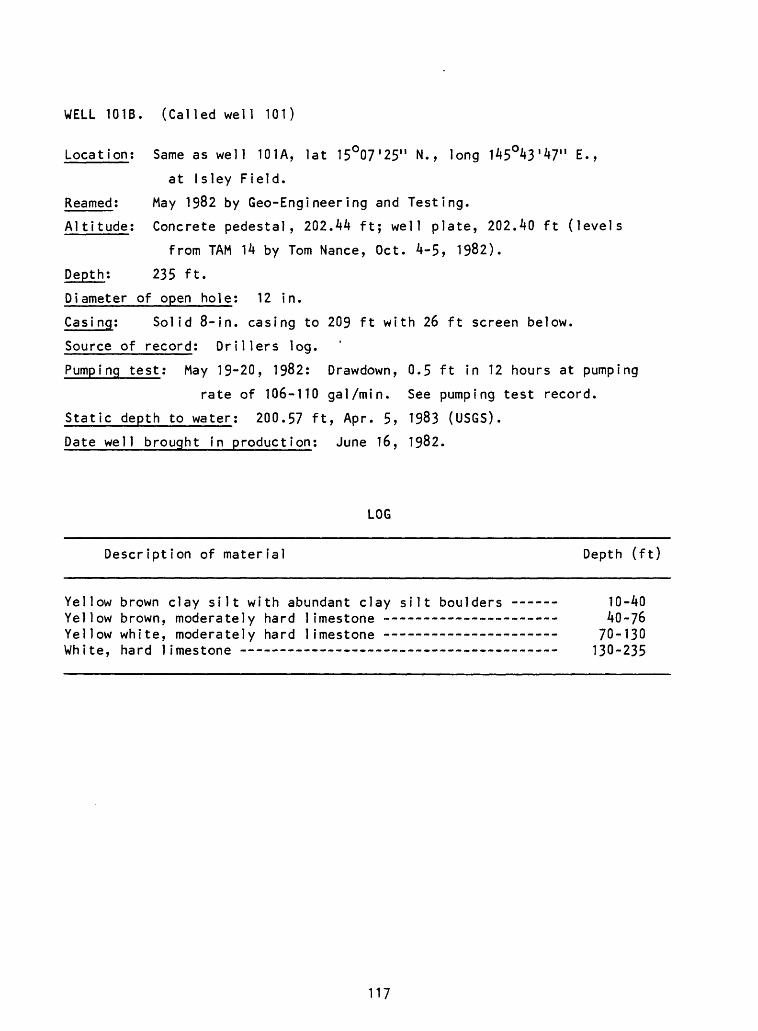
WELL 101B. (Called well 101)
Location: Same as well 101A, lat 15O07'25" N., long 145°43'47" E.,
at Isley Field.
Reamed; May 1982 by Geo-Engineering and Testing.
Altitude; Concrete pedestal, 202.44 ft; well plate, 202.40 ft (levels
from TAM 14 by Tom Nance, Oct. 4-5, 1982).
Depth: 235 ft.
Diameter of open hole; 12 in.
Casi ng; Solid 8-in. casing to 209 ft with 26 ft screen below.
Source of record; Drillers log.
Pumping test; May 19-20, 1982: Drawdown, 0.5 ft in 12 hours at pumping
rate of 106-110 gal/min. See pumping test record.
Static depth to water; 200.57 ft, Apr. 5, 1983 (USGS).
Date well brought in production: June 16, 1982.
LOG
Description of material Depth (ft)
Yellow brown clay silt with abundant clay silt boulders ---- 10-40Yellow brown, moderately hard limestone ------- ---------- - 40-76Yellow white, moderately hard limestone --- ----------------- 70-130White, hard limestone 130-235
117
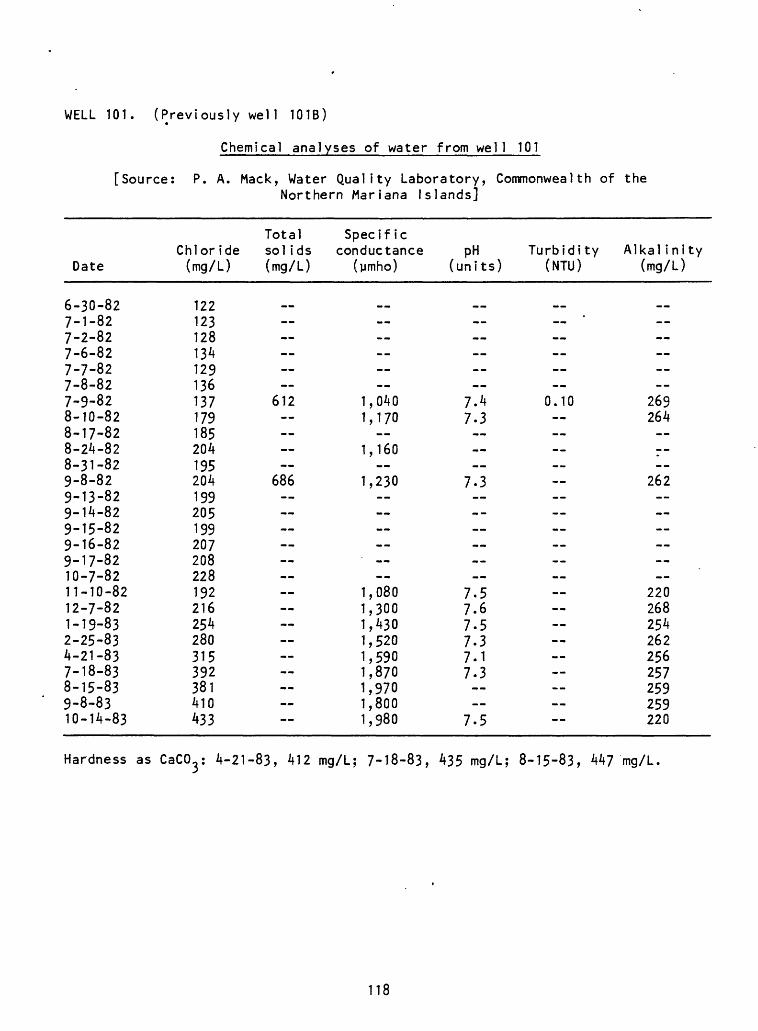
WELL 101. (Previously well 101B)
Chemical analyses of water from well 101
[Source: P. A. Mack, Water Quality Laboratory, Commonwealth of the
Date
6-30-827-1-827-2-827-6-827-7-827-8-827-9-828-10-828-17-828-24-828-31-829-8-829-13-829-14-829-15-829-16-829-17-8210-7-8211-10-8212-7-821-19-832-25-834-21-837-18-838-15-839-8-8310-14-83
Chloride(mg/L)
122123128134129136137179185204195204199205199207208228192216254280315392381410433
Northern
Total
Mariana Is
Specificsolids conductance(mg/L)
..
612
686
(ymho)
.. --
1,0401,170
1,160
1,230
1,0801,3001,4301,5201,5901,8701,9701,8001,980
lands]
pH(units)
.. --
7.47.3
7.3 -- --
7.57.67.57.37.17.3
7.5
Turbidity Alkalinity(NTU) (mg/L)
..
0.10 269264
__
262
220268254262256257259259220
Hardness as CaCOy 4-21-83, 412 mg/L; 7-18-83, 435 mg/L; 8-15-83, 447 mg/L.
118
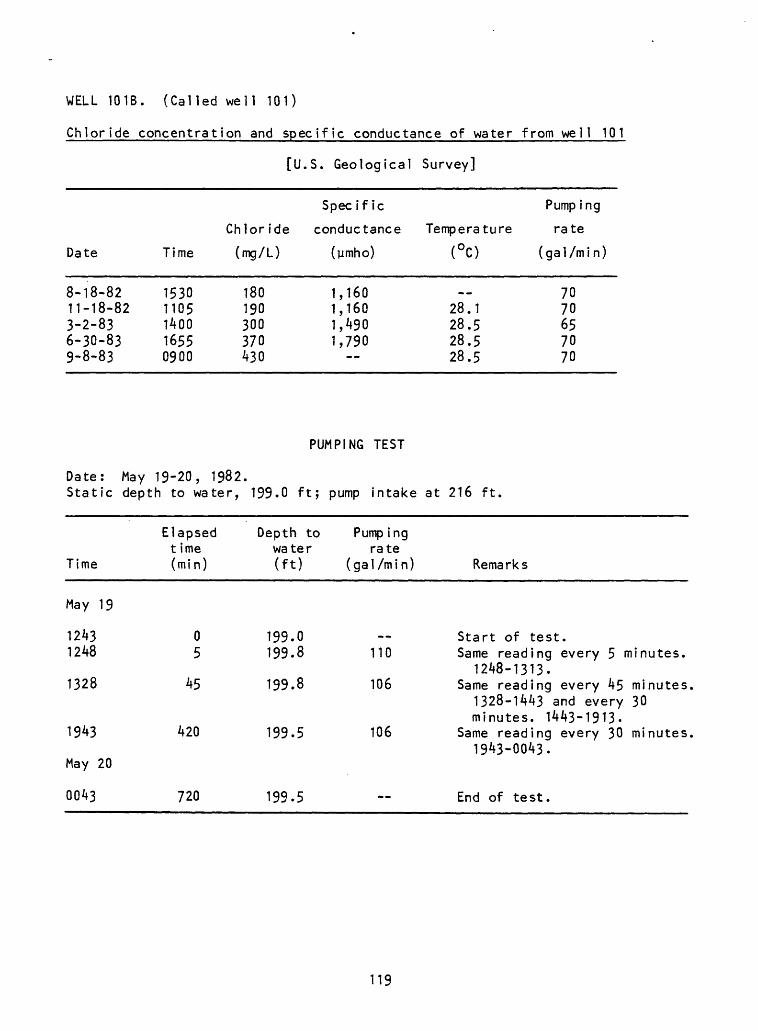
WELL 101B. (Called well 101)
Chloride concentration and specific conductance of water from well 101
Date
8-18-8211-18-823-2-836-30-839-8-83
Time
15301105140016550900
[u
Chloride
(mg/L)
180190300370430
.S. Geological
Spec if ic
conductance
(umho)
1,1601,1601,4901,790
--
Survey]
Temperature(°C)
-_28.128.528.528.5
Pump ing
rate
( ga 1 /m i n )
7070657070
PUMPING TEST
Date: May 19-20, 1982.Static depth to water, 199.0 ft; pump intake at 216 ft.
Time
May 19
12431248
1328
1943
May 20
0043
Elapsed t ime (min)
05
45
420
720
Depth to water (ft)
199.0199.8
199.8
199.5
199.5
Pump ing rate
(gal /min) Remarks
Start of test.110 Same reading every 5
1248-1313.106 Same reading every 45
1328-1443 and everyminutes. 1443-1913-
106 Same reading every 301943-0043.
End of test.
minutes.
minutes30
minutes
119
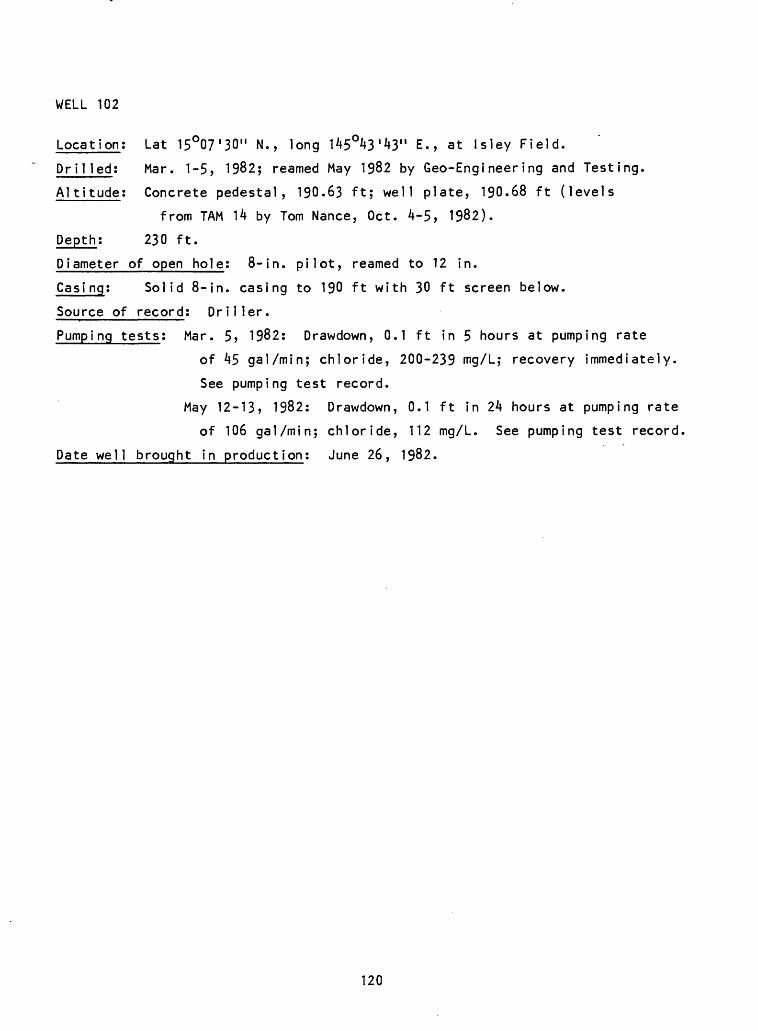
WELL 102
Location: Lat 15°07'30" N., long 145°43'43" E., at Isley Field.
Drilled; Mar. 1-5, 1982; reamed May 1982 by Geo-Engineering and Testing.
Altitude: Concrete pedestal, 190.63 ft; well plate, 190.68 ft (levels
from TAM 14 by Tom Nance, Oct. 4-5, 1982).
Depth; 230 ft.
Diameter of open hole; 8-in. pilot, reamed to 12 in.
Casi ng; Solid 8-in. casing to 190 ft with 30 ft screen below.
Source of record; Driller.
Pumping tests; Mar. 5, 1982: Drawdown, 0.1 ft in 5 hours at pumping rate
of 45 gal/min; chloride, 200-239 mg/L; recovery immediately.
See pumping test record.
May 12-13, 1982: Drawdown, 0.1 ft in 24 hours at pumping rate
of 106 gal/min; chloride, 112 mg/L. See pumping test record,
Date well brought in production; June 26, 1982.
120
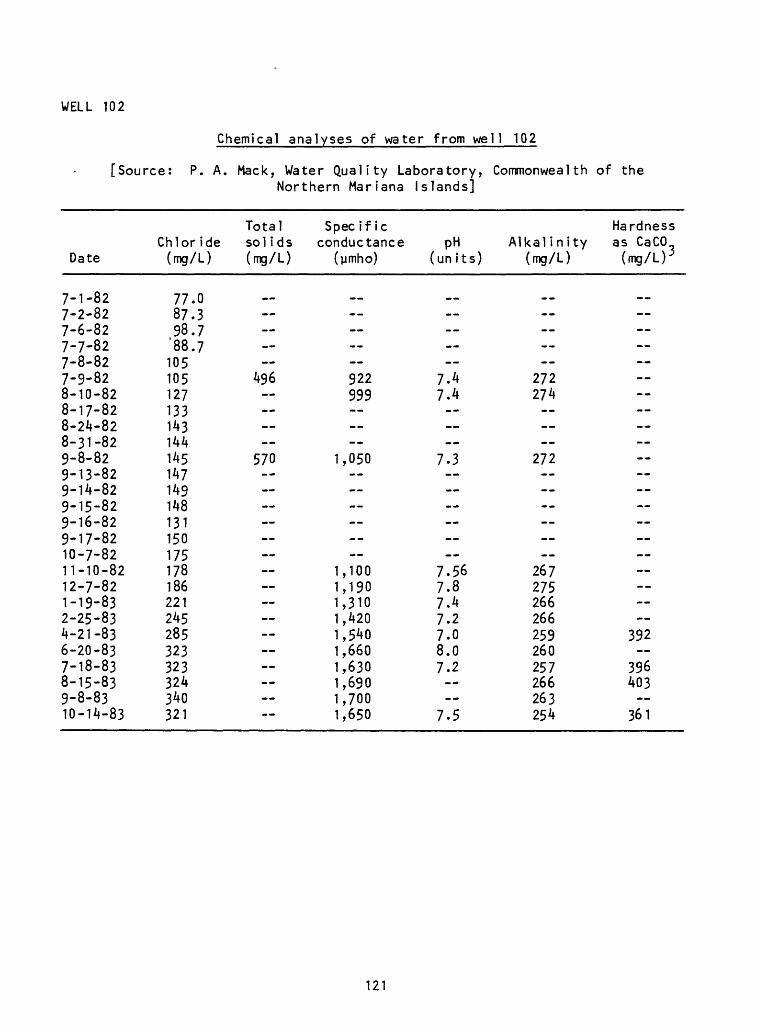
WELL 102
Chemical analyses of water from well 102
[Source: P. A. Mack, Water Quality Laboratory, Commonwealth of theNorthern Mariana Islands]
Date
7-1-827-2-827-6-827-7-827-8-827-9-828-10-828-17-828-24-828-31-829-8-829-13-829-14-829-15-829-16-829-17-8210-7-8211-10-8212-7-821-19-832-25-834-21-836-20-837-18-838-15-839-8-8310-14-83
Chloride (mg/L)
77.087.398.7
'88.7105105127133143144145147149148131150175178186221245285323323324340321
Total so 1 i d s (mg/L)
^
496
570 --
Spec if ic conductance
(ymho)
»
922999
1,050
1,1001,1901,3101,4201,5401,6601,6301,6901,7001,650
pH (un its)
7.47.4
7.3 --
7.567.87.47.27.08.07.2
7.5
Alkal i n ity (mg/L)
M
272274
272
267275266266259260257266263254
Hardness as CaCO
(mg/L) 3
_
392
396403
361
121
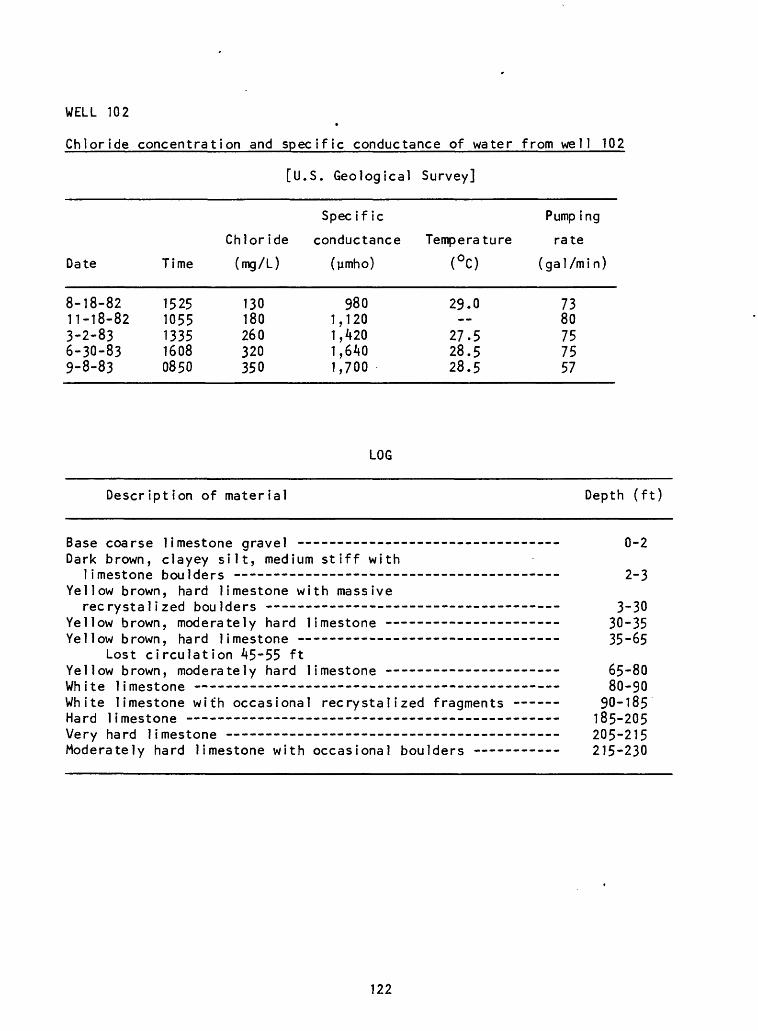
WELL 102
Chloride concentration and specific conductance of water from well 102
[U.S. Geological Survey]
Date
8-18-8211-18-823-2-836-30-839-8-83
Time
15251055133516080850
Chloride
(mg/L)
130180260320350
Spec if ic
conductance
(jimho)
9801,1201,4201,6401,700
Pump ing
Temperature rate(°C)
29.0
27.528.528.5
(gal/min)
7380757557
LOG
Description of material Depth (ft)
Base coarse limestone gravel - -- Dark brown, clayey silt, medium stiff with
limestone boulders --- -- ----- ----- Yellow brown, hard limestone with massive
recrystal i zed boulders - - ------- - - Yellow brown, moderately hard limestone Yellow brown, hard limestone -
Lost circulation 45-55 ftYellow brown, moderately hard limestone -- - White limestone - - - - White limestone with occasional recrystalized fragments Hard limestone - ---_ _ _ _.Very hard limestone Moderately hard limestone with occasional boulders
0-2
2-3
3-30 30-35 35-65
65-8080-90
90-185185-205205-215215-230
122
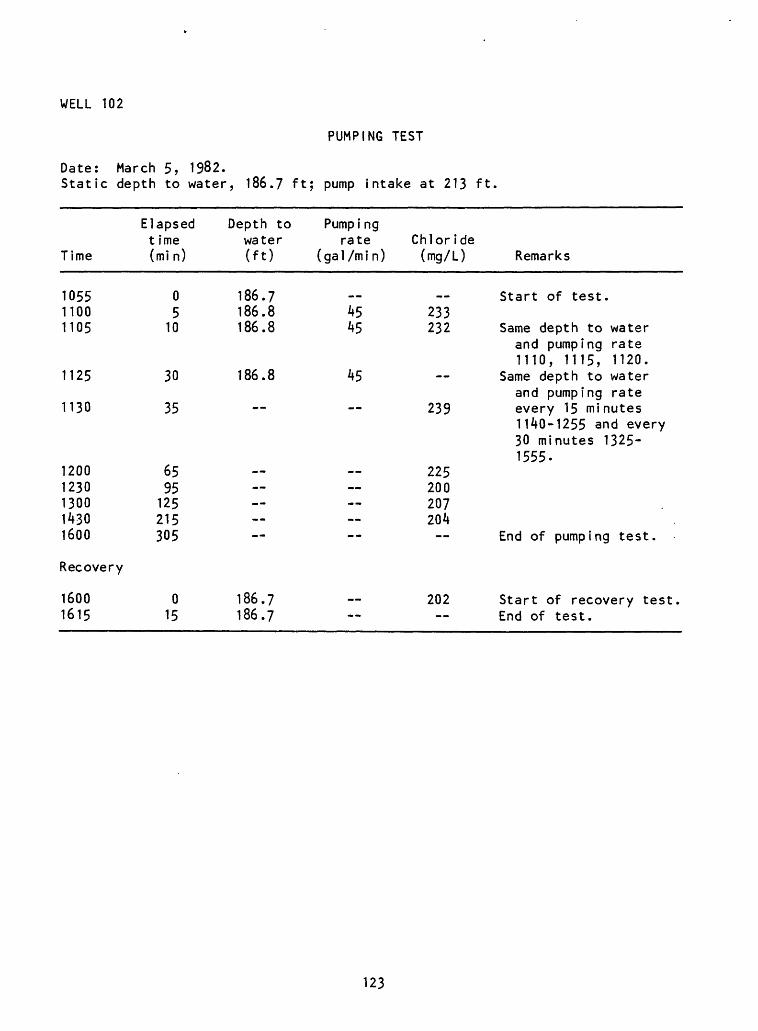
WELL 102
PUMPING TEST
Date: March 5, 1982.Static depth to water, 186.7 ft; pump intake at 213 ft
Time
105511001105
1125
1130
12001230130014301600
Recovery
16001615
Elapsed t ime (min)
05
10
30
35
6595125215305
015
Depth to water (ft)
186.7186.8186.8
186.8
186.7186.7
Pump i ng rate
( ga 1 /m i n )
»
4545
45
----
Chloride (mg/L)
»*
233232
239
225200207204
202--
Remarks
Start of test.
Same depth to waterand pumping rate1110, 1115, 1120.
Same depth to waterand pumping rateevery 15 minutes1140-1255 and every30 minutes 1325-1555.
End of pumping test.
Start of recovery test.End of test.
123
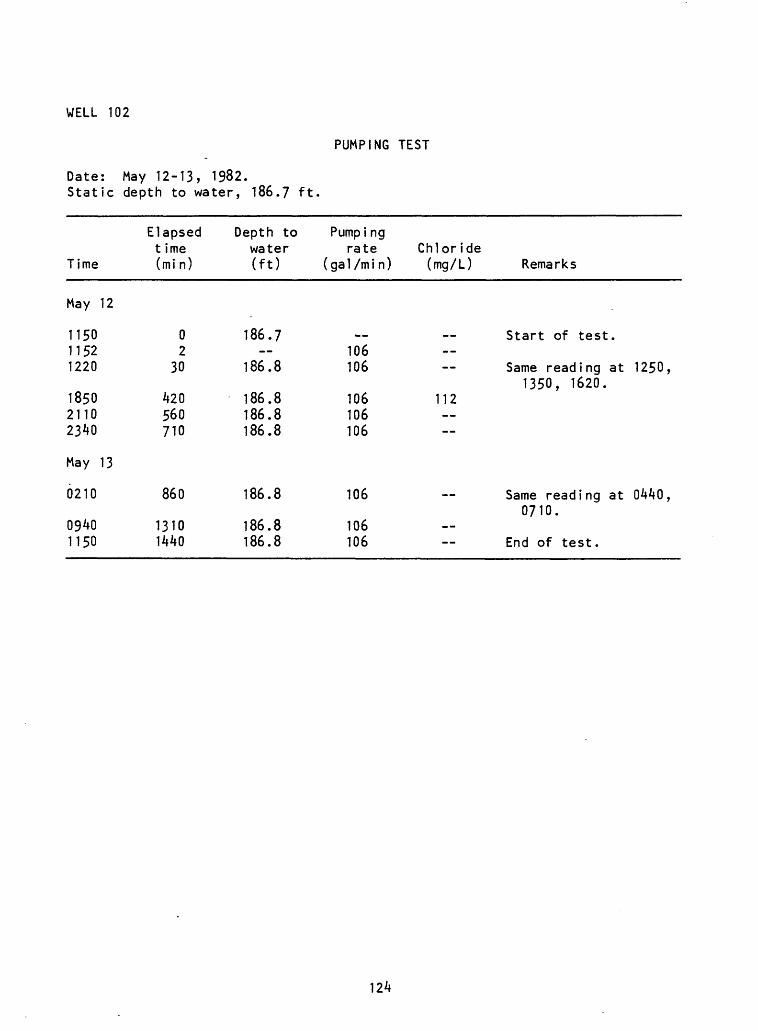
WELL 102
Date: May 12-13, 1982.Static depth to water, 186.7 ft.
PUMPING TEST
Time
May 12
115011521220
185021102340
May 13
0210
09401150
Elapsed t ime (mi n)
02
30
420560710
860
13101440
Depth to water (ft)
186.7
186.8
186.8186.8186.8
186.8
186.8186.8
Pump i ng rate
( ga 1 /m i n )
__106106
106106106
106
106106
Chloride (mg/L) Remarks
Start of test.
Same reading at 1250,1350, 1620.
112--
Same reading at 0440,0710.
End of test.
124
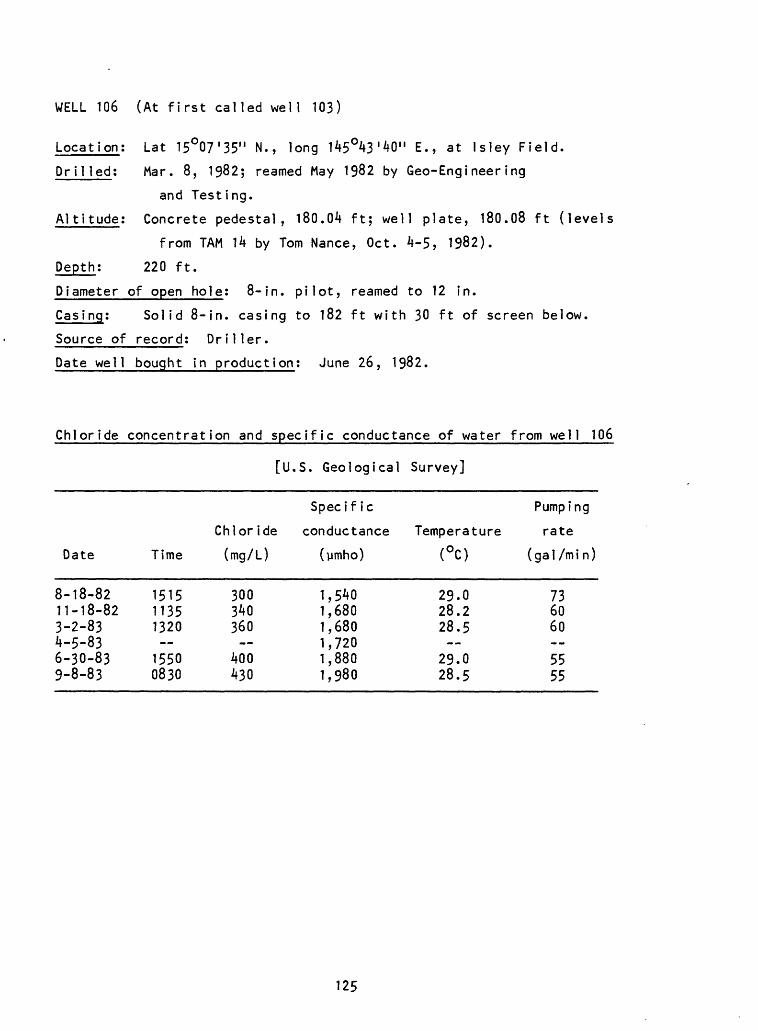
WELL 106 (At first called well 103)
Location; Lat 15°07'35" N., long 145°43'40" E., at Isley Field.
Drilled; Mar. 8, 1982; reamed May 1982 by Geo-Engineering
and Testing.
Altitude; Concrete pedestal, 180.04 ft; well plate, 180.08 ft (levels
from TAM 14 by Tom Nance, Oct. 4-5, 1982).
Depth; 220 ft.
Diameter of open hole; 8-in. pilot, reamed to 12 in.
Casing; Solid 8-in. casing to 182 ft with 30 ft of screen below.
Source of record; Driller.
Date well bought in production; June 26, 1982.
Chloride concentration and specific conductance of water from well 106
[U.S. Geological Survey]
Specific Pumping
Chloride conductance Temperature rate
Date Time (mg/L) (ymho) (°C) (gal/min)
8-18-8211-18-823-2-834-5-836-30-839-8-83
151511351320
15500830
300340360
400430
1,5401,6801,6801,7201,8801,980
29.028.228.5
29.028.5
736060 5555
125
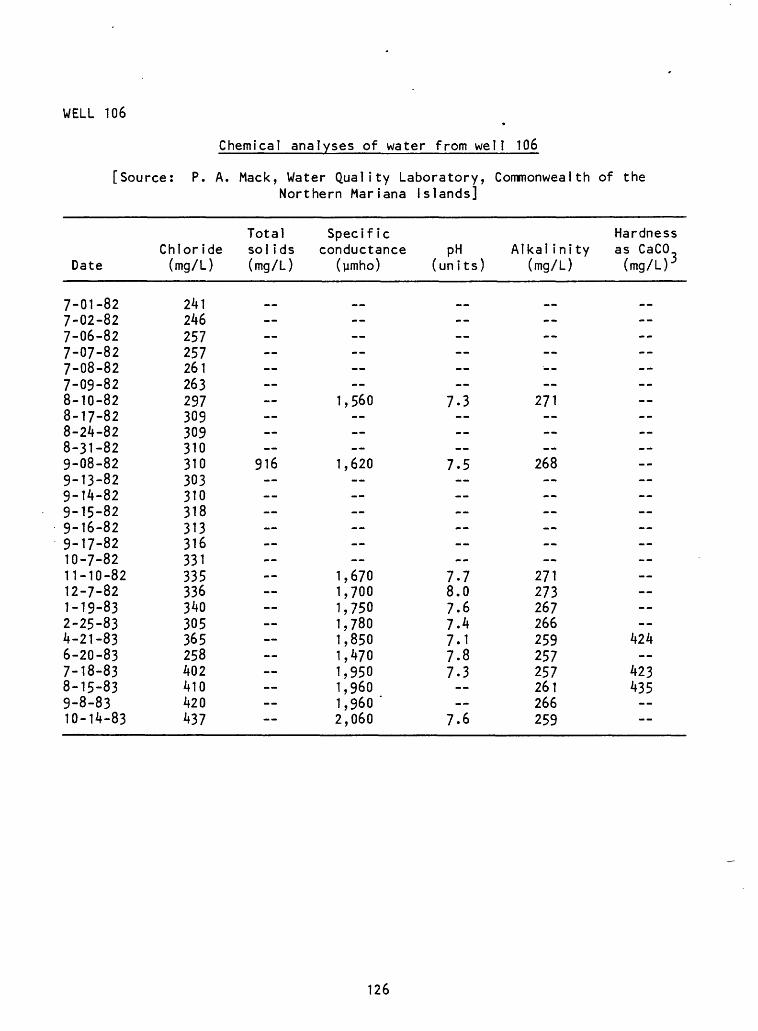
WELL 106
[Source
Chemical analyses of water from well 106
P. A. Mack, Water Quality Laboratory, Commonwealth of the Northern Mariana Islands]
Date
7-01-827-02-827-06-827-07-827-08-827-09-828-10-828-17-828-24-828-31-829-08-829-13-829-14-829-15-829-16-829-17-8210-7-8211-10-8212-7-821-19-832-25-834-21-836-20-837-18-838-15-839-8-8310-14-83
Chloride (mg/L)
241246257257261263297309309310310303310318313316331335336340305365258402410420437
Total sol ids (mg/L)
916 --
Specific conductance
(ymho)
1,560
1,620
1,6701,7001,7501,7801,8501,4701,9501,9601,960 '2,060
pH (units)
7.3
7.5
7.78.07.67.47.17.87.3
7.6
Alkal ini ty (mg/L)
--
271
268
271273267266259257257261266259
Hardness as CaCO (mg/L) 3
---------- -- -- --
424
423435 --
126
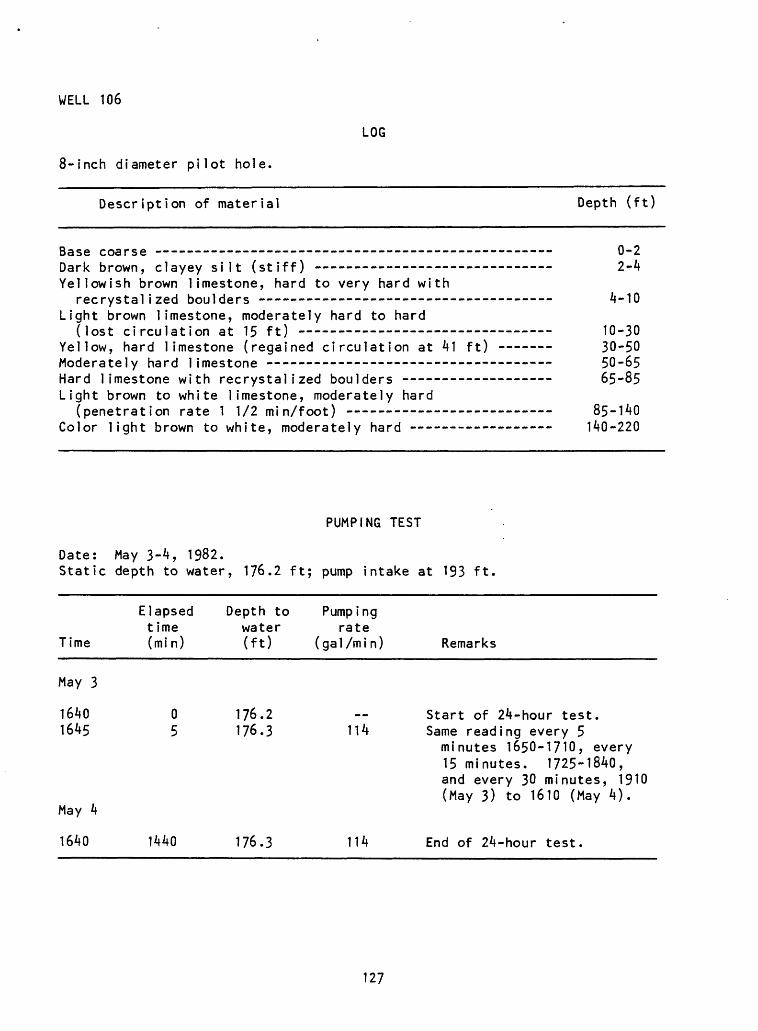
WELL 106
LOG
8-inch diameter pilot hole.
Description of material Depth (ft)
Base coarse 0-2Dark brown, clayey silt (stiff) 2-4Yellowish brown limestone, hard to very hard with
recrystal ized boulders - 4-10Light brown limestone, moderately hard to hard
(lost circulation at 15 ft) 10-30 Yellow, hard limestone (regained circulation at 41 ft) -- - 30-50 Moderately hard limestone - 50-65Hard limestone with recrystalized boulders ---------- ------ 65-85Light brown to white limestone, moderately hard
(penetration rate 1 1/2 min/foot) 85-140 Color light brown to white, moderately hard - - - 140-220
PUMPING TEST
Date: May 3-4, 1982.Static depth to water, 176.2 ft; pump intake at 193 ft.
Time
May 3
1640 1645
Elapsed time (min)
0 5
Depth to water (ft)
176.2 176.3
Pumping rate
(gal /mi n)
114
Remarks
Start of 24-hour test. Same reading every 5minutes 1650-1710, every 15 minutes. 1725-1840, and every 30 minutes, 1910 (May 3) to 1610 (May 4).
May 4
1640 1440 176.3 114 End of 24-hour test.
127
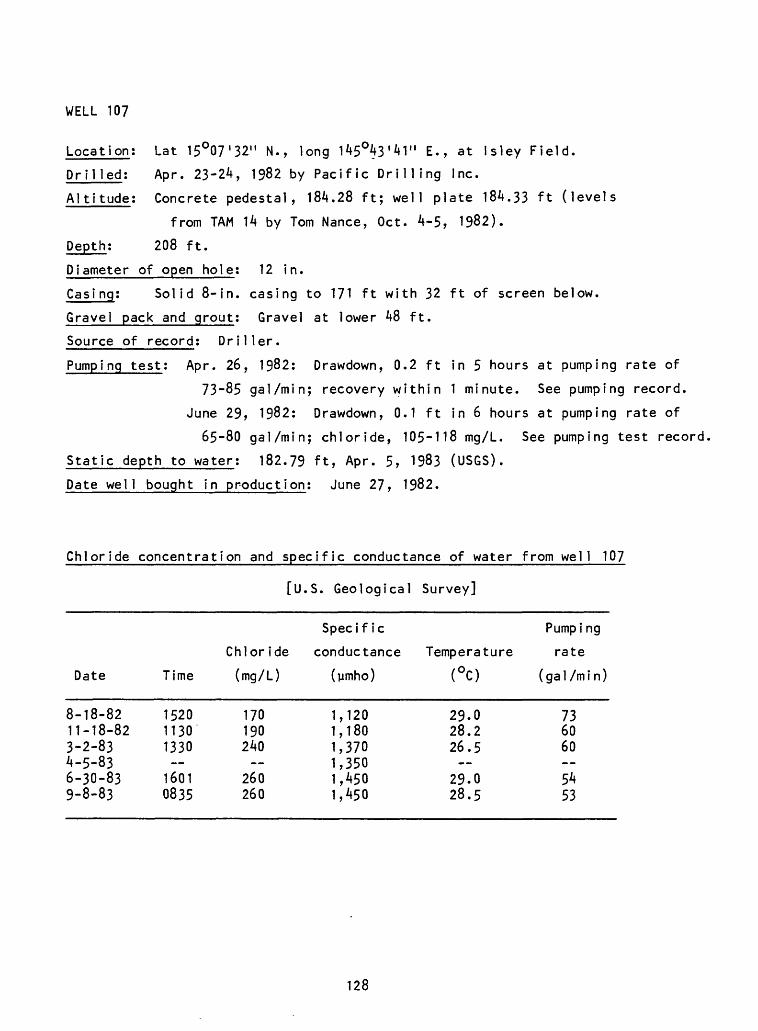
WELL 10?
Location: Lat 15°07'32" N., long 145O43'41" E., at Isley Field.
Drilled: Apr. 23-24, 1982 by Pacific Drilling Inc.
Altitude: Concrete pedestal, 184.28 ft; well plate 184.33 ft (levels
from TAM 14 by Tom Nance, Oct. 4-5, 1982).
Depth: 208 ft.
Diameter of open hole: 12 in.
Casi ng: Solid 8-in. casing to 171 ft with 32 ft of screen below.
Gravel pack and grout: Gravel at lower 48 ft.
Source of record: Driller.
Pumping test: Apr. 26, 1982: Drawdown, 0.2 ft in 5 hours at pumping rate of
73-85 gal/min; recovery within 1 minute. See pumping record.
June 29, 1982: Drawdown, 0.1 ft in 6 hours at pumping rate of
65-80 gal/min; chloride, 105-118 mg/L. See pumping test record
Static depth to water: 182.79 ft, Apr. 5, 1983 (USGS).
Date well bought in production: June 27, 1982.
Chloride concentration and specific conductance of water from well 107
Date
8-18-8211-18-823-2-834-5-836-30-839-8-83
Time
152011301330
16010835
[u
Chloride
(mg/L)
170190240
260260
. S. Geological
Specific
conductance
(umho)
1,1201,1801,3701,3501,4501,450
Survey]
Temperature(°0
29.028.226.5
29.028.5
Pumping
rate
(gal/min)
736060 5453
128
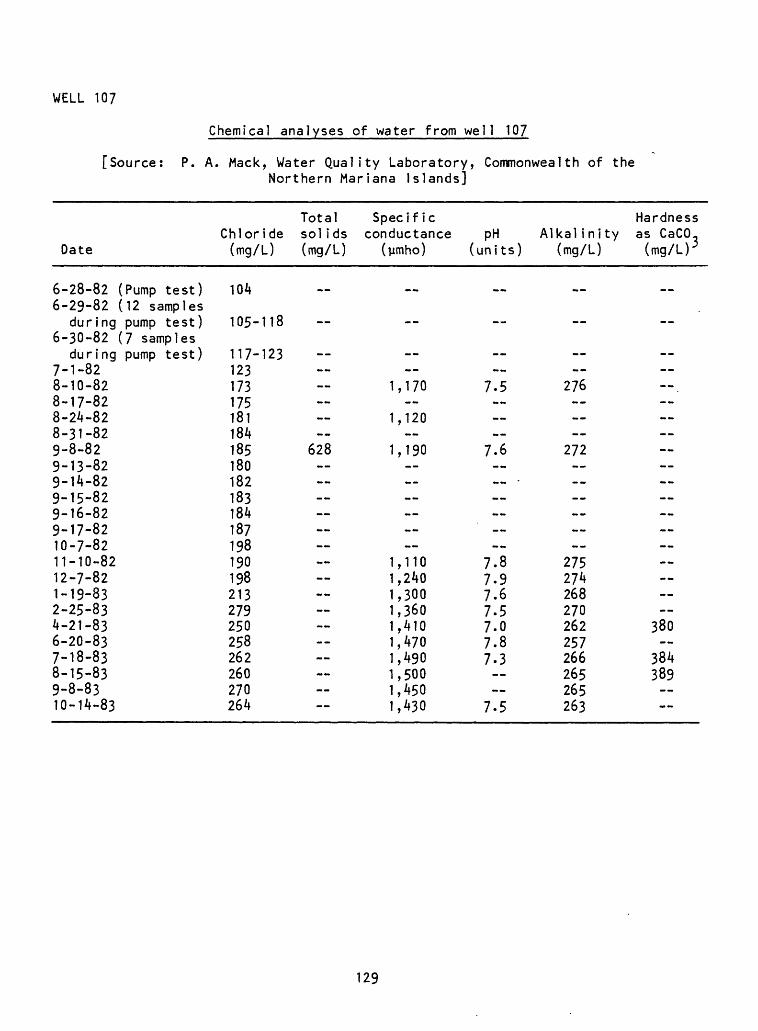
WELL 10?
Chemical analyses of water from well 107
[Source: P. A. Mack, Water Quality Laboratory, Commonwealth of theNorthern Mariana Islands]
Date
6-28-82 (Pump test)6-29-82 (12 samples
during pump test)6-30-82 (7 samples
during pump test)7-1-828-10-828-17-828-24-828-31-829-8-829-13-829-14-829-15-829-16-829-17-8210-7-8211-10-8212-7-821-19-832-25-834-21-836-20-837-18-838-15-839-8-8310-14-83
Chloride (mg/L)
104
105-118
117-123123173175181184185180182183184187198190198213279250258262260270264
Total sol ids (mg/L)
_
628 --
Specific conductance
(ymho)
MM
1,170
1,120
1,190
1,1101,2401,3001,3601,4101,4701,4901,5001,4501,430
PH (units)
MM
7.5
7.6 -
7.87.97.67.57.07.87.3
7.5
Alkal inity (mg/L)
M M
276
272 --
275274268270262257266265265263
Hardness as CaCO- (mg/L)^
__
380
384389
129
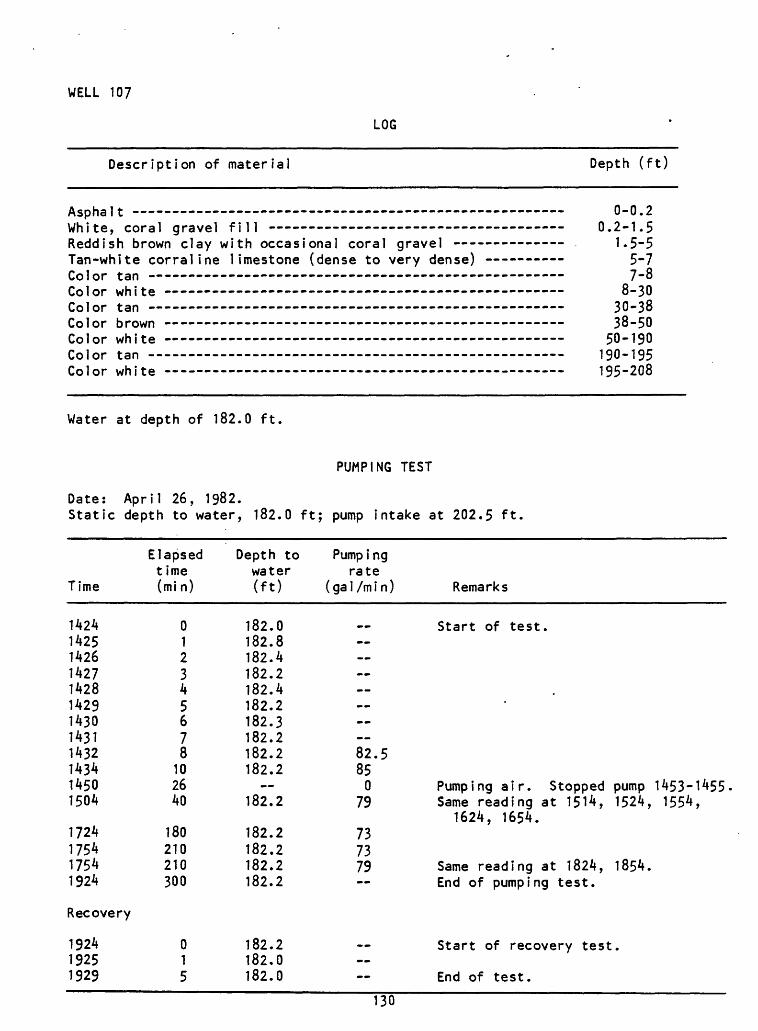
WELL 107
LOG
Description of material
Water at depth of 182.0 ft.
Depth (ft)
Asphal t White, coral gravel fill Reddish brown clay with occasional coral gravel Tan-white corral ine limestone (dense to very dense) Color tan Color white Color tan Color brown --- --- -- - Color white -- - - Color tan - - - -- -- Color white - --
0-0.20.2-1.5
1.5-55-77-8
8-3030-3838-50
50-190190-195195-208
Date: April 26, 1982. Static depth to water,
PUMPING TEST
182.0 ft; pump intake at 202.5 ft.
Time
Elapsed time (mi n)
Depth to water (ft)
Pump i ngrate
(ga 1 /m i n) Remarks
142414251426142714281429143014311432143414501504
1724175417541924
Recovery
192419251929
012345678
102640
180210210300
182.0182.8182.4182.2182.4182.2
Start of test.
182.3182,182,182.2
182.2
182,182,182,182.2
182.2182.0182.0
82,850
79
737379
Pumping air. Stopped pump 1453-1455 Same reading at 1514, 1524, 1554,
1624, 1654.
Same reading at 1824, 1854. End of pumping test.
Start of recovery test.
End of test.
130
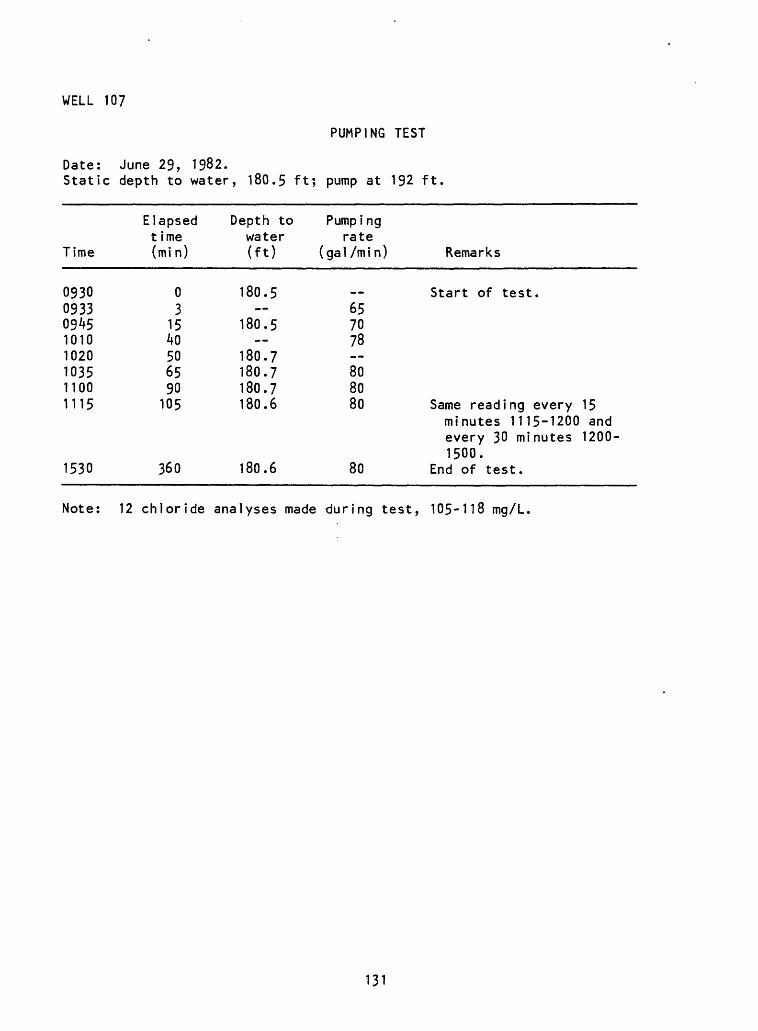
WELL 107
PUMPING TEST
Date: June 29, 1982.Static depth to water, 180.5 ft; pump at 192 ft
Time
09300933094510101020103511001115
Elapsedtime(mi n)
03
1540506590105
Depth towater(ft)
180.5
180.5
180.7180.7180.7180.6
Pump i ngrate
(gal/min) Remarks
Start of test.657078 808080 Same reading every 15
1530 360 180.6 80
minutes 1115-1200 and every 30 minutes 1200- 1500.
End of test.
Note: 12 chloride analyses made during test, 105-118 mg/L.
131
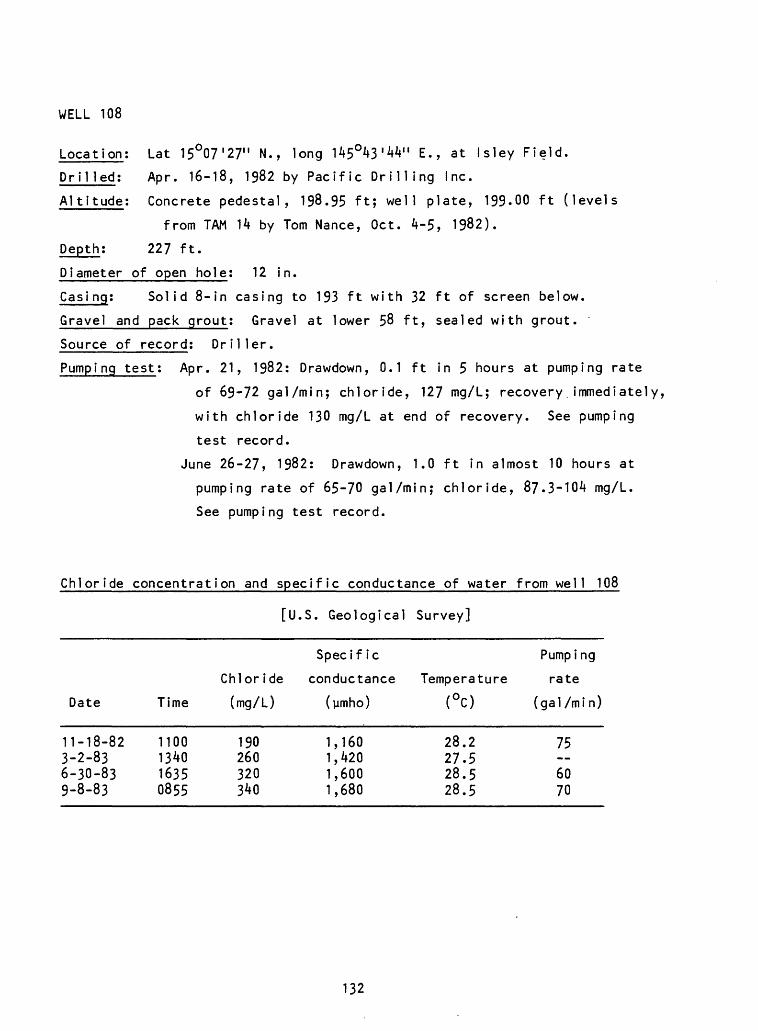
WELL 108
Location; Lat 15°07'27" N., long 145°43'44" E., at Isley Field.
Drilled; Apr. 16-18, 1982 by Pacific Drilling Inc.
Altitude; Concrete pedestal, 198.95 ft; well plate, 199.00 ft (levels
from TAM 14 by Tom Nance, Oct. 4-5, 1982).
Depth; 227 ft.
Diameter of open hole; 12 in.
Casi ng; Solid 8-in casing to 193 ft with 32 ft of screen below.
Gravel and pack grout; Gravel at lower 58 ft, sealed with grout.
Source of record; Driller.
Pumping test; Apr. 21, 1982; Drawdown, 0.1 ft in 5 hours at pumping rate
of 69-72 gal/min; chloride, 127 mg/L; recovery.immediately,
with chloride 130 mg/L at end of recovery. See pumping
test record.
June 26-27, 1982; Drawdown, 1.0 ft in almost 10 hours at
pumping rate of 65-70 gal/min; chloride, 87.3-104 mg/L.
See pumping test record.
Chloride concentration and specific conductance of water from well 108
Date
11-18-82 3-2-83 6-30-83 9-8-83
Time
1100 1340 1635 0855
[u.
Chloride
(mg/L)
190 260 320 340
S. Geological
Specif ic
conductance
(jamho)
1,160 1,420 1,600 1,680
Survey]
Temperature<°C)
28.2 27.5 28.5 28.5
Pumping
rate
(gal /mi n)
75
60 70
132
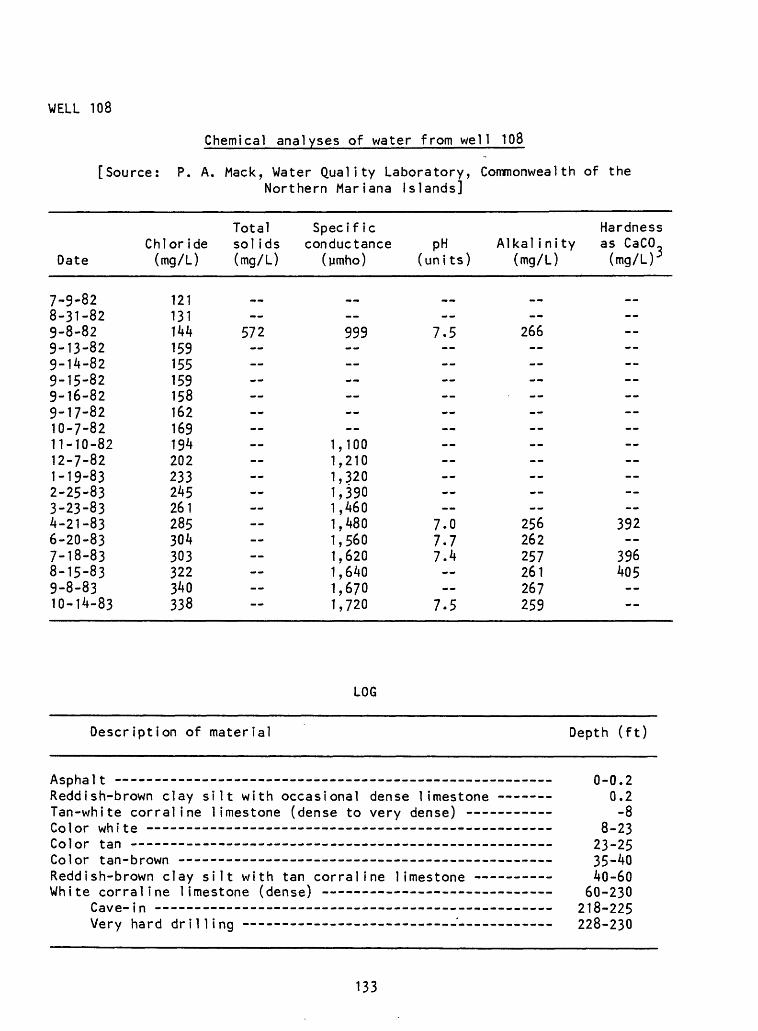
WELL 108
[Source
Chemical analyses of water from well 108
P. A. Mack, Water Quality Laboratory, Commonwealth of the Northern Mariana Islands]
Date
7-9-828-31-829-8-829-13-829-14-829-15-829-16-829-17-8210-7-8211-10-8212-7-821-19-832-25-833-23-834-21-836-20-837-18-838-15-839-8-8310-14-83
Chlor ide (mg/L)
121131144159155159158162169194202233245261285304303322340338
Total sol ids (mg/L)
572
Specif ?c conductance
(ymho)
999
1,1001,2101,3201,3901,4601,4801,5601,6201,6401,6701,720
P H (uni ts)
7.5
7.07.77.4
7.5
Alkal inity (mg/L)
266
.
256262257261267259
Hardness as CaCO (mg/LK
M M
--
392
396405 --
LOG
Description of material Depth (ft)
Asphalt Reddish-brown clay silt with occasional dense limestone Tan-white corraline limestone (dense to very dense) - Color white - - - ----- -- -.Color tan Color tan-brown Reddish-brown clay silt with tan corraline limestone White corral ine limestone (dense) - -
Cave-in Very hard drilling - -- -- - -__'--__.
0-0.20.2-8
8-2323-2535-4040-60
60-230218-225228-230
133
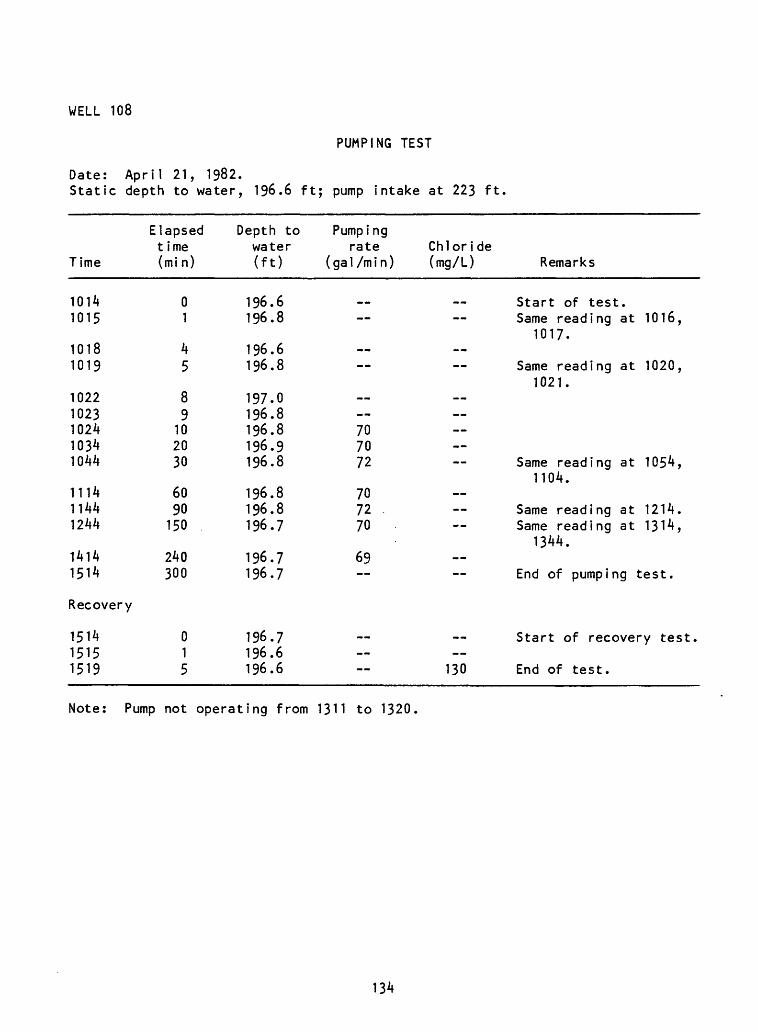
WELL 108
PUMPING TEST
Date: April 21, 1982.Static depth to water, 196.6 ft; pump intake at 223 ft
Time
10141015
10181019
10221023102410341044
111411441244
14141514
Recovery
151415151519
Elapsed t ime (mi n)
01
45
89
102030
6090150
240300
015
Depth to water (ft)
196.6196.8
196.6196.8
197.0196.8196.8196.9196.8
196.8196.8196.7
196.7196.7
196.7196.6196.6
Pumping rate
( ga 1 /m i n )
707072
707270
69
Chloride (mg/L) Remarks
Start of test.Same reading at 1016,
1017.
Same reading at 1020,1021.
Same reading at 1054,1104.
Same reading at 1214.Same reading at 1314,
1344.
End of pumping test.
Start of recovery test.
130 End of test.
Note: Pump not operating from 1311 to 1320.
134
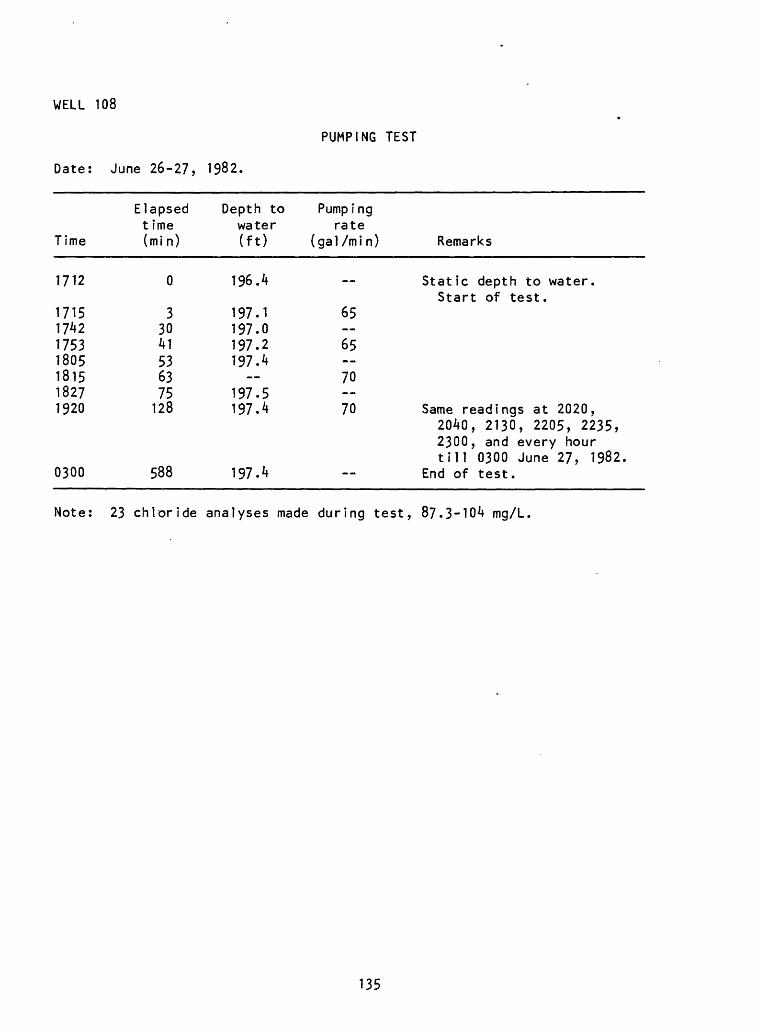
WELL 108
Date: June 26-27, 1982,
PUMPING TEST
Time
1712
1715174217531805181518271920
Elapsedtime(mi n)
0
33041536375128
Depth towater(ft)
196.4
197.1197.0197.2197.4
197.5197.4
Pumpingrate
(gal /mi n) Remarks
Static depth to water.Start of test.
65 65 70 70 Same readings at 2020,
0300 588 197.4
2040, 2130, 2205, 2235, 2300, and every hour till 0300 June 27, 1982,
End of test.
Note: 23 chloride analyses made during test, 87.3-104 mg/L.
135
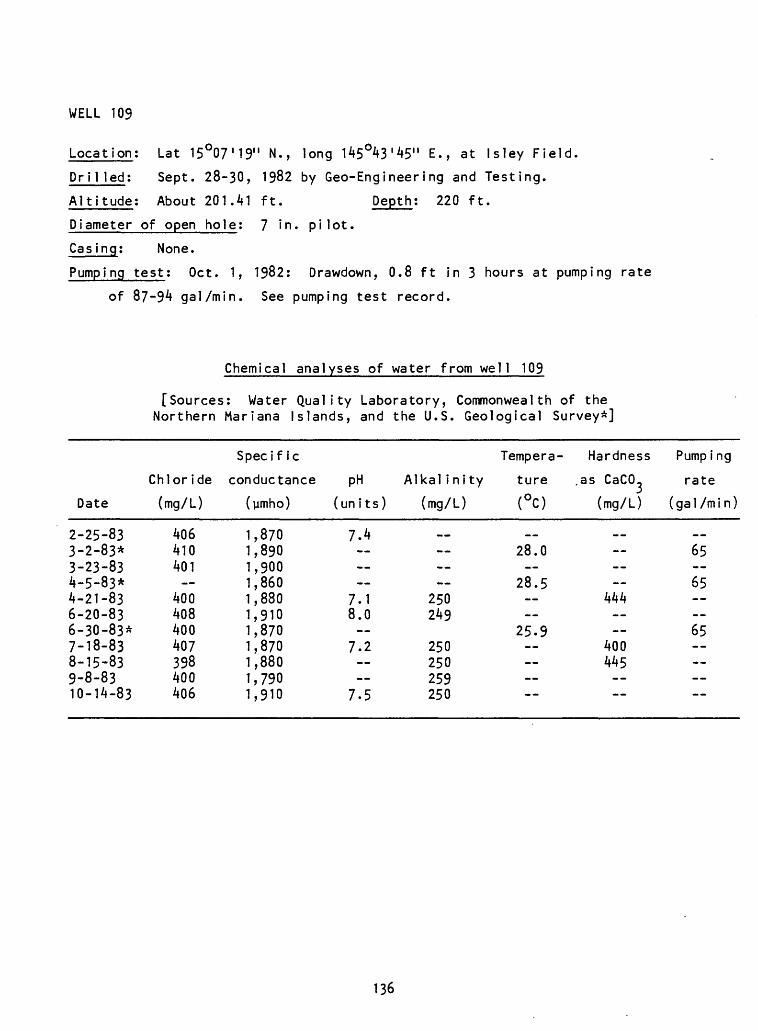
WELL 109
Location; Lat 15 O07'19" N., long 145°43'45" E., at Isley Field.
Dri1 led; Sept. 28-30, 1982 by Geo-Engineering and Testing.
Altitude; About 201.41 ft. Depth; 220 ft.
Diameter of open hole; 7 in. pilot.
Casing; None.
Pumping test; Oct. 1, 1982; Drawdown, 0.8 ft in 3 hours at pumping rate
of 87-94 gal/min. See pumping test record.
Chemical analyses of water from well 109
[Sources; Water Quality Laboratory, Commonwealth of the Northern Mariana Islands, and the U.S. Geological Survey*]
Date
2-25-833-2-83*3-23-834-5-83*4-21-836-20-836-30-83*7-18-838-15-839-8-8310-14-83
Chloride
(mg/L)
406410401
400408400407398400406
Specif ic
conductance pH
(ymho)
1,8701,8901,9001,8601,8801,9101,8701,8701,8801,7901,910
(units)
7.4
7.18.0
7.2
7.5
Alkal inity
(mg/L)
__
250249
250250259250
Tempera
ture(°c)
__28.0
28.5
25.9
Hardness
.as CaCO-
(mg/L)
__
444
400445
Pumping
rate
(gal/min)
__65 65 --65
136
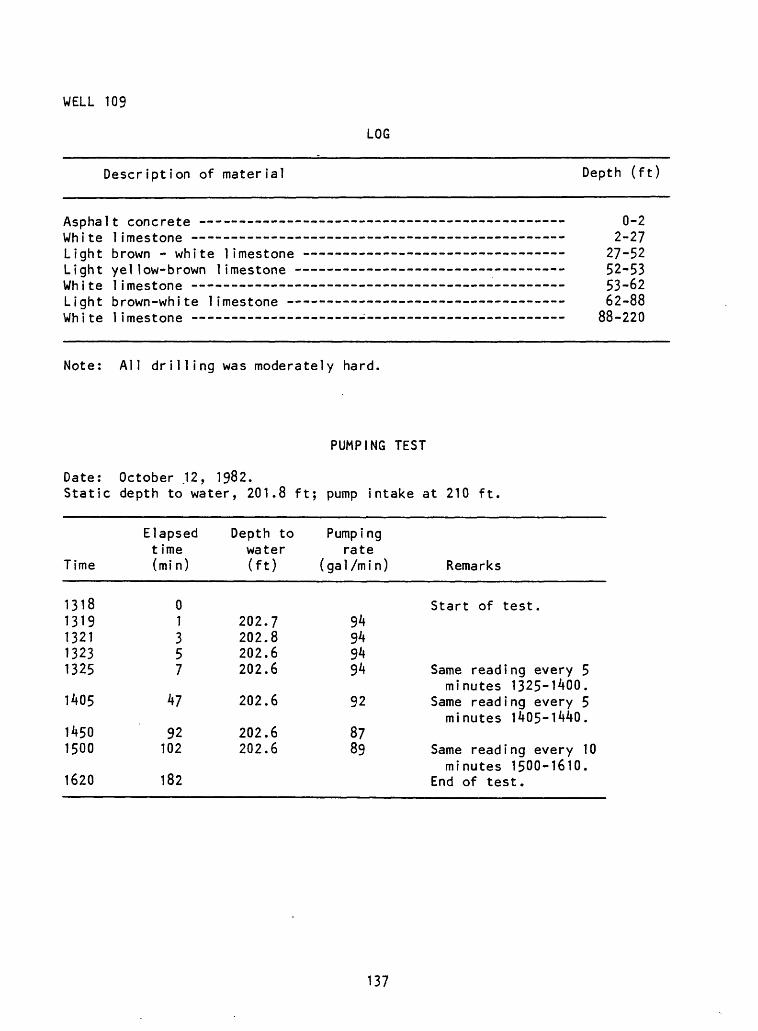
WELL 109
LOG
Description of material Depth (ft)
Asphalt concrete --- White limestone --------Light brown - white limestone Light yellow-brown limestone White limestone Light brown-white limestone - White limestone
0-22-27
27-5252-5353-6262-88
88-220
Note: All drilling was moderately hard.
Date: October .12, 1982.Static depth to water, 201.8 ft;
PUMPING TEST
pump intake at 210 ft.
Time
Elapsed t ime (mi n)
Depth to water (ft)
Pumpi ngrate
(ga 1 /m i n) Remarks
13181319132113231325
1405
14501500
1620
01357
47
92102
182
202.7202.8202.6202.6
202.6
202.6202.6
94949494
92
8789
Start of test.
Same reading every 5 minutes 1325-1400.
Same reading every 5 minutes 1405-1440.
Same reading every 10minutes 1500-1610.
End of test.
137
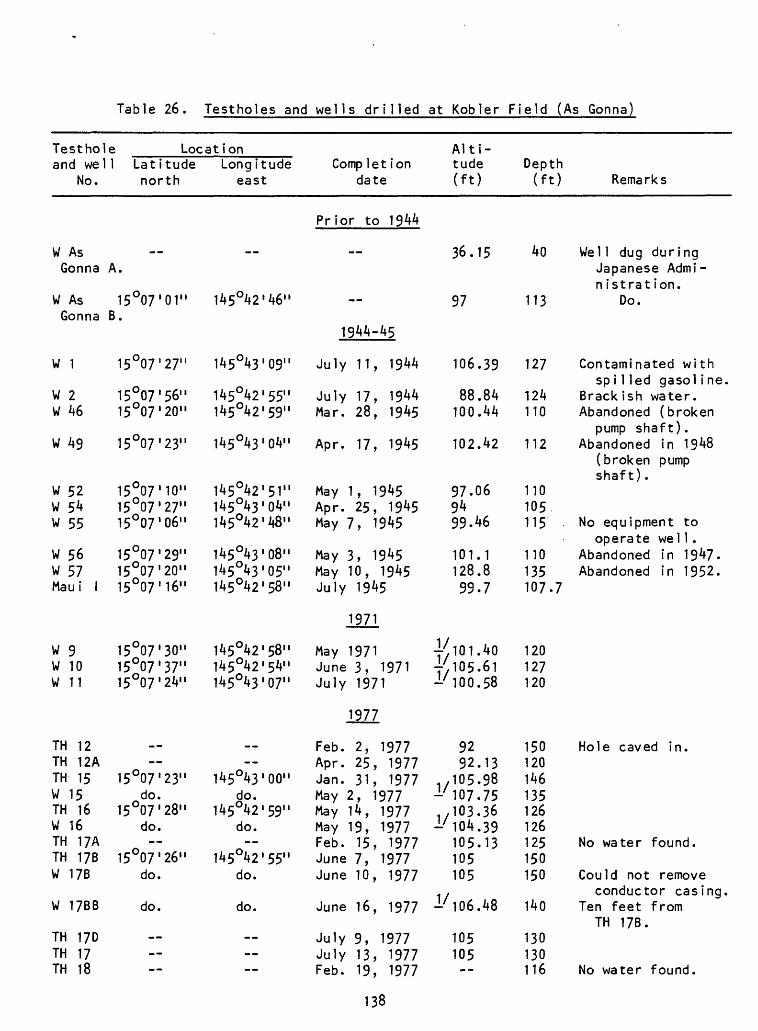
Table 26. Testholes and wells drilled at Kobler Field (As Gonna)
Testhole Locationand wel
No.
W AsGonna
W AsGonna
W 1
W 2W 46
W 49
W 52W 54W 55
W 56W 57Maui 1
W 9W 10W 11
TH 12TH 12ATH 15W 15TH 16W 16TH 17ATH 17BW 17B
W 17BB
TH 17DTH 17TH 18
II Latitude north
__A.
15°07'01"B.
15°07'27"
15°07'56"15°07'20"
15°07'23"
15 007'10"15°07'27"15°07'06"
15°07'29"15°07 I 20"15007'16"
15°07'30"15°07'37"15°07'24"
--
15°07'23"do.
15°07'28"do.
15°07'26"do.
do.
Longitude east
__
145°42'46"
145°43'09M
145°42'55"145°42'59"
1450^3'OV'
145 042'51"1/f 5°43'OV l145°42'48"
145°43'08"145°43'05"145°42'58"
145°42'58"145°42'54"145°43'07"
----
145°43'00"do.
145°42'59"do.
145°42'55"do.
do.
Complet ion date
Prior to 1944
__
1944-45
July 11, 1944
July 17, 1944Mar. 28, 1945
Apr. 17, 1945
May 1, 1945Apr. 25, 19^5May 7, 1945
May 3, 1945May 10, 1945July 19^5
1971
May 1971June 3, 1971July 1971
1977
Feb. 2, 1977Apr. 25, 1977Jan. 31, 1977May 2, 1977May 14, 1977May 19, 1977Feb. 15, 1977June 7, 1977June 10, 1977
June 16, 1977
July 9, 1977July 13, 1977Feb. 19, 1977
Alti tude (ft)
36.15
97
106.39
88.84100.44
102.42
97.069^99.46
101.1128.899.7
4^101.404/105.61-MOO. 58
9292.13
17 105.98-107.75,,103.36-'104.39
105.13105105
.1'106.48
105105
Depth (ft)
40
113
127
124110
112
110105.115
110135107.7
120127120
150120146135126126125150150
140
130130116
Remarks
Wel 1 dug duringJapanese Administration.
Do.
Contaminated withsp i 1 led gasol i ne.
Brack ish water.Abandoned (broken
pump shaft).Abandoned in 1948
(broken pumpshaft).
No equipment tooperate wel 1 .
Abandoned in 1947.Abandoned in 1952.
Hole caved in.
No water found.
Could not removeconductor casing.
Ten feet fromTH 17B.
No water found.
138
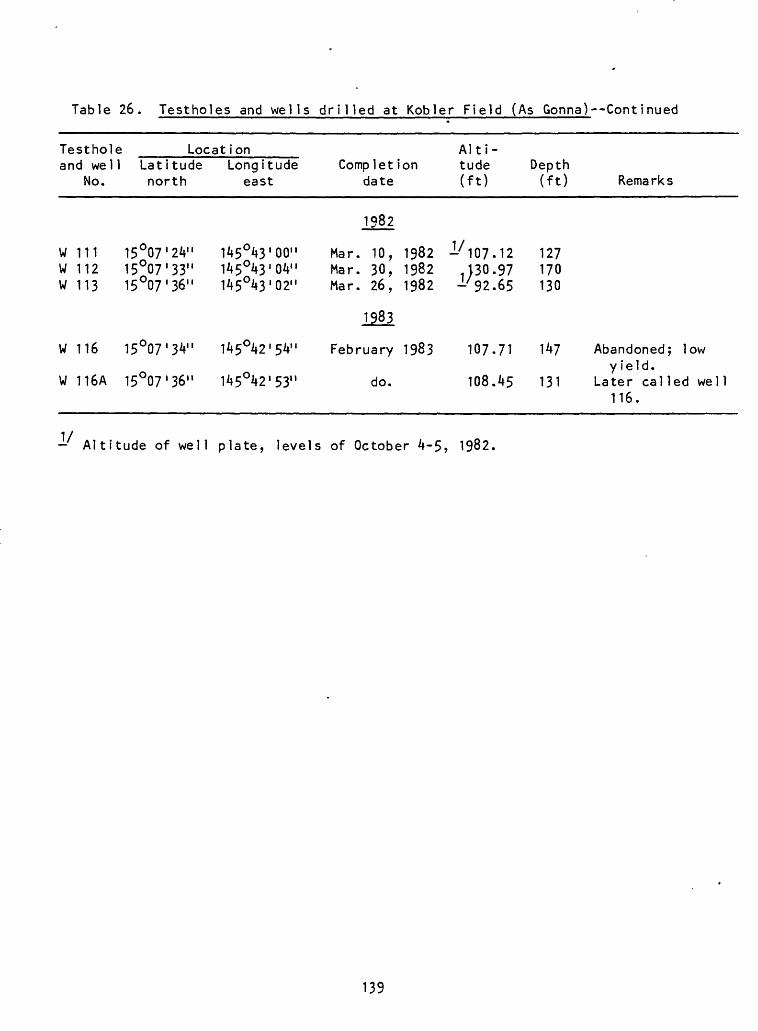
Table 26. Testholes and wells drilled at Kobler Field (As Gonna)--Continued
Testhol and wel
No.
WWW
W
W
111112113
116
116A
e 1
151515
15
15
Locat ionLatitude north
o°7o°7°07
°07
°07
24"'33" 36"
34"
36"
Longitude east
145°4145°4145°4
145°4
145°4
3 '00"3 '04"3 '02"
2 '54"
2 '53"
Comp let ion date
1JI82
Mar. 10,Mar. 30,Mar. 26,
1983
February
do.
198219821982
1983
Alti tude (ft)
1/107.12.130.97- 92.65
107.71
108.45
Depth (ft) Remarks
127170130
147 Abandoned; lowy ield.
131 Later cal led wel 1116.
- Altitude of well plate, levels of October 4-5, 1982.
139
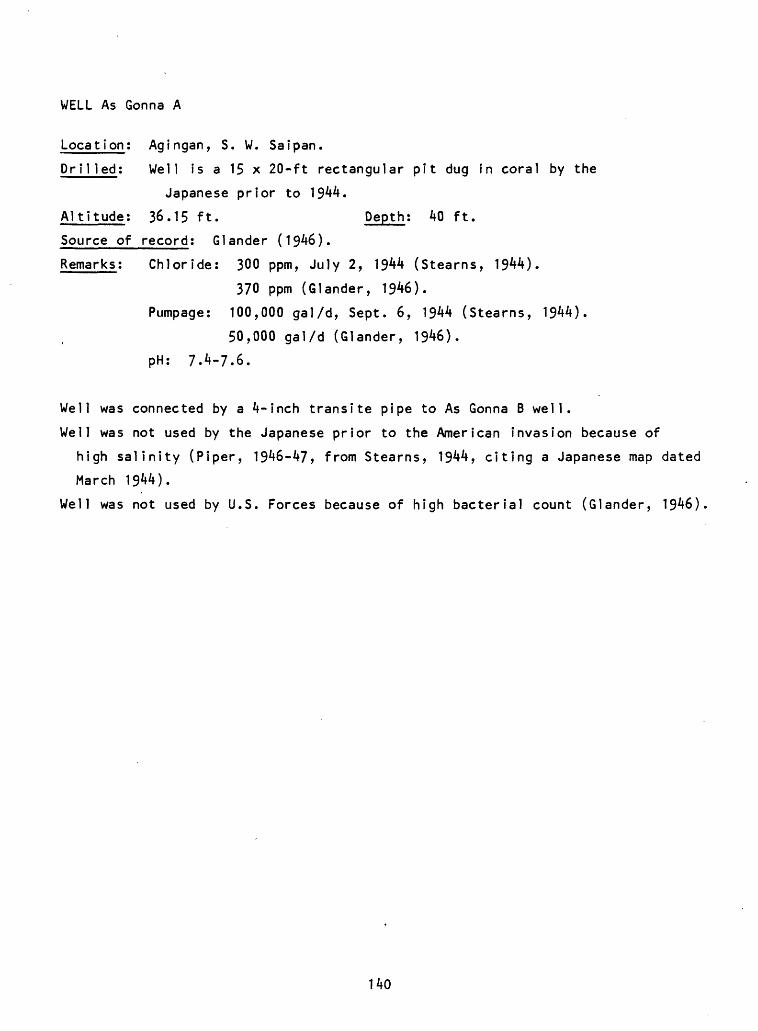
WELL As Gonna A
Loca t i on; Agingan, S. W. Sal pan.
Drilled; Well is a 15 x 20-ft rectangular pit dug in coral by the
Japanese prior to 1944.
Altitude; 36.15 ft. Depth; 40 ft.
Source of record; Glander (1946).
Remarks; Chloride; 300 ppm, July 2, 1944 (Stearns, 1944).
370 ppm (Glander, 1946).
Pumpage; 100,000 gal/d, Sept. 6, 1944 (Stearns, 1944).
50,000 gal/d (Glander, 1946).
pH; 7.4-7.6.
Well was connected by a 4-inch transite pipe to As Gonna B well.
Well was not used by the Japanese prior to the American invasion because of
high salinity (Piper, 1946-47, from Stearns, 1944, citing a Japanese map dated
March 1944).
Well was not used by U.S. Forces because of high bacterial count (Glander, 1946)
140
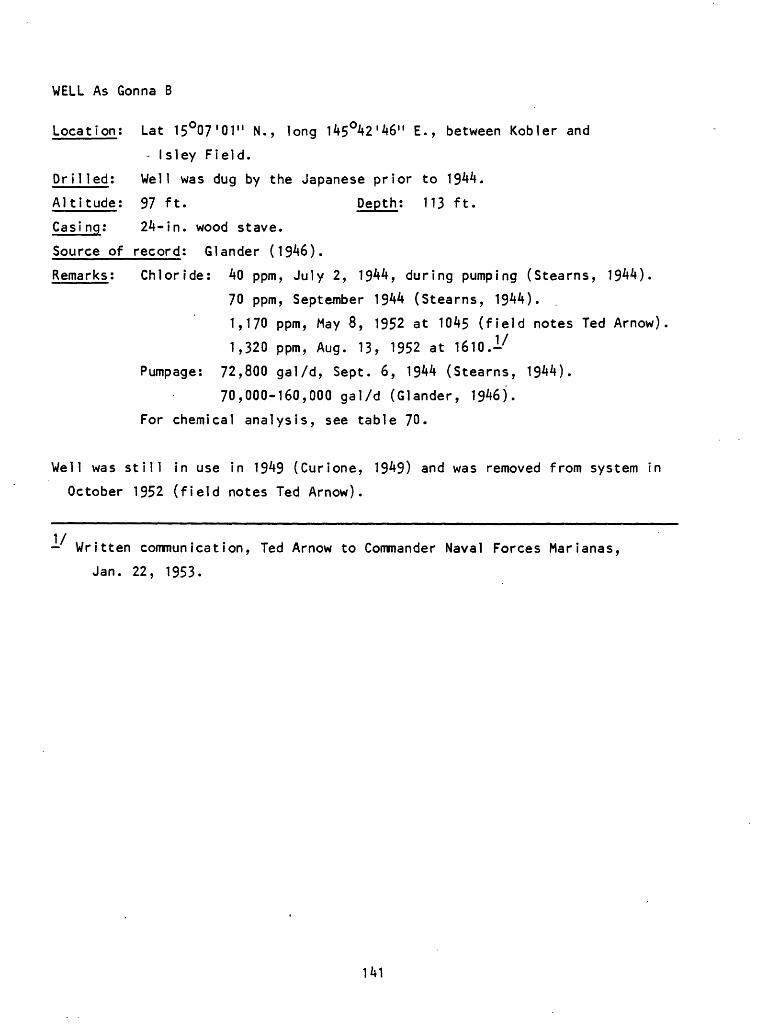
WELL As Gonna B
Location; Lat 15°07'01" N., long 145°42'46" E., between Kobler and
- Is1ey Field.
Dr i lied; Well was dug by the Japanese prior to 1944.
Altitude: 97 ft. Depth: 113 ft.
Casing: 24-in. wood stave.
Source of record; Glander (1946).
Remarks; Chloride: 40 ppm, July 2, 1944, during pumping (Stearns, 1944).
70 ppm, September 1944 (Stearns, 1944).
1,170 ppm, May 8, 1952 at 1045 (field notes Ted Arnow)
1,320 ppm, Aug. 13, 1952 at 1610.-7
Pumpage: 72,800 gal/d, Sept. 6, 1944 (Stearns, 1944).
70,000-160,000 gal/d (Glander, 1946).
For chemical analysis, see table 70.
Well was still in use in 1949 (Curione, 1949) and was removed from system in
October 1952 (field notes Ted Arnow).
Written communication, Ted Arnow to Commander Naval Forces Marianas,
Jan. 22, 1953.
141
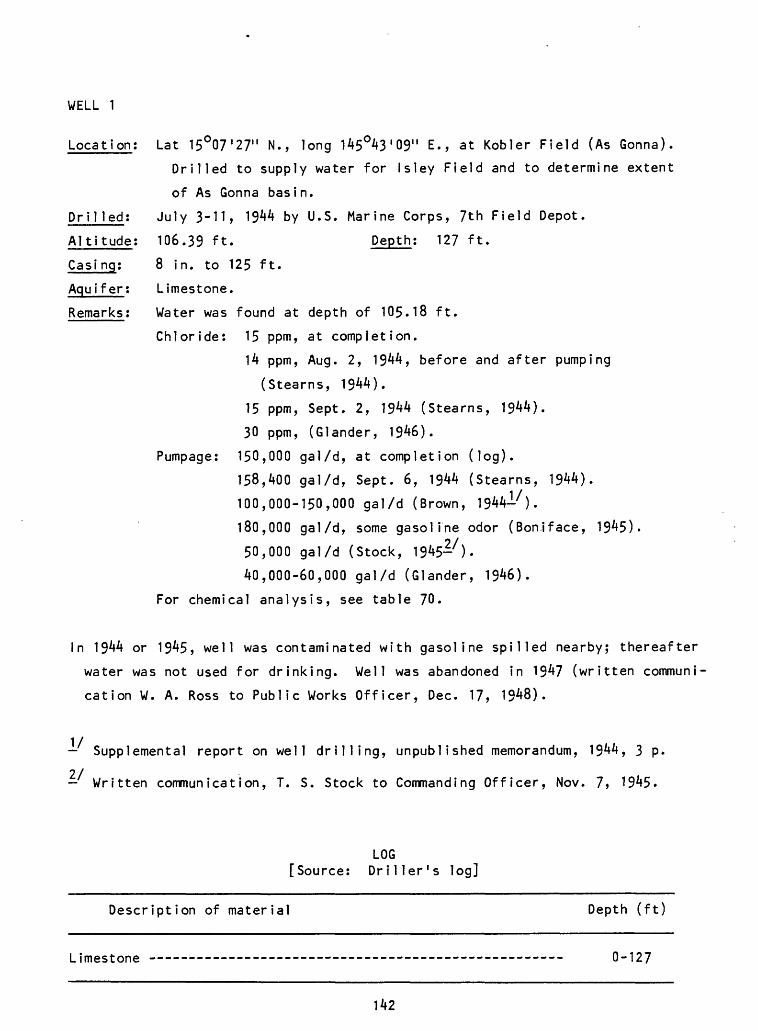
WELL 1
Location! Lat 15°07'27" N., long 145°43'09" E., at Kobler Field (As Gonna).
Drilled to supply water for Isley Field and to determine extent
of As Gonna basin.
Drilled; July 3-11, 1944 by U.S. Marine Corps, 7th Field Depot.
Altitude! 106.39 ft. Depth! 127 ft.
Casing! 8 in. to 125 ft.
Aquifer! Limestone.
Remarks! Water was found at depth of 105.18 ft.
Chloride! 15 ppm, at completion.
14 ppm, Aug. 2, 1944, before and after pumping
(Stearns, 1944).
15 ppm, Sept. 2, 1944 (Stearns, 1944).
30 ppm, (Glander, 1946).
Pumpagei 150,000 gal/d, at completion (log).
158,400 gal/d, Sept. 6, 1944 (Stearns, 1944).
100,000-150,000 gal/d (Brown, 1944-/ ).
180,000 gal/d, some gasoline odor (Boniface, 1945).
50,000 gal/d (Stock, 1945-/ ).
40,000-60,000 gal/d (Glander, 1946).
For chemical analysis, see table 70.
In 1944 or 1945, well was contaminated with gasoline spilled nearby; thereafter
water was not used for drinking. Well was abandoned in 1947 (written communi
cation W. A. Ross to Public Works Officer, Dec. 17, 1948).
Supplemental report on well drilling, unpublished memorandum, 1944, 3 p.2 / Written communication, T. S. Stock to Commanding Officer, Nov. 7, 1945.
LOG [Source! Driller's log]
Description of material Depth (ft)
Limestone - -- --- - - -- 0-127
142
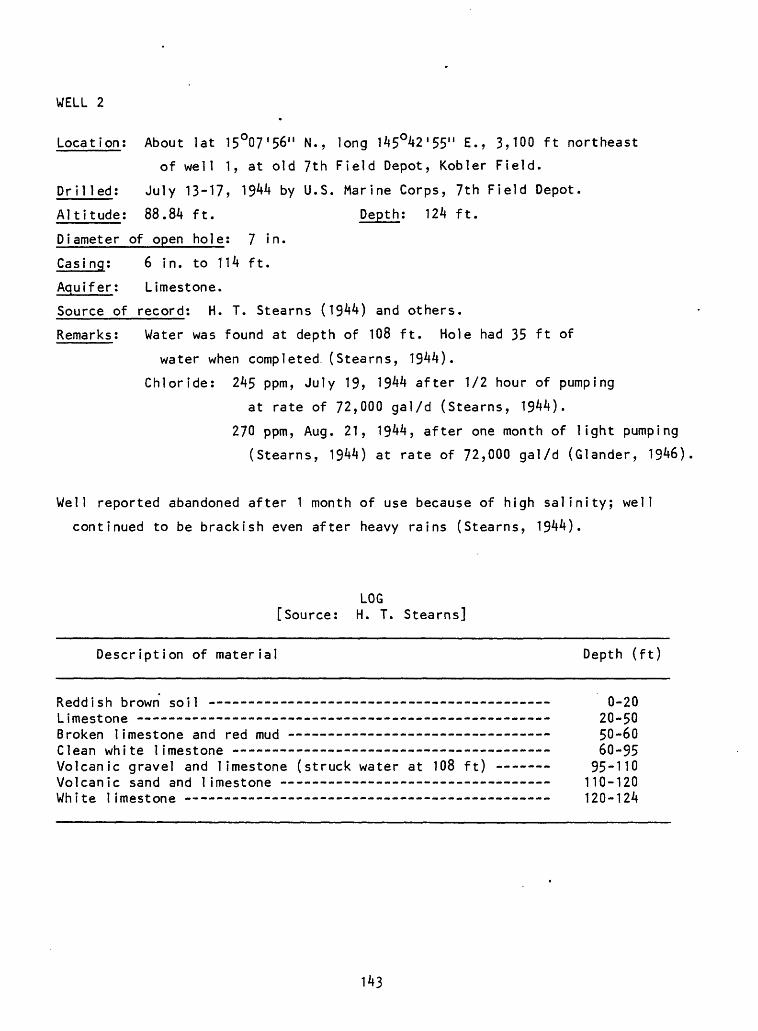
WELL 2
Location; About lat 15°07'56" N., long 145°42'55" E., 3,100 ft northeast
of well 1, at old 7th Field Depot, Kobler Field.
Drilled: July 13-17, 1944 by U.S. Marine Corps, 7th Field Depot.
Altitude; 88.84 ft. Depth; 124 ft.
Diameter of open hole; 7 in.
Casing; 6 in. to 114 ft.
Aquifer; Limestone.
Source of record; H. T. Stearns (1944) and others.
Remarks; Water was found at depth of 108 ft. Hole had 35 ft of
water when completed (Stearns, 1944).
Chloride; 245 ppm, July 19, 1944 after 1/2 hour of pumping
at rate of 72,000 gal/d (Stearns, 1944).
270 ppm, Aug. 21, 1944, after one month of light pumping
(Stearns, 1944) at rate of 72,000 gal/d (Glander, 1946)
Well reported abandoned after 1 month of use because of high salinity; well
continued to be brackish even after heavy rains (Stearns, 1944).
LOG [Source: H. T. Stearns]
Description of material Depth (ft)
Reddish brown soil 0-20Limestone 20-50Broken limestone and red mud - ---- ------------ ---- -- 50-60Clean white limestone -- 60-95Volcanic gravel and limestone (struck water at 108 ft) 95-110Volcanic sand and limestone - 110-120White limestone -- 120-124
143
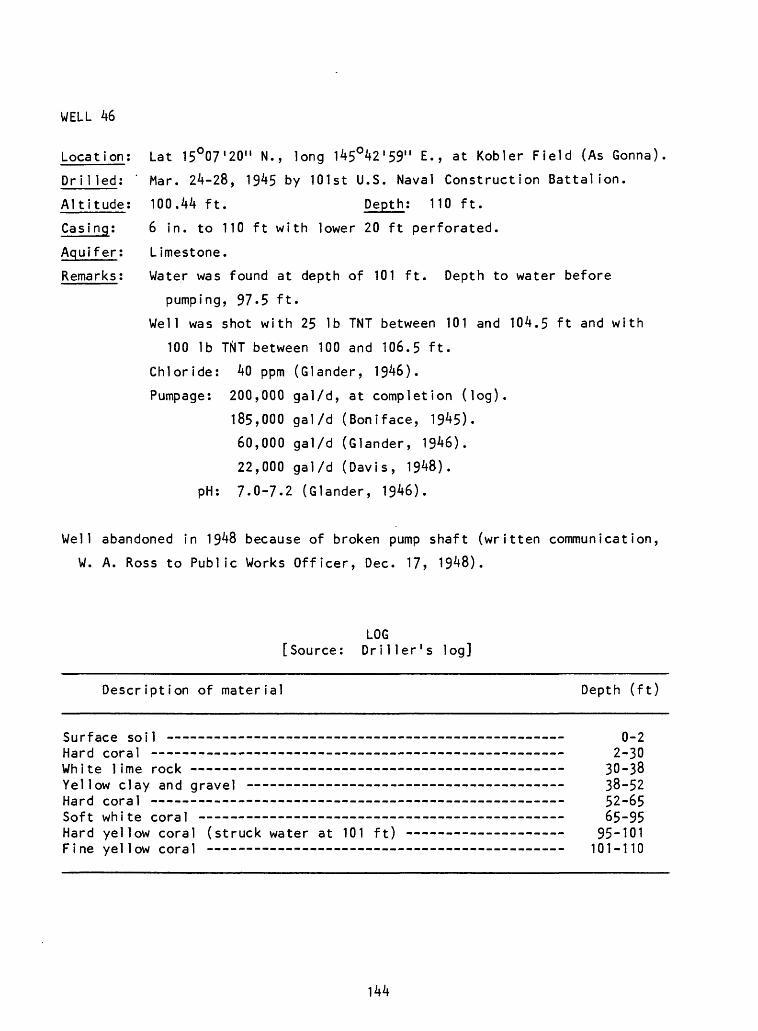
WELL 46
Location; Lat 15O07'20" N., long 145°42'59" E., at Kobler Field (As Gonna)
Drilled; ' Mar. 24-28, 1945 by 101st U.S. Naval Construction Battalion.
Altitude; 100.44 ft. Depth; 110 ft.
Casing; 6 in. to 110 ft with lower 20 ft perforated.
Aquifer; Limestone.
Remarks; Water was found at depth of 101 ft. Depth to water before
pumping, 97-5 ft.
Well was shot with 25 lb TNT between 101 and 104.5 ft and with
100 lb TtiT between 100 and 106.5 ft.
Chloride: 40 ppm (Glander, 1946).
Pumpage; 200,000 gal/d, at completion (log).
185,000 gal/d (Boniface, 1945).
60,000 gal/d (Glander, 1946).
22,000 gal/d (Davis, 1948).
pH: 7.0-7.2 (Glander, 1946).
Well abandoned in 1948 because of broken pump shaft (written communication,
W. A. Ross to Public Works Officer, Dec. 17, 1948).
LOG [Source: Driller's log]
Description of material Depth (ft)
Surface soil 0-2Hard coral 2-30White lime rock 30-38Yellow clay and gravel 38-52Hard coral 52-65Soft white coral 65-95Hard yellow coral (struck water at 101 ft) 95-101Fine yellow coral - 101-110
144
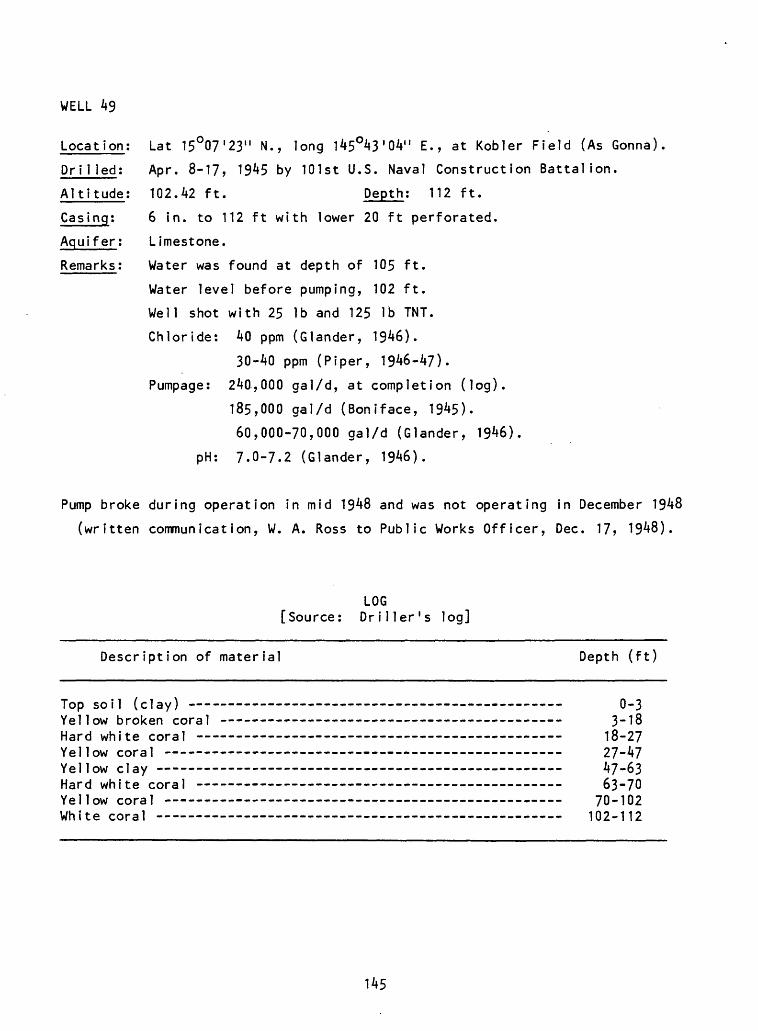
WELL 49
Location;
Drilled:
Altitude;
Casing;
Aquifer;
Remarks;
Lat 15°07'23" N., long 145°43'04" E., at Kobler Field (As Gonna)
Apr. 8-17, 19^5 by 101st U.S. Naval Construction Battalion.
102.42 ft. Depth; 112 ft.
6 in. to 112 ft with lower 20 ft perforated.
Limestone.
Water was found at depth of 105 ft.
Water level before pumping, 102 ft.
Well shot with 25 lb and 125 lb TNT.
Chloride: 40 ppm (Glander, 1946).
30-40 ppm (Piper, 1946-47).
Pumpage: 240,000 gal/d, at completion (log).
185,000 gal/d (Boniface, 1945).
60,000-70,000 gal/d (Glander, 1946).
pH: 7.0-7.2 (Glander, 1946).
Pump broke during operation in mid 1948 and was not operating in December 1948
(written communication, W. A. Ross to Public Works Officer, Dec. 17, 1948).
[SourceLOG Driller's log]
Description of material Depth (ft)
Top soil (clay) - Yellow broken coral Hard white coral Yellow coral - - Yellow clay - Hard white coral Yellow coral - - White coral -
0-3 3-1818-2727-4747-6363-7070-102102-112
145
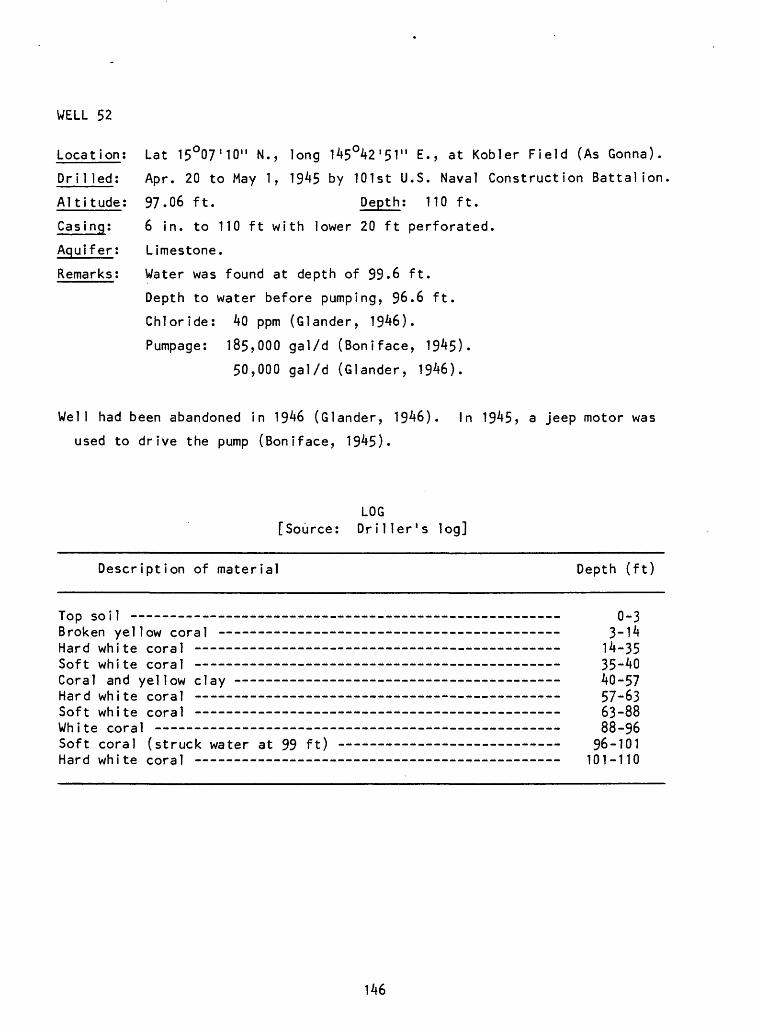
WELL 52
Location;
Drilled;
Altitude;
Casing;
Aquifer;
Remarks;
Lat 15°07'10" N., long 145°42'51" E., at Kobler Field (As Gonna).
Apr. 20 to May 1, 1945 by 101st U.S. Naval Construction Battalion
97.06 ft. Depth; 110 ft.
6 in. to 110 ft with lower 20 ft perforated.
Limestone.
Water was found at depth of 99.6 ft.
Depth to water before pumping, 96.6 ft.
Chloride; 40 ppm (dander, 1946).
Pumpage: 185,000 gal/d (Boniface, 1945).
50,000 gal/d (dander, 1946).
Well had been abandoned in 1946 (Glander, 1946). In 1945, a jeep motor was
used to drive the pump (Boniface, 1945).
[Source;LOG Dri1ler log]
Description of material Depth (ft)
Top soil -- Broken yellow coral Hard white coral Soft white coral - Coral and yellow clay Hard white coral - Soft white coral White coral Soft coral (struck water at 99 Hard white coral -
ft)
0-33-1414-3535-4040-5757-6363-8888-96
96-101101-110
146
WELL 54
Location; Lat 15°07'27" N., long 145°43'04" E., at Kobler Field (As Gonna).
Drilled; Completed Apr. 25, 1945 (Glander, 1946), May 25, 1945 (Boniface, 19*5)
by 2807th U.S. Naval Construction Battalion.
Altitude; 3k ft. Depth; 105 ft.
Casing; 6 in. to 105 ft.
Aquifer; Porous white coral.
Source of record; Glander (1946).
Remarks; Depth to water before pumping, 93 ft.
Chloride; 30 ppm (Glander, 1946).
Pumpage; 60,000-70,000 gal/d (Glander, 1946).
65,000 gal/d, pumped 8 hours per day (Ross, 1948).
pH; 7.0-7.2 (Glander, 1946).
The well was still in use in 1949 (Curione, 1949), but presumably abandoned not
long afterwards.
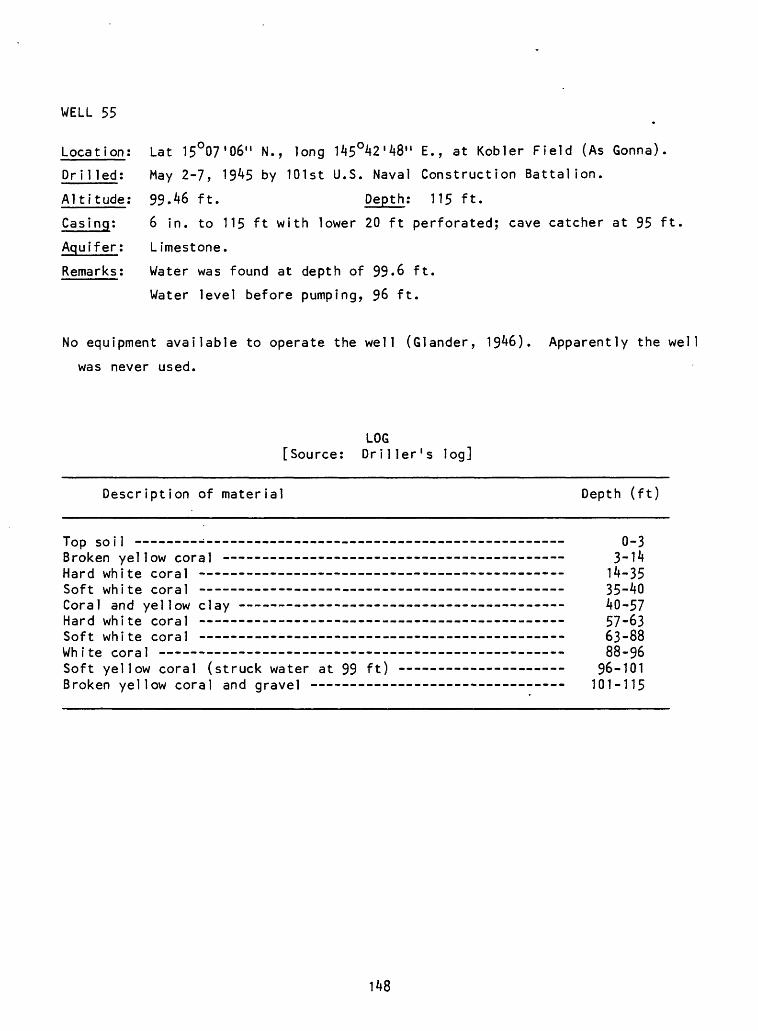
WELL 55*
Locationi Lat 15°07'06" N., long 145°42'48" E., at Kobler Field (As Gonna).
Drilled; May 2-7, 1945 by 101st U.S. Naval Construction Battalion.
Altitude; 99.46 ft. Depth; 115 ft.
Casing; 6 in. to 115 ft with lower 20 ft perforated; cave catcher at 95 ft.
Aquifer; Limestone.
Remarks; Water was found at depth of 99-6 ft.
Water level before pumping, 96 ft.
No equipment available to operate the well (dander, 1946). Apparently the well
was never used.
LOG [Source: Driller's log]
Description of material Depth (ft)
Top soil > 0-3Broken yellow coral 3-14Hard white coral 14-35Soft white coral 35-40Coral and yellow clay 40-57Hard white coral -- 57-63Soft white coral 63-88White coral 88-96Soft yellow coral (struck water at 99 ft) 96-101Broken yellow coral and gravel - - - ------ - ___- 101-115
148
WELL 56
Location; Lat 15°07'29" N., long 145°43'08" £., at Kobler Field (As Gonna).
Dri1 led; Completed May 3, 1945 by 2807th U.S. Naval Construction Battalion.
Altitude; 101.1 ft Depth; 110 ft.
Casing; 6 in. to 110 ft.
Aquifer; Porous coral.
Source of record; Glander (1946).
Remarks; Chloride; 30 ppm.
Pumpage; 60,000-70,000 gal/d.
Well was abandoned in 1947 (written communication, W. A. Ross to Public Works
Officer, Dec. 17, 1948).
WELL 57
Location; Lat 15°07'20" N., long 145°43'05" E., at Kobler Field (As Gonna).
Dri1 led; Completed May 10, 1945 by 2807th U.S. Naval Construction Battalion
Altitude; 128.8 ft. Depth; 135 ft.
Casing; 6 in. to 135 ft.
Aquifer; Porous coral.
Source of record; Glander (1946).
Remarks; Well not used at first as no equipment was available.
Chloride; 2,600 ppm, May 8, 1952 at 1000; pumped 2k hours per
day at rate of 350-400 gal/min (field notes Ted Arnow).
3,080 ppm, Aug. 13, 1952 at 1610 (Arnow, 1952).
For chemical analysis, see table 70.
Well was last used May 8, 1952 and was abandoned at end of 1952 (written
communication, Ted Arnow to Commander Naval Forces Marianas, Jan. 22, 1953)
149
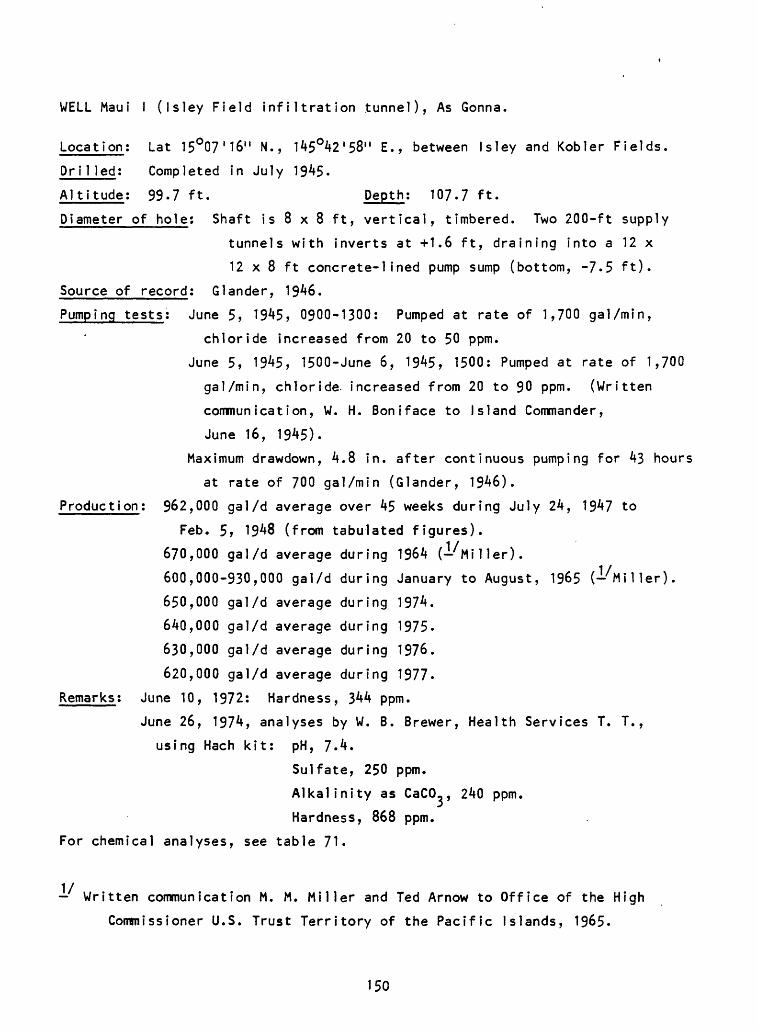
WELL Maul I (Isley Field infiltration tunnel), As Gonna.
Location: Lat 15°07'16" N., 145°42'58" E., between Isley and Kobler Fields.
Dr?1 led; Completed in July 1945.
Altitude; 99-7 ft. Depth; 107-7 ft.
Diameter of hole; Shaft is 8 x 8 ft, vertical, timbered. Two 200-ft supply
tunnels with inverts at +1.6 ft, draining into a 12 x
12 x 8 ft concrete-1ined pump sump (bottom, -7-5 ft).
Source of record; Glander, 1946.
Pumping tests; June 5, 1945, 0900-1300: Pumped at rate of 1,700 gal/min,
chloride increased from 20 to 50 ppm.
June 5, 1945, 1500-June 6, 1945, 1500: Pumped at rate of 1,700
gal/min, chloride increased from 20 to 90 ppm. (Written
communication, W. H. Boniface to Island Commander,
June 16, 19^5).
Maximum drawdown, 4.8 in. after continuous pumping for 43 hours
at rate of 700 gal/min (Glander, 1946).
Production; 962,000 gal/d average over 45 weeks during July 24, 1947 to
Feb. 5, 1948 (from tabulated figures).
670,000 gal/d average during 1964 (-^Miller).
600,000-930,000 gal/d during January to August, 1965 (-Miller).
650,000 gal/d average during 1974.
640,000 gal/d average during 1975-
630,000 gal/d average during 1976.
620,000 gal/d average during 1977-
Remarks; June 10, 1972: Hardness, 344 ppm.
June 26, 1974, analyses by W. B. Brewer, Health Services T. T.,
using Hach kit: pH, 7.4.
Sulfate, 250 ppm.
Alkalinity as CaCO., 240 ppm.
Hardness, 868 ppm.
For chemical analyses, see table 71.
Written communication M. M. Miller and Ted Arnow to Office of the High
Commissioner U.S. Trust Territory of the Pacific Islands, 1965.
150
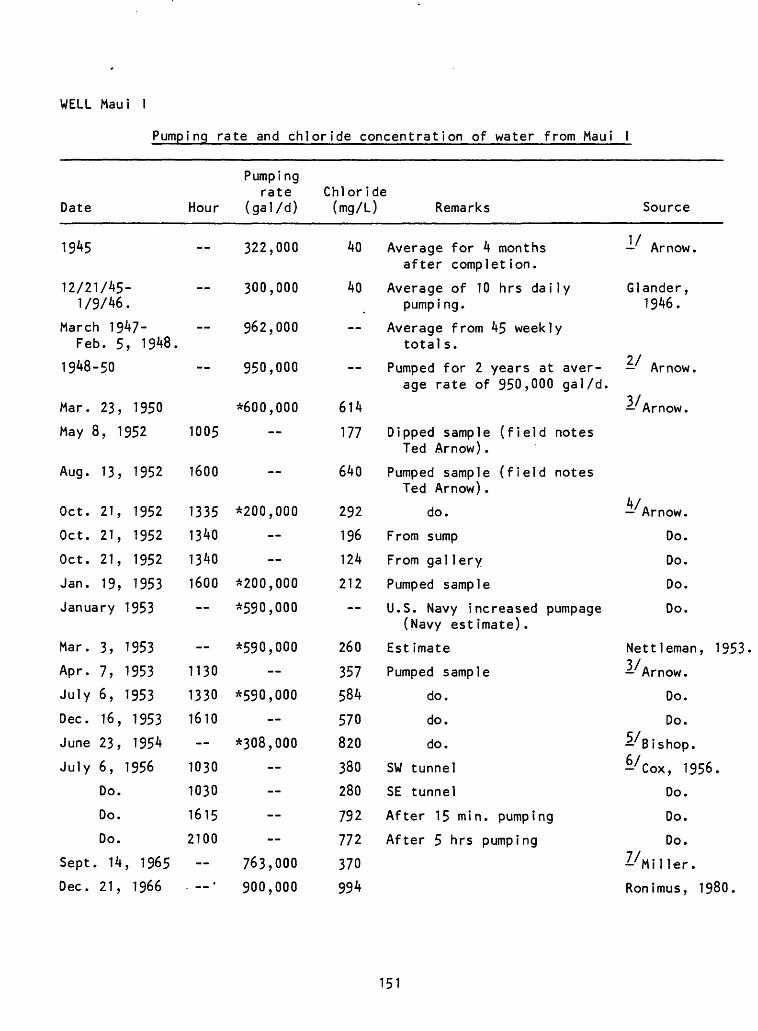
WELL Maul I
Pumping rate and chloride concentration of water from Maui I
Date
1945
12/21/45-1/9/46.
March 1947-Feb. 5, 1948.
1948-50
Mar. 23, 1950
May 8, 1952
Aug. 13, 1952
Oct. 21, 1952
Oct. 21, 1952
Oct. 21, 1952
Jan. 19, 1953
January 1953
Mar. 3, 1953
Apr. 7, 1953
July 6, 1953
Dec. 16, 1953
June 23, 1954
July 6, 1956
Do.
Do.
Do.
Sept. 14, 1965
Dec. 21, 1966
Hour
__
1005
1600
1335
1340
1340
1600
1130
1330
1610
1030
1030
1615
2100
- '
Pumping rate
(gal/d)
322,000
300,000
962,000
950,000
*600,000
*200,000
*200,000
*590,000
*590,000
*590,000
*308,000
763,000
900,000
Chloride (mg/L) Remarks
40
40
614
177
640
292
196
124
212
260
357
584
570
820
380
280
792
772
370
994
Average for 4 monthsafter completion.
Average of 10 hrs dailypumpi ng.
Average from 45 weeklytotals.
Pumped for 2 years at average rate of 950,000 gal/d.
Dipped sample (field notesTed Arnow) .
Pumped sample (field notesTed Arnow) .
do.
From sump
From gal lery
Pumped sample
U.S. Navy increased pumpage(Navy estimate).
Est imate
Pumped sample
do.
do.
do.
SW tunnel
SE tunnel
After 15 min. pumping
After 5 hrs pumping
Source
Arnow.
Glander ,1946.
2/ Arnow.
Arnow.
4/ Arnow.
Do.
Do.
Do.
Do.
Nettleman, 1953
Arnow.
Do.
Do.
- Bishop.
^Cox, 1956.
Do.
Do.
Do.
-filler.
Ronimus, 1980.
151
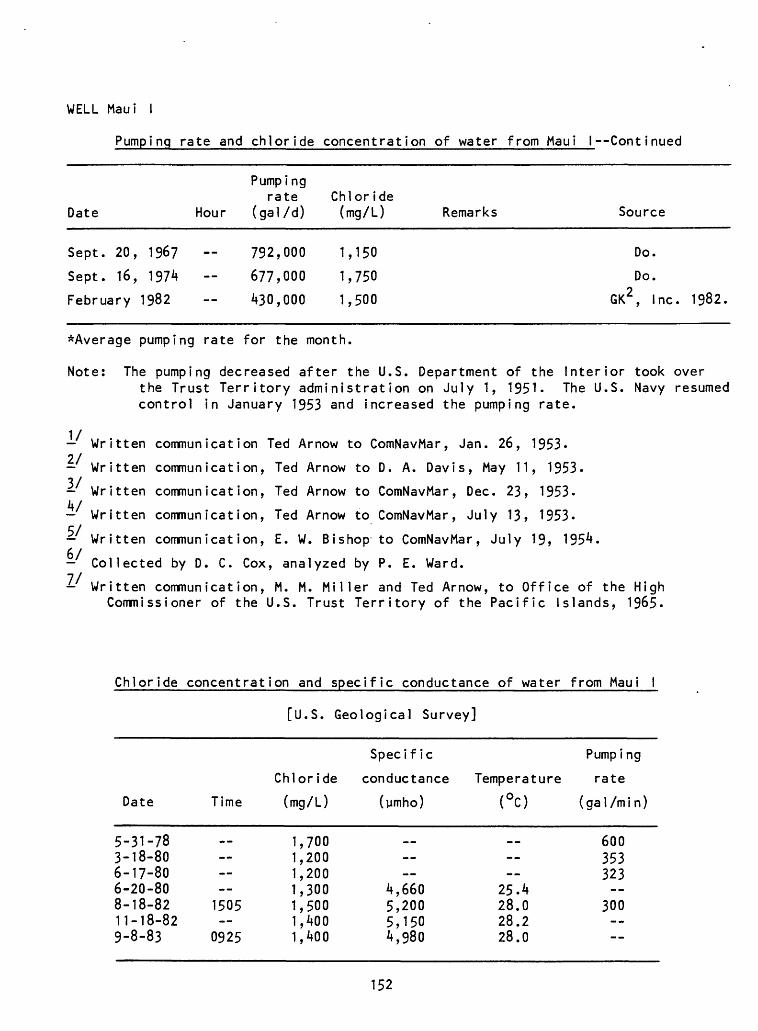
WELL Maui I
Pumping rate and chloride concentration of water from Maui l--Continued
Date Hour
Sept. 20, 1967
Sept. 16, 1974
February 1982
Pumpingrate
(gal/d)
792,000
677,000
430,000
Chloride(mg/L) Remarks
1,150
1,750
1,500
Source
Do.
Do.
GK2 , Inc. 1982.
^Average pumping rate for the month.
Note: The pumping decreased after the U.S. Department of the Interior took overthe Trust Territory administration on July 1, 1951. The U.S. Navy resumed control in January 1953 and increased the pumping rate.
Written communication Ted Arnow to ComNavMar, Jan. 26, 1953*2/ Written communication, Ted Arnow to D. A. Davis, May 11, 1953.3/ Written communication, Ted Arnow to ComNavMar, Dec. 23, 1953-4/ Written communication, Ted Arnow to ComNavMar, July 13, 1953.
Written communication, E. W. Bishop to ComNavMar, July 19, 1954.
Collected by D. C. Cox, analyzed by P. E. Ward.
Written communication, M. M. Miller and Ted Arnow, to Office of the High Commissioner of the U.S. Trust Territory of the Pacific Islands, 1965.
Chloride concentration and specific conductance of water from Maui
[U.S. Geological Survey]
Date
5-31-78 3-18-80 6-17-80 6-20-80 8-18-82 11-18-82 9-8-83
Chloride
Time (mg/L)
1,700 1,200 1,200 1,300
1505 1,500 1,400
0925 1,400
Specific
conductance
(ymho)
4,660 5,200 5,150 4,980
Temperature (°0
25.4 28.0 28.2 28.0
Pumping
rate
(gal/min)
600 353 323
300
152
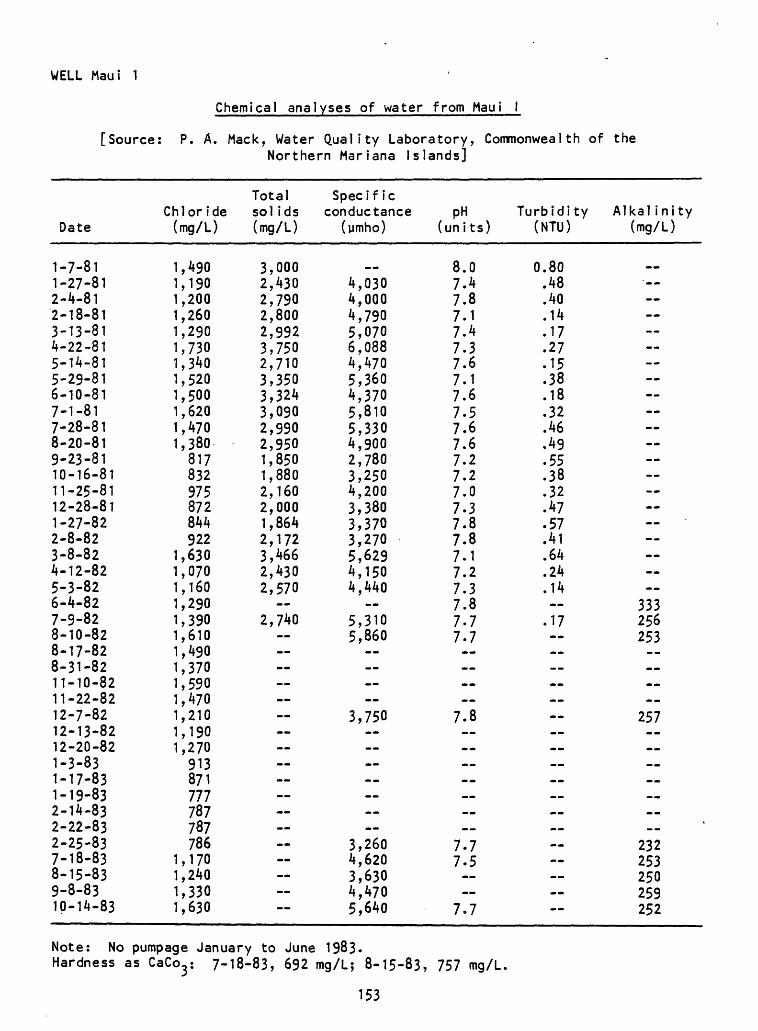
WELL Maui 1
Chemical analyses of water from Maul I
[Source: P. A. Mack, Water Quality Laboratory, Commonwealth of theNorthern Mariana Islands]
Date
1-7-811-27-812-4-812-18-813-13-814-22-815-14-815-29-816-10-817-1-817-28-818-20-819-23-8110-16-8111-25-8112-28-811-27-822-8-823-8-824-12-825-3-826-4-827-9-828-10-828-17-828-31-8211-10-8211-22-8212-7-8212-13-8212-20-821-3-831-17-831-19-832-14-832-22-832-25-837-18-838-15-839-8-8310-14-83
Chloride (mg/L)
1,4901,1901,2001,2601,2901,7301,3401,5201,5001,6201,4701,380817832975872844922
1,6301,0701,1601,2901,3901,6101,4901,3701,5901,4701,2101,1901,270913871111787787786
1,1701,2401,3301,630
Total sol ids (mg/L)
3,0002,4302,7902,8002,9923,7502,7103,3503,3243,0902,9902,9501,8501,8802,1602,0001,8642,1723,4662,4302,570
--2,740 ---- .. --
Specific conductance
(ymho)
4,0304,0004,7905,0706,0884,4705,3604,3705,8105,3304,9002,7803,2504,2003,3803,3703,2705,6294,1504,440
--5,3105,860
-- ----
3,750 .. ..--..--
3,2604,6203,6304,4705,640
PH (units)
8.07.47.87.17.47.37.67.17.67.57.67.67.27.27.07.37.87.87.17.27.37.87.77.7
------
7.8--..--......._
7.77.5
7.7
Turbidi ty (NTU)
0.80.48.40.14.17.27.15.38.18.32.46.49.55.38.32.47.57.41.64.24.14--.17
-- --..--_-........_«..._ .._ ..
Alkal i ni ty (mg/L)
~ --
333256253
------
257--......_..._.
232253250259252
Note: No pumpage January to June 1983.Hardness as CaCo^ 7-18-83, 692 mg/L; 8-15-83, 757 mg/L,
153
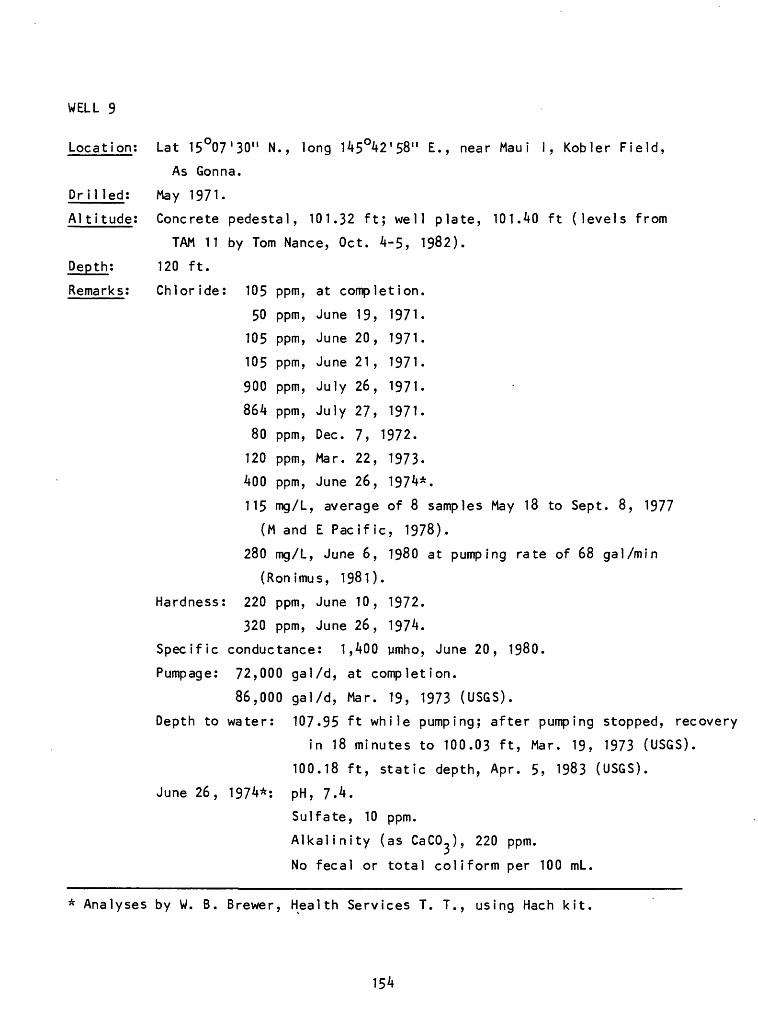
WELL 9
Location:
Drilled;
Al titude;
Depth:
Remarks:
Lat 15 07'30" N., long 145°42'58" E., near Maui I, Kobler Field,
As Gonna.
May 1971.
Concrete pedestal, 101.32 ft; well plate, 101.40 ft (levels from
TAM 11 by Tom Nance, Oct. 4-5, 1982).
120 ft.
Chloride: 105 ppm, at completion.
50 ppm, June 19, 1971.
105 ppm, June 20, 1971.
105 ppm, June 21, 1971.
900 ppm, July 26, 1971.
864 ppm, July 27, 1971.
80 ppm, Dec. 7, 1972.
120 ppm, Mar. 22, 1973.
400 ppm, June 26, 1974*.
115 mg/L, average of 8 samples May 18 to Sept. 8, 1977
(M and E Pacific, 1978).
280 mg/L, June 6, 1980 at pumping rate of 68 gal/min
(Ronimus, 1981).
Hardness: 220 ppm, June 10, 1972.
320 ppm, June 26, 1974.
Specific conductance: 1,400 ymho, June 20, 1980.
Pumpage: 72,000 gal/d, at completion.
86,000 gal/d, Mar. 19, 1973 (USGS).
Depth to water: 107.95 ft while pumping; after pumping stopped, recovery
in 18 minutes to 100.03 ft, Mar. 19, 1973 (USGS).
100.18 ft, static depth, Apr. 5, 1983 (USGS).
June 26, 1974*: pH, 7.4.
Sulfate, 10 ppm.
Alkalinity (as CaCO,), 220 ppm.
No fecal or total coliform per 100 mL.
* Analyses by W. B. Brewer, Health Services T. T., using Hach kit.
154
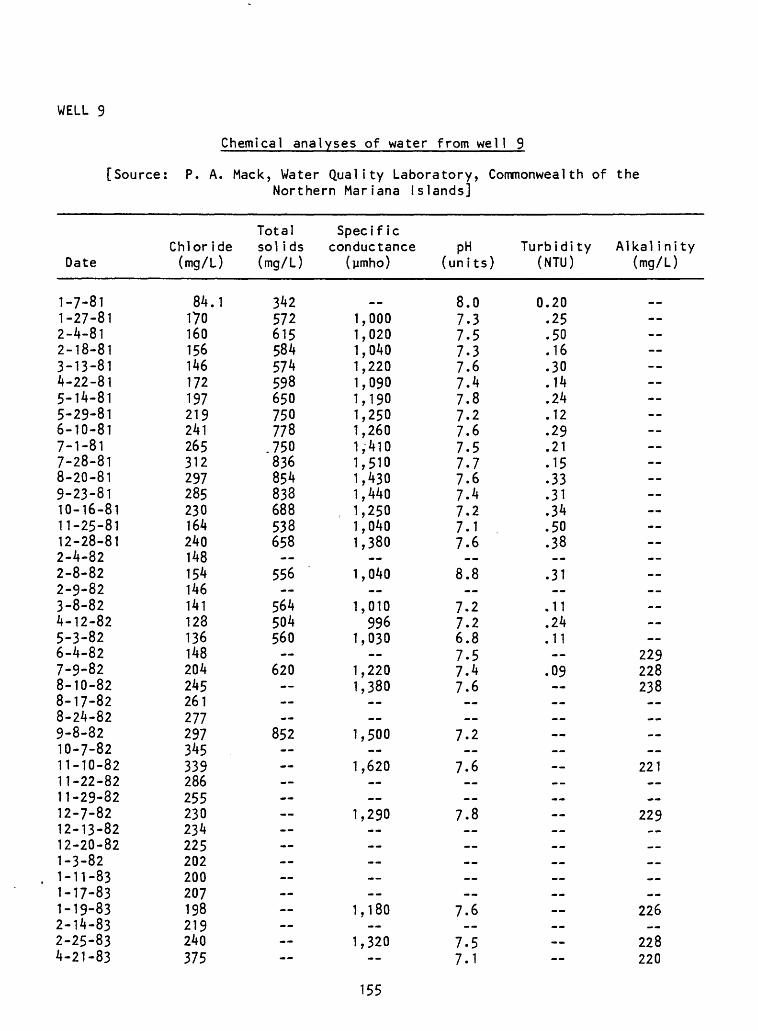
WELL 9
Chemical analyses of water from well 9
[Source: P. A. Mack, Water Quality Laboratory, Commonwealth of theNorthern Mariana Islands]
Date
1-7-811-27-812-4-812-18-813-13-814-22-815-14-815-29-816-10-817-1-817-28-818-20-819-23-8110-16-8111-25-8112-28-812-4-822-8-822-9-823-8-824-12-825-3-826-4-827-9-828-10-828-17-828-24-829-8-8210-7-8211-10-8211-22-8211-29-8212-7-8212-13-8212-20-821-3-821-11-831-17-831-19-832-14-832-25-834-21-83
Chloride (mg/L)
84.1170160156146172197219241265312297285230164240148154146141128136148204245261277297345339286255230234225202200207198219240375
Total sol ids (mg/L)
342572615584574598650750778.750836854838688538658
556
564504560
620
852 . --
Specific conductance
(ymho)
..1,0001,0201,0401,2201,0901,1901,2501,2601,4101,5101,4301,4401,2501,0401,380
--1,040
1,010996
1,030
1,2201,380 --
1,500._
1,620_---
1,290 ____--
1,180
1,320
pH (units)
8.07.37.57.37.67.47.87.27.67.57.77.67.47.27.17.6__
8.8
7.27.26.87.57.47.6--_-
7.2--
7.6__--
7.8 --____-_
7.6
7.57.1
Turbidity (NTU)
0.20.25.50.16.30.14.24.12.29.21.15.33.31.34.50.38__
.31
.11
.24
.11 .09---------- ____ --____---_--
Alkal ini ty (mg/L)
.. -- -- -_--------
229228238-_-__--_
221----
229_-__ _---_
226__
228220
155
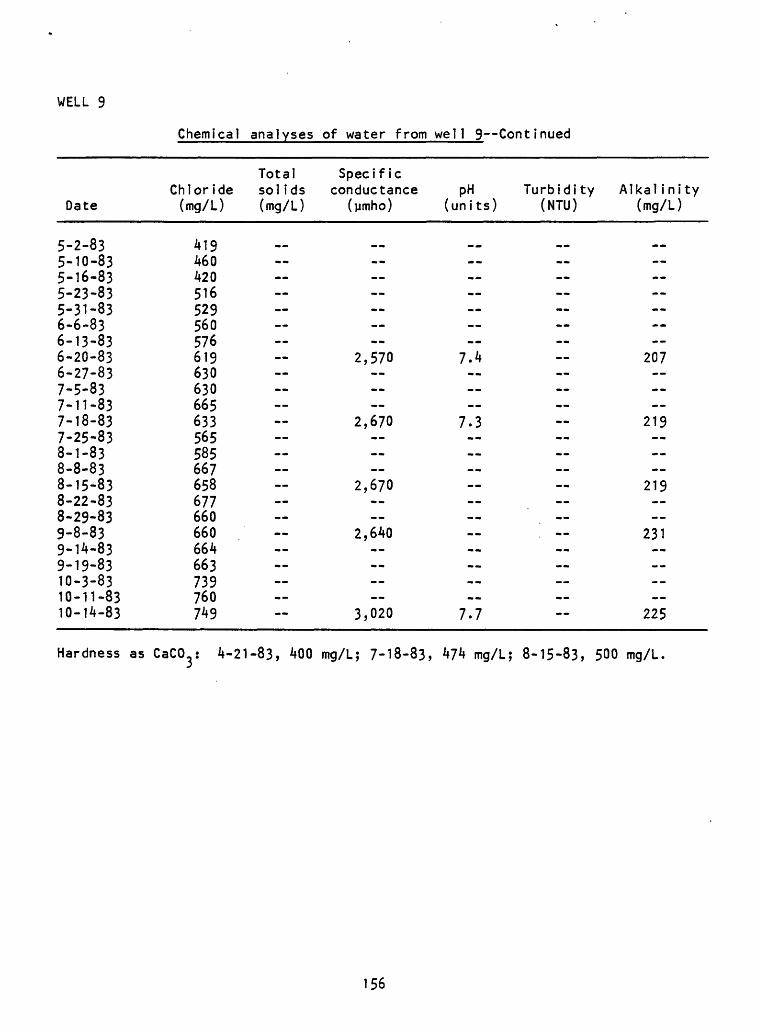
WELL 9
Chemical analyses of water from well 9 Cont i nued
Date
5-2-835-10-835-16-835-23-835-31-836-6-836-13-836-20-836-27-837-5-837-11-837-18-837-25-838-1-838-8-838-15-838-22-838-29-839-8-839-14-839-19-8310-3-8310-11-8310-14-83
Chloride (mg/L)
419460420516529560576619630630665633565585667658677660660664663739760749
Total sol ids (mg/L)
..-- -- -- ------
Specific conductance
(ymho)
------------
2,570 ----
2,670--
2,670
----
2,640 --
3,020
pH (units)
------------
7.4--
7.3----
---- --------
7.7
Turbidity Alkalinity (NTU) (mg/L)
..
__
207 .._-
219..____
219___-
'. - 231..
__
225
Hardness as CaCO : 4-21-83, 400 mg/L; 7-18-83, 474 mg/L; 8-15-83, 500 mg/L.
156
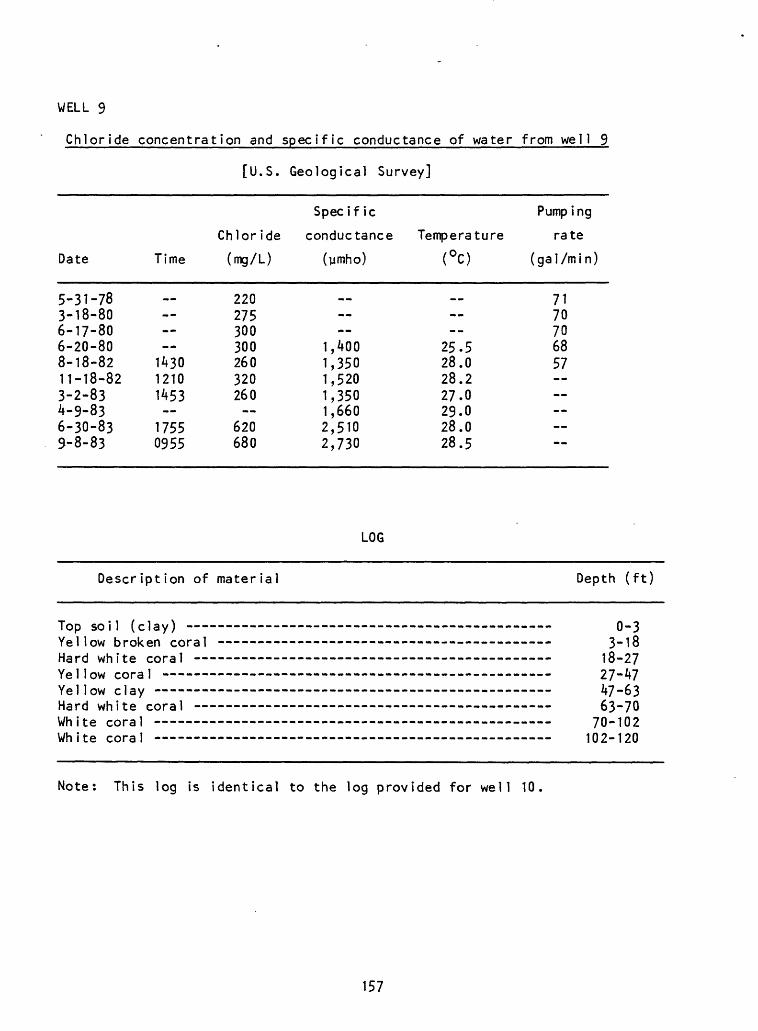
WELL 9
Chloride concentration and specific conductance of water from well 9
[U.S. Geological Survey]
Date
5-31-783-18-806-17-806-20-808-18-8211-18-823-2-834-9-836-30-839-8-83
Time
_«.
143012101453
17550955
Chloride
(mg/L)
220275300300260320260
620680
Spec if ic
conductance
(ymho)
__
1,4001,3501,5201,3501,6602,5102,730
Pump i ng
Temperature rate(°c)
__ --
25.528.028.227.029.028.028.5
(gal/min)
7170706857 MM
LOG
Description of material Depth (ft)
Top soil (clay) Yellow broken coral Hard white coral Ye 1 low coral Yellow clay - Hard white coral White coral White coral -
0-33-1818-2727-^747-6363-70
70-102102-120
Note: This log is identical to the log provided for well 10
157
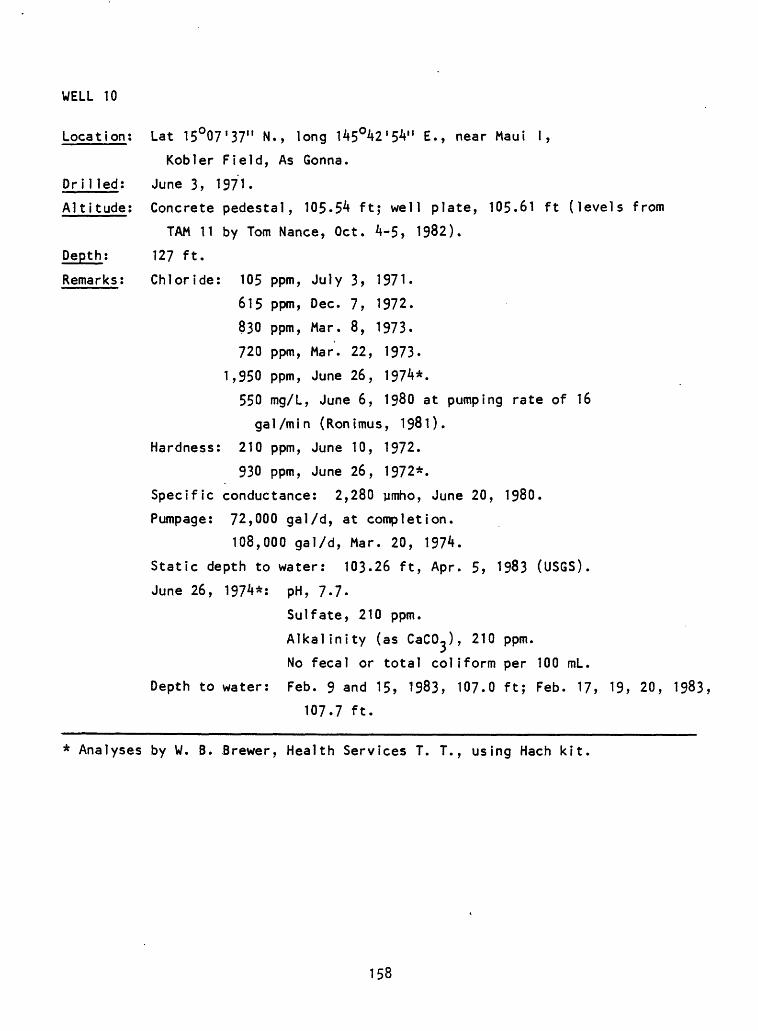
WELL 10
Location; Lat 15O07'37" N., long 1A5°^2'5V' E., near Maui I,
Kobler Field, As Gonna.
Drilled; June 3, 1971.
Altitude; Concrete pedestal, 105.54 ft; well plate, 105.61 ft (levels from
TAM 11 by Tom Nance, Oct. 4-5, 1982).
Depth; 127 ft.
Remarks; Chloride; 105 ppm, July 3, 1971.
615 ppm, Dec. 7, 1972.
830 ppm, Mar. 8, 1973.
720 ppm, Mar. 22, 1973.
1,950 ppm, June 26, 1974*.
550 mg/L, June 6, 1980 at pumping rate of 16
gal/min (Ronimus, 1981).
Hardness; 210 ppm, June 10, 1972.
930 ppm, June 26, 1972*.
Specific conductance: 2,280 ymho, June 20, 1980.
Pumpage: 72,000 gal/d, at completion.
108,000 gal/d, Mar. 20, 1974.
Static depth to water: 103.26 ft, Apr. 5, 1983 (USGS).
June 26, 1974*: pH, 7.7.
Sulfate, 210 ppm.
Alkalinity (as CaCO-), 210 ppm.
No fecal or total coliform per 100 mL.
Depth to water: Feb. 9 and 15, 1983, 107.0 ft; Feb. 17, 19, 20, 1983,
107.7 ft.
* Analyses by W. B. Brewer, Health Services T. T., using Hach kit.
158
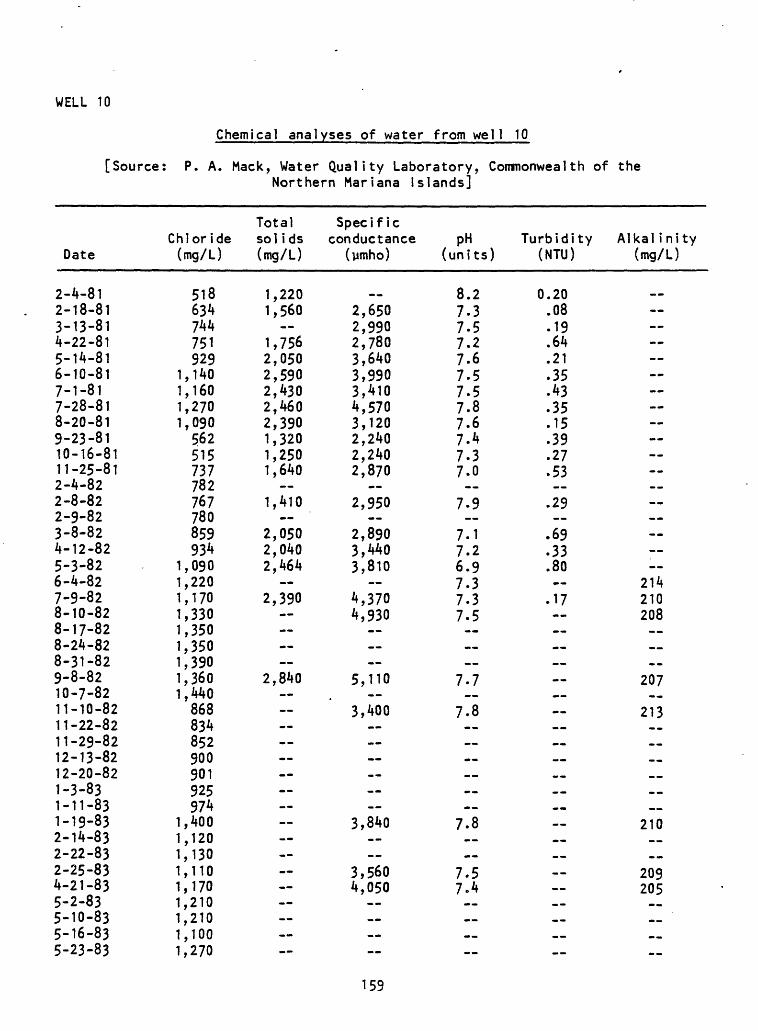
WELL 10
[Source
Chemical analyses of water from well 10
P. A. Mack, Water Quality Laboratory, Commonwealth of the Northern Mariana Islands]
Date
2-4-812-18-813-13-814-22-815-14-816-10-817-1-817-28-818-20-819-23-8110-16-8111-25-812-4-822-8-822-9-823-8-824-12-825-3-826-4-827-9-828-10-828-17-828-24-828-31-829-8-8210-7-8211-10-8211-22-8211-29-8212-13-8212-20-821-3-831-11-831-19-832-14-832-22-832-25-834-21-835-2-835-10-835-16-835-23-83
Chloride (mg/L)
518634744751929
1,1401,1601,2701,090562515737782767780859934
1,0901,2201,1701,3301,3501,3501,3901,3601,440868834852900901925974
1,4001,1201,1301,1101,1701,2101,2101,1001,270
Total solids (mg/L)
1,2201,560
1,7562,0502,5902,4302,4602,3901,3201,2501,640
1,410
2,0502,0402,464
2,390
2,840 __--_--- _-
Specific conductance
(ymho)
2,6502,9902,7803,6403,9903,4104,5703,1202,2402,2402,870
2,950
2,8903,4403,810
4,3704,930
5,110
3,400
__ ______
3,840
3,5604,050
__--
pH (units)
8.27.37.57.27.67.57.57.87.67.47.37.0
7.9
7.17.26.97.37.37.5
--__
7.7
7.8
__________
7.8
__7.57.4
«_-_
Turbidity (NTU)
0.20.08.19.64.21.35.43.35.15.39.27.53
.29
.69
.33
.80 .17
--_-_«___ ___«_ _______ ________________
Alkal ini ty (mg/L)
_ -___-_--
214210208-_____
207__
213
____ ___
210
__209205
____
159
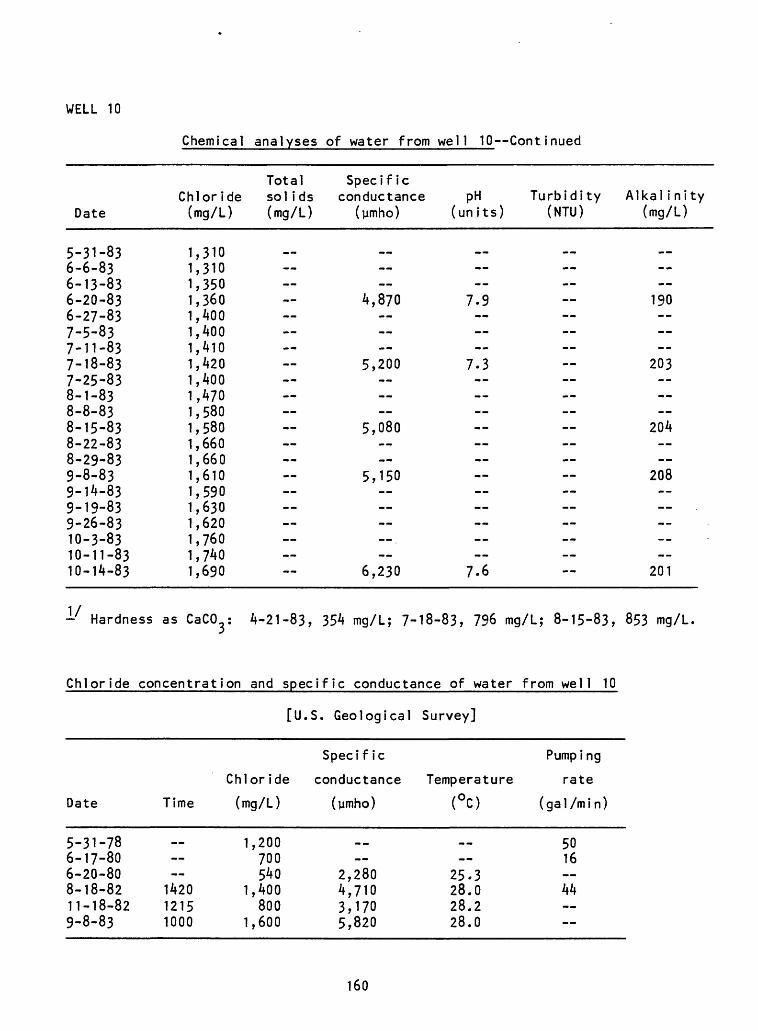
WELL 10
Date
5-31-836-6-836-13-836-20-836-27-837-5-837-11-837-18-837-25-838-1-838-8-838-15-838-22-838-29-839-8-839-14-839-19-839-26-8310-3-8310-11-8310-14-83
Chloride (mg/L)
1,3101,3101,3501,3601,4001,4001,4101,4201,4001,4701,5801,5801,6601,6601,6101,5901,6301,6201,7601,7401,690
Total Specific solids conductance (mg/L) (pmho)
4,870
5,200
5,080
5,150
6,230
pH (units)
^
7.9
7.3
7.6
Turbidity Alkal ini ty (NTU) (mg/L)
__ __
190
203
204
208
201
-1 Hardness as CaCCy 4-21-83, 354 mg/L; 7-18-83, 796 mg/L; 8-15-83, 853 mg/L.
Chloride concentration and specific conductance of water from well 10
[U.S. Geological Survey]
Date
5-31-786-17-806-20-808-18-8211-18-829-8-83
Time
_-
142012151000
Chloride
(mg/L)
1,200700540
1,400800
1,600
Specif ic
conductance
(ymho)
__
2,2804,7103,1705,820
Pumping
Temperature rate(°C)
__
25.328.028.228.0
(gal/min)
5016 44
160
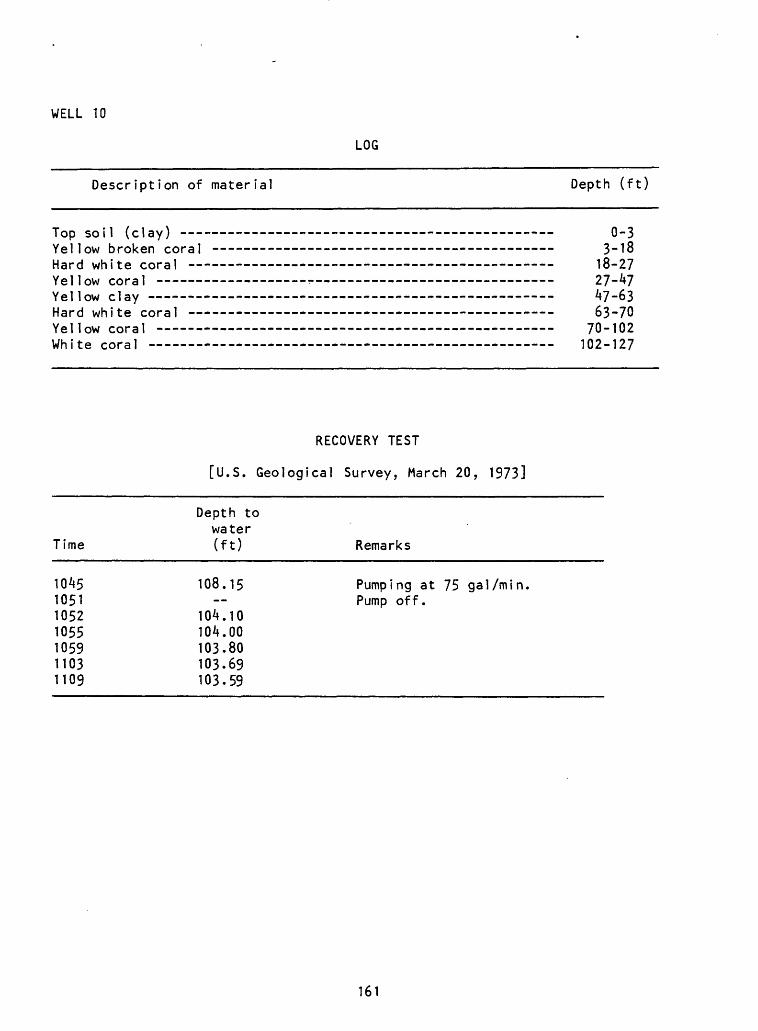
WELL 10
LOG
Description of material Depth (ft)
Top soil (clay) 0-3Yellow broken coral - --- - 3-18Hard white coral 18-27Yellow coral - 27-^7Yellow clay 47-63Hard white coral 63-70Yellow coral 70-102White coral 102-127
RECOVERY TEST
[U.S. Geological Survey, March 20, 1973]
Depth towater
Time (ft) Remarks
1045 108.15 Pumping at 75 gal/min.1051 Pump off.1052 104.101055 104.001059 103.801103 103.691109 103.59
161
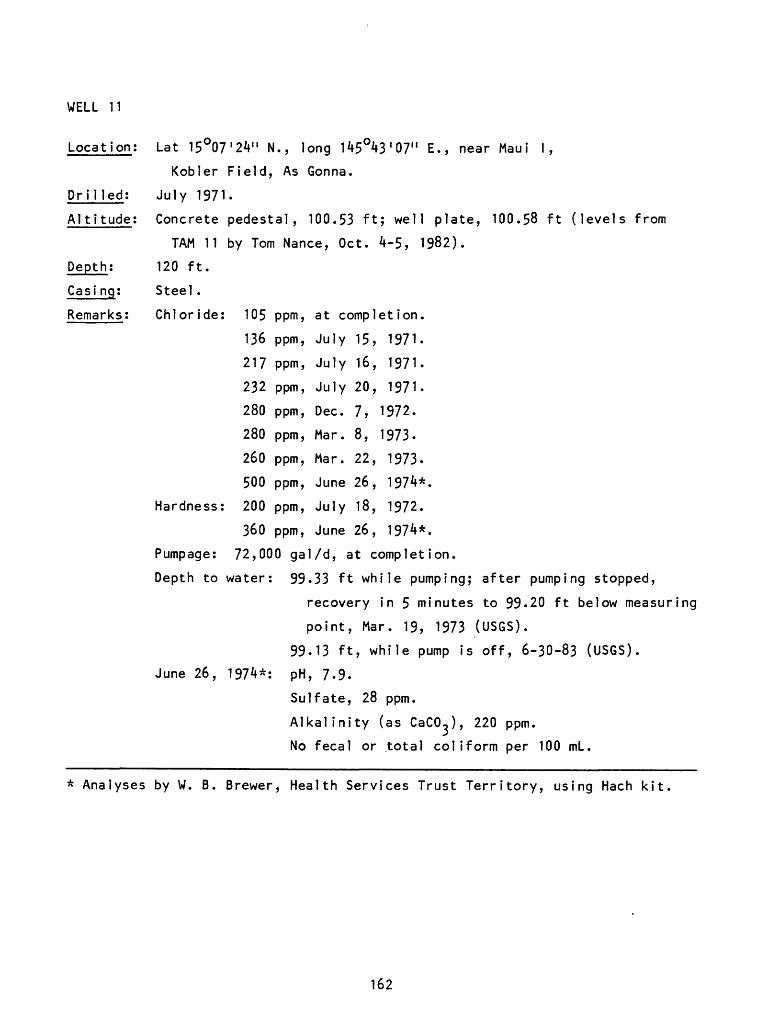
WELL 11
Location;
Drilled:
Al titude;
Lat 15°07'2V' N., long 145°43'07" E., near Maui I,
Kobler Field, As Gonna.
July 1971.
Concrete pedestal, 100.53 ft; well plate, 100.58 ft (levels from
TAM 11 by Tom Nance, Oct. 4-5, 1982).
120 ft.
Steel.
Chloride: 105 ppm, at completion.
136 ppm, July 15, 1971.
217 ppm, July 16, 1971.
232 ppm, July 20, 1971.
280 ppm, Dec. 7, 1972.
280 ppm, Mar. 8, 1973.
260 ppm, Mar. 22, 1973.
500 ppm, June 26, 197^*.
Hardness: 200 ppm, July 18, 1972.
360 ppm, June 26, 197^*.
Pumpage: 72,000 gal/d, at completion.
Depth to water: S3.33 ft while pumping; after pumping stopped,
recovery in 5 minutes to 99.20 ft below measuring
point, Mar. 19, 1973 (USGS).
99.13 ft, while pump is off, 6-30-83 (USGS).
June 26, 197^*: pH, 7-9.
Sulfate, 28 ppm.
Alkalinity (as CaCO,), 220 ppm.
No fecal or total coliform per 100 mL.
* Analyses by W. B. Brewer, Health Services Trust Territory, using Hach kit.
162
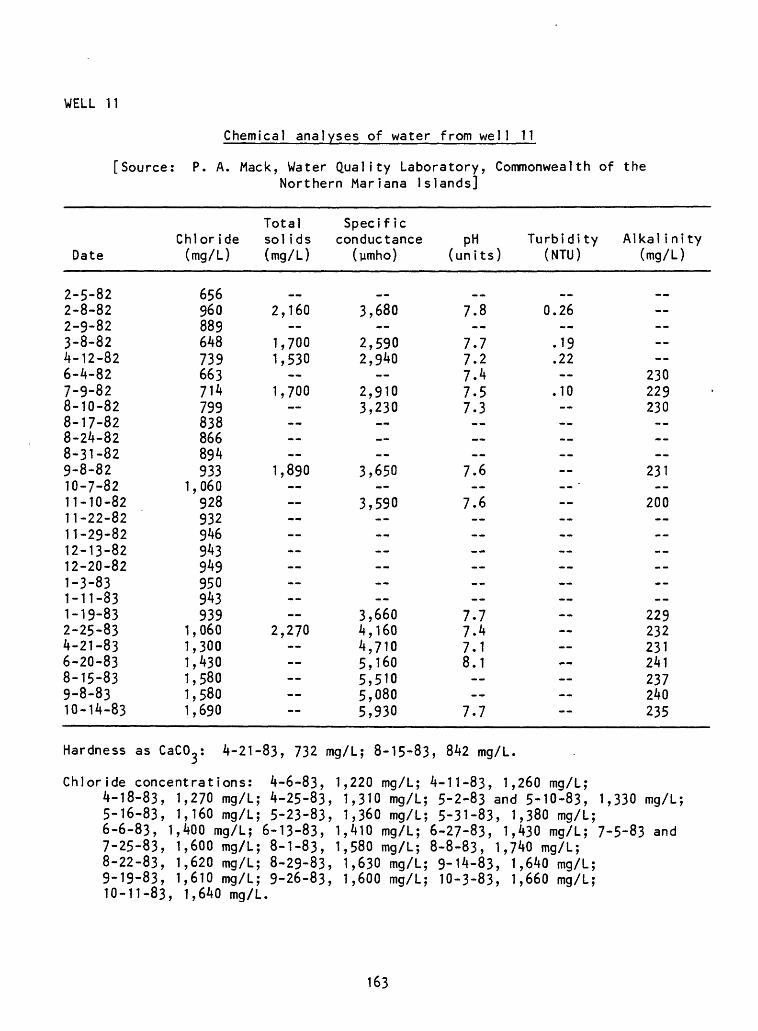
WELL 11
Chemical analyses of water from well 11
[Source: P. A. Mack, Water Quality Laboratory, Commonwealth of theNorthern Mariana Islands]
Date
2-5-822-8-822-9-823-8-824-12-826-4-827-9-828-10-828-17-828-24-828-31-829-8-8210-7-8211-10-8211-22-8211-29-8212-13-8212-20-821-3-831-11-831-19-832-25-834-21-836-20-838-15-839-8-8310-14-83
Chloride (mg/L)
656960889648739663714799838866894933
1,060928932946943949950943939
1,0601,3001,4301,5801,5801,690
Total sol ids (mg/L)
. 2,160
1,7001,530
1,700 ..
1,890
2,270 --
Specific conductance
(ymho)
..3,680
2,5902,940
2,9103,230 .
3,650
3,590
3,6604,1604,7105,1605,5105,0805,930
pH (units)
7.8
7.77.27.47.57.3 .
7.6
7.6 -- --
7.77.47.18.1 --
7.7
Turbidity (NTU)
..0.26
.19
.22
.10 -_
Alkal i ni ty (mg/L)
» mm
230
229230 --
231--
200 ----------
229232231241237240235
Hardness as CaCO^ 4-21-83, 732 mg/L; 8-15-83, 842 mg/L.
o-zz-03, l,t>ZU mg/L; 8-29-83, 1,630 mg/L; 9-14-83, 9-19-83, 1,610 mg/L; 9-26-83, 1,600 mg/L; 10-3-83,10-11.87. 1 -fi/ifl mo/I
163
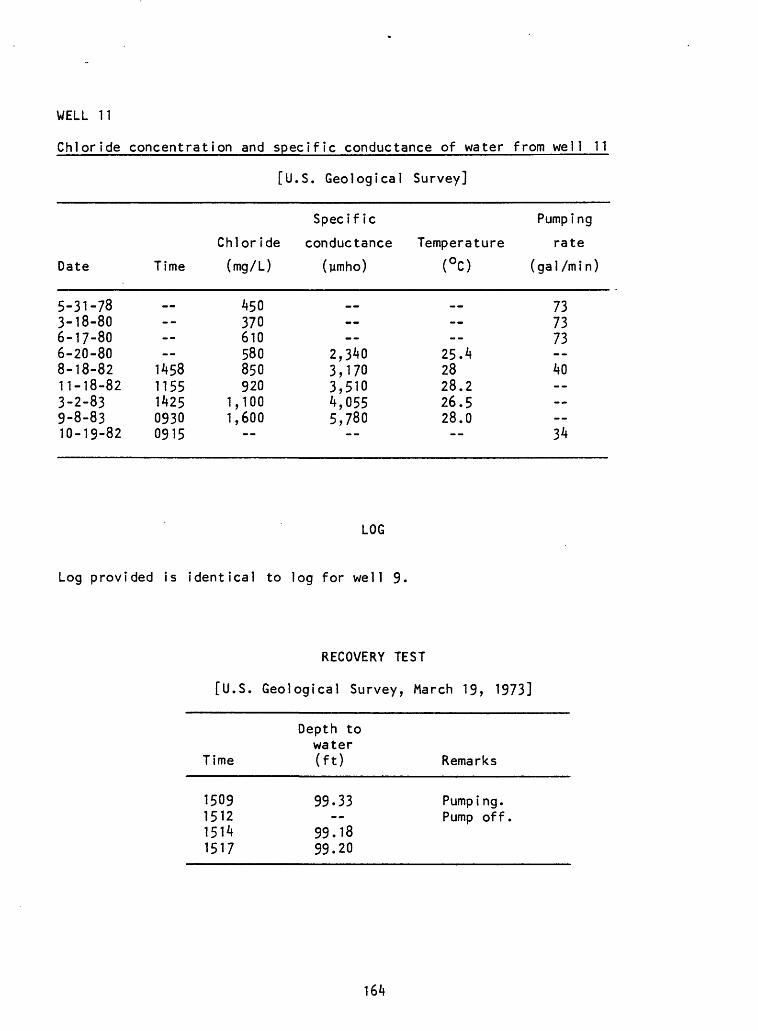
WELL 11
Chloride concentration and specific conductance of water from well 11
[U.S. Geological Survey]
Date
5-31-783-18-806-17-806-20-808-18-8211-18-823-2-839-8-8310-19-82
Time
__--
14581155142509300915
Chloride
(mg/L)
450370610580850920
1,1001,600
Specific
conductance
(ymho)
__ --
2,3403,1703,5104,0555,780
Pumping
Temperature rate(°C)
__
----
25.42828.226.528.0
(gal /mi n)
737373 40 3A
LOG
Log provided is identical to log for well 9
RECOVERY TEST
[U.S. Geological Survey, March 19, 1973]
Time
1509151215141517
Depth towater(ft)
99.33--
99.1899.20
Remarks
Pumping.Pump off.
164
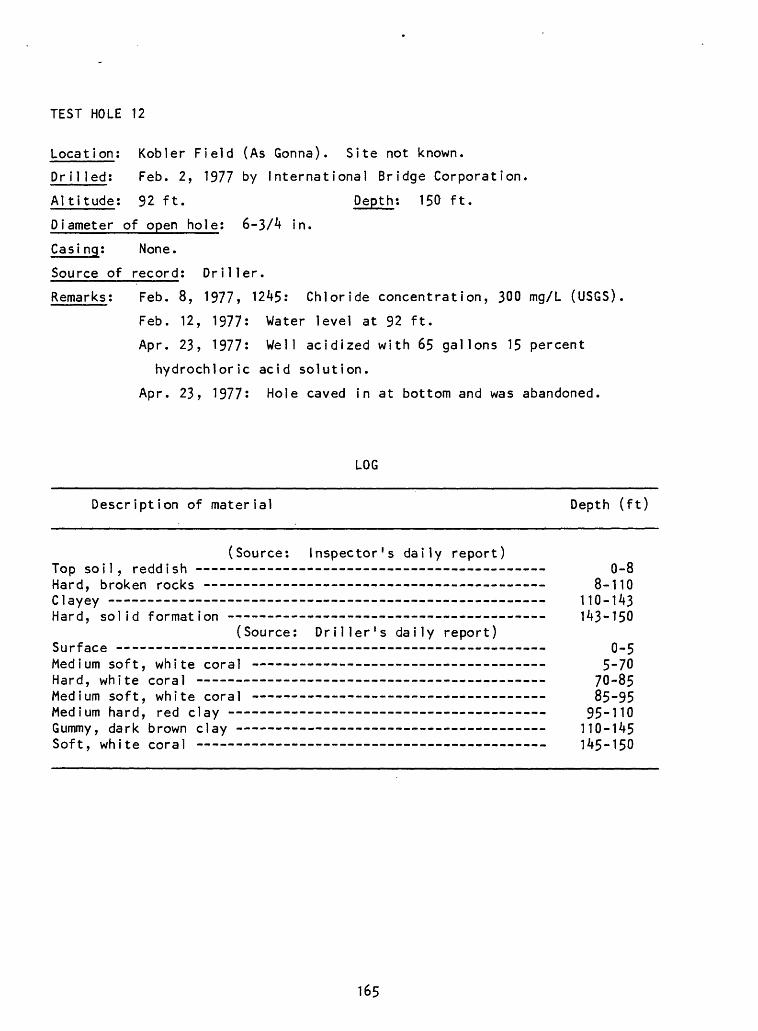
TEST HOLE 12
Location; Kobler Field (As Gonna). Site not known.
Dr J1 led: Feb. 2, 1977 by International Bridge Corporation.
Altitude; 92 ft. Depth; 150 ft.
Diameter of open hole; 6-3/4 in.
Casi ng; None.
Source of record; Driller.
Remarks; Feb. 8, 1977, 1245; Chloride concentration, 300 mg/L (USGS)
Feb. 12, 1977: Water level at 92 ft.
Apr. 23, 1977? Well acidized with 65 gallons 15 percent
hydrochloric acid solution.
Apr. 23» 1977: Hole caved in at bottom and was abandoned.
LOG
Description of material Depth (ft)
(Source: Inspector's daily report)Top soil, reddish -- -- - - -- - 0-8Hard, broken rocks 8-110Clayey 110-143Hard, solid formation - -- - -- 143-150
(Source: Driller's daily report)Surface - - - - 0-5Medium soft, white coral - 5-70Hard, white coral 70-85Medium soft, white coral - - - --- - 85-95Medium hard, red clay 95-110Gummy, dark brown clay 110-145Soft, white coral - 145-150
165
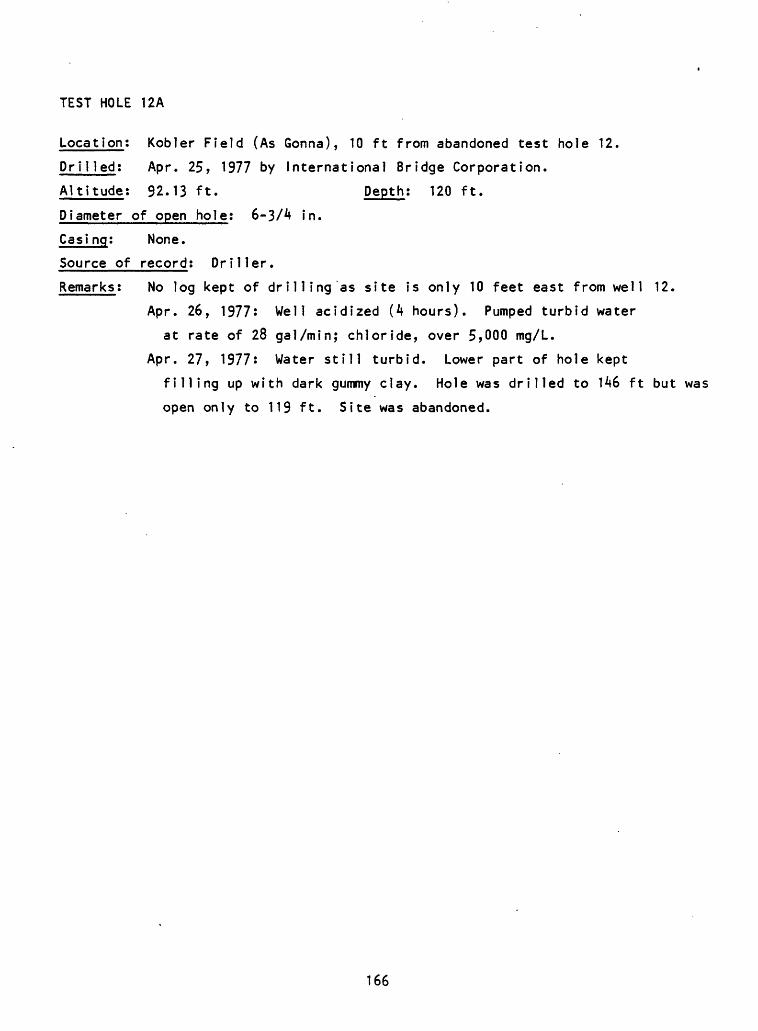
TEST HOLE 12A
Loca 11 on; Kobler Field (As Gonna), 10 ft from abandoned test hole 12.
Dri1 led; Apr. 25, 1977 by International Bridge Corporation.
Altitude; 92.13 ft. Depth; 120 ft.
Diameter of open hole; 6-3/4 in.
Casing; None.
Source of record; Driller.
Remarks; No log kept of drilling as site is only 10 feet east from well 12.
Apr. 26, 1977; Well acidized (4 hours). Pumped turbid water
at rate of 28 gal/min; chloride, over 5,000 mg/L.
Apr. 27, 1977; Water still turbid. Lower part of hole kept
filling up with dark gummy clay. Hole was drilled to 146 ft but was
open only to 119 ft. Site was abandoned.
166
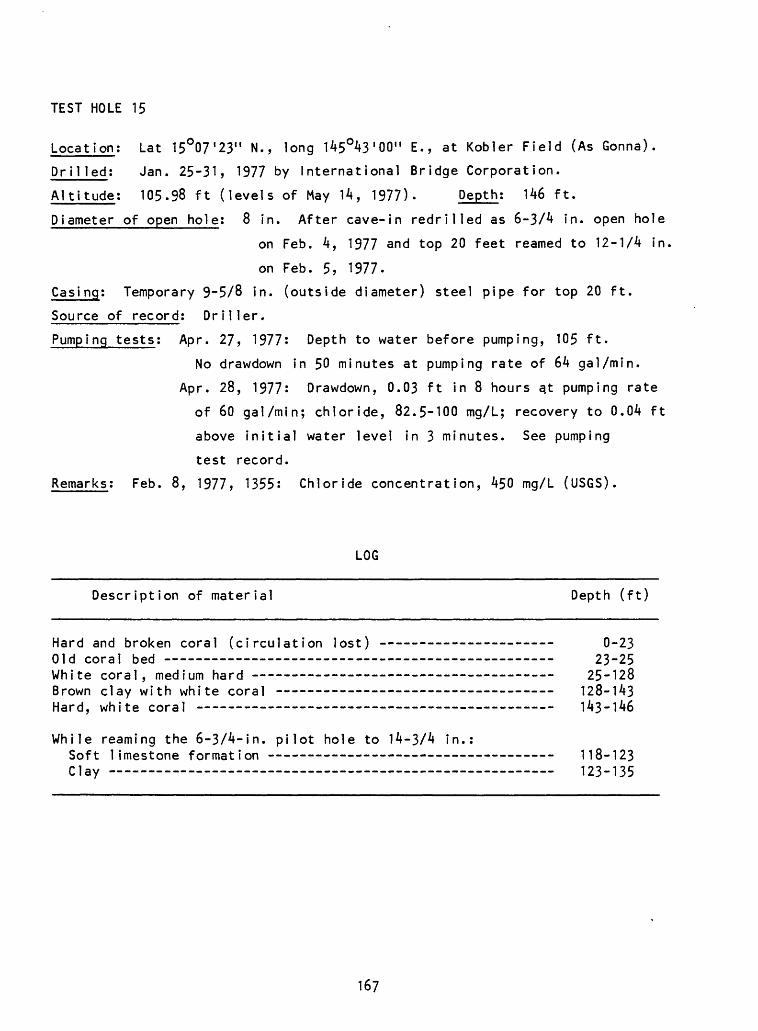
TEST HOLE 15
Location; Lat 15°07'23" N., long 145°43'00" E., at Kobler Field (As Gonna).
Drilled: Jan. 25-31, 1977 by International Bridge Corporation.
Altitude: 105.98 ft (levels of May 14, 1977). Depth: 146 ft.
Diameter of open hole: 8 in. After cave-in redrilled as 6-3/4 in. open hole
on Feb. 4, 1977 and top 20 feet reamed to 12-1/4 in,
on Feb. 5, 1977.
Casi ng: Temporary 9-5/8 in. (outside diameter) steel pipe for top 20 ft.
Source of record; Driller.
Pumping tests: Apr. 27, 1977: Depth to water before pumping, 105 ft.
No drawdown in 50 minutes at pumping rate of 64 gal/min.
Apr. 28, 1977: Drawdown, 0.03 ft in 8 hours a,t pumping rate
of 60 gal/min; chloride, 82.5-100 mg/L; recovery to 0.04 ft
above initial water level in 3 minutes. See pumping
test record.
Remarks; Feb. 8, 1977, 1355: Chloride concentration, 450 mg/L (USGS).
LOG
Description of material Depth (ft)
Hard and broken coral (circulation lost) Old coral bed --- White coral, medium hard - --- - Brown clay with white coral Hard, white coral
While reaming the 6-3/4-in. pilot hole to 14-3/4 in, Soft limestone formation - -- - - Clay
0-2323-25
25-128128-143143-146
118-123 123-135
167
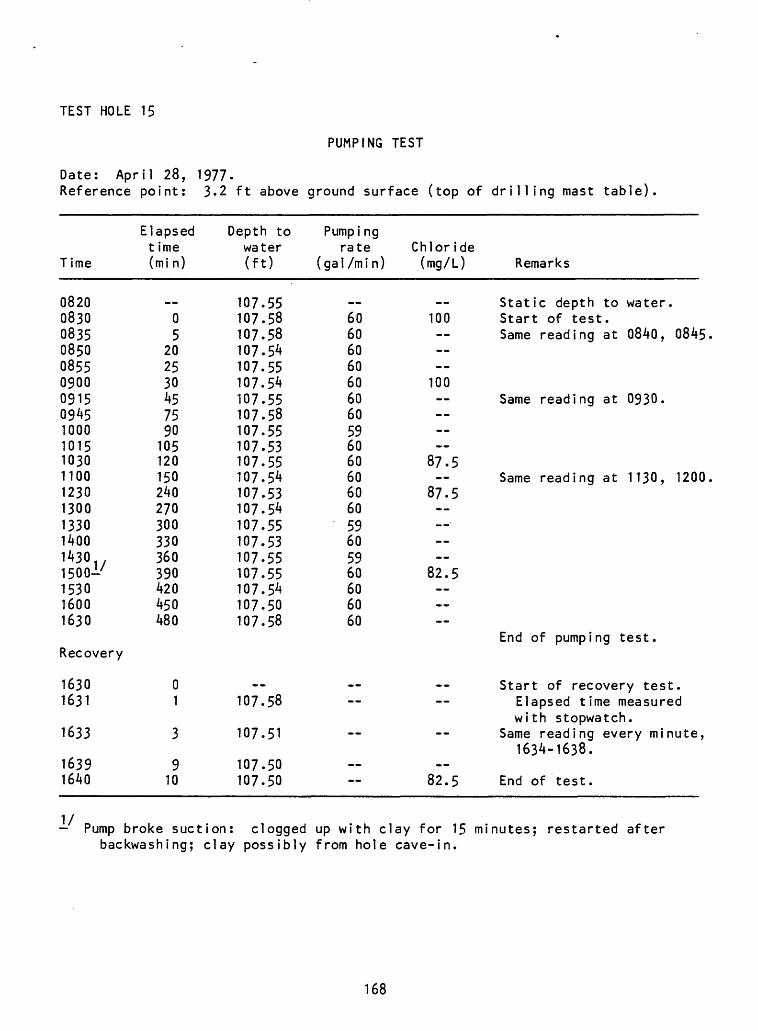
TEST HOLE 15
PUMPING TEST
Date: April 28, 1977.Reference point: 3.2 ft above ground surface (top of drilling mast table)
Time
08200830083508500855090009150945100010151030110012301300133014001^301500-'153016001630
Recovery
16301631
1633
16391640
Elapsed t ime (mi n)
__05
202530457590105120150240270300330360390420450480
01
3
910
Depth to water (ft)
107.55107.58107.58107.54107.55107.54107.55107.58107.55107.53107.55107.54107.53107.54107.55107.53107.55107.55107.54107.50107.58
__107.58
107.51
107.50107.50
Pumpi ng rate
(gal/min)
mm
6060606060606059606060606059605960606060
__
Chloride (mg/L)
__100
100
87.5
87.5
82.5
__
82.5
Remarks
Static depth to water.Start of test.Same reading at 0840, 0845
Same reading at 0930.
Same reading at 1130, 1200
End of pumping test.
Start of recovery test.Elapsed time measuredwith stopwatch.
Same reading every minute,1634-1638.
End of test.
Pump broke suction: clogged up with clay for 15 minutes; restarted after backwashing; clay possibly from hole cave-in.
168
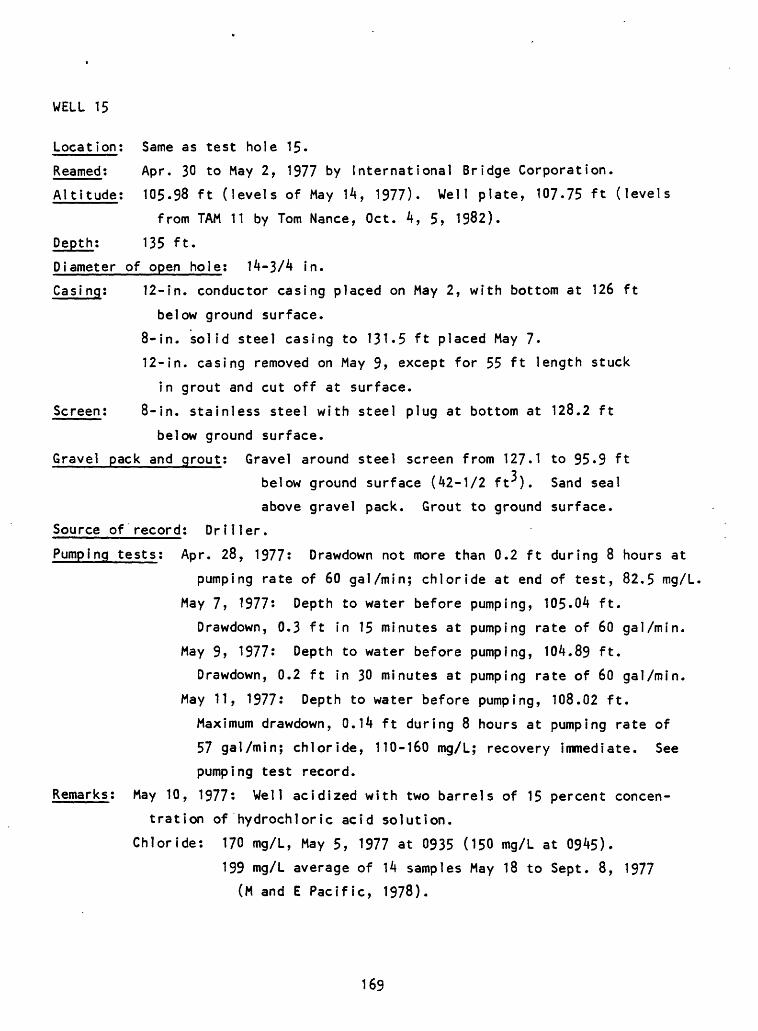
WELL 15
Loca 11 on t Same as test hole 15-
Reamed; Apr. 30 to May 2, 1977 by International Bridge Corporation.
Altitude: 105-98 ft (levels of May 14, 1977). Well plate, 107.75 ft (levels
from TAM 11 by Tom Nance, Oct. 4, 5, 1982).
Depth: 135 ft.
Diameter of open hole; 14-3/4 in.
Casi ng; 12-in. conductor casing placed on May 2, with bottom at 126 ft
below ground surface.
8-in. solid steel casing to 131-5 ft placed May 7-
12-in. casing removed on May 9, except for 55 ft length stuck
in grout and cut off at surface.
Screen: 8-in. stainless steel with steel plug at bottom at 128.2 ft
below ground surface.
Gravel pack and grout; Gravel around steel screen from 127.1 to 95-9 ft
below ground surface (42-1/2 ft ). Sand seal
above gravel pack. Grout to ground surface.
Source of record; Driller.
Pumping tests; Apr. 28, 1977: Drawdown not more than 0.2 ft during 8 hours at
pumping rate of 60 gal/min; chloride at end of test, 82.5 mg/L,
May 7, 1977: Depth to water before pumping, 105-04 ft.
Drawdown, 0.3 ft in 15 minutes at pumping rate of 60 gal/min.
May 9, 1977: Depth to water before pumping, 104.89 ft.
Drawdown, 0.2 ft in 30 minutes at pumping rate of 60 gal/min.
May 11, 1977: Depth to water before pumping, 108.02 ft.
Maximum drawdown, 0.14 ft during 8 hours at pumping rate of
57 gal/min; chloride, 110-160 mg/L; recovery immediate. See
pumping test record.
Remarks; May 10, 1977: Well acidized with two barrels of 15 percent concen
tration of hydrochloric acid solution.
Chloride: 170 mg/L, May 5, 1977 at 0935 (150 mg/L at 0945).
199 mg/L average of 14 samples May 18 to Sept. 8, 1977
(M and E Pacific, 1978).
169
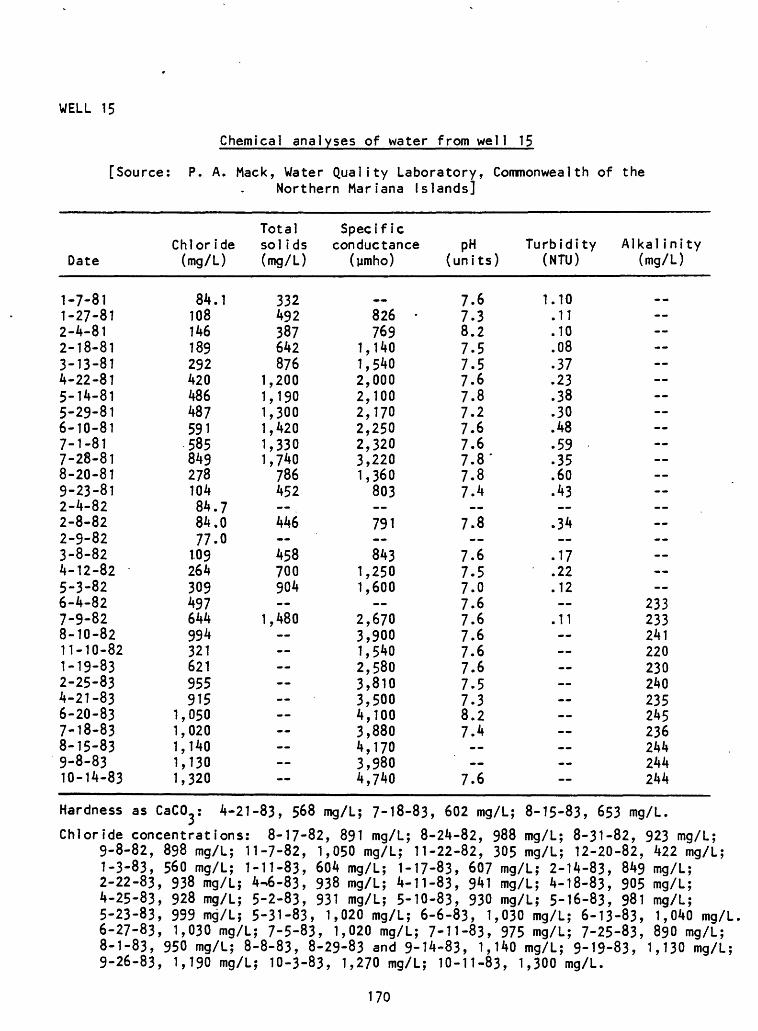
WELL 15
Chemical analyses of water from well 15
[Source: P. A. Mack, Water Quality Laboratory, Commonwealth of theNorthern Mariana Islands]
Date
1-7-811-27-812-4-812-18-813-13-814-22-815-14-815-29-816-10-817-1-817-28-818-20-819-23-812-4-822-8-822-9-823-8-824-12-825-3-826-4-827-9-828-10-8211-10-821-19-832-25-834-21-836-20-837-18-838-15-839-8-8310-14-83
Chloride (mg/L)
84.110814618929242048648759158584927810484.784.077.0109264309497644994321621955915
1,0501,0201,1401,1301,320
Total sol ids (mg/L)
332492387642876
1,2001,1901,3001,4201,3301,740
786452 446 458700904
1,480
Specif ic conductance
(jjmho)
..826 769
1,1401,5402,0002,1002,1702,2502,3203,2201,360
803 791
8431,2501,600
2,6703,9001,5402,5803,8103,5004,1003,8804,1703,9804,740
pH (units)
7.67.38.27.57.57.67.87.27.67.67.8'
7.87.4
7.8
7.67.57.07.67.67.67.67.67.57.38.27.4_- .
7.6
Turbidity (NTU)
1.10.11.10.08.37.23.38.30.48.59.35.60.43--.34
.17
.22
.12
.11 _- _-_-
_-
Alkal Ini ty (mg/L)
--
233233241220230240235245236244244244
t-j-vj, j\j\i my / i_^ i - i i -uj , uu-r my/i_; i - i / -v.} , uu/ mvj/i_; z.-in-o^, on^ mg/i_;
2-22-83, 938 mg/L; 4-6-83, 938 mg/L; 4-11-83, 941 mg/L; 4-18-83, 905 mg/L;4-25-83, 928 mg/L; 5-2-83, 931 mg/L; 5-10-83, 930 mg/L; 5-16-83, 981 mg/L;5-23-83, 999 mg/L; 5-31-83, 1,020 mg/L; 6-6-83, 1,030 mg/L; 6-13-83, 1,040 mg/L,6-27-83, 1,030 mg/L; 7-5-83, 1,020 mg/L; 7-11-83, 975 mg/L; 7-25-83, 890 mg/L;8-1-83, 950 mg/L; 8-8-83, 8-29-83 and 9-14-83, 1,140 mg/L; 9-19-83, 1,130 mg/L;9-26-83, 1,190 mg/L; 10-3-83, 1,270 mg/L; 10-11-83, 1,300 mg/L.
170
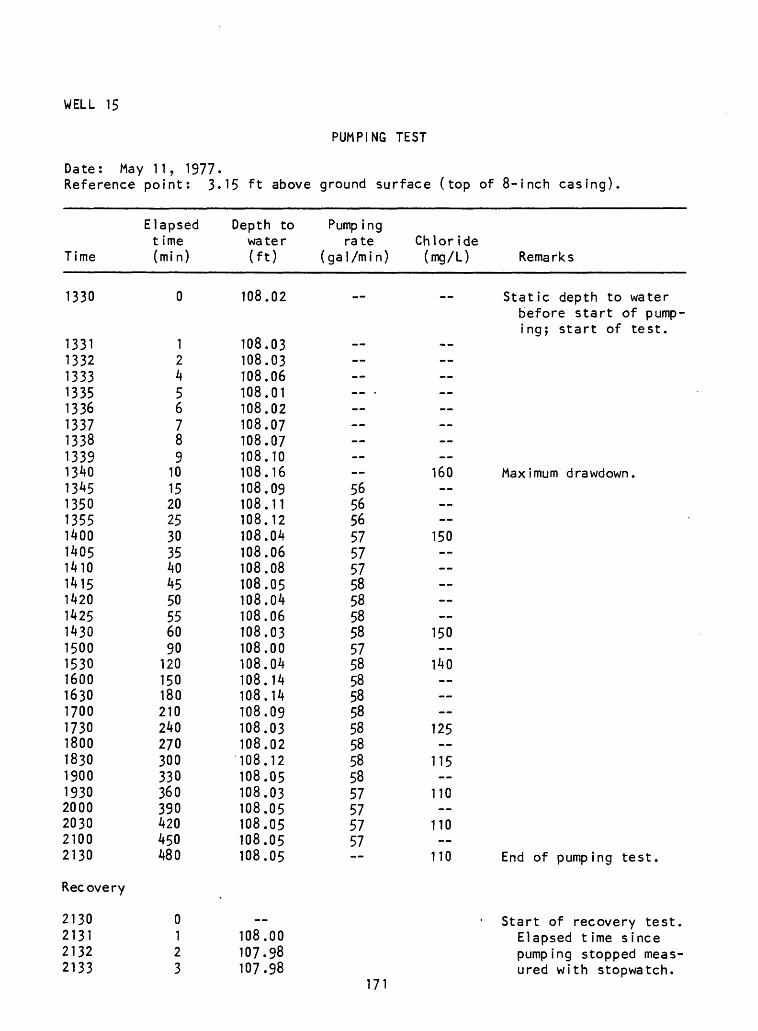
WELL 15
PUMPING TEST
Date: May 11, 1977.Reference point: 3-15 ft above ground surface (top of 8-inch casing)
Time
Elapsed t ime (min)
Depth to water (ft)
Pump ingrate
(gal/min)Chloride
(mg/L) Remarks
1330 0 108.02
13311332133313351336133713381339134013^513501355140014051410141514201425143015001530160016301700173018001830190019302000203021002130
12456789
101520253035404550556090
120150180210240270300330360390420450480
108.03108.03108.06108.01108.02108.07108.07108.10108.16108.09108.11108.12108.04108.06108.08108.05108.04108.06108.03108.00108.04108.14108.14108.09108.03108.02108.12108.05108.03108.05108.05108.05108.05
5656565757575858585857585858585858585857575757
Recovery
2130213121322133
108.00107.98107.98
Static depth to water before start of pump- ing; start of test.
160
150
Maximum drawdown.
150
140
125
115
110
110
110
171
End of pumping test.
Start of recovery test, Elapsed time since pumping stopped meas ured with stopwatch.
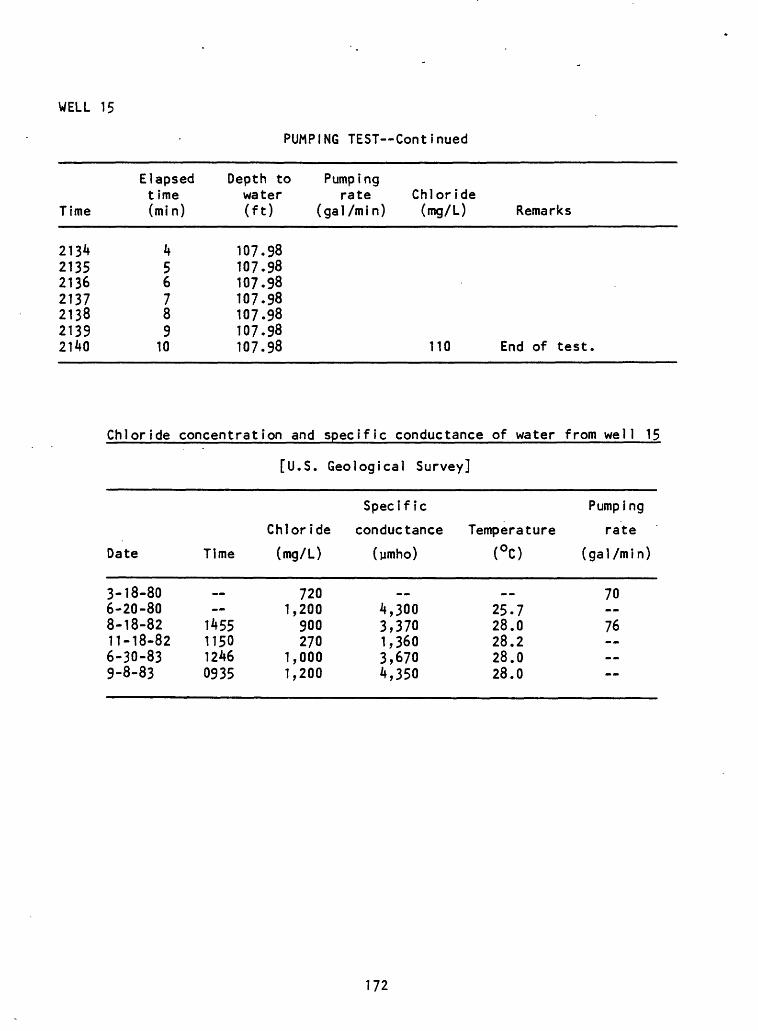
WELL 15
PUMPING TEST Continued
Time
2134213521362137213821392140
Elapsedtime(min)
456789
10
Depth to Pumpingwater rate Chloride(ft) (gal/min) (mg/L) Remarks
107.98107.98107.98107.98107.98107.98107.98 110 End of test.
Chloride concentration and specific conductance of water from well 15
[U.S. Geological Survey]
Specific Pumping
Chloride conductance Temperature rate
Date Time (mg/L) (umho) (°C) (gal/min)
3-18-806-20-808-18-8211-18-826-30-839-8-83
__ 1455115012460935
7201,200
900270
1,0001,200
__4,3003,3701,3603,6704,350
__
25.728.028.228.028.0
70 76----
172
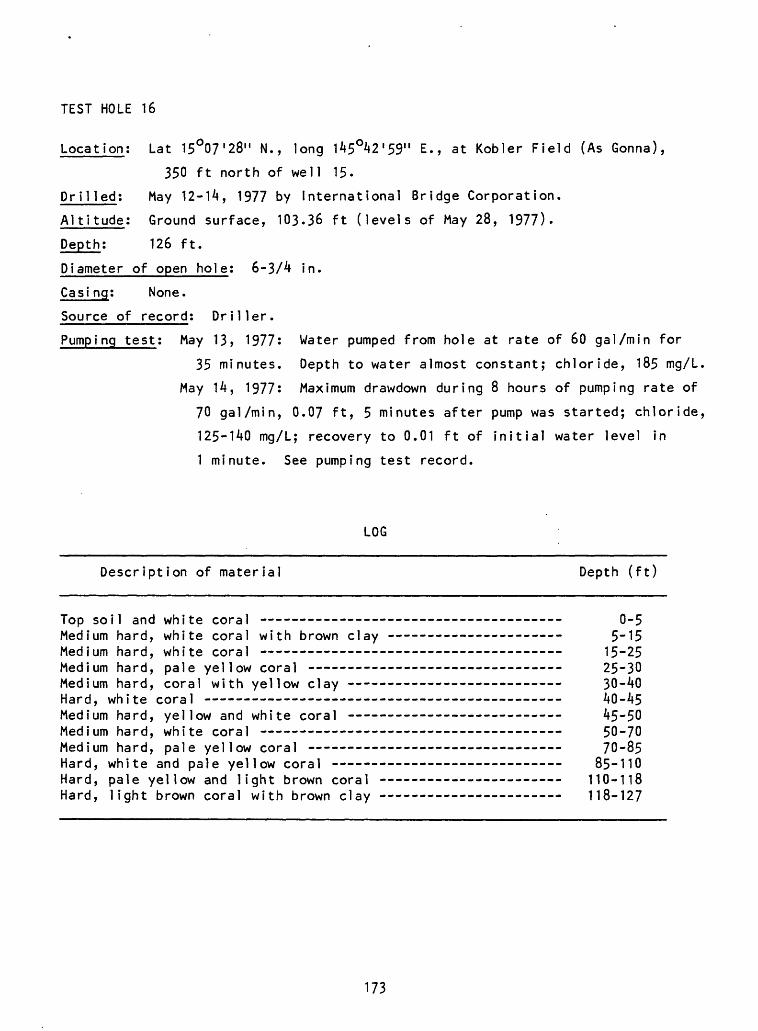
TEST HOLE 16
Location; Lat 15°07'28" N., long 145°42'59" E., at Kobler Field (As Gonna),
350 ft north of well 15.
Drilled; May 12-14, 1977 by International Bridge Corporation.
Altitude; Ground surface, 103-36 ft (levels of May 28, 1977).
Depth; 126 ft.
Diameter of open hole; 6-3/4 in.
Casi ng; None.
Source of record; Driller.
Pumping test; May 13, 1977; Water pumped from hole at rate of 60 gal/min for
35 minutes. Depth to water almost constant; chloride, 185 mg/L.
May 14, 1977; Maximum drawdown during 8 hours of pumping rate of
70 gal/min, 0.07 ft, 5 minutes after pump was started; chloride,
125-140 mg/L; recovery to 0.01 ft of initial water level in
1 minute. See pumping test record.
LOG
Description of material Depth (ft)
Top soil and white coral -- - - 0-5Medium hard, white coral with brown clay - - - 5-15Medium hard, white coral 15-25Medium hard, pale yellow coral 25-30Medium hard, coral with yellow clay 30-40Hard, white coral 40-45Medium hard, yellow and white coral 45-50Medium hard, white coral 50-70Medium hard, pale yellow coral 70-85Hard, white and pale yellow coral - - 85-110Hard, pale yellow and light brown coral 110-118Hard, light brown coral with brown clay 118-127
173
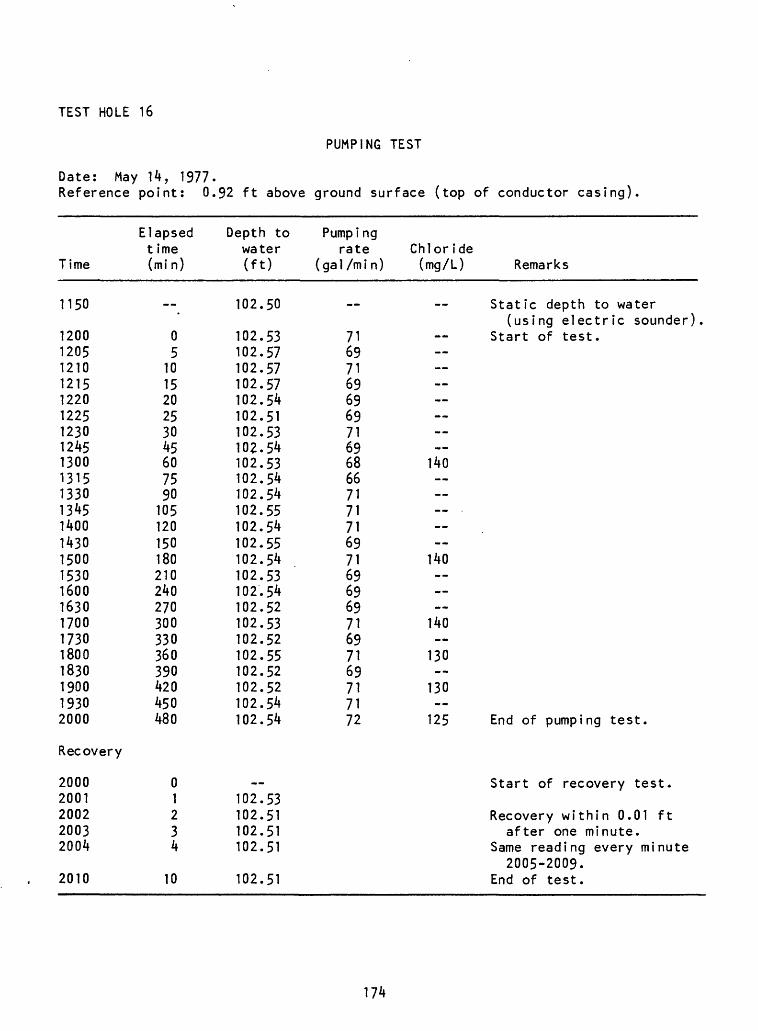
TEST HOLE 16
PUMPING TEST
Date: May 14, 1977.Reference point: 0.92 ft above ground surface (top of conductor casing)
Time
1150
1200120512101215122012251230124513001315133013^51400143015001530160016301700173018001830190019302000
Recovery
20002001200220032004
2010
Elapsed t ime (mi n)
mf mf
05
101520253045607590105120150180210240270300330360390420450480
01234
10
Depth to water (ft)
102.50
102.53102.57102.57102.57102.54102.51102.53102.54102.53102.54102.54102.55102.54102.55102.54102.53102.54102.52102.53102.52102.55102.52102.52102.54102.54
102.53102.51102.51102.51
102.51
Pumping rate
( ga 1 /m i n )
71697169696971696866717171697169696971697169717172
Chloride (mg/L) Remarks
Static depth to water(using electric sounder).
Start of test.
140 .
140
140
130
130
125 End of pumping test.
Start of recovery test.
Recovery within 0.01 ftafter one minute.
Same reading every minute2005-2009.
End of test.
174
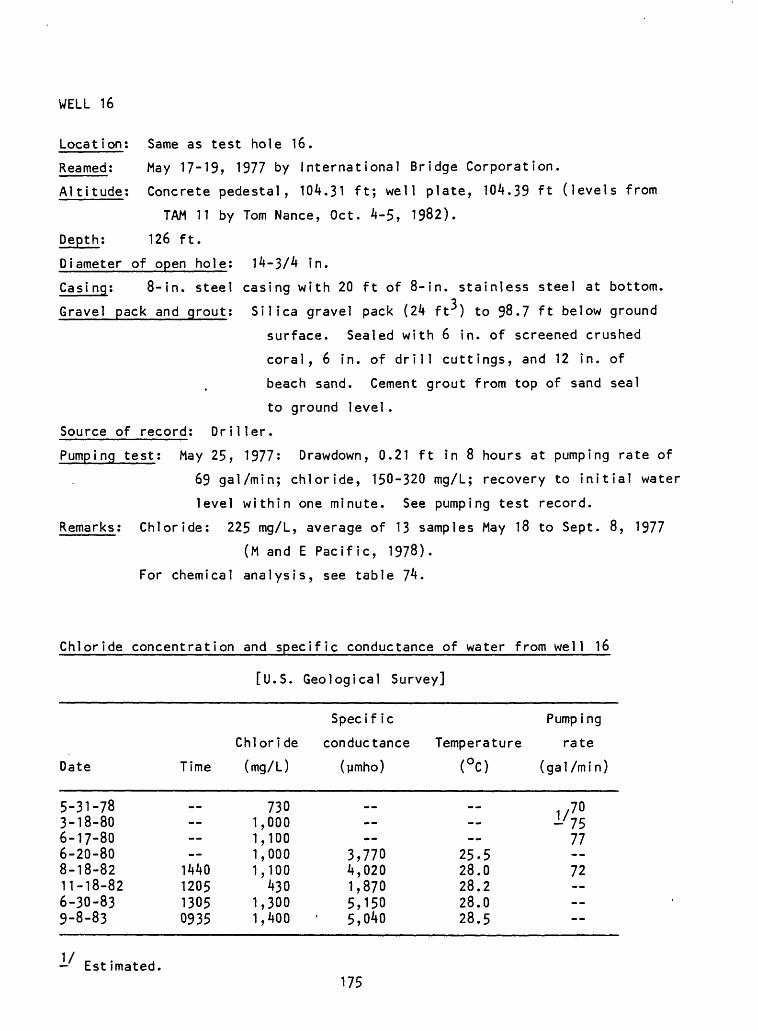
WELL 16
Location;
Reamed;
Altitude;
Same as test hole 16.
May 17-19, 1977 by International Bridge Corporation.
_____ Concrete pedestal, 104.31 ft; well plate, 104.39 ft (levels from
TAM 11 by Tom Nance, Oct. 4-5, 1982).
Depth; 126 ft.
Diameter of open hole; 14-3/4 in.
Casi ng; 8-in. steel casing with 20 ft of 8-in. stainless steel at bottom.
Gravel pack and grout; Silica gravel pack (24 ft^) to 98.7 ft below ground
surface. Sealed with 6 in. of screened crushed
coral, 6 in. of drill cuttings, and 12 in. of
beach sand. Cement grout from top of sand seal
to ground level.
Source of record; Driller.
Pumping test; May 25, 1977: Drawdown, 0.21 ft in 8 hours at pumping rate of
69 gal/min; chloride, 150-320 mg/L; recovery to initial water
level within one minute. See pumping test record.
Remarks; Chloride; 225 mg/L, average of 13 samples May 18 to Sept. 8, 1977
(M and E Pacific, 1978).
For chemical analysis, see table Ik.
Chloride concentration and specific conductance of water from well 16
Date
5-31-783-18-806-17-806-20-808-18-8211-18-826-30-839-8-83
Time
__ 1440120513050935
[U.S.
Chloride
(mg/L)
7301,0001,1001,0001,100
4301,3001,400
Geological Survey]
Specif ic
conductance
(ymho)
__
3,7704,0201,8705,1505,040
Pumping
Temperature rate(°C)
-_
25.528.028.228.028.5
(gal/min)
1/7°17 75
77 72 ----
Estimated,175
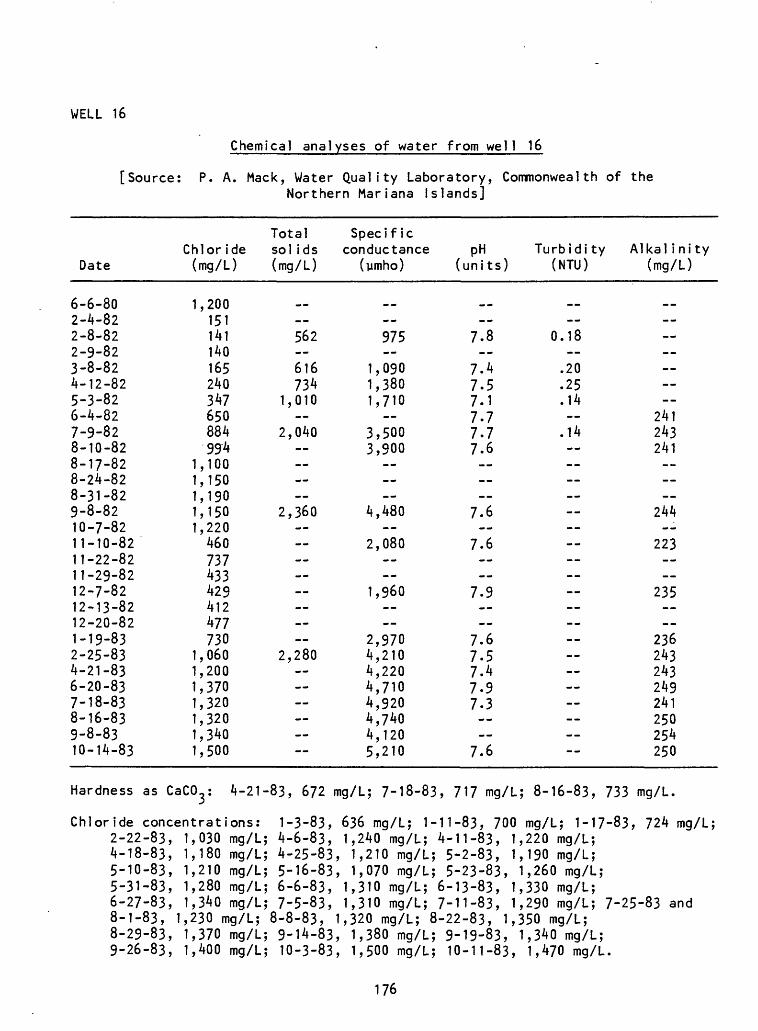
WELL 16
Chemical analyses of water from well 16
[Source: P. A. Mack, Water Quality Laboratory, Commonwealth of theNorthern Mariana Islands]
Date
6-6-802-4-822-8-822-9-823-8-824-12-825-3-826-4-827-9-828-10-828-17-828-24-828-31-829-8-8210-7-8211-10-8211-22-8211-29-8212-7-8212-13-8212-20-821-19-832-25-834-21-836-20-837-18-838-16-839-8-8310-14-83
Chlor ide (mg/L)
1,200151141140165240347650884994
1,1001,1501,1901,1501,220460737433429412477730
1,0601,2001,3701,3201,3201,3401,500
Total sol ids (mg/L)
M
562 616734
1,010
2,040
2,360
2,280
Specific conductance
(jimho)
975
1,0901,3801,710
3,5003,900
4,480
2,080 --
1,960
2,9704,2104,2204,7104,9204,7^04,1205,210
pH (units)
7.8--
7.47.57.17.77.77.6 --
7.6
7.6 __
7.9
7.67.57.47.97.3--
7.6
Turbidi ty (NTU)
0.18
.20
.25
.14 .14 -- -- -- --
Alkal ini ty (mg/L)
-- --
241243241--
244--
223----
235----
236243243249241250254250
Hardness as CaCO.: 4-21-83, 672 mg/L; 7-18-83, 717 mg/L; 8-16-83, 733 mg/L.
1-3-83, 636 mg/L; 1-11-83, 700 mg/L; 1-17-83, 724 mg/L; 4-6-8 1240 mL 4-11-8 1220 mL
Chloride concentrations:
--.j, i,^/u mg/u; 2-it-co, i,^ou mg/L; 9-26-83, 1,400 mg/L; 10-3-83, 1,500 mg/L;
176
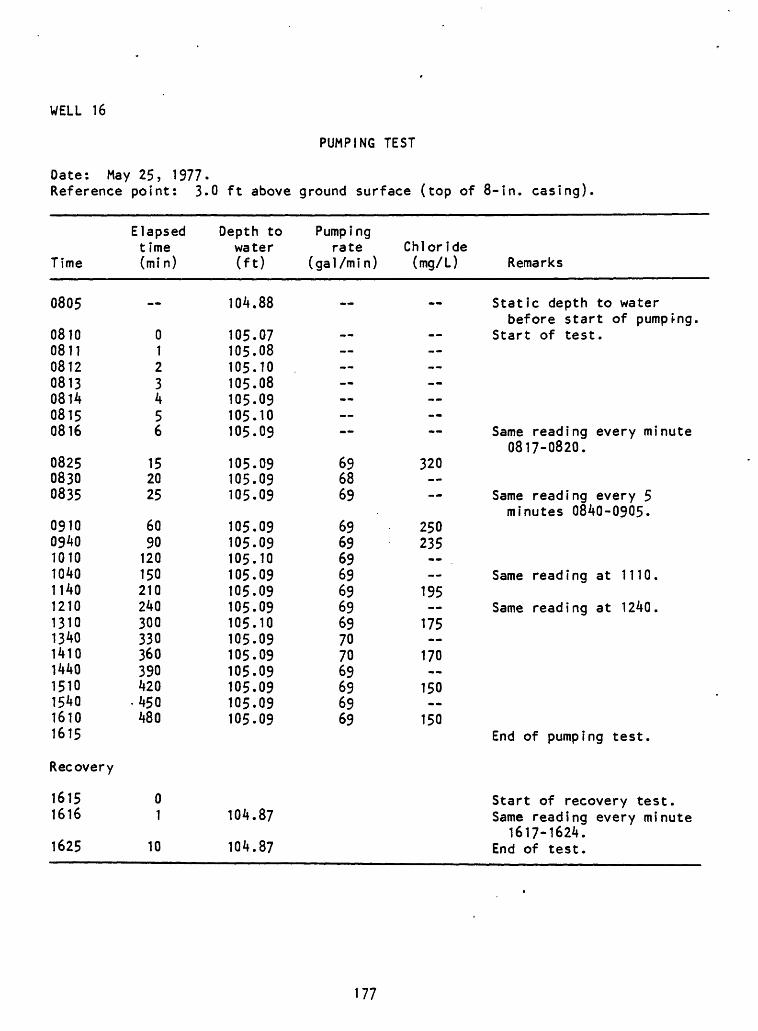
WELL 16
PUMPING TEST
Date: May 25, 1977.Reference point: 3.0 ft above ground surface (top of 8-in. casing)
Time
0805
0810081108120813081 A08150816
082508300835
09100940101010401140121013101340141014401510154016101615
Recovery
16151616
1625
Elapsed time (min)
0123456
152025
6090120150210240300330360390420
450480
01
10
Depth to water (ft)
104.88
105.07105.08105.10105.08105.09105.10105.09
105.09105.09105.09
105.09105.09105.10105.09105.09105.09105.10105.09105.09105.09105.09105.09105.09
104.87
104.87
Pump i ng rate
( ga 1 /m i n )
696869
69696969696969707069696969
Chloride (mg/L)
--
320
250235 195
175--
170..
150..
150
Remarks
Static depth to waterbefore start of pumping.
Start of test.
Same reading every minute0817-0820.
Same reading every 5minutes 0840-0905.
Same reading at 1110.
Same reading at 1240.
End of pumping test.
Start of recovery test.Same reading every minute
1617-1624.End of test.
177
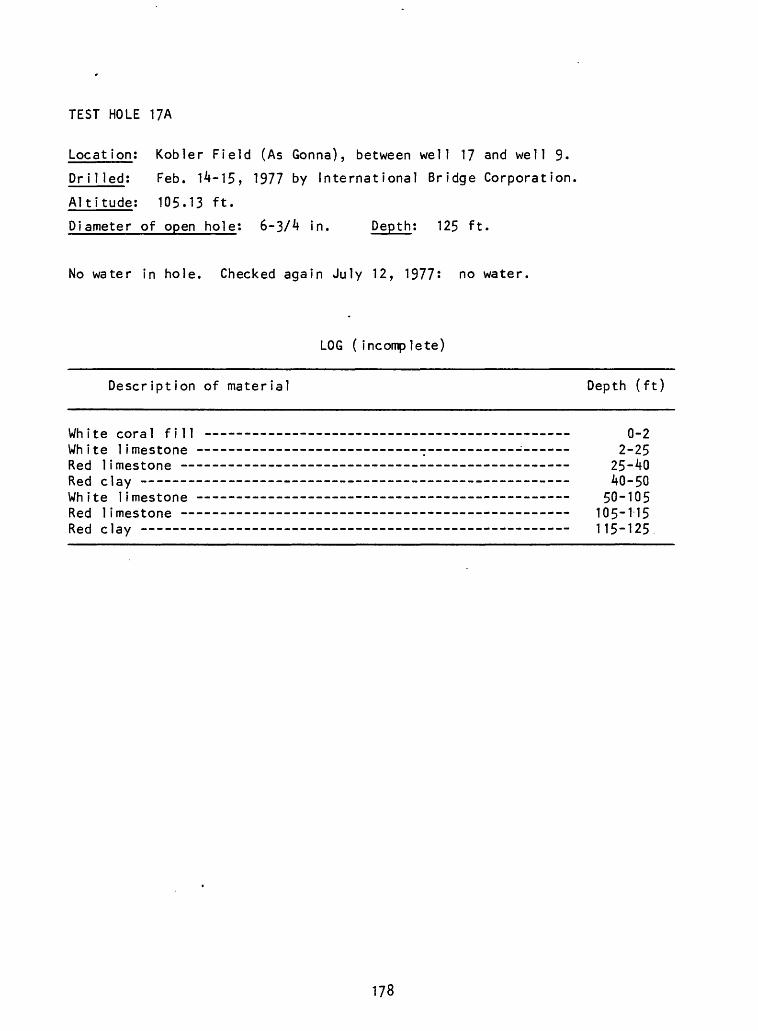
TEST HOLE 17A
Locat ion: Kobler Field (As Gonna), between well 17 and well 9.
Drilled: Feb. 14-15, 1977 by International Bridge Corporation.
Altitude; 105.13 ft.
Diameter of open hole: 6-3/4 in. Depth: 125 ft.
No water in hole. Checked again July 12, 1977: no water.
LOG (incomplete)
Description of material Depth (ft)
White coral fill 0-2White limestone - 2-25Red limestone 25-40Red clay 40-50White limestone 50-105Red limestone 105-115Red clay 115-125
178
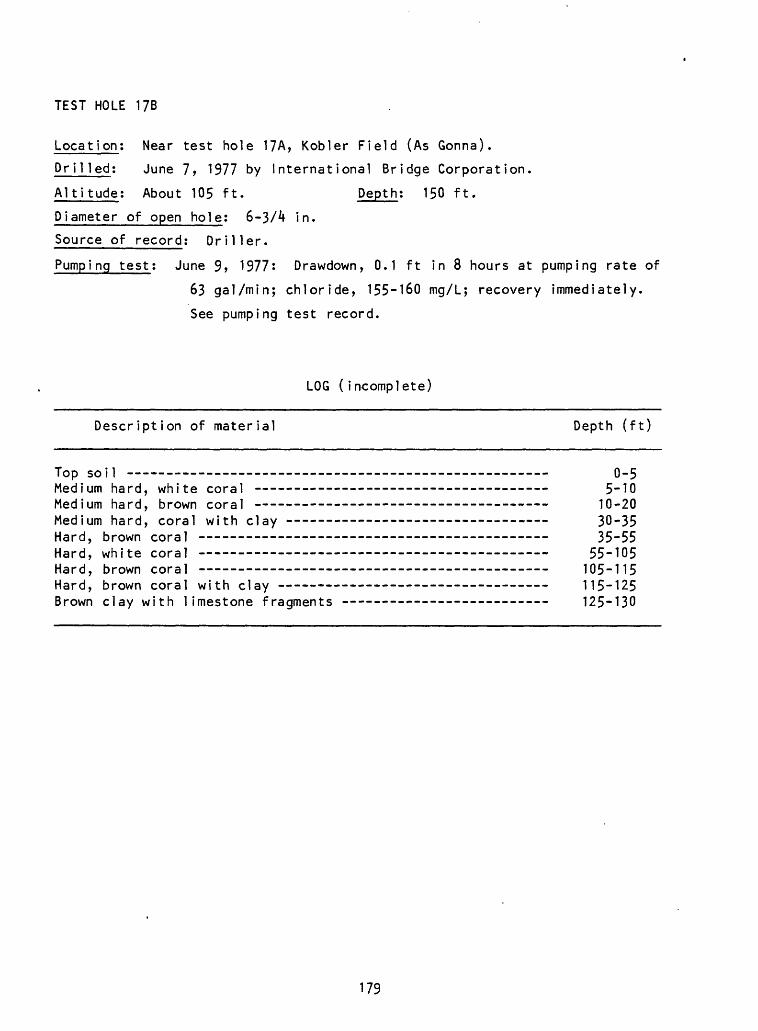
TEST HOLE 17B
Location; Near test hole 17A, Kobler Field (As Gonna).
Dr i1 led; June 7, 1977 by International Bridge Corporation.
Altitude; About 105 ft. Depth; 150 ft.
Diameter of open hole; 6-3/A in.
Source of record; Driller.
Pumping test; June 9» 1977s Drawdown, 0.1 ft in 8 hours at pumping rate of
63 gal/min; chloride, 155-160 mg/L; recovery immediately.
See pumping test record.
LOG (incomplete)
Description of material Depth (ft)
Top soil - - - - 0-5Medium hard, white coral -- - 5-10Medium hard, brown coral - - - - - 10-20Medium hard, coral with clay - 30-35Hard, brown coral 35-55Hard, white coral 55-105Hard, brown coral - - 105-115Hard, brown coral with clay - -------------------- - _ 115-125Brown clay with limestone fragments -- - 125-130
179
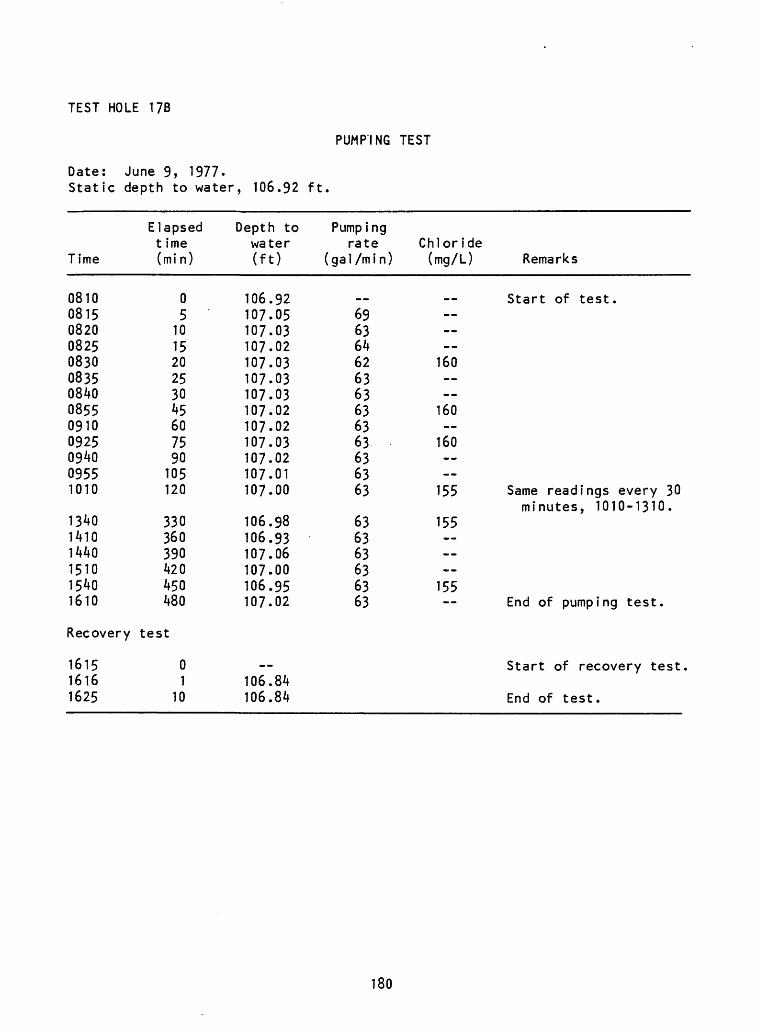
TEST HOLE 1?B
PUMPING TEST
Date: June 9, 1977.Static depth to water, 106.92 ft.
Time
081008150820082508300835084008550910092509^009551010
134014101440151015401610
Recovery
161516161625
Elapsed t ime (min)
05
101520253045607590105120
330360390420450480
test
01
10
Depth to water (ft)
106.92107.05107.03107.02107.03107.03107.03107.02107.02107.03107.02107.01107.00
106.98106.93107.06107.00106.95107.02
..106.84106.84
Pumping rate
(gal /min)
..696364626363636363636363
636363636363
Chloride (mg/L) Remarks
Start of test. --
160
160
160
155 Same readings every 30minutes, 1010-1310.
155
155End of pumping test.
Start of recovery test.
End of test.
180
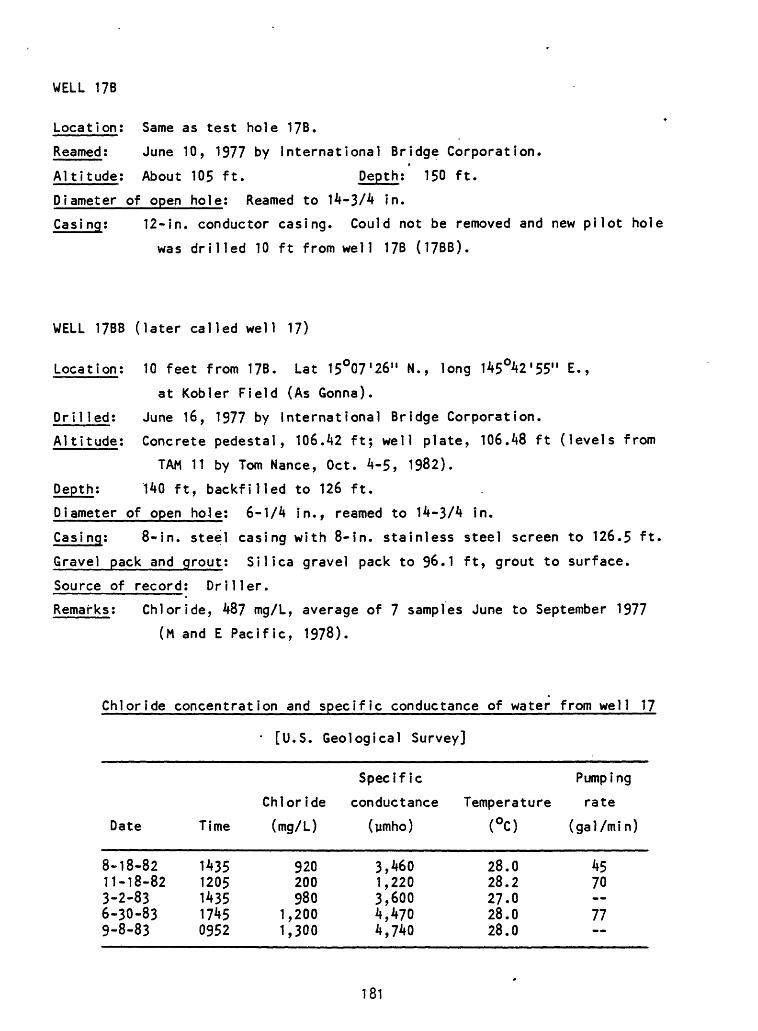
WELL 17B
Location; Same as test hole 17B.
Reamed; June 10, 1977 by International Bridge Corporation.
Altitude; About 105 ft. Depth; 150 ft.
Diameter of open hole; Reamed to 14-3/4 in.
Casing; 12-in. conductor casing. Could not be removed and new pilot hole
was drilled 10 ft from well 17B (17BB).
WELL 17BB (later called well 17)
Location; 10 feet from 17B. Lat 15°07 I 26U N., long 145°42'55" E.,
at Kobler Field (As Gonna).
Dril led; June 16, 1977 by International Bridge Corporation.
Altitude; Concrete pedestal, 106.42 ft; well plate, 106.48 ft (levels from
TAM 11 by Tom Nance, Oct. 4-5, 1982).
Depth; 140 ft, backfilled to 126 ft.
Diameter of open hole; 6-1/4 in., reamed to 14-3/4 in.
Casing; 8-in. steel casing with 8-in. stainless steel screen to 126.5 ft,
Gravel pack and grout; Silica gravel pack to 96.1 ft, grout to surface.
Source of record; Driller.
Remarks; Chloride, 487 mg/L, average of 7 samples June to September 1977
(M and E Pacific, 1978).
Chloride concentration and specific conductance of water from well 17
[U.S. Geological Survey]
Date
8-18-82 11-18-82 3-2-83 6-30-83 9-8-83
Time
1435 1205 1435 1745 0952
Chloride
(mg/L)
920 200 980
1,200 1,300
Specific
conductance
(ymho)
3,460 1,220 3,600 4,470 4,740
Temperature(°0
28.0 28.2 27-0 28.0 28.0
Pump i ng
rate
(gal/min)
45 70
77
181
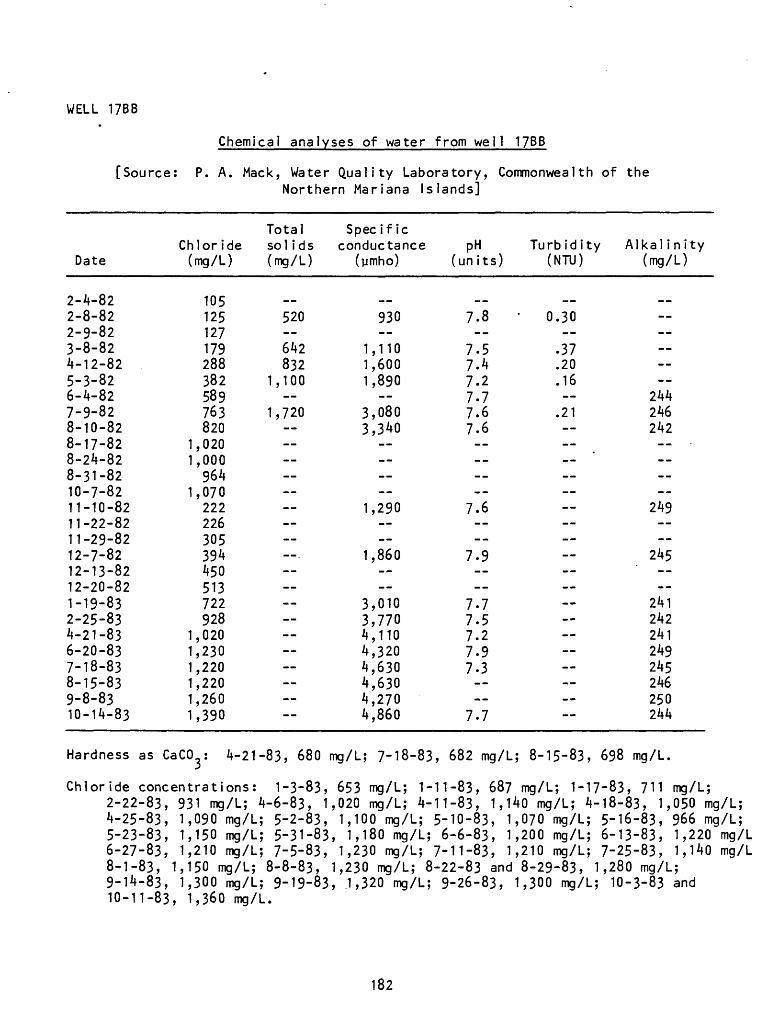
WELL 17BB*
Chemical analyses of water from well 17BB
[Source: P. A. Mack, Water Quality Laboratory, Commonwealth of theNorthern Mariana Islands]
Date
2-4-822-8-822-9-823-8-824-12-825-3-826-4-827-9-828-10-828-17-828-24-828-31-8210-7-8211-10-8211-22-8211-29-8212-7-8212-13-8212-20-821-19-832-25-834-21-836-20-837-18-838-15-839-8-8310-14-83
Chloride (mg/L)
105125127179288382589763820
1,0201,000964
1,070222226305394450513722928
1,0201,2301,2201,2201,2601,390
Total so 1 i d s (mg/L)
__520 642832
1,100
1,720 . --
Specific conductance
(ymho)
__930
1,1101,6001,890
3,0803,340
1,290
1,860
3,0103,7704,1104,3204,6304,6304,2704,860
pH (un its)
..7.8--
7.57.47.27.77.67.6 -- --
7.6 --
7.9 --
7.77.57.27.97.3 --
7.7
Turbidity (NTU)
__0.30 .37.20.16
.21 -- -- --
Alkal inity (mg/L)
__ --
244246242 ----
249
245'
241242241249245246250244
Hardness as CaCO : 4-21-83, 680 mg/L; 7-18-83, 682 mg/L; 8-15-83, 698 mg/L.
10-11-83, 1,360 mg/L.
182
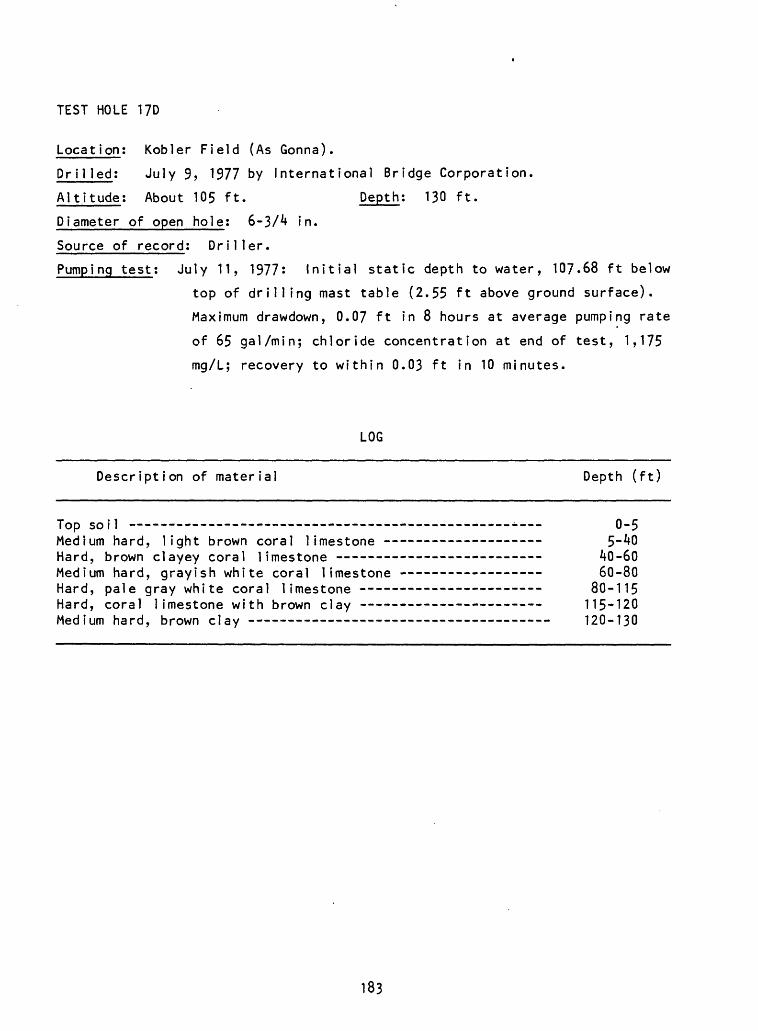
TEST HOLE 17D
Location; Kobler Field (As Gonna).
DrMled: July 9, 1977 by International Bridge Corporation.
Altitude; About 105 ft. Depth; 130 ft.
Diameter of open hole; 6-3/4 in.
Source of record; Driller.
Pumping test; July 11, 1977: Initial static depth to water, 107.68 ft below
top of drilling mast table (2.55 ft above ground surface).
Maximum drawdown, 0.07 ft in 8 hours at average pumping rate
of 65 gal/min; chloride concentration at end of test, 1,175
mg/L; recovery to within 0.03 ft in 10 minutes.
LOG
Description of material Depth (ft)
Top soil --- - -- - ----- 0-5Medium hard, light brown coral limestone 5-40Hard, brown clayey coral limestone ---- - - -- 40-60Medium hard, grayish white coral limestone ----- - - 60-80Hard, pale gray white coral limestone --- _________ 80-115Hard, coral limestone with brown clay 115-120Medium hard, brown clay 120-130
183
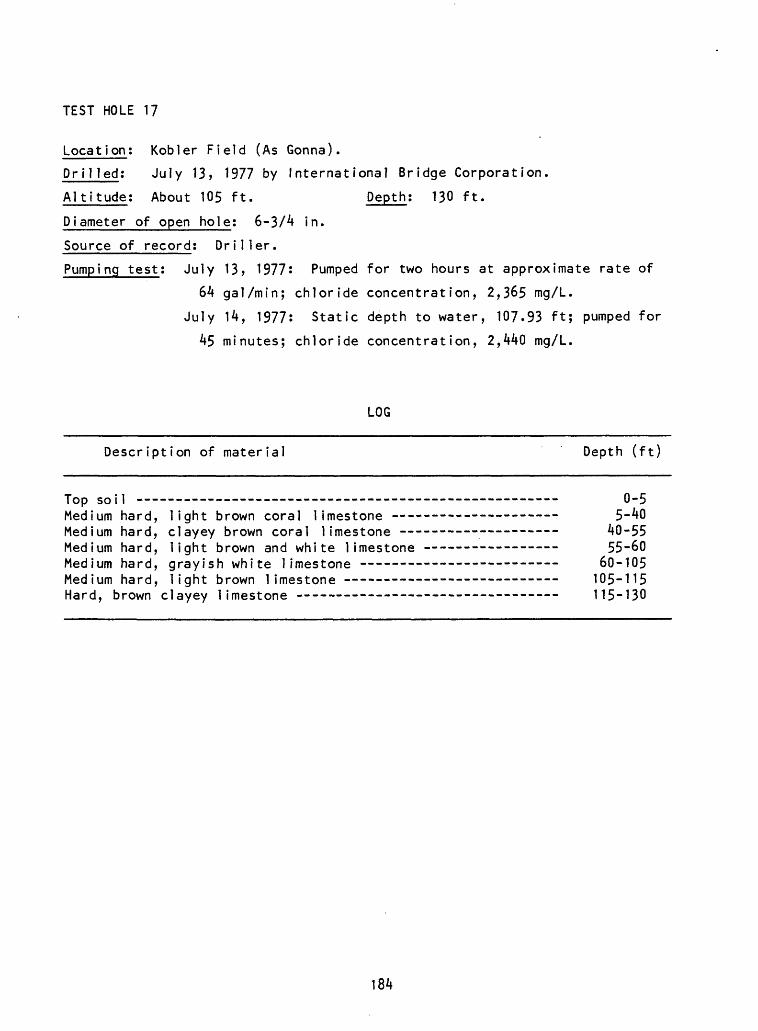
TEST HOLE 17
Location: Kobler Field (As Gonna).
DrII led: July 13, 1977 by International Bridge Corporation.
Altitude; About 105 ft. Depth; 130 ft.
Diameter of open hole; 6-3/4 in.
Source of record; Driller.
Pumping test; July 13? 1977: Pumped for two hours at approximate rate of
64 gal/min; chloride concentration, 2,365 mg/L.
July 14, 1977; Static depth to water, 107-93 ft; pumped for
45 minutes; chloride concentration, 2,440 mg/L.
LOG
Description of material Depth (ft)
Top soil -- -- ---- --------------- - - - ------ 0-5Medium hard, light brown coral limestone -- 5-40Medium hard, clayey brown coral limestone - 40-55Medium hard, light brown and white limestone ------ - 55-60Medium hard, grayish white limestone - 60-105Medium hard, light brown limestone 105-115Hard, brown clayey limestone - 115-130
184
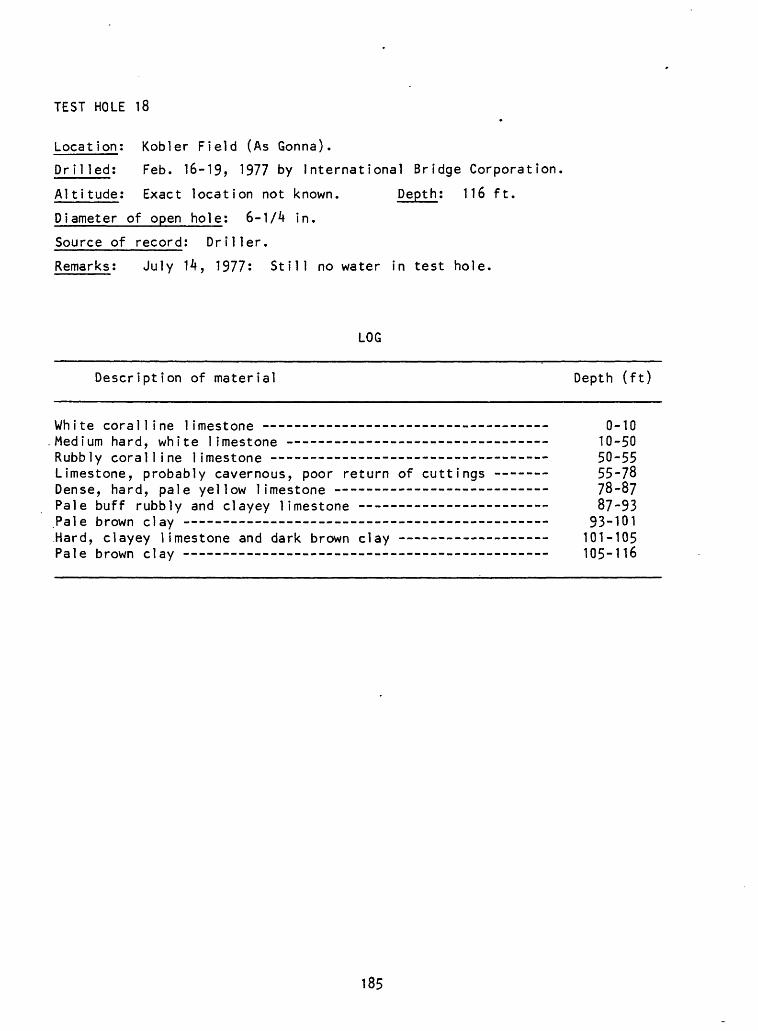
TEST HOLE 18*
Locat ion: Kobler Field (As Gonna).
DrII led: Feb. 16-19, 1977 by International Bridge Corporation
Alti tude: Exact location not known. Depth; 116 ft.
Diameter of open hole: 6-1/4 in.
Source of record; Driller.
Remarks: July 14, 1977: Still no water in test hole.
LOG
Description of material Depth (ft)
White coralline limestone - - - 0-10Medium hard, white limestone - - - - 10-50Rubbly coralline limestone - - - - 50-55Limestone, probably cavernous, poor return of cuttings 55-78Dense, hard, pale yellow limestone - 78-87Pale buff rubbly and clayey limestone - 87-93.Pale brown clay 93-101.Hard, clayey limestone and dark brown clay - 101-105Pale brown clay 105-116
185
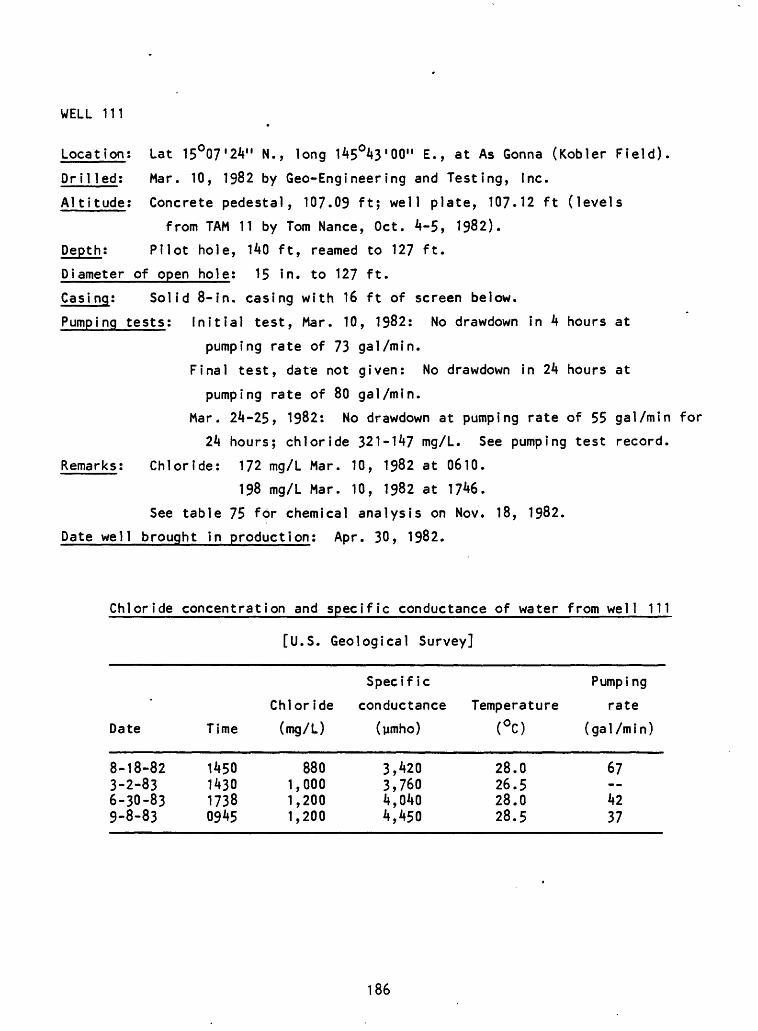
WELL 111*
Location; Lat 15°07'2V' N., long HS^'OO" E., at As Gonna (Kobler Field).
Drilled: Mar. 10, 1982 by Geo-Engineering and Testing, Inc.
Altitude; Concrete pedestal, 107.09 ft; well plate, 107.12 ft (levels
from TAM 11 by Tom Nance, Oct. 4-5, 1982).
Depth; Pilot hole, 140 ft, reamed to 127 ft.
Diameter of open hole; 15 in. to 127 ft.
Casi ng; Solid 8-in. casing with 16 ft of screen below.
Pumping tests; Initial test, Mar. 10, 1982; No drawdown in 4 hours at
pumping rate of 73 gal/min.
Final test, date not given; No drawdown in 24 hours at
pumping rate of 80 gal/min.
Mar. 24-25, 1982; No drawdown at pumping rate of 55 gal/min for
24 hours; chloride 321-147 mg/L. See pumping test record.
Remarks; Chloride; 172 mg/L Mar. 10, 1982 at 0610.
198 mg/L Mar. 10, 1982 at 1746.
See table 75 for chemical analysis on Nov. 18, 1982.
Date well brought in production; Apr. 30, 1982.
Chloride concentration and specific conductance of water from well 111
[U.S. Geological Survey]
Date
8-18-82 3-2-83 6-30-83 9-8-83
Time
1450 1430 1738 0945
Chloride
(mg/L)
880 1,000 1,200 1,200
Specific
conductance
(ymho)
3,420 3,760 4,040 4,450
Temperature<°0
28.026.5 28.0 28.5
Pumping
rate
(gal /mi n)
67
42 37
186
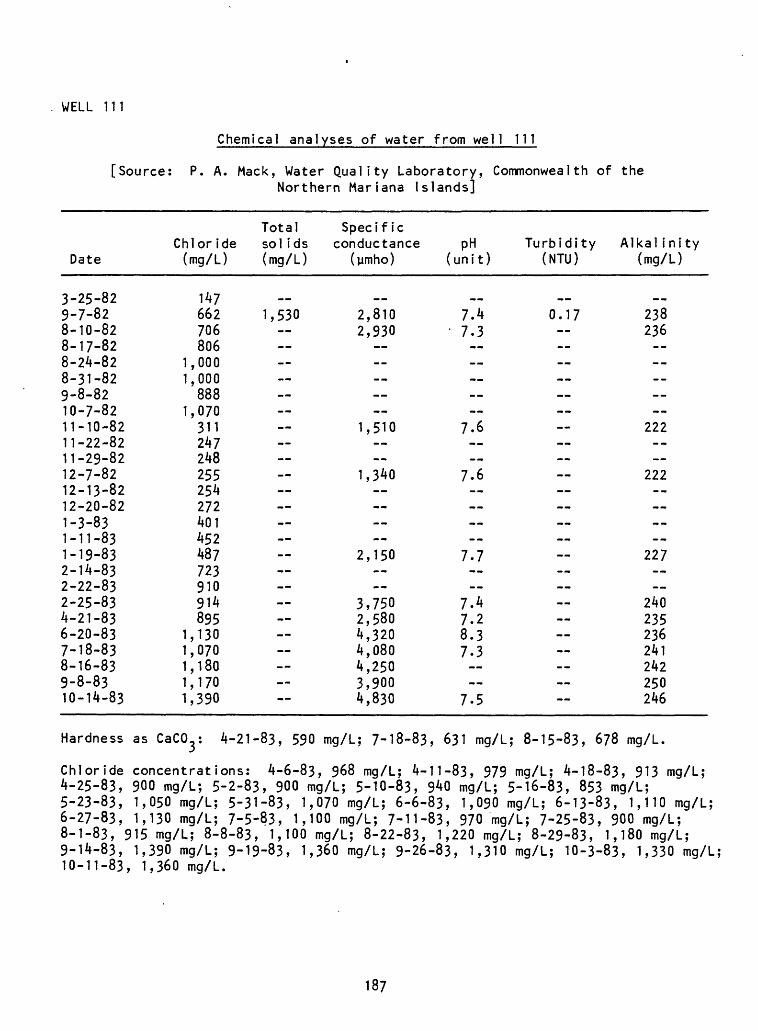
WELL 111
Chemical analyses of water from well 111
[Source: P. A. Mack, Water Quality Laboratory, Commonwealth of theNorthern Mariana Islands]
Date
3-25-829-7-828-10-828-17-828-24-828-31-829-8-8210-7-8211-10-8211-22-8211-29-8212-7-8212-13-8212-20-821-3-831-11-831-19-832-14-832-22-832-25-834-21-836-20-837-18-838-16-839-8-8310-14-83
Chloride (mg/L)
147662706806
1,0001,000888
1,070311247248255254272401452487723910914895
1,1301,0701,1801,1701,390
Total sol ids (mg/L)
..1,530 --
Specif ic conductance
(ymho)
..2,8102,930
1,510
1,340
2,150
3,7502,5804,3204,0804,2503,9004,830
pH (unit)
..7.4
7.3
7.6 --
7.6 ----
7.7
7.47.28.37.3
7.5
Turbidity Alkal ini ty (NTU) (mg/L)
..0.17 238
236
222
222 __
227
240235236241242250246
Hardness as CaCty 4-21-83, 590 mg/L; 7-18-83, 631 mg/L; 8-15-83, 678 mg/L.
4-6-83, 968 mg/L; 4-11-83, 979 mg/L; 4-18-83, 913 mg/L;POO mn/Li ^-10-8^. Q40 mn/1 ; 5-16-8V 8^ mn/l ;
Chloride concentrations:"
7 10-11-83, 1,360 mg/L.
187
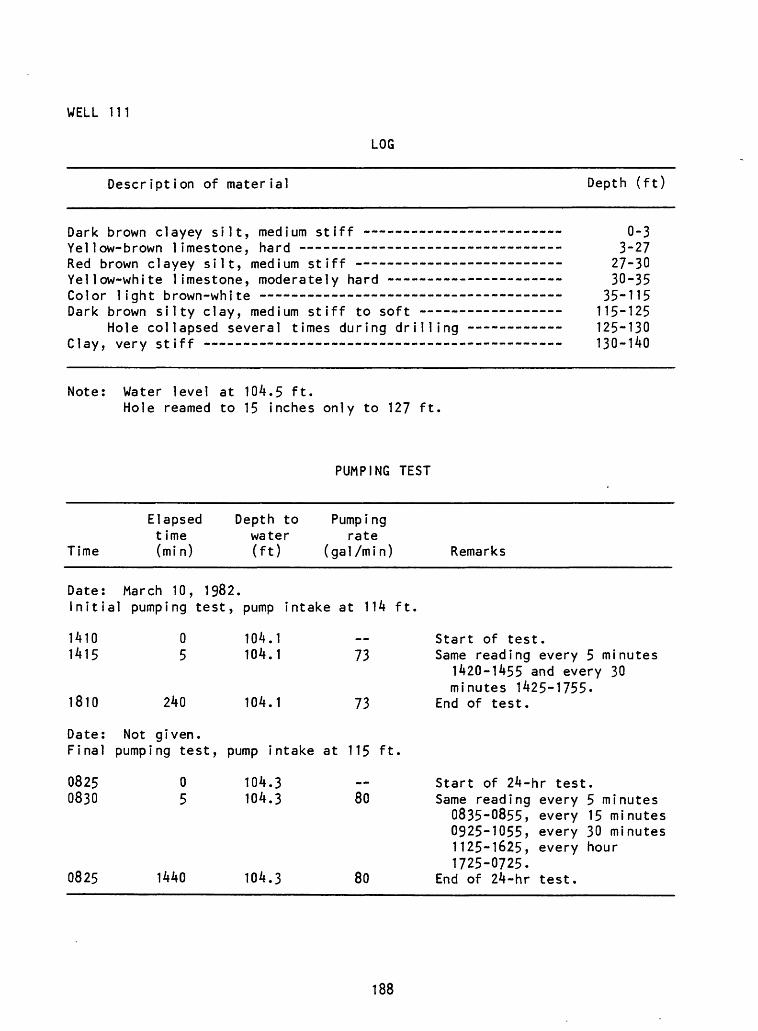
WELL 111
LOG
Description of material Depth (ft)
Dark brown clayey silt, medium stiff - --- - Yellow-brown limestone, hard -- -- ----------Red brown clayey silt, medium stiff - --- --- Yellow-white limestone, moderately hard - -- Color light brown-white Dark brown silty clay, medium stiff to soft -
Hole collapsed several times during drilling Clay, very stiff
0-33-27
27-3030-35
35-115115-125125-130130-140
Note: Water level at 104.5 ft.Hole reamed to 15 inches only to 127 ft.
PUMPING TEST
Time
Elapsedtime(mi n)
Depth towater(ft)
Pumpingrate
( ga 1 /m i n ) Remarks
Date: March 10, 1982.Initial pumping test, pump intake at 114 ft
14101415
1810
05
240
104.1104.1
104.1
73
73
Date: Not given.Final pumping test, pump intake at 115 ft.
08250830
0825 1440
104.3104.3
104.3
80
Start of test.Same reading every 5 minutes
1420-1455 and every 30minutes 1425-1755.
End of test.
80
Start of 24-hr test.Same reading every 5 minutes
0835-0855, every 15 minutes 0925-1055, every 30 minutes 1125-1625, every hour 1725-0725.
End of 24-hr test.
188
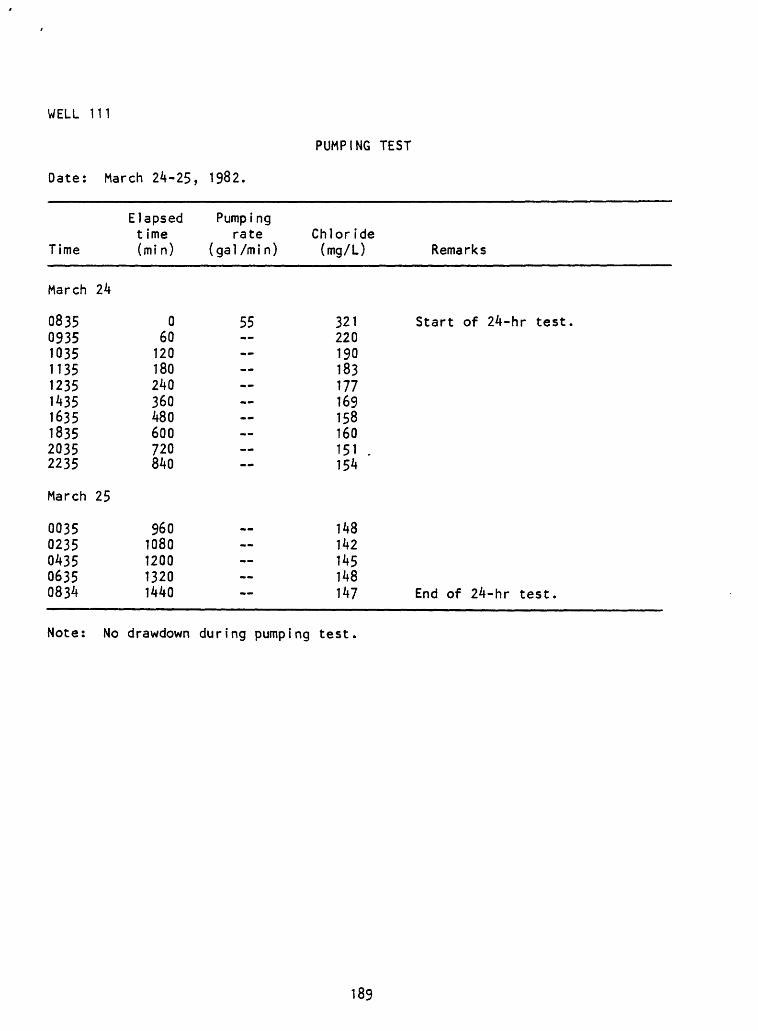
WELL 111
Date: March 24-25, 1982,
PUMPING TEST
Time
March 2k
0835093510351135123514351635183520352235
March 25
00350235043506350834
Elapsed t ime (mi n)
060120180240360480600720840
9601080120013201440
Pump i ng rate
( ga 1 /m i n )
55 --
__
Chlor ide (mg/L) Remarks
321 Start of 24-hr test.220190183177169158160151 .154
148142145148147 End of 24-hr test.
Note: No drawdown during pumping test.
189
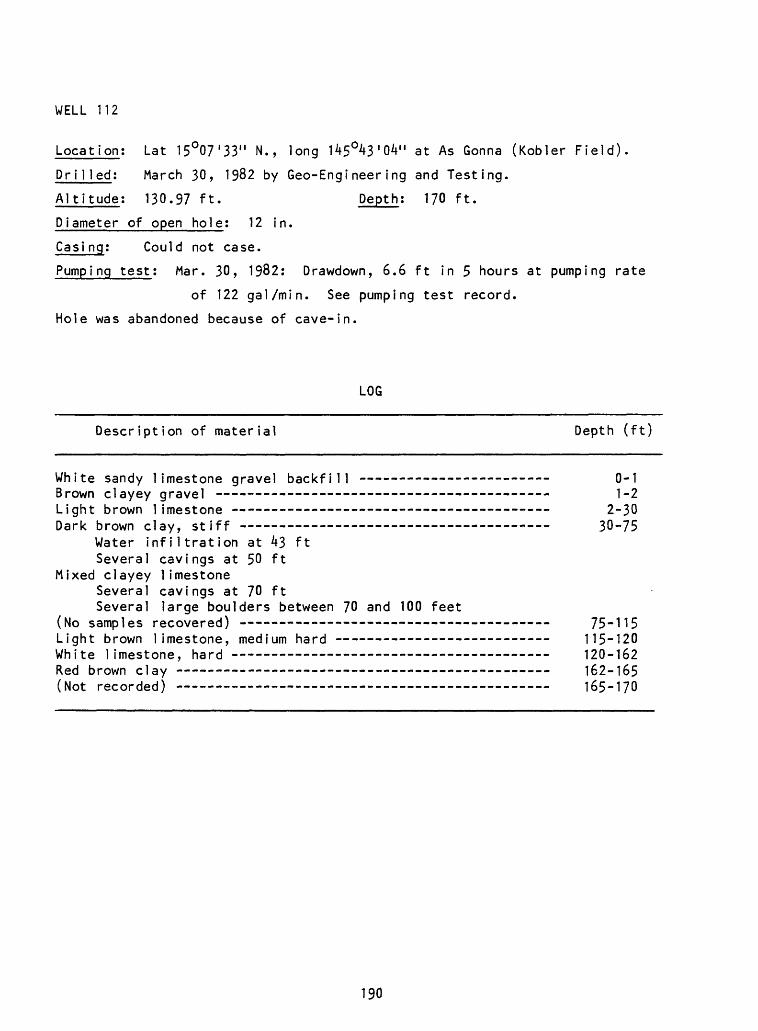
WELL 112
Location: Lat 15O07'33" N., long 145°43'OV' at As Gonna (Kobler Field).
Dri11ed; March 30, 1982 by Geo-Engineering and Testing.
Altitude: 130.97 ft. Depth; 170 ft.
Diameter of open hole; 12 in.
Casi ng: Could not case.
Pumping test: Mar. 30, 1982: Drawdown, 6.6 ft in 5 hours at pumping rate
of 122 gal/min. See pumping test record.
Hole was abandoned because of cave-in.
LOG
Description of material Depth (ft)
White sandy limestone gravel backfill 0-1 Brown clayey gravel 1-2 Light brown limestone 2-30 Dark brown clay, stiff 30-75
Water infiltration at 43 ftSeveral cavings at 50 ft
Mixed clayey limestoneSeveral cavings at 70 ftSeveral large boulders between 70 and 100 feet
(No samples recovered) - - - - --- - - -- 75-115 Light brown limestone, medium hard 115-120 White limestone, hard 120-162 Red brown clay - - 162-165 (Not recorded) 165-170
190
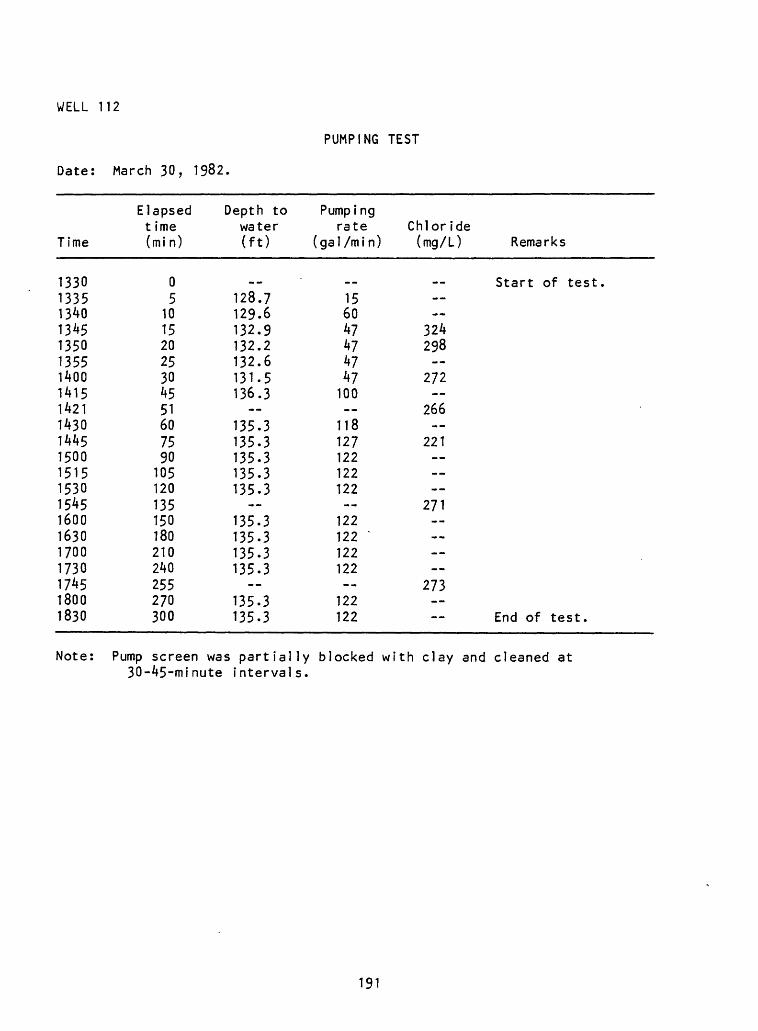
WELL 112
Date: March 30, 1982.
PUMPING TEST
Time
1330133513401345135013551400141514211430144515001515153015451600163017001730174518001830
Elapsed t ime (mi n)
05
10152025304551607590105120135150180210240255270300
Depth to water (ft)
128.7129.6132.9132.2132.6131.5136.3
135.3135.3135.3135.3135.3
135.3135.3135.3135.3
135.3135.3
Pumping rate
(gal /mi n)
156047474747100
118127122122122--
122122 '122122
122122
Chloride (mg/L) Remarks
Start of test.
324298
272
266
221
271----
273
End of test.
Note: Pump screen was partially blocked with clay and cleaned at 30-45-minute intervals.
191
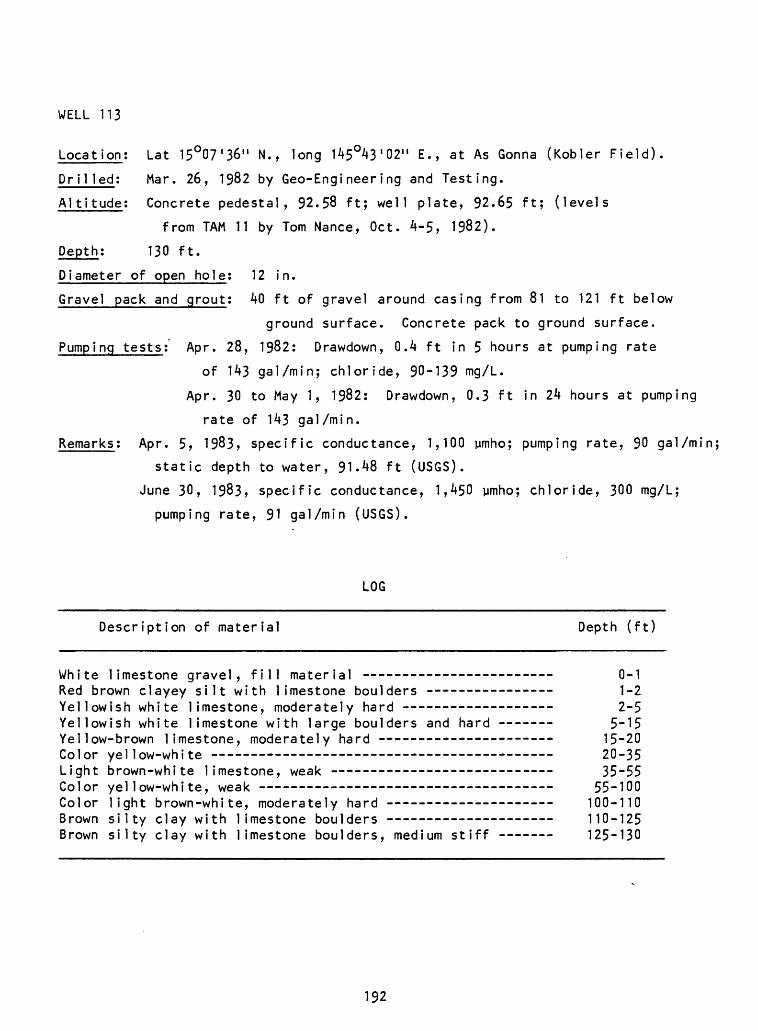
WELL 113
Location: Lat 15°07'36" N., long 145°43'02" E., at As Gonna (Kobler Field).
Dri1 led: Mar. 26, 1982 by Geo-Engineering and Testing.
Altitude; Concrete pedestal, 92.58 ft; well plate, 92.65 ft; (levels
from JAM 11 by Tom Nance, Oct. 4-5, 1982).
Depth; 130 ft.
Diameter of open hole; 12 in.
Gravel pack and grout; 40 ft of gravel around casing from 81 to 121 ft below
ground surface. Concrete pack to ground surface.
Pumping tests; Apr. 28, 1982: Drawdown, 0.4 ft in 5 hours at pumping rate
of 143 gal/min; chloride, 90-139 mg/L.
Apr. 30 to May 1, 1982: Drawdown, 0.3 ft in 24 hours at pumping
rate of 143 gal/min.
Remarks; Apr. 5, 1983, specific conductance, 1,100 vimho; pumping rate, 90 gal/min;
static depth to water, 91.48 ft (USGS).
June 30, 1983, specific conductance, 1,450 vimho; chloride, 300 mg/L;
pumping rate, 91 gal/min (USGS).
LOG
Description of material Depth (ft)
White limestone gravel, fill material ------------------ -- Q-1Red brown clayey silt with limestone boulders ------ _____ \-2Yellowish white limestone, moderately hard -------------- _ 2-5Yellowish white limestone with large boulders and hard 5-15Yellow-brown limestone, moderately hard - 15-20Color yellow-white -- 20-35Light brown-white limestone, weak - - 35-55Color yellow-white, weak - 55-100Color light brown-white, moderately hard - - 100-110Brown silty clay with limestone boulders - 110-125Brown silty clay with limestone boulders, medium stiff 125-130
192
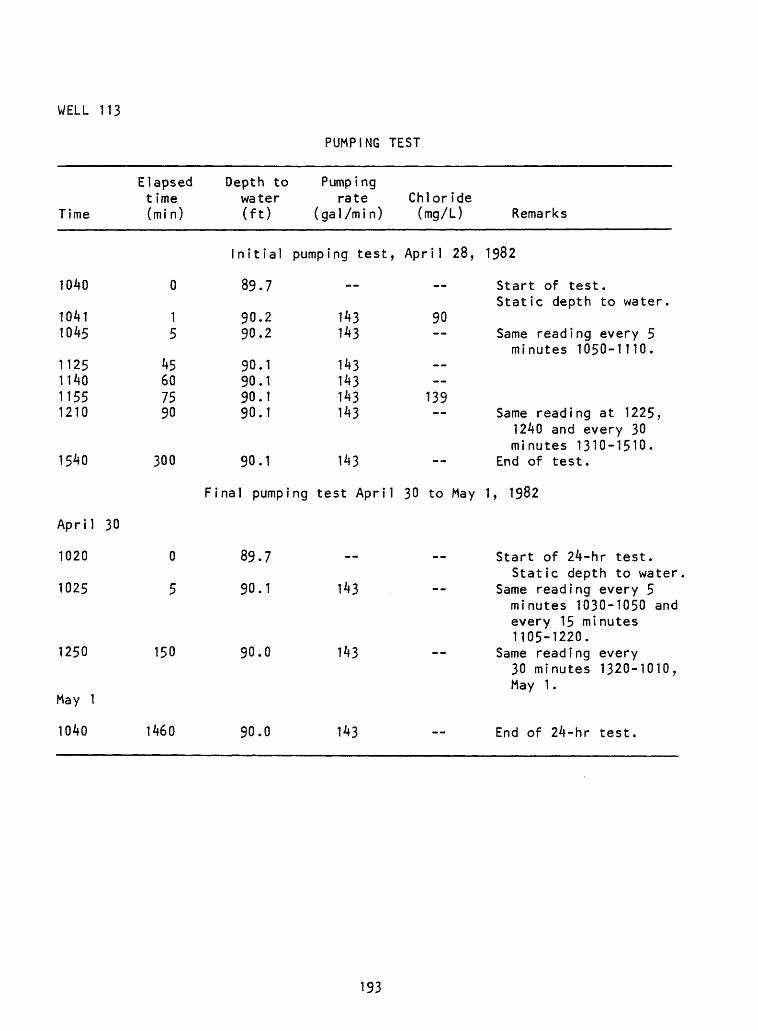
WELL 113
PUMPING TEST
Time
1040
10411045
1125114011551210
1540
April 30
1020
1025
1250
May 1
1040
Elapsed t ime (mi n)
0
15
45607590
300
0
5
150
1460
Depth to water (ft)
Initial
89.7
90.290.2
90.190.190.190.1
90.1
Final pumpi
89.7
90.1
90.0
90.0
Pumping rate Chloride
(gal /mi n) (mg/L)
pumping test, April 28,
__ __
143 90143
143143143 139143
143
ng test April 30 to May
__
143 .
143
143
Remarks
1982
Start of test.Static depth to water.
Same reading every 5minutes 1050-1110.
Same reading at 1225,1240 and every 30minutes 1310-1510.
End of test.
1, 1982
Start of 24-hr test.Static depth to water
Same reading every 5minutes 1030-1050 andevery 15 minutes1105-1220.
Same reading every30 minutes 1320-1010,May 1.
End of 24-hr test.
193
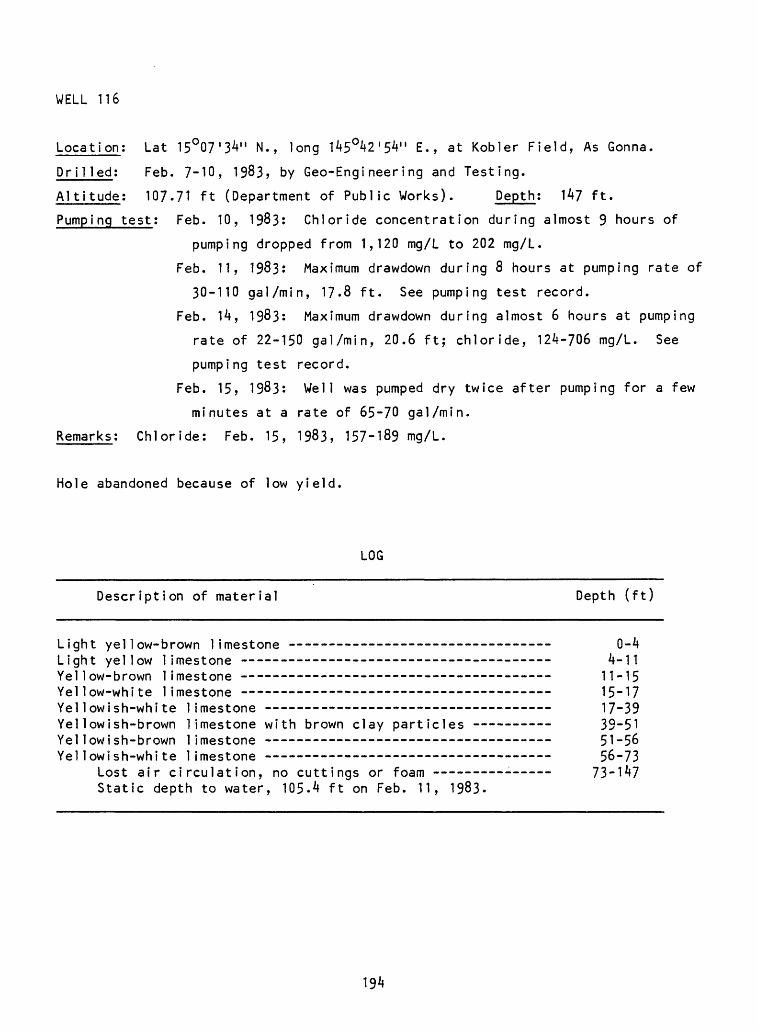
WELL 116
Location; Lat 15°07'34" N., long 145°42'54" E., at Kobler Field, As Gonna.
Dr i 1 led: Feb. 7-10, 1983, by Geo-Engineering and Testing.
Altitude; 107.71 ft (Department of Public Works). Depth; 147 ft.
Pumping test; Feb. 10, 1983; Chloride concentration during almost 9 hours of
pumping dropped from 1,120 mg/L to 202 mg/L.
Feb. 11, 1983; Maximum drawdown during 8 hours at pumping rate of
30-110 gal/min, 17.8 ft. See pumping test record.
Feb. 14, 1983: Maximum drawdown during almost 6 hours at pumping
rate of 22-150 gal/min, 20.6 ft; chloride, 124-706 mg/L. See
pumping test record.
Feb. 15, 1983: Well was pumped dry twice after pumping for a few
minutes at a rate of 65-70 gal/min.
Remarks; Chloride: Feb. 15, 1983, 157-189 mg/L.
Hole abandoned because of low yield.
LOG
Description of material Depth (ft)
Light yellow-brown limestone 0-4Light yellow limestone -- ---- -_ -_ - 4-11Yellow-brown limestone - ---- ----- - -_-___ 11-15Yellow-white limestone - -- - - - ----- - 15-17Yellowish-white limestone 17-39Yellowish-brown limestone with brown clay particles 39-51Yellowish-brown limestone 51-56Yellowish-white limestone - ---- ______________ ____ 56-73
Lost air circulation, no cuttings or foam - -____ 73-1^7Static depth to water, 105-4 ft on Feb. 11, 1983.
194
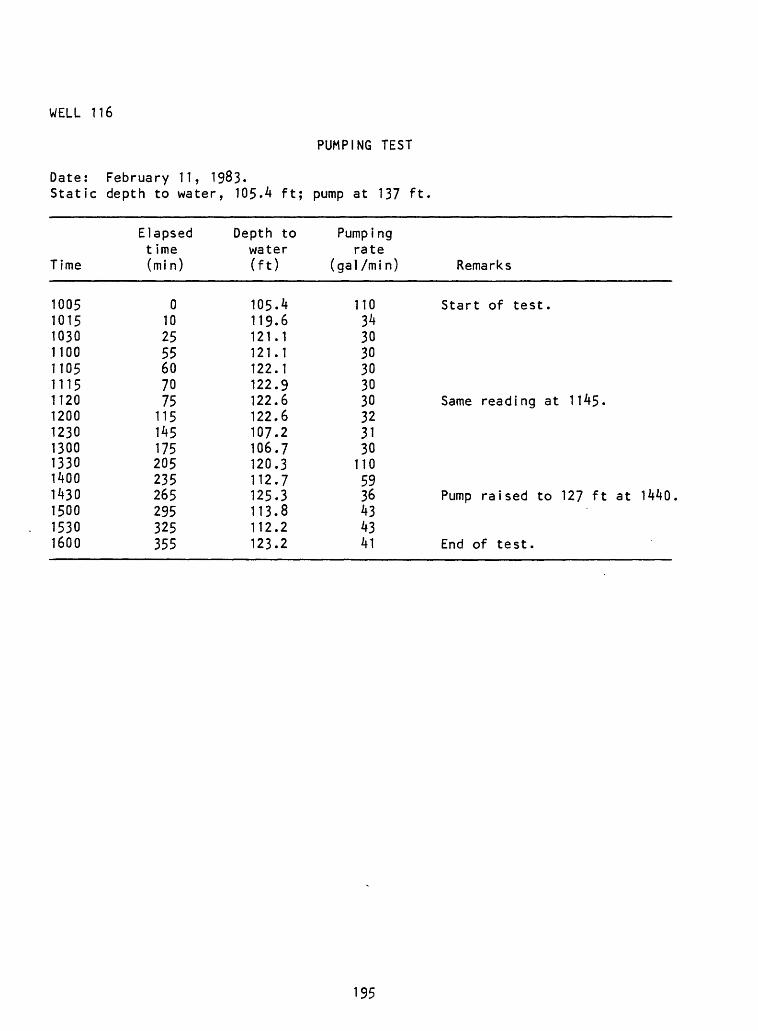
WELL 116
PUMPING TEST
Date: February 11, 1983.Static depth to water, 105.4 ft; pump at 137 ft
Time
1005101510301100110511151120120012301300133014001430150015301600
Elapsed t ime (mi n)
0102555607075
115145175205235265295325355
Depth to water (ft)
105.4119.6121.1121.1122.1122.9122.6122.6107.2106.7120.3112.7125.3113.8112.2123.2
Pumpi ng rate
(gal/min) Remarks
110 Start of test.343030303030 Same reading at 1145.3231301105936 Pump raised to 127 ft at 1440434341 End of test.
195
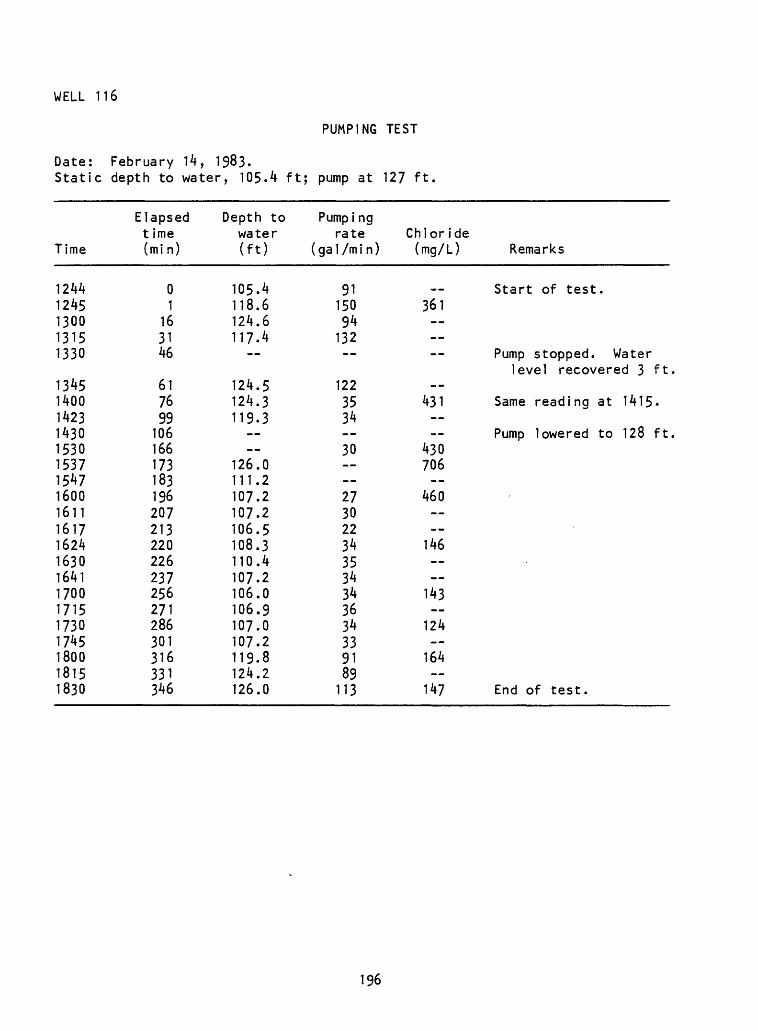
WELL 116
PUMPING TEST
Date: February 14, 1983.Static depth to water, 105.4 ft; pump at 127 ft
Time
12441245130013151330
13451400142314301530153715471600161116171624163016411700171517301745180018151830
Elapsed t ime (mi n)
01
163146
617699
106166173183196207213220226237256271286301316331346
Depth to water (ft)
105.4118.6124.6117.4
124.5124.3119.3
126.0111.2107.2107.2106.5108.3110.4107.2106.0106.9107.0107.2119.8124.2126.0
Pumping rate
(gal/min)
9115094132
1223534 30 273022343534343634339189113
Chloride (mg/L) Remarks
Start of test.361
Pump stopped. Waterlevel recovered 3 ft
431 Same reading at 1415.
Pump lowered to 128 ft430706
460
146
143
124
164
147 End of test.
196
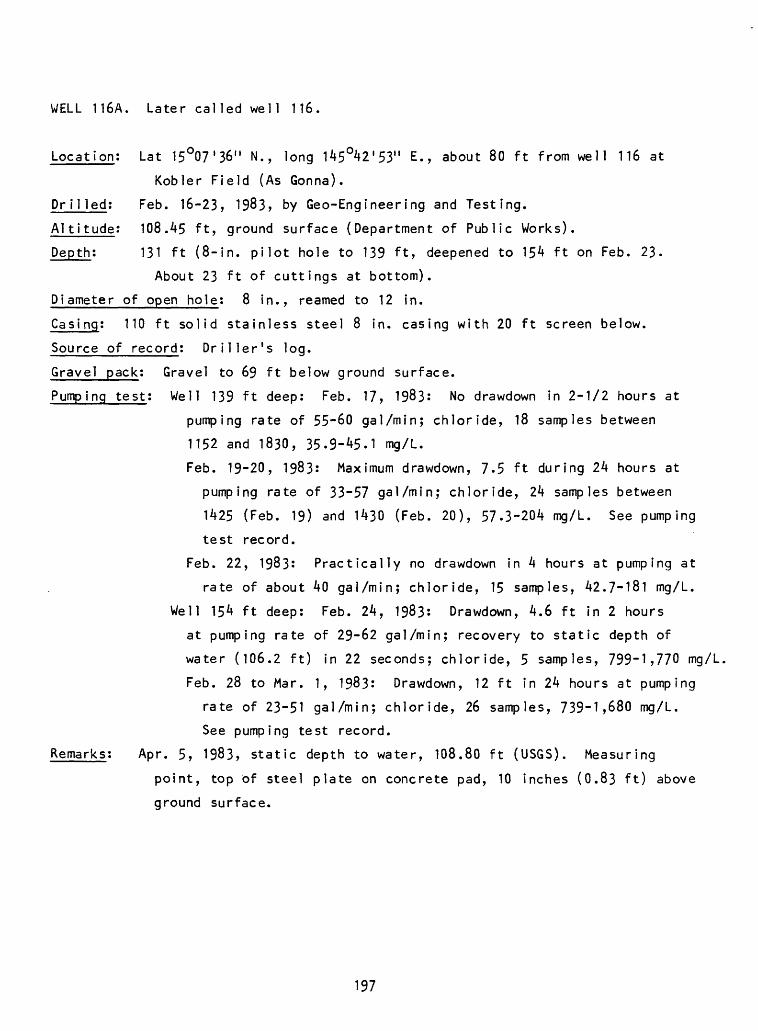
WELL 116A. Later called well 116.
Location; Lat 15°07'36" N., long 145°42'53" E., about 80 ft from well 116 at
Kobler Field (As Gonna).
Dr i1 led; Feb. 16-23, 1983, by Geo-Engineering and Testing.
Altitude; 108.45 ft, ground surface (Department of Public Works).
Depth; 131 ft (8-in. pilot hole to 139 ft, deepened to 154 ft on Feb. 23.
About 23 ft of cuttings at bottom).
Diameter of open hole; 8 in., reamed to 12 in.
Casi ng; 110 ft solid stainless steel 8 in. casing with 20 ft screen below.
Source of record; Driller's log.
Gravel pack; Gravel to 69 ft below ground surface.
Pumping test; Well 139 ft deep; Feb. 17, 1983; No drawdown in 2-1/2 hours at
pumping rate of 55~60 gal/min; chloride, 18 samples between
1152 and 1830, 35-9-45.1 mg/L.
Feb. 19-20, 1983; Maximum drawdown, 7.5 ft during 24 hours at
pumping rate of 33-57 gal/min; chloride, 24 samples between
1425 (Feb. 19) and 1430 (Feb. 20), 57.3-204 mg/L. See pumping
test record.
Feb. 22, 1983; Practically no drawdown in 4 hours at pumping at
rate of about 40 gal/min; chloride, 15 samples, 42.7-181 mg/L.
Well 154 ft deep; Feb. 24, 1983: Drawdown, 4.6 ft in 2 hours
at pumping rate of 29-62 gal/min; recovery to static depth of
water (106.2 ft) in 22 seconds; chloride, 5 samples, 799-1,770 mg/L,
Feb. 28 to Mar. 1, 1983; Drawdown, 12 ft in 24 hours at pumping
rate of 23-51 gal/min; chloride, 26 samples, 739-1,680 mg/L.
See pumping test record.
Remarks; Apr. 5, 1983, static depth to water, 108.80 ft (USGS). Measuring
point, top of steel plate on concrete pad, 10 inches (0.83 ft) above
ground surface.
197
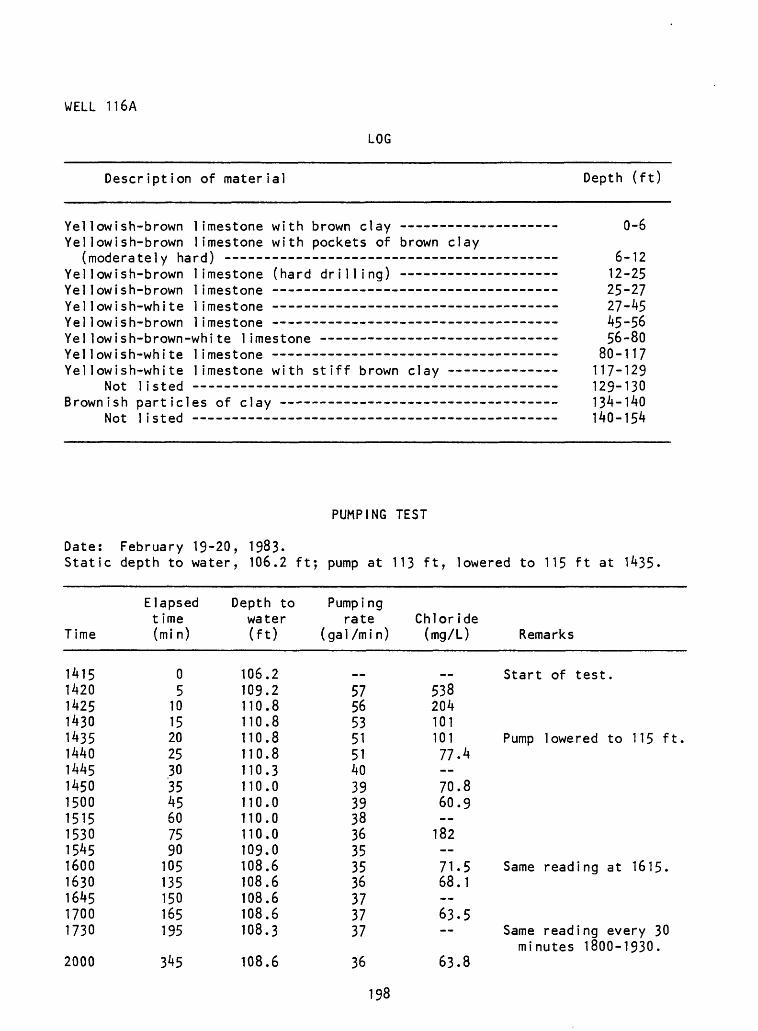
WELL 116A
LOG
Description of material Depth (ft)
Yellowish-brown limestoneYellowish-brown limestone
(moderately hard) ---
with with
brown clay pockets of brown clay
Yellowish-brown Yellowish-brown Yel1owish-white Yellowish-brown Yellowish-brown- Yel1owish-white Yel1owish-white
Not 1 isted ----------Brownish particles of clay
Not 1 isted ----------
imestone (hard drilling) imestone - imestone -- - -------------imestone ----- -------- --.
1 imestone imestone ------- __-______-.imestone with stiff brown clay
0-6
6-1212-2525-2727-4545-5656-80
80-117117-129129-130134-140140-154
PUMPING TEST
Date: February 19-20, 1983.Static depth to water, 106.2 ft; pump at 113 ft, lowered to 115 ft at 1435.
Time
14151420142514301435144014451450150015151530154516001630164517001730
2000
Elapsed t ime (mi n)
05
10152025303545607590105135150165195
345
Depth to water (ft)
106.2109.2110.8110.8110.8110.8110.3110.0110.0110.0110.0109.0108.6108.6108.6108.6108.3
108.6
Pumping rate
( ga 1 /m i n )
57565351514039393836353536373737
36
Chloride (mg/L) Remarks
Start of test.538204101101 Pump lowered to 115 ft.77.4 70.860.9 182 71.5 Same reading at 1615.68.1 63.5
Same reading every 30minutes 1800-1930.
63.8
198
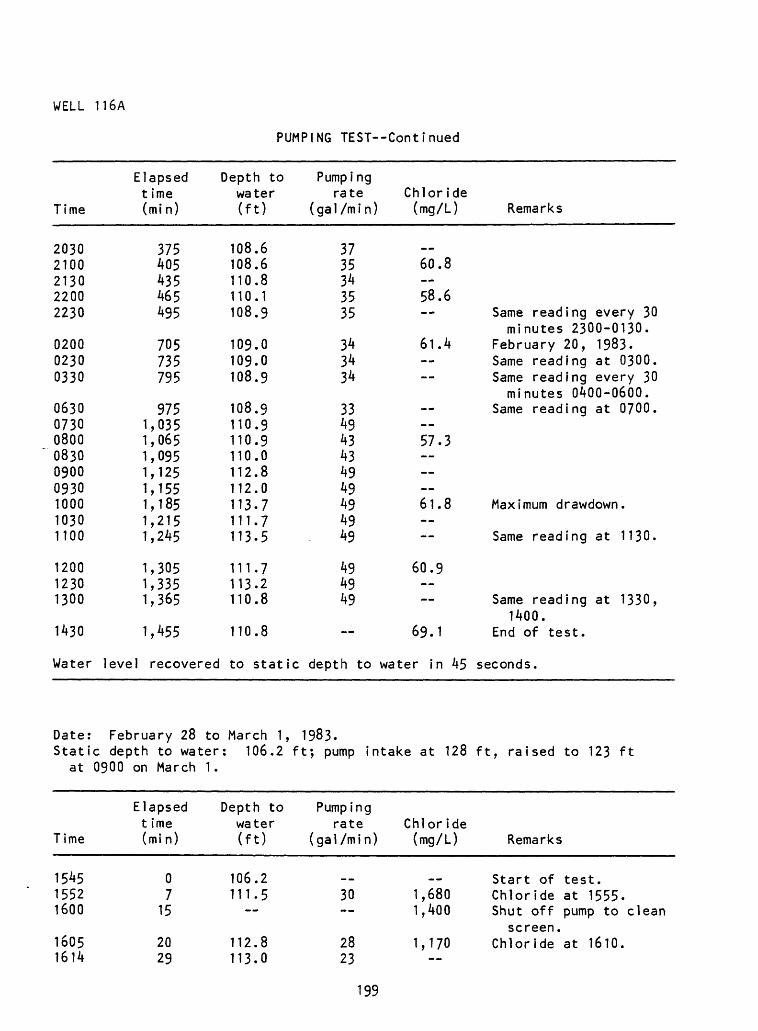
WELL 116A
PUMPING TEST Continued
Time
Elapsed Depth to Pumpingtime water rate Chloride(min) (ft) (gal/min) (mg/L) Remarks
20302100213022002230
020002300330
063007300800083009000930100010301100
120012301300
1430
375405435465495
705735795
9751,0351,0651,0951,1251,1551,1851,2151,245
1,3051,3351,365
1,455
108,108110110108.9
109.0109.0108.9
108110110110112,112.113.111,113.5
111.7113.2110.8
110.8
3735343535
343434
334943434949494949
494949
60.8
58.6
61.4
Same reading every 30 minutes 2300-0130.
February 20, 1983.Same reading at 0300.Same reading every 30 minutes 0400-0600.
Same reading at 0700.
57.3
61.8
60.9
69.1
Maximum drawdown.
Same reading at 1130.
Same reading at 1330,1400.
End of test.
Water level recovered to static depth to water in 45 seconds.
Date: February 28 to March 1, 1983.Static depth to water: 106.2 ft; pump intake at 128 ft, raised to 123 ft
at 0900 on March 1.
Time
154515521600
16051614
Elapsedt ime(mi n)
07
15
2029
Depth towater(ft)
106.2111.5
112.8113.0
Pumpingrate
(gal /mi n)
30
2823
Chloride(mg/L)
1,6801,400
1,170
Remarks
Start of test.Chloride at 1555.Shut off pump to clean
screen.Chloride at 1610.
199
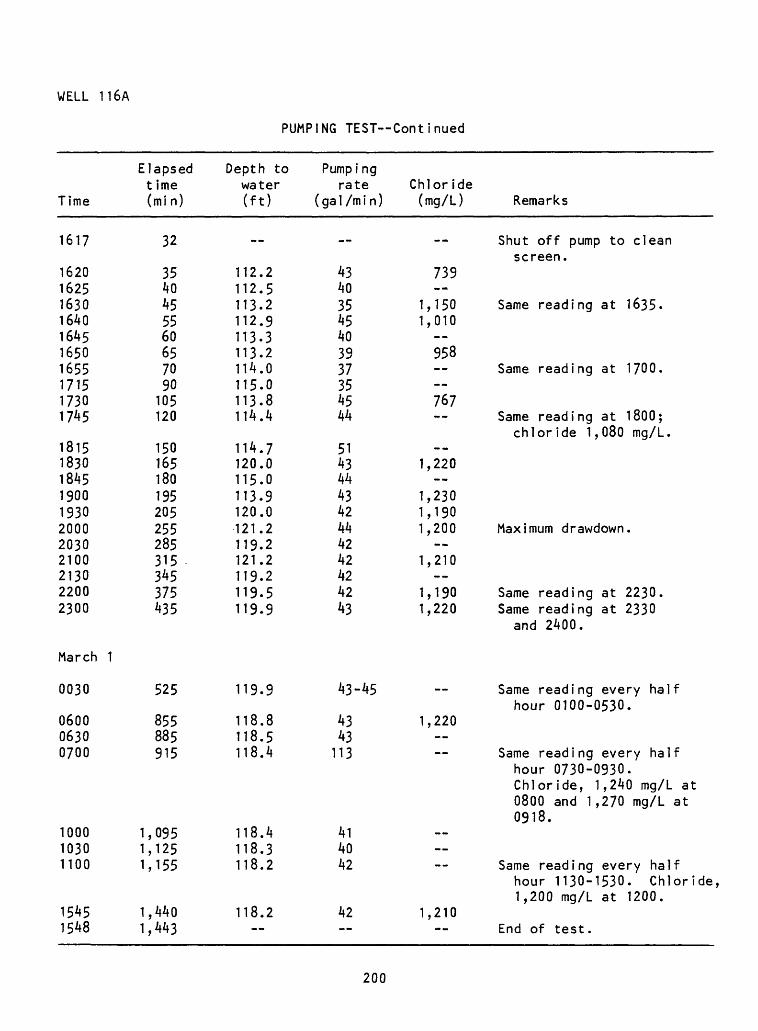
WELL 116A
PUMPING TEST Continued
Time
1617
16201625163016401645165016551715173017^5
18151830184519001930200020302100213022002300
March 1
0030
060006300700
100010301100
15451548
Elapsed time (mi n)
32
3540455560657090105120
150165180195205255285315345375435
525
855885915
1,0951,1251,155
1,4401,443
Depth to water (ft)
__
112.2112.5113.2112.9113.3113.2114.0115.0113.8114.4
114.7120.0115.0113.9120.0121.2119.2121.2119.2119.5119.9
119.9
118.8118.5118.4
118.4118.3118.2
118.2
Pumping rate
(gal/min)
__
43403545403937354544
5143444342444242424243
43-45
4343113
414042
42
Chloride (mg/L)
__
739
1,1501,010 958 767
--1,220
1,2301,1901,200
1,210--
1,1901,220
1,220
1,210--
Remarks
Shut off pump to cleanscreen.
Same reading at 1635-
Same reading at 1700.
Same reading at 1800;chloride 1,080 mg/L.
Maximum drawdown.
Same reading at 2230.Same reading at 2330
and 2400.
Same reading every halfhour 0100-0530.
Same reading every halfhour 0730-0930.Chloride, 1 ,240 mg/L at0800 and 1 ,270 mg/L at0918.
Same reading every halfhour 1130-1530. Chloride,1,200 mg/L at 1200.
End of test.
200
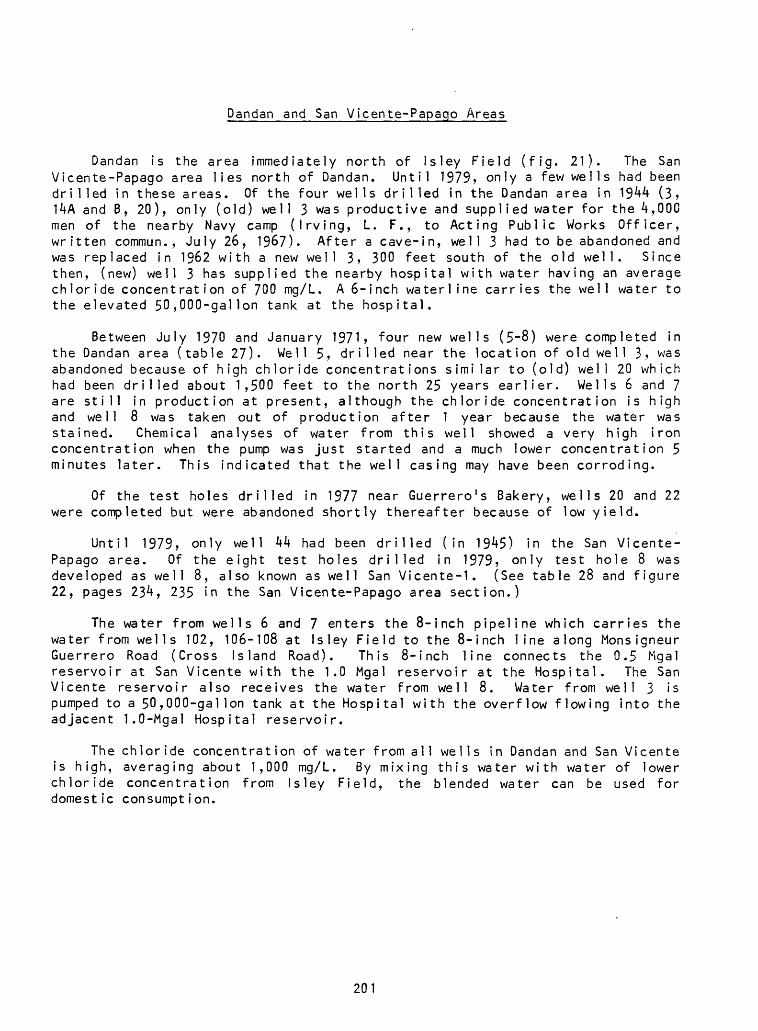
pandan and San Vicente-Papago Areas
Dandan is the area immediately north of Isley Field (fig. 21). The San Vicente-Papago area lies north of Dandan. Until 1979, only a few wells had been drilled in these areas. Of the four wells drilled in the Dandan area in 1944 (3, 14A and B, 20), only (old) well 3 was productive and supplied water for the 4,000 men of the nearby Navy camp (Irving, L. F., to Acting Public Works Officer, written commun. , July 26, 1967). After a cave-in, well 3 had to be abandoned and was replaced in 1962 with a new well 3, 300 feet south of the old well. Since then, (new) well 3 has supplied the nearby hospital with water having an average chlor ide concent rat ion of 700 mg/L. A 6-inch waterline carries the we 11 water to the elevated 50,000-galIon tank at the hospital.
Between July 1970 and January 1971, four new wells (5-8) were completed in the Dandan area (table 27). Well 5, drilled near the location of old well 3, was abandoned because of high chloride concentrations similar to (old) well 20 which had been drilled about 1,500 feet to the north 25 years earlier. Wells 6 and 7 are still in production at present, although the chloride concentration is high and well 8 was taken out of production after 1 year because the water was stained. Chemical analyses of water from this well showed a very high iron concentration when the pump was just started and a much lower concentration 5 minutes later. This indicated that the well casing may have been corroding.
Of the test holes drilled in 1977 near Guerrero's Bakery, wells 20 and 22 were completed but were abandoned shortly thereafter because of low yield.
Until 1979, only well 44 had been drilled (in 1945) in the San Vicente- Papago area. Of the eight test holes drilled in 1979, only test hole 8 was developed as well 8, also known as well San Vicente-1. (See table 28 and figure 22, pages 234, 235 in the San Vicente-Papago area section.)
The water from wells 6 and 7 enters the 8-inch pipeline which carries the water from wells 102, 106-108 at Isley Field to the 8-inch line along Monsigneur Guerrero Road (Cross Island Road). This 8-inch line connects the 0.5 Mgal reservoir at San Vicente with the 1.0 Mgal reservoir at the Hospital. The San Vicente reservoir also receives the water from well 8. Water from well 3 is pumped to a 50,000-gal Ion tank at the Hospital with the overflow flowing into the adjacent 1.0-Mgal Hospital reservoir.
The chloride concentration of water from all wells in Dandan and San Vicente is high, averaging about 1,000 mg/L. By mixing this water with water of lower chloride concentration from Isley Field, the blended water can be used for domestic consumption.
201
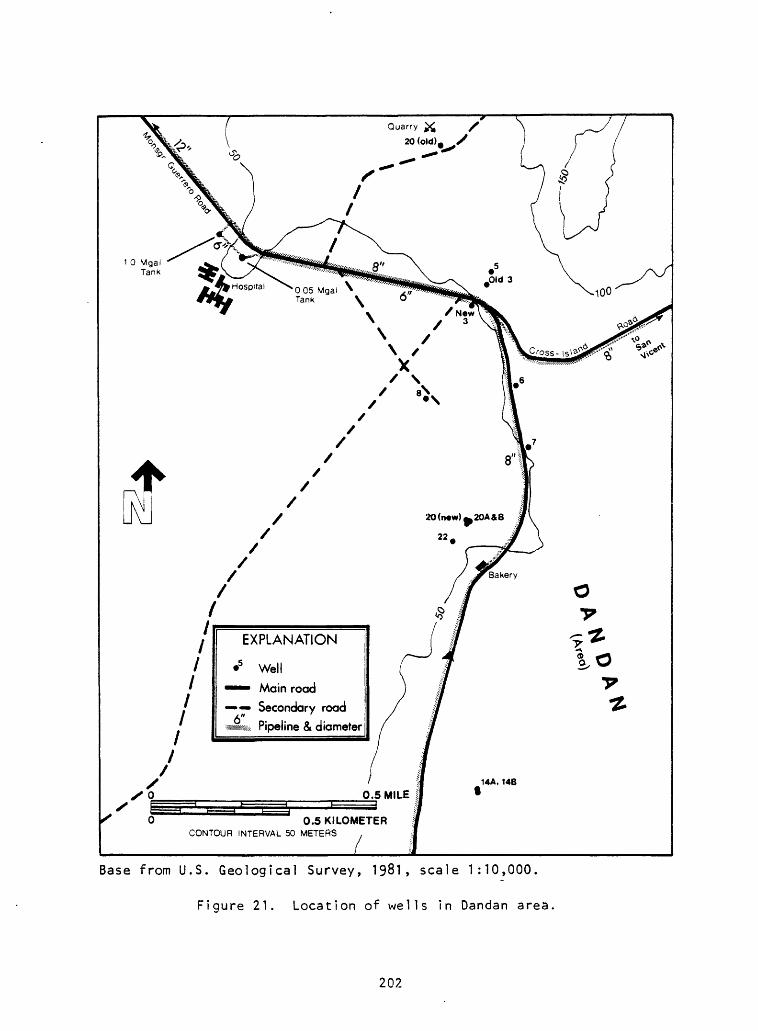
1 0 Mgal Tank
/>' (Ls f
R^/
/
EXPLANATION
5 Well " Main road
Secondary road
Pipeline & diameter
0.5 KILOMETERCONTOUR INTERVAL 50 METERS
/Base from U.S. Geological Survey, 1981, scale 1:10,000.
Figure 21. Location of wells In Dandan area
202
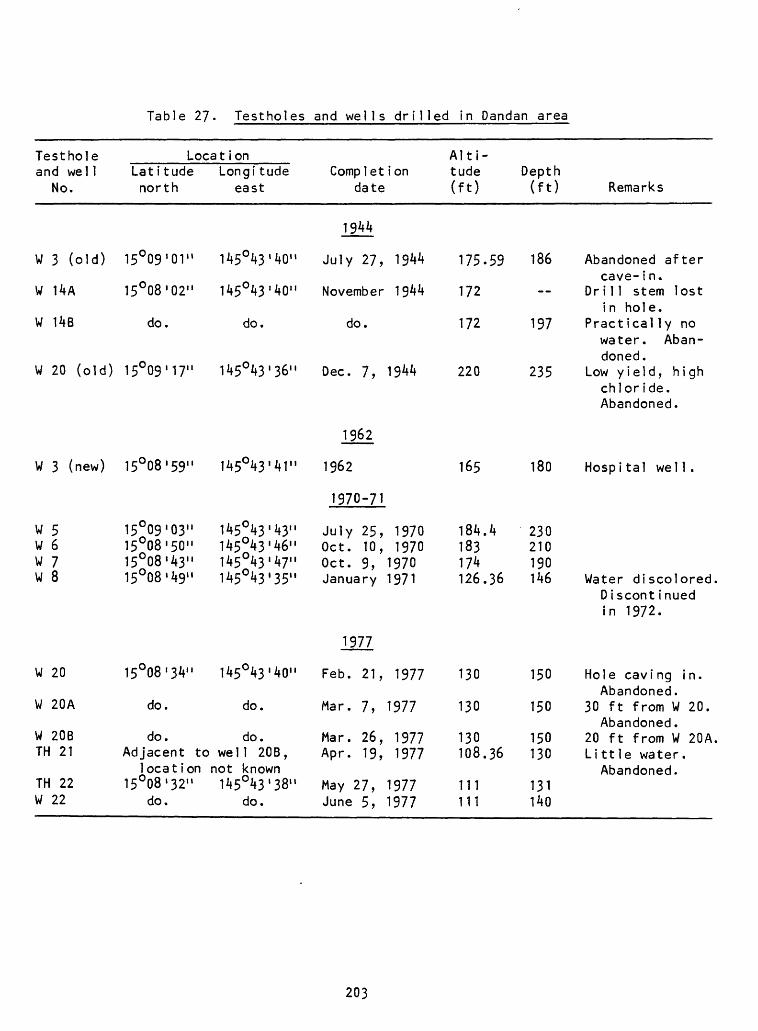
Table 27. Testholes and wells drilled in Dandan area
Testhole and wel 1
No.
W
W
W
W
W
WWWW
W
W
WTH
3 (old)
14A
14B
20 (old)
3 (new)
5678
20
20A
20B21
Locat ionLatitude north
15
15
15
15
15151515
15
°09
°08
do
°09
°08
°09°08°08°08
°08
do
do
01"
02"
.
17"
'59"
03" 50" 43" 49"
34"
.
.Adjacent to
locationTHW
2222
15°08
do 32"
Longi tude east
145
145
145
145
145145145145
145
welnot145
°43'40"
°43'40"
do.
°43'36"
°43'41"
°43'43"°43'46"043'47"°43'35"
°43'40"
do.
do.1 20B,known°43'38"
do.
Complet date
1944
July 27,
November
do.
Dec. 7,
1962
1962
1970-71
July 25,Oct. 10,Oct. 9,January
1977
Feb. 21,
Mar. 7,
Mar. 26,Apr. 19,
May 27,June 5,
ion
1944
1944
1944
19701970
19701971
1977
1977
19771977
19771977
Alti tude (ft)
175.59
172
172
220
165
184.4183174126.36
130
130
130108.36
111111
Depth (ft)
186
197
235
180
230210190146
150
150
150130
131140
Remarks
Abandoned aftercave- in.
Drill stem lostin hole.
Pract ical ly nowater. Abandoned.
Low yield, h ighchlor ide.Abandoned.
Hospi tal wel 1 .
Water discoloredDiscont inuedin 1972.
Hole caving in.Abandoned.
30 ft from W 20.Abandoned.
20 ft from W 20ALi tt le water .
Abandoned.
203
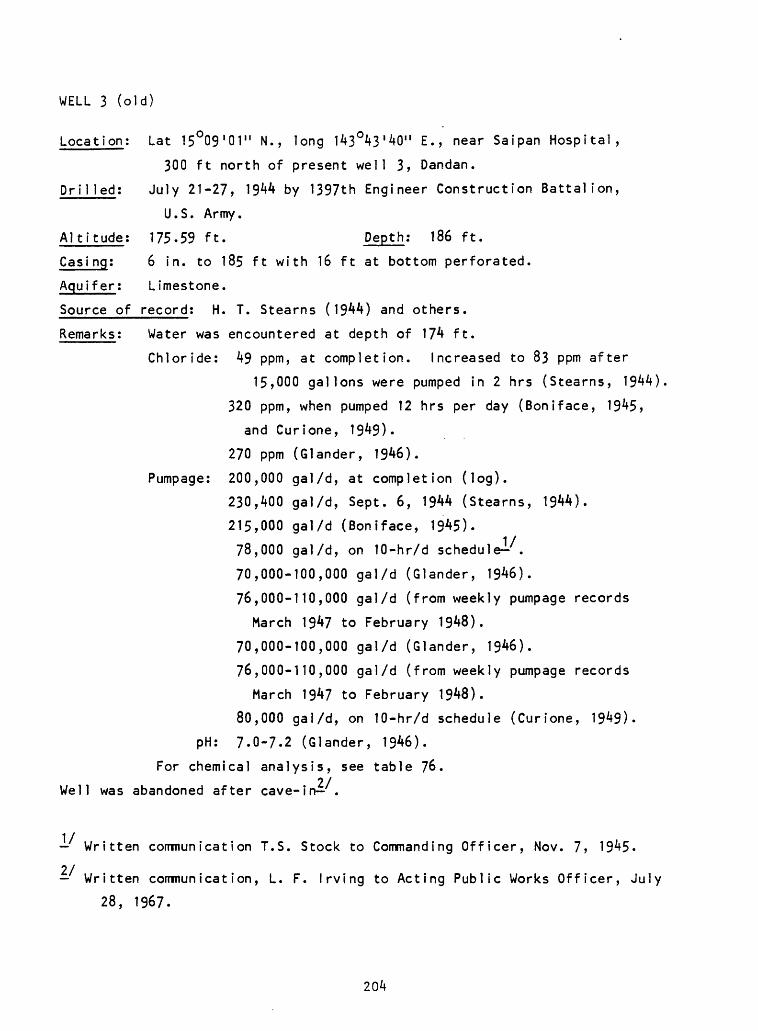
WELL 3 (old)
Location: Lat 15°09'01" N., long 143°43'40" E., near Saipan Hospital,
300 ft north of present well 3, Dandan.
Drilled; July 21-27, 19Mf by 1397th Engineer Construction Battalion,
U.S. Army.
Altitude: 175.59 ft. Depth: 186 ft.
Casi ng: 6 in. to 185 ft with 16 ft at bottom perforated.
Aquifer: Limestone.
Source of record: H. T. Stearns (1944) and others.
Remarks; Water was encountered at depth of 174 ft.
Chloride: 49 ppm, at completion. Increased to 83 ppm after
15,000 gallons were pumped in 2 hrs (Stearns, 1944)
320 ppm, when pumped 12 hrs per day (Boniface, 1945,
and Curione, 1949).
270 ppm (Glander, 1946).
Pumpage: 200,000 gal/d, at completion (log).
230,400 gal/d, Sept. 6, 1944 (Stearns, 1944).
215,000 gal/d (Boniface, 1945).
78,000 gal/d, on 10-hr/d schedule^.
70,000-100,000 gal/d (Glander, 1946).
76,000-110,000 gal/d (from weekly pumpage records
March 1947 to February 1948).
70,000-100,000 gal/d (Glander, 1946).
76,000-110,000 gal/d (from weekly pumpage records
March 1947 to February 1948).
80,000 gal/d, on 10-hr/d schedule (Curione, 1949).
pH: 7.0-7.2 (Glander, 1946).
For chemical analysis, see table 76.2/ Well was abandoned after cave-in .
Written communication T.S. Stock to Commanding Officer, Nov. 7, 1945.
2/ Written communication, L. F. Irving to Acting Public Works Officer, July
28, 1967.
204
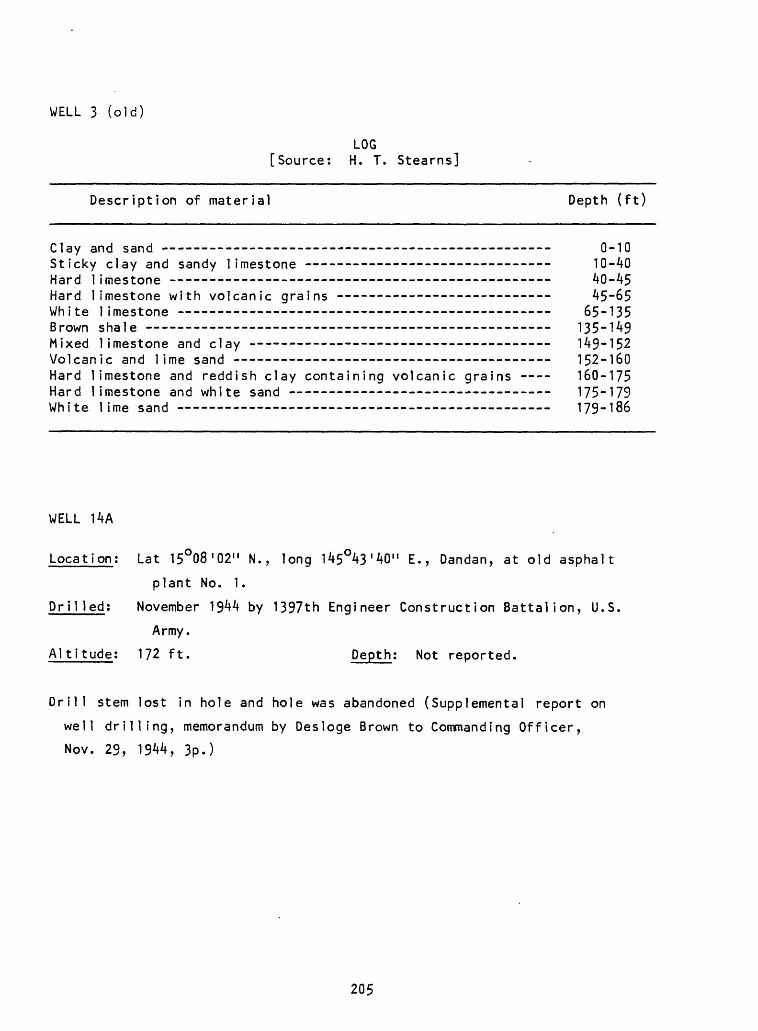
WELL 3 (old)
LOG [Source: H. T. Stearns]
Description of material Depth (ft)
Clay and sand -- -- - ------ 0-10Sticky clay and sandy limestone ----------- ______ ________ 10-40Hard limestone -- 40-45Hard limestone with volcanic grains ---- ----------------- -- 45-65White limestone ------- ________ ____ ___________ _ __ 65-135Brown shale 135-149Mixed limestone and clay - - - - - 149-152Volcanic and lime sand ----- ---------- _____________________ 152-160Hard limestone and reddish clay containing volcanic grains -- 160-175Hard limestone and white sand --- - - - 175-179White lime sand 179-186
WELL 14A
Location: Lat 15O08'02" N., long 145O43'40" E., Dandan, at old asphalt
plant No. 1.
Drilled: November 1944 by 1397th Engineer Construction Battalion, U.S.
Army.
Altitude: 172 ft. Depth: Not reported.
Drill stem lost in hole and hole was abandoned (Supplemental report on
well drilling, memorandum by Desloge Brown to Commanding Officer,
Nov. 29, 1944, 3p.)
205
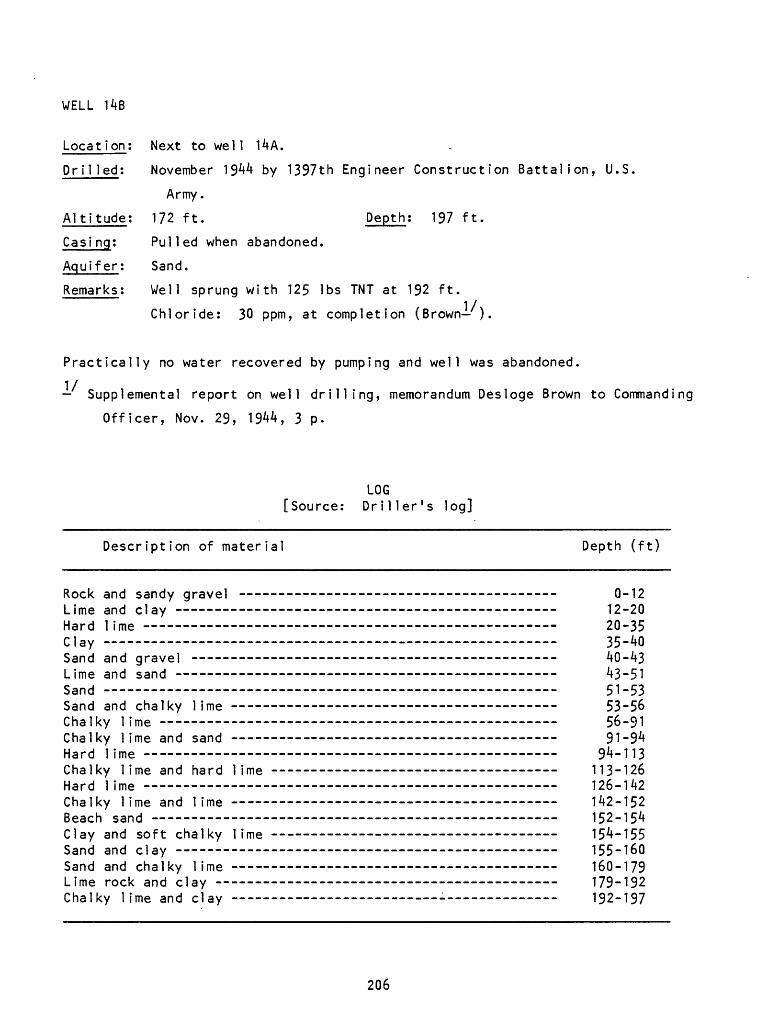
WELL 14B
Location; Next to wel1 14A.
Dr?1led: November 1944 by 1397th Engineer Construction Battalion, U.S
Army.
Altitude; 172 ft. Depth; 197 ft.
Casi ng; Pulled when abandoned.
Aquifer: Sand.
Remarks: Well sprung with 125 Ibs TNT at 192 ft.
Chloride: 30 ppm, at completion (Brown ).
Practically no water recovered by pumping and well was abandoned.
Supplemental report on well drilling, memorandum Desloge Brown to Commanding
Officer, Nov. 29, 1944, 3 p.
[Source;LOG Driller's log]
Description of material Depth (ft)
Rock and sandy gravel 0-12Lime and clay 12-20Hard lime 20-35d a y 35-40Sand and gravel 40-43Lime and sand - ________ _ ____ _____ ________ 43-51Sand 51-53Sand and chalky lime 53-56Chalky lime 56-91Chalky lime and sand 91-94Hard lime -- 94-113Chalky lime and hard lime 113-126Hard lime 126-142Chalky lime and lime 142-152Beach sand 152-154Clay and soft chalky lime -- 154-155Sand and clay 155-160Sand and chalky lime 160-179Lime rock and clay 179-192Chalky lime and clay - 192-197
206
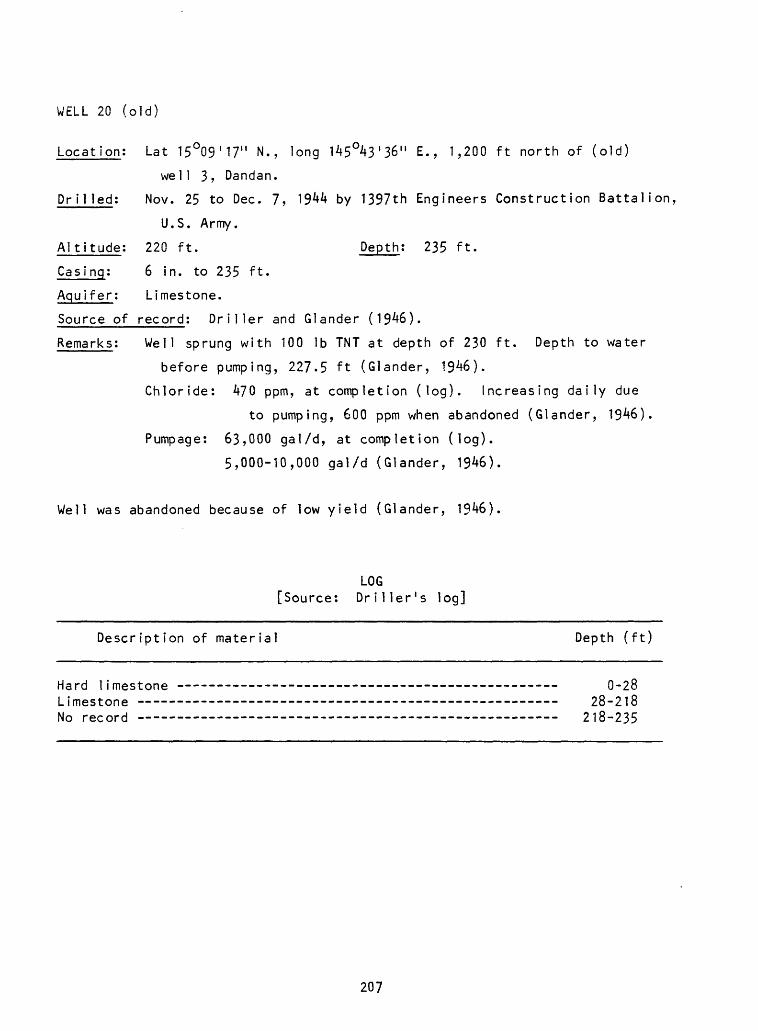
WELL 20 (old)
Location; Lat 15°09'17" N., long 145°43'36" E., 1,200 ft north of (old)
well 3, Dandan.
Dr i1 led; Nov. 25 to Dec. 7, 1944 by 1397th Engineers Construction Battalion,
U.S. Army.
Altitude; 220 ft. Depth; 235 ft.
Casing; 6 in. to 235 ft.
Aquifer; Limestone.
Source of record; Driller and Glander (1946).
Remarks; Well sprung with 100 Ib TNT at depth of 230 ft. Depth to water
before pumping, 227-5 ft (Glander, 1946).
Chloride: 470 ppm, at completion (log). Increasing daily due
to pumping, 600 ppm when abandoned (Glander, 1946).
Pumpage: 63,000 gal/d, at completion (log).
5,000-10,000 gal/d (Glander, 1946).
Well was abandoned because of low yield (Glander, 1946).
LOG [Source; Driller's log]
Description of material Depth (ft)
Hard limestone 0-28Limestone 28-218No record 218-235
207
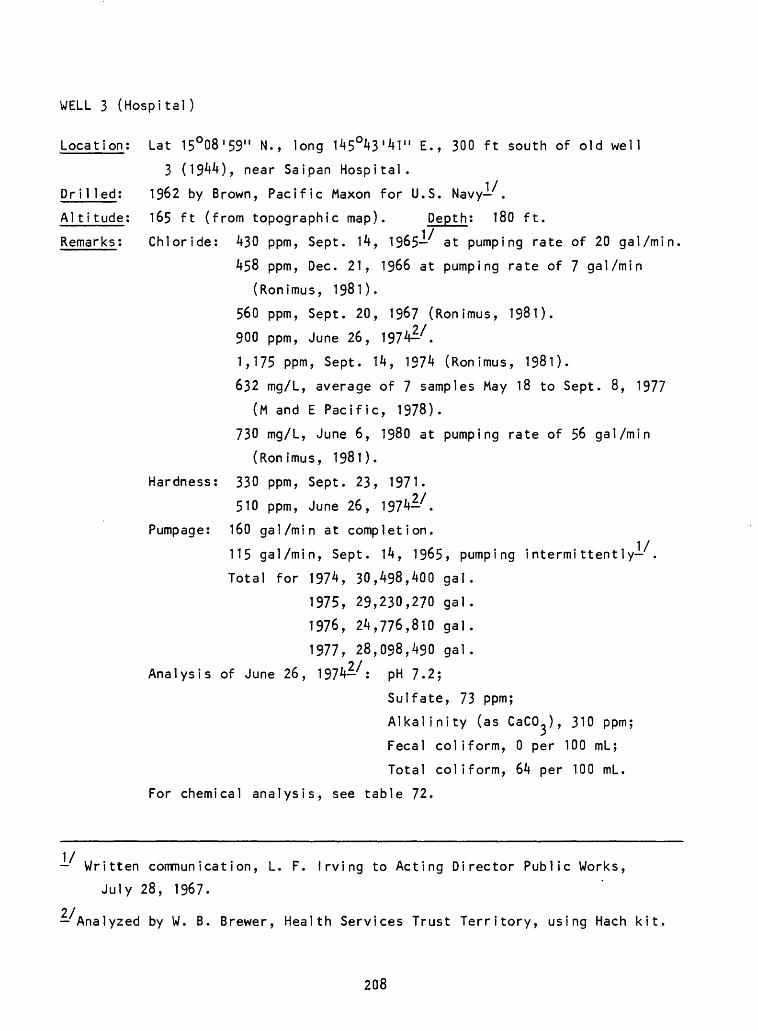
WELL 3 (Hospital)
Location: Lat 15°08'59" N., long 145°43'41" E., 300 ft south of old well
3 0944), near Saipan Hospital.
Drilled; 1962 by Brown, Pacific Maxon for U.S. Navy- .
Alti tude: 165 ft (from topographic map). Depth: 180 ft.
Remarks: Chloride: 430 ppm, Sept. 14, 1965 at pumping rate of 20 gal/min
458 ppm, Dec. 21, 1966 at pumping rate of 7 gal/min
(Ronimus, 1981).
560 ppm, Sept. 20, 1967 (Ronimus, 1981).
900 ppm, June 26, 1974^.
1,175 ppm, Sept. 14, 1974 (Ronimus, 1981).
632 mg/L, average of 7 samples May 18 to Sept. 8, 1977
(M and E Pacific, 1978).
730 mg/L, June 6, 1980 at pumping rate of 56 gal/min
(Ronimus, 1981).
Hardness: 330 ppm, Sept. 23, 1971.
510 ppm, June 26, 1974-7 .
Pumpage: 160 gal/min at completion.
115 gal/min, Sept. 14, 1965, pumping intermittently .
Total for 1974, 30,498,400 gal.
1975. 29,230,270 gal.
1976. 24,776,810 gal.
1977. 28,098,490 gal.
Analysis of June 26, 1974-/ : pH 7.2;
Sulfate, 73 ppm;
Alkalinity (as CaCO ), 310 ppm;
Fecal coliform, 0 per 100 mL;
Total coliform, 64 per 100 mL.
For chemical analysis, see table 72.
Written communication, L. F. Irving to Acting Director Public Works,
July 28, 1967.
2/ Analyzed by W. B. Brewer, Health Services Trust Territory, using Hach kit
208
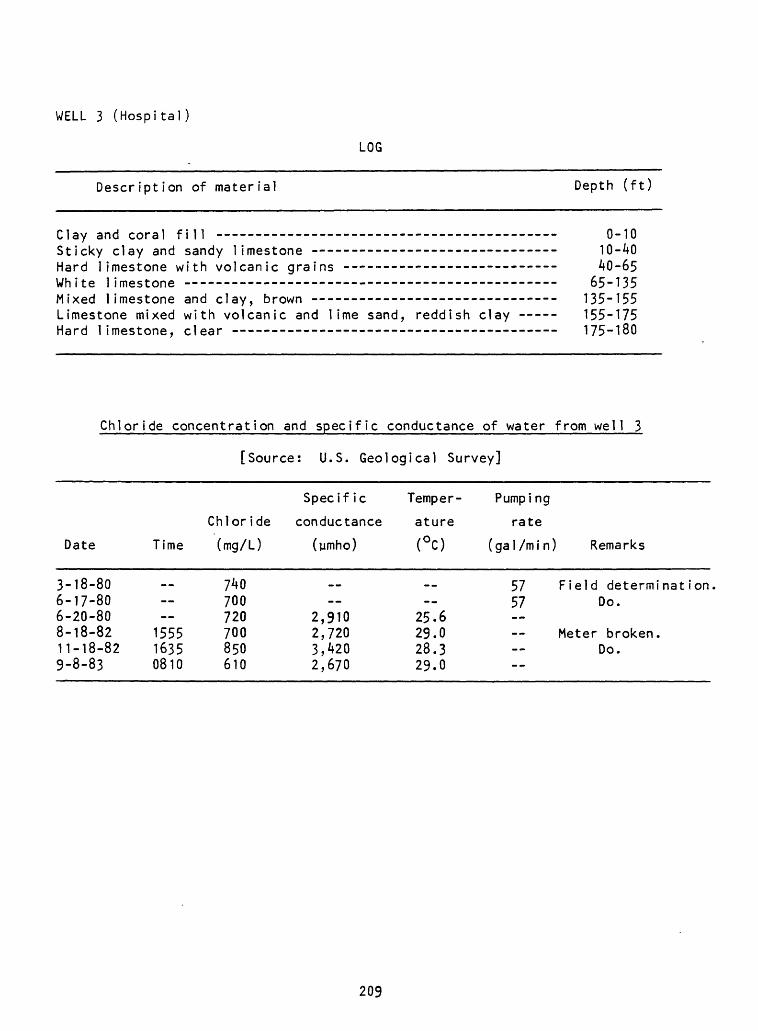
WELL 3 (Hospital)
LOG
Description of material Depth (ft)
Clay and coral fill ----------- --- ____________ _____ .Sticky clay and sandy limestone ------------------- ___-__-Hard limestone with volcanic grains - -----------------------W I 1 1 I w I IIHwOLwIlw
Mixed limestone and clay, brown ------------------------------Limestone mixed with volcanic and lime sand, reddish clay ----Hard limestone, clear ----------------------------------------
0-1010-4040-65
65-135- 135-155 - 155-175
175-180
Chloride concentration and specific conductance of water from well 3
[Source: U.S. Geological Survey]
Date
3-18-806-17-806-20-808-18-8211-18-829-8-83
Time
__ 155516350810
Chloride
"(mg/L)
740700720700850610
Specif ic
conductance
(jjmho)
__
2,9102,7203,4202,670
Temper
ature<°C)
__
25.629.028.329.0
Pumpi ng
rate
( ga 1 /m i
5757
n) Remarks
Field determinationDo.
Meter broken.Do.
209
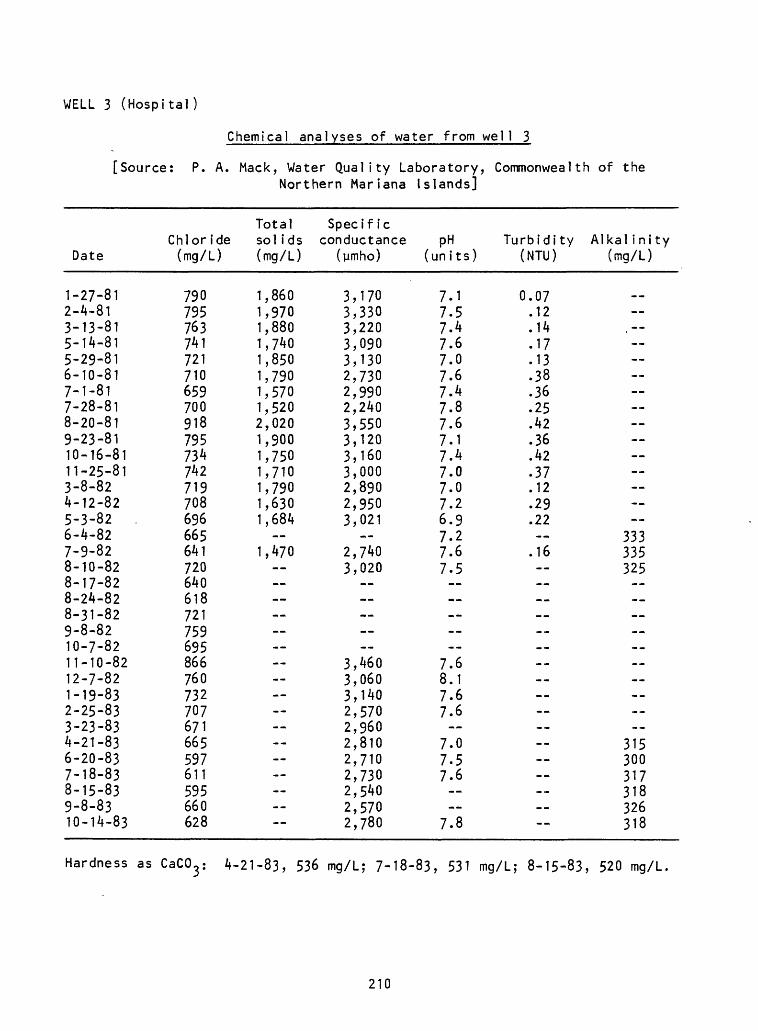
WELL 3 (Hospital)
Chemical analyses of water from well 3
[Source: P. A. Mack, Water Quality Laboratory, Commonwealth of theNorthern Mariana Islands]
Date
1-27-812-4-813-13-815-14-815-29-816-10-817-1-817-28-818-20-819-23-8110-16-8111-25-813-8-824-12-825-3-82 .6-4-827-9-828-10-828-17-828-24-828-31-829-8-8210-7-8211-10-8212-7-821-19-832-25-833-23-834-21-836-20-837-18-838-15-839-8-8310-14-83
Chlor ide (mg/L)
790795763741721710659700918795734742719708696665641720640618721759695866760732707671665597611595660628
Total sol ids (mg/L)
1,8601,9701,8801,7401,8501,7901,5701,5202,0201,9001,7501,7101,7901,6301,684
1,470 -- --
Specif ic conductance
(ymho)
3,1703,3303,2203,0903,1302,7302,9902,2403,5503,1203,1603,0002,8902,9503,021
2,7403,020 -- --
3,4603,0603,1402,5702,9602,8102,7102,7302,5402,5702,780
pH (un its)
7.17.57.47.67.07.67.47.87.67.17.47.07.07.26.97.27.67.5 __. ----
7.68.17.67.6
7.07.57.6
7.8
Turbidi ty (NTU)
0.07.12.14.17.13.38.36.25.42.36.42.37.12.29.22--.16 ---_.---------- ---- --------
Alkal inity (mg/L)
-- --
333335325---_ ---- ----
315300317318326318
Hardness as CaCO^ 4-21-83, 536 mg/L; 7-18-83, 531 mg/L; 8-15-83, 520 mg/L.
210
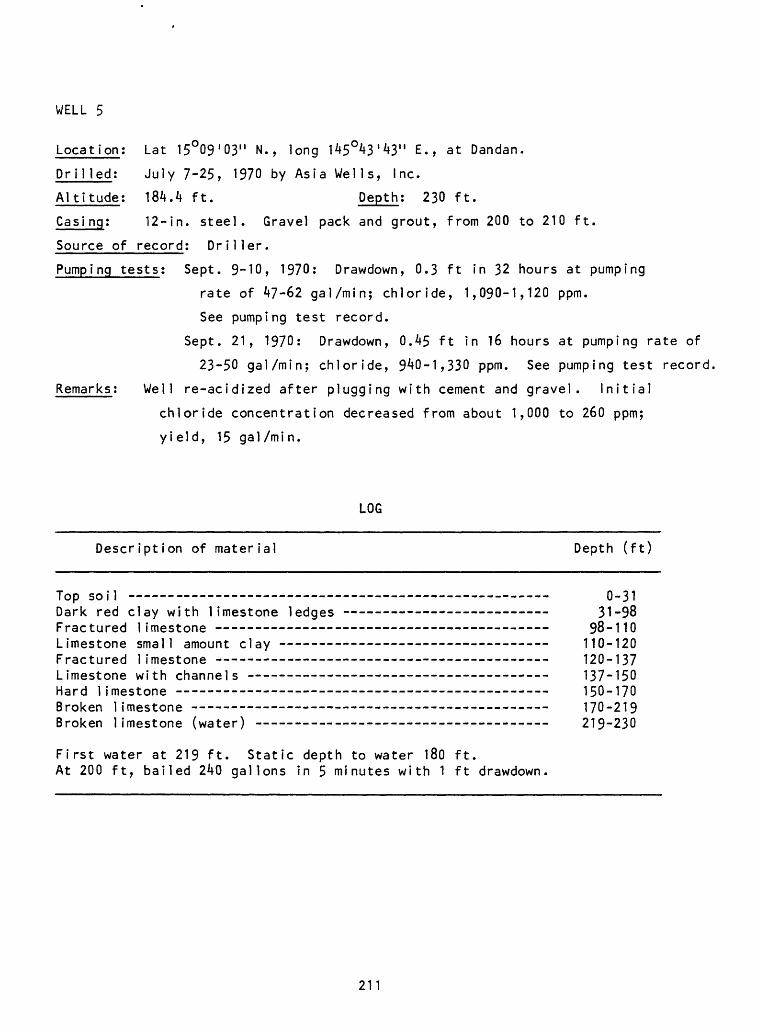
WELL 5
Location; Lat 15°09'03" N., long 145°43'43" E., at Dandan.
Drilled: July 7-25, 1970 by Asia Wells, Inc.
Altitude; 184.4 ft. Depth; 230 ft.
Cas? ng; 12-in. steel. Gravel pack and grout, from 200 to 210 ft.
Source of record; Driller.
Pumping tests; Sept. 9-10, 1970: Drawdown, 0.3 ft in 32 hours at pumping
rate of 47-62 gal/min; chloride, 1,090-1,120 ppm.
See pumping test record.
Sept. 21, 1970: Drawdown, 0.45 ft in 16 hours at pumping rate of
23-50 gal/min; chloride, 940-1,330 ppm. See pumping test record,
Remarks; Well re-acidized after plugging with cement and gravel. Initial
chloride concentration decreased from about 1,000 to 260 ppm;
yield, 15 gal/min.
LOG
Description of material Depth (ft)
Top soil 0-31Dark red clay with limestone ledges 31-98Fractured limestone 98-110Limestone small amount clay - - - - 110-120Fractured limestone - ---- --- - - 120-137Limestone with channels -- -- - - - 137-150Hard limestone 150-170Broken limestone - 170-219Broken limestone (water) - - 219-230
First water at 219 ft. Static depth to water 180 ft.At 200 ft, bailed 240 gallons in 5 minutes with 1 ft drawdown.
211
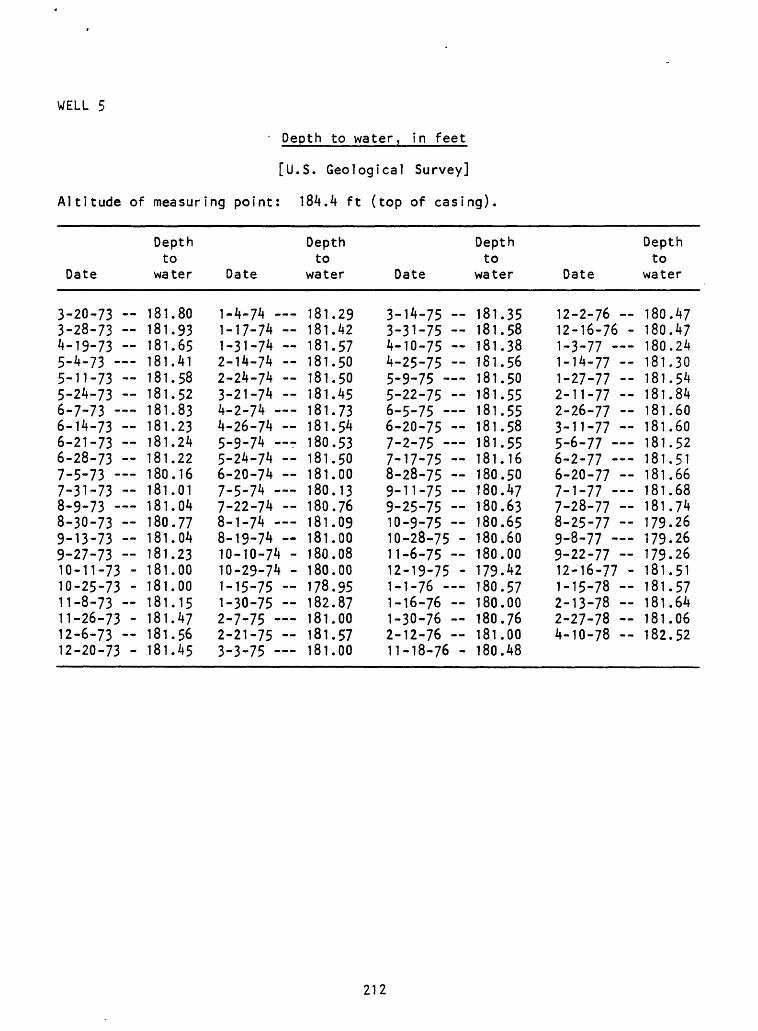
WELL 5
Depth to water, in feet
[U.S. Geological Survey]
Altitude of measuring point: 184.4 ft (top of casing).
Date
3-20-73 --3-28-73 -4-19-73 --5-4-73 5-11-73 -5-24-73 -6-7-73 6-14-73 --6-21-73 -6-28-73 -7-5-73 7-31-73 -8-9-73 8-30-73 -9-13-73 -9-27-73 -10-11-73 -10-25-73 -11-8-73 --11-26-73 -12-6-73 -12-20-73 -
Depth to
water
181.80181.93181.65181.41181.58181.52181.83181.23181.24181.22180.16181.01181.04180.77181.04181.23181.00181.00181.15181.47181.56181.45
Date
1-4.74 1-17-74 -1-31-74 -2-14-74 2-24-74 3-21-74 -4-2-74 4-26-74 -5-9-74 5-24-74 6-20-74 7-5-74 7-22-74 8-1-74 8-19-74 10-10-74 -10-29-74 -1-15-75 -1-30-75 -2-7-75 2-21-75 -3-3-75
Depth to
water
181.29181.42181.57181.50181.50181.45181.73181.54180.53181.50181.00180.13180.76181.09181.00180.08180.00178.95182.87181.00181.57181.00
Date
3-14-75 --3-31-75 -4-10-75 -4-25-75 -5-9-75 5-22-75 6-5-75 6-20-75 -7-2-75 7-17-75 -8-28-75 -9-11-75 -9-25-75 -10-9-75 -10-28-75 -11-6-75 -12-19-75 -1-1-76 1-16-76 1-30-76 -2-12-76 11-18-76 -
Depth to
water
181.35181.58181.38181.56181.50181.55181.55181.58181.55181.16180.50180.47180.63180.65180.60180.00179.42180.57180.00180.76181.00180.48
Date
12-2-76 12-16-76 -1-3-77 1-14-77 -1-27-77 -2-11-77 2-26-77 -3-11-77 -5-6-77 6-2-77 6-20-77 -7-1-77 7-28-77 -8-25-77 -9-8-77 9-22-77 -12-16-77 -1-15-78 -2-13-78 -2-27-78 4-10-78
Depth to
water
180.47180.47180.24181.30181.54181.84181.60181.60181.52181.51181.66181.68181.74179.26179.26179.26181.51181.57181.64181.06182.52
212
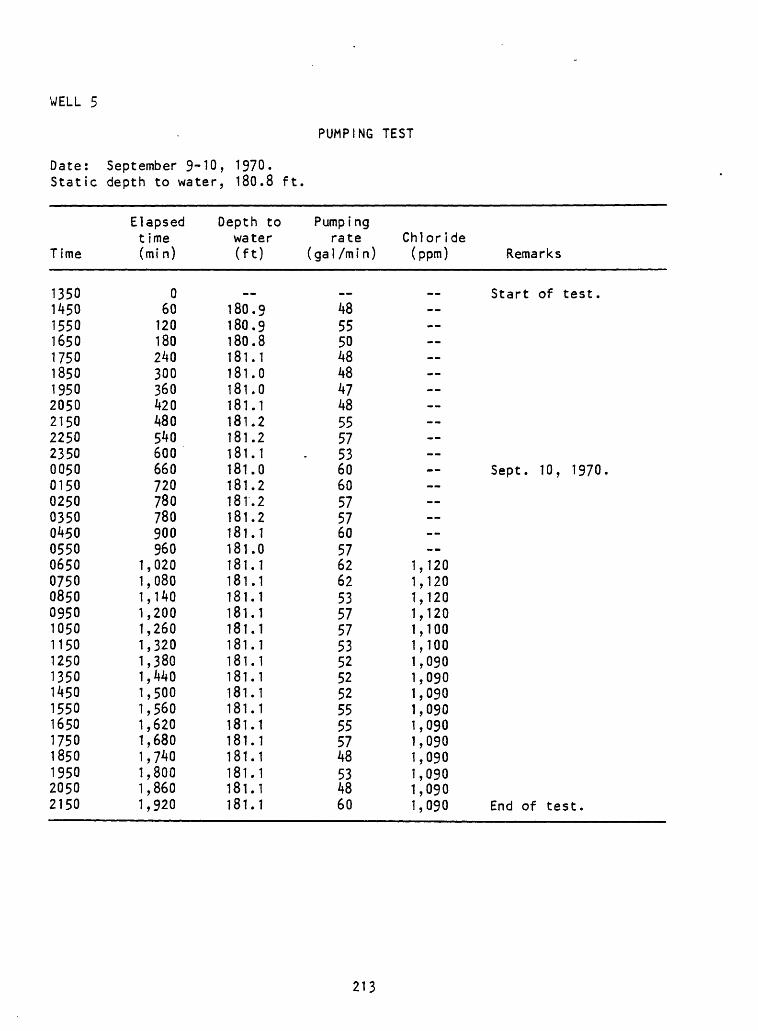
WELL 5
PUMPING TEST
Date: September 9-10, 1970. Static depth to water, 180.8 ft.^^ ^Mna^HM
Time *^^-^ B«*^H.
135014501550165017501850195020502150225023500050015002500350045005500650075008500950105011501250135014501550165017501850195020502150
~ ~~ __ Elapsed t ime (min)^ « .
060120180240300360420480540600660720780780900960
1,0201,0801,1401,2001,2601,3201,3801,4401,5001,5601,6201,6801,7401,8001,8601,920
_
~« ___ _ Depth to
water (ft)
180.9180.9180.8181.1181.0181.0181.1181.2181.2181.1181.0181.2181.2181.2181.1181.0181.1181.1181.1181.1181.1181.1181.1181.1181.1181.1181.1181.1181.1181.1181.1181.1
.
Pump i ng rate
(gal /min)^HB>^BM>HBM'^^M^Mi"^M*^wm«Mi
4855504848474855575360605757605762625357575352525255555748534860
_ ___
Chloride(ppm) Remarks
_______ ______ ___^ i^ .^H
Start of test. --
Sept. 10, 1970.
1,1201,1201,1201,1201,1001,1001,0901,0901,0901,0901,0901,0901,0901,0901,0901,090 End of test.
213
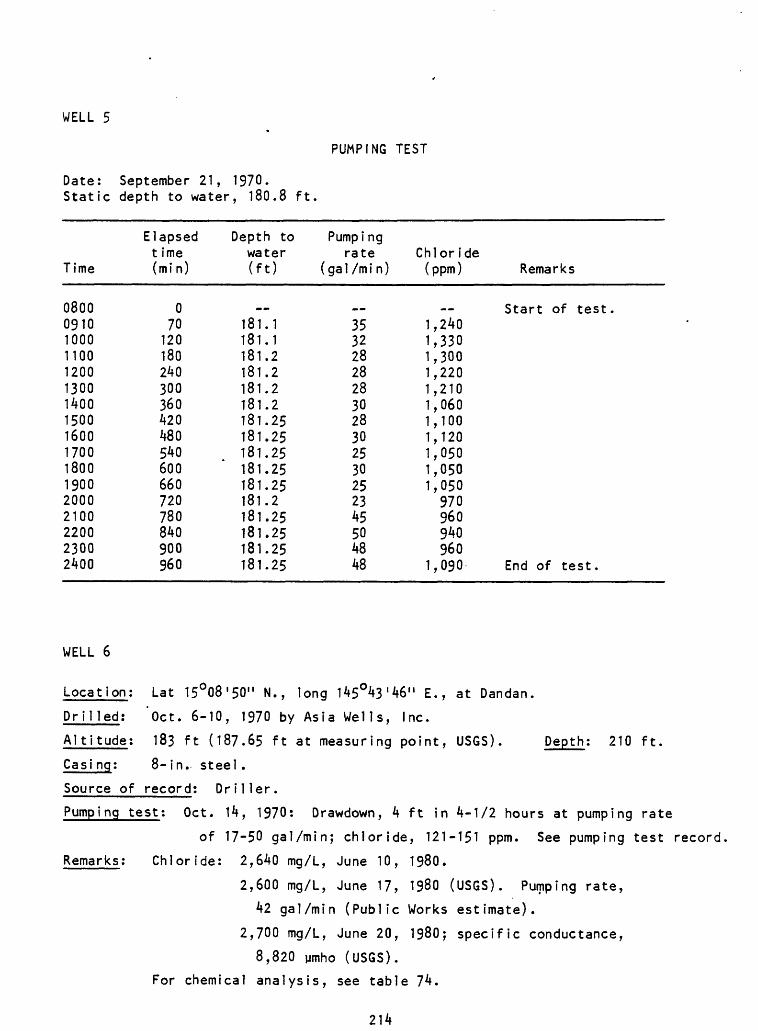
WELL 5
Date: September 21, 1970. Static depth to water, 180.8 ft.
PUMPING TEST
Time
08000910100011001200130014001500160017001800190020002100220023002400
Elapsed t ime (mi n)
070
120180240300360420480540600660720780840900960
Depth to water (ft)
..181.1181.1181.2181.2181.2181.2181.25181.25181.25181.25181.25181.2181.25181.25181.25181.25
Pumpi ng rate
(gal /mi n)
35322828283028302530252345504848
Chloride (ppm) Remarks
Start of test.1,2401,3301,3001,2201,2101,0601,1001,1201,0501,0501,050970960940960
1,090 End of test.
WELL 6
Location; Lat 15O08'50" N., long 145O43'46" E., at Dandan.
Drilled; "Oct. 6-10, 1970 by Asia Wells, Inc.
Altitude; 183 ft (187.65 ft at measuring point, USGS). Depth; 210 ft.
Casi ng; 8-in. steel.
Source of record; Driller.
Pumping test; Oct. 14, 1970: Drawdown, 4 ft in 4-1/2 hours at pumping rate
of 17-50 gal/min; chloride, 121-151 ppm. See pumping test record
Remarks; Chloride: 2,640 mg/L, June 10, 1980.
2,600 mg/L, June 17, 1980 (USGS). Pumping rate,
42 gal/min (Public Works estimate).
2,700 mg/L, June 20, 1980; specific conductance,
8,820 umho (USGS).
For chemical analysis, see table 74.
214
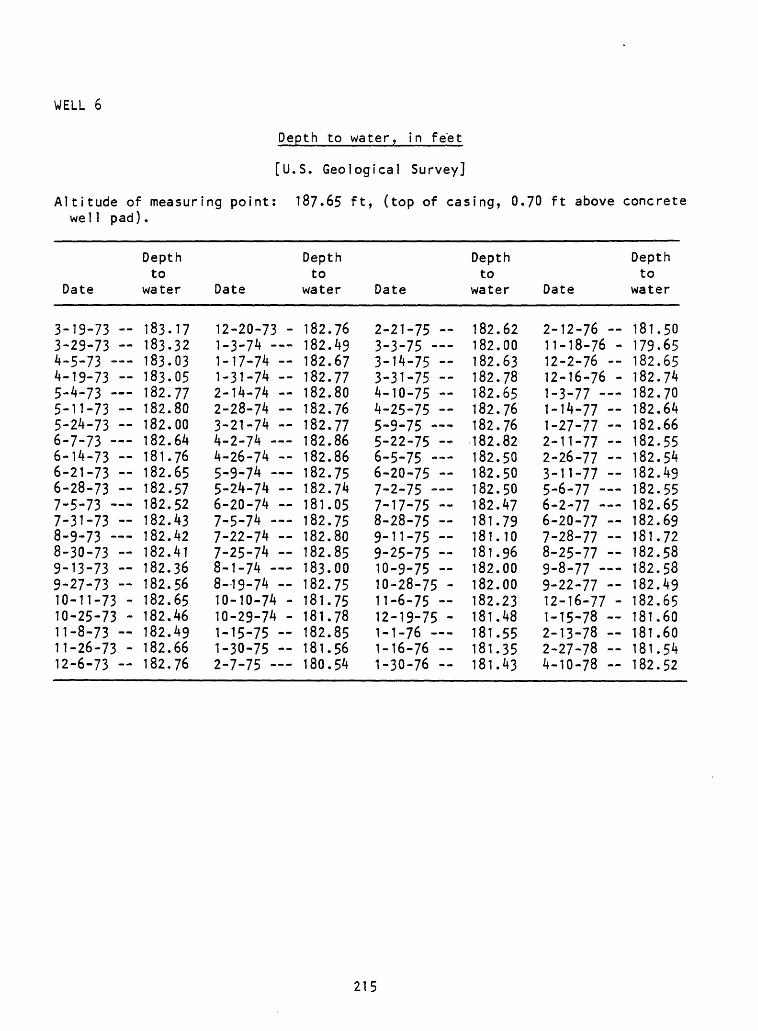
WELL 6
Depth to water, in feet
[U.S. Geological Survey]
Altitude of measuring point: 187.65 ft, (top of casing, 0.70 ft above concrete well pad).
Date
3-19-73 --3-29-73 --4-5-73 4-19-73 --5-4-73 5-11-73 --5-24-73 -6-7-73 6-14-73 -6-21-73 -6-28-73 -7-5-73 7-31-73 -8-9-73 8-30-73 --9-13-73 --9-27-73 --10-11-73 -10-25-73 -11-8-73 ~11-26-73 -12-6-73 -
Depth to
water
183.17183.32183.03183.05182.77182.80182.00182.64181.76182.65182.57182.52182.43182.42182.41182.36182.56182.65182.46182.49182.66182.76
Date
12-20-73 -1-3-74 1-17-74 -1-31-74 -2-14-74 2-28-74 3-21-74 -4-2-74 4-26-74 -5-9-74 5-24-74 6-20-74 7-5-74 7-22-74 7-25-74 -8-1-74 8-19-74 10-10-74 -10-29-74 -1-15-75 --1-30-75 -2-7-75
Depth to
water
182.76182.49182.67182.77182.80182.76182.77182.86182.86182.75182.74181.05182.75182.80182.85183.00182.75181.75181.78182.85181.56180.54
Date
2-21-75 -3-3-75 3-14-75 --3-31-75 -4-10-75 -4-25-75 -5-9-75 5-22-75 6-5-75 6-20-75 --7-2-75 7-17-75 -8-28-75 9-11-75 -9-25-75 -10-9-75 --10-28-75 -11-6-75 --12-19-75 -1-1-76 1-16-76 «1-30-76
Depth to
water
182.62182.00182.63182.78182.65182.76182.76182.82182.50182.50182.50182.47181.79181.10181.96182.00182.00182.23181.48181.55181.35181.43
Date
2-12-76 11-18-76 -12-2-76 --12-16-76 -1-3-77 1-14-77 -1-27-77 -2-11-77 -2-26-77 -3-11-77 --5-6-77 6-2-77 6-20-77 -7-28-77 --8-25-77 --9-8-77 9-22-77 12-16-77 -1-15-78 -2-13-78 -2-27-78 4-10-78 --
Depth to
water
181.50179.65182.65182.74182.70182.64182.66182.55182.54182.49182.55182.65182.69181.72182.58182.58182.49182.65181.60181.60181.54182.52
215
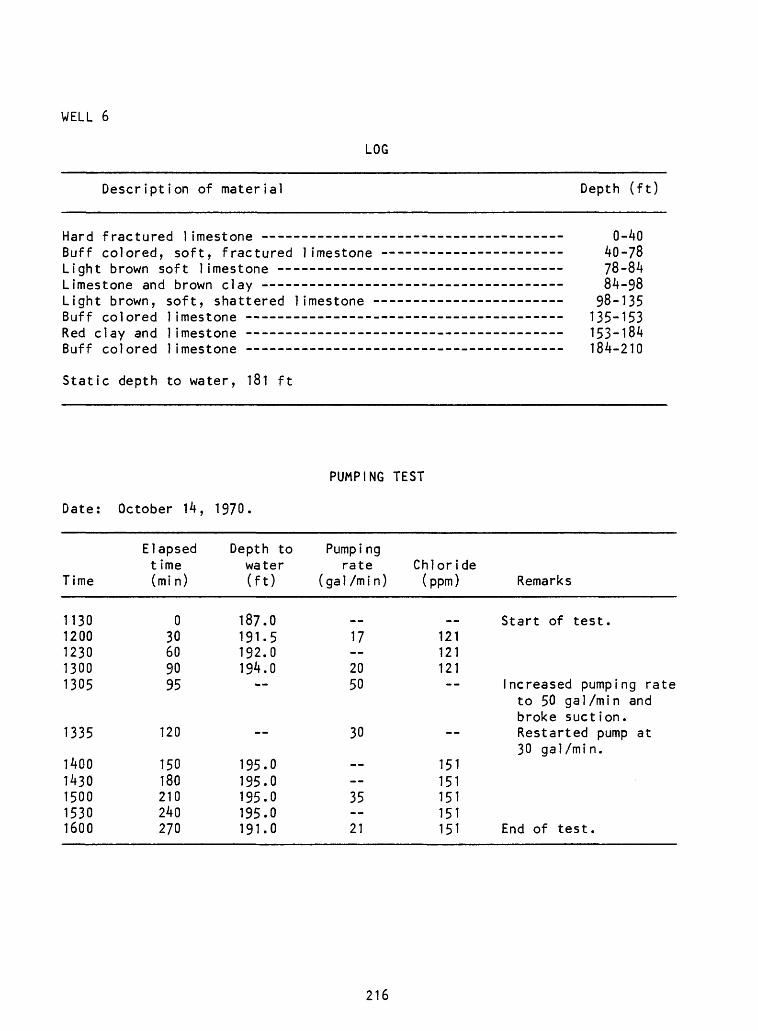
WELL 6
LOG
Description of material Depth (ft)
Hard fractured limestone Buff colored, soft, fractured limestone Light brown soft limestone - - Limestone and brown clay -------------Light brown, soft, shattered limestone Buff colored limestone - Red clay and limestone -------------- Buff colored limestone ---------------
Static depth to water, 181 ft
0-4040-7878-8484-98
98-135135-153153-184184-210
Date: October 14, 1970.
PUMPING TEST
Time
Elapsed time (mi n)
Depth to water (ft)
Pumpi ngrate
(gal/min)Chloride (ppm) Remarks
11301200123013001305
1335
14001430150015301600
030609095
120
150180210240270
187.0191.5192.0194.0
195.0195.0195.0195.0191.0
17
2050
30
35
21
121121121
151151151151151
Start of test.
Increased pumping rate to 50 gal/min and broke suction. Restarted pump at 30 gal/min.
End of test.
216
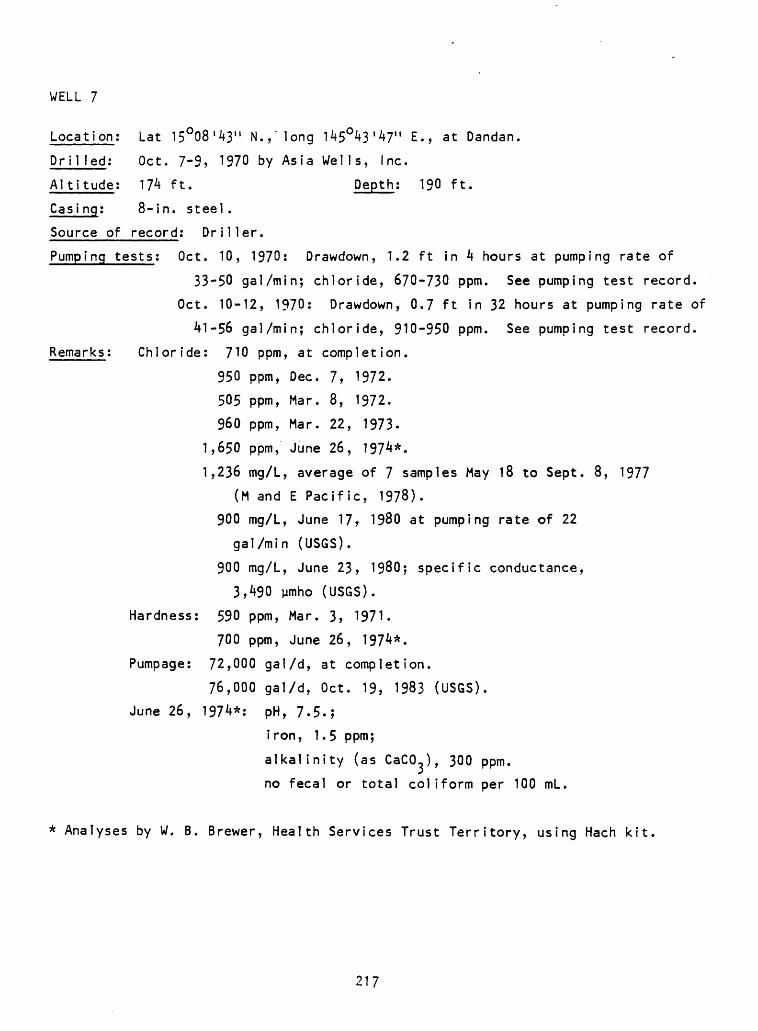
WELL 7
Location: Lat 15°08'43" N.,"long 145°43'47" E., at Dandan.
Drilled; Oct. 7-9, 1970 by Asia Wells, Inc.
Altitude: Mk ft. Depth: 190 ft.
8-in. steel.
Or iller.
Casing:
Source of record:
Pumping tests: Oct. 10, 1970: Drawdown, 1.2 ft in k hours at pumping rate of
33-50 gal/min; chloride, 670-730 ppm. See pumping test record.
Oct. 10-12, 1970: Drawdown, 0.7 ft in 32 hours at pumping rate of
41-56 gal/min; chloride, 910-950 ppm. See pumping test record.
Remarks; Chloride: 710 ppm, at completion.
950 ppm, Dec. 7, 1972.
505 ppm, Mar. 8, 1972.
960 ppm, Mar. 22, 1973.
1,650 ppm, June 26, 1974*.
1,236 mg/L, average of 7 samples May 18 to Sept. 8, 1977
(M and E Pacific, 1978).
900 mg/L, June 17 r 1980 at pumping rate of 22
gal/min (USGS).
900 mg/L, June 23, 1980; specific conductance,
3,490 umho (USGS).
Hardness: 590 ppm, Mar. 3, 1971.
700 ppm, June 26, 1974*.
Pumpage: 72,000 gal/d, at completion.
76,000 gal/d, Oct. 19, 1983 (USGS).
June 26, 1974*: pH, 7.5.;
iron, 1.5 ppm;
alkalinity (as CaCO-), 300 ppm.
no fecal or total coliform per 100 mL.
* Analyses by W. B. Brewer, Health Services Trust Territory, using Hach kit.
217
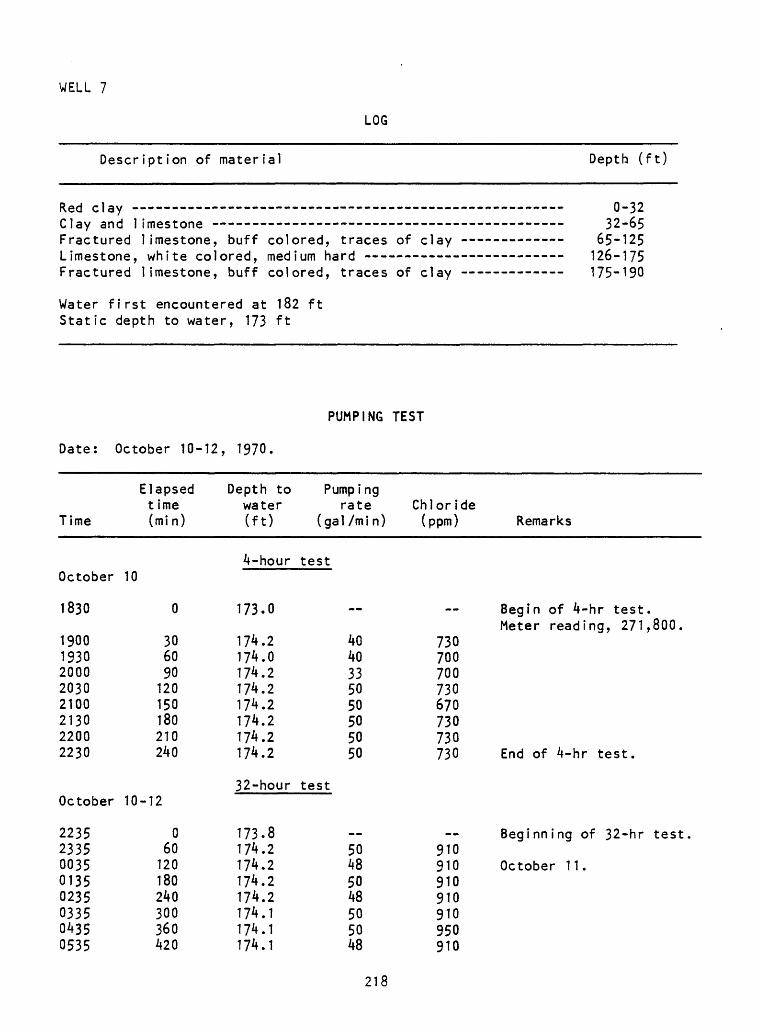
WELL 7
LOG
Description of material Depth (ft)
Red clay Clay and limestone - - - - Fractured limestone, buff colored, traces Limestone, white colored, medium hard - Fractured limestone, buff colored, traces of
of clay
clay
Water first encountered at 182 ft Static depth to water, 173 ft
0-3232-65
65-125126-175175-190
PUMPING TEST
Date: October 10-12, 1970.
Time
October
1830
19001930200020302100213022002230
October
22352335003501350235033504350535
Elapsed 1 1 me (min)
10
0
306090
120150180210240
10-12
060120180240300360420
Depth to Pumping water rate (ft) (gal/min)
4-hour test
173.0
174.2174.0174.2174.2174.2174.2174.2174.2
32-hour test
173.8174.2174.2174.2174.2174.1174.1174.1
4040335050505050
__50485048505048
Chloride (ppm) Remarks
Begin of 4-hr test.Meter reading, 271,800.
730700700730670730730730 End of 4-hr test.
Beginning of 32-hr test.910910 October 11.910910910950910
218
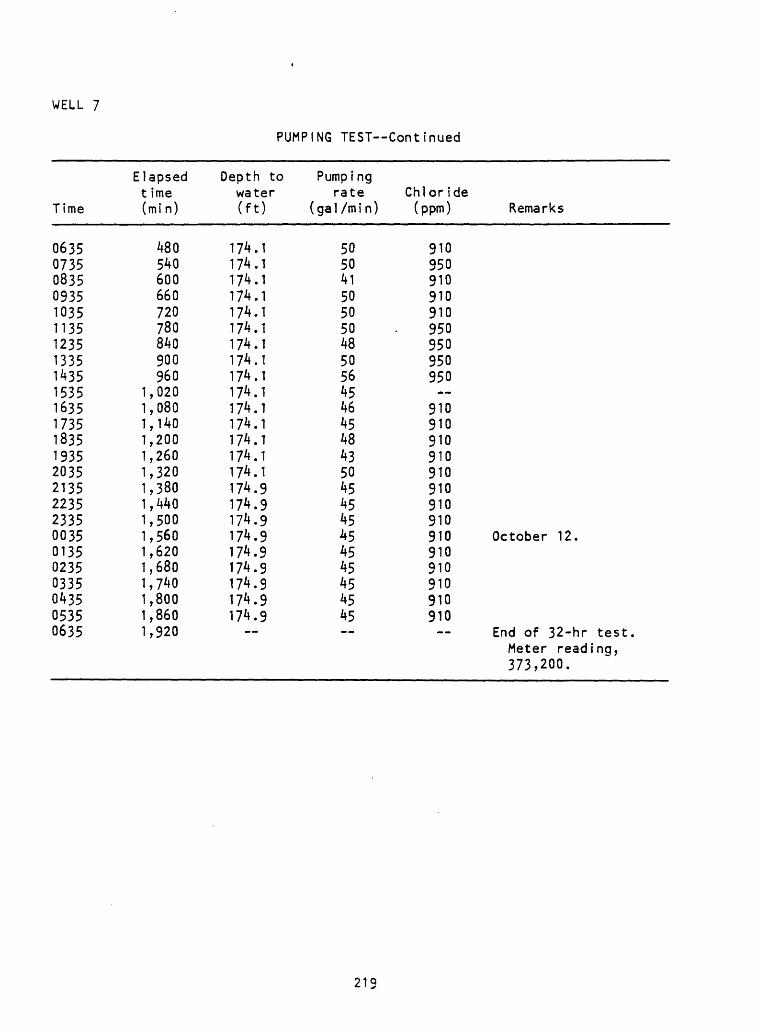
WELL 7
PUMPING TEST Continued
Time
0635073508350935103511351235133514351535163517351835193520352135223523350035013502350335043505350635
Elapsed t ime (min)
480540600660720780840900960
1,0201,0801,1401,2001,2601,3201,3801,4401,5001,5601,6201,6801,7401,8001,8601,920
Depth to water (ft)
174.1174.1174.1174.1174.1174.1174.1174.1174.1174.1174.1174.1174.1174.1174.1174.9174.9174.9174.9174.9174.9174.9174.9174.9
Pumping rate
( ga 1 /m i n )
505041505050485056454645484350454545454545454545
Chloride (ppm) Remarks
910950910910910950950950950
910910910910910910910910910 October 12.910910910910910
End of 32-hr test.Meter reading,373,200.
219
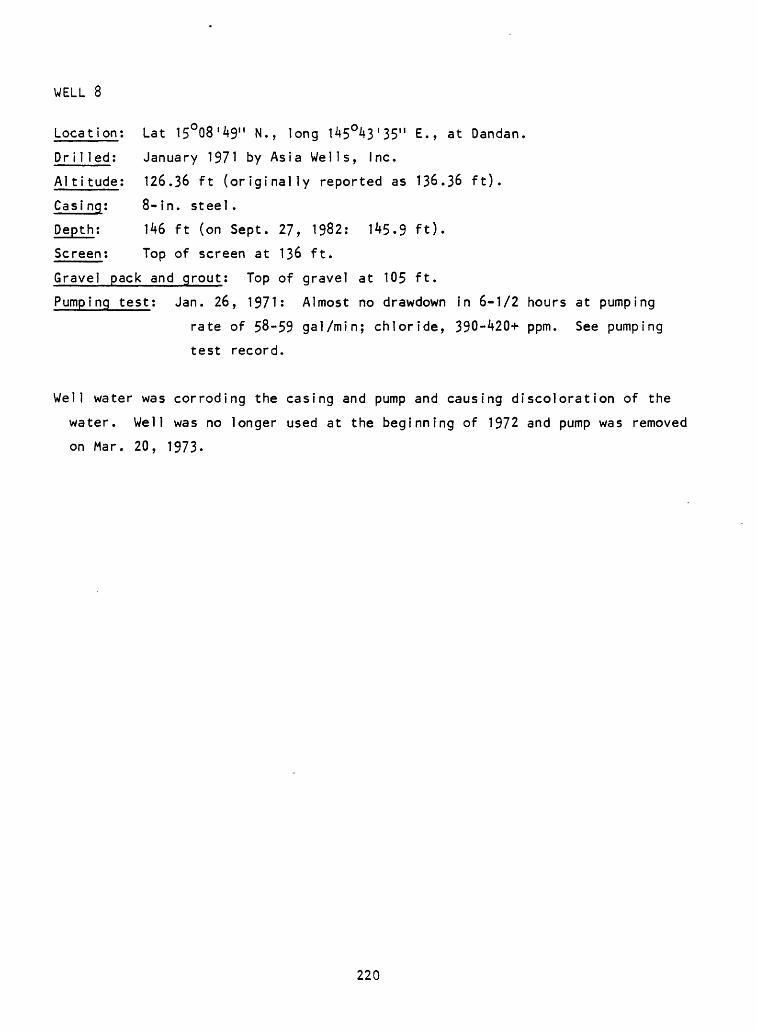
WELL 8
Location; Lat 15°08'49" N., long 145O43'35" E., at Dandan.
DriI led; January 1971 by Asia Wells, Inc.
Altitude; 126.36 ft (originally reported as 136.36 ft).
8-in. steel.
146 ft (on Sept. 27, 1982; 145.9 ft).
Top of screen at 136 ft.
Gravel pack and grout; Top of gravel at 105 ft.
Pumping test; Jan. 26, 1971: Almost no drawdown in 6-1/2 hours at pumping
rate of 58-59 gal/min; chloride, 390-420+ ppm. See pumping
test record.
Well water was corroding the casing and pump and causing discoloration of the
water. Well was no longer used at the beginning of 1972 and pump was removed
on Mar. 20, 1973.
220
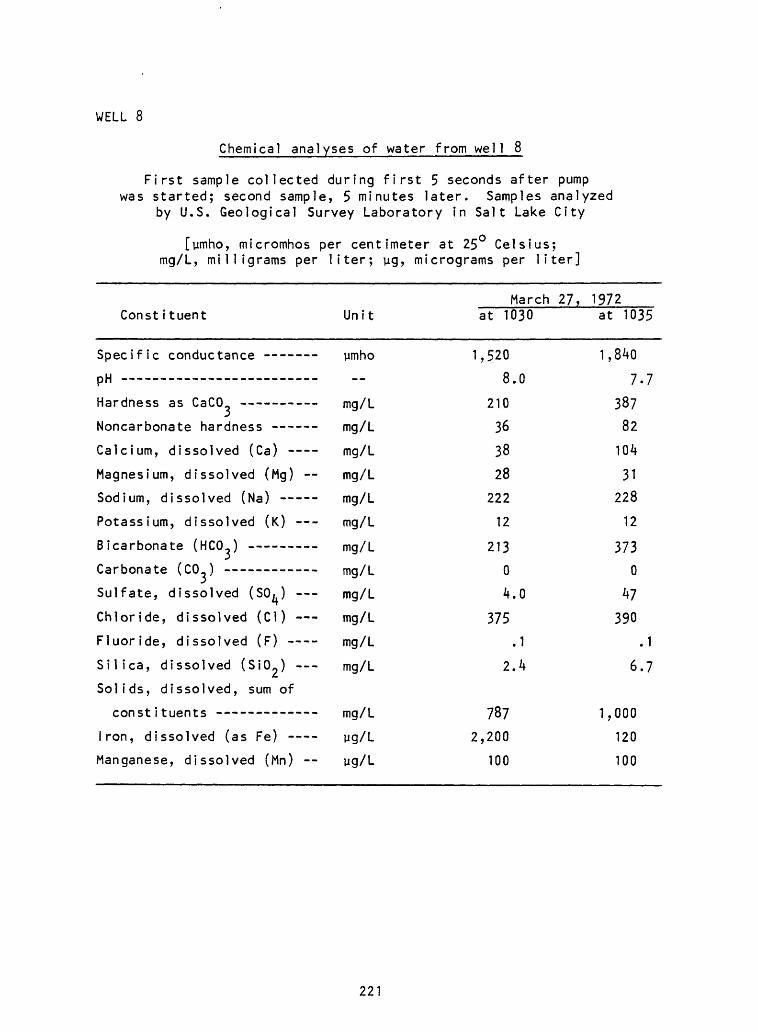
WELL 8
Chemical analyses of water from well 8
First sample collected during first 5 seconds after pump was started; second sample, 5 minutes later. Samples analyzed
by U.S. Geological Survey Laboratory in Salt Lake City
[ymho, micromhos per centimeter at 25 Celsius: mg/L, milligrams per liter; yg, micrograms per liter]
March 27, 1972Constituent Unit at 1030 at 1035
Specific conductance -- ymho 1,520 1,840pH 8.0 7.7
Hardness as CaCO mg/L 210 387
Noncarbonate hardness - - mg/L 36 82
Calcium, dissolved (Ca) mg/L 38 104
Magnesium, dissolved (Mg) -- mg/L 28 31
Sodium, dissolved (Na) mg/L 222 228
Potassium, dissolved (K) - mg/L 12 12
Bicarbonate (HCCL) mg/L 213 373
Carbonate (CO ) -- mg/L 0 0
Sulfate, dissolved (SO.) mg/L 4.0 47
Chloride, dissolved (Cl) mg/L 375 390
Fluoride, dissolved (F) -- mg/L .1 .1
Silica, dissolved (Si02 ) mg/L 2.4 6.7
Solids, dissolved, sum of
constituents mg/L 787 1,000
Iron, dissolved (as Fe) yg/L 2,200 120
Manganese, dissolved (Mn) -- yg/L 100 100
221
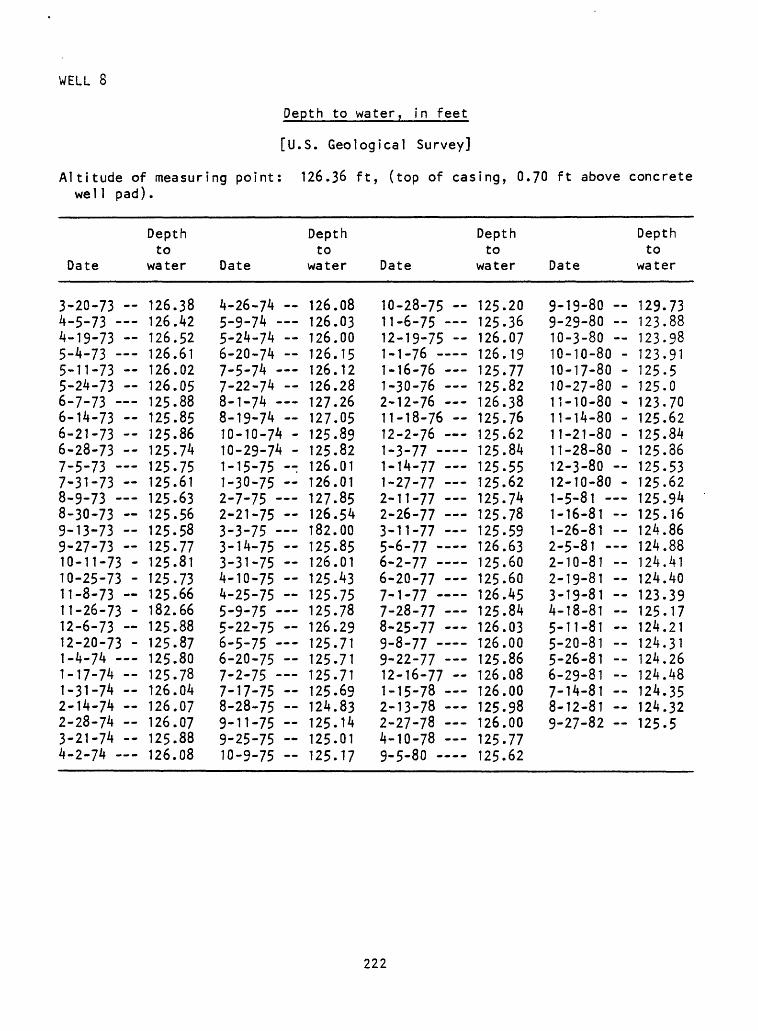
WELL 8
Depth to water, in feet
[U.S. Geological Survey]
Altitude of measuring point: 126.36 ft, (top of casing, 0.70 ft above concrete well pad).
Date
3-20-73 -4-5-73 4-19-73 -5-4-73 5-11-73 -5-24-73 --6-7-73 6-14-73 --6-21-73 -6-28-73 -7-5-73 7-31-73 --8-9-73 8-30-73 --9-13-73 -9-27-73 --10-11-73 -10-25-73 -11-8-73 --11-26-73 -12-6-73 --12-20-73 -1-4.74 1-17-74 -1-31-74 -2-14-74 2-28-74 3-21-74 -4-2-74
Depth to
water
126.38126.42126.52126.61126.02126.05125.88125.85125.86125. 7^125.75125.61125.63125.56125.58125.77125.81125.73125.66182.66125.88125.87125.80125.78126.04126.07126.07125.88126.08
Date
4-26-74 -5-9-74 5-24-74 6-20-74 7-5-74 7-22-74 8-1-74 8-19-74 --10-10-74 -10-29-74 -1-15-75 --1-30-75 -2-7-75 2-21-75 -3-3-75 3-14-75 --3-31-75 --4-10-75 -4-25-75 --5-9-75 5-22-75 --6-5-75 6-20-75 --7-2-75 7-17-75 -8-28-75 9-11-75 -9-25-75 --10-9-75 -
Depth to
water
126.08126.03126.00126.15126.12126.28127.26127.05125.89125.82126.01126.01127.85126.54182.00125.85126.01125.43125.75125.78126.29125.71125.71125.71125.69124.83125.14125.01125.17
Date
10-28-75 11-6-75 12-19-75 -1-1-76 1-16-76 1-30-76 2-12-76 11-18-76 --12-2-76 1-3-77 1-14-77 1-27-77 2-11-77 2-26-77 3-11-77 5-6-77 6-2-77 6-20-77 7-1-777-28-77 8-25-77 9-8-77 9-22-77 12-16-77 -1-15-78 2-13-78 2-27-78 4-10-78 9-5-80
Depth to
water
125.20125.36126.07126.19125.77125.82126.38125.76125.62125.84125.55125.62125.74125.78125.59126.63125.60125.60126.45125.84126.03126.00125.86126.08126.00125.98126.00125.77125.62
Date
9-19-80 9-29-80 --10-3-80 10-10-80 -10-17-80 -10-27-80 -11-10-80 -11-14-80 -11-21-80 -11-28-80 -12-3-80 12-10-80 -1-5-81 1-16-81 1-26-81 2-5-81 2-1Q-81 2-19-81 3-19-81 --4-18-81 -5-11-81 --5-20-81 5-26-81 --6-29-81 7-14-81 8-12-81 9-27-82
Depth to
water
129.73123.88123.98123.91125.5125.0123.70125.62125.84125.86125.53125.62125.94125.16124.86124.88124.41124.40123.39125.17124.21124.31124.26124.48124.35124.32125.5
222
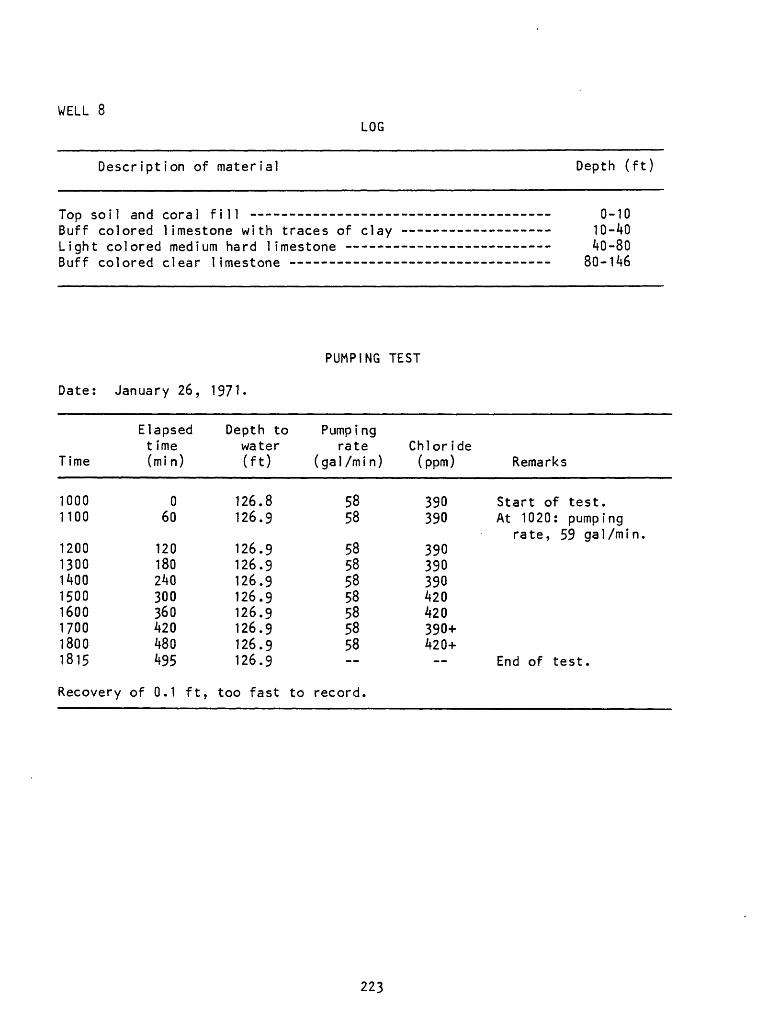
WELL 8LOG
Description of material Depth (ft)
Top soil and coral fill -----------Buff colored limestone with traces of Light colored medium hard limestone Buff colored clear limestone --- -
clay0-1010-4040-80
80-146
PUMPING TEST
Date: January 26, 1971.
Time
10001100
12001300140015001600170018001815
Elapsed t ime (min)
060
120180240300360420480495
Depth to water (ft)
126.8126.9
126.9126.9126.9126.9126.9126.9126.9126.9
Pumpi ng rate
(gal /min)
5858
58585858585858
Chloride (ppm)
390390
390390390420420390+420+
Remarks
Start of test.At 1020: pumping
rate, 59 gal /min.
End of test.
Recovery of 0.1 ft, too fast to record,
223
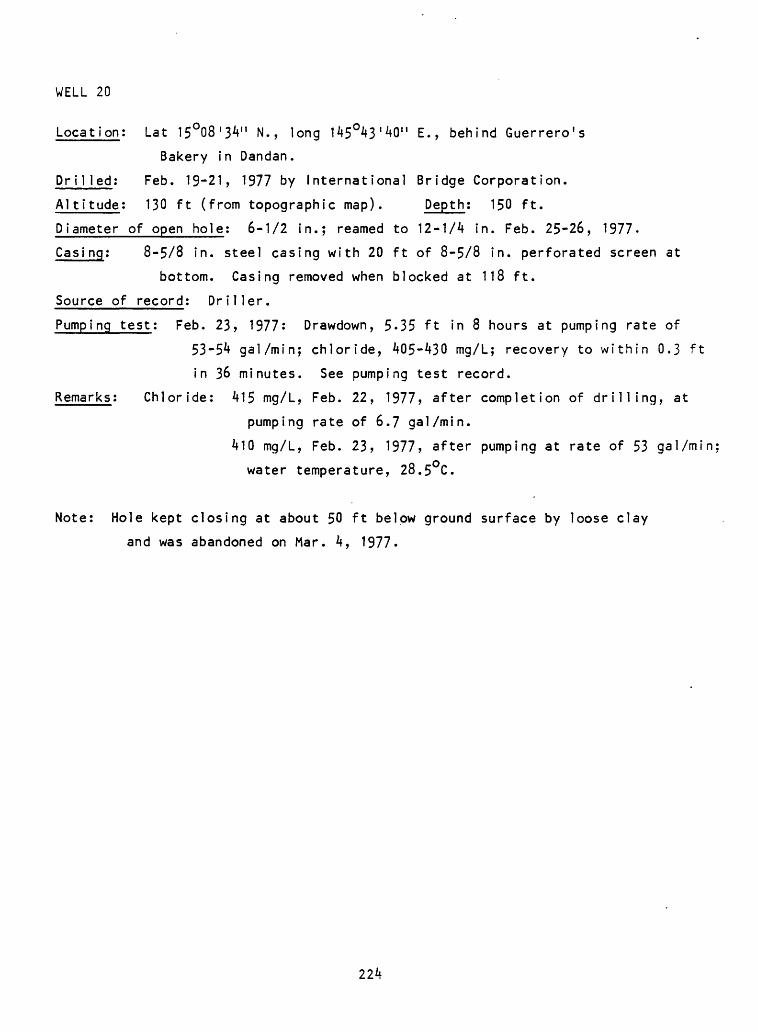
WELL 20
Location: Lat 15°08'34M N., long 145°43'40" E., behind Guerrero's
Bakery in Dandan.
Dri1 led: Feb. 19-21, 1977 by International Bridge Corporation.
Altitude: 130 ft (from topographic map). Depth; 150 ft.
Diameter of open hole: 6-1/2 in.; reamed to 12-1A in. Feb. 25-26, 1977.
Casi ng; 8-5/8 in. steel casing with 20 ft of 8-5/8 in. perforated screen at
bottom. Casing removed when blocked at 118 ft.
Source of record: Driller.
Pumping test: Feb. 23, 1977: Drawdown, 5.35 ft in 8 hours at pumping rate of
53-5^ gal/min; chloride, ^05-^30 mg/L; recovery to within 0.3 ft
in 36 minutes. See pumping test record.
Remarks: Chloride: ^15 mg/L, Feb. 22, 1977, after completion of drilling, at
pumping rate of 6.7 gal/min.
^10 mg/L, Feb. 23, 1977, after pumping at rate of 53 gal/min;
water temperature, 28.5°C.
Note: Hole kept closing at about 50 ft below ground surface by loose clay
and was abandoned on Mar. ^, 1977.
224
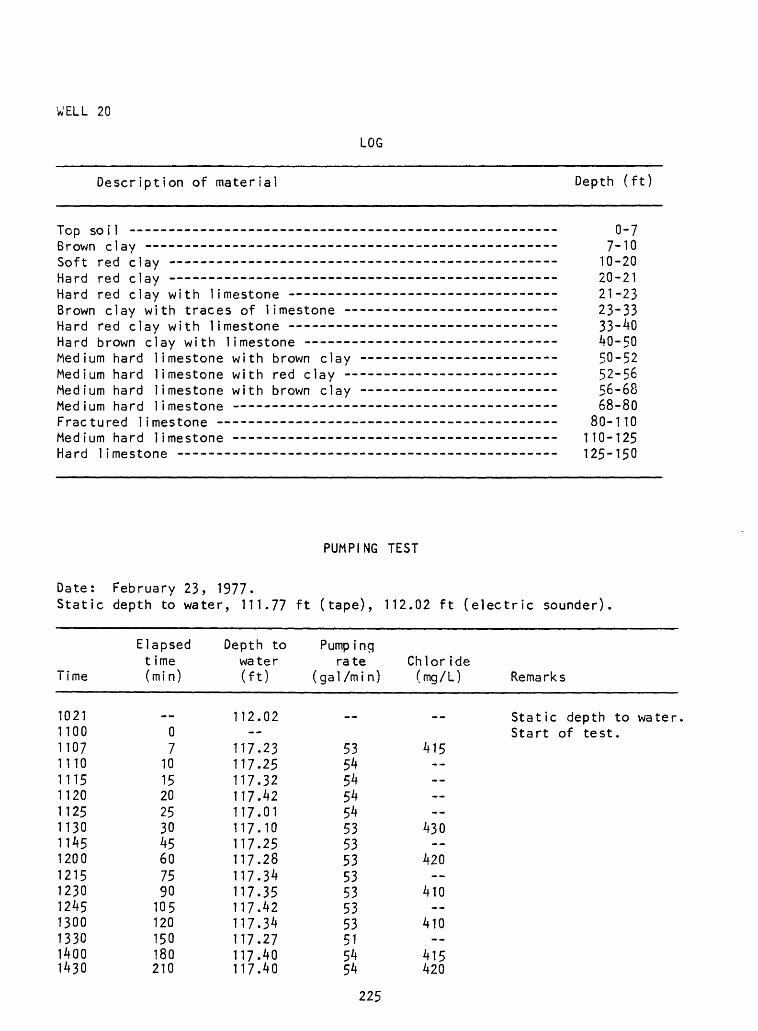
WELL 20
LOG
Description of material Depth (ft)
Top soil --------------------------Brown clay ------------------------Soft red clay ---------- --------- Hard red clay ---------------------Hard red clay with limestone --- -- Brown clay with traces of limestone - Hard red clay with limestone ------Hard brown clay with limestone - - Medium hard limestone with brown clay Medium hard limestone Medium hard limestone Medium hard limestone Fractured limestone - Medium hard limestone Hard limestone ----
with with
red clay - brown clay
0-77-1010-2020-2121-2323-3333-^040-5050-5252-5656-6868-80
80-110110-125125-150
PUMPING TEST
Date: February 23, 1977.Static depth to water, 111.77 ft (tape), 112.02 ft (electric sounder).
Time
Elapsed t ime (mi n)
Depth to water (ft)
Pump i ngrate
(ga 1 /m i n)Chloride (mg/L) Remarks
10211100110711101115112011251130114512001215123012451300133014001430
112.0207
101520253045607590105120150180210
Static depth to water, Start of test.
117,117117-117,117117117.117117117.117117117.117
2325324201102528343542342740
117.40
535454545453535353535353515454
415
430
420
410
410
415420
225
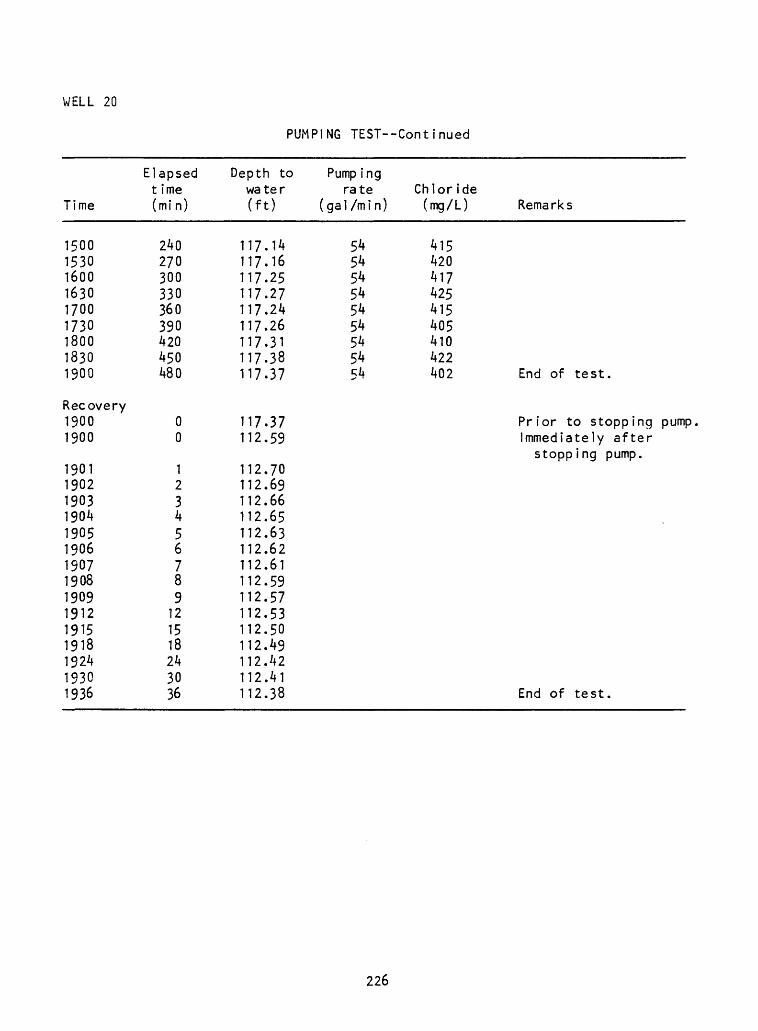
WELL 20
PUMPING TEST--Continued
Time
150015301600163017001730180018301900
Recovery19001900
190119021903190419051906190719081909191219151918192419301936
Elapsed t ime (mi n)
240270300330360390420450480
00
123456789
121518243036
Depth to water (ft)
117.14117.16117.25117.27117.24117.26117.31117.38117.37
117.37112.59
112.70112.69112.66112.65112.63112.62112.61112.59112.57112.53112.50112.49112.42112.41112.38
Pump ing rate
( ga I /m i n )
545454545454545454
Chloride (mg/L) Remarks
415420417425415405410422402 End of test.
Prior to stopping pumpImmediately afterstopping pump.
End of test.
226
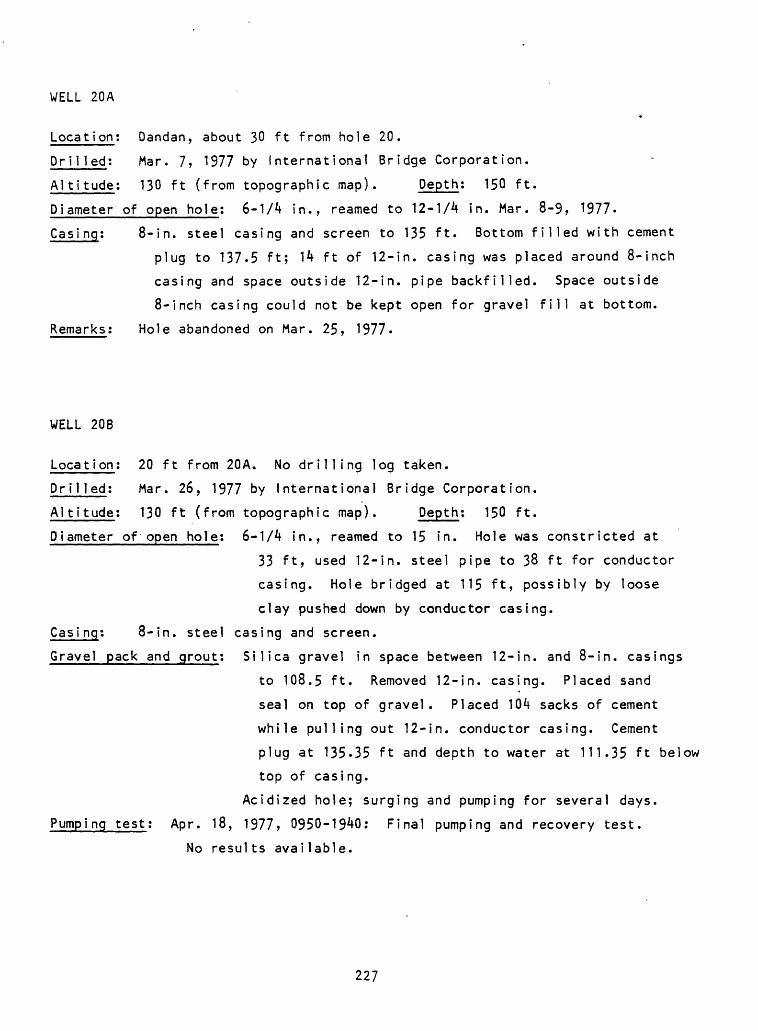
WELL 20A
Location; Dandan, about 30 ft from hole 20.
Dri1 led; Mar. 7, 1977 by International Bridge Corporation.
Altitude; 130 ft (from topographic map). Depth; 150 ft.
Diameter of open hole; 6-1/4 in., reamed to 12-1/4 in. Mar. 8-9, 1977.
Casing; 8-in. steel casing and screen to 135 ft. Bottom filled with cement
plug to 137.5 ft; 14 ft of 12-in. casing was placed around 8-inch
casing and space outside 12-in. pipe backfilled. Space outside
8-inch casing could not be kept open for gravel fill at bottom.
Remarks; Hole abandoned on Mar. 25, 1977.
WELL 20B
Location; 20 ft from 20A. No drilling log taken.
Dri1 led; Mar. 26, 1977 by International Bridge Corporation.
Altitude; 130 ft (from topographic map). Depth; 150 ft.
Diameter of open hole; 6-1/4 in., reamed to 15 in. Hole was constricted at
33 ft, used 12-in. steel pipe to 38 ft for conductor
casing. Hole bridged at 115 ft, possibly by loose
clay pushed down by conductor casing.
Casing; 8-in. steel casing and screen.
Gravel pack and grout; Silica gravel in space between 12-in. and 8-in. casings
to 108.5 ft. Removed 12-in. casing. Placed sand
seal on top of gravel. Placed 104 sacks of cement
while pulling out 12-in. conductor casing. Cement
plug at 135.35 ft and depth to water at 111.35 ft below
top of casing.
Acidized hole; surging and pumping for several days.
Pumping test; Apr. 18, 1977, 0950-1940; Final pumping and recovery test.
No results available.
227
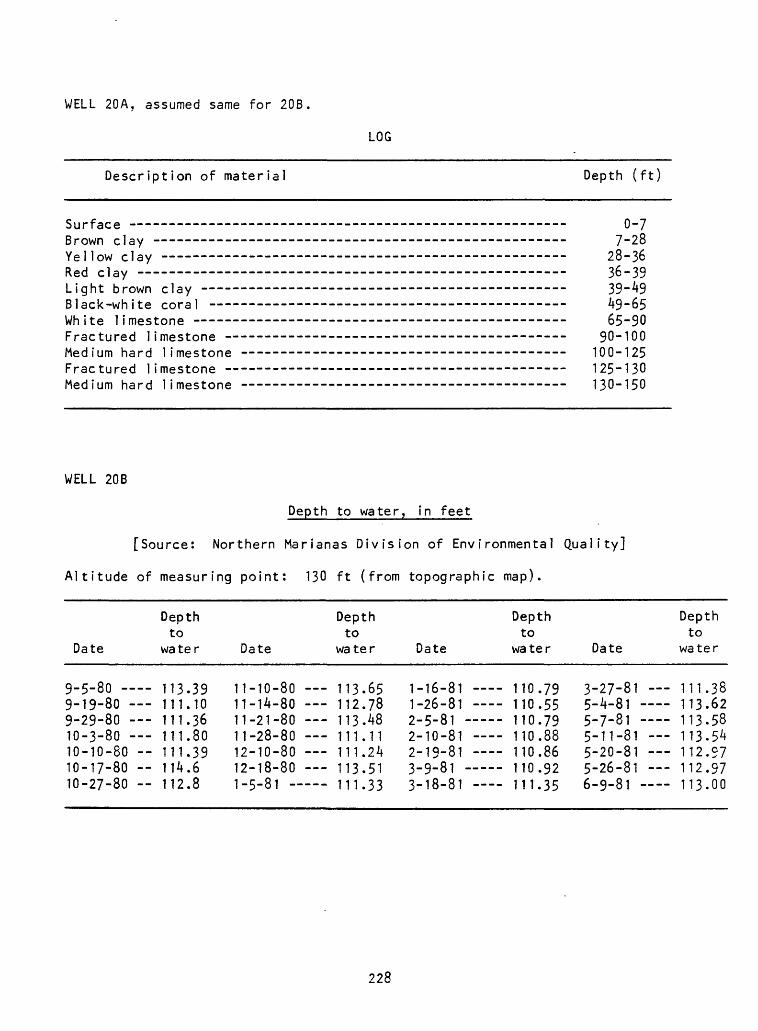
WELL 20A, assumed same for 20B
LOG
Description of material Depth (ft)
Surface - - - --Brown clay ------- ______________________Yellow clay ------------------------------Red clay -Light brown clay -------------------------Black-white coral ------------------------White limestone --------------------------Fractured limestone -- --Medium hard limestone ------- ___________Fractured limestone - ------- ----------Medium hard limestone --------------------
.. o-7
. 7-28
. 28-36
. __ - 36-39
. . 39-49
. - 49-55
. 65-90
. 90-100
. 100-125
. 125-130
. 130-150
WELL 20B
Depth to water, in feet
[Source: Northern Marianas Division of Environmental Quality]
Altitude of measuring point: 130 ft (from topographic map).
Date
9-5-80 9-19-80 9-29-80 10-3-80 10-10-80 -- 10-17-80 -- in-97_8n _-
Depth to
water
113.39 111.10 111.36 111.80 111.39 114.61 19 8
Date
11-10-80 11-14-80 11-21-80 11-28-80 12-10-80 12-18-80 1-C-81 _.
Depth to
water
113.65 112.78 113.^8 111.11 111.24 113.51.___ 111 "32
Date
1-16-81 1-26-81 2-5-81 2-10-81 2-19-81 3-9-81 3_lfl_«1
Depth to
water
110.79 - 110.55
- - 110.79 110.88 110.86
- 110.92____ 111 2C
Date
3-27-81 5-4-81 5-7-81 5-11-81 5-20-81 5-26-81 £_Q_«1 __--
Depth to
wa te r
111.38 113.62 113.58 113.54 112.27112.97 11-3 nn
228
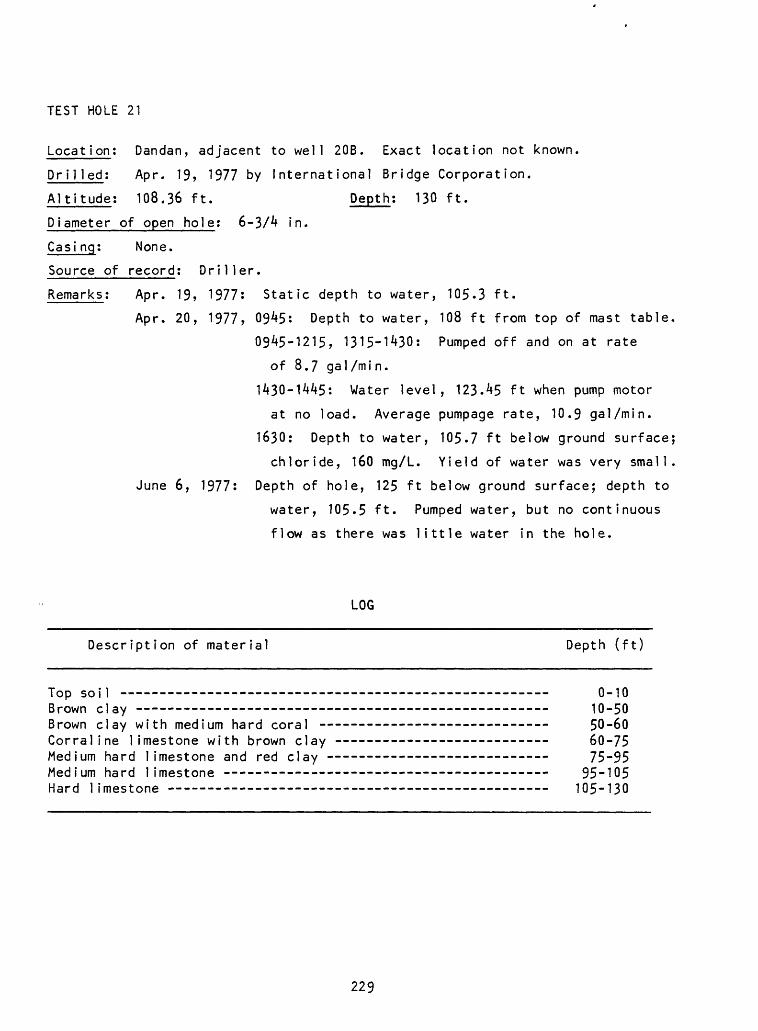
TEST HOLE 21
Location; Dandan, adjacent to well 20B. Exact location not known.
Dr i11ed; Apr. 19, 1977 by International Bridge Corporation.
Altitude; 108.36 ft. Depth; 130 ft.
Diameter of open hole; 6-3/4 in.
Casi ng; None.
Source of record; Driller.
Remarks; Apr. 19, 1977: Static depth to water, 105.3 ft.
Apr. 20, 1977, 0945: Depth to water, 108 ft from top of mast table.
09A5-1215, 1315-1430; Pumped off and on at rate
of 8.7 gal/min.
1430-1445: Water level, 123.45 ft when pump motor
at no load. Average pumpage rate, 10.9 gal/min.
1630; Depth to water, 105.7 ft below ground surface;
chloride, 160 mg/L. Yield of water was very small.
June 6, 1977: Depth of hole, 125 ft below ground surface; depth to
water, 105.5 ft. Pumped water, but no continuous
flow as there was little water in the hole.
LOG
Description of material Depth (ft)
Top soil 0-10Brown clay 10-50Brown clay with medium hard coral - - 50-60Corraline limestone with brown clay --------- ______ ____ 60-75Medium hard limestone and red clay - - - 75-95Medium hard limestone - 95-105Hard limestone -- 105-130
229
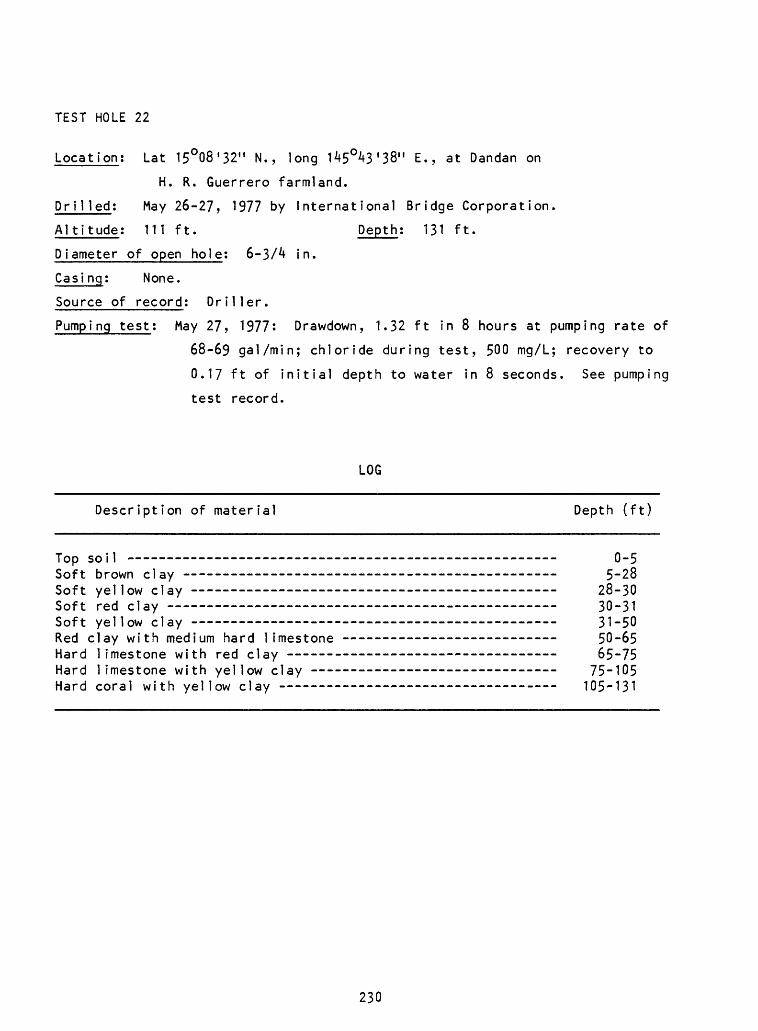
TEST HOLE 22
Location; Lat 15°08'32" N., long 145°43'38" E., at Dandan on
H. R. Guerrero farmland.
Dri 1 led; May 26-27, 1977 by International Bridge Corporation.
Altitude; 111 ft. Depth; 131 ft.
Diameter of open hole; 6-3/A in.
Casi ng; None.
Source of record; Driller.
Pumping test; May 27, 1977: Drawdown, 1.32 ft in 8 hours at pumping rate of
68-69 gal/min; chloride during test, 500 mg/L; recovery to
0.17 ft of initial depth to water in 8 seconds. See pumping
test record.
LOG
Description of material Depth (ft)
Top soil - -- - ------- - -- - ________ Q-5Soft brown clay -- 5-28Soft yellow clay 28-30Soft red clay 30-31Soft yellow clay 31-50Red clay with medium hard limestone -- -- -- -- 50-65Hard limestone with red clay - - 65-75Hard limestone with yellow clay ------ - ____ _____ _ 75.105Hard coral with yellow clay 105-131
230
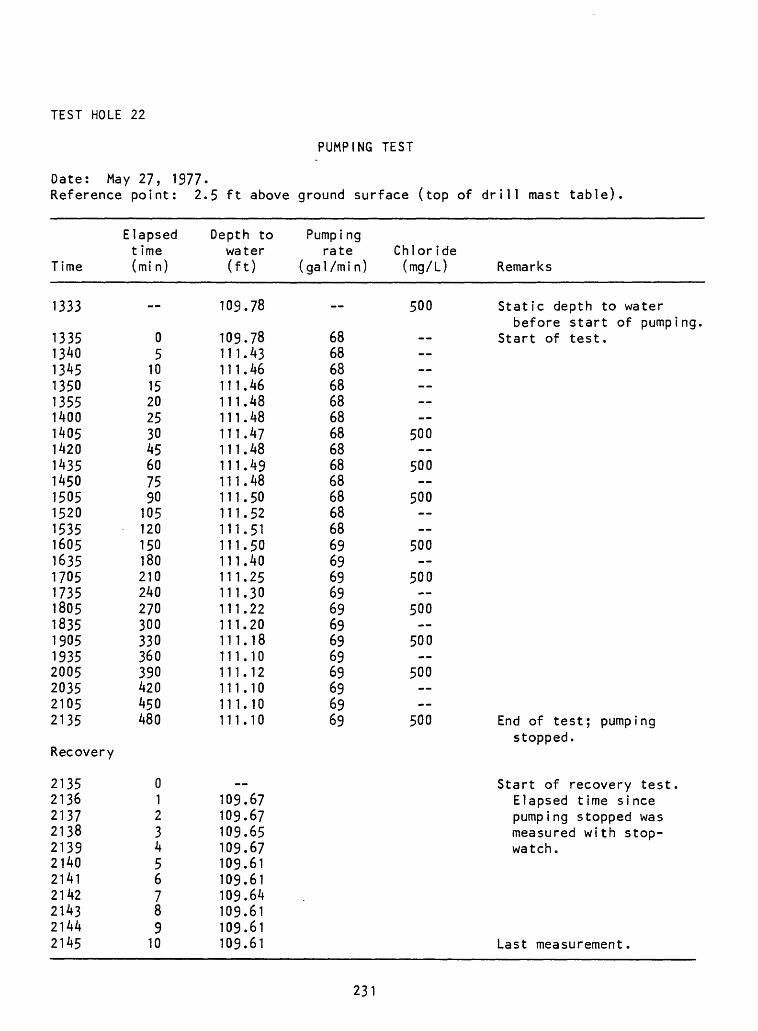
TEST HOLE 22
PUMPING TEST
Date: May 27, 1977.Reference point: 2.5 ft above ground surface (top of drill mast table)
Time
1333
1335134013451350135514001405142014351450150515201535160516351705173518051835190519352005203521052135
Recovery
21352136213721382139214021412142214321442145
Elapsed t ime (mi n)
__
05
101520253045607590105120150180210240270300330360390420450480
0123456789
10
Depth to water (ft)
109.78
109.78111.43111.46111.46111.48111.48111.47111.48111.49111.48111.501 1 1 . 52111.51111.50111.40111.25111.30111.22111.20111.18111.10111.12111.10111.10111.10
109.67109.67109.65109.67109.61109.61109.64109.61109.61109.61
Pumpi ng rate
(gal /mi n)
__
68686868686868686868686868696969696969696969696969
Chloride (mg/L) Remarks
500 Static depth to waterbefore start of pumping.
Start of test. ----
500--
500
500
500
500
500
500--
500
500 End of test; pumpingstopped.
Start of recovery test.Elapsed time sincepumping stopped wasmeasured with stopwatch.
Last measurement.
231
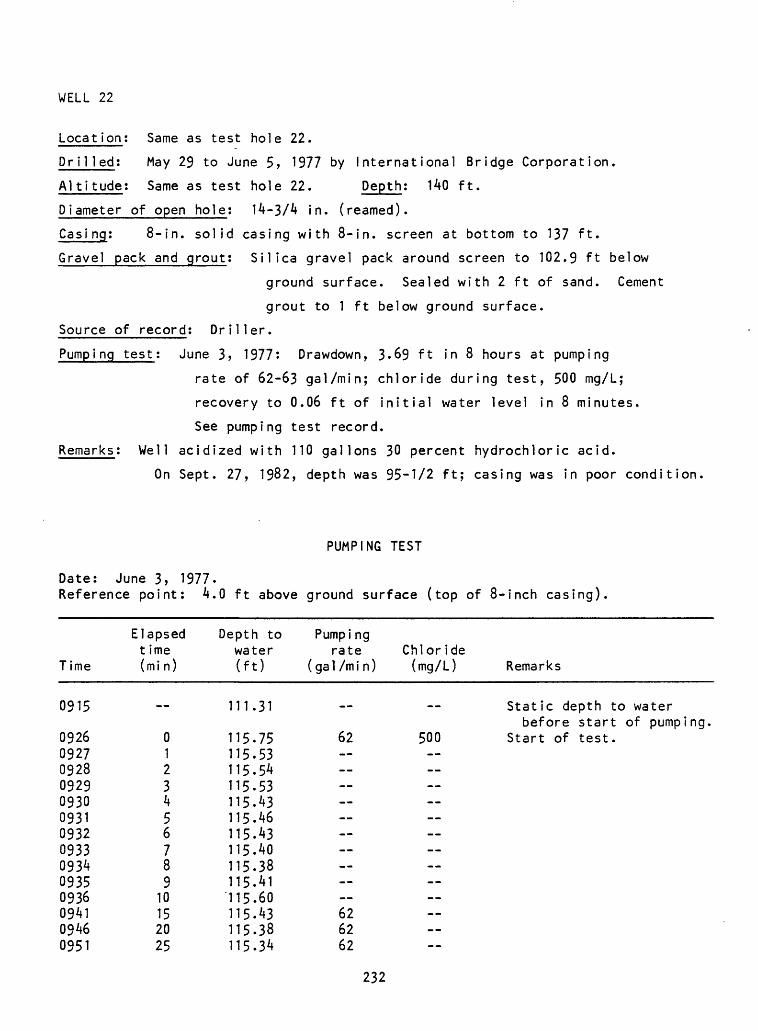
WELL 22
Locat ion; Same as test hole 22.
Dr ilied; May 29 to June 5, 1977 by International Bridge Corporation.
Altitude: Same as test hole 22. Depth; 140 ft.
Diameter of open hole; 14-3/4 in. (reamed).
Casi ng; 8-in. solid casing with 8-in. screen at bottom to 137 ft.
Gravel pack and grout; Silica gravel pack around screen to 102.9 ft below
ground surface. Sealed with 2 ft of sand. Cement
grout to 1 ft below ground surface.
Source of record; Driller.
Pumping test; June 3, 1977; Drawdown, 3.69 ft in 8 hours at pumping
rate of 62-63 gal/min; chloride during test, 500 mg/L;
recovery to 0.06 ft of initial water level in 8 minutes.
See pumping test record.
Remarks; Well acidized with 110 gallons 30 percent hydrochloric acid.
On Sept. 27, 1982, depth was 95-1/2 ft; casing was in poor condition
PUMPING TEST
Date; June 3, 1977.Reference point; 4.0 ft above ground surface (top of 8-inch casing).
Time
0915
09260927092809290930093109320933093409350936094109460951
Elapsed t ime (mi n)
__
0123456789
10152025
Depth to water (ft)
111.31
115.75115.53115.54115.53115.43115.46115.43115.40115.38115.41115.60115.43115.38115.34
Pumpi ng rate Chloride
(gal/min) (mg/L) Remarks
Static depth to waterbefore start of pumping.
62 500 Start of test. 626262
232
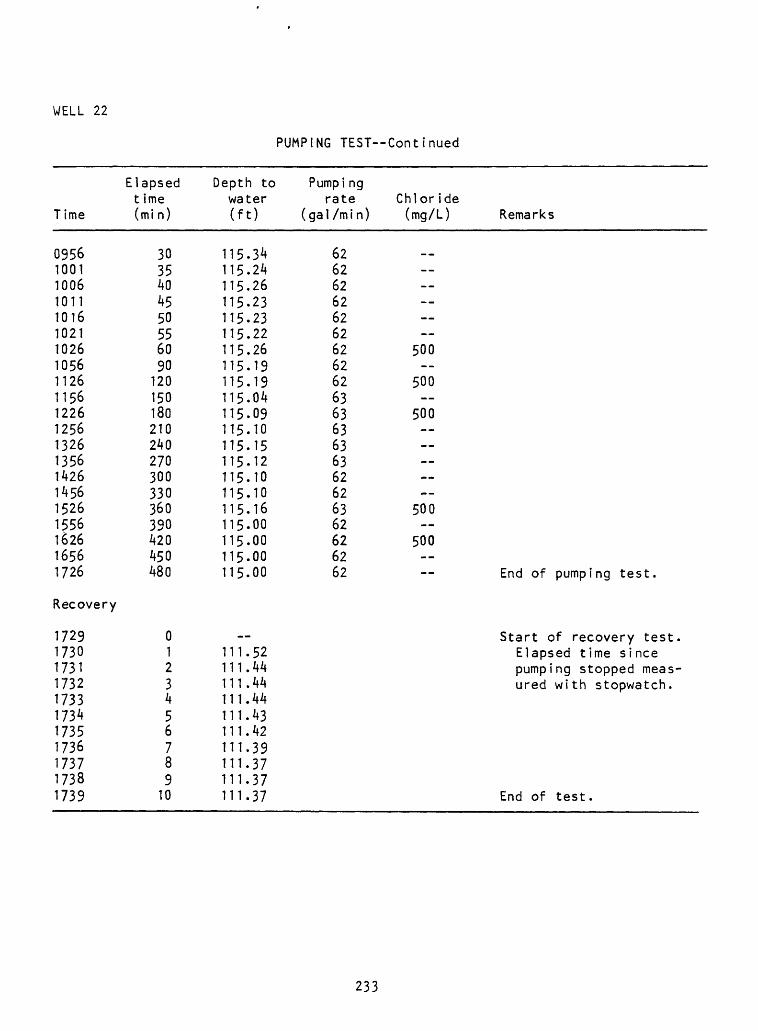
WELL 22
PUMPING TE5T--Continued
Elapsed t ime
Time (min)
095610011006101110161021102610561126115612261256132613561426145615261556162616561726
Recovery
17291730173117321733173417351736173717381739
3035404550556090120150180210240270300330360390420450480
0123456789
10
Depth to water (ft)
115.34115.24115.26115.23115.23115.22115.26115.19115.19115.04115.09115.10115.15115.12115.10115.10115.16115.00115.00115.00115.00
1 1 1 . 52111.44111.44111.44111.43111.42111.39111.37111.37111.37
Pumpi ng rate Chloride
(gal/min) (mg/L) Remarks
62626262626262 5006262 5006363 500636363626263 5006262 5006262 End of pumping test.
Start of recovery test.Elapsed time sincepumping stopped measured with stopwatch.
End of test.
233
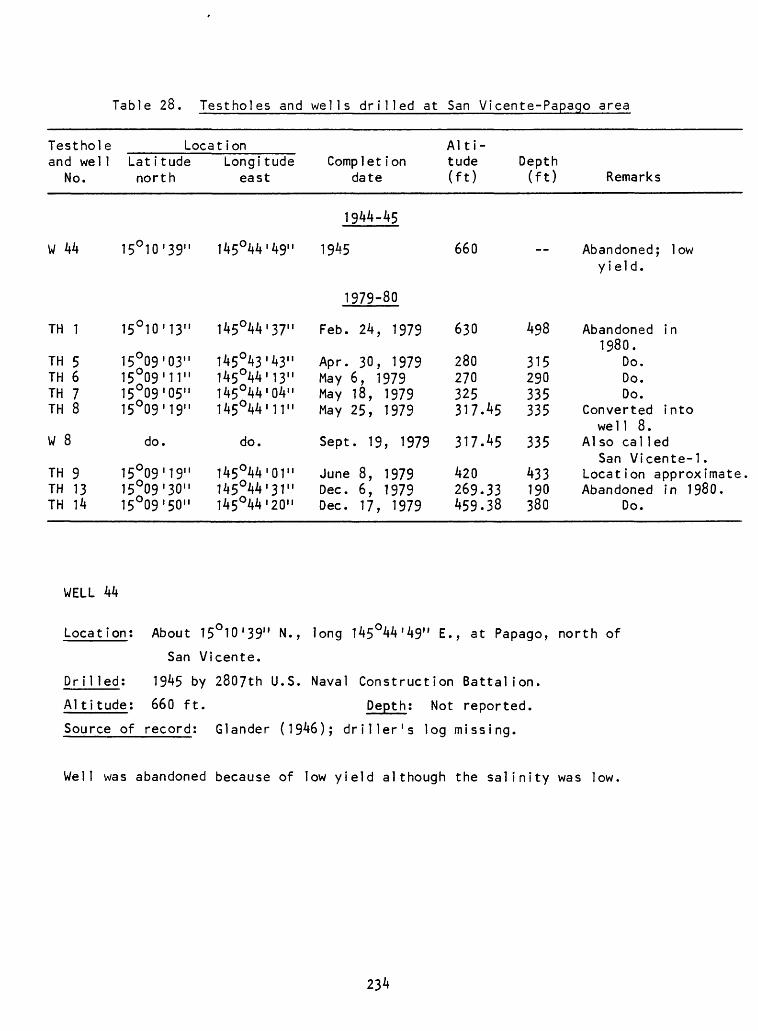
Table 28. Testholes and wells drilled at San Vicente-Papago area
Testhole and wel 1
No.
W 44
Locat ionLat i tude north
15°10'39"
Longi tude east
145°4V49"
Complet ion date
1944-45
1945
Alti tude (ft)
660
Depth (ft) Remarks
Abandoned; lowyield.
1979-80
TH 1
TH 5TH 6TH 7TH 8
W 8
TH 9TH 13TH 14
15 10'13"
15°09'03"15°09 ' 1 1"15°09'05"15°09'19"
do.
15°09'19"15°09'30"15°09'50"
145 4V 37"
145°43 143"145°44'13"145°44 "04"145°44'11"
do.
145°4V01"145°4V31"145°44'20"
Feb. 24, 1979
Apr. 30, 1979May 6, 1979May 18, 1979May 25, 1979
Sept. 19, 1979
June 8, 1979Dec. 6, 1979Dec. 17, 1979
630
280270325317.45
317.45
420269.33459.38
498
315290335335
335
433190380
Abandoned in1980.
Do.Do.Do.
Converted intowell 8.
Also cal ledSan Vicente-1 .
Location approximateAbandoned in 1980.
Do.
WELL 44
Location: About 15°10'39" N., long 145°44'49" E., at Papago, north of
San Vicente.
Drilled; 1945 by 2807th U.S. Naval Construction Battalion.
Alti tude: 660 ft. Depth: Not reported.
Source of record; Glander (1946); driller's log missing.
Well was abandoned because of low yield although the salinity was low.
234
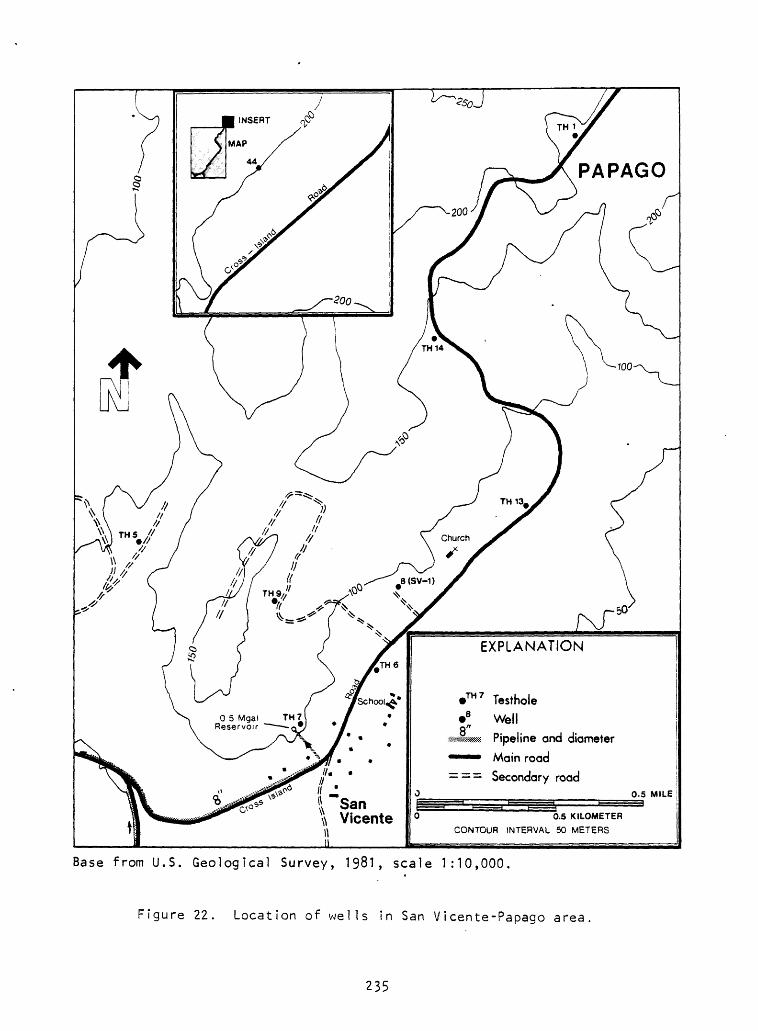
PAPAGO
EXPLANATION
TH7 Testhole
8 Well
Pipeline and diameter
Main road
= = Secondary road
0.5 KILOMETER
CONTOUR INTERVAL 50 METERS
Base from U.S. Geological Survey, 1981, scale 1:10,000
Figure 22. Location of wells in San Vicente-Papago area.
235
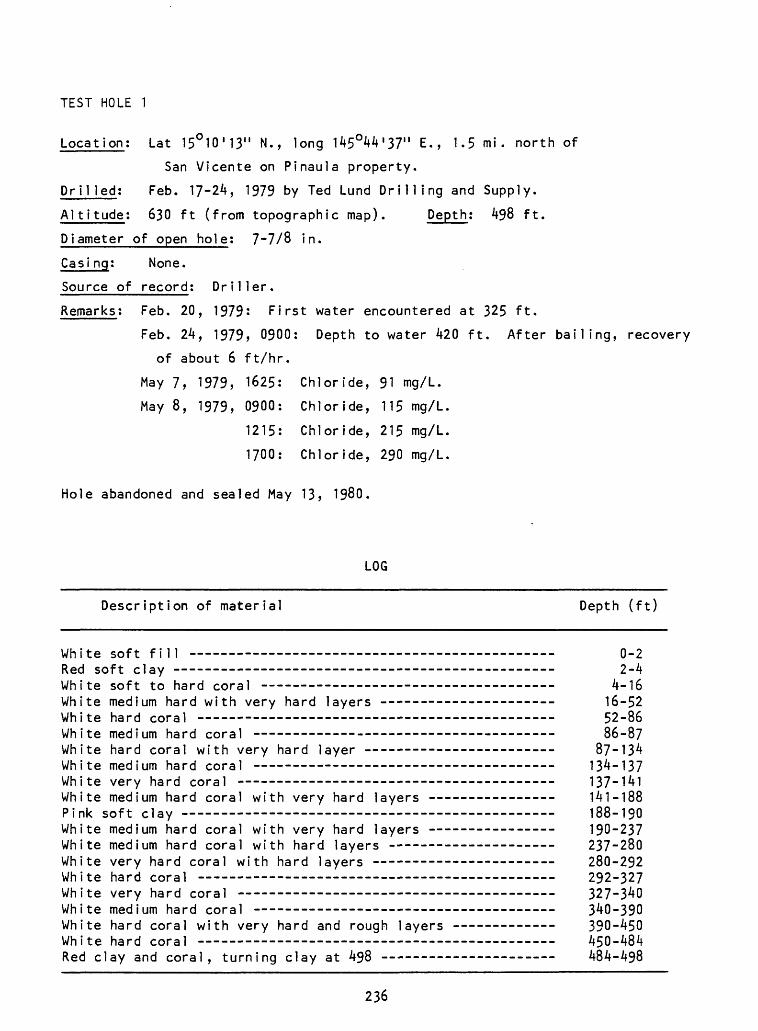
TEST HOLE 1
Location; Lat 15°10'13" N., long 145°44'37" E., 1.5 mi. north of
San Vicente on Pinaula property.
Drilled: Feb. 17-24, 1979 by Ted Lund Drilling and Supply.
Altitude: 630 ft (from topographic map). Depth: 498 ft.
Diameter of open hole; 7-7/8 in.
Casi ng; None.
Source of record; Driller.
Remarks: Feb. 20, 1979: First water encountered at 325 ft.
Feb. 24, 1979, 0900: Depth to water 420 ft. After bailing, recovery
of about 6 ft/hr.
May 7, 1979, 1625: Chloride, 91 mg/L.
May 8, 1979, 0900: Chloride, 115 mg/L.
1215: Chloride, 215 mg/L.
1700: Chloride, 290 mg/L.
Hole abandoned and sealed May 13, 1980.
LOG
Description of material Depth (ft)
White soft fill -----------------------------------------Red soft clay - _____White soft to hard coral -- --------------------------White medium hard with very hard layers - White hard coral - - -----White medium hard coral - White hard coral with very hard layer - White medium hard coral ---- _______________________White very hard coral --------- ______________________White medium hard coral with very hard layers -----------Pink soft clay -- -White medium hard coral with very hard layers ---------White medium hard coral with hard layers ----------- ---White very hard coral with hard layers --------- _- _White hard coral - - White very hard coral __________________________ ___White medium hard coral ---- ______ _________________White hard coral with very hard and rough layers -----White hard coral - -Red clay and coral, turning clay at 498 ---------- --_
0-2 2-4 4-16 16-52 52-86 - 86-87 - 87-134 134-137 - 137-141 141-188 188-190 190-237 237-280 280-292 292-327 - 327-340 340-390 390-450 450-484 484-498
236
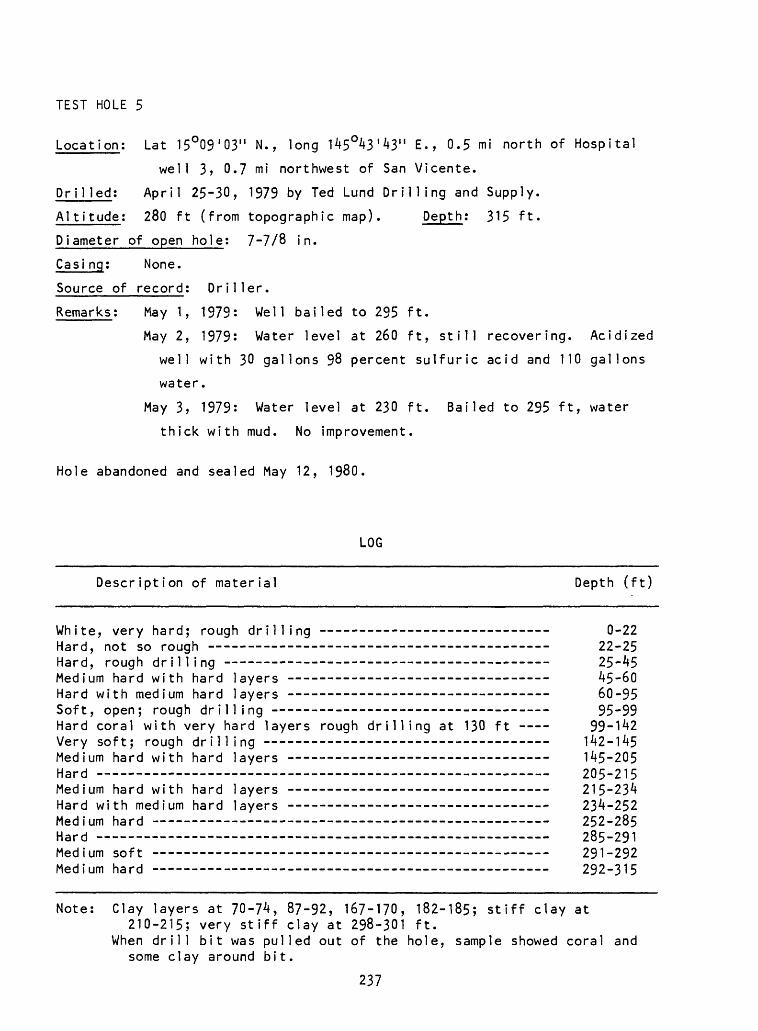
TEST HOLE 5
Location; Lat 15°09'03" N., long 145°43'43" E., 0.5 mi north of Hospital
well 3> 0.7 mi northwest of San Vicente.
Drilled; April 25-30, 1979 by Ted Lund Drilling and Supply.
Altitude; 280 ft (from topographic map). Depth; 315 ft.
Diameter of open hole; 7-7/8 in.
Casi ng; None.
Source of record; Driller.
Remarks; May 1, 1979: Well bailed to 295 ft.
May 2, 1979: Water level at 260 ft, still recovering. Acidized
well with 30 gallons 98 percent sulfuric acid and 110 gallons
water.
May 3, 1979: Water level at 230 ft. Bailed to 295 ft, water
thick with mud. No improvement.
Hole abandoned and sealed May 12, 1980.
LOG
Description of material Depth (ft)
White, very hard; rough drilling - 0-22Hard, not so rough 22-25Hard, rough drilling 25-45Medium hard with hard layers - - 45-60Hard with medium hard layers ---------------- ----- ________ 60-95Soft, open; rough drilling - - - - 95-99Hard coral with very hard layers rough drilling at 130 ft ---- 99-142Very soft; rough drilling 142-145Medium hard with hard layers - - - --- - 145-205Hard 205-215Medium hard with hard layers 215-234Hard with medium hard layers 234-252Medium hard 252-285Hard 285-291Medium soft 291-292Medium hard 292-315
Note: Clay layers at 70-74, 87-92, 167-170, 182-185; stiff clay at210-215; very stiff clay at 298-301 ft.
When drill bit was pulled out of the hole, sample showed coral and some clay around bit.
237
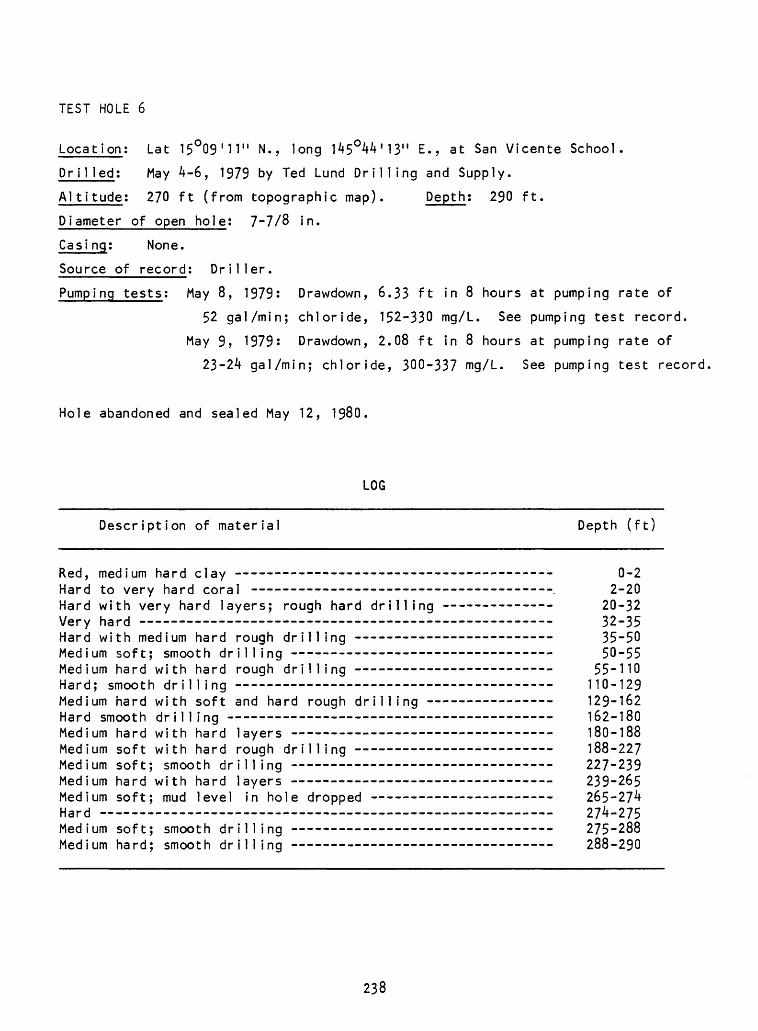
TEST HOLE 6
Location; Lat 15°09'11" N., long 145°44'13" E., at San Vicente School.
Drilled; May 4-6, 1979 by Ted Lund Drilling and Supply.
Altitude; 270 ft (from topographic map). Depth: 290 ft.
Diameter of open hole; 7-7/8 in.
Casi ng; None.
Source of record; Driller.
Pumping tests; May 8, 1979: Drawdown, 6.33 ft in 8 hours at pumping rate of
52 gal/min; chloride, 152-330 mg/L. See pumping test record.
May 9? 1979: Drawdown, 2.08 ft in 8 hours at pumping rate of
23-24 gal/min; chloride, 300-337 mg/L. See pumping test record
Hole abandoned and sealed May 12, 1980.
LOG
Description of material Depth (ft)
Red, medium hard clay - - ----- Q-2Hard to very hard coral . 2-20Hard with very hard layers; rough hard drilling ------ -_ 20-32Very hard 32-35Hard with medium hard rough drilling 35-50Medium soft; smooth drilling - - 50-55Medium hard with hard rough drilling - ---- -------------- 55-110Hard; smooth drilling -- - 110-129Medium hard with soft and hard rough drilling ---- --- 129-162Hard smooth drilling 162-180Medium hard with hard layers - -- -- 180-188Medium soft with hard rough drilling ----------------------- 188-227Medium soft; smooth drilling -- 227-239Medium hard with hard layers 239-265Medium soft; mud level in hole dropped -- --------- ------ 265-274Hard 274-275Medium soft; smooth drilling 275-288Medium hard; smooth drilling 288-290
238
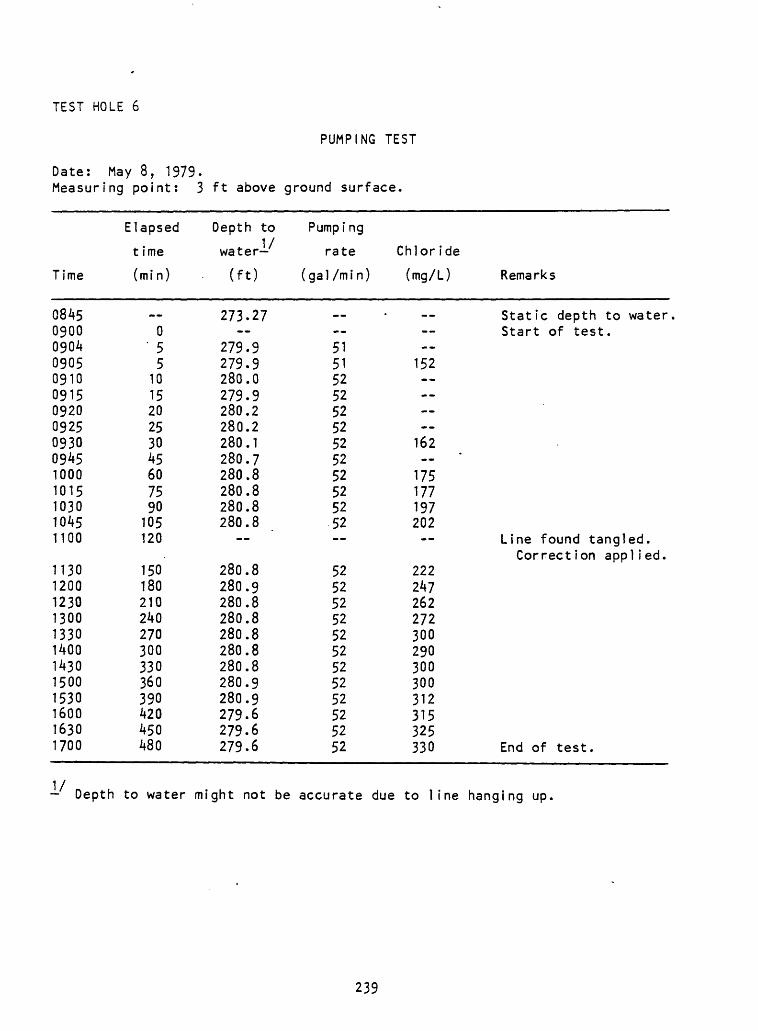
TEST HOLE 6
PUMPING TEST
Date: May 8, 1979-Measuring point: 3 ft above ground surface.
Time
084509000904090509100915092009250930094510001015103010451100
113012001230130013301400143015001530160016301700
Elapsed
t ime
(mi n)
0' 5
5101520253045607590105120
150180210240270300330360390420450480
Depth to water-'
(ft)
273.27
279.9279.9280.0279.9280.2280.2280.1280.7280.8280.8280.8280.8
280.8280.9280.8280.8280.8280.8280.8280.9280.9279.6279.6279.6
Pumpi ng
rate
(gal /mi n)
515152525252525252525252
525252525252525252525252
Chloride
(mg/L) Remarks
Static depth to waterStart of test.
--152----
162
175177197202
Line found tangled.Correction appl ied.
222247262272300290300300312315325330 End of test.
- Depth to water might not be accurate due to line hanging up.
239
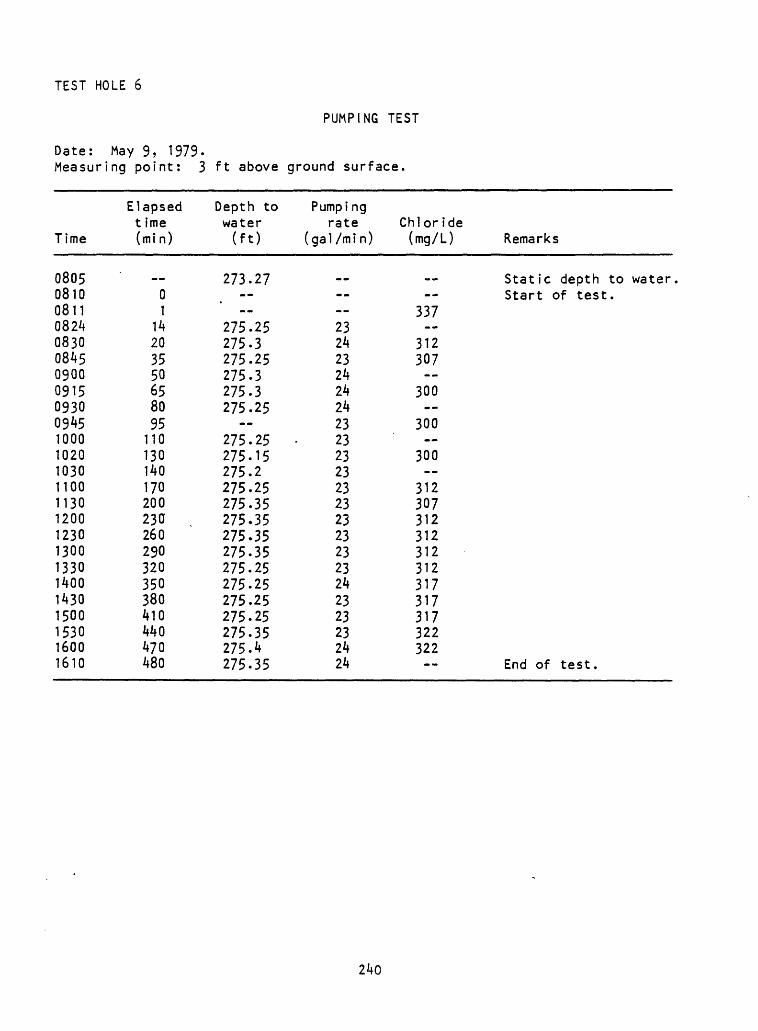
TEST HOLE 6
PUMPING TEST
Date: May 9, 1979.Measuring point: 3 ft above ground surface.
Time
08050810081108240830084509000915093009^5100010201030110011301200123013001330140014301500153016001610
Elapsed time (mi n)
« _01
14203550658095110130140170200230260290320350380410440470480
Depth to Pumping water rate (ft) (gal/min)
273.27
275.25275.3275.25275.3275.3275.25
275.25 -275.15275.2275.25275.35275.35275.35275.35275.25275.25275.25275.25275.35275.4275.35
_ _ 23242324242423232323232323232323242323232424
Chloride (mg/L) Remarks
Static depth to waterStart of test.
337
312307
300
300'
300
312307312312312312317317317322322
End of test.
240
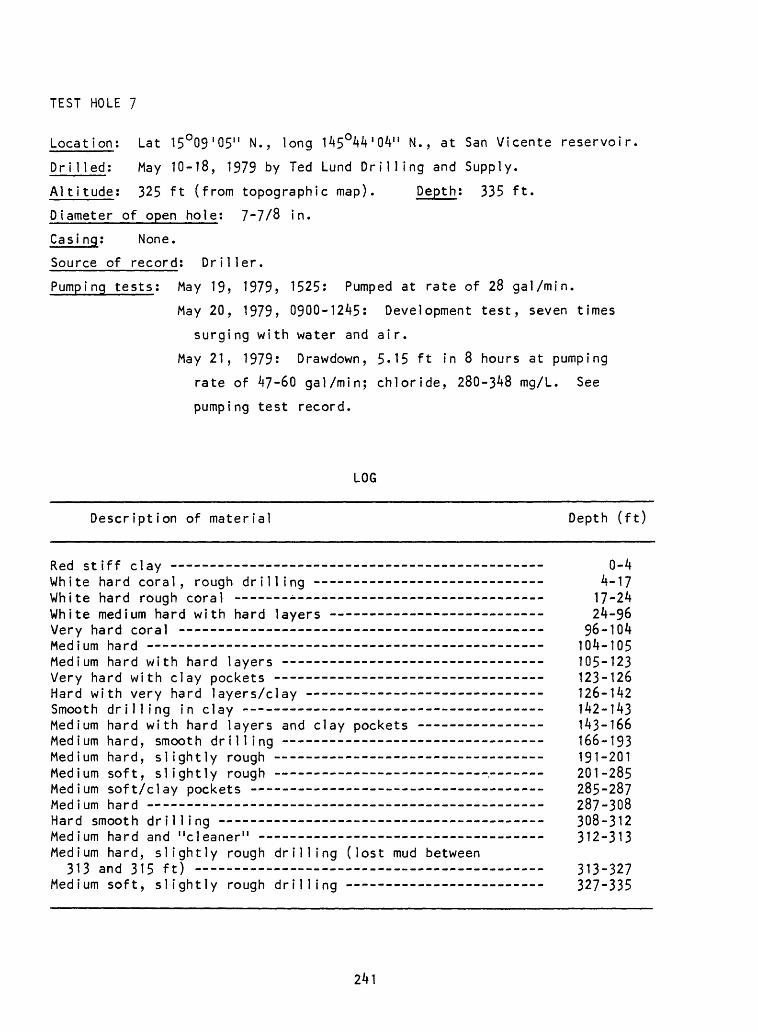
TEST HOLE 7
Location; Lat 15°09'05" N., long 145°44'04" N., at San Vicente reservoir
Dr?1 led: May 10-18, 1979 by Ted Lund Drilling and Supply.
Altitude: 325 ft (from topographic map). Depth; 335 ft.
Diameter of open hole; 7-7/8 in.
Casi ng: None.
Source of record; Driller.
Pumping tests; May 19, 1979, 1525: Pumped at rate of 28 gal/min.
May 20, 1979, 0900-1245: Development test, seven times
surging with water and air.
May 21, 1979: Drawdown, 5.15 ft in 8 hours at pumping
rate of 47-60 gal/min; chloride, 280-348 mg/L. See
pumping test record.
LOG
Description of material Depth (ft)
Red stiff clay 0-4White hard coral, rough drilling --- -- - 4-17White hard rough coral -------------------- ____-_-_--___-_ 17-24White medium hard with hard layers --- --------- --- __-__ 24-96Very hard coral - 96-104Medium hard 104-105Medium hard with hard layers ------- -- ---- ---------- 105-123Very hard with clay pockets -- -- - 123-126Hard with very hard layers/clay - ---- - -- - 126-142Smooth drilling in clay - 142-143Medium hard with hard layers and clay pockets ---- -------- 143-166Medium hard, smooth drilling - - - - - -- ---- 166-193Medium hard, slightly rough -- --- 191-201Medium soft, slightly rough -- 201-285Medium soft/clay pockets 285-287Medium hard 287-308Hard smooth drilling ~ 308-312Medium hard and "cleaner" 312-313Medium hard, slightly rough drilling (lost mud between
313 and 315 ft) 313-327Medium soft, slightly rough drilling -- --- 327-335
241
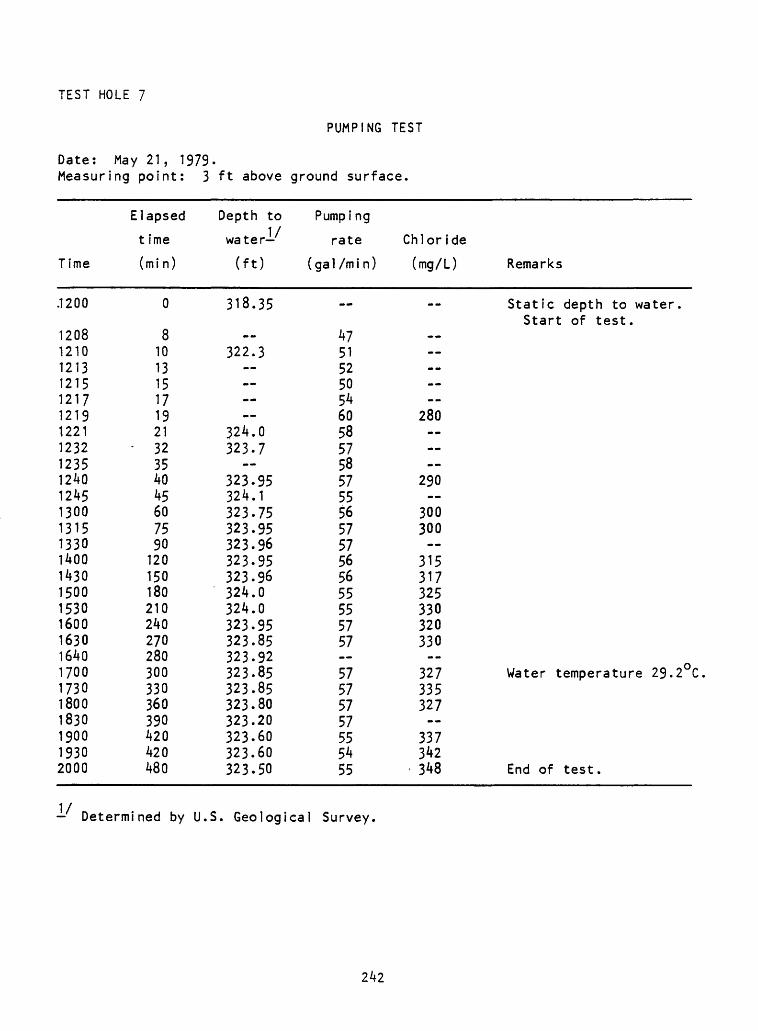
TEST HOLE 7
PUMPING TEST
Date: May 21, 1979-Measuring point: 3 ft above ground surface.
Time
.1200
1208121012131215121712191221123212351240124513001315133014001430150015301600163016401700173018001830190019302000
Elapsed
t ime
(min)
0
8101315171921
32354045607590
120150180210240270280300330360390420420480
Depth to water-'
(ft)
318.35
322.3
324.0323.7
323.95324.1323.75323.95323.96323.95323.96324.0324.0323.95323.85323.92323.85323.85323.80323.20323.60323.60323.50
Pumping
rate
(gal /mi n)
--
4751525054605857585755565757565655555757--57575757555455
Chloride
(mg/L) Remarks
Static depth to water.Start of test.
280 --
290--
300300
315317325330320330--
327 Water temperature 29.2°C335327--
337342348 End of test.
Determined by U.S. Geological Survey.
242
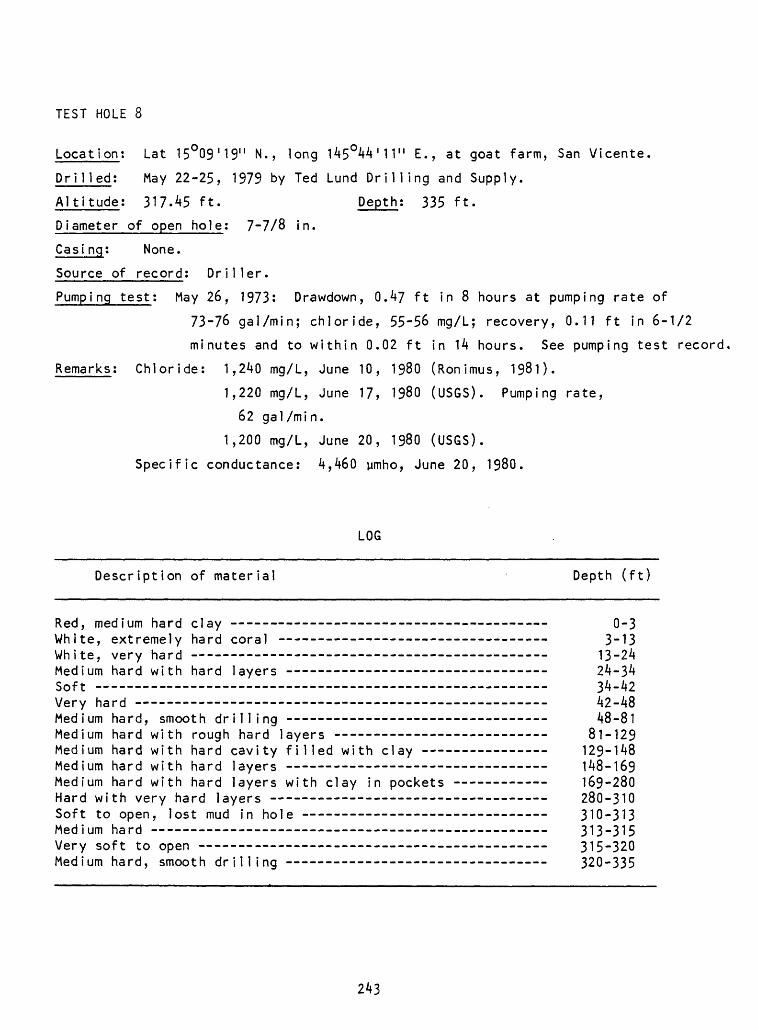
TEST HOLE 8
Location: Lat 15°09'19" N., long 145O44'H" E., at goat farm, San Vicente.
Drilled; May 22-25, 1979 by Ted Lund Drilling and Supply.
Altitude; 317.45 ft. Depth; 335 ft.
Diameter of open hole; 7-7/8 in.
Casi ng; None.
Source of record; Driller.
Pumping test; May 26, 1973; Drawdown, 0.47 ft in 8 hours at pumping rate of
73-76 gal/min; chloride, 55-56 mg/L; recovery, 0.11 ft in 6-1/2
minutes and to within 0.02 ft in 14 hours. See pumping test record
Remarks; Chloride: 1,240 mg/L, June 10, 1980 (Ronimus, 1981).
1,220 mg/L, June 17, 1980 (USGS). Pumping rate,
62 gal/min.
1,200 mg/L, June 20, 1980 (USGS).
Specific conductance: 4,460 ymho, June 20, 1980.
LOG
Description of material Depth (ft)
Red, medium hard clay - -- - 0-3White, extremely hard coral _____________ _____________ 3-13White, very hard -- 13-24Medium hard with hard layers - -- - - - 24-34Soft 34-42Very hard 42-48Medium hard, smooth drilling - -- 48-81Medium hard with rough hard layers ---------- --_____ __ __ 81-129Medium hard with hard cavity filled with clay 129-148Medium hard with hard layers -- 148-169Medium hard with hard layers with clay in pockets 169-280Hard with very hard layers -- 280-310Soft to open, lost mud in hole - 310-313Medium hard 313-315Very soft to open 315-320Medium hard, smooth drilling - - - 320-335
243
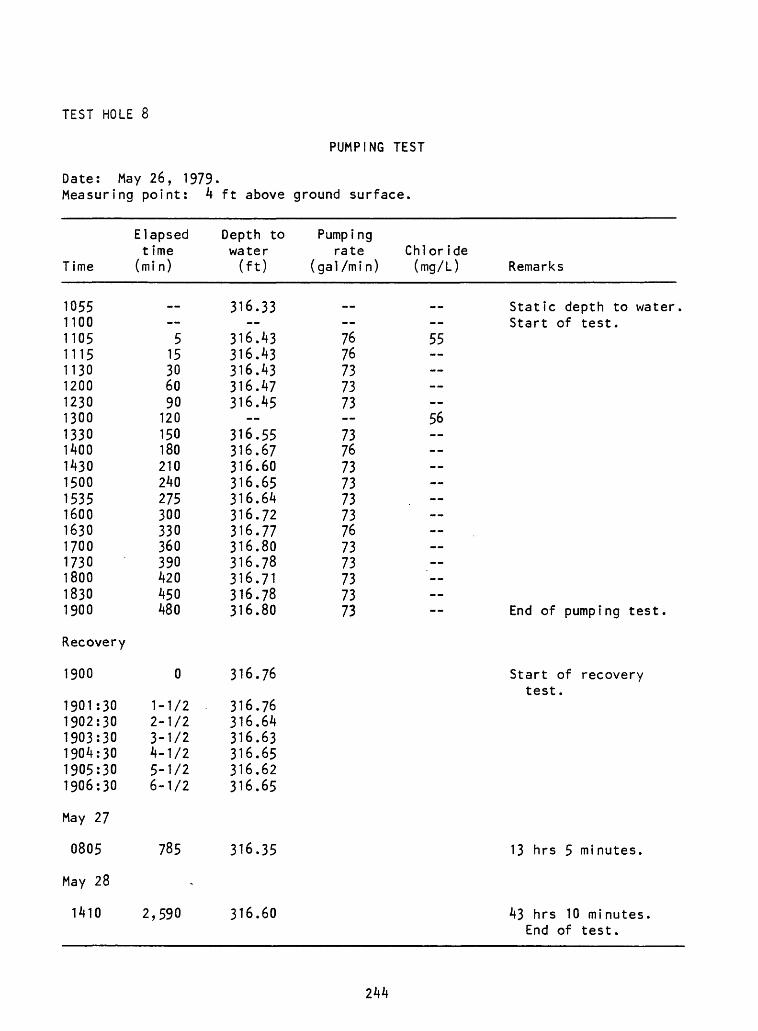
TEST HOLE 8
PUMPING TEST
Date: May 26, 1979.Measuring point: 4 ft above ground surface.
Time
10551100110511151130120012301300133014001^30150015351600163017001730180018301900
Recovery
1900
1901:301902:301903:301904:301905:301906:30
May 27
0805
May 28
1410
Elapsed t ime
(min)
_ 5
15306090120150180210240275300330360390420450480
0
1-1/22-1/23-1/24-1/25-1/26-1/2
785
-
2,590
Depth to water (ft)
316.33
316.43316.43316.43316.47316.45
316.55316.67316.60316.65316.64316.72316.77316.80316.78316.71316.78316.80
316.76
316.76316.64316.63316.65316.62316.65
316.35
316.60
Pumpi ng rate Chloride
(gal/min) (mg/L) Remarks
Static depth to water.Start of test.
76 5576737373
567376737373 . 73767373737373 End of pumping test.
Start of recoverytest.
13 hrs 5 minutes.
43 hrs 10 minutes.End of test.
244
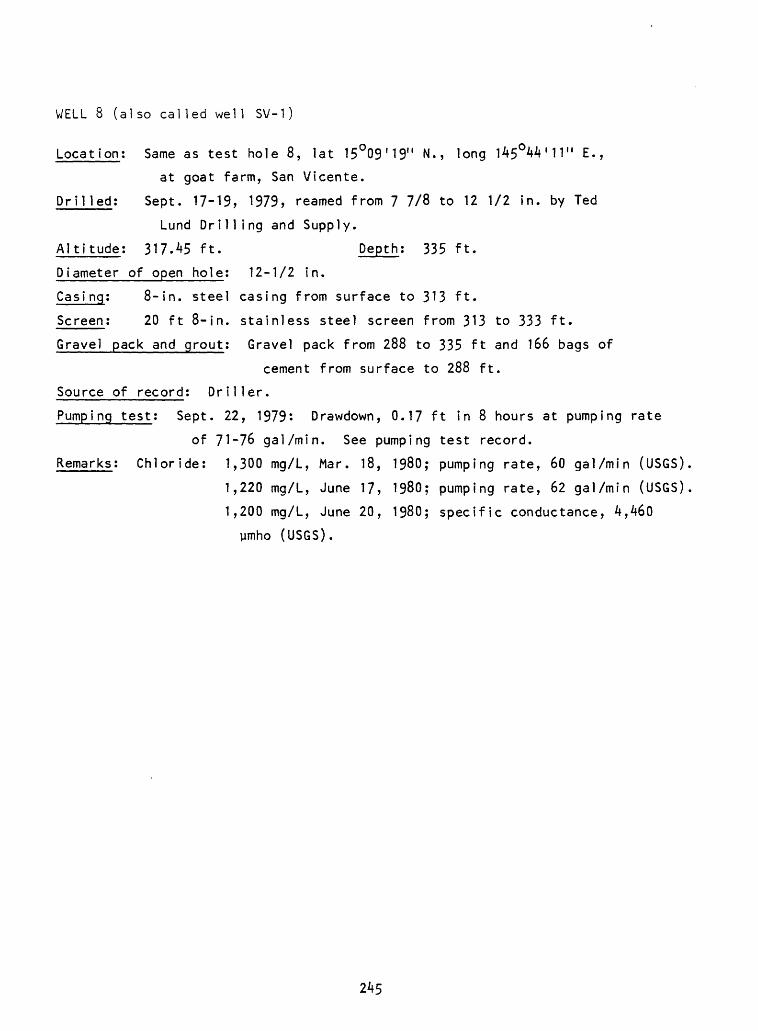
WELL 8 (also called wel1 SV-1)
Location; Same as test hole 8, lat 15°09'19" N., long 145O44'H" E.,
at goat farm, San Vicente.
Drilled; Sept. 17-19, 1979, reamed from 7 7/8 to 12 1/2 in. by Ted
Lund Drilling and Supply.
Altitude; 317.45 ft. Depth; 335 ft.
Diameter of open hole; 12-1/2 in.
Gas? ng; 8-in. steel casing from surface to 313 ft.
Screen; 20 ft 8-in. stainless steel screen from 313 to 333 ft.
Gravel pack and grout; Gravel pack from 288 to 335 ft and 166 bags of
cement from surface to 288 ft.
Source of record; Driller.
Pumping test; Sept. 22, 1979: Drawdown, 0.17 ft in 8 hours at pumping rate
of 71-76 gal/min. See pumping test record.
Remarks; Chloride: 1,300 mg/L, Mar. 18, 1980; pumping rate, 60 gal/min (USGS)
1,220 mg/L, June 17, 1980; pumping rate, 62 gal/min (USGS)
1,200 mg/L, June 20, 1980; specific conductance,
umho (USGS).
245
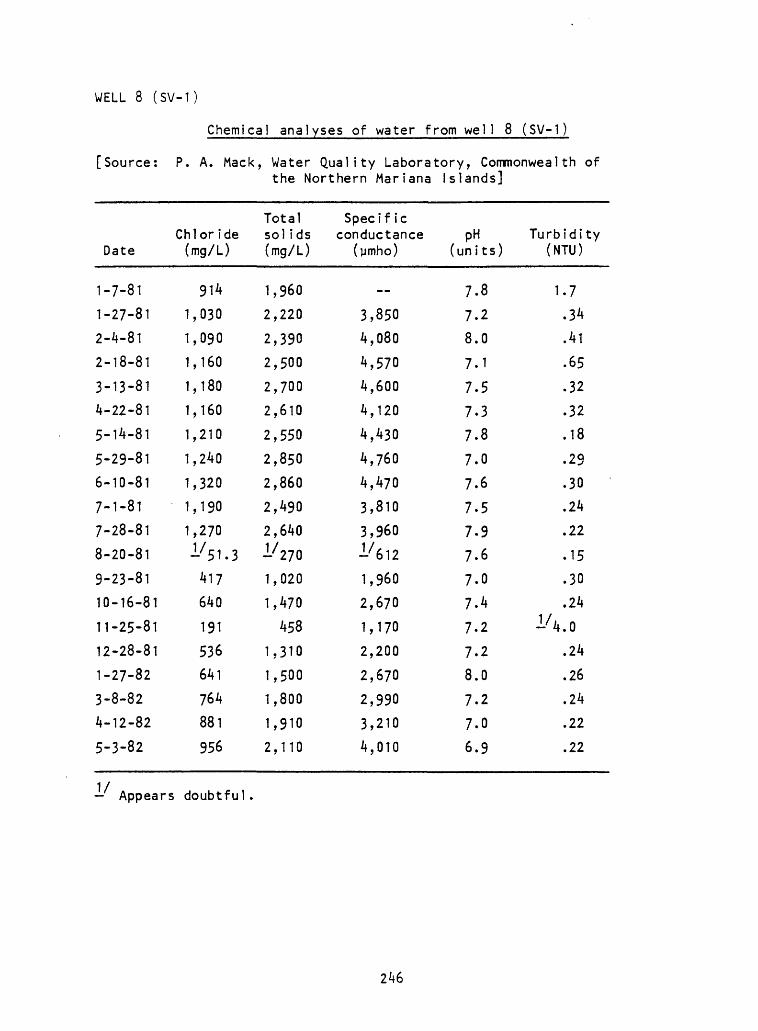
WELL 8 (SV-1)
Chemical analyses of water from well 8 (SV-1
[Source:
Date
1-7-81
1-27-81
2-4-81
2-18-81
3-13-81
4-22-81
5-14-81
5-29-81
6-10-81
7-1-81
7-28-81
8-20-81
9-23-81
10-16-81 11-25-81
12-28-81
1-27-82
3-8-82
4-12-82
5-3-82
P. A. Mack, Water Quality Laboratory, Commonwealth of the Northern Mariana Islands]
Chloride (mg/L)
914
1,030
1,090
1,160
1,180
1,160
1,210
1,240
1,320
1,190
1,270 1/51.3
417
640
191
536
641
764
881
956
Total sol ids (mg/L)
1,960
2,220
2,390
2,500
2,700
2,610
2,550
2,850
2,860
2,490
2,640 1/270
1,020
1,470
458
1,310
1,500
1,800
1,910
2,110
Specif ic conductance
(umho)
3,850
4,080
4,570
4,600
4,120
4,430
4,760
4,470
3,810
3,960 1/612
1,960
2,670
1,170
2,200
2,670
2,990
3,210
4,010
pH (units)
7.8
7.2
8.0
7.1
7.5
7.3
7.8
7.0
7.6
7.5
7.9
7.6
7.0
7.4
7.2
7.2
8.0
7.2
7.0
6.9
Turbidity (NTU)
1.7
.34
.41
.65
.32
.32
.18
.29
.30
.24
.22
.15
.30
.24 1/4.0
.24
.26
.24
.22
.22
Appears doubtful.
246
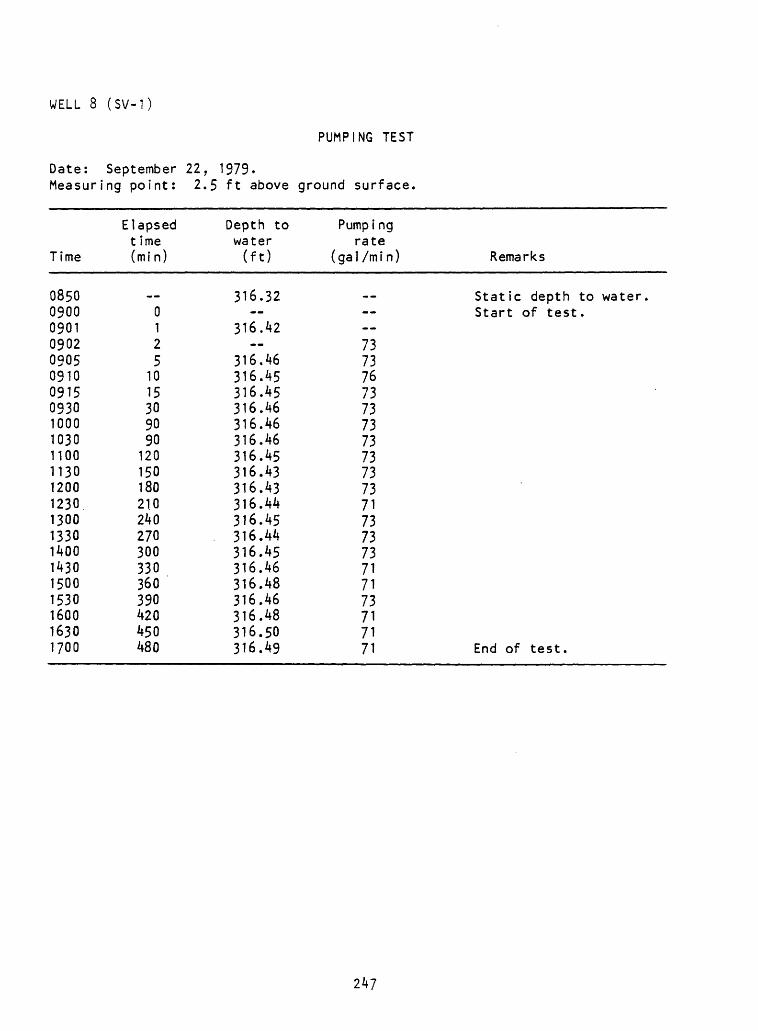
WELL 8 (SV-1)
PUMPING TEST
Date: September 22, 1979.Measuring point: 2.5 ft above ground surface.
Time
08500900090109020905091009150930100010301100113012001230130013301400143015001530160016301700
Elapsed t ime (min)
_ _0125
1015309090
120150180210240270300330360390420450480
Depth to water (ft)
316.32
316.42
316.46316.45316.45316.46316.46316.46316.45316.43316.43316.44316.45316.44316.45316.46316.48316.46316.48316.50316.49
Pumping rate
(gal /min) Remarks
Static depth to water.Start of test.
7373767373737373737371737373717173717171 End of test.
247
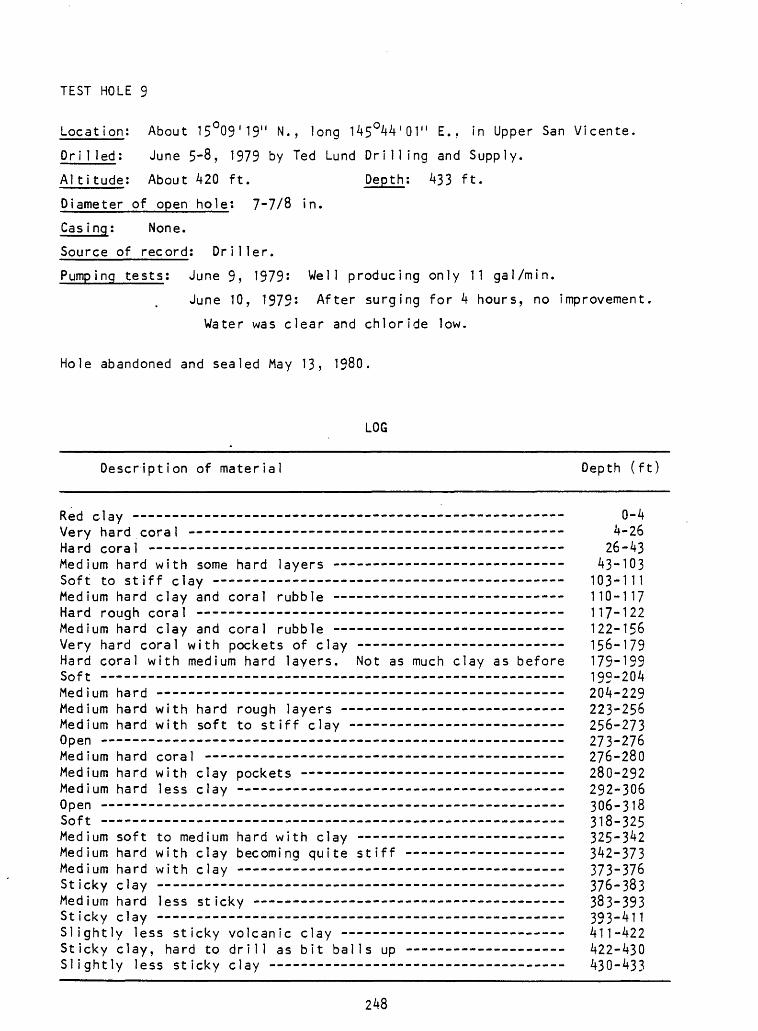
TEST HOLE 9
Location; About 15 O09'19" N., long 145 044'01" E.. in Upper San Vicente.
Dri1 led: June 5-8, 1979 by Ted Lund Drilling and Supply.
Altitude; About 420 ft. Depth; 433 ft.
Diameter of open hole: 7*7/8 in.
Cas ing: None.
Source of record: Driller.
Pumping tests: June 9, 1979: Well producing only 11 gal/min.
June 10, 1979 : After surging for 4 hours, no improvement
Water was clear and chloride low.
Hole abandoned and sealed May 13, 1980.
LOG
Description of material Depth (ft)
Red clay 0-4Very hard coral - ----- -- -- -- ___________ 4-26Hard coral 26-43Medium hard with some hard layers -- - - - 43-103Soft to stiff clay 103-111Medium hard clay and coral rubble -- ---- ------ _________ 110-117Hard rough coral 117-122Medium hard clay and coral rubble -- --- _-__--___- -__ 122-156Very hard coral with pockets of clay - - - - 156-179Hard coral with medium hard layers. Not as much clay as before 179-199Soft 199-204Medium hard 204-229Medium hard with hard rough layers - 223-256Medium hard with soft to stiff clay 256-273Open 273-276Medium hard coral 276-280Medium hard with clay pockets - - 280-292Medium hard less clay 292-306Open 306-318Soft 318-325Medium soft to medium hard with clay - -- - 325-342Medium hard with clay becoming quite stiff ------------------ 342-373Medium hard with clay - -- - - - - 373-376Sticky clay - - - - - 376-383Medium hard less sticky - - - - - 383-393Sticky clay - - - - - -- 393-411Slightly less sticky volcanic clay 411-422Sticky clay, hard to drill as bit balls up 422-430Slightly less sticky clay 430-433
248
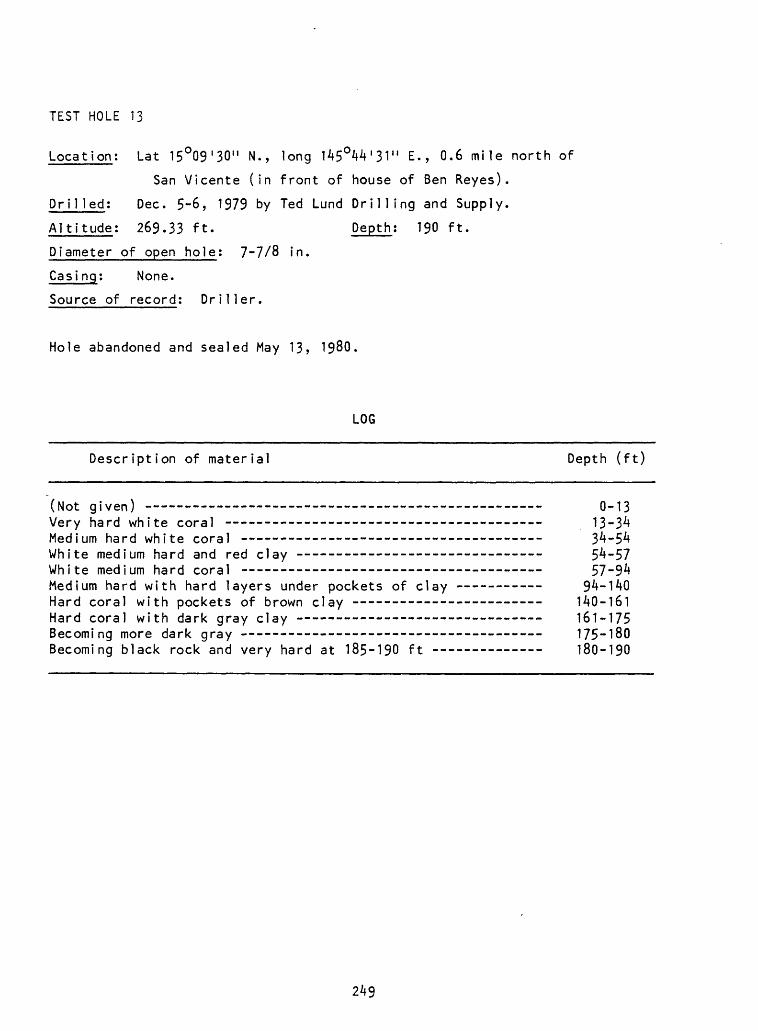
TEST HOLE 13
Location; Lat 15°09'30" N., long 145°4V31" E., 0.6 mile north of
San Vicente (in front of house of Ben Reyes).
Drilled: Dec. 5-6, 1979 by Ted Lund Drilling and Supply.
Altitude: 269.33 ft. Depth; 190 ft.
Diameter of open hole; 7-7/8 in.
Casing; None.
Source of record; Driller.
Hole abandoned and sealed May 13, 1980.
LOG
Description of material Depth (ft)
(Not given) ----- -- - - ______ _________ _ 0-13Very hard white coral -- - 13-3^Medium hard white coral -____- ______________ _______ 3^-5^White medium hard and red clay -- --- ----_------_--- 5^-57White medium hard coral - -_---__--__-_-- --__ __________ 57-9^Medium hard with hard layers under pockets of clay ------ - 94-140Hard coral with pockets of brown clay - 140-161Hard coral with dark gray clay ----------- ________ ____ 161-175Becoming more dark gray 175-180Becoming black rock and very hard at 185-190 ft -- - 180-190
249
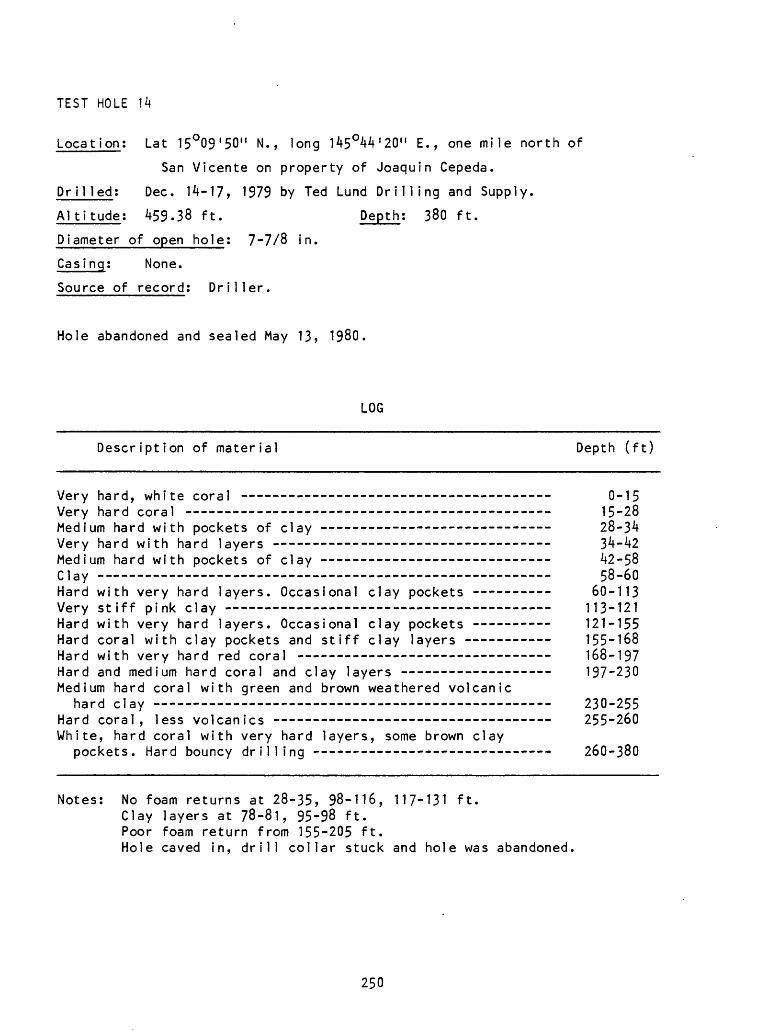
TEST HOLE 14
Location: Lat 15°09'50" N., long 145°44'20" E., one mile north of
San Vicente on property of Joaquin Cepeda.
Drilled: Dec. 14-17, 1979 by Ted Lund Drilling and Supply.
Altitude: 459-38 ft. Depth; 380 ft.
Diameter of open hole; 7-7/8 in.
Casing; None.
Source of record; Driller.
Hole abandoned and sealed May 13, 1980.
LOG
Description of material Depth (ft)
Very hard, white coral - - - 0-15Very hard coral 15-28Medium hard with pockets of clay 28-34Very hard with hard layers - - - 34-42Medium hard with pockets of clay 42-58day 58-60Hard with very hard layers. Occasional clay pockets - 60-113Very stiff pink clay 113-121Hard with very hard layers. Occasional clay pockets - 121-155Hard coral with clay pockets and stiff clay layers - 155-168Hard with very hard red coral --- --- -------- ------- - 168-197Hard and medium hard coral and clay layers -- - 197-230Medium hard coral with green and brown weathered volcanic
hard clay 230-255Hard coral, less volcanics - 255-260White, hard coral with very hard layers, some brown clay
pockets. Hard bouncy drilling - 260-380
Notes: No foam returns at 28-35, 98-116, 117-131 ft. Clay layers at 78-81, 95-98 ft. Poor foam return from 155-205 ft. Hole caved in drill collar stuck and hole was abandoned.
250
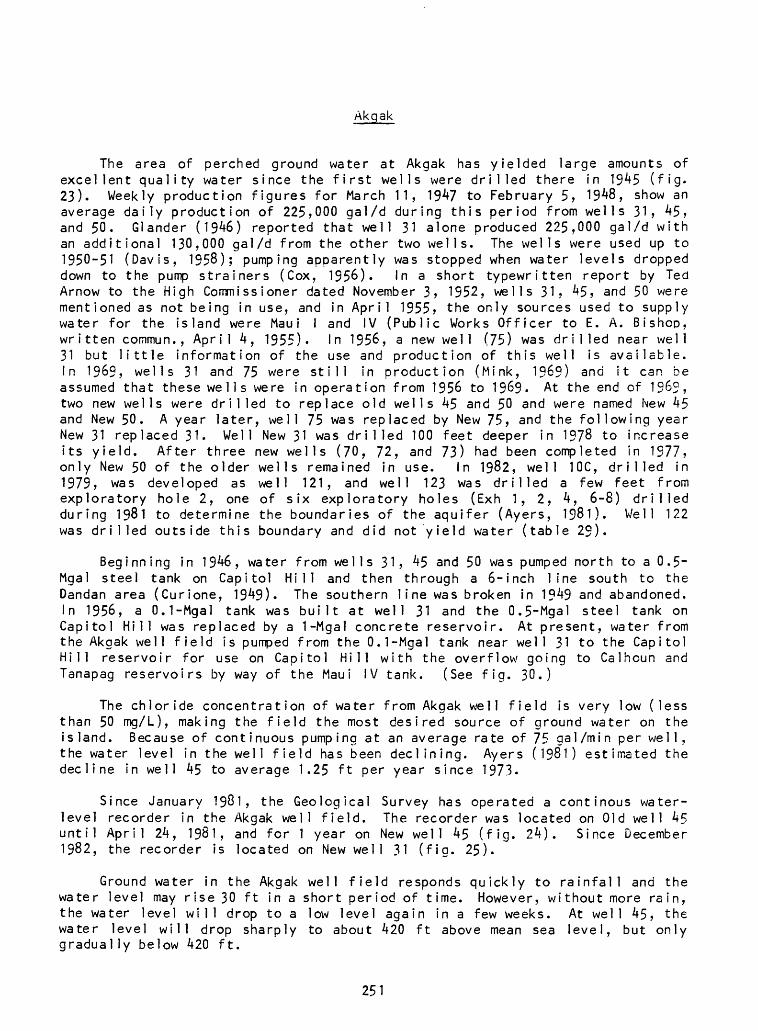
The area of perched ground water at Akgak has yielded large amounts of excellent quality water since the first wells were drilled there in 1945 (fig. 23). Weekly production figures for March 11, 1947 to February 5, 1948, show an average daily production of 225,000 gal/d during this period from wells 31, 45, and 50. Glander (1946) reported that well 31 alone produced 225,000 gal/d with an additional 130,000 gal/d from the other two wells. The wells were used up to 1950-51 (Davis, 1958); pumping apparently was stopped when water levels dropped down to the pump strainers (Cox, 1956). In a short typewritten report by Ted Arnow to the High Commissioner dated November 3, 1952, wells 31. 45, and 50 were mentioned as not being in use, and in April 1955, the only sources used to supply water for the island were Maui I and IV (Public Works Officer to E. A. Bishop, wr i tten commun., April 4, 1955). In 1956, a new we 1 I (75) was drilled near well 31 but little information of the use and production of this well is available. In 1969, wells 31 and 75 were still in production (Mink, 1969) and it can be assumed that these wells were in operation from 1956 to 1969. At the end of 1969, two new wells were drilled to replace old wells 45 and 50 and were named INCW 45 and New 50. A year later, well 75 was replaced by New 75, and the following year New 31 replaced 31. Well New 31 was drilled 100 feet deeper in 1978 to increase its yield. After three new wells (70, 72, and 73) had been completed in 1977, only New 50 of the older wells remained in use. In 1982, well 10C, drilled in 1979, was developed as well 121, and well 123 was drilled a few feet from exploratory hole 2, one of six exploratory holes (Exh 1, 2, 4, 6-8) drilled during 1981 to determine the boundaries of the aquifer (Ayers, 1981). Well 122 was drilled outside this boundary and did not yield water (table 29).
Beginning in 1946, water from wells 31, 45 and 50 was pumped north to a 0.5- Mgal steel tank on Capitol Hill and then through a 6-inch line south to the Dandan area (Curione, 1949). The southern line was broken in 1949 and abandoned. In 1956, a 0.1-Mgal tank was built at well 31 and the 0.5-Mgal steel tank on Capitol Hill was replaced by a 1-Mgal concrete reservoir. At present, water from the Akgak well field is pumped from the 0.1-Mgal tank near well 31 to the Capitol Hill reservoir for use on Capitol Hill with the overflow going to Calhoun and Tanapag reservoirs by way of the Maui IV tank. (See fig. 30.)
The chloride concentration of water from Akgak well field is very low (less than 50 mg/L), making the field the most desired source of ground water on the island. Because of continuous pumping at an average rate of 75 gal/min per well, the water level in the well field has been declining. Ayers (1981) estimated the decline in well 45 to average 1.25 ft per year since 1973.
Since January 1981, the Geological Survey has operated a continous water- level recorder in the Akgak well field. The recorder was located on Old well 45 until April 24, 1981, and for 1 year on New well 45 (fig. 24). Since December 1982, the recorder is located on New well 31 (fig. 25).
Ground water in the Akgak well field responds quickly to rainfall and the water level may rise 30 ft in a short period of time. However, without more rain, the water level will drop to a low level again in a few weeks. At well 45, the water level will drop sharply to about 420 ft above mean sea level, but only gradually below 420 ft.
251
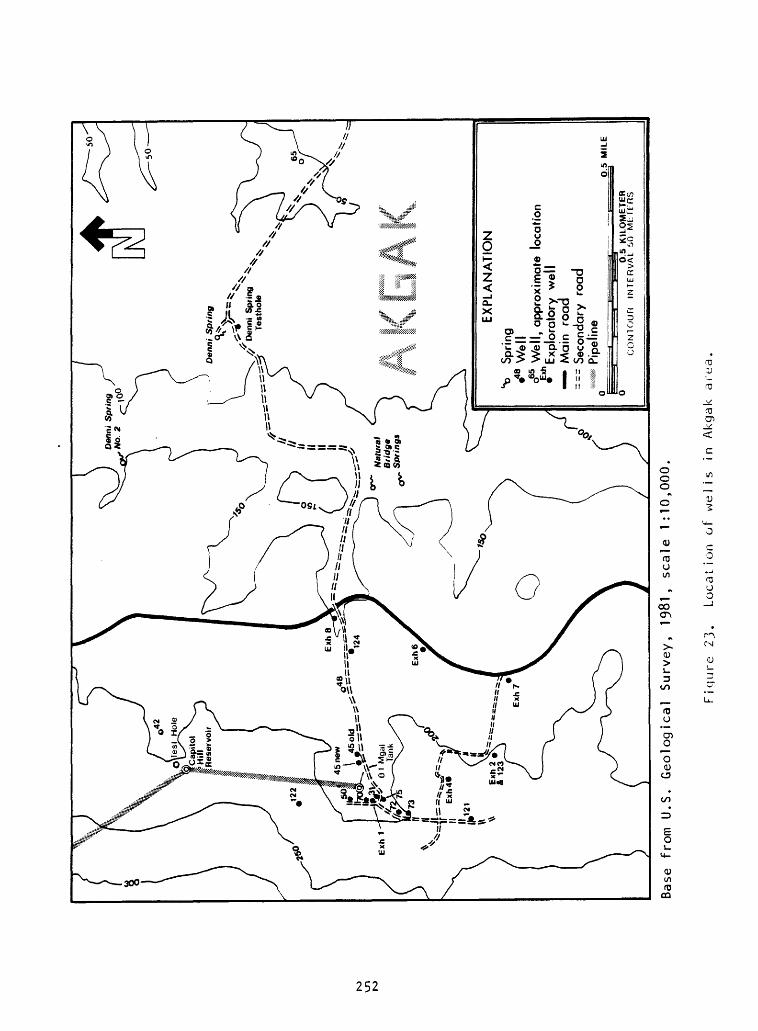
Ni
\Jt
Ni
Den
ni
Sp
rin
g
\%V
__
//'^
^
'
Den
ni S
prin
g ^
x
Tes
tho
le
x
.
EX
PL
AN
AT
ION
Sprin
g 4
8 W
ell
Wel
l, ap
prox
imat
e lo
catio
n ^
Exp
lora
tory
w
ell
M
ain
ro
ad--
- S
eco
nd
ary
road
m
m P
ipel
ine
0.5
M
ILE
0
0.5
K
ILO
ME
TE
RC
ON
IOU
R
INT
ER
VA
L
!>0
ME
TfR
S
Base
fr
om U.S. Geological Survey,
1981
, sc
ale
1:10
,000
.
Figure 23.
Loca
tion
of welis
in Akgak
area.
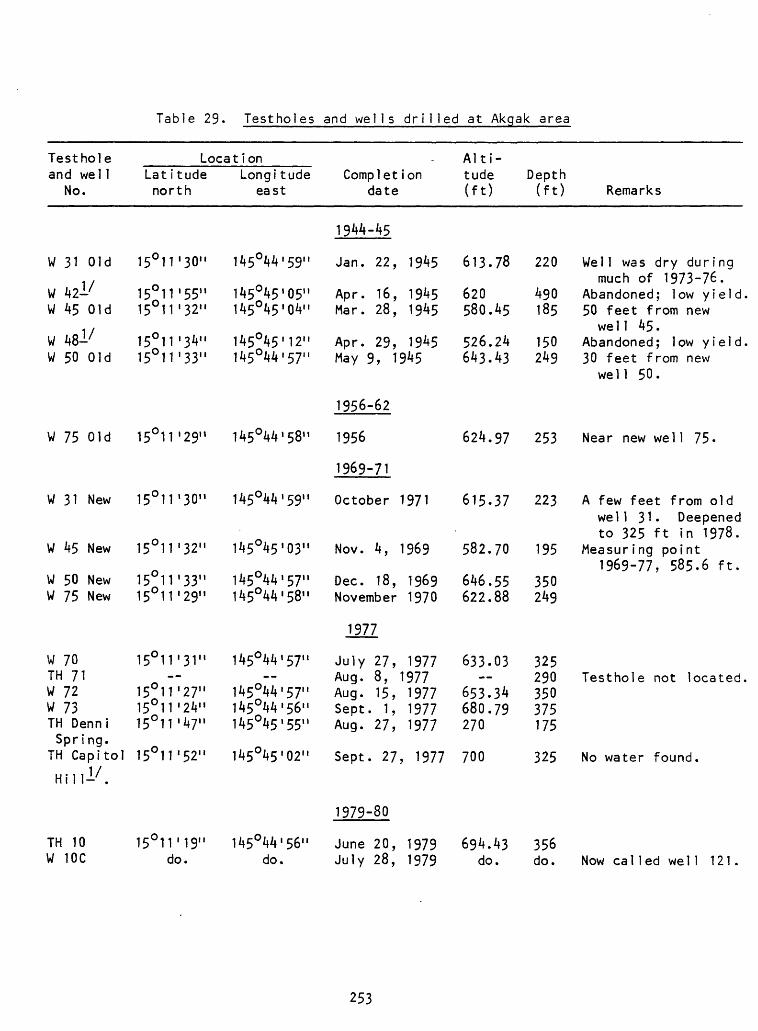
Table 29. Testholes and wells drilled at Akgak area
Testhole and wel 1
No.
W 31 Old
W 42-'W 45 Old
W 48-'W 50 Old
W 75 Old
W 31 New
W 45 New
W 50 NewW 75 New
W 70TH 71W 72W 73TH DenniSpring.
TH CapitolHilll/.
TH 10W 10C
LocationLat i tude north
15°H'30"
15°11'55"15°11'32"
15°11 '34"15°H'33"
15°11 '29"
15°11 '30"
15°11 '32"
15°11'33"15 11 '29"
15°11 '31"
150 11'27"15°11 '24"15°11 '47"
15°11 '52"
15°11 '19"do.
Longi tude east
1/t5°/t /t '59»
145°45'05"145°45'04"
145°45'12"1/t5°/t /f «57"
145°44'58"
145°44'59"
145°45'03"
145°44'57"145°44'58"
145°4V57"--
145°44'57"145°44'56"145°45'55"
145°45'02"
145°44 '56"do.
Complet ion date
1944-45
Jan. 22, 1945
Apr. 16, 1945Mar. 28, 1945
Apr. 29, 1945May 9, 1945
1956-62
1956
1969-71
October 1971
Nov. 4, 1969
Dec. 18, 1969November 1970
1977
July 27, 1977Aug. 8, 1977Aug. 15, 1977Sept. 1, 1977Aug. 27, 1977
Sept. 27, 1977
1979-80
June 20, 1979July 28, 1979
Alti tude (ft)
613.78
620580.45
526.24643.43
624.97
615.37
582.70
646.55622.88
633.03
653.34680.79270
700
694.43do.
Depth (ft)
220
490185
150249
253
223
195
350249
325290350375175
325
356do.
Remarks
Wel 1 was dry duringmuch of 1973-76.
Abandoned; low yield50 feet from new
well 45.Abandoned; low yield30 feet from new
well 50.
Near new wel 1 75.
A few feet from oldwel 1 31 Deepenedto 325 ft in 1978.
Measuring point1969-77, 585.6 ft.
Testhole not located
No water found.
Now cal led wel 1 121.
253
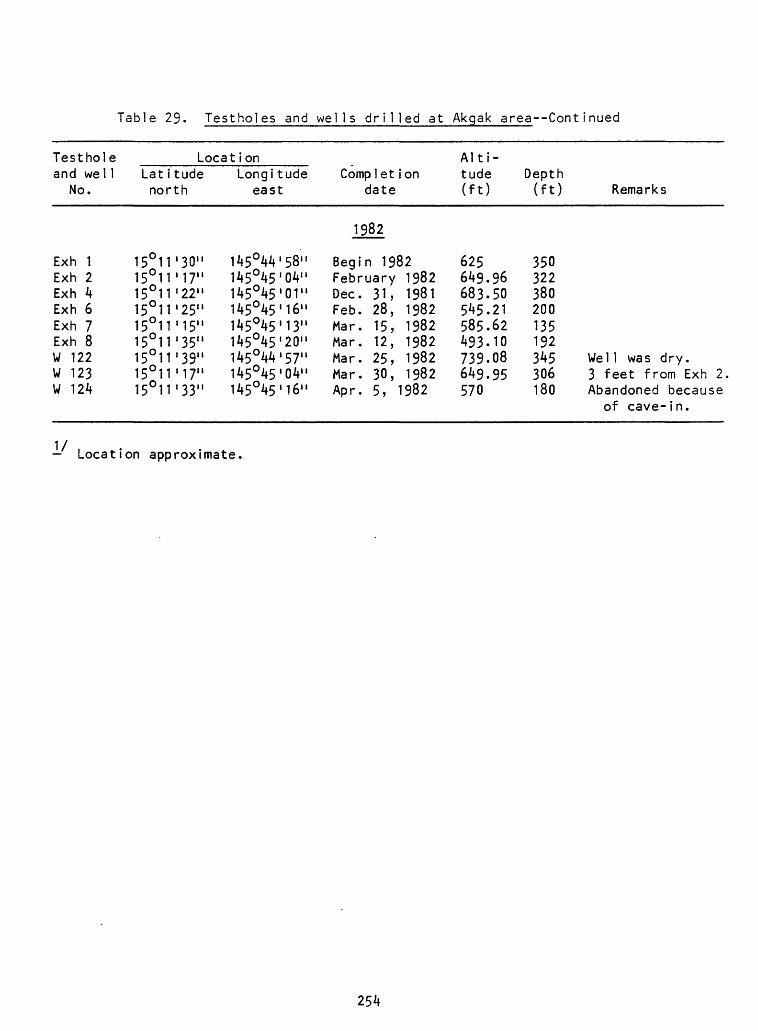
Table 29. Testholes and wells drilled at Akgak area Cent inued
Testho] e and wel 1
No.
LocationLat i tude north
Long! tude east
Complet Ion date
Alti tude (ft)
Depth (ft) Remarks
1982
Exh 1 Exh 2 Exh 4 Exh 6 Exh 7Exh 8WWW
122123124
150 11'30" 15°11 '17" 15°11 '22" 15°11 '25" 15°11 '15"15°11 '35"15°11 '39"15°11 '17"15°11 '33"
145°44 145°45 145°45 145°45 145°45145°45145°44145°45145°45
58" '04" 01" 16" 13"'20"'57" 04" 16"
Begin 1982 February 1982 Dec. 31, 1981 Feb. 28, 1982 Mar. 15, 1982Mar.Mar.Mar.Apr.
12,25,30,5,
198219821982
1982
625 649. 683. 545. 585.493-739.649.570
96 50 21 62100895
350 322 380 200 135192345306180
Wel 1 was dry.3 feet from Exh 2Abandoned because
of cave- in.
Location approximate.
254
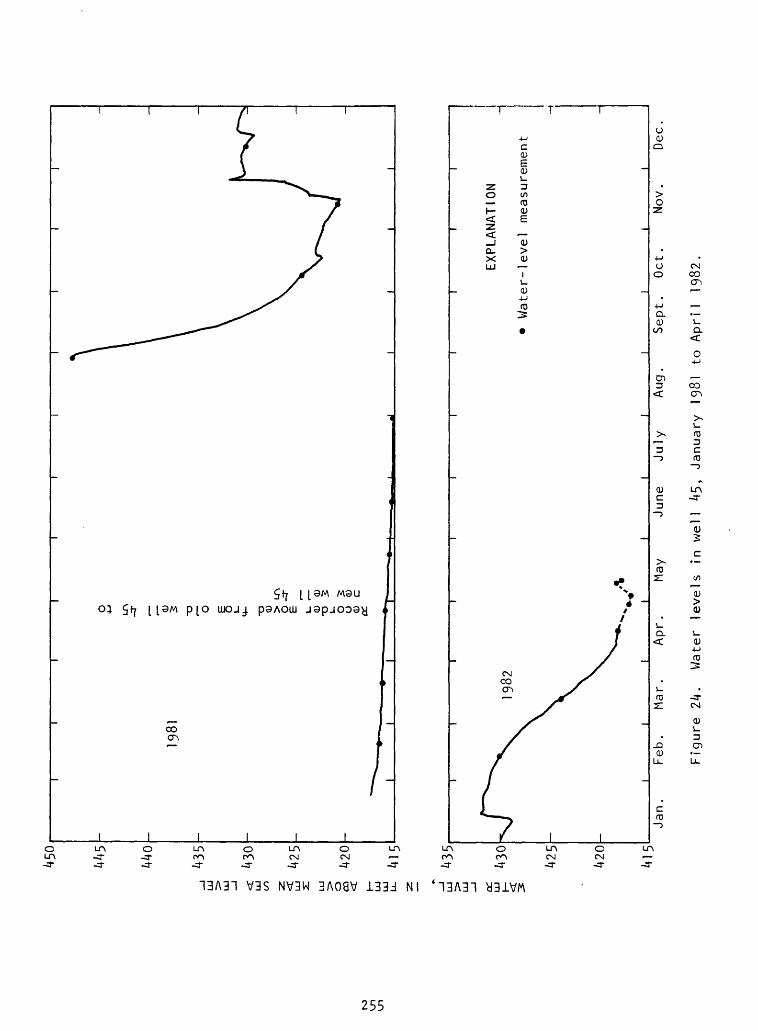
WATER LEVEL, IN FEET ABOVE MEAN SEA LEVEL
CO
>-o
OO
-c-NJ O
-c-NJvn
-c-NJ O
N3 U1
-c- vnO
0) CT
CO0)
Oo
00
Recorder moved from old well kS to new wel1 ^5
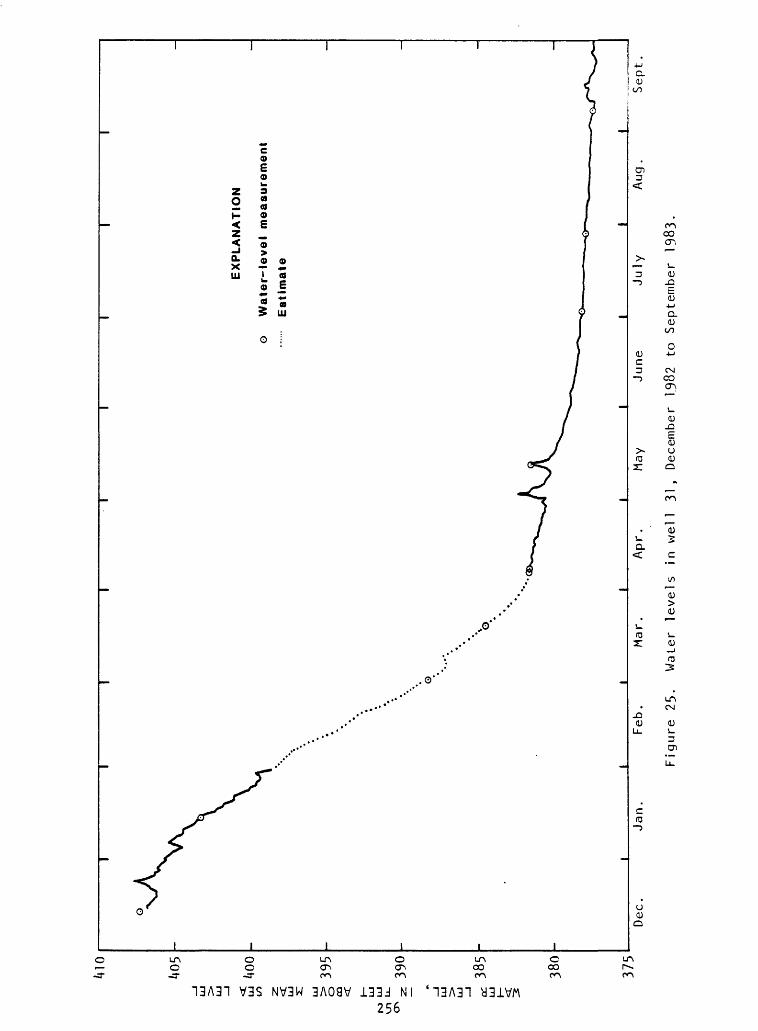
IHO
1*05
< LU
C
O
to
395
390
EX
PL
AN
AT
ION
o
Wate
r-le
vel
me
as
ure
me
nt
--
Esti
mate
a:38
5
380
375
Dec.
Jan.
Feb.
Mar.
Apr.
May
June
July
Aug.
Figure 25
. Water le
vels
in
we
ll 31,
December 1982 to
September 19
83.
Sep
t
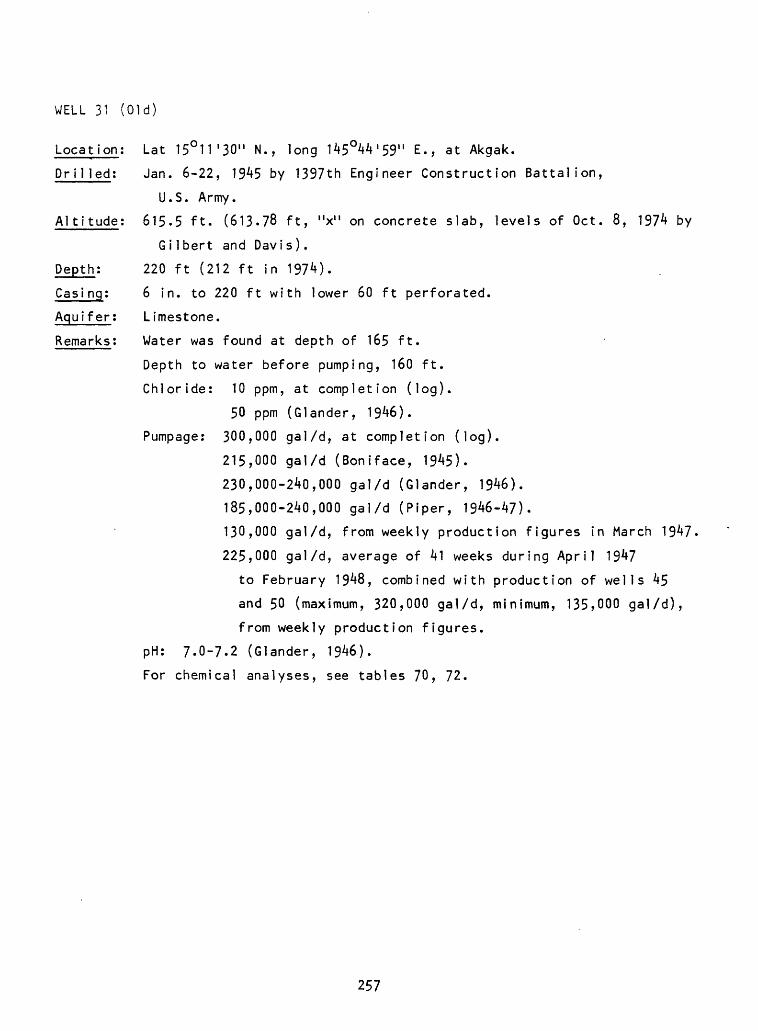
WELL 31 (Old)
Locat ion
Drilled:
Altitude
Lat 15°H'30" N., long 145°44'59" E., at Akgak.
Jan. 6-22, 1945 by 1397th Engineer Construction Battalion,
U.S. Army.
615.5 ft. (613.78 ft, "x" on concrete slab, levels of Oct. 8, 1974 by
GiIbert and Davis).
220 ft (212 ft in 197*0.
6 in. to 220 ft with lower 60 ft perforated.
Limestone.
Water was found at depth of 165 ft.
Depth to water before pumping, 160 ft.
Chloride: 10 ppm, at completion (log).
50 ppm (Glander, 1946).
Pumpage: 300,000 gal/d, at completion (log).
215,000 gal/d (Boniface, 1945).
230,000-240,000 gal/d (Glander, 1946).
185,000-240,000 gal/d (Piper, 1946-47).
130,000 gal/d, from weekly production figures in March 1947
225,000 gal/d, average of 41 weeks during April 1947
to February 1948, combined with production of wells 45
and 50 (maximum, 320,000 gal/d, minimum, 135,000 gal/d),
from weekly production figures.
pH: 7.0-7.2 (Glander, 1946).
For chemical analyses, see tables 70, 72.
257
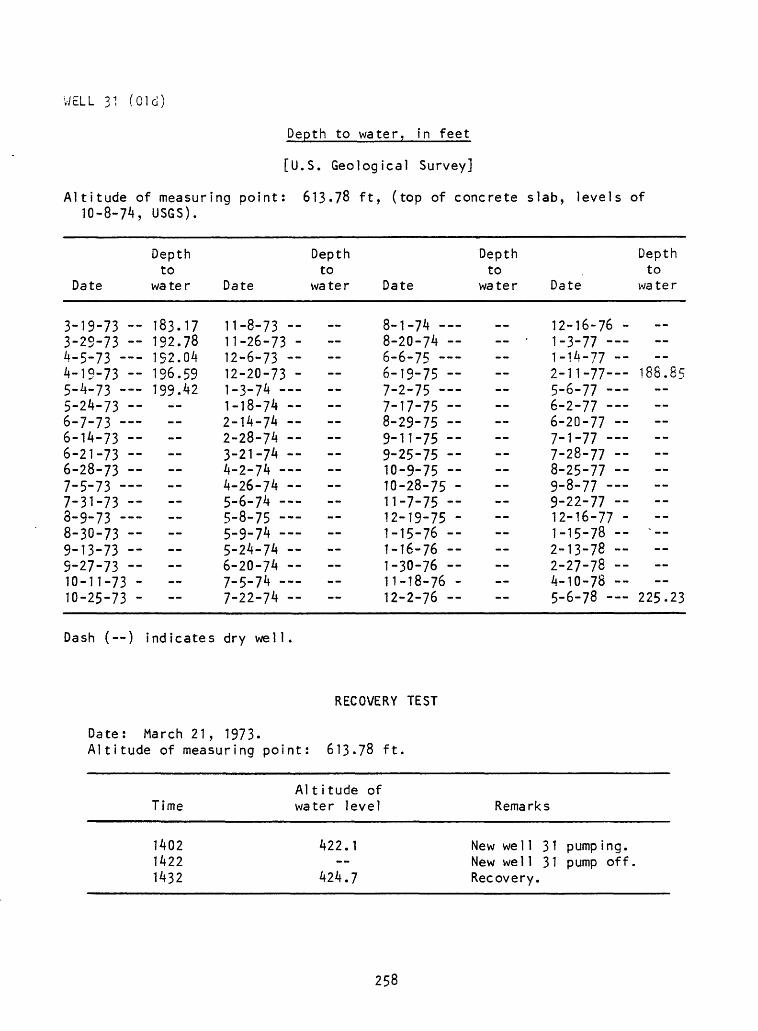
WELL 31 (Old)
Depth to water, in feet
[U.S. Geological Survey]
Altitude of measuring point: 613.78 ft, (top of concrete slab, levels of 10-8-74, USGS).
Date
3-19-73 3-29-73 -4-5-73 4-19-73 --5-4-73 5-24-73 -6-7-73 6-14-73 -6-21-73 -6-28-73 7-5-73 7-31-73 -8-9-73 8-30-73 -9-13-73 -9-27-73 -10-11-73 -10-25-73 -
Depth to
water
183.17192.781S2.04196.59199.42 -- --
Depth to
Date water
11-8-73 -- -11-26-73 - -12-6-73 - -12-20-73 -1-3-74 -1-18-74 2-14-74 2-28-74 --3-21-74 - -4-2-74 4-26-74 -5-6-74 -5-8-75 -5-9-74 -5-24-74 6-20-74 --7-5-74 -7-22-74 --
Depth to
Date water
8-1-74 --8-20-74 6-6-75 6-19-75 -7-2-75 7-17-75 -8-29-75 -9-11-75 -9-25-75 -10-9-75 -10-28-75 -11-7-75 -12-19-75 -1-15-76 --1-16-76 --1-30-76 -11-18-76 -12-2-76 --
Date
12-16-76 -1-3-77 1-14-77 2-11-77 5-6-77 6-2-77 6-20-77 -7-1-77 7-28-77 -8-25-77 9-8-77 9-22-77 -12-16-77 -1-15-78 -2-13-78 2-27-78 --4-10-78 5-6-78
Depth to
wa te r
__
188.85 --
225.23
Dash ( ) indicates dry well
Date: March 21, 1973. Altitude of measuring point:
RECOVERY TEST
613.78 ft.
TimeAltitude of water level Remarks
140214221432
422.1
424.7
New wel1 31 pump ing. New well 31 pump off Recovery.
258
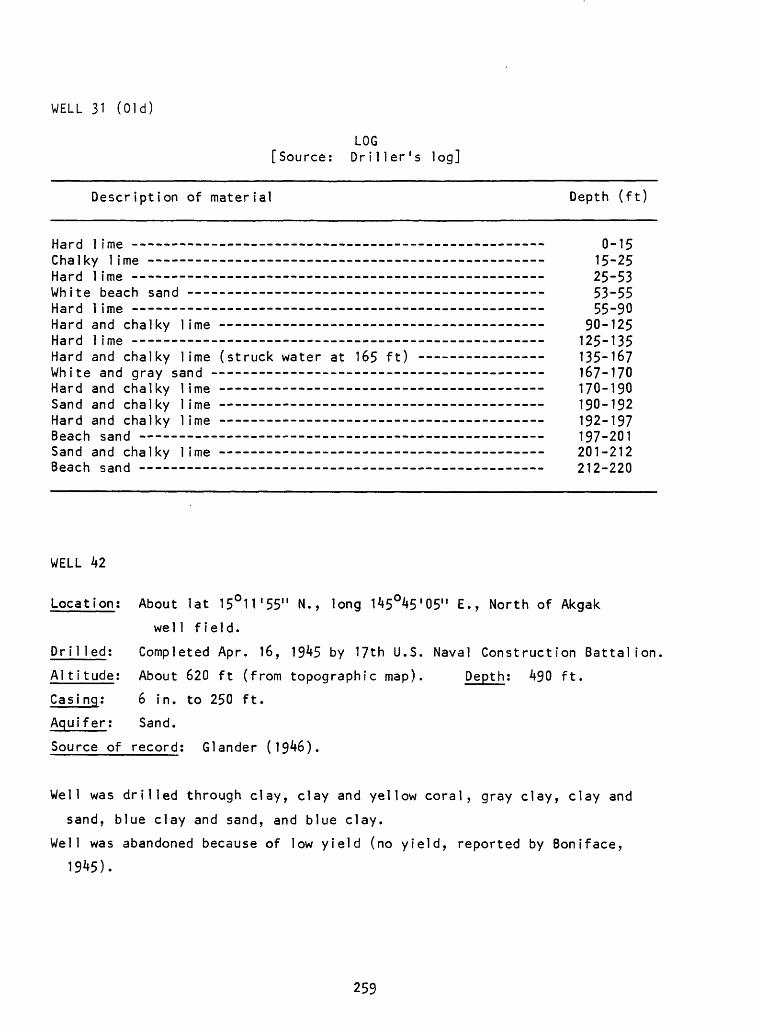
WELL 31 (Old)
LOG [Source: Driller's log]
Description of material
Hard 1 ime - - ----------Chalky lime --- U _ .. ~J 1 ? -.Hard 1 ime -- ----------------------------------------- White beach sand - - - U ~. .. ~J 1 !_oHard I ime -------------------------------------------Hard and chalky lime - Hard 1 ime - -- - -- -- ----Hard and chalky lime (struck water at 165 ft) - White and gray sand ------ -------------- ___________Hard and chalky lime - - - - Sand and chalky lime ________ ____ ____ _____Hard and chalky lime - - - Beach sand _-___ _Sand and chalky lime _____ _____ __________________ Beach sand -
Depth (ft)
0-1515-25
_______ 25-53_______ 53.55_______ 55.90
on 1 oc------- yu- lo 125-135_______ 135-167 167-170 170-190_____ 1 Qfl_ 1 Q9
192-197 197-201 201-212 212-220
WELL 42
Location: About lat 15°H'55" N., long 145°45'05" E., North of Akgak
we 11 field.
Drilled; Completed Apr. 16, 1945 by 17th U.S. Naval Construction Battalion
Altitude; About 620 ft (from topographic map). Depth; 490 ft.
Casing: 6 in. to 250 ft.
Aquifer; Sand.
Source of record: Glander (1946).
Well was drilled through clay, clay and yellow coral, gray clay, clay and
sand, blue clay and sand, and blue clay.
Well was abandoned because of low yield (no yield, reported by Boniface,
1945).
259
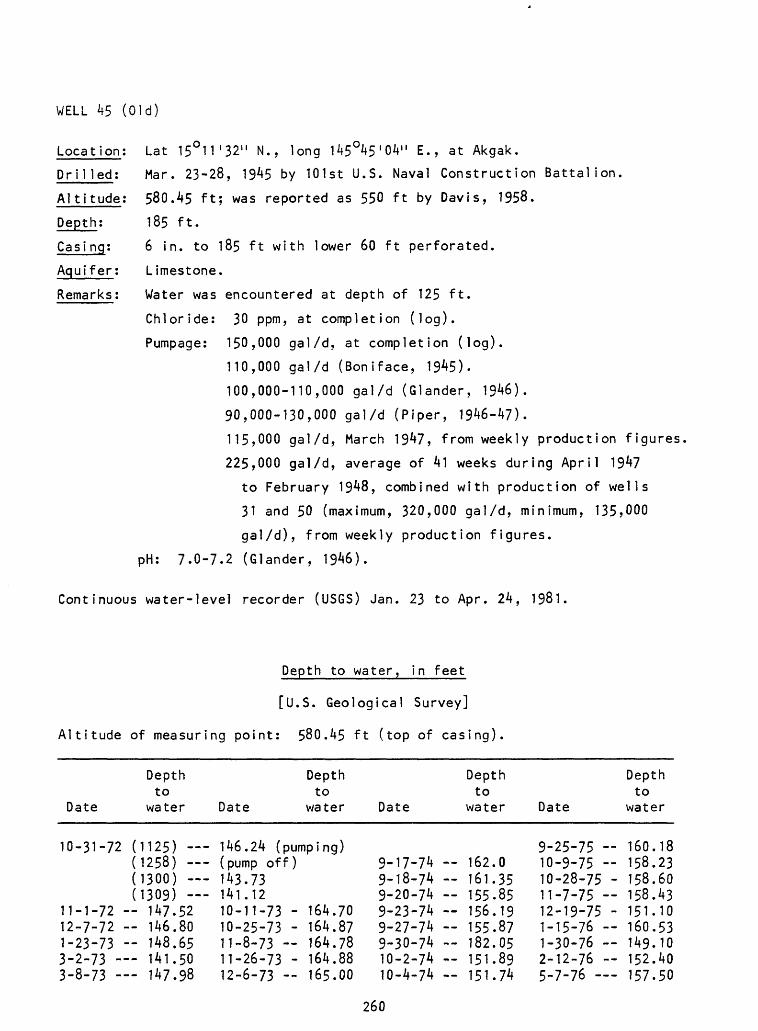
WELL 45 (Old)
Location; Lat 15°H'32" N., long 145°45'04" E., at Akgak.
Drilled; Mar. 23-28, 1945 by 101st U.S. Naval Construction Battalion.
Altitude; 580.45 ft; was reported as 550 ft by Davis, 1958.
185 ft.
6 in. to 185 ft with lower 60 ft perforated.
Limestone.
_____ Water was encountered at depth of 125 ft.
Chloride; 30 ppm, at completion (log).
Pumpage; 150,000 gal/d, at completion (log).
110,000 gal/d (Boniface, 1945).
100,000-110,000 gal/d (Glander, 1946).
90,000-130,000 gal/d (Piper, 1946-47).
115,000 gal/d, March 1947, from weekly production figures
225,000 gal/d, average of 41 weeks during April 1947
to February 1948, combined with production of wells
31 and 50 (maximum, 320,000 gal/d, minimum, 135,000
gal/d), from weekly production figures.
pH: 7.0-7.2 (Glander, 1946).
Continuous water-level recorder (USGS) Jan. 23 to Apr. 24, 1981.
Depth to water, in feet
[U.S. Geological Survey]
Altitude of measuring point: 580.45 ft (top of casing).
Depth Depthto to
Date water Date water Date
Depth Depthto to
water Date water
10-31-72 (1125) 146.24 (pumping) 9-25-75 160.18(1258) (pump off) 9-17-74 162.0 10-9-75 158.23(1300) 143.73 9-18-74 161.35 10-28-75 - 158.60(1309) 141.12 9-20-74 155.85 11-7-75 158.43
11-1-72 147.52 10-11-73 - 164.70 9-23-74 156.19 12-19-75 - 151.1012-7-72 146.80 10-25-73 - 164.87 9-27-74 155.87 1-15-76 -- 160.531-23-73 148.65 11-8-73 164.78 9-30-74 -- 182.05 1-30-76 149.103-2-73 141.50 11-26-73 - 164.88 10-2-74 151.89 2-12-76 152.403-8-73 147.98 12-6-73 165.00 10-4-74 151.74 5-7-76 157-50
260
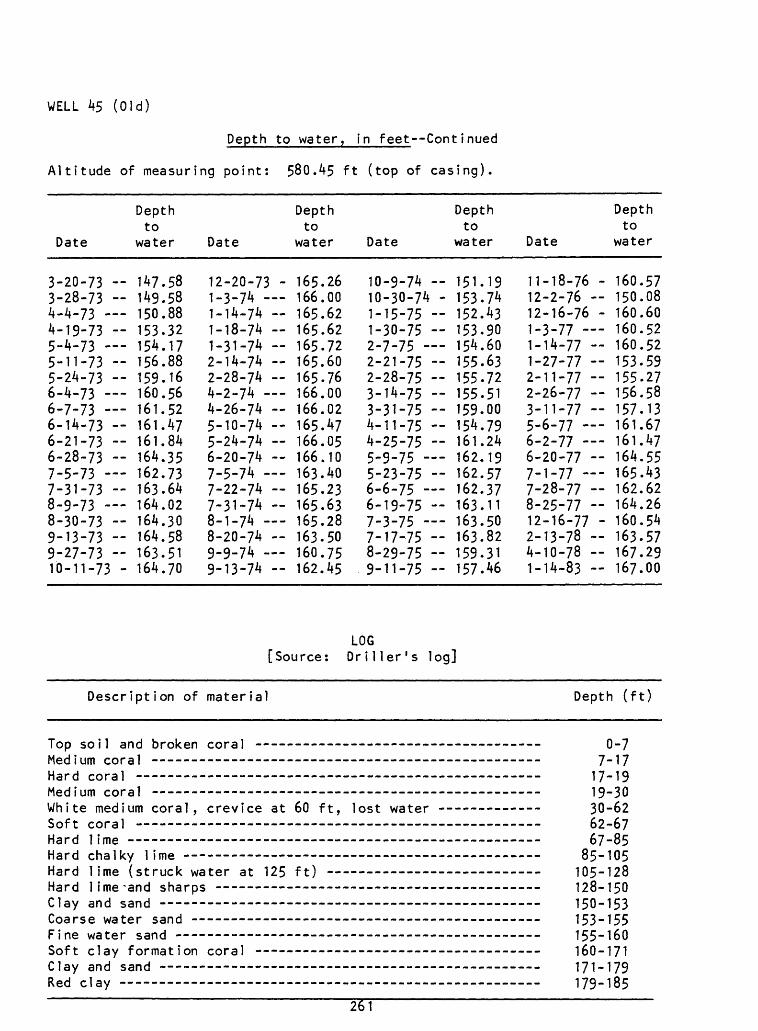
WELL 45 (Old)
Depth to water, in feet--Continued
Altitude of measuring point: 580.45 ft (top of casing).
Date
3-20-73 3-28-73 ~4-4-73 4-19-73 -5-4-73 5-11-73 -5-24-73 -6-4-73 6-7-73 6-14-73 -6-21-73 -6-28-73 -7-5-73 7-31-73 -8-9-73 8-30-73 -9-13-73 -9-27-73 -10-11-73 -
Depth to
water
147.58149.58150.88153.32154.17156.88159.16160.56161.52161.47161.84164.35162.73163.64164.02164.30164.58163.51164.70
Date
12-20-73 -1-3-74 1-14-74 1-18-74 1-31-74 -2-14-74 2-28-74 4-2-74 4-26-74 -5-10-74 -5-24-74 6-20-74 7-5-74 7-22-74 7-31-74 -8-1-74 8-20-74 9-9-74 9-13-74 -
Depth to
water
165.26166.00165.62165.62165.72165.60165.76166.00166.02165.47166.05166.10163.40165.23165.63165.28163.50160.75162.45
Date
10-9-74 10-30-74 -1-15-75 -1-30-75 -2-7-75 2-21-75 -2-28-75 3-14-75 -3-31-75 --4-11-75 -4-25-75 -5-9-75 5-23-75 -6-6-75 6-19-75 -7-3-75 7-17-75 -8-29-75 -9-11-75 -
Depth to
water
151.19153.74152.43153.90154.60155.63155-72155.51159.00154.79161.24162.19162.57162.37163.11163.50163.82159.31157.46
Date
11-18-76 -12-2-76 12-16-76 -1-3-77 1-14-77 -1-27-77 -2-11-77 -2-26-77 -3-11-77 -5-6-77 6-2-77 6-20-77 -7-1-77 7-28-77 -8-25-77 -12-16-77 -2-13-78 -4-10-78 1-14-83
Depth to
water
160.57150.08160.60160.52160.52153.59155.27156.58157.13161.67161.47164.55165.43162.62164.26160.54163.57167.29167.00
LOG [Source: Driller's log]
Description of material
Top soil and broken coral ------------------------------- Medium coral ----------------------- _--------_--______-Hard coral ---------- -- - ______ ___Medium coral -------------------- ____________________White medium coral, crevice at 60 ft, lost water ---- Soft coral ------- ----- - --_ - _ Hard lime - --- ---- - ________ -_ Hard chalky lime -- ----- ----- -__ ___ _ _ Hard lime (struck water at 125 ft) ------ ---- Hard lime -and sharps - ----- ------ ____ Clay and sand -------------------------- _______________ Coarse water sand ---- __--__ __ ______ __Fine water sand -------------- -_ ___________________Soft clay formation coral --------- __________ ______Clay and sand -------- ______ _ ___ ___ ________Red clay ----------------------------------------------
Depth (ft)
- 0-7_____ 7-17- 17-19_____ 19.30 30-62
£ 0 f-i
£7 p-o/-o5 _____ 85-105
1 fi c 1 oO----- lUp-lZo 1 o Q i rn
_____ 150-153
_____ 153-155 155-160 160-171_____ 171-179_____ 179-185
261
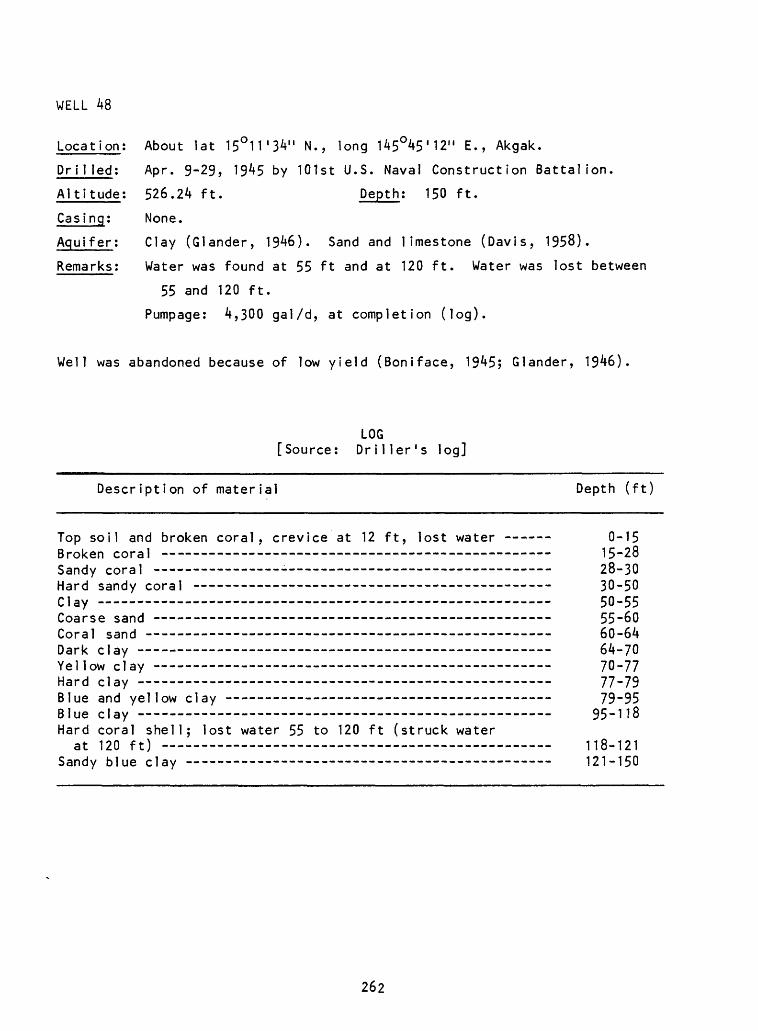
WELL 48
Location; About lat 15°H'34" N., long 145°45'12" E., Akgak.
Drilled; Apr. 9-29, 1945 by 101st U.S. Naval Construction Battalion.
Altitude; 526.24 ft. Depth; 150 ft.
Casing; None.
Aquifer; Clay (Glander, 1946). Sand and limestone (Davis, 1958).
Remarks; Water was found at 55 ft and at 120 ft. Water was lost between
55 and 120 ft.
Pumpage; 4,300 gal/d, at completion (log).
Well was abandoned because of low yield (Boniface, 1945; Glander, 1946).
[SourceLOG Driller's log]
Description of material Depth (ft)
Top soil and broken coral, crevice at 12 ft, lost water Broken coral - Sandy coral -------- --- ___- --- _-____- ____.Hard sandy coral - --- ---- -- ------ ---- ____.Clay Coarse sand --- --- - --- ------------ -_-_.Coral sand -- --- - - - -------- ----- _ .Dark clay -- -____-__ __- - ______ ________Yellow clay Hard clay - - Blue and yellow clay ----- --- - - ------ _-_-.Blue clay - - Hard coral shell; lost water 55 to 120 ft (struck water
at 120 ft) Sandy blue clay ----- ------ --- ______________
0-15 15-28 28-30 30-50 50-55 55-60 60-64 64-70 70-77 77-79 79-95
95-118
118-121 121-150
262
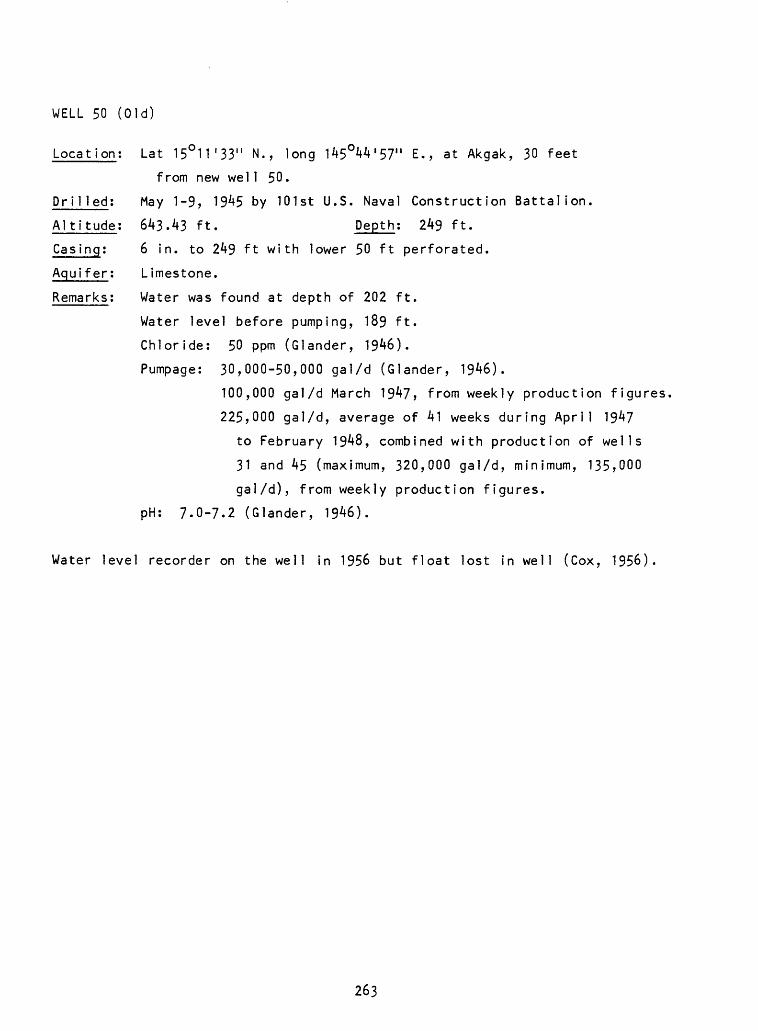
WELL 50 (Old)
Location: Lat 15°11 I 33" N., long 145°44'57" E., at Akgak, 30 feet
from new wel1 50.
Drilled: May 1-9, 1945 by 101st U.S. Naval Construction Battalion.
Altitude: 643.43 ft. Depth: 249 ft.
Casing: 6 in. to 249 ft with lower 50 ft perforated.
Aquifer; Limestone.
Remarks: Water was found at depth of 202 ft.
Water level before pumping, 189 ft.
Chloride: 50 ppm (Glander, 1946).
Pumpage: 30,000-50,000 gal/d (Glander, 1946).
100,000 gal/d March 1947, from weekly production figures,
225,000 gal/d, average of 41 weeks during April 194?
to February 1948, combined with production of wells
31 and 45 (maximum, 320,000 gal/d, minimum, 135,000
gal/d), from weekly production figures.
pH: 7.0-7.2 (Glander, 1946).
Water level recorder on the well in 1956 but float lost in well (Cox, 1956).
263
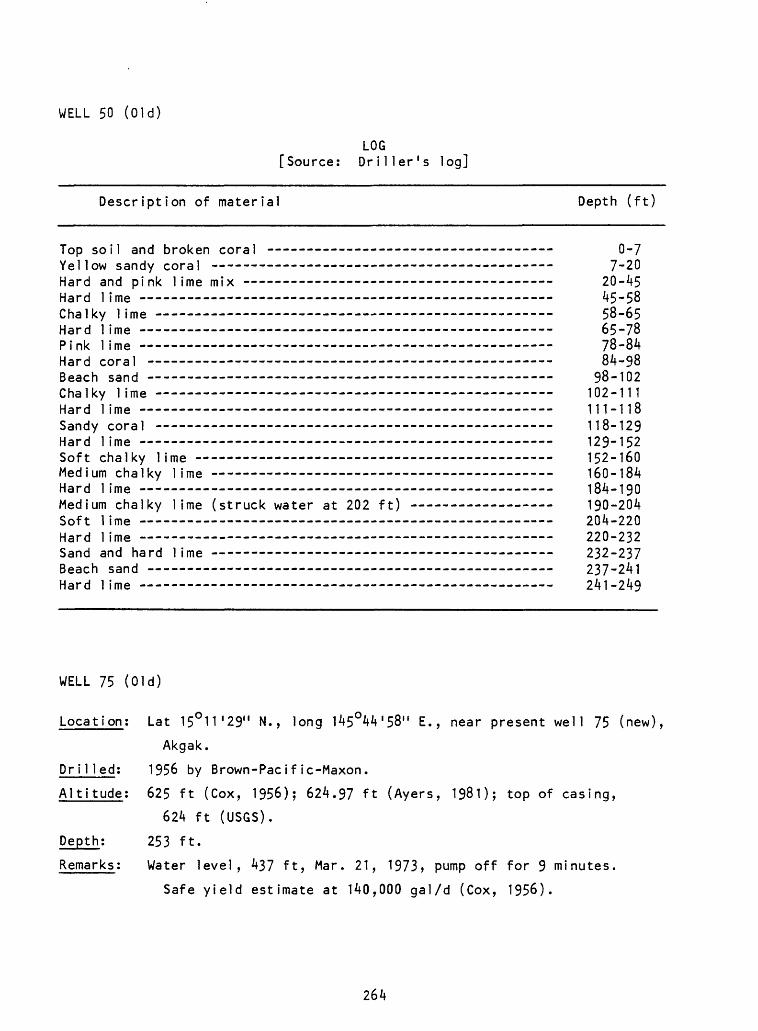
WELL 50 (Old)
[Source:LOG Driller's log]
Description of material Depth (ft)
Top soil and broken coral - 0-7Yellow sandy coral 7-20Hard and pink lime mix - 20-45Hard lime 45-58Chalky lime 58-65Hard lime 65-78Pink lime 78-84Hard coral 84-98Beach sand 98-102Chalky lime 102-111Hard lime 111-118Sandy coral 118-129Hard lime 129-152Soft chalky lime 152-160Medium chalky lime --- 160-184Hard lime 184-190Medium chalky lime (struck water at 202 ft) 190-204Soft lime 204-220Hard lime 220-232Sand and hard lime -- 232-237Beach sand 237-241Hard lime 241-249
WELL 75 (Old)
Location: Lat 15°11'29" N., long 145O44'58" E., near present well 75 (new),
Akgak.
Dri1 led; 1956 by Brown-Pacific-Maxon.
Altitude: 625 ft (Cox, 1956); 624.97 ft (Ayers, 1981); top of casing,
624 ft (USGS).
Depth: 253 ft.
Remarks: Water level, 437 ft, Mar. 21, 1973, pump off for 9 minutes.
Safe yield estimate at 140,000 gal/d (Cox, 1956).
264
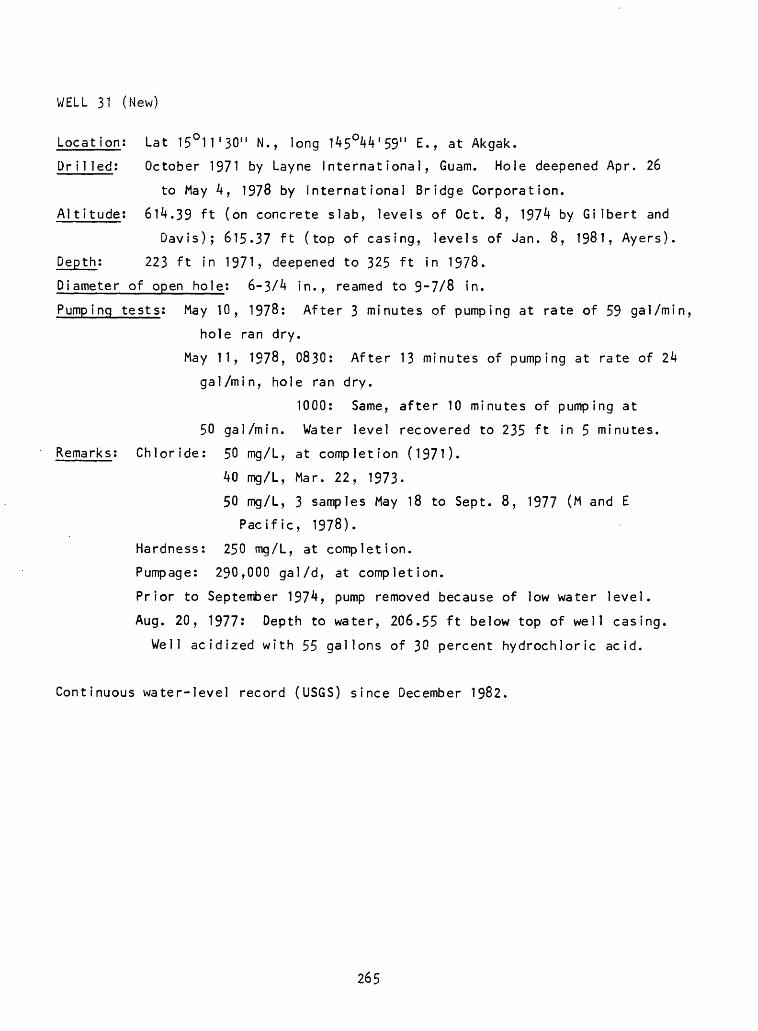
WELL 31 (New)
Location; Lat 15°11 I 30" N., long 145°4V59" E., at Akgak.
Dr 11 led: October 1971 by Layne International, Guam. Hole deepened Apr. 26
to May 4, 1978 by International Bridge Corporation.
Altitude; 614.39 ft (on concrete slab, levels of Oct. 8, 1974 by Gilbert and
Davis); 615.37 ft (top of casing, levels of Jan. 8, 1981, Ayers).
Depth; 223 ft in 1971, deepened to 325 ft in 1978.
Diameter of open hole; 6-3/4 in., reamed to 9-7/8 in.
Pumping tests; May 10, 1978; After 3 minutes of pumping at rate of 59 gal/min,
hole ran dry.
May 11, 1978, 0830: After 13 minutes of pumping at rate of 24
gal/min, hole ran dry.
1000: Same, after 10 minutes of pumping at
50 gal/min. Water level recovered to 235 ft in 5 minutes.
Remarks; Chloride: 50 mg/L, at completion (1971).
40 mg/L, Mar. 22, 1973.
50 mg/L, 3 samples May 18 to Sept. 8, 1977 (M and E
Pacific, 1978).
Hardness: 250 mg/L, at completion.
Pumpage: 290,000 gal/d, at completion.
Prior to September 1974, pump removed because of low water level.
Aug. 20, 1977: Depth to water, 206.55 ft below top of well casing.
Well acidized with 55 gallons of 30 percent hydrochloric acid.
Continuous water-level record (USGS) since December 1982.
265
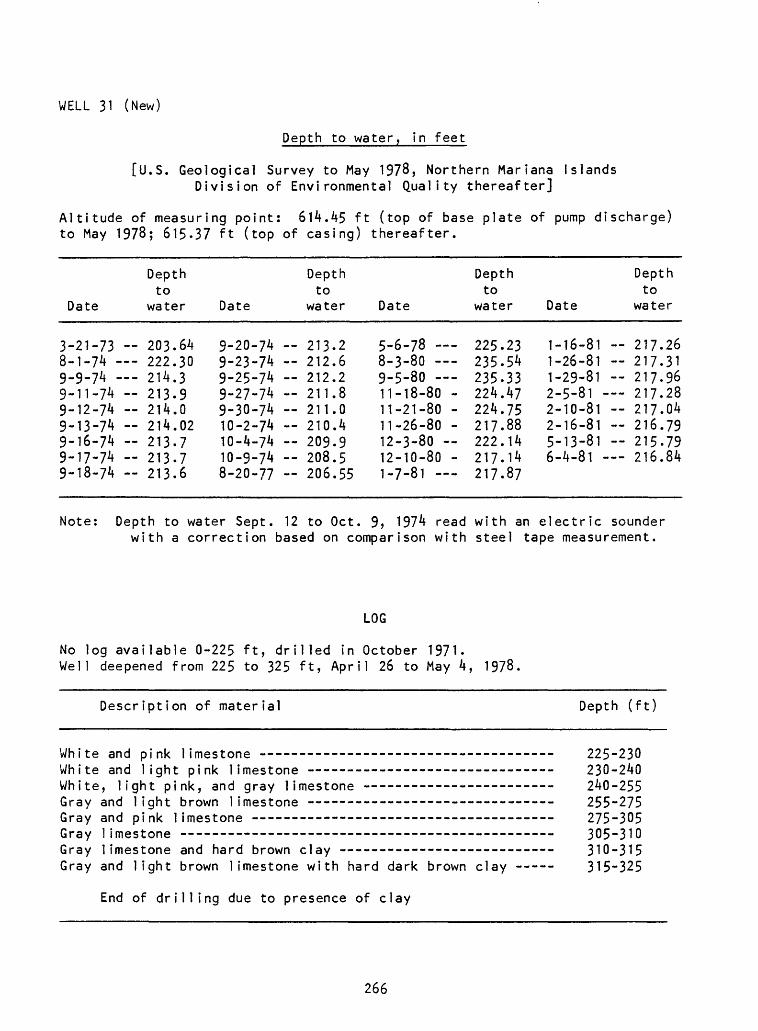
WELL 31 (New)
Depth to water, in feet
[U.S. Geological Survey to May 1978, Northern Mariana Islands Division of Environmental Quality thereafter]
Altitude of measuring point: 614.45 ft (top of base plate of pump discharge) to May 1978; 615.37 ft (top of casing) thereafter.
Date
3-21-738-1-749-9-749-11-7^9-12-749-13-749-16-749-17-749-18-74
Note:
Depthto
water
203.64 222.30 214.3- 213.9 214.0 214.02- 213.7 213.7 213.6
Date
9-20-749-23-749-25-749-27-749-30-7410-2-7410-4-7410-9-748-20-77
Depth to water Sept.with a correction
Depthto
water
213.2 212.6 212.2 211.8 211.0 210.4 209.9 208.5 206.55
12 to Oct.
Date
5-6-78 8-3-80 9-5-80 11-18-80 -11-21-80 -11-26-80 -12-3-80 12-10-80 -1-7-81
9, 1974 readbased on comparison with
Depthto
water
225.23235.54235.33224.47224.75217.88222.14217.14217.87
Date
1-16-811-26-811-29-812-5-812-10-812-16-815-13-816-4-81
with an electricsteel
Depthto
water
217.26- 217.31- 217.96 217.28 217.04- 216.79 215.79 216.84
soundertape measurement.
LOG
No log available 0-225 ft, drilled in October 1971.Well deepened from 225 to 325 ft, April 26 to May 4, 1978
Description of material Depth (ft)
White and pink limestone - --- - - White and light pink limestone ----- _________________White, light pink, and gray limestone -----------------Gray and light brown limestone - ---- ----------- -.Gray and pink limestone ---- _---_________ __________Gray 1imestone ---------- ______ ____________________Gray limestone and hard brown clay --------------------Gray and light brown limestone with hard dark brown clay
End of drilling due to presence of clay
225-230 230-240 240-255 255-275 275-305 305-310 310-315 315-325
266
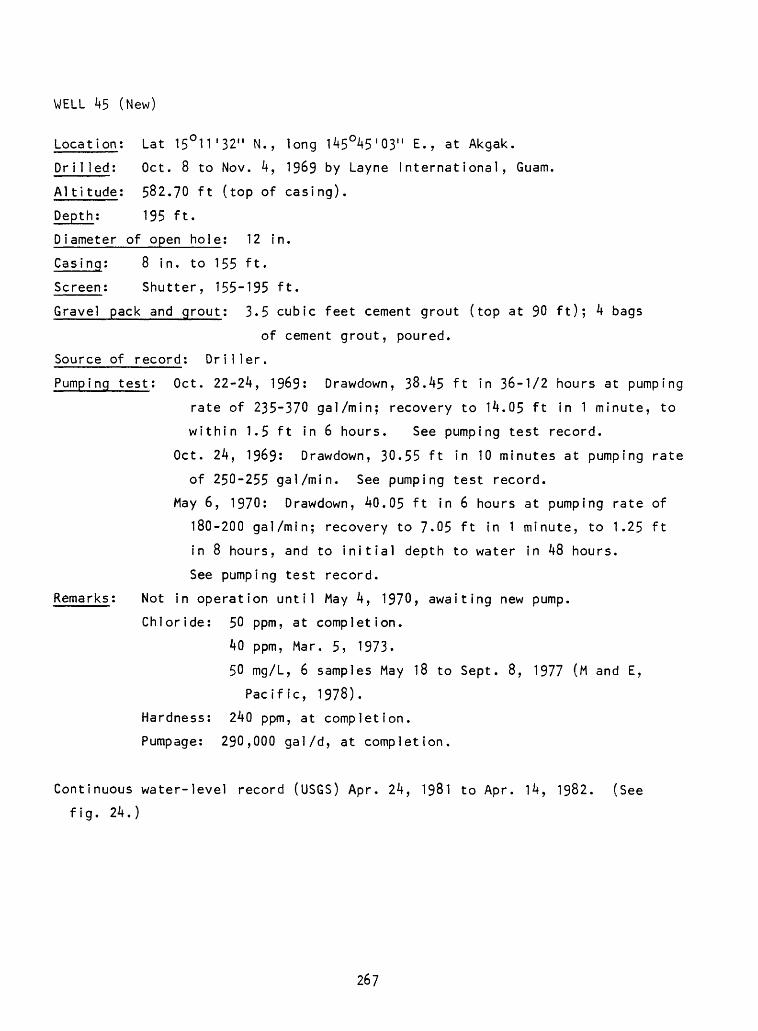
WELL 45 (New)
Location; Lat 15°11'32" N., long l45°45'03" E., at Akgak.
Dr11 led; Oct. 8 to Nov. 4, 1969 by Layne International, Guam.
Altitude; 582.70 ft (top of casing).
Depth; 195 ft.
Diameter of open hole; 12 in.
Casing; 8 in. to 155 ft.
Screen; Shutter, 155-195 ft.
Gravel pack and grout; 3.5 cubic feet cement grout (top at 90 ft); 4 bags
of cement grout, poured.
Source of record; Driller.
Pumping test; Oct. 22-24, 1969: Drawdown, 38.45 ft in 36-1/2 hours at pumping
rate of 235-370 gal/min; recovery to 14.05 ft in 1 minute, to
within 1.5 ft in 6 hours. See pumping test record.
Oct. 24, 1969: Drawdown, 30.55 ft in 10 minutes at pumping rate
of 250-255 gal/min. See pumping test record.
May 6, 1970; Drawdown, 40.05 ft in 6 hours at pumping rate of
180-200 gal/min; recovery to 7.05 ft in 1 minute, to 1.25 ft
in 8 hours, and to initial depth to water in 48 hours.
See pumping test record.
Remarks; Not in operation until May 4, 1970, awaiting new pump.
Chloride: 50 ppm, at completion.
40 ppm, Mar. 5, 1973.
50 mg/L, 6 samples May 18 to Sept. 8, 1977 (M and E,
Pacific, 1978).
Hardness: 240 ppm, at completion.
Pumpage: 290,000 gal/d, at completion.
Continuous water-level record (USGS) Apr. 24, 1981 to Apr. 14, 1982. (See
fig. 24.)
267
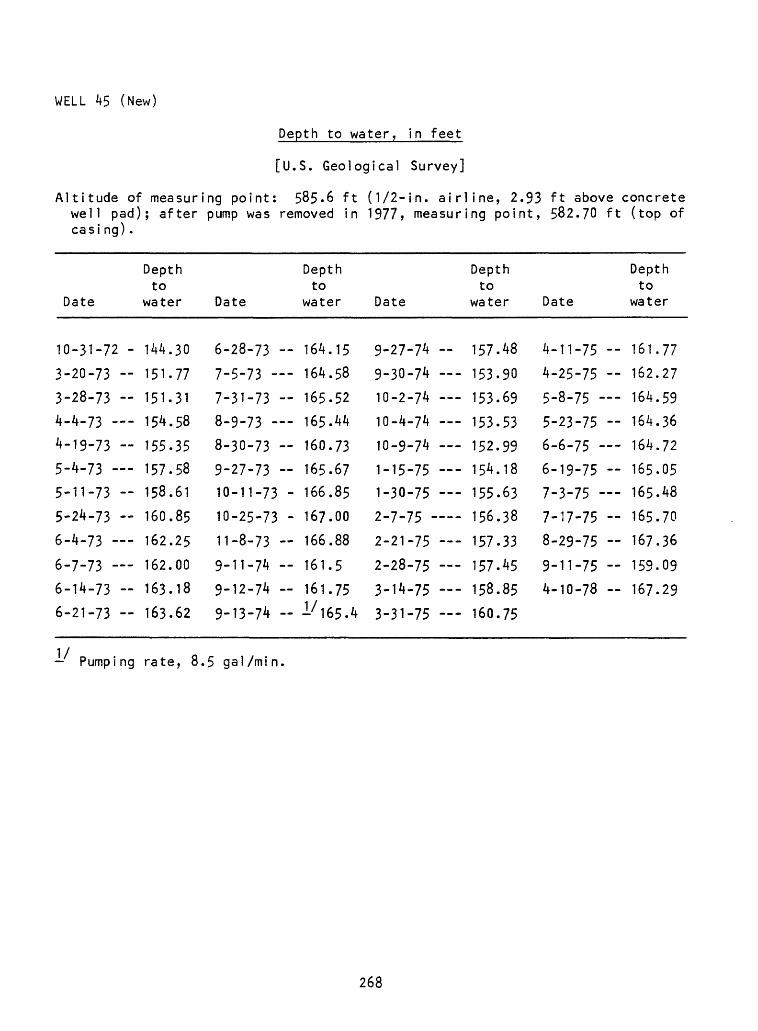
WELL 45 (New)
Depth to water, in feet
[U.S. Geological Survey]
Altitude of measuring point: 585-6 ft (1/2-in. airline, 2.93 ft above concrete well pad); after pump was removed in 1977, measuring point, 582.70 ft (top of casi ng).
Date
10-31-72 -
3-20-73 -
3-28-73 --
4-4-73
4-19-73 --
5-4-73
5-11-73 -
5-24-73 --
6-4-73
6-7-73
6-14-73 -
6-21-73 -
Depth to
water
144.30
151.77
151.31
154.58
155.35
157.58
158.61
160.85
162.25
162.00
163.18
163.62
Date
6-28-73 -
7-5-73
7-31-73 -
8-9-73
8-30-73 -
9-27-73 -
10-11-73 -
10-25-73 -
11-8-73 -
9-11-74 -
9-12-74
9-13-74 -
Depth to
water
164.15
164.58
165.52
165.44
160.73
165.67
166.85
167.00
166.88
161.5
161.751/165.4
Date
9-27-74 -
9-30-74
10-2-74
10-4-74
10-9-74
1-15-75 1-30-75
2-7-75
2-21-75
2-28-75
3-14-75
3-31-75
Depth to
water
157.48
153.90
153.69
153.53
152.99
154.18
155.63
156.38
157.33
157.45
158.85
160.75
Date
4-11-75 -
4-25-75 -
5-8-75
5-23-75 -
6-6-75
6-19-75 -
7-3-75
7-17-75 -
8-29-75 -
9-11-75 -
4-10-78
Depth to
water
161.77
162.27
164.59
164.36
164.72
165.05
165.48
165.70
167.36
159.09
167.29
Pumping rate, 8.5 gal/min.
268
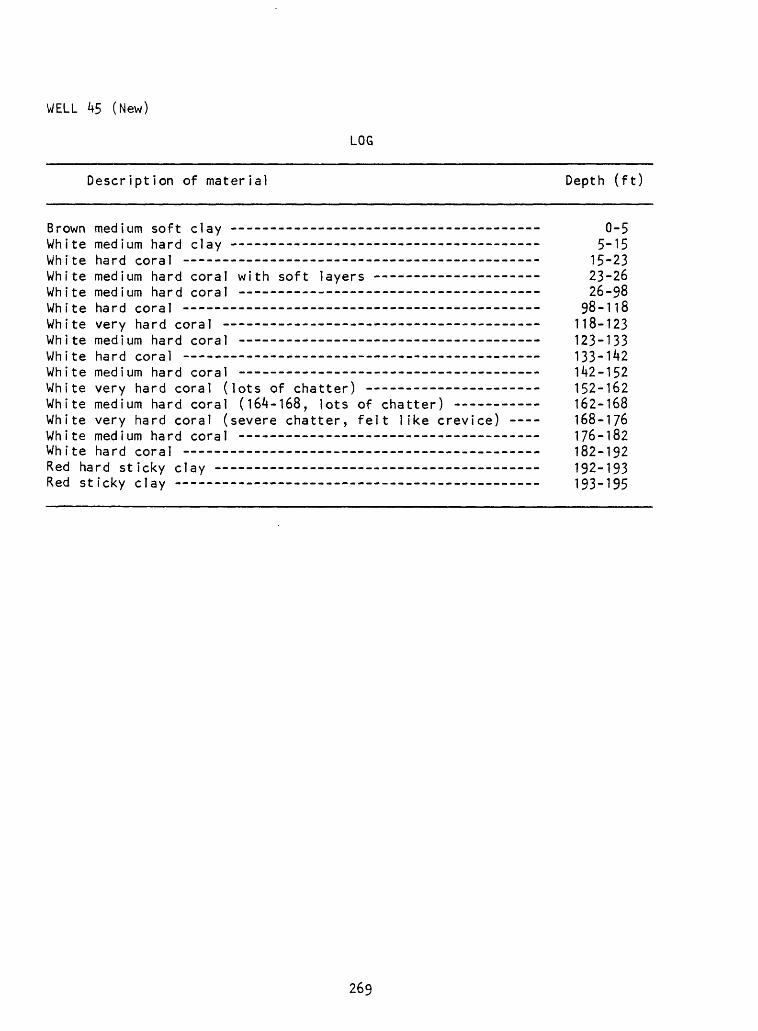
WELL 45 (New)
LOG
Description of material Depth (ft)
Brown medium soft clay -------------------------- - ------ Q-5White medium hard clay ---------- _------_----_-----------_-- 5-15White hard coral - 15-23White medium hard coral with soft layers --- -- --- ---- 23-26White medium hard coral --- - ----------- - _ 26-98White hard coral 98-118White very hard coral ---- ------ - ----- 118-123White medium hard coral ----- --- ---- -- 123-133White hard coral 133-142White medium hard coral - ----- ----- _--- --__ - 142-152White very hard coral (lots of chatter) --- -- --- ---- 152-162White medium hard coral (164-168, lots of chatter) --- -- 162-168White very hard coral (severe chatter, felt like crevice) ---- 168-176White medium hard coral -- ---------- ------ --- 176-182White hard coral 182-192Red hard sticky clay 192-193Red sticky clay 193-195
269
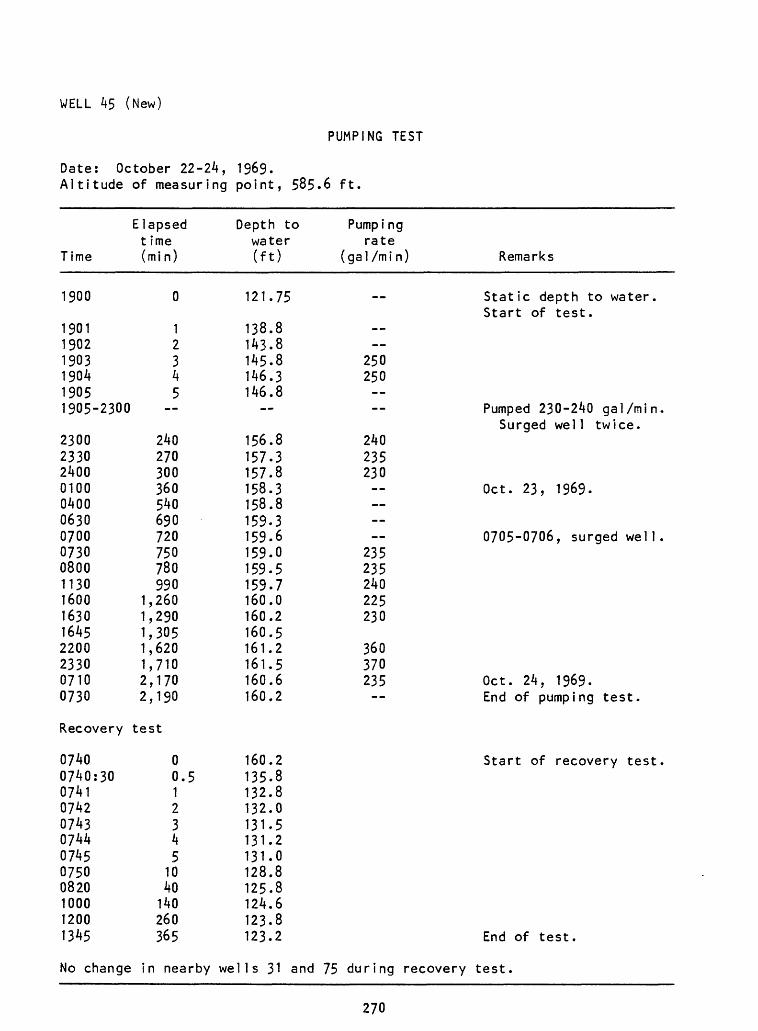
WELL 45 (New)
PUMPING TEST
Date: October 22-24, 1969.Altitude of measuring point, 585.6 ft.
Time
1900
190119021903190419051905-2300
23002330240001000400063007000730080011301600163016452200233007100730
Recovery
07400740:300741074207430744074507500820100012001345
No change
Elapsed t ime (min)
0
12345
240270300360540690720750780990
1,2601,2901,3051,6201,7102,1702,190
test
00.512345
1040140260365
in nearby
Depth to water (ft)
121.75
138.8143.8145.8146.3146.8
156.8157.3157.8158.3158.8159.3159.6159.0159.5159.7160.0160.2160.5161.2161.5160.6160.2
160.2135.8132.8132.0131.5131.2131.0128.8125.8124.6123.8123.2
wel 1 s 31 and
Pumping rate
(gal/min) Remarks
Static depth to water.Start of test.
250250
Pumped 230-240 gal/min.Surged wel 1 twice.
240235230
Oct. 23, 1969.
0705-0706, surged well.235235240225230
360370235 Oct. 24, 1969.
End of pumping test.
Start of recovery test.
End of test.
75 during recovery test.
270
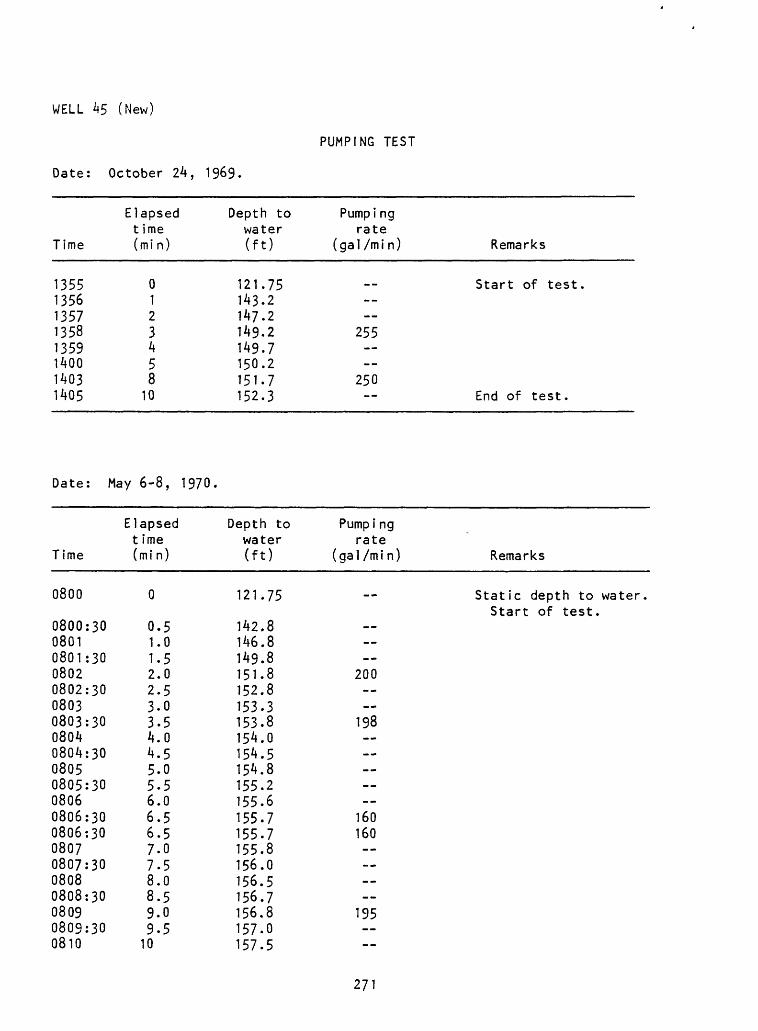
WELL 45 (New)
Date: October 24, 1969.
PUMPING TEST
Time
13551356135713581359140014031405
Elapsed t ime (mi n)
0123458
10
Depth to water (ft)
121.75143.2147.2149.2149.7150.2151.7152.3
Pumpi ng rate
(gal/min) Remarks
Start of test.--
255 --
250End of test.
Date: May 6-8, 1970
Time
Elapsedt ime(mi n)
Depth towater(ft)
Pumpi ngrate
(gal/min) Remarks
0800
0800:300801 0801:300802 0802:300803 0803:300804 0804:300805 0805:3008060806:300806:300807 0807:300808 0808:300809 0809:300810
0.5 1.01.5 2.02.5 3.0 3.5 4.0 4.5 5.0 5.5 6.0 6.5 6.5 7.07.58.08.59.09.5
10
121.75
142.8146.8149.8151.8152.8153.3153.8154.0154.5154.8155.2155.6155.7155.7155.8156.0156.5156.7156.8157.0157.5
Static depth to water Start of test.
200
198
160160
195
271
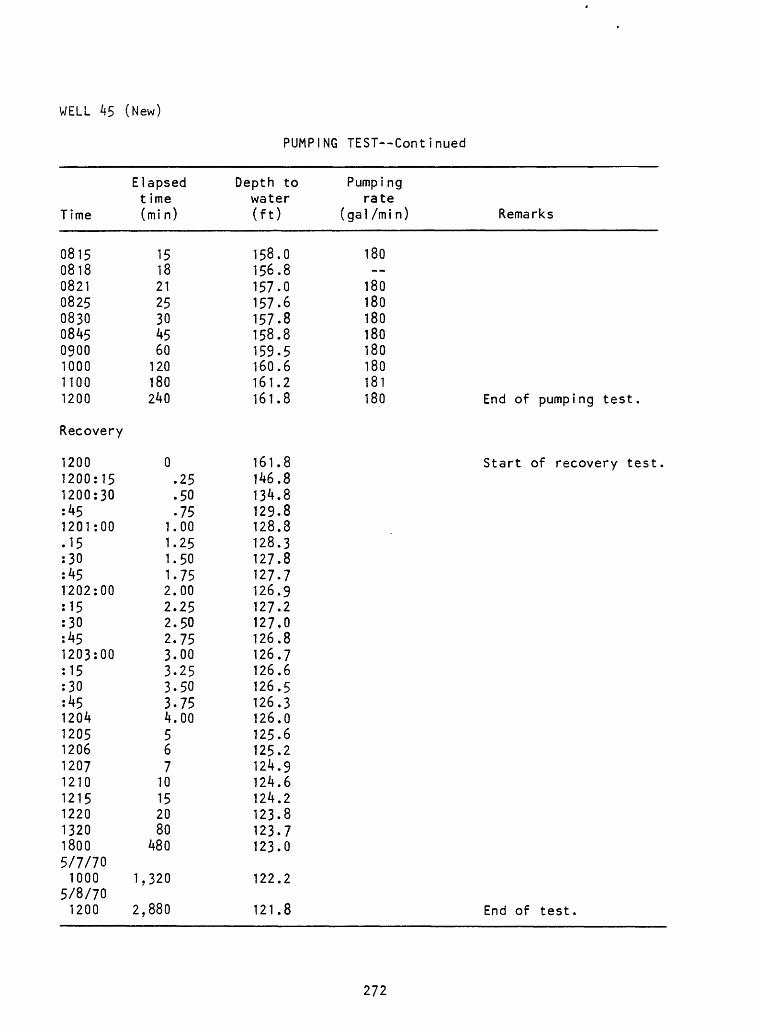
WELL 45 (New)
PUMPING TEST--Continued
Time
0815081808210825083008450900100011001200
Recovery
12001200:151200:30:451201:00.15:30:451202:00:15:30:451203:00:15:30:451204120512061207121012151220132018005/7/701000
5/8/701200
Elapsed t ime (mi n)
15182125304560120180240
0.25.50.75
1.001.251.501.752.002.252.502.753.003.253.503.754.00567
10152080
480
1,320
2,880
Depth to water (ft)
158.0156.8157.0157.6157.8158.8159.5160.6161.2161.8
161.8146.8134.8129.8128.8128.3127.8127.7126.9127.2127.0126.8126.7126.6126.5126.3126.0125.6125.2124.9124.6124.2123.8123.7123.0
122.2
121.8
Pumpi ng rate
(gal/min) Remarks
180--
180180180180180180181180 End of pumping test.
Start of recovery test.
End of test.
272
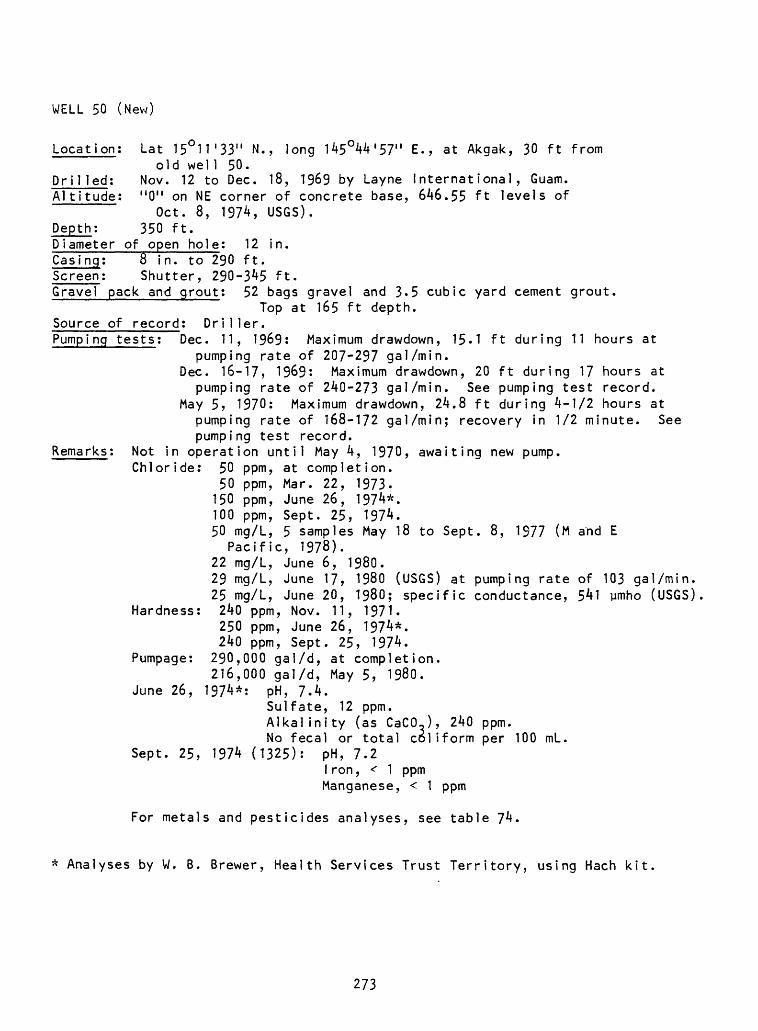
WELL 50 (New)
Locat ion:
Drilled; Altitude
Gravel
Lat 1511'33" N.,old well 50.
Nov. 12 to Dec. 18, "0" on NE
Oct. 8, 350 ft. open hole:
290
long 145°44'57" E., at Akgak, 30 ft from
1969 by Layne International, Guam, corner of concrete base, 646.55 ft levels of 1974, USGS).
12 in ft.
Depth;Diameter of _______Casingl8 in. toScreen: Shutter, 290-345 ft.
pack and grout: 52 bags gravel and 3.5165 ft depth.
Pumping tests:
cubic yard cement grout Top
Source of record: Driller.Dec. 11, 1969: Maximum drawdown, 15.1 ft during 11 hours at
pumping rate of 207-297 gal/min. Dec. 16-17, 1969: Maximum drawdown, 20 ft during 17 hours at
pumping rate of 240-273 gal/min. See pumping test record. May 5, 1970: Maximum drawdown, 24.8 ft during 4-1/2 hours at
pumping rate of 168-172 gal/min; recovery in 1/2 minute. See pumping test record.
Not in operation until May 4, 1970, awaiting new pump.Remarks:Chloride: 50 ppm,
50 ppm,150 ppm,100 ppm,50 mg/L,
at completion. Mar. 22, 1973. June 26, 1974*. Sept. 25, 1974. 5 samples May 18 to Sept. 8, 1977 (M and E
Hardness
Pumpage:
June 26,
Pacific, 1978). 22 mg/L, June 6, 1980.29 mg/L, June 17, 1980 (USGS) at pumping rate 25 mg/L, June 20, 1980; specific conductance, 240 ppm, Nov. 11, 1971. 250 ppm, June 26, 1974*.
25, 1974. at completion.
of 103 gal/min. 541 ymho (USGS)
240 ppm, Sept 290,000 gal/d,216,000 gal/d, May 5, 1980. 1974*: pH, 7.4.
Sulfate, 12 ppm. Alkalinity (as CaCO.,), 240 ppm. No fecal or total coliform per 100 mL.
Sept. 25, 1974 (1325): pH, 7.2I ron, < 1 ppm Manganese, < 1 ppm
For metals and pesticides analyses, see table 74.
* Analyses by W. B. Brewer, Health Services Trust Territory, using Hach kit.
273
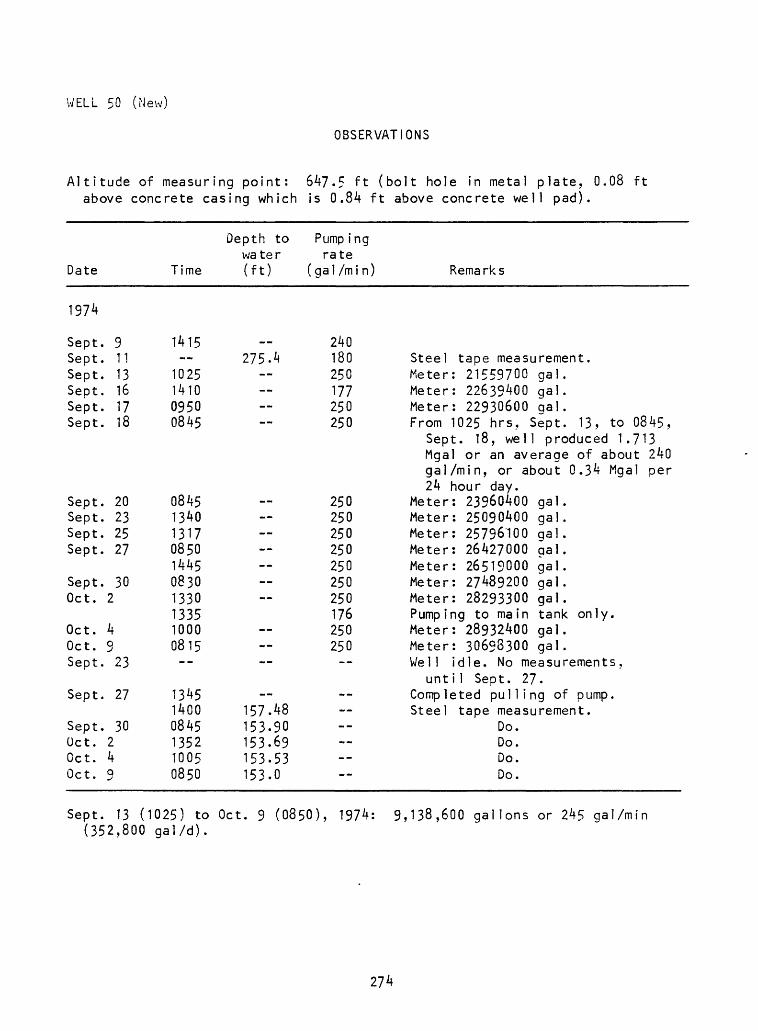
WELL 50 (New)
OBSERVATIONS
Altitude of measuring point: 647.5 ft (bolt hole in metal plate, 0.08 above concrete casing which is 0.84 ft above concrete well pad).
ft
Date
1974
Sept. 9Sept. 11Sept. 13Sept. 16Sept. 17Sept. 18
Sept. 20Sept. 23Sept. 25Sept. 27
Sept. 30Oct. 2
Oct. 4Oct. 9Sept. 23
Sept. 27
Sept. 30Oct. 2Oct. 4Oct. 9
Time
1415--
1025141009500845
0845134013170850144508301330133510000815--
134514000845135210050850
Depth to wa te r (ft)
_-
275.4---- --
-- --~
--157.48153.90153.69153.53153.0
Pump ing rate
(gal /mi n)
240180250177250250
250250250250250250250176250250--
-- ----
Remarks
Steel tape measurement.Meter: 21559700 gal.Meter: 22639400 gal.Meter: 22930600 gal.From 1025 hrs, Sept. 13, to 0845,
Sept. 18, well produced 1.713Mgal or an average of about 240gal/min, or about 0.34 Mgal per24 hour day.
Meter: 23960400 gal.Meter: 25090400 gal.Meter: 25796100 gal.Meter: 26427000 qal.Meter: 26519000 gal.Meter: 27489200 gal.Meter: 28293300 gal.Pumping to main tank only.Meter: 28932400 gal.Meter: 30698300 gal.Well idle. No measurements,
until Sept. 27.Completed pulling of pump.Steel tape measurement.
Do.Do.Do.Do.
Sept. 13 (1025) to Oct. 9 (0850), 1974; (352,800 gal/d).
9,138,600 gallons or 245 gal/min
274
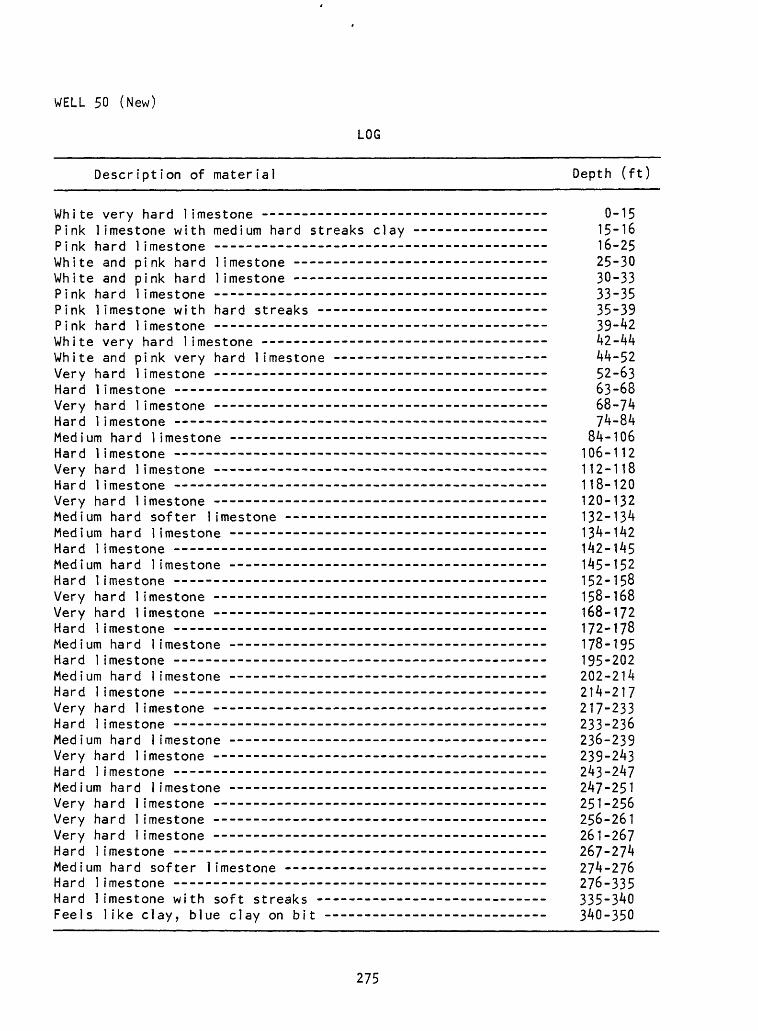
WELL 50 (New)
LOG
Description of material Depth (ft)
White very hard limestone ------------------------------------ 0-15Pink limestone with medium hard streaks clay ------- -------- 15-16Pink hard limestone ----- ----------------------------------- 16-25White and pink hard limestone ----------------------- ------- 25-30White and pink hard limestone ------- --------------------- 30-33Pink hard limestone -- - --- --- - --- ------------ 33-35Pink limestone with hard streaks -- -------- ---------- --- 35-39Pink hard limestone -- 39-42White very hard limestone ------------------------------------ 42-44White and pink very hard limestone ------------------------- 44-52Very hard 1imestone ------------------------------------------ 52-63Hard 1imestone --------------------------------------- ------ 63-68Very hard 1imestone ----- ---------- _-_-_ ______ _____ 68-74Hard limestone -- 74-84Medium hard limestone ---------------------------------------- 84-106Hard limestone -- - -- 106-112Very hard limestone ------------------------------------------ 112-118Hard limestone -- 118-120Very hard limestone -- -- 120-132Medium hard softer limestone ------ ---- ------ ------ --- 132-134Medium hard limestone ---------------------------------------- 134-142Hard limestone ---- 142-145Medium hard limestone ---------------------------------------- 145-152Hard limestone -- -- - -- - -- 152-158Very hard limestone ---- ________ _ _____ __ ______ 158-168Very hard limestone -- 168-172Hard limestone 172-178Medium hard limestone -- -------------------------------- 178-195Hard limestone ---- -- -- 195-202Medium hard limestone ---- -- -- 202-214Hard limestone -- -- -- ----- 214-217Very hard limestone -- - -- 217-233Hard limestone --- ----- ---- 233-236Medium hard limestone -------------------------- ------------ 236-239Very hard limestone --- ----- __ 239-243Hard limestone ----- _-_-_-_- _ __ 243-247Medium hard limestone ---------------------------------------- 247-251Very hard limestone ------------------------------- _______ 251-256Very hard limestone -- -- ---------------- ______ _____ 256-261Very hard limestone ------------------------------------------ 261-267Hard limestone -- _---____ ____ 267-274Medium hard softer limestone --------------------------------- 274-276Hard 1 imestone -- - - -- -- - 276-335Hard limestone with soft streaks ---- -- --- 335-340Feels like clay, blue clay on bit -------- -- 340-350
275
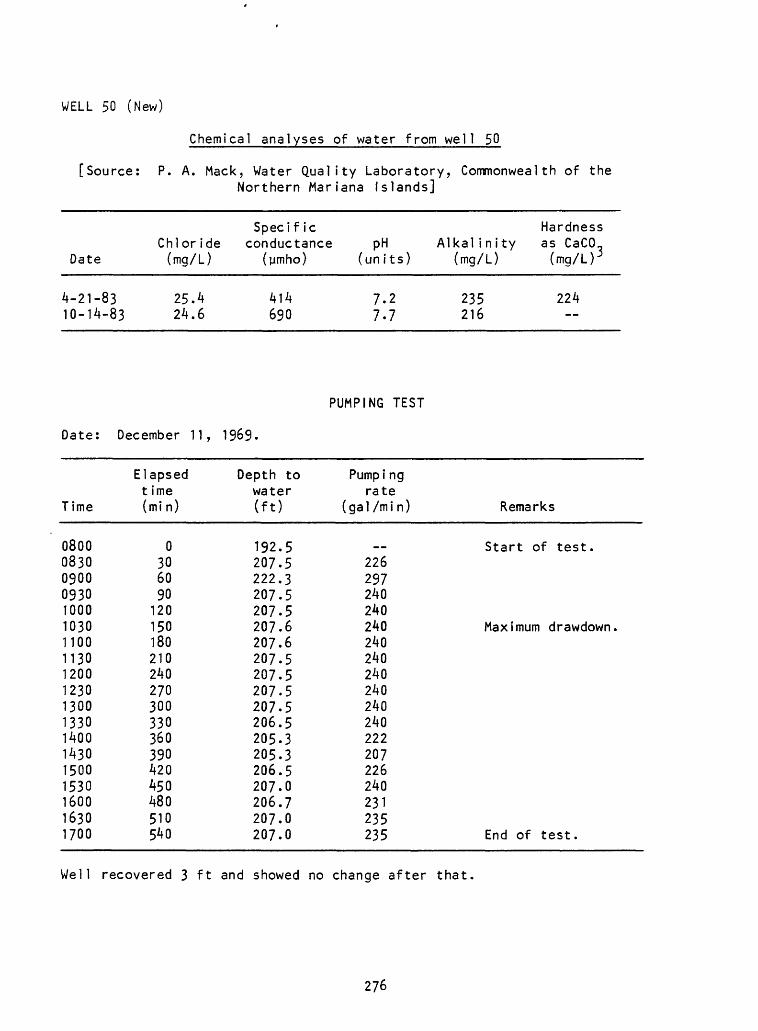
WELL 50 (New)
Chemical analyses of water from well 50
[Source: P. A. Mack, Water Quality Laboratory, Commonwealth of theNorthern Mariana Islands]
Date
4-21-83 10-14-83
Chloride (mg/L)
25.4 24.6
Spec! f ic conductance
(ymho)
414 690
pH (units)
7.2 7-7
Alkal inity (mg/L)
235 216
Hardness as CaCO (mg/L)*
224
PUMPING TEST
Date: December 11, 1969.
Time
0800083009000930100010301100113012001230130013301400143015001530160016301700
Elapsed t ime (mi n)
0306090120150180210240270300330360390420450480510540
Depth to water (ft)
192.5207.5222.3207.5207.5207.6207.6207.5207.5207.5207.5206.5205.3205.3206.5207.0206.7207.0207.0
Pumpi ng rate
(gal /mi n) Remarks
Start of test.226297240240240 Maximum drawdown.240240240240240240222207226240231235235 End of test.
Well recovered 3 ft and showed no change after that.
276
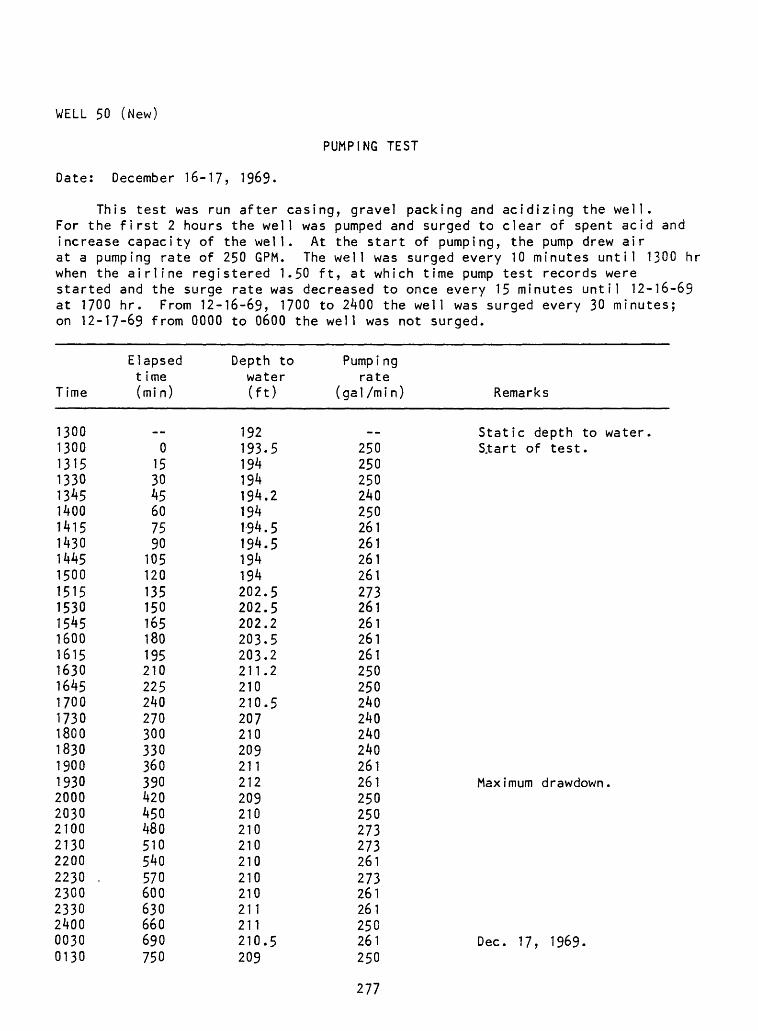
WELL 50 (New)
PUMPING TEST
Date: December 16-17, 1969.
This test was run after casing, gravel packing and acidizing the well. For the first 2 hours the well was pumped and surged to clear of spent acid and increase capacity of the well. At the start of pumping, the pump drew air at a pumping rate of 250 GPM. The well was surged every 10 minutes until 1300 hr when the airline registered 1.50 ft, at which time pump test records were started and the surge rate was decreased to once every 15 minutes until 12-16-65 at 1700 hr. From 12-16-69, 1700 to 2400 the well was surged every 30 minutes; on 12-17-69 from 0000 to 0600 the well was not surged.
Elapsed Depth to Pumpingtime water rate
Time (min) (ft) (gal/min) Remarks
1300 -- 192 -- Static depth to water.1300 0 193.5 250 S.tart of test.1315 15 194 2501330 30 194 2501345 45 194.2 2401400 60 194 2501415 75 194.5 2611430 90 194.5 2611445 105 194 2611500 120 194 2611515 135 202.5 2731530 150 202.5 2611545 165 202.2 2611600 180 203.5 2611615 195 203.2 2611630 210 211.2 2501645 225 210 2501700 240 210.5 2401730 270 207 2401800 300 210 2401830 330 209 2401900 360 211 2611930 390 212 261 Maximum drawdown.2000 420 209 2502030 450 210 2502100 480 210 2732130 510 210 2732200 540 210 2612230 . 570 210 2732300 600 210 2612330 630 211 2612400 660 211 2500030 690 210.5 261 Dec. 17, 1969.0130 750 209 250
277
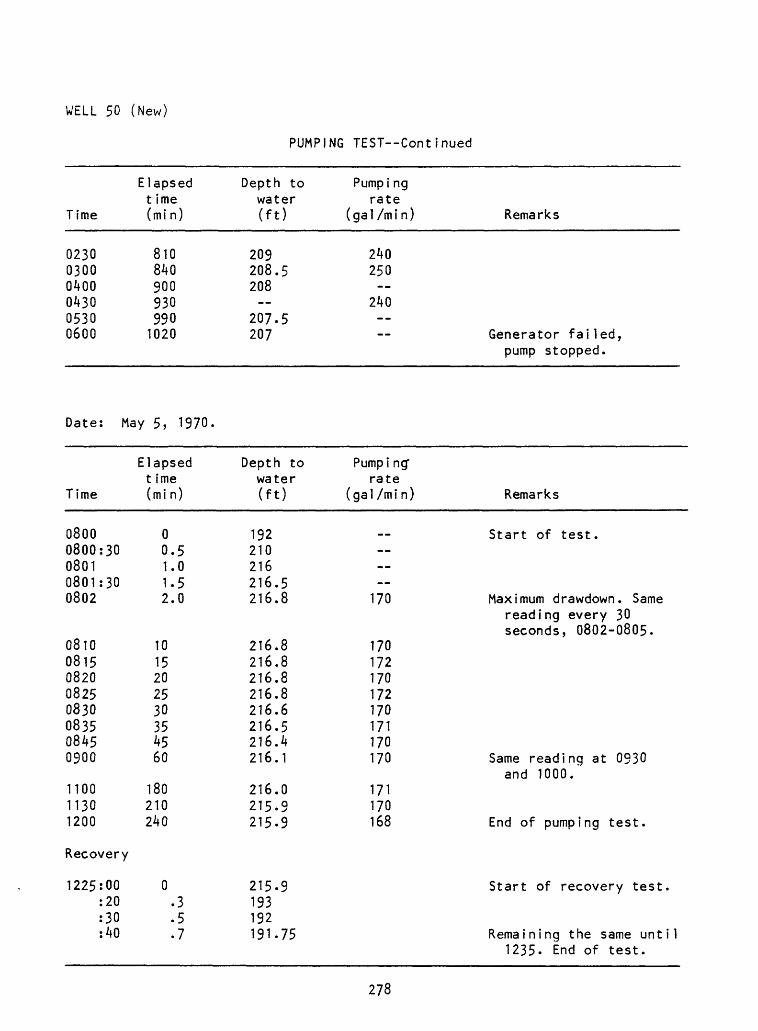
WELL 50 (New)
PUMPING TEST--Continued
Time
023003000400043005300600
Elapsed time (mi n)
8108409009309901020
Depth to water (ft)
209208.5208--
207.5207
Pumpi ng rate
(gal /mi n) Remarks
240250
240--
Generator failed,pump stopped.
Date: May 5, 1970
Time
08000800:3008010801:300802
08100815082008250830083508450900
110011301200
Recovery
1225:00:20:30:40
Elapsed t ime (mi n)
00.51.01.52.0
1015202530354560
180210240
0.3.5.7
Depth to water (ft)
192210216216.5216.8
216.8216.8216.8216.8216.6216.5216.4216.1
216.0215-9215-9
215-9193192191.75
Pumpi ng rate
(gal /mi n)
.. --
170
170172170172170171170170
171170168
Remarks
Start of test.
Maximum drawdown. Samereading every 30seconds, 0802-0805.
Same reading at 0930and 1000.
End of pumping test.
Start of recovery test.
Remaining the same until1235. End of test.
278
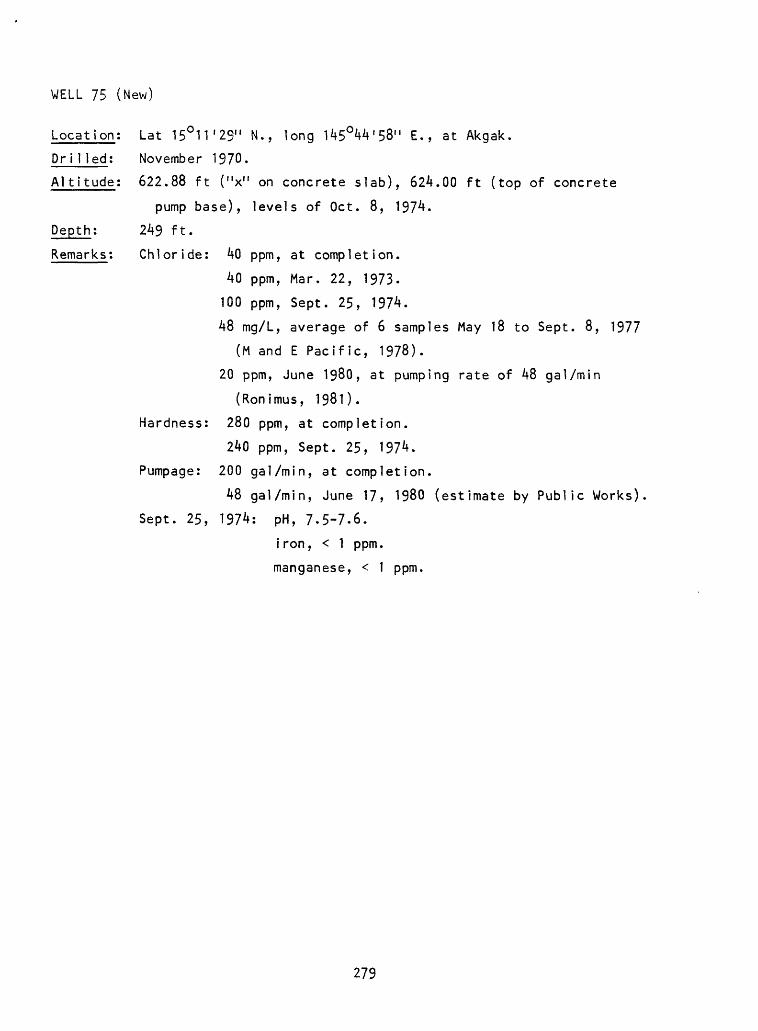
WELL 75 (New)
Location: Lat 15°H'29" N., long 145°44'58" E., at Akgak.
Dr 11 led; November 1970.
Altitude: 622.88 ft ("x" on concrete slab), 624.00 ft (top of concrete
pump base), levels of Oct. 8, 1974.
Depth: 249 ft.
Remarks: Chloride: 40 ppm, at completion.
40 ppm, Mar. 22, 1973.
100 ppm, Sept. 25, 1974.
48 mg/L, average of 6 samples May 18 to Sept. 8, 1977
(M and E Pacific, 1978).
20 ppm, June 1980, at pumping rate of 48 gal/min
(Ronimus, 1981).
Hardness: 280 ppm, at completion.
240 ppm, Sept. 25, 1974.
Pumpage: 200 gal/min, at completion.
48 gal/min, June 17, 1980 (estimate by Public Works)
Sept. 25, 1974: pH, 7-5-7.6.
iron, < 1 ppm.
manganese, < 1 ppm.
279
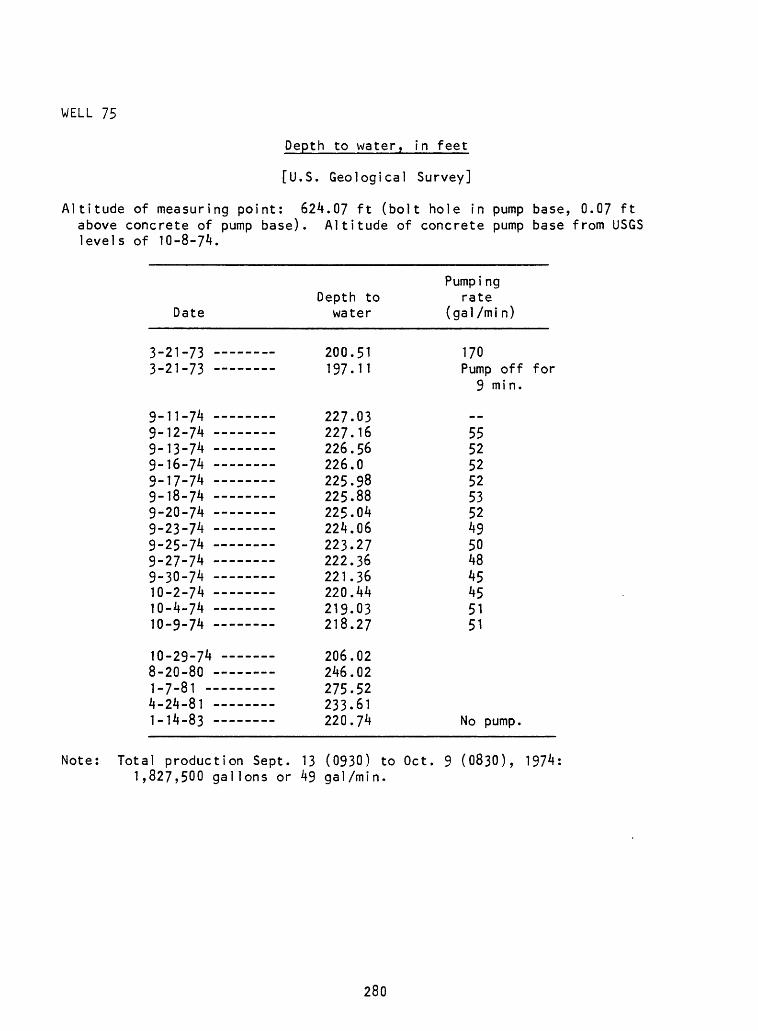
WELL 75
Depth to water, in feet
[U.S. Geological Survey]
Altitude of measuring point: 624.07 ft (bolt hole in pump base, 0.07 ft above concrete of pump base). Altitude of concrete pump base from USGS levels of 10-8-74.
Date
3-21-733-21-73
9-11-749-12-74 9-13-749-16-74 9-17-749-18-74 9-20-74 9-23-749-25-749-27-74 -9-30-74 10-2-74 10-4-74 10-9-74
10-29-74 8-20-80 1-7-81 4-24-81 1-14-83
Depth towater
200.51197.11
227.03227.16226.56226.0225.98225.88225.04224.06223.27222.36221.36220.44219.03218.27
206.02246.02275.52233.61220.74
Pumpi ngrate
(gal /mi n)
170Pump off for
9 min.
__55525252535249504845455151
No pump.
Note: Total production Sept. 13 (0930) to Oct 1,827,500 gallons or 49 gal/min.
9 (0830), 1974
280
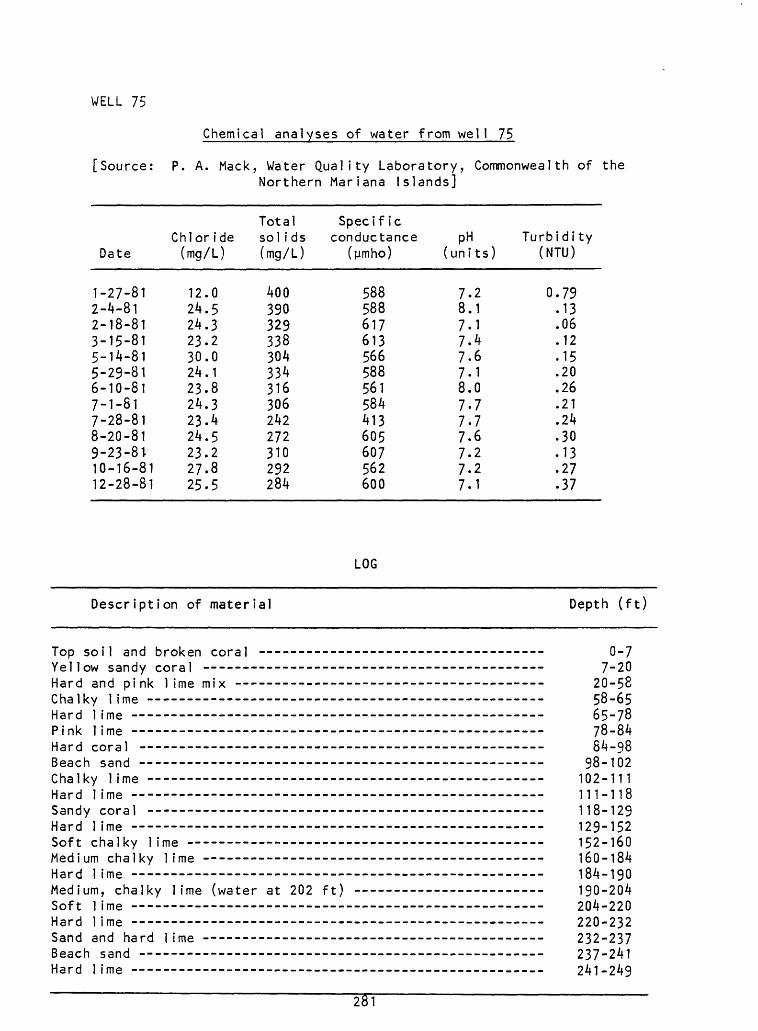
WELL 75
Chemical analyses of water from well 75
[Source: P. A. Mack, Water Quality Laboratory, Commonwealth of theNorthern Mariana Islands]
DateChlor ide (mg/L)
Total soli ds (mg/L)
Specif ic conductance
(ymho)pH
(uni ts)Turbidi ty
(NTU)
1-27-812-4-812-18-813-15-81 5-14-815-29-816-10-817-1-817-28-818-20-819-23-8110-16-81 12-28-81
12.024.524.323.230.024.123.824.323.424.523.227.825.5
400390329338304334316306242272310292284
588588617613566588561584413605607562600
7.2 8.1 7.1 7.4 7.67.1 8.07-7 7-7 7.6 7.2 7.2 7.1
0.79 .13 .06 .12.15 .20 .26 .21 .24 .30 .13 .27 .37
LOG
Description of material Depth (ft)
Top soil and broken coral ------------------------------------ 0-7Yellow sandy coral ----------------------------------------- 7-20Hard and pink lime mix ---------------------------------- --- 20-58Chalky lime 58-65Hard lime 65-78Pink lime 78-84Hard coral 84-98Beach sand 98-102Chalky lime 102-111Hard lime -- 111-118Sandy coral 118-129Hard lime 129-152Soft chalky lime 152-160Medium chalky lime -- -- --- ---- ---- 160-184Hard lime 184-190Medium, chalky lime (water at 202 ft) -- ---- -- 190-204Soft lime 204-220Hard lime 220-232Sand and hard 1ime ----------------- _-__-_-----____-____ 232-237Beach sand -- -- ------ ____- .___ _____ 237-241Hard lime -------------- -- ______ __ _ 241-249
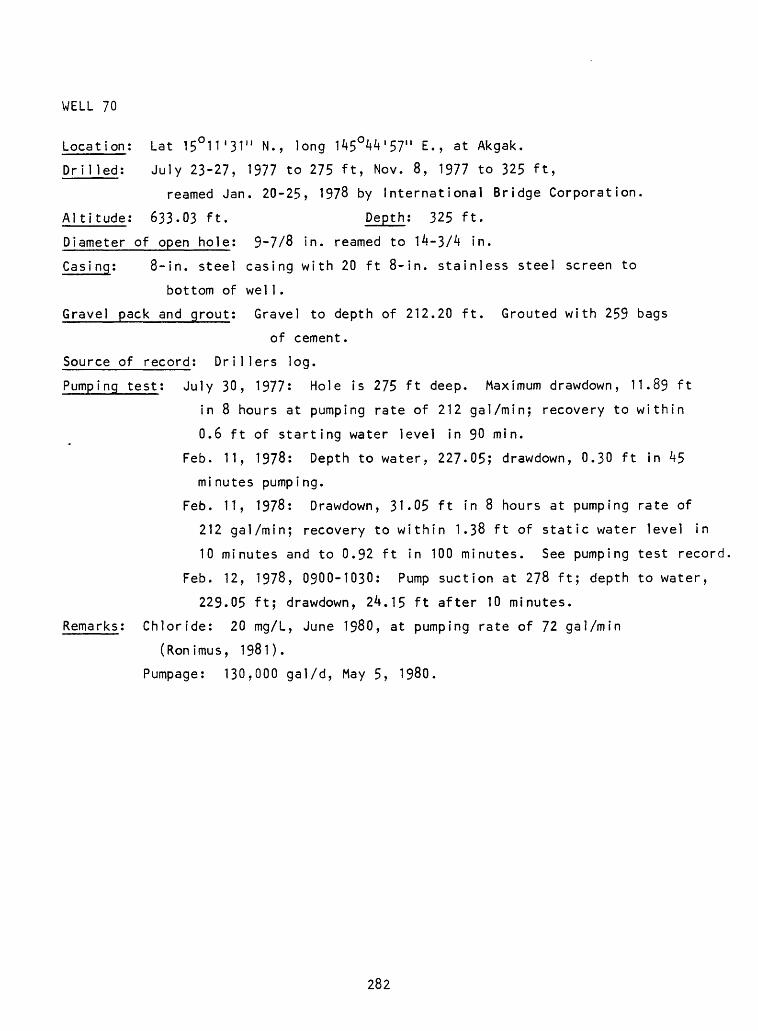
WELL 70
Location: Lat 15°11'31" N., long 145°M*'57" E., at Akgak.
Drilled; July 23-27, 1977 to 275 ft, Nov. 8, 1977 to 325 ft,
reamed Jan. 20-25, 1978 by International Bridge Corporation.
Altitude: 633.03 ft. Depth: 325 ft.
Diameter of open hole: 9-7/8 in. reamed to 14-3A in.
Casing: 8-in. steel casing with 20 ft 8-in. stainless steel screen to
bottom of wel1.
Gravel pack and grout: Gravel to depth of 212.20 ft. Grouted with 259 bags
of cement.
Source of record; Drillers log.
Pumping test: July 30, 1977: Hole is 275 ft deep. Maximum drawdown, 11.89 ft
in 8 hours at pumping rate of 212 gal/min; recovery to within
0.6 ft of starting water level in 90 min.
Feb. 11, 1978: Depth to water, 227.05; drawdown, 0.30 ft in 45
minutes pumping.
Feb. 11, 1978: Drawdown, 31.05 ft in 8 hours at pumping rate of
212 gal/min; recovery to within 1.38 ft of static water level in
10 minutes and to 0.92 ft in 100 minutes. See pumping test record
Feb. 12, 1978, 0900-1030: Pump suction at 278 ft; depth to water,
229.05 ft; drawdown, 24.15 ft after 10 minutes.
Remarks: Chloride: 20 mg/L, June 1980, at pumping rate of 72 gal/min
(Ronimus, 1981).
Pumpage: 130,000 gal/d, May 5, 1980.
282
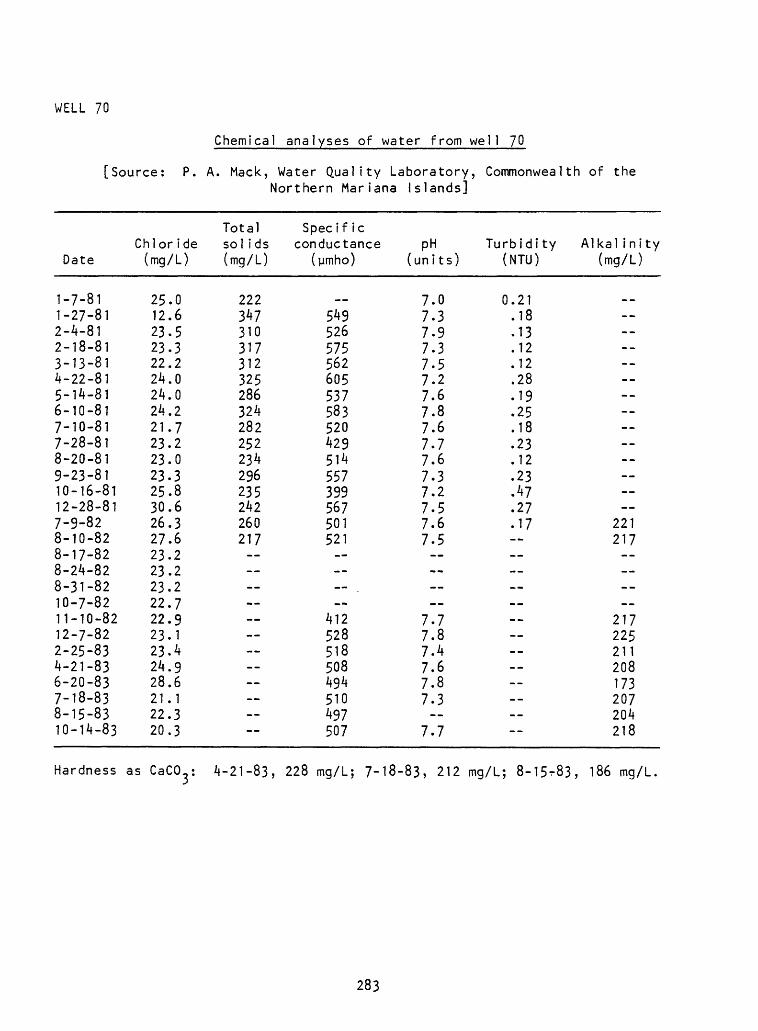
WELL 70
[Source
Chemical analyses of water from well 70
P. A. Mack, Water Quality Laboratory, Commonwealth of the Northern Mariana Islands]
Date
1-7-811-27-812-4-812-18-813-13-814-22-815-14-816-10-817-10-817-28-818-20-819-23-8110-16-8112-28-817-9-828-10-828-17-828-24-828-31-8210-7-8211-10-8212-7-822-25-834-21-836-20-837-18-838-15-8310-14-83
Chlor ide (mg/L)
25.012.623.523.322.224.024.024.221.723.223.023.325.830.626.327.623.223.223.222.722.923.123.424.928.621.122.320.3
Total sol ids (mg/L)
222347310317312325286324282252234296235242260217 ---- ----
Specif ic conductance
(urnho)
__549526575562605537583520429514557399567501521
412528518508494510497507
P H (units)
7.07.37.97.37.57.27.67.87.67.77.67.37.27.57.67.5 ----
7.77.87.47.67.87.3-_
7.7
Turbidity (NTU)
0.21.18.13.12.12.28.19.25.18.23.12.23.47.27.17 -------- ------_-----
Alkal inity (mg/L)
.. ------------ ----
221217--------
217225211208173207204218
Hardness as CaCO^ 4-21-83, 228 mg/L; 7-18-83, 212 mg/L; 8-15^83, 186 mg/L.
283
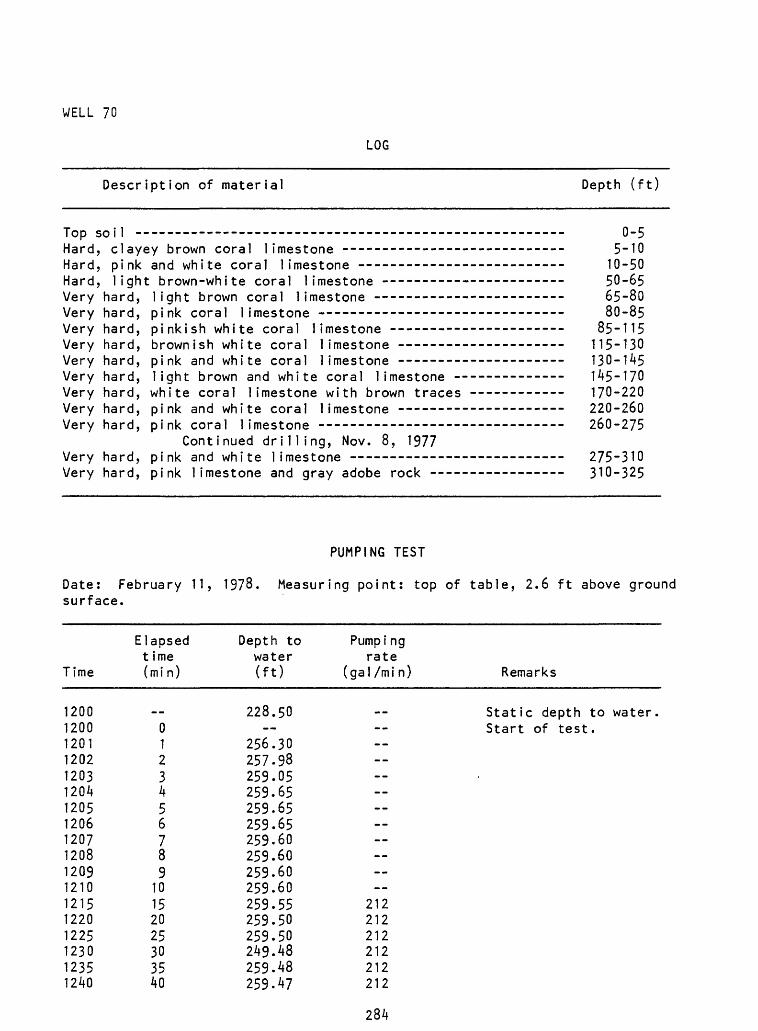
WELL 70
LOG
Description of material Depth (ft)
Top soil -- ---------------------------------------------Hard, clayey brown coral limestone -----------------------Hard, pink and white coral limestone ---------------------Hard, light brown-white coral limestone --- ----- ------Very hard, light brown coral limestone -----------------Very hard, pink coral limestone --- ---------------------Very hard, pinkish white coral limestone --- ---------Very hard, brownish white coral limestone --------------Very hard, pink and white coral limestone ----------------Very hard, light brown and white coral limestone ---------Very hard, white coral limestone with brown traces -------Very hard, pink and white coral limestone ________ _Very hard, pink coral limestone --------------------------
Continued drilling, Nov. 8, 1977Very hard, pink and white limestone -_-___ ________Very hard, pink limestone and gray adobe rock ---- -
----- 0-5 5-10 10-50_____ 50-65 65-80 80-85_____ 85-115_____ 115-130 130-U5 145-170 170-220 220-260 260-275
_____ 275-310_____ 310-325
PUMPING TEST
Date: February 11, 1978. Measuring point: top of table, 2.6 ft above ground surface.
Time
Elapsed t ime (mi n)
Depth to water (ft)
Pumpi ngrate
(gal/mi n) Remarks
120012001201120212031204120512061207120812091210121512201225123012351240
0123456789
10152025303540
228.50
256.30257.98259.05259.65259.65259.65259.60259.60259.60259.60259.55259.50259.50249.48259.48259.47
Static depth to water Start of test.
212212212212212212
284
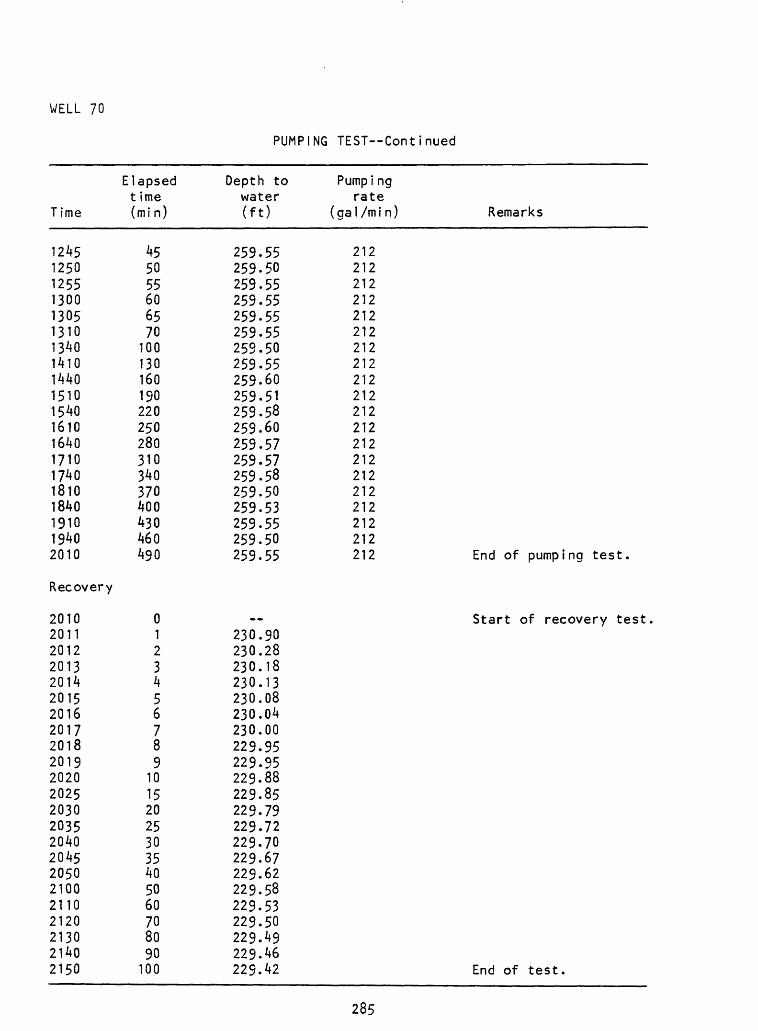
WELL 70
PUMPING TEST--Continued
Time
12451250125513001305131013401410144015101540161016401710174018101840191019402010
Recovery
20102011201220132014201520162017201820192020202520302035204020452050210021102120213021402150
Elapsed t ime (mi n)
455055606570
100130160190220250280310340370400430460490
0123456789
101520253035405060708090100
Depth to water (ft)
259.55259.50259.55259.55259.55259.55259.50259.55259.60259.51259.58259.60259.57259.57259.58259.50259.53259.55259.50259.55
--230.90230.28230.18230.13230.08230.04230.00229.95229.95229.88229.85229.79229.72229.70229.67229.62229.58229.53229.50229.49229.46229.42
Pumpi ng rate
(gal/min) Remarks
212212212212212212212212212212212212212212212212212212212212 End of pumping test.
Start of recovery test
End of test.
285
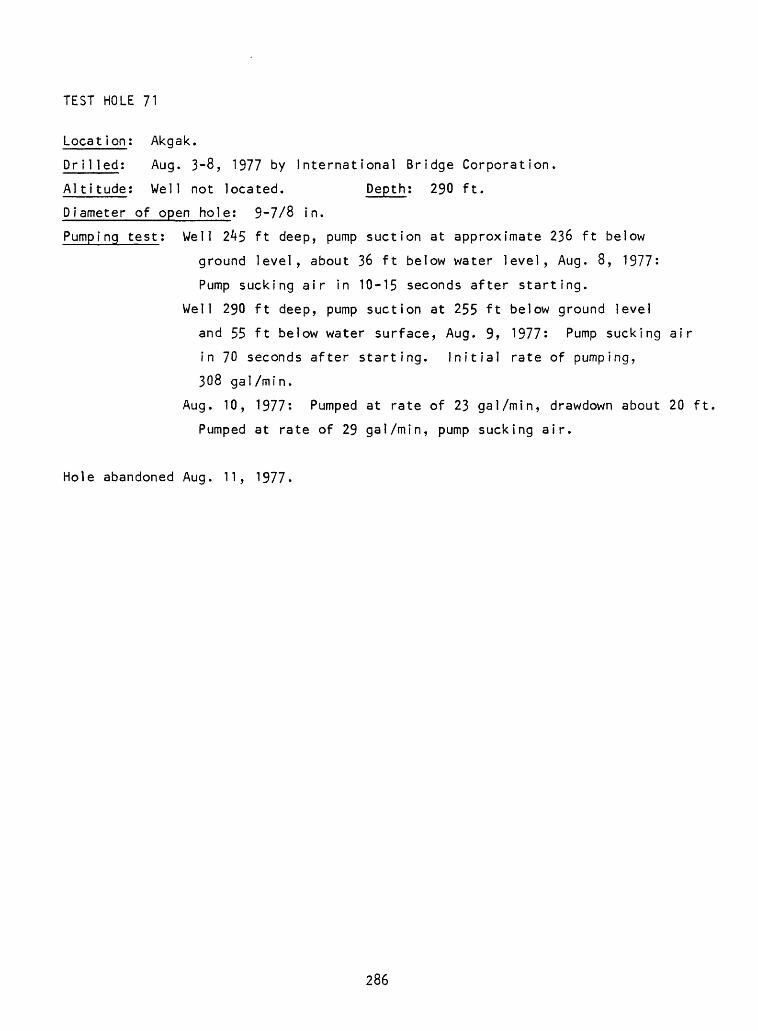
TEST HOLE 71
Locat ion; Akgak.
Dr11 led; Aug. 3-8, 1977 by International Bridge Corporation.
Altitude; Well not located. Depth; 290 ft.
Diameter of open hole; 9-7/8 in.
Pumping test; Well 245 ft deep, pump suction at approximate 236 ft below
ground level, about 36 ft below water level, Aug. 8, 1977:
Pump sucking air in 10-15 seconds after starting.
Well 290 ft deep, pump suction at 255 ft below ground level
and 55 ft below water surface, Aug. 9» 1977; Pump sucking air
in 70 seconds after starting. Initial rate of pumping,
308 gal/min.
Aug. 10, 1977; Pumped at rate of 23 gal/min, drawdown about 20 ft
Pumped at rate of 29 gal/min, pump sucking air.
Hole abandoned Aug. 11, 1977.
286
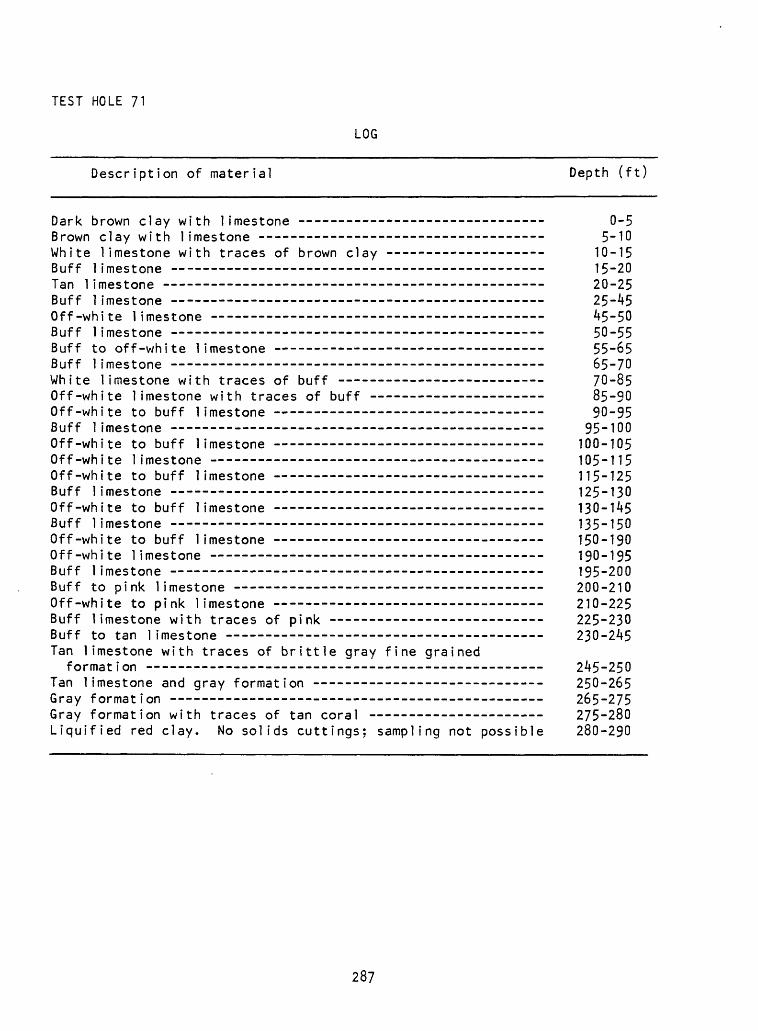
TEST HOLE 71
LOG
Description of material Depth (ft)
Dark brown clay with limestone --- ---------- ________ Q-5Brown clay with limestone ------------------------------------ 5-10White limestone with traces of brown clay -- ---------------- 10-15Buff limestone 15-20Tan limestone 20-25Buff 1 imestone -- 25-45Off-white limestone - 45-50Buff limestone -- 50-55Buff to off-white limestone -- - -- - 55-65Buff limestone -- 65-70White limestone with traces of buff - -- 70-85Off-white limestone with traces of buff 85-90Off-white to buff limestone 90-95Buff limestone -- 95-100Off-white to buff limestone -- 100-105Off-white limestone 105-115Off-white to buff limestone -- 115-125Buff limestone - -- - 125-130Off-white to buff limestone - 130-145Buff limestone -- 135-150Off-white to buff limestone -- 150-190Off-white limestone - - - - - 190-195Buff limestone - -------------------------------- -_- - 195-200Buff to pink limestone -- 200-210Off-white to pink limestone - -- - 210-225Buff limestone with traces of pink 225-230Buff to tan 1 imestone -- 230-245 Tan limestone with traces of brittle gray fine grained
format ion -- ---------- ______ ______________ ________ 245-250Tan limestone and gray formation - - -- -- ------ 250-265Gray formation ------------ --- ______________ _________ _ 265-275Gray formation with traces of tan coral - -- -- - 275-280Liquified red clay. No solids cuttings; sampling not possible 280-290
287
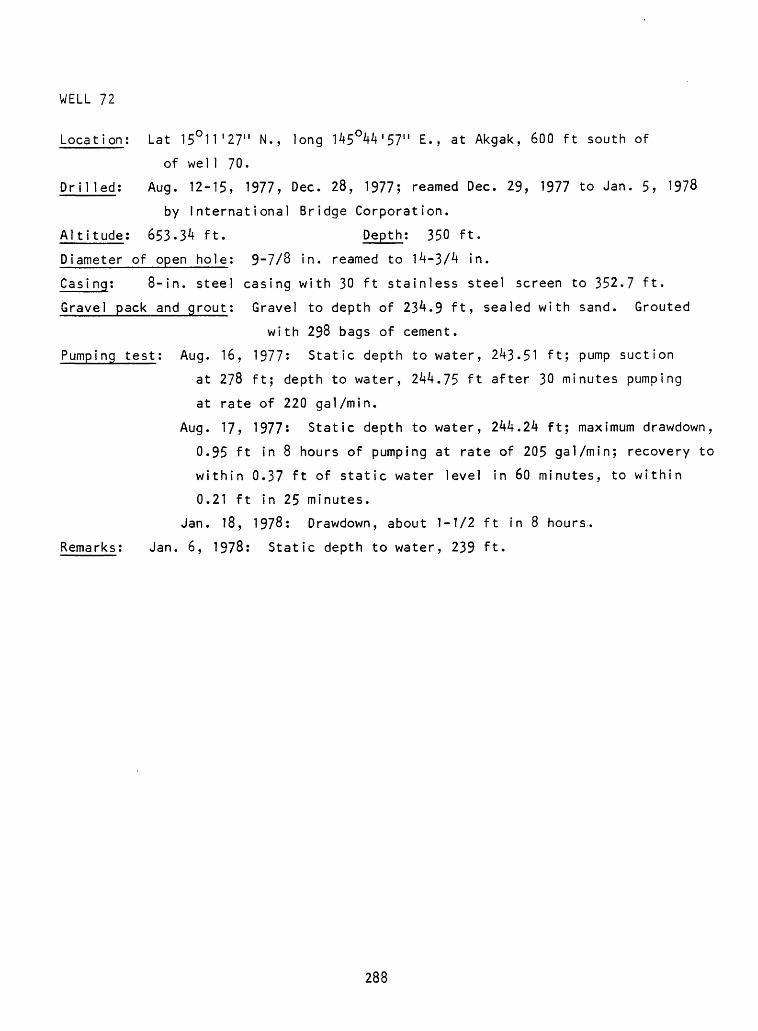
WELL 72
Location; Lat 15°11'27" N., long 145°44'57" E., at Akgak, 600 ft south of
of well 70.
Drilled: Aug. 12-15, 1977, Dec. 28, 1977; reamed Dec. 29, 1977 to Jan. 5, 1978
by International Bridge Corporation.
Altitude; 653-34 ft. Depth; 350 ft.
Diameter of open hole; 9-7/8 in. reamed to 14-3/4 in.
Casi ng; 8-in. steel casing with 30 ft stainless steel screen to 352.7 ft.
Gravel pack and grout; Gravel to depth of 234.9 ft, sealed with sand. Grouted
with 298 bags of cement.
Pumping test; Aug. 16, 1977: Static depth to water, 243.51 ft; pump suction
at 278 ft; depth to water, 244.75 ft after 30 minutes pumping
at rate of 220 gal/min.
Aug. 17, 1977: Static depth to water, 244.24 ft; maximum drawdown,
0.95 ft in 8 hours of pumping at rate of 205 gal/min; recovery to
within 0.37 ft of static water level in 60 minutes, to within
0.21 ft in 25 minutes.
Jan. 18, 1978: Drawdown, about 1-1/2 ft in 8 hours-
Remarks; Jan. 6, 1978: Static depth to water, 239 ft.
288
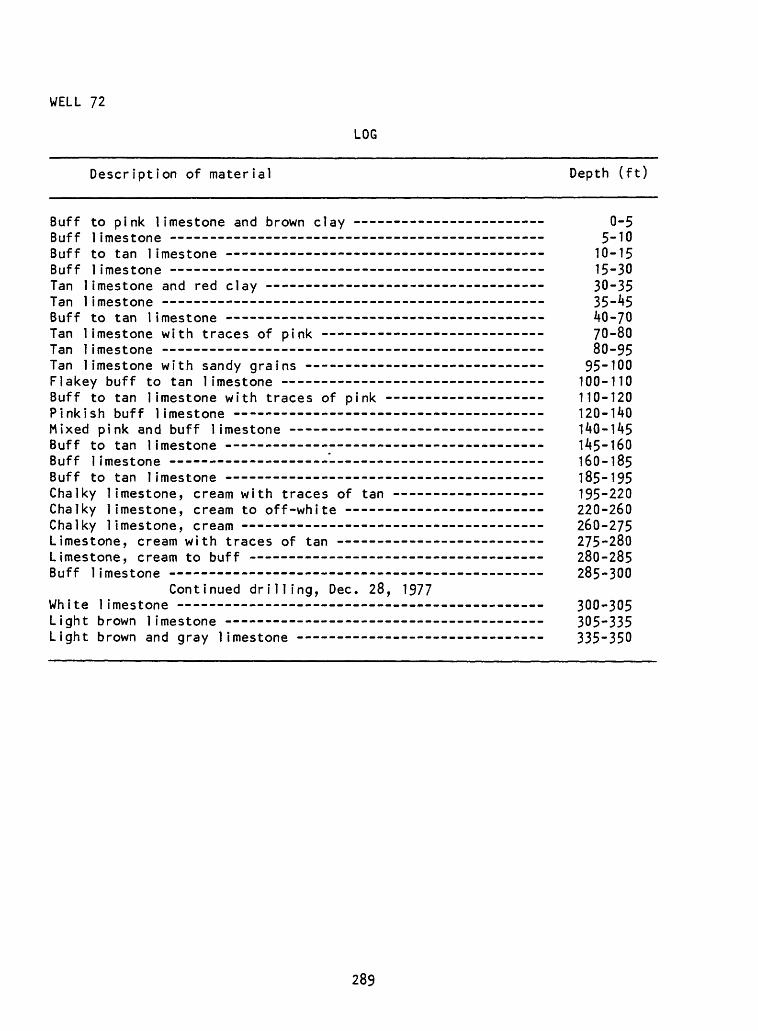
WELL 72
LOG
Description of material Depth (ft)
Buff to pink limestone and brown clay 0-5Buff limestone 5-10Buff to tan limestone 10-15Buff limestone 15-30Tan limestone and red clay 30-35Tan limestone 35-^5Buff to tan limestone 40-70Tan limestone with traces of pink 70-80Tan limestone 80-95Tan limestone with sandy grains ------ _- -- - 95-100Flakey buff to tan limestone 100-110Buff to tan limestone with traces of pink 110-120Pinkish buff limestone 120-140Mixed pink and buff limestone 140-145Buff to tan limestone 145-160Buff limestone " 160-185Buff to tan limestone 185-195Chalky limestone, cream with traces of tan 195-220Chalky limestone, cream to off-white 220-260Chalky limestone, cream -- 260-275Limestone, cream with traces of tan 275-280Limestone, cream to buff 280-285Buff limestone 285-300
Continued drilling, Dec. 28, 1977White limestone 300-305Light brown limestone 305-335Light brown and gray limestone - 335-350
289
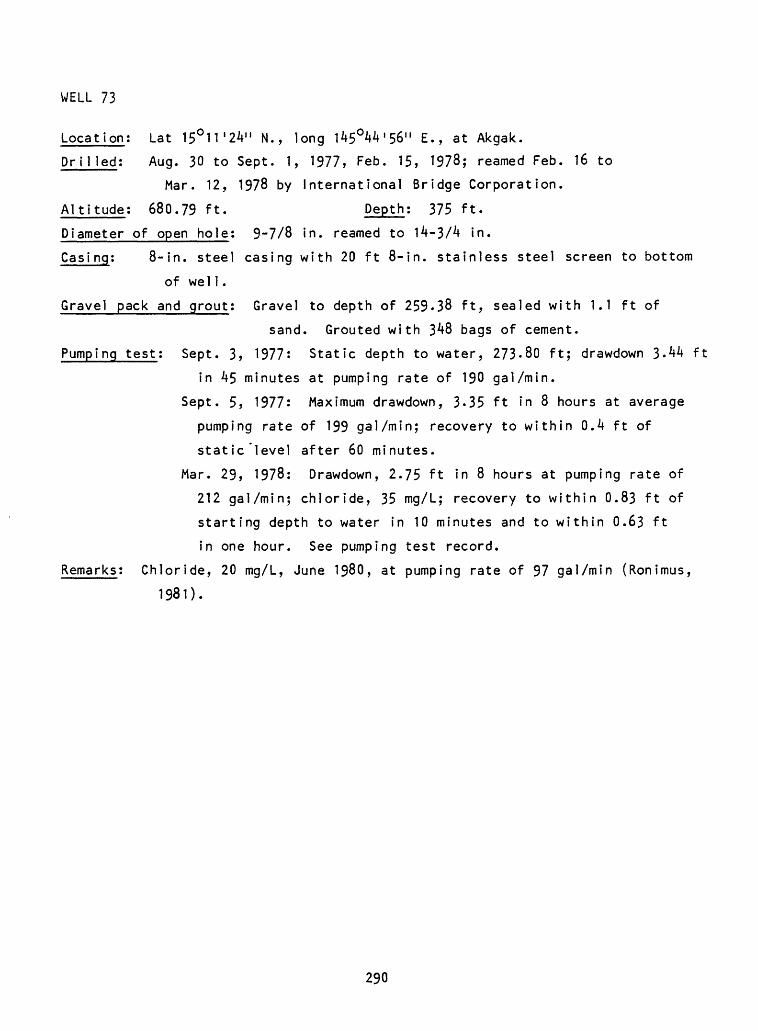
WELL 73
Location; Lat 15°11'24" N., long 145°4V56" E., at Akgak.
Drilled; Aug. 30 to Sept. 1, 1977, Feb. 15, 1978; reamed Feb. 16 to
Mar. 12, 1978 by International Bridge Corporation.
Altitude; 680.79 ft. Depth; 375 ft.
Diameter of open hole; 9-7/8 in. reamed to 14-3A in.
Casi ng; 8-in. steel casing with 20 ft 8-in. stainless steel screen to bottom
of wel1.
Gravel pack and grout; Gravel to depth of 259-38 ft, sealed with 1.1 ft of
sand. Grouted with 3^8 bags of cement.
Pumping test; Sept. 3, 1977: Static depth to water, 273.80 ft; drawdown J>.kk ft
in kS minutes at pumping rate of 190 gal/min.
Sept. 5, 1977: Maximum drawdown, 3-35 ft in 8 hours at average
pumping rate of 199 gal/min; recovery to within 0.4 ft of
static level after 60 minutes.
Mar. 29, 1978: Drawdown, 2.75 ft in 8 hours at pumping rate of
212 gal/min; chloride, 35 mg/L; recovery to within 0.83 ft of
starting depth to water in 10 minutes and to within 0.63 ft
in one hour. See pumping test record.
Remarks; Chloride, 20 mg/L, June 1980, at pumping rate of 97 gal/min (Ronimus,
1981).
290
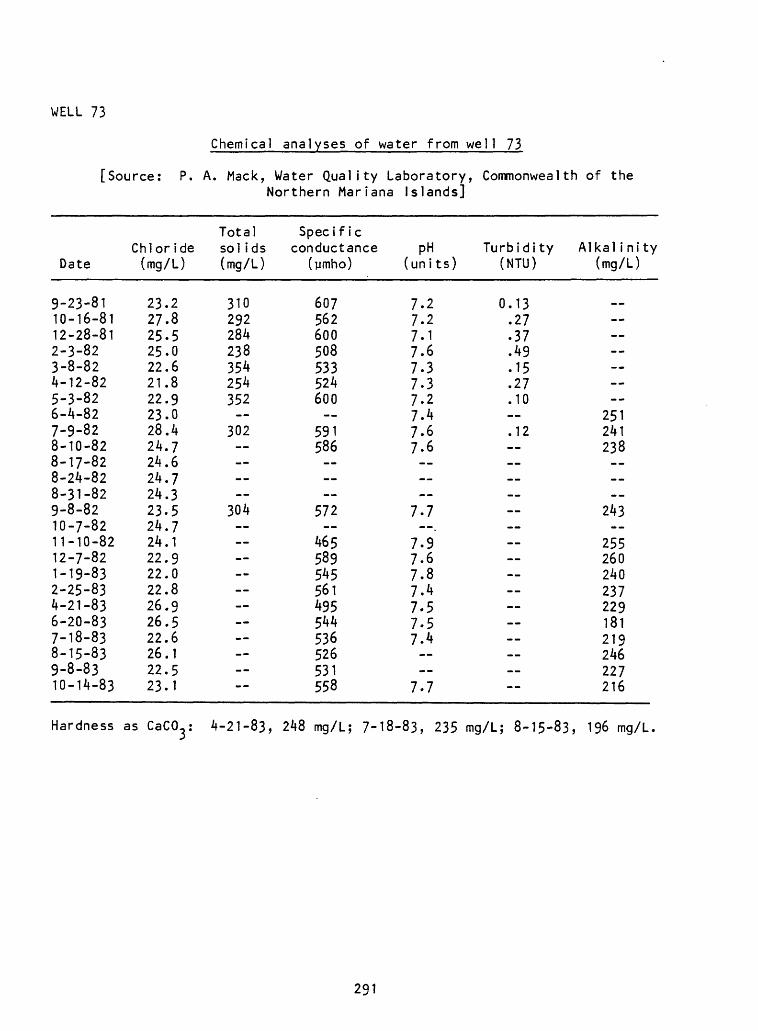
WELL 73
[Source
Chemical analyses of water from well 73
P. A. Mack, Water Quality Laboratory, Commonwealth of the Northern Mariana Islands]
Date
9-23-8110-16-8112-28-812-3-823-8-824-12-825-3-826-4-827-9-828-10-828-17-828-24-828-31-829-8-8210-7-8211-10-8212-7-821-19-832-25-834-21-836-20-837-18-838-15-839-8-8310-14-83
Chlor ide (mg/L)
23.227.825.525.022.621.822.923.028.424.724.624.724.323.524.724.122.922.022.826.926.522.626.122.523.1
Total sol ids (mg/L)
310292284238354254352
302
304 --
Spec if ic conductance
(ymho)
607562600508533524600
591586
572
465589545561495544536526531558
pH (un its)
7.27.27.17.67.37.37.27.47.67.6-- --
7.7--.
7.97.67.87.47.57-57.4
7.7
Turbidi ty (NTU)
0.13.27.37.49.15.27.10__.12-- __-- -- --____ --
Alkal i ni ty (mg/L)
-- --
251241238--__-_
243--
255260240237229181219246227216
Hardness as CaCCy 4-21-83, 248 mg/L; 7-18-83, 235 mg/L; 8-15-83, 196 mg/L.
291
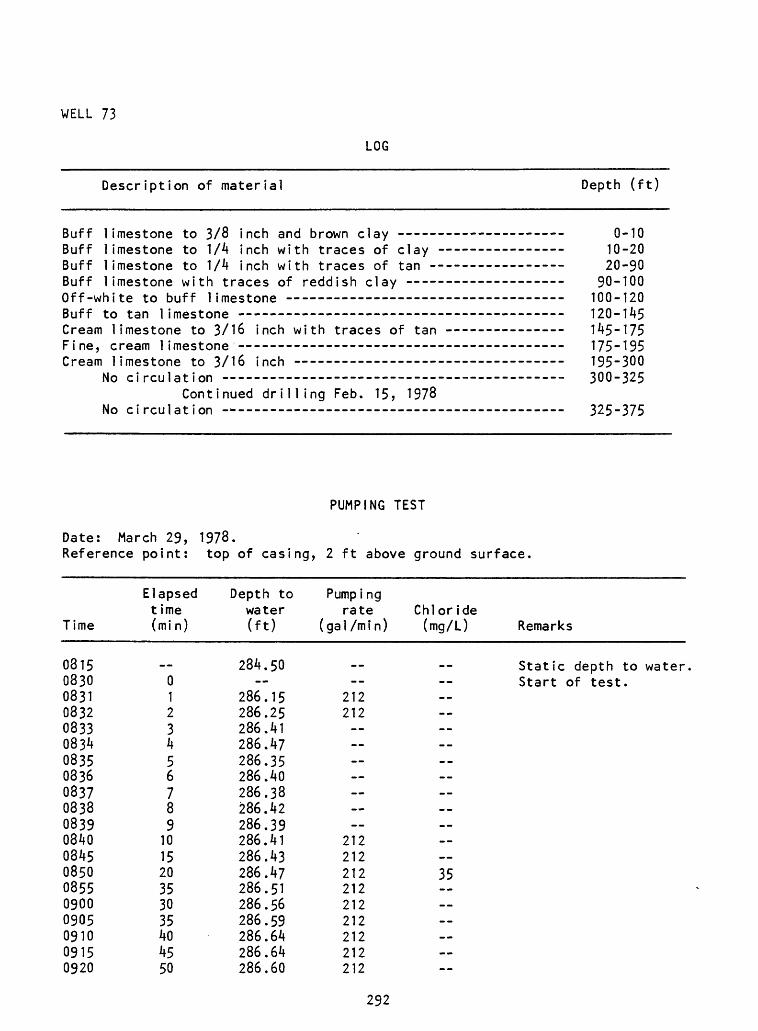
WELL 73
LOG
Description of material Depth (ft)
Buff limestone to 3/8 inch and brown clay - Buff limestone to 1/4 inch with traces of clay Buff limestone to 1/4 inch with traces of tan - Buff limestone with traces of reddish clay -- Off-white to buff limestone Buff to tan limestone -- Cream limestone to 3/16 inch with traces of tan Fine, cream limestone --------- -- - --- Cream limestone to 3/16 inch ---- ------
No circulation Continued drilling Feb. 15, 1978
No circulation - --
0-1010-2020-90
90-100100-120120-145145-175
195-300 300-325
325-375
PUMPING TEST
Date: March 29,Reference point:
Time
08150830083108320833083408350836083708380839084008450850085509000905091009150920
Elapsedtime(mi n)
__0123456789
101520353035404550
1978.top of casing,
Depth towater(ft)
284.50
286.15286.25286.41286.47286.35286.40286.38286.42286.39286.41286.43286.47286.51286.56286.59286.64286.64286.60
2 ft above
Pumpi ngrate
(gal/min)
__--
212212 --
212212212212212212212212212
ground surface.
Chloride(mg/L) Remarks
Static depth to waterStart of test.
------------------_---35
--_-----
292
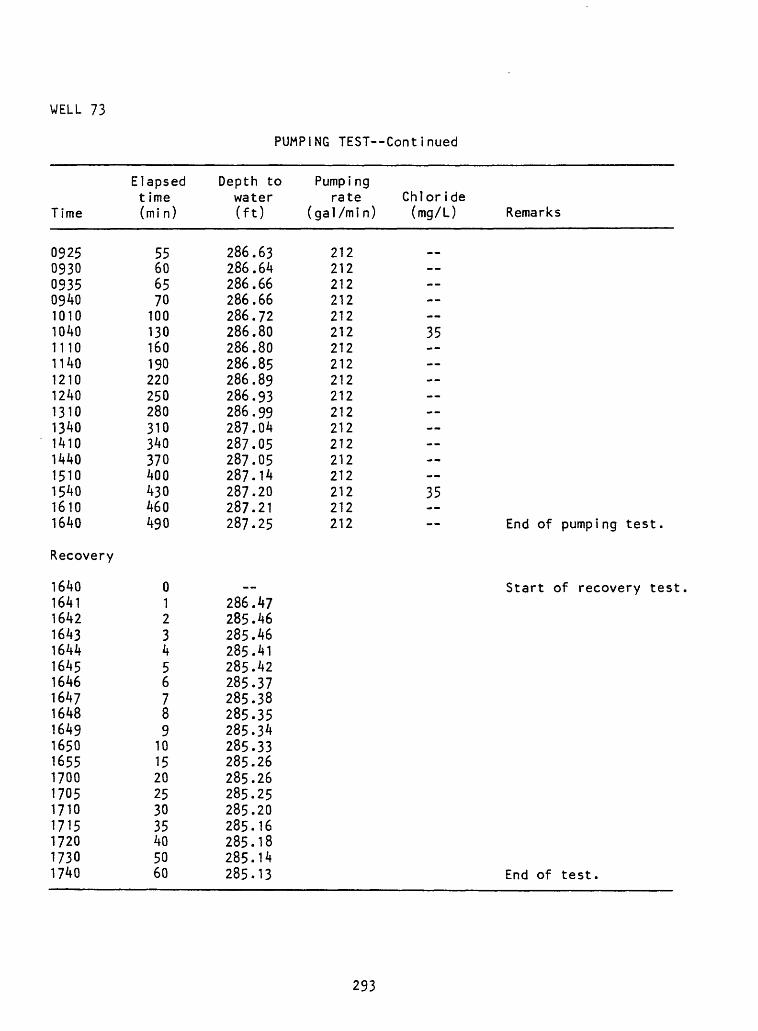
WELL 73
PUMPING TEST Continued
Time
092509300935094010101040111011401210124013101340141014401510154016101640
Recovery
1640164116421643164416451646164?16481649165016551700170517101715172017301740
Elapsed time (mi n)
55606570100130160190220250280310340370400430460490
0123456789
101520253035405060
Depth to water (ft)
286.63286.64286.66286.66286.72286.80286.80286.85286.89286.93286.99287.04287.05287.05287.14287.20287.21287.25
__286.47285.46285.46285.41285.42285.37285.38285.35285.34285.33285.26285.26285.25285.20285.16285.18285.14285.13
Pumpi ng rate Chloride
(gal/mi n) (mg/L) Remarks
212212212212212212 35212212212212212212212212212212 35212212 End of pumping test.
Start of recovery test
End of test.
293
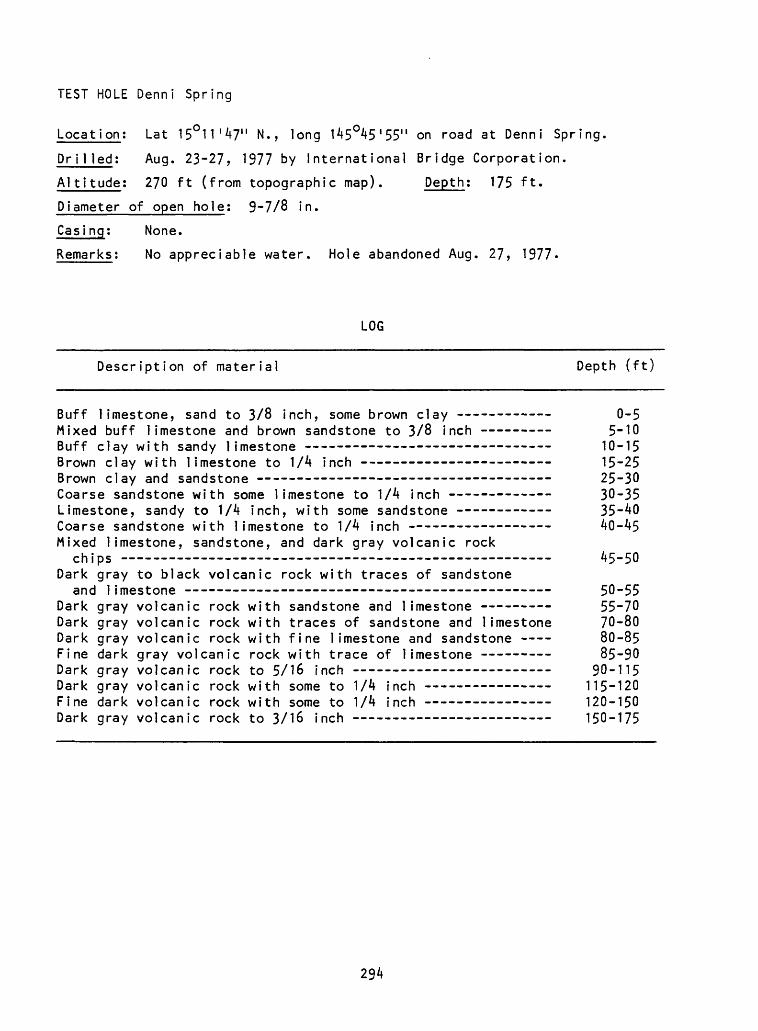
TEST HOLE Denni Spring
Location; Lat 15°11'47" N., long 145°45'55" on road at Denni Spring.
Dri1 led; Aug. 23-27, 1977 by International Bridge Corporation.
Altitude; 270 ft (from topographic map). Depth; 175 ft.
Diameter of open hole; 9-7/8 in.
Casing; None.
Remarks; No appreciable water. Hole abandoned Aug. 27, 1977.
LOG
Description of material Depth (ft)
Buff limestone, sand to 3/8 inch, some brown clay - 0-5Mixed buff limestone and brown sandstone to 3/8 inch - 5-10Buff clay with sandy limestone 10-15Brown clay with limestone to 1/4 inch - 15-25Brown clay and sandstone --- --- ------ ---- - ...... 25-30Coarse sandstone with some limestone to 1/4 inch -- 30-35Limestone, sandy to 1/4 inch, with some sandstone --- 35-40Coarse sandstone with limestone to 1/4 inch ------- -- - 40-45Mixed limestone, sandstone, and dark gray volcanic rock
chips - - - - 45-50Dark gray to black volcanic rock with traces of sandstone
and limestone - 50-55Dark gray volcanic rock with sandstone and limestone ------- 55-70
with traces of sandstone and limestone 70-80with fine limestone and sandstone -- 80-85rock with trace of limestone - - 85-90to 5/16 inch 90-115with some to 1/4 inch 115-120
rock with some to 1/4 inch 120-150rock to 3/16 inch 150-175
Dark Dark Fi ne Dark Dark Fine Dark
gray gray dark gray gray dark gray
volcanic rock volcanic rock gray volcanic volcanic rock volcanic rock volcan ic volcanic
294
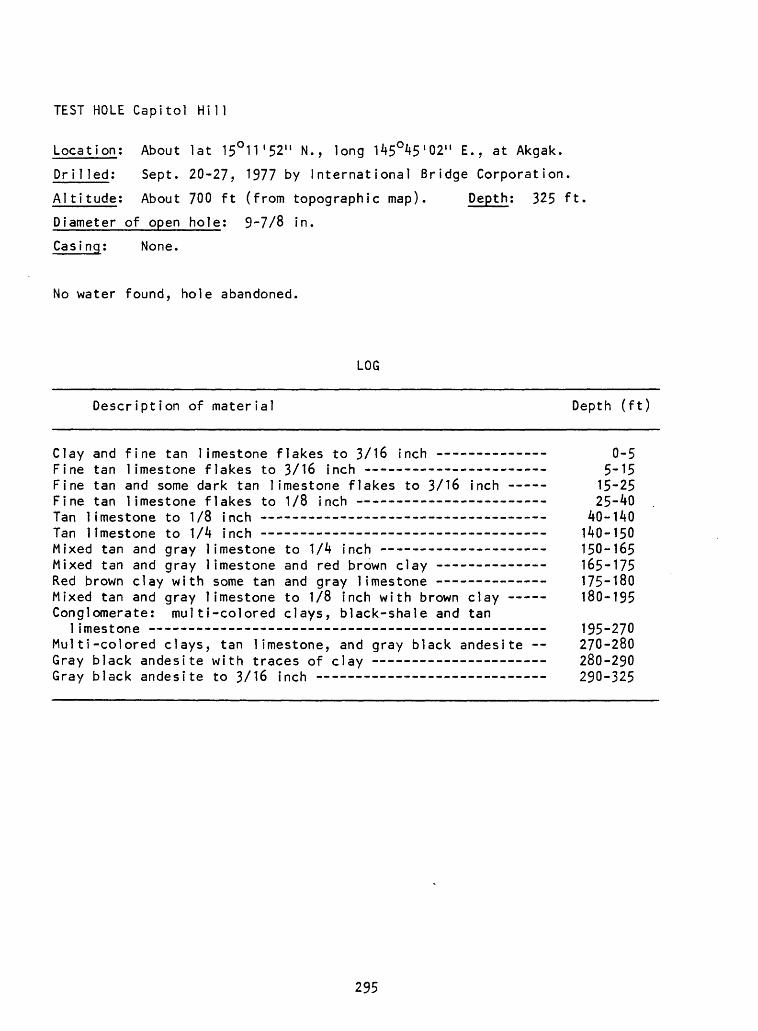
TEST HOLE Capitol Hill
Location; About lat 15°11'52" N., long 145°45'02" E., at Akgak.
Drilled; Sept. 20-27, 1977 by International Bridge Corporation.
Altitude; About 700 ft (from topographic map). Depth; 325 ft
Diameter of open hole; 9-7/8 in.
Casing; None.
No water found, hole abandoned.
LOG
Description of material Depth (ft)
Clay and fine tan limestone flakes to 3/16 inch ------------ Q-5Fine tan limestone flakes to 3/16 inch - - - - 5-15Fine tan and some dark tan limestone flakes to 3/16 inch --- 15-25Fine tan limestone flakes to 1/8 inch - - 25-40Tan limestone to 1/8 inch 40-140Tan limestone to 1/4 inch -- 140-150Mixed tan and gray limestone to 1/4 inch - - 150-165Mixed tan and gray limestone and red brown clay ---- ------ 165-175Red brown clay with some tan and gray limestone - - 175-180Mixed tan and gray limestone to 1/8 inch with brown clay - 180-195 Conglomerate; multi-colored clays, black-shale and tan
1 imestone - 195-270Multi-colored clays, tan limestone, and gray black andesite -- 270-280Gray black andesite with traces of clay 280-290Gray black andesite to 3/16 inch -- - 290-325
295
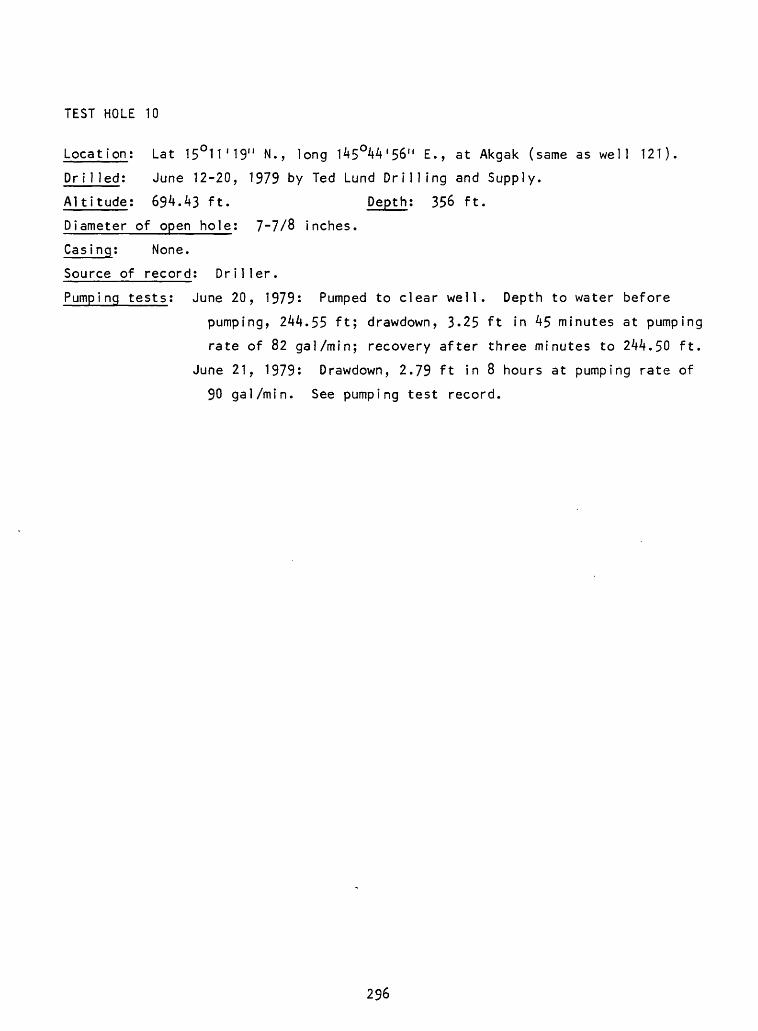
TEST HOLE 10
Location; Lat 15°11'19" N., long 145°44'56" E., at Akgak (same as well 121).
Dri1 led: June 12-20, 1979 by Ted Lund Drilling and Supply.
Altitude; 694.43 ft. Depth; 356 ft.
Diameter of open hole; 7-7/8 inches.
Casing; None.
Source of record; Driller.
Pumping tests; June 20, 1979: Pumped to clear well. Depth to water before
pumping, 244.55 ft; drawdown, 3-25 ft in 45 minutes at pumping
rate of 82 gal/min; recovery after three minutes to 244.50 ft.
June 21, 1979: Drawdown, 2.79 ft in 8 hours at pumping rate of
90 gal/min. See pumping test record.
296
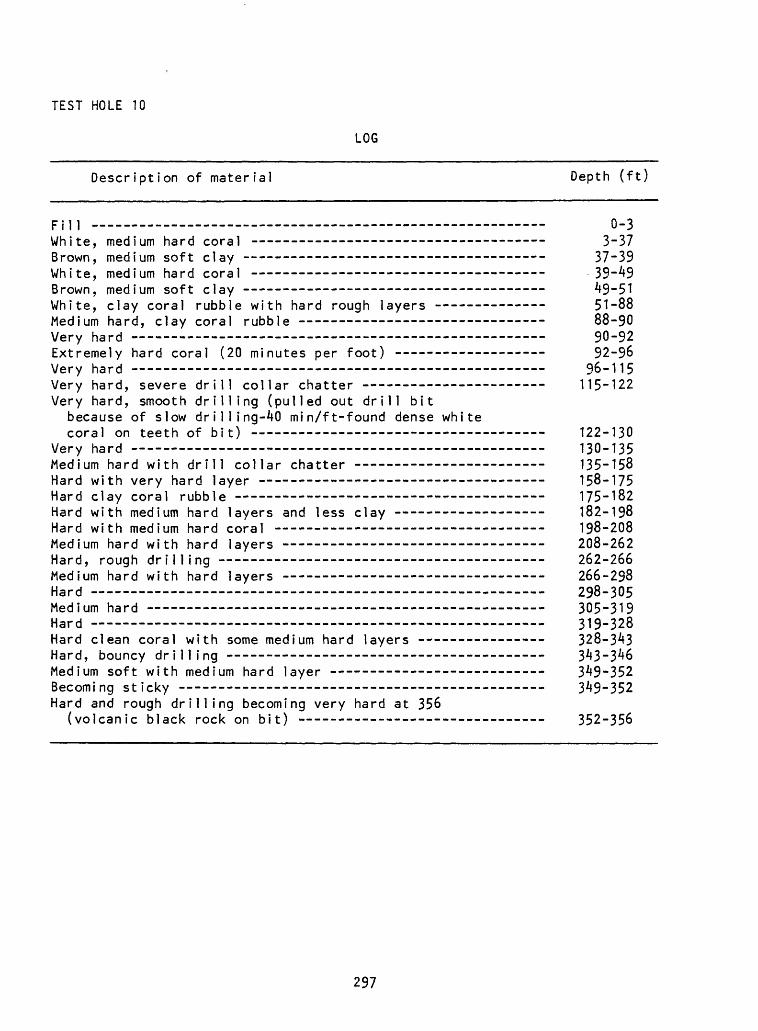
TEST HOLE 10
LOG
Description of material
Fill -White, medium hard coral ---------------------------------Brown, medium soft clay ----- ___-_-____---___-____ -_--White, medium hard coral ---------------------------------Brown, medium soft clay - - - -White, clay coral rubble with hard rough layers ------------Medium hard, clay coral rubble --- -------------- ------Very hard --------------------------------- --- -_-_ _-Extremely hard coral (20 minutes per foot) -----------------Very hard ------------------------------------------------Very hard, severe drill collar chatter ---------------------Very hard, smooth drilling (pulled out drill bit
because of slow drill ing-40 min/ft-found dense whitecoral on teeth of bit) -_-_----_-_---------------- ----
Very hard - - - - - ---Medium hard with drill collar chatter -------------- ----Hard with very hard layer -Hard clay coral rubble - --------- - -__-_---____ --_-Hard with medium hard layers and less clay ------ -----Hard with medium hard coral ---------- _________ _______Medium hard with hard layers - - - - -Hard, rough drilling - - - -Medium hard with hard layers -------------- _______ ___.Hard -Medium hard --------------------- _-__ ______--_ ___ .Hard -Hard clean coral with some medium hard layers --------------Hard, bouncy drilling - -- -- - -- -Medium soft with medium hard layer - -- -Becoming sticky - - - - -Hard and rough drilling becoming very hard at 356
(volcanic black rock on bit) ---------------------------
Depth (ft)
0-33.37
37-3939-49
-- 49-5151-8888-9090-9292-96
96-115115-122
122-130130-135135-158158-175175-182182-198198-208208-262262-266266-298298-305305-319319-328328-343343-346349-352349-352
352-356
297
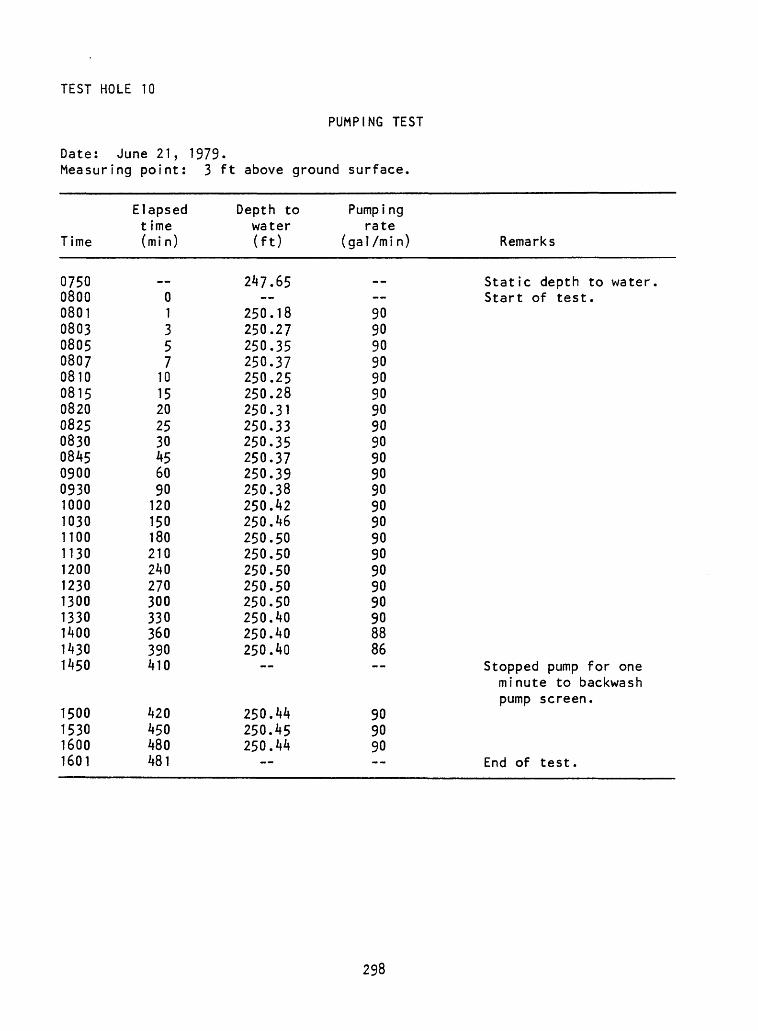
TEST HOLE 10
PUMPING TEST
Date: June 21, 1979.Measuring point: 3 ft above ground surface.
Time
0750080008010803080508070810081508200825083008450900093010001030110011301200123013001330140014301450
1500153016001601
Elapsed t ime (mi n)
__01357
1015202530456090120150180210240270300330360390410
420450480481
Depth to water (ft)
247.65
250.18250.27250.35250.37250.25250.28250.31250.33250.35250.37250.39250.38250.42250.46250.50250.50250.50250.50250.50250.40250.40250.40
250.44250.45250.44
Pumpi ng rate
(gal/min) Remarks
Static depth to water.Start of test.
90909090909090909090909090909090909090908886
Stopped pump for oneminute to backwashpump screen.
909090
End of test.
298
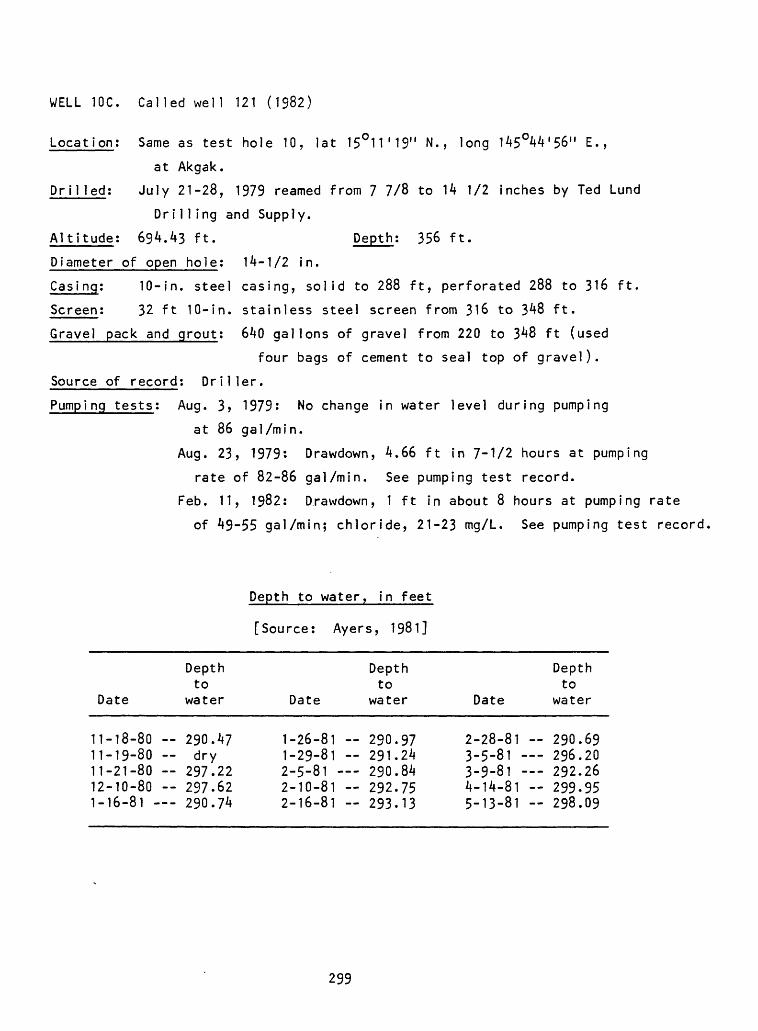
WELL 10C. Called well 121 (1982)
Location; Same as test hole 10, lat 15°1T19" N., long 145°44'56" E.,
at Akgak.
Drilled; July 21-28, 1979 reamed from 7 7/8 to 14 1/2 inches by Ted Lund
Drill ing and Supply.
Altitude; 694.43 ft. Depth; 356 ft.
Diameter of open hole; 14-1/2 in.
Casing; 10-in. steel casing, solid to 288 ft, perforated 288 to 316 ft.
Screen; 32 ft 10-in. stainless steel screen from 316 to 348 ft.
Gravel pack and grout; 640 gallons of gravel from 220 to 348 ft (used
four bags of cement to seal top of gravel).
Source of record; Driller.
Pumping tests; Aug. 3, 1979: No change in water level during pumping
at 86 gal/min.
Aug. 23, 1979: Drawdown, 4.66 ft in 7-1/2 hours at pumping
rate of 82-86 gal/min. See pumping test record.
Feb. 11, 1982; Drawdown, 1 ft in about 8 hours at pumping rate
of 49-55 gal/min; chloride, 21-23 mg/L. See pumping test record,
Depth to water, in feet
[Source: Ayers, 1981]
Depth Depthto to
Date water Date water
Depthto
Date water
11-18-80 290.47 1-26-81 290.97 2-28-81 290.6911-19-80 dry 1-29-81 291.24 3-5-81 296.2011-21-80 297.22 2-5-81 290.84 3-9-81 292.2612-10-80 297-62 2-10-81 292.75 4-14-81 299-951-16-81 290.74 2-16-81 293.13 5-13-81 298.09
299
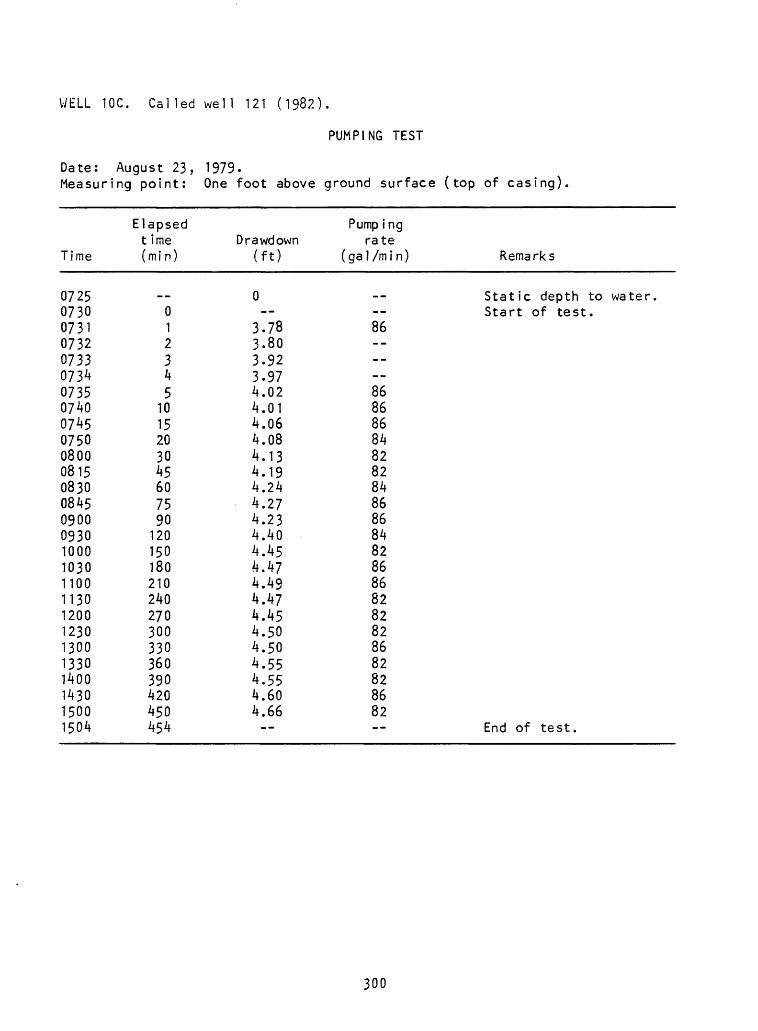
WELL 10C. Called well 121 (1982).
PUMPING TEST
Date: August 23, 1979-Measuring point: One foot above ground surface (top of casing)
Time
0725073007310732073307340735074007450750080008150830084509000930100010301100113012001230130013301400143015001504
Elapsed t ime (min)
_ _012345
1015203045607590120150180210240270300330360390420450454
Drawdown (ft)
0
3.783.803.923.974.024.014.064.084.134.194.244.274.234.404.454.474.494.474.454.504.504.554.554.604.66--
Pump ing rate
(gal /min) Remarks
Static depth to water.Start of test.
86 --868686848282848686848286868282828682828682
End of test.
300
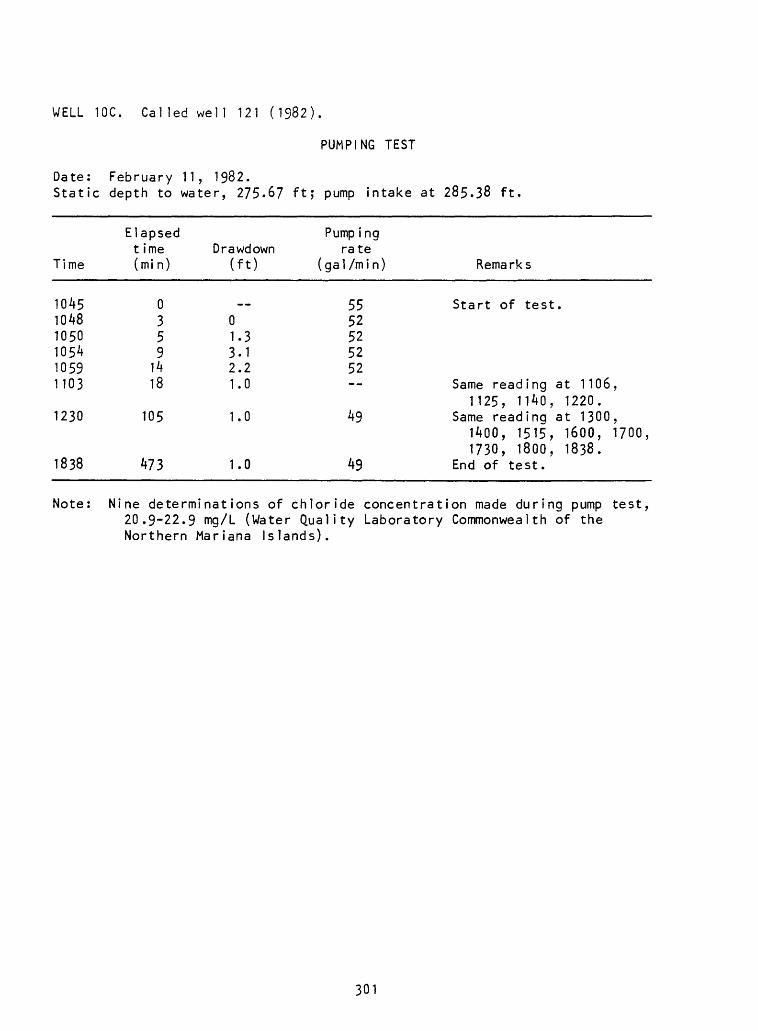
WELL 10C. Called well 121 (1982).
PUMPING TEST
Date: February 11, 1982.Static depth to water, 275.6? ft; pump intake at 285.38 ft
Time
Elapsed t ime (mi n)
Drawdown (ft)
Pump ingrate
(ga1/m i n) Remarks
104510481050105410591103
1230
1838
0359
1418
105
473
01.33.12.21.0
1.0
1.0
5552525252
49
49
Start of test
Same reading at 1106, 1125, 1140, 1220.
Same reading at 1300, 1400, 1515, 1600, 1700, 1730, 1800, 1838.
End of test.
Note: Nine determinations of chloride concentration made during pump test, 20.9-22.9 mg/L (Water Quality Laboratory Commonwealth of the Northern Mariana Islands).
301
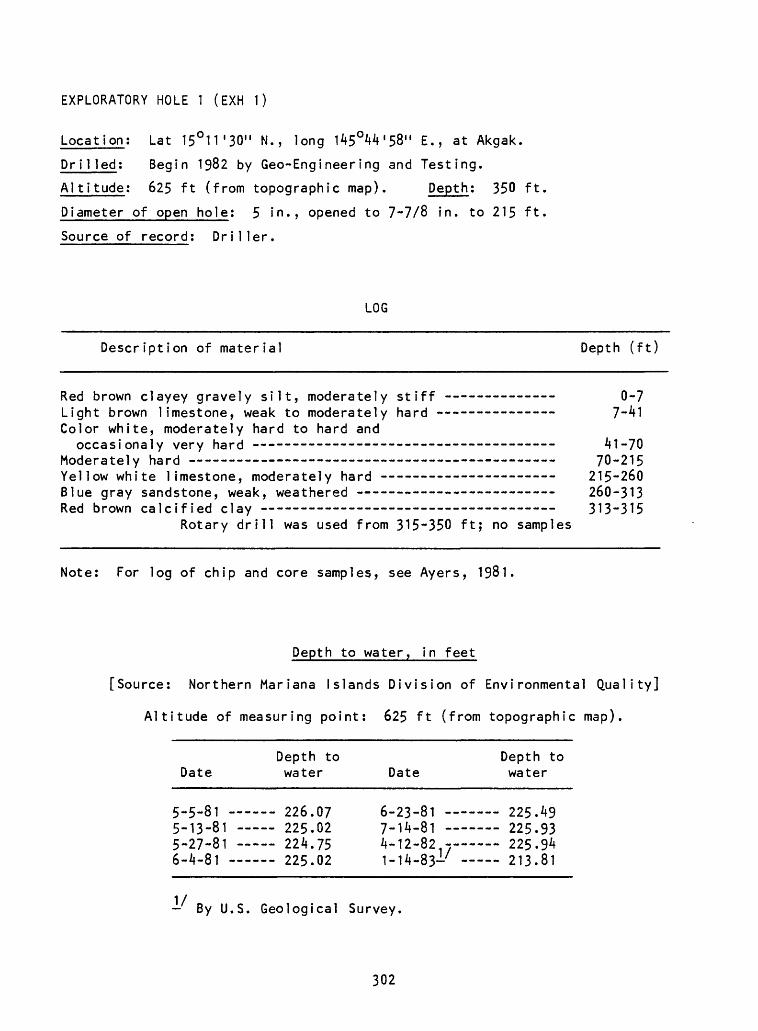
EXPLORATORY HOLE 1 (EXH 1)
Location; Lat 15°11'30" N., long 145°44'58" E., at Akgak.
Dr11 led; Begin 1982 by Geo-Engineering and Testing.
Altitude; 625 ft (from topographic map). Depth; 350 ft.
Diameter of open hole; 5 in., opened to 7-7/8 in. to 215 ft.
Source of record; Driller.
LOG
Description of material Depth (ft)
Red brown clayey gravely silt, moderately stiff -------------- 0-7Light brown limestone, weak to moderately hard ------- ---- 7-41Color white, moderately hard to hard and
occasionaly very hard -------- - ----------------------- 41-70Moderately hard 70-215 Yellow white limestone, moderately hard - - - 215-260 Blue gray sandstone, weak, weathered - - - 260-313Red brown calcified clay - ---- ---- -------------- -- 313-315
Rotary drill was used from 315-350 ft; no samples
Note; For log of chip and core samples, see Ayers, 1981.
Depth to water, in feet
[Source; Northern Mariana Islands Division of Environmental Quality]
Altitude of measuring point; 625 ft (from topographic map).
Date
5 c Q 1-5-01 -
5-13-81 -5 07 fl 1-Z/-OI
6-4-81
Depth to water
oo£ m 225.02 __ OO/i JC--- £.£.1 . /;>
225.02
Date
6 00 Q 1
7-14-81 /, 10 Q oH- IZ-OZ. -.-"
^
Depth to water
225.49 - 225.93
0 1 1 Q 1
By U.S. Geological Survey.
302
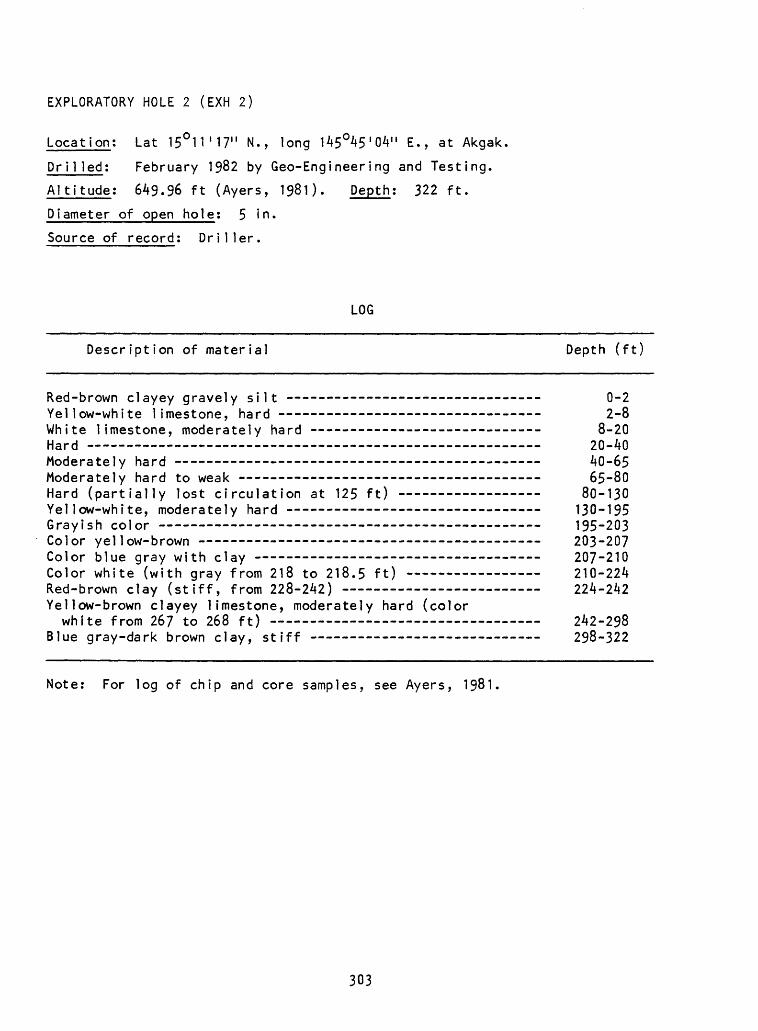
EXPLORATORY HOLE 2 (EXH 2)
Location: Lat 15°11'17" N., long 145°45'04" E., at Akgak,
Dr i1 led; February 1982 by Geo-Engineering and Testing.
Altitude; 649.96 ft (Ayers, 1981). Depth; 322 ft.
Diameter of open hole; 5 in.
Source of record; Driller.
LOG
Description of material Depth (ft)
Red-brown clayey gravely silt - 0-2Yellow-white limestone, hard - -- - -- --- 2-8White limestone, moderately hard - 8-20Hard 20-40Moderately hard 40-65Moderately hard to weak 65-80Hard (partially lost circulation at 125 ft) - 80-130Yellow-white, moderately hard 130-195Grayish color 195-203Color yellow-brown 203-207Color blue gray with clay 207-210Color white (with gray from 218 to 218.5 ft) 210-224Red-brown clay (stiff, from 228-242) 224-242 Yellow-brown clayey limestone, moderately hard (colorwhite from 267 to 268 ft) 242-298
Blue gray-dark brown clay, stiff 298-322
Note; For log of chip and core samples, see Ayers, 1981.
303
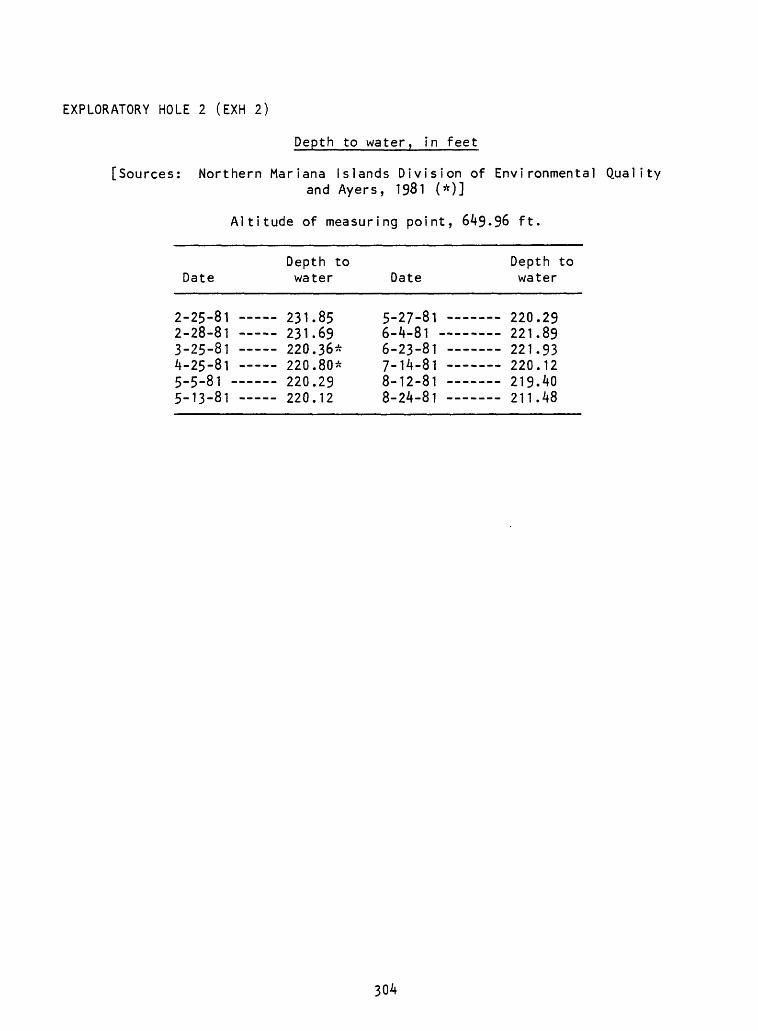
EXPLORATORY HOLE 2 (EXH 2)
Depth to water, in feet
[Sources: Northern Mariana Islands Division of Environmental Qualityand Ayers, 1981 (*)]
Altitude of measuring point, 649.96 ft.
DateDepth to water Date
Depth to water
2-25-81 231.85 5-27-81 220.292-28-81 231.69 6-4-81 221.893-25-81 220.36* 6-23-81 221.934-25-81 220.80* 7-14-81 220.125-5-81 220.29 8-12-81 219.405-13-81 220.12 8-24-81 211.48
304
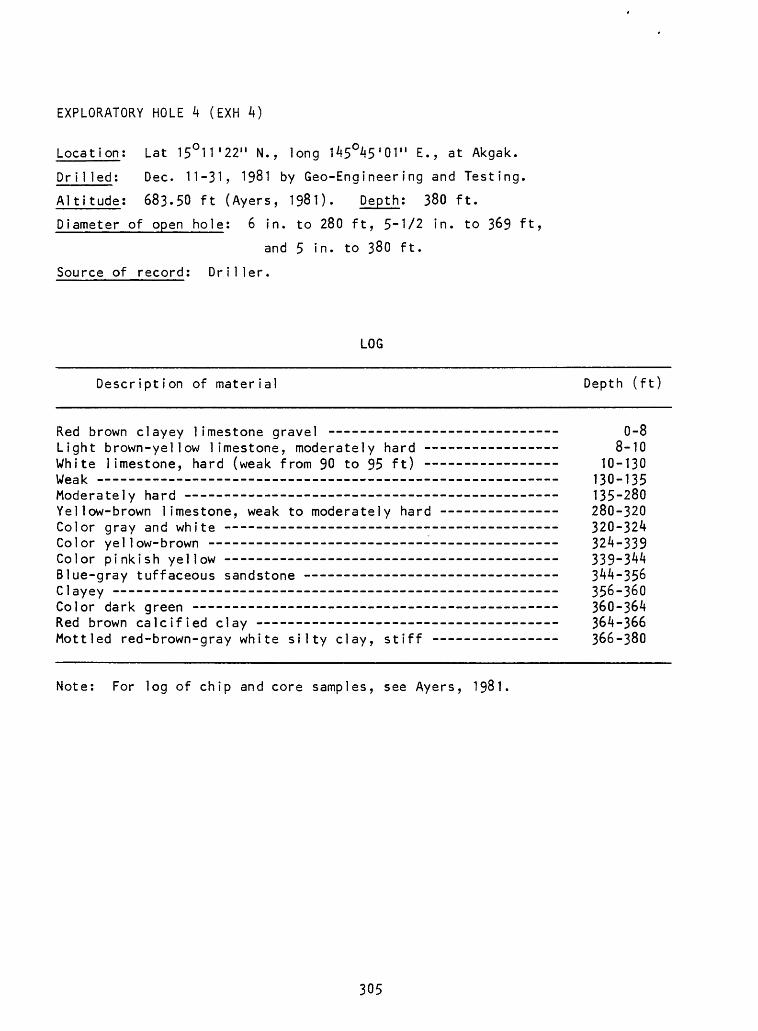
EXPLORATORY HOLE 4 (EXH 4)
Location; Lat 15°11 I 22" N., long 145°45'01" E., at Akgak.
Dr i1 led: Dec. 11-31? 1981 by Geo-Engineering and Testing.
Altitude: 683.50 ft (Ayers, 1981). Depth: 380 ft.
Diameter of open hole: 6 in. to 280 ft, 5-1/2 in. to 369 ft,
and 5 in. to 380 ft.
Source of record: Driller.
LOG
Description of material Depth (ft)
Red brown clayey limestone gravel ------- ______________ __ Q-8Light brown-yellow limestone, moderately hard - ________ __ 8-10White limestone, hard (weak from 90 to 95 ft) 10-130Weak 130-135Moderately hard 135-280Yellow-brown limestone, weak to moderately hard ---- ------- 280-320Color gray and white 320-324Color yellow-brown - 324-339Color pinkish yellow -- -- 339-344Blue-gray tuffaceous sandstone 344-356Clayey 356-360Color dark green 360-364Red brown calcified clay 364-366Mottled red-brown-gray white silty clay, stiff 366-380
Note: For log of chip and core samples, see Ayers, 1981.
305
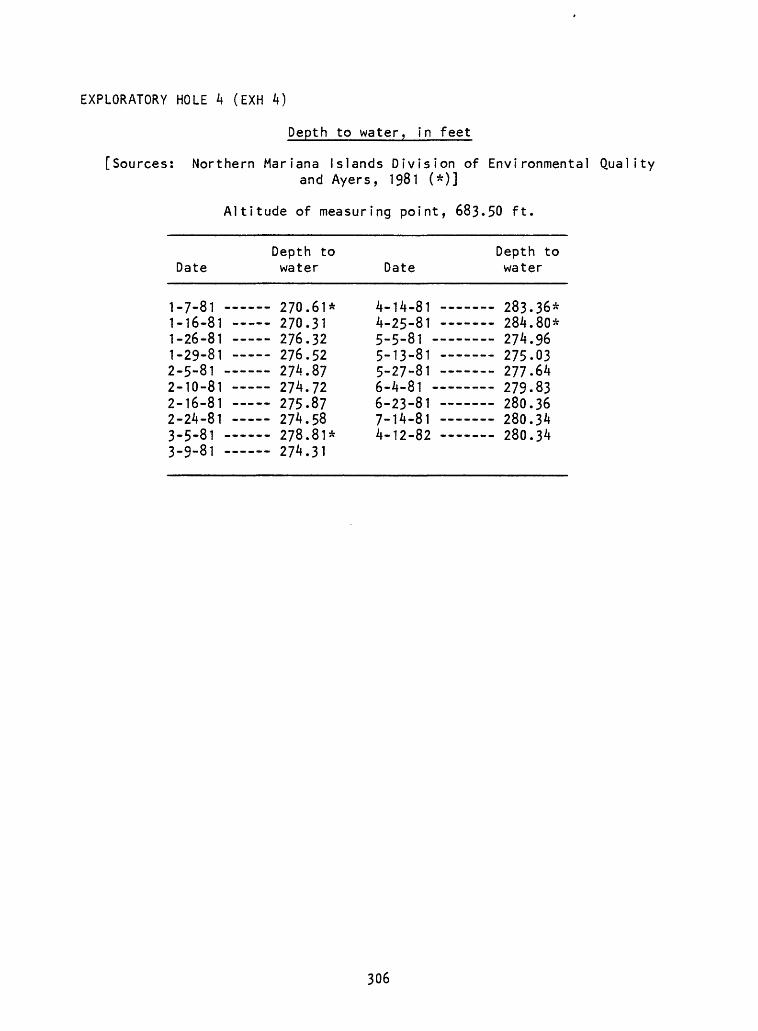
EXPLORATORY HOLE 4 (EXH 4)
Depth to water, In feet
[Sources: Northern Mariana Islands Division of Environmental Qualityand Ayers, 1981 (*)]
Altitude of measuring point, 683.50 ft.
Depth to Depth to Date water Date water
1-7-81 270.61* 4-14-81 283.36*1-16-81 270.31 4-25-81 284.80*1-26-81 276.32 5-5-81 274.961-29-81 276.52 5-13-81 275.032-5-81 274.87 5-27-81 277.642-10-81 274.72 6-4-81 279.832-16-81 275.87 6-23-81 280.362-24-81 274.58 7-14-81 280.343.5-81 278.81* 4-12-82 280.343-9-81 274.31
306
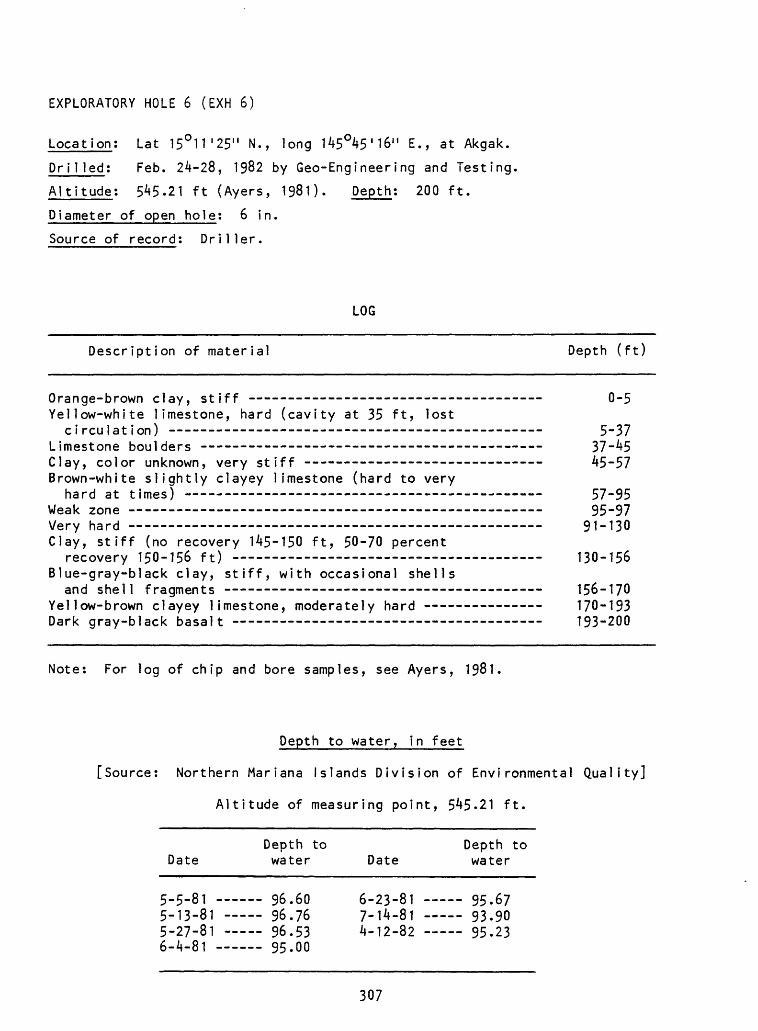
EXPLORATORY HOLE 6 (EXH 6)
Location; Lat 15°11'25" N., long 145°45'16" E., at Akgak.
DriI led; Feb. 24-28, 1982 by Geo-Engineering and Testing.
Altitude; 545.21 ft (Ayers, 1981). Depth; 200 ft.
Diameter of open hole; 6 in.
Source of record; Driller.
LOG
Description of material Depth (ft)
Orange-brown clay, stiff ---- - _---___-__--__ __-_ 0-5 Yellow-white limestone, hard (cavity at 35 ft, lost
ci rculat ion) ------------------------------------- - - 5-37Limestone boulders 37-45Clay, color unknown, very stiff -- --- - --------- --_- 45-57Brown-white slightly clayey limestone (hard to very
hard at times) 57-95 Weak zone -- 95-97 Very hard 91-130 Clay, stiff (no recovery 145-150 ft, 50-70 percent
recovery 150-156 ft) 130-156 Blue-gray-black clay, stiff, with occasional shells
and shell fragments 156-170Yellow-brown clayey limestone, moderately hard - 170-193 Dark gray-black basalt 193-200
Note: For log of chip and bore samples, see Ayers, 1981.
Depth to water, in feet
[Source; Northern Mariana Islands Division of Environmental Quality]
Altitude of measuring point, 545.21 ft.
Date
5 r Q 1-5-8! - 5-13-81 -5 f)-i Q )-2/-01 A-Zi-fli
Depth to water
96.60 96.76 96.53 _ QC nn
Date
6 0^ Q 1-23-0! --
7-14-81 It 10 Q o^f-lZ-OZ --
Depth to water
95.67--- Q7 onyj.yv--- QC 0 7y?»o
307
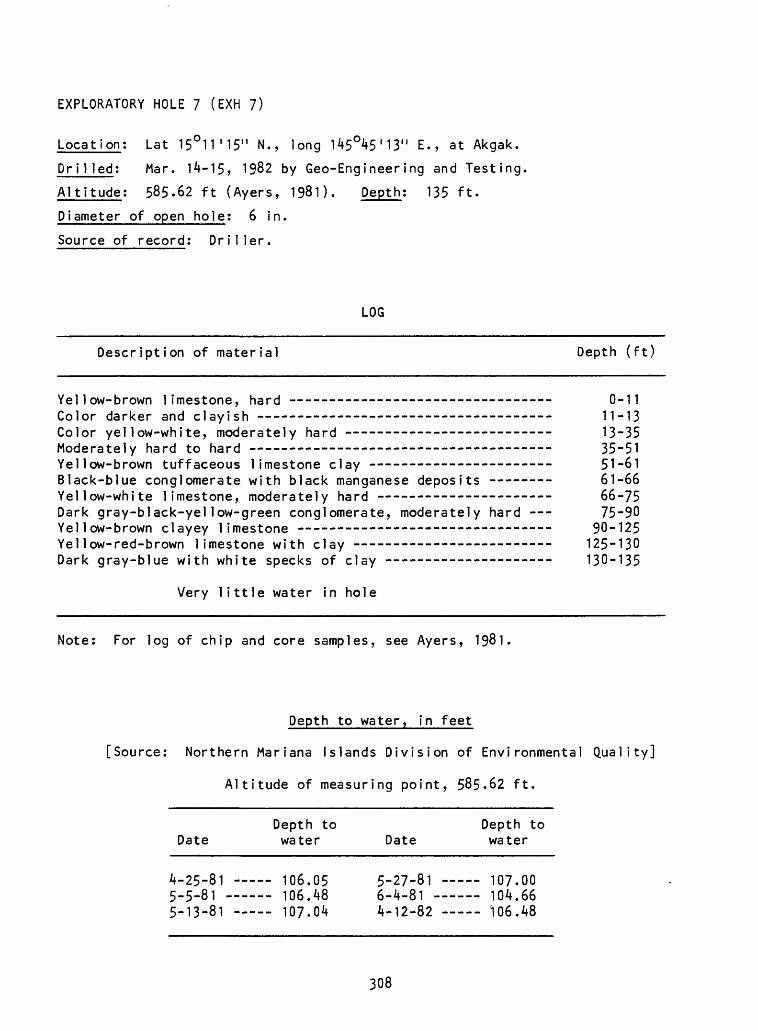
EXPLORATORY HOLE 7 (EXH 7)
Location; Lat 15 O 11'15" N., long 145°45'13" E., at Akgak.
Dri1 led; Mar. 14-15, 1982 by Geo-Engineering and Testing.
Altitude; 585.62 ft (Ayers, 1981). Depth; 135 ft.
Diameter of open hole; 6 in.
Source of record: Driller.
LOG
Description of material Depth (ft)
Yellow-brown limestone, hard ------- __-___- _-__ »»_»_-_ 0-11Color darker and clayish ---- _»_»_____»___ ____»__» 11-13Color yellow-white, moderately hard ------ _-__---________ 13-35Moderately hard to hard - - 35-51Yellow-brown tuffaceous limestone clay - 51-61Black-blue conglomerate with black manganese deposits -- ---- 61-66Yellow-white limestone, moderately hard - - 66-75Dark gray-black-yellow-green conglomerate, moderately hard - 75-90Yellow-brown clayey limestone - - - 90-125Ye 1 low-red-brown limestone with clay ------------- »__-____ 125-130Dark gray-blue with white specks of clay ------------------- 130-135
Very little water in hole
Note; For log of chip and core samples, see Ayers, 1981.
Depth to water, in feet
[Source: Northern Mariana Islands Division of Environmental Quality]
Altitude of measuring point, 585.62 ft.
Depth to Depth to Date water Date water
4-25-81 106.05 5-27-81 107.005_5_81 106.48 6-4-81 104.665-13-81 107.04 4-12-82 106.48
308
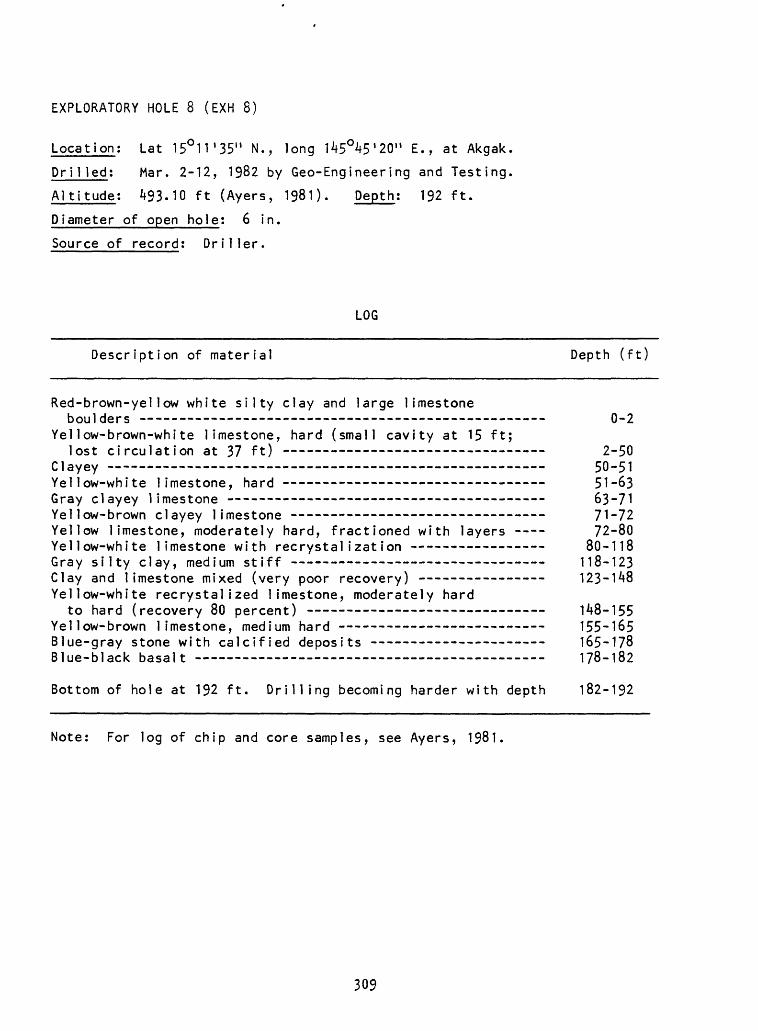
EXPLORATORY HOLE 8 (EXH 8)
Location; Lat 15°11'35" N., long 145°45'20" E., at Akgak.
Dri1 led; Mar. 2-12, 1982 by Geo-Engineering and Testing.
Altitude; 493-10 ft (Ayers, 1981). Depth; 192 ft.
Diameter of open hole; 6 in.
Source of record; Driller.
LOG
Description of material Depth (ft
Red-brown-yellow white silty clay and large limestoneboulders -- 0-2
Yellow-brown-white limestone, hard (small cavity at 15 ft;lost circulation at 37 ft) 2-50
Clayey 50-51 Yellow-white limestone, hard - - 51-63Gray clayey limestone ---------- ___- _ ___ _ __ ___ 63-71Yellow-brown clayey limestone - - - 71-72Yellow limestone, moderately hard, fractioned with layers - 72-80 Yellow-white limestone with recrystal izat ion 80-118Gray silty clay, medium stiff - 118-123Clay and limestone mixed (very poor recovery) -------- - - 123-148Yellow-white recrystalized limestone, moderately hard
to hard (recovery 80 percent) - 148-155Yellow-brown limestone, medium hard 155-165Blue-gray stone with calcified deposits - -- - - 165-178 Blue-black basalt 178-182
Bottom of hole at 192 ft. Drilling becoming harder with depth 182-192
Note; For log of chip and core samples, see Ayers, 1981.
309
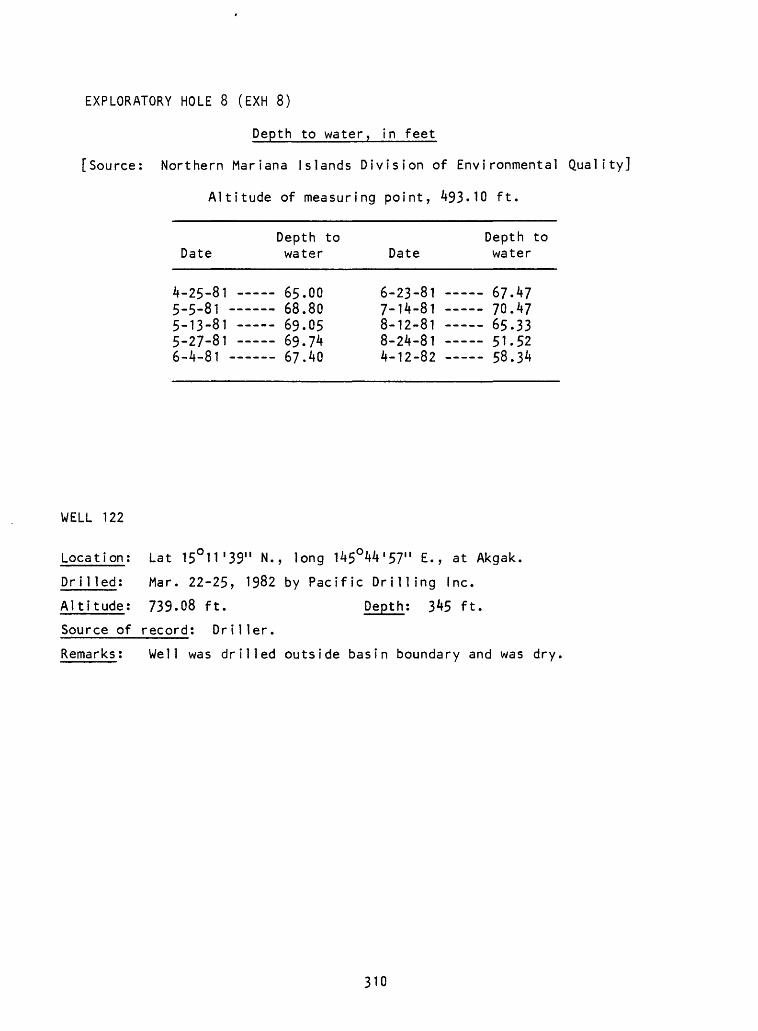
EXPLORATORY HOLE 8 (EXH 8)
Depth to water, in feet
[Source: Northern Mariana Islands Division of Environmental Quality]
Altitude of measuring point, 493.10 ft.
DateDepth to water Date
Depth to water
4-25-81 65.005-5-81 68.805-13-81 69.055-27-81 69.746-4-81 67.40
6-23-81 67.477-14-81 70.478-12-81 65.33 8-24-81 51.52 4-12-82 58.34
WELL 122
Location; Lat 15°n'39" N., long 145°44'57" E., at Akgak.
Drilled; Mar. 22-25, 1982 by Pacific Drilling Inc.
Altitude; 739.08 ft. Depth; 345 ft.
Source of record; Driller.
Remarks; Well was drilled outside basin boundary and was dry,
310
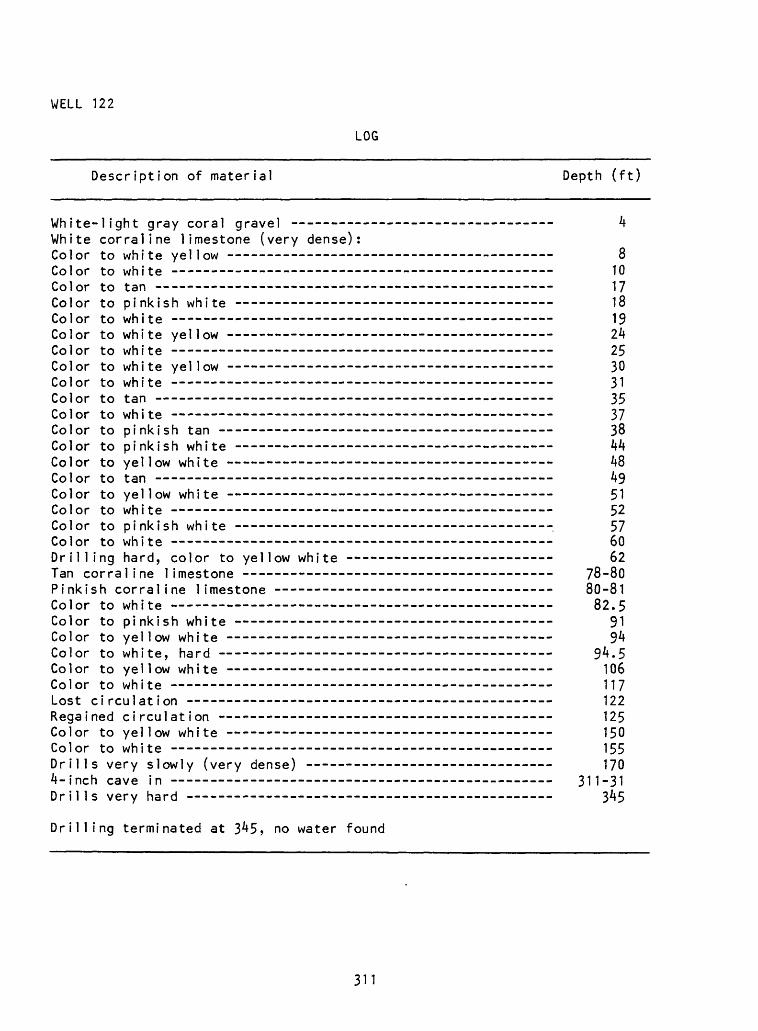
WELL 122
LOG
Description of material Depth (ft)
White-light gray coral gravel --- ___________ ___________ /fWhite corral ine limestone (very dense):Color to white yellow ------ ____-__- ____________________ 8Color to white -- -- -- 10Color to tan - - 17Color to pinkish white ------------ ______ __-.- ____ ___ 18Color to white 19Color to white yellow 2kColor to white -- 25Color to white yellow ------- _-___ ______________________ 30Color to white - - - -- - 31Color to tan ---------- ____ _______ __________ _________ 35Color to white --- - ________ ___ __. __-__-_ __ _____ 37Color to pinkish tan _______ _ __- _-_______._.. ___ __ 38Color to pinkish white -- - 44Color to yellow white - 48Color to tan 49Color to yellow white ------ ___________________ _ _ ____ 51Color to white -- - _______ _ ___.___-_-__ -__ 52Color to pinkish white ------------------------ ________ __ 57Color to white --------- _______________ ___. __ $QDrilling hard, color to yellow white - - 62Tan corral ine limestone -- - ------ ______ -_»-____________ 78-80Pinkish corral ine limestone 80-81Color to white ----- 82.5Color to pinkish white 91Color to yellow white - - 94Color to white, hard 94.5Color to yellow white -- --------- _____________ __.__ 106Color to white 117Lost circulation - 122Regained circulation - - 125Color to yellow white - - - - 150Color to white - ------------------ ____________ ______ 155Drills very slowly (very dense) - - - - 1704-inch cave in - -- 311-31Drills very hard 345
Drilling terminated at 345, no water found
311
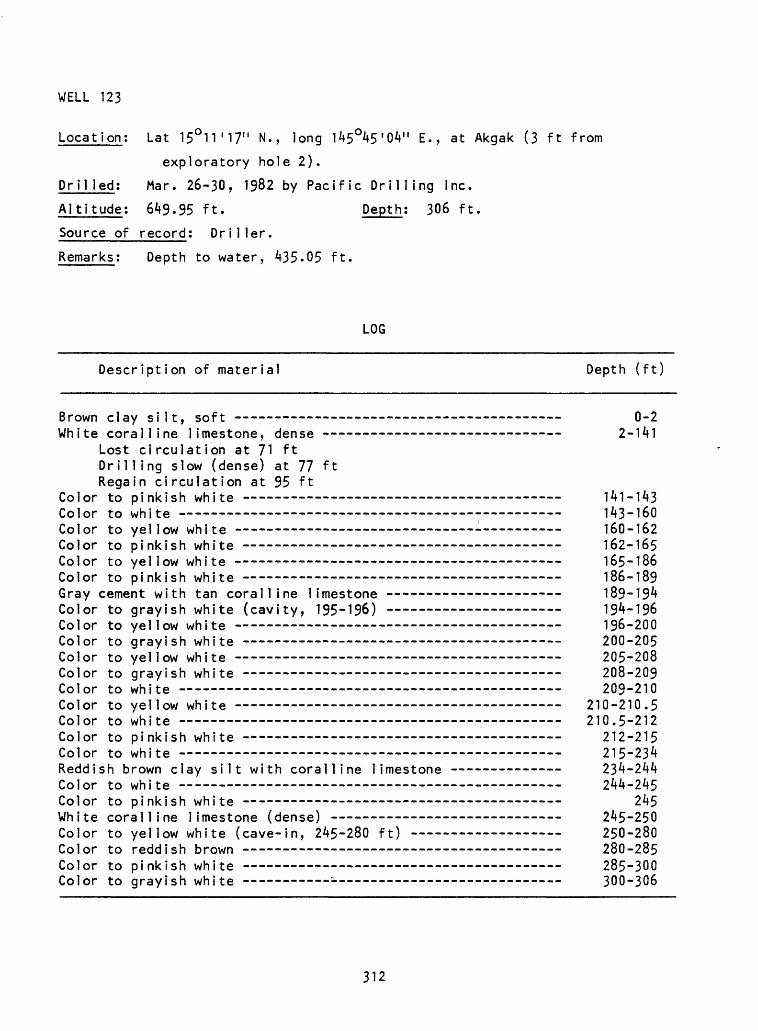
WELL 123
Location; Lat 15°11'17" N., long 145O45'OV' E., at Akgak (3 ft from
exploratory hole 2).
Drilled: Mar. 26-30, 1982 by Pacific Drilling Inc.
Altitude: 6^9.95 ft. Depth; 306 ft.
Source of record; Driller.
Remarks; Depth to water, 435.05 ft.
LOG
Description of material Depth (ft)
Brown clay silt, soft 0-2White coralline limestone, dense 2-141
Lost circulation at 71 ftDrilling slow (dense) at 77 ftRegain circulation at 95 ft
Color to pinkish white 141-143Color to white 1^3-160Color to yellow white - 160-162Color to pinkish white 162-165Color to yellow white 165-186Color to pinkish white 186-189Gray cement with tan coralline limestone 189-194Color to grayish white (cavity, 195-196) 194-196Color to yellow white 196-200Color to grayish white 200-205Color to yellow white 205-208Color to grayish white 208-209Color to white 209-210Color to yellow white 210-210.5Color to white 210.5-212Color to pinkish white 212-215Color to white 215-234Reddish brown clay silt with coralline limestone 234-244Color to white ~ 244-245Color to pinkish white 245White coralline limestone (dense) 245-250Color to yellow white (cave-in, 245-280 ft) 250-280Color to reddish brown 280-285Color to pinkish white 285-300Color to grayish white ' 300-306
312
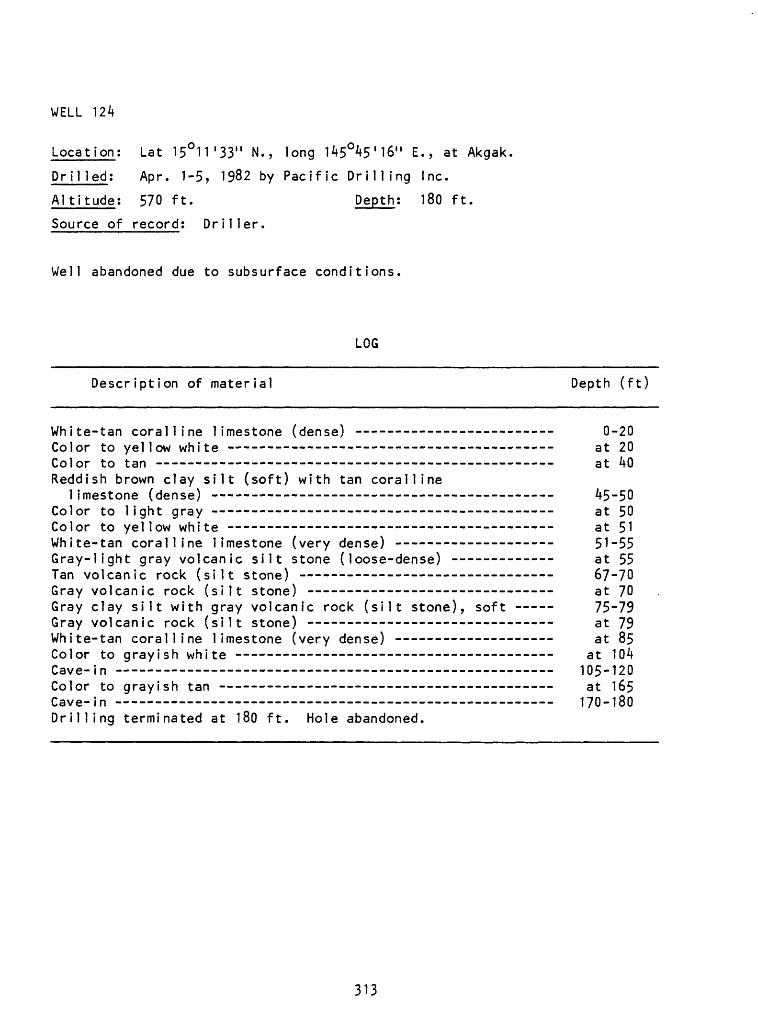
WELL 124
Location; Lat 15°11'33" N., long 145O45'16" E., at Akgak,
Dril led: Apr. 1-5, 1982 by Pacific Drilling Inc.
Altitude; 570 ft. Depth; 180 ft.
Source of record; Driller.
Well abandoned due to subsurface conditions.
LOG
Description of material Depth (ft)
White-tan coralline limestone (dense) ----------------------- 0-20Color to yellow white ------ --- _-_--_-_ _____ _____ __ a t 20Color to tan _--_ __- ______________________ ____ a t 49Reddish brown clay silt (soft) with tan coralline
limestone (dense) - - - 45-50Color to light gray - -- --------------- --_-___ ___ -__ a t 50Color to yellow white - - -- at 51White-tan coralline limestone (very dense) -- -- ----------- 51-55Gray-light gray volcanic silt stone (loose-dense) - - at 55Tan volcanic rock (silt stone) - - - - - 67-70Gray volcanic rock (silt stone) - - - at 70Gray clay silt with gray volcanic rock (silt stone), soft 75-79Gray volcanic rock (silt stone) - - at 79White-tan coralline limestone (very dense) ------ --- --_--_- a t 85Color to grayish white - - at 104Cave-in 105-120Color to grayish tan - - - at 165Cave-in 170-180 Drilling terminated at 180 ft. Hole abandoned.
313
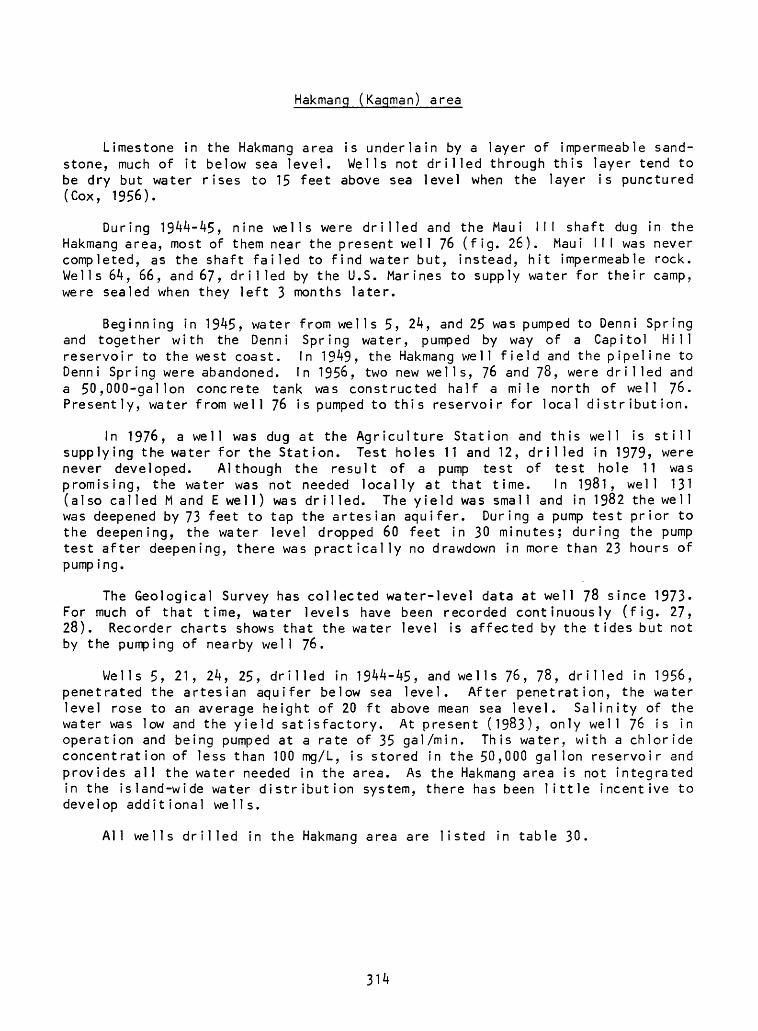
Hakmanq (Kaqman) area
Limestone in the Hakmang area is underlain by a layer of impermeable sand stone, much of it below sea level. Wells not drilled through this layer tend to be dry but water rises to 15 feet above sea level when the layer is punctured (Cox, 1956).
During 1944-45, nine wells were drilled and the Maui III shaft dug in the Hakmang area, most of them near the present well 76 (fig. 26). Maui III was never completed, as the shaft failed to find water but, instead, hit impermeable rock. Wells 64, 66, and 67, drilled by the U.S. Marines to supply water for their camp, were sealed when they left 3 months later.
Beginning in 1945, water from wells 5, 24, and 25 was pumped to Denni Spring and together with the Denni Spring water, pumped by way of a Capitol Hill reservoir to the west coast. In 1949, the Hakmang well field and the pipeline to Denni Spring were abandoned. In 1956, two new wells, 76 and 78, were drilled and a 50,000-gal Ion concrete tank was constructed half a mile north of well 76. Presently, water from well 76 is pumped to this reservoir for local distribution.
In 1976, a well was dug at the Agriculture Station and this well is still supplying the water for the Station. Test holes 11 and 12, drilled in 1979? were never developed. Although the result of a pump test of test hole 11 was promising, the water was not needed locally at that time. In 1981, well 131 (also cal led M and E wel 1) was dr i 1 led. The yield was smal 1 and in 1982 the wel 1 was deepened by 73 feet to tap the artesian aquifer. During a pump test prior to the deepening, the water level dropped 60 feet in 30 minutes; during the pump test after deepening, there was practically no drawdown in more than 23 hours of pump ing.
The Geological Survey has collected water-level data at well 78 since 1973. For much of that time, water levels have been recorded continuously (fig. 27, 28). Recorder charts shows that the water level is affected by the tides but not by the pumping of nearby well 76.
Wells 5, 21, 24, 25, drilled in 1944-45, and wells 76, 78, drilled in 1956, penetrated the artesian aquifer below sea level. After penetration, the water level rose to an average height of 20 ft above mean sea level. Salinity of the water was low and the yield satisfactory. At present (1983), only well 76 is in operation and being pumped at a rate of 35 gal/min. This water, with a chloride concentration of less than 100 mg/L, is stored in the 50,000 gallon reservoir and provides all the water needed in the area. As the Hakmang area is not integrated in the island-wide water distribution system, there has been little incentive to develop additional wells.
All wells drilled in the Hakmang area are listed in table 30.
314
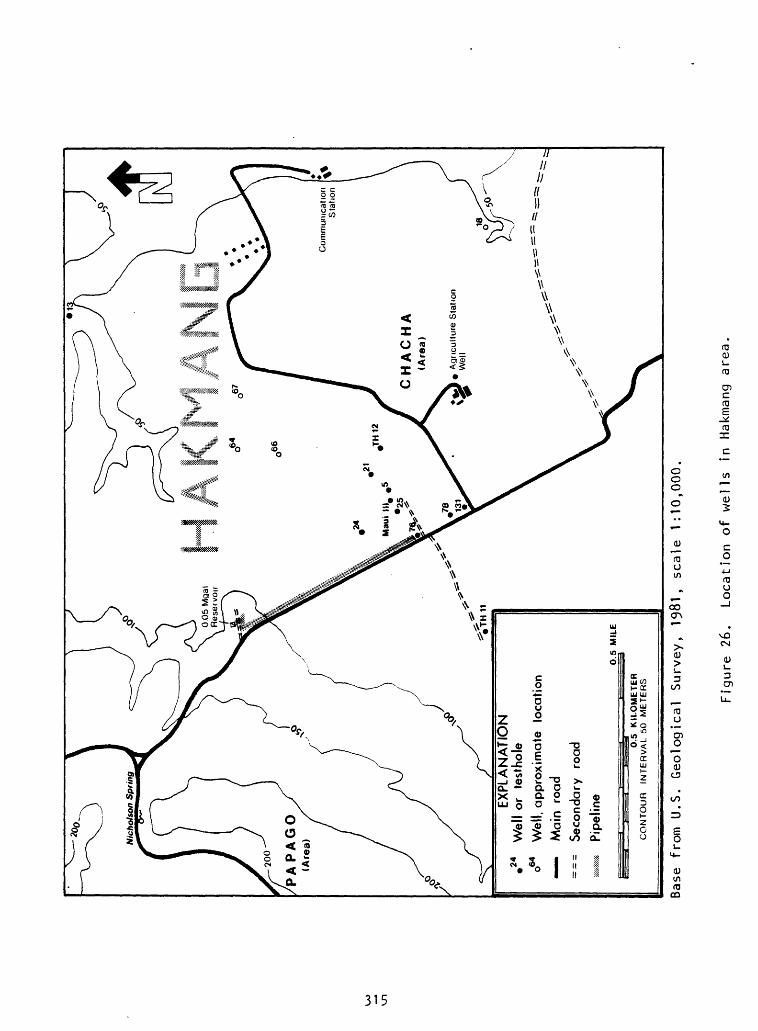
PA
PA
GO
(Are
a)
CH
AC
HA
(Are
a)
* A
gricu
lture
Sta
tion
EX
PLA
NA
TIO
N 2
4 W
ell
or
test
hole
o64
We
ll, a
ppro
xim
ate
lo
catio
n
Ma
in
road
= =
= S
eco
ndary
ro
ad
Pip
elin
e
0.5
K
ILO
ME
TE
RC
ON
TO
UR
IN
TE
RV
AL 50
ME
TE
RS
Base
fr
om U.S. Geological Survey,
1981
, sc
ale
1:10
,000
.
Figu
re 26
. Location of we
lls
in Hakmang
area
.
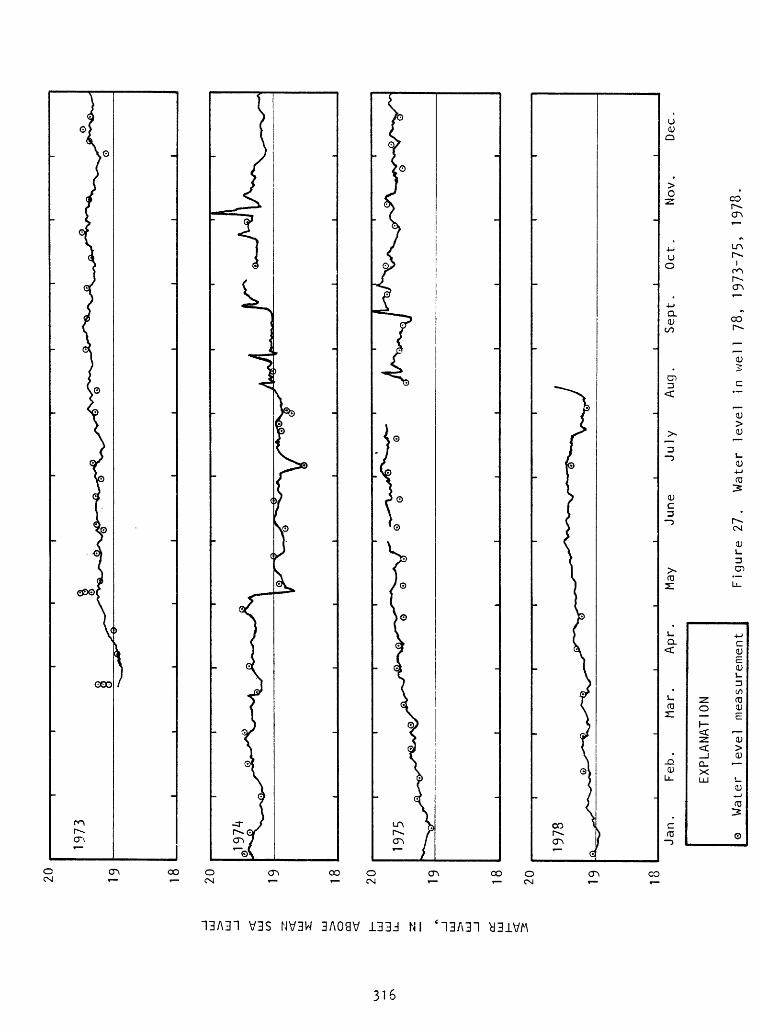
20
1973
19
ON
LU
CO o OQ LU
LU
UJ
Hi
01
LU
20 19
1975
20 19
1978
18Ja
n,
Feb.
Ma
r.
Apr.
May
June
July
Aug,
Se
pt.
Oct.
No
v.
Dec
EXPL
ANAT
ION
o Wa
ter
level
measurement
Figu
re 27
. Water
level
in we
ll 78
, 1973-75, 1978.
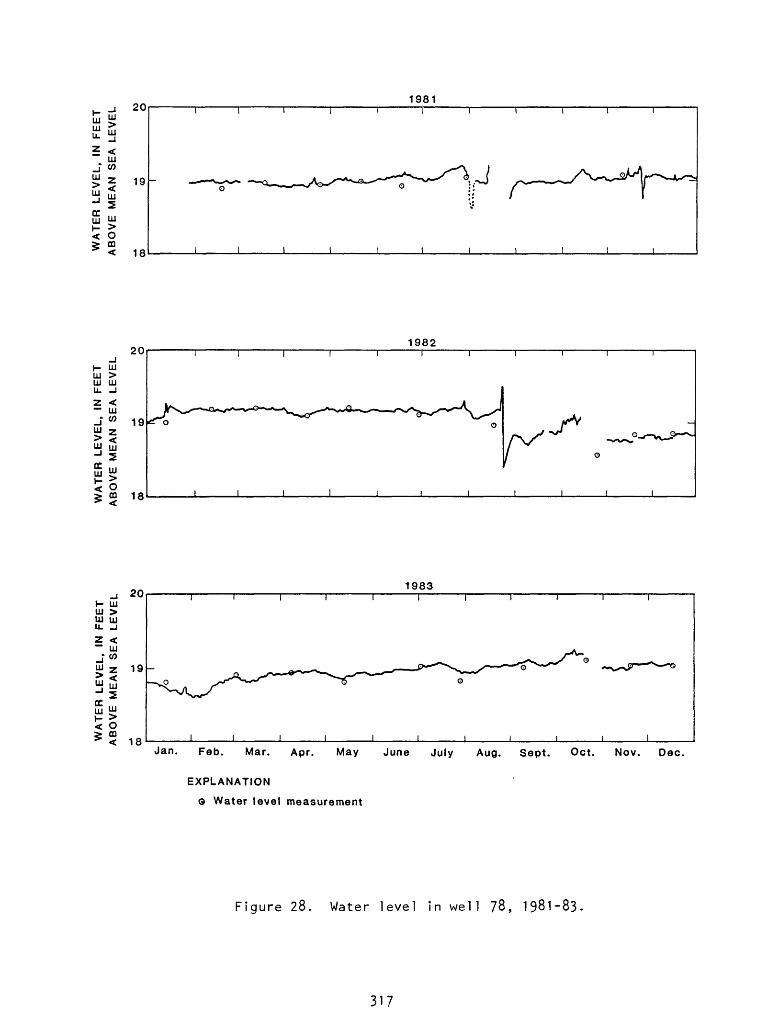
20UJ
5 <UJ
J o>19
< 18
1981
1982zu
_II- UJUJ >UJ UJU. -J
2 < UJ
J" 19UJ Z> <^ UJ-1 2
S^j^§^ a 18
I I I I II II III
VN^ ^--^rL^-«v-^-G>-^-s_-v ^-A-^O-^-^-x-^XW >^x-A
o o
1 I I I ! I I
ft*/
^yj ,.r\A -/~v /
201983
m >w \uu. _i2 <
2 19
UJ
5§^ OQ< 18
I I I I I I T T
J_______I_______I_______I________I_______I________I_______I j_____I
Jan. Feb. Mar. Apr. May June July Aug. Sept. Oct. Nov. Dec.
EXPLANATION
O Water level measurement
Figure 28. Water level in well 78, 1981-83
317
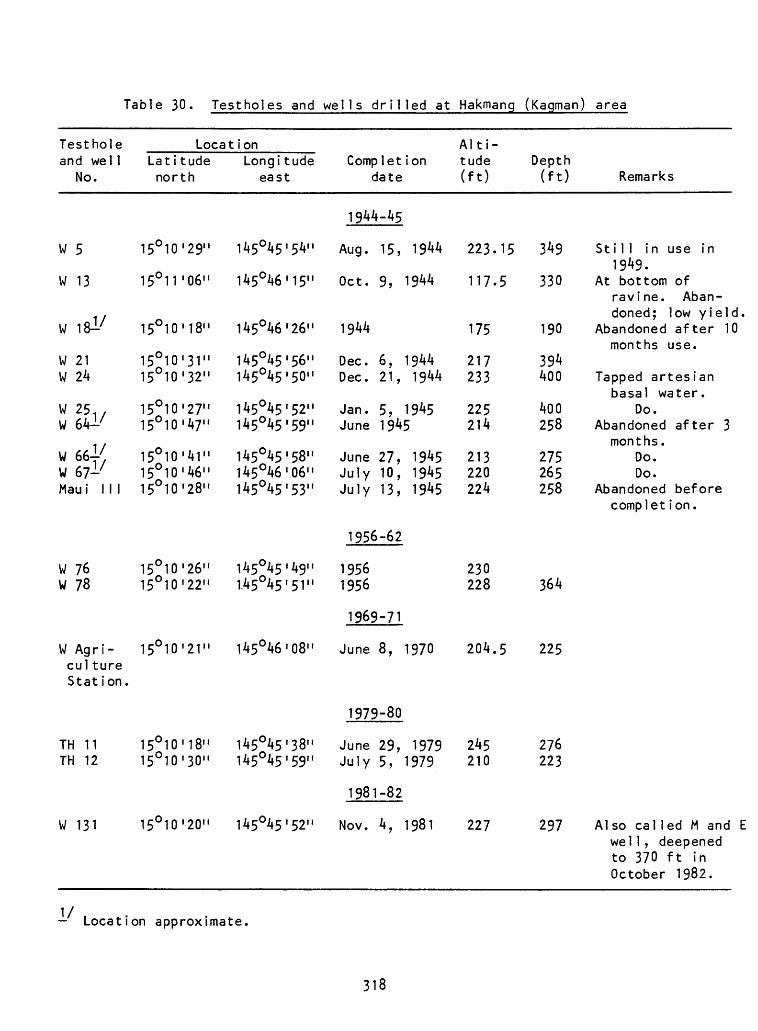
Table 30. Testholes and wells drilled at Hakmang (Kaqman) area
Testhole and wel 1
No.
W 5
W 13
w 18
W 21W 24
W 25 ,W 64-'
W 66J/W 67-7Mau i III
w 76w 78
W Agri-cul tureStat ion.
TH 11TH 12
w 131
Locat ionLatitude Longitude north east
150 10'29" 145045'54"
15°iro6" 145°46'15"
15°10 I 18" 145°46 I 26"
150 10'31" 145045'56M15°10'32 M 145045'50"
15010'27" 145045'52"150 10'47" 145045'59"
150 10'41" 145°45 I 58"150 10'46" 145046'06"15°10'28" 145°45'53"
150 10'26" 145°45'49"15°10'22M 1.45°45'51"
15°10'21 M 145°46'08"
150 10'18" 145°45'38M15°10'30" 145°45'59"
150 10'20" 145°45'52M
Complet ion date
19W-45
Aug. 15, 1944
Oct. 9, 1944
1944
Dec. 6, 1944Dec. 21, 1944
Jan. 5, 1945June 1945
June 27, 1945July 10, 1945July 13, 1945
1956-62
19561956
1969-71
June 8, 1970
1979-80
June 29, 1979July 5, 1979
1981-82
Nov. 4, 1981
Alti tude (ft)
223.15
117.5
175
217233
225214
213220224
230228
204.5
245210
227
Depth (ft)
349
330
190
394400
400258
275265258
364
225
276223
297
Remarks
St i 1 1 in use in1949.
At bottom ofravine. Abandoned; low yield
Abandoned after 10months use.
Tapped artesianbasal water.
Do.Abandoned after 3
months.Do.Do.
Abandoned beforecomplet ion.
Al so cal led M andwel 1 , deepenedto 370 ft inOctober 1982.
- Location approximate.
318
WELL 5
Location; Lat 15°10'29" N., long 145°45'54" E., 0.3 mi northwest of Hakmang
Agriculture Station.
Drilled: July 31 to Aug. 15, 1944 by 1397th Engineer Construction Battalion,
U.S. Army.
Altitude; 223.15 ft. Depth; 349 ft.
Casing; 6 in. to 132 ft.
Aquifer; Limestone.
Source of record; H. T. Stearns (1944) and others.
Remarks; Water encountered at depth of 349 ft (126 ft below sea level)
and rose to 206.8 ft before pumping (Stearns, 1944).
Chloride; 26 ppm, at completion, before and after pumping 3,000
gallons at pumping rate of 70,000 gal/d (Stearns, 1944).
70-90 ppm (dander, 1946).
70-200 ppm (Piper, 1946-47).
Pumpage: 72,000 gal/d, Sept. 6, 1944 (Stearns, 1944).
135,000 gal/d (Boniface, 1945).
70,000-130,000 gal/d (dander, 1946).
60,000 gal/d (anonymous report, March 1947).
pH; 6.8-7.0 (dander, 1946).
For chemical analysis, see table 70.
Well was reported in use in 1949 (Curione, 1949).
Well tapped artesian basal water in aquifer below sea level.
319
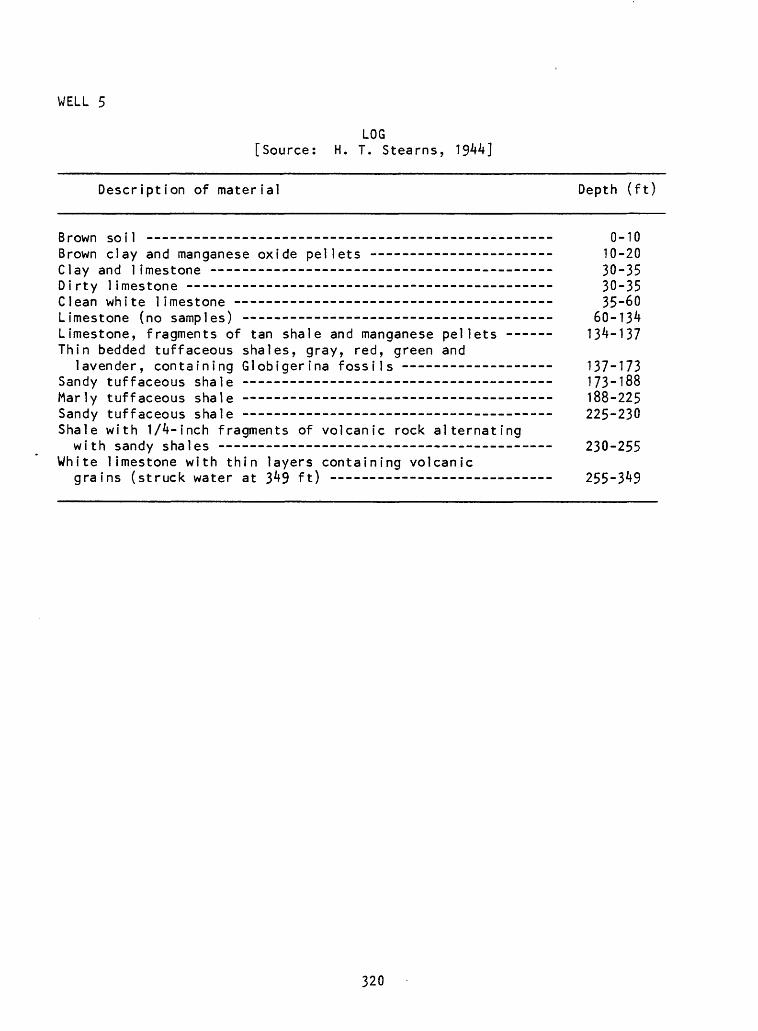
WELL 5
LOG [Source: H. T. Stearns,
Description of material Depth (ft)
Brown soil - - 0-10Brown clay and manganese oxide pellets - 10-20Clay and limestone _______ _ _________________________ 30-35Dirty limestone -- -- 30-35Clean white limestone - - - - - - 35-60 Limestone (no samples) --- - - ------ ______________ 60-13^Limestone, fragments of tan shale and manganese pellets - 13^-137 Thin bedded tuffaceous shales, gray, red, green and
lavender, containing Globigerina fossils -- -- 137-173 Sandy tuffaceous shale 173-188 Marly tuffaceous shale 188-225 Sandy tuffaceous shale 225-230 Shale with lA-inch fragments of volcanic rock alternatingwith sandy shales - 230-255
White limestone with thin layers containing volcanicgrains (struck water at 3^9 ft) 255-3^9
320
WELL 13
Location; Lat 15°1T06" N., long 145°46'15" E., Hakmang, near bottom of
ravine (to reduce drilling distance ).
Drilled: Sept 30 to Oct. 9, 1944 by 1397th Engineer Construction Battalion,
U.S. Army.
Altitude; 117.5 ft Depth; 330 ft.
Casing; 6 in. to 298 ft with bottom 18 ft perforated.
Aquifer; Limestone and sand.
Source of record; Driller.
Remarks; Water encountered from 15 ft to total depth but in small quantity.
When sand was reached at 295 ft, water level dropped 15 ft to
30 ft below surface .
Pumpage; 43,000 gal/d, at completion (log).
60,000-70,000 gal/d for several days, no decrease in
flow and taste remained sweet.
Well abandoned, presumably because of low yield (Glander, 1946).
Supplemental report on well drilling, memorandum from Desloge Brown to
Commanding Officer, Nov. 29, 1944, 3p.
321
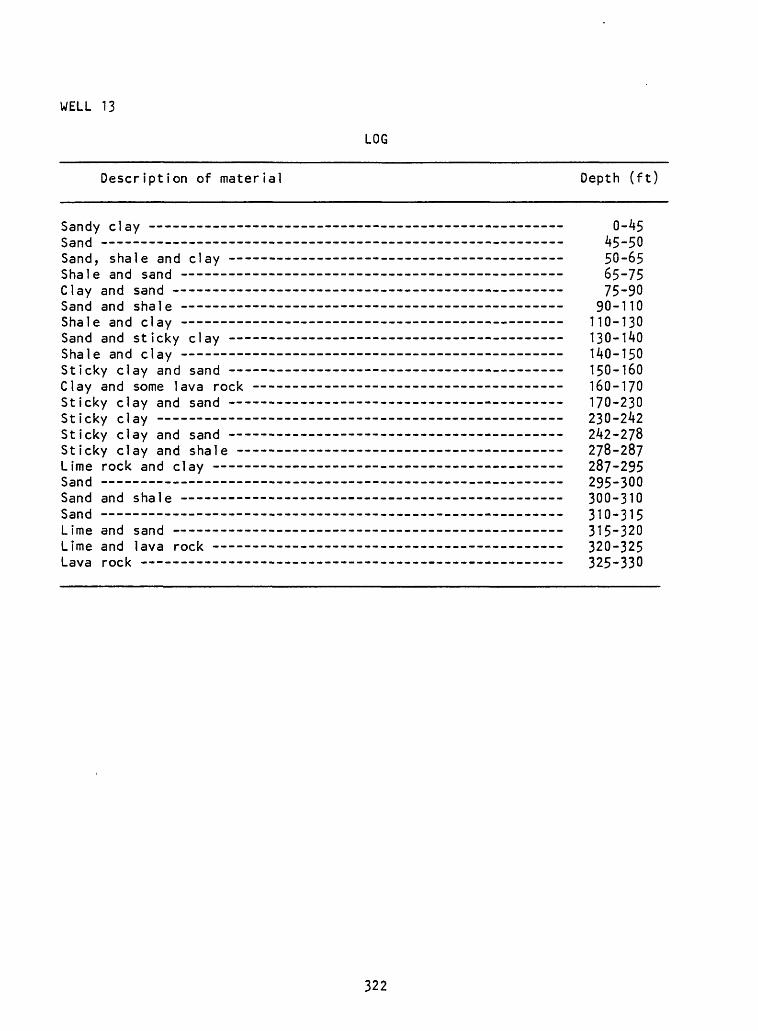
WELL 13
LOG
Description of material Depth (ft)
Sandy clay 0-45Sand 45-50Sand, shale and clay --------------- _______________________ 50-65Shale and sand ----------------------------------- _________ 65-75Clay and sand -- -- 75-90Sand and shale 90-110Shale and clay 110-130Sand and sticky clay 130-140Shale and clay 140-150Sticky clay and sand -- 150-160Clay and some lava rock - -- - - 160-170Sticky clay and sand 170-230Sticky clay 230-242Sticky clay and sand -- 242-278Sticky clay and shale 278-287Lime rock and clay 287-295Sand 295-300Sand and shale 300-310Sand 310-315Lime and sand 315-320Lime and lava rock 320-325Lava rock 325-330
322
WELL 18
Location: About lat 15°10'18" N., long 145°46'26" E., about 0.4 mi east
of Hakmang Agriculture Station.
D r i 11 ed; 1944 by U.S. Marine Corps.
Altitude; 175 ft. Depth; 190 ft.
Casing; 6 in. to 190 ft.
Aquifer; Limestone (Davis, 1958).
Source of record; Glander (1946), Piper (1946-47). Driller's log missing,
Remarks: Water encountered at depth of 190 ft (bottom of hole).
Chloride: 30 ppm (Glander, 1946).
30-190 ppm (Piper, 1946-47).
Pumpage: 30,000-40,000 gal/d (Glander, 1946).
30,000 gal/d (Piper, 1946-47).
pH: 7-0-7.2 (Glander, 1946).
Well was in use for about 10 months and then abandoned (Glander, 1946).
323
WELL 21
Location:
Drilled;
Altitude:
Casing;
Aquifer;
Remarks;
Lat 15°10'31" N., long 145O45'56" E., 500 ft north of well 5,
Hakmang.
Nov. 27 to Dec. 6, 1944 by 1397th Engineer Construction Battalion,
U.S. Army.
217 ft. Depth; 394 ft.
6 in. to 251 ft.
Limestone and sand.
Depth to water before pumping, 194 ft.
Chloride; 30 ppm, at completion (log).
90 ppm (Glander, 1946).
90-150 ppm (Piper, 1946-47).
Pumpage; 94,000 gal/d at completion (log).
105,000 gal/d (Boniface, 1945).
85,000-95,000 gal/d (Glander, 1946).
97,000 gal/d (anonymous report, 1947).
pH; 6.8-7.0 (Glander, 1946).
Well tapped artesian basal water in aquifer below sea level.
Well could not be located in 1956 (Cox, 1956).
324
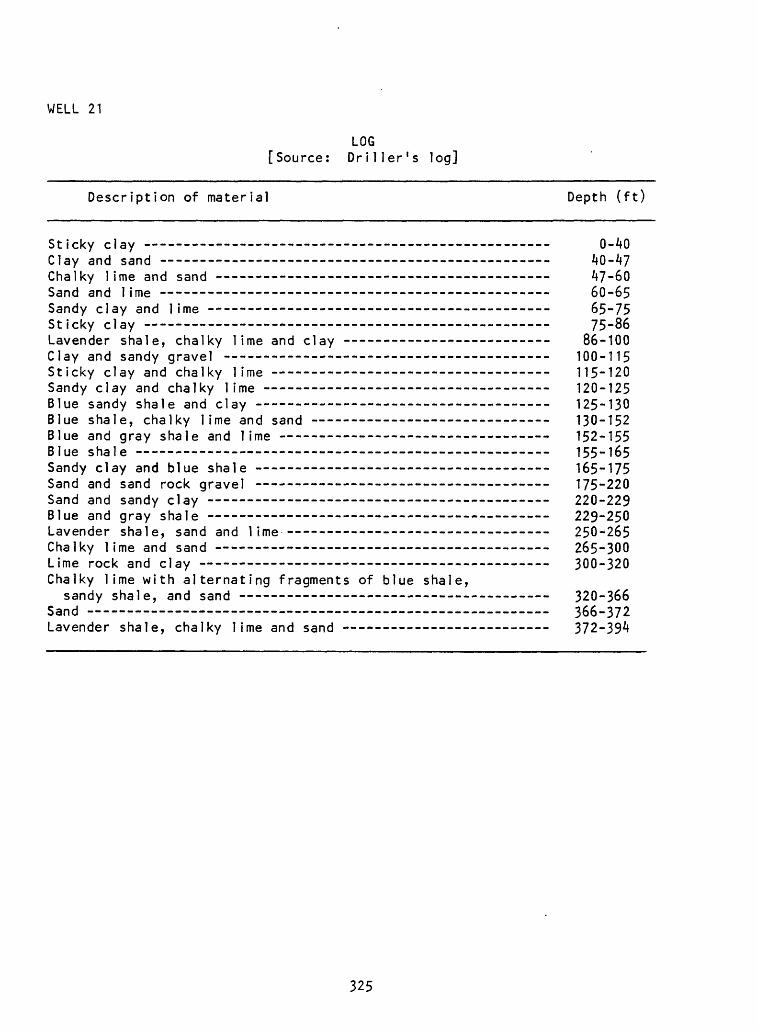
WELL 21
LOG [Source: Driller's log]
Description of material Depth (ft)
Sticky clay 0-40Clay and sand 40-47Chalky lime and sand - - -- 47-60Sand and 1 ime ------------------------------- _--_ ______ 60-65Sandy clay and lime - ----------------------------- ------- 65-75Sticky clay 75-86Lavender shale, chalky lime and clay - - - - 86-100Clay and sandy gravel - - - -- 100-115Sticky clay and chalky lime -- - - 115-120Sandy clay and chalky lime - - 120-125Blue sandy shale and clay -- 125-130Blue shale, chalky lime and sand - - 130-152Blue and gray shale and lime - - 152-155Blue shale 155-165Sandy clay and blue shale - - 165-175Sand and sand rock gravel - - - - -- 175-220Sand and sandy clay - - 220-229Blue and gray shale -- ------ -- _-- -_-_-____ __«-_ 229-250Lavender shale, sand and lime - - -- 250-265Chalky lime and sand 265-300Lime rock and clay 300-320Chalky lime with alternating fragments of blue shale,
sandy shale, and sand 320-366Sand - - - 366-372Lavender shale, chalky lime and sand - - 372-394
325
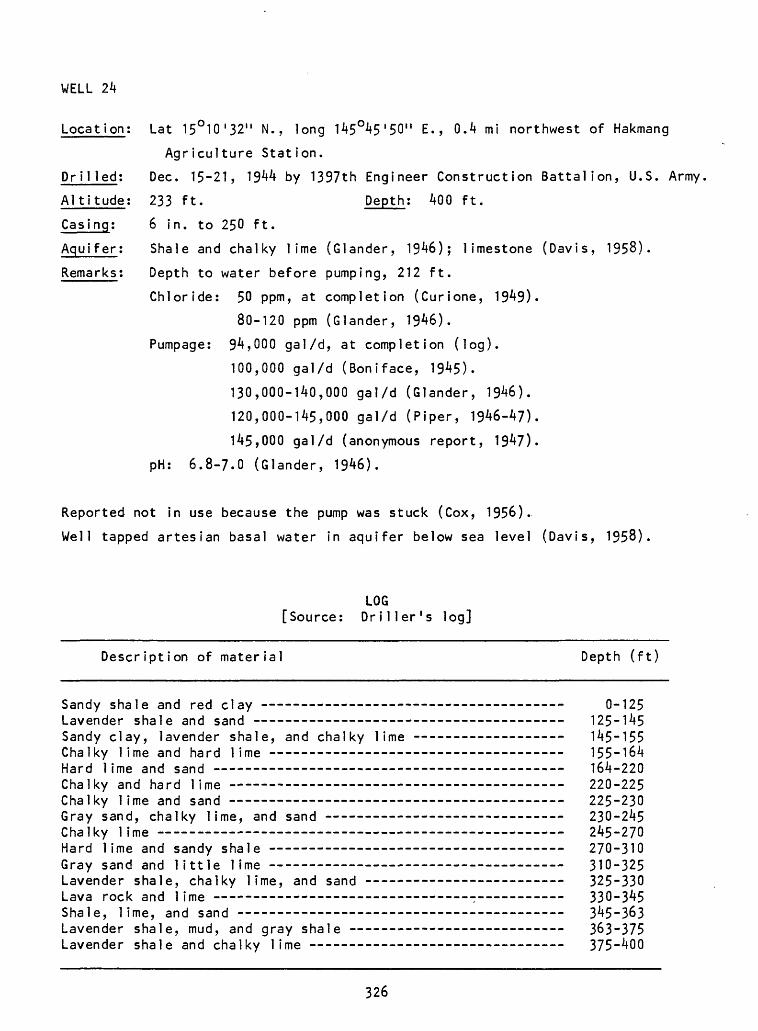
WELL 24
Location: Lat 15°10'32" N., long 145°45'50" E., 0.4 mi northwest of Hakmang
Agriculture Station.
Drilled; Dec. 15-21, 1944 by 1397th Engineer Construction Battalion, U.S. Army
Altitude; 233 ft. Depth; 400 ft.
Casing; 6 in. to 250 ft.
Aquifer; Shale and chalky lime (Glander, 1946); limestone (Davis, 1958).
Remarks; Depth to water before pumping, 212 ft.
Chloride; 50 ppm, at completion (Curione, 1949).
80-120 ppm (Glander, 1946).
Pumpage: 94,000 gal/d, at completion (log).
100,000 gal/d (Boniface, 1945).
130,000-140,000 gal/d (Glander, 1946).
120,000-145,000 gal/d (Piper, 1946-47).
145,000 gal/d (anonymous report, 1947).
pH: 6.8-7.0 (Glander, 1946).
Reported not in use because the pump was stuck (Cox, 1956).
Well tapped artesian basal water in aquifer below sea level (Davis, 1958).
[SourceLOG Driller's log]
Description of material Depth (ft)
Sandy shale and red clay Lavender shale and sand - - Sandy clay, lavender shale, and chalky lime Chalky lime and hard lime --- - - Hard 1 ime and sand --- -- - - - Chalky and hard lime Chalky lime and sand - -- - Gray sand, chalky lime, and sand --- - Chalky lime - -- - - -- Hard lime and sandy shale - - -- Gray sand and little lime Lavender shale, chalky lime, and sand -- Lava rock and 1 ime Shale, lime, and sand --- Lavender shale, mud, and gray shale Lavender shale and chalky lime -
0-125 125-145 145-155 155-164 164-220 220-225 225-230 230-245 245-270 270-310310-325 325-330 330-345 345-363 363-375 375-400
326
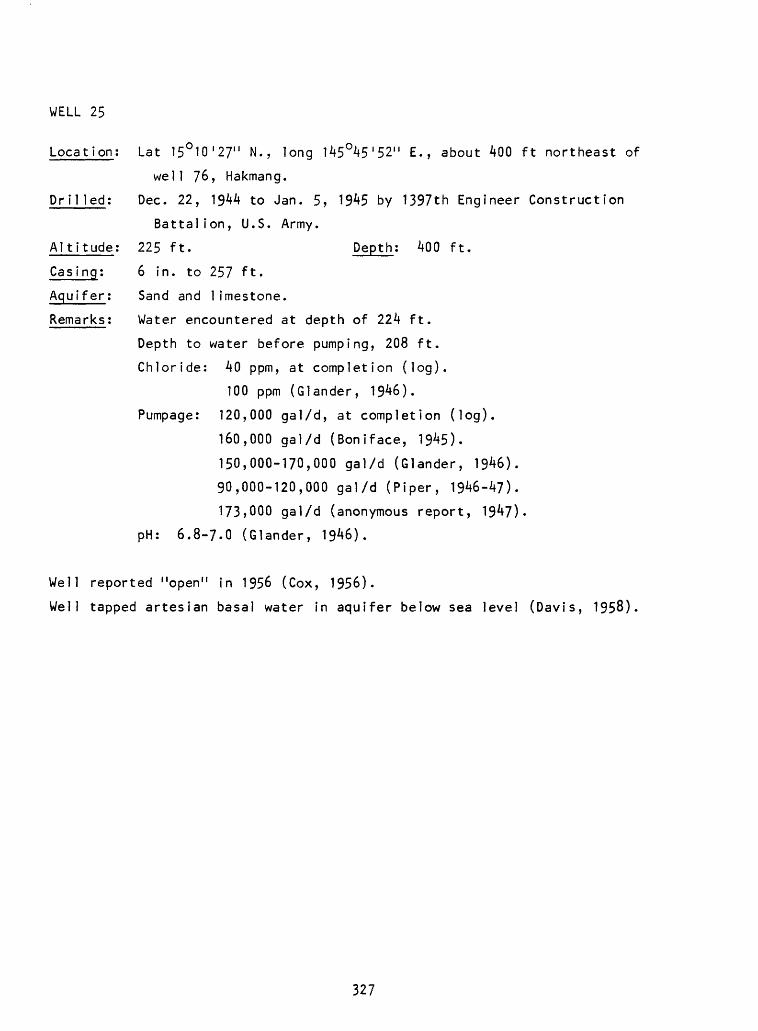
WELL 25
Location; Lat 15°10'27" N., long 145°45'52" E., about 400 ft northeast of
wel1 76, Hakmang.
Drilled; Dec. 22, 1944 to Jan. 5, 1945 by 1397th Engineer Construction
Battalion, U.S. Army.
Altitude; 225 ft. Depth; 400 ft.
Casing; 6 in. to 257 ft.
Aquifer; Sand and 1imestone.
Remarks; Water encountered at depth of 224 ft.
Depth to water before pumping, 208 ft.
Chloride; 40 ppm, at completion (log).
100 ppm (Glander, 1946).
Pumpage; 120,000 gal/d, at completion (log).
160,000 gal/d (Boniface, 1945).
150,000-170,000 gal/d (Glander, 1946).
90,000-120,000 gal/d (Piper, 1946-47).
173,000 gal/d (anonymous report, 1947).
pH; 6.8-7.0 (Glander, 1946).
Well reported "open" in 1956 (Cox, 1956).
Well tapped artesian basal water in aquifer below sea level (Davis, 1958).
327
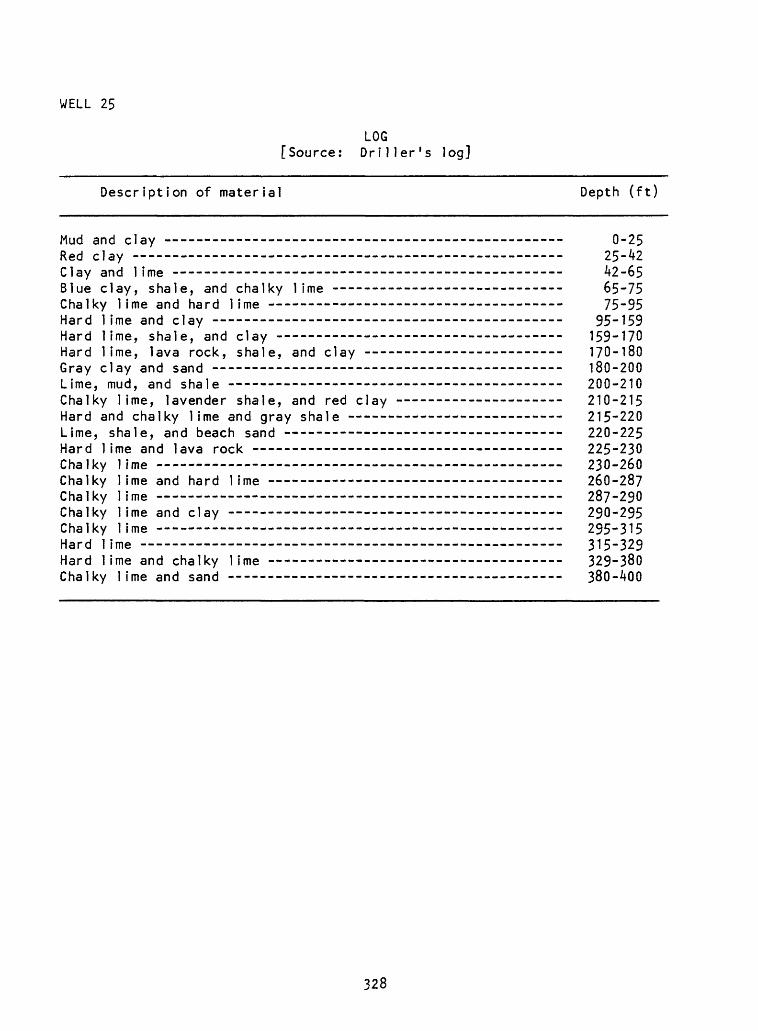
WELL 25
[SourceLOG Dri1ler log]
Description of material Depth (ft)
Mud and clay 0-25Red clay 25-A2Clay and lime -- -- ------ --- -- A2-65Blue clay, shale, and chalky lime ------- - -- ----- - 65-75Chalky lime and hard lime - - -- 75-95Hard lime and clay - ----- ------ 95-159Hard lime, shale, and clay - - - - -------- -- - 159-170Hard lime, lava rock, shale, and clay - - --- 170-180Gray clay and sand ---- -- -- -- -- - 180-200Lime, mud, and shale -- -- -- ------ 200-210Chalky lime, lavender shale, and red clay ------ -- 210-215Hard and chalky lime and gray shale - - -- 215-220Lime, shale, and beach sand -- -- 220-225Hard lime and lava rock ---- 225-230Chalky ime -- 230-260Chalky ime and hard lime -- - 260-287Chalky ime 287-290Chalky ime and clay -- -- -- 290-295Chalky ime 295-315Hard lime 315-329Hard lime and chalky lime -- ---- 329-380Chalky lime and sand -- --- ---- 380-AOO
328
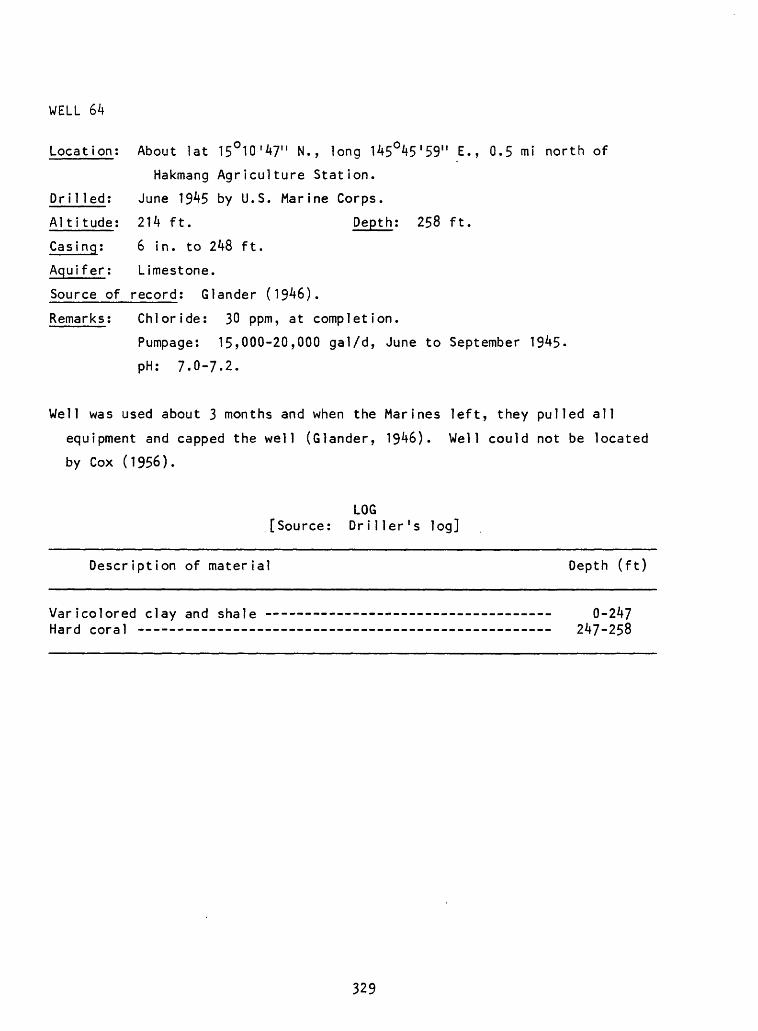
WELL 64
Location; About lat 15°10'47" N., long 145°45'59" E., 0.5 mi north of
Hakmang Agriculture Station.
Drilled: June 1945 by U.S. Marine Corps.
Altitude: 214 ft. Depth: 258 ft.
Casing: 6 in. to 248 ft.
Aquifer; Limestone.
Source of record; Glander (1946).
Remarks: Chloride: 30 ppm, at completion.
Pumpage: 15,000-20,000 gal/d, June to September 1945-
pH: 7.0-7.2.
Well was used about 3 months and when the Marines left, they pulled all
equipment and capped the well (Glander, 1946). Well could not be located
by Cox (1956).
LOG [Source: Driller's log]
Description of material Depth (ft)
Varicolored clay and shale - -- 0-247Hard coral 247-258
329
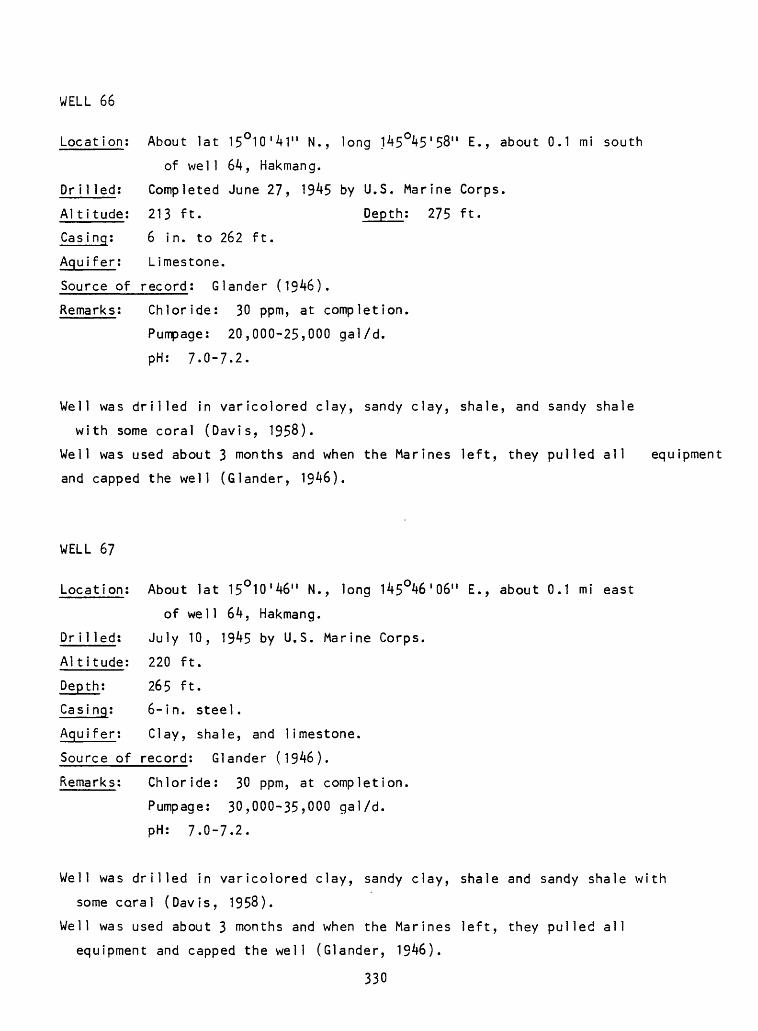
WELL 66
Location; About lat 15°10'41" N., long 145°45'58" E., about 0.1 mi south
of well 64, Hakmang.
Dr i]led; Completed June 27, 1945 by U.S. Marine Corps.
Altitude; 213 ft. Depth: 275 ft.
Casing; 6 in. to 262 ft.
Aquifer; Limestone.
Source of record; dander (1946).
Remarks; Chloride; 30 ppm, at completion.
Pumpage: 20,000-25,000 gal/d.
PH: 7.0-7.2.
Well was drilled in varicolored clay, sandy clay, shale, and sandy shale
with some coral (Davis, 1958).
Well was used about 3 months and when the Marines left, they pulled all equipment
and capped the well (Glander, 1946).
WELL 67
Location; About lat 15°10'46" N., long 145O46'06M E., about 0.1 mi east
of well 64, Hakmang.
Drilled; July 10, 1945 by U.S. Marine Corps.
Altitude; 220 ft.
Depth; 265 ft.
Casing; 6-in. steel.
Aquifer; Clay, shale, and limestone.
Source of record; Glander (1946).
Remarks; Chloride: 30 ppm, at completion.
Pumpage: 30,000-35,000 gal/d.
pH: 7.0-7.2.
Well was drilled in varicolored clay, sandy clay, shale and sandy shale with
some coral (Davis, 1958).
Well was used about 3 months and when the Marines left, they pulled all
equipment and capped the well (Glander, 1946).
330
WELL Maui III
Location; Lat 15°10'28" N., long 145°45'53" E., 0.1 mi northeast of well 76
Hakmang.
Dr il led: Excavation stopped July 13 >
Altitude; 224 ft. Depth; 258 ft.
Diameter of hole; 8x8 ft, vertical, timbered.
Source of record; Glander, 19^6.
Remarks; No tunnels dug.
Shaft penetrated formation of clay, coral, coral gravel, slate or mud rock,
sandstone, grey shale, and hard limestone.
Well was abandoned and sealed because shaft ended in impermeable rock and no
usable water was found (Davis, 1958).
331
WELL 76
Location; Lat 15O 10'26n N., long 145°A5'49" E., along main road in Hakmang,
0.3 mi northwest of Hakmang Agriculture Station.
Dr i1 led: 1956 by Brown-Pacific-Maxon. Well had not been tested in July 1956
(Cox, 1956).
Alt?tude: 230 ft (Cox, 1956, and from topographic map).
Depth; Not known.
Remarks; Safe yield estimated at 35,000 gal/d (Cox, 1956).
Chloride; 62 ppm, Sept. 14, 1965, at pumping rate of 30 gal/min.-
97 mg/L, average of 7 samples May 18 to Sept. 8, 1977
(M and E Pacific, 1978).
92 mg/L, Mar. 18, 1980 (USGS).
72 mg/L, June 17, 1980 (USGS).
75 mg/L, Sept. 8, 1983 (USGS).
Drawdown and salinity test June 20-25, 1966; In 5 days, 179,000
gal pumped at 25 gal/min and no drawdown. Salinity remained2 /
constant at 7^-78 ppm.-
Pumpage; 35 gal/min, June 17, 1980 and Aug. 18, 1982.
65 gal/min, Apr. 27, 1983.
67 gal/min, Sept. 8, 1983.
Well provides water for the Hakmang area. For chemical analyses, see tables
72 and 76.
Written communication M. M. Miller and Ted Arnow to High Commissioner of the
Trust Territory of the Pacific Islands, 1965.
itten communic
June 30, 1966.
2/- Written communication L. F. Irving to District Director Public Works,
332
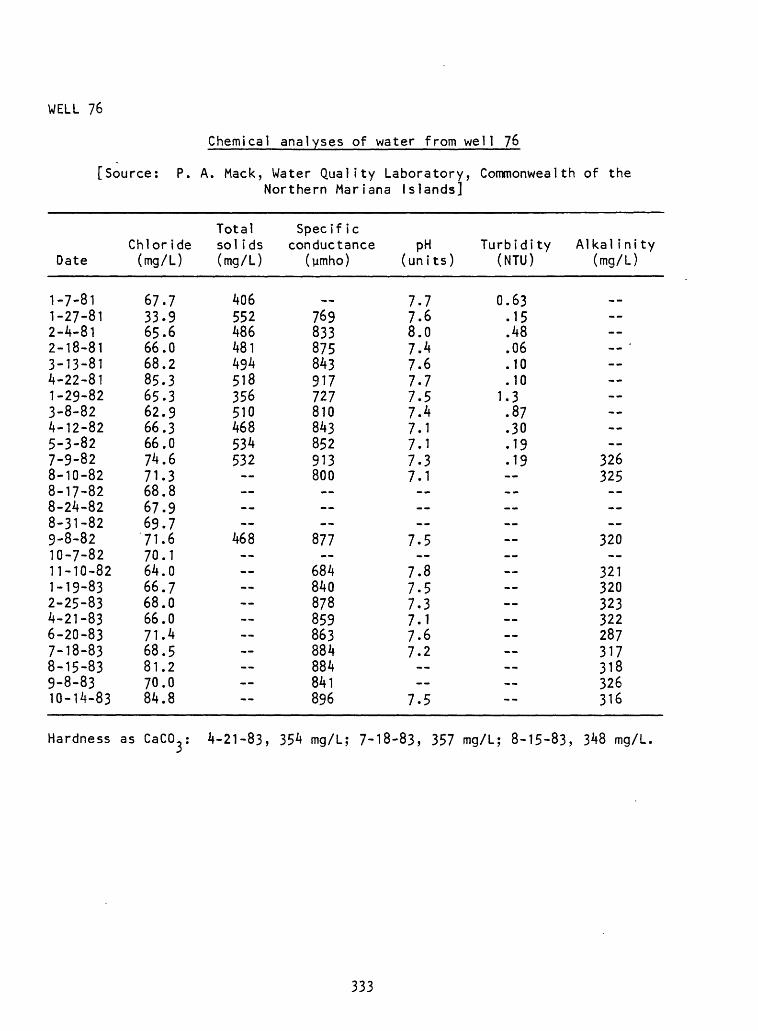
WELL 76
Chemical analyses of water from well 76
[Source: P. A. Mack, Water Quality Laboratory, Commonwealth of theNorthern Mariana Islands]
Date
1-7-811-27-812-4-812-18-813-13-814-22-811-29-823-8-824-12-825-3-827-9-828-10-828-17-828-24-828-31-829-8-8210-7-8211-10-821-19-832-25-834-21-836-20-837-18-838-15-839-8-8310-14-83
Chloride (mg/L)
67.733.965.666.068.285.365.362.966.366.074.671.368.867.969.771.670.164.066.768.066.071.468.581.270.084.8
Total sol ids (mg/L)
406552486481494518356510468534532 --
468--
Specif ic conductance
(limho)
..769833875843917727810843852913800
877
684840878859863884884841896
pH (un its)
7.77.68.07.47.67.77.57.47.17.17.37.1--
7.5
7.87.57.37.17.67.2
7.5
Turbidity (NTU)
0.63.15.48.06.10.10
1.3.87.30.19.19 -- -- --
Alkal i ni ty (mg/L)
mm < »
--__ --____------
326325--
320--
321320323322287317318326316
Hardness as CaCty 4-21-83, 354 mg/L; 7-18-83, 357 mg/L; 8-15-83, 348 mg/L.
333
WELL 78
Locat ion:
Drilled:
Altitude:
Lat 15°10'22" N., long 145 0/+5'51" E., along main road in Hakmang,
about 200 ft south of well 76.
1956 by Brown-Pacific-Maxon. (Well had not yet been tested in
July 1956 (Cox, 1956).
228 ft (from topographic map).
364 ft (Oct. 7, 1981).
12-in. steel.
July 2, 1983: Specific conductance, 883 ymho (USGS).
Continuous water-level record (USGS) in 1973-75, 1978, 1981-82.
(See figs. 27, 28).
334
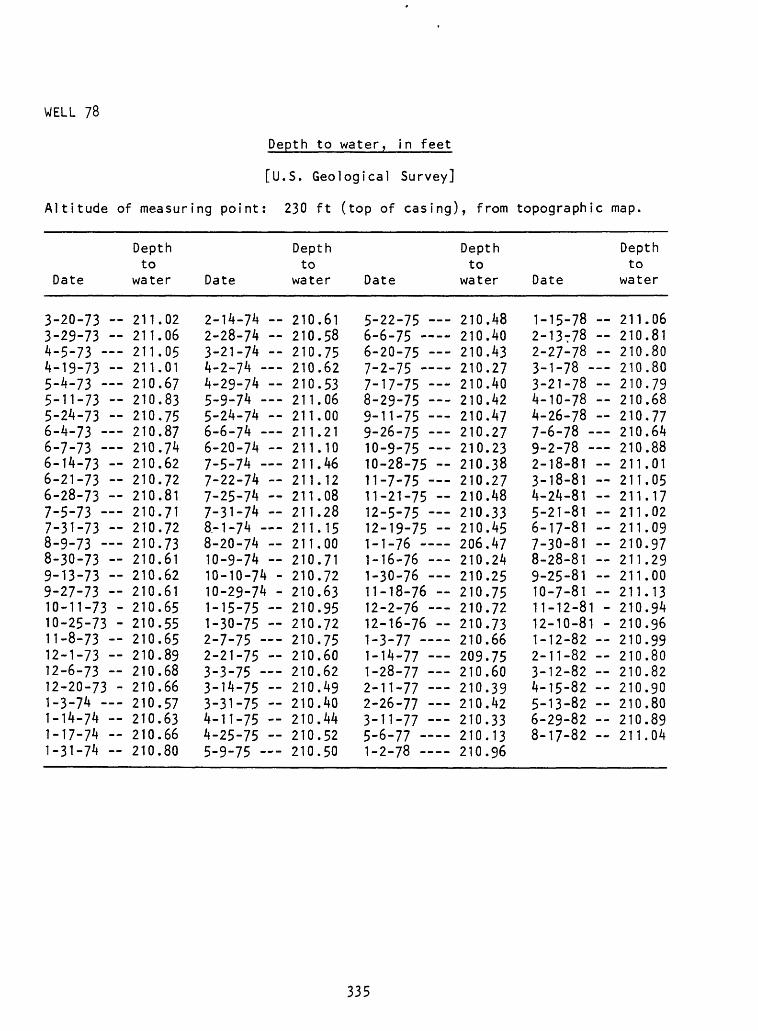
WELL 78
Depth to water, in feet
[U.S. Geological Survey]
Altitude of measuring point: 230 ft (top of casing), from topographic map
Date
3-20-73 -3-29-73 --4-5.73 4-19-73 -5-4.73 5-11-73 -5-24-73 -6-4-73 6-7-73 6-14-73 -6-21-73 --6-28-73 --7-5-73 7-31-73 -8-9-73 8-30-73 -9-13-73 -9-27-73 -10-11-73 -10-25-73 -11-8-73 -12-1-73 -12-6-73 --12-20-73 -1-3-74 1_14_ 7 4 _.1-17.74 -1-31-7^ -
Depth to
water
211.02211.06211.05211.01210.67210.83210.75210.87210.74210.62210.72210.81210.71210.72210.73210.61210.62210.61210.65210.55210.65210.89210.68210.66210.57210.63210.66210.80
Date
2-14-74 2-28-74 3-21-74 -4-2-74 4-29-74 5-9-74 5-24-74 6-6-74 6-20-74 7-5-74 7-22-74 7-25-74 --7.31-74 -8-1-74 8-20-74 10-9-74 --10-10-74 -10-29-74 -1-15-75 --1-30-75 2-7-75 2-21-75 3-3.75 3-14-75 3-31-75 --4-11-75 4-25-75 --5-9-75
Depth to
water
210.61210.58210.75210.62210.53211.06211.00211.21211.10211.46211.12211.08211.28211.15211.00210.71210.72210.63210.95210.72210.75210.60210.62210.49210.40210.44210.52210.50
Date
5-22-75 6-6-756-20-75 7-2-75 - 7-17.75 8-29-75 9-11-75 9-26-75 10-9-75 10-28-75 11-7-75 11-21-75 -12-5-75 12-19-75 -1-1-76 1-16-76 1-30-76 11-18-76 12-2-76 12-16-76 1-3-771-14-77 1-28-77 2-11-77 2-26-77 3-11-77 5-6-77 1-2-78
Depth to
water
210.48210.40210.43210.27210.40210.42210.47210.27210.23210.38210.27210.48210.33210.45206.47210.24210.25210.75210.72210.73210.66209.75210.60210.39210.42210.33210.13210.96
Date
1-15-78 ~2-13r78 -2-27-78 3-1-78 3-21-78 -4-10-78 4-26-78 -7-6-78 9-2-78 2-18-81 3-18-81 4-24-81 5-21-81 6-17-81 7-30-81 -8-28-81 -9-25-81 10-7-81 11-12-81 -12-10-81 -1-12-82 2-11-82 3-12-82 4-15-82 5-13-82 -6-29-82 8-17-82
Depth to
water
211.06210.81210.80210.80210.79210.68210.77210.64210.88211.01211.05211.17211.02211.09210.97211.29211.00211.13210.94210.96210.99210.80210.82210.90210.80210.89211.04
335
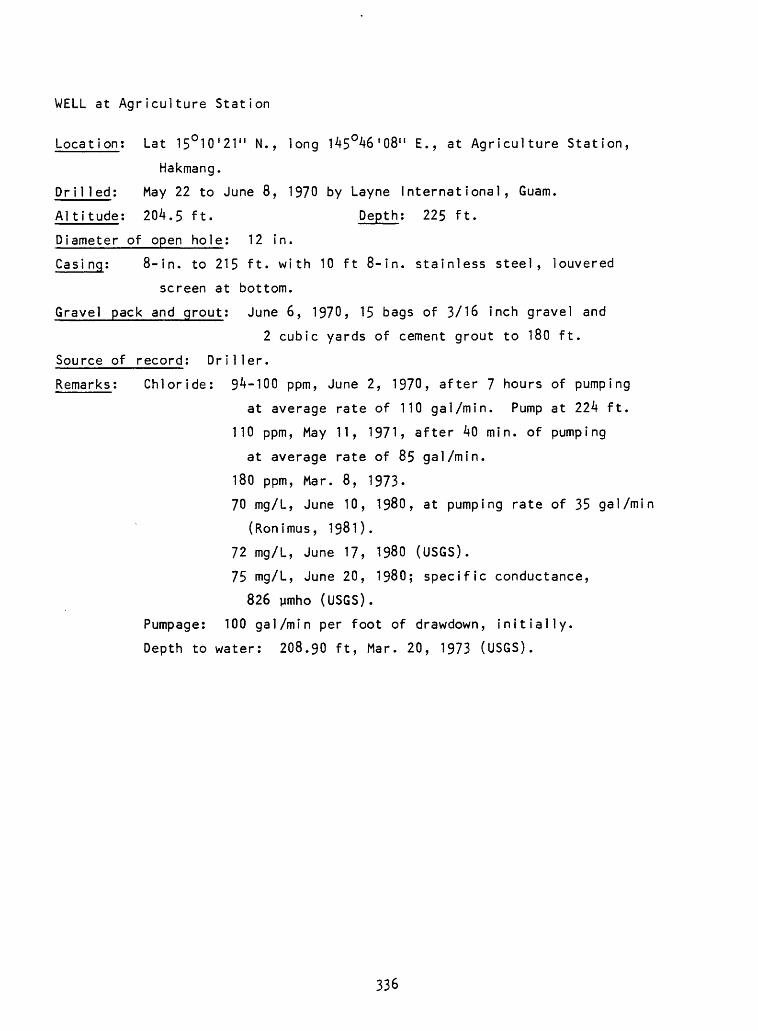
WELL at Agriculture Station
Location: Lat 15°10'21" N., long 145°46'08" E., at Agriculture Station,
Hakmang.
Dr i1 led: May 22 to June 8, 1970 by Layne International, Guam.
Altitude: 204.5 ft. Depth: 225 ft.
Diameter of open hole: 12 in.
Casi ng: 8-in. to 215 ft. with 10 ft 8-in. stainless steel, louvered
screen at bottom.
Gravel pack and grout; June 6, 1970, 15 bags of 3/16 inch gravel and
2 cubic yards of cement grout to 180 ft.
Source of record: Driller.
Remarks: Chloride: 94-100 ppm, June 2, 1970, after 7 hours of pumping
at average rate of 110 gal/min. Pump at 224 ft.
110 ppm, May 11, 1971? after 40 min. of pumping
at average rate of 85 gal/min.
180 ppm, Mar. 8, 1973.
70 mg/L, June 10, 1980, at pumping rate of 35 gal/min
(Ronimus, 1981).
72 mg/L, June 17, 1980 (USGS).
75 mg/L, June 20, 1980; specific conductance,
826 umho (USGS).
Pumpage: 100 gal/min per foot of drawdown, initially.
Depth to water: 208.90 ft, Mar. 20, 1973 (USGS).
336
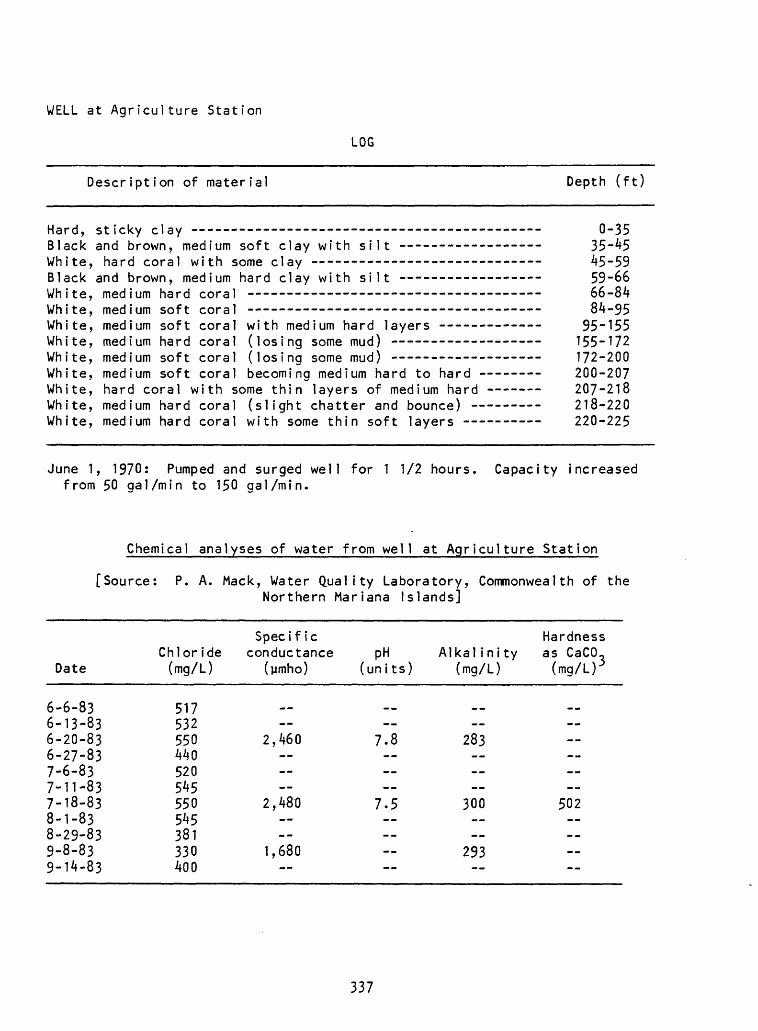
WELL at Agriculture Station
LOG
Description of material Depth (ft)
Hard, sticky clay ----------------------------------------Black and brown, medium soft clay with silt --------------White, hard coral with some clay ----- - - - -Black and brown, medium hard clay with silt --------------White, medium hard coral ---------------------------------White, medium soft coral - - - -White, medium soft coral with medium hard layers - White, medium hard coral (losing some mud) ----- -- ----White, medium soft coral (losing some mud) - - - -White, medium soft coral becoming medium hard to hard ----White, hard coral with some thin layers of medium hard ---White, medium hard coral (slight chatter and bounce) - -White, medium hard coral with some thin soft layers -
0-3535-4545-5959-6666-8484-95
95-155155-172172-200200-207207-218218-220220-225
June 1, 1970s Pumped and surged well for 1 1/2 hours, from 50 gal/min to 150 gal/min.
Capacity increased
Date
Chemical analyses of water from well at Agriculture Station
[Source: P. A. Mack, Water Quality Laboratory, Commonwealth of theNorthern Mariana Islands]
Specific HardnessChloride conductance pH Alkalinity as CaCO-(mg/L) (ymho) (units) (mg/L) (mg/L)
6-6-836-13-836-20-836-27-837-6-837-11-837-18-838-1-838-29-839-8-839-14-83
517532550440520545550545381330400
2,460
2,480 --
1,680
-_7.8 --
7.5 --
--283----
300 --
293
-- ----
502 --
337
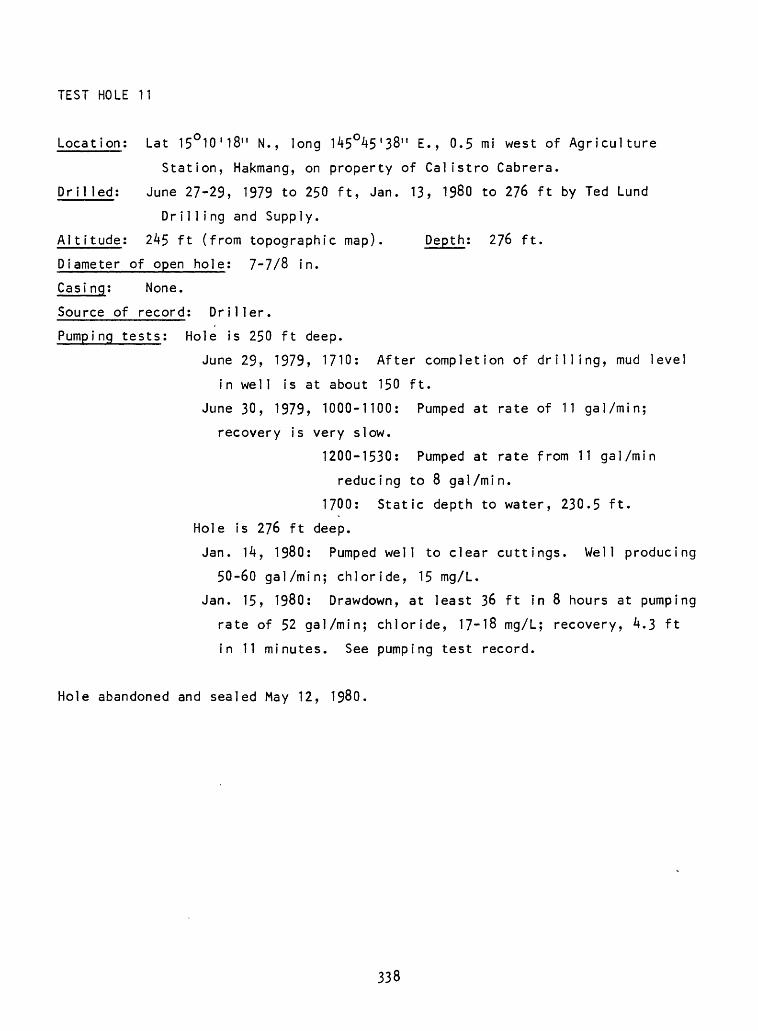
TEST HOLE 11
Location; Lat 15°10'18" N., long 145°45'38" E., 0.5 mi west of Agriculture
Station, Hakmang, on property of Calistro Cabrera.
Drilled; June 27-29, 1979 to 250 ft, Jan. 13, 1980 to 276 ft by Ted Lund
Dr i11i ng and Supply.
Altitude; 245 ft (from topographic map). Depth; 276 ft.
Diameter of open hole; 7-7/8 in.
Casi ng; None.
Source of record; Driller.
Pumping tests; Hole is 250 ft deep.
June 29, 1979, 1710; After completion of drilling, mud level
in well is at about 150 ft.
June 30, 1979, 1000-1100; Pumped at rate of 11 gal/min;
recovery is very slow.
1200-1530; Pumped at rate from 11 gal/min
reducing to 8 gal/min.
1700; Static depth to water, 230.5 ft.
Hole is 276 ft deep.
Jan. 14, 1980; Pumped well to clear cuttings. Well producing
50-60 gal/min; chloride, 15 mg/L.
Jan. 15, 1980; Drawdown, at least 36 ft in 8 hours at pumping
rate of 52 gal/min; chloride, 17-18 mg/L; recovery, A.3 ft
in 11 minutes. See pumping test record.
Hole abandoned and sealed May 12, 1980.
338
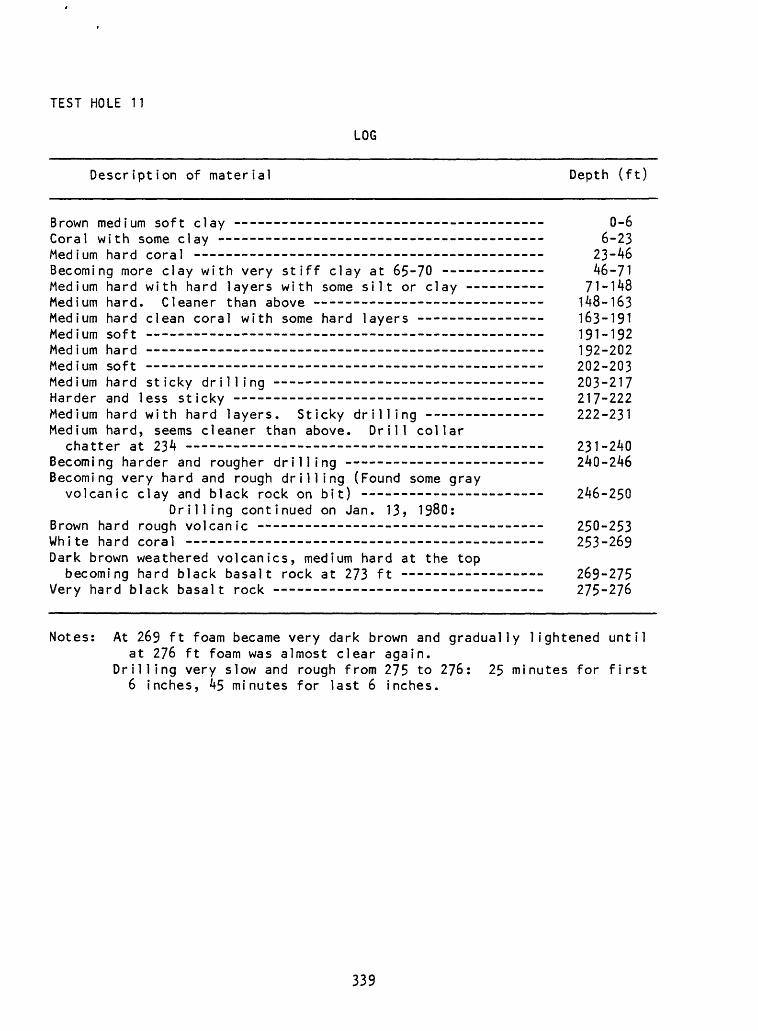
TEST HOLE 11
LOG
Description of material Depth (ft)
Brown medium soft clay ----------------------------------- 0-6Coral with some clay ------ ------------ ------ _______ 6-23Medium hard coral ----- ------------------ _______________ 23-46Becoming more clay with very stiff clay at 65-70 -- -------- 46-71Medium hard with hard layers with some silt or clay -------- 71-1^8Medium hard. Cleaner than above -------- _______ ________ 148-163Medium hard clean coral with some hard layers ------- ------- 163-191Medium soft 191-192 Medium hard 192-202 Medium soft 202-203 Medium hard sticky drilling -- 203-217 Harder and less sticky 217-222Medium hard with hard layers. Sticky drilling - 222-231 Medium hard, seems cleaner than above. Drill collar
chatter at 234 231-240 Becoming harder and rougher drilling - - 240-246 Becoming very hard and rough drilling (Found some gray
volcanic clay and black rock on bit) - - - 246-250Drilling continued on Jan. 13? 1980:
Brown hard rough volcanic - - - 250-253 White hard coral 253-269 Dark brown weathered volcanics, medium hard at the top
becoming hard black basalt rock at 273 ft 269-275 Very hard black basalt rock 275-276
Notes: At 269 ft foam became very dark brown and gradually lightened untilat 276 ft foam was almost clear again.
Drilling very slow and rough from 275 to 276: 25 minutes for first 6 inches, 45 minutes for last 6 inches.
339
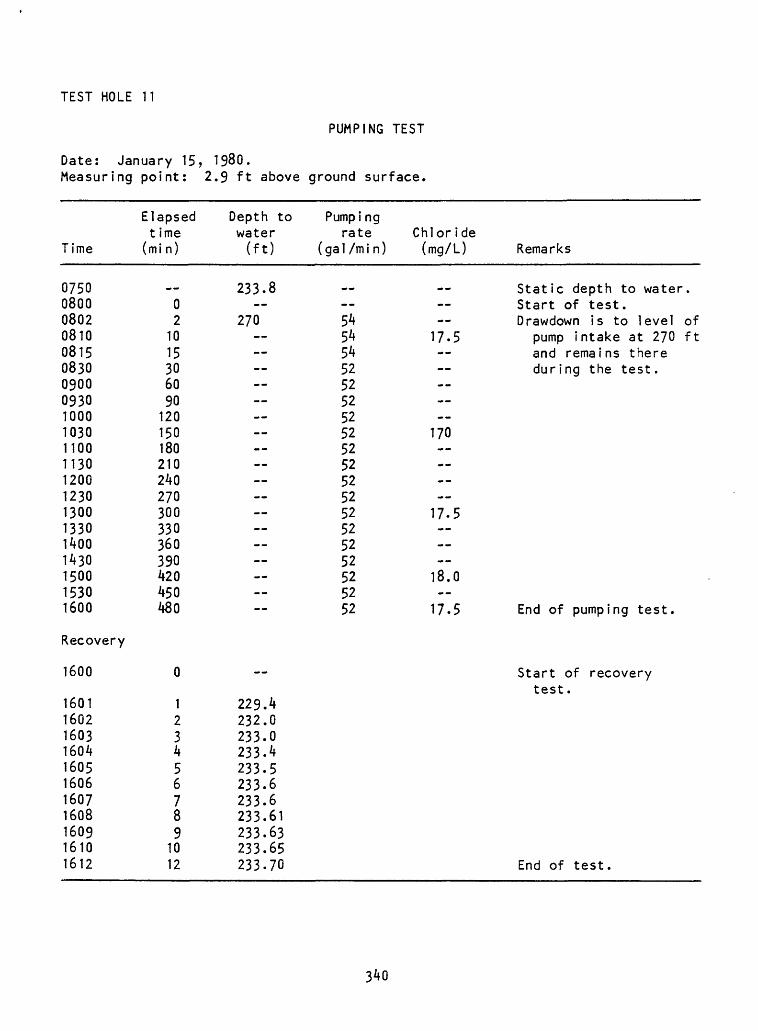
TEST HOLE 11
PUMPING TEST
Date: January 15, 1980.Measuring point: 2.9 ft above ground surface.
Time
075008000802081008150830090009301000103011001130120012301300133014001430150015301600
Recovery
1600
16011602160316041605160616071608160916101612
Elapsed time
(mi n)
w
02
1015306090120150180210240270300330360390420450480
0
123456789
1012
Depth to water (ft)
233.8
270
229.4232.0233.0233.4233.5233.6233.6233.61233.63233.65233.70
Pumpi ng rate Chloride
(gal /mi n) (mg/L) Remarks
Static depth to water.Start of test.
54 Drawdown is to level of54 17-5 pump intake at 270 ft54 and remains there52 during the test.52525252 1705252525252 17.552525252 18.05252 17.5 End of pumping test.
Start of recoverytest.
End of test.
340
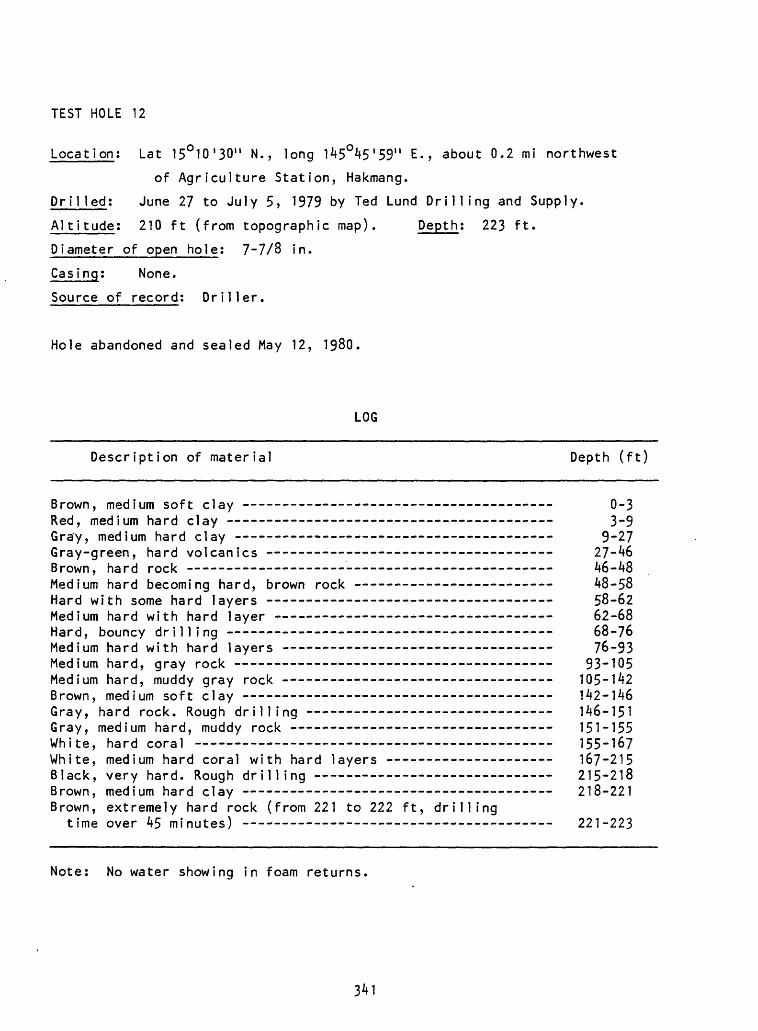
TEST HOLE 12
Location: Lat 15°10'30" N., long 145°45'59" E., about 0.2 mi northwest
of Agriculture Station, Hakmang.
Drilled; June 27 to July 5, 1979 by Ted Lund Drilling and Supply.
Altitude; 210 ft (from topographic map). Depth; 223 ft.
Diameter of open hole; 7-7/8 in.
Casing; None.
Source of record; Driller.
Hole abandoned and sealed May 12, 1980.
LOG
Description of material Depth (ft)
Brown, medium soft clay 0-3Red, medium hard clay - - - - 3-9Gra'y, medium hard clay - 9-27Gray-green, hard volcanics 27-46Brown, hard rock 46-48Medium hard becoming hard, brown rock 48-58Hard with some hard layers 58-62Medium hard with hard layer - - - - 62-68Hard, bouncy drilling 68-76Medium hard with hard layers 76-93Medium hard, gray rock - 93-105Medium hard, muddy gray rock - 105-142Brown, medium soft clay - --- --- --- ------- - -- - 142-146Gray, hard rock. Rough drilling 146-151Gray, medium hard, muddy rock --_- -- - -- 151-155White, hard coral 155-167White, medium hard coral with hard layers ------------------- 167-215Black, very hard. Rough drilling 215-218Brown, medium hard clay - 218-221Brown, extremely hard rock (from 221 to 222 ft, drilling
time over 45 minutes) 221-223
Note; No water showing in foam returns.
341
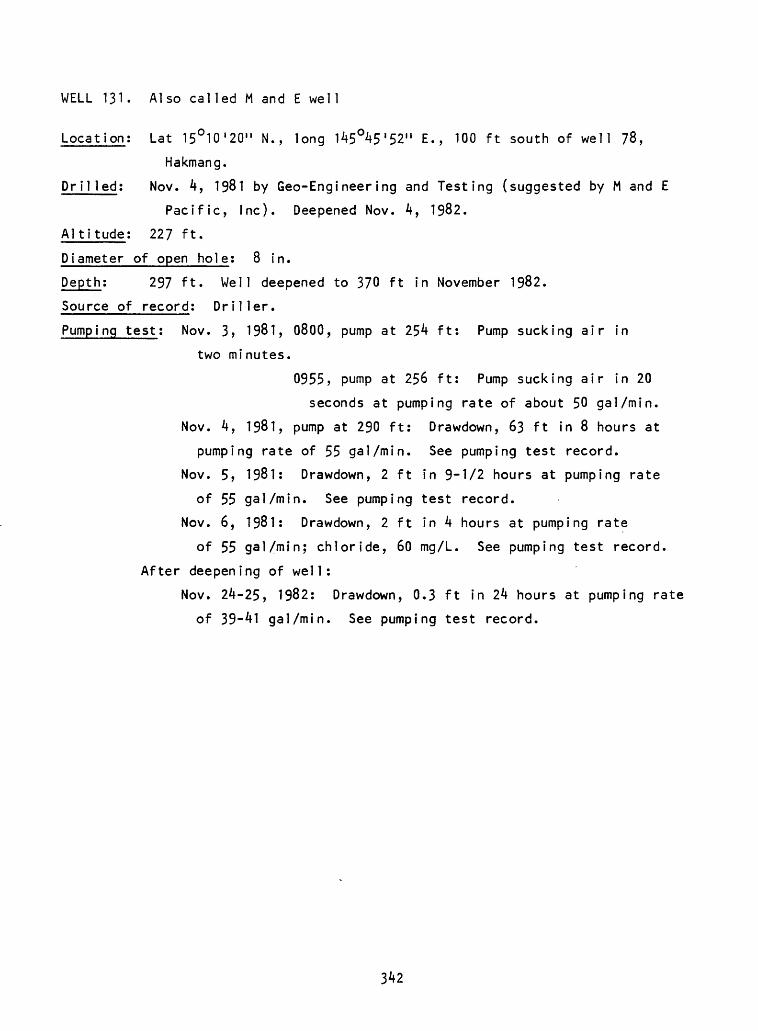
WELL 131. Also called M and E well
Location: Lat 15°10'20" N., long 145°45'52" E., 100 ft south of well 78,
Hakmang.
Drilled; Nov. 4, 1981 by Geo-Engineering and Testing (suggested by M and E
Pacific, Inc). Deepened Nov. 4, 1982.
Altitude; 227 ft.
Diameter of open hole; 8 in.
Depth; 297 ft. Well deepened to 370 ft in November 1982.
Source of record; Driller.
Pumping test; Nov. 3, 1981, 0800, pump at 254 ft; Pump sucking air in
two minutes.
0955, pump at 256 ft; Pump sucking air in 20
seconds at pumping rate of about 50 gal/min.
Nov. 4, 1981, pump at 290 ft; Drawdown, 63 ft in 8 hours at
pumping rate of 55 gal/min. See pumping test record.
Nov. 5, 1981; Drawdown, 2 ft in 9-1/2 hours at pumping rate
of 55 gal/min. See pumping test record.
Nov. 6, 1981; Drawdown, 2 ft in A hours at pumping rate
of 55 gal/min; chloride, 60 mg/L. See pumping test record.
After deepening of well;
Nov. 24-25, 1982; Drawdown, 0.3 ft in 2k hours at pumping rate
of 39-41 gal/min. See pumping test record.
342
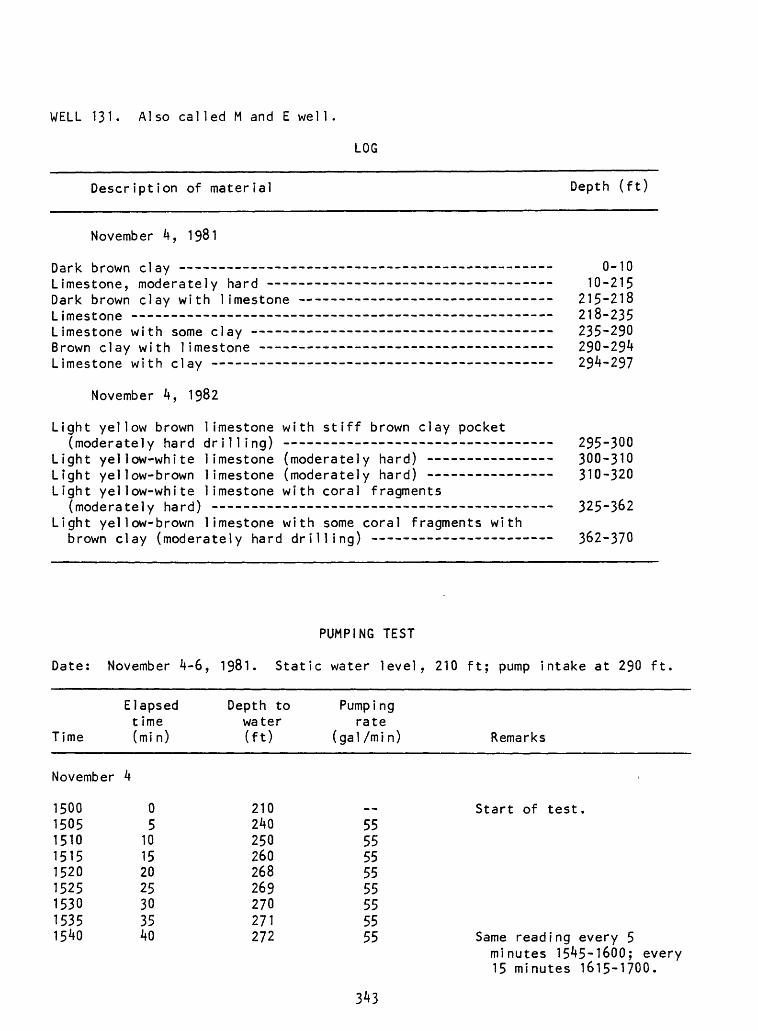
WELL 131. Also called M and E well
LOG
Description of material Depth (ft)
November 4, 1981
Dark brown clay Limestone, moderately hard - Dark brown clay with limestone Limestone --- ----------------Limestone with some clay - Brown clay with limestone -- Limestone with clay ------
November 4, 1982
Light yellow brown limestone with stiff brown clay pocket (moderately hard drilling) - -
Light yellow-white limestone (moderately hard) - Light yellow-brown limestone (moderately hard) ----- ---.Light yellow-white limestone with coral fragments
(moderately hard) Light yellow-brown limestone with some coral fragments with
brown clay (moderately hard drilling) ------------------
0-1010-215
215-218 218-235 235-290 290-294 294-297
295-300 300-310 310-320
325-362
362-370
PUMPING TEST
Date: November 4-6, 1981. Static water level, 210 ft; pump intake at 290 ft.
Time
November
150015051510151515201525153015351540
Elapsed t ime (mi n)
4
05
10152025303540
Depth to water (ft)
210240250260268269270271272
Pumpi ng rate
(gal /mi n) Remarks
Start of test.5555555555555555 Same reading every 5
minutes 1545-1600; every 15 minutes 1615-1700.
343
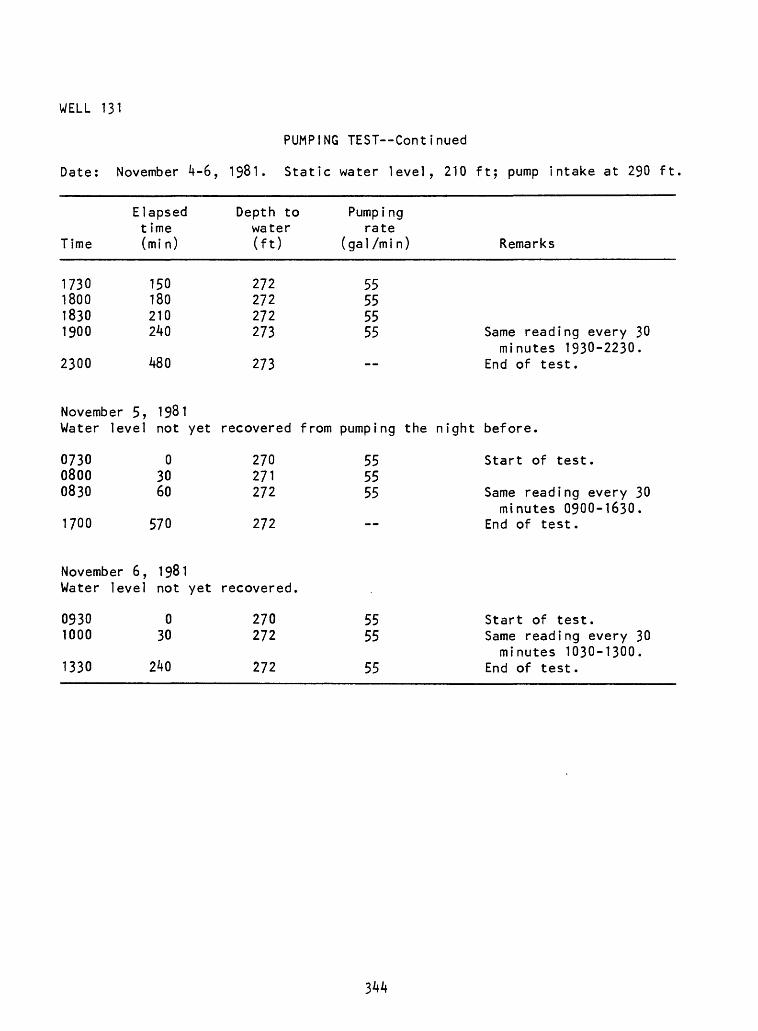
WELL 131
PUMPING TEST Continued
Date: November 4-6, 1981. Static water level, 210 ft; pump intake at 290 ft
Time
1730180018301900
Elapsedtime(mi n)
150180210240
Depth towater(ft)
272272272273
Pump i ngrate
(gal /mi n)
55555555
Remarks
Same reading every 30minutes 1930-2230.
2300 480 273 End of test.
November 5, 1981Water level not yet recovered from pumping the night before.
0730 0 270 55 Start of test.0800 30 271 550830 60 272 55 Same reading every 30
minutes 0900-1630. 1700 570 272 End of test.
November 6, 1981Water level not yet recovered.
0930 0 270 55 Start of test.1000 30 272 55 Same reading every 30
minutes 1030-1300. 1330 240 272 55 End of test.
344
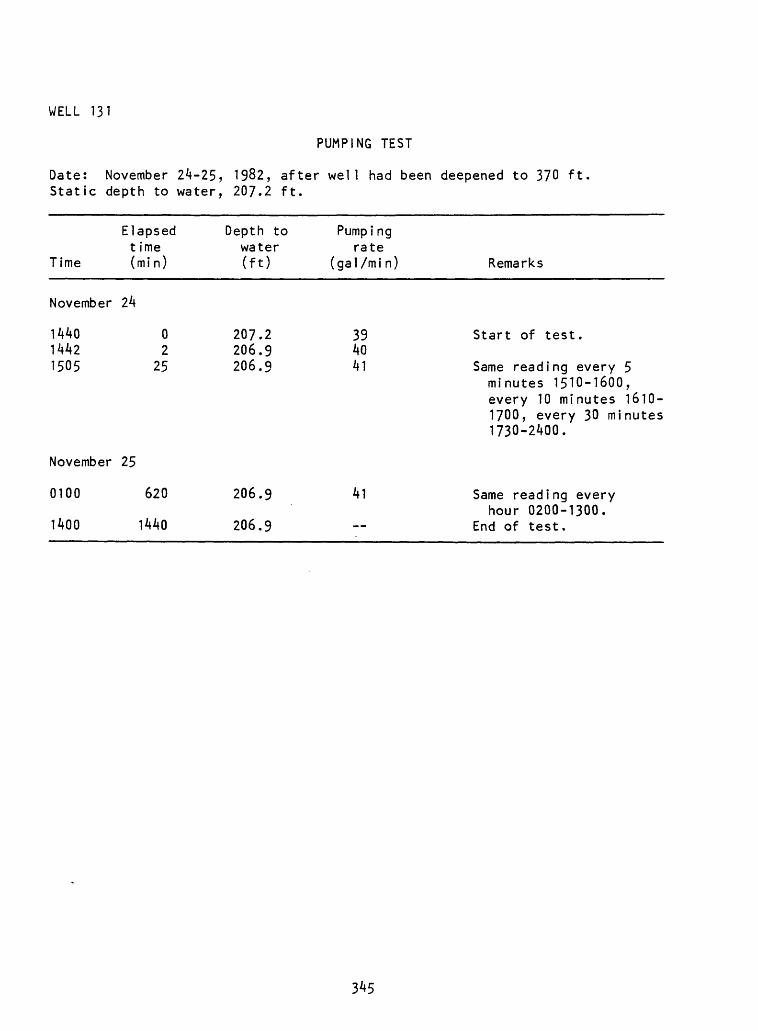
WELL 131
PUMPING TEST
Date: November 24-25, 1982, after well had been deepened to 370 ft Static depth to water, 207.2 ft.
Time
Elapsed t ime (min)
Depth to water (ft)
Pumpi ngrate
(gal/mi n) Remarks
November 24
144014421505
02
25
November 25
0100 620
1400 1440
207.2206.9206.9
206.9
206.9
394041
41
Start of test.
Same reading every 5 minutes 1510-1600, every 10 minutes 1610- 1700, every 30 minutes 1730-2400.
Same reading everyhour 0200-1300.
End of test.
345
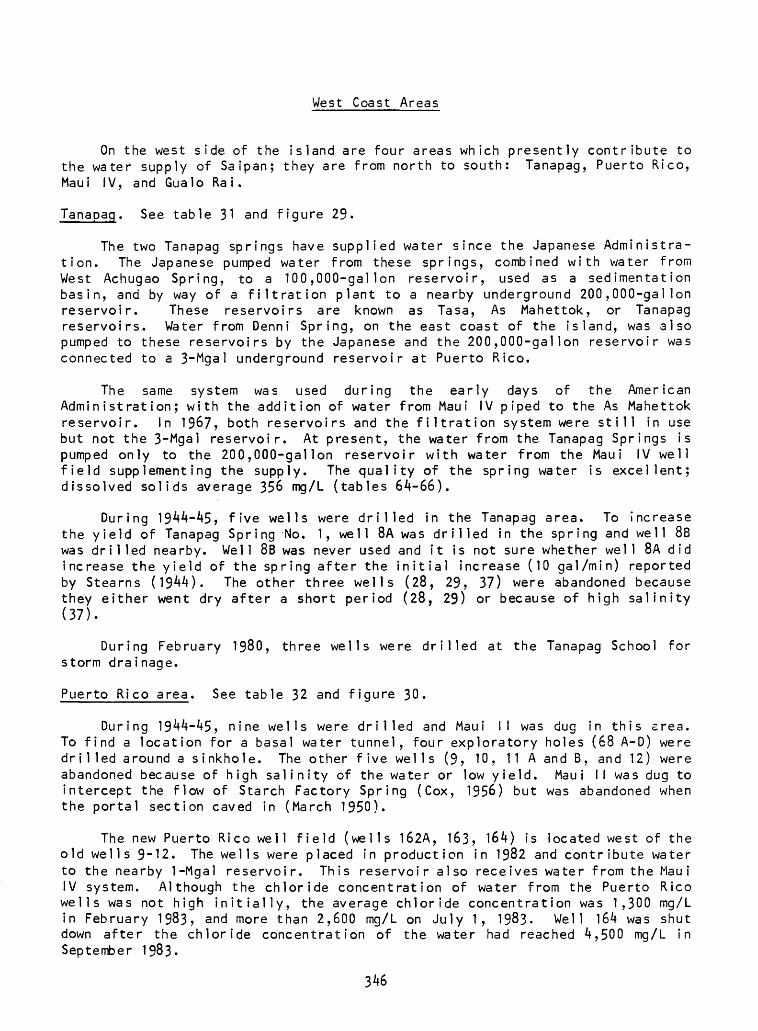
West Coast Areas
On the west side of the island are four areas which presently contribute to the water supply of Saipan; they are from north to south: Tanapag, Puerto Rico, Maui IV, and Gualo RaI.
Tanapaq. See table 31 and figure 29.
The two Tanapag springs have supplied water since the Japanese Administra tion. The Japanese pumped water from these springs, combined with water from West Achugao Spring, to a 100,000-galIon reservoir, used as a sedimentation basin, and by way of a filtration plant to a nearby underground 200,000-galIon reservoir. These reservoirs are known as Tasa, As Mahettok, or Tanapag reservoirs. Water from Denni Spring, on the east coast of the island, was also pumped to these reservoirs by the Japanese and the 200,000-galIon reservoir was connected to a 3~Mga1 underground reservoir at Puerto Rico.
The same system was used during the early days of the American Administration; with the addition of water from Maui IV piped to the As Mahettok reservoir. In 1967, both reservoirs and the filtration system were still in use but not the 3~Mgal reservoir. At present, the water from the Tanapag Springs is pumped only to the 200,000-galIon reservoir with water from the Maui IV well field supplementing the supply. The quality of the spring water is excellent; dissolved solids average 356 mg/L (tables 64-66).
During 1944-45, five wells were drilled in the Tanapag area. To Increase the yield of Tanapag Spring No. 1, well 8A was drilled in the spring and well 88 was drilled nearby. Well 8B was never used and it is not sure whether well 8A did increase the yield of the spring after the initial increase (10 gal/min) reported by Stearns (1944). The other three wells (28, 29, 37) were abandoned because they either went dry after a short period (28, 29) or because of high salinity (37).
During February 1980, three wells were drilled at the Tanapag School for storm drainage.
Puerto Rico area. See table 32 and figure 30.
During 1944-45, nine wells were drilled and Maui II was dug in this area. To find a location for a basal water tunnel, four exploratory holes (68 A-D) were drilled around a sinkhole. The other five wells (9, 10, 11 A and B, and 12) were abandoned because of high salinity of the water or low yield. Maui II was dug to intercept the flow of Starch Factory Spring (Cox, 1956) but was abandoned when the portal section caved in (March 1950).
The new Puerto Rico well field (wells 162A, 163, 164) is located west of the old wells 9~12. The wells were placed in production in 1982 and contribute water to the nearby 1-Mgal reservoir. This reservoir also receives water from the Maui IV system. Although the chloride concentration of water from the Puerto Rico wells was not high initially, the average chloride concentration was 1,300 mg/L in February 1983, and more than 2,600 mg/L on July 1, 1983. Well 164 was shut down after the chloride concentration of the water had reached 4,500 mg/L in September 1983.
346
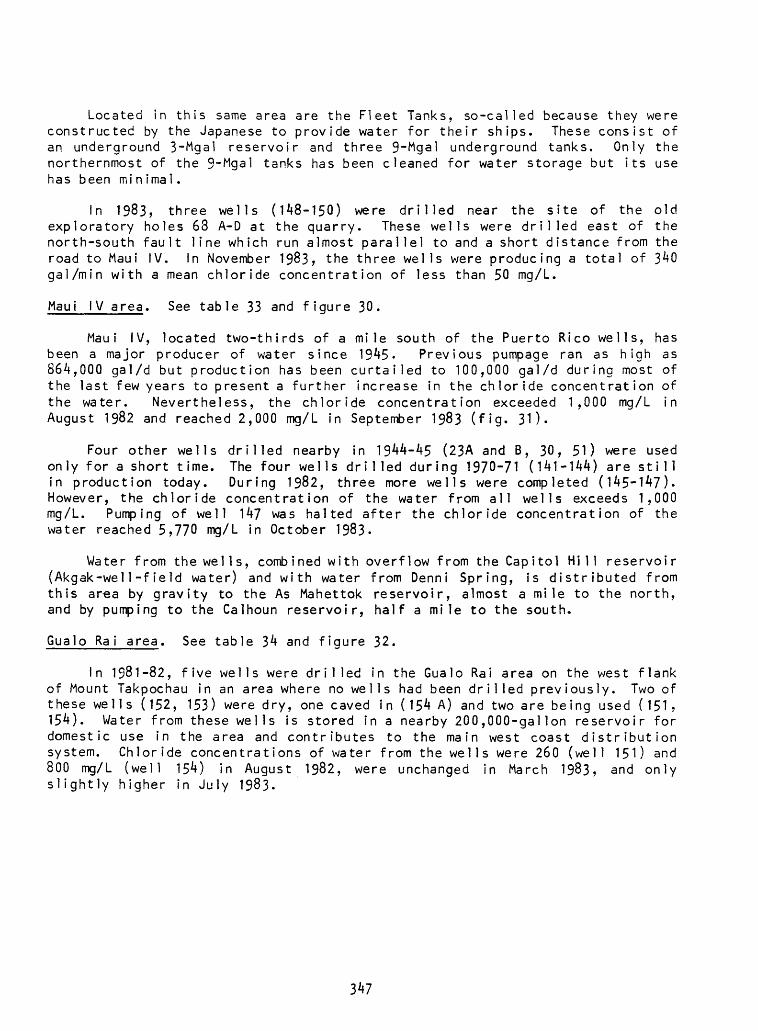
Located in this same area are the Fleet Tanks, so-called because they were constructed by the Japanese to provide water for their ships. These consist of an underground 3~Mgal reservoir and three 9"Mgal underground tanks. Only the northernmost of the 9-Mgal tanks has been cleaned for water storage but its use has been mi n imal.
In 1983, three wells (148-150) were drilled near the site of the old exploratory holes 68 A-D at the quarry. These wells were drilled east of the north-south fault line which run almost parallel to and a short distance from the road to Maui IV. In November 1983, the three wells were producing a total of 340 gal/min with a mean chloride concentration of less than 50 mg/L.
Maui IV area. See table 33 and figure 30.
Maui IV, located two-thirds of a mile south of the Puerto Rico wells, has been a major producer of water since 1945- Previous pumpage ran as high as 864,000 gal/d but production has been curtailed to 100,000 gal/d during most of the last few years to present a further increase in the chloride concentration of the water. Nevertheless, the chloride concentration exceeded 1,000 mg/L in August 1982 and reached 2,000 mg/L in September 1983 (fig. 31).
Four other wells drilled nearby in 1944-45 (23A and B, 30, 51) were used only for a short time. The four wells drilled during 1970-71 (141-144) are still in production today. During 1982, three more wells were completed (145-147). However, the chloride concentration of the water from all wells exceeds 1,000 mg/L. Pumping of well 147 was halted after the chloride concentration of the water reached 5,770 mg/L in October 1983.
Water from the wel Is, comb ined with overflow from the Cap i to 1 Hill reservoi r (Akgak-wel1-field water) and with water from Denni Spring, is distributed from this area by gravity to the As Mahettok reservoir, almost a mile to the north, and by pumping to the Calhoun reservoir, half a mile to the south.
Gualo Ra i area. See table 34 and figure 32.
In 1981-82, five wells were drilled in the Gualo Rai area on the west flank of Mount Takpochau in an area where no wells had been drilled previously. Two of these wells (152, 153) were dry, one caved in (154 A) and two are being used (151, 154). Water from these wells is stored in a nearby 200,000-galIon reservoir for domestic use in the area and contributes to the main west coast distribution system. Chloride concentrations of water from the wells were 260 (well 151) and 800 mg/L (well 154) in August 1982, were unchanged in March 1983, and only slightly higher in July 1983.
347
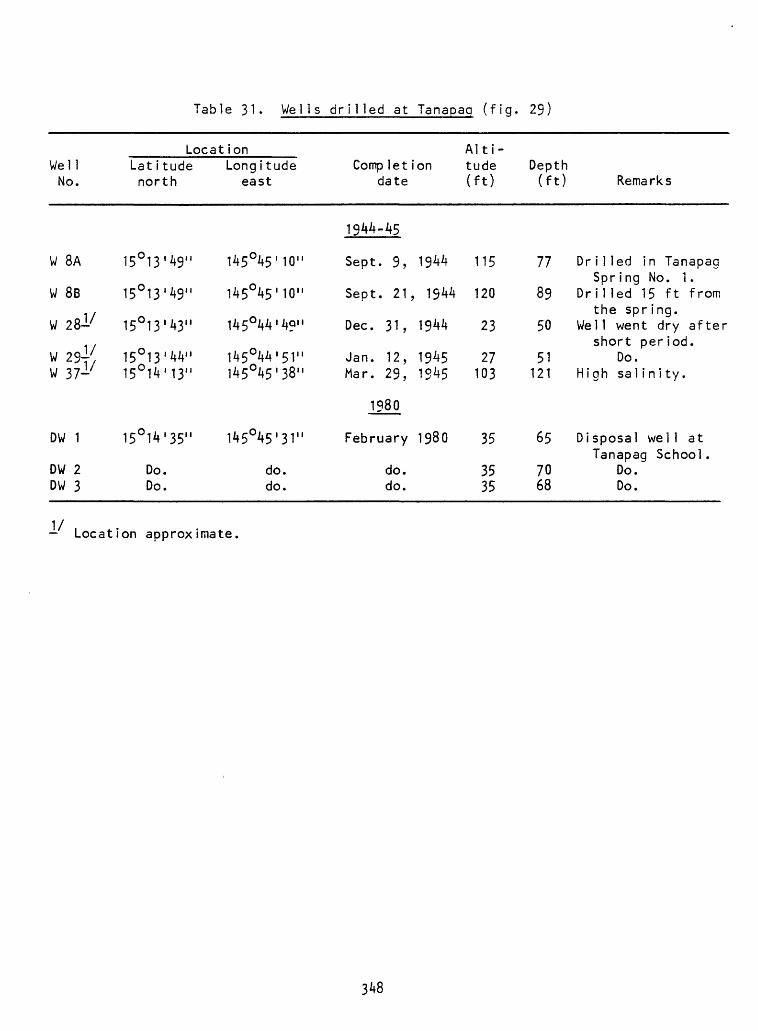
Table 31. WelIs dri1 led at Tanapaq (fig. 29)
Locat ionWell No.
W 8A
W 8B
W 28^'
W 29J'W 37-
DW 1
DW 2DW 3
Lat i tude north
15°13
15°13
15°13
49"
49"
43"
Longi tude east
145°45'
145°45'
145°44'
10"
10"
49"
Comp let date
1944-45
Sept. 9,
Sept. 21
Dec. 31,
ion
1944
, 1944
1944
Alti tude (ft)
115
120
23
Depth (ft)
77
89
50
Remarks
Drilled iSpr ing
Dril led 1the spr
Wel 1 went
n TanapagNo. 15 fting.dry
.from
aftershort period.
15°1315°14
15°14
DoDo
'44"'13"
'35"
.
»
145°44'145°45'
145°45'
dodo
51"38"
31"
.
Jan. 12,Mar. 29,
1980
February
do.do.
19451S45
1980
27103
35
3535
51121
65
7068
Do.High sal i
DisposalTanapag
Do.Do.
n i ty.
we] 1 atSchool .
Location approximate.
348
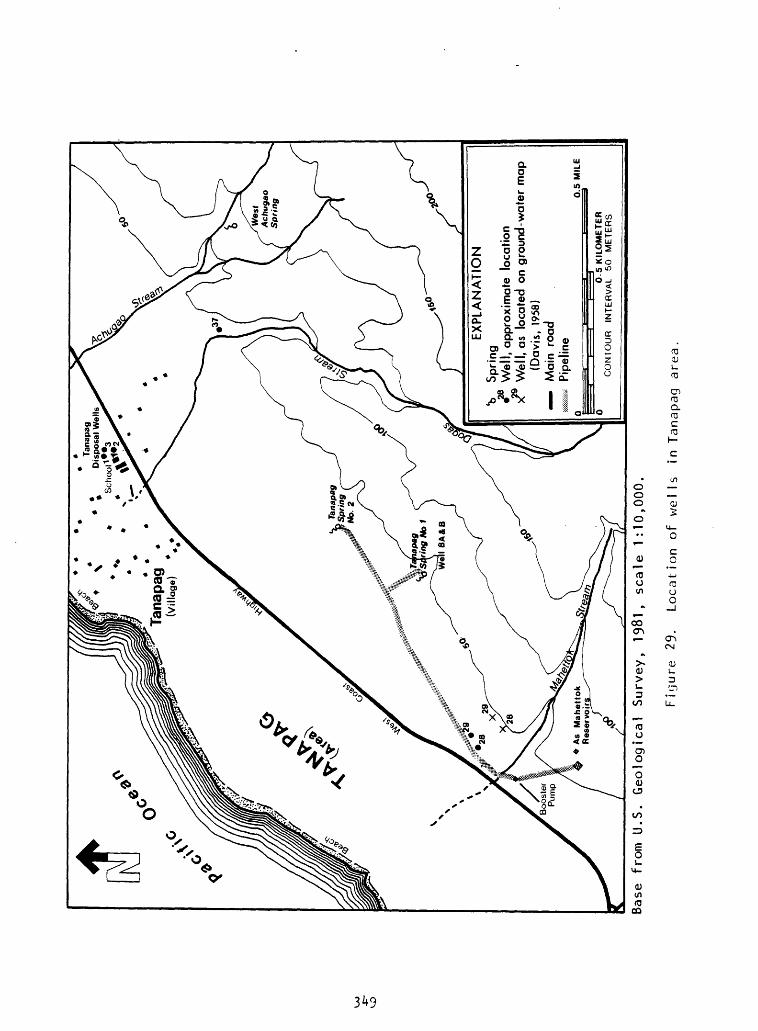
Tana
pag
D
ispo
sal W
ells
Sch
ool 1
f?3
* %v
EX
PLA
NA
TIO
Nw
v
Kli
llfc
|
W
ell,
app
roxi
mat
e lo
catio
nx
Wel
l, as
lo
cate
d on
gro
und-
wat
er m
ap(D
avis
, 19
58)
<
M
ain
road
P
ipel
ine
0.5
KIL
OM
ET
ER
CO
NT
OU
R
INT
ER
VA
L
50
ME
TE
RS
Base from U.S. Geological Survey,
1981
, sc
ale
1:10,000.
Figure 29.
Loca
tion
of
we
lls
in Tanapag ar
ea.
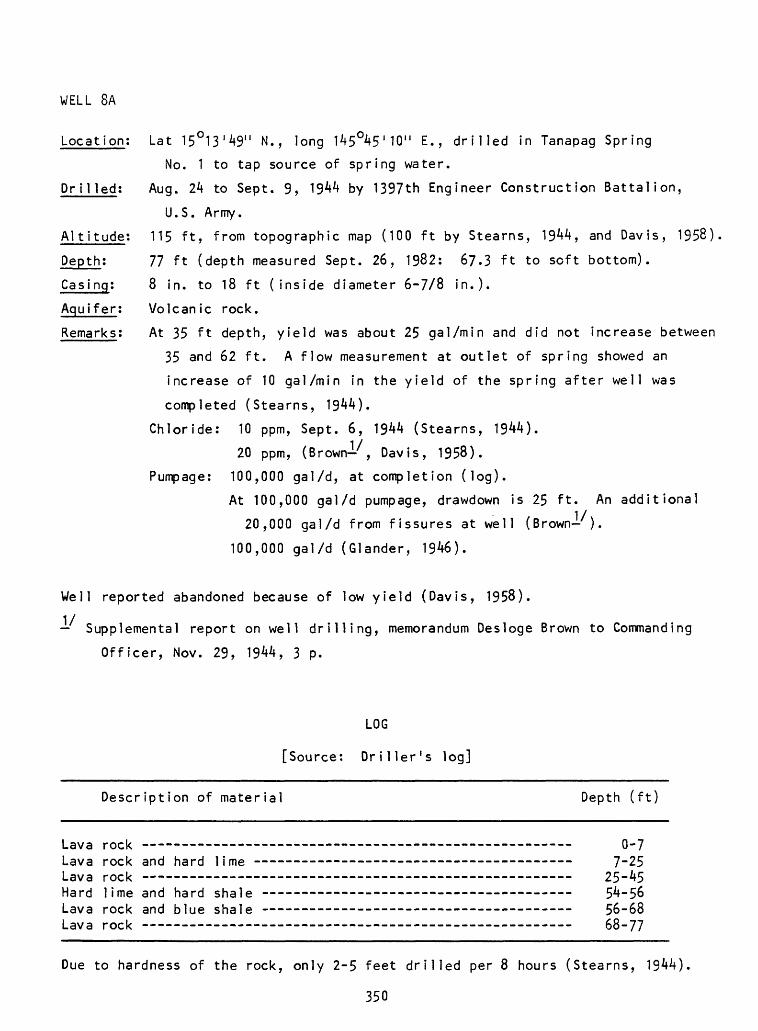
WELL 8A
Locat ion;
Drilled:
Altitude:
Lat 15°13'49" N., long 145O45'10" E., drilled in Tanapag Spring
No. 1 to tap source of spring water.
Aug. 2k to Sept. 9, 1944 by 1397th Engineer Construction Battalion,
U.S. Army.
115 ft, from topographic map (100 ft by Stearns, 1944, and Davis, 1958).
77 ft (depth measured Sept. 26, 1982: 67-3 ft to soft bottom).
8 in. to 18 ft (inside diameter 6-7/8 in.).
Volcanic rock.
At 35 ft depth, yield was about 25 gal/min and did not increase between
35 and 62 ft. A flow measurement at outlet of spring showed an
increase of 10 gal/min in the yield of the spring after well was
completed (Stearns, 1944).
Chloride: 10 ppm, Sept. 6, 1944 (Stearns, 1944).
20 ppm, (Brown- , Davis, 1958).
Pumpage: 100,000 gal/d, at completion (log).
At 100,000 gal/d pumpage, drawdown is 25 ft. An additional
20,000 gal/d from fissures at well (Brown- ).
100,000 gal/d (Glander, 1946).
Well reported abandoned because of low yield (Davis, 1958).
Supplemental report on well drilling, memorandum Desloge Brown to Commanding
Officer, Nov. 29, 1944, 3 p.
LOG
[Source: Driller's log]
Description of material Depth (ft)
Lava rock Lava rock and hard lime Lava rock -------------Hard lime and hard shale Lava rock and blue shale Lava rock --------- -.
0-7 7-25
25-45 54-56 56-68 68-77
Due to hardness of the rock, only 2-5 feet drilled per 8 hours (Stearns, 1944)
350
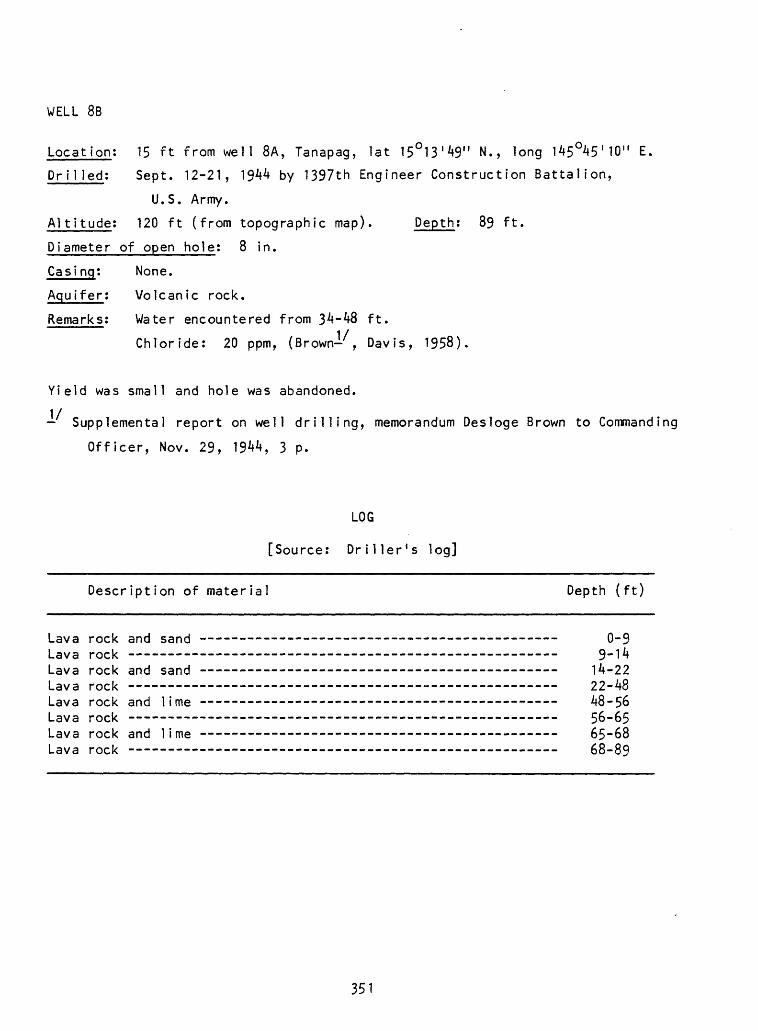
WELL 8B
Location; 15 ft from well 8A, Tanapag, lat 15°13'49" N., long 145°45'10" E.
Dr i1 led; Sept. 12-21, 1944 by 1397th Engineer Construction Battalion,
U.S. Army.
Altltude; 120 ft (from topographic map). Depth; 89 ft.
Diameter of open hole; 8 in.
Casing; None.
Aquifer; Volcanic rock.
Remarks; Water encountered from 34-48 ft.
Chloride; 20 ppm, (Brown- , Davis, 1958).
Yield was small and hole was abandoned.
Supplemental report on well drilling, memorandum Desloge Brown to Commanding
Officer, Nov. 29, 1944, 3 p.
LOG
[Source; Driller's log]
Description of material Depth (ft)
Lava rock and sand - 0-9Lava rock 9-14Lava rock and sand 14-22Lava rock 22-48Lava rock and lime - --- - 48-56Lava rock -- - - - 56-65Lava rock and lime --------- ______________ _______ _____ 65-68Lava rock 68-89
351
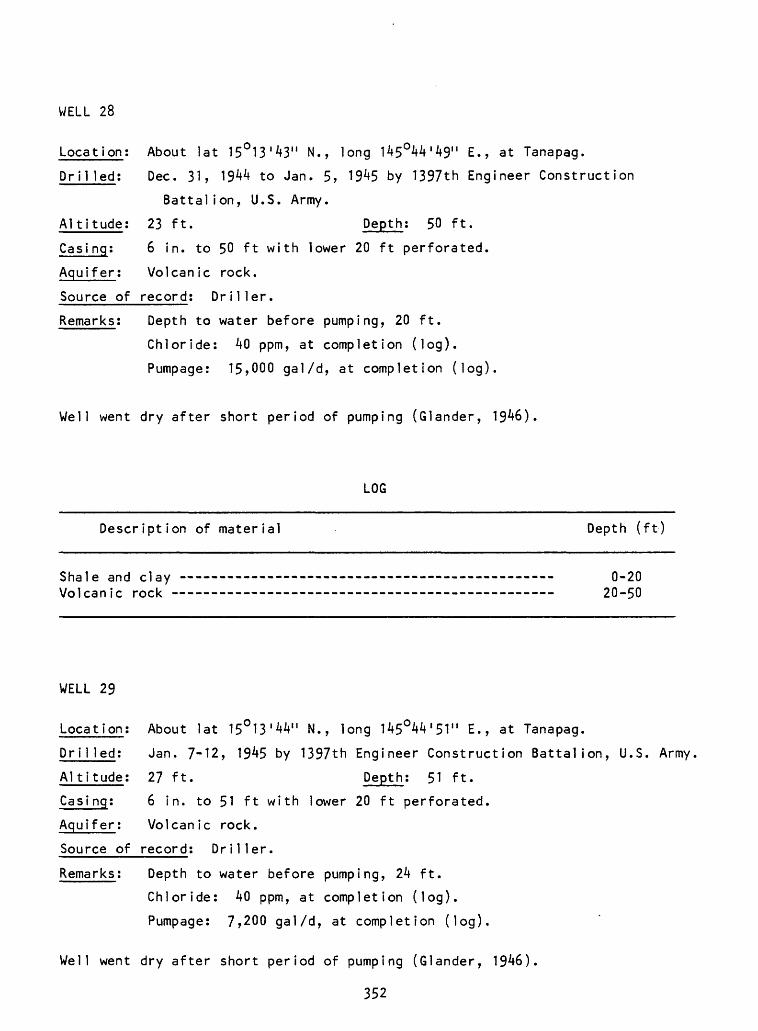
WELL 28
Location: About lat 15°13'43" N., long 145°44 '49" E., at Tanapag.
Drilled; Dec. 31, 1944 to Jan. 5, 1945 by 1397th Engineer Construction
Battalion, U.S. Army.
Altitude: 23 ft. Depth; 50 ft.
Casi ng; 6 in. to 50 ft with lower 20 ft perforated.
Aquifer: Volcanic rock.
Source of record; Driller.
Remarks; Depth to water before pumping, 20 ft.
Chloride: 40 ppm, at completion (log).
Pumpage: 15,000 gal/d, at completion (log).
Well went dry after short period of pumping (Glander, 1946).
LOG
Description of material Depth (ft)
Shale and clay ~ 0-20 Volcanic rock 20-50
WELL 29
Location; About lat 15O 13'44" N., long 145°44'51" E., at Tanapag.
Dri1 led; Jan. 7-12, 1945 by 1397th Engineer Construction Battalion, U.S. Army
Altitude; 27 ft. Depth; 51 ft.
Casi ng; 6 in. to 51 ft with lower 20 ft perforated.
Aquifer; Volcanic rock.
Source of record; Driller.
Remarks; Depth to water before pumping, 24 ft.
Chloride: 40 ppm, at completion (log).
Pumpage: 7,200 gal/d, at completion (log).
Well went dry after short period of pumping (Glander, 1946).
352
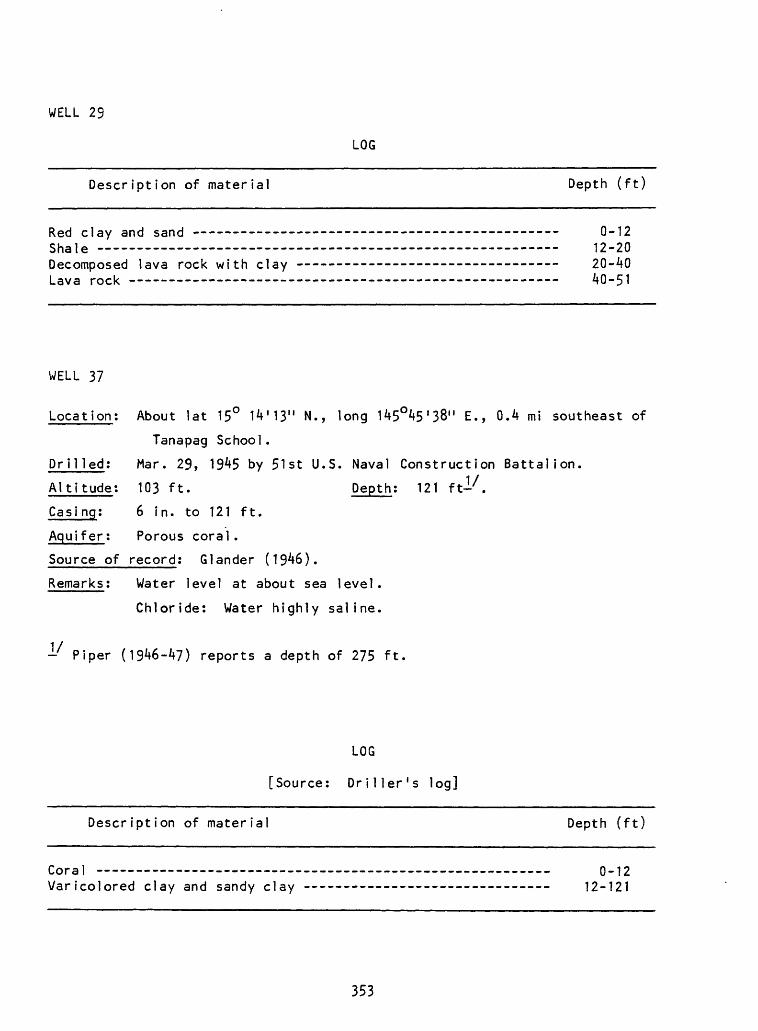
WELL 29
LOG
Description of material Depth (ft)
Red clay and sand -- ----------- ----- -_-_-__________-_-_- 0-12Shale 12-20Decomposed lava rock with clay - - 20-40Lava rock 40-51
WELL 37
Location; About lat 15° 14'13" N., long 145045'38" E., 0.4 mi southeast of
Tanapag School.
Drilled: Mar. 29, 1945 by 51st U.S. Naval Construction Battalion.
Altitude: 103 ft. Depth: 121 ft-/.
Casing; 6 in. to 121 ft.
Aquifer; Porous coral.
Source of record; Glander (1946).
Remarks; Water level at about sea level.
Chloride: Water highly saline.
- Piper (1946-4?) reports a depth of 275 ft.
LOG
[Source: Driller's log]
Description of material Depth (ft)
Coral ----- --__-___-_ _________ _______________ __ __ 0-12Varicolored clay and sandy clay - - 12-121
353
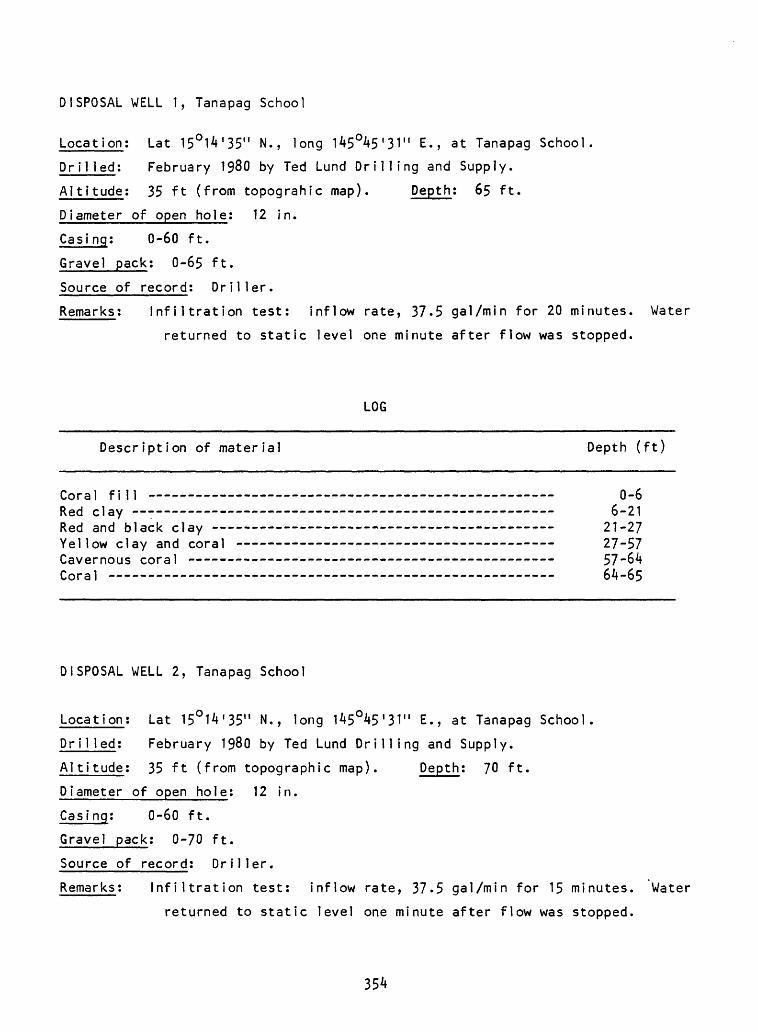
DISPOSAL WELL 1, Tanapag School
Location; Lat 15O 14'35" N., long 145°45'31" E., at Tanapag School.
Dri1 led: February 1980 by Ted Lund Drilling and Supply.
Altitude; 35 ft (from topograhic map). Depth: 65 ft.
Diameter of open hole; 12 in.
Casi ng; 0-60 ft.
Gravel pack; 0-65 ft.
Source of record; Driller.
Remarks; Infiltration test: inflow rate, 37.5 gal/min for 20 minutes. Water
returned to static level one minute after flow was stopped.
LOG
Description of material Depth (ft)
Coral fill 0-6Red clay 6-21Red and black clay 21-27Yellow clay and coral 27-57Cavernous coral 57-64Coral 64-65
DISPOSAL WELL 2, Tanapag School
Location; Lat 15°14'35" N., long 145°45'31" E., at Tanapag School.
Dr i1 led; February 1980 by Ted Lund Drilling and Supply.
Alti tude; 35 ft (from topographic map). Depth; 70 ft.
Diameter of open hole; 12 in.
Casing; 0-60 ft.
Gravel pack; 0-70 ft.
Source of record; Driller.
Remarks; Infiltration test: inflow rate, 37.5 gal/min for 15 minutes. Water
returned to static level one minute after flow was stopped.
354
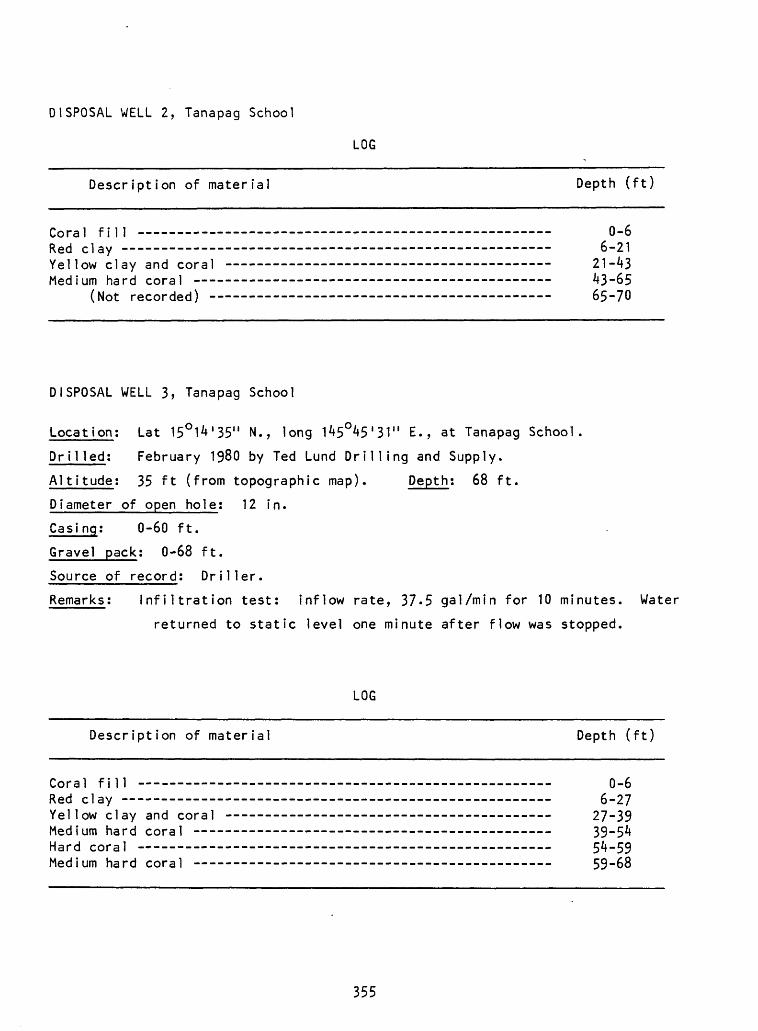
DISPOSAL WELL 2, Tanapag School
LOG
Description of material Depth (ft)
Coral fill 0-6Red clay 6-21Yellow clay and coral - - 21-43Medium hard coral - - - -- 43-65
(Not recorded) 65-70
DISPOSAL WELL 3, Tanapag School
Location; Lat 15°14'35" N., long 145°45'31" E., at Tanapag School.
Dr i1 led: February 1980 by Ted Lund Drilling and Supply.
Altitude: 35 ft (from topographic map). Depth: 68 ft.
Diameter of open hole; 12 in.
Casi ng; 0-60 ft.
Gravel pack; 0-68 ft.
Source of record; Driller.
Remarks; Infiltration test: inflow rate, 37*5 gal/min for 10 minutes. Water
returned to static level one minute after flow was stopped.
LOG
Description of material Depth (ft)
Coral fill 0-6Red clay 6-27Yellow clay and coral - 27-39Medium hard coral - - - - 39-54Hard coral 54-59Medium hard coral - - - - 59-68
355
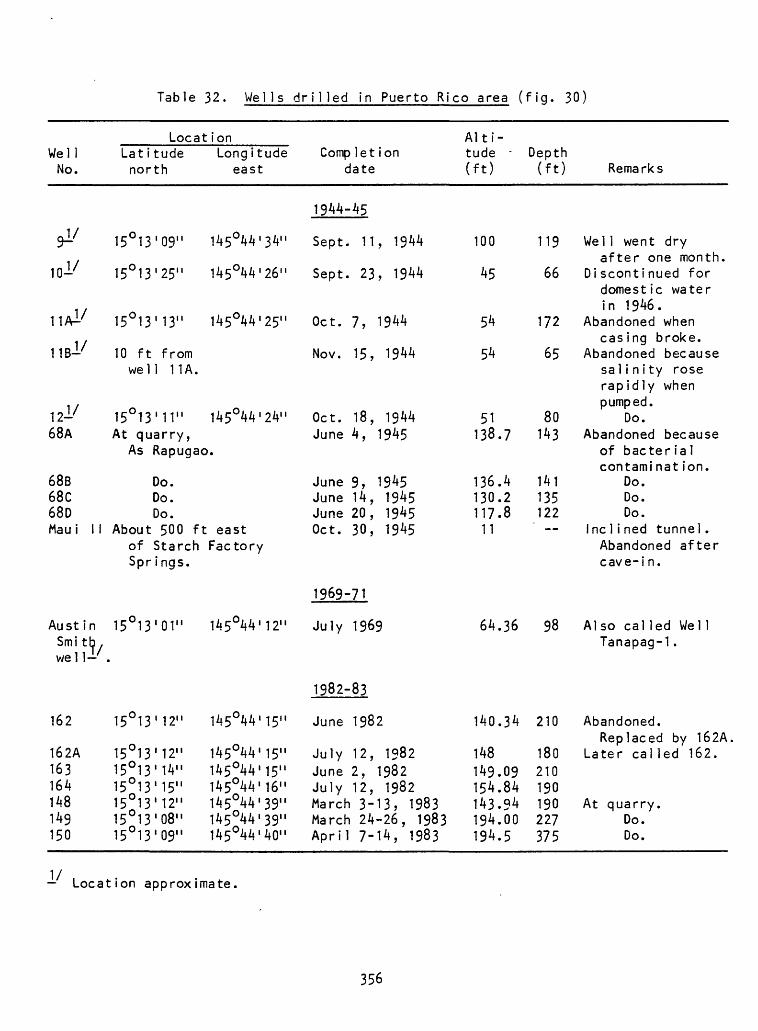
Table 32. Wells drilled in Puerto Rico area (fig. 30)
Well No.
9J/
W-/
IIA^.
1 1B-
12-68A
68B68C68DMau i II
Aust inSmi tb.well-7
162
162A163164148149150
Locat ionLatitude Longitude north east
15°13'09" 145°44'34"
150 13'25" 145044'26"
15 0 13'13" 145044'25"
10 ft fromwell 11A.
15 0 13'11" 145°44'24"At quarry,
As Rapugao.
Do.Do.Do.
About 500 ft eastof Starch FactorySpr ings.
15 0 13'01" 145°44'12"
15°13'12" 145044'15"
15°13'12" 145044'15"15°13'14" 145044'15"15°13'15" 145°44'16"15°13'12" 145°44 I 39"15°13'08" 145044'39"15 0 13'09" 145°44'40"
Comp let ion date
1944-45
Sept. 11, 1944
Sept. 23, 1944
Oct. 7, 1944
Nov. 15, 1944
Oct. 18, 1944June 4, 1945
June 9, 1945June 14, 1945June 20, 1945Oct. 30, 1945
1969-71
July 1969
1982-83
June 1982
July 12, 1982June 2, 1982July 12, 1982March 3-13, 1983March 24-26, 1983April 7-14, 1983
Alti tude -
(ft)
100
45
54
54
51138.7
136.4130.2117.811
64.36
140.34
148149.09154.84143.94194.00194.5
Depth (ft)
119
66
172
65
80143
141135122
98
210
180210190190227375
Remarks
Wel 1 went dryafter one month.
Discontinued fordomestic waterin 1946.
Abandoned whencasing broke.
Abandoned becausesalinity roserapidly whenpumped.
Do.Abandoned because
of bacterialcontaminat ion.
Do.Do.Do.
Inc 1 i ned tunnel .Abandoned aftercave-i n.
Also called WellTanapag-1 .
Abandoned.Replaced by 162A
Later cal led 162.
At quarry.Do.Do.
Location approximate.
356
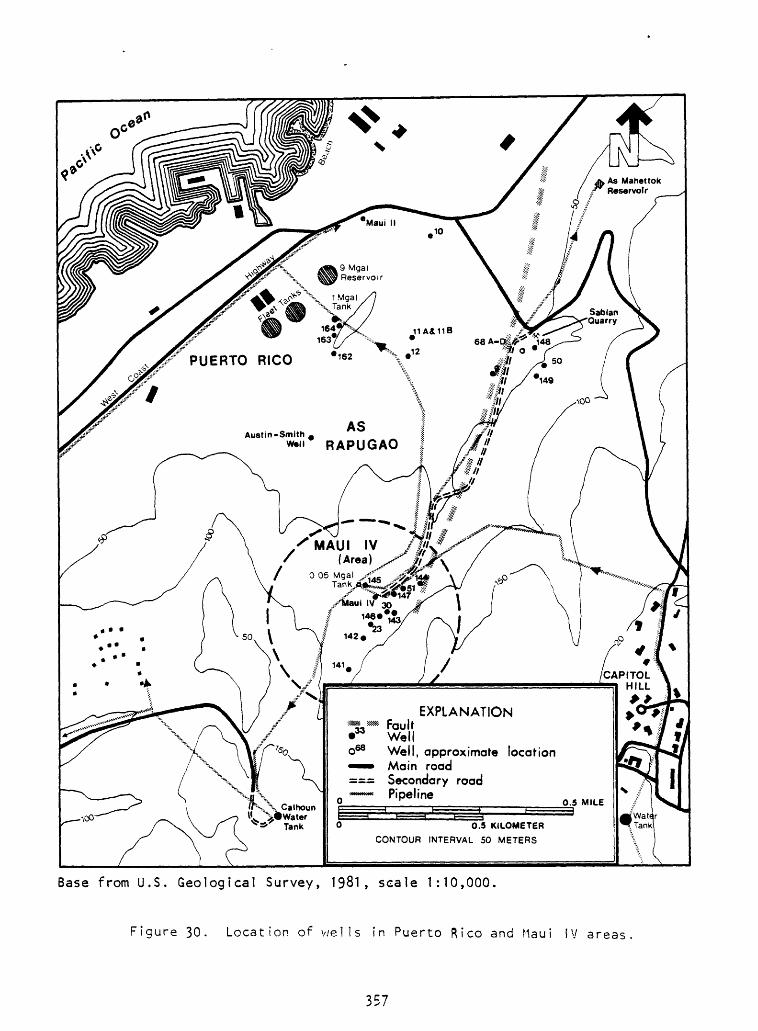
PUERTO RICO
.RAPUGAO
EXPLANATION33 ^Ult M Wello68 Well, approximate location " Main road === Secondary road
PipelineCalhoun
">HWater * Tank 0.5 KILOMETER
CONTOUR INTERVAL 50 METERS
Base from U.S. Geological Survey, 1981, seale 1:10,000.
Figure 30. Location of wells in Puerto Rico and Maui IV areas.
357
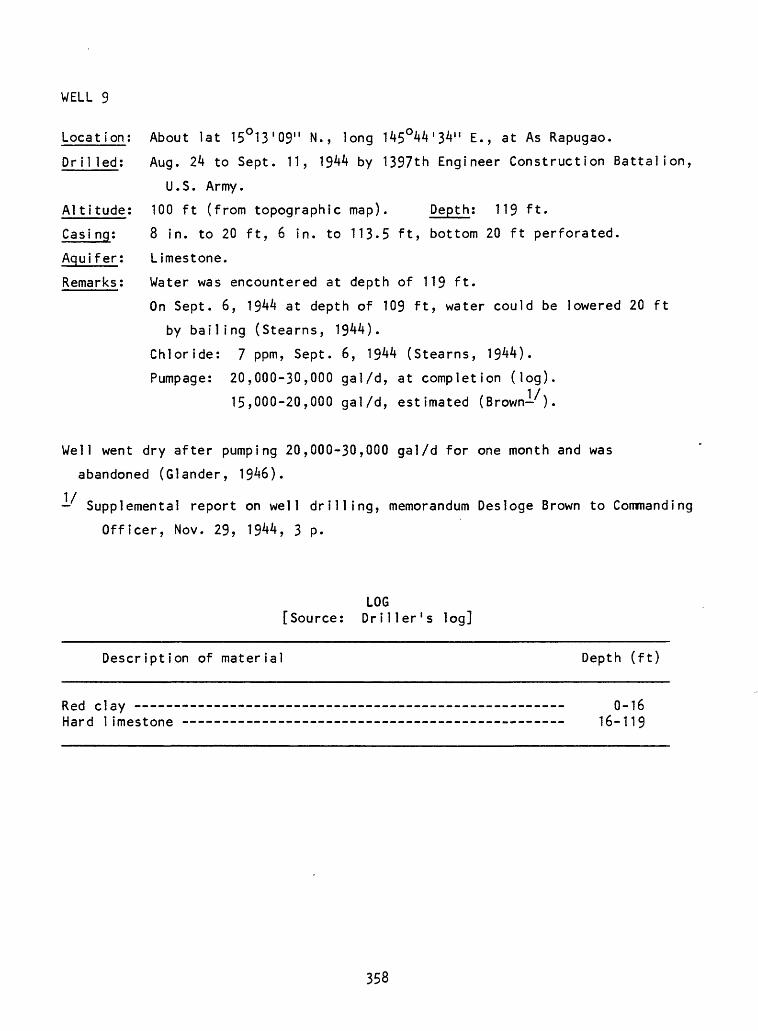
WELL 9
Location; About lat 15°13'09" N., long 145°44'34" E., at As Rapugao.
Drilled: Aug. 24 to Sept. 11, 1944 by 1397th Engineer Construction Battalion,
U.S. Army.
Al titude; 100 ft (from topographic map). Depth; 119 ft.
Casing; 8 in. to 20 ft, 6 in. to 113-5 ft, bottom 20 ft perforated.
Aquifer; Limestone.
Remarks; Water was encountered at depth of 119 ft.
On Sept. 6, 1944 at depth of 109 ft, water could be lowered 20 ft
by bailing (Stearns, 1944).
Chloride; 7 ppm, Sept. 6, 1944 (Stearns, 1944).
Pumpage; 20,000-30,000 gal/d, at completion (log).
15,000-20,000 gal/d, estimated (Brown- ).
Well went dry after pumping 20,000-30,000 gal/d for one month and was
abandoned (Glander, 1946).
Supplemental report on well drilling, memorandum Desloge Brown to Commanding
Officer, Nov. 29, 1944, 3 p.
LOG [Source; Driller's log]
Description of material Depth (ft)
Red clay 0-16 Hard limestone 16-119
358
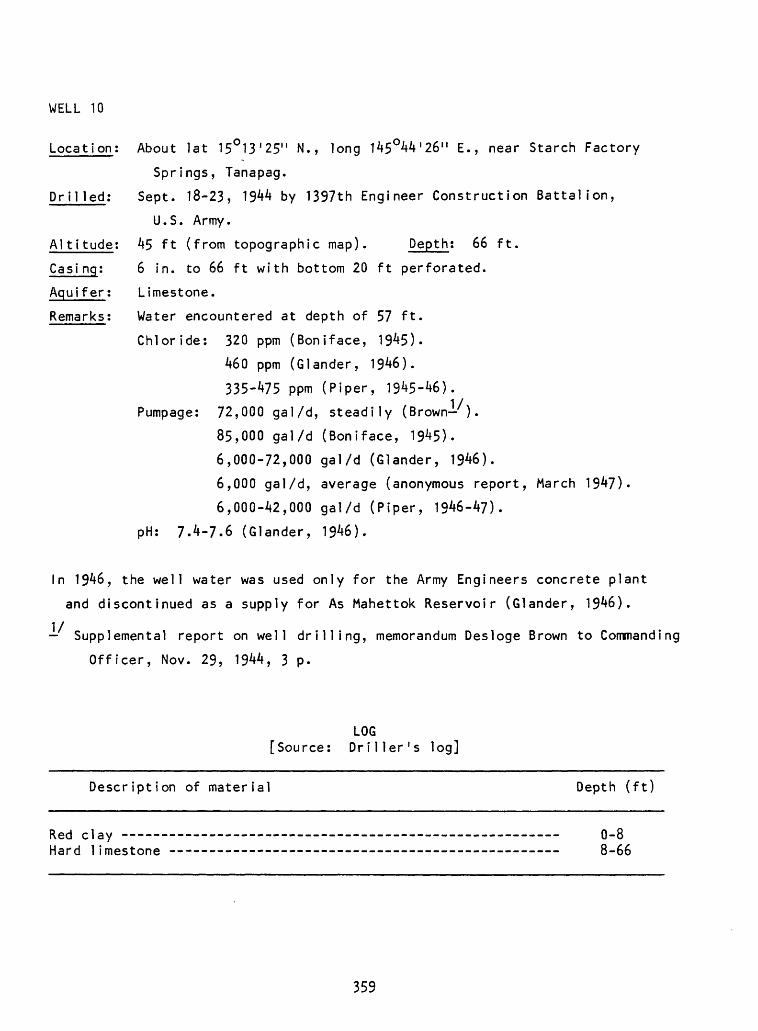
WELL 10
Location;
Dri)led;
A)titude:
Casi ng;
Aquifer:
Remarks:
About lat 15°13'25" N., long 145°44'26" E., near Starch Factory
Springs, Tanapag.
Sept. 18-23, 1944 by 1397th Engineer Construction Battalion,
U.S. Army.
45 ft (from topographic map). Depth; 66 ft.
6 in. to 66 ft with bottom 20 ft perforated.
Limestone.
Water encountered at depth of 57 ft.
Chloride: 320 ppm (Boniface, 1945).
460 ppm (Glander, 1946).
335-475 ppm (Piper, 1945-46).
Pumpage: 72,000 gal/d, steadily (Brown-).
85,000 gal/d (Boniface, 1945).
6,000-72,000 gal/d (Glander, 1946).
6,000 gal/d, average (anonymous report, March 1947)-
6,000-42,000 gal/d (Piper, 1946-47).
pH: 7.4-7.6 (Glander, 1946).
In 1946, the well water was used only for the Army Engineers concrete plant
and discontinued as a supply for As Mahettok Reservoir (Glander, 1946).
Supplemental report on well drilling, memorandum Desloge Brown to Commanding
Officer, Nov. 29, 1944, 3 p.
[Source:LOG Driller's log]
Description of material Depth (ft)
Red clay - Hard limestone
0-8 8-66
359
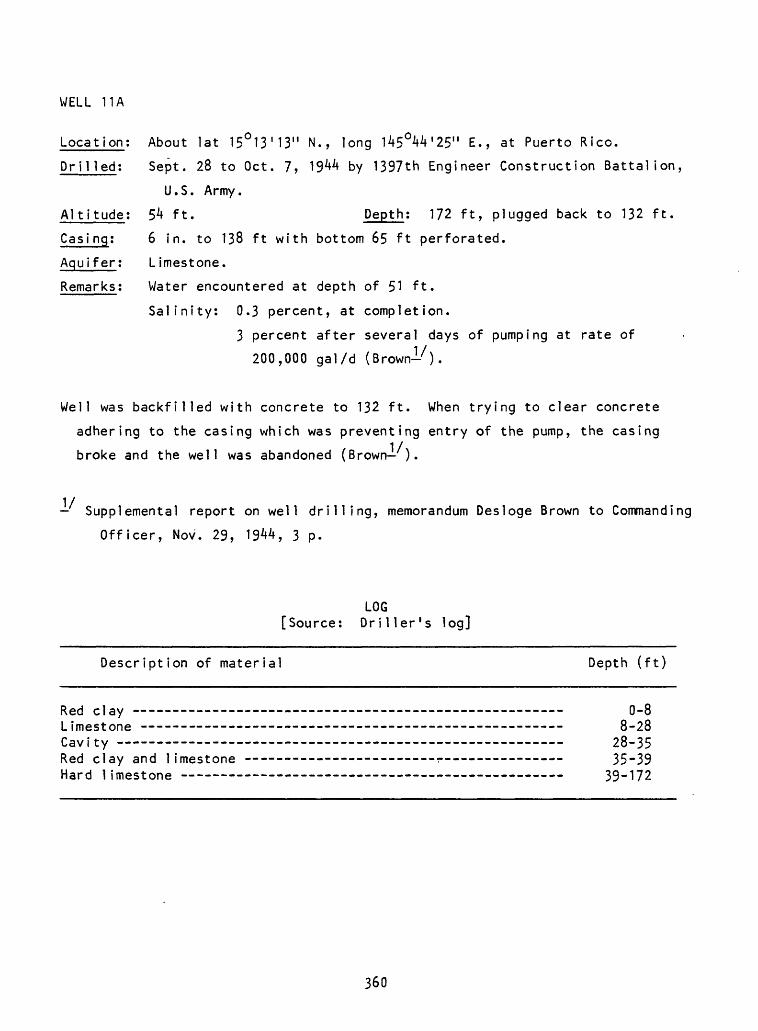
WELL 11A
Location;
Drilled:
Altitude;
Gas? ng;
Aquifer;
Remarks;
About lat 15°13'13" N., long 145°44'25" E., at Puerto Rico.
Sept. 28 to Oct. 7, 1944 by 1397th Engineer Construction Battalion,
U.S. Army.
54 ft. Depth; 172 ft, plugged back to 132 ft.
6 in. to 138 ft with bottom 65 ft perforated.
Limestone.
Water encountered at depth of 51 ft.
Salinity; 0.3 percent, at completion.
3 percent after several days of pumping at rate of
200,000 gal/d (Brown-/).
Well was backfilled with concrete to 132 ft. When trying to clear concrete
adhering to the casing which was preventing entry of the pump, the casing
broke and the well was abandoned (Brown ).
Supplemental report on well drilling, memorandum Desloge Brown to Commanding
Officer, Nov. 29, 1944, 3 p.
[SourceLOG Driller's log]
Description of material Depth (ft)
Red clay - - Limestone - - Cavity - - Red clay and limestone Hard 1 imestone
0-88-28
28-3535-39
360
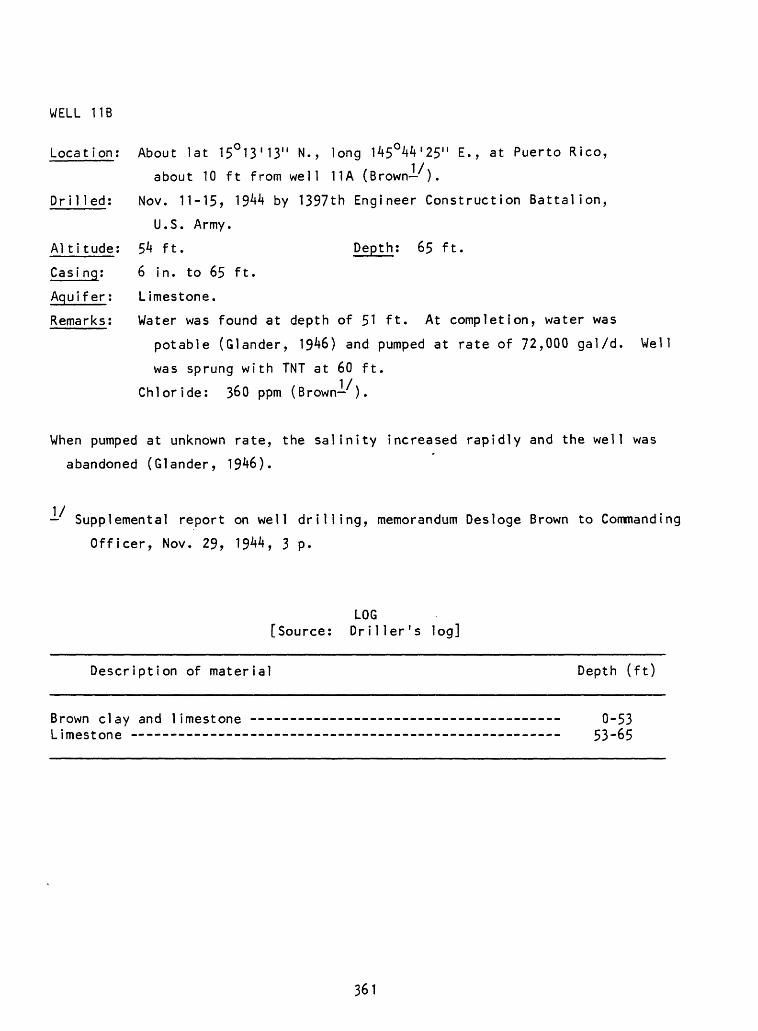
WELL 11B
Location; About lat 15°13'13" N., long 145°44'25" E., at Puerto Rico,
about 10 ft from well 11A (Brown- ).
Drilled: Nov. 11-15, 1944 by 1397th Engineer Construction Battalion,
U.S. Army.
Altitude; 5k ft. Depth; 65 ft.
Casi ng; 6 in. to 65 ft.
Aquifer; Limestone.
Remarks; Water was found at depth of 51 ft. At completion, water was
potable (Glander, 1946) and pumped at rate of 72,000 gal/d. Well
was sprung with TNT at 60 ft.
Chloride: 360 ppm (Brown- ).
When pumped at unknown rate, the salinity increased rapidly and the well was
abandoned (Glander, 1946).
Supplemental report on well drilling, memorandum Desloge Brown to Commanding
Officer, Nov. 29, 1944, 3 p.
LOG [Source: Driller's log]
Description of material Depth (ft)
Brown clay and limestone - - -- -- 0-53 Limestone - -- -- - - 53-65
361
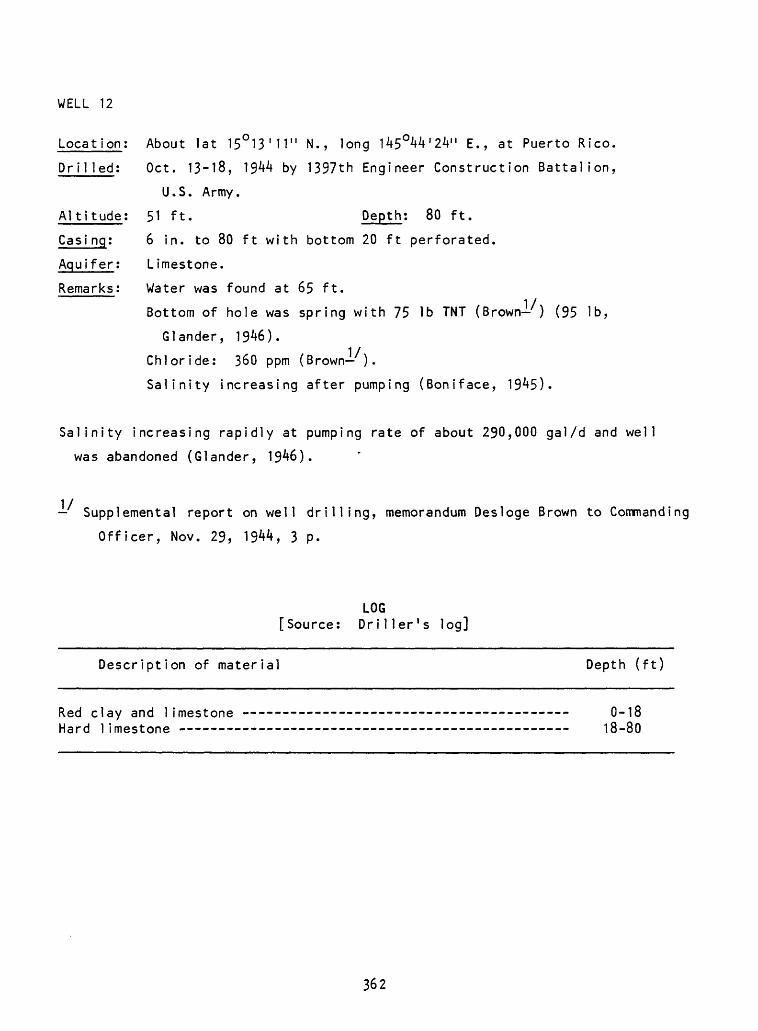
WELL 12
Location: About lat 15°13'11" N., long 145°44'24" E., at Puerto Rico.
Drilled; Oct. 13-18, 1944 by 1397th Engineer Construction Battalion,
U.S. Army.
Altitude; 51 ft. Depth; 80 ft.
Casing; 6 in. to 80 ft with bottom 20 ft perforated.
Aquifer; Limestone.
Remarks; Water was found at 65 ft.
Bottom of hole was spring with 75 Ib TNT (Brown-) (95 Ib,
dander, 1946).
Chloride: 360 ppm (Brown ).
Salinity increasing after pumping (Boniface, 1945).
Salinity increasing rapidly at pumping rate of about 290,000 gal/d and well
was abandoned (Glander, 1946).
Supplemental report on well drilling, memorandum Desloge Brown to Commanding
Officer, Nov. 29, 1944, 3 p.
LOG [Source: Driller's log]
Description of material Depth (ft)
Red clay and limestone - - -- -- --- ----- - 0-18 Hard limestone 18-80
362
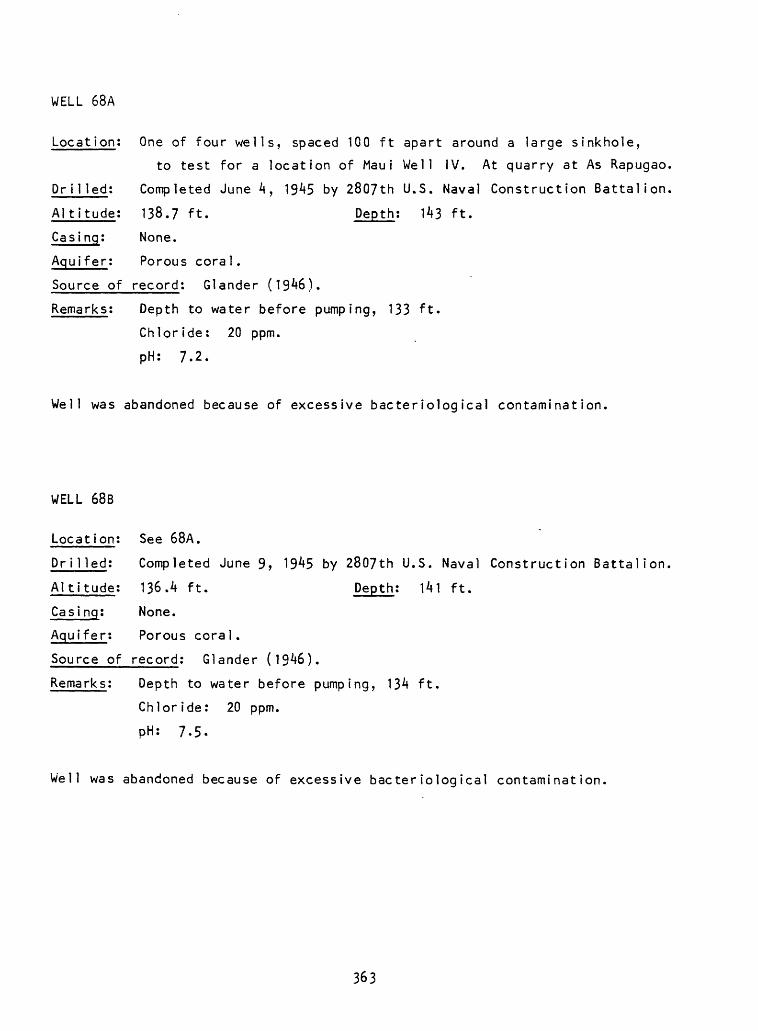
WELL 68A
Locat ion: One of four wells, spaced 100 ft apart around a large sinkhole,
to test for a location of Maui Well IV. At quarry at As Rapugao,
Dri1 led: Completed June 4, 19^5 by 2807th U.S. Naval Construction Battalion,
Altitude; 138.7 ft. Depth; 143 ft.
Casi nq; None.
Aquifer; Porous coral.
Source of record; Glander (1946).
Remarks; Depth to water before pumping, 133 ft.
Chloride; 20 ppm.
pH; 7.2.
Well was abandoned because of excessive bacteriological contamination.
WELL 68B
Location; See 68A.
Dri 1 led; Completed June 9, 19^5 by 2807th U.S. Naval Construction Battalion,
Altitude; 136.4 ft. Depth; 141 ft.
Casi nq; None.
Aquifer; Porous coral.
Source of record; Glander (1946).
Remarks; Depth to water before pumping, 134 ft.
Chloride: 20 ppm.
pH: 7.5.
Well was abandoned because of excessive bacteriological contamination.
363
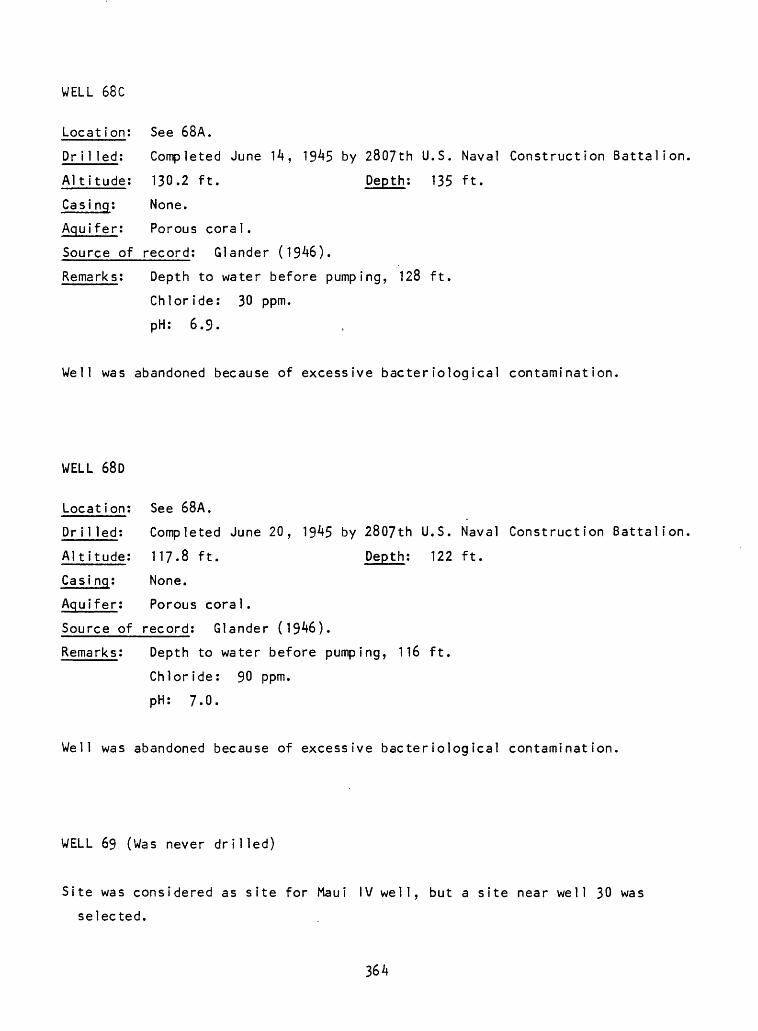
WELL 68C
Location; See 68A.
DrM Ted; Completed June 14, 1945 by 2807th U.S. Naval Construction Battalion,
Altitude: 130.2 ft. Depth: 135 ft.
Casi nq: None.
Aquifer: Porous coral.
Source of record: Glander (1946).
Remarks: Depth to water before pumping, 128 ft.
Chloride: 30 ppm.
pH: 6.9.
Well was abandoned because of excessive bacteriological contamination.
WELL 68D
Location: See 68A.
Drilled: Completed June 20, 1945 by 2807th U.S. Naval Construction Battalion,
Altitude: 117-8 ft. Depth: 122 ft.
Casi nq: None.
Aquifer: Porous coral.
Source of record: Glander (1946).
Remarks: Depth to water before pumping, 116 ft.
Chloride: 90 ppm.
pH: 7.0.
Well was abandoned because of excessive bacteriological contamination.
WELL 69 (Was never drilled)
Site was considered as site for Maui IV well, but a site near well 30 was
selected.
364
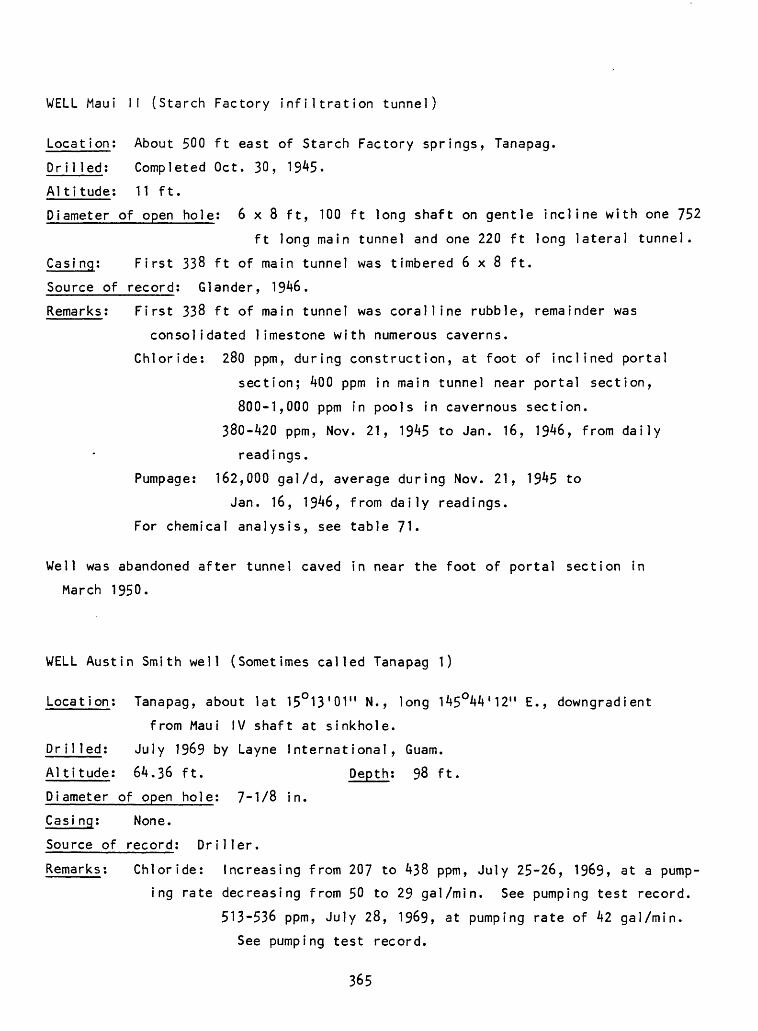
WELL Maui II (Starch Factory infiltration tunnel)
Locat ion; About 500 ft east of Starch Factory springs, Tanapag.
Drilled; Completed Oct. 30, 1945.
Altitude: 11 ft.
Diameter of open hole; 6x8 ft, 100 ft long shaft on gentle incline with one 752
ft long main tunnel and one 220 ft long lateral tunnel.
Casi ng; First 338 ft of main tunnel was timbered 6x8 ft.
Source of record; Glander, 1946.
Remarks; First 338 ft of main tunnel was coralline rubble, remainder was
consolidated limestone with numerous caverns.
Chloride; 280 ppm, during construction, at foot of inclined portal
section; 400 ppm in main tunnel near portal section,
800-1,000 ppm in pools in cavernous section.
380-420 ppm, Nov. 21, 1945 to Jan. 16, 1946, from daily
readings.
Pumpage; 162,000 gal/d, average during Nov. 21, 1945 to
Jan. 16, 1946, from daily readings.
For chemical analysis, see table 71.
Well was abandoned after tunnel caved in near the foot of portal section in
March 1950.
WELL Austin Smith well (Sometimes called Tanapag 1)
Location; Tanapag, about lat 15°13'01" N., long 145°44'12" E., downgradient
from Maui IV shaft at sinkhole.
Drilled; July 1969 by Layne International, Guam.
Altitude; 64.36 ft. Depth; 98 ft.
Diameter of open hole; 7-1/8 in.
Casi ng; None.
Source of record; Driller.
Remarks; Chloride: Increasing from 207 to 438 ppm, July 25-26, 1969, at a pump
ing rate decreasing from 50 to 29 gal/min. See pumping test record.
513-536 ppm, July 28, 1969, at pumping rate of 42 gal/min.
See pumping test record.
365
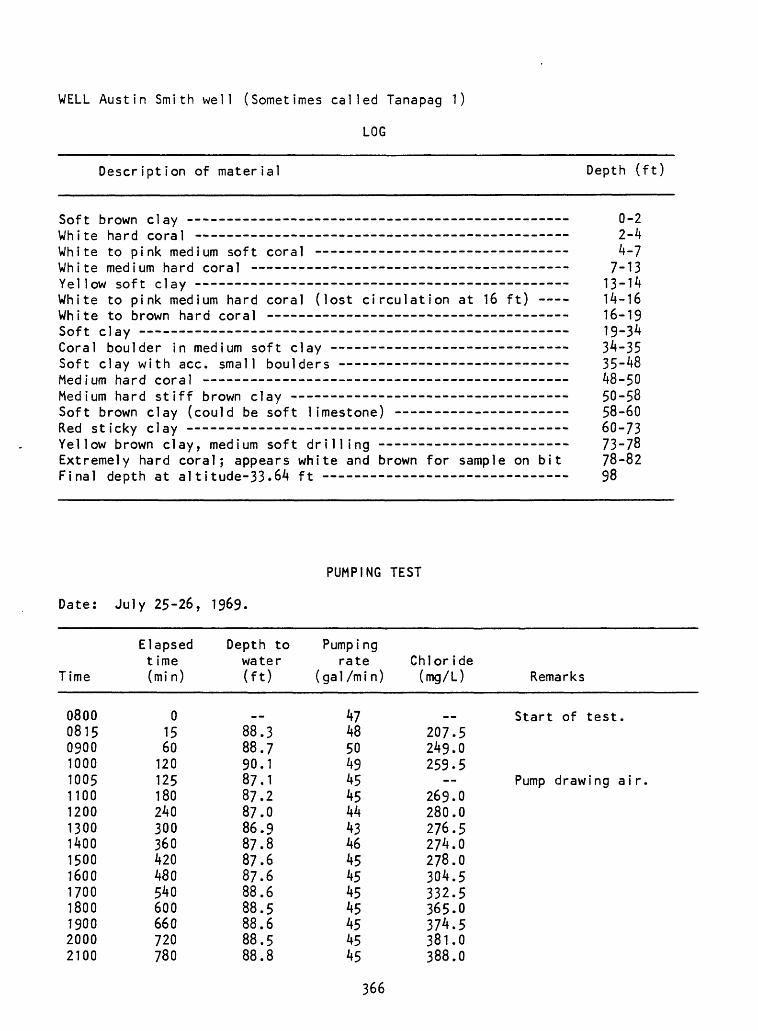
WELL Austin Smith well (Sometimes called Tanapag 1)
LOG
Description of material Depth (ft)
Soft brown clay ----------------- _______________ ____ .White hard coral ----------- ________________________________White to pink medium soft coral ------------------------------White medium hard coral ------- ____________ ______________Yellow soft clay -------------------------------- ----- ___--.White to pink medium hard coral (lost circulation at 16 ft) White to brown hard coral ---- __-____--__--____-__ _____ .Soft clay - - Coral boulder in medium soft clay -------- - ----- _--- ---.Soft clay with ace. small boulders --- -- ------- -_--___-.Medium hard coral - - - - - Medium hard stiff brown clay - - - Soft brown clay (could be soft limestone) - ________ ____.Red sticky clay - - - - Yellow brown clay, medium soft drilling ---------- __________Extremely hard coral; appears white and brown for sample on bit Final depth at al ti tude-33.64 ft
0-22-44-7
7-1313-1414-16 16-19 19-3434-3535-48 48-50 50-58 58-60 60-73 73-78 78-82 98
Date: July 25-26, 1969.
PUMPING TEST
Time
Elapsed t ime (min)
Depth to water (ft)
Pumpingrate
(gal/mi n)Chloride (mg/L) Remarks
0800081509001000100511001200130014001500160017001800190020002100
01560
120125180240300360420480540600660720780
88.388.790.187.187.287.086.987.887878888888888.8
47485049454544434645454545454545
207.5249.0259.5
269.0280.0276.5274.0278.0304.5332.5365.0374.5381.0388.0
Start of test.
Pump drawing ai r
366
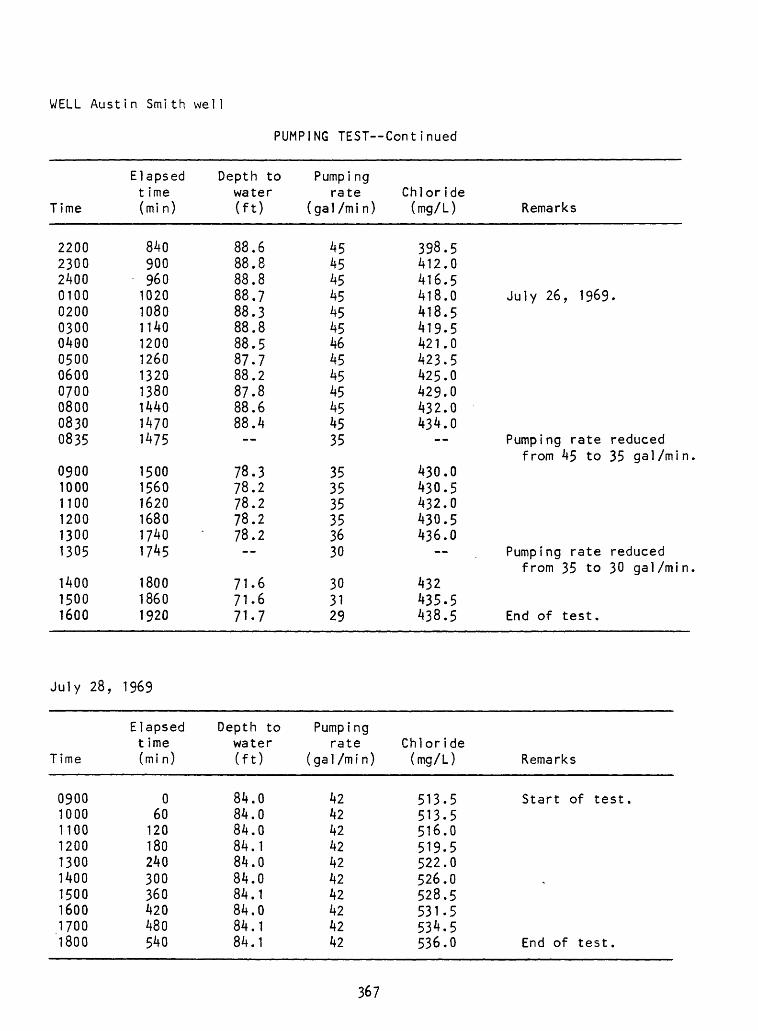
WELL Austin Smith wel1
PUMPING TEST Continued
Time
2200230024000100020003000400050006000/00080008300835
090010001100120013001305
140015001600
Elapsed t ime (mi n)
8409009601020108011401200126013201380144014701475
150015601620168017401745
180018601920
Depth to water (ft)
88.688.888.888.788.388.888.587.788.287.888.688.4
78.378.278.278.278.2
71.671.671.7
Pumpi ng rate
(gal/min)
45454545454546454545454535
353535353630
303129
Chloride (mg/L) Remarks
398.5412.0416.5418.0 July 26, 1969.418.5419.5421.0423.5425.0429.0432.0434.0
Pumping rate reducedfrom 45 to 35 gal/min
430.0430.5432.0430.5436.0
Pumping rate reducedfrom 35 to 30 gal/min
432435.5438.5 End of test.
July 28, 1969
Time
0900100011001200130014001500160017001800
Elapsed t ime (mi n)
060120180240300360420480540
Depth to water (ft)
84.084.084.084.184.084.084.184.084.184.1
Pumping rate
(gal/min)
42424242424242424242
Chloride (mg/L) Remarks
513.5 Start of test.513.5516.0519.5522.0526.0528.5531.5534.5536.0 End of test.
367
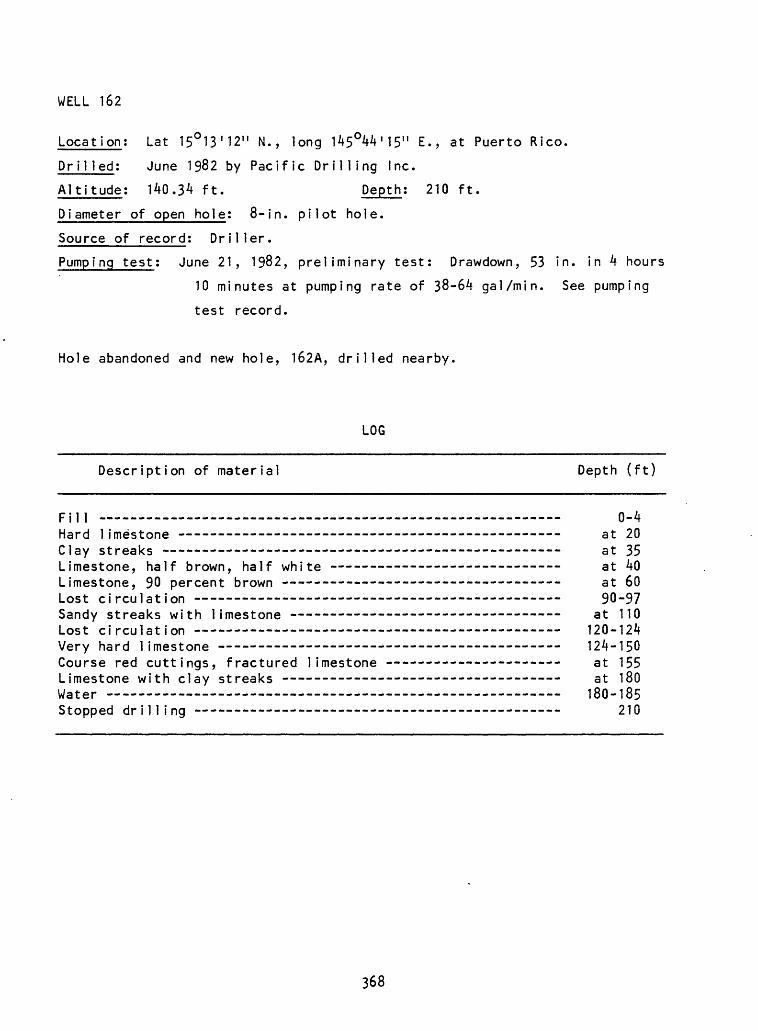
WELL 162
Location; Lat 15°13'12" N., long 145°44'15" E., at Puerto Rico.
Drilled: June 1982 by Pacific Drilling Inc.
Altitude; 140.34 ft. Depth; 210 ft.
Diameter of open hole; 8-in. pilot hole.
Source of record; Driller.
Pumping test; June 21, 1982, preliminary test; Drawdown, 53 in. in 4 hours
10 minutes at pumping rate of 38-64 gal/min. See pumping
test record.
Hole abandoned and new hole, 162A, drilled nearby.
LOG
Description of material Depth (ft)
Fill 0-4Hard 1 imestone -- -- - - --- - --- ----- -- at 20Clay streaks - ------ --- -------- -- - -- a t 35Limestone, half brown, half white - at 40Limestone, 90 percent brown - - - -- - - -- -- at 60Lost circulation 90-97Sandy streaks with limestone - ---- ___________ ___ a t 110Lost circulation 120-124Very hard limestone -- 124-150Course red cuttings, fractured limestone - - at 155Limestone with clay streaks - at 180Water 180-185Stopped drilling ~ 210
368
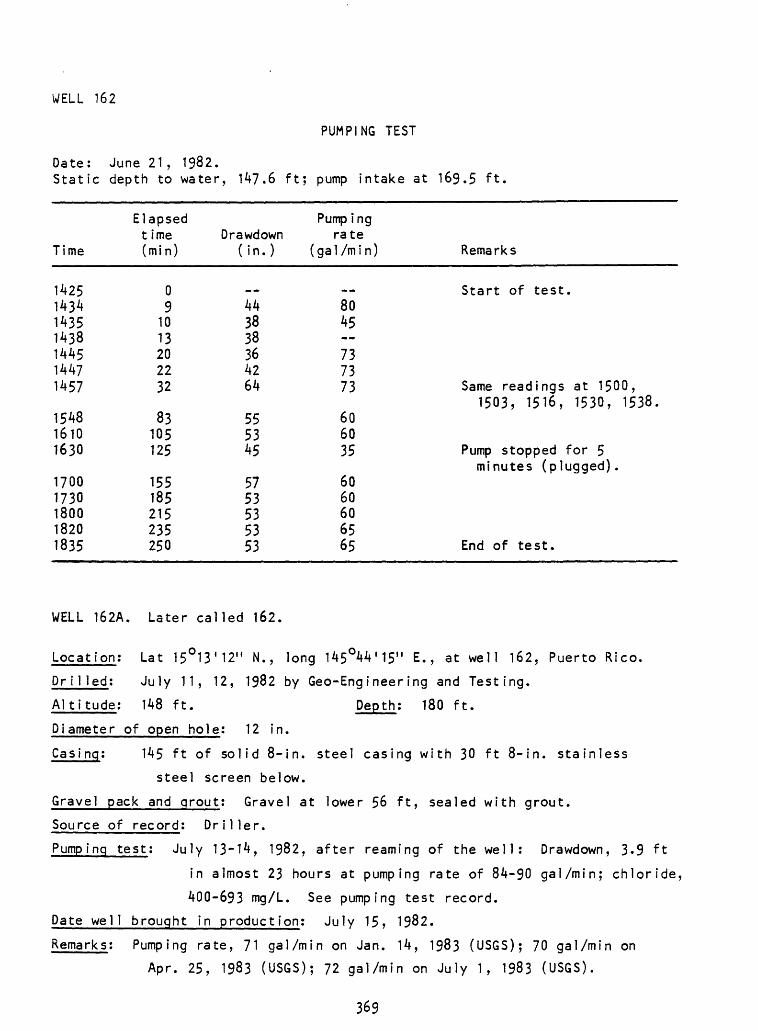
WELL 162
PUMPING TEST
Date: June 21, 1982.Static depth to water, 147.6 ft; pump intake at 169.5 ft,
Time
1425143414351438144514471457
154816101630
17001730180018201835
Elapsed t ime (min)
09
1013202232
83105125
155185215235250
Drawdown (in.)
..443838364264
555345
5753535353
Pump ing rate
( ga 1 /m i n )
8045 737373
606035
6060606565
Remarks
Start of test.
Same readings at 1500,1503, 1516, 1530, 1538.
Pump stopped for 5minutes (plugged).
End of test.
WELL 162A. Later called 162.
Location: Lat 15°13'12" N., long 145O44'15" E., at well 162, Puerto Rico.
Dr i1 led; July 11, 12, 1982 by Geo-Engineering and Testing.
Altitude; 148 ft. Depth; 180 ft.
Diameter of open hole; 12 in.
Casing; 145 ft of solid 8-in. steel casing with 30 ft 8-in. stainless
steel screen below.
Gravel pack and grout: Gravel at lower 56 ft, sealed with grout.
Source of record; Driller.
Pumping test; July 13-14, 1982, after reaming of the well: Drawdown, 3.9 ft
in almost 23 hours at pumping rate of 84-90 gal/min; chloride,
400-693 mg/L. See pumping test record.
Date well brought in production; July 15, 1982.
Remarks; Pumping rate, 71 gal/min on Jan. 14, 1983 (USGS); 70 gal/min on
Apr. 25, 1983 (USGS); 72 gal/min on July 1, 1983 (USGS).
369
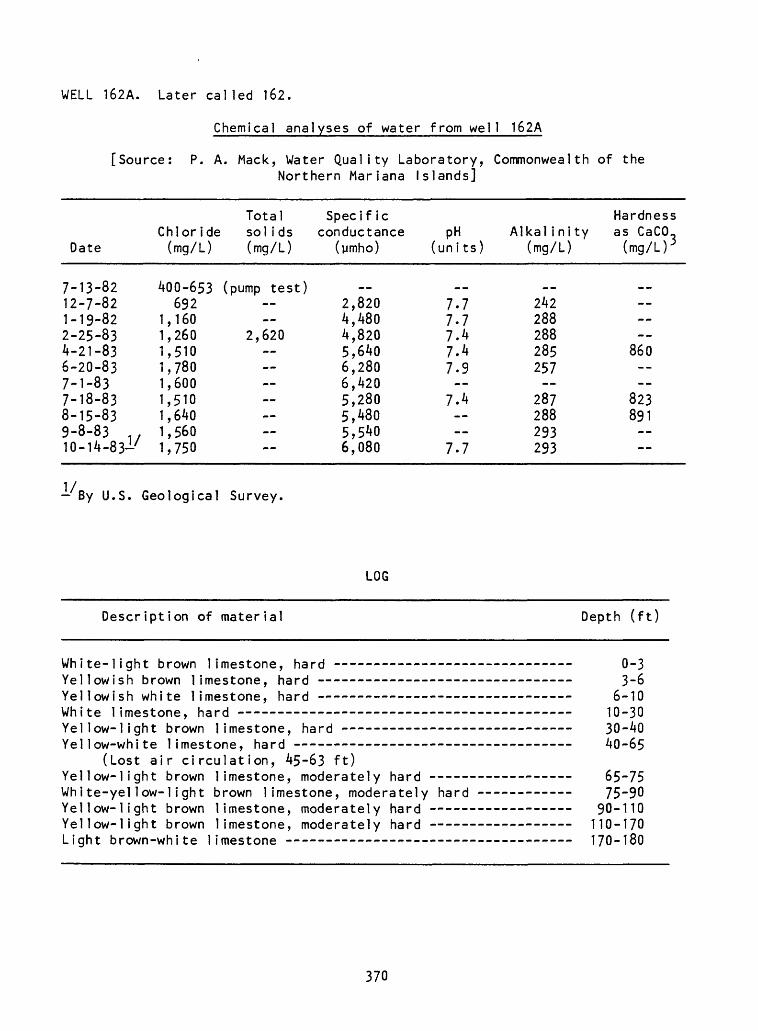
WELL 162A. Later called 162.
Chemical analyses of water from well 162A
[Source: P. A. Mack, Water Quality Laboratory, Commonwealth of theNorthern Mariana Islands]
Date
7-13-8212-7-821-19-822-25-834-21-836-20-837-1-837-18-838-15-839-8-83 , 10-14-83-
Total Chloride sol ids
(mg/L) (mg/L)
400-653 (pump test)692
1,1601,260 2,6201,5101,7801,6001,5101,6401,560 1,750
Specif ic conductance
(umho)
_2,8204,4804,8205,6406,2806,4205,2805,4805,540 6,080
pH (uni ts)
_
7.77.77.47.47.9
7.4
7.7
Alkal i ni ty (mg/L)
_242288288285257
287288293 293
Hardness as CaCO,
(mg/LK
__
860--
823891
- By U.S. Geological Survey.
LOG
Description of material Depth (ft)
White-light brown limestone, hard - - 0-3Yellowish brown limestone, hard - - 3-6Yellowish white limestone, hard - 6-10White limestone, hard - - 10-30Yellow-light brown limestone, hard - - 30-40Yellow-white limestone, hard ------------------------------- 40-65
(Lost air circulation, 45-63 ft)Yellow-light brown limestone, moderately hard -- - 65-75White-yellow-light brown limestone, moderately hard -- 75-90Yellow-light brown limestone, moderately hard - 90-110Yellow-light brown limestone, moderately hard 110-170Light brown-white limestone - - - - 170-180
370
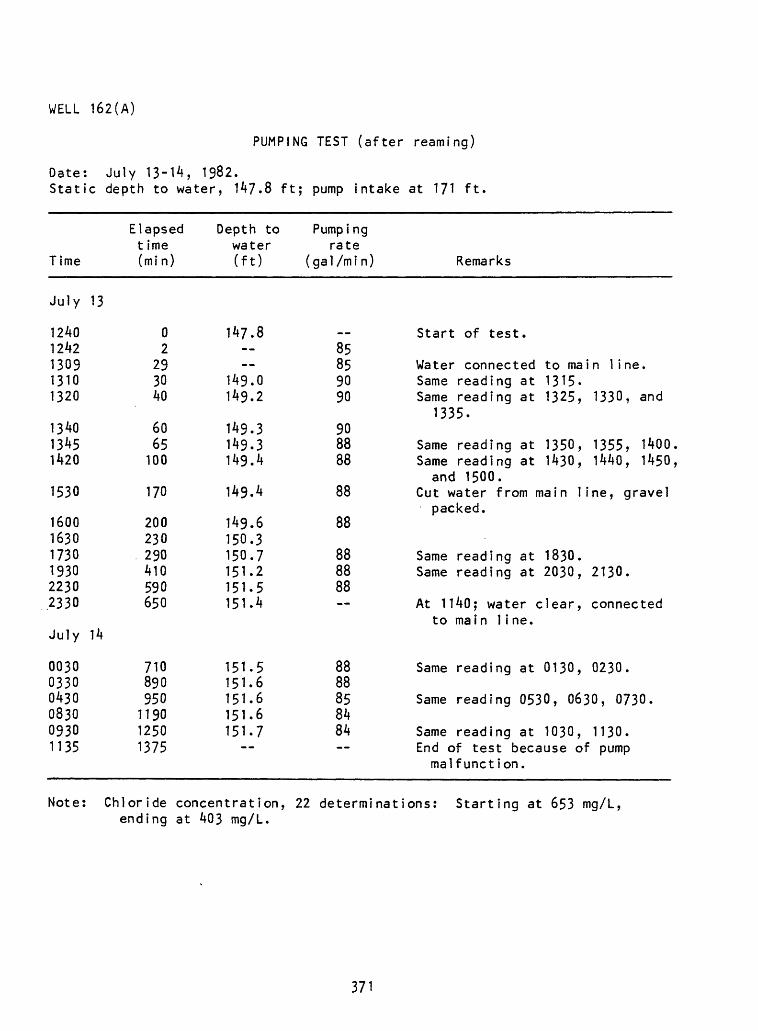
WELL 162(A)
PUMPING TEST (after reaming)
Date: July 13-14, 1982.Static depth to water, 147.8 ft; pump intake at 171 ft.
Time
July 13
12401242130913101320
134013451420
1530
160016301730193022302330
July 14
003003300430083009301135
Elapsed t ime (min)
02
293040
6065100
170
200230290410590650
710890950119012501375
Depth to water (ft)
147.8
149.0149.2
149.3149.3149.4
149.4
149.6150.3150.7151.2151.5151.4
151.5151.6151.6151.6151.7
Pumpi ng rate
(gal /mi n)
__85859090
908888
88
88
888888
8888858484
Remarks
Start of test.
Water connected to main line.Same reading at 1315.Same reading at 1325, 1330, and
1335.
Same reading at 1350, 1355, 1400.Same reading at 1430, 1440, 1450,and 1500.
Cut water from main line, gravelpacked.
Same reading at 1830.Same reading at 2030, 2130.
At 1140; water clear, connectedto main 1 i ne.
Same reading at 0130, 0230.
Same reading 0530, 0630, 0730.
Same reading at 1030, 1130.End of test because of pumpmalfunction.
Note: Chloride concentration, 22 determinations: Starting at 653 mg/L, ending at 403 mg/L.
371
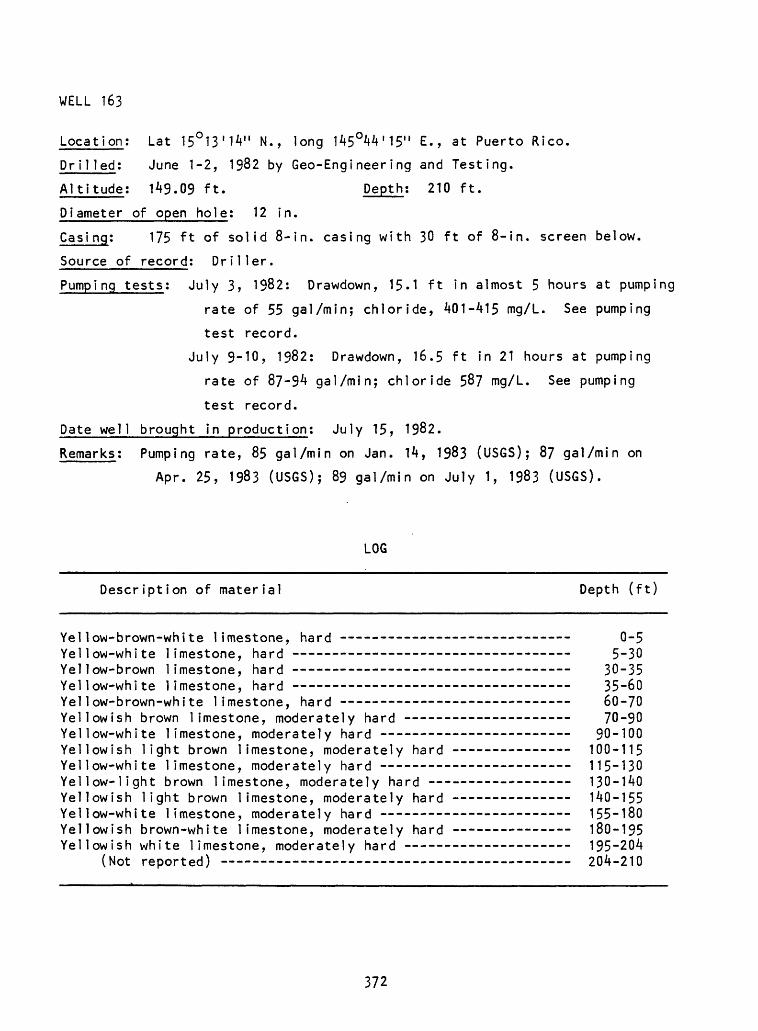
WELL 163
Location; Lat 15°13'lV' N., long 145°44'15" E., at Puerto Rico.
Dr ilied; June 1-2, 1982 by Geo-Engineering and Testing.
Altitude; 149.09 ft. Depth; 210 ft.
Diameter of open hole; 12 in.
Casi ng; 175 ft of solid 8-in. casing with 30 ft of 8-in. screen below.
Source of record; Driller.
Pumping tests; July 3, 1982; Drawdown, 15.1 ft in almost 5 hours at pumping
rate of 55 gal/min; chloride, 401-415 mg/L. See pumping
test record.
July 9-10, 1982: Drawdown, 16.5 ft in 21 hours at pumping
rate of 87-94 gal/min; chloride 587 mg/L. See pumping
test record.
Date well brought in production; July 15, 1982.
Remarks; Pumping rate, 85 gal/min on Jan. 14, 1983 (USGS); 87 gal/min on
Apr. 25, 1983 (USGS); 89 gal/min on July 1, 1983 (USGS).
LOG
Description of material Depth (ft)
Yellow-brown-white limestone, hard 0-5Yellow-white limestone, hard - - --------- _.__ _ 5-30Yellow-brown limestone, hard - ---- - - - - - 30-35Yellow-white limestone, hard --- ------ - - -- --- 35-60Yellow-brown-white limestone, hard 60-70Yellowish brown limestone, moderately hard ---- - - 70-90Yellow-white limestone, moderately hard 90-100Yellowish light brown limestone, moderately hard 100-115Yellow-white limestone, moderately hard 115-130Yellow-light brown limestone, moderately hard - 130-140Yellowish light brown limestone, moderately hard 140-155Yellow-white limestone, moderately hard - - --- -- 155-180Yellowish brown-white limestone, moderately hard 180-195Yellowish white limestone, moderately hard - 195-204
(Not reported) 204-210
372
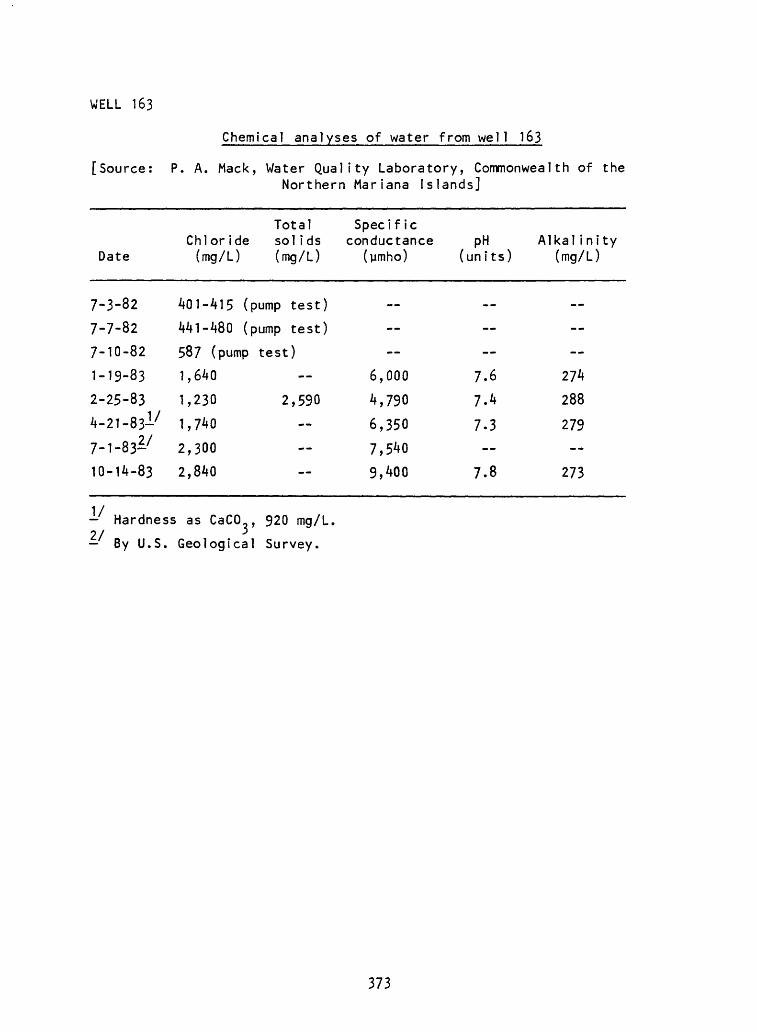
WELL 163
Chemical analyses of water from well 163
[Source: P. A. Mack, Water Quality Laboratory, Commonwealth of theNorthern Mariana Islands]
Date
7-3-82
7-7-82
7-10-82
1-19-83
2-25-83
4-21-83-7
7-1-83^
10-14-83
Chloride (mg/L)
Total Specific solids conductance (mg/L) (ymho)
PH (un its)
Alkal inity (mg/L)
401-415 (pump test)
441-480 (pump test)
587 (pump1,640
1,230
1,740
2,300
2,840
test)
6,000
2,590 4,790
6,350
7,540
9,400
7.67.4
7.3
7.8
274
288
279
273
- Hardness as CaCO , 920 mg/L.2/ *- By U.S. Geological Survey.
373
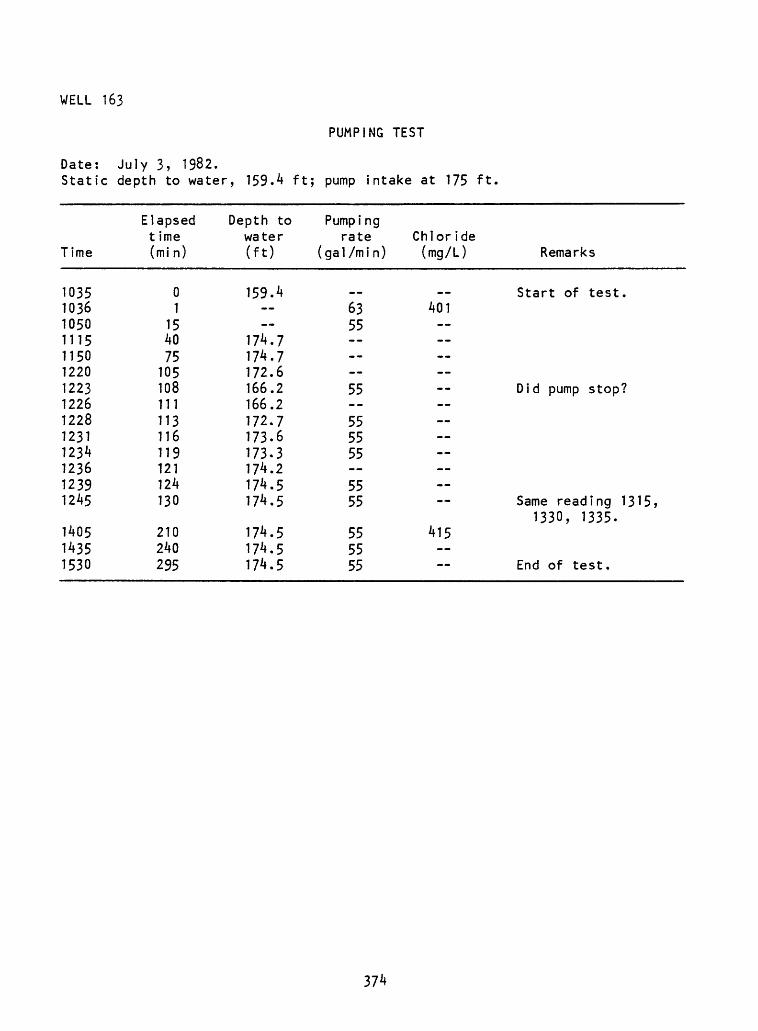
WELL 163
PUMPING TEST
Date:Static
Time
1035103610501115115012201223122612281231123 1*123612391245
140514351530
July 3, 1982.depth to water
Elapsedt ime(mi n)
01
154075
105108111113116119121124130
210240295
, 159.4 ft;
Depth towater(ft)
159.4
174.7174.7172.6166.2166.2172.7173.6173.3174.2174.5174.5
174.5174.5174.5
pump intake
Pumpi ngrate
( ga 1 /m i n )
6355 55--555555 5555
555555
at 175 ft.
Chloride(mg/L) Remarks
Start of test.401
Did pump stop?
Same reading 1315 »1330, 1335.
415
End of test.
374
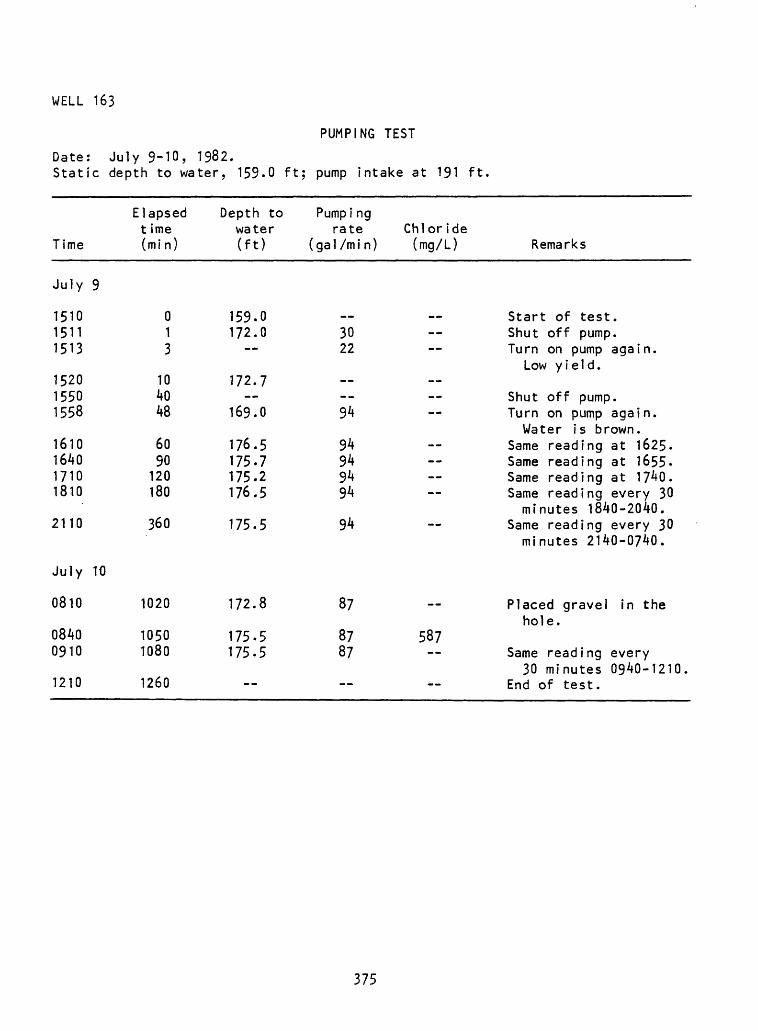
WELL 163
PUMPING TEST
Date: July 9-10, 1982.Static depth to water, 159.0 ft; pump intake at 191 ft,
Time
July 9
151015111513
152015501558
1610164017101810
2110
July 10
0810
08400910
1210
Elapsed t ime (mi n)
013
104048
6090120180
360
1020
10501080
1260
Depth to water (ft)
159.0172.0
172.7
169.0
176.5175.7175.2176.5
175.5
172.8
175.5175.5
--
Pumpi ng rate Chloride
(gal/min) (mg/L)
_- __3022
94
94949494
94
87
87 58787
-- --
Remarks
Start of test.Shut off pump.Turn on pump again.
Low yield.
Shut off pump.Turn on pump again.Water is brown.
Same reading at 1625.Same reading at 1655 Same reading at 1740.Same reading every 30minutes 1840-2040.
Same reading every 30minutes 2140-0740.
Placed gravel in thehole.
Same reading every30 minutes 0940-1210.
End of test.
375
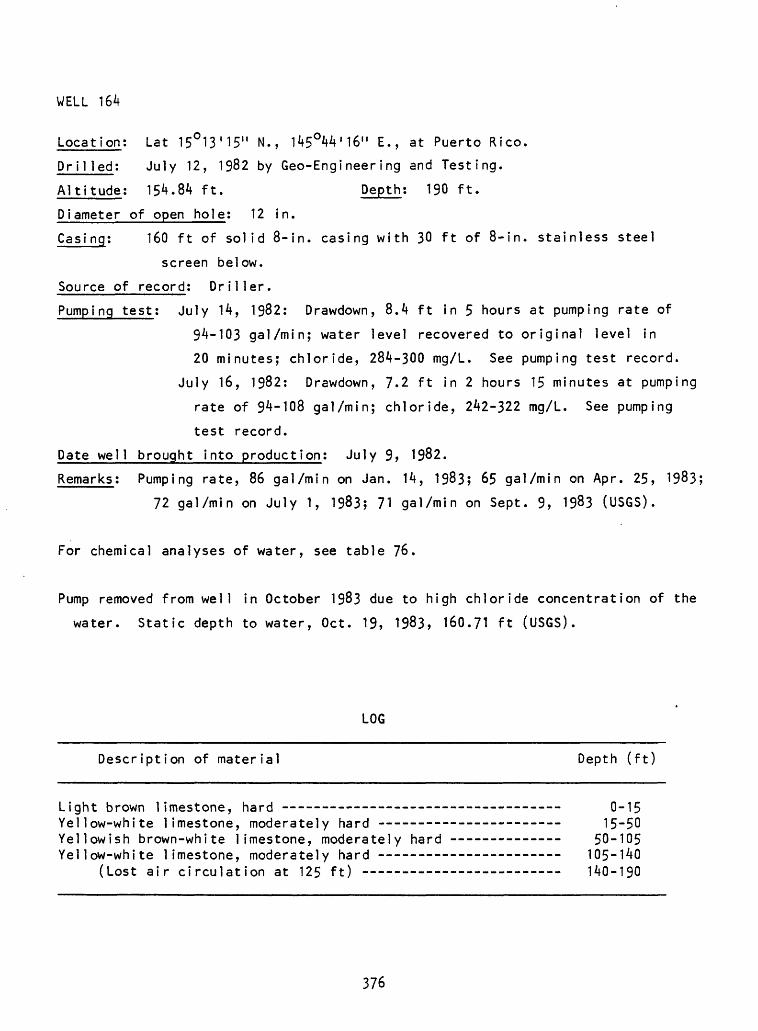
WELL 164
Location: Lat 15°13'15" N., 145°44 1 16" E., at Puerto Rico.
Drilled: July 12, 1982 by Geo-Engineering and Testing.
Altitude: 154.84 ft. Depth; 190 ft.
Diameter of open hole: 12 in.
Casi ng: 160 ft of solid 8-in. casing with 30 ft of 8-in. stainless steel
screen below.
Source of record: Driller.
Pumping test: July 14, 1982: Drawdown, 8.4 ft in 5 hours at pumping rate of
94-103 gal/min; water level recovered to original level in
20 minutes; chloride, 284-300 mg/L. See pumping test record.
July 16, 1982: Drawdown, 7.2 ft in 2 hours 15 minutes at pumping
rate of 94-108 gal/min; chloride, 242-322 mg/L. See pumping
test record.
Date well brought into production; July 9, 1982.
Remarks; Pumping rate, 86 gal/min on Jan. 14, 1983; 65 gal/min on Apr. 25, 1983;
72 gal/min on July 1, 1983; 71 gal/min on Sept. 9, 1983 (USGS).
For chemical analyses of water, see table 76.
Pump removed from well in October 1983 due to high chloride concentration of the
water. Static depth to water, Oct. 19, 1983, 160.71 ft (USGS).
LOG
Description of material Depth (ft)
Light brown limestone, hard - - 0-15Yellow-white limestone, moderately hard ------ _____________ 15-50Yellowish brown-white limestone, moderately hard --- --- -- 50-105Yellow-white limestone, moderately hard - - - 105-140
(Lost air circulation at 125 ft) 140-190
376
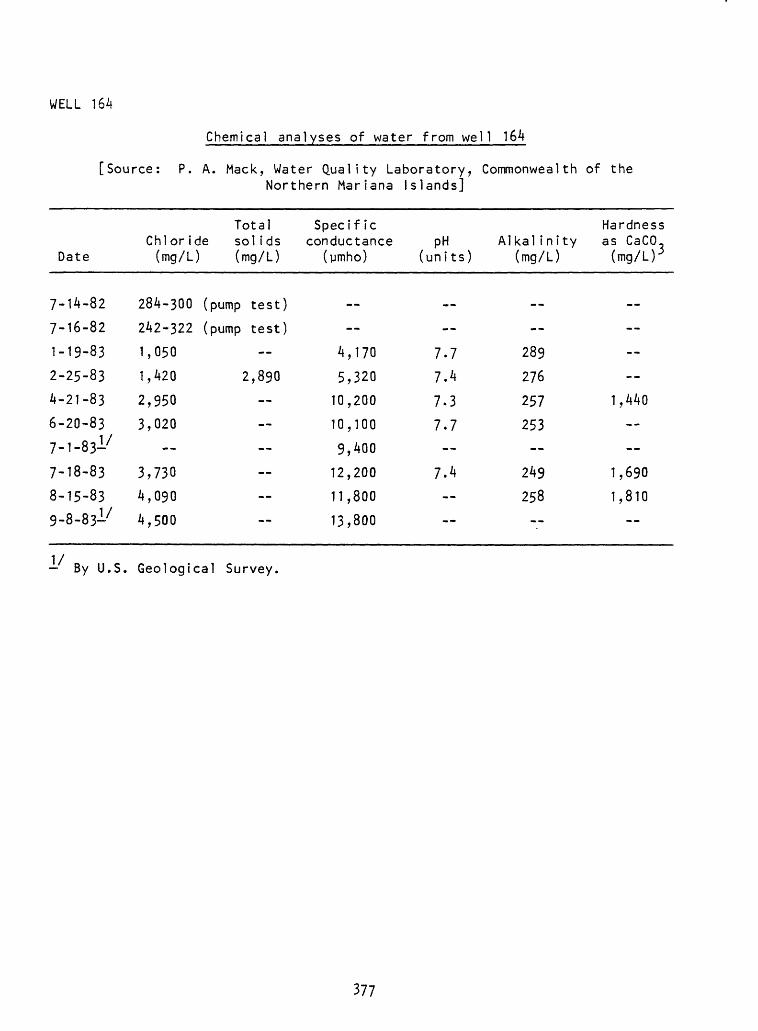
WELL 164
[Source
Chemical analyses of water from well 164
P. A. Mack, Water Quality Laboratory, Commonwealth of the Northern Mariana Islands]
Date
7-14-82
7-16-82
1-19-83
2-25-83
4-21-83
6-20-83
7-1-83-7
7-18-83
8-15-83
9-8-S3-7
Chlor ide (mg/L)
Total Specific solids conductance (mg/L) (ymho)
PH (units)
Alkal inity (mg/L)
Hardness as CaCO- (mg/L) 3
284-300 (pump test)
242-322 (pump test)
1,050
1,420
2,950
3,020
3,7304,090
4,500
4,170
2,890 5,320
10,200
10,100
9,400
12,200
11,800
13,800
7.7
7.4
7.3
7.7
7.4
289
276
257
253
249
258
--
1,440
1,690
1,810
By U.S. Geological Survey.
377
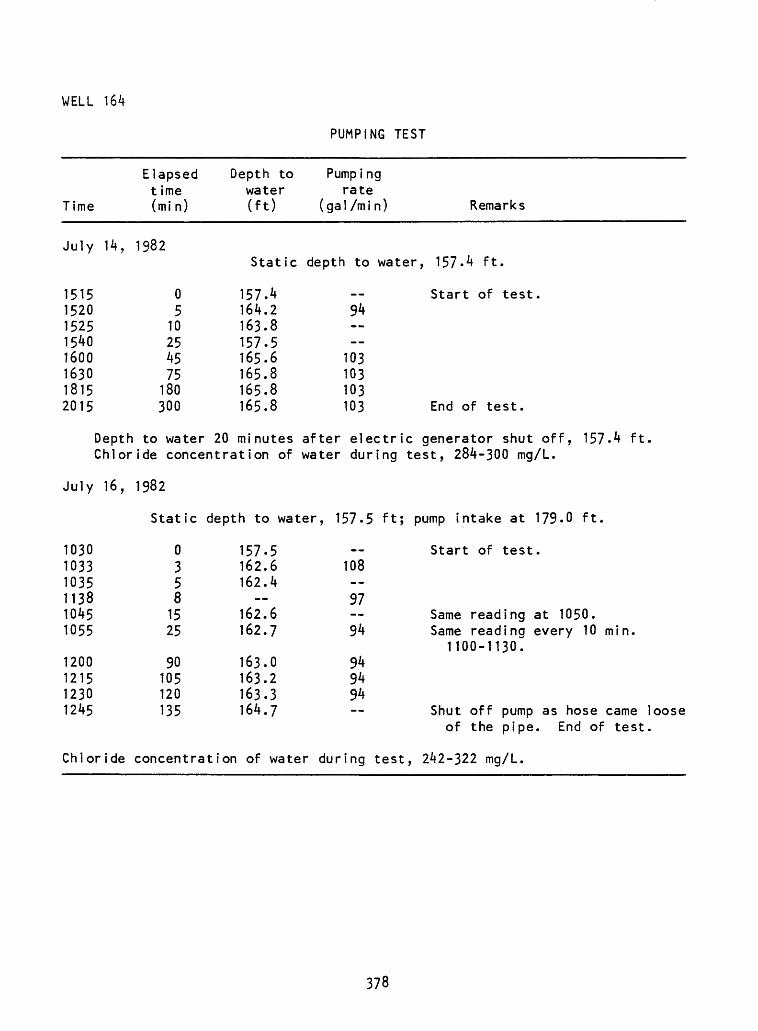
WELL 164
PUMPING TEST
Time
Elapsed t ime (mi n)
Depth to water (ft)
Pumpi ngrate
(ga 1 /m i n) Remarks
July 14, 1982
15151520152515401600163018152015
05
10254575
180300
157.4164.2163.8157.5165.6165.8165.8165.8
94
103103103103
Static depth to water, 157.4 ft.
Start of test.
End of test.
Depth to water 20 minutes after electric generator shut off, 157-4 ft. Chloride concentration of water during test, 284-300 mg/L.
July 16, 1982
Static depth to water, 157.5 ft; pump intake at 179.0 ft.
Start of test.
Same reading at 1050. Same reading every 10 min.
1100-1130.
Shut off pump as hose came loose of the pipe. End of test.
Chloride concentration of water during test, 242-322 mg/L.
103010331035113810451055
1200121512301245
03581525
90105120135
157.5162.6162.4
162.6162.7
163.0163.2163.3164.7
108 97 94
949494
378
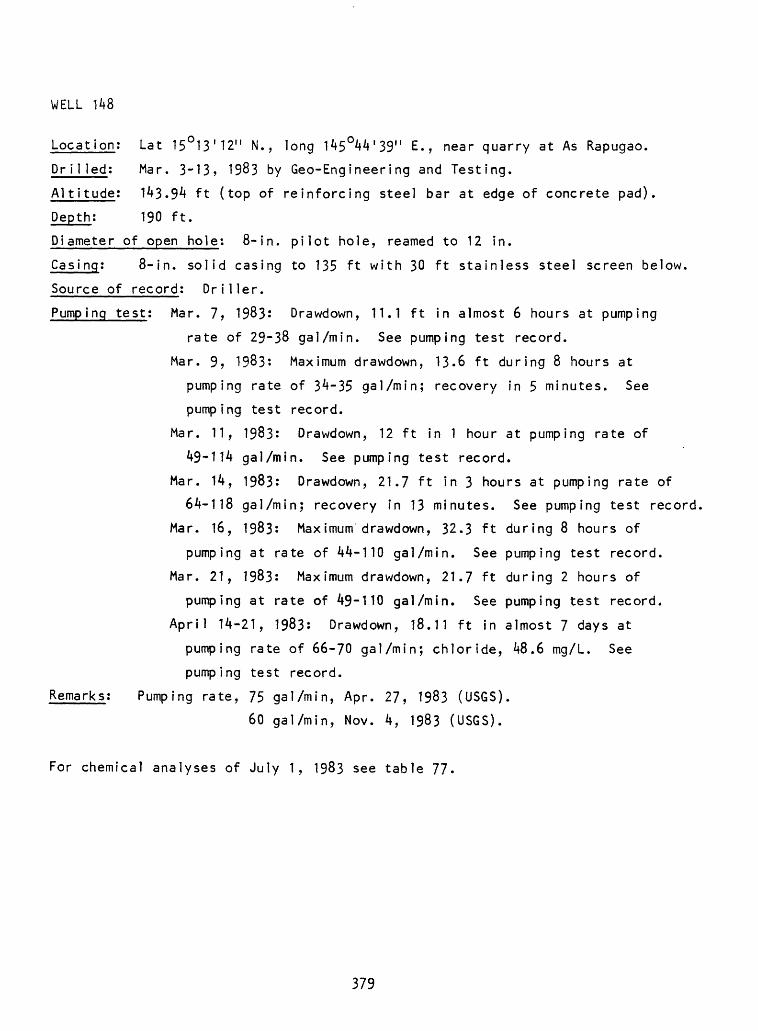
WELL 148
Location: Lat 15 O 13'12" N., long 145O44'39" E., near quarry at As Rapugao.
Dr iI led; Mar. 3-13? 1983 by Geo-Engineering and Testing.
Altitude; 143.94 ft (top of reinforcing steel bar at edge of concrete pad).
Depth; 190 ft.
Diameter of open hole; 8-in. pilot hole, reamed to 12 in.
Casing; 8-in. solid casing to 135 ft with 30 ft stainless steel screen below.
Source of record; Driller.
Pumping test; Mar. 7, 1983: Drawdown, 11.1 ft in almost 6 hours at pumping
rate of 29~38 gal/min. See pumping test record.
Mar. 9, 1983: Maximum drawdown, 13.6 ft during 8 hours at
pumping rate of 34-35 gal/min; recovery in 5 minutes. See
pumping test record.
Mar. 11, 1983: Drawdown, 12 ft in 1 hour at pumping rate of
49-114 gal/min. See pumping test record.
Mar. 14, 1983: Drawdown, 21.7 ft in 3 hours at pumping rate of
64-118 gal/min; recovery in 13 minutes. See pumping test record,
Mar. 16, 1983: Maximum drawdown, 32.3 ft during 8 hours of
pumping at rate of 44-110 gal/min. See pumping test record.
Mar. 21, 1983: Maximum drawdown, 21.7 ft during 2 hours of
pumping at rate of 49-110 gal/min. See pumping test record.
April 14-21, 1983: Drawdown, 18.11 ft in almost 7 days at
pumping rate of 66-70 gal/min; chloride, 48.6 mg/L. See
pumping test record.
Remarks; Pumping rate, 75 gal/min, Apr. 27, 1983 (USGS).
60 gal/min, Nov. 4, 1983 (USGS).
For chemical analyses of July 1, 1983 see table 77.
379
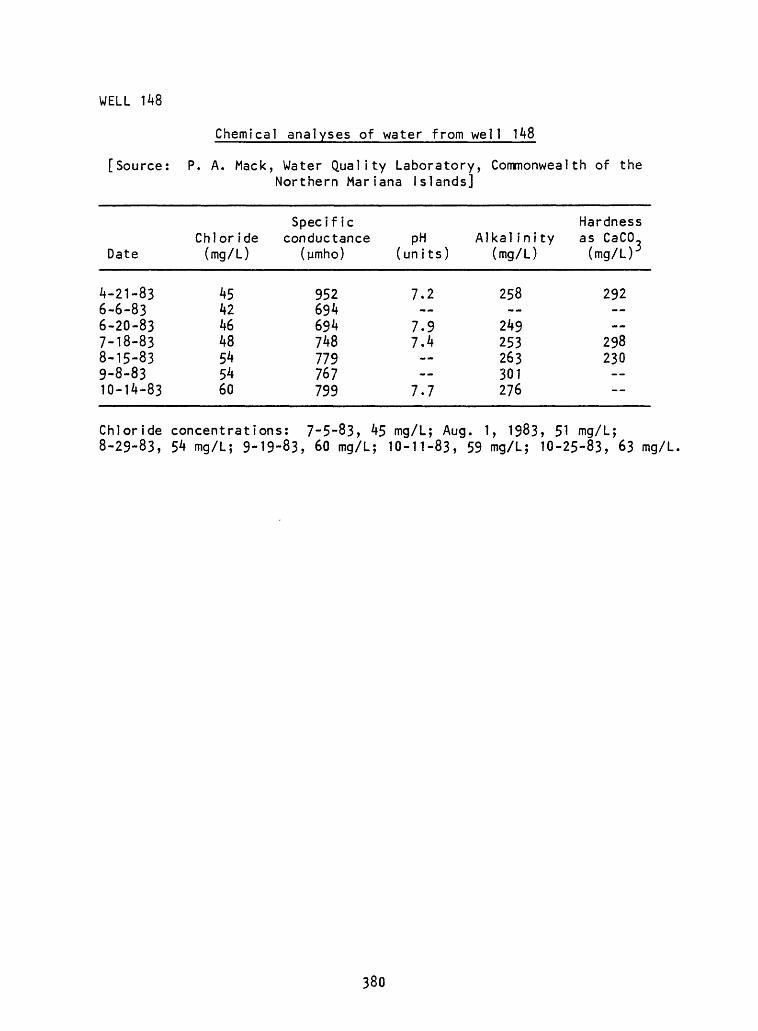
WELL 148
Chemical analyses of water from well 148
[Source: P. A. Mack, Water Quality Laboratory, Commonwealth of theNorthern Mariana Islands]
Date
4-21-836-6-836-20-837-18-838-15-839-8-8310-14-83
Chloride(mg/L)
45424648545460
Specificconductance
(ymho)
952694694748779767799
pH(un its)
7.2
7.97.4
7.7
Alkal i ni ty(mg/L)
258--
249253263301276
Hardnessas CaCO,(mg/ir
292
298230
Chloride concentrations: 7-5-83, 45 mg/L; Aug. 1, 1983, 51 mg/L; 8-29-83, 54 mg/L; 9-19-83, 60 mg/L; 10-11-83, 59 mg/L; 10-25-83, 63 mg/L
380
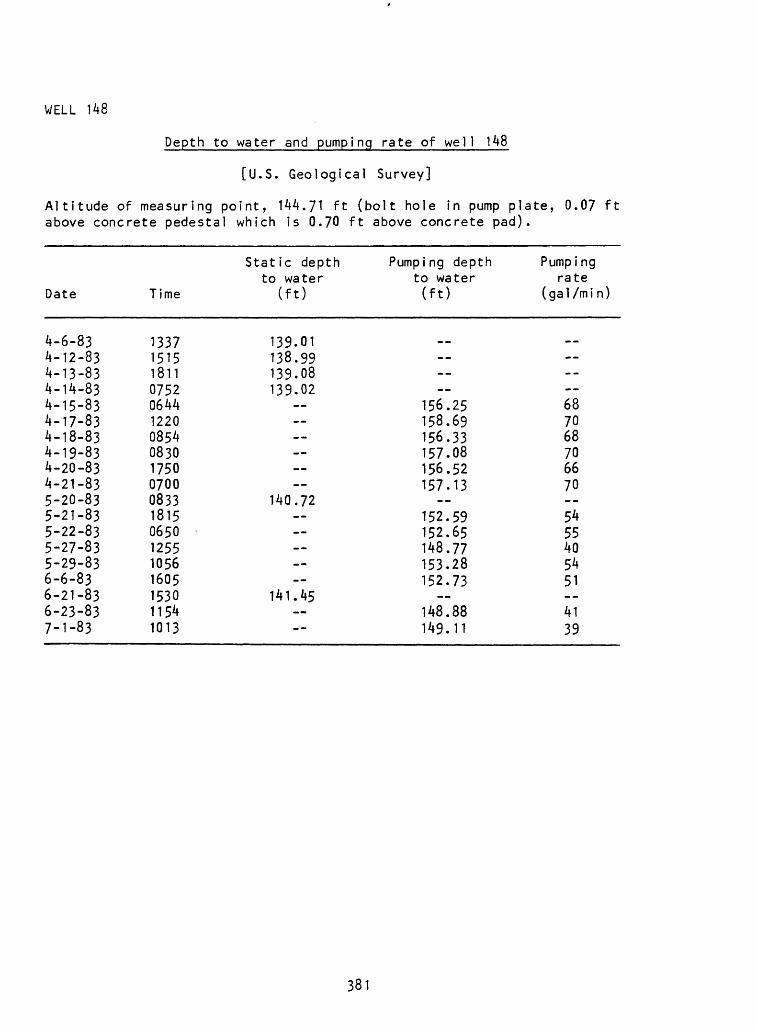
WELL 148
Depth to water and pumping rate of well 148
[U.S. Geological Survey]
Altitude of measuring point, 144.71 ft (bolt hole in pump plate, 0.07 ft above concrete pedestal which is 0.70 ft above concrete pad).
Date
4-6-834-12-834-13-834-14-834-15-834-17-834-18-834-19-834-20-834-21-835-20-835-21-835-22-835-27-835-29-836-6-836-21-836-23-837-1-83
Time
1337151518110752064412200854083017500700083318150650125510561605153011541013
Static depth to water
(ft)
139.01138.99139.08139.02
140.72 --
141.45
Pumping depth to water(ft)
..--
156.25158.69156.33157.08156.52157.13
152.59152.65148.77153.28152.73
148.88149.11
Pumpi ng rate
(gal /mi n)
----687068706670--5455405451--4139
381
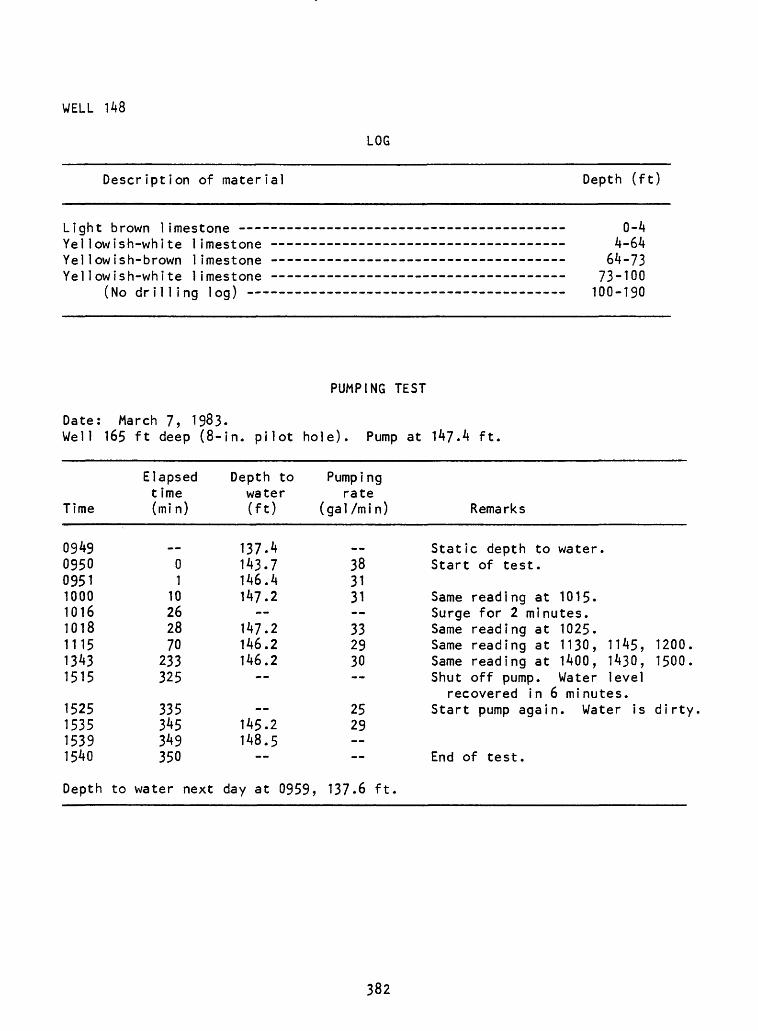
WELL 148
LOG
Description of material Depth (ft)
Light brown limestone - Yellowish-white limestone Yellowish-brown limestone Yellowish-white limestone
(No dri11 ing log)
0-44-64
64-7373-100100-190
Date: March 7, 1983. Well 165 ft deep (8-in.
PUMPING TEST
pilot hole). Pump at 147.4 ft.
Time
094909500951100010161018111513431515
1525153515391540
Elapsed t ime (mi n)
«. _01
10262870
233325
335345349350
Depth to water (ft)
137.4143.7146.4147.2
147.2146.2146.2
145.2148.5
Pumpi ng rate
(gal/min)
383131 332930
2529
Remarks
Static depth to water.Start of test.
Same reading at 1015.Surge for 2 minutes.Same reading at 1025.Same reading at 1130, 1145,Same reading at 1400, 1430,Shut off pump. Water level
recovered in 6 minutes.Start pump again. Water is
End of test.
12001500
dirt
Depth to water next day at 0959, 137.6 ft
382

WELL 148
Date: March 9, 1983. Well 165 ft deep (8-in.
PUMPING TEST
pilot hole). Pump at 152 ft
Time
1045105510571100110511201150123012451300131513301400150015301630173018001855
Recovery
Elapsed t ime (mi n)
__025
10255595110125140155185245275335395425480
to static
Depth to water (ft)
137.6
144.0148.3149.2149.6149.6149.4148.7149.1151.2151.2150.3149.2148.9149.0146.6147.1147.1
level in 5
Pumping rate
(gal /mi n)
__ 4541404039393443 41383837373737
mi nutes.
Remarks
Static depth to water.Start of test.
Same reading at 1110.Same reading at 1125,Same reading at 1200,
1130, 11401210, 1220
At 1250 surged for 2 minutes.
Pump lowered to 154 ftMaximum drawdown.
Same reading at 1545,Same reading at 1645,
Same reading until endEnd of test.
.
1600, 16151700, 1715
of test.
383

WELL 148
PUMPING TEST
Date: March 11, 1983.Well 175 ft deep (8-in. pilot hole). Pump at 160 ft
Time
11551200120512201225123312351255
Elapsed time (mi n)
__05
2025333555
No information until
Depth to water (ft)
137.6145.6149.2149.5144.2139-9149.4149.6
end of test
Pumpi ng rate
(gal /mi n)
__656354491148765
at 1515.
Remarks
Static depth to water.Start of test.Same reading at 1215«
Surged for 2 minutes.
Same reading at 1300, 1305, 1310
Date: March 14, 1983.Well 175 ft deep (reamed to 12 in.). Pump at 160 ft.
Time
1410142314251428143414421451
1535
1730
Elapsed time (min)
__025
111928
72
187
Depth to water (ft)
137.6147.6
147.6157.0159.0
159.3
159.3
Pumpi ng rate
(gal /min)
118
1141147066
64-65
64
Remarks
Static depth to water.Start of test.Water dirty and very slow.Surged for total of 6 minutes.
Same reading at 1456, 1502, 1508,1520, 1525.
Same reading at 1545 and every15 minutes 1600-1730.
End of test.
Recovery to static water level in 13 minutes.
384

WELL 148
PUMPING TEST
Date: March 16, 1983.Well 190 ft deep. Pump at 170 ft.
Time
123912401245125013001305131013201345140014151430143914551500
15501605163017001730
2100
Elapsed t ime (mi n)
__05
1020253040658095110119135190
190205230260290
500
Depth to water (ft)
137.6
151.2159.0159.0161.3165.9169.2159.0153.7155.0153.3147.6169.9169.9
167.1162.2150.9151.6152.2
152.2
Pumpi ng rate
(gal/min)
__
110103103103103828956975010610385
10062445355
Remarks
Static depth to water.Start of test.
Surged 1 minute 1257-1258.
Same reading at 1330.Pump at 171 ft.
Maximum drawdown.Same reading every 5 minutes
1505-1540.
No change unt i 1 end of test at2100.
End of test.
385

WELL 148
PUMPING TEST
Date: March 21, 1983.Well 190 ft deep. Pump at 170 ft. Final test before backfilling
Elapsed Depth to Pumpingtime water rate
Time (min) (ft) (gal/min) Remarks
11451150115111531156115912021207121012121217123012401400
01369
12172022274050
130
138.7
156.1156.9158.2160.4152.9150.0148.9149.3149.7149.9150.7150.7
11010610679634949545453
54-55
Static depth to water.Start of test.
Maximum drawdown.
Same reading to end of test.End of test.
386

WELL 148
Date: April 14-21, 1983.Static depth to water, 139.79 ft.
PUMPING TEST
Wel1 completed,
Time
0752
083008310833083808400910124617520644
153012241220
0854
0830
17500700
Elapsed t ime (mi n)
__
0138
1040
276562
1,334
1,8603,1144,550
5,784
7,200
9,2009,990
Depth to water (ft)
139.79
--147.70151.30
155.93156.70157.41157.83157.02
156.98157.83159.46
157.10
157.85
157.29157.90
Draw down (ft)
. ,
07.9111.51 16.1416.9117.6218.0417.23
17.1918.0419.67
17.31
18.06
17.5018.11
Pumping rate
( ga 1 /m i n )
-p
--70--70707068
686570
68
70
6670
Remarks
April 14. Meterreading 001232.
Start of test.
April 18. Meterreading 092200.
April 16.April 17. Meter
reading 312000.April 18. Chloride,
48.6 mg/L.April 19. Meter
reading 493100.April 20.Meter reading 673800.End of test.
387

WELL
Location: Lat 15°13'08" N., long 145°44'39" E., near quarry at As Rapugao.
Dri1 led; Mar. 24-26 by Geo-Engineering and Testing.
Altitude; 194.00 ft (top of reinforcing steel bar, 8 ft from well).
Depth: 227 ft (220.8 ft measured inside casing and screen on Apr. 22, 1983).
Diameter of open hole: 8-in pilot hole, reamed to 12 in.
Casi ng: 8-in. solid casing to 187 ft with 40 ft stainless steel screen below.
Source of record: Driller.
Pumping test: Mar. 28, 1980: Drawdown, 4.2 ft in 7-1/2 hours at pumping rate
of 57-94 gal/min; chloride, 30-40 mg/L. See pumping test record
Apr. 6, 1983: Drawdown, 3 ft in almost 13 hours at pumping rate
of 92 gal/min; recovery to static level in 7 minutes; chloride
(21 readings), from 52.5 to 29.2 mg/L. See pumping test record.
Remarks: Apr. 21, 1983: With nearby well 150 pumping at rate of 87-92 gal/min
for more than 8 hours, the water level in well 149 dropped 0.25 ft;
recovery to within 0.11 ft in 3-1/2 hours, to within 0.02 ft in 16
hours.
For chemical analysis of July 1, 1983> see table 77.
LOG
Description of material Depth (ft)
Brownish-white limestone, very hard drilling - - 0-27White limestone - - - - - -- - 27-68Yellowish-white limestone 68-82Brownish-white limestone with traces of light brown clay
particles 82-96Yellowish-white limestone 96-102Brown-white limestone with traces of light brown clay 102-112Brown-white limestone - 112-128Yellowish-white limestone 128-178Brown-yellow limestone -- -- - --- - 178-193Brown-yellow-white limestone -- -- - -- 193-197Yellowish-brown limestone 197-200Yellowish-white limestone 200-225
(No drilling log) 225-227
Note: Drilling moderately hard from 27 to 225 ft.
388

WELL 149
Chemical analyses of water from wel1 149
[Source: P. A. Mack, Water Quality Laboratory, Commonwealth ofthe Northern Mariana Islands]
Date
6-6-836-20-836-27-8310-19-8310-25-83
Chlor ide(mg/L)
2830274243
Specif icconductance
(ymho)
587592 --
pH Alkalinity(units) (mg/L)
M M
7.9 236_____ _ _ _
Depth to water and pumping rate of well 149
[U.S. Geological Survey]
Altitude of measuring point, 195.25 ft, April 14-21, 1983 (top of casing, 1.25 ft above ground surface); 195.05 ft, since May 1983 (access hole in pump plate, 1.05 ft above ground surface).
Date
4-12-834-13-834-13-834-14-834-21-835-14-835-20-835-21-835-22-835-27-835-29-836-6-836-23-837-1-839-8-83
Time
135008001830072011351003093017400748133011461653114010561145 -
Static depth to water
(ft)
188.19188.19188.30188.24188.57
189.94 -- -- --
Pumping depth to water (ft)
..--------
192.40__
191.82192.03192.29192.44192.73191.91192.55193.64
Pumpi ng rate
(gal /mi n)
--------66--5858545858555860
389

WELL 149
PUMPING TEST
Date: March 28, 1983.Well 225 ft deep (8-in. pilot hole). Pump at 213 ft
Time
08300831083^083708380847090009010905
0930
1600
Elapsed time (mi n)
«
0367
16293034
59
449
Depth to water (ft)
187.0187.0189.7189.0191.0189.8189.0
189.8
191.2
191.2
Draw down (ft)
«
929257928061 94
94
Pumping rate
(gal/mi n)
«
40 30
Remarks
Static depth to water.Start of test.
Surged for 4 minutes.Same reading at 0913,
0926.No change until end of
test at 1600.End of test.
Date: April 6, 1983.Well 227 ft deep. Pump at 211 ft.
Time
105210551100
143914431454
2345
Recovery
Elapsed t ime (mi n)
__05
224228239
770
to static
Depth to water (ft)
187.0191.8190.4
189.9190.0
190.0
level in 7
Pumpi ng rate Chloride
(gal/min) (mg/L)
__92 52.592 I/
9292
92
minutes.
Remarks
Static depth to water.Start of test.Same reading every 15minutes 1115-1430.
Surged the wel 1 .Same reading at 1450.Same reading every 15minutes 1545-1700and every 30 minutes1730-2300.
End of test.
- 1100-1145, 20 chloride concentration readings, 45.8-29.2 mg/L.
390

WELL 150
Location; Lat 15°13'09" N., long 145°44'40" E., near quarry at As Rapugao.
Dr i1 led; Apr. 7-14, 1983 by Geo-Engineering and Testing.
Altitude: About 194.5 ft. Depth; 375 ft.
Casing; 8-in. solid casing to 225 ft with 150 ft of stainless steel screen
below.
Source of record; Driller.
Pumping test; Apr. 14-15, 1983; Drawdown, 16.29 ft in almost 26 hours at
pumping rate of 60-70 gal/min. See pumping test record.
Apr. 21-22, 1983: Drawdown, 1.30 ft in 8 hours 20 minutes at
pumping rate of 82-92 gal/min; recovery immediately and water
level 1 ft higher than original level in 1 minute; chloride,
(19 readings) 29-31 mg/L; specific conductance, 598-630 ymho.
See pumping test record.
For chemical analyses of Apr. 23, 1983 and July 1, 1983, see table 77.
Depth to water and pumping rate of well 150
[U.S. Geological Survey]
Altitude of measuring point, about 197.5 ft, April 21, 1983 (edge of drilling table, 3 ft above ground surface); about 195.65 ft since May 1983 (access hole in pump plate, 1.15 ft above ground surface).
Date
4-21-834-21-835-19-835-20-835-27-835-29-836-23-837-1-839-8-83
Time
1440153219060723131611241130--1025
Static depthto water
(ft)
188.86
190.22 _.---- --
Pumping depthto water
(ft)
193.43--
197.30196.96197.15196.90196.59197.90
Pump i ngrate
(gal/min)
82220220215225--
215222
391

WELL 150
LOG
Description of material Depth (ft)
(No drilling log) 0-275 White-yellow limestone and very small clay particles. Hard
drilling 275-285 Yellow-white limestone 285-290
At 286 ft color of foam changes to light tanAt 287 ft color of foam changes to white
Yellow-light brown-white limestone - - 290-295At 292 ft color of foam changes to grayAt 293 ft color of foam changes to white
Yellow-brownish-white limestone. Soft drilling ------- -- 295-300At 298 color of foam changes to light yellowAt 299 color of foam changes to white
White-yellow limestone ---------- ____ -- _ _-- ______ 300-305White-yellow limestone. Hard drilling - 305-310
At 308 color of foam changes to whiteYellow-white limestone. Soft drilling - 310-325 White-yellow limestone with little clay ----- --- --------- 325-350
(No drilling log) 350-375
Chemical analyses of water from well 150
[Source: P. A. Mack, Water Quality Laboratory, Commonwealth ofthe Northern Mariana Islands]
Date
6-27-83, 9-8-831'9-12-839-19-8310-3-8310-11-8310-14-8310-25-83
- By U.S.
Specif icChloride conductance(mg/L) (ymho)
26 34 6113434363637 64939
Geological Survey.
pH Alkalinity(units) (mg/L)
____
7.8 259
392

WELL 150
Date: April 14-15, 1983. Well is 325 ft deep.
PUMPING TEST
Time
075208300831083308400843084808500902091009340945
10171031131906441020
Elapsed t ime (mi n)
__013
1013152032406475
107121289
1,3341,550
Depth to water (ft)
138.76
154.53150.93153.70153.68153.90154.19154.39154.47154.66154.64
154.84155.16155.27154.79155.05
Pumpi ng rate
(gal /mi n)
70 -- 7060
7068
Remarks
Static depth to water.Start of test.
Same reading at 0951,1000, 1012.
April 15.End of test.
393

WELL 150
Date: April 21-22, 1983. Well is 375 ft deep.
PUMPING TEST
Elapsed t ime
Time (min)
1440144414451446145014531500150815401604
1620
2010
2130
22262259
2306
Recovery:
23062307230823092312233223561525
__
01269
16245680
96
326
406
462495
502
01236
2650
979
Depth to Pumping water rate (ft) (gal/min)
191.86
192.21192.11192.36192.68 92193.00193.32 92193.40 82193.39
193.37 82
193.25 87
193.19
193.17193.16 87
193.16
193.16190.81190.74190.69190.60190.50190.45190.25
Chlor ide (mg/L) Remarks
Static depth to water.Start of test.
28.9
Specific conductance,630 umho.
Same reading at 1638,1702, 1724.
Specific conductance,598 umho.
30.7 Specififc conductance,598 umho.
29.8Specific conductance,
620 umho.End of pumping test.
Start of recovery test
End of test.
394

Table 33. Wells drilled near Maui IV (fig. 30)
Locat ionWell No.
23A 23B 30 51 Maui IV
TH MauiIV-1.
141
142
143
144
145146147
Lat itude north
15°12'40"
do. 15°12'42" 15°12'44" 15°12'44"
15°12'35"
do.
15°12'39"
150 12'42"
15°12'45"
15°12'45"15°12'41"15°12'44"
Longi tude east
145°44 do.
145°44 145°44 145°44
145°44
do
145°44
145°44
145°44
145°44145°44145°44
19"
20" 23" 20"
16"
.
18"
22"
25"
18" 20" 22"
Complet date
1944-45
Dec. 26, Jan. 15, Jan. 22, Sept. 1, 1945-46
1969-70
Mar. 5,
Nov. 16,
Sept. 26
Nov. 25,
January
1982
Mar. 11,August 1Aug. 20,
ion
1944 1945 1945 1945
1970
1970
, 1970
1970
1971
19829821982
Alti tude (ft)
241 241 220 210 224
285
290
261
239
214
242223210
-
.62
.76
.37
.66
.35
.61
.23
.12
Depth (ft) Remarks
225 Wel 1 was bailed dry. 250 Abandoned; low yield. 290 248 225.7
308
304
281
251
232
300300280
Converted to we! 1 141
PriorMaui
Priorcall
PriorMaui
PriorMaui
to 1982IV-1.
to 1982ed Mauito 1982IV-3.
to 1982IV-4.
cal led
IV-2.called
called
395

CHLORIDE CONCENTRATION IN MILLIGRAMS PER LITER
MONTHLY RAINFALL AT 9 MGAL RESERVOIR, IN INCHES
ro .c- ON oo o hoj^ONQoorsjoooo ooooooo
ooooo ooooooo NJ <uJ
OOOO
UDC
3*
o
l/>
3
rf-3*
<
QJ
o>
cu3 Q.
3-hCJ
12
US
00
CO N)
OD
i
1

WELL 23A (called 23B by Piper, 1946-47)
Location; Lat 15°12 I 40" N., long 145°44'19" E., near Maui IV.
Drilled; Dec. 11-26, 1944 by 1397th Engineer Construction Battalion,
U.S. Army.
Altitude; 241 ft. Depth; 225 ft.
Cas? ng; None.
Aquifer; Red clay and sand.
Source of record; Driller.
Remarks; Water was found at depth of 208 ft.
Chloride; 20 ppm, at completion (log).
Well was bailed dry. Well was plugged and abandoned.
LOG
Description of material Depth (ft)
Clay and limestone - - - - ----- - -- - 0-26Limestone - - - - --- - 26-100Limestone and red clay ---------------------- -__ ________ 100-155Red clay and sand (struck water at 208 ft, bailed dry) 155-225
397

WELL 23B (called 23A by Piper, 1946-47)
Location; At well 23A, lat 15°12'40" N., long 145°44'19" E.,
near Maui IV.
Drilled: Dec. 24, 1944 to Jan. 15, 1945 by 1397th Engineer Construction
Battalion, U.S. Army.
Altitude; 241 ft. Depth; 250 ft.
Casing; 6 in. to 245 ft with lower 40 ft perforated.
Aquifer; Red clay and sand (dander, 1946); limestone and red clay (Davis,
1958).
Source of record; Driller.
Remarks; Water was found at depth of 195 ft.
Depth to water before pumping, 195 ft.
Chloride: 20 ppm, at completion (log).
Pumpage: less than 15,000 gal/d at completion (log).
15,000 gal/d (Glander, 1946).
Well was abandoned because of low yield.
LOG
Description of material Depth (ft)
Limestone - - -- - - - - 0-47Red clay 47-50Limestone 50-114Shale 114-115Limestone - - - -- 115-135Shale 135-136Limestone ----- - --- - - - 136-160Limestone and red clay -- ---------------------------------- 160-206Red clay and sand 206-210Red clay 210-237Red clay and sand 237-250
398

WELL 30
Location; Lat 15°12'42" N., long 145°44'20" E., near Maui IV.
Drilled: Jan. 6-22, 1945 by 1397th Engineer Construction Battalion,
U.S. Army.
Altitude; 220 ft. Depth; 290 ft.
Casi ng; 6 in. to 255 ft with lower 40 ft perforated.
Aquifer; Limestone.
Remarks; Depth to water before pumping, 213 ft.
Chloride: 40 ppm, at completion (log).
40-100 ppm (Glander, 1946).
30-100 ppm (Piper, 1946-47).
Pumpage: 200,000 gal/d, at completion (log).
85,000 gal/d (Boniface, 1945).
40,000-60,000 gal/d (Glander, 1946).
pH: 7.0-7.2 (Glander, 1946).
LOG
Description of material
Hard 1 ime ---- -_-_-___ ___- _ __________Brown clay - - -------- -- ______________Limestone and brown clay ------ _______-_. Limestone -------------- _- --- ________Hard lime and sand clay - Hard lime and brown clay ------------- --.Very hard lime ________ _ ____________
Depth (ft)
0_qc. 95-115. 115-135 . 135-147. . 147-157_________________ 157-175. 175-187. ______ __ lft7_9Qfl
399

WELL 51
Location; Lat 15 O 12'44" N., long 145°44'23" E., near Maui IV.
Dr II led; Completed Sept. 1, 1945 by 117th U.S. Naval Construction Battalion
Altitude; 210 ft. Depth; 248 ft.
Casi ng; 6 in. to 248 ft with bottom 45 ft perforated.
Aguifer; Limestone and clay.
Source of record; Glander (1946).
Remarks; Chloride; 40-80 ppm (Glander, 1946).
30-85 ppm (Piper, 1946-4?)
Pumpage; 45,000-75,000 gal/d (Glander, 1946).
pH: 7.2-7.4 (Glander, 1946).
Well was abandoned in 1947 or 1948.
400

WELL Maui IV (Tanapag infiltration tunnel)
Location; Lat 15°12'44" N., long 145°44'20" E.
Dr ?1led: September 1945 to April 1946.
Altitude: 224.62 ft. Depth; 225.7 ft.
Diameter of hole; Shaft is 8 x 8 ft, vertical, timbered. Two main tunnels,
each with one lateral, draining into a 12 x 12 x 8 ft
concrete lined pump sump. Total length is 1,100 ft.
Source of record: Glander (1946).
Remarks; June 26, 1974: Analyses by W. B. Brewer, Health Services Trust
Territory, using Hach kit:
Chloride, 650 ppm.
pH, 7.6.
Sulfate, 60 ppm.
Alkalinity as CaCO_, 240 ppm.
Hardness, 390 ppm.
No fecal or total coliform per 100 ml.
Production: 230,000 gal/d, average during 1964- .
270,000-470,000 gal/d, during January to August,
1965^.
114,000 gal/d, average during 1974.
143,000 gal/d, average during 1975.
143,000 gal/d, average during 1976.
152,000 gal/d, average during 1977.
Well reported dry on Dec. 9, 1953 (Field notes Ted Arnow).
For chemical analyses, see tables 71, 74.
- Written communication M. M. Miller and Ted Arnow to High Commissioner of
the Trust Territory of the Pacific .Islands, 1965.
401

WELL Maui IV
Pumping rate and chloride concentrations of Maui IV
Date
1946July 1947 to
Feb. 1948March 1950
May 8, 1952Aug. 13, 1952Oct. 21, 1952
Do.Do.
Jan. 19, 1953Mar. 3, 1953Apr. 7, 1953July 6, 1953Dec. 16, 1953June 23, 1954
July 6, 1956
July 7, 1956
September 1965Dec. 21, 1966January 1967Sept. 20, 1967June 26, 1974Sept. 14, 1974
Time
14301500151515151500
103011051315
1545
0200
--
Pumping rate
(gal/d)
..315,000
300,000
170,000
170,000--
170,000643,000 --
~864,000
177,000
Chloride (mg/L)
50
838
330280588336332520
1,150685
1,2751,440
780
1,200
1,160
540600427620650
1,030
Source
Arnow Pumpage records
2/ Arnow-'
Field notes Arnowdo
Arnow^-do.do.do.-'do. jdo. -do.do.
Bishop^,
Cox (1956)^
do.
Ronimus (1980)do.do.do.
Remarks
After construction.Average of 45 weekly
totals.Pumping rate increased
to 300,000 gal/dduring 1946-50.
Pumped water.From sump.From gal lery.
Pumping was decreasedto reduce sal i ni ty .
After 15 minutes ofpumping.
After 2-1/2 hours ofpumping.
Ronimus (1980).Do.
Note: The pumping decreased after the U.S. Dept. of the Interior took overthe Trust Territory administration on July 1, 1951. The U.S. Navy resumed control in January 1953 and increased the pumping rate.
- Written communication Ted Arnow to ComNavMar, Jan. 22, 1953.2/- Written communication Ted Arnow to ComNavMar, Dec. 23, 1953.
- Written communication Ted Arnow to ComNavMar, July 13, 1953-4/- Written communication Ted Arnow to D. A. Davis, May 11, 1953.
- Written communication, E. W. Bishop to ComNavMar, July 19, 1954
- Collected by D. C. Cox, analyzed by P. E. Ward.
402

WELL Maui IV
Chloride concentration and specific conductance of water from Mau? IV
[U.S. Geological Survey]
Specific Pumping
Chloride conductance Temperature rate
Date Time (mg/L) (ymho) (°C) (gal/min)
5-31-78 3-18-806-17-806-20-808-18-8211-18-827-1-839-8-83
1635 1400
790 280480520
1,1001,0001,5002,000
2,2004,1303,9805,5006,930
--25.628.528.232.527.5
116 7070
250
403

WELL Maui IV
[Source
Chemical analyses of water from Haul IV
P. A. Mack, Water Quality Laboratory, Commonwealth of the Northern Mariana Islands]
Date
2-17-822-3-822-22-823-8-824-12-825-3-825-14-825-24-826-4-827-6-827-9-828-10-828-17-828-24-828-31-829-9-8210-7-8211-10-8212-7-821-19-832-25-834-21-836-20-837-18-838-15-839-8-8310-14-83
Chloride (mg/L)
306329297147222403536527886
1,7001,3601,6401,7121,6701,660
970686450854744880910
1,1801,8301,8802,0001,430
Total sol ids (mg/L)
880 594656
1,110 _.
2,760 259 -- -- __
Specific conductance
(vimho)
._1,630
1,0101,2702,0002,370
5,2805,870
3,760
2,0003,3503,0603,5903,5104,5006,5605,9906,7104,940
pH (uni ts)
7.7
7.27.57.0 --
7.2
7.47.5
7.5
7.87.77.77.57.37.97.5-- --
Turb idi ty (NTU)
._0.32 .68.20.20-- --1.3.18
. -- --
Alkal inity (mg/L)
__ -- ----
251
260--
254258 --
259
262257252251250249241246248--
Hardness as CaCCy 4-21-83, 615 mg/L; 7-18-83, 892 mg/L; 8-15-83, 876 mg/L.
404

WELL Maui IV
LOG
Date Remarks
Sept. 7, 1945 Clearing operation at shaft portal.Sept. 23 Depth of shaft, 50 ft.Oct. 8 Depth of shaft, 102 ft.Nov. 4 Depth of shaft, 208 ft. Began excavation
of pump chamber. Nov. 11 Began excavation of tunnels, tunnel A in
easterly direction, tunnel B in westerlydi rect ion.
Nov. 15 Length of tunnel A, 14 ft; tunnel B, 14 ft.Jan. 1, 1946: Length of tunnel A, 355 ft.
Jan. 20 Tunnel A completed, length 575 ft. Jan. 21 Began taking up bottom in tunnel A, beginning
at heading and working toward shaft.Invert of finished tunnel, about 1.5 ftbelow water level at heading and 3-5 ftbelow water level at pump sump.
Feb. 3 Take up of bottom in tunnel A, 345 ft fromheading. Started excavating tunnel Cin southerly direction from A at 221 fromshaft.
Feb. 8 Resumed excavation in tunnel B. Feb. 13 Length of tunnel B, 40 ft. Length of tunnel C,
100 ft. Feb. 18 Length of tunnel C, 155 ft. Small cave
with pool of water at 155 ft. Lengthof tunnel B, 76 ft.
Feb. 19 Test made on pool in tunnel C; pumped at316,800 gal/d for 1/2 hour; drawdown,0.2 ft, chloride, 30 ppm.
Feb. 28 Length of tunnel B, 135 ft. Tunnel C completedat 256 ft.
405

TEST HOLE Maui IV wel1 1
Location; Lat 15°12'35" N., long 145°44'16" E., at Maui IV.
Drilled: Feb. 25 to Mar. 5, 1970; reamed Mar. 6-20, 1970 by Layne
Internat ional, Guam.
Altitude: 285.76 ft. Depth: 308 ft.
Diameter of open hole: 10 in.
Source of record: Driller.
Pumping test: At completion, yield less than 50 gal/min during 24-hour
pump test; chloride, more than 200 mg/L.
Remarks: Chloride: 390 mg/L, February 1970.
Chloride determinations, April 23? 1970
Elapsed Pumpingtime rate Chloride
Hour (mln) (gal/min) (mg/L)
1200 Start test.1220 2 18 1501300 60 19 1501400 120 21 1701500 180 211600 240 21 170 End of test
406

TEST HOLE Maui IV well 1
LOG
Description of material Depth (ft)
Brown medium hard clay -------------------------------------- 0-5Brown soft clay --------------------------------------------- 5-1^Dark brown medium soft clay --------------------------------- 14-18Brown medium soft clay - ----------------------------------- 18-30Brown hard -- -------- _______ __________ __ 30-35Brown medium hard ------------------------------------------- 35-39Brown hard ---------- ------ _ - __ 39-42Brown very hard -------------------_----------------_-_---- 42-47Brown medium soft ------- ------------------------_-_-___--- 47-49Brown medium hard (51-55 open) ---------------------------- 49-75Brown hard ------------------------------------------------ 75-86Very hard coral (chatter) --- -- --- -- - 86-90 Very hard -- - ----- --_ __.__ 90-95Medium hard ------ -- _______________ __ .___ 95-106Medium soft, clay mixed with coral - -------------- ----- 106-110Soft 110-135 Hard coral 135-140 Very hard 140-155 Hard clay --- -- - ------ -- 155-159Very hard coral - 159-181'3 1/2" Very hard coral 181'3 1/2"-223 Hard 223-229'8 1/2" Very hard 229'8 1/2"-265 Open --- -- - -- ------- ______ ____ 265-268Medium soft 268-272 Medium hard 272-276 Medium soft 276-283 Hard (Static depth to water 284.25 ft) 283-286 Medium hard 286-305'8 1/2"
End of dril1 ing 308
407

WELL Maui IV well 1. Called 141 (1982)
Location: Same as testhole Maui IV well 1, lat 15°12'35" N.,
long 145044'16" E., 0.2 mi south of Maui IV.
Drilled; Nov. 11-16, 1970 by Asia Wells, Inc.
Altitude: 290.37 ft (Sablan, Takai and Assoc., April 1982).
Depth: 304 ft.
Casi ng: 8-in. steel with 10 ft 8-in. stainless steel screen at bottom.
Gravel pack and grout; Gravel from 275 ft to bottom, grout from ground surface
to gravel.
Source of record: Driller.
Pumping test: Nov. 21, 1970, before acidizing: No drawdown in 4-1/2 hours at
pumping rate of 12-30 gal/min; chloride, 185-390 ppm;
hardness, 240-290 ppm. See pumping test record.
Nov. 23-24, 1970, after acidizing: Drawdown, 1.4 ft in 28 hours
at pumping rate of 20-50 gal/min; chloride, 315-480 ppm.
See pumping test record.
Mar. 20, 1982: Drawdown, 3-3 ft in 4 hours at pumping
rate of 32 gal/min; recovery to original water level in one
minute; pump was sucking air during the test. See pumping
test record.
Remarks; Chloride: 690 ppm, Nov. 13, 1970.
390 ppm, Dec. 22, 1970.
450 ppm, Jan. 7, 1971.
160 ppm, Dec. 7, 1972.
375 ppm, Dec. 14, 1972.
295 ppm, Mar. 8, 1972.
219 mg/L, Feb. 22, 1982.
Hardness: 344 ppm, at completion.
Pumpage: 76,300 gal/d, Mar. 21, 1973 (USGS).
No water, May 5, 1980.
408

WELL Maui IV well 1. Called 141 (1982)
Depth to water, in feet
[Source: Northern Mariana Islands Division of Environmental Quality]
Altitude of measuring point, 290.37 ft.
Date
9-27-713-21-739-5-80 -9-19-809-29-8010-3-8011-10-8011-28-8012-5-8012-12-801-5-81 -
Depth to water
j/285.78 1'286.54 286.82 280.56 274.96 285.84 286.12- 285.51 285.45- 285.46 285.27
Date
1-16-81 1-26-81 2-4-81 2-10-81 2-16-81 3-9-81 3-12-81 5-7-81 5-11-81 5-13-81 -5-20-81
Depth to water
285.22285.97285.79285.32285.31285.27285.34287.06286.88287.57286.99
Date
6-2-81 6-19-81 6-30-81 7-14-81 8-12-81 9-9-8110-16-81 11-25-81 12-3-81 12-10-81 T-6-82
Depth to water
286.36286.92286.86286.79286.91286.14286.80275.12274.98274.81290.17
- By U.S. Geological Survey.
LOG
Description of material Depth (ft)
Hard, shattered 1imestone -------------------------- __---__ Q-8Fairly soft limestone and clay ------------------------------ 8-30Hard, fractured limestone with traces of reddish brown clay - 30-135Fractured limestone, buff colored - - - -- 135-240Brown sandy clay and fractured limestone - - 240-245Limestone, light buff colored 245-294Light colored fissured limestone -- -- 294-304
Water bearing strata, 294 ft Static depth to water 283 ft
409

WELL Maul IV well 1. Called 141 (1982)
PUMPING TEST
Date: November 21, 1970.
Time
0730
0800081508450915093010001030110011301200
Elapsed t ime (mi n)
0
304575
105120150180210240270
Depth to water (ft)
284.8
284.8284.8284.8284.8284.8284.8284.8284.8284.8284.8
Pump ing rate
( ga 1 /m i n )
__
12202020303030303030
Chloride (ppm)
__
--
185240300300300360360390390
Hardness (ppm) Remarks
Static depth towa te r .
Start of test.----
240290240240240240240275 End of test.
410

WELL Maul IV well 1. Called 141 (1982)
PUMPING TEST
Date: November 23-24, 1970.
Time
Elapsed t ime (min)
Depth to water (ft)
Chloride Pumping (ppm)
rate (gal /min) Field
Layne Lab.
Hardness (ppm) Remarks
November 23. Pump intake at 286 ft
0815 0
082008300845090009150940102011201150
1150-1415
141514301515153016301730183019302030213022302330
November
0030013002300330 10430 10530 10630 10730 10830 1
51530456085125185215
: Change
215230275290350410470530590650710770
24
830890950,010,070,130,190,250,310
285.8285.2284.5284.5286.0286.1286.1286.2286.2
pump sett
__291.2286.0286.5287.2287.2287.2287.2287.2287.2287.2287.2
287.2287.2287.2287.2287.2287.2287.2287.2287.2
202320203030303232
ing from
__4040505050505050505050
505050505050505050
--
330330330360390390390
286 to
__390390390420420420450450450450450
450- 450
450450450480480480480
------------
315335--
291 ft
__--
350----
375380385395405415425
420430435440450435440450440
Start of test. After ac idiz ing,
275275275275275280280
Continue test.275275275375
411

WELL Maui IV well 1. Called 141 (1982)
PUMPING TEST--Continued
Time
0930103011301215
Elapsedt ime(min)
1,3701,4301,4901,535
Depth towater(ft)
287.2287.2287.2287.2
Pump ingrate
(gal /min)
505050
Chloride (ppm)
Field
480480480
LayneLab.
450450440450
Hardness(ppm) Remarks
_
pH 7-7; alkal i n ity
1230 1,550 287.2 50 480
(CaCO ), 210 ppm
End of 28-hour test
Date: March 20, 1982.
Static depth to water 286.0 ft; pump intake at 289.4 ft.
Elapsedtime(mi n)
05
10204060
120240
100 percent
Depth towater(ft)
286.0289.0289.2289.3289.328S.3289.3289.3
recovery in
Pump i ngrate
(gal /min) Remarks
Start of test.32323232323231 End of test.
one minute.
412

WELL Maui IV well 2 (B). Called 142 (1982)
Location; Lat 15°12'39" N., long 145°44'18" E., 0.1 mi south of at Maui IV.
Drilled; Aug. 19 to Sept. 26, 1970 by Asia Wells, Inc.
Altitude; 261.66 ft (Sablan, Takai, and Assoc., April 1982).
Depth; 281 ft.
Casi ng; 8-in. steel.
Source of record; Driller.
Pumping tests; Initial test: Drawdown, 0.1 ft at pumping rate of 30 gal/min;
chloride, 400-650 mg/L.
Oct. 5, 1970: Drawdown, 4.8 ft in 4 hours at pumping rate of
28-58 gal/min; chloride, 300-315 mg/L. See pumping test record,
Oct. 5~7, 1970: No drawdown, in 32 hours at pumping rate of
47-58 gal/min; chloride, 275-315 mg/L. See pumping test record,
Remarks; Chloride: 275-315 ppm, Oct. 5-6, 1970.
330 ppm, Dec. 21, 1970.
945 ppm, Dec. 14, 1973.
1,600 ppm, June 26, 1974.*
Hardness: 440 ppm, Sept. 23, 1971.
680 ppm, June 26, 1974.*
Pumpage: 250 gal/min, May 5, 1980.
27 gal/min, Aug. 18, 1982 (USGS).
55 gal/min, Apr. 27, 1983 (USGS).
53 gal/min, July 1, 1983 (USGS).
June 26, 1974*: pH, 6.9.
sulfate, 175 ppm.
alkalinity (as CaCo~), 210 ppm.
no fecal or total coliform per 100 mL.
* Analysis by W. B. Brewer, Health Services Trust Territory, using Hach kit.
413

WELL Maul IV well 2. Called 142 (1982)
Chemical analyses of water from well 142
[Sources: Water Quality Laboratory, Commonwealth of the Northern Mariana Islands, and U.S. Geological Survey(*)]
Date
4-21-839-8-83*10-14-83
Chloride(mg/L)
8551,2001,430
Specificconductance
(ymho)
3,8704,2804,000
pH(units)
7.2
7.8
Turbidi ty(NTU)
545
246
Alkal inity(mg/L)
249
LOG
Description of material Depth (ft)
Clay and limestone - - - -- - - Limestone - -- - - --- - Clay and soft limestone - - Hard limestone - - - - - - Soft limestone - Limestone, open channel -- -- Broken limestone and clay, soft Broken limestone, some clay, soft Red clay with sand and gravel, soft -- Shattered limestone, buff colored, traces of clay Shattered limestone and layer of dark brown clay Fractured limestone, buff colored, traces of clay Limestone, buff colored, very hard Fractured limestone, buff colored, traces of clay
Water bearing formation at 258 ft Static depth to water, 255 ft
0-22-4
4-2828-3232-3434-4242-6060-85
85-140140-170170-180180-254254-258258-281
414

WELL Maui IV well 2. Called 142 (1982)
Depth to water, in feet
[Source: Ayers, 1981]
Date
9-10-71J/ -9-27-71- --9-5-809-19-80 9-29-80 10-3-80 10-10-80 --10-17-80 --
Depthto
water
256.99257-18257.30257.43256.52256.31255-97255.78
Date
10-27-80 11-10-80 11-14-80 --11-18-80 --11-19-80 --11-21-80 --11-28-80 12-5-80
Depthto
water
256.15256.52257.30257.38257.98257.96256.36257.95
Date
12-12-80 --1-5-81 1-16-81 1-26-81 2-4-81 2-16-81
Depthto
water
257.57257.04256.88257.04257.27256.80
By U.S. Geological Survey.
PUMPING TEST
Date: October 5~7, 1970.
Time
Elapsedt ime(mi n)
Depth towater(ft)
Pump ingrate
(gal /mi n)Chloride(mg/L) Remarks
1330
1430153015351630163517001730
4-hour test
0
60120125180185210240
260.2
260260263263265.0265.0265.0
28
2828
37
58
315
315300300300300315300
Start of test. Meter reading 157,300.
End of 4-hour test. Meter reading 166,800
415

WELL Maui IV well 2. Called 142 (1982)
PUMPING TEST--Continued
Time
180019002000210022002300240001000200030004000500060007000800
09001000110012001300140015001600
1700180019002000210022002300240001000200
Elapsed t ime (mi n)
32-hour
060
120180240300360420480540600660720780840
900960
1,0201,0801,1401,2001,2601,320
1,3801,4401,5001,5601,6201,6801,7401,8001,8601,920
Depth to water (ft)
test
264.7265.0265.0264.8264.7264.8264.8264.8264.8264.8264.8264.8264.8264.8264.8
264.8264.8264.8264.8264.7264.8264.7264.8
264.8264.8264.8264.8264.8264.7264.7264.7264.7264.7
Pump ing rate
( ga 1 /m i n )
555655535656565658585555555553
5551515545555551
55555353515147505052
Chloride (mg/L) Remarks
275 Continuation of test.275275255275275275275 Oct. 6, 1970.275275275275275275275
275275300315300275275275
275275275275275275275275275 Oct. 7, 1970.275 End of 32-hour test.
416

WELL Maui IV well 3- Called 143 (1982)
Location: Lat 15°12'42" N., long l45°44'22" E., 0.05 mi southeast of Maui IV.
Drilled; Completed Nov. 25, 1970 by Asia Wells, Inc.
Altitude; 239.35 ft (Sablan, Takai and Assoc., April 1982).
Depth; 251 ft.
Casi ng; 8-in. steel.
Source of record; Driller.
Pumping test; Nov. 13, 1970: Drawdown, 0.1 ft in 2 hours at pumping rate of
20-32 gal/min; chloride, 210-690 ppm. See pumping test record,
Remarks: Chloride: 690 ppm, Nov. 17, 1970.
840 ppm, Dec. 17, 1970.
220 ppm, Sept. 23, 1971; hardness 330 ppm.
480 ppm, Dec. 14, 1972.
200 ppm, Mar. 8, 1973-
950 ppm, June 26, 1974; hardness 510 ppm.*
1,236 mg/L, average of 7 samples May 18 to Sept. 8, 1977
(M and E Pacific, 1978).
Depth to water: 235.11 ft (not pumping), Sept. 27, 1971; 241.95 ft
(pumping), Mar. 21, 1973 (USGS).
Pumpage: 72,000 gal/d, initially.
June 26, 1974*: pH, 7.4.
sulfate, 92 ppm.
alkalinity (as CaCCL), 240 ppm.
no fecal or total coliform per 100 mL.
* Analysis by W. B. Brewer, Health Services Trust Territory, using Hach kit.
417

WELL Maui IV wel1 3. Called 143 (1982)
Chemical analyses of water from well 143
[Source: P. A. Mack, Water Quality Laboratory, Commonwealth of Northern Mariana Islands]
Date
1-7-811-27-812-4-812-18-813-13-814-22-815-29-816-10-817-1-817-28-818-20-819-23-8110-16-8111-25-8112-28-812-17-822-22-823-8-824-12-825-3-825-24-826-4-827-6-827-9-828-10-828-17-828-24-829-8-8210-7-8211-10-8212-7-821-19-832-25-834-21-836-20-837-18-838-15-839-8-8310-14-83
Chlor ide (mg/L)
377357357361364429414429437978 .600500758114724275262179412365544991
1,4501,510
621584586595639952
1,3601,1301,1701,2301,2801,9301,9401,9901,860
Total sol ids (mg/L)
1,000944
1,050992
1,0501,0701,1001,1201,1001,6801,3401,2401,680498
1,660804 618
1,0101,150
3,050 __
1,380--__
2,460 __ --
Specific conductance
(ymho)
..1,6701,7201,8001,8501,9202,0002,0202,0103,1202,4502,2403,070
8963,0001,450
__1,1102,0201,790 --__
5,5892,760
----
2,610--
3,6804,8504,3804,5404,7204,8306,3306,1705,1606,310
pH (units)
7.87.27.77.37.57.77.17.77.67.87.77.47.57.57.57.8--
7.37.47.1
7.5--
7.47.3----
7.5--
7.78.17.67.77.47.97.5--__
7.8
Turbidi ty (NTU)
0.11.30.30.29.33.58.59.29.35.16.28.53.31.25.22.19 .58.22.34 --.29.14 ____ __ --
the
Alkal inity (mg/L)
mm mm
--
--
--
--
--
__
--
__
--
--
--
--
--
__
--
--
--
265--
255272----
268--
262266264262256253253254257259
Hardness as CaCCL: 4-21-83, 635 mg/L; 7-18-83,
418
mg/L; 8-15-83, 901 mg/L

WELL Maui IV well 3. Called 143 (1982)
Chloride concentration and specific conductance of water
Date
5-31-786-17-806-20-808-18-8211-18-823-2-837-1-839-8-83
Time
*- *-
16451425154512301410
[U.S.
Chl or ide(mg/L)
1,100500520650
1,2001,2001,6002,000
from wel 1 143
Geological Survey]
Speci f icconductance
(umho)
..
2,2102,8404,3404,3605,6707,010
PumpingTemperature rate(°c)
..--
25.528.028.227.528.027.0
(gal /mi n)
3031--50--------
LOG
Description of material Depth (ft)
Clay and coral fill --- --- ------------Clay and limestone, soft ---------- -----Traces of clay, alternating hard and softFractured Fractured Fractured Fractured Fractured
imestone, medium hard, traces of clay imestone, buff colored, traces of clay imestone, medium hard, traces of clay imestone, hard, traces of clay ----- imestone, hard, clean -----------------
0-4
20-6060-100100-140140-200200-230
419

WELL Maui IV well 3. (Called 143 (1982)
PUMPING TEST
Date: November 13, 1970.
Time
Elapsed t ime(mi n)
Depth to water (ft)
Pumpi ngrate
(gal/mi n)Chloride (ppm) Remarks
0750 Meter reading, 438,880
075508050820083508500905092009350950
5153045607590105120
234.1234.1234.1234.1234.1234.1234.1234.2234.2
20 -- 23
32--
210420540600630630630660690 Meter reading,
442,700
420

WELL Maui IV well 4. Called 144 (1982)
Location: Lat 15°12'45" N., long 145°44'25" E., 0.1 mi northeast of
Maui IV.
Dr 11 led: January 1971 by Asia Wells, Inc.
A1titude; 214.61 ft (Sablan, Takai and Assoc., April 1982).
(212.94 ft at measuring point, USGS).
Depth; 232 ft.
Casi ng: 8-in. steel casing with 10 ft 8-in. stainless steel screen at bottom,
Gravel pack and grout: Silica gravel to 204 ft, grout to ground level.
Source of record: Driller.
Remarks; Chloride: 90 ppm, at completion.
450 ppm, Jan. 15, 1971.
375 ppm, Jan. 27, 1971.
375 ppm, Feb. 10, 1971.
480 ppm, Dec. 14, 1972.
380 ppm, Mar. 8, 1973.
1,850 ppm, June 26, 1974.*
1,404 mg/L, average of 6 samples May 18 to Sept. 8, 1977
(M and E Pacific, 1978).
738 mg/L, June 10, 1980.
Hardness: 470 ppm, Sept. 23, 1971.
730 ppm, June 26, 1974.*
Water level: + 1.69 ft, Mar. 21, 1971 at 0939. Pump off at
0935 (USGS).
+ 3.06 ft, Sept. 27, 1971 at 1811 (USGS).
+ 3.04 ft, Sept. 28, 1971 at 0824 (USGS).
+ 3.00 ft, Sept. 29, 1971 at 1000 (USGS).
Pumpage: 72,000 gal/d, initially.
June 26, 1974*: pH 7.3.
sulfate, 250 ppm.
alkalinity (as CaCCL), 220 ppm.
fecal coliform, 0 per 100 mL.
total coliform, 20 per 100 mL.
For chemical analyses of July 1, 1983, see table 76.
* Analysis by W. B. Brewer, Health Services Trust Territory, using Hach kit.
421

WELL Maui IV well 4. Called 144 (1982)
Chemical analyses of water from wel1
[Source : P. A. Mack, Water Quality Laboratory, CommonwealNorthern Mariana Is
Date
1-27-812-4-812-18-813-13-815-14-815-29-816-10-817-1-817-28-818-20-819-23-8110-16-8111-25-8112-28-812-17-822-22-823-8-824-12-825-3-825-24-826-4-827-6-827-9-828-10-828-17-828-24-829-8-8210-7-8211-10-8212-7-821-19-832-25-834-21-836-20-837-18-838-15-839-8-8310-14-83
Chlor ide(mg/L)
540594579620700415797800809608500773446786371369377405413530495595687625595584697594121
1,3601,130
540760753969
1,3801,0501,180
Totalsol ids(mg/L)
1,3901,4101,4501,5701,6201,1701,7501,7601,7801,3901,2701,7101,1401,800
996
1,0901,0201,050
1,530 --
1,530 --
Specificconductance
(pmho)
2,3102,1702,5802,6702,8302,0002,6702,7402,3002,4902,2603,1602,8703,2301,810
1,9301,9802,000
2,8702,6802,850
2,900 853
4,8504,3902,4703,1703,1403,7504,7204,1904,340
lands]
pH Turbi
th of
dity(units) (NTU)
7.2 2.7.7 1.7.3 1.7.47.57.17.67.57.87.67.37.57.0 3-7.37.7
7.27.47.1
7.7
7.67.5
7.4
7.87.87.77.47.47.97.5
7.7
35375167050482322844002226 222322 2013 -- --
the
Alkal ini ty(mg/L)
---- --
271
265271 --
257--
264264262263263262262263267267
Hardness as CaCO 4-21-83, 580 mg/L; 7-18-83, 598 mg/L; 8-15-83, 728 mg/L
422

WELL Maui IV well 4. Called 144 (1982)
Chloride concentration and specific conductance of water from well
[U.S. Geological Survey]
Date
5-31-783-18-806-17-806-20-808-18-8211-18-829-8-83
Time
.. 165013501345
Chloride(mg/L)
1,800600750750700460
1,100
Specif icconductance
(ymho)
..
2,9502,8502,1104,030
Temperature(°c)
..
25.62828.227.5
Pumpingrate
(gal/min)
704836 43 --
LOG
Description of material Depth (ft)
Clay and coral fill - - - Clay and limestone ---- -------------------Limestone, slightly fractured, medium hard Traces of clay, limestone, medium hard -- Fractured limestone, medium hard ---------Fractured limestone, medium hard, traces of Fractured limestone, hard, traces of clay - Clean limestone, fractured, buff colored
clay
0-44-30
30-4040-6060-80
80-120120-160160-232
423

WELL 145 (At first called 141)
Location; Lat 15°12'45" N., long 145°44'18" E., at Maui IV.
Drilled; Mar. 4-11, 1982 by Pacific Drilling Inc.
Altitude; 242.23 ft (Sablan, Takai and Assoc., April 1982).
Depth; 300 ft.
Casi ng; 260 ft solid 8-in. casing with 32 ft stainless steel screen below,
Gravel pack and grout; Gravel at lower 58 ft; 10 bags cement used.
Source of record; Driller.
Pumping test; Mar. 12, 1982; Maximum drawdown, 50 inches during 5 hours
at pumping rate of 22-55 gal/min; chloride, about 400 mg/L.
See pumping test record.
May 25-26, 1982: Drawdown, 6.2 ft in almost 19 hours
at pumping rate of 36-55 gal/min. See pumping test record.
June 8, 1982: Maximum drawdown, 11.8 ft during 1-1/2 hours
at pumping rate of 50 gal/min; recovery to static level
in less than 10 minutes. Test interrupted by malfunction.
See pumping test record.
June 9> 1982; Maximum drawdown, 10.6 ft during 8-1/3 hours
at pumping rate of 60-70 gal/min; chloride, 347-389 mg/L.
See pumping test record.
424

WELL 145
Chemical analyses of water from well 145
[Source: P. A. Mack, Water Quality Laboratory, Commonwealth of theNorthern Mariana Islands]
Date
6-16-826-17-827-6-827-S-828-10-828-17-828-24-829-8-8210-7-8212-7-821-19-832-25-834-21-836-20-837-18-838-15-839-8-8310-14-83
Chloride (mg/L)
368400591691
1,2401,3301,4001,5201,7001,4201,8402,1202,4102,8302,9203,1203,2703,520
Total sol ids (mg/L)
_
1,610
3,080
4,120 -- --
Specific conductance
(pmho)
.. --
2,9504,690
5,590
5,0406,5907,3308,3409,4108,7308,81010,80010,500
pH (units)
..
7.67.5
7.4
7.47.67.47.37.87.4
7.6
Turbidi ty (NTU)
0.18.09 --
Alkal inity (mg/L)
«
--
272246
242--
257243242237232228
233229
Hardness as CaCO : 4-21-83, 1,270 mg/L; 7-18-83, 1,460 mg/L; 8-15-83, 1,560 mg/L,
Chloride concentration and specific conductance of water from well 145
[U.S. Geological Survey]
Time
8-18-8211-18-821-14-833-2-837-1-839-8-83
Time
__
0900153512001350
Chloride(mg/L)
1,4001,300
2,2002,9003,400
Specif icconductance
(pmho)
4,7304,690
7,3509,45010,600
PumpingTemperature rate?°C)
» M
28.2
28.5. 28.028.5
(gal /mi n)
» *
6565----
425

WELL 145
LOG
Description of material Depth (ft)
White silty sandy coral gravel (dense to very dense) - 5Color to tan white -- - - 35Color to light brown - - 40Brown silty clayey with coralline limestone (dense) -- ---- 55White coralline limestone (dense) --------------------------- 60Lost circulation - 65Regained circulation - - --- - - -- 85Drills very hard 190Blue-green volcanic rock (medium dense) - - 200Loose drilling - - -- - 205Reddish volcanic rock (dense) - - - 210Limestone - 224-226Lost circulation -- 235Regained circulation - - 245Drills very hard 250White limestone; occasional reddish brown -- - - 275Cave-in 278-280Volcanic rock 280Color to pinkish white 290Color to white -- -- 295Boring terminated --- - - - 300
426

WELL 145
PUMPING TEST
Date: March 12, 1982.Static depth to water, 239.7 ft; pump intake at 273 ft
Time
14101411141214131414141514161417141814191420143014401450150015101520153015401610164017101740181018401910
Elapsed t ime (mi n)
0123456789
102030404060708090120150180210240270300
Drawdown (in.)
815182630303030303031333636494950505050 ------
Pumpi ng rate Chloride
(gal /mi n) (mg/L) Remarks
Start of test55555555555555555555555555554242424238383624 *400222323 End of test.
* About
427

WELL 145
PUMPING TEST
Date: May 25-26, 1982.Static depth to water, 228.0 ft.
Time
1308130913101311131213131314131613281338135314081429150816081620163516481658171318081918195320532153225300530153025303530453055306530753
Elapsed t ime (mi n)
01234568
2030456080120180192207220230245300370405465525585705765825885945
1,0051,0651,125
Depth to water (ft)
228.0228.9229.3229.5230.0230.5230.7230.8230.8230.8230.9231.0231.1231.4231.6
229.0230.0230.2230.5230.7231.7233.0232.7233.5234.0234.2234.2234.2234.2234.2234.2234.2
Pumpi ng rate
(gal/min) Remarks
Start of test.555555555550 Same reading at 1315.504828281818 Same reading at 1448.18 Same reading a 1538.16
Stopped pump; lowered pump 8 ftStarted pump.
55555555 Same reading at 1823.5550385050 Same reading at 2353.50 May 26, 1982.50453636464850 End of test.
428

WELL 145
PUMPING TEST
Date: June 8, 1982.Static depth to water, 238.7 ft; pump intake at 275 ft
Time
Elapsed t ime (mi n)
Depth to water (ft)
Pump ingrate
(gal/mi n) Remarks
094109440951095810001007102010211023102510401046105110571103
1107
03
10171926394042445965707682
86
238249.250.
Start of test.
248.9
238.7247.4247.2248.9248.8248.7249.2249.6
238.7
5550
55
50
5050505045
Turned off pump for repairs. Resumed pumping.
Same reading at 1030 and 1035
Lost suction, shut off pump to allow back flow to clean pump
End of test because of pump troubles.
429

WELL 145
PUHPING TEST
Date: June 9, 1982.Static depth to water, 238.7 ft; pump intake at 275 ft
Time
09401008102210371043104711501300142015091545162517151800
Elapsed t ime (mi n)
02842576367130200280329365405455500
Depth to water (ft)
238.7
247.2249.2
249.3249.3249.1249.1249.0249.2249.0248.8248.8
Pumping rate
(gal/min) Remarks
Start of test.60606065 7070707070707070 End of test.
Note: Chloride during test, 347-389 mg/L.
430

WELL 146
Location; Lat 15O 12'41" N., long 145°44'20" E., at Maui IV.
Dr i1 led: August 1982 by Geo-Engineering and Testing.
Altitude; 223.12 ft. Depth; 300 ft.
Diameter of open hole; 12 in.
Casi nq; 8-in. steel.
Source of record; Driller.
Remarks: Well is not used.
LOG
Description of material Depth (ft)
Light brown limestone fill - - --- -------------- ------- Q-2Red brown silty clay, soft --- ---- ---------- _____________ 2-11Yellowish white limestone, hard ------------------------- -- 11-20Yellowish light brown limestone, hard ------------------- 20-30Yellowish white limestone, hard - - - - 30-50Yellowish brown limestone, moderately hard ----------------- 50-70Yellowish green-brown clayey limestone, moderately hard ----- 70-130Yellowish green-brown clayey limestone, hard ---------------- 130-150Yellow-white limestone, hard -------- ______________ ______ 150-170Yellow-green-brown clayey limestone, hard _________________ 170-180Yellow-brown slightly clayey limestone, moderately hard ------- 180-190Yellow-white limestone, moderately hard - - 190-230White limestone, hard 230-300

WELL 147
Location; Lat 15°12'44" N., long 145°44'22" E., at Maui IV.
Dri11ed: Aug. 20, 1982 by Geo-Engineering and Testing.
Altitude; About 210 ft. Depth; 280 ft.
Diameter of open hole; 8-in. pilot hole.
Source of record; Driller.
Pumping test; Aug. 25? 1982: Maximum drawdown, 16.4 ft in 5 hours at pumping
rate of 66-80 gal/min; recovery to initial level in 5 minutes.
See pumping test record.
Sept. 3, 1982: Drawdown, 21 ft in 1 hour; chloride, 272-790 mg/L
(6 samples). See pumping test record.
Pumpage: 55-58 gal/min January to April 1983 (USGS).
Chemical analyses of water from well 147
[Sources: Water Quality Laboratory, Commonwealth of the Northern Mariana Islands, and U.S. Geological Survey(*)]
Date
9-4-822-25-83-3-2-83*3-23-834-18-834-21-836-20-837-1-83*7-18-838-15-839-8-8310-14-83
Chloride (mg/L)
7363,7904,1004,2104,6104,660
5,4005,3705,5005,5005,770
Specif ic conductance
(jimho)
12,00012,40013,600
14,90016,20016,00015,70015,70013,90016,300
pH (units)
7.5--
7.47.8
7.4
7.7
Alkal i ni ty (mg/L)
244 --
234228
224229231229
Hardness as CaCCL (mg/L) 3
----
1,820----
2,0502,100
----
- Total dissolved solids, 7,200 mg/L.
432

WELL 147
LOG
Description of material Depth (ft)
WhM Yel Yel Yel Yel Yel Yel Yel Yel Yel Yel
:e limestone, backfill - --------- _-____-______- _____owish light brown limestone, hard ---------- _-____--___owish white limestone, hard ------------------ - --- -owish brown limestone, hard ---------------- _-_- -____owish white limestone, moderately hard _--_______ _-__owish brown limestone, moderately hard ------------ _-_-ow brown clayey limestone, moderately hard ------ ___-_-owish light brown limestone, moderately hard ----- -------ow white limestone, moderately hard -- -------- ____---owish white limestone, moderately hard - ---- --------- owish brown slightly clayey limestone, moderately hard ----
0-3 3-12 12-14 14-20 20-30 30-70 70-80 80-90
90-120 120-180 180-230
Yellowish white limestone, moderately hard with occasional clay pockets - - - 230-280
PUMPING TEST
Date:Static
Time
080808090814081908250845
August 25, 1982.depth to water
Elapsedt ime(min)
016
111737
, 208.0 ft;
Depth towater(ft)
208.0224.4224.2224.3224.3224.3
pump intake
Pumpi ngrate
(gal /min)
80
737369
at 170 ft.
Remarks
Start of test.
Same reading at 0830, 0835, 0840.Same reading every 5 minutes
0920
104511001120
13051315
72
157172192
297307
224.3
224.2224.2224.2
224.2224.2
67
666666
66
0850-0910.Same reading every 15 minutes
0930-1030.
Same readings every 1140-1240.
End of test.
20 minutes
Recovery to static depth to water in 5 minutes.
433

WELL 147
Date: September 3, 1982. Static depth to water 208.0 ft.
Time
14301441144514551505151115301537
Elapsedt ime(mi n)
011152535416067
Depth towater(ft)
208.0
224.0
229.0
Pumpingrate
(gal/min)
82 47 73 73
Chloride(mg/L)
111
661
756
Remarks
Start of test.Stopped pump. No water.Turn pump on. Water dirty.Turn off pump.Turn pump on.Turn off pump. Little waterTurn on pump.Turn off water. Pump
defective.
Table 34. Wells drilled at Gualo Rai area (fig. 32)
Loca t i onWellNo.
151152
153154A
154B
Lat i tudenorth
15°11 '20"15°11 '19"
15°11 '14"15°11 '19"
do.
Longi tudeeast
145°43'27"145°43'31"
145°43'30"145°43'23"
do.
Complet iondate
1981-82
September 1981April 1982
April 1982June 6, 1982
June 12, 1982
Altitude(ft)
304.65341.53
312.97260.69
260.69
Depth(ft)
317425
360330
330
Remarks
Wel 1 was dry andwas abandoned.
Do.Hole caved in andwas abandoned.
Called 154.
434

Gualo Rai(Hill)
GUALO RAI (Area
EXPLANATION Well » Main road
Reservoir === Secondary road Pipeline
CONTOUR INTERVAL 50 METERS
Base from U.S. Geological Survey, 1981, scale 1:10,000.
Figure 32. Location of wells in Gualo Ra i area.

WELL 151
Location: Lat 15°11 I 20" N., long 145°43'27" E., at Gualo Rai.
Dr Mled: Reaming completed September 1981 by Pacific Drilling Inc.
Altitude; 304.65 ft (Sablan, Takai and Assoc., April 1982).
Depth; 6-in. pilot hole to 325 ft, reamed to 12 in. to 317 ft.
Diameter of open hole; 12 in.
Casi ng; 8-in. steel with stainless steel screen below to 315 ft.
Gravel pack and grout; Gravel packing from 280 to 317 ft and concrete from
0 to 280 ft.
Source of record; Driller.
Pumping test; 6-in. pilot hole, July 13> 1981; Drawdown, 0.4 ft in 9 hours
of pumping at rate of 42-82 gal/min; chloride, 175-184 mg/L
Chloride concentration and specific conductance of water from well 151
[U.S. Geological Survey]
Specif icChloride conductance Temperature
Date Time (mg/L) (umho) (°C)
8-18-82 260 1,3503-2-83 1600 270 1,400 29.07-1-83 1015 300 1,470 29.09-8-83 1315 270 1,410 29.0
436

WELL 151
Chemical analyses of water from well 151
[Source: P. A. Mack, Water Quality Laboratory, Commonwealth of theNorthern Mariana Islands]
Date
9-23-8110-16-8111-25-8112-28-812-4-822-8-823-8-824-12-825-3-826-4-827-9-828-10-828-17-828-24-828-31-829-8-8210-7-8211-10-8212-7-821-19-832-25-834-21-836-20-837-18-838-15-839-8-8310-14-83
Chloride (mg/L)
200244259153250242253262266274279257267256258265273230211229260250297293286270301
Total sol ids (mg/L)
638738721530726736730706804
670 --
Specif ic conductance
(ymho)
1,1701,3301,4201,0101,3701,3301,4101,4201,440
1,4601,460 --
1,2001,2101,2601,4101,4201,4801,4801,4501,5201,440
pH (un i ts)
7.57.77.17.58.17.87.27.26.97.57.77.6 --
7.87.87.67.57.47.67.4
7.8
Turbidi ty (NTU)
0.30.28.20.28.26.24.16.24.17 .12-- --
_-- -- --
Alkal ini ty (mg/L)
_ _-- --
243190238----------
23624022926022719822422S231231
Hardness as CaCCy 4-21-83, 312 mg/L; 7-18-83, 325 mg/L; 8-15-83, 309 mg/L.
Chloride concentrations: 10-20-81, 240 mg/L; " 12-9-81, 239 mg/L 2-16-82, 255 mg/L4-5-82, 246 mg/L;5-24-82, 263 mg/L; 7-6-82, 269 mg/L.
10-13-81, 245 mg/L;
437

WELL 152
Location; Lat 15°1T19" N., long 145°43'31" E., at Gualo Rai
Dr i1 led; April 1982 by Geo-Engineering and Testing.
Altitude; 341.53 ft (Sablan, Takai and Assoc., April 1982).
Depth; 425 ft.
Diameter of open hole; 8 in.
Source of record; Driller.
Well was dry and was abandoned.
LOG
Description of material Depth (ft)
Brown-red clayey silt with abundant limestone gravel ---- -- 0-2Dark yellow-brown limestone, moderately hard 2-5Color light yellow-light brown - - - 5-65Color dark yellow-brown limestone with some clay particles -- 65-70 Color light brown-white, moderately hard - -- 70-110Color white with coralline limestone gravel and shell
fragments 110-140 Color yellow-brown with clay particles - ------ _________ 140-180
Lost circulation from 150-180 ftColor yellow-brown-white, hard, with recrystal ized fragments -- 180-220 Light gray-yellow brown, slightly clayey limestone, moderately 220-240 Light brown limestone, hard 240-250 Light gray-yellow-brown clayey limestone --------- - _--_-- 250-260Light brown-white-gray limestone - - - 260-285Slightly clayish 285-290 Brown-yellow slightly clayey limestone -- - -- 290-300Gray-yellow clayey limestone with weathered sandstone gravel 300-310 Red-brown clay with occasional sandstone gravel ____ _______ 310-355Abundant sandstone gravel -- - --- - - 355-365Occasional sandstone gravel 365-370Light-brown-yellow-white limestone with abundant sandstone
gravel 370-380 Brown-gray weathered sandstone with limestone boulders -------- 370-425
More abundant sandstone 405-410 ft
438

WELL 153
Location; Lat 15°iriV N., long 145°43'30" E., at Gualo Rai.
Dr?I led; April 1982 by Geo-Engineering and Testing.
Altitude; 312.97 ft (Sablan, Takai and Assoc., April 1982). Concrete monument
Depth; 360 ft.
Diameter of open hole; 8 in.
Source of record; Driller.
Well was dry and was abandoned.
LOG
Description of material Depth (ft)
Light red brown clay and gravel - 0-2Yellowish white limestone, moderately hard - 2-5White limestone, hard - -- ------ - ---- -- ---_ 5-10Yellowish white limestone, hard - - - 10-30Yellowish brown limestone, moderately hard --- ---- ----- 30-50Yellowish white limestone, hard 50-100
Lost air circulation, 60-90 ftYellowish brown limestone, moderately hard -------- - ----- 100-190
Lost air circulation, 110-130 ftYellowish white limestone, moderately hard - 190-220Yellowish brown limestone, hard to very hard - 220-230Yellowish white limestone -------------- ________________ 230-240Yellowish brown limestone ---------- ________ ___________ 240-290Dark yellow-brown limestone, hard -- - - - 290-320Yellowish brown limestone -- - - 320-330Light brown-white limestone - - - 330-360
Note; No water found.
439

WELL 154A
Location; Lat 15°11'19" N., long 145°43'23" E., at Gualo Rai.
Dri1 led; June 3-6, 1982 by Geo-Engineering and Testing.
Altitude; 260.69 ft. Depth; 330 ft.
Diameter of open hole; 8 in.
Pumping test; Initial test June 6, 1982; Drawdown, 7.2 ft in 5 hours at
pumping rate of 69-73 gal/min. See pumping test record.
Source of record; Driller.
Hole caved and was abandoned.
LOG
Description of material Depth (ft)
Dark brown clay, moderately stiff --- 0-3Yellow-brown limestone, moderately hard* slightly clayish 3-20Light brown limestone, weak to moderately hard - - -- 20-30Yellowish brown limestone, weak to moderately hard ---------- 30-40Color light brown-white, weak to moderately hard - 40-50Yellow-white limestone, hard 50-60Yellow-white limestone, moderately hard 60-150Light brown-white limestone, moderately hard ---- ---- -- 150-170Light brown-yellow limestone, moderately hard ----------------- 170-210Light brown-white limestone, moderately hard ----- _-____-__ 210-260
Lost air circulation at 215 ft.Limestone, hard -- ---- 260-290Limestone, moderately hard - -- 290-330
440

WELL 154A
PUMPING TEST
Date: June 6, 1982.Static depth to water 261.8 ft; pump intake at 285 ft.
Elapsed Depth to Pumpingtime water rate
Time (min) (ft) (gal/min) Remarks
1415 0 261.8 Start of test.1420 5 263.6 691425 10 264.01430 15 264.21435 20 265.01440 25 265.21445 30 266.0 73 Same reading at 1500,
1515, 1530.1545 90 267.0 731600 105 268.0 731645 150 269.0 73 Same reading every 30
minutes 1715-1845. 1915 300 269.0 End of test.
441

WELL 154B. Called well 154.
Location; Lat 15 o n'19M N., long 145 O43'23" E., at Gualo Rai, 10 feet
from wel1 154A.
Dr11 led; June 12, 1982 by Geo-Engineering and Testing.
Altitude: 260.69 ft. Depth: 330 ft.
Diameter of open hole; 12 inches.
Casi ng; Solid 8-in. casing to 280 ft with 30 ft of 8-in. screen at bottom.
Source of record; Driller.
Pumping test; June 24, 1982: Maximum drawdown, 14.7 ft in 4-1/2 hours at
pumping rate of 67-69 gal/min; chloride, 890-990 mg/L. See
pumping test record.
July 6-7, 1982: Maximum drawdown, 13-5 ft in 29-1/2 hours at
pumping rate of 41-60 gal/min; chloride, 800-990 mg/L. See
pumping test record.
Date well brought into production: July 16, 1982.
Remarks; Apr. 21, 1983-/ : Chloride, 795 mg/L.
Specific conductance, 3>220 ymho.
pH, 7.4.
Alkalinity, 229 mg/L.
Total hardness (as CaCC- ), 484 mg/L.
Oct. 14, 1983-7 : Chloride, 950 mg/L.
Specific conductance, 3>560 ymho.
pH, 7.8.
Alkalinity, 227 mg/L.
Turbidity, 6.9 NTU.
- By Water Quality Laboratory, Commonwealth of the Northern Mariana Islands
442

WELL 154 (B)
Chloride concentration and specific conductance of water from well 154
[U.S. Geological Survey]
Date
8-18-8211-18-823-2-834-25-837-1-839-8-83
Time
*
1600143510151305
Chloride(mg/L)
800700780
8201,000
Specificconductance
(ymho)
3,0902,7802,910
3,1403,820
PumpingTemperature rate(°c)
»
29.0
30.530.5
(gal/min)
mm
4339
PUMP-ING TEST
Date: June 24, 1982.Static depth to water, 260.8 ft; pump intake at 288 ft.
Time
10001005101010151020102511001115
1230
14001430
Elapsed t ime (mi n)
05
101520256075
150
240270
Depth to water (ft)
260.8267.8275.5275.0274.8274.1274.0273.5
273.7
273.6273.6
Pumping rate
(gal/min)
...6969696969__67
67
6767
Chloride (mg/L)
990 --
--
890
Remarks
Start of test.
Same reading at
Same reading at1145, 1200.
Same reading at1330.
End of test.
1030
1130
1300
443

WELL 154 (B)
PUMPING TEST
Date: July 6-7, 1982.Static depth to water, 262 ft; pump intake at 285 ft
Time
July 6
08500851085509000905
0950100510351050
12501650
182019201950
July 7
0120
1420
Elapsed t ime (mi n)
015
1015
6075
105120
240480
570630660
930
1830
Depth to water (ft)
262
267272279.5
279.5278.5277. 5277.5
276.2276.1
276.1276.2276.2
276.0
274.3
Pump i ng rate Chloride
(gal/min) (mg/L)
__ __800
606060
60 990 5347
4444
434341
41
41
Remarks
Start of test.
Same reading every 5minutes 0910-0925.
Same reading at 1020.
Same reading at 1120,1150, 1220.
Same reading at 1720,1750.
Same reading at 1850.
Same reading every 30minutes 2020-0050.
Same reading every 30minutes 0150-1250.
End of test.
444

Northern Saipan
The water from all wells drilled in Northern Saipan, with the possible exception of well 6, show a high chloride concentration. It appears doubtful that potable ground water can be obtained in this area. No information is available for well 6 beyond the initial low chloride concentration and good yield. It is not known if the well was used for any length of time. The wells drilled in the area are listed in table 35 and their location is shown in figure 33 (Harpi Point) and figure 34 (Northwest Saipan).
Table 35. Wells drilled in Northern Saipan
Well No.
26
32
60
616263
627
33
PW
Locat ionLatitude Longitude north east
At
15°16'18" 145°48'40"
150 16'13" 145048'25"
15 0 16'22" 145048'43"
15°16'21" 145048'50"15°16'17" 145048'51"15°16'19" 145048'46"
15 0 15'09" 145°46 I 56"15°15'38" 145°47'18"
15 0 14'51" 145046'48"
150 14'45" 145°46'26"
Comp let ion date
Alti tude (ft)
Depth (ft) Remarks
Marpi (Makpe) Point
1944-45
Jan. 1, 1945
January 1945
Apr. 21, 1945
Apr. 19, 1945May 4, 1945May 7, 1945
At Northwest coast
1944-45
Aug. 10, 1944May 21, 1945
January 1945
May 1945
1969-71
176
293.3-
149.8
134.8126.3141.5
167385
200
80
185
302
230
144.5141.2154.5
173405
Abandoned; highsal in ity.
Brack ish water andporous strata.
Abandoned; highsal i n ity and lowy ield.
High sal i nity.Do.Do.
Abandoned; highsal i n ity.
Wel 1 went dry in1946.
High sal i nity.
Hawaiian Rock Quarry15 15'21" 145U46'56" July 11, 1969 110 170 High salinity.
445

Table 35- Wells drilled in Northern Saipan Continued
Locat ionWell No.
Lati tude north
Long!tude east
Complet ion date
Alti tude (ft)
Depth (ft) Remarks
Makpe golf course well 115°15'38" 145°47'27"
Makpe golf course well 215°15'28" 145°47'15"
171172
15°15'08" 15°15'08"
145°46'53" 145°47'18"
1979-80
1981-82
May May
25, 30,
19821982
360
335
149.18339.49
366.3
For watering the golf course.
Do.
200390
446

Secondary road 32 Well
0 0.5 KILOMETERCONTOUR INTERVAL 50 METERS
Base from U.S. Geological Survey, 1981, scale 1:10,000.
Figure 33- Location of wells at Marpi Point (Makpe).

MATUIS/(Area)
EXPLANATION
~ Wello w Well, approximate location
San Roque (Village)
Main road Secondary road
CONTOUR INTERVAL 50 METERS
Base from U.S. Geological Survey, 1981 , scale 1:10,000.
Figure 3^. Location of wells in Northwest SaTpan r

WELL 26
Locat ion:
Dri1 led;
Altitude:
Casi ng:
Aquifer;
Remarks:
About lat 15°16'18" N., long 145°48'40" E., near abandoned
Marpi Airfield.
Dec. 26, 1944 to Jan. 1, 1945 by 101 U.S. Naval Construction Battalion
176 ft. Depth; 185 ft.
6 in. to 185 ft with lower 20 ft perforated.
Limestone.
Water was found at depth of 180 ft.
Depth to water before pumping, 171.5 ft.
Chloride: 880 ppm (Glander, 1946).
825 ppm (Piper, 1946-47).
Pumpage: 72,000 gal/d, at completion (log).
40,000-50,000 gal/d (Glander, 1946).
25,000-50,000 gal/d (Piper, 1946-47).
pH: 7.2-7.4 (Glander, 1946).
Well abandoned because of high salinity.
LOG
Description of material Depth (ft)
Top so i1 ----------Broken coral - Sol id coral -- Soft coral ------Hard coral ------Medium coral ------Pink coral --------White medium coral Ye 1 low medi urn cora Snow white coral -
0-77-1919-5959-8080-99
99-107107-117117-133133-182182-185
449

WELL 32
Location: About lat 15°16'13" N., long 145°48'25" E., at Marpi (Makpe),
near base of cli ff.
Dri1 led: January 1945 by 51st U.S. Naval Construction Battalion.
Altitude: 293-3 ft. Depth: 302 ft.
Casing; 6 in. to 224 ft.
Source of record: Glander (1946).
Well yielded a small amount of brackish water and was abandoned.
Well was drilled through coral and limestone with occasional streaks of clay
or sand. At 300 ft, porous strata was encountered and the brackish water
di sappeared.
WELL 60
Location; About lat 15°16'22" N., long 145°48'43" E., at abandoned
Marpi Airfield.
Dri1 led; Completed Apr. 21, 1945 by 51st U.S. Naval Construction Battalion
Altitude: 149.8 ft. Depth: 230 ft.
Casing; 6 in. to 224 ft.
Aquifer; Limestone.
Source of record; Glander (1946).
Remarks: Chloride: 1,000 ppm.
Well abandoned because of high salinity and low yield.
LOG
Description of material Depth (ft)
Limestone ----------------------------------------------------- 0-60Sandy clay and clayey limestone - - --- --------- --- 60-140Limestone --- - -- 140-200Sand and sandy clay ---- --- 200-220Limestone containing brackish water ---- -------- _____-_-_ 220-230
450

WELL 61
Location; About lat 15O l6'21" N., long 145°48'50" E., at abandoned
Marpi Airfield.
Drilled; Completed Apr. 19, 1945 by 57st U.S. Naval Construction Battalion
Altitude; 134.8 ft. Depth; 144.5 ft.
Casi ng; 6 in.
Aquifer; Sandy limestone.
Source of record; Glander (1946).
Remarks; Chloride; 800-1,000 ppm.
Pumpage: 50,000-60,000 gal/d.
pH; 7.4-7.6.
Water not potable because of high salinity.
WELL 62
Location; About lat 15O 16'17" N., long 145°48'51" E., at abandoned
Marpi Airfield.
Drilled; Completed May 4, 1945 by 51st U.S. Naval Construction Battalion
Altitude; 126.3 ft. Depth; 141.2 ft.
Casi ng; 6 in. to 141 ft.
Aquifer; Gravelly clay.
Source of record; Glander (1946).
Remarks; Chloride; 1,000 ppm.
Pumpage; 40,000 gal/d.
pH; 7.4-7.6.
Water not potable because of high salinity.
451

WELL 63
Location; About lat 15°16'19" N., long 145°48'46" E., at abandoned
Marpi Airfield.
Drilled; Completed May 7, 1945 by 51st U.S. Naval Construction Battalion
Altitude; 141.5 ft. Depth; 154.5 ft.
Casi ng; 6 in. to 154.5 ft.
Aquifer; Sandy limestone.
Source of record; Glander (1946).
Remarks; Water level at sea level.
Chloride; 1,000 ppm.
Pumpage; 40,000 gal/d.
pH; 7.4-7.6.
Water not potable because of high salinity.
452

WELL 6
Location: About lat 15°15'09" N., long 145°46'56" E., along Matuis road,
at Matansa.
Drilled: Aug. 5-10, 1944 by U.S. Marine Corps.
Altitude; 167 ft. Depth; 173 ft.
Casi ng: 6 in. to 173 ft, with bottom 6 ft slotted.
Aquifer: Limestone.
Source of record: H. T. Stearns (1944) and Glander (1946).
Remarks: Water was found at depth of 167 ft. Depth to water before pumping,
166 ft.
Chloride: 73 ppm, at completion prior to pumping (Stearns, 1944).
125 ppm, Aug. 10, 1944 after pumping 1,000 gallons
(Stearns, 1944).
166 ppm, Aug. 22, 1944 after pumping 8,500 gallons for
12 days (Stearns, 1944).
100-250 ppm (Glander, 1946).
Pumpage: 50,400 gal/d, Sept. 6, 1944 (Stearns, 1944).
12,000-45,000 gal/d (Glander, 1946).
pH: 7.4-7.6 (Glander, 1946).
For chemical analysis of the water, see table 70.
LOG
Description of material Depth (ft)
Clean white sandstone ------------ ______________ ______ _ 0-173
453

WELL 27
Location; About lat 15°15'38" N., long 145°47'18" E., near golf course
(NW Sal pan).
Dri1 led; Completed May 21, 1945 by 11th Service Marines, U.S. Marines Corps
Altitude; 385 ft. Depth: 405 ft.
Casi ng; 6 in. to 405 ft with lower 10 ft perforated.
Aquifer; Limestone.
Source of record; Glander (1946).
Remarks; Drilling penetrated hard coral, coral with gray streaks, and
sandy coral .
Well shot at 395 ft with 104 Ibs of TNT.
Salinity increased rapidly when pumped and well was abandoned.
WELL 33
Location; About lat 15°14'51" N., long 145O46'48" E., at Matansa (NW Saipan)
Dr i1 led; January 1945 by 101st U.S. Naval Construction Battalion.
Altitude; 200 ft. Depth; Not reported.
Casi ng; 6 in.
Source of record; Glander (1946).
Remarks; Chloride; 350 ppm (Glander, 1946).
375 ppm (Piper, 1946-47).
Pumpage; 20,000-40,000 gal/d, 1945 (Piper, 1946-47).
Wel1 went dry in 1946.
454

WELL PW
Location: About lat 15°1V45" N., long 145°46'26" E., at San Roque village,
Dr ? 1 led; May 19^5 by U.S. Marine Corps.
Altitude: 80 ft. Depth; Not reported.
Source of record; Glander
Remarks; Chloride: 680 ppm.
Pumpage: 25,000-35,000 gal/d.
pH: 7.2-7.4.
Water not potable due to high salinity.

WELL Hawaiian Rock Quarry (Also called Dillingham well)
Location: About lat 15°15'21" N., long 145O46'56" E., at quarry,
Makpe (Marpi).
Dri1 led; June 2k to July 11, 1969 by Layne International, Guam.
Altitude: About 110 ft. Depth: 170 ft.
Diameter of open hole: 12 in.
Casi ng: 8 in. to 110 ft with 20 ft 8-in. screen at bottom.
Gravel pack and grout; 1-1/2 cubic yard cement, 1-1/4 cubic yard gravel.
Top altitude of gravel pack is 90 ft.
Source of record; Driller.
Pumping test; July 8, 1969: No drawdown in 10 hours at pumping rate of
225-250 gal/min; chloride, 620 ppm.
Remarks; Nov. 11, 1971: Motor broke off when pump was pulled; new pump and
motor installed.
Chloride: 800 ppm, at completion.
LOG
Description of material Depth (ft)
White land fill 0-3Red soft clay 3-11White medium hard coral - - 11-22White very hard coral -- 22-26Medium hard 26-32Medium soft -- 32-53Medium hard 53-102Very hard 102-111Soft, hole caving -- 111-116Hard 116-122Soft, hole caving -- 122-129Medium hard - 129-150Medium hard, hole caving -- - - 150-170
Hole caving badly at 170 ft

WELL Hawaiian Rock Quarry (Also called Dillingham well)
Chemical analyses of water from Hawaiian Rock quarry well
[Analyses by Layne International, Guam. Psi, pound per square inch]
Constituent Time
Specific conductance -_% LJpH
Temperature (water) -- Total hardness
Calcium hardness -----
Bicarbonate (HCO-)
Methol Alkal i nity,as CaCo, ---------
Chloride (Cl)
Total dissolved solids
umho
°cmg/L
mg/L
mg/L
mg/L
mg/L
mg/L
0815
2,510
7.4
23
505
315
325
266
725
1,506
July 8, 1969
1400
2,560 2
7.5
23
505
320
320
268
730
1,536 1
1600
,590
7.6
23
505
325
325
266
740
,554
July 28, 1969
1700
2,950
7.8
29
520
340
260
810
Time
Water pressure ---
Water temperature rm^K-irio (ri\ ______
psi °C
m/-i / 1
0840 0940
105 105
30 30 ftsn ft-sn
Sept. 3,
1040 1140
110 107
30 30 ft-sn fl-jn
1969
1240
105
30 ftLn
1340 1440
105 105
30 30 ft-sn ft-sn
457

WELL Makpe golf course 1
Location; Lat 15°15'38" N., long 145°47'27" E., at pond on golf course.
Alti tude; About 360 ft (from topographic map). Depth; Not reported.
Remarks; Chloride; 785 mg/L at depth of 325 ft, June 23, 1981.
mg/L at depth of 314 ft, July 2, 1981.
WELL Makpe golf course 2
Location; Lat 15 O 15'28M N., long 145°47'15" E., along road to golf course.
Altitude; About 335 ft (from topographic map). Depth; 366.3 ft.
Remarks; Chloride; 695 mg/L, at depth of 344 ft, June 19, 1981.
821 mg/L, at depth of 355 ft, June 23, 1981.
2,780 mg/L, at depth of 365 ft, June 23, 1981.
Chemical analyses of water from Makpe golf course wells
[Source; P. A. Mack, Water Quality Laboratory, Commonwealth of the Northern Mariana Islands]
Total Specific HardnessChloride solids conductance pH Alkalinity as CaCO-
Date (mg/L) (mg/L) (ymho) (units) (mg/L) (mg/L)
Makpe golf course 1
Feb. 25, 1981 900 2,070 3,680 7.8 0.54 > 2400
Makpe golf course 2
Feb. 25, 1981 1,800 3,925 6,830 7-1 3-0 > 2400
458

WELL 171
Location; Lat 15 0 15'08" N., long 145046'53" E., along Matuis Road.
Dr illed: May 24-25, 1982 by Geo-Engineering and Testing.
Altitude: 149.18 ft. Depth; 200 ft.
Diameter of open hole: 8 in.
Pumping test; May 26, 1982: No drawdown in 75 minutes at pumping rate of 118
gal/min; chloride 2,780-6,990 mg/L. See pumping test record.
Source of record; Driller.
Remarks; Depth to water, 147.69 ft June 1, 1982, (T. Camacho, using home
made sampler).
For chemical analysis of June 30, 1983, see table 76.
LOG
Description of material Depth (ft)
Dark brown clayey silt with abundant limestone boulders --- 0-3Light brown-red with abundant limestone boulders -___-__ 3-15Yellow-brown limestone, moderately hard ---------- _-____-__ 15-20Light brown-reddish limestone with silt pocket - -- -- - 20-25Yellow-brown limestone, moderately hard ------------------- 25-35Yellow-white limestone, moderately hard ----- ______--___-__ 35-45Color white, hard --- -- ----- - ________________________ 45-55
Yellowish white, medium hard --------------------------- 55-60Reddish white, medium hard ------------------------------- 60-70Yellowish white, medium hard - ------ - -- ----- -- 70-90
White limestone, moderately hard ---- ------ __-___-____-__ 90-110Color yellowish white, moderately hard ------------------------ 110-120White limestone, moderately hard --- ----- -- - ------ - 120-140Brownish white limestone, moderately hard --------------------- 140-150Yellow-white limestone, weak -- ------- .......... ____- 150-200
459

WELL 171
PUMPING TEST
Date: May 26, 1982.Static depth to water, 148.0 ft; pump intake at 165 ft,
Time
16401642164516501655170017051710172517401755
Elapsed t ime (mi n)
025
1015202530456075
Depth to water (ft)
148.0148.0148.3148.3148.3148.3148.3148.3148.0148.0148.0
Pumping rate
(gal/mi n)
118118118118118118118118--
Chloride (ppm) Remarks
Start of test.2,780 --
6,990End of test.
WELL 172
Location; Lat 15°15'08" N., long 145°47'18" E., along Matuis Road.
Drilled: May 28-30, 1982 by Geo-Engineering and Testing.
Altitude; 339.49 ft. Depth; 390 ft.
Diameter of open hole; 8 in.
Pumping test; June 1, 1982: Drawdown 0.3 ft in about 7 hrs at pumping
rate of 55 gal/min; chloride, 821-3,210 mg/L. See pumping
test record.
Source of record: Driller.
460

WELL 172
LOG
Description of material Depth (ft)
Red-brown clayey silt, medium stiff with limestone gravel 0-3Yellow-brown limestone, moderately hard 3-10Color yellow-white, moderately hard 10-20Color yellow-brown, moderately hard 20-40Color light brown-white, moderately hard - 40-60Color yellow-brown, moderately hard 60-72Clay pocket 72-74Color light brown-white, moderately hard 74-90Color yellow-white, moderately hard -- 90-108Brown clayey limestone, weak 108-112Light brown-red-grey clay, 20 ft 112-124Yellow-brown limestone, moderately hard 124-150Yellow-white limestone, moderately hard 150-160Color light brown-yellow, moderately hard 160-180Color yellow-white, moderately hard 180-260Color white, moderately hard 260-270Color yellow-white, moderately hard 270-288Light brown-white, slightly clayey limestone 280-320Light brown-yellow-white limestone, moderately hard 320-350Color yellow-white, moderately hard to weak 350-380Yellow-white limestone, moderately hard 380-390
PUMPING TEST
Date: June 1, 1982.Static depth to water, 339.0 ft.
Time
Elapsed t ime (min)
Depth to water (ft)
Pumpingrate
(gal/min)Chloride (mg/L) Remarks
094509470950
1015
1115
1245
1445
16451650
025
30
90
180
300
420425
339.0339.0339.2
339.3
339.4
339.7
339.6
339.5339.3
82155
55
55
3,210
Start of test.
Same reading every5 minutes 0955-1010
Same reading at 1030,1045, 1100.
Same reading at 1130,1145, 1215.
Same reading 1315,1345, 1415.
Same reading at 1515,1545, 1615.
End of test.
461

Miscellaneous si tes
During 1944-45, wells were drilled in many places on the island in hopes of finding water. As potable water in sufficient quantity was not found in most areas, further miscellaneous exploration has not been done. The only wells listed under miscellaneous sites that were drilled after 1945 are test hole 17, drilled in 1980 along the road to Talufofo Stream near the site of well 36, and well 161, drilled at Navy Hill in 1982. Testhole 17 was not developed because of low yield and well 161 was abandoned because the chloride concentration of the water exceeded 2,000 mg/L.
Six of the wells drilled near Garapan are listed separately in table 36 and the remaining wells are listed under miscellaneous sites in table 37- The locations of the wells are shown in figure 35-
Table 36. Wells drilled at Garapan
Locat ionWell No.
Latitude north
Longi tude east
Complet ion date
Alti tude (ft)
Depth (ft) Remarks
16
17 19A
19B 19C
161
15°12'06" 145043'26"
15 11'55" 150 12'18"
150 12'19" 150 12'20"
15°13'35"
145043'28" 145043'32"
145°43'35" 145°43'43"
1944-45
Nov. 2, 1944
Nov. 10, 1944 Feb. 10, 1945
Feb. 15, 1945 February 1945
1982
May 21, 1982
121 173 Abandoned; high sali n i ty.
Abandoned; highsali nity.
240 370 Do. 320 430 Do.
156.45 170240 248
170 215 At Navy Hill.See figure 32
Note: Locations of wells 16-19C are approximate.
462

Table 37. Wells drilled at miscellaneous sites
Approximate locationWell No.
Lat i tude north
Long i tude east
Comp let ion date
1944-45
Listed from North to
3835A
35B
47344336
58653970
7174
15 0 14'09"15°13 '31"
do.
150 13'32"15°13 ' 17"15 0 12'42"15°12'29"
15 0 12'22"15°11 1 38"150 11'59"15 0 10'35"
150 10'10"15°09'49"15°09'06"
145°47'21"145046'16"
do.
145°45'51"145045'22"145°45'30"145045'22"
145046'07"145046'13"145°44'20"145°43'05"
1it5°43'l5"145043'05"145°43'00"
Feb. 21, 1945Feb. 4, 1945
1945
April 19451945Mar. 15, 1945February 1945
Apr. 28, 1945June 20, 1945March 1945Sept. 20, 1945
Oct. 25, 1945Aug. 21, 1944July 31, 1944
Alti tude (ft)
South
224.5201.65
200
433650556.4604
161.615072142
1785065.9
Depth (ft)
220200
(140)
190--67
300
22417153550
18948180
Remarks
Abandoned; low yield.Had been abandoned
in 1946.Hole caved in at depth
of 140 ft.Abandoned; low yield.
Do.Abandoned; contaminatedWel 1 went dry after
20 min. pumping.Abandoned; low yield.Abandoned; contaminatedNo water found.Abandoned; high
sal i nity.Do.Do.Do.
TH17 15 0 12'24" 145°45'18" at Talufofo.
1980
May 7, 1980 615 335 Abandoned; low yield.
463

7 Well
TH Test hole
_ Main road
Figure 35- Location of wells at miscellaneous sites.
464

WELL 16
Location: About lat 15°12'06" N., long 145°43'26" E., near Garapan.
DrII led; Oct. 31 to Nov. 2, 1944 by 17th Navy Construction Battalion.
Altitude: 121 ft. Depth; 173 ft.
Casi ng; 6 in. to 160 ft.
Aguifer; Soft coral and shale (dander, 1946); limestone (Davis, 1958).
Source of record; Driller.
Remarks: Water was found at depth of 121 ft.
Depth to water before pumping, 121 ft (at sea level).
Chloride: 400-500 ppm, Nov. 3, 1944 during 24-hour pump test at
pumping rate of 20 gal/min.
For chemical analysis of the water, see table 74.
Salinity increased steadily and well was abandoned.
LOG
Description of material Depth (ft)
(Source: Driller's log)
Top soil ------------------- ______________ _--____-__-____ o-4Soft coral with hard streaks ---------------------------------- 4-156Soft shale 156-168Blue gumbo -------- ------ __- -- _____ 168-173
(Source: Written communication Lt. Col. H. M. Arnold to H. T. Stearns, Dec. 2, 1944)
Top soil --- ---- --- ------------------------- ------- o-4Soft coral with hard streaks ------------------------- ----- 4-121Soft shale 121-156Blue gumbo -------------- __________________________________ 156-161
Not given 161-173
465

WELL 17
Location; About lat 15O 11'55" N., long 145°43'28" E., near Garapan,
1,000 ft south of wel1 16.
Drilled: Nov. 7-10, 1944 by 17th U.S. Navy Construction Battalion.
Altitude; 156.45 ft. Depth; 170 ft.
Casi ng; 6 in. to 158 ft.
Aquifer; Hard coral (dander, 1946); limestone (Davis, 1958).
Remarks; Water was found at 156 ft.
Well sprung with 24 Ibs TNT at depth of 153 ft.
Chloride: 30 ppm, Nov. 28, 1944. Pumping at rate of 30 gal/min,
chloride increased from 30 to 550 ppm (Glander, 1946).
575 ppm (Piper, 1946-47).
Pumpage: 30,000 gal/d, at completion (log).
43,000 gal/d (Brown-/).
30,000-40,000 gal/d (Glander, 1946).
pH: 7.4-7.6 (Glander, 1946).
Supplemental report on well drilling, memorandum Desloge Brown to Commanding
Officer, Nov. 29, 1944, 3 p.
LOG [Source: Driller's log]
Description of material Depth (ft)
Loose coral - - -- - - - -- - 0-40Medium coral 40-120Hard coral 120-170
466

WELL 19A
Location; About lat 15O 12'18" N., long 145°43'32" E., about 3/4 mile
east of Garapan town.
Drilled; Feb. 10, 1945 by 117th U.S. Navy Construction Battalion.
Altitude; 240 ft. Depth; 248 ft.
Casi ng: None.
Aguifer: No record, probably limestone (Davis, 1958).
Source of record; Glander (1946). Driller's log is missing.
Chloride concentration was high and well was abandoned.
WELL 19B
Location; About lat 15O 12'19" N., long 145°43'35" E., near Garapan,
400 ft east of wel1 19A.
Drilled; Feb. 15, 1945 by 117th U.S. Navy Construction Battalion.
Altitude; 240 ft. Depth; 370 ft.
Casi ng; None.
Aquifer; No record, probably limestone (Davis, 1958).
Source of record; Glander (1946). Driller's log is missing.
Chloride concentration was high and well was abandoned.
467

WELL 19C
Location; About lat 15°12'20" N., long 145°43'^3" E., near Garapan,
east of we 11 19B.
Drilled: February 19^5 by 117th U.S. Navy Construction Battalion.
Altitude: 320 ft. Depth; 430 ft.
Casi ng; 6 in.
Aquifer; No record, probably limestone (Davis, 1958).
Source of record; Glander (19^6). Driller's log is missing.
Remarks; Chloride 3>000 ppm.
Pumpage: 20,000 gal/d.
pH: 7.6-7.8.
Because of high salinity, water was used in 117th Construction Battalion
camp for shower and wash water only.
468

WELL 161
Location; Lat 15°13 I 35" N., long 145°4V31" E., at Navy Hill.
Dri1 led; May 20-21, 1982 by Geo-Engineering and Testing.
Altitude; 170 ft (from topographic map). Depth; 215 ft.
Diameter of open hole; 8 in.
Source of record; Driller.
Pumping test; May 21, 1982: Drawdown, 23.2 ft in k hours at pumping rate
of 106-110 gal/min; chloride, 2,170-3,210 mg/L. See pumping
test record.
LOG
Description of material Depth (ft)
Dark brown clayey silt, moderately stiff - 0-1.5Yellow-white limestone, moderately hard ------------ ------ 1.5-5Light brown-white limestone, hard ------------------ _-____- 5-20Color pinkish -- -- 20-25Color light pink-white -- -- 25-30Color pink, moderately hard - - - 30-35Color pink, weak - - - - 35-^5Moderately hard, slightly clayish ----------------------- -- 45-50Pink clayey limestone, moderately hard ---------------------- 50-60Light brown limestone, moderately hard . 60-100
Lost circulation at 80 ftModerately hard to weak limestone ----------------------------- 100-125Moderately hard limestone - -------------- -----__-___-_-_- 125-1^5Hard limestone --- - - 1^5-155Moderately hard limestone --- -------------------------------- 155-215
469

WELL 161
Date: May 21, 1982,
PUMPING TEST
Time
15401542154515501555
16551710172517401810184019101940
Elapsed t ime (mi n)
025
1015
7590105120150180210240
Depth to water (ft)
143.2
146.1146.6147.2
148.4151.8156.5161.2163.8165.6166.6166.4
Pumpi ng rate
(gal /mi n)
106106106
106106106110110110110110
Chloride (mg/L) Remarks
Start of test.2,170
----
Same reading at 1600,1605, 1610, 1625,and 1640.
-- ----
3,210 End of test.
Next day, recovery to 163.0 ft.
WELL 38
Location: About lat 15°14 I 09" N., long 145°47 I 21" E., at Kalabera,
N. E. Saipan.
Drilled: Completed Feb. 21, 1945 by 51st U.S. Naval Construction Battalion
Altitude: 224.5 ft. Depth: 220 ft.
Casi ng; None.
Aqui fer: Volcanic sediments.
Source of record; Glander (1946).
Remarks: Water level, + 20 ft (Piper, 1946-47).
Well was abandoned because of low yield.
470

WELL 35A
Location; About lat 15O 13'31" N., long 145°46'16" E., at Talufofo.
DriI led; Jan. 22 to Feb. 4, 1945 by 1397th Engineer Construction Battalion,
U.S. Army.
Altitude; 201.65 ft. Depth; 200 ft.
Casi ng; 6 in. to 142 ft with lower 107 ft perforated.
Aquifer; Volcanic rock.
Remarks; Depth to water before pumping, 191.7 ft.
Chloride: 50 ppm (Glander, 1946).
Pumpage: 43,000 gal/d, at completion (log).
27,000 gal/d (Stock, 1945-7 ).
6,000-27,000 gal/d (Glander, 1946).
27,000 gal/d (Curione, 1947).
pH: 6.8-7.0 (Glander, 1946).
Well had been abandoned in February 1946.
Written communication T. S. Stock to Commanding Officer, Nov. 7> 1945.
LOG [Source; Driller's log]
Description of material
C *lay ---------------------------- _------_------_----_--Sand and clay ------------------------------- ----------Blue clay and volcanic ash ------------------------------ Shale and sand ------------------------------------------Volcanic ash and shale ----------------------------------Shale, clay, and sand ----------------------------------- Lime and sand -------------------------------------------Lava rock and sand --------------------------------------Shale, lava rock, and sand ---------------------------- Lime and sand -------------------------------------------Lava, ash, and sand -------------------------------------Lime, sand, and clay -- --------------------------------Lime, sand, clay, and lava rock -------------------------
Depth (ft)
. o-4
. 4.40
. 40-50
.__-._ 50-53------ 53-75....... 75-95 ------- 0^-100jj i uu 100-105. 105-120
1 o n 1 o£1 o f. i r f)
. 150-170 170-200
471

WELL 35B
Location; 500 ft from well 35A, Talufofo.
Drilled; 19^5 by 2807th U.S. Naval Construction Battalion Detachment
Altitude; About 200 ft. Depth; 140 ft.
Hole began to cave in at 1^0 ft and was abandoned after attempt to
install casing failed (Glander,
WELL kl
Location; About lat 15°13'32" N., long 145°^5'51 M E., at Talufofo H
Drilled; April 19^5 by 2807th U.S. Naval Construction Battalion.
Altitude; ^33 ft. Depth; 190 ft.
Casi ng; 6 in. to 170 ft.
Source of record; Glander (19^6).
Aquifer; Sandy, porous coral.
Remarks; Chloride; "low".
Pumpage: 3*000 gal/d, at completion.
Well was abandoned because of low yield.
WELL 3^
Location; About lat 15°13'17" N., long 1^5°45'22" E., near Radio Nil
Spring No. 1.
Dr iI led; 19^5 by 1397th Engineer Construction Battalion, U.S. Army.
AIt?tude; 650 ft. Depth; Not reported.
Source of record; No driller's log available.
Well was reported abandoned because of low yield and excessive
contamination (Piper,
^72

WELL 43
Location; About lat 15°12'42" N., long 145°45'30" E., at Capitol Hill.
Drilled; Completed Mar. 15, 1945 by 2807th U.S. Naval Construction Battalion
Altitude; 556.A ft.
6 in. to 55 ft.
Sandstone and clay.
Depth; 67 ft.
Casi ng;
Aquifer;
Source of record; Glander (1946).
Remarks; Water level at altitude 530 ft.
Well reported capable of producing 108,000 gal/d, but was abandoned because
of excessive contamination.
WELL 36
Location; About lat 15°12'29" N., long 145O45'22" at old booster pumping
station, Capitol Hill, along road to Talufofo Stream (Glander, 1946)
Dr i1 led; February 1945 by 1397th Engineer Construction Battalion, U.S. Army.
Altitude; 604 ft. Depth; 300 ft.
Casi ng; 6 in. to 252 ft with lower 100 ft perforated.
Aquifer; Volcanic rock.
Source of record; Glander (1946) and Piper (1946-4?).
Remarks; Depth to water before pumping, 484 ft.
Well went dry after 20 minutes pumping at 30 gal/min and was abandoned
(Piper, 1946-4?).
473

WELL 58
Location: About lat 15°12'22" N., long 145°46'07" E., along road to
Talufofo Stream.
Drilled; Completed Apr. 28, 1945 by U.S. Marine Corps.
Altitude: 161.6 ft. Depth; 224 ft.
Casing; 6 in. to 217 ft.
Aquifer: Coral and sand.
Source of record; Glander (1946).
Remarks: Water level before pumping, 57 ft.
Well shot at 205 ft with 85 pounds TNT.
Well abandoned because of low yield.
[SourceLOG Driller's log]
Description of material Depth (ft)
Clay Coral with some sand Lava rock ---------
0-5555-218
218-224
WELL 65
Location: About lat 15°11'38" N., long 145°46'13" E., east of Denn? Spring,
Drilled; Completed June 20, 1945 by U.S. Marine Corps.
Altitude; 150 ft. Depth; 171 ft.
Casing; 6 in. to 170 ft.
Aqui fer: Limestone.
Source of record; Glander (1946).
Remarks; Chloride: 60 ppm, at completion.
Pumpage: 15,000-20,000 gal/d.
pH: 7.0-7.2.
Well was used only a short time and capped because of bacteriological
contamination. Well could not be located by Cox (1956).
474

WELL 65
[SourceLOG Driller's log]
Description of materia Depth (ft)
Clay and coral ------Yellow clay and coral White coral -------No record -----------
0-5050-150150-163163-171
WELL 33
Location: About lat 15°11'59" N., long 145O44'20" E., 6,000 ft north
of Mount Takpochau (Glander, 1946).
Drilled: March 1945 by 17th U.S. Naval Construction Battalion.
Altitude: 721 ft.
None.
Depth: 535 ft.
Cas? ng:
Source of record: Glander (1946).
Remarks: No water-bearing beds found.
Well was drilled through coral, clay, sand, and several crevices
and caverns.
Well was abandoned because of absence of water.
475

WELL 70
Location; About lat 15°10'35" N., long 145°43'05" E., at Chalan Pupulu.
Drilled: Completed Sept. 20, 1945 by 117th U.S. Naval Construction Battalion
Altitude; 42 ft. Depth; 50 ft.
Casi ng; None.
Aquifer; Hard coral with streaks of clay.
Source of record; Glander (1946).
Remarks; Water was found at depth of 43 ft (1 ft below sea level).
Chloride: 1,100 ppm from bailer sample.
pH: 7.4-7.6.
Well was abandoned because of high salinity.
WELL 71
Location: About lat IS^O'IO" N., long 145043'15" E., east of Chalan Laolao.
Dril led: Completed Oct. 25, 1945 by 117th U.S. Naval Construction Battalion
Altitude; 178 ft.
None.
Coral.
Depth; 189 ft.
Cas? ng;
Aquifer:
Source of record: Glander (1946).
Remarks; Water was found at 179 ft.
Chloride: 1,100 ppm, from bailer sample.
pH: 7.4-7.6.
Well was abandoned because of high salinity.
476

WELL 7
Location; About lat 15°09'49" N., long 145°43'05" E., at Kiya near
Lake Susupe.
Dril led; Aug. 9-21, 1944 by 1397th Engineer Construction Battalion, U.S.
Army.
Altitude; 50.29 ft (51.6 ft by Glander, 1946). Depth; 481 ft.
Diameter of open hole; 8 in.
Aquifer; Limestone.
Casi ng; None.
Source of record; Stearns (1944).
Remarks; Drilled in existing dug well, which was 3 ft in diameter and 50 ft
deep, to explore for artesian water. Dug well contained 28 in. of
water, yielded 14,400 gal/d with chloride concentration of 40 ppm
(Stearns, 1944); 50 ppm, Glander (1946).
No water was found between bottom of dug well and 479 ft. Bailer
sample contained 3>210 ppm of chloride.
Well was abandoned Aug. 21, 1944 (Stearns, 1944).
477

WELL 7
LOG [Source: Stearns, 1944]
Description of material Depth (ft)
Soil (dug) 0-12Very open limestone (dug) ------------------------------------- 12-50Brown clay ---- -------------- ____-___-____--__--___--__-___ 50-55Coarse lime sand and clay ------------------------------------- 55-60Fine lime sand and clay -------- __________ __ __ _ 60-75Coarse lime fragments and clay -------------------------------- 75-80Brown clay ----------- -- ____________ _____ 80-85Lime sand (Foraminifera) ------------------ ----_-__----_----_ 85-95Red clay 95-125 Alternating red, gray, green, and lavender Globigernia
tuffaceous shales -- ------ ----- _ - ________ ________ 125-175Marly shale 175-185Coarse sandy Globigernia shale with manganese pellets ----- 185-205Marly shale 205-220Brown shale with sandy layers - -- ----- -- ______ 220-255Shale with 1/4 inch pebbles 255-265Brown shale with some marl -------- -__-------____ __________ 265-280Sandy and pebbly shale 280-315Sandy and pebbly shale with lime granules - - --- - -- 315-350White marl 350-370Tuffaceous marl -- - 370-415Lavender marl 415-419Tuffaceous marl ---- 419-440Fine-grained marl -- 440-445Pink and lavender marl -- ---- - - 445-475White marl 475-480Caving marl -- 480-481
478

WELL 4
Location; About lat 15°09'06" N., long 145°43'00" E., east of Lake Susupe.
Drilled; July 1-31, 1944 by 1397th Engineer Construction Battalion, U.S.
Army.
Altitude; 65-9 ft. Depth; 80 ft.
Diameter of open hole; 8 in.
Casi ng; 6 in., could not be driven beyond 80 ft.
Aqui fer; Limestone.
Source of record; Stearns (1944).
Remarks; July 23, 1944, hole 22 ft deep: Chloride, 280 ppm, after pumping at
rate of 25 gal/min for 15 minutes. At 80 ft, bailer sample showed
chloride concentration of 1,7^0 ppm.
Well was abandoned on Aug. 1, 1944.
LOG [Source: Driller's log]
Description of material Depth (ft)
Lump coral ---------------------------------------------------- 0-20Sandy coral and limestone ----------------------------------- 20-40Hard 1ime and coral ------------------------------------------- 40-60Hard sand and 1imestone --- ----------- ___________ __ 60-70Hard lime and coral ------------------------------------------- 70-74Mud and salt water -- -- --- ---- --- -- - 7^-76Coral rock and salt water ------------------------------------- 76-80
Note: Hole caved badly below 20 ft (Stearns, 1944)
479

TEST HOLE 17
Location; Lat 15°12'24" N., long 145°45'18" E., 100 ft south of road to
Talufofo, at Denni Spring pipeline crossing.
Drilled: Apr. 16 to May 7, 1980 by Ted Lund Drilling and Supply.
Alt?tude; 615 ft (from topographic map). Depth: 335 ft.
Diameter of open hole: 7-7/8 in.
Casi ng: None.
Source of record: Driller.
Pumping tests: Apr. 17> 1980, pumping test when well was 83 ft deep: Well
producing 20 gal/min.
Apr. 18, 1980, pumping test when well was 103 ft deep:
Pumping rate dropped from 42 gal/min to less than 20 gal/min
in less than one hour; recovery very slow. See pumping test
record.
Apr. 19, 1980, pumping test when well was 205 ft deep: Pumped
for two hours; results about the same as test of April 18.
See pumping test record.
May 8, 1980, pumping test when well was 335 ft deep: Pumping
rate dropped from 48 to 16 gal/min in less than 3-1/2 hours.
Recovery very slow. See pumping test record.
Well was abandoned and sealed May 13, 1980.
480

TEST HOLE 17
LOG
Description of material Depth (ft)
coral coral
Brown clayBrown, hardWhite, hardRed clayWhite, hard coral (foam becoming wet) ------- ------Red clayBeige, hard coral-rough drilling ------------------Brown clay Brown clay and coral ------------ -------_----_-____Black, soft weathered rock ---- -- Gray soft sandstone (tuff), becoming sticky at bottom Gray tuff with soft black rock -- Black, medium hard weathered rock --- ---- -Hard, black rock-rough drilling - ---- - -Black, medium hard to medium soft highly weathered
basalt with multicolored soft tuff Black, medium hard, highly weathered basalt with layers
of gray brown and pink soft tuff ------- - --Black, pink, gray silt and highly weathered rock
medium hard rock with coral layer ---- rock/less coral hard coral layer ------ - _hard rock with coral layers - - hard rock with less coral layers - --
Black, Black, White, Black, Black,
harder medium medium medium
Q-88-23
23-48 48-50 50-56 56-58 58-7171-7272-7575-83
83-103103-107107-135135-143
143-170
170-205 205-238 238-261 261-280 280-285 285-310 310-355
Note: At 75 ft foam became very dark and started to lighten at 78 ft.
481

TEST HOLE 17
PUMPING TEST
Date: April 18, 1980.Measuring point: 3.0 feet above ground surface; static depth to
water, 35.4 ft.
Time
080008020805081008150830084509000930
Elapsedt ime(mi n)
025
101530456090
Pumpi ngrate
(gal/min) Remarks
Start of test.about 100
423833232118 Same reading at 0915.17 Same reading every 15 minutes
until end of test at 1030.
Recovery was very slow. One hour after end of test the water was still 5 feet below water level at start of test.
Date: April 19, Measuring point:
1980.3.0 feet above ground surface; static depth to water, 35.7 ft.
Time
Elapsed time (mi n)
Pumpi ngrate
(gal/min) Remarks
1020
10251027
1031103610451100
12301240
02
6112035
125135
38
29242118
1818
Water level still recovering from drilling with air-foam,
Start pump test.Pump drawing air from 1027 til
end of test.
Same reading every 15 minutes 1115-1215.
End of test.
482

TEST HOLE 17
PUMPING TEST
Date: May 8, 1980.Measuring point: 3.0 feet above ground surface; static depth
to water, 35.4 ft.
Time
10281031103510451115114512151245131513451350 to1410
1415143014451500
Recoverywas st
Elapsed t ime (mi n)
037
174777
107137167197
227242257272
was very sill 7 feet
Pumpi ng rate
(gpm) Remarks
Start of test.483627211818171716
Pump stopped.22201717 End of test.
low. One hour after end of test, the waterbelow water level at start of test.
483

OTHER HYDKOLQGIC DATA
Page
Ra infal1 data
German sources:Garapan, monthly and annual totals, 1901-12 ---------------- ---- 486
Japanese sources:Tanapag (Mount Talufofo), monthly and annual totals, 1926-41 --- 487 Garapan, monthly and annual totals, 1927-42 488
U.S. sources:Miscellaneous sites, monthly totals, 1945-46, 1953 489 Maui-l, weekly totals, 1948 490 Well 3, weekly totals, 1948 ' 491 Capitol Hill, weekly totals, 1948 492 U.S. Navy, monthly and annual totals, 1954-63 493 U.S. Coast Guard LORAN station, monthly and annual totals, 1963-76 ^54 Agriculture Station, monthly and annual totals, 1976-83 ---------- 495Communication Center, monthly and annual totals, 1968-83 ------- 497
Communication Center, daily totals, 1976-83 498Isley Field, monthly and annual totals, 1977-83 506
Isley Field, daily totals, 1977-83 5079-Mgal reservoir, monthly and annual totals, 1977-83 - - - 514
9-Mgal reservoir, daily totals, 1977-83 515
Streamflow records
Gaging stations --------------- ________ _____ _______ ______ 522South Fork Talufofo Stream, 1969-83 522
Annual maximum and peak discharges -------------- ________ 523Annual minimum discharge - -- -- - 524Monthly and annual discharges ---------- __________ _____ 525Instantaneous discharge with water and air temperatures --- 527Chemical analyses - ------------ _-__-___-____-___-_-__ 533
Middle Fork Talufofo Stream, 1968-82 530Annual maximum and peak discharges ------------------------ 531Annual minimum discharge ------------- ___________________ 532Monthly and annual discharges - -- -- - -- - 533Instantaneous discharge with water and air temperatures --- 535Chemical analyses of water from Talufofo Stream ----------- 538
Low-flow partial-record stations -- -------------------------------- 539Hasngot Stream, 1967-77 - 539
Discharge measurements and water temperatures - - 539North Fork Talufofo Stream, 1968-71 542
Discharge measurements and water temperatures ----- -------- 542Talufofo Stream, 1968-73 543
Discharge measurements and water temperatures ------------- 543Miscellaneous discharge measurements --- --------------------------- 545
484

Page Spr inos
Nicholson Spring ----------------------------------------------------Natural Bridge Spring No. 1 --- --- - ------ -------------- 547Natural Bridge Spring No. 2 - ---- 547Denni Spring - --- - - - 548
Annual maximum daily discharge, 1953-54, 1970-82 -- 549Annual minimum daily discharge, 1953-54, 1969-82 ------ -- -- 550Instantaneous discharge with water temperatures ----- --------- 550Monthly and annual discharges, 1952-54, 1968-82 551Chloride concentration of the water ---------------------------- 55^Chemical analyses of the water ----------------------------------- 555Analysis of water for metals and pesticides -- ---------------- 556
Denni Sprinq No. 2 - - - --- ---- - -- - --- -- 557Radio Hill Spring No. 1 557Radio Hill Spring No. 2 - -- -- -- 558Radio Hill Spring No. 3 558Radio Hill Spring No. 4 555East Achugao Sprinq ---- ------------------------------------------- 559
Discharge measurements and water temperatures -------------------- 560West Achugao Spring - - - - ------------- __-_--- _-- 552
Discharge measurements and water temperatures --------- ------- 552Tanapag Spring No. 1 -- --- - - - - - 564Tanapag Spring No. 2 ---------------------------- -------------------- 564Starch Factory Spring ----------------------------------------------- 565Chemical analyses of spring water (1944-45) --- -------------------- 566
Chemical analyses of ground water
Wells 1, 3, 5, 6, 31, 57, Asqona B (1944-52) 567Maui -type wells, Mau i I, II, IV (1945-67) 568Wells 3, 31, 76 (1967) - 559Coast Guard well (1971) 570For metals and pesticides, wells 6, 16, 50. Maui IV (1977) -- - 571Wells 103, 111 (1982) - 572Wells 76, 144, 164, 171 (1983) 573Wells 148, 149, 150 (1983) 574
485

Rainfall data
Table 38. Monthly and annual rainfall, in inches, at Garapan from German sources (1901-12)
Location: Lat 15°12'N., long l45°43'E. at altitude 30 ft-'.
[Source: Mitt(h)eilungen von Forschungreisenden und Gelehrten aus dendeutschen Schutzgebieten; annual publication, Berlin, 1902-13
(Converted from millimeters to inches)]
Year
190119021903190419051906190719081909191019111912
MeanPercent
Jan.
0.634.601.804.132.442.242.091.571.30.87
2.83.79
2.11
2.5
Feb.
1.444.821.374.301.263.113.501.024.763.7411.381.12
3.48
4.2
Mar.
10.463.741.927.332.245.871.543.193.231.899.92.90
4.35
5.2
Apr.
2.081.162.577.151.731.305.163-314.293.313.82.59
3.04
3.6
May
1.306.971.506.362.202.242.201.342.287.801.891.43
3.13
3.8
June
6.176.932.158.325.797.367.682.054.214.2911.504.59
5-92
7.1
July
8.198.119.1510.355.317.4810.0315.639.0613.0710.596.50
9.46
11.3
Aug.
11.248.838.6714.2520.9414.7219.3312.443.6212.1722.9918.37
13.96
16.7
Sept.
,,14.82^(9.33)
12.5611.1512.4018.6610.317.8016.1410.249.2116.84
12.74
15.2
Oct.
,,10.04- (1.12)
13.684.3014.7614.619.098.9819.6513.589.1713.04
11.90
14.2
Nov.
3.382.718.325.6913.6210.359.696.425.316.8519.453.56
7.95
9.5
Dec.
8.181.498.449.997.405.874.965.088.901.892.362.97
5.63
6.7
Annual
?/ 77 ' 93-'(59.81)
72.1393.3290.0993.8185.5868.8382.7579.70115.1170.70
^83.67
100
Location also published as lat 15°11'N., long 145°44'E. (Schott, 1938) and lat 15°13'N., long 145°4TE. (Taylor, 1973).
2/ No records available for September 22 to October 14, 1902.
Total of monthly means.
486

Table 39- Monthly and annual rainfall, in inches, at Tanapaq from Japanese sources (1926-41)
Location: Lat 15°l4'N., long 145°46'E., at Mount Talufofo, at altitude 680 ft (Cox and Evans, 1956j Davis, 1958).
[Source: Japan Central Meteorological Observatory, The rainfall of Nippon, as published in Military Geology of Saipan (Davis, 1958)]
Year
1926192719281929193019311932193319341935193619371938193919*01941
MeanPercent
Jan.
__
4.842.442.953.115.203.2719-0910.981.591.386.514.665.043.94
5.36
6.3
Feb.
__--
7.283.78.83
2.012.832.011.899.72.79
3.591.783-214.812.95
3-39
4.0
Mar.
__--
3.392.091.612.053.353.032.685.714.881.08.97
1.771.943.12
2.69
3.2
Apr.
__
2.520.9*1.222.011.181.302.405.634.043.482.022.722.702.70
2.49
2.9
May
__
7.052.833.314.253-783.5017.322.201.335.742.821.352.392.23
4.29
5.0
June
__
4.574.172.092.245.795.4310.8711.733.684.617.402.645.063.40
5.26
6.2
July
__
15.9*21.509.256.309.3712.2413.359.947.213.929-9212.5514.6112.96
11.36
"13.3
Aug.
8.15
7.689.6111.7713.869.809.9212.9916.9714.5513.5316.9021.999.1414.14
13.06
15.3
Sept.
7.95
24.1716.3019.028.3110.758.8611.6129.6815.9113-2415.638.05
29.709.46
15.76
18.5
Oct.
16.98
24.3711.508.708.287.9510.3211.5010.1215.756.989.865.877.1*5.68
10.29
12.1
Nov.
10.91
5.274.2110.679.063.863.193.7412.2410.304.046.905.237.222.25
6.30
7.4
Dec.
2.80
6.183.5*5.164.412.951.814.579.613.406.112.846.939.3*2.*8
*.95
5.8
Annual
__
113.2682.9176.5865.8966.8164.88112.01134.5383. *367.7083.5576.9799.0965.31
-^85.20
100
- Total of monthly means 1928-41.
48?

Table 40. Monthly and annual rainfall, in inches, at Garapan from Japanese sources (1927-42)
Location: Lat 15°12'N., long 145°43'E., at altitude 21 ft-' (Austin Smith and Associates, 1967).
[Sources Taylor, 1973]
Year
1927192819291930193119321933193419351936193719381939194019411942
MeanPercent
Jan.
4.874.922.483.153.305.372.7618.5910.521.601.366.614.425.304.1114.50
5.24
6.1
Feb.
8.045-943.828.232.152'. 822.271.899.03.77
3.401.763.484.652.893.36
4.03
4.7
Mar.
3.945.232.151.782.263.262.732.636.384.391.311.001.751.803-133.31
2.94
3.4
Apr.
7.732.50.85
1.262.151.231.312.365.764.373.232.022.762.802.322.74
2.84
3.3
May
10.403.072.462.874.303.863.7417.322.091.375.902.711.392.352.726.18
4.55
5.3
June
8.314.094.792.752.385.905.4411.2510.083.764.577.532.605.113.583.50
5.35
6.2
July
9.8916.0221.579.536.589.2812.0312.609.957.223.9010.0011.3414.8512.8414.15
11.36
13.1
Aug.
12.577.519.7412.0813.7510.069.9813.8716.6514.3513.3316.7523.729.1316.8714.66
13.44
15.6
Sept.
12.4323.9517.2619.007.4310.968.7111.2430.1915.4312.7815.838.32
30.2610.229.85
15.24
17.6
Oct.
5.5725.1611.9610.019.287.6110.2411.259.6417.087.349.976.557.086.4510.60
10.36
12.0
Nov.
5.225.404.376.949.173.843.163.3912.1510.004.116.965.117.042.265.65
5.92
6.9
Dec.
6.056.143.745.664.392.961.744.029-003.506.09
6.879.552.914.27
5.13
5.8
Annual
95.02109.9385.1983.2667.1467.1564.11110.41131.4483.8467.32
78.3199.9270.3082.77
^86.40
100
Latitude, longitude given by Taylor is for Kobler Field. Altitude given by Cox and Evans (1956)is 10 ft.
21 Total of monthly means.
Note: In Schott, 1938, monthly means of rainfall for 1927-29 given for Tanapag rain gage at altitude 680 ft (called Hohenstation - High station) are the means for Garapan station.
^88

Table 41. Monthly ra infalI, in inches, at miscellaneous sites
(Source: Glander, 1946)
Locat ion
Maui wel 1 1 , Kobler FieldDeep well 14, near HospitalChacha, Hakmang FieldDenni SpringIsland Command Booster,Capitol Hill.
Tanapag Booster, Tanapag
October7-31
5.078.926.746.629.28
8.02
1945November
5.105.053.162.502.95
3.10
December
2.483.151.652.603.25
2.10
1946January
2.522.75.93
2.101.16
2.45
(Source: Written communication W. M. Winfred and F. E. Morris to Navy Authorities)
Location: U.S. Naval Air Station, Tanapag. January 1947 to January 1950.
Jan. Feb. Mar. Apr. May June
Mean of 3 years 2.99 2.14 2.09 1.79 2.85
July Aug. Sept. Oct. Nov. Dec. Annual
Mean of 3 years 7.68 5.86 9.13 8.03 5.42 2.07 51.23
Lowest monthly rainfall, February 1949, 0.33 inches; highest, October 1947, 14.28 inches.
Lowest annual rainfall, 47.78 inches; highest, 57.02 inches.
489

Table 42. Weekly rainfall , i
[Source: Cur
Day Jan.
12 JU
3 *4 *5 *6 *7 *8 .55Q A
10 *11 *12 *13 *14 *15 2.5516 *17 *18 *19 *20 *21 *22 1.0523 *24 *25 *26 *27 *28 *29 .3230 *31 *
Feb.
JU
AJU
A
.55JU
JU
JUf\
AJU
A
.88A
A
A
AJL
JL
.05*AJU
JU
AJU
.18JUf\
AJU
Mar.
JU
*A
.68A
A
A
A
A
A
1.60*
AJU
A
A
*
1.15A
*
A
A
A
*
.60*
*JU
A
*
A
Apr.
.50AJU
A
A
A
A
1.83AJU
*A
AJU
3.33*AJU
JUt\
A
A
.16*
*
A
*
A
A
.35A
May
JU
AJU
A
A
1.15JU
*AJU
A
*
0JL
A
*
*
A
A
1.00JU
JU
JU
JU
JU
JU
.95JU
A
A
A
June
JU
A
.53A
AJU
AJU
A
2.53A
A
A
A
A
A
.45JL
*
A
A
A
A
.65JU
*AJL
A
A
in inches, at Mau i 1 (1948)
lone, 1949]
July
4.23AJU
A
A
A
A
.93A
*
A
*
AJUf\
3.63AJU
**A
A
.13A
AJU
AJU
A
1.88A
A
Aug.
A
AJU
A
2.80A
A
A
A
A
A
1.77AJU
A
*JL
A
.70*JU
A
A
A
*
.63 --
Sept. Oct.
A
A
A
A
A
A
2.79.... A
A
A
.. A
A
.. A
.20A
__ JL
___ JU
A
A
A
1.61A
A
A *
A A
A A
A A
* 4.11A A
1.18 *A
Nov.
AJU
A
8.41A
A
A
AJU
A
.14AJU
A
A
*JL
2.20A
A
A
A
A
A
1.25A
A
AJL
A
Dec.
JU
.30JU
A
A
AJU
JU
.13.1.
A
A
A
Aj.
.54A
A
A
AJL
A
.01A
.50AJL
A
A
JL
.10
* Included in following total. Total January 2 to August 26, 1948: 40.29 inches.
490

Table 43. Weekly rainfall, in inches, at well 3 (1948)
[Source: Curione, 1949]
Day
123456789
10111213141516171819202122232425262728293031
Feb. Mar. Apr.
.10 *.35**
* ** ** ** 1.50JL JL
JL JL
3.95 ** AJL JL
* *
* 3.05* ** *.55 ** *
JL
*
.45JL
*
30 **
JL . JL
* *
* .25**
May
--------*JL
JL
*
JL
*
.35JL
*
*
JU
JU
*
.65***JU
JL
*
.55JL
JL
JL
JL
June
*JL
.55*JL
*
JL
JL
JL
1.35JL
*
JL
*
JL
*
.90****JL
JL
.25**JL
AJL
.70
July Aug.
_ _ JL
* A
* *
JL JL
* .35JL JL
* A
1.90 *_ _ JL
*
_ *
1.95*A
*
* *JL JL
* *
* 2.75it *
* A
.70 *JU JL
JL JL
JL JL
* 2.10JL
A
1.40**
Sept. Oct.
JL
JL
JL
JL
*
*
1.10JL __
JL __
*
*
JL __
*
1.40JL
*
*
*
JL
A
2.70____**AJL __
A
JL JL
.88 *JL
Nov. Dec.
JL _ _
*
JL _ _
9.55*JL _
JL __
*
*
JL JL
.65 **
__ JL
_ _ JL
__ JL
.40__ JL
__ JL
* *
JL JL
JL J.
JL JL
* .70JL
.90 --------
Included in followina total.
491

Table 44. Weekly rainfall
[Source:
Day Jan.
123456789
101112131415161718192021222324252627282930 *31 *
Feb.
JL
A
A
*
1.0*****A
1.5JU
*****
1.0***JL
JL
A
.3***
Mar.
JL
*
*
.8******
1.8***A**
2.8JL
JL
A
*
A
*
1.7JU
**JU
*JL
Apr.
.5**JU
AJU
*1.8*A****
6.9 *JU
***Jt,
.2*
May
*****.7**A
A
A
*
0JU
JU
*JU
**
1.2*JU
***A
.4JL
*
*
*
, in inches, at Capitol Hill (1948)
: Curione, 1949]
June July Aug.
* 1.2A
1.2**A
A
A
A
4.7A
A
A
A
A
A
.1A
A
A
AJU __
A
.9A
A
A
A
A
A
__ __
Sept. Oct.
_ _ _ _
__ __ A**AJL __
* *
3.6 *JL
A
*
*
2.9**
* ** *JU JU
JU JU
* 4.2JU JU
.5 *JU
Nov.
**JL
8.5*****j>.
.4JU
JU
*AJL
A
3.7*JU
****
1.3*JL
*
JU
A
Dec.
A1.8
JL
A
A
AJL
*
3.4*AA*A
*
.3JU
****JL
.8
Included in following total.
492

Table 45. Monthly and annual rainfal1, in inches, from U.S. Navy (1954-63)
[Source: U.
Year
1954 1955 1956 1957 1958 1959
Jan.
1.59 5.00 4.06 4.02 3.01 2.19
Feb.
3.25 2.10 1.12 1.99 1.64 4.34
Mar.
3.60 3.64 3.65 2.30 2.29 3.14
Apr.
At
1.76 1.87
1.26 1.72 4.02
May
lat 15°07
2.97 1.45 3.08 2.33 1.67 2.63
At lat 15°13'
1959 I960
I960 1961
2.16
6.52
2.06
2.83
1.21
3.89
2.52
At
4.23
3.58
lat 15°13
3.66
At lat 15°13'
1961 1962 1963
Mean Per cent
6.65 3.06
3.83
5.3
4.55 3.54
2.74
3.8
2.87 2.40
2.90
4.0
3.45 13.31
3.79
5.2
2.74 4.33
2.84
3.9
S. Weather Bureau, 1954-55, 1956-63]
June
'N., long
July
145°42
1.98 2.65 4.42 9-28
2.22 1.54 11.29 13.28 2.76 7.11
N., long
4.78
'N., long
6.36
N., long
5.05
4.86
6.7
145°42'
4.38
145°43
6.80
145°46'
6.43
8.9
Aug. Sept. Oct.
'E., altitude 105 ft
13.57 17.75 8.21 4.90 9.44 7.43 10.70 10.55 9.28 11.40 7.83 7.34 7.59 9.88 6.79 10.08 13.08 7.34
E., altitude 105 ft-'
28.94 16.61
'E., altitude 495 ft
19.50 11.10 9.11 19.29
E., altitude 495 ft-'
7.44
11.75 11-78 10.65
16.3 16.3 14.7
Nov.
4.74 5.98 11.32 5.21 7.04
9.45 3.64
~
6.77
9.4
Dec.
4.64 3.98 2.71 2.67 3.90 (1.70)
1.70
7.04 (5.27)
5.27
3.99
5.5
Annual
58.25
56.22 68.27 65.43
82.70
^72.33
100
U.S. Weather Bureau publications do not indicate whether this is a relocation or a correction of latitude or longitude; altitude remained unchanged.
Total of monthly means.

Table 46. Monthly and annual rainfall, in inches, from U.S. Coast Guard LORAN station (1963*76)
Location: Lat 15°08'N., long 145°42'E., altitude 9 ft, at U.S. Coast Guard.
[Sources: U.S. Weather Bureau, 1963-69, and U.S. National Oceanic and Atmospheric Administration, 1970-76]
Year
19631964196519661967196819691970197119721973197419751976
MeanPercent
Jan.
2.029.203.183.173.551.04
11.132.783.74
4.045.018.65
4.79
6.0
Feb.
__
1.743.004.423.981.121.434.555.50 1.753.784.763.24
3.27
4.1
Mar.
_ _
2.291.981.013.553.312.062.9913.79 1.026.244.331.83
3.70
4.6
Apr.
10.381.681.236.62 1.721.645.372.132.207.932.282.71
3.82
4.8
May
4.564.41 .74 1.651.488.88
5.311.06
3.51
4.4
June
..2.492.032.276.578.412.795.645.496.131.635.763.15
4.36
5.4
July
9.068.0515.174.3514.2711.789.6810.199.70
6.845.8311.81
9.73
12.2
Aug.
8.147.093.80
22.0317.6412.524.108.316.80
11.0716.0017-59
11.26
14.1
Sept.
16.9911.0719.7117.6321.0217.735.044.83
7.2211.9816.0010.68
13.32
16.6
Oct.
9.407-307.8213.0410.2011.6818.615.006.666.959.3611.967.714.24
9.28
11.6
Nov.
3-876.644.888.3912.4522.574.812.559.13
7.439.376.93
8.25
10.3
Dec.
9.695.258.143.873.141.108.285.383.402.13
2.765.222.92
4.71
5.9
Annual
_ 68.8881.82
103-35
61.2163-99--
89.0288.29
1/80.00
100
Total of monthly means.

Agriculture Station, Hakmang [Commonwealth of the Northern Mariana Islands]
Location: Lat 1510'21" N., long 14546'05" E., at Agriculture Station,Hakmang, 0.6 mile southwest from Communication Center rain gage.
Period of record; 1976-83.1630.Gage; Rain can read twice daily at 0730 and
(from topographic map). Remarks; After typhoon Diana in November 1980,
Altitude of gage is 205 ft
rain gage was moved from largeopen space in center of Agriculture Station buildings to an area between two of the buildings. Gage was returned to original site two years later,
Table 47. Monthly and annual rainfall, in inches,
at Agriculture Station, Hakmang (1976-83)
[Source: Agriculture Station]
Year Jan. Feb. Mar. Apr. May June
1976197719781979
. 1980198119821983
MeanPercent
..2.281.81
1.103.579.592.20
3.424.2
._2.121.59
7.402.031.902.14
2.863.5
1.304.393.63 1.342.458.181.90
3.314.1
1.921.831.90 1.574.231.281.85
2.082.5
4.66.72
5.99
4.342.256.771.27
3.714.5
2.601.394.46
3.742.8411.271.61
3.994.9
Year July Aug. Sept. Oct. Nov. Dec. Annual
1976197719781979198019811982
MeanPercent
10.003.458.69
6.2615.5711.27
9.2111.3
13.70 --
9.1129.7010.32
15.7019.2
17.3322.7412.2810.9027.276.826.70
14.8618.2
2.4514.8511.75
--8.99
1/ 9 ' 2 °I7 15.5
10.4612.8
4.8812.35
3.0411.7812.022.76
7.809.5
2.051.294.95--
7.007.063.80
4.365.3
._----
89.901797.74^89.34
^81.76100
At least as much. Rain can overflowed on October 18, 1982. 2/ Total of monthly means.
495

Communication Center Rain Gage, Hakmang
Location; Lat 15O 10'37" N., long 145°46'32" E., in center of area between
Communication Center buildings at Hakmang.
Period of record; 1968-72, 1975-83.
Gage; Eight-inch diameter rain can, read daily at 1000. Altitude of gage is
150 ft (from topographic map).
Remarks; Station is U.S. Weather Service Substation at Hakmang Communication
Center. Records are not published by U.S. Weather Service.
496

Table 48. Monthly and annual rainfall, in inches, at Communication Center, Hakmang (1968-83)
[Source: U.S.
Year
19681969197019711972
197519761977197819791980198119821983
MeanPercent
'cent!/
Jan.
_*.0.5411.231.181.06
__
2.691.123.66.88
3.477.183.06
3.28
4.5
4.8
Feb.
1.483.388.67.54
__ 1.401.192.045.901.831.991.91
2.76
3.8
4.1
Mar.
..2.41.60
3-75.90
__1.483-221.311.65.66
2.124.081.43
1.97
2.7
2.9
Apr.
_ 1.50.18
4.04.73
__2.231.223.341.531.283.421.091.94
1.88
2.6
2.8
May
_
1.69.19
5.33.45
_13.24
.653.353.243.203.161.751.17
3.12
4.2
4.6
June
..3.79 1.501.58
__3.612.01
1'4.503.133.712.405.881.32
3.04
4.1
4.5
. Weather Service, Guam]
July
..1.31
17-319.80
18.3611.717.3614.068.694.5711.029.913.29
9.78
13.3
14.4
Aug.
11.90
4.823.79
22.3418.31
2/ 3 - 73±'73.25
10.9924.248.4510.31
^17.47
23.8
17.5
Sept.
_«
8.55
4.76.93
9.8616.5220.1514.74
25.495.095.835.24
10.65
14.5
15.7
Oct.
_*
4.92
7.291.45
5.441.98
16.0910.5811.868.045.16
23.8010.71
8.94
12.2
13.2
Nov.
1.6316.32
1.061.15
6.63
13.7313.492.7511.708.962.206.08
7.14
9.7
10.5
Dec.
__4.04 59
3.181.651.114.143.475.695.962.754.52
3.37
4.6
5.0
Annual
__58.45
60.30
__
73.36145.07
82.1176.8374.9150.98
i/73.40
100
100
No record June 30, 1978.
Rainfall for Aug. 11-12, 1978: 44.5 inches with rain can overflowing both days.
August mean without 1978 monthly total is 11.89 inches.4/ Total of monthly means.
August 1978 mean not included (for comparison with other rain gages where August 1978 totals were missing)

Table 49. Daily rainfall, in inches, at Communication Center (1976-83)
[Source: U.S. Weather Service, Guam]
1976
Day
123456789
10111213141516171819202122232425262728293031
Jan.
1.25.08
0 .17.05
0.18.48.04.01
00.04.07.35
0.12.41.28.33.25.06.01 .16.84.24
Feb.
0.19.20.33.01.12.13.08.35.02.06.03.01 .06 .23.42.08.03 .14
Mar.
0.48.02
0.05
00.05.07
00000.02
00000.17
0.21.06.04.11.10.06
0.04
00
Apr.
0.17.06.01
000000.09
000000.09.23.10.46.12
000.01
0.75.14
0
May
0.101.95.40.14.05.07.30
00000.23
0.01
00001.383.454.02.07
00.35.30.03.39
00
June
000.09
0.01.18.04.16.01.06
00.02
0.63.07
0.17
0.15.04.35.53.09.13
0.53.11.24
July
0.06.09.02.03.16
0.09.06.11.66
00.59
3.10.14.11.26
0.41
2.10.72.45.16.73
0.52.13.06.09.85.01
Aug.
0.71.32.35
5.493.102.12.54.09.06
0000.27.30.20.38
1.05.01
01.351.42.06.06.19.03.01.02
000
Sept.
0.0300.05
1.502.75.20.99.14
0.36.15.45.12
1.20.80.35.25.01.01.01.18
1.254.40.13.37.19
00.63
Oct.
0.20.08
0.19.46.34
00000.01
0000.02.15
00.02
00000.01.05.03.17.25
Nov. Dec.
0.01
00.03
00000.02.09.43.40
0000.01.01.05.22.05
0000.20.03.05.05
Total 1.48 2.23 13.24 3.61 11.71 18.13 16.52 1.98 1.65
498

Table 49. Daily rainfall, in Inches, at Communication Center Cent I nued
1977
Day
123456789
10111213141516171819202122232425262728293031
Total
Jan.
0.170.20.25
0000.04
0.17.22
00.11.50
00.22.06.07.03.06.24
0.02.23
00.10
0
2.69
Feb.
000000.03
0.04.25.22
0.04
000.03
00.26.05.07
00.05.22.08.06
1.40
Mar.
00.01
00.01.40.07.06.05.02.06.39
0.73.01.13.02.23.02.22.01.17.29.22
0.02.01
0.03.04
3.22
Apr.
0.050.12
0000.04
00.42.15
000.01
0.02
000.01.01
000.01
0.26.12
1.22
May
00.07
0.04.22
000.01.04.04
000000.10
00000000000.13
0.65
June
0,03
00.37
0 72 ,.07.06
0.05.08.02.03.01.05
0.12.04.03
000.15.07
0.05
00.06
2.01
July
0.4600000.05
0.03.02.02.04.03.01.01
0.03
00.03.07
2.37.11.25.21.60.42
1.05.10
1.40.05
7.36
Aug.
0.0600.41
00.05.08.02
0.04.18.07.17.45
00.01.05.08.01.09
00.68.31.01.16.30.45.05
3.73
Sept.
0.06.14.04.03
1.201.47.04
000.05
2.855.552.025.06.78.20
. .10.11.05
000000.18.17.05
20.15
Oct.
0.38.02
0.02
0.04
0.02.80.86.07.60.10.40.52.38.11.27
2.02.54
1.537.15.15
00.02.05
0.04
0
16.09
Nov.
03.64.01.01.12.03.25
1.402.022.49.09.15.33
1.051.870000.03.15
0000.04
0.01.01.03
13.73
Dec.
0.02.01.03.09.04
00.37.03
0000000.01
0-.04
0000.23.01
00.05.09.07.02
1.11
Total for 1977: 73-36 inches.
499

Table 49. Daily rainfall, in inches, at Communication Center Cent inued
1978
Day
123456789
10111213141516171S19202122 .232k25262728293031
Total
Total
Jan.
0.050.02.04.01
00000000.02.08.01.24.03
0000.01
0.30
0.01
0.07
0.23
1.12
for 1978
Feb.
000.03.06.06.02.01.01
000.09
00.16.12
0.03.04.02.03.48.03
0000
1.19
: 145
Mar.
0.1000.14
00.11
000.02
0000.01.01
0.53
0.01
0.07.01
0.01
0.07.20.02
0
1.31
Apr.
0.08.02
0.01
1.35.01
0.12.20
000000.04.29.11.15.11.01.21.02.35.02.01.05
00.18
3.34
May
0.03.02.01.02
00.34
0.10.04.01.01.86
00.05.14.03
0000001.140.08
0.22.25
0
3.35
June
0.460.05
0.05.12.11.02.11.11.57
0.18.07
0.05.27.16.10.25
0.03
01.09.01.01.06.04.58
4.50
July
0.41.25.37.92
1.03.02
0.15
0.80.15
0.17.89.30
2.57.45.52.13
1.011.50.04.03.02.04.15.29
0.59
1.22.04
14.06
Aug.
0.010.13.01.75.04.05
3.015.051.30
22.3022.201.801.001.25.03
0.04.58.56.38.21
2.20.01.08.05.12.16
8.72.89.32
73.25
Sept.
0.15.07.03.17.03.49.19.05.13
0.05
1.100.02.14.15.86.02.06.04.18.44.02.26
1.74.32.48
7.500.05
14.74
Oct.
0.591.28.09.45.60.94
01.40.20.32.01
0.31.02
1.04.06.07.02.19-.18
0.02.01.20.60.40.04.16.25.23.90
10.58
Nov.
0.802.60.01.03.02.02.03.18
00.04.19
0.30.86
0.01.02
1.30.05
2.18.06
0.07.03
0.36
2.052. 15.09
13.49
Dec.
0.20.24.57.01
0.01.19.01.10.07.05.04.10.02.03.50.02
0000.02.23.75.02.80.05.02.01.08
0
4.14
.07 inches.
500

Table 49. Daily rainfall, in inches, at Communication Center Cent inued
1979
Day
123456789
10111213141516171819202122232425262728293031
Total
* Incl
Jan.
0.05
0000
.050
.04
.51
.23
.45
.29
.08
.0200
.050
.13
.020
.04
.07
.09
.49
.060
.03
.52
.44
3.66
luded
Feb
0.37.09.01.02.04.10.28
00
.08
.020
.01
.28
.27
.1300
.06
.03
.05
.20000000
2.04
in fol
000
0
000000
00
000
0
00
1
1 owi
Mar
.07
.30
.23
.08
.25
.01
.02
.63
.01
.01
.02
.01
.01
.65
ng
Apr.
0.02.06.14.01.02.10.09
0.02
00
.01
.02000
.10
.260
.05
.15
.07
.04
.11
.01
.02JU
.05
.06
.12
1.53
total .
May
0.01
00000
.01000000
.03
.01
.020
.050
.03
.06
.050
.031.801.02
.0700
.05
3.24
June
0.01000
.010
.14
.40
.04
.02
.03
.10
.06
.40
.30
.0100
.250
.030
.07
.02
.40
.300
.15
.390
3.13
July
0.21.75.36.19.93
0.30.01
00
.2900
.22000
.060
.0601.82001.50
.97
.22
.10
.05
.25
.40
8.69
Aug. Sept. Oct.
0.752.110
.58
.05
.020
.450
.801.00.29.07
1.55.15.02
00
.22o02.25
.39
.05
.80
.08
.03
.05
.11
.02
.02
- 11.86
Nov.
0.02.03.03.05.06.03.06.06.20.05.21.01
0.04.02
00
.03
.02
.10
.09
.07
.05
.04
.18
.08
.121.05
.01
.04
2.75
Dec.
0.01.01.01.07.20.37.20.42.82.01.30.08.12.07.02.01
0.13.27.09
0000
.02
.04
.11
.05
.01
.02
.01
3.47
501

Table 49. Daily rainfall, in inches, at Communication Center Cent i nued
1380
Day
123456789
10111213141516171819202122232k25262728293031
Total
Jan.
0.03.09.15
000.01
0.19
000.06
00.05
0000.01.01
0.04.10
00.01.13
00
0.88
Feb.
00.01.05
00.24.01.04
000.04.15
00.05
0.10
0002.251.63.47.49.20.15.02
5.90
Mar.
0.030000.01
000000.04
00.02.06.08.09.01.22
00.05.02.01
00.01
0.01
0.66
Apr.
0.03.10.02.01.01.18
0.03
0.05
0.06
00.10.03.01.32
000.19.01
0.02.03
00.04.04
1.28
May
000.01
0.05
0.69.04
00001.14.01.06
0.20
0.32.11.04.02
0.01.05
0.01.44
00
3.20
June
0.10.76
0.02.12.11.01.20
0.03.06.26.15.01
0.06.02
0.08.24.02.02.09.08
0.10.04.69.05.39
3.71
July
0.190.14
0.05.60.41.30.01.06.01
0.09.30.28.16.80.12.07
0.44.14.02.32.02
0000.03.01
4.57
Aug.
01.05.10.75.25.44.01
0.02.80
0.02.02.40.10.90.19.12.-20.25.15.25
2.302.00.06.17.25.05.02.01.11
10.99
Sept.
0.050.07.21.36
2.302.901.214.101.303.60.50.25
00.09.05.05.09
00.45.07.49.55
1.214.00.22.25
1.12
25.49
Oct.
1.30.02.56
00.14
1.401.94.01.24
0.15
0.08
0.01.04.20.04
0.16.10
0.15.05.75.01.01.03.05.60
8.04
Nov.
0.60.01.01.01.50.05.30.10.02.04.03.15.10.09.90.10.05.01.86.79.05.20
6.01000.20.07.0^.40
11.70
Dec.
0.10.10.05.15.01.01
000.05.02
00.10.50
00000.72
2.00.60.08.01.08.11.16.23.61
0
5.69
Total for 1980: 82.11 inches.
502

Table 49- Daily rainfall, in inches, at Communication Center Cent I nued
1981
Day
123456789
10111213141516171819202122232425262728293031
Total
Jan.
0.33j.j-
.20
.01
.06
.05
.06000.06.02
0.23.31
000.45.35
0.89.03.01.06.03.15.07.04.06
3.47
Feb.
0.12
0.02
000.11.90.65.01
0.02
000000000000000
1.83
Mar.
0.70.10.11.05.03.25.01.01.01
0.26
00.02
00000.05.01
0.10.16
000.25
000
2.12
Apr.
0.030.07.10
00.02
0.01.54.43
00.03
000.14
1.70.11.06.09.01.02.01
0000.05
3.42
May
00.02
0.08.02.04.05.74.25
1.45.19.02
0000.15.02
000.04.03.02
00.03
00.01
3.16
June
0.02.01.01
0.01
00.04
0.05
00.24
0.85.19.12.15.0?.02.01
00.03
0.13.20.05.11.15
2.40
July
0.01.10.16.05.04
0.05.30.12.10.08.47.42.66.63.14.10
2.00.03.22.29.08.02.02.05.32.02.03.43
2.781.30
11.02
Aug.
5.801.05.60.03.20.15.29
0.04.05.02.43.59
2.153.051.052.751.00.01.03.14.19.09.35.60
3.00.22.35
00.01
24.24
Sept.
0.010.02
0.19
000.02.01
0.05.07.36.19.04.44.85.04
0.12
0.06.05.55.25
1.00.76.01
0
5.09
Oct.
0.80
00.22.05
0.25.23.41.02.03.12.18.89.20.03.01.15.01.02.75
0.12.04.43.12.06
0.02
0
5.16
Nov.
0.10.25.05.15.49.06.01
00.18
0.08.11.09.70
2.31.17.04.02
1.200.21
02.33.01.01.24.09
0.06
8.96
Dec.
0.39.21.04
0.12
0000.01
0.03.33.69.06.02
3.10.01.20.05.08.02.28.02.02.05.02.10
0.10.01
5.96
* Included in following total.
Total for 1981: 76.83 inches.
503

Table 49. Daily rainfall, in inches, at Communication Center Cent inued
1982
Day
123456789
10111213141516171819202122232425262728293031
Total
Jan.
0.02.50.01.10.01.02.03.01.04
2.401.36.81.01
0.02.04.01
00.05.03
0.04.08.02
1.08.05.03.40.01
7.18
Feb.
0.70.21.01.01.02.11.10.10
00.01.01.11
0.13
0.23
000.05.05
0000.10.04
1.99
Mar.
0.4000.05
00.20
000.03
0.05
000.10.06
1.35.03.07
000.02.15.02.05.10
1.35.05
4.08
Apr.
0.02.01
000.07.15.05
000.01
0000.12
000.01.07.15
000.13
0.20.10
1.09
May
0.01
0.04.10
000.07.15
0.03.01.01.27.01.35.36
00.02
0000.10.03.02.11.04.02
1.75
June
00.15
0.02
0.14
0.11.03
0.01
000.03
000.03
0.40
2.80.24.05.14.77.30.14.52
5.88
July
00.42.25.10.01
0.07.01.40
00.01.39.31.07.23.05.01
1.0000.69.05
00.02
3.801.46.46.10
9.91
Aug.
0.21.05.21.07.01
001.20.01.13
0.09
0.65.03.71.16.05.07.25.02.05
4.10.13
0.01.08.02.10.01.03
8.45
Sept.
0.01.11.09.04.12
1.30.03.45.01.40
1.050.04.15.01
0.15.17
1.00.01.02
00000.02
0.65
0
5.83
Oct.
0.12
3.50.54.05
1.00.55.65.09.19
0.80.04.47.29
03.508.002.001.75.05.08.02
00.05.04
00.02
IX (0)
23.80
Nov.
0.10.25.12.39.05.05.10.20.10
0.03
0.05.02
0.02.03
00.03.40
0.02.02
0.05.08.07.02
2.20
Dec.
0.07.17.08
0.03.02
0.34.02.01.02
00.20.17.08
0.98
0.19.04.04.09
0.02.01.04.06.02
0.05
2.75
Total for 1982: 74.91 inches.
Not recorded by Communication Center personnel. Estimated.
504

Table 49. Daily rainfall, in inches, at Communication Center Cent i nued
1983
Day
123456789
10111213141516171819202122232425262728293031
Total
Jan.
0001.80.10
00.01.01
0.01.25.10
0.03
000.01
0.13.40.19
000.01
000.01
3.06
Feb.
0.10
0000000.01
00.01.13.28.01
00.57.03
000.01
0.75
0.01
1.91
Mar.
0.09000.01
00.32.09.02.27.14
00000.01
00.05
00.11
0.12
00.11.02.07
1.43
Apr.
0.12.05.05
0.03.09.02.01
00.06
0.01.17
0.02
0.38.60.01
00000.20.02.02.01.07
1.94
May
0.01.01.08.01
0.10.01.10.01.01
000.20.01.01.05.05.07
00.04.02.05.03.01.03.05.20.01
0
1.17
June
0.020000.05.01.09
0.02.01.03.10
0.15.60.02.02.01.05
0.03
0.04
00.02.02.03
0
1.32
Ju ly
0.15.01
0000.01.01.09.01.03.03.02.34.70.08.03.01.21.20.15.25.13.06.01.10.01.01.15.39.10
3.29
Aug.
0.15.40.10.11.02
02.602.47.10
1.40.49.06
0.10.44.60.10.06.57.04
0000.10.30
00.07.03
10.31
Sept.
0.12.54.03
0.10.23
0.03
00.17.10.01.57.05.30.20.02.47
1.10.05
0.15.06.20.50.04.03.17
5.24
Oct.
0.111.17.04.07.09.05
1.71.33.10.09.02.05.44
0.20.27.20.38.09.06
1.70.20
1.79.50.17.09.06.40.30.02.01
10.71
Nov.
0.2$.21.09.01.01.15.06
0.17
0.20.16.27.22.90.28.30.06.10
0.so
1.10.20.10.15.02.01.07.02.03
6.08
Dec.
0.101.600.03.40.37
0.10.03.02.08
0.01.05.10.27.48
0.03.01.22.35.12.01
0.07.02
00.05
0
4.52
Total for 1983: 50.98 inches.
505

Isley Field Rain Gage
(U.S. Geological Survey)
Location: Lat 15°07'33" N., long 145°43'00" E., at west side of covered
reservoir near Isley Field.
Period of record; March 1977 to December 1983.
: Eight-inch diameter rain can, continuous record of rainfall. Altitude
of gage is 200 ft (from topographic map).
Table 50. Monthly and annual rainfall, in inches, at Isley Field
Year
1977197819791980198119821983
MeanPercent
Jan.
»
0.481.41.13
3.075.891.28
2.043.4
Feb.
_
0.57.01
6.011.232.011.15
1.833.1
Mar.
2.16.39
1.53.53
1.752.851.57
1.542.6
Apr.
0.311.03.78.29
3.06.59.82
.981.6
May
2.52*
3.832.961.401.581.15
2.243.7
June
3.87*
2.052.251.734.49.23
2.444.1
Year
1977197819791980198119821983
MeanPercent
July
2.96(16.72)8.194.8915.639.671.80
7.1912.1
Aug.
3.75--
6.3112.2226.864.0410.06
10.5417.7
Sept.
21.418.1612.5826.975.144.205.33
11.9720.1
Oct.
*7.2611.167.336.75
23-558.76
10.8018.1
Nov.
(20.68)
2.417.479.751.934.67
5.258.8
Dec.
0.272.124.115.384.361.162.11
2.794.7
Annual
54.3776.4380.7361.9638.53
1X 59.61100
MIncluded in following total.
Total of monthly means.
506

Table 51- Daily ra i nfal1, in inches, at Isley Field
1977
Day
123456789
10111213141516171819202122232425262728293031
Total
Mar.
I/Ol/oI/O1 o
00.35.22
0000.10.31.16
0.10
0.02
0.32
00.38.16
00.04
000
2.16
Apr.
000000000.06.12
0000000000000.06.05.01.01
00
0.31
May
0000.06
0.01.01
00.28
000000000000.01
0.03
0.08
00.04
0.52
June
00000.39.30
0.71.23.10.08.28
00.06.52.12
0.06.08
0000****.94
3.87
July
0.010000000000000000000.66
0.04.04.94.02.06.76
0.42.01
2.96
Aug.
0.080.17.11
0000.12.90.12.04
0000.01.83.05.12
0***.52
00.35.14.19
0
3.75
Sept.
000.68
1.871.92*.89
00.02.56
4.963.304.63.61
1.09.48.12.02.10
0.01.01.01
000.03.10
21.41
Oct.
0.20.08
00.90.04
000.44
0.48.36.36.22.47.01.05
1.28.24
1.752.69*JU
*JU
*JU
*JU
*
*
Nov.
JU
J.
**
6.940.13.96.90.14.05.10.26.10
1.150000000000.38
0000
20.68
Dec.
0000000
000000000000000
0000
00
0
.11
.08
.08
.27
Rain gage established March 5? 1977.
* Included in following total.
- Estimated on basis of daily rainfall readings at Communication Center.
Total for March to December 1977: 55.93 inches.
507

Table 51. Daily rainfall, in inches, at Isley Field Continued
1978
Day
123456789
10111213141516171819202122232425262728293031
Total
Jan.
000000000.02.01.08.04.01
0.17.12
00000000000.02.01
0
0.48
Feb.
000.04
00.06
00000000.06.02
0000.02.36.01
0000
0.57
Mar.
00000.07.01
00000
JL
*
*
*
JL
*
*
*
.310000000000
0.39
Apr.
000******.86
000000000000.15.02
000000
1.03
May
0.0300000.06****
1.080000000000000*JL
**
**
JL
June
******a. f\
JL f\
***JL
*
*
JL
*
JL
*
*
*
*
JL
*
*
*
*
*
*
*
JL
*
July
*****
4.04000.41
000.55
1.044.14.02.18.13
2.36.32.20.07
00001.08.60.28.13
16.72
Aug.
0.46.01.08
001.461.211.73
-(12.00)._
^(3.02)****.10.80
0***JL
*
*
*
JL
*
*
*
10.7
--
Sept.
J/J.15-'.05000.72.05.05.02
0.02
0.31
0.10.04.35.23.07.38
0.08.44.22.29
1.542.88.01
0.16
8.16
Oct.
0.08.42.32.24.77.80.47.36.16.01
0.04.02.29.58.48.02
0000.02.31
0.41
0.02.22.23.49.50
7.26
Nov. Dec.
0.38 0.295.70 .07
.1300000000.07
0.16.18.08
000000.12
- «**
-. -. i*JL
_ _ *
"" 4/ *-1.02
2.12
* Included in following total.
Estimated on basis of daily rainfall readings at Communication Center.2/ Can overflowed. Rainfall recorded from midnight to 1700 hours only.
- Recorder reset. Rainfall recorded from 1000 to midnight only.4/- Estimated on basis of rainfall of 1.12 inches for period Dec. 24, 1978 to Jan. 6, 1979.
508

Table 51. Daily rainfall, in inches, at Isley Fi e1d--Cont inued
1979
Day
123456789
10111213141516171819202122232425262728293031
Tota
Jan.
JL
*
*
J.
A
-1/0.1000.60.20.08.06.02
0000000000.35
000000
1 1.41
Feb.
0.01000000000000000000000000000
0.01
Mar.
000.08.01.36.32.06
0.22
0.48
0000000000000000000
1.53
Apr.
0.0200.01
0.13.01.06
0000***j.j.***j.*j.j.*&j.
.5500
0.78
May
00.11
0.11
0.04.13.10
00000000.14.01.01
0.01.48
0.94
1.26.44
000.05
3.83
June
000.08
0.12.14.07
00.24.08.19.13.49
00.06
00.01
0.06.22.06
000.10
0
2.05
July
0.04.17.12
1.14.38
000000000.01
0.20
0o-.02.92.13
01.68.61
1.57.13.07.31.13.56
8.19
Aug.
0.53.08.50.08.02.04.02
1.27.12.01.16
000.04.19
1.66.02.08
0000***j.*j.*
1.49
6.31
Sept.
0.80.02.01
000.11.12.16.25.79.25.11
0.71.10.46.17.72.18.20
3.28.07.01.01.10.59.30
1.731.33
12.58
Oct.
0.221.34.53.07
00.22.02*j.
1.290.16
1.18.02.23
0.02
0003.62.05
1.13.16.19.07.54
00.10
11.16
Nov.
0.05.04.01.01.01.08.26.01.01.07
0000.01
000.10
0.02.24.04.16.04.17
1.06.02
00
2.41
Dec.
.1.j.j.JU
J-.
*
J,
1.51.36
0.28.44.16.01
000.07.64.19
00000.14
0.16.14.01
0
4.11
Included in followin total.
Estimated on basis of rainfall of 1.12 inches for period Dec. 24, 1978 to Jan. 6, 1979.
Total for 1979: 54.37 inches.
509

o0)ZJc4-1coo1-o, 0)
U_0)
V)
4-1CD,.V
)0)ucc
1 0) M
-cCDV-
>^
t CD0
CD
CO^
'
.i ur\<UJD
CD
1
,OQ
B
O.4-1Uo
4-1
CL
0)to.en«
-£^ ->0)c-5>
-
^
.uCL
<£ v-
rSI.0)
u_.c0)-5(0 Q
C\J
QO
f\j
\jT\
C**4 C
3
OJ
CZ*
CD
C
D
CD
C
D
CD
CD
C
O «
C
O
«
T i
' CD
CD
C
D
CD
CM
vD
'
«
CO
<
NC
O
CM
C
D
CD
C
O -3
- -3
-
CD
C
D
CM
«
CM
' vD
CO
-^1"
CF\ in
0
»-
ro_
3- -3- C
O -3-
CD
C
D
CM
CM
CM
CD
CD
CD
CO
CO
CD
1 _*
CD
CM
COin-3-
CD
CTi
CM
CDCM
CD
CM
!"-» C
D
CM
CO
CO
CD
C
D vO
C
D
CD
C
D
CD
C
D
CD
« -3- in
en CM vo
CD
C
D
CD
C
M
CD
C
D
CO
CD a
*
T
-3-
CD
»
C
D
CD
<v>
C
D
CD
*
CM
CD
C
D
CD
CM
-3
- r r-
CD
t^>
r
CD
C
D
CD
C
D
CD
C
Df
i
C
D
CD
C
D
CD
C
D
CD
CD
CD
CD
CD
CD
CD
CD
CD
CD
-3
-
CD
CD
C
D
CD
C
D
CD
C
D
. r-
r
CD
CD
C
D
CD
C
D
CD
C
D
-
CM ro
^-
LA
VD
r-.C
O
CD
CD
CD
CD
CD
CD
CD
cn
r~CM*
rr\C
M
CD
CD
CD
CD
CD
CD
CD
CD
,^CD
CD
CD
CMC
D
CD
CD
-
r-,
C^O
VD
o -3- vr> o
-3"CD
u
nin
ro
\£> »
»
CD c^
CD
CD
C
DC
DC
DC
DC
D
r-
CD
in-3
- cD
uncM
vo-3
-cM
rou^cD
C
OC
DC
DC
DC
D
LA
CD
CD
LncM
CD
' <
v>
CD
»
CM
CD
i
CO
C
D
CD
C
D
CM
C
O «
CM
C
O -3
" »
*
CM
*
OO
o
r^o
»-C
D*-C
Dr«
^
CD
CD
CD
C
D
CD
C
D
CD
C
D
CD
ro
CM un rr\\£
j -3* » \o
-3" oo oo in
r^~ CD ro
(V>
*
CD
CD
OOCO
^-=1"
^
<v>
v£
) rr\
CMrr\
CO
CM
C
D
CT» CM
*
CD
r i C
MC
MC
DrO
' -^r^
vvX
)
CD
C
D
CD
CM
CM
0
CD CM
<
NvD
r^r^r^co -v
O
vO o
-
CM
CM
r^r^.C
M-yC
O-a-C
DC
M'
CD
»~
CD
CD
r vO
C
D
CD
C
D
vO
-d-C
M-3
-vO
*--3
-vO
' .
_^-
in-3
-CD
-3-v
O*-C
D<
v>
' »
r
CD
C
D
CD
C
D
CD
C
D
CD
CM oo oo oo in
* -^- CM r»«. CM
CD
CD
O
CD
rO
CD
C
DC
DC
OC
D
CD
CD
CD
CD
CD
CD
C
DC
D
r^» cr» cr» r*^
r*^ CM
« CD
vo oof~> -^-
*"^ ^ " *"~
< f^> ^j*
f^> ^j~
CD
C
D
CD
CD
CD
CD
CD
C
D
CM
r-.0
0
*
CD
CD
CD
CD
CD
CD
CD
CD
CD
O
CD
CD
OO
OO
vo *~ cr»
» -d"
^-
CD
«
CD
CD
C
DC
DC
D
CD
CD
C
DC
DC
D
OC
DC
DC
D
vO
vO
r>-v
O<
Nrr\c
MC
MC
MC
DvO
C
D
CD
C
DC
M»
U
TN
r^C
DC
MvO
CD
CD
C
DC
D
CD
C
DC
D
CO
r-
CD
CD
CD
CD
OO
OO
OO
OC
DO
CD
C
DC
DC
DC
D
^~
OCD
CM'
CD
CD
CD
CD
rr\
^.
CD
CD
CD
CD
rr\
CO
rC.
r^»a\
vOCMCMCM
CM' O^
CO
^tnCMCM
vOcnCM
OA
CM
CD
r**\inoT
-
CD
VO
COi
CDCD
4-1O
h-
CD
in
(/)0)_coc C
O-3
-*
r^...C
DC
O._v_0ro4-1
O
h-

Table 51. Daily rainfall, in inches, at Isley Field Continued
1981
Day
123456789
10111213141516171819202122232425262728293031
Total
Jan.
0.47.01
00.04.22
000.06.42
0.02.23.01
0000.44
01.040000.05.06
00
3.07
Feb.
0000000.30.48.10
00000000000000000.35
1.23
Mar.
0.060.19.02.14.07
00.08
0.41
0.10.01
000000.01
0.08.04
0.10.24.02
0.05.13
1.75
Apr.
0.11.08
00000.07.06.36
0.14.16
00.11
1.50.34.05.07
0.01
0000000
3.06
May
0000.18.04.04.13.07.35.04.02.08
000.04.04.14
00000.04
0.11
0.06
0.02
1.40
June
0.02
0000.14
0.04.12
0.01
00.50.29.04
0. 0000.10.04.04
0.01
0.38
0
1.73
July
0.77.02
0.10.14.38.01
00.06.02.20.56
1.140.01.36.17.50
1.06001.07.08.30.01.04
1.38.73
2.424.10
15.63
Aug.
2.16.94.01.22.02.12
0.10.13.04.18.41
7.30*J.*
8.00.37
0.06.49.01
0.01
3.281.42.13
1.30.01.10.05
26.86
Sept.
0000000.02.06
00.18.32.08.04.01
1.380.01.06.07.01
01.38.38
1.12.02
000
5.14
Oct.
0.28.04
000.08.06.22.19.67
0.24.04
1.10.05
1.24.60.20.01
0.12.50.01
0.01.24.31.04
0
^.5
6.75
Nov.
*-;>*********
1.04.05.17
2.46.04.58.01.67.42.89
0.52
2.34000.05.02.49
9.75
Dec.
0.11.05.0*
000.01
0.20
00.25.18.68
001.76.01.41.12.02.04.05
0.17.08.18
0000
4.36
* Included in following total.
Est imated.
Total for 1981: 80.73 inches.
511

Table 51. Daily rainfall, in inches, at Isley Field--Continued
1982
Day
123A56789
10111213141516171819202122232425262728293031
Total
Jan.
0.06.10.04.05
0.02
001.78.41.66.05
0.17.12.13
00.01
000.01.07.76.74.67.04
00
5.89
Feb.
0.52000.04.22.02.06
0.04
0.19.24.05.01.12
00000000000.50
2.01
Mar.
0.08.05.05.08
00.41.01.07
00.06.10
000.18
0.56.10
000.05.14
0.02.12.25.52
0
2.85
Apr.
0.040.11
0.02.28*******.12
00.02
00000000oo 1'000
0.59
May
000.05
0.23.04.02
0.12.10
00****A
*
*
*
*
*
*
*j.
1 .000.02
0
1.58
June
0.01.01
000000.01
000000000000.54
2.50.10.20.42.44.01
0.25
4.49
July
0.080.01.01.18.01
0.01.01
0000.20.13.12.10.12
0.06.82.74.67.06.01.12
2.272.261.20.01.47
9.67
Aug.
0.04.20.23.01.01
001.160.19
0.02.01.42.54'
.0100.34.17
0.01.62
0.02.01
00.01
0.02
4.04
Sept.
0.64.02*.19***
1.81.20.40.19.01.12
00.07
0.46.04.05
0000000000
4.20
Oct.
0.121.221.13.07.12
1.06.62
1.2501.86.13.50.24.11.01
09.32*
5.73.05
0.01
000000000
23.55
Nov.
0.010.19.25.23.19.07.19
000.04.03.04.13
0.07
000.12.26
00000.06
00
1.93
Dec.
0.09.13.13
000.02.02
00000.06.06
00.04
0.20
0.12.04.02.04.04.11.04
000
1.16
* Included in following total.
Estimated on basis of daily rainfall at 9~Mgal reservoir and Communication Center.
Total for 1982: 61.96 inches.
512

Table 51. Daily rainfall, in inches, at Isley Field--Continued
1983
Day
123456789
10111213141516171819202122232425262728293031
Total
Jan.
000.01.12
000000.04
00000000.44
0.67
00000000
1.28
Feb.
0.02.01
0000000xj**
*
*
*
*
.240.07.01
00000.78
0.02
1.15
Mar.
0.1400000.53.12.11.01.60.06
0000000000000000000
1.57
Apr.
00000.01
0.04.06
0000.04
000.53
0000000.07
0.07
00
0.82
May
0.04
00.04.11.10.01
00000.18
00.07
00.24.01.05
00.07
0000.22.01
1.15
June
00000.05
0000000.11
000*JL
*
J.
.040.01
00000.02
0.23
July
0.070000000000.02.02.26.02.11
00.32.08.40
0.01.30.02.04
00.12.01
0
1.80
Aug.
0.01.19
00.02
1.60.25
3.73.22
1.42.04.86.11
0******* k**1.4900.12
00
10.06
Sept.
0.12.01
0.12.08
00000.14.07.73
1.44.26.18.11.06.11
J.
J.
*
*
*
*
*
*
J.
-1.9
5.33
Oct.
J.
J.
J.
J,
-1.0.52.32.02
0.71.01.78.06.02
0.12.36.22.04.61.31.48.07
1.32.79
0.36.41.13.02.08
8.76
Nov.
0.60.25
0.01
0.65.01
000.10.16.08.72.17.04.01.01
001.16.16.22.01.07
00.24
00
4.67
Dec.
0.06.01
0.12.01
0000.01.11
000.62.26
000.24.01.01.07.20.31.07
00000
2.11
" Included in following total.
Estimated on basis of rainfall at 9~Mga1 reservoir and Communication Center.
Total for 1983: 38.93 inches.
513

Rain Gage at 9-Mgal Reservoir
(U.S. Geological Survey)
Location: Lat 15°13'29" N., long 145°44'28" E., on south rim of the
9 million gallon reservoir at Tanapag.
Period of record; March 1977 to December 1983.
Gagei Eight-inch diameter rain can, continuous record of rainfall.
Altitude of gage is 60 ft (from topographic map).
Table 52. Monthly and annual rainfall, in inches, at 9-Mgal reservoir
Year
1977197819791980198119821983
MeanPercent
Jan.
>»
0.312.06.34
2.158.49.86
2.373.4
Feb.
..0.961.256.861.742.52.90
2.373.4
Mar.
1.51.35
1.74.98
1.543.481.62
1.602.3
Apr.
1.441.731.97.83
4.551.371.14
1.862.7
May
0.74*
5.053.862.511.89.91
2.493.5
June
1.85*
2.672.871.798.47.53
3.034.4
Year
1977197819791980198119821983
MeanPercent
July
3.84(26.18)
7.565.3615.3811.362.79
7.7211.1
Aug.
4.78__
9.498.15
23.605.1510.15
10.2214.7
Sept.
22.099.75
23.876.755.666.27
12.4017.9
Oct.
*8.43
8.907.20
24.2910.74
11.9117.2
Nov.
(24.45)27.363.1312.528.282.315.02
9.7714.1
Dec.
0.273.245.662.096.943.593.83
3.665.3
Annual
..--__
76.5682.4378.5844.76
-769.40100
Included in following total.
Total of monthly means.
514

Table 53. Daily rainfall, in inches, at 9-Hqal reservoir
1977
Day
123456789
10111213141516171819202122232425262728293031
Total
Mar.
I/O-,Q
I/O
00.02.04.17
000.01.04.18
0.03
0.07
0.28.19
0.34.02
00.12
000
1.51
Apr.
0.14.07.48
0000.20.38
0000000.08
0.05
0000000.04
00
1.44
May
0.010.04.02.01.02
000.01.08
0000 '
0000.46
00000.06.02
0.01
00
0.74
June
0000.10.65.12
0000.10.07
0*JU
***.31
000.07
00000.43
1.85
July
0.19.06
0.05
00.14
00.14
00.03
00000.01.06
00.71.22
0.13.18
1.080.84
0
3.84
Aug.
0.100.61
00000.82
0.01
000.04
00.30.46
0000.36
1.720.01.13.04.14.04
4.78
Sept.
0.08.76.01.22
1.131.01*1.420001.126.64
T/4-gJj
I7 ! 7000000000000000
22.09
Oct.
0000.07.04
0001.62.10.58.56.35.46.30.10.35
1.20.48
1.681.64*JU
***JU
JU
**
JU f\
Nov.
*JU
**
9.500.47.85
1.10.31.22
0.35.26
1.810.05
0000000000000
24.45
Dec.
0000000
0000000000000000
00
00
0
.17
.02
.04
.04
.27
Rain gage established March 5> 1977.
Estimated on basis of daily rainfall readings at Communication Center and Isley Field.
* Included in following total.
Total for March to December 1977: 60.97 inches.
515

Table 53 Daily rainfall, in inches, at 9~Mqal reservoir Continued
1978
Day
123456789
10111213141516171819202122232425262728293031
Total
Jan.
00000000000.07
000.02.14
000000000000.08
0
0.31
* IncludedI/ c < .
Feb.
000.02.05.10.11.07
0000000.07.10
0.02
00.04.37
0.01
000
0.96
in fol1 U_
Mar.
0000000000000000.24.11
0000000000000
0.35
1 owing-. : -. ~£
Apr.
000******
1.600000000000.04
0.01.01.01
0.01.02.01.02
1.73
total ..
May
0.01000000*.43.10
0.32
00000000000********
*
June
******************************
*
t
July
*****
11.96.23
00.29
00.10
1.632.343.00.26.50.78.42.86.48.05.05.10
00.01.54
1.26.46
26.18
. _ A. ^
Aug.
0.0200.16.02.24.84
1.002.2015.00
- ( 12.8)^(14.9)
000001.51.07.60.71.13
1.51.01.04.16
02.46
m
Sept.
!/ 15I'.OS00.17.28
0.17.18.18.26.04.02
0.18
0.13.46.14.12.07.14.52.40.50
1.094.32.07
0.11
9.75
Oct.
0.47.85.10.08.32.98.45.29.35.29.04.06.06.08.98
0.06
0000.01.08.28.30.05
01.18.19.53.35
8.43
Nov.
0.537.45
1/11.240.17
0000.01
00.07.24.50
00.32.77.36.31
0.12
0.02
0.44
3.601.210
27.36
Dec.
0.61.14.8300000.04.05
.05
.07.01.11.02.160
.01000********JL
4/1.14
3.24
2/ Can overflowed. Rainfall record missing one hour (0930 - 1030).
Rainfall for Aug. 11 and 12 estimated at 12.8 and 14.9 inches using curves based on flowof Middle Fork Talofofo Stream (written communication Huxel); recorded rainfall on Aug. 11 from midnight to 0330, 1.64 inches and on Aug. 12 from 0900 to midnight, 5-28 inches.
4/ Rainfall for period Dec. 22, 1978 to Jan. 6, 1979 was 1.24 inches.
516

Table 53. Daily rainfall, in inches, at 9-Mqal reservoir Continued
1979
Day
123456789
10111213141516171819202122232425262728293031
Total
Jan.
****
1/0.1*000.90.30.19.05
0.02
0.01.01
0000.16
0.20.02
0000.10
2.06
Feb.
0.22.17.03
00.07.23
00.34
0000.10.07.02
00000000000
1.25
Mar.
000.14.13.18.59.05.01
0.01.83
0000000000000000000
1.74
Apr.
0.31.01.06.04.02.42.26
0000000.01
00**********.84
00
1.97
May
0.1200.01.06
0.13.06.05
000000000.05
00.13.01.01
2.121.141.15.01
000
5.05
June
0000.06.04.14.01.10.01.06.10.05.01.16
0.07.04
0000.16.85.58.02
0.07.14
0
2.67
July
0.29.28.16.77.13
0.04
0000.04
000.01.77.02.04.08.04.23
01.85.37.43.35.39.62.49.16
7.56
Aug.
0.121.02.20.11
0.47.07
2.29.23
0.22.01.01
00.28
1.15.41.29.02
00.07.34******
2.18
9.49
Sept.
2.81.20.01.34
00.25.02.06
1.27.06.36.10.01.14.11.02.14.23.12.06
1.1300.19.26
1.20***
Oct. Nov.
* ** ** ** ** ** 1/0.2* 0* .17* .01* .10* .01* .01
8.74 0.04.06.01.11
0.13.14.11.30.04.22.05.31
1.06.05
00
3.13
Dec.
000.11.80**.90
1.24.01.20.28.41.02.11.02
0.14.24.06
0000.07.11.36.32.16
0.10
5.66
* Included in following total.
Estimated on basis of daily rainfall readings at Communication Center.
Total for January to August 1979: 31.79 inches.
517

Table 53« Daily rainfall, in inches, at 9-Mgal reservoir Continued
1980
Day
123456789
10111213141516171819202122232425262728293031
Total
Jan.
0.05.04
0000000000.01
0000000000.04.14
00.06
000
0.34
Feb.
0.02.05
00.05'.01
.05000.01.10.04.03
0.02.06.25.10
0.05
3.83.16.95.47.50.11
0
6.86
Mar.
000000000000.04.10
0.20.10.08.02.12.04
000.26
00000.02
0.98
Apr.
0.01
000.07
0.06
00.13
0000.13
0.25
0 .0.01.17
00000000
0.83
May
00.01.04
00.58.07
0000.06.34.01.46.08
0.14.24.04.05.01.21.07.29
0.01
01.14.01
3.86
June
1.01.01.02
000.32.01
00.01.13
0000.01
0.02.04.01.11.08.01
0.43.11.40.04.10
2.87
July
0.05.28.01.54.56.07.11
0.19.05.10
1.03.44
0.67.22.16.01.43.13.01.06.05
0.05
0000.14
5.36
Aug.
0.01.14.89.01
0.02
00.01.04.10
0.14.12.02.34.67.06.30.55.28
1.582.18.23.16.05.01.14.02
0.08
8.15
Sept.
0.17.02.01.14
3.382.091.092.48
I/2 ' 961/4.0T/° 0I/O
0.04.22.04
0.10.01.59.17.04.44.32
1.382.53.23.40
1.02
23.87
Oct.
0.42.82.17.14.01
1.623.12.01.18.17
00.12.01
00.01
0.17.19.06.05.38.01.22.01.11
00.78.12
8.90
Nov.
0.6100.73.18.06.02.19
0.01.24.22.04.31.38.24.01.72
1.12.04.01.31
6.38000***
I/. 7
12.52
Dec.
*****************
1/1.10.01.24.53.06
0.01
00000.14
2.09
* Included in following total.
Estimated on basis of daily rainfall readings for Communication Center and Isley Field.
Total for 1980: 76.63 inches.
518

Table 53. Daily rainfall, in inches, at 9-Hqal reservoir--Continued
1981
Day
123456789
10111213141516171819202122232425262728293031
Total
Jan.
0.01.02
0.17
0.01
0000000.26.2k
00.01
0.19.41
0.66.01*****.16
0
2.15
Feb.
0.08.10
00000.12.61.30.10
000000.23
000000000.20
1.74
Mar.
0.02.16.41.37
0000.13.01.02.05
000000000.28.06
00.02.01
000
1.54
Apr.
0.01.01.41.01
0000.41.41.58.01.01.43
00.38
1.40.37.01.10
000000000
4.55
May
0000.04.19.07.12.65
1.16.14.04
0000.02
00.04
000000.01.01
00.02
2.51
June
0.14
0000000********
1.13000.08.20.16.02.04.02
000
1.79
July
0.311.01.04.04.23.71**it*
*
*
**
it
if***
3.03.56.07.55
1.36.01.02.04
0.68
2.803.92
15.38
Aug.
3.881.48.05.07.06.14.04.01.01
0.34
1.092.681.90**
4.10.41
0.08.14
0003.702.81.19.40
0.01.01
23.60
Sept.
0.22
00000.04.02.17.18.13.56.30.04
1.31.10
0.14.30.13.08.06.20.55
2.02.07.02.11
0
6.75
Oct.
0.41.04
00000.16.07.26
0.25.28.98.20
1.501.02.17.02.02.02.58.04
0.24.12.30.01
0.01.50
7.20
Nov.
0.16.02.06.40.10.04.19.01.05.12
0000
itit**
I's.s.01
00.64
1.4500.56.38.01.58
8.28
Dec.
0.13.14.01
00.01.04.11.02.05.01.44.31.55.06.30
3.020.44.05.40.23.14
0.04.28.04
0.12
00
6.94
* Included in following total.
Roof blown off by typhoon.
Total for 1981: 82.43 inches.
519

Table 53. Daily rainfall, In inches, at 9-Mqal reservoir Continued
1982
Day
123456789
10111213141516171819202122232k25262728293031
Total
Jan.
0.10.31.10.10.01
0.04
002.38.47
1.650.01
01.07.37.01
0.02.04.01
0.04.13.37.88.32.01
0.05
8.49
Feb.
0.48.08
0.02.12.12.13.26.01.06.02.06.16
0.02.24.01
000.18
000000.55
2.52
Mar.
0.08.20.16
000.14
0.01
0.01.01.04.06.05.06.08
0.62.04.01.01
0.08.04.01.02.05.91.79
0
3.48
Apr.
0.01.01.08.10.25.05.16
0.01.11.02
00.01.01
0.01
00.01.02.12
0.02.13
000.24
1.37
May
000.16.02.16.02.04.02.23.11.06
0.05.17.06.62.06
000000000.06
0.04.01
1.89
June
0.02.01
0.06.05*******.24
0000.07.01.18
1.803.52.10.54.64.18.08.01.96
8.47
July
0.010.22.12.02.01
00.10.01.01.12.49.04.58.08.04.08
0.02.56.25.84.20.01
01.401.652.991.08.43
11.36
Aug.
0.06.31.35
0000.79.02.37
0.10.05.31.26.04.12.01.17.07
0.01
1.9800.02
0.04.02
0.05
5.15
Sept.
0.100.23.02.10
1.19.19.26.76.14.01
0.12.25
0.19.08
1.14.19.07.01
000000.60.01
0
5.66
Oct.
0.052.461.55.65.16.70.07.34.02
2.95.62.28.76.22.01.02
8.66*
4.31.20.13.11.62
00000000
24.29
Nov.
00.01.37.30.05.06.05.02
00.01.13
000.10
000.38.28
0.31.06
00.06
0.12
2.31
Dec.
0.12.14.07
0.05
0.30.02.01.02.05.02.02.30.99.02.19.40.04.48
0.20.01
000.12
0.02
00
3.59
* Included in following total.
Total for 1982: 78.58 inches.
520

Table 53. Daily rainfall, in inches, at 9-Mqal reservoir--Continued
1983
Day
123456789
10111213141516171819202122232425262728293031
Total
Jan.
000.05.01
000.02.02.01.22.04
0000.01.02
0.19
0.17.05
0.05
00000
0.86
Feb.
0.02.02.01
000000
j.*j.*JL
*
J.
.200.12.03
0000.02.36
0.12
0.90
Mar.
0.2200.02
0.22.50
0.17.01.40.04
00000000000.02.01
00000.01
1.62
Apr.
0.0600000000.04
000.13
00.06.47.01
0000.05
0.30.01
00.01
1.14
May
0.080.01.02
0.16.05
0.08
00.01
0.12
0.01.06
0.01.01
00.10
0.02
0.02
00.14.01
0.91
June
0000000000000.01
0.30
0.05.01
0.04.04.02
0000.02
0.04
0.53
July
0.1300000.02.01
0.02.02.19
0.05.11.12.12
0.25.05.46.29.22.34.01
00.13.25
00
2.79
Aug.
0.11.10.06.07
02.34.20
2.89.43
1.96.34.11.01
0.80.12.04
0.28.02
000000.05.20.02
0
10.15
Sept.
0.14.20
00.43
0.71.10
000.14.05
0.54.07.22.16.40.20
1.56.04.06.06.02.30.47.01.38.01
6.27
Oct.
1.18.04.06j..25.60.52.55.19.04.06.30.22
0.24.07.54.28.08.53
1.52..88.02.66.46.11.08.55.02.06.13
10.74
Nov.
0.31.16
00.07.38.02
0.02
0.28.08.16
1.02.23.04.46.11.01
01.13.04.06
0.07
0.12.22.02.01
5.02
Dec.
0.44.04.01.43.01
0.04.02.25.01.13
00.06.89.19
0.08.02.73.04.11.07.06.18.01
00000
3.83
* Included in following total.
Total for 1983: 44.76 inches.
521

Streamflow records
Gaging stations
Table 54. Streamflow records for South Fork Talufofo Stream (1680100)
Location; Lat 15°12'48" N., long l45°46'17" E., on left bank 0.4 mi upstream
from confluence with Middle and North Forks, 1.4 mi south of
Ogso Dogas, and 2.2 mi southeast of Tanapag.2 2
Dra inaqe area; 0.64 mi . Area at site used prior to Mar. 31, 1971, 0.73 mi .
Period of record; October 1968 to September 1983. Low-flow records not
equivalent prior to Mar. 31j 1971, due to undetermined amount of underflow
between sites.
Gage; Water-stage recorder. Concrete control since Mar. 31, 1971. Altitude
of gage is 60 ft, from topographic map. Prior to Mar. 31, 1971, at site
0.2 mi downstream at different datum.
Remarks; Records fair. No diversion above station. Water-quality analysis is
given in table 58.
Average discharge: 12 years (water years, 1972-83), 1.40 fWs, 1,010 acre-ft/yr,
Extremes for period of record; Maximum discharge, 4,100 ft^/s, Aug. 4, 1976,
gage height, 8.15 ft, from rating curve extended above 55 ft /s on basis
of slope-area measurements at gage heights 7-30 and 8.15 ft; no flow
at times prior to Mar. 31, 1971, at site then in use, and at present
site, July 16, 17, 19, 20, 1977.
A. Discharge measurements, in cubic feet per second, made prior to beginning of continuous discharge record
Date Discharge Date Discharge
Feb. 13, 1968 0.10 May 31, 1968 0.08Mar. 27, 1968 0 July 24, 1968 17May 3, 1968 .10 Aug. 30, 1968 7-7
522

Table 54. Streamflow records for South Fork Talufofo Stream--Continued
B. Annual maximum discharge (*) and peak discharges above base (250 ff/s)
(Discharge in cubic feet per second, gage height in feet)
Date
Oct. 23Nov. 2,Nov. 19
Oct. 16Sept. 1
May 7,July 20Sept. 6
July 23Aug. 4,Aug. 6,Aug. 10
Oct. 2,
May 4,July 3,
Nov. 3,Aug. 12Aug. 18
, 19681968
, 1968
, 1969, 1970
1971, 1971, 1971
, 197219721972
, 1972
1972
19741974
1974, 1975, 1975
Sept. 17, 1975
Oct. 29Aug. 4,
, 19751976
Sept. 24, 1976
Time
a0330a12001400
17301830
130009002030
a0300130002001500
2230
03001800
1300093005000800
09300400
a0600
Dis charge
a300a1,000*1,230
*664272
*530344308
*924454575595
*170
*378278
*480386378254
296*4,100a1,500
Gage he ight
1/8
7
75
443
1/5444
3
43
4443
38
.14
.18
.22
.10
.52
.08
.96
.24
.36
.61
.65
.45
.17
.86
.42
.19
.17
.78
.92
.15--
Date
Sept
Aug.Aug.Aug.
Nov.Nov.Sept
Oct.SeptSeptSept
Nov.Aug.Aug.
Nov.Aug.
Oct.
. 13
10,12,29,
2,3,
. 30
14,. 5,. 9,. 10
23,1,16,
15,23,
17,
, 1977
197819781978
19781978, 1979
197919801980
, 1980
198019811981
19811982
1982
Time
1230
123011300130
053004002200
0730200003301630
053007301000
14300630
0830
Dis charge
*304
1,640*2,7201,220
*1,270736255
396308
*468331
*1,940472408
416*620
*620
Gageheight
4.23
6.377.305.90
5.965.213.98
4.484.194.674.27
6.654.684.52
4.545.00
5.00
a About.
From floodmark in well.
523

Table 54. Stream-Mow records for South Fork Talufofo Stream Continued
C. Annual minimum discharge, in cubic feet per second
Water year Date Discharge
1969 - - 1970 -19711972 1973 -
1Q7S1976 -1O77 ________ 1 J 1 11978 1979 - 1980 1981 1982 9 3
Most of the time --- ------Many days -------------------- Jan. 4, 29, Feb. 1-8, 1971 May 13, 15-17, 1972 Many days in June, July 1973 - Several days in March 1974 --- June 6-19, 21-23, 1975 A r> > *)£\ 07 1Q7£ ____________r\pr. zo , // , i"/o ------------ July 16, 17, 19, 20, 1977 - May 18, 19, 1978 lnl\/ 17 1Q7Q ________________JU 1 y 1 / , ij/j
July 1, 2, 4, 5, 1980 May 30, June 14, 1981 June 14-20, 1982 Many days in June-August, 1983
1X 01X 0i/S
.05
.01
.01
.01
.06 0 .01 .03 .02 .01 .04 .01
At lower site. Record not equivalent due to underflow between upper and lower site.
524

Tabl
e 54.
Stre
amfl
ow records
for
South
Fork
Ta
lufo
fo St
ream
Con
tinu
ed
Year
1968
1969
1970
1971
1972
1973
1974
1975
Calendar
year
Tota
l
Mean
Max.
Mi
n.
Tota
l
Mean
Max.
Min.
Total
Mean
Max.
Min.
Total
Mean
Max.
Min.
Total
Mean
Max.
Min.
Total
Mean
Max.
Min.
Total
Mean
Max.
Min.
Total
Mean
Max.
Min.
227.
83 .62
127 0
231.
30 .63
17 0
560.21
1.53
22 0
460.
761.
2683
.06
91.44
.25
9-3 .01
456.
921.25
44.01
509.
251.
4043
.01
Jan.
12.50
.40
.60
.25
59.3
5
1.91
13.7
6
5.58 .18
.96
0 8.12 .26
.78
.16
6.41 .21
.28
.17
4.55 .15
.76
-07
8.39 .27
.54
.17
D.
Feb.
4.89 .17
.30
.14
40.63
1.45
6.8 .55
33.7
4
1.21
17 0 3.29 .11
.16
.09
3.86 .14
.22
.10
2.10 .075
.21
.02
13.39
.48
2.9 .21
Monthly
and
annu
al discharges,
in cu
bic
feet
per
Mar. .84
.027
.16
0 10.62
.34
.72
.10
65.32
2.11
9.5 .25
4.21 .14
.25
.08
2.74 .088
.14
.06
2.57 .083
.28
.01
5.43 .18
.72
.11
Apr.
0 0 0 0
.95
.032
.32
0 35.52
1.18
11.40
3-09 .10
.29
.08
1.95 .065
.10
.05
7.01 .23
4.4 .02
3.30 .11
.25
.08
May
0 .0 0 0
.04
.
.001
.04
0
105.
94
3.42
22.6
2
2.89 .093
.20
.06
1.37 .044
.14
.02
40.7
5
1.31
26.15
3.15 .10
.23
.03
June
0 0 0 0 1.44 .048
1.0
0 13.50
.45
.96
.29
3.98 .13
.32
.07
1.01 .034
.23
.01
6.74 .22
1.2 .11
1.22 .041
.19
.01
July .18
.006
.13
0 1.96 .063
.96
0 66.9
3
2.16
17.26
71.75
2.31
20.11
2.60 .084
.25
.01
49.5
2
1.60
18.28
63.53
2.05
14.06
Aug. 0 0 0 0 45.90
1.48
8.6
0 73.22
2.36
11.78
223.30
7.20
83.9
0
6.74 .22
.81
.04
81.8
7
2.64
12.2
1
199.
7
6.44
431.6
second
Sept.
.38
.013
.38
0 37.35
1.25
17.12
64.1
7
2.14
12.6
8
44.57
1.49
5.0 .68
22.7
8
.76
3.7 .17
52.8
9
1.76
12.6
4
92.5
4
3.08
33.6
7
Oct.
107.
7 3-47
50 1.0
169.
605.47
127 0 14.20
.46
2.0 .05
57.45
1.85
9.6 .90
55.31
1.78
6.5 .72
24.4
1.7
99.
3 .19
77-76
2.51
17.6
7
53-00
1.71
14.7
2
Nov.
328.7
11.0
10
0 2.5
8.54 .28
.70
0 12.62
.42
1.7 .18
27.86
.93
2.9 .56
29.32
.98
4.3 .45
14.55
.49
2.9 .17
115.59
3.85
44.7
2
43.22
1.44
4.5 .80
Dec.
37.60
1.21
2.
5 .70
30.90
1.00
9.2
0 6.24 .20
.70
.01
10.98
.35
.56
.23
10.9
3.3
5.4
5.2
5
3.02 .097
.19
.06
15.57
.50
.72
.36
22.38
.72
2.0 .44
Water
year
492.79
1.35
100 0
407.28
1.12
127 0
496.98
1.36
220
461.49
1.26
83.0
6
145.02 .40
6.5 .01
289.98 .79
26.01
599.
57
1.64
44.01

Table
5
4.
Str
ea
mflo
w
record
s
for
South
F
ork
T
alu
fofo
S
tre
am
Ce
nt
inued
Year
1976
1977
1978
1979
1980
1981
1982
1983
Tota
l
Mean
Max.
Min.
Tota
l
Mean
Max.
Min.
Tota
l
Mean
Max.
Min.
Tota
l
Mean
Max.
Min.
Tota
l
Mean
Max.
Min.
Tota
l
Mean
Max.
Min.
Tota
l
Mean
Max.
Min.
Total
Mean
Max.
Min.
Ca lendar
year
545.91
1.49
100.08
355.75 .97
59 0
1,601.98
4.39
303.0
2
279.
00 .76
18.04
565.65
1.54
119.03
659.
761.
8154
.02
516.06
1.41
91.05
D
Jan.
14.0
7
.45
1.5 .25
3-77 .12
.16
.10
5.85 .19
.27
.16
18.12
.58
.82
.42
7.05 .23
.39
.18
16.90
.55
.80
.35
59.3
5
1.91
11.7
0
4.45 .14
.20
.10
Monthly
and
annu
al discharges,
in cubic
feet
pe
r second Con
tinu
ed
Feb.
16.0
1
.55
2.3 .23
2.48 .089
.11
.06
3.38 .12
.20
.10
8.81 .31
.46
.20
11.4
4
.39
2.7 .14
7.89 .28
.45
.20
19.65
.70
1.2 .42
2.36 .084
.11
.06
Mar.
5.05 .16
.25
.11
1.77 .057
.08
.05
2.06 .066
.14
.04
5-36 .17
.30
.11
5.26 .17
.27
.08
4.74 .15
.22
.11
10.7
0
.35
.80
.24
2.01 .065
.12
.04
Apr.
3.00 .10
.17
.08
1.46 .049
.10
.03
2.01 .067
.48
.04
3.39 .11
.16
.07
2.29 .076
.11
.05
2.82 .094
.34
.06
5.68 .19
.30
.14
1.30 .043
.10
.03
May
71-90
2.32
33.0
8
1.10 .035
.06
.02
1.18 .038
.07
.02
3.41 .11
.68
.05
2.03 .065
.11
.04
1.93 .062
.29
.04
3.18 .10
.16
.07
.80
.026
.04
.02
June
10.2
5
.34
.62
.23
1.11 .037
.06
.01
2.20 .073
.20
.03
2.27 .076
.14
.05
2.13 .071
.19
.03
1.00 .033
.10
.02
5-19 .17
1.2 .05
.65
.022
.04
.01
July
55.73
1.80
16.1
9
.88
.028
.18
0 75.06
2.42
20.0
5
6.52 .21
1.6 .04
2.78 .090
.36
.03
41.55
1.34
23.0
4
29.93
.97
9.5 .14
.49
.016
.05
.01
Aug.
215.
20
6.94
100.80
.91
.029
.06
.01
847.32
27.3
3t)3
.46
23.17
.75
6.1 .27
23-5
7
.76
15.0
4
264.
00
8.52
42.80
62.71
2.02
40.3
0
5.40 .17
1.3 .01
Sept
.
114.
6
3.82
401.0
130.58
4.35
37.0
2
112.6
3.75
38 1.1
73-3
6
2.45
18.27
227.
72
7-59
41.18
51.82
1.73
9.2 .82
20.77
.69
3.1 .34
6.21 .21
1.1 .05
Oct.
22.44
.72
1.3 .42
127.09
4.10
59.2
2
79.34
2.56
6.5 .94
98.2 3.17
13 1.2
86.8
82.
8017
.88
54.1
61.75
12.6
6
267.
208.
6291
.30
Nov.
11.2
1.3
7.64
.27
70.6
02.
3513
.07
409.9
13.7
154 1.
4
20.04
.67
1.1 .46
159.66
5.32
119.66
142.
104.74
54.8
8
22.46
.75
1.3 .46
Dec.
6.45 .21
.34
.16
14.00
.45
.70
.27
61.0
81.
976.
9 .76
16.35
.53
.88
.38
34.84
1.12
6.0 .50
70.85
2.29
29.90
9.24 .30
.49
.20
Wate
r ye
ar
624.
41
1.71
100.0
8
184.
16 .50
37 0
1,26
3.35
3.46
303.02
694.
73
1.90
154.0
4
418.
86
1.14
41.0
3
674.
03
1.85
119.0
2
484.
27
1.33
54.0
5
322.
57 .88
91.0
1

Table 55- Instantaneous discharge with water and air temperaturesat South Fork Talufofo Stream
(Discharge in cubic feet per second, temperature in degrees Celsius)
Date
Aug. 30, 1968 Oct. 1, 1968 Nov. 7, 1968 Dec. 12, 1968 Jan. 15, 1969 Feb. 20, 1969 Mar. 7, 1969 Oct. 30, 1969 Nov. 13, 1969 Dec. 11, 1969 Dec. 30, 1969 Jan. 8, 1970 Jan. 22, 1970 Feb. 5, 1970 Feb. 19, 1970 Mar. 5, 1970 Mar. 19, 1970 Apr. 2, 1970 Apr. 16, 1970 June 18, 1970 Aug. 6, 1970 Aug. 20, 1970 Sept. 3, 1970 Oct. 15, 1970 Oct. 20, 1970 Oct. 30, 1970 Nov. 19, 1970 Dec. 4, 1970 Dec. 18, 1970 Jan. 11, 1971 Jan. 27, 1971 Feb. 11, 1971 Mar. 5, 1971 Apr. 6, 1971 May 7, 1971 May 26, 1971 June 16, 1971 July 14, 1971 July 20, 1971 Aug. 5, 1971 Aug. 20, 1971 Sept. 13, 1971 Oct. 8, 1971 Nov. 12, 1971
Time
- 1400 0930 1210
- 0930 - 0930 -- 1430 - 1120 - 1030 . noO - 1100 - 1100 - 1030 - 1020 - 1130 - 0910 - 1010 - 1030 - 0845 - 1100 - 1500 1015 - 1120 - 0950 - 1110 - 1510 .... 0950 - 1050 - 1440 - 1000 .... 1330 - 1030 - 1030 - 1030 - 1410 - 1430 - 1000 - 1000 . 0940 . 1040 . 1010 - 1130 - 1030
I nstantaneousdischarge
...... 7.7 1.2 ...... 3.7 ..... 1.2 ...... .36 ----- .18 ... .07...... .75 ..... ... .36 ----- .93 .63 ----- 1.1 3.6 1.1 1.2 .60 .27 . .13 ..... .03...... .16 .30
1.4
.10 .63 .60 ... .28 . .20 ...... .18 ...... .29 . .08 .08 . .30 ...... .82 . 3.5 - 1.5 ...... .41 .------ .52 -----...... 23 ......- u .- 1.0 ------ .57 --- - -- 59 -----...... .82
Water Airtemperature temperature
28 28... 27 26 27 26... 27... 27 26 26 26 26... 24 26 26 26 26 26 26 26... 25 26 26 26 26... 27 26... 25... 25 26... 25 24... 24... 24 26... 27 28--- 25... 25 26... 25... 25... 25... 25
527

Table 55. Instantaneous discharge with water and air temperatures
Date
Dec. 20, 1971 Jan. 27, 1972 Feb. 25, 1972 Mar. 10, 1972 Mar. 2k, 1972 Apr. 12, 1972 May 8, 1972 -June 8, 1972 Aug. 21, 1972 Sept. 11, 1972 Sept. 28, 1972 Oct. 28, 1972 Nov. 30, 1972 Dec. 28, 1972 Mar. 8, 1973 -Apr. 6, 1973 -Apr. 20, 1973 May 11, 1973 -May 25, 1973 -June 20, 1973 July 6, 1973 -Aug. 10, 1973 Aug. 31, 1973 ---Sept. 14, 1973 --Sept. 28, 1973 -Oct. 12, 1973 Nov. 9, 1973 Nov. 23, 1973 Dec. 7, 1973 Dec. 21, 1973 Jan. 4, 197^ Jan. 14, 1974 Feb. 1, 1974 Mar. 1, 1974 Mar. 21, 1974 Apr. 8, 1974 - May 10, 1974 July 25, 1974 Oct. 1, 1974 Nov. 11, 1974 Jan. 14, 1974 Jan. 28, 1974 Feb. 6, 1975Feb. 28, 1975 Mar. 13, 1975 May 23, 1975 -July 31, 1975
at South Fork Ta'
Time
1050 0910 0900 0820 - 0915, mo 0900 0910 1320 1040 0900 0940 0910 0910 1440 0840 1400
0900 0940 1010 - 1330 091t) 0930 0950 0830 1150 1010 1000 1435 . --- 1525 0955 1440 1035 0930 1040 1130 1425 .... 1545 - ............ 1345 ...... 1510 1410 .... ------ 0925 - 1325 - 0940 1205
lufofo Stream Cont
I nstantaneousdischarge
0.32 -.... .,8 ............ .07 ........ .10 -.... .16 ............ .08 ............ .08 ............ .06 ............ .89 ............ .38 ............ .34 ........ 1.0 - .4! ..... .15 ............ .08 -.-..-. .10 - .05 - .03 . .12 - .02 - .01 - .03 -.... .25 ........ .60 - .51 ..... .25 ............ .38 ........ .26 -.... .13 ........ .12 -.... .09 ............ .16 ............ .09 ........ .04 - .10 - .08 -.... .43 ............ .50 ............ .67 ............ 1.7 ........ .11 ..... .16 ............ .67 ........ .21 . .22 -.... .14 ........ 1.7 -
inued
Watertemperature
... 25
... 25
... 25
... 25
... 25
... 25
... 25
... 24
... 25
... 25
... 27
... 25
... 25
... 25
... 24
... 25 26 26 28... 25... 25 26 26... 25... 25 26... 25... 25 26 26... 27... 24... 25... 25... 23... 25... 25... 25... 24... 26 - ... 25... 25 ~ ... 25... 24 25... 25 26
Airtemperature
- 30
..... 27
..... 27
. - 26
..... 25
528

Table 55. Instantaneous discharge with water and air temperatures
Date
Nov. 6, 1975 Nov. 21, 1975Feb. 27, 1976 Mar. 26, 1976 Apr. 22, 1976 Aug. 12, 1976Oct. 22, 1976 Nov. 19, 1976Dec. 17, 1976Jan. 13, 1977 Jan. 20, 1977 Feb. 10, 1977 Mar. 4, 1977 Mar. 24, 1977 Apr. 12, 1977 July 29, 1977 Aug. 16, 1977 Aug. 26, 1977 Oct. 19, 1977 Nov. 6, 1977 Dec. 3, 1977 Dec. 31, 1977 Jan. 20, 1977 Feb. 14, 1977Mar. 22, 1978 Apr. 26, 1978July 7, 1978 Aug. 2, 1978 Aug. 21, 1978Nov. 10, 1978 Mar. 3, 1979 Mar. 21, 1979 Apr. 28, 1979 May 2, 1979 June 2, 1979 July 17, 1979 Oct. 13, 1979 Nov. 17, 1979 Feb. 19, 1981Aug. 27, 1981
at South Fork
Time
_ 1440 - - 1350
- 0905 - 0940 - 1430 - 0830 . 1320 _______ 0930 - 1440 . 0900 - 1020 _______ 0930 - 1430 - 0950 - 0920 - 1100 _______ 1530 _ 1240 _______ 0835 _ 1010 _ 1805 __. 1445 - 1010 _ 1140 1425 0935 - 1330 _______ 1535 - 1430 - 1540 - 1450 - 1600
Talufofo Stream Cont
I nstantaneousdischarge
0.97 - 2.0 - .29 -_______ .14 _________. .17 ._______ 2.9_______ .46 _______________ .48_______ .32 ________ .21 -_______ .14 _______________ .15 _______________ .05_______ .13 _______________ .06_______ .04_______ .02 - .02 -_______ .89_______ 1.3 _______________ .56 _______________ .85 -_-_-________ .19 _______________ .15 _______________ .06_______ .04 -_______ .09_______ .60_______ 2.7_______ 2.7_______ .22 - .14 ________ .09 _______________ .09_______ .09 _______________ .03_______ .89_______ .69 _______________ .23_______ 6.4
Inued
Watertemperature
.__ 25 25 25 25 25 25 26 25... 25 25.__ 24 25.__ 27 25.__ 25 25 25... 25.__ 26 - 25 26 25 23 25 25 25.__ 25.__ 28.__ 26 25 25.__ 26.__ 25 25 25
28.5 25 26
26.526.5
Airtemperature
-- 25.5
.____ 27
. - 26
._._- 27
.- 28
. 27
. - 28
.- 28 29
529

Table 56. Streamflow records for Middle Fork Talufofo Stream (16801500)
Location: Lat 15°12'59" N., long 145^6'17" E., on left bank 0.2 mi upstream
from confluence with South and North Forks, 2.2 mi southeast of
Tanapag, and 3-7 mi east of Garapan.2
Dra inaqe area: 0.28 mi .
Period of record: March 1968 to June 1980, February 1981 to September 1982
(discont inued).
Gage: Water-stage recorder. Concrete control since Feb. 28, 1971- Altitude
of gage is 65 ft, from topographic map.
Remarks: Records fair. No diversion above station. Water-quality analysis is
given in table 58.
Average discharge; 12 years (water years, 1969-79, 1982), 0.682 ftvs,
49 1* acre-ft/yr.
Extremes for period of record: Maximum discharge, 840 ft /s Aug. 12, 1978,
gage height, 6.58 ft, from rating curve extended above 5.3 ft /s on
basis of slope-area measurements at gage heights 5-38 ft and 6.58 ft;
minimum, 0.05 ft^/s July 5, 6, 1977-
Discharge measurement made after the end of continuous discharge record:
Nov. 19, 1982 0.56 ft 3 /s.
530

Table 56. Streamflow records for Middle Fork Talufofo Stream Cent inued
A. Annual maximum discharge (*) and peak discharges above base (100 ft /s)
(Discharge in cubic feet per second, gage height in feet)
Date
Apr.JuneSept.
Oct.Nov.Nov.
Oct.
Sept.
JulyAug.Aug.
Oct.
May 4
Nov.
Aug.Sept.
12282
232,19
16
6
236,10
2,
)
3,
4,
, 1968, 1968, 1968
, 19681968
, 1968
, 1969
, 1971
, 19721972
, 1972
1972
197^
1974
197624, 1976
Time
013007302200
033012001430
1730
2100
030002001500
2300
0500
1300
03300530
Dis charge
69*278171
135360
*415
*282
*108
1/183*256246
*58
*74
*186
455*541
Gage height
3.234.644.07
3.835.005.22
4.66
3.62
4.144.534.48
3. 10
3.29
4.16
5.385.67
Date
Sept
Oct.Aug.Aug.Aug.Sept
Nov.Nov.
Oct.
JulyAug.Aug.
Nov.Dec.Aug.
. 13
23,10,12,29,
. 27
2,3,
14,
31,1,16,
15,17,23,
, 1977
1977197819781978
, 1978
19781978
1979
198119811981
198119811982
Time
1200
05301230110002001200
06150445
0800
203007301000
131503000615
Dis charge
*130
107360
*842440168
*322197
o/^*83
141^'*176
152
*209111178
Gage he ight
3.79
3.615.006.585.324.05
4.854.22
3.38
3.874.103.95
4.293.644.11
- From floodmark in well.
-1 October 1979 to June 1980.
- February to September 1981.
531

Table 56. Streamflow records for Middle Fork Talufofo Stream Continued
B. Annual minimum discharge, in cubic feet per second
Water year Date Discharge
1968 17 -196919701971 -1972 1973 19741975 -197619771978 1979 2/ -1980fx -198il'1982
Apr. 6, 1968 July 3, 1969 July 18, 19, 1970 Feb. 7, 8, 1971 May 7, 1972 July 5, 6, 1973 Apr. 25, 197^ May 26-28, 30, 1975 May 14-18, 1976 July 5, 6, 1977 May 22, June 2, 3, 1978 July 14, 15, 18, 1979 May 28, 29, 31, 1980 June 22-26, 1981 July 19, 1982
0.15.08.13.17.10.07.07.08.10.05.09.14.10.09.16
- February to September 1968.
-X October 1979 to June 1980. 3 /
- February to September 1981.
532

Tabl
e 56.
Streamflow records
for
Middle Fork Ta
lufo
fo St
ream
ContInued
Year
1968
1969
1970
1971
1972
1973
1974
1975
Tota
l
Mean
Max.
Mln.
Tota
l
Mean
Max.
Min.
Total
Mean
Max.
Mln.
Tota
l
Mean
Max.
Mln.
Tota
l
Mean
Max.
Mln.
Tota
l
Mean
Max.
Mln.
Tota
l
Mean
Max.
Min.
Total
Mean
Max.
Min.
Cale
ndar
year -- --
198.76 .54
49.10
213.
25 .58
.*17
250.03 .69
5.2 .19
207.13 .57
26.13
84.16
.23
1.7 .10
154.48 .42
9.0 .08
229.74 .63
8.3 .12
Jan.
20.0
1
.65
.74
.52
36.3
6
1.17
9.4 .36
8.82 .28
1.0 .19
12.6
8
.41
.60
.28
8.97 .29
.38
.24
6.16 .20
.56
.14
11.65
.38
.52
.29
C.
Feb.
12.1
5
.43
.62
.36
24.5
8
.88
3.5 .52
14.5
9
.52
5.2 .19
7.33 ,25
.28
.21
6.55 .23
.25
.22
4.87 .17
.32
.10
11.08
.40
.95
.32
Monthly
Mar.
11.3
1
.36
.47
.27
16.3
1
.53
.82
.36
18.1
4
.59
2.1 .19
7.48 .24
.50
.19
6.55 .21
.26
.17
4.51 .15
.24
.10
9.47 .31
.44
.26
and
annual discharges,
in cu
bic
Apr.
37.1
5
1.24
18.17
8.66 .29
.50
.23
11.19
.37
.68
.20
16.76
.56
3.4 .34
6.56 .22
.31
.17
6.07 .20
.29
.16
5-57 .19
.70
.08
7.21 .24
.26
.22
May
14.4
8
.47
6.1 .23
7.70 .25
.33
.19
9.94 .32
.57
.25
32.75
1.06
4.4 .42
5.01 .16
.25
.13
5.31 .17
.22
.15
11.6
8
.38
5.4 .16
5.59 .18
.24
.12
June
23.16
.77
15.20
5.51 .18
.27
.12
11.6
2
.39
1.4 .25
17.5
6
.59
.95
.46
6.29 .21
.42
.15
4.31 .14
.22
.12
6.66 .22
.44
.16
6.09 .20
.24
.18
July
51.49
1.66
15.3
1
6.90 .22
1.0 .13
9.27 .30
1.2 .17
26.6
0
.86
3.9 .50
27.3
0
.88
6.6 .19
5.62 .18
.32
.10
14.36
.46
3.9 .18
25.4
4
.82
4.5 .16
feet per
seco
nd
Aug.
35.9
6
1.16
3.4 .65
7.30 .24
.85
.10
27.56
.89
4.8 .23
26.1
0
.84
2.5 .55
67.65
2.18
26.42
8.47 .27
.89
.16
19.7
1
.64
1.9 .20
54.0
5
1.74
8.3 .75
Sept.
170.10
5.67
27.78
7.76 .26
1.6 .13
30.79
1.03
6.7 .36
26.58
.89
4.0 .43
19.41
.65
1.7 .42
9.46 .32
1.2 .16
16.90
.56
1.9 .35
30.92
1.03
6.8 .56
Oct.
63.3
12.
0425
.78
74.4
02.
4049
.17
14.77
.48
1.4 .27
26.95
.87
2.5 .60
22.00
.71
2.1 .48
9.35 .30
1.7 .18
20.2
6.6
52.
4 .32
25.4
6.8
23.
2 .56
Nov.
196.4
6.55
641.
5
11.87
.40
1.2 .30
11.8
0.3
91.1 .23
20.27
.68
1.3 .50
14.3
9.4
81.
2 .38
6.99 .23
.56
.18
29-50
.98
9.0 .48
25.3
2.8
42.
4 .65
Dec.
30.6
1.9
91.
4 .81
25.19
.81
6.2 .30
9.06 .29
.75
.20
14.9
1.4
8.5
5.4
2
11.03
.36
.38
.32
6.51 .21
.38
.14
14.3
0.4
6.5
2.4
4
17.4
6.5
6.8
0.4
8
Water
year __
377.
62
1.03
64.10
289.08 .79
49.17
223.53 .61
5.2 .19
221.
84 .61
26.1
3
108.
73 .30
2.1 .10
113.27 .31
5.4 .08
225.
56 .62
9.0 .12

Ta
ble
56.
Str
eam
flow
re
cord
s fo
r M
idd
le
Fork
T
alu
fofo
S
tre
am
--C
on
tin
ue
d
Year
1976
1977
1978
1979
1980
1981
1982
To
tal
Mea
nM
ax.
Min
.
Tota
l
Mea
nM
ax.
Min
.
To
tal
Mea
nM
ax.
Min
.
To
tal
Mea
nM
ax.
Min
.
Tota
l
Mea
nM
ax.
Min
.
To
tal
Mea
nM
ax.
Min
.
To
tal
Mea
nM
ax.
Min
.
C
Ca
lendar
ye
ar
Jan.
15-4
42
44
.75
.67
.50
22
.70
.14
.35
9.1
3151.8
1.4
2
.29
16
.36
.06
.23
8.2
9581.1
71.5
9
.27
84
.33
.13
.24
21.6
7198.4
8.5
4
.70
8.1
.9
0.1
6
.55
9.0
9
.29
.33
.24
_--
27.0
2
.87
3.0 .6
0
Mo
nth
ly
and
annual
dis
ch
arg
es
Fe
b.
12.0
5
.42
1.2 .2
6
7.5
3
.27
.33
.21
5.5
7
.20
.27
.14
15
.51
.55
.60
.50
10.4
3
.36
1.8 .1
4
9.2
9
.33
.50
.24
15
-60
.56
.78
.45
Mar.
8.2
1
.26
.30
.23
5.3
0
.17
.21
.14
6.8
7
.22
.30
.18
13.0
7
.42
.60
.30
9-0
3
.29
.33
.24
7.1
7
.23
.30
.18
14
.39
.59
.73
.37
Apr.
6.9
1
.23
.30
.16
4.3
6
.15
.16
.14
5.8
8
.20
.87
.14
9.9
7
.33
.41
.27
6.2
0
.21
.27
.13
7.4
3
.25
.50
.18
10.8
1
.37
.50
.30
May
24
.34
.79
8.6 .1
4
3.4
2
.11
.14
.08
4.9
6
.16
.21
.13
10.1
2
.33
1.3 .2
1
4.9
8
.16
.27
.10
6.2
3
.20
.68
.14
8.5
6
.28
.37
.24
, in
cubic
fe
et
June
11
.68
.39
.50
.30
3.0
0
.10
.15
.06
5.3
9
.18
.50
.13
7-7
1
.26
.33
.18
6.3
3
.21
.30
.12
4.6
2
.15
.30
.11
11.1
6
.37
1.2 .2
4
Ju
ly
27.7
1
.89
5.3 .2
6
3.4
4
.11
.42
.06
25
-20
.81
5.8 .1
4
10
.89
.35
1.8 .1
6
-- __ --
18.8
7
.61
7.4 .1
6
14.8
8
.48
2.8 .2
1
per
seco
nd
C
ontinued
Aug.
59.1
4
1.9
122
.47
3-5
3
.11
.16
.07
24
5-9
9
7.9
484
.21
14.0
8
.45
2.5 .2
2
__
12
0.3
7
3.8
815
.45
20
.01
.65
10.2
4
Se
pt.
40
.79
1.36
14.4
3
40
.61
1.35
10.0
8
43
.67
1.46
15.4
5
29
.97
1.00
8.1 .2
4
--
31
.81
1.06
4.0 .5
5
8.6
8
.29
1.2 .1
8
Oct.
14.4
2.4
7.5
7.3
6
36
.73
1.18
16.1
8
48.2 1.55
3.0 1.1
37
.60
1.21
4.6 .5
5
26
.40
.85
3.7 .5
0
Nov
.
12.6
0.4
2.5
7.3
6
24
.10
.80
3.4 .4
1
138.
24
.61
511.
1
14.2
0.4
7.7
2.4
0
60.6
22
.02
22.5
5
Dec
.
11.4
6-3
7.5
7.3
0
10.6
6.3
4.4
5.2
7
42
.95
1.3
93
.0 .85
13.6
9.4
4.5
5.3
7
--
32.2
61.0
48.3 .6
0
Wa
ter
ye
ar
27
4.5
1
.75
22.1
4
118.
80 .33
10.0
6
423-
31
1.1
684
.13
362.3
4
-99
51.1
6
-- -_ -- -- -- --
25
0.3
9
.69
22.1
8

Table 57. Instantaneous discharge with water and air temperatures
(Discharge
Date
Feb. 12, 1968May 3, 1968 -May 31, 1968 -July 24, 1968 Aug. 29, 1968 Oct. 1, 1968 -Nov. 7, 1968 -Dec. 12, 1968Jan. 15, 1968Feb. 20, 1968Mar. 7, 1969 -Apr. 16, 1969 May 16, 1969 -June 12, 1969July 10, 1969 Aug. 7, 1969 -Sept. 4, 1969 Oct. 2, 1969 -----Oct. 30, 1969 Nov. 13, 1969 Dec. 11, 1969Dec. 30, 1969 ---Jan. 8, 1970 -Jan. 22, 1970 Feb. 5, 1970 -Feb. 19, 1970 Mar. 19, 1970 Apr. 16, 1970 May 14, 1970 -June 18, 1970 July 9, 1970 -Aug. 6, 1970 -Sept. 3, 1970 ---Oct. 2, 1970 -Oct. 20, 1970 Nov. 19, 1970 Dec. 18, 1970 Jan. 11, 1970 Feb. 11, 1971 Mar. 5, 1971 -Apr. 6, 1971 -May 7, 1971May 26, 1971 -July 14, 1971 Aug. 5, 1971 -
at Mi(
in cubic feet
Time
1540. -I040 1120 1340. TQ40 1540 1140 1330 1230 1030 1010 1230 1330 1020. 1310 - 1330. TQ30 1030 1020 1030. 0940 1000. -J020 1010. 0940. ___ 0950 1000
1020 1310. Q950, 0940 1030. 0930. 0910 1230, !4 10, 0920 1320
. 0940
. 0950, 0900 0930 1320 OSOO 1040
Jdle Fork Talufofo Strean
per second, temperature
I nstantaneousdischarge
0.29 - .31- ------ .23__________ 5.0 __-___,__________ .72 __ ____________ .94 _____-_,__________ 2.3 _______ -j.O __________ .63 _-_ _,__________ .4! __________________ .34 _ __.,__ -____ . 27
.18 -__________ .24 ~
.15 __________ .25 _______ .20 -__________ .28__________ .55 .___ _ .79 ,__________ .49 ________ _____ .44 .__________ .50 -_-____.__________ 2.4__________ .67 -___.__. .60 -__________ .54 ________ .42 .__________ .29 -______. _ .29 - .__ _ .39 .__________ .52 _________________ . 71 __________________ .52 _______ _ .39 __. ___ .27 .__________ .24__________ .30 __________ .22 _______ . 15 __. _ .42 ._ _ -1.6 ... .90 . .60 -__________ 3.2 ____-_.
i
in degrees Celsius)
Water Airtemperature temperature
24 27 28 26 26 28 27 26 27 26 24 27 29... 27 29--- 28 27 27 26... 27 26 26 26 25 24 26... 26 26 27.__ 26 25... 25 27 26 28 26... 25--- 26 25 24 24 25--- 26 25 26
535

Table 57. Instantaneous discharge with water and air temperatures
Date
Sept. 13, 1971 -Oct. 8, 1871 Nov. 12, 1971 -- Dec. 20, 1971 Jan. 27, 1972 Feb. 25, 1972 Mar. 24, 1972 Apr. 12, 1972 May 8, 1972 -June 8, 1972 Aug. 21, 1972 Sept. 28, 1972 -Oct. 28, 1972 Nov. 30, 1972 Dec. 28, 1972 Jan. 23, 1972 Feb. 8, 1973 Mar. 8, 1973 - Apr. 6, 1973 May-5, 1973June 4, 1973 July 6, 1973 -Aug. 2, 1973 Sept. 14, 1973 -Oct. 12, 1973 Nov. 9, 1973 Dec. 7, 1973 -Jan. 4, 1973 Feb. 1, 1973 Mar. 1, 1974 -Mar. 21, 1974 Apr. 8, 1974 -July 25, 1974 Oct. 1, 1974 Nov. 11, 1974 Jan. 14, 1975 Jan. 28, 1975 Feb. 6, 1975 -Mar. 13, 1975 Apr. 1, 1975 May 23, 1975 July 3, 1975 July 18, 1975 Aug. 28, 1975 Oct. 10, 1975 ---Nov. 6, 1975 -
at Middle Fork
Time
----- - 0930 - - 1330. Q920 -- 1010 -- 1020 -. 1000 - 1010 . 0850 -- 0940 -. 0940 - 1430 -- - 0950. 0920 . 0910 -. 1030 .- 0910 -- 1000 -. 1600 -. 0930
. 1000 -
. o840 -
. 0930
. 0830 -
. 0900 -
. Q940 - - 0930. 1400 -. . 1055 . 1345 - 0945 . 1020 -. 1Q40 .... 1330 .. 1420 -. 1045 -....... 1535 ..... 1320 ........ 1350 .. 0940 . Q845 -- 0920 . 1020 -. 1030 -- 1005 -....... 1330
Talufofo Stream Cent
I nstantaneousdischarge
. 0.47
....... 14 ........
....... .67 .-.-.-
....... .41 ...
....... .31 ........
....... .23 . -
. .22
....... .18
....... .13 ........
....... .18 . -
....... .26
....... .28
....... .33 ........
....... .37 ........
....... .32 .... -
... . 26
. . .24
. . .17
. .22
... .16
. .13 ........
....... .13 ........
. .28
. .26
. .22
. .23 ........
. .14 - .16 . .20 ............... .14 ......... .12 ........- .12 . .21 ............... .32....... . 72 ... ........ .35 ............... .27....... .46 ......... .30 ............... .36 ............... .17 ............... . U ............... .36 ........
....... .62
....... .67 ........
inued
Watertemperature
- 25 25 25- 25 24- 25- 25- 25- 25 24- 25- 27- 25-- 25- 25- 23 24 24 25- 25- 25~ 26- 25.. 25- 25- 25 26 26.. 25.. 25 25- 25.. 25- 25 26.. 25_. 25 -- 25- 25 26- 25- 25.. 25 . 25- 25-- 25
Airtemperature
- 30
..... 27- 26
..... 25
..... 25
536

Table 57- Instantaneous discharge with water and air temperatures
Date
Nov. 21, 1975 Jan. 29, 1976 Feb. 27, 1976 Mar. 26, 1976 Apr. 22, 1976 June 7, 1976 June 23, 1976 Aug. 31, 1976 Oct. 22, 1976 Nov. 19, 1976 Dec. 17, 1976 Jan. 20, 1977 Feb. 10, 1977 Mar. 10, 1977 Apr. 12, 1977 May 20, 1977 June 4, 1977 July 2, 1977 - July 29, 1977 Aug. 26, 1977 Oct. 19, 1977 Nov. 21, 1977 Dec. 31, 1977 Jan. 20, 1978 Mar. 22, 1978 Apr. 11, 1978 July 7, 1978 -Aug. 2, 1978 Aua. 21, 1978 Oct. 7, 1978 -Nov. 10, 1978 Dec. 2, 1978 Jan. 20, 1979 Mar. 3, 1979 -Mar. 21, 1979 Apr. 28, 1979 May 2, 1979 June 2, 1979 July 7, 1979 July 17, 1979 Oct. 13, 1979 Feb. 19, 1981 Mar. 20, 1981 Aug. 27, 1981 Oct. 8, 1981
at Middle Fork
Time
1440 - 1010 - - 1330 1415 - 1030 - 1400 - 1240 - 1410 - -IOOO - -IOOO - 0930 1010 - 1050 - 0930 - 1400 - 1440 - 1340 - 1030 - 0840 - 1000 - 0900 - 0845 - - 0915 0830 - 1440 -
0930 - 0950 - 1430 - 1400 - 1300 - 0900 - 0950 - 1045 - 1030 -- 1315 - 0845 - 1400 - 1410 - 1430 - 1045 - 1140 - 1000 - 1410 - 1340 -
Talufofo Stream Cont
I nstantaneousdischarge
. 0.86 - .32 - .27 - .29 ... . .24. .41 ........ - .34 .23....... .31 ......... .42 . ... .56
.27 ....... .30 ........ .21 - .14 ------ .11 .10 .11 ....... .16
.21 - .29. .94 ........ .55 ....... .28....... .16 ............... .19 ............... .16 ........ .21 . 1.0 . 2.0 ....... 1.3 . _.._
.80 .33....... .35 ........ .25 .27 .22 ....... .24 - ---....... .15 ..... ...
.50 --------....... .31 _ ....... .25 ....... 1.9- ............... .48 -- --
i nued
Watertemperature
-- 25 25 25 26 25- 25 25 25 26.. 25.. 25.. 24 .. 25.. 25 25 25 25.. 25 25 25_. 26 - 25-- 25.. 23 .. 25.. 25 25.. 26 .. 28 ------ 25- 25- 25- 25 25.. 25 ..... 25.. 25 -- 25- 25.. 28 --- 25- 26.5 - 25.5 - 26.5 - 27.5
Airtemperature
.... 26
.... 28
.... 23
.... 28
.... 29
- 28
.... 27
- 27.5
.... 27 27.5.... 29 28.5
537

Table 58. Chemical analyses of water from Talufofo Stream
Constituent Date --- Time -
Discharge, instantaneous ----
Specific conductance ------ _ LJpH - --------------------
Temperature (water) ----- --
Hardness as CaCO ------ -
Noncarbonate hardness -------
Calcium, dissolved (Ca) ---
Magnesium, dissolved (Mg) ---
Sodium, dissolved (Na) ------ Percent sodium --------- -
Sodium adsorption ratio ---
Potassium, dissolved (K) -
Alkalinity, total as CaCO --
Sulfate, dissolved (SO.) --
Chloride, dissolved (Cl)
Fluoride, dissolved (F) --
Silica, dissolved (SiO.) --
Sol i ds, dissolved, sum of constituent ------
Nitrogen, dissolved (NO. + NO,) \ 2 3
Iron, dissolved (Fe) -- --
Manganese, dissolved (Mn) ---
ft 3 /s
umho
°C
mg/L
mg/L
mg/L
mg/L
mg/L
percent
mg/L
mg/L
mg/L
mg/L
mg/L
mg/L
mg/L
mg/L
MQ/l
South Fork 11-19-82
1300
0.56
380
8.2
26.0
130
0
41
6.4
32
35 1.3
1.1
140
9
39 .1
40
253
< .1
17
1
Middle Fork 11-19-82
1145
0.56
370
8.0
26.0
120 0
37 6.6
31
36
1.3 1.3
136
6
37 .1
44
245
< .1
31
2
538

Low-flow partial-record stations
Table 59. Discharge measurements and water temperatures at
Hasngot Stream (16800500)
Location; Lat 15°12'45" N., long 145°46'21" E., 750 ft upstream from unnamed
tributary, 0.5 mi upstream from mouth, and 3-4 mi east of Garapan.. Altitude
is 100 ft (from topographic map).2 Drainage area; 0.43 mi .
Period of record; 1967-75, 1977 (water years).
Date Time
Instantaneous discharge
(ft3 /s)
Water temperature
116,
JulyAug.Oct.Nov.Jan.Feb.Mar.AprMayMayMay 29,June 12JuneJulyJulyAug.Aug.SeptSeptOct.
16.30,
25, 1968 29, 1968 2, 1968 6, 1968 15, 1969 20, 1969 6, 1969 16, 1969 , 1969 -
Oct OctNov. Nov. Dec, Dec, Jan, Jan, Feb, Feb. Mar,
27, 10, 24, 7, 21, 4,
1969 - 1969 - 1969 1969 1969 1969
1969 - 1969 1969
18, 1969 2, 1969 -
1969 1969 1969 1969 1969 1969
8, 1970 - 22, 1970-
1970 -1970 -
13, 26,11, 30,
5, 19,
1410141511201620
5, 1970
11301205121012101215124512001125
2.3 .73 .51
1.2
1350 - 1210 -14 5 0 -1130 -1155 - 1430 -1440 .1115 -1455 -
11551200 -1200 -1150 -i9nn -
1 *>z -----------. ... .07 --- ------______ .07 --- ------ .06 ______ .07 - -- --. ... .05 _________...... .05 .... ....
n i.UZ -----------
. .04
...... .07 . ............. .05 ...........
.04 . .04
nP...... .07 -. 9fl __ __ ____ __
.27
.22
.76
.53
26
28, 28, 28,
.31
27.026.526.0
55005055
26.526.529.527.028.527.026.526.526.5
26.526.027.026.0
24.5
.5
539

Table 59. Discharge measurements and water temperatures at
Date
Mar. 19, 1970 Apr. 2, 1970 - Apr. 16, 1970 Apr. 30, 1970May 14, 1970 May 28, 1970 June 12, 1970 -June 26, 1970 July 9, 1970 - -July 23, 1970 -Aug. 6, 1970 Aug. 21, 1970 -Sept. 3, 1970 Sept. 17, 1970 -Oct. 2, 1970 -Oct. 15, 1970 -Oct. 29, 1970 -Nov. 19, 1970 -Dec. 4, 1970 -Dec. 21, 1970 -Jan. 12, 1971 -Jan. 28, 1971 -Feb. 11, 1971 Mar. 9, 1971 -Apr. 7, 1971 -May 10, 1971 -May 27. 1971 -July 14, 1971 Aug. 6, 1971 -Aug. 25, 1971Sept. 14, 1971 -Oct. 8, 1971 -Nov. 2, 1971 -Dec. 10, 1971 -Mar. 10, 1972 -Mar. 24, 1972 -May 8, 1972 June 8, 1972 -Aug. 21, 1972 -Sept. 11, 1972 -Sept. 28, 1972 -Oct. 28, 1972 -Nov. 30, 1972 -Dec. 28, 1972 -
Hasnqot
Time
- 1055 - -- 1050 -- 1135 -- 1105 -- 1410 -- 1300 -- 1040 -.... 1315 ......- 1040 -- 1430 -. 1200 - - 1355- 1155 -.... 1135 ......- 1120 -- 1150 -- 1510 - -- 1545 -- 1040 -- 1040 -- 1110 - 1020 -- 1050 - 1100 -- 1050 -- 1205 -- 1220 -- 1045 -- 1130 -- 1145 -- 1245 -.... 1235 ......- 1050 -- 1405 -.... 0955 1050 -- 1100 -- 1000 -.... 15 15 .- 0900 -- 1125 -. 1100 -. 1120 -. 1430 -
Stream Cont inued
Instantaneousdischarge
(ft 3 /s)
0.22 -. . .16 - -. .10 -. .06 -. .05 -. .06 -........ .05 ......... .12 -. .08 -. .05 -........ .15 ........ .22 -........ .06 .. ........ .16 ......... .20 - .11 -........ .18 ......... .09 -. .08 -. .08 -........ .07 ......... .06 -........ .07 ........ .25 - .22 -. .60 -. .12 - .10 -........ .34 ........ .21 -. .29 -........ 4.3 ......... .26 -. ... .14 . .. .07 - .17. .04 -. .04 - .10 - .29 -.--. .14 .. .22 -........ .16 ......... ._ .14 . .
Watertemperature
(°c)
- 25.5 - 25.5
26.0 - 25.5 - 25.5
28.026.027.026.027.025.026.026.026.027.0
....27.026.0
26.025.026.025.0
25.025.027.026.026.025.026.026.025.025.025.025.0
....25.025.025.025.027.025.025.025.0
540

Table 59. Discharge measurements and water temperatures atHasngot Stream--Cont inued
Date
Jan. 23, 1973 Feb. 8, 1973 Mar. 5, 1973Apr. 6, 1973 Apr. 13, 1973 --Apr. 26, 1973 May 18, 1973May 25, 1973 June 15, 1973 June 22, 1973 July 6, 1973 Aug. 2, 1973 Sept. 28, 1973 Oct. 12, 1973 Nov. 9, 1973 Nov. 26, 1973 Dec. 7, 1973 Apr. 8, 1974 --Jan. 30, 1975 Feb. 6, 1975 Mar. 13, 1975 ----- July 18, 1975 -----Aug. 28, 1975 Now 19 1976
Time
1015 - 1100 - 1310 - 1320 - 1500 - 1320 - - 1345---- 1320 - 1310 - 1520 - 1025 - - 1325 1125 - . 1305 - 1200 - 1130 - - 1315 - 1315 - - - 1035 - 1000 - 1100 - - 1055 ----- 1405 _ m?n
I nstantaneous discharge
(ft3 /s)
0.10 . .10 -...... .05 -
n(L
no.___-_ nc _ _ _ .. up
06 ------- U \J
._-___ QC _______ up
...... .04 -n on o------ .uz -------1 O
o o.23 - 1 /:------ .]b _____-.O 1
1 Q------ .10 -------O 1------ .21 -------
.06 -...... .16 - .--_-- LL __ ___ .» ~~
1 O
.19 -oQ------ .20 -------
. ift __ _ __ .
Water temperature
(°c)
- 23.0
- 24.0o£ n
- 25.0
- 25.0- 25.0
r\f r\
.-___ ?£ 0w « « ^\J m \J
.-___ ?c ot-^> . U
- 25.0 o£ nor ot-J . Uf)r n----- Zp.U
25.0 o£ noc noc noc n
o£ n
.___- 9C. n
541

Table 60. Discharge measurements and water temperatures at
North Fork Talofofo Stream (16801800)
Location: Lat 15°13'07" N., long 145°46'41" E., 350 ft upstream from confluence
with South and M.iddle Forks and 2.3 mi southeast of Tanapag. Altitude is
40 ft (from topographic map).2 Drainage area; 0.45 mi .
Period of record: 1968-71.
Date
July Aug. Oct. Nov. Dec. Jan. Feb. Mar. Apr. May May May June July Aug. Sept Oct. Apr. MayAnn
24 30 2, 6, 1215 207, 16
1, 16, 29, 12 247,
. 42,9,
10,c
1968 - , 1 ^<JU
, 1968 1968 -1968
, 1968 1QAQ ______, \yoy ------
1 CtAQ ______, i yoy ___. 1969
, 1969 1969 -1969 1969 -
, 1969 , 1969 - 1969 1069 ______, 1 .7° 3
1969 '
1969
1971 1Q71 _-- -.
I nstantaneous di scharge
Time (ft 3 /s)
___ mnn ____________ ?___ 1 "3 1 C ____________I.5 I?
ikkn
___ _ _ __________ n
__ o
___ _ ____________ n
.__ 13CC _ ___ __
.1 .
10 _ ___ .
i.1 .37 --- -
Q7 ____
Water temperature
.____ ?fi n
.____ 9£ Czoo
._ _ 9C C
?A'^
o~7 n.____ ?c n
542

Table 61. Discharge measurements and water temperatures at
Talufofo Stream (16802000)
Location; Lat 15°13'05" N., long 145°46'43" E., 200 ft downstream from confluence
of South, Middle, and North Forks, 0.25 mi upstream from mouth, 2.4 miles
southeast of Tanapag, and 3.8 miles east of Garapan. Altitude is 30 ft (from
topographic map).2 Drainage area: 1.56 mi .
Period of record: 1968-73.
Date
Feb. 9, 1968 -Feb. 13, 1968 -Mar. 27, 1968 -May 3, 1968 -May 31, 1968 -July 24, 1968 -Aug. 30, 1968 -Oct. 2, 1968 -Nov. 6, 1968 -Jan. 15, 1969 Feb. 20, 1969 -Mar. 6, 1969 -Apr. 16, 1969 -May 1, 1969 May 16, 1969 -May 29, 1969 -June 12, 1969 -July 10, 1969 -Aug. 7, 1969 -Aug. 21, 1969 -Sept. 3, 1969 -Sept. 4, 1969 -Sept. 18, 1969 -Oct. 2, 1969 -Oct. 16, 1S69 -Oct. 30, 1969 -Nov. 13, 1969 -Nov. 26, 1969 -Dec. 11, 1969 -Dec. 30, 1969 -Jan. 8, 1970 -Jan. 22, 1970 -Feb. 5, 1970 -
Time
- 1105 -- 0900 - 1435 -.... 0925 1200 -- 1530 -- 1245 -.... 0955 -- 1525 - 1415 - 1135 1450 - 1310 - 1130 -- 1425 - 1105 -
1420 - 1210 - 1130 - 1130 -
.... 1135 1130 - 1130 - 1205 - 1140 - 1145 - 1140 - 1150 - 1210 - 1115 -
1 nstantaneousdischarge
(ft 3 /s)
. 0.16 - .15 - .02 - .11 -. . 10 -. 20 -. 11 . 2.0 -....... 7.4 ............... .44....... .32 ............... .17 ......... .08 -
.14 ... ........ .03 ------ .02 -. o - 0 -....... .07 . .01 -....... .26 ----- .03 -. o -. .10 -. .07 ....... .99 .......... .69 . .10 -....... .92 ........ .40 - 1.0 4.7 1.3
Watertemperature
(°C)
24.524.529.0
.......
.......26.5
.___ 25.5
26.527.026.526.526.528.0
- 29.5 29.5
.___28.5
29.526.028.5
.___27.0
- 24.526.526.027.026.0
25.526.024.0
- 25.5
543

Table 61. Discharge measurements and water temperatures atat
Date
Feb. 19, 1970 Mar. 5, 1970Mar. 19, 1970 Apr. 2, 1970Apr. 16, 1970 Apr. 30, 1970May 14, 1970 May 28, 1970 June 12, 1970 June 18, 1970 June 26, 1970 July 9, 1970July 23, 1970Aug. 6, 1970 Aug. 21, 1970 Sept. 3, 1970 --- Sept. 17, 1970Oct. 2, 1970 Oct. 15, 1970 Oct. 29, 1970 Nov. 19, 1970 Dec. 4, 1970 Dec. 18, 1970 Jan. 12, 1971 Jan. 27, 1971 Feb. 11 , 1971 Mar. 9, 1971Apr. 6, 1971 --------May 10, 1971 May 27, 1971 - July 14, 1971 Aug. 5, 1971Aug. 25, 1971 -----Sept. 14, 1971 Oct. 8, 1971 Dec. 20, 1971 Feb. 25, 1972 Mar. 10, 1972 Mar. 24, 1972 May 8, 1972 . June 8, 1972 Sept. 28, 1972 Oct. 28, 1972 Nov. 30, 1972
Talufofo
Time
1105 1200 1035 - 1205 1110 1055 - 1355 -1110 1020 1030 1100 1020 1410 1135 15451105 1105 1110 1135 1430 1530 1020 1110 1100 1100 1030 1355 -1045 1140 1200 1025 1335 ----1125 1215 1055 -1315 1040 0925 -1030 1030 0945 - 1030 1040 1015
Stream Cont inued
1 nstantaneousdischarge
(ft 3 /s)
1.0 ________ .64________ .28________ .05 _______________ .!4 _______________ .09 -_--__-________ .03________ . 10 .02 ________ . 17 _______________ .06 __--__-________ . 19 _______ .02 __ __ .4! 2.2 ________ 2.8________ .40________ 1.3 _______ .10 __ .86 .11 ________ .09 _______ .10 .22 ________ .03 _______________ .04 _______________ L8 _______________ .65 _______________ 3>1 _______________ .79 _______________ .57 _______________ 7.0________ . 91 _______________ .69 _______________ 24 _______________ .33 _______________ .04________ .06 _______________ .07 _______________ .03 _______________ .04 _______ .11 ________ .30 _______ .20
Watertemperature
(°c)
25.5 - 25.5 26.5 27.0 26.5 26.5 - 29.5 28.5 - 29.5 26.0 29.0 27.0 30.0 25.0 26.0 25.0 27.0 26.0 29.0 28.0 26.0 26.0 25.0 25.0 25.0
26.0 26.0 27.0 27.0 26.0 25.0 26.0 26.0 25.0 26.0 25.0 25.0
25.0 25.0 27.0 25.0 25.0
544

Table 62. Miscellaneous discharge measurements made for flooding Of August 12, 197^
Stream Location
Drainagearea
(mi 2 )
Di scharge
(ft 3 /s)
Rapugao Stream
San Roque drainage
ditch.
Lake Susupe
tr ibutary.
Lat 15°13'30" N., long 145°44'46" E.,
50 ft upstream from Cross Island
road at altitude 50 ft.
Lat 15°14'55" N., long 145°46'31" E.,
in vilage of San Roque at altitude
49 ft.
Lat 15°15'59" N., long 145°46'51" E.,
a gully at altitude 65 ft draining
the western hillside into Lake Susupe,
1.34
.21
.06
666
300
285
54 5

Springs
Nicholson Spring (Bobo Papago)
(also has been called Nickelson Spring, Papako Spring and Nakada Zenko)
Location: Lat 15°10'58" N., long 145°45'15" £ , along south side of the
Cross Island Road at the Hakmang (Kagman) road intersection at
altitude 540 ft (from topographic map).-
Aquifer; Limestone resting on impermeable floor of marine shale and volcanic
sediment.
Remarks: Spring is encased in concrete.
Production: 8,000-30,000 gal/d (Stearns, 1944).
11,000 gal/d measured on July 27, 1944 (Stearns, 1944).
30,000-45,000 gal/d (Glander, 1946).
20,000-35,000 gal/d (Piper, 1946-4?).
Chloride: 40 ppm (Glander, 1946).
30 ppm Aug. 12, 1952 at 1500; temperature 30°C.-
26 ppm Oct. 21, 1952 at 1205; temperature 26°C.-
pH: 7.0-7.2 (Glander, 1946).
Springwater was used locally during the Japanese Administration. Prior to 1946,
water was flowing through a 4-inch pipe to a small treatment plant. In 1946,
the spring had been abandoned (Glander, 1946).
- Altitude reported as 500 ft by Glander (1946) and 375 ft by Piper (1946-47).
2/ Field notes Ted Arnow.
546

Natural Bridge Spring No. 1 (Bobo As Teo No. 1)
Location; Lat 15°ir30" N.-, long 145°45'35" N., south of the road to
Denni Spring about 2,000 ft south of Denni Spring, at altitude of
425 ft (from topographic map).-
Aquifer; Limestone on impermeable bed.
Remarks; Production: 5,000-10,000 gal/d.
Chloride: 50 ppm (Glander, 1946).
38 ppm, Oct. 21, 1952 at 1100; temperature 2?°C.-
pH: 7.0-7.2 (Glander, 1946).
Spring has not been developed.
- Altitude reported as 370 ft by Glander (1946) and 300 ft by Piper (1946-4?)
2/ Field notes Ted Arnow.
Natural Bridge Spring No. 2 (Bobo As Teo No. 2)
Location; Lat 15°11 I 27" N., long 145O45'36" E., about 2,400 feet south of
Denni Spring at altitude of 395 ft (from topographic map).
Aquifer; Limestone on impermeable bed.
Remarks; Production: 3,000-15,000 gal/d (Stearns, 1944).
7,200 gal/d measured on Aug. 1, 1944 (Stearns, 1944).
15,000-20,000 gal/d (Glander, 1946).
Chloride: 50 ppm (Glander, 1946).
46 ppm, Oct. 21, 1952 at 1115; temperature 2?°C.-
pH: 7.0-7.2 (Glander, 1946).
- Altitude reported as 375 ft by Glander (1946) and 300 ft by Piper (1946-47)
2/ Field notes Ted Arnow.
547

Gaging station
Table 63. Sprinqflow records for Denni Spring (Bobo I Denne), 16800000
(also has been called Donnay Spring No. 1)
Location; Lat 15°H'48" N., long 145°45'52" E., 2.8 mi southeast of Tanapag,
3.1 mi east of Garapan, and 5'6 mi northeast of Chalan Kanoa.
Period of record; August 1952 to June 1954 (published as Donni Spring near
Garapan), March 1968, January 1969 to September 1983.
Gage; Water-stage recorder and sharp-crested weir. Altitude of gage is
261 ft from U.S. Navy.
Remarks; Records good except those above 2 ft^/s, which are poor. Water-
quality analyses are given in tables 64-66.
Average discharge; 15 years (water years 1953, 1970-83), 0.643 ftvs (466
acre-ft/yr).
Extremes for period of record; Maximum daily discharge, 8.5 ft /s
Aug. 13, 1978; minimum daily, 0.02 ftVs Sept. 16, 17, 1969.
548

Table 63. Springflow records for Denni SprIng--Continued
A. Annual maximum daily discharge, in cubic feet per second
Water year Date Discharge
1953,7" 1954-!-, --- 1969 2/1970 -----
19711972 1973197419751976 -----1977197819791980 -1981 -1982 -
--- Nov. 2-5, 11-13, 1952 --- Oct. 18, 19, 1953 --- Jan. 1, 1969 --- Oct. 19-22, 1969, Jan. 22-24,
1970 -- May 8, 9, 1971 -- Aug. 11-16, 1972 Oct. 5-8, 1972 --- Aug. 29-31, Sept. 4, 1974 -- Nov. 5, 6, 197^ Aug. 7-10, 1976 Sept. 16-18, 1977 - Aug. 13, 1978 - -- Nov. 9, 10, 1979 ----- -- Sept. 12-14, 1980 --- Aug. 18-21, 1981 -- Jan. 14, 1982
1.81.7.72
2.62.02.71.31.61.81.82.58.57.03.57.01.8
- October 1953 to June 1954.2/- January to October 1969.
549

Table 63. Springflow records for Denni Spring--Continued
Annual minimum daily discharge, in cubic feet per second
Water year Date Di scharge
1953
1954-!- ---1969 -----1970 -----1971 19721973 - 1974 -1975 197619771978 - 1979 -1980 -1981 1982 1983 -
---- Many days in July, August,1953 - ---. -- .
- June 12-21, 1954 - Sept. 16, 17, 1969 --- Oct. 1-15, 1969 - Jan. 27 to Feb. 11, 1971 - June 7 to July 21, 1972 - June 24 to July 14, 1973 - Mar. 21-31, 1974 - July 14-21, 1975 - May 9-17, 1976 -- - Aug. 1-18, 1977 - July 3-7, 14, 1978 - July 25-29, 1979 -- July 1-3, 1980 - July 8, 9, 1981 - June 14-28, 1982 - July 26 to Aug. 6
0.11.05.02.10.21.12.06.12.14.10.20.20.20.12.22.35.08
- October 1953 to June 1954.
C. Instantaneous discharge with water temperatures
(Discharge in cubic feet per second, temperature in degree Celsius)
Date Timenstantaneous discharge
Watertemperature
Feb. 13, 1968 Mar. 28, 1968 Oct. 2, 1969 - Sept. 13, 1971 Aug. 22, 1972 Mar. 20, 1974
134010001400133008201540
0.19 .26
1.1 .46 .23 .12
272727262526
550

Tabl
e 63.
Springflow records
for
Denn
i SprIng--Continued
Year
1952
1953
1954
1968
1969
1970
1971
1972
Tota
l
Mean
Max.
Min.
Total
Mean
Max.
Min.
Tota
l
Mean
Max.
Min.
Tota
l
Mean
Max.
Min.
Tota
l
Mean
Max.
Min.
Tota
l
Mean
Max.
Min.
Total
Mean
Max.
Min.
Tota
l
Mean
Max.
Min.
Ca len
dar
year
207.
65 -57
1.7 .11
__
121.58 .33
2.6 .02
195.35 .5*
2.6 .12
243.21 .67
2.0 .21
187.05 .51
2.7 .12
Jan.
23.27
.75
1.3 .48
15.2
4
.49
.60
.39
16.96
.55
.72
.45
34.2
6
1.11
2.6 .60
7.45 .24
.28
.21
11.33
.37
.44
.31
0.
Feb.
16.96
.61
1.3 .42
9.04 .32
.39
.28
11.9
5
.43
.45
.36
28.52
1.02
1.2 .84
17.33
.62
1.2 .21
7.40 .26
.31
.21
Monthly
Mar.
16.8
0
.54
1.0 .36
6.68 .22
.28
.16
8.94 .29
.32
.26
9.13 .29
.36
.21
21.5
4
.69
.84
.55
26.2
6
.85
1.1 .50
6.97 .22
.27
.20
and
annual discharges,
in cu
bic
Apr.
9.90 .33
.36
.28
3.65 .12
.16
.10
-- 5.58 .19
.21
.15
11.3
7
.38
.50
.28
20.29
.68
1.0 .50
4.84 .16
.20
.15
May
6.76 .22
.28
.18
2.69 .087
.10
.07
3.10 .10
.10
.10
7.39 .24
.28
.21
33.7
4
1.09
2.0 .66
4.11 .13
.15
.13
June
4.18 .14
.18
.12
1.88 .063
.09
.05
2.28 .076
.10
.06
6.09 .20
.24
.15
14.70
.49
.60
.40
3.66 .12
.13
.12
July
3.53 .11
.12
.11
1.72 .055
.08
.04
5.54 .18
.36
.12
16.0
9
.52
.96
.28
13.96
.45
1.5 .12
feet pe
r
Aug.
18.1
1
.58
1.3 .11
2.30 .074
.10
.06
18.30
.59
.78
.28
29.7
1
.96
1.4 .55
51.2
2
1.65
2.7 .78
second
Sept
.
25.32
.84
1.4 .20
33.53
1.12
1.6 .54
2.32 .77
.28
.02
23.0
6
.77
1.2 .50
17.6
3
.59
.90
.40
24.3
2
.81
1.2 .68
Oct.
38.7
9 1.
25
1.6 .63
32.6
11.05
1.7 .57
27.6
1.8
92.
6 .10
15.8
0.51
.60
.50
26.19
.84
1.2 .66
28.17
.91
1.3 .65
Nov.
48.84
1.63
1.8
1.1
18.06
.60
.76
51
-- 17.05
.57
.84
.45
12.7
2.4
2.5
0.36
18.74
.62
.71
.55
18.00
.60
.75
.50
Dec.
26.02
.84
1.2 .60
23.9
4.77
1.4 .42
-- --
21.58
.70
1.1 .45
10.76
.35
.40
.28
15.08
.49
.56
.43
13-0
7.42
50
.34
Water
year
-- --
246.
69 .68
1.8 .11
-- -- -- -- -- -- -- -- --
222.31 .61
2.6 .10
222.
48 .61
2.0 .21
187.82 .51
2.7 .12

Table
6
3.
Sprlngflow
re
cord
s fo
r D
ennI
S
prin
g--
Co
ntin
ue
d
Year
1973
1974
1975
1976
1977
1978
1979
1980
Total
Mean
Max.
Min.
Tota
l
Mean
Max.
Min.
Total
Mean
Max.
Min.
Tota
l
Mean
Max.
Min.
Tota
l
Mean
Max.
Min.
Total
Mean
Max.
Min.
Tota
l
Mean
Max.
Min.
Tota
l
Mean
Max.
Min.
Cale
ndar
year
62.4
5.1
7.5
5.0
6
233.
66 .64
1.8 .12
204.
54 .56
1.7 .14
219.77 .60
1.8 .10
215.93 .59
4.5 .20
488.45
1.34
8.5 .20
197.
39 .54
1.3 .20
217.88 .60
3.5 .12
D
Jan.
8.82 .28
.34
25
6.29 .20
.23
.17
14.95
.48
.61
.37
14.55
.47
.53
.37
14.4
7
.47
.53
.45
18.0
7
.58
.61
.53
25.21
.81
.95
.73
14.0
3
.45
.53
.37
Mont
hly
and
annu
al discharges,
in cu
bic
feet
pe
r second Continued
Feb.
5.36 .19
.22
.15
5.03 .18
.20
.17
10.96
.39
.45
.37
10.3
3
.36
.37
.33
10.8
4
.39
.41
.33
12.96
.46
.53
.41
18.2
0
.65
.73
.60
11.13
.38
.45
.33
Mar.
3.63 .12
.14
.10
4.42 .14
.17
.12
10.27
.33
.37
.29
8.33 .27
.29
.26
10.4
7
.34
.37
.29
11.1
5
.36
.41
.33
16.0
7
.52
.61
.45
10.6
7
.34
.45
.29
Apr.
3.00 .10
.10
.10
5.32 .18
.34
.14
7.53 .25
.29
.23
6.99 .23
.26
.17
8.64 .29
.29
.26
9.20 .31
.33
.26
12.46
.42
.45
.37
7.29 .24
.29
.17
May
2.92 .094
.10
.08
13.4
7
.43
1.0 .18
6.23 .20
.23
.17
11.63
.38
1.1 .10
8.06 .26
.26
.26
7.61 .25
.29
.23
10.55
.34
.37
.29
6.47 .21
.26
.17
June
2.08 .069
.08
.06
6.58 .22
.26
.19
5.40 .18
.20
.17
12.43
.41
.65
.26
7.35 .25
.26
.23
7.14 .24
.26
.23
8.22 .27
.29
.23
5.85 .20
.23
.14
July
2.41 .078
.10
.06
20.93
.68
1.1 .20
7.14 .23
.69
.14
15.00
.48
.90
.26
7.13 .23
.23
.23
18.0
5
.58
1.2 .20
6.98 .23
.23
.20
5.42 .17
.23
.12
Aug.
3.57 .12
.15
.10
28.9
5
.93
1.6 .37
40.38
1.30
1.7 .81
38.9
3
1.26
1.8 .77
6.59 .21
.23
.20
124.
87
4.03
8.5 .61
9.46 .31
.37
.23
8.88 .29
.69
.14
Sept
.
6.14 .20
.25
.15
38.31
1.28
1.6 .85
28.9
8
.97
1.4 .65
33.81
1.13
1.4 .81
27.11
.90
2.5 .23
73.8 2.46
7.0
1.1
13.54
.45
.77
.33
41.8
7
1.40 .35
.37
Oct.
8.91 .29
.55
.20
42.4 1.37
1.7
1.0
31.02
1.00
1.4 .73
29.0
0.9
41.
4 .69
41.22
1.33
4.5 .49
53.4 1.72
,3-0 1.1
34.72
1.12
1.3 .90
44.85
1.45
2.0 .91
Nov.
9.26 .31
.47
.24
39.9
31.33
1.8 .81
22.7
7.7
6.9
6.6
5
20.9
0.7
0.77
.61
49.2 1.64
2.5
1.1
95.2 3.17
7.0
1.1
23.3
9.7
81.
1 .65
30.0
21.
001.
6 .74
Dec.
6.35 .20
.23
.19
22.0
3 71
.81
.65
18.9
1.61
.69
.53
17.87
.58
.61
.53
24.8
5.80
1.0 .65
57.0
01.
844.
5 .95
18.59
.60
.65
.57
31.40
1.01
1.4 .85
Water
year
97-1
7
.27
1.3 .06
153.
82 .42
1.6 .12
236.20 .65
1.8 .14
224.
70 .61
1.8 .10
168.
43 .46
2.5 .20
398.
12
1.09
8.5 .20
326.
29 .89
7.0 .20
188.
31 .51
3.5 .12

Table
63.
Spri
ngfl
ow records
for
Denn
i Sp
ring
Con
tinu
ed
Year
1981
1982
1983
To
tal
Mea
nM
ax.
Min
.
To
tal
Mea
nM
ax.
Min
.
To
tal
Mea
nM
ax.
Min
.
Ca
len
da
r ye
ar
36
1.6
2.9
97.0 .2
2
326.9
3.9
07.0 .3
5
0
Jan.
25
.67
.83
.95
.74
35.2
2
1 . 1
41.
8 .87
13.5
5
.44
-53
.33
Month
ly
and
annual
dis
ch
arg
es,
in cu
bic
fe
et
pe
r se
cond C
on
tinued
Fe
b.
19
.44
.69
.74
.66
24.6
2
.88
1.0 .7
5
8.05 .2
9.3
3.2
6
Mar.
18.1
7
.59
.66
.50
22.
17
.72
.75
.67
7.6
7
.25
.29
.23
Ap
r.
14.6
0
.49
.55
.45
19.2
6
.64
.71
.59
6.60 .2
2.2
6.2
0
May
13.4
2
.43
.50
.39
16.8
1
.54
.59
.47
4.92 .1
6.2
6.1
2
June
9.5
4
.32
.39
.25
11.7
8
.39
.47
.35
3.60 .1
2.1
2.1
2
July
8.99 .2
9.7
5.2
2
16.0
3
.52
1.2 .3
9
3.02 .0
97.1
2.0
8
Aug
.
109.
1
3.5
27.0 1.2
29
.80
.96
1.4 .6
7
6.3
8
.21
.33
.08
Sept.
40.1
1
1.3
43
.5 .87
22.8
0
.76
.92
.59
8.04 .2
7.3
7.2
0
Oct
.
32.9
11.
061.
5 .87
84.8
12.
747.
0 .53
Nov
.
31.7
91.
061.
3 .83
26
.32
.88
1.5 .65
Dec
.
37
.88
1.2
21.5 .9
8
17.3
1.5
6.6
5.5
3
Wate
r ye
ar
36
5.3
1
1.0
07.0 .2
2
301.0
7
.82
1.8 .3
5
190.
27 .52
7.0 .0
8

Table 6k. Chloride concentration of water from Denni Spring
Date Time
1946
1946
May 8, 1952 1250
Aug. 12, 1952 1530
Oct. 21, 1952 1035
Jan. 19, 1953 1430
Mar. 3, 1953
Apr. 7,
July 6 ,
Dec. 16,
June 22,
July 12,
June 26,
1953 0945
1953 1035 1953 1510
1954
1955 1974
Chlor ide
(mg/L)
50
40
45
35 38
36
36
38
3935
3540
100
Temper ature
(°C) Remarks
pH 6.8 (Glander, 1946).
Piper, 1946-47.
32 Discharge, 0.25 ft^/s.
30
27
26.5
27
27
27 Discharge, 1.3 ftvs.
Discharge, 0.10 ftvs.
Hardness, 310 ppm; pH 7.1;sulfate, 15 ppm; alkalinity
Sept. 25
June 10,
June 20,
, 1977
1980
1980
30
30
35
(as CaCO ), 286 ppm.
Hardness, 275 mg/L; total
sol ids, 350 mg/L (Mink,
Specific conductance, 649
dissolved
1977).
ymho.
By W. B. Brewer, using Hach kit
554

[Analyses by: 18 MGL, 18th Medical General Laboratory, Saipan; Tokyo, Tokyo-To Laboratories
for Medical Sciences, Tokyo; USGS, U.S. Geological Survey, Salt Lake City Laboratory;
Layne, Layne International Laboratory, Guam; USGS-2,
Const ituent
Analyses by
pH
Hardness as CaCO
Calcium, dissolved (Ca)
Magnesium, dissolved (Mg)
Potassium, dissolved (K)
Bicarbonate (HCO,)
Alkalinity, total as CaCO
Sulfate, dissolved (SO,)
Chloride, dissolved (Cl)
Fluoride, dissolved (F)
Silica, dissolved (SiO.)
Solids, dissolved, sum of
Nitrogen,dissolved (N0 2 +NO-)
Manganese, dissolved (Mn)
umho
°C
mg/L
mg/L
mg/L
mg/L
mg/L
mg/L
mg/L
mg/L
mg/L
mg/L
mg/L
mg/L
mg/L
wg/L
wg/L
9-8-44
18 MGL
287
106
5.3 4.9^
293
3.6
27~
3-2
337
20
250
0
3-23-50
Tokyo
6.7
253
97
2.4
14
3.5
224
255
4.3
30
2.6
381
2.2
80
80
U.S. Geological Survey,
5-8-52
USGS
632
7-0
298
111
5.2
18
.7
333
8.2
30
0
7.0
359
11
70
7-20-67
Layne
560
7.2
24
270
108
26.7
33.5
311
255
36~
13
355
40
I/
I/
7.2
25
305
58
39
234 -
6
32
0
360
2
Denver Laboratory]
11-19-82
USGS-2
630
6.7
290
110
4.3
21
.8
287
7 36
< .1
7.2
358
2.3
10 < 1
7-2-83
USGS-2
735
7.3
27.5
320
120
4.3
23
.7
< .1
7.3
2.4
4 < 1
Austin Smith and Associates, 1967. Date and laboratory not given.
Includes potassium expressed as sodium.
555

Table 65. Chemical analyses of water from Denni Spring--Continued
[Source: P. A. Mack, Water Quality Laboratory, Commonwealth of theNorthern Mariana Islands]
Date
Feb 3, 1982Mar. 8, 1982Apr. 12, 1982May 3, 1982June 4, 1982July 9, 1982Aug. 10, 1982Aug. 31, 1982Sept. 8, 1982Oct. 7, 1982Nov. 10, 1982Dec. 7, 1982Jan. 19, 1983Feb. 25, 1983May 23, 1983June 20, 1983July 18, 1983Aug. 15, 1983Sept. 8, 1983Oct. 14, 1983
Chloride (mg/L)
32.932.333.733.336.336.833.833.230.528.634.035.033.634.533.8
35.334.445.031.5
Dissolved sol ids (mg/L)
346404288404
314 ..-- --
Conduc tivity (ymho)
674562553625--
717688
513677672696
714701566682690
pH(units)
8.07.47.67.17.37.67.6
7.87.87.77.6
7.8. 7.3
7.7
Turbidi ty (NTU)
0.21.14.20.19 .16 -- ---- --
Alkal i ni ty (mg/L)
__
291292289 --
281286298287
241291293297293
Table 66. Analysis of water from Denni Spring for metals and pesticides
[Analyses by LFE Environmental Analysis Laboratory, Richmond, Calif.
Date of sampling, November 1977- Date of analyses, December 1977]
Const i tuent
Metals
Barium ---Cadmium --- Chromium -----Lead -Mercury --- Selenium
Units
-- mg/L -- mg/L -- mg/L
mg/Lmg/L
-- mg/L __ /i -- mg/L
< 0.01 .04 .006
< .05 .058
4.7 < .005
Const i tuent
Pest icides
Si 1 ver -- -- -Endrin ----------Lindane - -- Methoxychlor --- -Toxaphene --- --- ? 4_n __________jL 9 ~ \J
2, 4, 5-TP Silvex -
Units
mg/L
ppb ppb ppb ppb ppb
< < < < < <
0.005 .01 .01 .01.1.01 .01
556

Denni Spring No. 2 (Bobo I Denne No. 2)
(also has been called Donnay Spring No. 2)
Location: Lat 15°H'59" N., long 145°45'38" E., 2,000 ft northwest of
Denni Spring (No. 1) at altitude 475 ft (from topographic map).
Aquifer; Limestone on impermeable bed (Glander, 1946).
Remarks; Spring issues from cave in a limestone cliff.
Production: 0-2,500 gal/d (Stearns, 1944).
0 gal/d on July 8, 1944 (Stearns, 1944).
0-3,000 gal/d (Glander, 1946).
Chloride: 34 ppm, Oct. 21, 1945 at 1145; temperature 26.5 C.
Spring is too small to be developed.
- Altitude reported as 350 ft by Glander (1946).
Radio Hi 11 Spring No. 1
Location: Lat 15°13'25" N., long 145°45'16" E., 1.2 mi south of Tanapag
School at altitude 500 ft (from topographic map).
Aquifer: Volcanic sediment (Stearns, 1944).
Remarks; Spring was developed during the Japanese Administration.
Production: Varies directly with rainfall: 10,000-30,000 gal/d
(Stearns, 1944).
21,000 gal/d measured on Aug. 28, 1944 (Stearns, 1944).
0-20,000 gal/d (Glander, 1946).
5,000-30,000 gal/d (Piper, 1946-47).
Chloride: 40 ppm (Glander, 1946).
pH: 7.0-7.2 (Glander, 1946).
- Altitude reported as 620 ft by Glander (1946) and 600 ft by Piper (1946-47)
557

Radio Hi 11 Spring No. 2
Location; Lat 15°13'57" N., long 145°45'45" E., 0.7 mi southeast of Tanapag
School at altitude of 350 ft (from topographic map).-
Aquifer: Volcanic sediment (Glander, 1946).
Remarks: Spring enclosed in concrete masonry. Discharged by gravity through
4-in. steel main to west coast main in 1946.
Production: 10,000-20,000 gal/d (Stearns, 1944).
15,520 gal/d measured July 11, 1944 (Stearns, 1944).
15,000-30,000 gal/d (Piper, 1946-47).
Chloride: 70 ppm.
pH: 7.2-7.4.
- Altitude reported by Glander (1946) as 425 ft.
Radio Hill Spring No. 3
Location: Lat 15 O 13'47" N., long 145°46 I 11" E., 0.6 mi south of Mount Achugao
at altitude of 575 ft (from topographic map).-
Aquifer: Volcanic sediment.
Remarks: Spring is not developed and discharges in the valley.
Production: 1,500-5,000 gal/d (Stearns, 1944).
1,500 gal/d measured Aug. 11, 1944 (Stearns, 1944).
0-5,000 gal/d (Glander, 1946).
5,000-10,000 gal/d (Piper, 1946-47).
Chloride: 30 ppm.
pH: 7.6.
- Altitude reported as 300 ft by Glander (1946) and 325 ft by Piper (1946-47).
558

Radio Hi 11 Spring No. 4
Location; Lat 15°13'44" N., long 145°46'06" E., 0.9 mi southwest of Mount
Achugao at altitude 400 ft (from topographic map).-
Aqu i fer: Volcanic sediment.
Remarks; Spring is not developed and discharges into the valley. Yield varies
directly with rainfall, reaching 30,000 gal/d in the wet season.
Production: 5,000-10,000 gal/d (Stearns, 1944).
7,200 gal/d measured July 23, 1944 (Stearns, 1944).
5,000-30,000 gal/d (Piper, 1946-4?).
-f Altitude reported as 200 ft by Glander (1946) and 350 ft by Piper (1546-47).
16802500 East Achugao Spring (Bobo Achugao Hava)
(also has been called Achugau Spring No. 2)
Location; Lat 15°13'54" N., long 145°46'32" E., 0.45 mi southeast of Mount
Achugao at altitude 320 ft (from topographic map).-
Aquifer; Limestone (Stearns, 1944).
Remarks; Spring issues from the foot of a 5-ft ledge of limestone and is
encased in a concrete cistern.
Production: 30,000-60,000 gal/d (Stearns, 1944).
40,000-80,000 gal/d (Glander, 1946).
Chloride: 50 ppm (Glander, 1946).
pH: 7.2-7.4 (Glander, 1946).
For chemical analyses of spring water in December 1944, see table 69.
- Altitude reported as 440 ft by Glander (1946) and 325 ft by Piper (1946-
47).
559

Table 67. Discharge measurements and water temperatures
(Discharge in
Date
Sept. 15, 1965 -Dec. 13, 1968 Jan. 16, 1969 Mar. 6, 1969 Apr. 17, 1969 -May 2, 1969 May 17, 1969 May 31, 1969 June 13, 1969 June 27, 1969 July 12, 1969 July 25, 1969 Aug. 8, 1969 Aug. 22, 1969 Sept. 5, 1969 ~Sept. 19, 1969 -Oct. 3, 1969 Oct. 18, 1969 Oct. 31, 1969 Nov. 15, 1969 ~Nov. 28, 1969 Dec. 12, 1969 Dec. 31, 1969 Jan. 9, 1970 Jan. 23, 1970 Feb. 6, 1970 Feb. 20, 1970 --Mar. 6, 1970 Mar. 20, 1970 Apr. 3, 1970 Apr. 17, 1970 May 1, 1970 May 15, 1970 June 1, 1970 June 15, 1970 June 30, 1970 July 10, 1970 July 24, 1970 Aug. 7, 1970 Aug. 21, 1970 Sept. 4, 1970 Sept. 18, 1970 -Oct. 5, 1970 Oct. 16, 1970
at East Achugao Spr
cubic feet per second,
Time
1020 1320 1120 ....... 0930....... 1020 1020 ....... 0935....... 1000 1020 1025 1005 1015 1005 1010 ....... 1 115 ......... 1050 ....... 1055....... 1035....... 1000 1125 12^5 1105 1015 ....... 0935....... 1035 ....... 0915....... 0940 0930 ....... 0935 0845 ....... 0935....... 0930 - 1020 ....... 0935....... 0940 1010 1105 0950 1005 1005 ....... 1035....... 1000 1020
ing (16802500)
temperature in
I nstantaneousdischarge
0.17 .26 .11 , .10 .... .07.... .06 .... .03.... .05.... .04 - .05 .... .04.... .03.... .04 .04 .... .05.... .02 .... .05 -.... .28.... .12 . .12 . .09 .... .05 ..... .11 .12 .... .25.... .43.... .16 . .10 .... . 15 . . .12 .10 - .10 . .10 .08 .06 - .06 .06 -.... .85.... .44 ,.... .05 ..... .15 .12 .... .14 . .10 .
degrees Celsius)
Watertemperature
- 26.5 26.5...... 26.5. 26.0...... 26.5. 26.0...... 26.5. 26.0. 26.0 25.5. 26.0...... 26.5...... 26.5- 26.0...... 26.5. 26.5- 25.5...... 26.5...... 26.5. 27.0- 26.5...... 25.5- 26.0. 24.5 25.5...... 25.5...... 25.5 25.5- 26.0- 25.5...... 25.5- 25.5. .. 25.5. 25.5. 25.0. 26.0. 25.0. 25.0. 26.0- 26.0. 26.0. 27.0. 26.0
560

Table 6j. Discharge measurements and water temperatures
Date
Nov. 2, 1970 Nov. 20, 1970 Dec. 9, 1970 Dec. 21, 1970 Jan. 12, 1971 Jan. 28, 1971 Mar. 9, 1971Apr. 7, 1971 May 10, 1971 May 27, 1971 July 23, 1971 Aug. 6, 1971 Aug. 25, 1971 Sept. 14, 1971 Oct. 8, 1971 June 9, 1972 Aug. 22, 1972 Sept. 29, 1972 --Dec. 1, 1972 Dec. 29, 1972 Mar. 20, 1972 Apr. 8, 1974
at East Achuaao
Time
1015 - 1110 - 1015 - 0940 - 1010 -----__ fiQOC ____________ uyo ------______ 0955 ______ 0940 - 1015 - 1100 - 1005 - 1030 - 1025 - 1025 -______ 0950
______ 12 35 -
1035 -______ 0930
------ 1520 -
Spr i ng--Cont inued
Instantaneous discharge
. o.11 1 1nfi.(Jo -------
.11 . .06 ________ 06 ------- \J \J
________ 06 _ _ --- U w
11 _______. i iO 1-------- .21 -------
.15 ________ 10 _ _ ---
1 U
.13 ________ .05 -. .09 ________ . 31 _______. o. .31 . o
o t1 9
. o
. .04
Water temperature
o£ ni£ no£ no£ n
--- 25 0._. _? \J
25.0 i£ nr\f n
25.0 o£ no£ n
___ oc nL~ J U
o£ n
25.025.0
25.0
r\f A
___ ?c nL. J . U
o£ n--- Zb.U
561

West Achugao Spring (Bobo Aguchao Lagu)
(also has been called Achugao Spring No. 1)
Location: Lat 15°1V16" N., long 145°46'06" £., 0.7 mi upstream from mouth
of Achugao Stream and 1.3 mi east of Tanapag at altitude of
270 ft (from topographic map).
Aquifer; Sandy marl (dander, 1946).
Remarks: Spring issues from crevices in marl beds in western slope of Talufofo
basin and is enclosed in a concrete cistern.
Production: 20,000-60,000 gal/d (Stearns, 1944).
20,000-50,000 gal/d (Glander, 1946).
100,000 gal/d maximum (Curione, 1949).
Chloride: 70 ppm (Glander, 1946).
pH: 7.2-7.4 (Glander, 1946).
For chemical analyses of the spring water in December 1944, see table 69.
- Altitude reported as 340 ft by Glander (1946) and 300 ft by Piper (1946-47).
Table 68. Discharge measurements and water temperatures at West Achuqao Spring (16804000)
(Discharge in cubic feet per second, temperature in degrees Celsius)
Date
IAPI 77 1Q&4 _____wall, f-i- , l j*i"
Oct. 3, 1967 Dec. 13, 1968 Jan. 15, 1968 Fph 1Q 1Q&Q - -- C U ' ' > *^7^_?
Mar. 6, 1969 Apr. 17, 1969 May 1 , 1969 May 17, 1369 -- Mav 23 1 Q 69 ------Ma y z.^ , i _/ <jj
June 13, 1S69 June 27, 1969 July 12, 1969 July 25, 1969 Aug. 8, 1969 fii.n 90 1O£G _____
Time
- 1225 1650 - 1700 -
- 1335 ---- 1140 1400 - 1400 - 1410 - 1140 -
1 O *3 ^ 1235 1205 1150 1210 -____ 17iiC ______
I nstantaneous di scharge
- 0.04- .34
oQ-------- ,2o ------- nQ -- --- .Uo -------
________ .05________ .05 - . ____ .03________ n-3 _______ ** j
n i-------- .02 ------- . .04 - .02 . 04
\J *
. .02 ________ .03 _______
n o.02 ------- ________ no _______
Water temperature
o/r r--- Zb.t) 26.5_ _ o£ c:
o£ c--- Zb o o£ cf)£ no£ c--- 2c.t> ?£ c--- Zoo o f. no£ c*>£ nf\f r\--- Zb .1) oA c--- Zc.b
___ oA c
562

Table 68. Pi scharqe measurements and water temperatures
Date
Sept. 5, 1969 Sept. 19, 1969 Oct. 3, 1969 Oct. 31, 1969 Nov. 15, 1969 Nov. 18, 1969 Dec. 12, 1969 Dec. 31, 1969 Jan. 9, 1970 Feb. 6, 1970 Feb. 20, 1970 Mar. 6, 1970 Mar. 20, 1970 Apr. 3, 1970 -Apr. 10, 1970 Apr. 17, 1970 May 1 , 1970 May 15, 1970 June 1, 1970 June 15, 1970 June 30, 1970 July 10, 1970 July 24, 1970 Aug. 21, 1970 Sept. 18, 1970 --Oct. 5, 1970 Oct. 16, 1970 Nov. 2, 1970 Nov. 20, 1970 Dec. 9, 1970Dec. 21, 1970 Jan. 12, 1971 Jan. 28, 1971 Mar. 9, 1971 - Apr. 7, 1971 -May 10, 1971 -May 28, 1971 July 23, 1971 Aug. 6, 1971 Aug. 25, 1971 Oct. 12, 1971
at West Achuqao
Time
1200 - 1220 - 1050 - 1155...... -,055------ 1225 - 1400 - 1200 -...... 1115 ...... 1120 - 1015 - 1040 - 1015 -...... 10 35...... o845 - 0940 ------ 1035...... -IQ25 -...... 1135 ...... 1040 - 1040 - 1105 - 1220 - 1110 - 1145 -...... 10 55------ 1120 - 1145 - 0910 -...... 1325...... 1330 ............ 1305 ............ 1330 ...... 1550...... 1315 ...... 1410 -...... 1305 ----- ... 1335 ............ 1305 ...... 1345----- - 1430 -
Spr ing--Cont i nued
Instantaneousdischarge
0.02 .01 . .02 ........ .30....... . 15 .......
.08 ........ . 19 ........... . .27 .... ......... .29 ............... .43 ............... .26........ <13 ............ .14 ............... . 13 ............... .07....... .05 -
. .06
. .06
. .06
........ .03 .......
. .02
. .02
. . n .......
........ .26 -----
........ . 26 .............. .24 -
. .22 .22
.11 . .10 ..... . 10 . .08 . .06 .. .40 ........ .17 ............... .36 ............... .14 ............... .09 .......- .40 .12 ........ . 3 4 .......
Watertemperature
26.0 26.5 26.5
26.026.026.5
26.5 25.5
26.026.0
25.5 25.5 25.5 25.5
26.0 25.5 25.5--- 25.5
26.0 25.5
26.026.028.025.026.027.026.026.026.026.026.026.026.026.026.026.026.026.025.026.026.0
Measurement at West Achugao Stream, lat 15°14'20" N., long 145046'06" E., 0.7 mile above mouth and 1.2 miles east of Tanapag:
Aug. 30, 1968 0.32 ft3/ s
563

Tanapag Spring No. 1 (Bobo Agatan)
Location: Lat 15°13'49" N., long 145°45'10" E., 0.6 mi upstream from mouth
and 0.7 mi south of Tanapag School at altitude 120 ft (from
topographic map).
Aquifer: Andesite lava (Stearns, IS 1* 2*), volcanic lava (Piper, 1946-47).
Remarks; Spring is encased in a concrete cistern.
Production: 25,000-40,000 gal/d (Stearns, 1944).
36,000 gal/d measured Aug. 14, 1944 (Stearns, 1944).
20,000-40,000 gal/d (dander, 1946).
144,000 gal/d (Curione, 1949).
Chloride: 30 ppm (Glander, 1946).
pH: 7.4-7.6 (Glander, 1946).
Well 8a was drilled in the spring in September 1944. The discharge was reported
as artesian water flowing from the well by Mink (1977). For chemical analyses
of the spring water in December 1944, see table 69.
-f Altitude reported as 100 ft by Glander (1946) and 300 ft by Piper (1946-47).
Tanapag Spring No. 2 (Bobo Mames)
Location: Lat 15°13'59" N., long 145°45'15" E., 0.5 mi south of Tanapag
School at altitude of 60 ft (from topographic map).
Aquifer; Andesite lava (Stearns, 1944).
Remarks; Spring is encased in a concrete cistern.
Production: 25,000-80,000 gal/d (Stearns, 1944).
54,000 gal/d measured July 20, 1944 (Stearns, 1944)
20,000-60,000 gal/d (Glander, 1946).
Chloride: 30 ppm (Glander, 1946).
pH: 7.4-7.6 (Glander, 1946).
For chemical analyses of the spring water in December 1944, see table 69.
- Altitude reported as 50 ft by Piper (1946-47).
564

Starch Factory Springs
Location; Lat 15°13'29" N., long 145°44'13" E., and lat 15°13'28" N., long
145044'16" E., 0.2 mi southwest of Public Works buildings at
altitude 5 ft (from topographic map).
Aquifer: Limestone.
Remarks: Springs flow into Tanapag Swamp and were used only for raw water
because of high salinity.
Production: 1.5-2.5 Mgal (Stearns, 1944).
1-2 Mgal (dander, 1946).
2 Mgal, with 100,000-130,000 gal/d pumped for use.
Chloride: 1,206 ppm, Aug. 22, 1944 (Stearns, 1944).
680 ppm, September 1945 (Davis, 1959).
900 ppm (Glander, 1946).
480-1,200 ppm (Piper, 1946-4?).
981 ppm, May 8, 1952 at 1515; temperature, 32°C.
2,420 ppm July 2, 1956 at 0900 (low and rising tide)-'
1,200 ppm, June 16, 1980 (Ronimus, 1981).
1,200 mg/L, Sept. 27, 1982 (Nance, 1982).
pH: 7.4-7.6 (Glander, 1946).
Specific conductance: 4,580 umhos, June 16, 1980 (Ronimus, 1981)
I/
For chemical analyses of the spring water in September 1945> see table 69.
- Sample collected by D. C. Cox, analyzed by P. E. Ward (Cox, 1956).
565

Table 69. Chemical analyses of spring water (1944)
[Source: Davis, 1958. Reported in parts per million . Analyses by:
18 MGL, 18th Medical General Laboratory, Saipan; HBWS, Honolulu Board of Water Supply]
Constituent
Samp] ing
Analyses
pH -
Hardness as CaCO,
Calcium, dissolved (Ca)
Magnesium, dissolved (Mg) -
Sodium, dissolved (Na)
Potassium, dissolved (K)
Bicarbonate (HCO-)
Alkalinity, total as CaCO-
Sulfate, dissolved (SO.)
Chloride, dissolved (Cl)
Fluoride, dissolved (F)
Silica, dissolved (SiO.)
Solids, dissolved, sum ofconstituents
Nitrate, dissolved (NO.) Iron, dissolved (Fe)
Manganese, dissolved (Mn) -
Aluminum, dissolved (Al)
date
by
mg/L
mg/L
mg/L
mg/L
mg/L
mg/L
mg/L
mg/L
mg/L
mg/L
mg/L
mg/L
mg/L
ug/L
yg/L
ug/L
Achugao
West 12-1-44
18 MGL
269
100
4.81/26
325
13
330
12
380
01,800
0
Spring
East 12-5-44
18 MGL
~
312
112
8.01/49
332
23
69
0
14
478
0300
0
Tanapag
No. 1 12-1-44
18 MGL
17045
141/32
232
16230
47
310
0800
0
Spring
No. 2 12-5-44
18 MGL
16742
152/39
256
8.2
23
0
55
325
0500
0
Starch
Factory
Springs
Sept. 1945
HBWS
465112
45
35512
252~
86
680
.6
7.3
1,560
7.6200~
Radio Hill
Spring 12-1-44
18 MGL
6.9
353131
6.31/14.5
400328
12
30
0
12
492
0
240
200
270
I/ Parts per million is numerically equivalent to milligrams per liter,
Includes potassium expressed as sodium.
566

Chemical analyses of ground water
Table 70. Chemical analyses of ground water
[Source: Davis, 1959. Reported in parts per million- . Analyses by:
18 MGL, 18th Medical General Laboratory, Saipan; Tokyo, Tokyo-To Laboratories for Medical Science, Tokyo;
USGS, U.S. Geological Survey, Salt Lake City Laboratory]
Const ituent
Sampling date
Analyses by
Specific conductance -----
pH
Hardness as CaCO.
Noncarbonate hardness ----
Calcium, dissolved (Ca)
Magnesium, dissolved (Mg)-
Sodium, dissolved (Na)
Bicarbonate (HCO )
Alkalinity, totalas CaCO
Sulfate, dissolved (SO.)
Chloride, dissolved (Cl) -
Fluoride, dissolved (F)
Silica, dissolved (SiO ) -
Solids, dissolved, sumof constituent
Nitrate, dissolved (NO.)
Iron, dissolved (Fe)
ymho
mg/L
mg/L
mg/L
mg/L
mg/L
mg/L
mg/L
mg/L
mg/L
mg/L
mg/L
mg/L
mg/L
ug/L
1
12-1-44
18 MGL
7.2
252
86
9.1
32
295
9.4
49
0
9.5
348
0
300
39-8-44
18 MGL
7.4
445~
129
29
212
338
57
395
0
2.4
1,170
16
110
Well
5 9-8-44
18 MGL
8.0
360
124
12
18
361
5.3
67
4.8
483
3.6
130
6 9-8-44
18 MGL
8.1
460~
108
46
335
272
55630
5.6
1,529
500
31 3-27-50
Tokyo
6.9
220
86
1.1
12.9
205
6.9
3.5
17
2.2
333
1.2
40
^57
5-8-52
USGS
7,770
7.4
1,150
942
177
173
254
315
2,480
5,000~
40
Asgona B
9-8-44
18 MGL
228
74
9.9
31
206
169
12
70
6.8
335
18
100
Parts per million is numerically equivalent to milligrams per liter.
2/ Well 57 was being used only to maintain Isley reservoir level during Maui I breakdown. Had been
pumped steadily for 3 weeks, 24 hours per day at about 350-400 gallons per hour, when sampled
(field notes Ted Arnow).
567

Table 71. Chemical analyses of water from Maui-type wells (1945-67)
[Reported in parts per million . Analyses by Tokyo: Tokyo-To Laboratories for Medical Science,
Tokyo, USGS, U.S. Geological Survey, Salt Lake City Laboratory;
Layne, Layne International Laboratory, Guam; HBWS, Honolulu Board of Water Supply]
Const i tuent
Sampling date
nU ______________________ ___P«
Total hardness as CaCO
Calcium, dissolved (Ca)
Magnesium, dissolved (Mg) Sodium, dissolved (Na)
Potassium, dissolved (K) Bicarbonate (HCO.)
Carbonate (CO,)
Alkalinity, total as CaCO.
Sulfate, dissolved (SO.)
Chloride, dissolved (Cl)
Silica, dissolved (SiO_)
Sol ids, dissolved,
Nitrate, dissolved. (NO )
Manganese, dissolved (Mn)
umho
°C
mg/L
mg/L
mg/L
mg/L
mg/L
mg/L
mg/L
mg/L
mg/L
mg/L
mg/L
mg/L
mg/L
mg/L
mg/L
mg/L
wg/L
wg/L
3-23-50
Tokyo
7.1
130 30
296 13
175
199 38
614
5.0
1,508
.5 0
140
Maui^5-8-52
USGS
843
8.2
246
87 7.1
210
10
24
148
464
50
1
(3)
7.1 25
627
115 82
312 994
0
1,815
15
7-20-67
Layne
4,000
7.1
24
670
440
176
56
600
311
255
1,150
1.4
2,540
30
Maui II9-14-45
HBWS
2,670
7.1
.7 465 258 112 45
355 12
252
207 86
680 67.3
1,558
7.6 200 100
3-23-50
Tokyo
7.1
134
26
440
10
176
49 838
40
1,990 .4
20 11
Maui5-8-52
USGS
1,500 7.2
308
95 17
0 290 48
330
849
40
IV7-20-67
Layne
2,200
7.5
24
440
330
132
26.7
330
293
240
620
1.2
1,440
25
(3)
7.1
25
436
77 59
344 600
0
568
25
Parts per million is numerically equivalent to milligrams per liter.
Not pumping for one hour before sampling.
Austin Smith and Associates, 19&7- Date and laboratory not given.
568

Table 72. Chemical analyses of water from wells 3> 31? 76 (1967)
[Source: Austin, Smith and Associates
Const i tuent
LIpH
Temperature, water ---- -Turbidity ----- ______ _
Total hardness as CaCO, - Calcium (Ca) - --
Magnesium (Mg) -------- -
Carbon dioxide (CO.) -- -
Methyl orange alkalinity ---
Sulfate (SO^)
Chloride (Cl)
Fluoride (F) --- ----- -
Total solids -
Iron (Fe) -----
Units
°C
NTU
mg/L
mg/L
mg/L
mg/L
mg/L
mg/L
mg/L
mg/L
mg/L
mg/L
, 1967. Reported in parts per
3 (new)
7.3
25
2
422
52
71
40
328
458
0 1,370
.093
Well31 (old)
7.5
25
0
270
69
24
18
234
4.5
26
0 317
.009
mi 1 1 ion]
76
7.1
25
0
318
58
43
41
308
14
64
0 461
.011
Parts per million is numerically equivalent to milligrams per liter.
569

Table 73« Chemical analysis of water from U.S Coast Guard well (1971)
[Analyses by U.S. Geological Survey, Salt Lake City Laboratory]
July 25, 1971 Constituent Unit at 1000
Hardness, total - mg/L 660
Calcium, dissolved (Ca) -- mg/L 150
Magnesium, dissolved (Mg) mg/L 69
Sodium, dissolved (Na) mg/L 600
Percent sodium - - percent 66
Sodium adsorption ratio -- 10
Potassium, dissolved (K) mg/L 17
Chloride, dissolved (Cl) mg/L 1,200
Fluoride, dissolved (F) mg/L 0
Silica, dissolved (Si02 ) mg/L S.k
Nitrite and Nitrate,as dissolved N - - mg/L 2.3
Iron, dissolved (Fe) ijg/L 40
Boron, dissolved -- ijg/L 280
570

Table Ik. Analyses of ground water for metals and pesticides (1977)
[Analyses by LFE Environmental Analysis Laboratories, Richmond, Calif.
Date of sampling, November 1977* Date of analyses, December 1977]
Const i tuent
Metals
r\ | 3 d I I \*
Barium ----------
Cadmium ---------
Chromium --------
Lead .
Mercury ---- ---
Selenium --------
Silver - -
Pest icidesEndrin ------ --
Lindane -- -----
Methoxychl or ----
Toxaphene -- --
9 2i-n --------- _ .
2, 4, 5-TP
Silvex ---------
Unit
mg/L
mg/L -- mg/L
-- mg/L
mg/L
mg/L
mg/L
mg/L
ppb
ppb
ppb
ppb
ppb
ppb
6
<0.01
.03
.004
< .05
.058
4.4
< .005
< .005
< .01
< .1
< .01
< .1
< .01
< .01
16
<0.01
.04
.004
< .05
.077
.6
< .005
< .005
< .01
< .01
< .01
< 1
< .01
< .01
We! 150
<-0.01
.03
.002
< .05
.049
< .5
< .005
< .005
< .01
< .01
< .01
< .1
< .01
< .01
Maui IV
<0.01
.04
.005
< .05
.072
< .5
< .005
< .005
< .01
< .01
< .01
< .1< .01
< .01
ppb - parts per billion.
571

Table 75- Chemical analyses of water from wells 103 and 111 (1382)
WellConst i tuent
Date Time -
Specific conductance -----_ LJpH -------------------------
Temperature (water) --- ---Hardness as CaCO, --------
Noncarbonate hardness --- -
Calcium, dissolved (Ca) -
Magnesium, dissolved (Mg)
Sodium, dissolved (Na) - Percent sodium -- -
Sodium adsorption ration -
Potassium, dissolved (K) -
Alkalinity, total as CaCO -
Sulfate, dissolved (SO.) -
Chloride, dissolved (Cl)
Fluoride, dissolved (F) ----
Silica, dissolved (SiCK)
Solids, dissolved, sum of const itutents ------------
Ni trogen, dissolved (NCK + NO.,) -
Iron, dissolved (Fe) - -
Manganese, dissolved (Mn)
ymho
°C
mg/L
mg/L
mg/L
mg/L
mg/L
percent
mg/L
mg/L
mg/L
mg/L
mg/L
mg/L
mg/L
ug/L ug/L
103
11-18-82 1110
874
7.0
28.5
330
66
120
6.3
52
26
1.3 2.0
262
11
110
< .1
6.5
484
4.0
37
3
111
11-18-82 1200
1,320
7.1
28.5
350
130
110
18
120
42
2.3 4.7
223
30
270
< .1
8.8
712
3.6
28
3
572

Table 76. Chemical analyses of water from wells 76, 144, 164, 171 (1983)
[U.S. Geological Survey]
Const i tuent
Date Time -
Specific conductance ----- LJpH ------------------------
Temperature (water) ------
Hardness as CaCCL ----------
Noncarbonate hardness ------
Calcium, dissolved (Ca) ----
Magnesium, dissolved (Mg)
Sodium, dissolved (Na) --- Percent sodium -------
Sodium adsorption ration -
Potassium, dissolved (K) -
Alkalinity, total as CaCO -
Sulfate, dissolved (SO.)
Chloride, dissolved (Cl)
Fluoride, dissolved (F) ----
Silica, dissolved (SiO^)
Solids, dissolved, sum of const itutents -- -
Ni trogen, dissolved (NO + N0~)
Iron, dissolved (Fe) -------
Manganese, dissolved (Mn)
ymho
°c
mg/L
mg/L
mg/L
mg/L
mg/L
percent
mg/L
mg/L
mg/L
mg/L
mg/L
mg/L
mg/L
mg/L
vg/L vg/L
76
7-1-83 1355
883
7.3
28.5
360
130
7.6
42
20
1.0
1.5
< .1
26
1.5 4 1
1447-1-83 1250
3,250
7. A
28.0
560
380
140
52
470
64
8.6
15 180 330 870 < .1 7.6
2,000
2.5
40
10
Well164
7-1-83 1055
9,400
7.6
28.5
1,300
1,100
250
170
1,500
70
18
41
197
360
2,800
< .1
8.2
5,260
1.8
40
10
171
6-30-83 0645
26,300
7.6
3,200
2,700
330
570
5,200
77 40
130
500
550
9,300
< .1
10
16,400
< .10
160
5,000
573

[U.S. Geological Survey]
WellConst i tuent
Date Time -
Specific conductance _ LJpH -------------------------
Temperature (water)
Hardness as CaCO, - Noncarbonate hardness - -
Calcium, dissolved (Ca) --
Magnesium, dissolved (Mg)
Sodium, dissolved (Na) --- Percent sodium -
Sodium adsorption ration -
Potassium, dissolved (K) -
Alkalinity, total as CaCO, -
Sulfate, dissolved (SO.) -
Chloride, dissolved (Cl)
Fluoride, dissolved (F) --
Silica, dissolved (SiCL)
Solids, dissolved, sum ofconst i tutents -
Ni trogen, dissolved (NCL + NO.,)
Iron, dissolved (Fe) - -
Manganese, dissolved (Mn)
umho
°C
mg/L
mg/L
mg/L
mg/L
mg/L
percent
mg/L
mg/L
mg/L
mg/L
mg/L
mg/L
mg/L
mg/L
ug/L ug/L
148
7-1-83 1021
653
7.5
27.5
270
75 100
A. 7
28
18 .8
.2.6
7.9
51 < .1
9.1
334
3.1 6
< 1
149
7-1-83 1104
560
7.5
27.0
250
5 94
4.6
18
13 .5
.8
249
6.7
29
< .1
9.2
326
3.2 10
2
4-23-83 1000
639
7.9
270 6
100
4.7
23 16
.6
2.9
263
8.8 42
< .1
8.6
348
9 2
150
7-1-83 1045
577 7.5
27.5
260
96
4.7
19 14
.5
1.1
< .1
10
2.6
3
3
574

REFERENCES
Arnow, Ted, 1952, Report to High Commissioner Trust Territory of the Pacific Islands: Unpublished typewritten report, 7 p.
- 1953> Report on Island water system for Saipan: Unpublished typewritten report to U.S. Navy, 19 p.
Austin, Smith and Associates, 1967, Engineering report covering a master planned water system and sewerage system for the Island of Saipan, Mariana Islands: Honolulu, Hawaii, 50 p.
--- 1972, Engineering report covering extensions and improvements to the existing water system for the Island of Saipan, Mariana Islands.
Ayers, J. F., 1981, Evaluation of the groundwater resources of the Agag Basin, Saipan: University of Guam, Technical Report No. 31? 82 p.
Boniface, Major W. H., 19^5, Report on the water system of Saipan developed by the Corps of Engineers, U.S. Army, 15 June 19^A to 1 August 19^5: Unpub lished typewritten report, 2k p.
Bowers, N. M., 1950, Problems of resettlement on Saipan, Tinian, and Rota, Mariana Islands: University of Hawaii, 258 p.
Bryan, E. H., Jr., 19^6, A geographic summary of Micronesia and notes on the climate of Micronesia: U.S. Commercial Co., Economic Survey, v. 2-1, 102 p.
Cloud, P. E., Schmidt, R. G., and Burke, H. W., 1956, Geology of Saipan, Mariana Islands: Part 1. General Geology: Geological Survey Professional Paper 280-A, 126 p.
Cox, D. C., and Evans, T. R., 1956, Water supply, _m Utilities study for Island of Saipan: Honolulu, Hawaii, Belt, Lemmon and Lo, section IV, p. 41-86.
Curione, Ensign Charles, 19^9, Report on Island water system, Saipan, Mariana Islands: Unpublished typewritten report, 21 p.
Davis, D. A., 1959, Water resources, in Military geology of Saipan, Mariana Islands: Chief of Engineers U.S. Army, v. 2, 96 p.
Davis, T., Jr., 1973> Saipan Island water plan, District Administrator Mariana District, Trust Territory of the Pacific Islands, 113 p.
Glander, Lt. Raymond, 19^6, Report on the water supply system of Saipan, Naval Operating Base - Public Works: Unpublished typewritten report, 61 p.
2GK , Inc./CE Maguire, Inc., 1982, Saipan water supply system study: Saipan,
220 p.
Hawaii Architects and Engineers, Inc., 1968, Saipan: Trust Territory physical planning program, 69 p.
575

Knott, Norman, 1972, Groundwater Resources Saipan, Mariana Islands: Department of Resources and Development, Report of Trust Territory of the Pacific I s lands.
M and E Pacific, 1978, Water management plan for Saipan, Rota and Tinian: Department of Public Works, Commonwealth of the Northern Marianas, various paging.
Mink, J. F., 1969, Ground-water development in the Trust Territory: The Earth Sciences Group, Inc., Washington D.C., 71 p.
----- 1977? Water resources and supply in the Northern Mariana Islands: Saipan, Tinian and Rota: Physical planning program for Northern Mariana Islands, 27 p.
Mitt(h)eilungen von Forschungreisenden und Gelehrten aus den deutschen Schutzgebieten [Communications from explorers and scientist from the German protectorates]: Annual publications, Berlin, 1902-13.
Nance, Tom, 1982, Status and future development of Saipan's water supply: Honolulu, Hawaii, Belt, Collins and Associates, 94 p.
Nettleman, Pete, 1953 > Water supply system for Saipan: Unpublished typewritten report, 19 p.
Oliver, D. L., 1961, The Pacific Islands: The National History Library, 456 p.
Pacific Island Year Book, 1978, 13th edition: New York, 512 p.
Pacific Planning and Design Consultants, 1978, Physical development master plan for the Commonwealth of the Northern Mariana Islands, Saipan, Volume II: Office of Transitional Studies, Trust Territory of the Pacific Islands, various paging.
Piper, A. M., 1946-47, Water resources of Guam and the ex-Japanese mandated islands in the western Pacific: Unpublished typewritten report, p. 100-129.
Reyes, William, not dated, A copy of Japanese records. A translation of Japanese records covering approximately the years 1915-1937: University of Hawaii, Hamilton Library, unpublished mimeographed report, 19 p.
Ronimus, A. D., 1981, Saipan: Commonwealth of the Northern Mariana Islands, Ground water resources and their use: University of Hawaii, School of Public Health, 44 p.
Schal 1 enberg, R. T., and Ford, J. I., 1978, Report on field trip to Guam and Saipan, 13-23 December, 1978: Unpublished processed U.S. Army Corps of Engineers report, Honolulu, Hawaii, 63 p.
Schott, Prof. Dr. G., 1938, Handbuch der Klimatologie: Band IV, Teil T, Klimakunde der Sudsee Inseln, Berlin 1938, p. 114.
576

Spoehr, Alexander. 195^? Saipan, the ethnology of a war-devastated island: Chicago Natural History Museum, 380 p.
Stearns, H. T., 1?44, Water, rock, and mineral resources of the Island of Saipan, Mariana Islands: U.S. Geological Survey, Honolulu, Hawaii, unpublished typewritten report, 28 p.
Tayama, Risaburo, 1939? Report on ground water on Saipan Island, Tropical Industry Institute, Palau islands; Bull. No. 2, translated by M. Shimakura. 1948: Unpublished typewritten report, 13 p. and tables.
Taylor, R. C., 1973, An atlas of Pacific Island rainfall: Hawaii Institute of Geophysics Data Report No. 25, Honolulu, Hawaii, 5 p., App. A-E, various pag ing.
Tenorio Environmental Engineering, 1973, Evaluation of the groundwater resources at Isley Field region and other areas for planning and development. Saipan, Mariana Islands: District Administrator Marianas, Saipan, Mariana Islands, 32 p.
U.S. Army Corps of Engineers, 1981, Susupe - Chalan Kanoa flood control study, Saipan, Northern Marianas: U.S. Army Engineer District, Honolulu, p. A29-A40.
U.S. Department of the Navy, Office of the Chief of Naval Operation, 19^4, Civil affairs handbook. Mandated Mariana Islands: Washington D.C., 205 p.
U.S. Geological Survey, 1962, Surface water supply of Mariana. Caroline and Samoa Islands through June 1960: Geological Survey Water-Supply Paper 1751, p. 5, 6.
1968-74, Water resources data for Hawaii and other Pacific areas, water years 1968-74: U.S. Geological Survey Water-Data Reports 1968, 296 p.; 1969, 289 p.; 1970, 299 p.; 1971, 333 p.; 1972, 280 p.; 1973, 264 p.; 197^, 277 p.
1975-76, Water resources data for Hawaii and other Pacific areas, water years 1975 and 1976: U.S. Geoloqical Survey Water-Data Reports HI-75-1, 401 p.; HI-76-1, 445 p.
1977, Surface water supply of the United States, 1966-70: U.S. Geological Survey Water Supply Paper 2137, p. 692-695, 735, 736.
1977-80, Water resources data for Hawaii and other Pacific areas, water years 1977-80, v. 2. Trust Territory of the Pacific Islands, Guam, American Samoa, and Northern Mariana Islands: U.S. Geological Survey Water-Data Reports HI-77-2, 90 p.; HI-78-2, 108 p.; HI-79-2, 126 p.; HI-80-2, 158 p.
1581-82, Water Resources Data Hawaii-other Pacific areas, water years 1981 and 1982, v. 2. Guam, Northern Mariana Islands, Federated States of Micronesia, Palau Islands, and American Samoa: U.S. Geological SurveyWater-Data Reports HI-81-2, 1^8 p.: HI-82-2, 146 p.
577

U.S. National Oceanic and Atmospheric Administration, 1970-72, 'Climatolonical Data, Pacific: v. 15, no. 6-12, v. 16, 17, nos. 1-12.
1973-82, Climatological Data, Hawaii and Pacific: v. 69-78, nos. 1-12.
U.S. Weather Bureau, 195^-55, Climatological Data, Hawaii: v. 50, 51, nos. 1-12.
----- 1956-70, Climatological Data, Pacific: v. 1-14, nos. 1-12, v. 15, nos. 1-5.
Von Kotzebue, Otto. 1821 , A voyage of discovery into the South Sea and Bering Strait: London, v. I, p. 79.
World Health Organization, 1971? International standards for drinking water, 3rd ed., 70 p.
Young, M. W. H., Wong, D. E., Chun, M. J., and Young, R. H. F., 1977, Sanitary Survey of major municipal water systems, Trust Territory of the Pacific Islands: Unpublished typewritten report, 95 p.
578