Embed Size (px)
Citation preview
American Planning Association
Planning Advisory Service Report Number 559
Barbara McCann and Suzanne Rynne, Editors
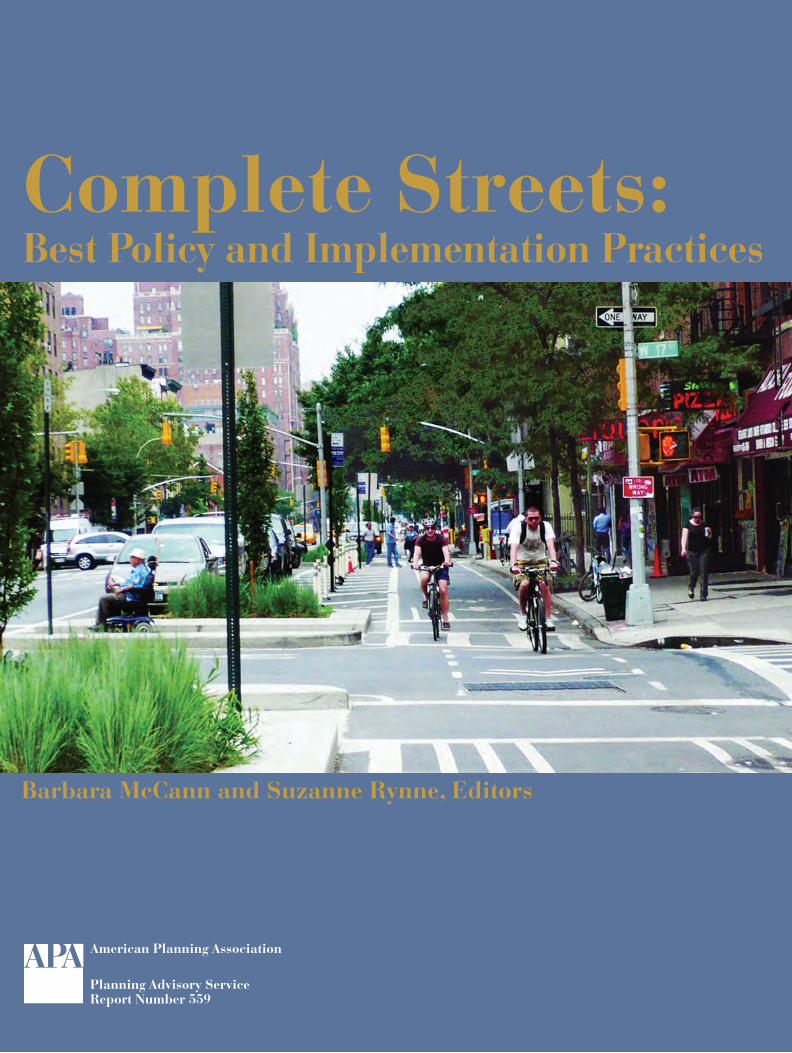
Complete Streets:Best Policy and Implementation Practices
Com
plete Streets A
merican
Plan
nin
g Association
PA
S R
eport N
um
ber 559
COMPLETE STREETS: BEST POLICY AND IMPLEMENTATION PRACTICES
Chapter 1: Introduction ...............................................................................................................1
Chapter 2: Adopting a Policy and Building Support ..................................................................9
Case Studies
Pierce County, Washington ............................................................................................ 10
Columbia, Missouri ......................................................................................................... 13
Rochester, Minnesota ...................................................................................................... 15
Kirkland, Washington ..................................................................................................... 17
Columbus, Ohio ............................................................................................................... 19
East-West Gateway Council of Governments, Missouri .......................................... 21
Chapter 3: Elements of a Complete Streets Policy ...................................................................23
Case Studies
Decatur, Georgia ............................................................................................................... 25
Oregon ................................................................................................................................ 28
Virginia Department of Transportation ....................................................................... 30
Arlington County, Virginia ............................................................................................ 32
Roanoke, Virginia ............................................................................................................. 33
Chapter 4: Integration and Institutionalization: The Strategic Points of Intervention ............35
Case Studies
University Place, Washington ....................................................................................... 36
Santa Barbara, California ................................................................................................ 38
Washtenaw County, Michigan ....................................................................................... 39
Fort Collins, Colorado ..................................................................................................... 40
Sacramento, California .................................................................................................... 41
Barbara McCann and Suzanne Rynne, aicp, Editors
t a B l E o f C o n t E n t S
Chapter 5: Making the Transition: Planning for Change and Addressing Problems ...............45
Case Studies
New Haven, Connecticut ................................................................................................ 46
Chicago ............................................................................................................................... 47
Charlotte, North Carolina ............................................................................................... 48
Pennsylvania Department of Transportation ............................................................. 50
Metropolitan Transportation Commission, California ............................................. 53
Redmond, Washington .................................................................................................... 54
Seattle .................................................................................................................................. 59
Chapter 6: Handling Costs ........................................................................................................65
Case Studies
New York City ................................................................................................................... 66
Colorado Springs, Colorado .......................................................................................... 69
Florida ................................................................................................................................. 71
Boulder, Colorado ............................................................................................................ 73
San Diego County, California ........................................................................................ 75
Chapter 7: Creating Complete Streets: Design Principles and Features .................................79
Case Studies
Louisville, Kentucky ........................................................................................................ 82
Massachusetts Department of Transportation ........................................................... 83
Chapter 8: Lessons Learned from the Case Studies ..............................................................101
References ................................................................................................................................107
Appendix A: Complete Streets Bibliography ...........................................................................109
Appendix B: Model Complete Streets Policies ........................................................................117
45
It should be clear that complete streets policies can and should
lead to changes in transportation planning, design, and construc-
tion processes. But how do communities make the transition from
traditional, automobile-based transportation planning to a more
inclusive and multimodal process? What are the biggest issues they
must resolve? And how do they measure the success of their new
way of doing business?
CHAPTER 5
Making the Transition: Planning for Change and Addressing Problems
s
46 Complete Streets: Best Policy and Implementation Practices
This chapter addresses these issues. It explores implementa-tion planning, training, perfor-mance measures, and exception procedures. It also examines how some jurisdictions have shifted their transportation pri-orities and what that has meant for their relationships with other agencies that control roads in their community.
IMPLEMENTATION PLANNINGIt is too easy to adopt a strongly worded complete streets resolu-tion or even a law—and then let it sit, unimplemented. Many communities have taken years to move their policies from paper into practice, with fits and starts along the way. For example, Or-egon’s 1971 bike bill was ignored by many local governments until a 1992 lawsuit led to a court decision confirming that the law must be applied to all road projects. (See sidebar, p. 28.)
In Massachusetts, the 1996 bicycle and pedestrian accom-modation law calls for “reason-able provisions” for bicyclists and pedestrians, but the Mas-sachusetts Highway Depart-ment struggled to understand what that meant substantively, and transportation modes other than automobiles remained an afterthought. A full complete streets implementation process was not born in the state until the state highway design manual was rewritten in 2006.
One way to get things moving is to create an implementation plan—or to charge a committee with doing so. An implementa-tion plan can identify documents and processes that need to be changed, assign responsibility for who will be making such changes, and name specific doc-uments or processes that should be created as part of complete streets implementation. This was the case in New Haven, Connecticut. In order to back
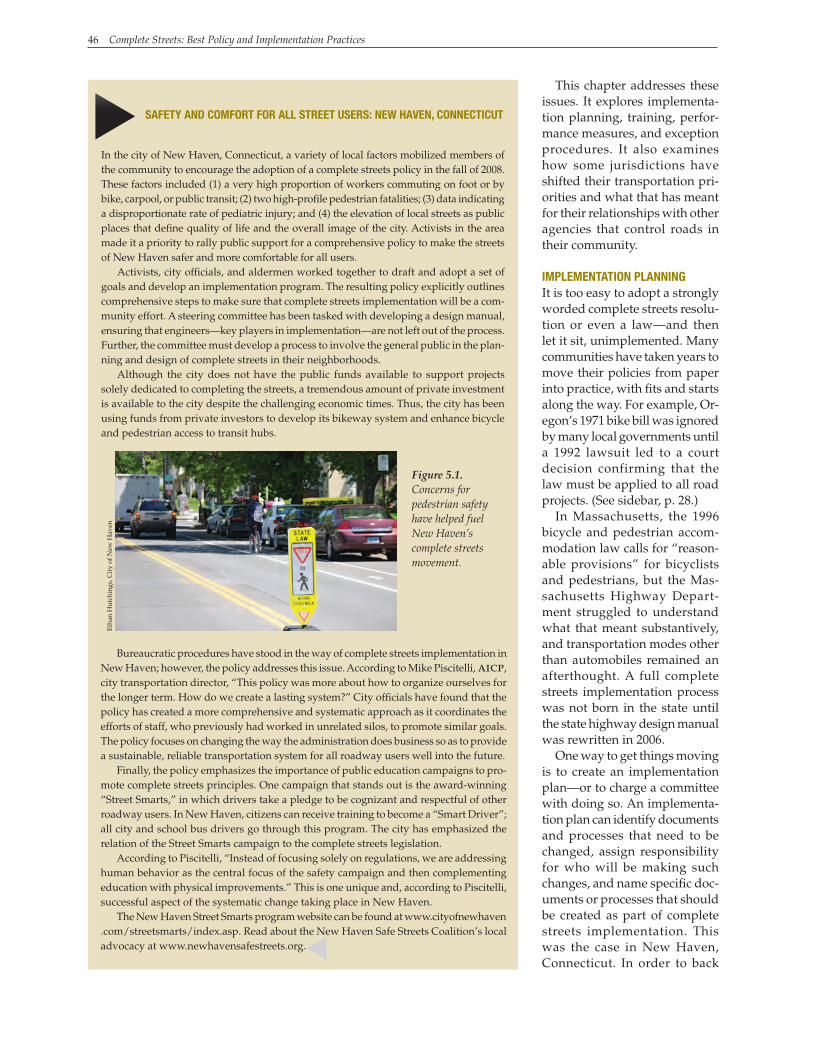
In the city of New Haven, Connecticut, a variety of local factors mobilized members of the community to encourage the adoption of a complete streets policy in the fall of 2008. These factors included (1) a very high proportion of workers commuting on foot or by bike, carpool, or public transit; (2) two high-profile pedestrian fatalities; (3) data indicating a disproportionate rate of pediatric injury; and (4) the elevation of local streets as public places that define quality of life and the overall image of the city. Activists in the area made it a priority to rally public support for a comprehensive policy to make the streets of New Haven safer and more comfortable for all users.
Activists, city officials, and aldermen worked together to draft and adopt a set of goals and develop an implementation program. The resulting policy explicitly outlines comprehensive steps to make sure that complete streets implementation will be a com-munity effort. A steering committee has been tasked with developing a design manual, ensuring that engineers—key players in implementation—are not left out of the process. Further, the committee must develop a process to involve the general public in the plan-ning and design of complete streets in their neighborhoods.
Although the city does not have the public funds available to support projects solely dedicated to completing the streets, a tremendous amount of private investment is available to the city despite the challenging economic times. Thus, the city has been using funds from private investors to develop its bikeway system and enhance bicycle and pedestrian access to transit hubs.
sAfETy ANd COMfOrT fOr ALL sTrEET usErs: NEw HAvEN, CONNECTICuT
s
Figure 5.1. Concerns for pedestrian safety have helped fuel New Haven’s complete streets movement.
Bureaucratic procedures have stood in the way of complete streets implementation in New Haven; however, the policy addresses this issue. According to Mike Piscitelli, aicp, city transportation director, “This policy was more about how to organize ourselves for the longer term. How do we create a lasting system?” City officials have found that the policy has created a more comprehensive and systematic approach as it coordinates the efforts of staff, who previously had worked in unrelated silos, to promote similar goals. The policy focuses on changing the way the administration does business so as to provide a sustainable, reliable transportation system for all roadway users well into the future.
Finally, the policy emphasizes the importance of public education campaigns to pro-mote complete streets principles. One campaign that stands out is the award-winning “Street Smarts,” in which drivers take a pledge to be cognizant and respectful of other roadway users. In New Haven, citizens can receive training to become a “Smart Driver”; all city and school bus drivers go through this program. The city has emphasized the relation of the Street Smarts campaign to the complete streets legislation.
According to Piscitelli, “Instead of focusing solely on regulations, we are addressing human behavior as the central focus of the safety campaign and then complementing education with physical improvements.” This is one unique and, according to Piscitelli, successful aspect of the systematic change taking place in New Haven.
The New Haven Street Smarts program website can be found at www.cityofnewhaven .com/streetsmarts/index.asp. Read about the New Haven Safe Streets Coalition’s local advocacy at www.newhavensafestreets.org.
Eth
an H
utch
ings
, Cit
y of
New
Hav
en
s
Chapter 5. Making the Transition: Planning for Change and Addressing Problems 47
up its complete streets policy with action, the city established a steering committee to focus on policy development, establish a complete streets design manual, encourage community involvement, spearhead an educational cam-paign, and work with city police officers to ensure that traffic enforcement is in alignment with the policy goals.
Seattle and Chicago have focused on a systematic review of all documents that need to be updated to implement the policy. Seattle also established an internal complete streets steering committee to help clarify and define the daily operational practices that the Department of Transportation would take to implement the policy.
The California DOT, Caltrans, adopted a limited policy in 2001 and expanded it in 2008 to include transit and apply to seniors and people with disabilities. Following the update, Caltrans decided to create an implementa-tion plan, overseen by a high-level steering committee, that engaged all 12 of the depart-ment’s districts and created specific next steps. Among other items, the plan called for a re-view of all relevant transportation documents and for reports on specific topics such as work-zone issues and how to incorporate changes into repaving and maintenance projects.
Such formal implementation plans are the exception rather than the rule. The places that have moved beyond the initial policy state-ment have usually done so by creating a more detailed transportation plan, design manual, or design standards, often while working to apply complete streets principles to specific projects. Other places have been content to take a more ad hoc approach, learning from the experience of pilot projects, with the in-tent to codify new standards and procedures later.
CHANGING EvErydAy TrANsPOrTATION PLANNING PrOCEssEsTraditionally, engineers and planners in transportation agencies and public works departments have made their day-to-day decisions on the basis of the demands for roadway capacity expansion and repair. One of the biggest challenges for complete streets advocates is changing business as usual. New planning processes can help guide planners and engineers through new procedures and ways of thinking.
One of the most systematic changes to date has occurred in Charlotte, North Carolina. Prior
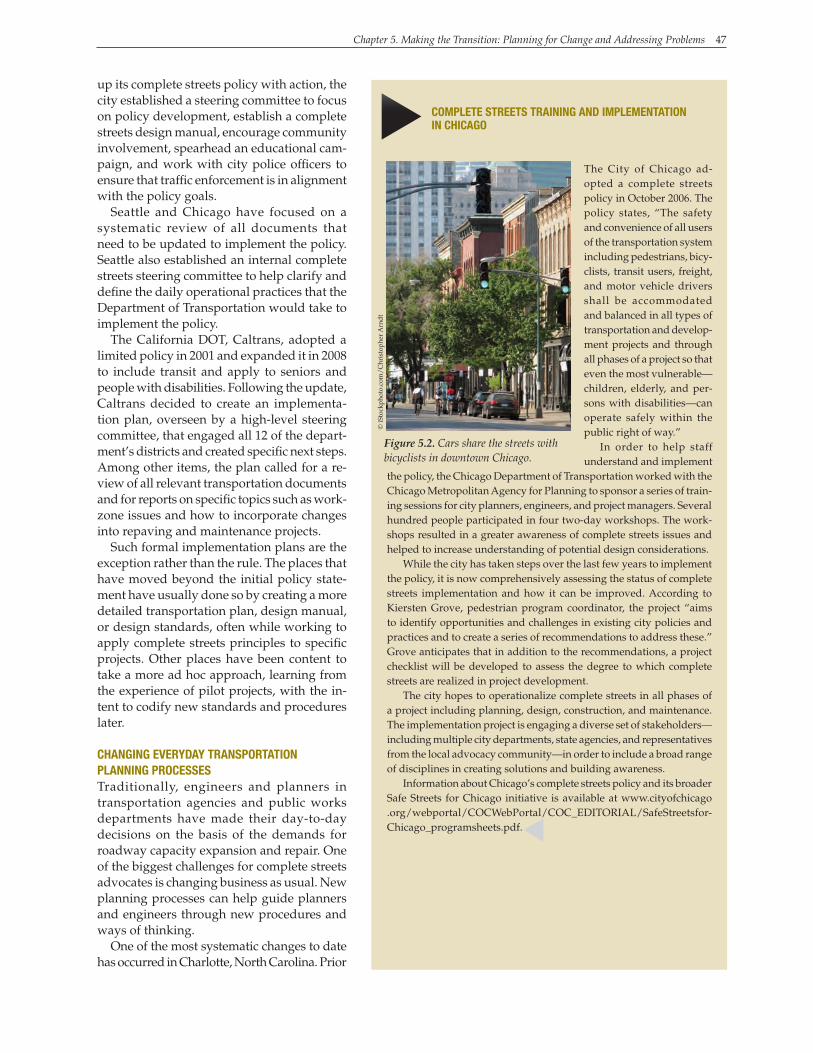
The City of Chicago ad-opted a complete streets policy in October 2006. The policy states, “The safety and convenience of all users of the transportation system including pedestrians, bicy-clists, transit users, freight, and motor vehicle drivers shall be accommodated and balanced in all types of transportation and develop-ment projects and through all phases of a project so that even the most vulnerable—children, elderly, and per-sons with disabilities—can operate safely within the public right of way.”
In order to help staff understand and implement
COMPLETE sTrEETs TrAINING ANd IMPLEMENTATION IN CHICAGO
sthe policy, the Chicago Department of Transportation worked with the Chicago Metropolitan Agency for Planning to sponsor a series of train-ing sessions for city planners, engineers, and project managers. Several hundred people participated in four two-day workshops. The work-shops resulted in a greater awareness of complete streets issues and helped to increase understanding of potential design considerations.
While the city has taken steps over the last few years to implement the policy, it is now comprehensively assessing the status of complete streets implementation and how it can be improved. According to Kiersten Grove, pedestrian program coordinator, the project “aims to identify opportunities and challenges in existing city policies and practices and to create a series of recommendations to address these.” Grove anticipates that in addition to the recommendations, a project checklist will be developed to assess the degree to which complete streets are realized in project development.
The city hopes to operationalize complete streets in all phases of a project including planning, design, construction, and maintenance. The implementation project is engaging a diverse set of stakeholders—including multiple city departments, state agencies, and representatives from the local advocacy community—in order to include a broad range of disciplines in creating solutions and building awareness.
Information about Chicago’s complete streets policy and its broader Safe Streets for Chicago initiative is available at www.cityofchicago .org/webportal/COCWebPortal/COC_EDITORIAL/SafeStreetsfor-Chicago_programsheets.pdf. s
Figure 5.2. Cars share the streets with bicyclists in downtown Chicago.
© iS
tock
phot
o.co
m/
Chr
isto
pher
Arn
dt
48 Complete Streets: Best Policy and Implementation Practices
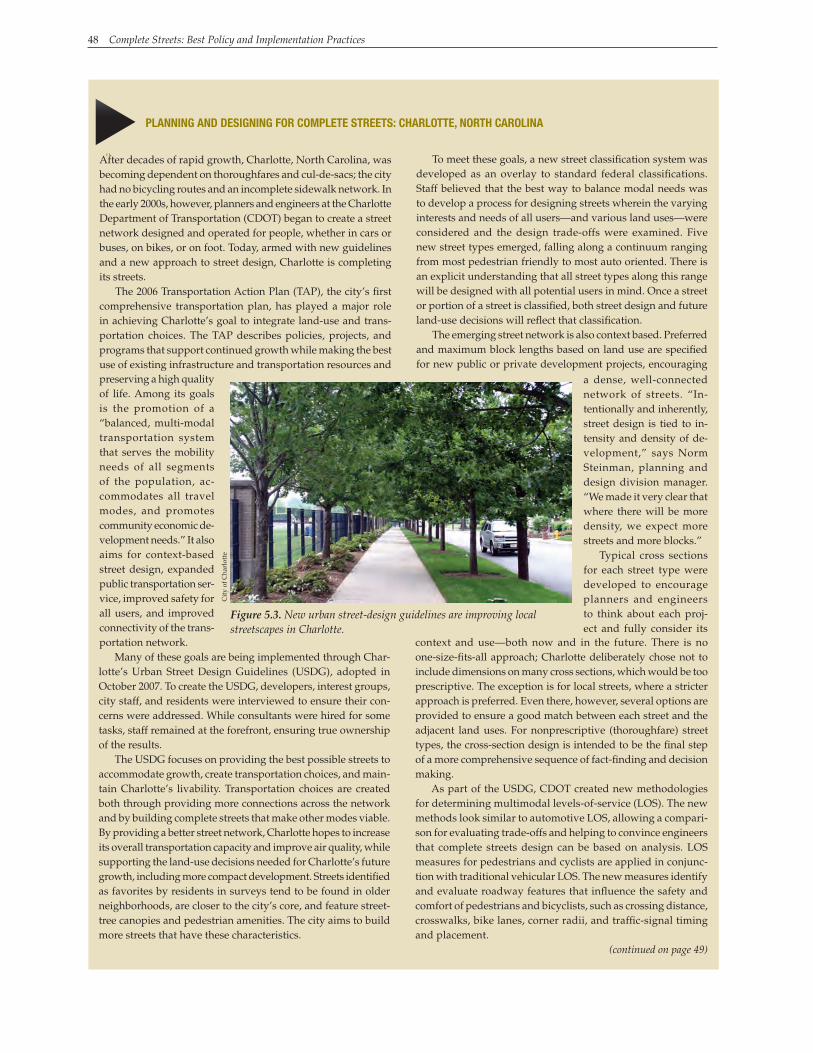
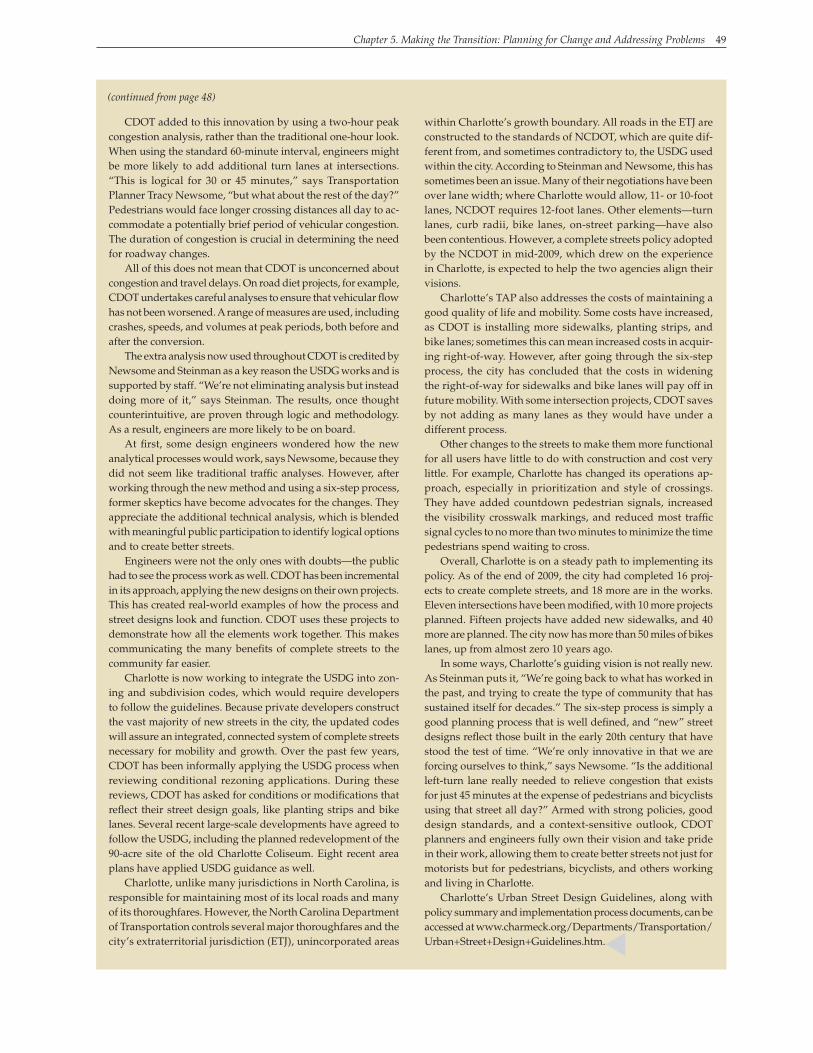
After decades of rapid growth, Charlotte, North Carolina, was becoming dependent on thoroughfares and cul-de-sacs; the city had no bicycling routes and an incomplete sidewalk network. In the early 2000s, however, planners and engineers at the Charlotte Department of Transportation (CDOT) began to create a street network designed and operated for people, whether in cars or buses, on bikes, or on foot. Today, armed with new guidelines and a new approach to street design, Charlotte is completing its streets.
The 2006 Transportation Action Plan (TAP), the city’s first comprehensive transportation plan, has played a major role in achieving Charlotte’s goal to integrate land-use and trans-portation choices. The TAP describes policies, projects, and programs that support continued growth while making the best use of existing infrastructure and transportation resources and
PLANNING ANd dEsIGNING fOr COMPLETE sTrEETs: CHArLOTTE, NOrTH CArOLINA
,,
s
To meet these goals, a new street classification system was developed as an overlay to standard federal classifications. Staff believed that the best way to balance modal needs was to develop a process for designing streets wherein the varying interests and needs of all users—and various land uses—were considered and the design trade-offs were examined. Five new street types emerged, falling along a continuum ranging from most pedestrian friendly to most auto oriented. There is an explicit understanding that all street types along this range will be designed with all potential users in mind. Once a street or portion of a street is classified, both street design and future land-use decisions will reflect that classification.
The emerging street network is also context based. Preferred and maximum block lengths based on land use are specified for new public or private development projects, encouraging
(continued on page 49)
preserving a high quality of life. Among its goals is the promotion of a “balanced, multi-modal transportation system that serves the mobility needs of all segments of the population, ac-commodates all travel modes, and promotes community economic de-velopment needs.” It also aims for context-based street design, expanded public transportation ser-vice, improved safety for all users, and improved connectivity of the trans-portation network.
Many of these goals are being implemented through Char-lotte’s Urban Street Design Guidelines (USDG), adopted in October 2007. To create the USDG, developers, interest groups, city staff, and residents were interviewed to ensure their con-cerns were addressed. While consultants were hired for some tasks, staff remained at the forefront, ensuring true ownership of the results.
The USDG focuses on providing the best possible streets to accommodate growth, create transportation choices, and main-tain Charlotte’s livability. Transportation choices are created both through providing more connections across the network and by building complete streets that make other modes viable. By providing a better street network, Charlotte hopes to increase its overall transportation capacity and improve air quality, while supporting the land-use decisions needed for Charlotte’s future growth, including more compact development. Streets identified as favorites by residents in surveys tend to be found in older neighborhoods, are closer to the city’s core, and feature street-tree canopies and pedestrian amenities. The city aims to build more streets that have these characteristics.
a dense, well-connected network of streets. “In-tentionally and inherently, street design is tied to in-tensity and density of de-velopment,” says Norm Steinman, planning and design division manager. “We made it very clear that where there will be more density, we expect more streets and more blocks.”
Typical cross sections for each street type were developed to encourage planners and engineers to think about each proj-ect and fully consider its
context and use—both now and in the future. There is no one-size-fits-all approach; Charlotte deliberately chose not to include dimensions on many cross sections, which would be too prescriptive. The exception is for local streets, where a stricter approach is preferred. Even there, however, several options are provided to ensure a good match between each street and the adjacent land uses. For nonprescriptive (thoroughfare) street types, the cross-section design is intended to be the final step of a more comprehensive sequence of fact-finding and decision making.
As part of the USDG, CDOT created new methodologies for determining multimodal levels-of-service (LOS). The new methods look similar to automotive LOS, allowing a compari-son for evaluating trade-offs and helping to convince engineers that complete streets design can be based on analysis. LOS measures for pedestrians and cyclists are applied in conjunc-tion with traditional vehicular LOS. The new measures identify and evaluate roadway features that influence the safety and comfort of pedestrians and bicyclists, such as crossing distance, crosswalks, bike lanes, corner radii, and traffic-signal timing and placement.
Figure 5.3. New urban street-design guidelines are improving local streetscapes in Charlotte.
Cit
y of
Cha
rlot
te
Chapter 5. Making the Transition: Planning for Change and Addressing Problems 49
CDOT added to this innovation by using a two-hour peak congestion analysis, rather than the traditional one-hour look. When using the standard 60-minute interval, engineers might be more likely to add additional turn lanes at intersections. “This is logical for 30 or 45 minutes,” says Transportation Planner Tracy Newsome, “but what about the rest of the day?” Pedestrians would face longer crossing distances all day to ac-commodate a potentially brief period of vehicular congestion. The duration of congestion is crucial in determining the need for roadway changes.
All of this does not mean that CDOT is unconcerned about congestion and travel delays. On road diet projects, for example, CDOT undertakes careful analyses to ensure that vehicular flow has not been worsened. A range of measures are used, including crashes, speeds, and volumes at peak periods, both before and after the conversion.
The extra analysis now used throughout CDOT is credited by Newsome and Steinman as a key reason the USDG works and is supported by staff. “We’re not eliminating analysis but instead doing more of it,” says Steinman. The results, once thought counterintuitive, are proven through logic and methodology. As a result, engineers are more likely to be on board.
At first, some design engineers wondered how the new analytical processes would work, says Newsome, because they did not seem like traditional traffic analyses. However, after working through the new method and using a six-step process, former skeptics have become advocates for the changes. They appreciate the additional technical analysis, which is blended with meaningful public participation to identify logical options and to create better streets.
Engineers were not the only ones with doubts—the public had to see the process work as well. CDOT has been incremental in its approach, applying the new designs on their own projects. This has created real-world examples of how the process and street designs look and function. CDOT uses these projects to demonstrate how all the elements work together. This makes communicating the many benefits of complete streets to the community far easier.
Charlotte is now working to integrate the USDG into zon-ing and subdivision codes, which would require developers to follow the guidelines. Because private developers construct the vast majority of new streets in the city, the updated codes will assure an integrated, connected system of complete streets necessary for mobility and growth. Over the past few years, CDOT has been informally applying the USDG process when reviewing conditional rezoning applications. During these reviews, CDOT has asked for conditions or modifications that reflect their street design goals, like planting strips and bike lanes. Several recent large-scale developments have agreed to follow the USDG, including the planned redevelopment of the 90-acre site of the old Charlotte Coliseum. Eight recent area plans have applied USDG guidance as well.
Charlotte, unlike many jurisdictions in North Carolina, is responsible for maintaining most of its local roads and many of its thoroughfares. However, the North Carolina Department of Transportation controls several major thoroughfares and the city’s extraterritorial jurisdiction (ETJ), unincorporated areas
(continued from page 48)
within Charlotte’s growth boundary. All roads in the ETJ are constructed to the standards of NCDOT, which are quite dif-ferent from, and sometimes contradictory to, the USDG used within the city. According to Steinman and Newsome, this has sometimes been an issue. Many of their negotiations have been over lane width; where Charlotte would allow, 11- or 10-foot lanes, NCDOT requires 12-foot lanes. Other elements—turn lanes, curb radii, bike lanes, on-street parking—have also been contentious. However, a complete streets policy adopted by the NCDOT in mid-2009, which drew on the experience in Charlotte, is expected to help the two agencies align their visions.
Charlotte’s TAP also addresses the costs of maintaining a good quality of life and mobility. Some costs have increased, as CDOT is installing more sidewalks, planting strips, and bike lanes; sometimes this can mean increased costs in acquir-ing right-of-way. However, after going through the six-step process, the city has concluded that the costs in widening the right-of-way for sidewalks and bike lanes will pay off in future mobility. With some intersection projects, CDOT saves by not adding as many lanes as they would have under a different process.
Other changes to the streets to make them more functional for all users have little to do with construction and cost very little. For example, Charlotte has changed its operations ap-proach, especially in prioritization and style of crossings. They have added countdown pedestrian signals, increased the visibility crosswalk markings, and reduced most traffic signal cycles to no more than two minutes to minimize the time pedestrians spend waiting to cross.
Overall, Charlotte is on a steady path to implementing its policy. As of the end of 2009, the city had completed 16 proj-ects to create complete streets, and 18 more are in the works. Eleven intersections have been modified, with 10 more projects planned. Fifteen projects have added new sidewalks, and 40 more are planned. The city now has more than 50 miles of bikes lanes, up from almost zero 10 years ago.
In some ways, Charlotte’s guiding vision is not really new. As Steinman puts it, “We’re going back to what has worked in the past, and trying to create the type of community that has sustained itself for decades.” The six-step process is simply a good planning process that is well defined, and “new” street designs reflect those built in the early 20th century that have stood the test of time. “We’re only innovative in that we are forcing ourselves to think,” says Newsome. “Is the additional left-turn lane really needed to relieve congestion that exists for just 45 minutes at the expense of pedestrians and bicyclists using that street all day?” Armed with strong policies, good design standards, and a context-sensitive outlook, CDOT planners and engineers fully own their vision and take pride in their work, allowing them to create better streets not just for motorists but for pedestrians, bicyclists, and others working and living in Charlotte.
Charlotte’s Urban Street Design Guidelines, along with policy summary and implementation process documents, can be accessed at www.charmeck.org/Departments/Transportation/Urban+Street+Design+Guidelines.htm. s
50 Complete Streets: Best Policy and Implementation Practices
decision making had focused on meeting automobile level-of-service standards, but the development of the new Urban Street Design Guide-lines has led to a transportation planning process that is flexible, inclusive, well-documented, and clear. The Charlotte Department of Transportation’s six-step process focuses on project context and has fostered creative solutions to trans-portation questions.
1. Define the existing and future land use and urban design context.
2. Define the existing and future transportation context.
3. Identify deficiencies.
4. Describe future objectives.
5. Recommend street classification and test initial cross-section.
6. Describe trade-offs and select cross-section.
The process ensures that planners understand the project and the area that surrounds it, and is applied to all plans, programs, and projects that could affect existing streets or result in new streets. This includes area plans, streetscape plans, neighbor-hood improvement plans, develop-ment proposal reviews, and prepa-ration of capital improvement plans. Area planning, in particular, benefits from the process, as it provides the framework necessary for integration of land use and transportation on a larger scale.
Other places are using checklists as a way to ensure early consid-eration of the needs of all users. PennDOT uses a bicycle and pe-destrian checklist throughout its project planning and program-ming, scoping, and final design processes to ensure that bicycle and pedestrian accommodations are considered from the very beginning of a project. On a regional scale, the Metropolitan Transportation Com-mission (MTC), the San Francisco Bay Area’s MPO, adopted a routine
PennDOT is working to change its traditional automobile-oriented approach. It has emphasized context-sensitive solutions since 2001, and the agency’s compliance with federal ADA requirements has been key in revising design guidelines for accommodat-ing pedestrian access. The 2008 Smart Transportation Guide, developed in partnership with the New Jersey DOT, has further enabled PennDOT to consider the needs of all users and integrate all modes of transportation. Finally, the state’s secretary of trans-portation, Allen Biehler, has been a leader in thinking about a complete transportation system encompassing multiple roads, rather than just focusing on highways.
One of the most helpful tools PennDOT uses to take a proactive approach to com-plete streets is its Bicycle and Pedestrian Checklist. The checklist is used throughout PennDOT’s project planning and programming, scoping, and final design processes, and it ensures that bike and pedestrian accommodations are considered from the very beginning of a project. According to Danielle Spila, director of PennDOT’s Policy Office, the checklist is just one of various complete streets–type policies in place throughout PennDOT under the umbrella of its Smart Transportation policy.
MOvING TOwArd COMPLETE sTrEETs: PENNsyLvANIA dEPArTMENT Of TrANsPOrTATION
s
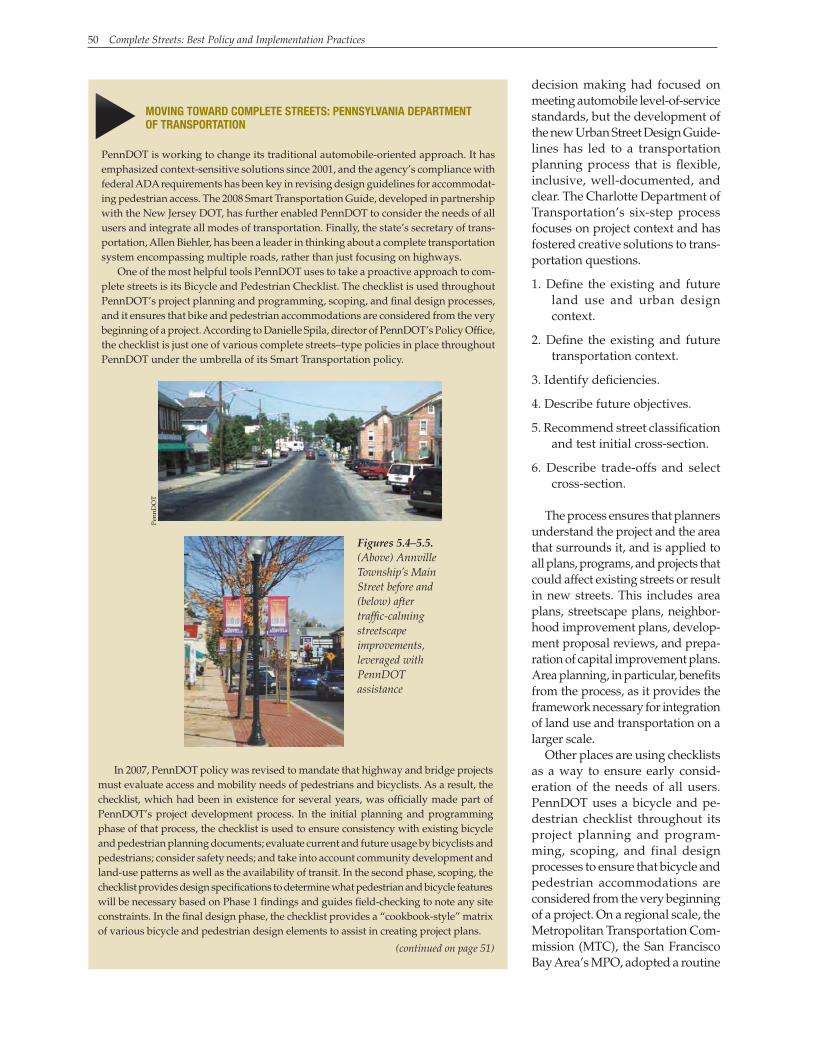
Figures 5.4–5.5. (Above) Annville Township’s Main Street before and (below) after traffic-calming streetscape improvements, leveraged with PennDOT assistance
Penn
DO
T
In 2007, PennDOT policy was revised to mandate that highway and bridge projects must evaluate access and mobility needs of pedestrians and bicyclists. As a result, the checklist, which had been in existence for several years, was officially made part of PennDOT’s project development process. In the initial planning and programming phase of that process, the checklist is used to ensure consistency with existing bicycle and pedestrian planning documents; evaluate current and future usage by bicyclists and pedestrians; consider safety needs; and take into account community development and land-use patterns as well as the availability of transit. In the second phase, scoping, the checklist provides design specifications to determine what pedestrian and bicycle features will be necessary based on Phase 1 findings and guides field-checking to note any site constraints. In the final design phase, the checklist provides a “cookbook-style” matrix of various bicycle and pedestrian design elements to assist in creating project plans.
(continued on page 51)
Chapter 5. Making the Transition: Planning for Change and Addressing Problems 51
The checklist is important because it acts as a data-gathering piece, pulling together all of the necessary information early in the planning process so that proper funding can be applied to ensure the inclusion of bicycle and pedestrian facilities. According to Ben DeVore, a civil engineer and PennDOT bike/ped coordina-tor, mandatory use of the checklist has had a positive impact on provision of accommodation. Most accommodation needs are now identified early in the process, and design solutions can be engineered in from the start. The checklist also enables PennDOT to include local communities and transportation users; relationships are established through having one-on-one conversations with these stakeholders to determine their needs. However, DeVore’s experience has shown him that the effectiveness of the checklist to a large extent depends on who uses it. Project managers are of-ficially responsible for completing checklists, but DeVore completes the checklists for all projects in his district to ensure that adequate attention is paid to this step.
Other challenges to successful implementation remain. Patrick Roberts, a former PennDOT planner who now works as principal transportation planner for the City of Pittsburgh, as-serts that local planners must work with PennDOT to ensure that accommodation needs are met on projects in their communities. While PennDOT’s jurisdiction in urban areas is minor—Roberts estimates that PennDOT is involved with about 5 percent of the roads within Pittsburgh—the roads it does work on are vital for connectivity throughout the city.
Cost is always an issue, according to DeVore. ADA accom-modation is absolutely required, so sometimes a project must be scaled back to incorporate all the required improvements. When multimodal needs are considered very early in the process, the costs are incorporated into PennDOT’s project budget from the beginning and are not as much of an obstacle. If bike/ped improvements are added to an active project, however, the local municipality may be asked to come up with the additional funds, and that can be a problem.
Sidewalks can be another sticking point. In Pennsylvania, responsibility for sidewalk maintenance has been delegated to municipalities, so while PennDOT will build sidewalks if they are incorporated into the project design early in the process, the municipality must still sign a maintenance agreement. Local politics can play a role as well. In more rural areas where the car is king, politicians don’t see a need for complete streets and are often against reducing lane capacity to accommodate other modes of transportation.
Through its Smart Transportation policy, the driving force of which is consideration of all modes, PennDOT is moving toward a complete streets perspective. The bicycle and pedestrian check-list is an important tool to make sure that accommodation issues are considered very early in the process, so that these facilities can be planned and designed into a project from the start.
For more information on PennDOT’s Smart Transporta-tion initiative, see www.smart-transportation.com. The Smart Transportation Guidebook can be downloaded at www.smart-transportation.com/guidebook.html. The Bicycle and Pedestrian Checklist, Appendix J in PennDOT’s Design Manual 1A, can be found at ftp.dot.state.pa.us/public/Bureaus/design/PUB10A/Appendix/Append-J.pdf.
(continued from page 50)
s
accommodation checklist in 2008 for those projects applying for funding through the American Recovery and Reinvestment Act (see MTC sidebar, p. 53).
1. Consistency with Bicycle/Pedestrian Planning Documents
• Is the transportation facility included in or related to bicycle and pedestrian facilities identified in a master plan?• MPO/LDD bike/ped plan• Local planning documents• BicyclePA Routes• Statewide Bicycle and Pedestrian Master Plan
2. Existing and Future Usage
• Do bicycle/pedestrian groups regularly use the transportation facility?• Bike clubs• Bicycle commuters• Hiking, walking, or running clubs• Skateboarding or rollerblading groups• Bicycle touring groups• General tourism/sightseeing
• Does the existing transportation facility provide the only convenient transportation connection/linkage between land uses in the local area or region?
3. Safety• Would the transportation facility (and all users) benefit
from widened or improved shoulders or improved markings (shoulders, crosswalks)?
4. Community and Land Use
• Are sidewalks needed in the area?• Presence of worn paths along the facility• Adjacent land uses generate pedestrian traffic• Possible linkages/continuity with other pedestrian facilities
• Is the transportation facility in close proximity to hospitals, elderly care facilities, or the residences or businesses of persons with disabilities?
5. Transit
• Is the transportation facility on a transit route?
6. Traffic Calming
• Is the community considering traffic calming as a possible solution to speeding and cut-through traffic?
frOM THE PENNdOT BICyCLE ANd PEdEsTrIAN CHECKLIsT
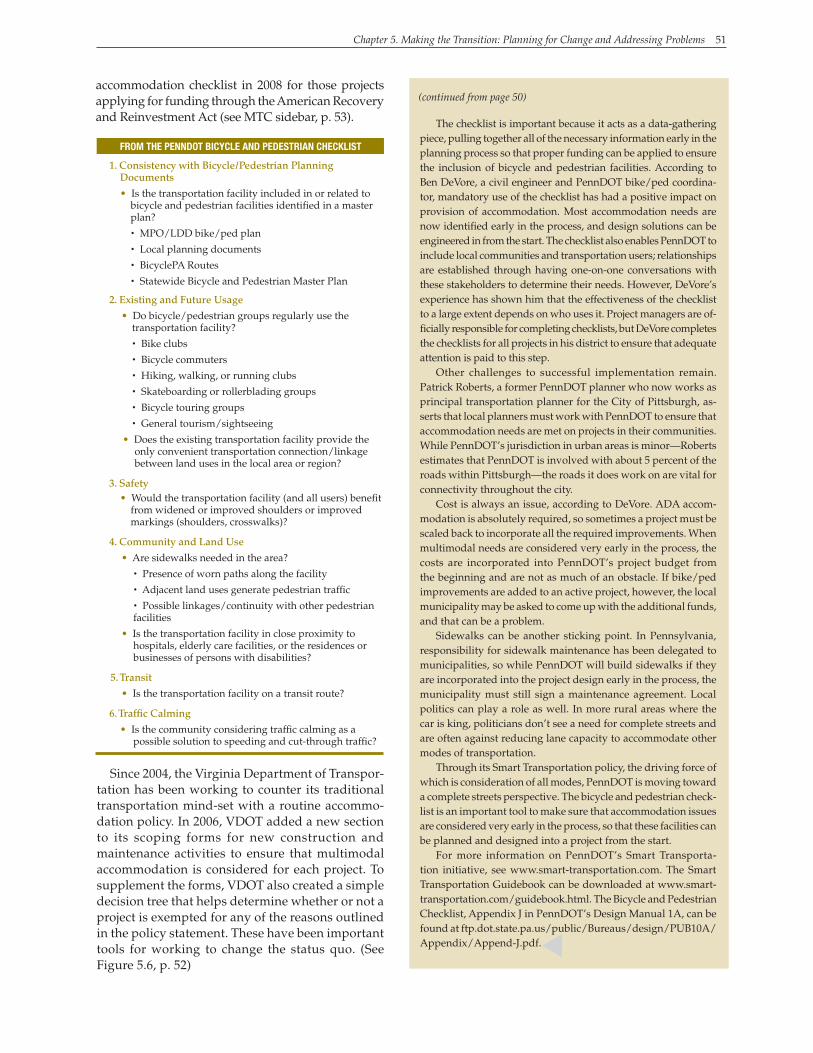
Since 2004, the Virginia Department of Transpor-tation has been working to counter its traditional transportation mind-set with a routine accommo-dation policy. In 2006, VDOT added a new section to its scoping forms for new construction and maintenance activities to ensure that multimodal accommodation is considered for each project. To supplement the forms, VDOT also created a simple decision tree that helps determine whether or not a project is exempted for any of the reasons outlined in the policy statement. These have been important tools for working to change the status quo. (See Figure 5.6, p. 52)
52 Complete Streets: Best Policy and Implementation Practices
Another common innovation is the use of planning teams and early project meetings. In Roanoke, Virginia; Columbus, Ohio; and Seattle, project devel-opment starts with broad team meetings that bring all relevant departments together to coordinate everything from utilities to transit stops along a cor-ridor.
TrAINING A common complaint is that transportation planners and engineers have not received the technical training needed to effectively serve all transportation system users. Many learned very little in their formal education about planning and designing facilities for bicyclists, pedestrians, or transit and were taught even less about how to balance the needs of different modes. Some places with complete streets policies have conducted extensive design training on pedes-trian and bicyclist facilities or ADA requirement compliance. This training is sometimes provided through traditional continuing-education forums or at state conferences, and such courses are widely available. But some planners and engineers involved in complete streets are cautious about the value of an
Figure 5.6. VDOT’s
accommodation decision tree
Virginia D
epartment of Transportation
Chapter 5. Making the Transition: Planning for Change and Addressing Problems 53
emphasis on technical training. They believe this may create the impression that the design of such facilities requires spe-cialized knowledge when this should be part of routine plan-ning and design.
Some communities have in-stead emphasized procedural training. This approach focuses on the meaning of a complete streets policy and the avenues to its implementation. The in-tent of any procedural training program is to ensure that agency staff charged with implementa-tion of the policy are aware of the new procedures that apply to their field of work. In Colum-bus, Ohio, the Mobility Division conducted a training session for zoning staff to help them con-sider the complete streets policy in site plan review. In addition, the implementation team has of-fered training to public utilities to help them understand the city’s expectations when they dig up roads. The division has also held training sessions for contractors, consultants, and developers to ensure that the private develop-ment community understands complete streets provisions with-in the land-use regulations.
Both Charlotte and the Com-monwealth of Massachusetts upended their former project development processes when they moved to a complete streets approach. In Charlotte, when the Urban Street Design Guidelines (USDG) document was first adopted, staff participated in extensive discussion, review, and training sessions on apply-ing the new six-step planning process. Eventually, the USDG methodologies will be incorpo-rated into all land development review processes. As Charlotte moves ahead with updating its land development standards to further integrate the complete streets approach, more trainings and reviews are planned.
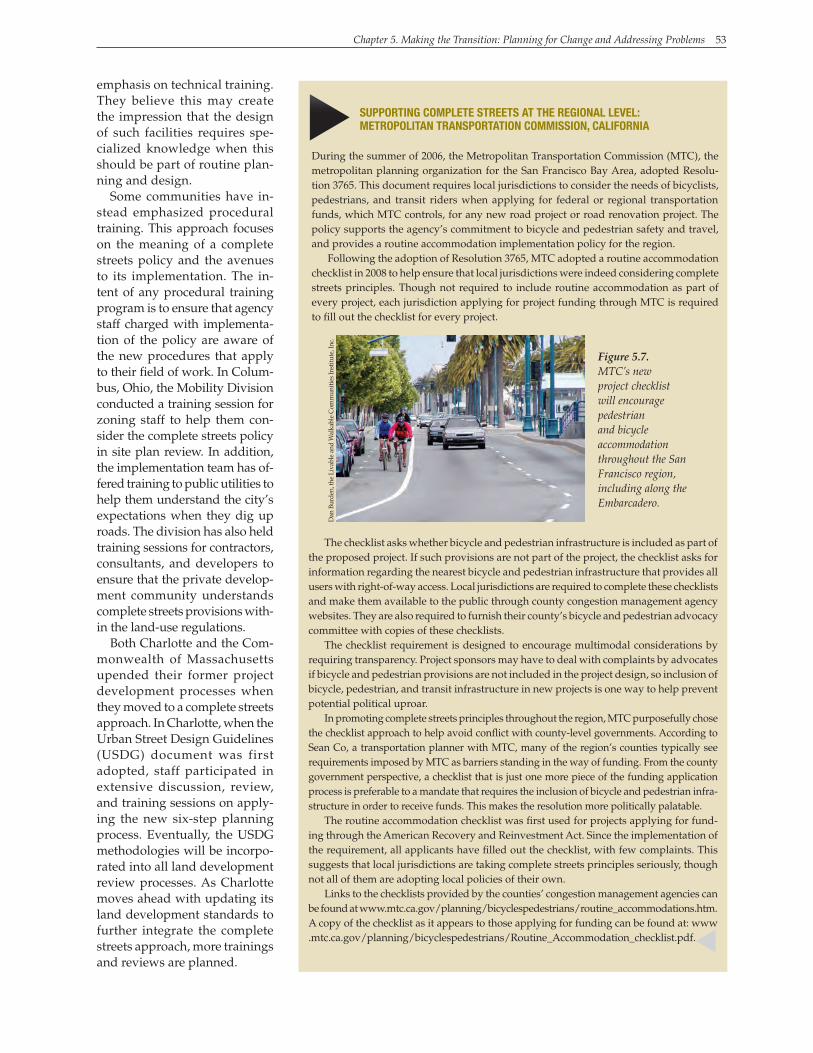
During the summer of 2006, the Metropolitan Transportation Commission (MTC), the metropolitan planning organization for the San Francisco Bay Area, adopted Resolu-tion 3765. This document requires local jurisdictions to consider the needs of bicyclists, pedestrians, and transit riders when applying for federal or regional transportation funds, which MTC controls, for any new road project or road renovation project. The policy supports the agency’s commitment to bicycle and pedestrian safety and travel, and provides a routine accommodation implementation policy for the region.
Following the adoption of Resolution 3765, MTC adopted a routine accommodation checklist in 2008 to help ensure that local jurisdictions were indeed considering complete streets principles. Though not required to include routine accommodation as part of every project, each jurisdiction applying for project funding through MTC is required to fill out the checklist for every project.
suPPOrTING COMPLETE sTrEETs AT THE rEGIONAL LEvEL: METrOPOLITAN TrANsPOrTATION COMMIssION, CALIfOrNIA
s
Figure 5.7. MTC’s new project checklist will encourage pedestrian and bicycle accommodation throughout the San Francisco region, including along the Embarcadero.
Dan
Bur
den,
the
Liva
ble
and
Wal
kabl
e C
omm
uniti
es In
stitu
te, I
nc.
The checklist asks whether bicycle and pedestrian infrastructure is included as part of the proposed project. If such provisions are not part of the project, the checklist asks for information regarding the nearest bicycle and pedestrian infrastructure that provides all users with right-of-way access. Local jurisdictions are required to complete these checklists and make them available to the public through county congestion management agency websites. They are also required to furnish their county’s bicycle and pedestrian advocacy committee with copies of these checklists.
The checklist requirement is designed to encourage multimodal considerations by requiring transparency. Project sponsors may have to deal with complaints by advocates if bicycle and pedestrian provisions are not included in the project design, so inclusion of bicycle, pedestrian, and transit infrastructure in new projects is one way to help prevent potential political uproar.
In promoting complete streets principles throughout the region, MTC purposefully chose the checklist approach to help avoid conflict with county-level governments. According to Sean Co, a transportation planner with MTC, many of the region’s counties typically see requirements imposed by MTC as barriers standing in the way of funding. From the county government perspective, a checklist that is just one more piece of the funding application process is preferable to a mandate that requires the inclusion of bicycle and pedestrian infra-structure in order to receive funds. This makes the resolution more politically palatable.
The routine accommodation checklist was first used for projects applying for fund-ing through the American Recovery and Reinvestment Act. Since the implementation of the requirement, all applicants have filled out the checklist, with few complaints. This suggests that local jurisdictions are taking complete streets principles seriously, though not all of them are adopting local policies of their own.
Links to the checklists provided by the counties’ congestion management agencies can be found at www.mtc.ca.gov/planning/bicyclespedestrians/routine_accommodations.htm. A copy of the checklist as it appears to those applying for funding can be found at: www .mtc.ca.gov/planning/bicyclespedestrians/Routine_Accommodation_checklist.pdf. s
54 Complete Streets: Best Policy and Implementation Practices
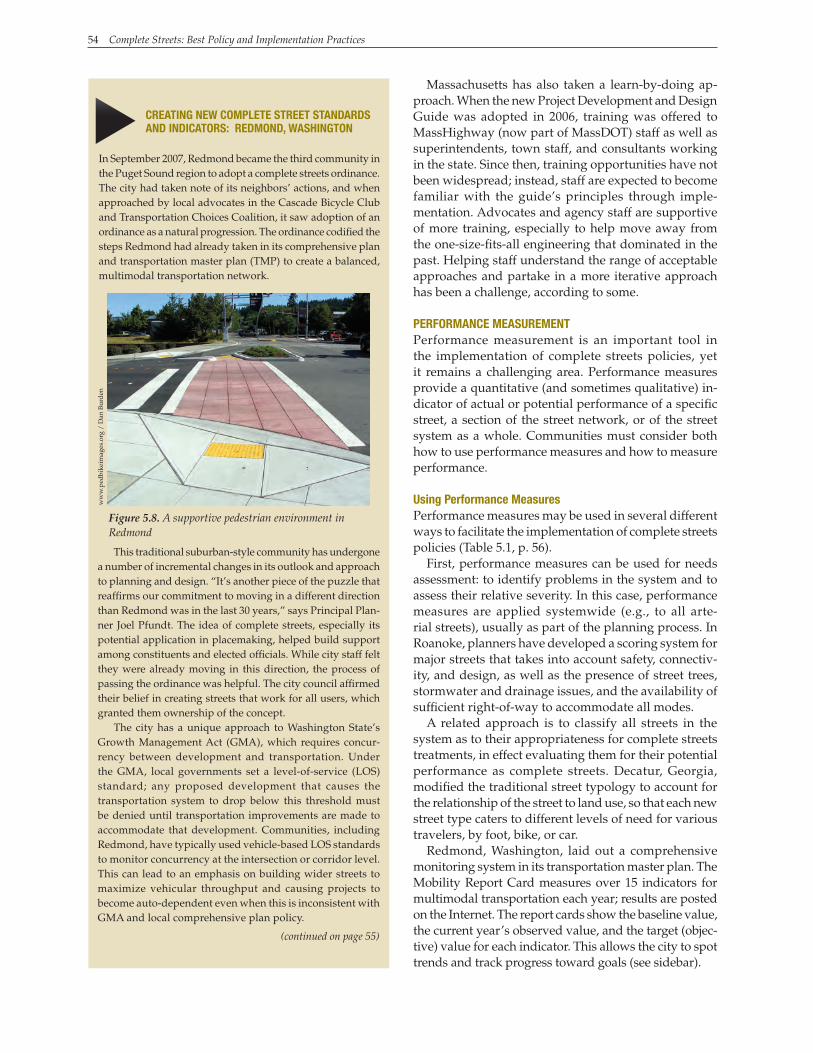
In September 2007, Redmond became the third community in the Puget Sound region to adopt a complete streets ordinance. The city had taken note of its neighbors’ actions, and when approached by local advocates in the Cascade Bicycle Club and Transportation Choices Coalition, it saw adoption of an ordinance as a natural progression. The ordinance codified the steps Redmond had already taken in its comprehensive plan and transportation master plan (TMP) to create a balanced, multimodal transportation network.
CrEATING NEw COMPLETE sTrEET sTANdArds ANd INdICATOrs: rEdMONd, wAsHINGTON
s Massachusetts has also taken a learn-by-doing ap-proach. When the new Project Development and Design Guide was adopted in 2006, training was offered to MassHighway (now part of MassDOT) staff as well as superintendents, town staff, and consultants working in the state. Since then, training opportunities have not been widespread; instead, staff are expected to become familiar with the guide’s principles through imple-mentation. Advocates and agency staff are supportive of more training, especially to help move away from the one-size-fits-all engineering that dominated in the past. Helping staff understand the range of acceptable approaches and partake in a more iterative approach has been a challenge, according to some.
PErfOrMANCE MEAsurEMENTPerformance measurement is an important tool in the implementation of complete streets policies, yet it remains a challenging area. Performance measures provide a quantitative (and sometimes qualitative) in-dicator of actual or potential performance of a specific street, a section of the street network, or of the street system as a whole. Communities must consider both how to use performance measures and how to measure performance.
using Performance MeasuresPerformance measures may be used in several different ways to facilitate the implementation of complete streets policies (Table 5.1, p. 56).
First, performance measures can be used for needs assessment: to identify problems in the system and to assess their relative severity. In this case, performance measures are applied systemwide (e.g., to all arte-rial streets), usually as part of the planning process. In Roanoke, planners have developed a scoring system for major streets that takes into account safety, connectiv-ity, and design, as well as the presence of street trees, stormwater and drainage issues, and the availability of sufficient right-of-way to accommodate all modes.
A related approach is to classify all streets in the system as to their appropriateness for complete streets treatments, in effect evaluating them for their potential performance as complete streets. Decatur, Georgia, modified the traditional street typology to account for the relationship of the street to land use, so that each new street type caters to different levels of need for various travelers, by foot, bike, or car.
Redmond, Washington, laid out a comprehensive monitoring system in its transportation master plan. The Mobility Report Card measures over 15 indicators for multimodal transportation each year; results are posted on the Internet. The report cards show the baseline value, the current year’s observed value, and the target (objec-tive) value for each indicator. This allows the city to spot trends and track progress toward goals (see sidebar).
This traditional suburban-style community has undergone a number of incremental changes in its outlook and approach to planning and design. “It’s another piece of the puzzle that reaffirms our commitment to moving in a different direction than Redmond was in the last 30 years,” says Principal Plan-ner Joel Pfundt. The idea of complete streets, especially its potential application in placemaking, helped build support among constituents and elected officials. While city staff felt they were already moving in this direction, the process of passing the ordinance was helpful. The city council affirmed their belief in creating streets that work for all users, which granted them ownership of the concept.
The city has a unique approach to Washington State’s Growth Management Act (GMA), which requires concur-rency between development and transportation. Under the GMA, local governments set a level-of-service (LOS) standard; any proposed development that causes the transportation system to drop below this threshold must be denied until transportation improvements are made to accommodate that development. Communities, including Redmond, have typically used vehicle-based LOS standards to monitor concurrency at the intersection or corridor level. This can lead to an emphasis on building wider streets to maximize vehicular throughput and causing projects to become auto-dependent even when this is inconsistent with GMA and local comprehensive plan policy.
Figure 5.8. A supportive pedestrian environment in Redmond
(continued on page 55)
ww
w.p
edbi
keim
ages
.org
/ D
an B
urd
en
Chapter 5. Making the Transition: Planning for Change and Addressing Problems 55
Second, performance measures can be used to rank projects for funding in the programming process, as described in chapter 4. The methods used here may be similar to those used for needs assessment.
Third, performance measures can be used in impact assessments. In this application, the probable impact of a proposed development project on the performance of the street system is projected, and the result is used as the basis for impact fees or other exactions, such as requirements to provide bicycle and pedestrian facilities. For ex-ample, in Sacramento, traditional level-of-service (LOS) standards for the impact of development on vehicle traffic have been relaxed to accommodate development that may improve conditions for other modes. In Redmond, where the state requires concurrency for developments, the city is developing a new plan-based system that will let them measure impact on a network basis rather than through corridor LOS measures.
Fourth, performance measures can be used to evaluate the effects of a policy or project on the performance of the system and to assess whether it achieved its goal. These before-and-after studies are important for building a base of evidence for the effectiveness of the complete streets approach and can be instrumental in justifying further investments in complete streets projects. Although it has been common to measure changes in vehicle traffic before and after implementation of traffic-calming programs, impacts on other modes are rarely measured. When operating under a complete streets framework, jurisdictions can measure traffic volume of all modes, note any modal shifts, and track the number of crashes and injuries incurred by all roadway users. (See Table 5.1, p. 56.)
Measuring PerformanceThese uses of performance measures are standard, but for com-plete streets some of the metrics being used are new. In all four applications, it is standard practice to use vehicular LOS, which focuses on the automobile alone. In using performance measures to implement complete streets policies, communities are expand-ing the range of measures used to account for multiple modes and to achieve a broader range of objectives.
In developing appropriate methods of performance measure-ment, communities must consider three interrelated concepts. First, performance can be measured as inputs, outputs, or out-comes. Inputs are the initial actions taken by the community to achieve the desired goal. For complete streets, inputs could include adoption of complete streets policies or dollars spent on complete streets projects. Outputs are the direct result of these actions and could include the number of projects completed, the extent of the bicycle or pedestrian network, or the characteristics of that network. For example, Seattle has set goals with respect to numbers of sidewalks, crosswalks, and street trees. Charlotte measures crossing distances, bike lanes, and corner radii. Out-comes, in contrast, reflect the impacts on the users of the system, and include counts of users, mode shares, and crashes, as well as subjective assessments such as perceived safety and user satisfac-tion. Most before-and-after studies focus on outcomes; however, because outcomes tend to be harder to measure, they are less often used in needs assessments and other applications.
Redmond is replacing its vehicle-based inter-section LOS standard with plan-based concur-rency, which allows for a transportation system that can accommodate the network of complete streets envisioned by the community. In this way, the implementation of the transportation plan will explicitly support achievement of the comprehensive plan’s visions and policies.
The plan-based approach is also intended to be simple and predictable. The city used its transportation model to calculate “mobility units,” or person-miles of travel, provided by existing streets and public transportation service to offer a quantifiable moving capacity. Each de-velopment proposal is analyzed to estimate the number of mobility units it will generate. This is compared to the available mobility units within the city’s Six-Year Transportation Improvement Program/Capital Improvement Program. The city’s land-use growth target and 2022 transpor-tation facility plan (TFP) set the total allowed amount of person-miles traveled. As long as the land-use growth target and the development of the transportation system remain proportionate, the LOS standard, and therefore the concurrency requirement, is met.
In the TMP, Redmond created a mobility report card measuring a variety of indicators: concurrency; completion of the 2022 TFP; a.m. mode share; school bus ridership; public trans-portation travel time and service frequency; average weekday boardings on public trans-portation; service hour targets for local public transportation; p.m. peak-hour VMT; changes in traffic volume across key screenlines; average traffic growth by transportation management district; roadway volume-to-capacity ratios along selected screenlines; percentage of pe-destrian environment designed to “supportive” standards; completion of the bicycle network; number of vehicle, pedestrian, and bicyclist collisions; and status of the Three-Year Priority Action Plan. This information supplements the concurrency management system and is used to evaluate the performance of each mode.
Annual mobility report cards are avail-able to download from http://redmond.gov/ connectingredmond/policiesplans/tmpprojectdocs .asp.
(continued from page 54)
s
56 Complete Streets: Best Policy and Implementation Practices
Second, to be effective, performance measures must be closely tied to plan-ning goals: each must measure a relevant aspect of system performance. If the goal is to increase walking and bicycling or to improve safety for these modes, then performance measures should measure these outcomes. In developing performance measures, communities should thus take the goals of their complete streets policy as their starting points. Note that inputs and outputs tend to be less directly related to goals than are outcomes.
There are two important corollaries to this concept: (1) If performance measures do not match goals, they will bring confusion to planning and programming processes. Decisions based on those performance measures are likely to lead the community in unrelated directions. (2) Goals should have performance measures. Goals without performance measures are likely to get less attention in the planning process because it is harder to document problems and evaluate solutions.
New York City has developed an extensive process for matching goals and measures. The Sustainable Streets strategic plan sets a number of goals for the transportation department. Each is accompanied by a number of bench-marks for measuring success—including improved safety and mobility, good maintenance of infrastructure, well-developed placemaking policies, and the incorporation of sustainability objectives into projects, among others—that are to be measured annually. As the agency works through the plan, it will update and add new goals on a continual basis. The department expects to
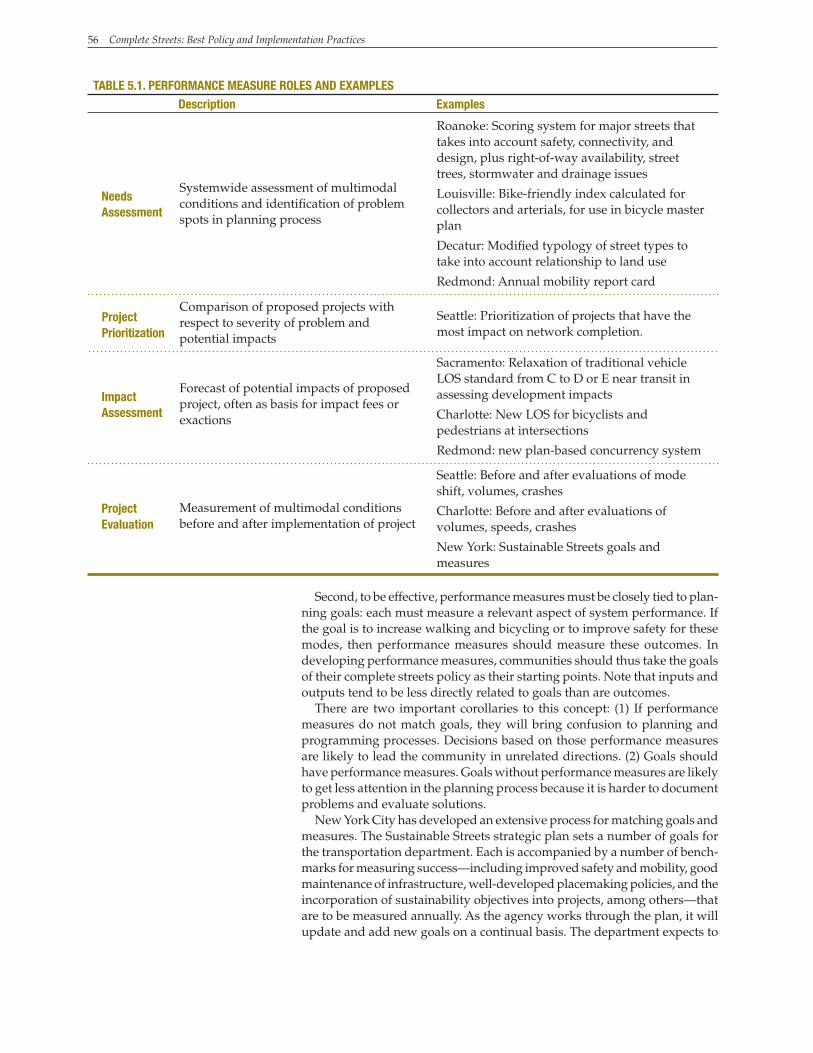
TABLE 5.1. PErfOrMANCE MEAsurE rOLEs ANd ExAMPLEs description Examples
Impact Assessment
Systemwide assessment of multimodal conditions and identification of problem spots in planning process
Comparison of proposed projects with respect to severity of problem and potential impacts
Forecast of potential impacts of proposed project, often as basis for impact fees or exactions
Measurement of multimodal conditions before and after implementation of project
Needs Assessment
Roanoke: Scoring system for major streets that takes into account safety, connectivity, and design, plus right-of-way availability, street trees, stormwater and drainage issues
Louisville: Bike-friendly index calculated for collectors and arterials, for use in bicycle master plan
Decatur: Modified typology of street types to take into account relationship to land use
Redmond: Annual mobility report card
Seattle: Prioritization of projects that have the most impact on network completion.
Seattle: Before and after evaluations of mode shift, volumes, crashes
Charlotte: Before and after evaluations of volumes, speeds, crashes
New York: Sustainable Streets goals and measures
Project Evaluation
Sacramento: Relaxation of traditional vehicle LOS standard from C to D or E near transit in assessing development impacts
Charlotte: New LOS for bicyclists and pedestrians at intersections
Redmond: new plan-based concurrency system
ProjectPrioritization
Chapter 5. Making the Transition: Planning for Change and Addressing Problems 57
hold staff retreats every year or two, where employees will discuss what has been achieved and what new goals they should set.
One challenge is measuring a complete streets network’s outcomes related to long-term community goals that reach far beyond the immediate trans-portation realm, such as goals to increase the physical activity of residents or decrease the emission of greenhouse gases. In the first instance, the public health community has been exploring ways to measure the effectiveness of transportation investments in altering behavior, mainly through the develop-ment of health impact assessment tools.
Third, all four uses of performance measures may require the establish-ment of standards by which performance can be judged. These standards should, of course, be tied to the goals of the community and can be viewed as the quantification of those goals. However, standards may be constrained by practical limitations. For example, while it might be the goal of the com-munity to eliminate all crashes, physical and financial constraints may make this standard unachievable. Still, standards can be used to judge the severity of an existing problem (how far below the standard an existing situation is) or the effectiveness of a proposed or implemented solution (whether or not the solution achieves the standard). Redmond’s mobility report card is a good example of the use of standards, or targets, to evaluate progress toward goals.
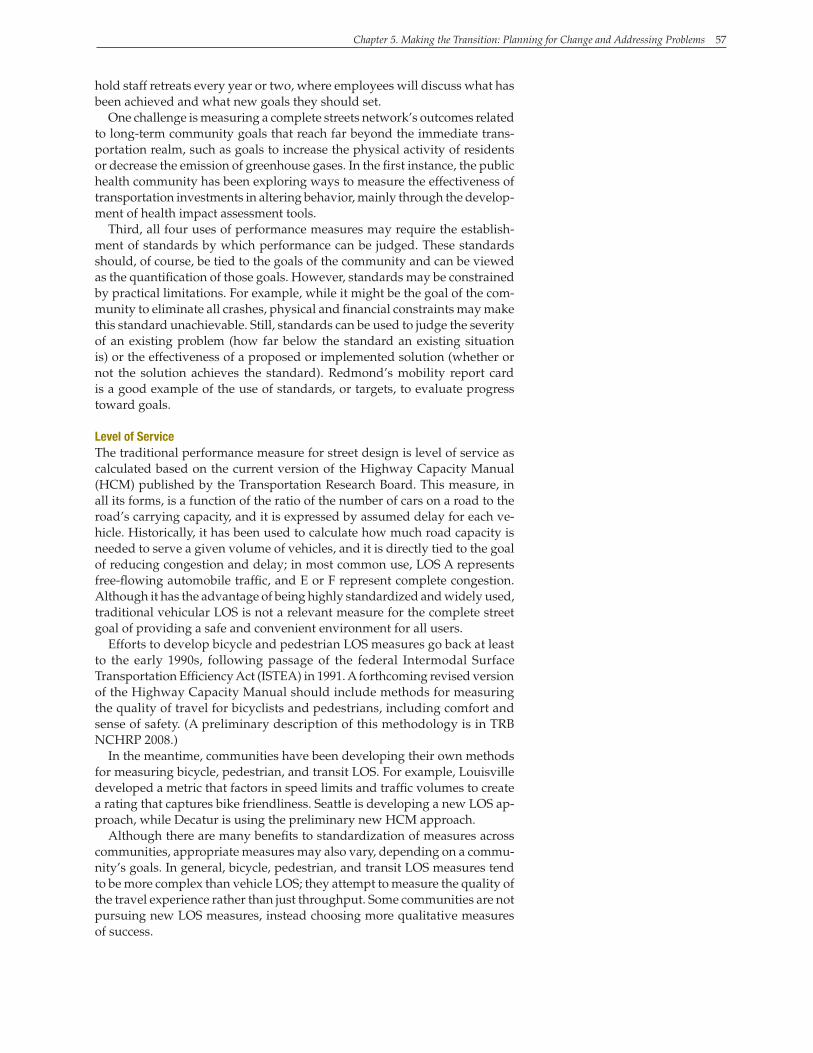
Level of service The traditional performance measure for street design is level of service as calculated based on the current version of the Highway Capacity Manual (HCM) published by the Transportation Research Board. This measure, in all its forms, is a function of the ratio of the number of cars on a road to the road’s carrying capacity, and it is expressed by assumed delay for each ve-hicle. Historically, it has been used to calculate how much road capacity is needed to serve a given volume of vehicles, and it is directly tied to the goal of reducing congestion and delay; in most common use, LOS A represents free-flowing automobile traffic, and E or F represent complete congestion. Although it has the advantage of being highly standardized and widely used, traditional vehicular LOS is not a relevant measure for the complete street goal of providing a safe and convenient environment for all users.
Efforts to develop bicycle and pedestrian LOS measures go back at least to the early 1990s, following passage of the federal Intermodal Surface Transportation Efficiency Act (ISTEA) in 1991. A forthcoming revised version of the Highway Capacity Manual should include methods for measuring the quality of travel for bicyclists and pedestrians, including comfort and sense of safety. (A preliminary description of this methodology is in TRB NCHRP 2008.)
In the meantime, communities have been developing their own methods for measuring bicycle, pedestrian, and transit LOS. For example, Louisville developed a metric that factors in speed limits and traffic volumes to create a rating that captures bike friendliness. Seattle is developing a new LOS ap-proach, while Decatur is using the preliminary new HCM approach.
Although there are many benefits to standardization of measures across communities, appropriate measures may also vary, depending on a commu-nity’s goals. In general, bicycle, pedestrian, and transit LOS measures tend to be more complex than vehicle LOS; they attempt to measure the quality of the travel experience rather than just throughput. Some communities are not pursuing new LOS measures, instead choosing more qualitative measures of success.
58 Complete Streets: Best Policy and Implementation Practices
In practice, communities have been using these new measures in addition to the traditional vehicle LOS measure, not in place of it. They have both expanded their measures of vehicle standards (e.g., to include crashes), and they have added measures of LOS for other modes. In Massachusetts, vehicle LOS is one of many “measures of effectiveness,” and designers are directed to calculate and provide a “reasonable LOS for all users.” The state’s new Project Development and Design Guide offers tools to do so, including guid-ance on balancing LOS measures for different users at intersections, where automobiles and nonmotorized users so often come into conflict.
It may be important to continue to measure traditional vehicle LOS in order to provide a balanced assessment across all modes and to alleviate potential concerns about negative impacts on vehicles. Modifying rather than rejecting the traditional performance-measurement approach seems to have smoothed the way for many complete streets projects. For example, the added analysis now used by the Charlotte DOT is credited by lead planners as a key reason their complete streets policy works and is supported by staff. “We’re not changing our analysis but instead doing more of it,” says Norm Steinman, planning and design division manager. Staff engineers in particular appreci-ate the use of logic and analysis to justify complete streets design.
sETTING uP AN ExCEPTIONs PrOCEssCreating a clear exceptions process has been a central issue in many juris-dictions transitioning to the complete streets approach. During the policy adoption process, exceptions are often hotly debated and can make or break political support for the policy.
Once a complete streets policy is in place, a clear and fair exception pro-cess can enhance credibility, ease fears of both opponents and proponents of change, and provide a guide for planners. Redmond’s ordinance is short and to the point, outlining three exceptions to its policy: where accommodating all users would be contrary to public safety; where there is no identified long-term need; and where the public works director allows a documented exception in specific situations. The exceptions process forces staff to be systematic and to consider all options.
In Massachusetts, eliminating discrepancies in the existing exceptions process was a top priority for the new project guide. Now, any exceptions to the guide’s standards are handled each month by a review committee of senior-level engineers from across the state, according to a standard, docu-mented procedure. (See sidebar, p. 83.)
As noted, the Virginia DOT has created a new project scoping form, decision tree, and guidance document to assist in determining exceptions to its policy. In Seattle, a checklist process is used, but the approval of an exception is not the end of the story. If complete streets improvements were identified in the process but were unable to be included in the final scope, one of the city’s transportation divisions is required to include that need in its list of projects, regardless of funding. In this way, user needs are not lost or written off.
Cost ExceptionsThe worry that complete streets policies will break the bank is very common and has spurred many communities to provide for cost exceptions. While worries about cost are sometimes overstated (see Chapter 6), many places have accepted the FHWA’s 2000 guidance defining “excessively dispropor-tionate” as costs above 20 percent of total project costs. But the guidance also uses this phrase from the Oregon law: “if the cost of establishing such paths and trails would be excessively disproportionate to the need or prob-able use.” In Oregon, accordingly, a project in a high-use area for bicycling and walking has no ceiling.
Chapter 5. Making the Transition: Planning for Change and Addressing Problems 59
BrIdGING THE GAP: sEATTLE
s
Seattle has been swift and methodical in its implementation of com-plete streets. With the adoption of its nine-year “Bridging the Gap” transportation funding levy, Seattle pledged not only to reduce its backlog of transportation maintenance, make seismic upgrades to bridges, and increase public transportation speed and reliability but also to allocate funds to creating complete streets. Six months later, the city council adopted an ordinance so that all transportation projects, not just those funded through Bridging the Gap, would improve travel for all users. Barbara Gray, transportation system design and planning manager in the Policy and Planning Divi-sion at the Seattle Department of Transportation (SDOT), credits both policies for providing SDOT with “a consistent and formal approach to improving the right-of-way for all users.”
Gray indicated that SDOT had been moving toward a more integrated approach to delivering complete streets under the lead-
(continued on page 60)
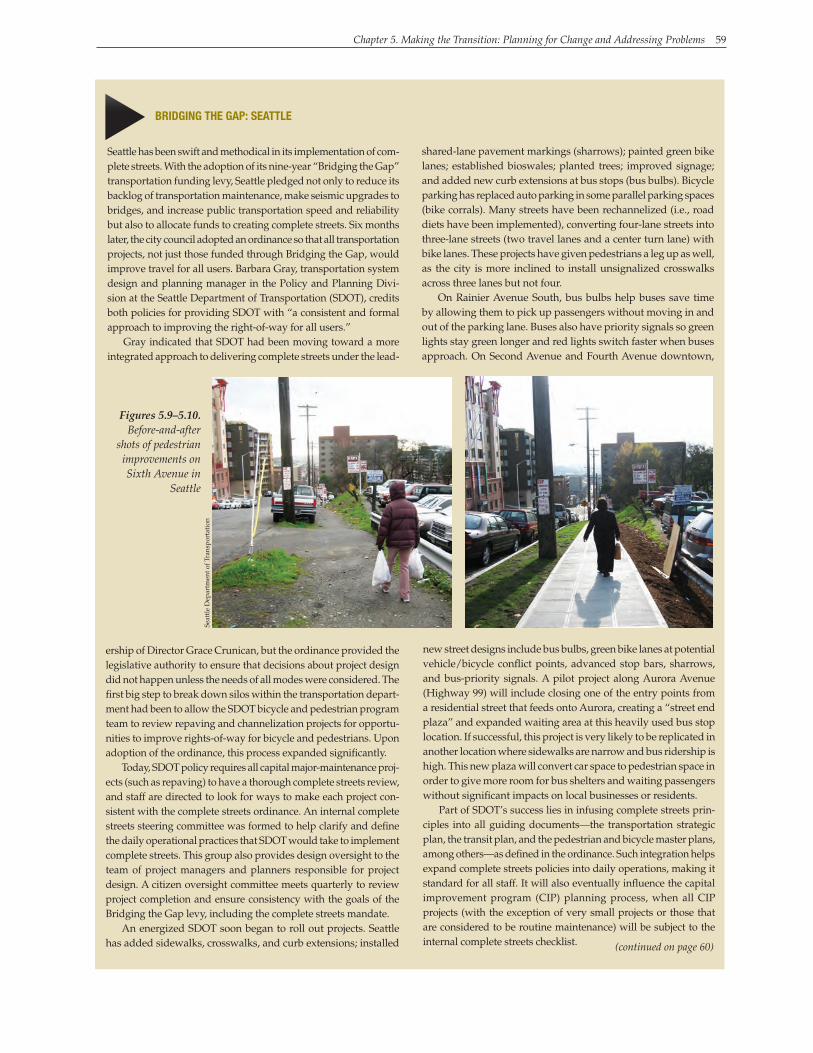
shared-lane pavement markings (sharrows); painted green bike lanes; established bioswales; planted trees; improved signage; and added new curb extensions at bus stops (bus bulbs). Bicycle parking has replaced auto parking in some parallel parking spaces (bike corrals). Many streets have been rechannelized (i.e., road diets have been implemented), converting four-lane streets into three-lane streets (two travel lanes and a center turn lane) with bike lanes. These projects have given pedestrians a leg up as well, as the city is more inclined to install unsignalized crosswalks across three lanes but not four.
On Rainier Avenue South, bus bulbs help buses save time by allowing them to pick up passengers without moving in and out of the parking lane. Buses also have priority signals so green lights stay green longer and red lights switch faster when buses approach. On Second Avenue and Fourth Avenue downtown,
Figures 5.9–5.10. Before-and-after
shots of pedestrian improvements on Sixth Avenue in
Seattle
ership of Director Grace Crunican, but the ordinance provided the legislative authority to ensure that decisions about project design did not happen unless the needs of all modes were considered. The first big step to break down silos within the transportation depart-ment had been to allow the SDOT bicycle and pedestrian program team to review repaving and channelization projects for opportu-nities to improve rights-of-way for bicycle and pedestrians. Upon adoption of the ordinance, this process expanded significantly.
Today, SDOT policy requires all capital major-maintenance proj-ects (such as repaving) to have a thorough complete streets review, and staff are directed to look for ways to make each project con-sistent with the complete streets ordinance. An internal complete streets steering committee was formed to help clarify and define the daily operational practices that SDOT would take to implement complete streets. This group also provides design oversight to the team of project managers and planners responsible for project design. A citizen oversight committee meets quarterly to review project completion and ensure consistency with the goals of the Bridging the Gap levy, including the complete streets mandate.
An energized SDOT soon began to roll out projects. Seattle has added sidewalks, crosswalks, and curb extensions; installed
new street designs include bus bulbs, green bike lanes at potential vehicle/bicycle conflict points, advanced stop bars, sharrows, and bus-priority signals. A pilot project along Aurora Avenue (Highway 99) will include closing one of the entry points from a residential street that feeds onto Aurora, creating a “street end plaza” and expanded waiting area at this heavily used bus stop location. If successful, this project is very likely to be replicated in another location where sidewalks are narrow and bus ridership is high. This new plaza will convert car space to pedestrian space in order to give more room for bus shelters and waiting passengers without significant impacts on local businesses or residents.
Part of SDOT’s success lies in infusing complete streets prin-ciples into all guiding documents—the transportation strategic plan, the transit plan, and the pedestrian and bicycle master plans, among others—as defined in the ordinance. Such integration helps expand complete streets policies into daily operations, making it standard for all staff. It will also eventually influence the capital improvement program (CIP) planning process, when all CIP projects (with the exception of very small projects or those that are considered to be routine maintenance) will be subject to the internal complete streets checklist.
Seat
tle
Dep
artm
ent o
f Tra
nspo
rtat
ion
60 Complete Streets: Best Policy and Implementation Practices
Seattle’s CIP involves a wide range of projects, from bridge repair and construction to trail extensions and roadway repaving. Although the CIP is a six-year plan, SDOT has a nine-year paving plan. This look ahead at paving projects has been instrumental in complete streets implementation, and SDOT has leveraged these projects to implement complete streets in every case since 2007, when the Bridging the Gap levy was passed. As the city updates its planning documents with the complete streets outlook and looks at new data, priority projects will emerge and be slated for implementation, either through the CIP or through one of SDOT’s annual funding programs. The 2009 update to Seattle’s pedestrian master plan used a variety of GIS indicators, such as income, pedestrian generators, and density, to locate priority areas for pedestrian improvement. From this, planners look for what’s missing in the system, prioritizing projects that will have the most impact and help create a complete network for pedestrians, especially those who are most dependent on walking and transit.
Three to four years out, those priority projects found through the planning process will be put through a complete streets checklist. This allows SDOT time to work with different divisions to link needed improvements and to secure funding. After this, the project goes to design. At the design reviews conducted 30, 60, and 90 percent of the way through the process, all involved city stakeholders will ensure that the designs follow the input communicated through the checklist. When complete, the checklist is signed by each key member of the SDOT project team, then by the SDOT director. If complete streets improvements are identified in the process but not included in the final scope, one of SDOT’s divisions is required to include that need in its list of projects, to ensure that user needs are not lost simply because current funding is not available.
In 2005, Seattle made major revisions to its Right-of-Way Improve-ments Manual, a design standards manual that is used primarily by private developers. While the document has routine accommodation language, SDOT felt it did not fully express the complete streets poli-cies set forth in 2007 and 2008. Seattle depends on private developers’ work for smaller sections of corridors and encourages all projects in the right-of-way to be consistent with complete streets policies. The ordinance officially applies only to SDOT-funded projects, so private developers are not required to comply. However, many see the benefit of improving pedestrian, bicycle, and public transportation quality and have made commitments to such improvements as key pieces of their projects—another demonstration that complete streets can also be good for business.
The Right-of-Way Improvements Manual and related roadway design standards are scheduled to be updated in 2010 through 2011 and will contain a stronger focus and message about complete streets. Until that time, SDOT will continue to use state-of-the-practice designs and encourage others to do the same. “Our new designs just create new internal standards,” says Strategic Advisor Darby Watson. “Our design has not changed a whole lot; it’s more our willingness to look at streets in a new way.” Innovative designs for road diets, longer street tree pits, bike boulevards, pervious sidewalks, bio-swales, and green bike lanes have been integrated into internal design standards so they become regular practice. If a pilot program shows results, it is added to the list as well. “The more we can add to the standards, the fewer prolonged debates often resulting from ‘new’ or ‘nonstandard’ design details are needed. The constant debate about the details can really slow a project down,” says Gray, so standardizing innovative approaches improves efficiency and makes a difference on the ground quickly.
(continued from page 59)
Seattle has been measuring its success as well. The Bridging the Gap initiative sets clear goals for SDOT, such as building 117 blocks of new sidewalks, restriping 5,000 crosswalks, planting 8,000 new street trees, and developing a pedestrian master plan. SDOT has also begun to examine how best to use LOS indicators for different modes; a new LOS measure for Seattle is being considered for the near future, Gray says. On a case-by-case basis, SDOT conducts before-and-after evaluations to measure mode shift, volumes, and crash data. For every road diet project, an “after” study is done one year after installation. In the broader sense, though, Gray feels that it will be harder to measure performance as time goes on because complete streets will be “just standard practice.” Seattle is investigating a way to overcome that barrier but has yet to find the answer.
Seattle has not been blocked by the costs in developing complete streets. While some complete streets work is funded by the Bridging the Gap tax levy, many are funded through traditional means. Here, making good plans steeped in complete streets principles helps tremendously. “With good planning and information shared across departments several years out, we can leverage the dollars much more effectively,” notes Gray. “Planning in advance makes complete streets much easier to accomplish.” Projects can also be done incrementally to help manage costs and expectations.
Seattle employs a number of low-cost methods to improve its transportation system. When repaving a street, staff will consider a new configuration in the existing right-of-way that creates space for bicyclists or improves traffic flow for automobiles. They may flag the location as needing further study later on, when more funding can be attached. Painting and signing stop bars greatly improves the pe-destrian environment and can be done for the low cost of paint when repaving or intersection redesign work is occurring. When moving signal detectors, SDOT will install bike loop detectors so cyclists can activate the signal without needing to wait for a vehicle. Installing bike corrals is another low-cost technique that signals bicyclists are welcome in the area.
Many times, it is best for SDOT to do all the improvements at once, benefiting from the economies of scale and lessening inconveniences on travelers by closing portions of the street only once. Furthermore, priorities among the divisions can be aligned so that all modes can benefit from a project. If a road is due for sidewalk improvements and will already be rechannelized after a repaving, SDOT will try to pair up the projects. On bridge projects, where adding a nonmotorized trail is far too costly, SDOT takes a “do no harm” approach. So long as the design does not preclude inclusion of that trail in the future, SDOT can plan to do it when funding can be secured.
Gray strongly believes complete streets policies have been valu-able “from elected officials on down, at every level of the city” and in engaging with the public. “It’s just our system now.” Each project brings debate, but SDOT has good support and policies to reinforce its efforts. For Seattle, it is not about convincing people; it is about getting the systems in place to ensure complete streets is standard operating procedure. The policies have caused them to consider each project as a part of the whole city. “I’m hopeful that the work we are doing lays the groundwork for other cities—that would be an incredible measure of success,” concludes Gray.
Seattle’s complete streets ordinance (ordinance no. 122386) can be accessed at http://clerk.ci.seattle.wa.us/~public/CBOR1.htm. Read more about the Bridging the Gap initiative at www.seattle .gov/Transportation/BridgingtheGap.htm. s
Chapter 5. Making the Transition: Planning for Change and Addressing Problems 61
Other communities have also rejected specific ceilings. Seattle initially capped complete streets elements when they added 20 percent or more to total project cost, but city planners later decided that every project should be evaluated individually. If the costs add 21 percent but the benefits out-weigh the costs, the project is just as valid as one where the complete streets elements add 19 percent to the cost.
When creating guidance for the TransNet tax extension, San Diego’s regional agency, the San Diego Association of Governments (SANDAG), decided not to set a percentage threshold over which costs would be deemed excessive, instead allowing policy makers to make these decisions on a case-by-case basis. If an agency decides that costs would be excessively disproportionate to the need or probable use, the agency must provide documentation and justification for its decision, go through a public hear-ing, and have the exemption approved by SANDAG.
Some communities are placing less emphasis on an exceptions process aimed at individual streets and more emphasis on creating a variety of street cross-sections, new street typologies, or network plans that clarify what facilities will be placed in what contexts. Smaller communities, such as Boulder, Colorado, and Decatur, Georgia, are thus able to identify future improvements across the entire street network, if not on every street.
THE BALANCING ACT: MEETING THE NEEds Of vArIOus usErs To successfully balance user needs, planners must first change the way in which automobile traffic congestion is viewed. But the dominance of the au-tomobile paradigm is not easy to displace. Patrick Roberts, a former PennDOT planner who now works as principal transportation planner for the City of Pittsburgh, laments the lack of state or national policies mandating equity for the needs of all transportation modes. AASHTO and other standards are still focused on planning for cars, and ensuring capacity for automobiles puts pedestrian and bicycle facilities at a disadvantage when funding or right-of-way is limited. He would like to see policies that allow for a reduction in automobile capacity in order to provide accommodation for other modes.
Such a change is an especially tall order for state DOTs, with their primary missions of supporting long-distance travel. But at the municipal level, some of the most successful policies have directly addressed the way that complete streets affect automobile traffic. Santa Barbara, California, and Seattle have embraced complete streets as a way to increase the capacity of the transportation network, but communication and education are essential for acceptance. For example, Seattle has launched a public awareness cam-paign and “Commuter Toolkit” with information about the city’s efforts to be more walkable, bikeable, and transit-friendly, tips on reducing automobile dependence, and a poster illustrating the space 200 people take up if they are in cars, on light rail, on a bus, or riding bicycles.
Once the rights of other modes to share the streets are recognized, the balancing act has just begun. Many projects need creative solutions so improvements for one mode do not overly burden others. The recently completed project on Stone Way North in Seattle is a poster child for this kind of balance. Stone Way is a low-traffic freight corridor with strong pedestrian and bicycle usage: the perfect candidate for a road diet. “In the design phase, there was a lot of fear,” says Darby Watson, the strategic advisor in SDOT’s policy and planning division. Local bicyclists wanted bike lanes on both sides of the roadway, but freight users worried about reduced access to light industrial areas. SDOT brokered a compromise, installing bike lanes along the street’s uphill side, where cyclists would be moving more slowly, and shared lane pavement markings, or “sharrows,” along the other, where the grade would allow them to move close to the
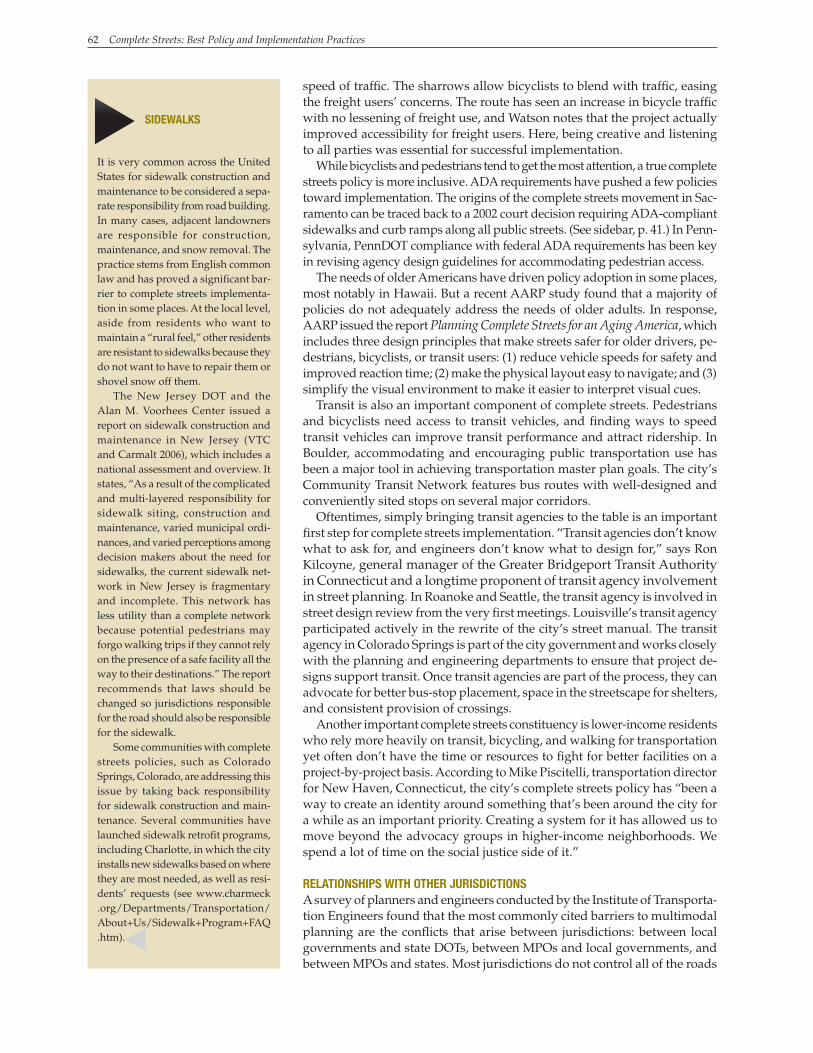
62 Complete Streets: Best Policy and Implementation Practices
speed of traffic. The sharrows allow bicyclists to blend with traffic, easing the freight users’ concerns. The route has seen an increase in bicycle traffic with no lessening of freight use, and Watson notes that the project actually improved accessibility for freight users. Here, being creative and listening to all parties was essential for successful implementation.
While bicyclists and pedestrians tend to get the most attention, a true complete streets policy is more inclusive. ADA requirements have pushed a few policies toward implementation. The origins of the complete streets movement in Sac-ramento can be traced back to a 2002 court decision requiring ADA-compliant sidewalks and curb ramps along all public streets. (See sidebar, p. 41.) In Penn-sylvania, PennDOT compliance with federal ADA requirements has been key in revising agency design guidelines for accommodating pedestrian access.
The needs of older Americans have driven policy adoption in some places, most notably in Hawaii. But a recent AARP study found that a majority of policies do not adequately address the needs of older adults. In response, AARP issued the report Planning Complete Streets for an Aging America, which includes three design principles that make streets safer for older drivers, pe-destrians, bicyclists, or transit users: (1) reduce vehicle speeds for safety and improved reaction time; (2) make the physical layout easy to navigate; and (3) simplify the visual environment to make it easier to interpret visual cues.
Transit is also an important component of complete streets. Pedestrians and bicyclists need access to transit vehicles, and finding ways to speed transit vehicles can improve transit performance and attract ridership. In Boulder, accommodating and encouraging public transportation use has been a major tool in achieving transportation master plan goals. The city’s Community Transit Network features bus routes with well-designed and conveniently sited stops on several major corridors.
Oftentimes, simply bringing transit agencies to the table is an important first step for complete streets implementation. “Transit agencies don’t know what to ask for, and engineers don’t know what to design for,” says Ron Kilcoyne, general manager of the Greater Bridgeport Transit Authority in Connecticut and a longtime proponent of transit agency involvement in street planning. In Roanoke and Seattle, the transit agency is involved in street design review from the very first meetings. Louisville’s transit agency participated actively in the rewrite of the city’s street manual. The transit agency in Colorado Springs is part of the city government and works closely with the planning and engineering departments to ensure that project de-signs support transit. Once transit agencies are part of the process, they can advocate for better bus-stop placement, space in the streetscape for shelters, and consistent provision of crossings.
Another important complete streets constituency is lower-income residents who rely more heavily on transit, bicycling, and walking for transportation yet often don’t have the time or resources to fight for better facilities on a project-by-project basis. According to Mike Piscitelli, transportation director for New Haven, Connecticut, the city’s complete streets policy has “been a way to create an identity around something that’s been around the city for a while as an important priority. Creating a system for it has allowed us to move beyond the advocacy groups in higher-income neighborhoods. We spend a lot of time on the social justice side of it.”
rELATIONsHIPs wITH OTHEr JurIsdICTIONs A survey of planners and engineers conducted by the Institute of Transporta-tion Engineers found that the most commonly cited barriers to multimodal planning are the conflicts that arise between jurisdictions: between local governments and state DOTs, between MPOs and local governments, and between MPOs and states. Most jurisdictions do not control all of the roads
sIdEwALKs
s
It is very common across the United States for sidewalk construction and maintenance to be considered a sepa-rate responsibility from road building. In many cases, adjacent landowners are responsible for construction, maintenance, and snow removal. The practice stems from English common law and has proved a significant bar-rier to complete streets implementa-tion in some places. At the local level, aside from residents who want to maintain a “rural feel,” other residents are resistant to sidewalks because they do not want to have to repair them or shovel snow off them.
The New Jersey DOT and the Alan M. Voorhees Center issued a report on sidewalk construction and maintenance in New Jersey (VTC and Carmalt 2006), which includes a national assessment and overview. It states, “As a result of the complicated and multi-layered responsibility for sidewalk siting, construction and maintenance, varied municipal ordi-nances, and varied perceptions among decision makers about the need for sidewalks, the current sidewalk net-work in New Jersey is fragmentary and incomplete. This network has less utility than a complete network because potential pedestrians may forgo walking trips if they cannot rely on the presence of a safe facility all the way to their destinations.” The report recommends that laws should be changed so jurisdictions responsible for the road should also be responsible for the sidewalk.
Some communities with complete streets policies, such as Colorado Springs, Colorado, are addressing this issue by taking back responsibility for sidewalk construction and main-tenance. Several communities have launched sidewalk retrofit programs, including Charlotte, in which the city installs new sidewalks based on where they are most needed, as well as resi-dents’ requests (see www.charmeck .org/Departments/Transportation/About+Us/Sidewalk+Program+FAQ .htm). s
Chapter 5. Making the Transition: Planning for Change and Addressing Problems 63
within their boundaries; roads can be built and maintained by states, coun-ties, cities, townships, or private developers. Conflicting goals and design standards can result in an abrupt character change along a roadway or a stalled project that never gets off the ground at all. These issues were reported widely during our case study interviews. (See the Decatur case study, p. 25, and the Charlotte case study, p. 48.)
For example, Louisville Metro’s complete streets policies have helped the municipality communicate its complete streets vision to Kentucky’s DOT, which controls many roadways in the rural part of the metro area. And while the policy in Rochester, Minnesota, is quite new, it has already been used in negotiations with the state. When the Minnesota DOT recently sent the city its plans to refurbish a highway through the city, the city council noted the new complete streets policy and requested that inclusion of bike lanes be considered.
On the other side of the equation, state DOTs with complete streets policies report challenges in working with local communities and developers that do not necessarily share their vision. In Massachusetts, land-use and subsequent transportation decisions are entirely within the jurisdiction of municipalities, which are exempted from following the state’s Project Development and De-sign Guide. According to Rosalie Anders, a member of the state’s bicycle and pedestrian advisory board, “there needs to be a lot of education on the local level.” A former planner at PennDOT struck the same note on the need for local planners to educate the public and build support. PennDOT focuses on designing projects and maintaining facilities, not planning, so the agency is heavily reliant on the efforts of local planners and municipal staff as well as existing bicycle or pedestrian plans that document facility needs.
Smaller communities lament their inability to provide a more complete network beyond their borders. The relationship with its MPO—and meeting funding criteria—has been a challenge for Boulder, Colorado, as detailed in Chapter 6. University Place, Washington, controls all the roads within its borders, which has allowed this community to make dramatic on-the-ground changes. However, no adjacent jurisdictions have extended any of the town’s bike lanes—though a new countywide complete streets policy may change that. In contrast, the Sacramento region enjoys an interlocking web of jurisdictions with complete streets policies. Policies are in existence at the state, MPO, county, and city levels.
CONCLusIONThe transition from traditional automobile-centered transportation planning to complete streets is almost always a long one. Staff must learn not only new design techniques but new procedures and new ways of thinking through problems. A clear commitment to a complete streets approach, with the sup-port of the community’s leadership, is the best compass to guide planners and engineers through the transition.