Embed Size (px)
Citation preview

Complex distillationsystems.
Theory and models.
Pio AguirreINGAR
Santa Fe-Argentina

1.- Introduction.
2.- Theory in simple columns design.
3.- Reversible distillation columns and sequences.
4.- Optimal synthesis distillation columns sequences.
Outline

1.- Introduction.Mathematical models in Distillation⇒ predict values:
Product composition for F (xF)Minimum energy demand RminMinimum number of stages NminRelationship R/Rmin vs N/Nmin
Mathematical models for:Process optimization, design, synthesis.Process control.Process fault diagnosis.
Interest in Distillation grows because of:Energy intensive process: Petrochemical, Biofuels.New processes.
Complex sequences: energy intensive.Reactive distillation: equipment intensive.Reactive-extractive distillation.
High improvement potentials in distillation processes.
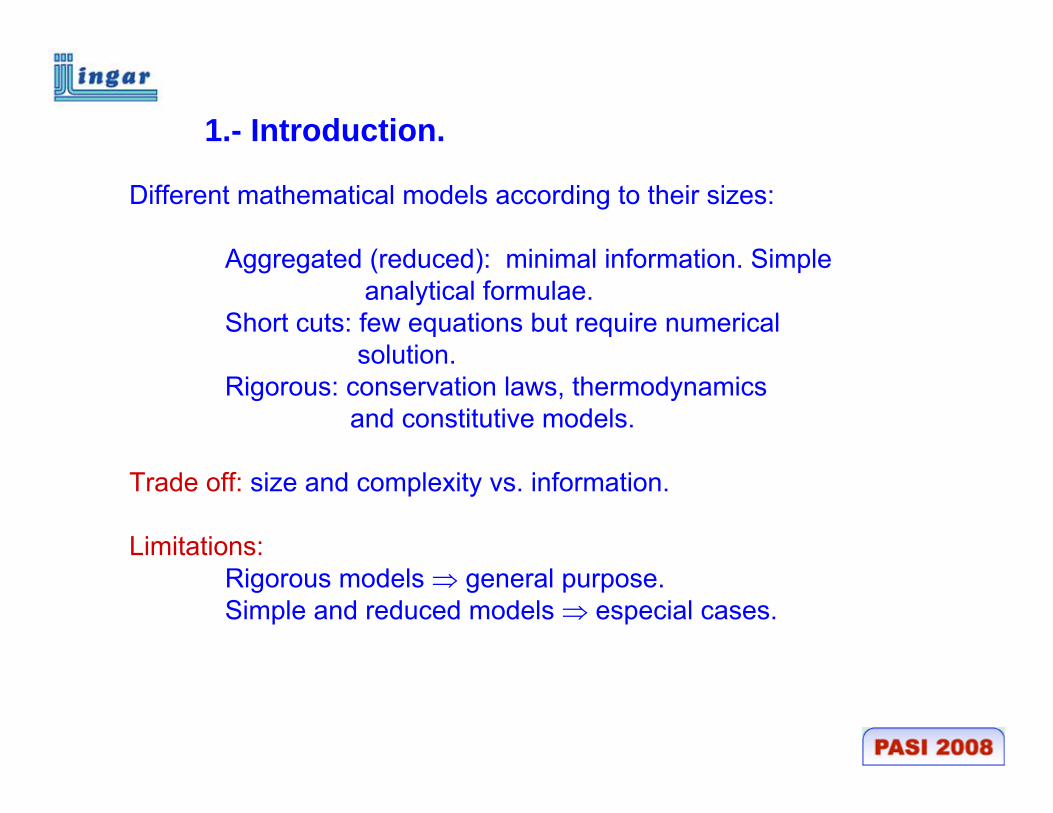
1.- Introduction.
Different mathematical models according to their sizes:
Aggregated (reduced): minimal information. Simple analytical formulae.
Short cuts: few equations but require numerical solution.
Rigorous: conservation laws, thermodynamics and constitutive models.
Trade off: size and complexity vs. information.
Limitations:Rigorous models ⇒ general purpose.Simple and reduced models ⇒ especial cases.

Fundamental concepts in distillation
Models components:Mass balancesV-L equilibrium Energy balances
Very exact descriptions using rigorous models for distillations
Concepts derived from distillation theory:Pinch pointsResidue curves Distillation points
1.- Introduction

2.- Theory in simple columns design.
Thermodynamic aspectsV-L Equilibrium Ideal MixturesT vs X(Y), P=cte. diagram
NCiTPPTyxK =K iii
...,1);(),,,(
==
iii xTKy )(=
Mathematical models.Minimum energy demand.Minimum number of stages.
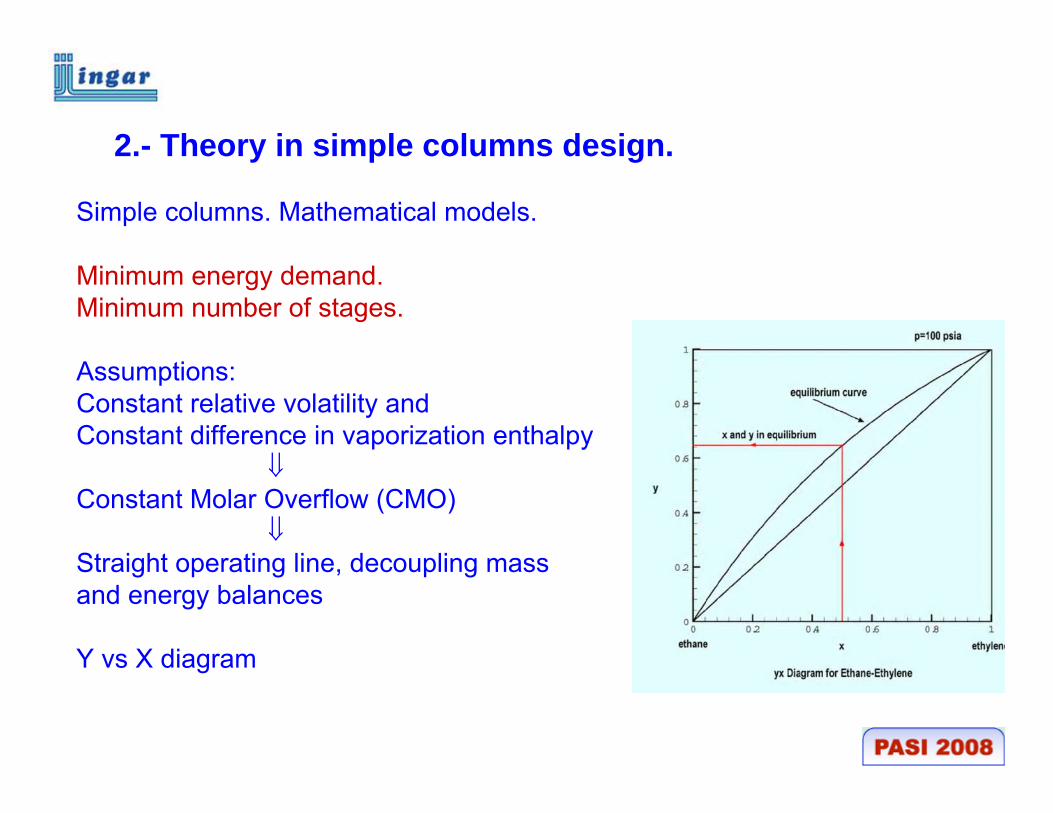
Simple columns. Mathematical models.
Minimum energy demand.Minimum number of stages.
Assumptions:Constant relative volatility andConstant difference in vaporization enthalpy
⇓Constant Molar Overflow (CMO)
⇓Straight operating line, decoupling mass and energy balances
Y vs X diagram
2.- Theory in simple columns design.
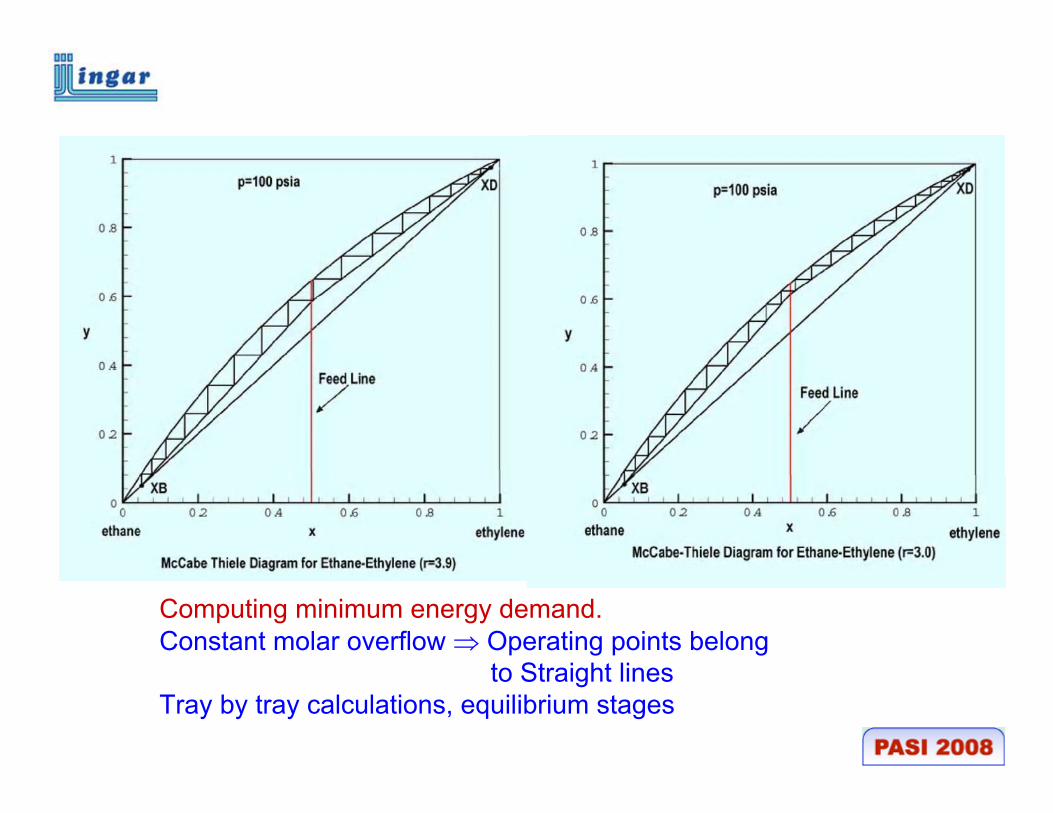
Computing minimum energy demand.Constant molar overflow ⇒ Operating points belong
to Straight linesTray by tray calculations, equilibrium stages

Minimum energy demand.Pinch at Feed tray.The number of stages increases at the feed location.

Minimum number of stages. Total reflux = Distillation pointsXk⇒VLE ⇒ Yk
* = Xk+1 ⇒ VLE ⇒ Y*k+1 = Xk+2 …

V-L Equilibrium
Non- Ideal Mixtures
X vs Y ; P=cte. diagram
);(),(),,,(
TPTxPTyxK =K
ii
ii
γ=
Constant molar overflow?.

Multicomponent systems. Adiabatic Column. Constant pressure. Rigorous simulation.Liquid composition profiles
0 10 20 30 40 50 60 70 80 900,0
0,1
0,2
0,3
0,4
0,5
0,6
0,7
0,8
A B C
Feed Stage: 42
Frac
cion
Mol
ar
Stages
Composition profiles (F, i = 0.33/ 0.33/ 0.34 - D, i = 0.7946/ 0.205/ 0 -B, i = 0/0.4184/0.5815 - p = 101.3 Kpa)n-pentane, n-hexane and n-heptane
Pinch points?

1
(1)
Increasing Reboil Ratio
2
3
4
5
Adiabatic Stripping Profile
(2) (3) B
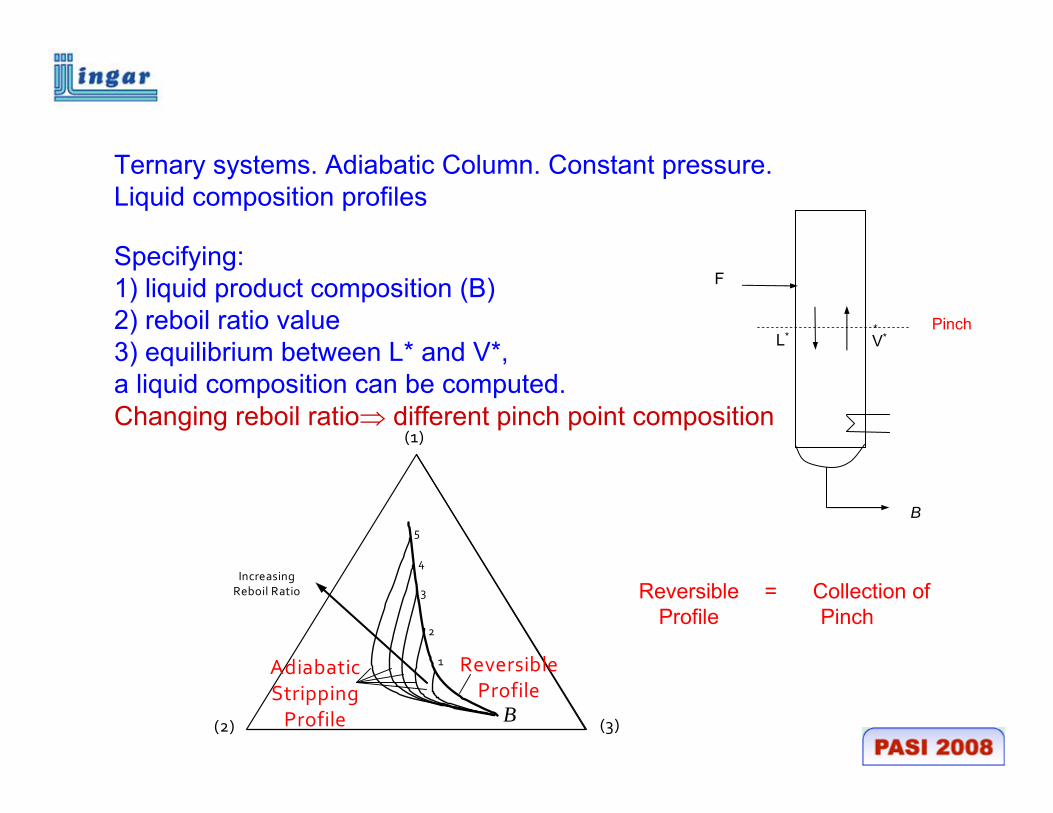
Ternary systems. Adiabatic Column. Constant pressure. Liquid composition profiles.
Rigorous simulation.Specifying a liquid product composition (B) and the reboil ratio, the succession of liquid composition tray-tray profile can be computed.
The liquid profile approaches a pinch point. The number of stages ⇒ ∞ at eachpoint: 1, 2, …
1
(1)
Increasing Reboil Ratio
Reversible Profile
2
3
4
5
Adiabatic Stripping Profile (2) (3)
B
Ternary systems. Adiabatic Column. Constant pressure. Liquid composition profiles
Specifying:1) liquid product composition (B) 2) reboil ratio value3) equilibrium between L* and V*, a liquid composition can be computed.Changing reboil ratio⇒ different pinch point composition
L* V*
F
*
B
Pinch
Reversible Profile
= Collection of Pinch

Reversible path for a bottom: distillative alcoholic mixture.
Reversible ProfileAdiabaticProfiles

Energy
Reversible Path
Tem
pera
ture
Reversible path for a bottom: distillative alcoholic mixture.Starting from product D (TD) and increasing reboil ratio, the profile is computed.Temperature and Energy results from the reversible profile.

Reversible path for a bottom (B): azeotropic system.
Points computed with newton homotopy.
Ace
tone
Acetone-ChloroformAzeotrope
Chloroform Benzene Benzene
ReversibleProfile
Disjunct Arm
Acetone

L*
L V
V*
F
D rev
Q C rev
Q H rev
*
Specifying:1) Feed composition,2) product compositions B and D satisfying total mass balance, 2) reboil and reflux ratios satisfying total energy balance, 3) equilibrium between L* and V* and between L and V,
liquid composition profiles can be computed.
PINCH CURVES, PINCH PATHS, REVERSIBLE PROFILES, REVERSIBLE PATHS, ETC.
NO ASSUMPTION ON V-L EQUILIBRIUM AND ON ENTHALPY MODELS
3.- Reversible distillation columns and sequences.

ss V = D + L
sisDisis yV =x D +x L ,,,
sVsDDsLs hV =Qh D +h L ,, +
),,,( ,, sssisiii pTyxK =K
),,( ,,, sssisLsL pTxh =h
),,( , sssiVV pTyh =h
Cs p =p
sisisi xKy ,,, =
Mass balances
Given:XD, YD, P, TD and QDat least one liquid composition can be computed: X,ss ∈ S: set of different kinds of pinches.
NO ASSUMPTION ON V-L EQUILIBRIUM AND ON ENTHALPY MODELS
Equilibrium
Energy balance
Thermodynamic Properties Constant pressure
PINCH EQUATIONS3.- Reversible distillation columns and sequences.

Reversible Profile from D
Reversible Profile from B
Pinch profiles for products B and D.
Mass balance line: B-F-D
Pinch points satisfying total energy balance.
NO ASSUMPTION ON V-L EQUILIBRIUM AND ON MOLAR FLOWS
3.- Reversible distillation columns and sequences.

Reversible Profile from D
Reversible Profile from B
Pinch profiles for products B and D.
Mass balance line: B-F-D
Moving F : Reversible specification
NO ASSUMPTION ON V-L EQUILIBRIUM AND ON MOLAR FLOWS
Reversible specificationReversible profiles intersect at feed composition
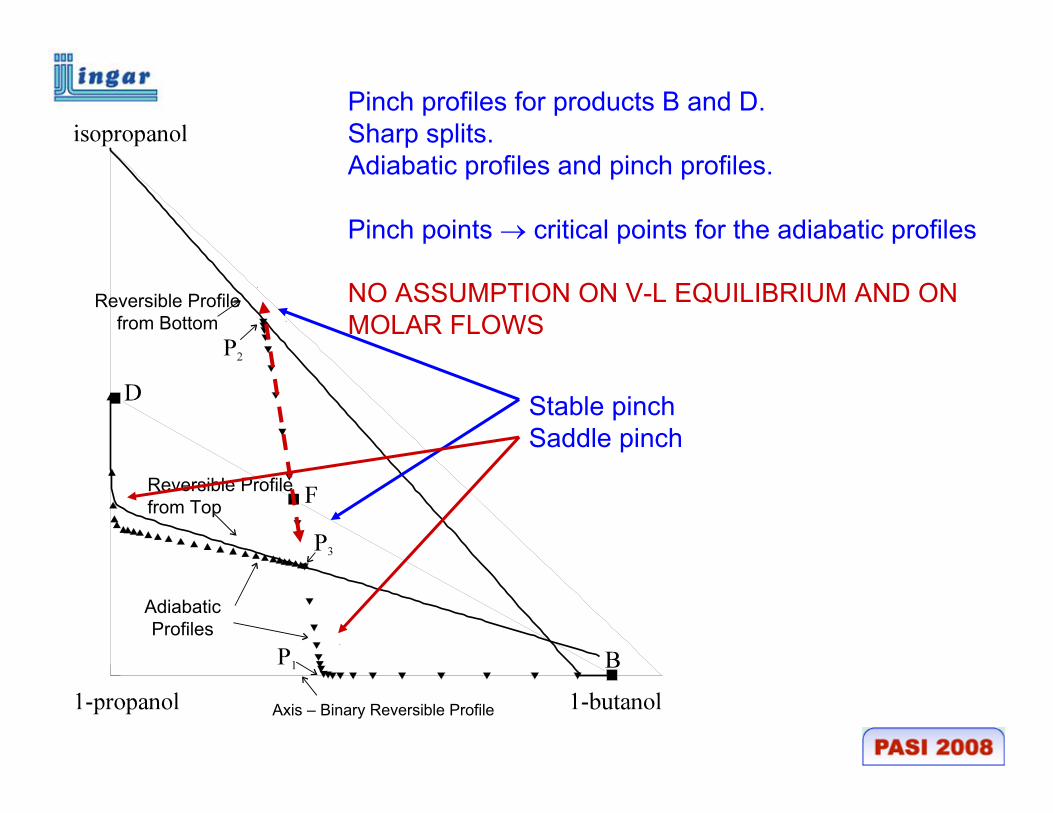
Axis – Binary Reversible Profile
AdiabaticProfiles
Reversible Profilefrom Top
Reversible Profilefrom Bottom
Pinch profiles for products B and D. Sharp splits.Adiabatic profiles and pinch profiles.
Pinch points → critical points for the adiabatic profiles
NO ASSUMPTION ON V-L EQUILIBRIUM AND ON MOLAR FLOWS
Stable pinchSaddle pinch

Brev, max
(3) (2)
(1)
F
Drev, max
y *
Drev, max
Brev, max
F
UpperSaddle
Pinch Point
LowerSaddle
Pinch Point
DoublePinch Point
Q H, rev
Q C, rev min
Reversible Distillation. (Sharp).
For each feed composition, there exists a special, “preferred” specification.
V-L equilibrium vector (Y*-X*) belongs to Mass balance line: D-F-B.
NO ASSUMPTION ON V-L EQUILIBRIUM AND ON MOLAR FLOWS

Reversible distillation.For each feed composition, there exists a special “preferred”product specification set.
Other product specifications ⇒ Non reversible distillation (1 col.)
Are pinch points always “observable” in adiabatic columns profiles?
It depends on feed and product specification and on RR. Non sharp in this figure.
D rev
B rev, maxB rev, max
(3) (2)
(1)
F
D rev
y * F
Lower SaddlePinch Point Q > Q H, rev
Q > Q C, rev

Adiabatic profile shape is determined by the pinch point.
AdiabaticProfiles
Reversible distillation.(Y* - X*) � B-F-D ⇒ Reversible specification
“Observable” pinch in adiabatic column.Double feed pinch.

Non Reversible distillation.(X* - Y*) ⊈ B-F-DPinch topology. Specifying reflux and reboil ratiosThree pinches for D→ upper triangle Three pinches for B → lower triangle
Minimum reflux⇒ pinch triangles touch each other at Feed composition
Note: some pinches outside: xb<0

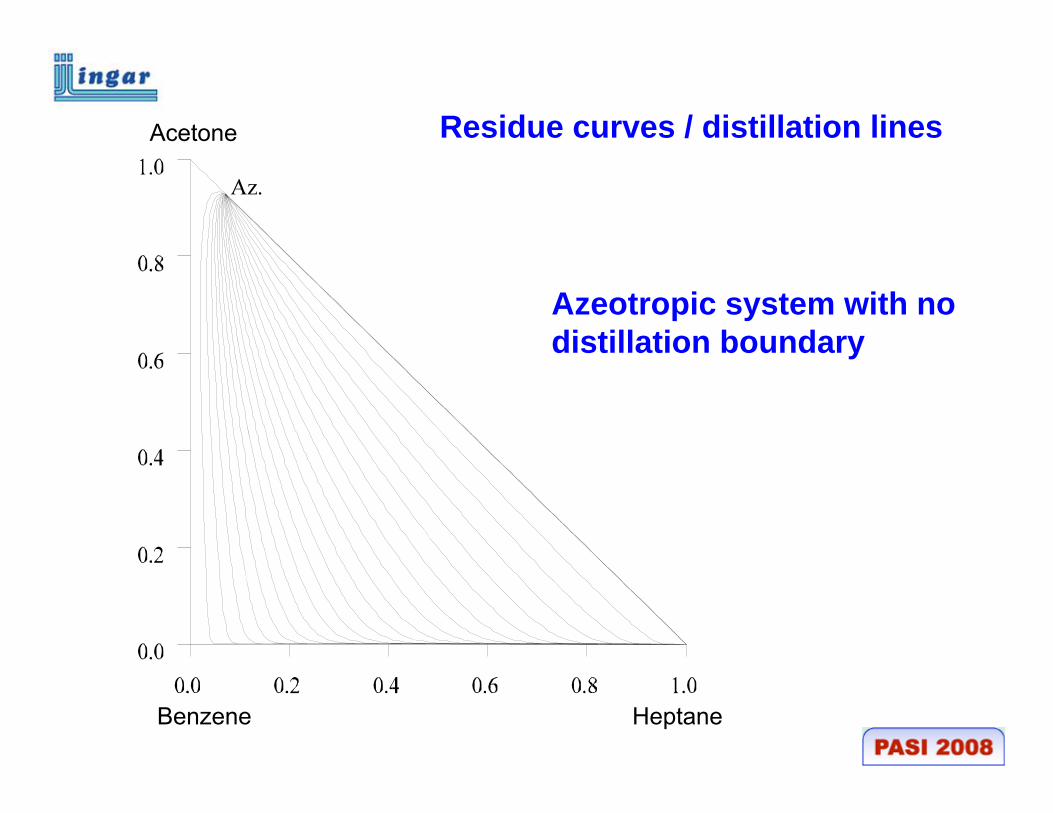
Residue curves distillation lines
Pinch profiles and Residue curves dominate distillation theory.
Acetone
BenzeneChloroform
Distillation boundary (DB)
Not possible to cross DB at total reflux

iii
Vap
iVapi
y =x K
F = dtdV
yF = dt
xVd
−
−)(
iii
Vap
iiVapi
y =x K
F = dtdV
xyF = dt
xdV
−
−− )(
Residue curves
V; X; T; P
Fvap; Y; T; P
HeptaneBenzene
Acetone Residue curves / distillation lines
Azeotropic system with no distillation boundary

Residue curves divide the simplex in two regions.One region may be convex. Adiabatic profiles only cross residue curves to the locally convex side when going from products to feed.
Ternary systems

0 100 200 300
1,05
1,10
1,15
1,20
rectifying section stripping section
Red
uce
Tem
pera
ture
T/2
98·K
Cumulative Energy (KJ/s)
Cumulative energy profilesobtained from pinch equations.Ideal three-component mixture
Improving energy distribution in Simple columns. Temperature – Energy Pinch profiles
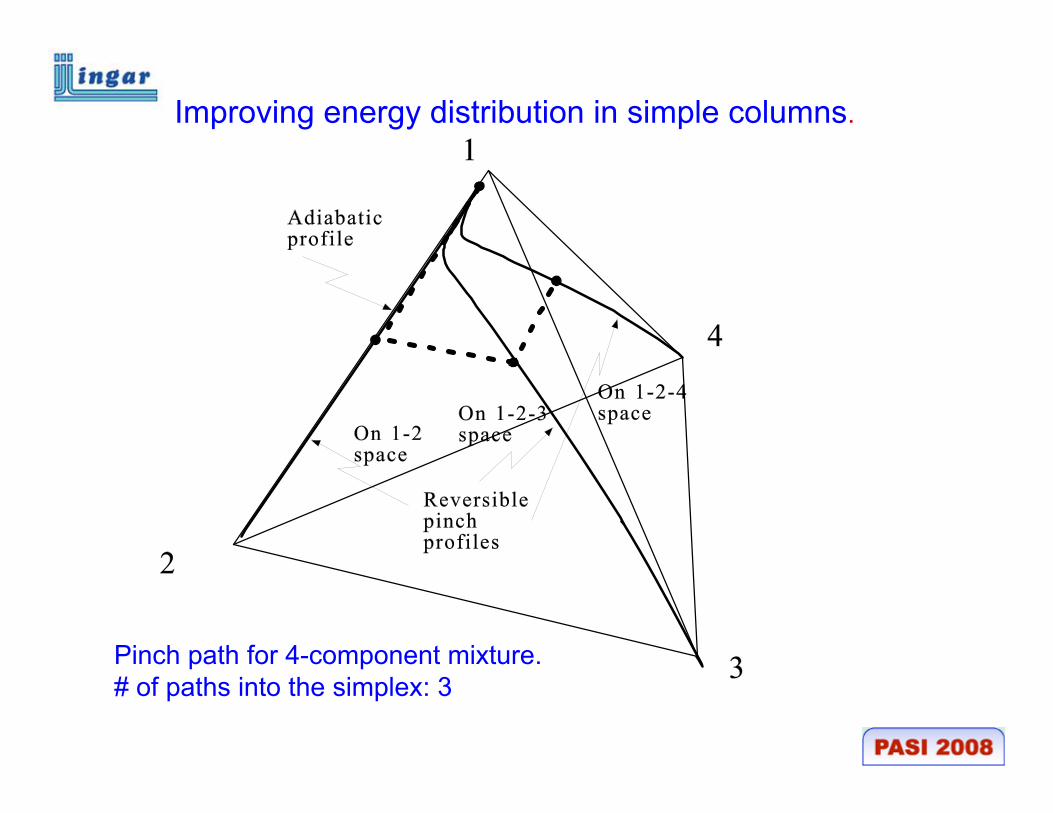
Pinch path for 4-component mixture.# of paths into the simplex: 3
Improving energy distribution in simple columns.

Pinch path for 3-component mixture.# of paths into the simplex: 2Which one should be used to approximate reversible profiles?
Improving energy distribution in simple columns.

A Pinch path for non ideal mixture.Tangent pinch is possible.
Minimum energy determined by tangent pinch.
Improving energy distribution in simple columns.
BenzeneChloroform
Acetone
Benzene
AdiabaticProfiles
ReversibleProfilesA
ceto
ne
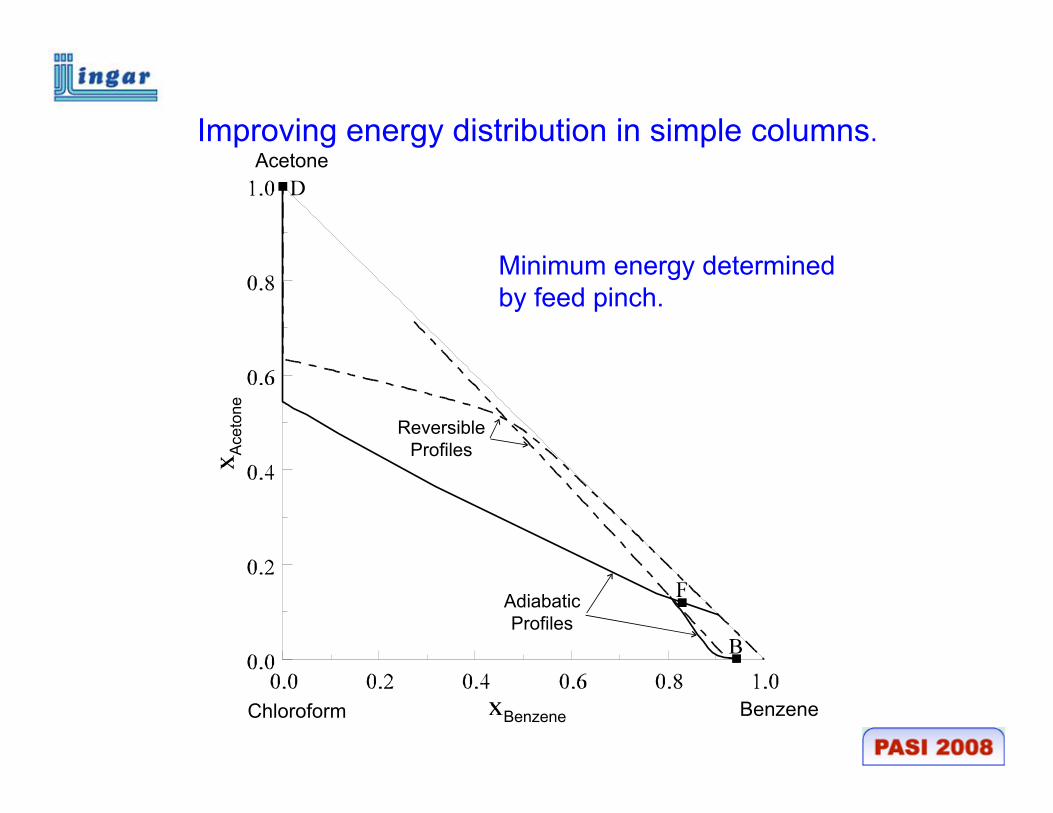
Improving energy distribution in simple columns.
Minimum energy determined by feed pinch.

BenzeneChloroform
AcetoneAc
eton
e
Benzene
AdiabaticProfiles
DistillateReversible Profile
Improving energy distribution in simple columns.
Minimum energy determined by tangent pinch.

Separations involving tangent pinch.
Residue curve with inflexion points.
Improving energy distribution in simple columns.
Chloroform
Acetone
Benzene

Reversible Distillation Sequence Model (RDSM)
What is the superstructure that most closely approximates the Reversible Distillation of Multicomponent Mixtures like?
Which is the optimal energy distribution in the RDSM-based sequence?
3.- Reversible distillation columns and sequences.

Theoretical model.Infinite number of stages.Continuous heat distribution along column length.Heat to and from the column is transferred at zero temperature difference.No contact of non-equilibrium streams take place in any point of the column.Only one separation task can be performed: the reversible separation.
A Reversible Column

F
Drev
Brev
QC rev =Σ QC rev i
QH rev =Σ QH rev i
F
Drev
Brev
QC rev i
QH rev i
i
i
A sufficiently high number of stages must be employed.The same energy is involved in the separation with a different distribution.The same products are achieved but different composition profiles develop within each unit.
RDC Adiabatic Approach

RDSM Sequence
A B C D
A B C
B C D
C D
B C
D
CC
BC
B C
A B
BB
A
A B C D
B C D
C D
B CC
A B
D
A
A B C
B C
B
B
C
1
2
6
3
4
5
7
RDSM-based Sequence

RDSM-based Synthesis Model
Preprocessing Phase
Single ColumnPreprocessing
Phase
Efficient SequenceSynthesis Model
SequencePreprocessing
Phase

Preprocessing Phase
Optimal Energy Distribution foreach single unit.Number of stages for each singlecolumn of the sequence.Objective functions and constraints to approach the reversible separationtask.
Values to initializate variables.Values to bound critical variablesrelated to unit interconnection and
heat loads.Parameters to formulate objective functions.
Sequence Preprocessing
Reversible Products,Saddle Pinch Points and
Reversible Exhausting Pinch Points Calculations
Single ColumnPreprocessing
Adiabatic Approximation to the Reversible Separation

Initialization
xtop i ≈ x revi,D
xbot i ≈ x revi,B
QC tot ≈ Q revC,
QH tot ≈ Q revH,
D ≈ Drev
B ≈ B rev
x i, s , x*i, s , y i, s , y*
i, sLs , L*
s , Vs , V*s
Ts , T*s
xxFF ii , , qqFF , , ppCCFeed Flash
Model
Reversible Model
hlF , hvF , yF i , TF
QC rev , QH rev , x revi,D , x rev
i,BhD , hB , Drev , B rev
Single Column Optimization
Model
Saddle Pinch Model
Ls , L*s ,
Vs , V*s
TD , TB
FF
Initialization
Initialization
Single ColumnPreprocessing
Adiabatic Approximation to the Reversible Separation

revBV = L +**
revB,i
revi
*i
* xByV =x L +
* *rev revL H V BL h Q = V h B h+ +
revBa
revDc x x =z ,,min +
V = D + L rev
irev
D,irev
i yV =x D +x L
rev revL D C VL h + D h Q = V h+
(RM): *F L =F)q(L −+ 1
*F V =FqV +
( , , , ) 1, ...i i i iK = K x y T p i NC=
( , , )L L ih = h x T p
( , , )V V ih = h y T p
,
Single ColumnPreprocessing
Adiabatic Approximation to the Reversible Separation
Known values from flash calculations at Feed

revss BV = L +**
revrevsissis Bi
xByV =x L,,
*,
* +
srev
s V = D + L
sisrevrev
sis yV =x D +x LDi ,, ,
(SPM):
( , , , ) 1, ...i i i iK = K x y T p i NC=
( , , )L L ih = h x T p
( , , )V V ih = h y T p
,
Single ColumnPreprocessing
Adiabatic Approximation to the Reversible Separation
Known values from flash calculations at Feed
* * * *, ,
rev revs L s H s V s BL h Q = V h B h+ +
, ,rev rev
s L s D C s i sL h + D h Q = V h+
, ,0 0NC s NC sx y= =1, 1,
* *0 0s s
x y= =

The number of trays is selected by optimizing the condenser, reboiler and/or feed stream locations.
F
D
B
F
B
D
F
B
D
Variable feed and reboiler location
F
D
B
F
B
DF
B
D
Variable feed and condenser location
F
B
D
F
D
B
F
B
DVariable condenser and reboiler location

F1
Lv2
Qctot3
PP2
PP1
PP3
F3 = S3
F2 = S2
Ll2
Qhtot3
Qctot2
Qhtot2
Qctot1
Qhtot1j =1
j =3
j =2PLlj
j
j +1
PLvj
Qphase j < 0
Qphase j > 0
PPj
Ternary mixture.
Heat IntegrationSuperstructure
Sequence PreprocessingReversible Products, Saddle Pinch Points and Reversible Exhausting Pinch Points Calculations

Less efficient RDSM-based superstructures:
PP3
PP1
PP2F1
1
2
3
PP3
PP1
PP2F1
1
3
2
Fully Thermally Coupled Scheme (Petlyuk Column)
Fully Thermally Coupled Scheme with Heat Integration

ABC
ABC
BC
AB
BC
A
B
B
Azeotrop
C
B C
C D
A B
A B C
B C D
A
A B C D
B C
B
C
B
C
D
Zeotropic Mixture Azeotropic Mixture
3.- Reversible distillation columns and sequences.

PP3
PP1
PP2
Numerical ExamplesModels implemented and solved in GAMS employing DICOPTCONOPT.
ppl
F1
Qphase
Qh3
Qint
Qc1
Qh1
Qc2
ppv
S3F3
S2F2
L2
PLlj
j
j +1
PLvj
Qphase j < 0
Qphase j > 0
PPj
L2
L3
3.- Reversible distillation columns and sequences.

Entering stagenumber for
Theoretical Our ModelTheoretical Our ModelStream
Flow rate (mol/sec) Composition
Feed: n-pentane, n-hexane, n-heptane 0.3/0.5/0.2Stages: col1 30, col2 80, col3 50
F2
F3
S2
S3
L2v
L2l
ppl
ppv
5.34 5.36
8.16 8.08
1.05 1.15
2.45 2.291.88 1.77
2.49 2.4
0.67 0.60
4.33 4.42
0.6355/0.364/0 0.634/0.3652/6e-4
0/0.714/0.286 4e-3/0.71/0.2856
0.6355/0.364/0 0.634/0.3652/6e-4
0.375/0.625/0 0.373/0.6257/9e-4
0/0.864/0.1356 1e-3/0.863/0.1356
0/1/0 2e-3/0.997/7e-4
0/1/0 2e-3/0.997/7e-40/1/0 2e-3/0.997/7e-4
0/1/0 2e-3/0.997/7e-4
40
26
1
30
80
1-
-
3.- Reversible distillation columns and sequences.
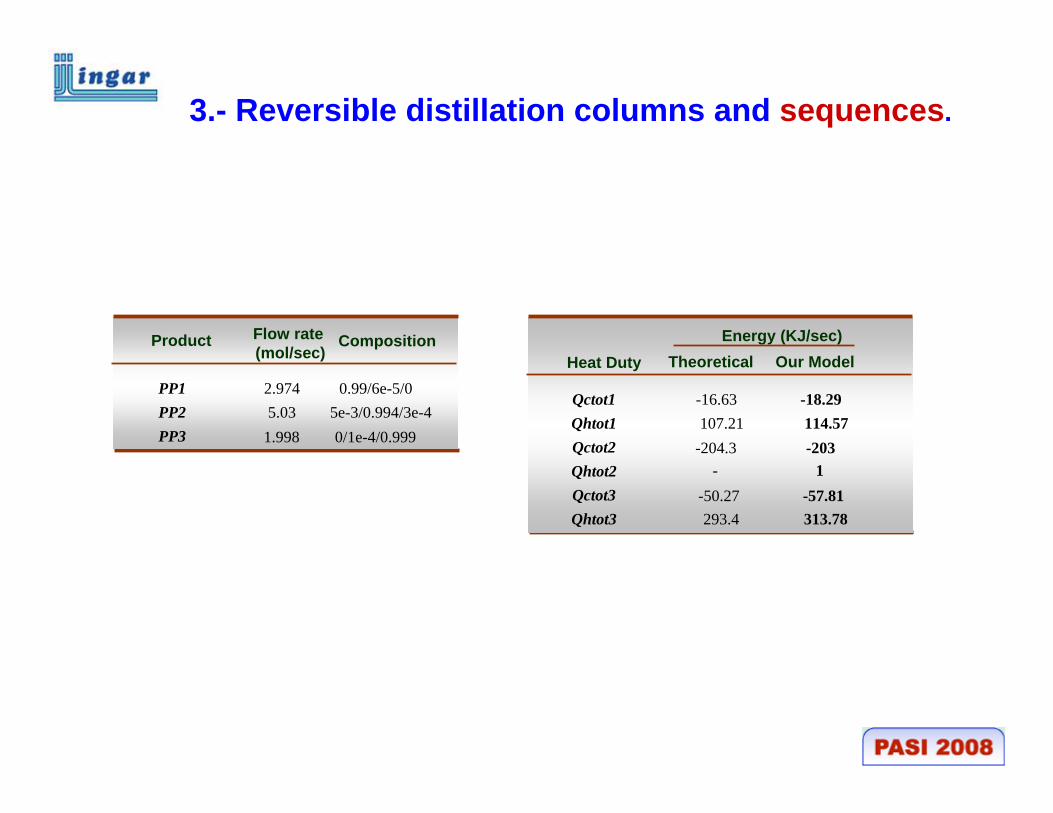
Theoretical Our ModelHeat DutyEnergy (KJ/sec)
107.21 114.57-16.63 -18.29
-204.3 -203- 1
-50.27 -57.81293.4 313.78
Qctot1Qhtot1Qctot2Qhtot2Qctot3Qhtot3
Flow rate (mol/sec)
CompositionProduct
5.03 5e-3/0.994/3e-42.974 0.99/6e-5/0
1.998 0/1e-4/0.999
PP1PP2PP3
3.- Reversible distillation columns and sequences.

Problem specsMixture: N-pentane/ N-hexane/ N-heptaneFeed composition: 0.33/ 0.33/ 0.34Feed: 10 moles/sPressure: 1 atmMax no trays: 15 (each section)Min purity: 98%Ideal thermodynamics
Superestructure
NLP Model
Continuous Variables 3301
Constraints 3230
MILP Model
Continuous Variables 15000
Discrete Variables 96
Constraints 8000
PP1
PP2
F
PP3
0.0 0.1 0.2 0.3 0.4 0.5 0.6 0.7 0.8 0.9 1.00.0
0.1
0.2
0.3
0.4
0.5
0.6
0.7
0.8
0.9
1.0
Mol
e Fr
actio
n n-
pent
ane
Mole Fraction n-hexane
Feed Col 1 Col 2 Col 3
Initialization
4.- Optimal synthesis distillation columns sequences.

Optimal Configuration$140,880 /year
Optimal Design
Annual cost ($/year) 140,880
Preprocessing(min) 2.20
Subproblems NLP (min) 6.97
Subproblems MILP (min) 2.29
Iterations 5
Total solution time (min) 11.460.0 0.1 0.2 0.3 0.4 0.5 0.6 0.7 0.8 0.9 1.0
0.0
0.1
0.2
0.3
0.4
0.5
0.6
0.7
0.8
0.9
1.0
Mol
e Fr
actio
nn-
pent
ane
Mole Fraction n-hexane
FeedCol 1 (tray 1 to 14)Col 1 (tray 15 to 34)Col 2 (tray 1 al 9)Col 2 (tray 10 al 32)
PP398% n-heptane
36
9
32
PP298% n-hexane
26
19
PP198% n-pentane
F
Qc = 52.4 kW
QH = 298.8 kW
48.8 kW
1
11 12
14
Qc = 271.3 kW
PP398% n-heptane
12
23
PP298% n-hexane
10
PP198% n-pentane
F
1
22
Dc1 = 0.45 m
Dcrect2 = 0.6 m
Dcstrip2 = 0.45 m
1
14
23
1
Dcstrip3 = 0.63 m
Dcrect3 = 0.45 m
4.- Optimal synthesis distillation columns sequences.

Optimal Configuration$140,880 /año
Optimal Design
Annual cost ($/year) 140,880
Preprocessing(min) 2.20
Subproblems NLP (min) 6.97
Subproblems MILP (min) 2.29
Iterations 5
Total solution time (min) 11.46
PP398% n-heptane
36
9
32
PP298% n-hexane
26
19
PP198% n-pentane
F
Qc = 52.4 kW
QH = 298.8 kW
48.8 kW
1
11 12
14
Qc = 271.3 kW
PP398% n-heptane
12
23
PP298% n-hexane
10
PP198% n-pentane
F
1
22
Dc1 = 0.45 m
Dcrect2 = 0.6 m
Dcstrip2 = 0.45 m
1
14
23
1
Dcstrip3 = 0.63 m
Dcrect3 = 0.45 m
Side-Rectifier $143,440 /year
Direct Sequence $145,040 /year
4.- Optimal synthesis distillation columns sequences.

Problem specifications(Yeomans y Grossmann, 2000)
Mixture: Methanol/ Ethanol/ WaterFeed composition: 0.5/ 0.3/ 0.2Feed flowrate: 10 moles/sPressure: 1 atmInitial trays: 20 (per section)Purity specification: 90%
F
methanol
ethanol
Azeotrope
water
ethanol
Superstructure
NLP Model
Continuous Variables 9025
Constraints 8996
Nonlinear non-zeroes 18230
MILP Model
Continuous Variables 12850
Discrete Variables 96
Constraints 18000
0.0 0.1 0.2 0.3 0.4 0.5 0.6 0.7 0.8 0.9 1.00.0
0.1
0.2
0.3
0.4
0.5
0.6
0.7
0.8
0.9
1.0
Frac
ción
mol
ar m
etan
ol
Fracción molar de etanol
Alimentación Líquido columna 1 Líquido columna 2 Líquido columna 3 Líquido columna 4 Líquido columna 5
Initialization
4.- Optimal synthesis distillation columns sequences.
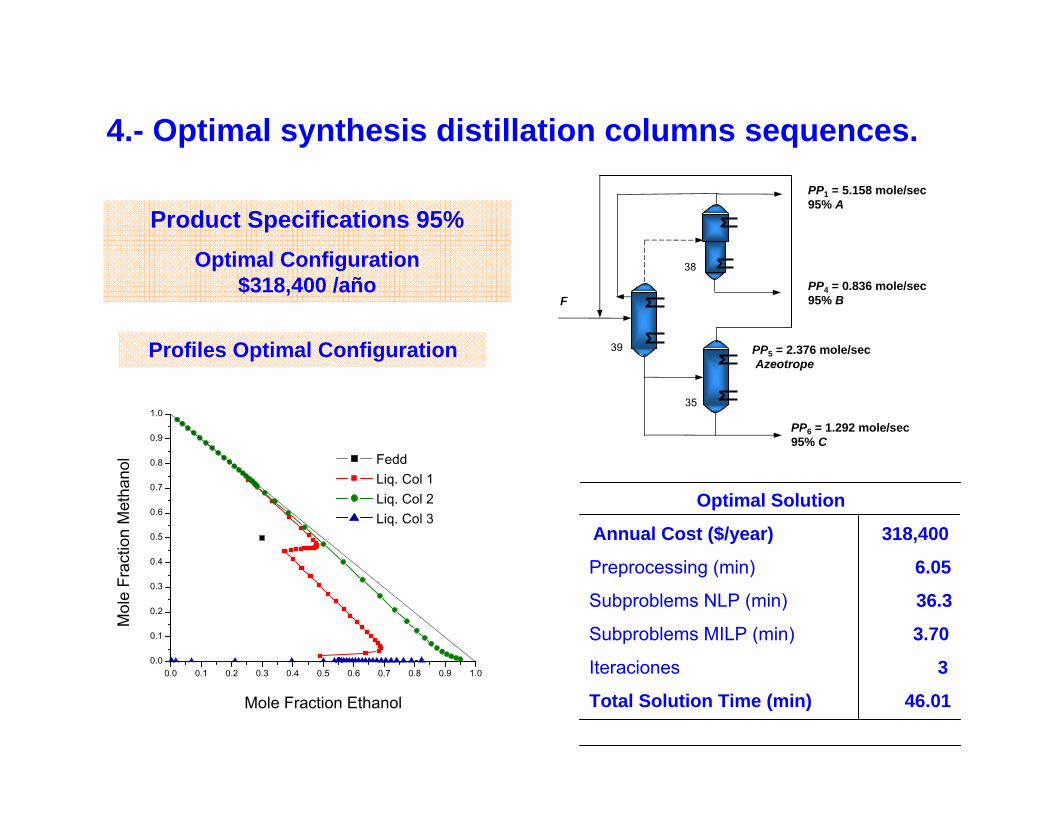
Product Specifications 95%Optimal Configuration
$318,400 /año
Optimal Solution
Annual Cost ($/year) 318,400
Preprocessing (min) 6.05
Subproblems NLP (min) 36.3
Subproblems MILP (min) 3.70
Iteraciones 3
Total Solution Time (min) 46.01
F
PP6 = 1.292 mole/sec95% C
PP1 = 5.158 mole/sec95% A
PP4 = 0.836 mole/sec95% B
39
38
35
PP5 = 2.376 mole/secAzeotrope
0.0 0.1 0.2 0.3 0.4 0.5 0.6 0.7 0.8 0.9 1.00.0
0.1
0.2
0.3
0.4
0.5
0.6
0.7
0.8
0.9
1.0
Mol
e Fr
actio
n M
etha
nol
Mole Fraction Ethanol
Fedd Liq. Col 1 Liq. Col 2 Liq. Col 3
Profiles Optimal Configuration
4.- Optimal synthesis distillation columns sequences.

Conclusions
Distillation optimization with rigorous models remains major computational challenge
Optimal feed tray and number of trays problems are solvable
Keys: Initialization, MINLP/GDP models
Synthesis of complex columns remains non-trivialProgress with initialization, GDP, decomposition
Improvements potential in distillation processes


![Data Distillation: Towards Omni-Supervised Learning · Data Distillation model A model A Figure 1. Model Distillation [18] vs. Data Distillation. In data distillation, ensembled predictions](https://img.pdfslide.net/doc/110x75/60a237adb93b13457117b793/data-distillation-towards-omni-supervised-learning-data-distillation-model-a-model.jpg)