Embed Size (px)
Citation preview
Complex genetic patterns in closely related colonizinginvasive speciesAibin Zhan1, John A. Darling2, Dan G. Bock1, Anaıs Lacoursiere-Roussel3, Hugh J. MacIsaac1
& Melania E. Cristescu1
1Great Lakes Institute for Environmental Research, University of Windsor, 401 Sunset Avenue, Windsor, Ontario N9B 3P4, Canada2National Exposure Research Laboratory, US Environmental Protection Agency, 109 T. W. Alexander Drive, Durham, North Carolina 27711, USA3Department of Biology, McGill University, 1205 Docteur Penfield, Montreal, Quebec H3A 1B1, Canada
KeywordsCiona intestinalis, genetic complexity,phylogeography, population genetics,selection/local adaptation, solitary ascidian.
CorrespondenceAibin Zhan, Great Lakes Institute forEnvironmental Research, University of Windsor,Windsor, Ontario, N9B 3P4, Canada.Tel: +519 2533000, ext. 3749;Fax: +519 9713616; E-mail:[email protected]
This work was supported by research grantsfrom Natural Sciences and EngineeringResearch Council of Canada (NSERC) and theCanadian Aquatic Invasive Species Network(CAISN) to M. E. C. and H. J. M., a DiscoveryAccelerator Supplement grant to H. J. M., andan Ontario Ministry of Research and InnovationEarly Researcher Award to M. E. C. A. L. R. wassupported by scholarships from FondsQuebecois de la Recherche sur la Nature et lesTechnologies (FQRNT), Quebec-Ocean andMcGill University. The United StatesEnvironmental Protection Agency (EPA)through its Office of Research andDevelopment partially funded and collaboratedin the research described here.
Received: 29 February 2012; Revised: 16March 2012; Accepted: 16 March 2012
Ecology and Evolution 2012; 2(7):1331–1346
doi: 10.1002/ece3.258
Abstract
Anthropogenic activities frequently result in both rapidly changing environmentsand translocation of species from their native ranges (i.e., biological invasions).Empirical studies suggest that many factors associated with these changes can leadto complex genetic patterns, particularly among invasive populations. However,genetic complexities and factors responsible for them remain uncharacterized inmany cases. Here, we explore these issues in the vase tunicate Ciona intestinalis(Ascidiacea: Enterogona: Cionidae), a model species complex, of which spA and spBare rapidly spreading worldwide. We intensively sampled 26 sites (N = 873) fromboth coasts of North America, and performed phylogenetic and population genet-ics analyses based on one mitochondrial fragment (cytochrome c oxidase subunit 3–NADH dehydrogenase subunit I, COX3-ND1) and eight nuclear microsatellites.Our analyses revealed extremely complex genetic patterns in both species on bothcoasts. We detected a contrasting pattern based on the mitochondrial marker: twomajor genetic groups in C. intestinalis spA on the west coast versus no significantgeographic structure in C. intestinalis spB on the east coast. For both species, geo-graphically distant populations often showed high microsatellite-based geneticaffinities whereas neighboring ones often did not. In addition, mitochondrial andnuclear markers provided largely inconsistent genetic patterns. Multiple factors,including random genetic drift associated with demographic changes, rapid selec-tion due to strong local adaptation, and varying propensity for human-mediatedpropagule dispersal could be responsible for the observed genetic complexities.
IntroductionIdentifying factors responsible for microevolutionary pro-cesses over contemporary timescales is important for under-
standing how species evolve in response to rapidly changingenvironments associated with recent anthropogenic activi-ties (Carroll 2008; Roux and Wieczorek 2008). Biologicalinvasions provide an opportunity to answer fundamental
c© 2012 The Authors. Published by Blackwell Publishing Ltd. This is an open access article under the terms of the CreativeCommons Attribution Non Commercial License, which permits use, distribution and reproduction in any medium, providedthe original work is properly cited and is not used for commercial purposes.
1331
Genetic Complexities in Ciona intestinalis A. Zhan et al.
questions regarding microevolution, especially those involv-ing rapid range expansion or habitat transitions (Lee 2002;Suarez and Tsutsui 2008; Winkler et al. 2008; Bock et al.2012). Processes associated with biological invasions, suchas transfers of individuals to dramatically different environ-ments and sudden changes in population demography, canlead to exceedingly rapid evolutionary changes (Reznick andGhalambor 2001; Lee 2002; Prentis et al. 2008). However,understanding evolutionary processes that may accompanybiological invasions can be challenging because of geneticcomplexities generated by biological invasions (Lee 2002).Despite recent progress on evolutionary aspects of biologicalinvasions, the role and importance of the microevolutionaryfactors remain poorly understood (see reviews by Lee 2002;Prentis et al. 2008).
To better understand these evolutionary mechanisms, itis necessary to identify potential generalities and inconsis-tencies within and among multiple invasive species acrossdifferent geographic scales, and then identify the evolution-ary/ecological factors associated with common and uniquegenetic patterns. For aquatic species, many factors includinglife-history characteristics (e.g., sexual vs. asexual reproduc-tion, planktotrophic vs. direct development, etc.), environ-mental heterogeneity (e.g., different temperature, salinity,etc.), anthropogenic activities (e.g., habitat fragmentation,pollution, etc.), coupled with varying propensity for human-mediated propagule dispersal, can lead to extremely complexgenetic patterns (Lodge 1993; Kolar and Lodge 2001; Sakaiet al. 2001; Lee and Boulding 2009; Dupont et al. 2010; Bocket al. 2011). Recent empirical studies have revealed complexgenetic patterns at different geographic scales in aquatic in-vasive species (see e.g., Ben-Shlomo et al. 2006; Dupont et al.2009; Tepolt et al. 2009; Bock et al. 2011). Given that numer-ous nonindependent factors may be involved in determininggenetic patterns of aquatic invasive species, the choice of anappropriate model system seems critically important.
The vase tunicate, Ciona intestinalis, is a well-known modelspecies for developmental and evolutionary biology (see re-view by Procaccini et al. 2011). The recently published wholegenome (Dehal et al. 2002), coupled with detailed phylo-genetic and population genetics analyses (Caputi et al. 2007;Sordino et al. 2008; Nydam and Harrison 2010; Zhan et al.2010), has expanded C. intestinalis as a model for evolution-ary studies associated with biological invasions. Phylogeneticanalyses revealed that C. intestinalis is a species complex con-sisting of at least four morphologically cryptic but geneticallydistinct species (spA, spB, spC, spD; Zhan et al. 2010). Inter-estingly, the two highly invasive species, spA and spB, inhabitlargely disjoint geographic regions worldwide, while the othertwo, spC and spD, remain restricted to their putative nativeranges in the Mediterranean Sea and Black Sea, respectively(Caputi et al. 2007; Nydam and Harrison 2007; Zhan et al.2010). Population genetics analyses further illustrated rel-
atively low population differentiation and high populationconnectivity for the two highly invasive species at both re-gional and continental scales (Zhan et al. 2010). Abundantgenetic information generated by intensive developmentaland evolutionary studies, as well as increasing knowledge re-garding phylogenetics and population biology, indicates thatthe C. intestinalis species complex is a promising system forcomparing genetic patterns in closely related invasive speciesduring range expansions.
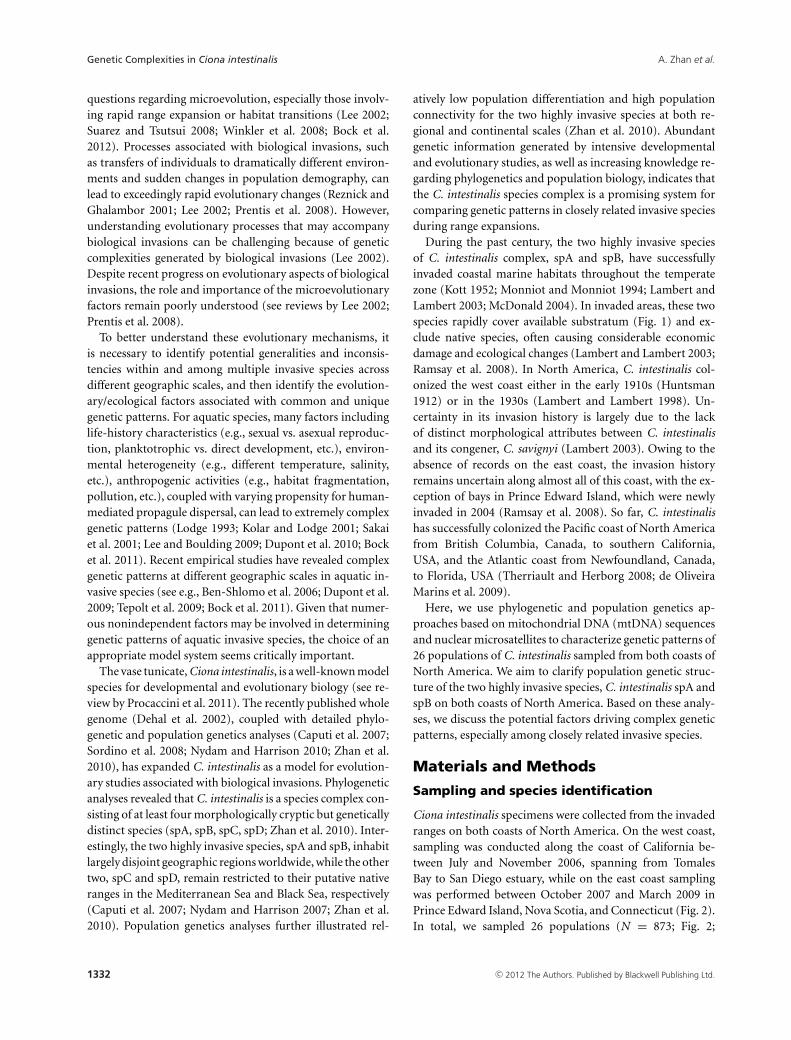
During the past century, the two highly invasive speciesof C. intestinalis complex, spA and spB, have successfullyinvaded coastal marine habitats throughout the temperatezone (Kott 1952; Monniot and Monniot 1994; Lambert andLambert 2003; McDonald 2004). In invaded areas, these twospecies rapidly cover available substratum (Fig. 1) and ex-clude native species, often causing considerable economicdamage and ecological changes (Lambert and Lambert 2003;Ramsay et al. 2008). In North America, C. intestinalis col-onized the west coast either in the early 1910s (Huntsman1912) or in the 1930s (Lambert and Lambert 1998). Un-certainty in its invasion history is largely due to the lackof distinct morphological attributes between C. intestinalisand its congener, C. savignyi (Lambert 2003). Owing to theabsence of records on the east coast, the invasion historyremains uncertain along almost all of this coast, with the ex-ception of bays in Prince Edward Island, which were newlyinvaded in 2004 (Ramsay et al. 2008). So far, C. intestinalishas successfully colonized the Pacific coast of North Americafrom British Columbia, Canada, to southern California,USA, and the Atlantic coast from Newfoundland, Canada,to Florida, USA (Therriault and Herborg 2008; de OliveiraMarins et al. 2009).
Here, we use phylogenetic and population genetics ap-proaches based on mitochondrial DNA (mtDNA) sequencesand nuclear microsatellites to characterize genetic patterns of26 populations of C. intestinalis sampled from both coasts ofNorth America. We aim to clarify population genetic struc-ture of the two highly invasive species, C. intestinalis spA andspB on both coasts of North America. Based on these analy-ses, we discuss the potential factors driving complex geneticpatterns, especially among closely related invasive species.
Materials and Methods
Sampling and species identification
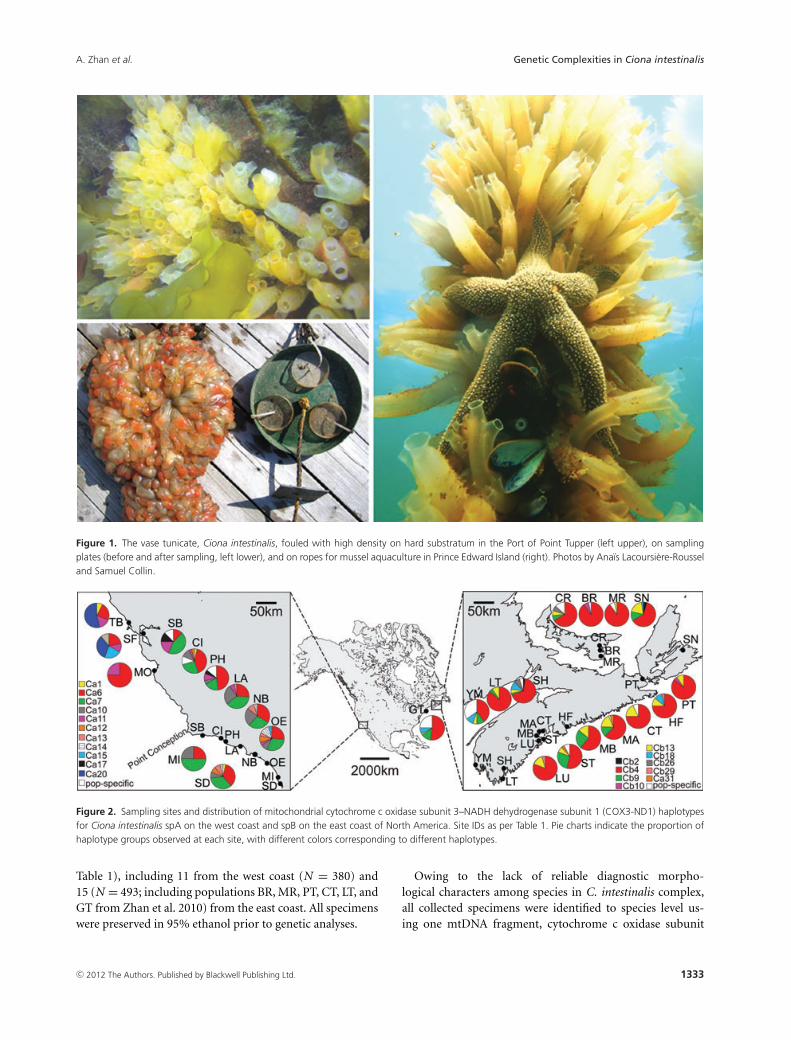
Ciona intestinalis specimens were collected from the invadedranges on both coasts of North America. On the west coast,sampling was conducted along the coast of California be-tween July and November 2006, spanning from TomalesBay to San Diego estuary, while on the east coast samplingwas performed between October 2007 and March 2009 inPrince Edward Island, Nova Scotia, and Connecticut (Fig. 2).In total, we sampled 26 populations (N = 873; Fig. 2;
1332 c© 2012 The Authors. Published by Blackwell Publishing Ltd.
A. Zhan et al. Genetic Complexities in Ciona intestinalis
Figure 1. The vase tunicate, Ciona intestinalis, fouled with high density on hard substratum in the Port of Point Tupper (left upper), on samplingplates (before and after sampling, left lower), and on ropes for mussel aquaculture in Prince Edward Island (right). Photos by Anaıs Lacoursiere-Rousseland Samuel Collin.
Figure 2. Sampling sites and distribution of mitochondrial cytochrome c oxidase subunit 3–NADH dehydrogenase subunit 1 (COX3-ND1) haplotypesfor Ciona intestinalis spA on the west coast and spB on the east coast of North America. Site IDs as per Table 1. Pie charts indicate the proportion ofhaplotype groups observed at each site, with different colors corresponding to different haplotypes.
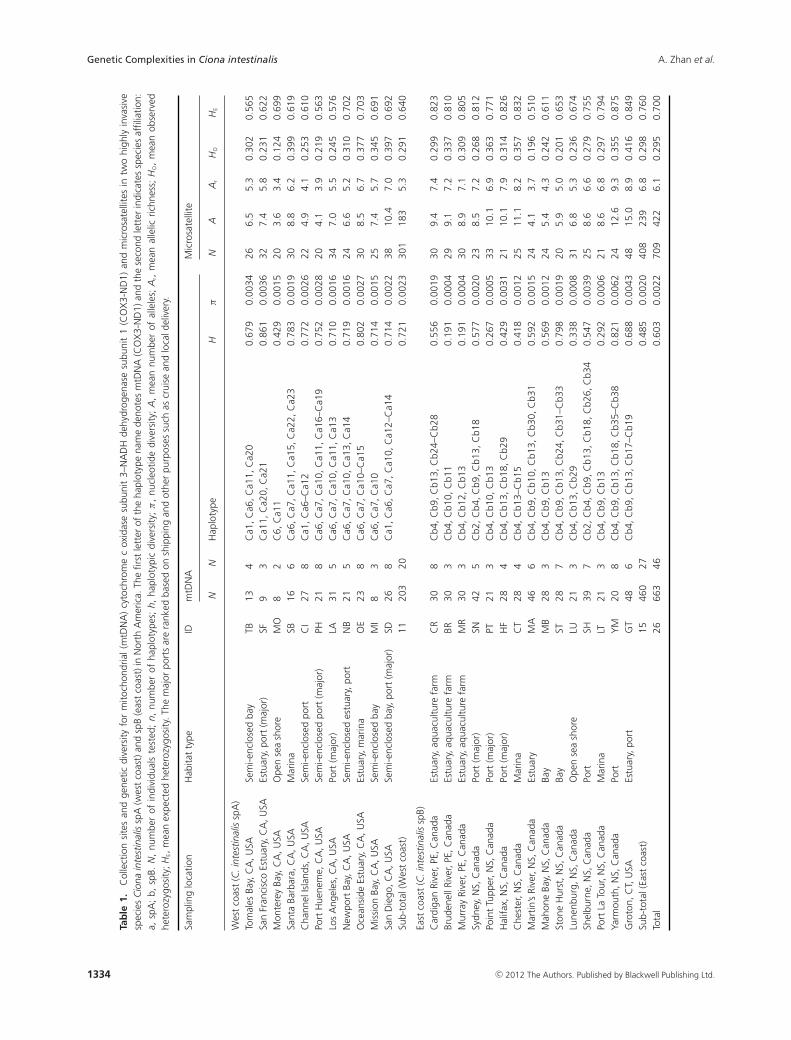
Table 1), including 11 from the west coast (N = 380) and15 (N = 493; including populations BR, MR, PT, CT, LT, andGT from Zhan et al. 2010) from the east coast. All specimenswere preserved in 95% ethanol prior to genetic analyses.
Owing to the lack of reliable diagnostic morpho-logical characters among species in C. intestinalis complex,all collected specimens were identified to species level us-ing one mtDNA fragment, cytochrome c oxidase subunit
c© 2012 The Authors. Published by Blackwell Publishing Ltd. 1333
Genetic Complexities in Ciona intestinalis A. Zhan et al.
Tab
le1.
Col
lect
ion
site
san
dge
netic
dive
rsity
for
mito
chon
dria
l(m
tDN
A)
cyto
chro
me
cox
idas
esu
buni
t3–
NA
DH
dehy
drog
enas
esu
buni
t1
(CO
X3-
ND
1)an
dm
icro
sate
llite
sin
two
high
lyin
vasi
vesp
ecie
sC
iona
inte
stin
alis
spA
(wes
tco
ast)
and
spB
(eas
tco
ast)
inN
orth
Am
eric
a.Th
efir
stle
tter
ofth
eha
plot
ype
nam
ede
note
sm
tDN
A(C
OX
3-N
D1)
and
the
seco
ndle
tter
indi
cate
ssp
ecie
saf
filia
tion:
a,sp
A;
b,sp
B.N
,nu
mbe
rof
indi
vidu
als
test
ed;
n,nu
mbe
rof
hapl
otyp
es;
h,ha
plot
ypic
dive
rsity
;π
,nu
cleo
tide
dive
rsity
;A
,m
ean
num
ber
ofal
lele
s;A
r,m
ean
alle
licric
hnes
s;H
O,
mea
nob
serv
edhe
tero
zygo
sity
;HE,m
ean
expe
cted
hete
rozy
gosi
ty.T
hem
ajor
port
sar
era
nked
base
don
ship
ping
and
othe
rpu
rpos
essu
chas
crui
sean
dlo
cald
eliv
ery.
Sam
plin
glo
catio
nH
abita
tty
peID
mtD
NA
Mic
rosa
telli
te
NN
Hap
loty
peH
πN
AA
rH
OH
E
Wes
tco
ast
(C.i
ntes
tinal
issp
A)
Tom
ales
Bay,
CA
,USA
Sem
i-enc
lose
dba
yTB
134
Ca1
,Ca6
,Ca1
1,C
a20
0.67
90.
0034
266.
55.
30.
302
0.56
5Sa
nFr
anci
sco
Estu
ary,
CA
,USA
Estu
ary,
port
(maj
or)
SF9
3C
a11,
Ca2
0,C
a21
0.86
10.
0036
327.
45.
80.
231
0.62
2M
onte
rey
Bay,
CA
,USA
Ope
nse
ash
ore
MO
82
C6,
Ca1
10.
429
0.00
1520
3.6
3.4
0.12
40.
699
Sant
aBa
rbar
a,C
A,U
SAM
arin
aSB
166
Ca6
,Ca7
,Ca1
1,C
a15,
Ca2
2,C
a23
0.78
30.
0019
308.
86.
20.
399
0.61
9C
hann
elIs
land
s,C
A,U
SASe
mi-e
nclo
sed
port
CI
278
Ca1
,Ca6
–Ca1
20.
772
0.00
2622
4.9
4.1
0.25
30.
610
Port
Hue
nem
e,C
A,U
SASe
mi-e
nclo
sed
port
(maj
or)
PH21
8C
a6,C
a7,C
a10,
Ca1
1,C
a16–
Ca1
90.
752
0.00
2820
4.1
3.9
0.21
90.
563
Los
Ang
eles
,CA
,USA
Port
(maj
or)
LA31
5C
a6,C
a7,C
a10,
Ca1
1,C
a13
0.71
00.
0016
347.
05.
50.
245
0.57
6N
ewpo
rtBa
y,C
A,U
SASe
mi-e
nclo
sed
estu
ary,
port
NB
215
Ca6
,Ca7
,Ca1
0,C
a13,
Ca1
40.
719
0.00
1624
6.6
5.2
0.31
00.
702
Oce
ansi
deEs
tuar
y,C
A,U
SAEs
tuar
y,m
arin
aO
E23
8C
a6,C
a7,C
a10–
Ca1
50.
802
0.00
2730
8.5
6.7
0.37
70.
703
Mis
sion
Bay,
CA
,USA
Sem
i-enc
lose
dba
yM
I8
3C
a6,C
a7,C
a10
0.71
40.
0015
257.
45.
70.
345
0.69
1Sa
nD
iego
,CA
,USA
Sem
i-enc
lose
dba
y,po
rt(m
ajor
)SD
268
Ca1
,Ca6
,Ca7
,Ca1
0,C
a12–
Ca1
40.
714
0.00
2238
10.4
7.0
0.39
70.
692
Sub-
tota
l(W
est
coas
t)11
203
200.
721
0.00
2330
118
35.
30.
291
0.64
0
East
coas
t(C
.int
estin
alis
spB)
Car
diga
nRi
ver,
PE,C
anad
aEs
tuar
y,aq
uacu
lture
farm
CR
308
Cb4
,Cb9
,Cb1
3,C
b24–
Cb2
80.
556
0.00
1930
9.4
7.4
0.29
90.
823
Brud
enel
lRiv
er,P
E,C
anad
aEs
tuar
y,aq
uacu
lture
farm
BR30
3C
b4,C
b10,
Cb1
10.
191
0.00
0429
9.1
7.2
0.33
70.
810
Mur
ray
Rive
r,PE
,Can
ada
Estu
ary,
aqua
cultu
refa
rmM
R30
3C
b4,C
b12,
Cb1
30.
191
0.00
0430
8.9
7.1
0.30
90.
805
Sydn
ey,N
S,C
anad
aPo
rt(m
ajor
)SN
425
Cb2
,Cb4
,Cb9
,Cb1
3,C
b18
0.57
70.
0020
238.
57.
20.
268
0.81
2Po
int
Tupp
er,N
S,C
anad
aPo
rt(m
ajor
)PT
213
Cb4
,Cb1
0,C
b13
0.26
70.
0005
3310
.16.
90.
363
0.77
1H
alifa
x,N
S,C
anad
aPo
rt(m
ajor
)H
F28
4C
b4,C
b13,
Cb1
8,C
b29
0.42
90.
0031
2110
.17.
90.
314
0.82
6C
hest
er,N
S,C
anad
aM
arin
aC
T28
4C
b4,C
b13–
Cb1
50.
418
0.00
1225
11.1
8.2
0.35
70.
832
Mar
tin’s
Rive
r,N
S,C
anad
aEs
tuar
yM
A46
6C
b4,C
b9,C
b10,
Cb1
3,C
b30,
Cb3
10.
592
0.00
1524
4.1
3.7
0.19
60.
510
Mah
one
Bay,
NS,
Can
ada
Bay
MB
283
Cb4
,Cb9
,Cb1
30.
569
0.00
1224
5.4
4.3
0.24
20.
611
Ston
eH
urst
,NS,
Can
ada
Bay
ST28
7C
b4,C
b9,C
b13,
Cb2
4,C
b31–
Cb3
30.
798
0.00
1920
5.9
5.0
0.20
10.
653
Lune
nbur
g,N
S,C
anad
aO
pen
sea
shor
eLU
213
Cb4
,Cb1
3,C
b29
0.33
80.
0008
316.
85.
30.
236
0.67
4Sh
elbu
rne,
NS,
Can
ada
Port
SH39
7C
b2,C
b4,C
b9,C
b13,
Cb1
8,C
b26,
Cb3
40.
547
0.00
3925
8.6
6.6
0.27
90.
755
Port
LaTo
ur,N
S,C
anad
aM
arin
aLT
213
Cb4
,Cb9
,Cb1
30.
292
0.00
0621
8.6
6.8
0.29
70.
794
Yarm
outh
,NS,
Can
ada
Port
YM
208
Cb4
,Cb9
,Cb1
3,C
b18,
Cb3
5–C
b38
0.82
10.
0062
2412
.69.
30.
355
0.87
5G
roto
n,C
T,U
SAEs
tuar
y,po
rtG
T48
6C
b4,C
b9,C
b13,
Cb1
7–C
b19
0.68
80.
0043
4815
.08.
90.
416
0.84
9Su
b-to
tal(
East
coas
t)15
460
270.
485
0.00
2040
823
96.
80.
298
0.76
0To
tal
2666
346
0.60
30.
0022
709
422
6.1
0.29
50.
700
1334 c© 2012 The Authors. Published by Blackwell Publishing Ltd.
A. Zhan et al. Genetic Complexities in Ciona intestinalis
3–NADH dehydrogenase subunit 1 (COX3-ND1; Zhan et al.2010).
mtDNA amplification and sequencing
Total genomic DNA was extracted from approximately 50 mgof tissue according to the proteinase K method (Waters et al.2000). The mitochondrial COX3-ND1 fragment was ampli-fied using the primers TX3F and TN1R (Iannelli et al. 2007).PCR amplification was performed according to the proto-col described by Iannelli et al. (2007). Sequencing reactionswere performed using the forward primer (TX3F), BigDyeTerminator v3.1 sequencing chemistry, and an ABI 3130XLautomated sequencer (PE Applied Biosystems, Foster City,CA). Sequences that contained ambiguous nucleotides weresubsequently sequenced using the reverse primer (TN1R).
mtDNA analysis
Mitochondrial sequences were aligned and edited us-ing CodonCode Aligner v2.0.6 (CodonCode Corporation,Dedham, MA). Bayesian inference (BI) and neighbor-joining (NJ) phylogenetic analyses were conducted usingC. savignyi as outgroup (Nydam and Harrison 2007; Zhanet al. 2010). The best DNA substitution model for mtDNAhaplotypes was determined using MODELTEST v3.7 (Posadaand Crandall 1998) with Akaike Information Criterion. TheBI analysis was conducted using MRBAYES v3.2 (Ronquistand Huelsenbeck 2003). Trees were sampled every 100 gen-erations for two million generations, and the first 25% ofall the trees sampled were discarded as burn-in. NJ phylo-genetic analyses were performed using MEGA v4.0 (Tamuraet al. 2007) based on nucleotide distances corrected using theTamura–Nei model (Tamura and Nei 1993). Clade supportwas estimated using bootstrap analysis with 1000 replicates.Relationships between mtDNA haplotypes were further ex-amined using a statistical parsimony haplotype network gen-erated at the 95% connection limit with TCS v1.21 (Clementet al. 2000).
The number of haplotypes (n), haplotype diversity (h),and nucleotide diversity (π) were assessed using DNASP v5(Rozas et al. 2003). Population pairwise �ST was calculatedusing the Tamura and Nei (TrN) substitution model and10,000 permutations in ARLEQUIN v3.1 (Excoffier et al.2005), with levels of significance adjusted using sequentialBonferroni corrections (Rice 1989). To assess hierarchicalpopulation genetic structure, we conducted a hierarchicalanalysis of molecular variance (AMOVA; Excoffier et al. 1992)based on 10,000 random permutations using ARLEQUIN.AMOVA was performed separately for both coasts (i.e., twospecies, spA on the west coast and spB on the east coast,see Results section). Populations were grouped according todifferent geographical regions on both coasts, two groupson the west coast: northern California (TB, SF, MO) and
southern California (SB, CI, PH, LA, NB, OE, MI, SD;Table 1, Fig. 2); three groups on the east coast: Prince EdwardIsland (CR, BR, MR), Nova Scotia (SN, PT, HF, CT, MA,MB, ST, LU, SH, LT, YM), and Connecticut (GT; Table 1;Fig. 2). Molecular variance was partitioned into three lev-els: between regions, among populations within regions, andwithin populations. To test the correlation between geneticdistance [�ST/(1–�ST)] and geographic distance, we per-formed isolation by distance (IBD) analysis for spA and spBusing a Mantel test with 10,000 permutations implemented inGENEPOP v3.4 (Raymond and Rousset 1995). Geographicaldistances were calculated as the minimum coastline distancesbetween sampling locations using Google Earth.
Microsatellite DNA genotyping and analysis
All individuals were genotyped for eight polymorphicmicrosatellite markers (Zhan et al. 2010). PCR amplifica-tion and genotyping were performed according to the pro-tocol described by Zhan et al. (2010). Microsatellite geneticdiversity was evaluated by the number of alleles (A), allelicfrequency (F), allelic richness (Ar), as well as the observedheterozygosity (HO) and expected heterozygosity (HE) usingFSTAT v2.9.3.2 (Goudet 2001). Additionally, a nonparametrictest (Mann–Whitney U test), implemented in STATISTICAv6 (StatSoft, Inc., Tulsa, OK), was used to test the difference inallelic richness (Ar) and expected heterozygosity (HE) amongpopulations. Markov chain method (Guo and Thompson1992) was employed to estimate the probability of signifi-cant deviation from Hardy–Weinberg equilibrium (HWE)using GENEPOP. Significance criteria were adjusted for thenumber of simultaneous tests using sequential Bonferronicorrections.
Population differentiation was determined by FST (Weirand Cockerham 1984) for all population pairs using FSTAT.A total of 10,000 permutations were performed, and signif-icance levels were adjusted using sequential Bonferroni cor-rections. In addition, population structure was determinedby conducting a three-dimensional factorial correspondenceanalysis (3D-FCA) in GENETIX v4.05 (Belkhir et al. 2004)and a Bayesian, Markov Chain Monte Carlo (MCMC) basedapproach implemented in STRUCTURE v2.1 (Pritchard et al.2000). For the STRUCTURE analysis, we assessed likelihoodsfor models with the number of clusters ranging from K = 1 tothe total number of sampling sites (11 for spA and 15 for spB).Ten independent runs were performed for each specified K-value, and for each run, 1,000,000 generations were used afterdiscarding 100,000 generations as burn-in. The measure of�K (Evanno et al. 2005) was used to infer the number ofbiologically relevant clusters. To test for a pattern of IBD, weused a Mantel procedure with 10,000 permutations imple-mented in GENEPOP to assess the dependence between thegenetic distances [FST/(1–FST)] and geographic distances in
c© 2012 The Authors. Published by Blackwell Publishing Ltd. 1335
Genetic Complexities in Ciona intestinalis A. Zhan et al.
each species. A hierarchical AMOVA was performed in AR-LEQUIN based on microsatellite genetic distances betweenpopulations, and partitioning variance as for mtDNA.
Results
mtDNA analyses
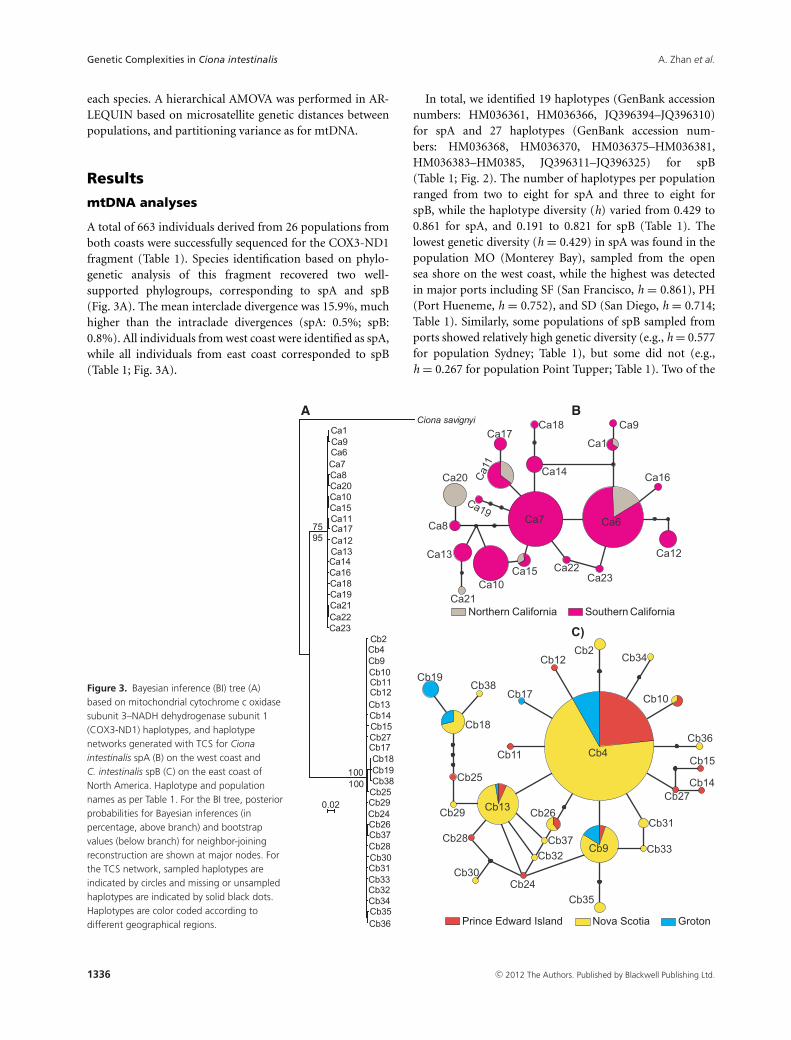
A total of 663 individuals derived from 26 populations fromboth coasts were successfully sequenced for the COX3-ND1fragment (Table 1). Species identification based on phylo-genetic analysis of this fragment recovered two well-supported phylogroups, corresponding to spA and spB(Fig. 3A). The mean interclade divergence was 15.9%, muchhigher than the intraclade divergences (spA: 0.5%; spB:0.8%). All individuals from west coast were identified as spA,while all individuals from east coast corresponded to spB(Table 1; Fig. 3A).
In total, we identified 19 haplotypes (GenBank accessionnumbers: HM036361, HM036366, JQ396394–JQ396310)for spA and 27 haplotypes (GenBank accession num-bers: HM036368, HM036370, HM036375–HM036381,HM036383–HM0385, JQ396311–JQ396325) for spB(Table 1; Fig. 2). The number of haplotypes per populationranged from two to eight for spA and three to eight forspB, while the haplotype diversity (h) varied from 0.429 to0.861 for spA, and 0.191 to 0.821 for spB (Table 1). Thelowest genetic diversity (h = 0.429) in spA was found in thepopulation MO (Monterey Bay), sampled from the opensea shore on the west coast, while the highest was detectedin major ports including SF (San Francisco, h = 0.861), PH(Port Hueneme, h = 0.752), and SD (San Diego, h = 0.714;Table 1). Similarly, some populations of spB sampled fromports showed relatively high genetic diversity (e.g., h = 0.577for population Sydney; Table 1), but some did not (e.g.,h = 0.267 for population Point Tupper; Table 1). Two of the
Figure 3. Bayesian inference (BI) tree (A)based on mitochondrial cytochrome c oxidasesubunit 3–NADH dehydrogenase subunit 1(COX3-ND1) haplotypes, and haplotypenetworks generated with TCS for Cionaintestinalis spA (B) on the west coast andC. intestinalis spB (C) on the east coast ofNorth America. Haplotype and populationnames as per Table 1. For the BI tree, posteriorprobabilities for Bayesian inferences (inpercentage, above branch) and bootstrapvalues (below branch) for neighbor-joiningreconstruction are shown at major nodes. Forthe TCS network, sampled haplotypes areindicated by circles and missing or unsampledhaplotypes are indicated by solid black dots.Haplotypes are color coded according todifferent geographical regions.
1336 c© 2012 The Authors. Published by Blackwell Publishing Ltd.
A. Zhan et al. Genetic Complexities in Ciona intestinalis
most recently established populations, BR (Brudenell River;reported in 2005, C. D. Mills, personal communication) andMR (Murray River; detected in 2006, C. D. Mills, personalcommunication), sampled from aquaculture facilities inPrince Edward Island, exhibited the lowest haplotypediversity (h = 0.191; Table 1). By contrast, one recentlyestablished neighboring population CR (Cardigan River;reported in 2006, C. D. Mills, personal communication)showed a similar level of genetic diversity (h = 0.556) to thatin other populations (Table 1).
The shallow phylogeny within each species was confirmedby TCS haplotype networks. Haplotypes were connected toeach other by only several mutation steps (Fig. 3B and C). Thenetwork for spB showed a star-shaped pattern with one dom-inant haplotype at the center (Fig. 3C), whereas we detectedtwo dominant haplotypes at the center for spA (Fig. 3B). De-spite the shallow phylogeny and close relationships amonghaplotypes, we detected geographic structure for spA alongthe west coast. Generally, populations located at two sides ofPoint Conception belonged to two geographic groups, thatis, southern and northern California (Fig. 2). The haplo-type composition and haplotype frequencies were differentin these two geographic groups (Table 1; Fig. 2). For example,the most dominant haplotype in southern California, Ca7,was not detected in any locations in northern California. Sim-ilarly, haplotypes with relatively high frequencies in north-ern California, such as Ca20, were not observed in southernCalifornia (Fig. 2). The difference between two groups wasfurther confirmed by both pairwise�ST values (Table 2A) andAMOVA (Table 3). Comparisons between populations sam-pled from northern and southern California revealed highand significant �ST values in more than half of the popu-lation pairs (14 out of 27; Table 2A), while low and non-significant values were detected for population pairs withineach region (Table 2A). AMOVA attributed a statistically sig-nificant proportion of genetic variance (14.53%, P < 0.005)to the among-group component (i.e., between two groups,Table 3).
By contrast, we did not observe significant geographicstructure at the mtDNA locus for spB along the eastcoast. Generally, all populations shared the same dom-inant haplotype, Cb4 (Table 1; Fig. 2). Statistical anal-ysis of pairwise �ST values revealed that only eight of120 pairs were significantly different after sequential Bon-ferroni correction (Table 2B). AMOVA attributed only asmall proportion of genetic variance (3.42%) to the among-group component, although it was statistically significant(Table 3).
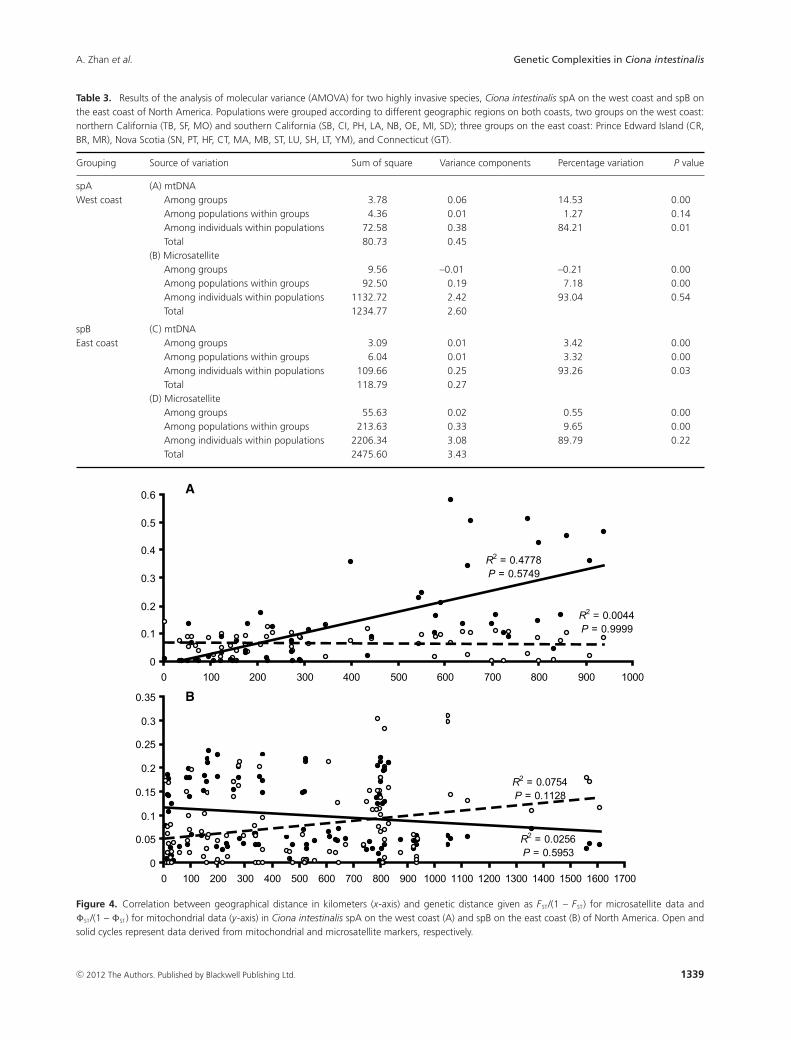
Mantel tests based on the COX3-ND1 fragment revealedno correlation between genetic and geographical distances foreither species on both coasts (Fig. 4), suggesting no patternof IBD.
Microsatellite DNA analyses
A total of 709 individuals from 26 populations, including 301individuals from 11 populations for spA and 408 individu-als from 15 populations for spB, were successfully genotypedat eight microsatellite loci. In total, we identified 183 and239 alleles for spA and spB, respectively. Allelic richness (Ar)ranged from 3.4 to 7.0 (mean 5.3) for spA and from 3.7 to 9.3(mean 6.8) for spB (Table 1). Generally, high expected hetero-zygosity (HE) values were observed for all populations, rang-ing from 0.563 to 0.703 for spA and from 0.510 to 0.875for spB (Table 1; Table S1). For spA, the population MO(Monterey Bay) had the lowest genetic diversity, all consis-tent with mtDNA results (Table 1). Allelic richness in thispopulation was significantly lower than three populations(LA, OE, SD) (Mann–Whitney U test, P < 0.013; Table S2).We did not detect statistical difference in expected hetero-zygosity between any population pairs (P > 0.05; Table S2).Similarly to mtDNA, populations sampled from major portsshowed relatively high genetic diversity (Table 1).
Interestingly, nuclear and mtDNA markers often providedinconsistent results. For example, for spA population PH(Port Hueneme) had the highest number of mtDNA haplo-types (n = 8; Table 1) but a relatively low number of allelesat microsatellite loci (mean A = 4.1; Table 1). For spB, thelowest microsatellite genetic variation was identified in fourpopulations including MA (Martin’s River), MB (MahoneBay), ST (Stone Hurst), and LU (Lunenburg), which weresampled from southeastern Nova Scotia (Tables 1 and S1).Both allelic richness and expected heterozygosity were signifi-cantly lower than those in other populations (Mann–WhitneyU test; Table S2). However, two of these four populations, MAand ST, exhibited high mitochondrial diversity (Table 1).Compared to the other populations, the populations sam-pled from major ports such as HF (Halifax) did not showhigher genetic diversity, and recently established populationsin Prince Edward Island did not exhibit significantly lowergenetic diversity (Table 1). Deviations from HWE were ob-served at multiple loci and sampling locations for both species(Table S1). All of the deviant cases showed significant het-erozygote deficiency (P < 0.001; Table S1). As suggested byZhan et al. (2010), recurrent inbreeding and Wahlund effectsmay be responsible for these deviations.
Overall, we detected a relatively high level of genetic dif-ferentiation in both species when analyzing microsatellitedata. For spA, pairwise FST values ranged from zero to 0.123with an average of 0.059. In total, 36 of 55 (65.5%) popu-lation pairs were significantly different after Bonferroni cor-rection (Table 2A). Interestingly, the highest genetic differen-tiation (FST = 0.123) was detected between two neighboringpopulations, CI (Channel Islands) and PH (Port Hueneme;Fig. 2; Table 2A). For spB, pairwise FST values varied from0.005 to 0.191, with an average of 0.088. In total, 75 of 105
c© 2012 The Authors. Published by Blackwell Publishing Ltd. 1337
Genetic Complexities in Ciona intestinalis A. Zhan et al.
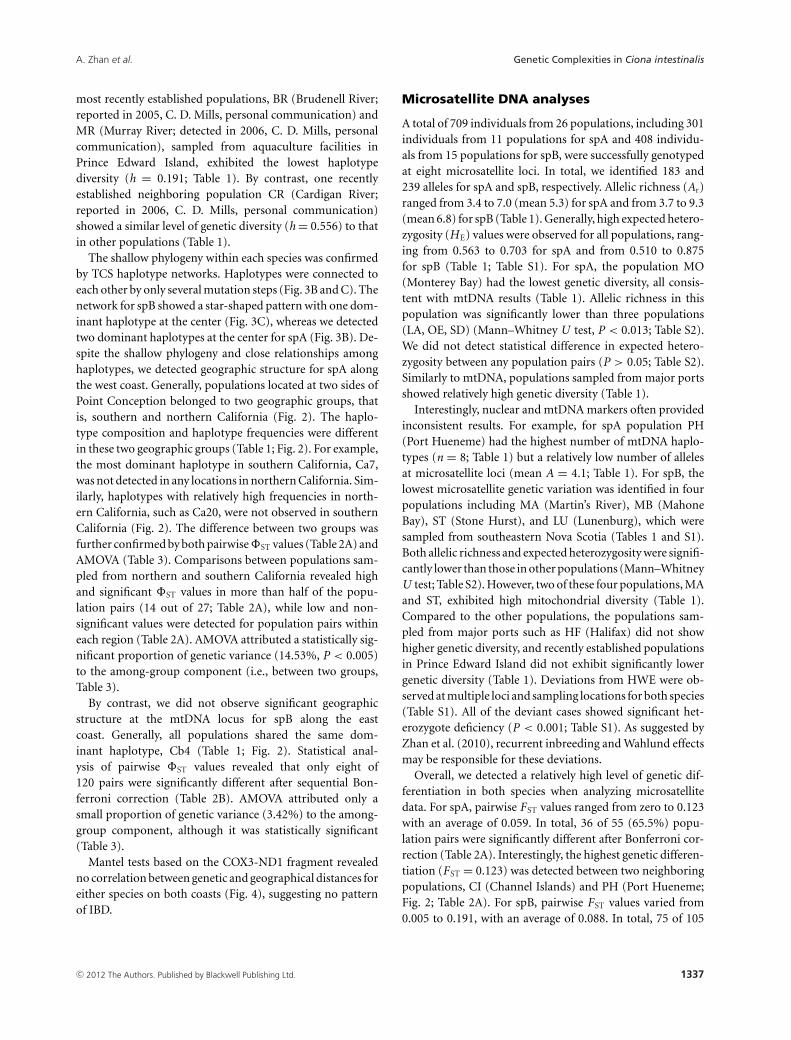
Table 2. Estimates of population genetic differentiation in two highly invasive vase tunicates: Ciona intestinalis spA on the west coast (A) and spB onthe east coast (B) of North America. Above diagonal: pairwise FST based on cytochrome c oxidase subunit 3–NADH dehydrogenase subunit 1 region(COX3-ND1); Below diagonal: pairwise FST based on microsatellite markers. Bold numbers indicate statistical significance after sequential Bonferronicorrections. Negative values were converted into zero.
(A) TB SF MO SB CI PH LA NB OE MI SD
TB **** 0.000 0.111 0.367 0.255 0.336 0.339 0.299 0.311 0.265 0.318SF 0.022 **** 0.027 0.185 0.094 0.174 0.119 0.092 0.129 0.043 0.144MO 0.092 0.085 **** 0.264 0.019 0.081 0.198 0.142 0.120 0.143 0.081SB 0.063 0.060 0.069 **** 0.120 0.061 0.120 0.147 0.069 0.100 0.114CI 0.022 0.013 0.105 0.049 **** 0.008 0.032 0.000 0.000 0.000 0.000PH 0.095 0.087 0.074 0.079 0.123 **** 0.082 0.068 0.011 0.033 0.007LA 0.024 0.000 0.087 0.033 0.048 0.089 **** 0.000 0.018 0.000 0.036NB 0.000 0.003 0.082 0.057 0.036 0.080 0.000 **** 0.005 0.000 0.006OE 0.092 0.078 0.097 0.050 0.111 0.079 0.077 0.051 **** 0.000 0.000MI 0.021 0.007 0.098 0.059 0.035 0.095 0.011 0.013 0.081 **** 0.000SD 0.077 0.069 0.097 0.015 0.078 0.082 0.056 0.053 0.037 0.068 ****
(B) CR BR MR SN PT HF CT MA MB ST LU SH LT YM GT
CR **** 0.058 0.041 0.000 0.003 0.035 0.000 0.000 0.010 0.062 0.000 0.012 0.000 0.125 0.104BR 0.019 **** 0.023 0.073 0.006 0.115 0.071 0.092 0.153 0.233 0.102 0.056 0.033 0.236 0.153MR 0.005 0.015 **** 0.054 0.006 0.100 0.046 0.076 0.136 0.220 0.065 0.048 0.006 0.229 0.147SN 0.057 0.059 0.057 **** 0.013 0.024 0.007 0.000 0.005 0.056 0.000 0.019 0.000 0.131 0.099PT 0.044 0.030 0.038 0.033 **** 0.054 0.000 0.026 0.088 0.168 0.000 0.023 0.000 0.176 0.116HF 0.034 0.026 0.029 0.051 0.039 **** 0.043 0.065 0.090 0.130 0.021 0.000 0.054 0.054 0.020CT 0.030 0.018 0.035 0.066 0.035 0.037 **** 0.021 0.071 0.144 0.000 0.030 0.000 0.175 0.120MA 0.162 0.175 0.174 0.176 0.148 0.152 0.125 **** 0.000 0.039 0.010 0.049 0.007 0.169 0.132MB 0.168 0.182 0.174 0.180 0.186 0.166 0.156 0.009 **** 0.000 0.075 0.056 0.045 0.139 0.120ST 0.147 0.169 0.163 0.129 0.154 0.152 0.124 0.150 0.097 **** 0.148 0.094 0.129 0.123 0.131LU 0.111 0.125 0.115 0.130 0.129 0.123 0.111 0.016 0.031 0.074 **** 0.014 0.000 0.145 0.100SH 0.054 0.043 0.047 0.047 0.009 0.027 0.030 0.174 0.191 0.155 0.131 **** 0.022 0.062 0.037LT 0.047 0.030 0.036 0.068 0.036 0.039 0.033 0.154 0.185 0.179 0.146 0.032 **** 0.164 0.112YM 0.048 0.037 0.054 0.042 0.062 0.035 0.048 0.153 0.168 0.147 0.134 0.054 0.055 **** 0.023GT 0.036 0.030 0.039 0.067 0.053 0.046 0.005 0.124 0.152 0.111 0.120 0.048 0.043 0.053 ****
(71.4%) comparisons of population pairs remained signifi-cantly different after Bonferroni correction (Table 2B). Thehighest FST values were detected for comparisons betweenfour populations (MA, MB, ST, LU) and all other sites sur-veyed, with an average of pairwise FST values greater than 0.1(Table 2B).
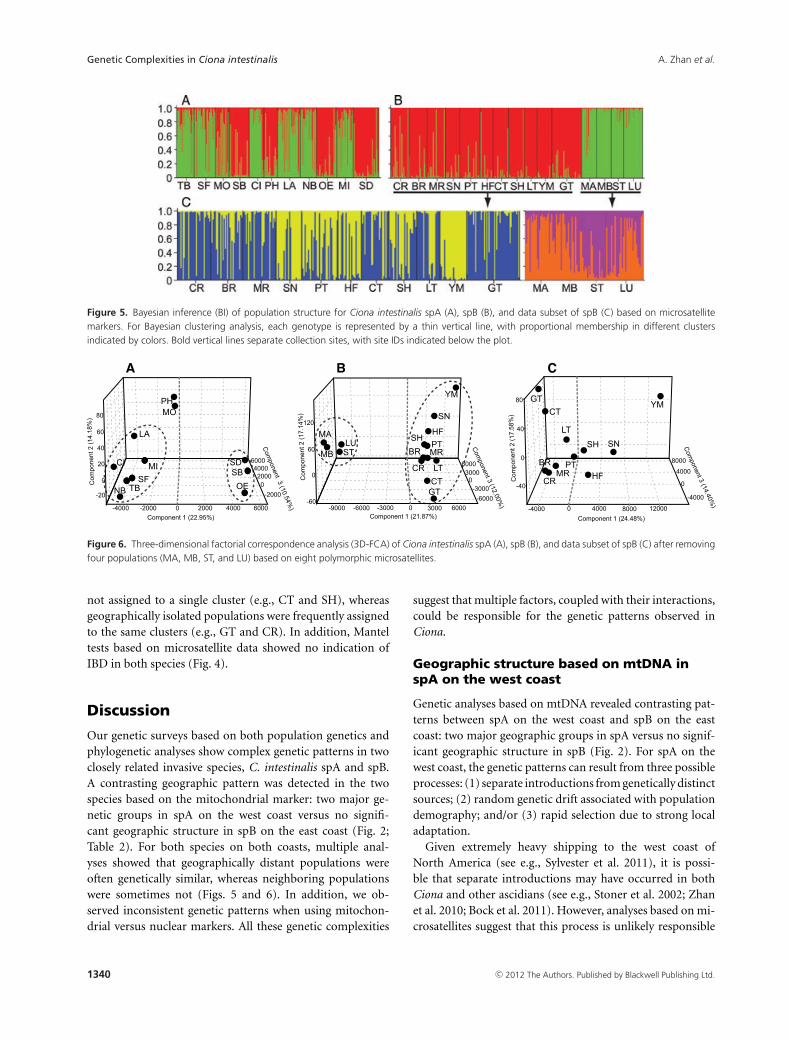
The two different approaches used to infer populationstructure, 3D-FCA and Bayesian clustering, provided largelyconsistent results in both species. For spA on the westcoast, both analyses grouped populations into two clustersbased on geographic regions (i.e., northern and southernCalifornia), which is inconsistent with mtDNA results ob-tained from pairwise �ST (Table 2A) and AMOVA (Table 3).Bayesian clustering analysis suggests a two-cluster model(K = 2) as the most parsimonious possibility (Fig. 5A).Most individuals from five populations (TB, SF, CI, LA, MI)were assigned into one cluster regardless of geographic ori-gin, whereas most individuals from three populations (SD,SB, OE) collected from southern California were assigned tothe other cluster (Fig. 5A). However, individuals from the
remaining two populations, PH (Port Hueneme) and MO(Monterey Bay), do not appear to assign consistently to asingle cluster (Fig. 5A). This pattern was confirmed by 3D-FCA. Component 1, explaining 22.95% of genetic variance,separated the five (TB, SF, CI, LA, MI) from the three popula-tions (SD, SB, OE), with the remaining two (PH, MO) in themiddle (Fig. 6A). For spB on the east coast, the two analysesconsistently supported a two-cluster model and clearly sepa-rated four populations (MA, MB, ST, LU; Figs. 5B and 6B), allconsistent with microsatellite diversity results (Table 1) andpairwise FST values (Table 2B). Since low genetic diversityin these four populations can inflate genetic differentiation,3D-FCA and Bayesian clustering were rerun after removingthese four populations. Bayesian clustering analysis still sup-ported a two-cluster model, showing a high level of admixtureand mixture of individuals from different geographical ori-gins (Fig. 5C). This finding is consistent with the 3D-FCAresults, showing no obvious population cluster (Fig. 6C).Similar to spA, the two clusters showed discontinuous distri-butions along the east coast. Neighboring populations were
1338 c© 2012 The Authors. Published by Blackwell Publishing Ltd.
A. Zhan et al. Genetic Complexities in Ciona intestinalis
Table 3. Results of the analysis of molecular variance (AMOVA) for two highly invasive species, Ciona intestinalis spA on the west coast and spB onthe east coast of North America. Populations were grouped according to different geographic regions on both coasts, two groups on the west coast:northern California (TB, SF, MO) and southern California (SB, CI, PH, LA, NB, OE, MI, SD); three groups on the east coast: Prince Edward Island (CR,BR, MR), Nova Scotia (SN, PT, HF, CT, MA, MB, ST, LU, SH, LT, YM), and Connecticut (GT).
Grouping Source of variation Sum of square Variance components Percentage variation P value
spA (A) mtDNAWest coast Among groups 3.78 0.06 14.53 0.00
Among populations within groups 4.36 0.01 1.27 0.14Among individuals within populations 72.58 0.38 84.21 0.01Total 80.73 0.45
(B) MicrosatelliteAmong groups 9.56 –0.01 –0.21 0.00Among populations within groups 92.50 0.19 7.18 0.00Among individuals within populations 1132.72 2.42 93.04 0.54Total 1234.77 2.60
spB (C) mtDNAEast coast Among groups 3.09 0.01 3.42 0.00
Among populations within groups 6.04 0.01 3.32 0.00Among individuals within populations 109.66 0.25 93.26 0.03Total 118.79 0.27
(D) MicrosatelliteAmong groups 55.63 0.02 0.55 0.00Among populations within groups 213.63 0.33 9.65 0.00Among individuals within populations 2206.34 3.08 89.79 0.22Total 2475.60 3.43
Figure 4. Correlation between geographical distance in kilometers (x-axis) and genetic distance given as FST/(1 – FST) for microsatellite data and�ST/(1 – �ST) for mitochondrial data (y-axis) in Ciona intestinalis spA on the west coast (A) and spB on the east coast (B) of North America. Open andsolid cycles represent data derived from mitochondrial and microsatellite markers, respectively.
c© 2012 The Authors. Published by Blackwell Publishing Ltd. 1339
Genetic Complexities in Ciona intestinalis A. Zhan et al.
Figure 5. Bayesian inference (BI) of population structure for Ciona intestinalis spA (A), spB (B), and data subset of spB (C) based on microsatellitemarkers. For Bayesian clustering analysis, each genotype is represented by a thin vertical line, with proportional membership in different clustersindicated by colors. Bold vertical lines separate collection sites, with site IDs indicated below the plot.
Figure 6. Three-dimensional factorial correspondence analysis (3D-FCA) of Ciona intestinalis spA (A), spB (B), and data subset of spB (C) after removingfour populations (MA, MB, ST, and LU) based on eight polymorphic microsatellites.
not assigned to a single cluster (e.g., CT and SH), whereasgeographically isolated populations were frequently assignedto the same clusters (e.g., GT and CR). In addition, Manteltests based on microsatellite data showed no indication ofIBD in both species (Fig. 4).
Discussion
Our genetic surveys based on both population genetics andphylogenetic analyses show complex genetic patterns in twoclosely related invasive species, C. intestinalis spA and spB.A contrasting geographic pattern was detected in the twospecies based on the mitochondrial marker: two major ge-netic groups in spA on the west coast versus no signifi-cant geographic structure in spB on the east coast (Fig. 2;Table 2). For both species on both coasts, multiple anal-yses showed that geographically distant populations wereoften genetically similar, whereas neighboring populationswere sometimes not (Figs. 5 and 6). In addition, we ob-served inconsistent genetic patterns when using mitochon-drial versus nuclear markers. All these genetic complexities
suggest that multiple factors, coupled with their interactions,could be responsible for the genetic patterns observed inCiona.
Geographic structure based on mtDNA inspA on the west coast
Genetic analyses based on mtDNA revealed contrasting pat-terns between spA on the west coast and spB on the eastcoast: two major geographic groups in spA versus no signif-icant geographic structure in spB (Fig. 2). For spA on thewest coast, the genetic patterns can result from three possibleprocesses: (1) separate introductions from genetically distinctsources; (2) random genetic drift associated with populationdemography; and/or (3) rapid selection due to strong localadaptation.
Given extremely heavy shipping to the west coast ofNorth America (see e.g., Sylvester et al. 2011), it is possi-ble that separate introductions may have occurred in bothCiona and other ascidians (see e.g., Stoner et al. 2002; Zhanet al. 2010; Bock et al. 2011). However, analyses based on mi-crosatellites suggest that this process is unlikely responsible
1340 c© 2012 The Authors. Published by Blackwell Publishing Ltd.
A. Zhan et al. Genetic Complexities in Ciona intestinalis
for defining the two geographic groups. Two tests, including3D-FCA and Bayesian clustering, did not separate north-ern from southern populations (Figs. 5A and 6A). In addi-tion, microsatellite analyses such as pairwise FST values sug-gest a high level of gene flow between several northern andsouthern populations. For example, there is no detectablemicrosatellite-based genetic differentiation between popula-tions TB (Tomales Bay) and NB (Newport Bay), located intwo different geographic groups as defined by mtDNA (Fig. 2;Table 2). Additional evidence for supporting this argumentcomes from little genetic structure based on global samplingand population genetics and phylogeographic analyses us-ing both nuclear and mtDNA markers (Zhan et al. 2010).Altogether, available evidence suggests that separate intro-ductions are unlikely responsible for such a genetic patternin spA on the west coast.
Genetic drift can create complex genetic patterns by ran-domly changing allele frequencies and/or eliminating low-frequency alleles, especially when effective population sizes(N e) decrease. Moreover, compared to nuclear markers,mtDNA has smaller effective population size (N emtDNA ≈ 1/4N enuclear), likely leading to stronger signatures of genetic drifton mtDNA. For broadcast spawning marine invasive speciesincluding Ciona, two possible processes—sweepstakes re-productive success and dramatic demographic changes dur-ing translocation—can lead to strong genetic differentiationbetween populations. Marine species with broadcast spawn-ing exhibit sweepstakes reproductive success, in which a sub-set of the population contributes the majority of offspringto subsequent generations (Hedgecock et al. 2007). This cansharply decrease effective population size, resulting in spatialand/or temporary genetic structuring (see e.g., Li and Hedge-cock 1998, Hedgecock et al. 2007; Christie et al. 2010). Theexistence of population-specific haplotypes/alleles (Fig. 2;Table S1) suggests that sweepstakes reproductive successmight occur in Ciona. In addition, population bottlenecksmay have occurred during the translocation and settlementon the west coast. Random genetic drift due to severe bottle-necks, especially for mtDNA that is more sensitive to effectivepopulation size changes, may have created divergent geneticgroups at initial stages of invasions when limited numbersof propagules were transplanted, and then these divergentgenetic groups were transported to other locations via sec-ondary spread.
However, genetic drift alone seems inadequate to explainthe genetic pattern on the west coast, given the incon-sistency between unique dominant haplotypes to specificgeographic regions (Table 1; Fig. 2) and high gene flowbetween these regions suggested by microsatellite analyses(Table 2A; Figs. 5A and 6A). This mitochondrial-nucleardiscrepancy (i.e., high mtDNA differentiation vs. no orvery low genetic differentiation at nuclear loci) has been
detected in several other marine species including thosewith relatively high self-dispersal capacity (e.g., a marinegoby Pomatoschistus minutus; Larmuseau et al. 2010). Se-lection and sex-biased dispersal are generally adopted asmajor explanations for this discrepancy (see Larmuseauet al. 2010 and references therein). However, given thatCiona is hermaphroditic, sex-biased dispersal cannot bea valid explanation. Considering a high level of ge-netic exchange among populations suggested by micro-satellite analyses (Table 2A; Figs. 5A and 6A) and possiblepopulation connection mediated by frequent shipping, suchdifferences at mtDNA between northern and southern Cali-fornia may be maintained by rapid selection associated withstrong local adaptation. The two geographic groups detectedon the west coast are located on two sides of a well-knownoceanographic and biogeographic boundary, Point Concep-tion (PC), where multiple species exhibit phylogeographicbreaks (see e.g., Burton 1998; Bernardi 2000; Dawson et al.2006; Earl et al. 2010). PC is marked by strong discontinu-ities in water temperature, salinity, dissolved oxygen, as wellas hydrography (Burton 1998; Dawson et al. 2001). Strongupwelling and high wave exposure dominate the north of PC,while weak and seasonal upwelling and warmer water tem-peratures are characteristics in the south (Blanchette et al.2007). These oceanographic conditions have important ef-fects on benthic communities, influencing both growth rateand recruitment dynamics (see e.g., Connolly et al. 2001;Blanchette et al. 2007). Therefore, Ciona populations mightlocally adapt to these two dramatically distinct environments.Compared to neutral nuclear makers such as microsatellites,selection events are much easier to capture through mtDNA,mainly because the entire mitochondrial genome is one link-age group without recombination. A selective sweep due toany selection pressure on any mtDNA gene can easily fix thehaplotypes having higher fitness. Indirect and direct selec-tions on mtDNA have been demonstrated in many species(e.g., reviews by Ballard and Rand 2005; Hurst and Jiggins2005), although genetic mechanisms for such selections onmtDNA remain poorly understood. Consequently, the ob-served pattern on the west coast in spA likely resulted fromthe interaction between random genetic drift associated withdemographic change and rapid selection due to strong localadaptation.
Additional evidence suggests that the interaction betweengenetic drift and selection could be responsible for such a geo-graphic pattern. When our data are combined with the globaldata from Zhan et al. (2010), we observed different dominant,and sometimes unique, haplotypes on different continents,although only several mutation steps were observed betweenthese haplotypes (Fig. S1). This pattern was found not onlyin spA but also in spB. For instance, all haplotypes of spB inAsia are unique (Fig. S1).
c© 2012 The Authors. Published by Blackwell Publishing Ltd. 1341
Genetic Complexities in Ciona intestinalis A. Zhan et al.
Complex intraspecific genetic patterns inboth species
Multiple analyses show that intraspecific genetic patterns var-ied significantly across the sampling regions analyzed. Highgenetic differentiation (FST values) was observed not only be-tween geographically distant populations, but also betweenadjacent ones (Table 2). IBD analyses did not reveal any sig-nificant correlation between genetic differentiation and geo-graphical proximity for either species based on both types ofmarkers (Fig. 4). Both Bayesian clustering and 3D-FCA occa-sionally assigned geographically distant populations into thesame clusters (Figs. 5 and 6).
Recent empirical studies have revealed that human-mediated dispersal may leave strong signatures on populationgenetic structures in numerous invasive species, including as-cidians (see e.g., Dupont et al. 2010; Zhan et al. 2010; Bocket al. 2011). Human-mediated gene flow can both generatecomplex genetic structuring at regional and local scales (seee.g., Darling and Folino-Rorem 2009; Dupont et al. 2010;Bock et al. 2011), and affect population genetic patternsamong continents (see, e.g., Zhan et al. 2010). Generally,aquaculture transfer and shipping are considered as the lead-ing pathways for human-mediated dispersal of ascidians inNorth America (Dijkstra et al. 2007; Zhan et al. 2010; Bocket al. 2011). Our genetic analyses detected apparent signa-tures of these two pathways on population genetic structurein Ciona. The major pathway responsible for introductions ofCiona to Prince Edward Island is aquaculture trade betweenPrince Edward Island and Nova Scotia (Dijkstra et al. 2007).Our genetic analysis is concordant with this view. For ex-ample, the population CT (Chester), sampled from Chesterbasin supporting aquaculture in Nova Scotia, showed no sig-nificant genetic differentiation from the three populations(CR, BR, MR) sampled from aquaculture facilities in PrinceEdward Island (Table 2). Genetic analyses, including pairwiseFST, 3D-FCA, and Bayesian clustering, suggest long-distancegene flow between geographically distant populations in bothspecies on both coasts (Table 2; Figs. 5 and 6), all consis-tent with population connectivity via watercraft-mediatedtransportation of propagules. The new evidence found here,coupled with that from Zhan et al. (2010), suggests that in-traspecific genetic complexities largely resulted from geneticexchanges assisted by anthropogenic transfers, possibly fromtransportation of large numbers of larvae inside ballast tanks,and/or adults fouled on watercrafts and/or aquaculture facil-ities/organisms.
Contrasting with high genetic exchange likely associatedwith human activities at both fine and large geographic scales,several neighboring populations exhibited significant geneticdifferentiation (Table 2; Figs. 5 and 6). Because most of thepopulations analyzed here were sampled from semienclosedor enclosed waters (Table 1), the high genetic differentia-
tion between neighboring populations likely resulted fromrestricted gene flow associated with the configuration of thesesites. Ciona larvae may be unable to disperse naturally outsideof semienclosed or enclosed waters. A similar genetic patternhas been observed in other invasive ascidians, including Styelaclava (Dupont et al. 2009).
Several populations exhibited lower genetic diversity andhigher genetic differentiation in both species. For spA on thewest coast, population MO (Monterey Bay), sampled fromopen sea shore, had lower genetic diversity than other popu-lations (Table 1; Table S1). Compared to other sites such asports and marinas with a large number of pathways available,a slower natural dispersal with limited numbers of propag-ules can result in founder effects, leading to low genetic di-versity (Table 1) and high interpopulation genetic differenti-ation (Table 2). For spB on the east coast, all tests based onmicrosatellites including pairwise FST, Bayesian clustering,and 3D-FCA illustrated that four populations (MA, MB,ST, LU) were divergent from all other populations (Table 1;Figs. 5 and 6). Analyses of microsatellite allelic variation in-dicated significantly lower genetic diversity in these popu-lations (Table S2). The observed lower level of genetic di-versity and significant differentiation can result from threepossible processes: separate introductions from geneticallydistinct sources, rapid selection due to local adaptation,and bottlenecks during secondary range expansion. Multi-ple lines of evidence suggest that the first two processes areunlikely to be major determinants. Detailed analysis of mi-crosatellite alleles did not show many unique alleles, withonly 19 (out of 239, 7.9%) in these four populations. Re-gionally, given the intensive sampling and relatively low ge-netic differentiation of the remaining populations on theeast coast (Table 2B; Figs. 5B and 6B), a genetically dis-tinct source does not likely exist on the east coast. Glob-ally, genetic analyses revealed a much lower level of ge-netic differentiation (Zhan et al. 2010). Bayesian clusteringanalysis based on a combined dataset obtained here andfrom Zhan et al. (2010) still separated these four popula-tions (Fig. S2). Consequently, introductions from geneticallydistinct sources both regionally and globally were unlikely.The lower genetic diversity at multiple microsatellite loci(Table S1) suggests that direct selection and/or genetic hitch-hiking are likely not responsible for the observed pattern. Bycontrast to the lower genetic diversity in these four popula-tions, one neighboring population CT (Chester marina) ex-hibited a level of genetic diversity similar to other populationson the east coast (Fig. 2; Table 1). Compared to these four sites,the Chester marina has both relatively higher shipping trafficand nearby aquaculture activities, either of which could me-diate gene flow. Considering the lighter commercial shippingto these four sites, these populations may have been acciden-tally seeded by limited numbers of propagules transferredvia watercrafts, or by natural dispersal from neighboring
1342 c© 2012 The Authors. Published by Blackwell Publishing Ltd.
A. Zhan et al. Genetic Complexities in Ciona intestinalis
sources. Population bottlenecks during secondary range ex-pansions can lead to sharp decrease of genetic diversity (seeexamples in Roman and Darling 2007), and the loss of allelicdiversity can result in a high level of genetic differentiation(see e.g., Zhan et al. 2009).
Inconsistent patterns based on differentmarkers
Interestingly, we observed inconsistent patterns of geneticdiversity when using mtDNA and nuclear microsatellites inboth species (Table 1; Table S1). The two newly colonizedpopulations of spB, BR (Brudenell River) and MR (MurrayRiver), showed relatively low mtDNA diversity (n = 3, h =0.191), though the pattern was not repeated with microsatel-lite loci (Table 1). In addition, the two populations, MA (Mar-tin’s River) and ST (Stone Hurst) that possibly experienceda genetic bottleneck had lower microsatellite diversity but asimilar level of mtDNA diversity to other populations (Ta-ble 1; Fig. 2). A similar pattern was also detected in populationPH (Port Hueneme) of spA (Table 1). Given the difference ofeffective population size between mtDNA and nuclear mark-ers, genetic drift associated with population size decrease dur-ing postestablishment spread may be responsible for produc-ing this inconsistency. In addition, different selection pres-sures and/or genetic hitchhiking events on mitochondrialversus nuclear genomes could also lead to this discordance.
Conclusions
Our genetic surveys add to growing evidence that complexgenetic patterns can emerge in invasive species, includingclosely related species having similar biological characteris-tics. In addition, inconsistent genetic patterns also can bedetected when using two different types of markers, thatis, mtDNA versus nuclear microsatellites. Detailed analysessuggest that multiple factors, including random genetic driftassociated with population demography change, rapid selec-tion due to strong local adaptation, varying propensity forhuman-mediated propagule dispersal, as well as their inter-actions, could be responsible for such genetic complexities.In addition, in order to avoid possible biased results causedby one type of molecular marker, our study highlights the ne-cessity of use of both mtDNA and nuclear markers to performgenetic analysis in invasive species. The complex genetic pat-terns observed here, coupled with multiple putative factorscausing such complexities, open a window for us to deeplyinvestigate mechanisms of rapid evolution associated withfast environmental changes due to frequent anthropogenicactivities.
Acknowledgments
We thank G. Arsenault, J. Davidson, J. Hill, C. Lejeusne,J. Nicolas, A. Ramsay, and B. Vercaemer for assistance withsample collection. This work was supported by research
grants from Natural Sciences and Engineering ResearchCouncil of Canada (NSERC) and the Canadian Aquatic Inva-sive Species Network (CAISN) to MEC and HJM, a Discov-ery Accelerator Supplement grant to HJM, and an OntarioMinistry of Research and Innovation Early Researcher Awardto MEC. ALR was supported by scholarships from FondsQuebecois de la Recherche sur la Nature et les Technologies(FQRNT), Quebec-Ocean and McGill University. The UnitedStates Environmental Protection Agency (EPA) through itsOffice of Research and Development partially funded andcollaborated in the research described here. The manuscripthas been subjected to Agency review and approved for pub-lication. The views expressed are those of the authors and donot necessarily reflect the policy positions of the EPA.
References
Ballard, J. W. and D. M. Rand. 2005. The population biology of
mitochondrial DNA and its phylogenetic implications. Annu.
Rev. Ecol. Syst. 36:621–642.
Belkhir, K., P. Borsa, L. Chikhi, N. Raufaste, and F. Bonhomme.
2004. GENETIX 4.05, logiciel sous Windows TM pour la
ge´ne´tique des populations. Laboratoire Ge´nome,
Populations, Interactions, Universite´ de Montpellier,
Montpellier (France).
Ben-Shlomo, R., G. Paz, and B. Rinkevich. 2006.
Postglacial-period and recent invasions shape the population
genetics of Botryllid ascidians along European Atlantic coasts.
Ecosystems. 9:1118–1127.
Bernardi, G. 2000. Barriers to gene flow in Embiotoca jacksoni, a
marine fish lacking a pelagic larval stage. Evolution
54:226–237.
Blanchette, C. A., B. Helmuth, and S. D. Gaines. 2007. Spatial
patterns of growth in the mussel, Mytilus californianus, across
a major oceanographic and biogeographic boundary at Point
Conception, California, USA. J. Exp. Mar. Biol. Ecol.
340:126–148.
Bock, D. G., A. Zhan, C. Lejeusne, H. J. MacIsaac, and M. E.
Cristescu. 2011. Looking at both sides of the invasion: patterns
of colonization in the violet tunicate Botrylloides violaceus.
Mol. Ecol. 20: 503–516.
Bock, D. G., H. J. MacIsaac, and M. E. Cristescu. 2012. Multilocus
genetic analyses differentiate between widespread and spatially
restricted cryptic species in a model ascidian. Proc. R. Soc. B
279: 2377–2385.
Burton, R. S. 1998. Intraspecific phylogeography across the point
conception biogeographic boundary. Evolution 52:734–745.
Caputi, L., N. Andreakis, F. Mastrototaro, P. Cirino, M. Vassillo,
and P. Sordino. 2007. Cryptic speciation in a model
invertebrate chordate. Proc. Natl. Acad. Sci. U. S. A. 104:
9364–9369.
Carroll, S. P. 2008. Facing change: forms and foundations of
contemporary adaption to biotic invasions. Mol. Ecol. 17:
361–372.
c© 2012 The Authors. Published by Blackwell Publishing Ltd. 1343
Genetic Complexities in Ciona intestinalis A. Zhan et al.
Christie, M. R., D. W. Johnson, C. D. Stallings, and M. A. Hixon.
2010. Self-recruitment and sweepstakes reproduction amid
extensive gene flow in a coral–reef fish. Mol. Ecol. 19:
1042–1057.
Clement, M., D. Posada, and K. A. Crandall. 2000. TCS: a
computer program to estimate gene genealogies. Mol. Ecol.
9:1657–1659.
Connolly, S. R., B. A. Menge, and J. Roughgarden. 2001. A
latitudinal gradient in recruitment of intertidal invertebrates
in the northeast Pacific Ocean. Ecology 82:1799–
1813.
Darling, J. A., and N. C. Folino-Rorem. 2009. Genetic analysis
across different spatial scales reveals multiple dispersal
mechanisms for the invasive hydrozoan Cordylophora in the
Great Lakes. Mol. Ecol. 18:4827–4840.
Dawson, M., R. Waples, and G. Bernardi. 2006. Phylogeography.
Pp. 26–54 in L. G. Allen, D. J. Pondella, and M. H. Horn eds.
The ecology of marine fishes: California and adjacent waters.
UC Press, Berkeley.
Dawson, M. N., J. L. Staton, and D. K. Jacobs. 2001.
Phylogeography of the tidewater goby, Eucyclogobius newberryi
(Teleostei, Gobiidae), in coastal California. Evolution
55:1167–1179.
de Oliveira Marins, F., C. da Silva Oliveira, N. Maria Vieira
Maciel, and L. Felipe Skinner. 2009. Reinclusion of Ciona
intestinalis (Ascidiacea: Cionidae) in Brazil – a methodological
view. Mar. Biodivers. Rec. 2:e112.
Dehal, P., Y. Satou, R. K. Campbell, J. Chapman, B. Degnan, A.
De Tomaso, B. Davidson, A. Di Gregorio, M. Gelpke, D. M.
Goodstein. 2002. The draft genome of Ciona intestinalis:
insights into chordate and vertebrate origins. Science
298:2157–2167.
Dijkstra, J., L. G. Harris, and E. Westerman. 2007. Distribution
and long-term temporal patterns of four invasive colonial
ascidians in the Gulf of Maine. J. Exp. Mar. Biol. Ecol.
342:61–68.
Dupont, L., F. Viard, M. J. Dowell, C. Wood, and D. D. Bishop.
2009. Fine- and regional-scale genetic structure of the exotic
ascidian Styela clava (Tunicata) in southwest England, 50 years
after its introduction. Mol. Ecol. 18:442–453.
Dupont, L., F. Viard, M. H. Davis, T. Nishikawa, and D. D.
Bishop. 2010. Pathways of spread of the introduced ascidian
Styela clava (Tunicata) in Northern Europe, as revealed by
microsatellite markers. Biol. Invasions 12:2707–2721.
Earl, D. A., K. D. Louie, C. Bardeleben, C. C. Swift, and D. K.
Jacobs. 2010. Rangewide microsatellite phylogeography of the
endangered tidewater goby, Eucyclogobius newberryi (Teleostei:
Gobiidae), a genetically subdivided coastal fish with limited
marine dispersal. Conserv. Genet. 11:103–114.
Evanno, G., S. Regnaut, and J. Goudet. 2005. Detecting the
number of clusters of individuals using the software structure:
a simulation study. Mol. Ecol. 14:2611–2620.
Excoffier, L., P. E. Smouse, and J. M. Quattro. 1992. Analysis of
molecular variance inferred from metric distances among
DNA haplotypes: application to human mitochondrial DNA
restriction data. Genetics 131:479–491.
Excoffier, L., G. Laval, and S. Schneider. 2005. Arlequin (version
3.0): an integrated software package for population genetic
data analysis. Evol. Bioinform. 1:47–50.
Goudet, J. 2001. FSTAT, a program to estimate and test gene
diversities and fixation indices (version 396 2.9.3). Available at:
http://www.unil.ch/izea/softwares/fstat.html
Guo, S. W., and E. A. Thompson. 1992. Performing the exact test
of Hardy–Weinberg proportion for multiple alleles. Biometrics
48:361–372.
Hedgecock, D., P. H. Barber, and S. E. Edmands. 2007. Genetic
approaches to measuring connectivity. Oceanography 20:
70–79.
Huntsman, A. G. 1912. Ascidians from the coasts of Canada. T.
Can. Institutes 9:111–148.
Hurst, G. D. D., and F. M. Jiggins. 2005. Problems with
mitochondrial DNA as a marker in population,
phylogeographic and phylogenetic studies: the effects of
inherited symbionts. Proc. R. Soc. B 272:1525–1534.
Iannelli, F., G. Pesole, P. Sordino, and C. Gissi. 2007.
Mitogenomics reveals two cryptic species in Ciona intestinalis.
Trends Genet. 23:419–422.
Kolar, C. S., and D. M. Lodge. 2001. Progress in invasion biology:
predicting invaders. Trends Ecol. Evol. 16:199–204.
Kott, P. 1952. The ascidians of Australia. Aust. J. Mar. Freshwat.
Res. 3:206–333.
Lambert, C. C., and G. Lambert. 1998. Non-indigenous ascidians
in southern California harbors and marinas. Mar. Biol.
130:675–688.
Lambert, C. C., and G. Lambert. 2003. Persistence and differential
distribution of nonindigenous ascidians in harbors of the
Southern California Bight. Mar. Ecol.-Prog. Ser. 259:145–161.
Lambert, G. 2003. New records of ascidians from the NE Pacific:
a new species of Trididemnum, range extension and
redescription of Aplidiopsis pannosum (Ritter, 1899) including
its larva, and several non-indigenous species. Zoosystema 25:
665–679.
Larmuseau, M. H. D., J. A. M. Raeymaekers, B. Hellemans, J. K. J.
Van Houdt, and F. A. M. Volckaert. 2010. Mito-nuclear
discordance in the degree of population differentiation in a
marine goby. Heredity 105:532–542.
Lee, C. E. 2002. Evolutionary genetics of invasive species. Trends
Ecol. Evol. 17:386–391.
Lee, H. J., and E. G. Boulding. 2009. Spatial and temporal
population genetic structure of four northeastern Pacific
littorinid gastropods: the effect of mode of larval development
on variation at one mitochondrial and two nuclear DNA
markers. Mol. Ecol. 18:2165–2184.
Li, G., and D. Hedgecock. 1998. Genetic heterogeneity, detected
by PCR–SSCP, among samples of larval Pacific oysters
(Crassostrea gigas) supports the hypothesis of large variance in
reproductive success. Can. J. Fish. Aquat. Sci. 55:1025–
1033.
1344 c© 2012 The Authors. Published by Blackwell Publishing Ltd.
A. Zhan et al. Genetic Complexities in Ciona intestinalis
Lodge, D. M. 1993. Biological invasions: lessons for ecology.
Trends Ecol. Evol. 8:133–137.
McDonald, C. 2004. The invasive pest species Ciona intestinalis
(Linnaeus, 1767) reported in a harbour in southern Western
Australia. Mar. Pollut. Bull. 49:868–870.
Monniot, C., and F. Monniot. 1994. Additions to the inventory of
eastern tropical Atlantic Ascidians: arrival of cosmopolitan
species. Bull. Mar. Sci. 54:71–93.
Nydam, M. L., and R. G. Harrison. 2007. Genealogical
relationships within and among shallow-water Ciona species
(Ascidiacea). Mar. Biol. 151:1839–1847.
Nydam, M. L., and R. G. Harrison. 2010. Polymorphism and
divergence within the ascidian genus Ciona. Mol. Phylogenet.
Evol. 56:718–726.
Posada, D., and K. A. Crandall. 1998. MODELTEST: testing the
model of DNA substitution. Bioinformatics 14:817–818.
Prentis, P. J., J. R. U. Wilson, E. E. Dormontt, D. M. Richardson,
and A. J. Lowe. 2008. Adaptive evolution in invasive species.
Trends Plant Sci. 13:288–294.
Pritchard, J. K., M. Stephens, and P. Donnelly. 2000. Inference of
population structure using multilocus genotype data. Genetics
155:945–959.
Procaccini, G., O. Affinito, F. Toscano, and P. Sordino. 2011. A
new animal model for merging ecology and evolution. Pp.
91–106 in P. Pontarotti ed. Evolutionary biology – concepts,
biodiversity, macroevolution and genome evolution.
Springer-Verlag, Berlin Heidelberg.
Ramsay, A., J. Davidson, T. Landry, and G. Arsenault. 2008.
Process of invasiveness among exotic tunicates in Prince
Edward Island, Canada. Biol. Invasions 10:1311–1316.
Raymond, M., and F. Rousset. 1995. Genepop (version 1.2):
population genetic software for exact tests and ecumenicism.
J. Heredity 86:248–249.
Reznick, D. N., and C. K. Ghalambor. 2001. The population
ecology of contemporary adaptations: what empirical studies
reveal about the conditions that promote adaptive evolution.
Genetica 112:183–198.
Rice, R. W. 1989. Analyzing tables of statistical tests. Evolution
43:223–225.
Roman, J., and J. A. Darling. 2007. Paradox lost: genetic diversity
and the success of aquatic invasions. Trends Ecol. Evol.
22:454–464.
Ronquist, F., and J. P. Huelsenbeck. 2003. MrBayes 3: Bayesian
phylogenetic inference under mixed models. Bioinformatics
19:1572–1574.
Roux, J. L., and A. M. Wieczorek. 2008. Molecular systematics
and population genetics of biological invasions: towards a
better understanding of invasive species management. Ann.
Appl. Biol. 154:1–17.
Rozas, J., J. C. Sanchez-DelBarrio, X. Messeguer, and R. Rozas.
2003. DnaSP, DNA polymorphism analyses by the coalescent
and other methods. Bioinformatics 19:2496–2497.
Sakai, A., F. W. Allendorf, J. S. Holt, D. M. Lodge, J. Molifsky, K.
A. With, S. Baughman, R. J. Cabin, J. E. Cohen, N. C.
Ellstrand, et al. 2001. The population biology of invasive
species. Annu. Rev. Ecol. Evol. S. 32:305–332.
Sordino, P., N. Andreakis, E. R. Brown, N. I. Leccia, P. Squarzoni,
R. Tarallo, C. Alfano, L. Caputi, P. D’Ambrosio, P. Danieleet al.
2008. Natural variation of model mutant phenotypes in Ciona
intestinalis. PLoS One 3:e2344.
Stoner, D. S., R. Ben-Shlomo, B. Rinkevich, and I. L. Weissman.
2002. Genetic variability of Botryllus schlosseri invasions to the
east and west coasts of the USA. Mar. Ecol.-Prog. Ser.
243:93–100.
Suarez, A. V., and N. D. Tsutsui. 2008. The evolutionary
consequences of biological invasions. Mol. Ecol. 17:351–
360.
Sylvester, F., O. Kalaci, B. Leung, A. Lacoursiere-Roussel, C. C.
Murray, F. M. Choi, M. A. Bravo, T. W. Therriault, and H. J.
MacIsaac. 2011. Hull fouling as an invasion vector: can simple
models explain a complex problem? J. Appl. Ecol. 48:415–
423.
Tamura, K., and M. Nei. 1993. Estimation of the number of
nucleotide substitutions in the control region of mitochondrial
DNA in humans and chimpanzees. Mol. Biol. Evol.
10:512–526.
Tamura, K., J. Dudley, M. Nei, and S. Kumar. 2007. MEGA4:
molecular evolutionary genetics analysis (MEGA) software
version 4.0. Mol. Biol. Evol. 24:1596–1599.
Tepolt, C. K., J. A. Darling, M. J. Bagley, J. B. Geller, M. J. Blum,
and E. D. Grosholz. 2009. European green crabs (Carcinus
maenas) in the northeastern Pacific: genetic evidence for high
population connectivity and current-mediated expansion
from a single introduced source population. Divers. Distrib.
15:997–1009.
Therriault, T. W., and L. Herborg. 2008. Predicting the potential
distribution of the vase tunicate Ciona intestinalis in Canadian
waters: informing a risk assessment. ICES J. Mar. Sci.
65:788–794.
Waters, J. M., L. H. Dijkstra, and G. P. Wallis. 2000. Biogeography
of a southern hemisphere freshwater fish: how important is
marine dispersal? Mol. Ecol. 9:1815–1821.
Weir, B. S., and C. C. Cockerham. 1984. Estimating F-statistics
for the analysis of population structure. Evolution 38:1358–
1370.
Winkler, G., J. J. Dodson, and C. E. Lee. 2008. Heterogeneity
within the native range: population genetic analyses of
sympatric invasive and noninvasive clades of the freshwater
invading copepod Eurytemora affinis. Mol. Ecol. 17:415–
430.
Zhan, A., C. Li, and J. Fu. 2009. Big mountains but small barriers:
population genetic structure of the Chinese wood frog (Rana
chensinensis) in the Tsinling and Daba Mountain region of
northern China. BMC Genet. 10:17.
Zhan, A., H. J. MacIsaac, and M. E. Cristescu. 2010. Invasion
genetics of the Ciona intestinalis species complex: from
regional endemism to global homogeneity. Mol. Ecol.
19:4678–4694.
c© 2012 The Authors. Published by Blackwell Publishing Ltd. 1345
Genetic Complexities in Ciona intestinalis A. Zhan et al.
Supporting Information
Additional Supporting Information may be found online onWiley Online Library.
Figure S1. Bayesian inference (BI) tree (A) and haplo-type networks generated with TCS for Ciona intestinalisspA (B) and spB (C) based on a combined mitochondrialdataset obtained from the present study and Zhan et al.(2010).Figure S2. Bayesian inference (BI) of population structurefor Ciona intestinalis spA (A) and spB (B) based on a com-bined dataset obtained from the present study and Zhan et al.(2010).
Table S1. Genetic diversity at eight microsatellite loci for twohighly invasive species, Ciona intestinalis spA (west coast)and spB (east coast) collected from North America.Table S2. P-values for the exact test of difference in allelic rich-ness (below diagonal) and expected heterozygosity (above di-agonal) using nonparameteric statistics (Mann–Whitney Utest) for the two highly invasive species, Ciona intestinalis spAon the west coast (S2-1) and spB on the east coast (S2-2) ofNorth America.
Please note: Wiley-Blackwell is not responsible for the contentor functionality of any supporting materials supplied by theauthors. Any queries (other than missing material) should bedirected to the corresponding author for the article.
1346 c© 2012 The Authors. Published by Blackwell Publishing Ltd.