Embed Size (px)
Citation preview

Compliance Costs, Economies of Scale and Compliance Performance
Evidence from a Survey of Community Banks
APRIL 2018

Table of Contents
Executive Summary . . . . . . . . . . . . . . . . . . . . . . . . . . . . . . . . . 1
Compliance Costs, Economies of Scale andCompliance Performance . . . . . . . . . . . . . . . . . . . . . . . . . . . . 3
Endnotes . . . . . . . . . . . . . . . . . . . . . . . . . . . . . . . . . . . . . . . 18
References . . . . . . . . . . . . . . . . . . . . . . . . . . . . . . . . . . . . . . 18

1
Executive Summary
Regulatory burden consistently tops polls that ask bankers about their greatest challenges. The costs of compliance are especially burdensome for smaller banks. Regulators and
legislators are working on ways to lessen the load. One impediment to regulatory relief has been a lack of evidence as to the extent of the
problem, especially for smaller institutions. The goal of this paper is to quantify the relationship between bank size and compliance costs, using a unique set of survey data collected over a three-year period. The surveys, conducted in 2015, 2016 and 2017 by the Conference of State Bank Supervisors, collected operational costs data for almost 1,100 community bank and thrift institutions.1
KEY FINDINGS:
1. Compliance costs averaged 7 percent of noninterest expense over the period studied. Personnel expenses accounted for the majority of these expenses, followed by data processing, accounting, legal and consulting expenses.
2. In 2016, compliance with mortgage-related regulations accounted for about one-third of all regulatory costs. Compliance with the Bank Secrecy Act accounted for about one-fifth of all expenses.
3. Economies of scale exist in compliance, i.e., relative compliance costs increase with decreases in bank size. Banks with assets of less than $100 million reported compliance costs that averaged almost 10 percent of noninterest expense, while the largest banks in the study reported compliance costs that averaged 5 percent. In other words, the compliance cost burden for the smallest community banks is double that of the largest community banks.
4. The compliance cost burden varied by year in the study. Compliance expenses as a share of noninterest expense rose from 5.5 percent in 2014 to 8.1 percent in 2015 before declining to 7.7 percent in 2016. The implementation of Dodd-Frank related regulations may explain this pattern in part.
5. The economies of scale results do not vary depending on scores on the quality of management or consumer compliance given to banks by their regulators. The same basic pattern of an increase of compliance cost burden with a decrease in size held regardless of these regulatory performance ratings. There is no indication, therefore, that large banks spend relatively less on compliance activities because they are willing to tolerate lower performance ratings.
6. Within a given size category, these regulatory performance ratings were independent of the amount spent on compliance. This suggests that compliance performance is based on factors other than what is spent on it.
Compliance Costs, Economies of Scale and Compliance Performance
Evidence from a Survey of Community Banks
DREW DAHL, JIM FUCHS, ANDREW MEYER AND MICHELLE NEELY
DIVISION OF BANK SUPERVISIONFEDERAL RESERVE BANK OF ST. LOUIS
APRIL 2018
The views expressed are those of the individual authors and do not necessarily reflect official positions of the Federal Reserve Bank of St . Louis or the Federal Reserve System .
Abstract . We investigate compliance expenses incurred by 1,091 surveyed community banks in 2015, 2016 and 2017 . Comparisons of ratios of compliance expenses in various operational areas, across banks grouped by size, indicate the existence of scale economies . We also find that performance on two sep-arate regulatory-assessed rating scales is not necessarily compromised among larger banks that benefit from reduced costs . This is relevant to ongoing proposals to reduce regulatory burden for smaller financial institutions advocated by Congress, the Treasury and regulatory agencies .
3

4
in bank size. Banks with less than $100 million in assets, for instance, reported mean total compliance costs representing nearly 10 percent of noninterest expense, compared with 5 percent reported by banks with assets of between $1 billion and $10 billion. This suggests that any cost-saving benefits of regulatory reform would be concentrated among the smallest banks within the community banking industry. Alle-viating the compliance burden for them is an oft-cited reason for regulatory reform.
We extend our analysis of economies of scale in compliance by focusing on subsamples of banks that share similar regulatory ratings for management quality and for compliance with rules governing the provision of consumer services. We find that econ-omies of scale in compliance expenses are evident within banks with the same ratings. That is, lesser compliance expenses for larger banks, relative to smaller banks, are not necessarily associated with penalties that regulators may impose on a more parsimonious approach to satisfying regulatory requirements. This may be of interest to policymakers as they consider various regulatory reforms.
2. BACKGROUND
While community banks make up the vast majority of all banks, their numbers are declining. Consolidation has been driven by new financial technologies, operat-ing inefficiencies, demographic changes, pressure from nonbank competitors, and perhaps most important, regulation. Eighty-five percent of bankers responding to the 2017 CSBS survey said that regulatory costs were important in considering acquisition offers.
2.1 THE CURRENT REGULATORY ENVIRONMENT
Current proposals for deregulation focus on smaller banks. The U.S. Department of the Treasury (2017), for example, has recommended that regulatory burdens “be appropriately tailored” to bank size in order to mitigate competitive advantages for larger institutions that “can more easily absorb regulatory costs.” The FFIEC (2017) has similarly identified initiatives that regulatory agencies “have or will be undertaking” to reduce regulatory burden, “especially
1. INTRODUCTION
Regulatory burden has long been a concern within the banking industry. Particular attention has been devoted recently to compliance costs that weigh more heavily on smaller banks than on larger ones. These costs play a prominent role in regulatory rollbacks pro-posed by the U.S. Congress (U.S. Senate Committee on Banking, Housing and Urban Affairs, 2017), the U.S. Department of the Treasury (2017) and bank regula-tory agencies (Federal Financial Institutions Examina-tion Council (FFIEC), 2017).
We provide new evidence on the relationship between bank size and compliance costs using data from annual surveys conducted in 2015, 2016 and 2017 by the Conference of State Bank Supervisors (CSBS).1 The surveys identify costs incurred by 1,091 community banks, within five specific operational areas, in responding to the entirety of their regulatory requirements.2 A unique aspect of our analysis consid-ers the extent to which relationships between size and compliance costs may be affected by varying levels of performance in meeting these requirements.
We find that compliance costs across all banks, and all years, averaged about 7 percent of noninterest expense. This level of exposure is at the low end of ranges previously estimated by the FDIC (1992), Ellie-hausen (1998) and KPMG (2016). This may suggest a lower base from which regulatory reform can deliver cost-reducing benefits.
Within operational areas, we find that personnel expenses account for the majority of a community bank’s compliance burden. Costs also are relatively high for data processing and accounting, but are much lower for legal and consulting services. In all of these areas except personnel, relative costs increased in 2015 before declining in 2016. Although we are unable to attribute the decline in 2016 to any particular regulatory influence, we note that it follows final implementation of mortgage regulations under the Dodd-Frank Wall Street Reform and Consumer Protection Act (Dodd-Frank) of 2010.
The key findings of our study concern economies of scale. Consistent with prior research, we find that relative compliance costs increase with decreases
5
for community banks.” Recent efforts in Congress have been designed to achieve the same objectives; for example, the Economic Growth, Regulatory Relief and Consumer Protection Act (U.S. Senate Commit-tee on Banking, Housing and Urban Affairs, 2017) is intended to “right-size” regulation for smaller finan-cial institutions.
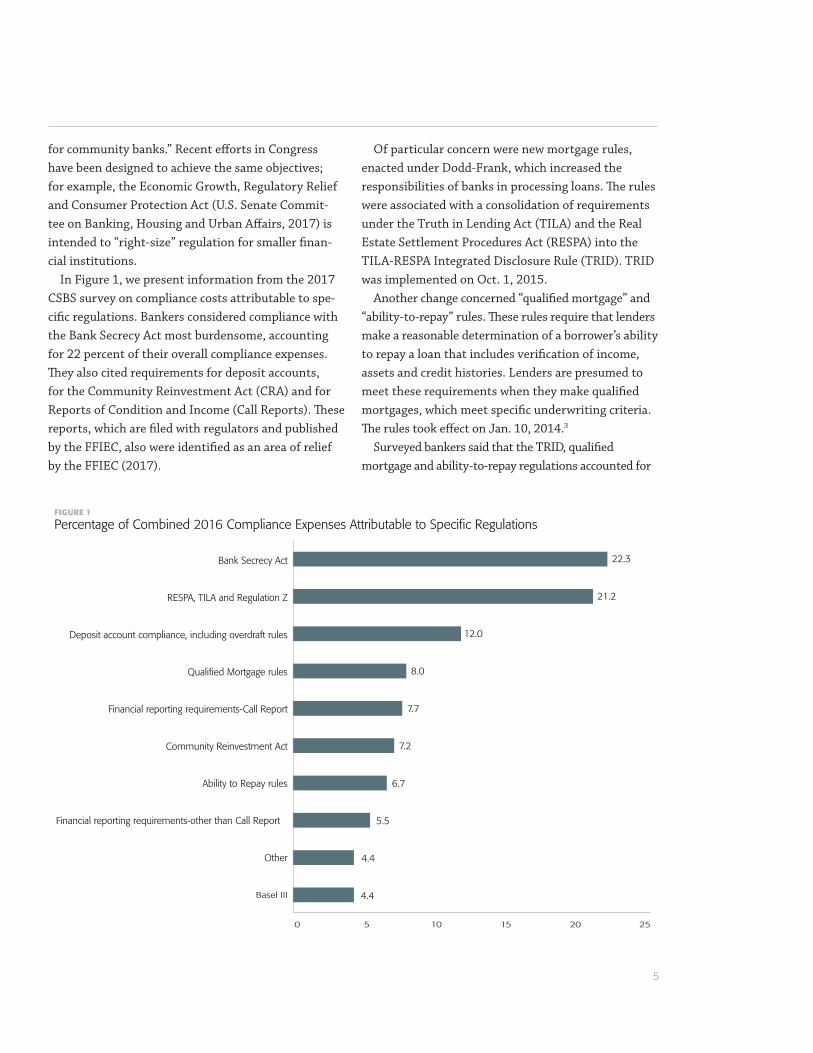
In Figure 1, we present information from the 2017 CSBS survey on compliance costs attributable to spe-cific regulations. Bankers considered compliance with the Bank Secrecy Act most burdensome, accounting for 22 percent of their overall compliance expenses. They also cited requirements for deposit accounts, for the Community Reinvestment Act (CRA) and for Reports of Condition and Income (Call Reports). These reports, which are filed with regulators and published by the FFIEC, also were identified as an area of relief by the FFIEC (2017).
Of particular concern were new mortgage rules, enacted under Dodd-Frank, which increased the responsibilities of banks in processing loans. The rules were associated with a consolidation of requirements under the Truth in Lending Act (TILA) and the Real Estate Settlement Procedures Act (RESPA) into the TILA-RESPA Integrated Disclosure Rule (TRID). TRID was implemented on Oct. 1, 2015.
Another change concerned “qualified mortgage” and “ability-to-repay” rules. These rules require that lenders make a reasonable determination of a borrower’s ability to repay a loan that includes verification of income, assets and credit histories. Lenders are presumed to meet these requirements when they make qualified mortgages, which meet specific underwriting criteria. The rules took effect on Jan. 10, 2014.3
Surveyed bankers said that the TRID, qualified mortgage and ability-to-repay regulations accounted for
Financial reporting requirements-other than Call Report
Bank Secrecy Act 22.3
21.2
12.0
8.0
7.7
7.2
6.7
5.5
4.4
4.4
RESPA, TILA and Regulation Z
Deposit account compliance, including overdraft rules
Qualified Mortgage rules
Financial reporting requirements-Call Report
Community Reinvestment Act
Ability to Repay rules
Other
Basel III
0 5 10 15 20 25
FIGURE 1
Percentage of Combined 2016 Compliance Expenses Attributable to Specific Regulations

6
pating banks, which limits the conclusions that can be drawn from them. The GAO (2015), the FDIC (2012a) and CFPB (2013), for instance, interview only a hand-ful of banks; Peirce et al. (2014) is more expansive, with about 200 participants, but is limited to a single year and one that, moreover, preceded the full imple-mentation of the mortgage provisions of Dodd-Frank. Marsh and Norman (2013) focus on anecdotes.
3. THE CSBS SURVEY
Data from the CSBS survey address some of these lim-itations of the previous studies: (1) They are obtained from a relatively large sample of banks observed over multiple years ending in 2016; (2) They incorporate the effects of all regulations; (3) They are listed in dollar amounts; and (4) They are likely to incorporate direct costs that “are straightforward and easily identi-fiable (FDIC, 2012a).”
Our sample is limited, however, in a number of ways:1. It may overlook indirect costs that are not easily
segregated within our specified categories of operating costs (FDIC, 2012);4
2. Bias may be a problem if respondents have incentives to exaggerate reported regulatory burden or were influenced by knowledge that the survey was conducted by state regulators;
3. Some respondents may have interpreted com-pliance costs on an incremental, rather than total, basis;5
4. Opportunity costs, attributable to regulations that limit profitable activities, may have played a larger role in other studies;
5. The sample may not be representative of the industry as a whole;6
6. Comparing banks in different size groups fails to account for the possibility that compliance costs may be influenced by other factors that vary systematically with size (Elliehausen, 1998); and
7. Comparisons over time may be impacted by the changing composition of respondent banks (only a minority of banks reported in each of the three years).
Our conclusions must be qualified accordingly.
21 percent, 8 percent and 7 percent, respectively, of com-pliance costs. Thus, more than one-third of all regulatory costs incurred by community banks were reported to be associated with these mortgage regulations.
2.2 PRIOR RESEARCH
Prior analyses of regulatory costs in banking have used anecdotes, case studies, surveys, economet-ric estimation or other methods of inference. They include, or are summarized in: the FFIEC (1992); the Government Accountability Office (GAO, 1994); Elliehausen (1998); Elliehausen and Lowrey (2000); Dolar and Shugart (2007); the Federal Reserve Bank of Kansas City (2011); FDIC (2012a and 2012b); the Consumer Financial Protection Bureau (CFPB, 2013); Feldman et al. (2013); Marsh and Norman (2013); the Independent Community Bankers of America (ICBA, 2014); Peirce et al. (2014); GAO (2015); KPMG (2016); Hoskins and Labonte (2015); and Cyree (2016). All of them are subject to various limitations.
One problem with these studies is that banks generally “do not actively track the various costs associated with regulatory compliance, because it is too time-consuming, costly, and is so interwoven into their operations (FDIC, 2012a).” This makes it difficult to identify aggregate regulatory costs. Feldman et al. (2013), for instance, illustrate them by applying pub-licly available data on salaries in banking to estimates of the numbers of employees working in regulatory compliance that, in turn, mirror the results of a survey by the Federal Reserve Bank of Kansas City (2011).
Alternatively, some studies examine compliance costs that span the date of implementation for a specific individual regulation and ascribe observed changes to it. Elliehausen and Lowrey (2000) examine the Truth in Savings Act. Dolar and Shugart (2007) examine the Patriot Act, as does Cyree (2016), who also considers the FDIC Improvement Act and Dodd-Frank. The CFPB (2013), in a case study, focuses on the costs of compliance with regulations that govern deposit-related products and services. These studies are useful but do not provide direct information on the entirety of regulatory burden.
Some studies involve only a small number of partici-

7
“Consulting and advisory expenses” are paid to out-side vendors who assist banks in managing compliance activities (FDIC, 2012a). Vendors have been increas-ingly used by bankers to update loan origination and documentation system software in response to TRID (GAO, 2015). Additional appraisal requirements under Dodd-Frank, as well as heightened standards for evaluat-ing investment securities, may also have increased costs in this area. The latter standards have led some banks lacking internal expertise to hire experts (GAO, 2015).
“Legal fees and expenses” include costs incurred by banks to satisfy regulations related to consumer protection, safety and soundness, and fair lending practices, among others. Expenses in these areas are driven by labor (CFPB, 2013) and, in the case of compliance with TRID, may extend from “increased regulatory liability,” which was recently named by community bankers as their greatest challenge (CSBS, 2017). According to the GAO, some banks lack ade-quate technology and staff to comply with expanded requirements for escrow accounts under Dodd-Frank (GAO, 2015), which may necessitate additional exter-nal legal support.
Personnel costs dominate total operating expenses in the banking industry and, for community banks, are nearly seven times larger than the previous four expense categories combined (CSBS, 2016). Within compliance, they are likely to dominate as well, and presumably extend or overlap with the previously listed categories.8 They account for a large share of the costs of implementing new regulations and an even larger share of the costs of satisfying regulatory requirements on a day-to-day basis (Elliehausen, 1998).
More than 90 percent of respondents to the survey by Peirce et al. (2014) said that in-house employees were responsible for compliance. From this perspec-tive, new regulations can be addressed by the hiring of new employees. But they also may be satisfied by a redirection of existing employees toward compliance or increasing training expenses for existing staff to meet new compliance demands (GAO, 2015).9
Compliance expenses for personnel appear to be more subjective than expenses in the other categories. For example, it may be difficult to estimate just how
3.1 DESCRIPTIONS OF CATEGORIES
The survey asked bankers to identify expenses in one of five categories: 1) data processing; 2) accounting and auditing; 3) consulting and advising; 4) legal; and 5) personnel. They were asked to specify both the dol-lar amounts of total expenses and the amounts spent on compliance in each of the five categories.
The categories were chosen because they represent operational areas in which compliance expenses were considered likely to be incurred. They also reflect spe-cific line items in Call Reports.7 McCord and Prescott (2014) similarly identified these same categories (personnel expenses excepted) in their analysis of regulatory burden.
“Data processing expenses” include compliance costs associated with the manipulation of data for regula-tory purposes. The CFPB (2013) reported that infor-mation technology was one of two business functions that incurred the highest share of compliance costs in four of the seven banks it studied, while bankers inter-viewed by the GAO (2015) said that implementation of the TRID mortgage disclosure rules required banks to revise and test software and compliance systems.
Economies of scale appear possible in data process-ing to the extent that they have fixed cost compo-nents. It is difficult, however, to “parse out” incremen-tal and fixed costs in this area, particularly as only a small percentage of information technology expenses are attributable to compliance (CFPB, 2013).
“Accounting and auditing expenses” attributable to compliance extend from auditing and financial report-ing requirements. These expenses include bank-wide risk assessments and design of processes and tools (CFPB, 2013). The reliance of some banks on dedicated in-house staffs suggests a role for fixed costs. Other expenses are paid to external vendors (ICBA, 2005).
Accounting costs also vary because of size-based regulatory rules. For example, more comprehensive, and more expensive, external audit requirements are required for larger banks; banks with assets of less than $500 million are exempt from external audit requirements and those with assets of less than $1 bil-lion are exempt from requirements for external audit inclusive of analyses of internal controls.

8
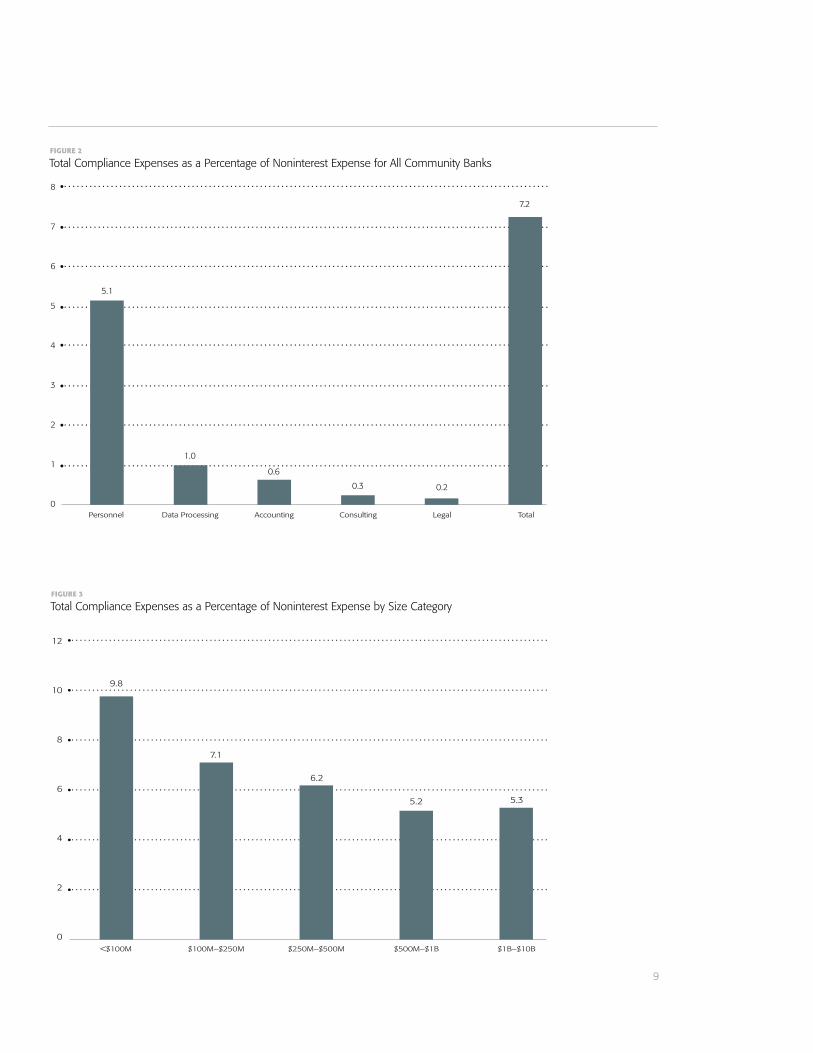
Turning next to specific expense categories, we note that compliance expenses were dominated by personnel, at 5.1 percent of mean (and 3.3 percent of median) noninterest expense. Personnel expenses accounted for about two-thirds of total compliance costs across all categories, which is the same propor-tion of compliance costs that the CFPB study (2013) ascribed to “in-house labor.”
Data processing, legal services, accounting and consulting constituted 1.0 percent (0.6 percent), 0.2 percent (0 percent), 0.6 percent (0.3 percent) and 0.3 percent (0 percent) of mean (median) non-interest expense, respectively. These amounts seem relatively modest, and they underscore the conclusion of McCord and Prescott (2014) that absolute compli-ance expenses in these categories are “just too small to have a big effect on bank profitability.”
4. COMPLIANCE COSTS AND BANK SIZE
Figure 3 provides information on the five categories of expenses for banks in different size groups. It lists mean compliance expenses as percentages of nonin-terest expense in each size category. The intent of this analysis is to identify potential economies of scale in satisfying regulatory requirements.
Total compliance expenses averaged 9.8 percent of noninterest expense at banks with assets of less than $100 million. For banks with assets of $1 billion to $10 billion, expenses averaged 5.3 percent of nonin-terest expense. The difference in these values suggests an approximate doubling of regulatory burden for banks in the smallest size category relative to banks in the largest category.
A difference in regulatory cost burden based on bank size is not a new finding. For example, the CFPB (2013) found that two banks with less than $1 billion in assets had compliance costs of 6 percent and 4 per-cent of retail deposit operating expenses while another two banks with more than $1 billion in assets had ratios of 2 percent and 1 percent. In earlier studies, the FFIEC (1992) and Elliehausen (1998) concluded that compliance costs increase by 6 percent to 8 per-cent in response to a 10-percent increase in output. The FDIC (2012b) found that exams of banks with less
much time a loan officer spends filling out compliance forms versus drumming up new business. Respon-dents may account differently for the time and atten-tion devoted to compliance by chief executive officers or boards of directors (FDIC, 1992).
3.2 OVERVIEW OF THE DATA
Surveys were distributed by state banking regula-tory agencies in April of 2015, 2016 and 2017 and remained open through July of each year. There were 542 respondents from 39 states in 2015, 497 respon-dents from 26 states in 2016, and 542 respondents from 37 states in 2017 for which complete financial and ratings information were available. All of these entities had less than $10 billion in assets. Included among them are 99 thrift institutions, which differ in many respects from community banks, but which have operational and compliance activities that we consider similar enough for inclusion in a combined sample. We will refer hereafter to this group of institutions as “community banks.”
The final sample consists of 1,504 observations across all three years from 1,091 unique banks. We identify overall compliance costs for these banks in Figure 2.
Across all years and all banks, mean (median) expenses as a percentage of noninterest expense were 7.2 percent (5.0 percent).10 By comparison, nearly 90 percent of respondents to a recent survey by KPMG (2016) reported that compliance accounted for 5 percent to 20 percent of operating costs. Elliehausen (1998), in summarizing the results of several studies, estimated that total compliance costs may account for 12 percent to 13 percent of noninterest expense. An earlier estimate by the FFIEC (1992) was in the range of 6 percent to 14 percent.
From this perspective, the compliance costs we esti-mate appear to represent a lower bound relative to the estimates of prior research. If our estimates are closer to actual compliance costs than those compiled else-where, it suggests, perhaps, a more limited potential for regulatory reform to deliver cost-reducing benefits that radically improve profitability across the entirety of the community banking industry.
9
5.1
1.0
0.6
0.3 0.2
7.2
8
7
6
5
4
3
2
1
0
Total Compliance Expenses as a Percentage of Noninterest Expense for All Community BanksFIGURE 2
Personnel Data Processing Accounting Consulting Legal Total
12
109.8
7.1
6.2
5.2 5.3
7.1
6.2
5.2 5.3
8
6
4
2
0
Total Compliance Expenses as a Percentage of Noninterest Expense by Size CategoryFIGURE 3
<$100M $100M–$250M $250M–$500M $500M–$1B $1B–$10B

10
3.9 percent for banks with assets of $1 billion to $10 billion. The declines, moreover, were monotonic within all intermediate size categories. These results are consistent with the notion that smaller banks have fewer staff members over which regulatory costs can be spread efficiently (Yellen, 2015).
For data processing, mean compliance expenses as percentages of noninterest expense declined from 1.5 percent to 0.6 percent in moving from the smallest to largest size category, which represents a percentage drop of 60 percent. This decline may reflect economies of scale as discussed by the CFPB (2013). Larger banks may implement their information technology needs in-house, while smaller banks may rely exclusively on external vendors. Larger banks also may have greater bargaining power with external vendors to negotiate fees than smaller banks do.
Mean compliance expenses for accounting exhibited a percentage drop of about 50 percent (from 1.0 per-cent to 0.5 percent) in moving from the less than $100
than $50 million in assets averaged 335 hours, while those for banks with assets between $500 million and $1 billion averaged 850 hours—i.e., the increase in examination time was not linear with respect to size. Dolar and Shugart (2007) similarly found that the bur-den of complying with the Patriot Act fell more heavily on smaller banks.
Mean costs decline uniformly (monotonically) in all transitions from smaller to larger size categories through $1 billion in assets. For banks with assets of $1 billion to $10 billion, however, costs increase from 5.2 percent to 5.3 percent. This result appears to conform to the conclusion of Elliehausen (1998) that economies of scale decline with increases in size.
Information on compliance costs as percentages of noninterest expense, arranged by both size category and operational area, is presented in Figure 4. Begin-ning with personnel, the area in which regulatory burden is most pervasive, ratios averaged 7 percent for banks with less than $100 million in assets and
7
7.0
5.1
4.6
4.0 3.9
1.5
1.10.9
0.7 0.6
1.00.6
0.50.3
0.60.3 0.3 0.3 0.2 0.2 0.2 0.1 0.2 0.1 0.1
8
6
5
4
3
2
1
0
Compliance Expense in Each Category as a Percentage of Noninterest Expense by Size CategoryFIGURE 4
Data ProcessingPersonnel Accounting Consulting Legal
<$100M
$100M–$250M
$250M–$500M
$500M–$1B
$1B–$10B

11
are low as percentages of overall expenses compared with other categories (medians, in fact, are typically zero). Observed declines in means are not as consistently monotonic with increases in size categories. Their relative invariance across size categories is inconsistent with economies of scale in these operational areas.
Although prior research has tended to define rela-tive compliance costs in terms of noninterest expense, as we have done thus far, other bases of compari-son are also informative. It could be instructive, for instance, to look at compliance costs in a spending category as a percentage of overall categorical spend-ing. We present this information in Figure 5. It offers insight into the proportion of expenses in a given cat-egory that are accounted for by compliance activities and how they vary by size.
Mean compliance expenses in consulting and accounting as percentages of categorical expenses were 44.8 percent and 40.5 percent, respectively, indicating
million asset category to the $250 to $500 million category. This change is comparable to one in a study by the ICBA (2014), which found that the annual costs of preparing required financial statements were $10,316 for a bank with assets of less than $100 million and $14,990 for a bank with assets of $250 million to $500 million. In other words, costs were 45 percent higher over an interval in which size increased by a minimum of 150 percent.
Banks in the $500 million to $1 billion asset cate-gory had average accounting costs that were about 40 percent lower than for banks in the $250 million to $500 million asset size category. This suggests that economies of scale were sufficient to overcome any additional costs associated with the mandatory audit faced by banks with assets of $500 million or more. Relative costs increased among banks with assets of more than $1 billion, the level at which audits under internal controls are required.11
Compliance expenses for legal fees and consulting
50
45
40
11.4
17.3
40.5
44.8
21.16.2
5.2 5.3
35
20
25
30
10
15
5
0
Compliance Expense in Each Category as a Percentage of Total Spending in That Category for All Size CategoriesFIGURE 5
Data ProcessingPersonnel Accounting Consulting Legal
12
higher in the less than $100 million asset category compared with the $1 billion to $10 billion size cate-gory. The declines are monotonic across size categories.
In Figure 7, compliance expenses as a percentage of categorical spending are broken out by operational area and size category. Declines are monotonic with size category for consulting, data processing, account-ing and (with one exception) personnel. A difference, however, emerges in legal services, for which relative expenses do not exhibit any obvious pattern with respect to size category.
5. COMPLIANCE COSTS BY YEAR
Compliance expenses in the various categories are presented for each of the three years in our sample in Figure 8. As in Figures 2, 3 and 4, they are expressed as percentages of noninterest expense.
Observed changes in compliance costs over time suggest a potential shift in the evolution of regulatory
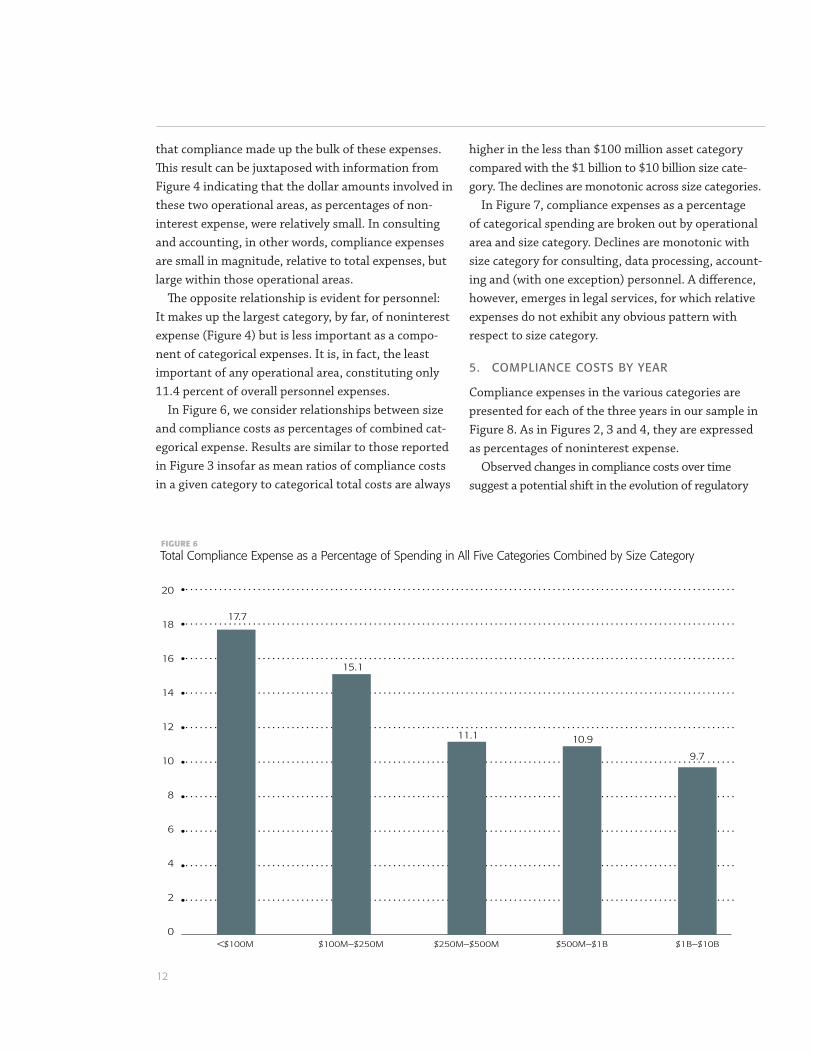
that compliance made up the bulk of these expenses. This result can be juxtaposed with information from Figure 4 indicating that the dollar amounts involved in these two operational areas, as percentages of non-interest expense, were relatively small. In consulting and accounting, in other words, compliance expenses are small in magnitude, relative to total expenses, but large within those operational areas.
The opposite relationship is evident for personnel: It makes up the largest category, by far, of noninterest expense (Figure 4) but is less important as a compo-nent of categorical expenses. It is, in fact, the least important of any operational area, constituting only 11.4 percent of overall personnel expenses.
In Figure 6, we consider relationships between size and compliance costs as percentages of combined cat-egorical expense. Results are similar to those reported in Figure 3 insofar as mean ratios of compliance costs in a given category to categorical total costs are always
20
18
16
17.7
15.1
11.1 10.9
9.7
6.2
5.2 5.3
14
8
10
12
4
6
2
0
Total Compliance Expense as a Percentage of Spending in All Five Categories Combined by Size CategoryFIGURE 6
<$100M $100M–$250M $250M–$500M $500M–$1B $1B–$10B

13
16.4
10.9 9.8 10.18.3
22.8
17.3 16.014.6
12.7
47.8
39.7
37.8 37.6 37.1
61.3
49.0
40.7
33.8
28.325.9
18.2
21.6 20.0 20.5
70
60
50
40
30
20
10
0
Compliance Expense in Each Category as a Percentage of Total Spending in That Category by Size CategoryFIGURE 7
Data ProcessingPersonnel Accounting Consulting Legal
<$100M
$100M–$250M
$250M–$500M
$500M–$1B
$1B–$10B
5.5
8.17.7
9
8
7
6
5
4
3
2
1
0
Total Compliance Expense as a Percentage of Noninterest Expense by YearFIGURE 8
2014 2015 2016

14
to 2016 at an average level approaching 0.7 percent of noninterest expense. Among possible contributing factors is a potentially associated stability in staffing for preparation of financial reports. Almost two-thirds of respondents to the ICBA survey (2014) said the number of employees involved in preparing Call Reports did not increase over an extended period.
6. COMPLIANCE COSTS, BANK SIZE AND PERFORMANCE
Elliehausen and Lowrey (2000) define “output” in compliance as cost-causing activities that a bank must perform to meet its regulatory requirements. They define a bank’s optimization decision as a choice of production at a uniform level of compliance perfor-mance. Banks, however, operate at different regulatory- assessed levels of performance.
This raises an interesting question insofar as banks vary by both their measured success in meeting the regulatory requirements as well as by their size: Does evidence of economies of scale in satisfying regulatory requirements persist when output is held constant? It seems possible, from this perspective, that lesser (greater) relative expenditures on com-pliance for larger (smaller) banks may be associated with worse (better) performance outcomes. Previous research on economies of scale in banking has not addressed the possibility of endogenous choice in compliance performance.
To address this issue, we create subsamples of banks that share the same regulatory performance rating. We select two proxies for compliance performance. One is a rating established by regulators for a bank’s ability to comply with consumer regulations, which ranges from “1” (highest) to “3” (lowest). Another is a component of the overall “CAMELS” rating that is assigned to a bank by its regulators for “management,” which ranges from “1” (highest) to “5” (lowest).13 The latter reflects, in part, the capability to “identify, measure, monitor and control the risks of an institution’s activities and to insure a financial institution’s safe, sound and efficient operation in compliance with applicable laws and regulations.”
Our analysis is based on comparisons of compliance
burden: Mean (median) ratios of compliance expenses to noninterest expense increased from 5.5 percent (4.1 per-cent) in 2014 to 8.1 percent (5.9 percent) in 2015 before declining to 7.7 percent (5.2 percent) in 2016.
What might explain that shift? It may be that compliance costs moderate as regulators more clearly define regulatory requirements and banks get accus-tomed to complying with them (Peirce et al., 2014). One particular possibility is the implementation of previously described mortgage rules under Dodd-Frank that went into effect on Oct. 3, 2015. The costs to implement these rules, as previously mentioned, constituted as much as one-third of total compliance costs (CSBS, 2017), and were found to reduce bank profitability by 8 basis points (Cyree, 2016). More than 80 percent of bankers surveyed by Peirce et al. (2014) reported that the new mortgage rules resulted in an increase in compliance costs of more than 5 percent.12
Further insight into possible implications of Dodd-Frank is obtained from Figure 9, which breaks out changes in compliance expenses by year across operational areas. Expenses for data processing, as a percentage of noninterest expense, increased in 2015 (to a mean of 1.2 percent from the prior level of 0.9 percent) but decreased in 2016 (to 1.1 percent). Similar up-and-down relationships were observed in legal, accounting and consulting services. This may be related to the conclusion of Cyree (2016) that new regulations under Dodd-Frank increased the number and salaries of employees but reduced technological expenses for community banks, thereby diverting funds from technology to hiring more workers to han-dle the new regulations.
Consulting expenses as percentages of noninterest expense, perhaps surprisingly, declined modestly over time. This result contrasts with an increasing reliance on consultants that was earlier observed by the FDIC (2012a), the comments of some bankers surveyed by the CSBS (various years) and the observed hiring by some community banks of experts in response to new requirements for identifying “investment grade” securities under Dodd-Frank (GAO, 2015).
Accounting expenses were relatively stable from 2014

15
6.4 percent for banks with assets between $1 billion and $10 billion. The percentage decline in expenses of nearly 40 percent from smallest to largest size category is similar to what was reported in Figure 3.
Similar relationships are observed for banks in the second-highest category of performance. For banks with the highest rating, mean compliance expenses as a percentage of noninterest expense averaged 9.8 percent for banks with assets under $100 million and 4.9 percent for banks with assets of $1 billion to $10 billion. The declines in compliance costs as the size class increases, once again, are monotonic.
We also note that, within a given size category, compliance expenses as percentages of noninterest expense do not appear to vary systematically for banks with different performance ratings. For banks with assets of less than $100 million, for example, rela-tive compliance expenses at the highest rated banks were lower than for other banks, while for banks with
costs among different-sized banks within the highest ratings category, “1,” as well as within the second-high-est ratings category, “2,” for both management and consumer compliance. We exclude consideration of lower ratings categories because of the limited number of banks in them.
Mean total compliance expenses as percentages of noninterest expense for differently rated banks are presented in Figures 10 and 11. The former reflects the compliance expenses of banks in the highest, and second-highest, categories, respectively, for consumer compliance. The latter does the same for management performance.
In Figure 10, banks with the best consumer compliance rating and assets of less than $100 million had mean compliance expenses as a percentage of non-interest expense of 10.2 percent. Relative expenses declined monotonically (with one exception) in mov-ing from smaller to larger size categories to a level of
10.29.8
6.87.3
5.3
6.7
4.3
5.4
6.4
4.9
12
10
8
6
4
2
0
Total Compliance Expense as Percentage of Noninterest Expense by Consumer Compliance Rating and Size Category
FIGURE 10
Compliance = 1
Compliance = 2
<$100M $100M–$250M $250M–$500M $500M–$1B $1B–$10B

16
Our analysis features a time-series aspect that isolates recent changes in regulatory burden. Of particular interest are effects on compliance expenses of mortgage regulations under Dodd-Frank, which were completely implemented by 2015. We found that relative expenses in data processing, which involve compliance with these regulations, declined in the following year. Among other explanations, this may suggest the existence of one-time start-up costs.
Another key aspect of our study examines the relationship between economies of scale in compliance expenses and the “output” of those expenses in terms of how well regulatory obligations are met. We find that economies of scale in compliance expenses are evident within banks with the same regulatory performance ratings. This finding indicates that lower relative com-pliance expenses at larger banks, compared with smaller banks, can be achieved without sacrificing compliance performance, and offers insight into the possibility that “small banks might be able to benefit from additional regulatory relief without undermining the goals of pro-tecting consumers, enhancing the safety and soundness of banks, and promoting financial stability (Hoskins and Labonte, 2015).”
Our findings, collectively, are relevant to ongoing proposals intended to provide regulatory relief to community banks. First, they identify the magnitude of compliance expenses. Second, they identify how expenses have changed over time during a period in which some regulations, which may be curtailed in the future, were implemented. And third, they show that cost efficiencies in meeting regulatory requirements can be achieved by bigger banks that share the same performance rating as their smaller counterparts.
assets between $500 million and $1 billion, relative compliance expenses were higher for the highest rated banks than for other banks. This suggests that compli-ance performance is based on factors other than what is spent on it.
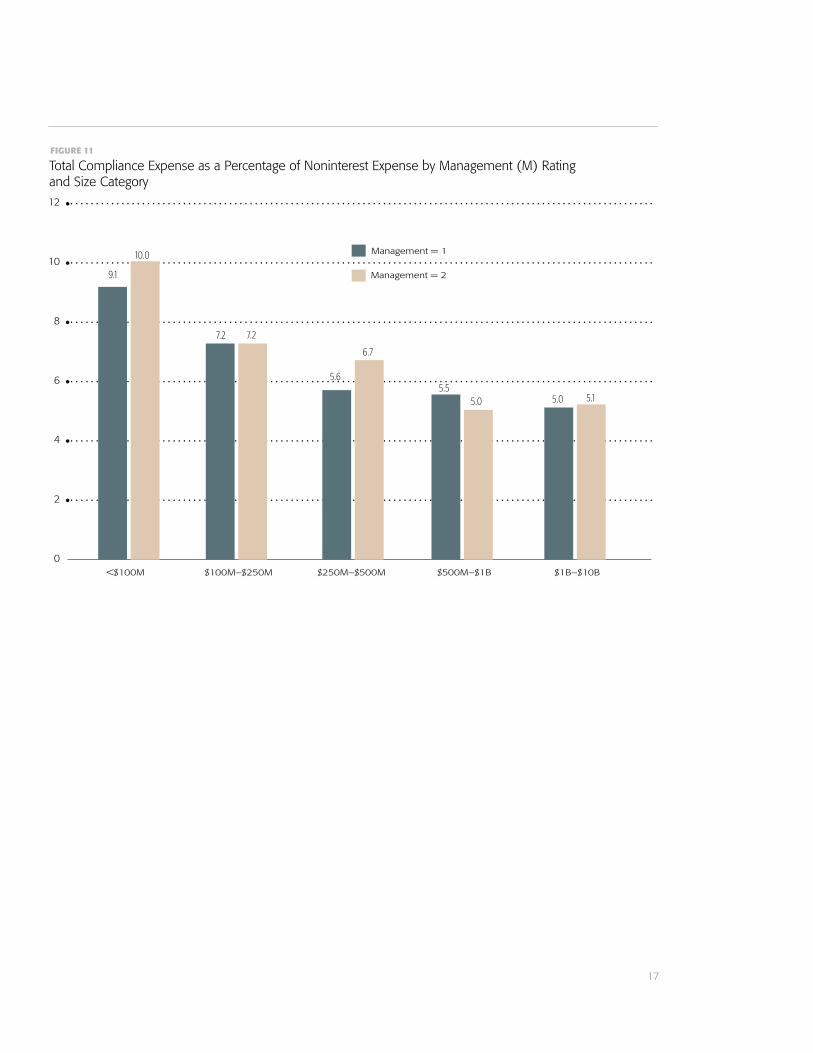
Results for the sample focusing on management rating, in Figure 11, are similar to those reported for consumer compliance rating. Relative compliance costs decline with increases in size category, and the declines usually are monotonic. Compliance expenses, once again, do not appear to vary systematically for banks with different performance ratings within a given size category.
The foregoing results, in Figures 10 and 11, show that economies of scale are evident even among banks with comparable regulatory performance ratings. That is, they exist when output, on this metric, is held constant. This appears to be inconsistent with a hypothesis that larger banks spend relatively less on compliance activities because they are willing to tolerate lower performance ratings.
7. CONCLUSIONS
We compare compliance costs across a sample of 1,504 observations on 1,091 banks using data collected in annual surveys conducted over a three-year period ending in 2017. We find that the ratio of these costs to total noninterest expense averages 10 percent at banks with assets of less than $100 million and 5 percent at banks with assets of $1 billion to $10 billion. This is consistent with the existence of economies of scale in fulfilling compliance obligations.
Previous studies have described similar economies of scale. But they are limited to the consideration of costs that are unique to a particular regulation rather than cumulative across all regulations or are cumu-lative but observed only among a relative handful of banks. We, on the other hand, are able to identify, using a relatively large sample, a “cumulative compliance cost” across banks that has been “hard to quantify” because it is not listed in Call Reports (GAO, 2015). We focus, specifically, on operational areas listed in these reports.
17
9.1
10.0
7.2 7.2
5.6
6.7
5.55.0 5.0 5.1
12
10
8
6
4
2
0
Total Compliance Expense as a Percentage of Noninterest Expense by Management (M) Ratingand Size Category
FIGURE 11
Management = 1
Management = 2
<$100M $100M–$250M $250M–$500M $500M–$1B $1B–$10B

E N D N O T E S
1 . The surveys were administered by The Survey Research Institute at
Cornell University (Cornell SPI) .
2 . Community banks are defined as commercial banks with less than
$10 billion in assets .
3 . Other mortgage-related aspects of Dodd-Frank included an expansion
of obligations for banks in mortgage servicing, escrow accounts and
appraisals (see GAO, 2015) .
4 . One example is potential variation in how respondents may have
incorporated compliance-induced “distractions” among senior manag-
ers in their cost calculations (Peirce et al ., 2014) .
5 . Elliehausen (1998) defines the costs of performing activities that are
mandated by law but would be performed anyway in the ordinary
course of business as part of the total cost of a regulation but not as
part of the incremental cost . As an example, he notes that the Truth
in Savings Act required banks to disclose information about deposit
accounts that many of them already did, to varying extent, before the
law was enacted .
6 . Surveyed banks, on the other hand, were similar to the universe of
banks with respect to several key characteristics (see CSBS, various
years) .
7 . More information on the Call Report, including current and historical
examples and instructions for completing them, can be found at
https://www .ffiec .gov/forms031 .htm .
8 . Personnel expenses make up a large share of total compliance
expenses, but compliance expenses in total are small compared with
total personnel expenses, especially for larger institutions .
9 . Credit ratings regulation under Dodd-Frank, for instance, led some
banks to hire employees and to spend additional time conducting
credit analysis (Peirce et al ., 2014) .
10 . In the text, we discuss both means and, on occasion, medians . In
figures, however, only mean values are reported .
11 . See 12 C .FR Part 363, Final Rule, Nov . 28, 2005 .
12 . The period of evaluation used by Cyree (2016) is the 18 quarters after
passage .
13 . A “CAMELS” rating stands for Capital adequacy (C), Asset quality (A),
Management (M), Earnings (E), Liquidity (L) and Sensitivity to market
risk (S) and is assigned by a bank’s primary regulator to asses various
aspects of its safety and soundness . It consists of an overall composite
rating and separate ratings for each component (see FDIC Statements
of Policy (5000), Uniform Financial Institution Rating System) .
R E F E R E N C E S
Consumer Financial Protection Bureau . 2013 . Understanding the Effects
of Certain Deposit Regulations on Financial Institutions’ Operations
(November) .
Conference of State Bank Supervisors . 2015-2017 . Community Banking in
the 21st Century, Community Banking Research and Policy Confer-
ence, Federal Reserve Bank of St . Louis .
Cyree, K . The Effects of Regulatory Compliance for Small Banks around
Crisis-based Regulation, Journal of Financial Research 39, 215-245 .
Dolar, B . and W . Shugart . 2007 . The Wealth Effects of the USA Patriot Act:
Evidence from the Banking and Thrift Industries, Journal of Money
Laundering Control 10, 300-317 .
Elliehausen, G . 1998 . The Cost of Bank Regulation: A Review of the
Evidence, Staff Study, Federal Reserve Board .
Elliehausen, G . and B . Lowrey . 2000 . The Costs of Implementing Regula-
tory Changes: The Truth in Savings Act, Journal of Financial Services
Research 17, 165-179 .
Federal Reserve Bank of Kansas City . 2011 . Survey of Community Deposi-
tory Institutions (August) .
Feldman, R ., K . Heinecke and J . Schmidt . 2013 . Quantifying the Costs of
Additional Regulation on Community Banks, Economic Policy Paper,
Federal Reserve Bank of Minneapolis .
Federal Deposit Insurance Corp . 2005 . Statement of John Reich on Regu-
latory Burden Relief Efforts (U .S . House of Representatives, June 9) .
Federal Deposit Insurance Corp . 2012a . Community Banking Study
(December) .
Federal Deposit Insurance Corp . 2012b . The FDIC’s Examination Process
for Small Community Banks (August) .
Federal Financial Institutions Examination Council . 1992 . Study on Regula-
tory Burden (December 17) .
Federal Financial Institutions Examination Council . 2017 . Economic Growth
and Regulatory Paperwork Reduction Act (Federal Register, March 30) .
Federal Register . 2013 . Integrated Mortgage Disclosures Under the Real
Estate Settlement Procedures Act (Regulation X) and the Truth in Lend-
ing Act (Regulation Z), 12 CFR Parts 1024 and 1026 (December 3) .
Government Accountability Office . 1993 . Regulatory Burden (December) .
Government Accountability Office . 2015 . Dodd-Frank Regulations: Impacts
on Community Banks, Credit Unions and Systemically Important
Institutions (December) .
Hoskins, S . and M . Labonte . 2015 . An Analysis of the Regulatory Burden
on Small Banks, Working Paper, Congressional Research Service .
Independent Community Bankers of America . 2005 . The Costs of Com-
plying with Section 404 of the Sarbanes-Oxley Act .
Independent Community Bankers of America . 2014 . Community Bank Call
Report Burden Survey .
KPMG . 2016 . A Matter of Momentum (July) .
18
Marsh, T . and J . Norman . 2013 . The Impact of Dodd-Frank on Community
Banks . American Enterprise Institute (May) .
McCord, R . and E . Prescott . 2014 . The Financial Crisis, the Collapse of
Bank Entry, and Changes in the Size Distribution of Banks, Economic
Quarterly, Federal Reserve Bank of Richmond, 23-50 .
Peirce, H ., I . Robinson and T . Stratman . 2014 . How Are Small Banks Faring
under Dodd-Frank? Working Paper, George Mason University .
U .S . Senate Committee on Banking, Housing and Urban Affairs . 2017 .
Economic Growth, Regulatory Relief and Consumer Protection Act
(November 16) .
U .S . Department of the Treasury . 2017 . A Financial System That Creates
Economic Opportunities (June) .
Yellen, J . 2015 . Some Thoughts on Community Banking: a Conversation
with Janet Yellen, Community Banking Connections (Federal
Reserve System) .
19