Embed Size (px)
Citation preview
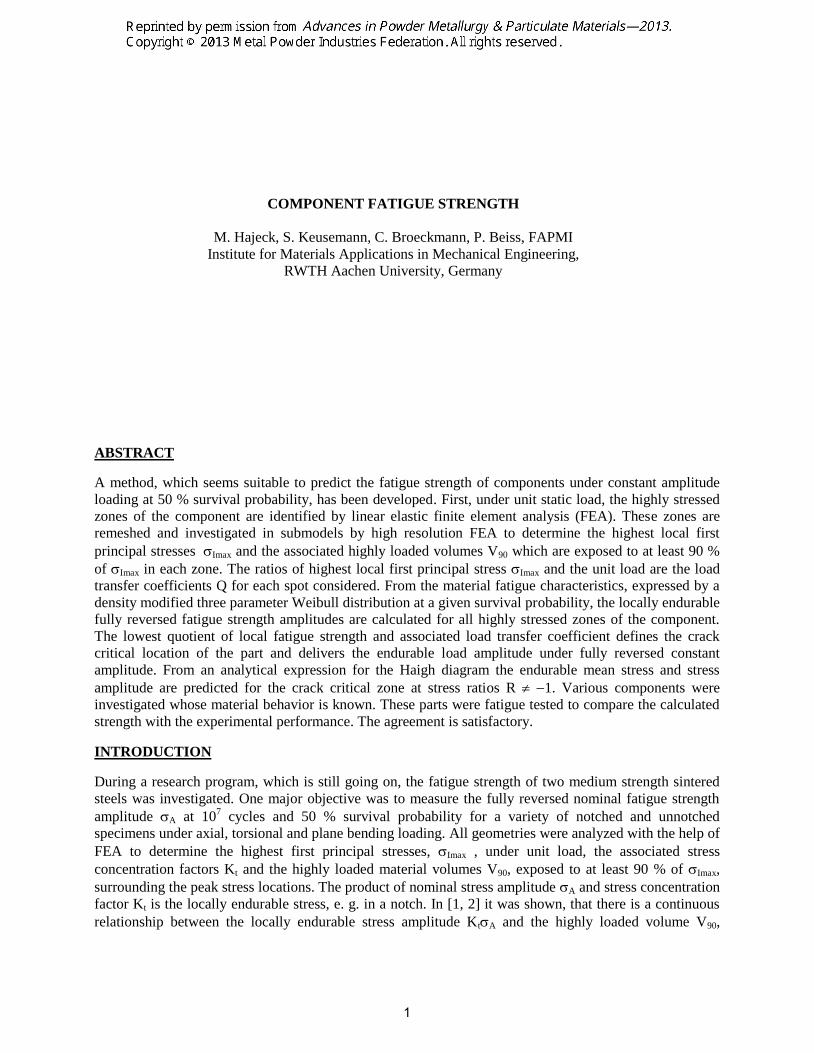
COMPONENT FATIGUE STRENGTH
M. Hajeck, S. Keusemann, C. Broeckmann, P. Beiss, FAPMI
Institute for Materials Applications in Mechanical Engineering,
RWTH Aachen University, Germany
ABSTRACT
A method, which seems suitable to predict the fatigue strength of components under constant amplitude
loading at 50 % survival probability, has been developed. First, under unit static load, the highly stressed
zones of the component are identified by linear elastic finite element analysis (FEA). These zones are
remeshed and investigated in submodels by high resolution FEA to determine the highest local first
principal stresses Imax and the associated highly loaded volumes V90 which are exposed to at least 90 %
of Imax in each zone. The ratios of highest local first principal stress Imax and the unit load are the load
transfer coefficients Q for each spot considered. From the material fatigue characteristics, expressed by a
density modified three parameter Weibull distribution at a given survival probability, the locally endurable
fully reversed fatigue strength amplitudes are calculated for all highly stressed zones of the component.
The lowest quotient of local fatigue strength and associated load transfer coefficient defines the crack
critical location of the part and delivers the endurable load amplitude under fully reversed constant
amplitude. From an analytical expression for the Haigh diagram the endurable mean stress and stress
amplitude are predicted for the crack critical zone at stress ratios R 1. Various components were
investigated whose material behavior is known. These parts were fatigue tested to compare the calculated
strength with the experimental performance. The agreement is satisfactory.
INTRODUCTION
During a research program, which is still going on, the fatigue strength of two medium strength sintered
steels was investigated. One major objective was to measure the fully reversed nominal fatigue strength
amplitude A at 107 cycles and 50 % survival probability for a variety of notched and unnotched
specimens under axial, torsional and plane bending loading. All geometries were analyzed with the help of
FEA to determine the highest first principal stresses, Imax , under unit load, the associated stress
concentration factors Kt and the highly loaded material volumes V90, exposed to at least 90 % of Imax,
surrounding the peak stress locations. The product of nominal stress amplitude A and stress concentration
factor Kt is the locally endurable stress, e. g. in a notch. In [1, 2] it was shown, that there is a continuous
relationship between the locally endurable stress amplitude KtA and the highly loaded volume V90,
1

irrespective of specimen size, notch geometry or loading mode. This relationship can be expressed by a
density modified three parameter Weibull distribution at a survival probability p = exp(1):
m
0
n/1
ref
90
ref0A0AAtV
VK
(1)
(KtA: locally endurable fatigue strength amplitude at 107 cycles and 36.8 % survival probability; the
survival probability of 36.8 % is approximated by 50 % for practical purposes; A0: asymptotic volume
independent strength amplitude at full density 0; A0ref: volume dependent part of the strength amplitude
at full density 0 and at a highly loaded reference volume Vref = 1 mm3; n: Weibull exponent; : density;
m: density exponent)
Figure 1. Effect of highly loaded volume V90 on the locally endurable fatigue strength amplitude KtA at a
stress ratio of R = 1, 107 cycles and 50 % survival probability for a diffusion bonded iron containing 4 %
Ni, 1.5 % Cu, 0.5 % Mo and 0.6 % admixed graphite
2

Figure 2. Effect of highly loaded volume V90 on the locally endurable fatigue strength amplitude KtA at a
stress ratio of R = 1, 107 cycles and 50 % survival probability for a prealloyed 1.5 % molybdenum steel
containing 2 % admixed copper and 0.65 % graphite
With a sufficient number of experimental results the four coefficients A0, A0ref, n and m can be
obtained by multiple nonlinear regression analysis. The findings for the two steels investigated were
normalized to a common density of 7.0 g/cm3 via eq. 1 and are presented in Fig. 1 and 2. The data points
marked with an asterisk were excluded from the regression evaluation for microstructural reasons.
Usually real PM parts are not subjected to fully reversed cyclic stresses but rather to static mean stresses
different from zero with superimposed cyclic stress amplitudes. Therefore, a second objective of the
project is to develop an analytical approach to take the mean stresses into account. To this end, S-N curves
at different stress ratios R are considered in double logarithmic coordinates in the finite life region, as
shown in Fig. 3. At any number of cycles Basquin’s equation delivers
C(R 1) [Kta(R 1)]k(R 1)
= C(R = 1) [Kta (R = 1)]k(R=1)
(2)
Since C(R 1), C(R = 1), k(R 1) and k(R = 1) are constants eq. 2 stays valid also at nominal
endurance limits A if the S-N curves at R 1 and at R = 1 have similar knee points.
With
RK1RC
1RC1Rk/1
and
k(R = 1) / k(R ≠ 1) = q(R)
eq. 2 becomes
)R(q
AtAt 1RKRK1RK (3)
Figure 3. Schematic illustration of the effect of mean stresses on the locally endurable stress amplitude in
double logarithmic coordinates
Eq. 3 predicts the locally endurable fatigue strength at any stress ratio R ≠ 1 as a function of the fully
reversed fatigue strength at R = 1 if the stress ratio dependence of the factor K(R) and of the exponent
3

q(R) is known. In [3] an attempt was made to establish analytical expressions for these functions derived
from additional fatigue tests at the stress ratios R = 5, R = 0 and R = 0.5 with both steels. Within the
limits of experimental error K(R) and q(R) did not depend on the type of steel investigated. The current
status of the project is presented in Fig. 4 with the expressions
K(R) = 0.693 + 0.897 expR (4)
q(R) = 1.156 0.497 [1 exp(expR)] (5)
and with the coefficients of eq. 1 in Table 1. All these regression coefficients given here are subject to
change when all results of the project are available for a final evaluation.
Figure 4. Functional relationship between stress ratio R, factor K(R) and exponent q(R) in eq. 3
Table 1: Regression coefficients of eq. 1 for fully reversed fatigue strength amplitudes, R = 1
steel A0
N/mm2
A0ref
N/mm2
1/n m
Distaloy AE + 0.6 % C 230.7 223.6 0.1974 4.571
Atomet 4901 + 2 % Cu + 0.65 % C 181.8 207.1 0.2012 5.113
Eqs. 4 and 5 offer the opportunity to calculate a synthetic Haigh diagram to any fully reversed fatigue
strength amplitude KtA(R = 1), Fig. 5.
4

Fig. 5: Synthetic Haigh diagram according to eq. 3, 4 and 5 for the two steels investigated
We think that the locally endurable fatigue strength amplitude KtA(R) from the specimen results, as
estimated from eq. 1 and eq. 3, can directly be compared with the locally endurable first principal stress
amplitude in a component under cyclic load. If this assumption is correct, eq. 1 and 3 in combination with
an FEA are suitable to predict the fatigue strength of components. The FEA is needed to determine the
highly loaded volumes V90 around positive stress peaks and the proportionality factors between outer load
and local first principal stresses.
COMPONENT FATIGUE STRENGTH
The approach to predict the constant amplitude fatigue strength of components manufactured from the two
steels considered can be separated in several steps:
1. FEA with a unit load as applied under service conditions to identify highly stressed zones of the
component
2. Remesh a high resolution submodel of each potential crack critical zone
3. Calculate the maximum first principal stress Imax for each location, the highly loaded volume V90
surrounding each stress peak and the load transfer coefficient Q as quotient of Imax and external
unit load for each location under consideration
4. Measure the local density at each potential failure site of the component
5. Calculate the endurable fully reversed (R = 1) stress amplitude for each location from eq. 1 with
V90 and and the coefficients in Table 1
6. Divide each locally endurable stress amplitude by its associated load transfer coefficient Q. The
lowest quotient indicates the failure critical highly loaded zone of the component.
7. Convert the stress amplitude at the lowest endurable load at R = 1 to the applicable stress ratio R
via eq. 3, 4 and 5. The resulting stress amplitude is divided by the load transfer coefficient Q and
delivers the predicted endurable fatigue load amplitude of the component at 50 % failure probability
and 107 cycles.
This procedure makes use only of the FEA results (Imax, V90, Q) and material specific fatigue testing
results from laboratory specimens expressed by eq. 1 and eq. 3 without any adjustment or correction
factor. The viability must be demonstrated by component tests.
EXAMPLE SYNCHRONIZER HUB
5
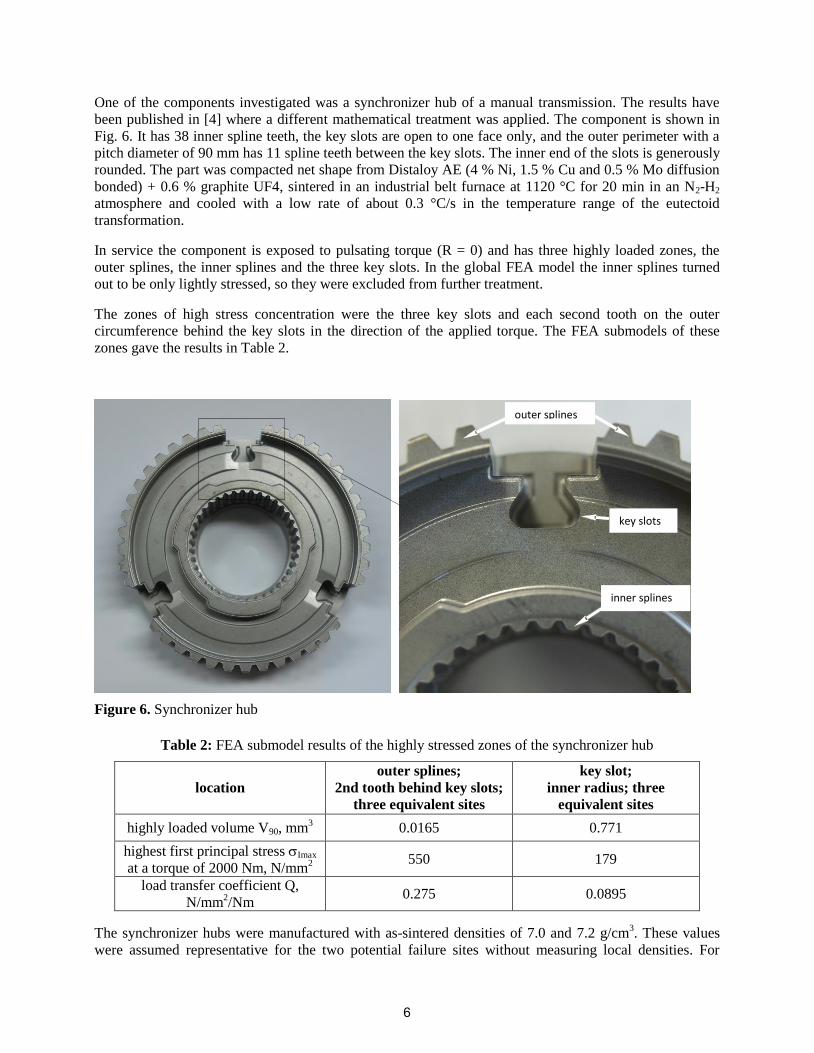
One of the components investigated was a synchronizer hub of a manual transmission. The results have
been published in [4] where a different mathematical treatment was applied. The component is shown in
Fig. 6. It has 38 inner spline teeth, the key slots are open to one face only, and the outer perimeter with a
pitch diameter of 90 mm has 11 spline teeth between the key slots. The inner end of the slots is generously
rounded. The part was compacted net shape from Distaloy AE (4 % Ni, 1.5 % Cu and 0.5 % Mo diffusion
bonded) + 0.6 % graphite UF4, sintered in an industrial belt furnace at 1120 °C for 20 min in an N2-H2
atmosphere and cooled with a low rate of about 0.3 °C/s in the temperature range of the eutectoid
transformation.
In service the component is exposed to pulsating torque (R = 0) and has three highly loaded zones, the
outer splines, the inner splines and the three key slots. In the global FEA model the inner splines turned
out to be only lightly stressed, so they were excluded from further treatment.
The zones of high stress concentration were the three key slots and each second tooth on the outer
circumference behind the key slots in the direction of the applied torque. The FEA submodels of these
zones gave the results in Table 2.
Figure 6. Synchronizer hub
Table 2: FEA submodel results of the highly stressed zones of the synchronizer hub
location
outer splines;
2nd tooth behind key slots;
three equivalent sites
key slot;
inner radius; three
equivalent sites
highly loaded volume V90, mm3 0.0165 0.771
highest first principal stress Imax
at a torque of 2000 Nm, N/mm2
550 179
load transfer coefficient Q,
N/mm2/Nm
0.275 0.0895
The synchronizer hubs were manufactured with as-sintered densities of 7.0 and 7.2 g/cm3. These values
were assumed representative for the two potential failure sites without measuring local densities. For
ä outer splines
key slots
inner splines
6

Distaloy AE + 0.6 % C the pore-free density 0 = is 7.90 g/cm3. With the constants in Table 1 eq. 1 yields
the fully reversed locally endurable stress amplitudes for the outer splines and the key slots in Table 3.
Table 3: Locally endurable fully reversed fatigue strengths and corresponding torques
location outer splines key slot radii
density, g/cm3 7.0 7.2 7.0 7.2
KtA (R = 1) from eq. 1, N/mm2 421.9 479.9 268.1 305.0
endurable torque at R = 1
KtA (R = 1) / Q, Nm 1534 1745 2996 3408
It is evident that the key slots have a much higher load bearing capacity than the three second teeth behind
the key slots. Thus, the outer splines represent the failure critical regions of this type of synchronizer hub,
opposite to hubs with key slots that are open to both faces.
Using eq. 3, 4 and 5 the fully reversed local fatigue strength KtA (R = 1) is now converted to the real
load case of pulsating torque with R = 0. For R = 0 eq. 4 yields K(R = 0) = 1.590 and eq. 5 delivers
q(R = 0) = 0.8418. Table 4 compares the predicted with the measured fatigue torques from [4]. The
difference is less than 10 %.
Table 4: Comparison between predicted and measured torque at R = 0
density, g/cm3 7.0 7.2
locally endurable stress amplitude KtA (R = 0) from eq. 3, N/mm2 257.8 287.5
predicted endurable torque KtA (R = 0)/Q, Nm 937 1045
measured fatigue strength at 5 106 cycles, R = 0, Nm 870 960
measured/predicted 0.928 0.919
EXAMPLE INJECTOR CLAMP
The injector clamp in Fig. 7 is symmetric with regard to the central through hole accepting a fastening bolt
submitting the component under a high static mean bending stress. In service the static bending stress is
superimposed by cyclic bending stress components from periodic fuel injection. For this investigation the
part was compacted from Distaloy AE + 0.6 % C, sintered at 1120 °C and slowly cooled to match the
microstructural characteristics of the laboratory specimens on which Fig. 1 is based.
7
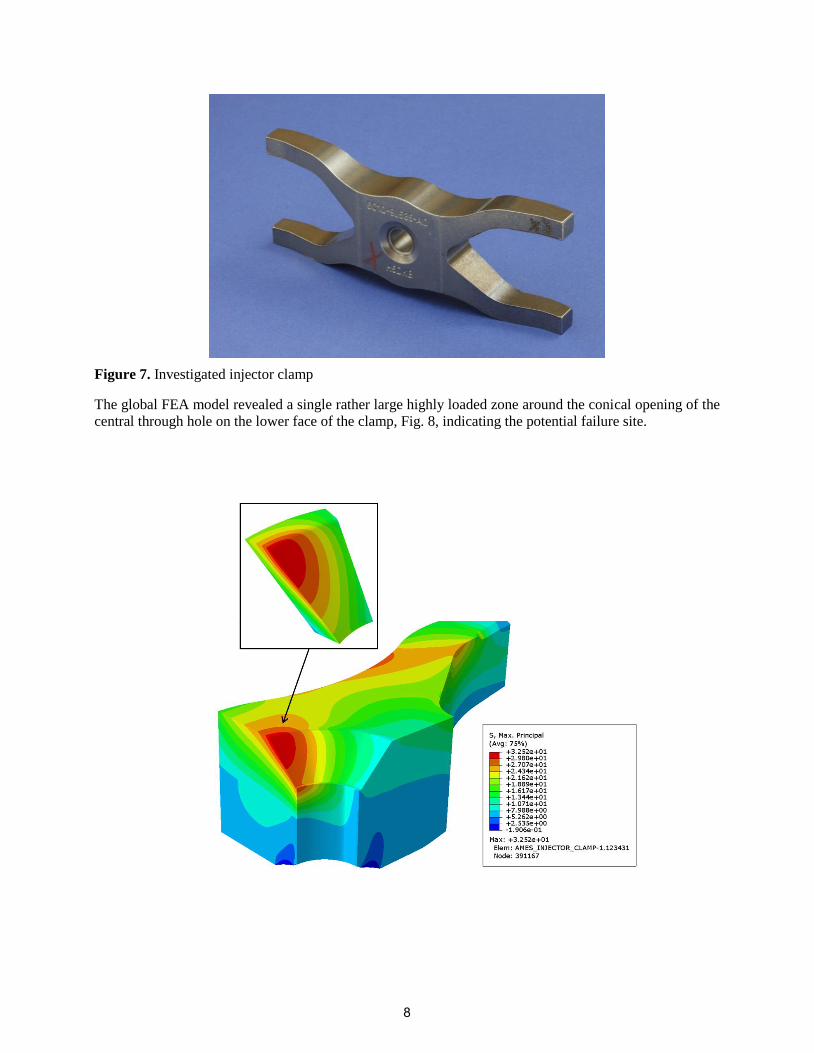
Figure 7. Investigated injector clamp
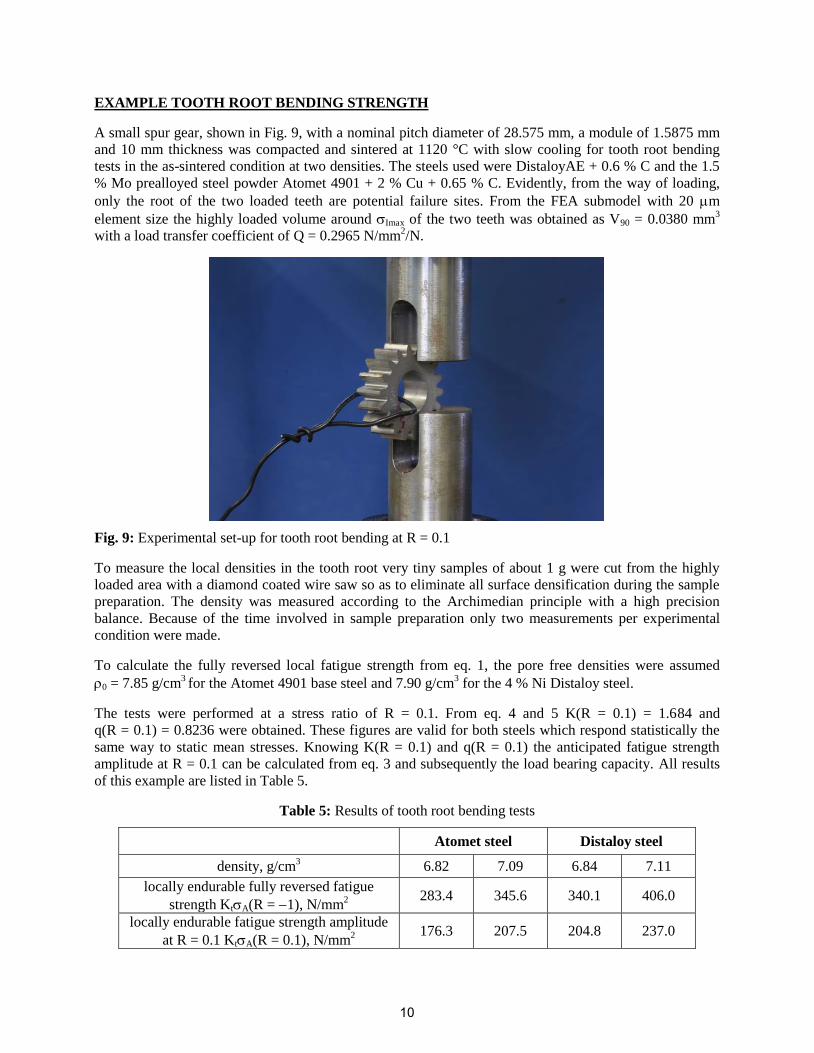
The global FEA model revealed a single rather large highly loaded zone around the conical opening of the
central through hole on the lower face of the clamp, Fig. 8, indicating the potential failure site.
8

Figure 8. Distribution of first principal stresses I with Imax on the lower face around the conical hole
opening with submodel
The submodel of this zone was remeshed in several steps down to 40 m element size until the value of
the highly loaded volume had converged to V90 = 6.34 mm3, and the load transfer coefficient was
Q = 0.0325 N/mm2/N.
The local density was determined on thin slices weighing less than 4 g cut adjacent to the fatigue fracture
surfaces with a diamond wire saw. The average of five measurements was 7.11 g/cm3. With
0 = 7.90 g /cm3 for Distaloy AE + 0.6 % C eq. 1 delivers the locally endurable fully reversed stress
amplitude
KtA(R = 1) = 238.5 N/mm2.
The component was submitted to bending fatigue testing at a stress ratio of R = 0.5 which is rather
realistic in this application. From eq. 4 K(R = 0.5) = 2.172 and from eq. 5 q(R = 0.5) = 0.7546 are
obtained. With these values eq. 3 yields
KtA(R = 0.5) = 135.2 N/mm2.
The predicted endurable bending load amplitude is
KtA(R = 0.5)/Q = 135.2/0.0325 N = 4159 N
The measured fatigue strength at R = 0.5, 107 cycles and 50 % survival probability was 3958 N. The ratio
measured/predicted is 3958/4159 = 0.951. Also in this case the deviation from the testing result is below
10 %.
9
EXAMPLE TOOTH ROOT BENDING STRENGTH
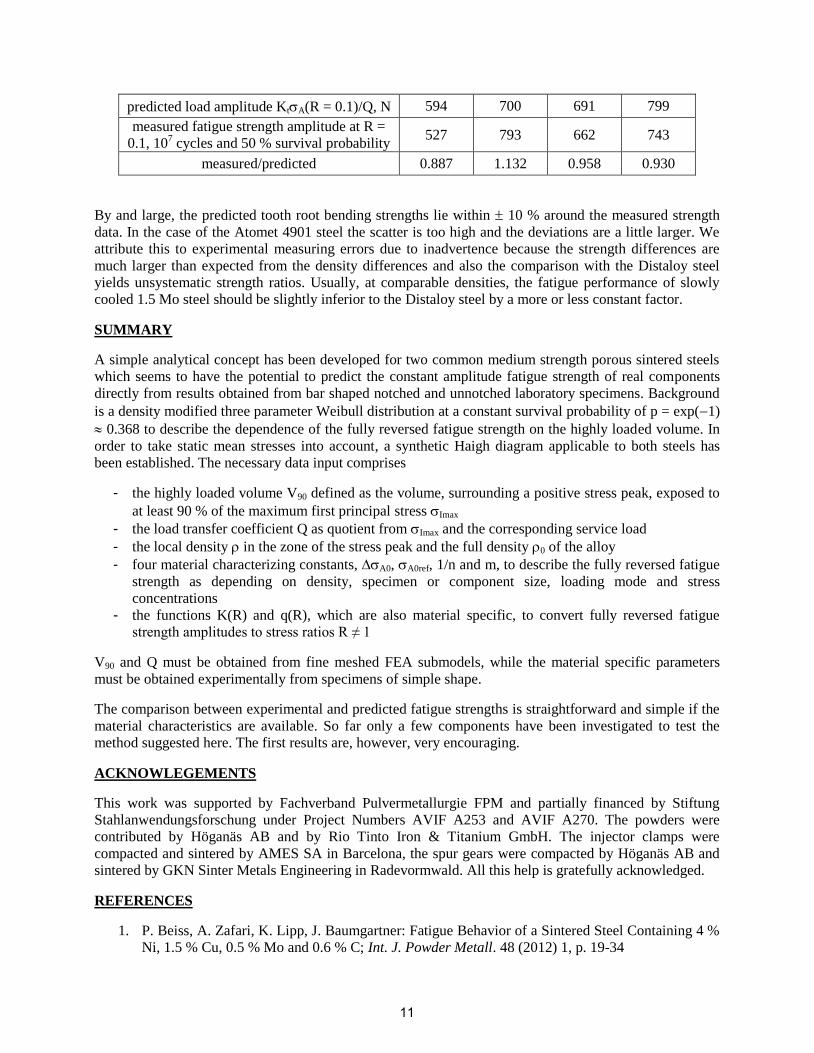
A small spur gear, shown in Fig. 9, with a nominal pitch diameter of 28.575 mm, a module of 1.5875 mm
and 10 mm thickness was compacted and sintered at 1120 °C with slow cooling for tooth root bending
tests in the as-sintered condition at two densities. The steels used were DistaloyAE + 0.6 % C and the 1.5
% Mo prealloyed steel powder Atomet 4901 + 2 % Cu + 0.65 % C. Evidently, from the way of loading,
only the root of the two loaded teeth are potential failure sites. From the FEA submodel with 20 m
element size the highly loaded volume around Imax of the two teeth was obtained as V90 = 0.0380 mm3
with a load transfer coefficient of Q = 0.2965 N/mm2/N.
Fig. 9: Experimental set-up for tooth root bending at R = 0.1
To measure the local densities in the tooth root very tiny samples of about 1 g were cut from the highly
loaded area with a diamond coated wire saw so as to eliminate all surface densification during the sample
preparation. The density was measured according to the Archimedian principle with a high precision
balance. Because of the time involved in sample preparation only two measurements per experimental
condition were made.
To calculate the fully reversed local fatigue strength from eq. 1, the pore free densities were assumed
0 = 7.85 g/cm3 for the Atomet 4901 base steel and 7.90 g/cm
3 for the 4 % Ni Distaloy steel.
The tests were performed at a stress ratio of R = 0.1. From eq. 4 and 5 K(R = 0.1) = 1.684 and
q(R = 0.1) = 0.8236 were obtained. These figures are valid for both steels which respond statistically the
same way to static mean stresses. Knowing K(R = 0.1) and q(R = 0.1) the anticipated fatigue strength
amplitude at R = 0.1 can be calculated from eq. 3 and subsequently the load bearing capacity. All results
of this example are listed in Table 5.
Table 5: Results of tooth root bending tests
Atomet steel Distaloy steel
density, g/cm3 6.82 7.09 6.84 7.11
locally endurable fully reversed fatigue
strength KtA(R = 1), N/mm2
283.4 345.6 340.1 406.0
locally endurable fatigue strength amplitude
at R = 0.1 KtA(R = 0.1), N/mm2
176.3 207.5 204.8 237.0
10
predicted load amplitude KtA(R = 0.1)/Q, N 594 700 691 799
measured fatigue strength amplitude at R =
0.1, 107 cycles and 50 % survival probability
527 793 662 743
measured/predicted 0.887 1.132 0.958 0.930
By and large, the predicted tooth root bending strengths lie within 10 % around the measured strength
data. In the case of the Atomet 4901 steel the scatter is too high and the deviations are a little larger. We
attribute this to experimental measuring errors due to inadvertence because the strength differences are
much larger than expected from the density differences and also the comparison with the Distaloy steel
yields unsystematic strength ratios. Usually, at comparable densities, the fatigue performance of slowly
cooled 1.5 Mo steel should be slightly inferior to the Distaloy steel by a more or less constant factor.
SUMMARY
A simple analytical concept has been developed for two common medium strength porous sintered steels
which seems to have the potential to predict the constant amplitude fatigue strength of real components
directly from results obtained from bar shaped notched and unnotched laboratory specimens. Background
is a density modified three parameter Weibull distribution at a constant survival probability of p = exp(1)
0.368 to describe the dependence of the fully reversed fatigue strength on the highly loaded volume. In
order to take static mean stresses into account, a synthetic Haigh diagram applicable to both steels has
been established. The necessary data input comprises
- the highly loaded volume V90 defined as the volume, surrounding a positive stress peak, exposed to
at least 90 % of the maximum first principal stress Imax
- the load transfer coefficient Q as quotient from Imax and the corresponding service load
- the local density in the zone of the stress peak and the full density 0 of the alloy
- four material characterizing constants, A0, A0ref, 1/n and m, to describe the fully reversed fatigue
strength as depending on density, specimen or component size, loading mode and stress
concentrations
- the functions K(R) and q(R), which are also material specific, to convert fully reversed fatigue
strength amplitudes to stress ratios R ≠ 1
V90 and Q must be obtained from fine meshed FEA submodels, while the material specific parameters
must be obtained experimentally from specimens of simple shape.
The comparison between experimental and predicted fatigue strengths is straightforward and simple if the
material characteristics are available. So far only a few components have been investigated to test the
method suggested here. The first results are, however, very encouraging.
ACKNOWLEGEMENTS
This work was supported by Fachverband Pulvermetallurgie FPM and partially financed by Stiftung
Stahlanwendungsforschung under Project Numbers AVIF A253 and AVIF A270. The powders were
contributed by Höganäs AB and by Rio Tinto Iron & Titanium GmbH. The injector clamps were
compacted and sintered by AMES SA in Barcelona, the spur gears were compacted by Höganäs AB and
sintered by GKN Sinter Metals Engineering in Radevormwald. All this help is gratefully acknowledged.
REFERENCES
1. P. Beiss, A. Zafari, K. Lipp, J. Baumgartner: Fatigue Behavior of a Sintered Steel Containing 4 %
Ni, 1.5 % Cu, 0.5 % Mo and 0.6 % C; Int. J. Powder Metall. 48 (2012) 1, p. 19-34
11
2. A. Zafari, P. Beiss, C. Broeckmann, K. Lipp: Assessing the Fatigue Strength of a Sintered Steel as
Affected by the Highly Stressed Volume; Proc. Euro PM 2011, Barcelona, Vol. 1, p. 15-20;
EPMA, Shrewsbury, 2011
3. S. Keusemann, C. Broeckmann, P. Beiss: A Synthetic Haigh Diagram for Structural Sintered
Steels; Proc. CD 2012 PM World Congr. Yokohama, paper no. 16 A - T9-5; JSPM, Tokyo, 2013
4. D. Amos, P. Delarbre, K. Lipp, H. Kaufmann: Reliable Component Fatigue Design Applying
Appropriate Cyclic Properties; Proc. 2010 PM World Congr. Florence, Vol. 3, p. 301-308;
EPMA, Shrewsbury, 2010
12