Embed Size (px)
Citation preview
Component Unit Liquidity
FOR THE MONTH OF AUGUST 2019

2
DISCLAIMER This presentation was prepared and is being published by the Puerto Rico Fiscal Agency and Financial Advisory Authority (“AAFAF”) as part of its ongoing evaluation of financial matters of the Government of Puerto Rico, its public corporations and instrumentalities (collectively, the “Government”). Government creditors and other third parties should not rely on the information included in this presentation to purchase or sell any security or make any investment decision regarding securities issued by the Government. The amounts shown on this presentation are based on information obtained by AAFAF from governmental instrumentalities and financial institutions as of the dates indicated. AAFAF has not validated all of the information received and, as a result, cannot and does not assume any responsibility for the accuracy of such information. As additional information becomes available, there could be material changes to the information contained herein. This presentation contains certain “forward-looking” statements and information (including the liquidity projections set forth herein). These forward-looking statements are not guarantees of future performance and involve certain risks, uncertainties, estimates, expectations and assumptions by AAFAF and the Government that are difficult to predict, inherently uncertain and some of which are beyond the control of AAFAF and the Government. Information that subsequently becomes available may have a material impact on the liquidity projections set forth herein. Certain amounts shown in this presentation are for specific periods or as of specific dates. Cash flows and account balances are expected to change, potentially materially, on a day-to-day basis based on, among other things, the receipts and disbursements of funds by the Government, which can be affected by a number of factors, including judicial determinations. Any statement as to the restricted or unrestricted nature of any amounts is preliminary and subject to further analysis. The amounts shown in this presentation (including those related to the cash receipts, disbursements, accounts receivable, accounts payable and account balances) have not been confirmed through an audit conducted in accordance with generally accepted auditing standards, an examination of internal controls or other attestation or review services in accordance with standards established by the American Institute of Certified Public Accountants or any other organization. Accordingly, none of AAFAF, the Government, and each of their respective officers, directors, employees, agents, attorneys, advisors, members, partners or affiliates (collectively, with AAFAF and the Government, the “Parties”) express an opinion or any other form of assurance on the financial or other information contained in this presentation. The Parties make no representation or warranty, express or implied, to any third party with respect to the information contained in this presentation, and all Parties expressly disclaim any such representations or warranties. The Parties do not owe or accept any duty or responsibility to any reader or recipient of this presentation, whether in contract or tort, and shall not be liable for or in respect of any loss, damage (including without limitation consequential damages or lost profits) or expense of whatsoever nature of such third party that may be caused by, or alleged to be caused by, the use of this presentation or that is otherwise consequent upon the gaining of access to this document by such third party. Following Hurricane Maria, the systems and communications of some component units were adversely affected, which in turn affected the timing, reliability and integrity of information and data. Continuous efforts are being made to enhance data integrity progressively. This presentation may contain capitalized terms that are not defined herein, or may contain terms that are discussed in other documents or that are commonly understood. You should make no assumptions about the meaning of capitalized terms that are not defined, and you should consult with AAFAF should clarification be required. The Parties do not undertake any duty to update the information contained in this presentation. By receiving this document, the recipient shall be deemed to have acknowledged and agreed to the terms and limitations described in these disclaimers.

3
GLOSSARY
AAFAF Puerto Rico Fiscal Agency and Financial Advisory Authority.
Abriendo Caminos A 2018 infrastructure program to repair and maintaining island roads.
ACAA Automobile Accident Compensation Administration, an agency of the Commonwealth of Puerto Rico.
Act 22 Enacted in 2012 and known to “Promote the Relocation of Individual Investors to Puerto Rico,” Act No. 22 provides tax exemptions for investment income to eligible individuals who become residents of Puerto Rico.
Act 60 Puerto Rico Tax Incentives Code (Incentives Code), which consolidated dozens of tax decrees, incentives, subsidies, and tax benefits in a single statute.
Act 257 Act. No. 257 or Law 257 of December 10, 2018 amends several provisions of the Commonwealth's internal revenue code, which includes the implementation and enforcement of taxes from Video Lottery Terminals ("VLTs"). The law specifies the responsibility of the Puerto Rico Tourism Company ("PRTC") to regulate and monetize VLTs as they become legal.
ADEA Puerto Rico Administration for the Development of Agricultural Enterprises, a public corporation and a component unit of the Commonwealth of Puerto Rico.
AMA Metropolitan Autobus Authority.
A/P Accounts payable.
A/R Accounts receivable.
ASEM Puerto Rico Medical Services Administration, a public corporation and a component unit of the Commonwealth of Puerto Rico.
ASES Puerto Rico Health Insurance Administration, a public corporation and a component unit of the Commonwealth of Puerto Rico.
ASSMCA Administration of Mental Health and Anti-Addiction Services of Puerto Rico.
ATI Puerto Rico Integrated Transit Authority.
ATM Maritime Transportation Authority.
Bahía Urbana Waterfront Park in San Juan, Puerto Rico.
BBA Bi-Partisan Budget Act of 2018.
BDE Economic Development Bank of Puerto Rico.
CapEx Capital expenditures.
Cardio Cardiovascular Center of Puerto Rico and the Caribbean, a public corporation and a component unit of the Commonwealth of Puerto Rico.
CCDA Puerto Rico Convention Center District Authority, a public corporation and a component unit of the Commonwealth of Puerto Rico.
CDBG Community Development Block Grant – Disaster Recovery (CDBG – DR) is a program responsible to ensure decent affordable housing opportunities and provision of services, community assistance, and to expansion and conserve jobs.
CM Conway MacKenzie, Inc.
CMS Clinical Medical Services provides an Integrated Home Health Delivery System consisting of Durable Medical Equipment, Respiratory Equipment, Home Health, Orthotics, Prosthetics and Home Infusion Services.
Component Unit (CU) Public corporation of the Commonwealth of Puerto Rico.
COR3 Central Office of Recovery and Reconstruction of Puerto Rico.
Corporacion para la Promocion de Puerto Rico como Destino
Corporation for the Promotion of Puerto Rico, a destination marketing organization (DMO).
CRIM Center for the Collection of Municipal Revenues rendering fiscal services in favor of the Municipalities and has the responsibility to notify, assess, collect, receive and distribute the public funds from the property tax, the state subsidy, funds from the Electronic Lottery, and any other funds that are disposed by law for the benefit of the Municipalities of Puerto Rico.
CU See ‘Component unit.’
DDEC Puerto Rico Department of Economic Development and Commerce, a public corporation and a component unit of the Commonwealth of Puerto Rico.

4
Disaster-Related Disbursements
Expenditures related to the damages caused from hurricanes Irma and Maria.
Disaster-Related Receipts Federal emergency funds, insurance related to hurricanes Irma and Maria.
DMO Destination Marketing Organization.
DPO (Intergovernmental) Days Payable Outstanding [Intergovernmental Payables divided by trailing 12 months PayGo Charges plus Facilities/Rent Payments multiplied by 365].
DPO (Third Party) Days Payable Outstanding [Third Party Payables divided by trailing 12 months Operating Disbursements, not including Payroll Costs, PayGo, Christmas Bonus, or Facilities/Rent Payments multiplied by 365].
DSO (Intergovernmental) Days Sales Outstanding [Intergovernmental Receivables divided by trailing 12 months Intergovernmental Receipts multiplied by 365].
DSO (Third Party) Days Sales Outstanding [Third Party Receivables divided by trailing 12 months Third Party Receipts multiplied by 365].
DTOP Puerto Rico Department of Transportation and Public Works.
DTPR, Hacienda Puerto Rico Department of Treasury.
ERS Employees Retirement System of Puerto Rico.
FEMA Federal Emergency Management Agency coordinates the federal government’s role in preparing for, preventing, mitigating the effects of, responding to, and recovering from all domestic disasters, whether natural or man-made, including acts of terror.
FHWA Federal Highway Administration of Puerto Rico.
FOMB Financial Oversight and Management Board of Puerto Rico.
Fondo Puerto Rico State Insurance Fund Corporation, a public corporation and a component unit of the Commonwealth of Puerto Rico.
FTA The Federal Transit Administration provides financial and technical assistance to local public transit systems, including buses, subways, light rail, commuter rail, trolleys and ferries. FTA also oversees safety measures and helps develop next-generation technology research.
GDB Government Development Bank for Puerto Rico, a former government agency currently winding down operations under PROMESA.
General Fund The Commonwealth's principal operating fund.
HFA Puerto Rico Housing Finance Authority, a public corporation and a component unit of the Commonwealth of Puerto Rico.
HTA Puerto Rico Highways and Transportation Authority, a public corporation and a component unit of the Commonwealth of Puerto Rico.
HUD Department of Housing and Urban Development responsible for national policy and programs that address U.S. housing needs, improve and develop communities, and enforce fair housing laws.
Intergovernmental Receipts General fund appropriations to and funds transferred between public corporations and municipalities.
Invest Puerto Rico Nonprofit investment organization created by Act 13-2017 to promote Puerto Rico as a competitive investment jurisdiction to attract new business in order to drive economic development.
IXS Marketing contract through advertising company KOI IXS for Puerto Rico.
Liquidity Plan (LP) Projected cash flows for each component unit, based on their respective government FY19 Budget submission on September 7, 2018.
MCO Managed care organization.
MMIS Medicaid Management Information System.
MOU Memorandum of understanding; nonbinding yet formal agreement between two parties.
New Insurance Project A new business venture for Fondo in which the corporation is partnering with private insurers through a commission-based model to market and sell its products to potential new customers.
OCFO The office of the Chief Financial Officer of Puerto Rico.
OECI Office of Industrial Tax Exemption of Puerto Rico.
OGPE The Permit Management Office of Puerto Rico, established to facilitate and promote integral, economic, social and physical sustainable development of Puerto Rico through the issuance of permits, licenses, and other necessary authorizations.

5
Operating Disbursements Includes payroll and related costs, material and supplies, purchased services, professional services, donations, subsidies, transportation expenses, media ads, and other operating payments.
Operating Receipts Revenues collected from operations.
OPPEA Office of the Ombudsman for the Elderly; Oficina Del Procurador De Las Personas De Edad Avanzada of Puerto Rico.
Other Inflows Sales of toll tags, rental income, and impact fees.
Other Outflows Payments to suppliers from prior years.
Partial Task Appointees Fixed-term appointments granted to cover a position, or an unregulated position that entails the provision of services through an irregular schedule, depending on their classification as teaching staff or non-teaching staff. The permanence to the employees of the University of Puerto Rico is guaranteed.
PayGo Charges Puerto Rico pension system that is funded through a pay-as-you-go system pursuant to Act 106-2017. Retirement benefits expenses of covered government employers are paid by the central government and reimbursed by the employers, with such funds received by the TSA.
PBA Puerto Rico Public Buildings Authority, a public corporation and a component unit of the Commonwealth of Puerto Rico.
PBM Pharmacy Benefit Manager in Puerto Rico.
Permanent Appointees Appointments granted to cover a position, or regular position approved in the budget, after the incumbent has satisfactorily complied the period of probationary work.
PHA Public Housing Administration, a public corporation and a component unit of the Commonwealth of Puerto Rico.
Platino Medicaid + Medicare dual-eligible populations.
Ports Puerto Rico Ports Authority, a public corporation and a component unit of the Commonwealth of Puerto Rico.
PRIDCO Puerto Rico Industrial Development Company, a government-owned corporation dedicated to promoting Puerto Rico as an investment destination for companies and industries worldwide.
PRITA, ATI Puerto Rico Integrated Transit Authority, a public corporation and a component unit of the Commonwealth of Puerto Rico.
Probationary Appointees Appointments initially granted to cover a position, or a position approved in the budget for a fixed duration in accordance with the provisions of the General Rules of UPR. During the appointment period, the appointee will be subjected to evaluation to determine, if at the end of the probationary period, he/she will be retained for a permanent appointment.
PROMESA The Puerto Rico Oversight, Management, and Economic Stability Act (PROMESA) is a 2016 US federal law that established an oversight board, a process for restructuring debt, and expedited procedures for approving critical infrastructure projects in order to combat the Puerto Rican government-debt crisis.
PRTC The Puerto Rico Tourism Company, also referred to as “Tourism.”
Special Appointees Appointments granted to cover a position, or position paid with funds of extra university origin, whose recurrence is not guaranteed. The University authorities may consider the experience acquired by employees with this type of appointment, if they happen to occupy regular positions.
Substitute Appointees Appointments granted to university staff for a period not greater than twelve (12) months, to provisionally cover a position or regular position approved in the budget, while the incumbent in ownership thereof is in use of the license. This appointment must not be the prelude to a probationary or permanent appointment, unless this is achieved through the regular procedure that establishes the General Rules of UPR.
Temporary Appointees Appointments granted to cover a non-regular position or positions, which get approved for a fixed period no longer than twelve (12) months to meet the needs of special services, such as unforeseen and occasional increases in the volume of the work.
Tourism Tourism Company of Puerto Rico, a public corporation and a component unit of the Commonwealth of Puerto Rico, also referred to as “PRTC.”
Trust Position Appointments that extend to university personnel denominated of trust in Chapter VIII, Article 71 of the General Rules of UPR. The positions of trust will be of free selection and removal in regard to the positions or posts thus classified; but will retain the rights acquired by virtue of some previous regular appointment in the System.

6
TSA TSA (continued)
Treasury Single Account, the Commonwealth’s main operational bank account (concentration account) in which a majority of receipts from Governmental funds are deposited and from which most expenses are disbursed. TSA receipts include tax collections, charges for services, intergovernmental collections, the proceeds of short- and long-term debt issuances and amounts held in custody by the Secretary of the Treasury for the benefit of the Commonwealth’s fiduciary funds. A portion of the revenues collected through the TSA corresponds to the General fund. Other revenues include federal funds and special revenues conditionally assigned by law to certain agencies or public corporations that flow through the TSA.
TTM Trailing twelve months.
UDH Hospital Universitario, a hospital affiliated with UPR and part of the Department of Health.
UPR University of Puerto Rico, a public corporation and a component unit of the Commonwealth of Puerto Rico.
VLT Video Lottery Terminals in Puerto Rico located outside of casinos.
VTP Voluntary Transition Program, as established by AAFAF Administrative Orders 2017-05, 2018-03, 2018-04, 2018-05, 2018-06, and 2018-13.
WIC Special supplemental health program for women (pregnant and postpartum mothers), infants, and children up to the age of 5 in Puerto Rico.
WIOA The Workforce Innovation and Opportunity Act is a United States public law that replaced the previous Workforce Investment Act of 1998 as the primary federal workforce development legislation to bring about increased coordination among federal workforce development and related programs.

7
INTRODUCTION
AAFAF has been compiling financial information from selected public corporations of the Commonwealth of Puerto Rico that are component units (“CU”) for financial reporting purposes, as part of AAFAF’s evaluation of the liquidity of the Government of Puerto Rico and its public corporations.
This report is for the month of August 2019, and presents information with respect to 19 select CUs. Fiscal Year 2020 (“FY20”) Liquidity Plans for 18 CUs1 are still in development, and draft plans are a part of this Aug-19 report.
Each of the CUs has reported actual cash flow information for the month of August 2019. Section “A” of this report for each CU provides year-to-date (“YTD”) actual information, as well as the CU’s draft Liquidity Plan for the balance of fiscal year 20202. Analysis in section “A” includes details on actual receipts and expenses for August 20191, and where relevant, a year-over-year comparison to Aug-18 results.
The forecasts contain projections of cash receipts, cash disbursements, and CapEx. Cash receipts include revenues collected from operations; intergovernmental receipts – general fund appropriations and other transfers from Central Government, municipalities, and public corporations; disaster relief receipts – federal emergency funds, insurance proceeds related to Hurricanes Irma and Maria, and other federal funds. Cash disbursements include operating payments – e.g. payroll and related costs, PayGo charges, purchased services, professional services, transportation expenses, and disaster relief disbursements – e.g. expenditures related to the damages caused from Hurricanes Irma and Maria.
The CUs are also expected to report monthly headcount figures in order to monitor changes in staff levels and their actual and projected effects on payroll costs. This information is presented in the document under section “B” for each CU.
A Full Year FY19 Sources and Uses of Funds is provided to allow readers to bridge the beginning cash balance as of July 1, 2018 and forecasted ending cash at August 30, 2019. This information is presented in the document under section “C” for each CU. For the balance of the fiscal year, there is a forecast provided for each CU taking into consideration timing and permanent variances, based on conversations with CU finance and accounting leaders.
This report also contains pertinent working capital information for the CUs. Where available, the CUs have provided monthly information on Accounts Payable and Accounts Receivable. Figures are unaudited and subject to change. This information is presented in the document under section “D” for each CU.
The report contains two Appendix items. The first of these Appendix items (Appendix A) is a cash reconciliation. A bridge is provided between the actual cash data provided by the CUs as of August 30, 2019 and the August 2019 AAFAF reported figures as of close of business on August 31, 2019 represented in the “Summary of Bank Account Balances for the Government of Puerto Rico and its Instrumentalities,” which was released on August 31, 2019. The second Appendix (Appendix B) item is a consolidated view of CU headcount and payroll information, which is based on information provided by CU management.
1 No Liquidity Plan will be prepared for COR3 for FY20, as it acts as a pass-through entity and does not disburse nor transfer out funds prior to having these transferred
in from FEMA. 2 For 18 of the 19 CUs references to August 2019 in this report refer to the period of July 27, 2019 through August 30, 2019, when the CUs performed their monthly cut
off for cash flow reporting purposes. UPR is reporting based off of the calendar month, therefore the period is August 1, 2019 through August 31, 2019.

8
TABLE OF CONTENTS
Executive Summary 9 Summary of Reporting by Component Unit 10 Individual Component Unit Reports 11
I. 11 Puerto Rico Ports Authority (“Ports”) 10
II. 13 Medical Services Administration (“ASEM”) 12
III. 15 Puerto Rico Integrated Transit Authority (“PRITA”) 14
IV. 17 Puerto Rico State Insurance Fund Corporation (“Fondo”) 16
V. 19 Health Insurance Administration (“ASES”) 18
VI. 21 Puerto Rico Highways and Transportation Authority (“HTA”) 20
VII. 23 Puerto Rico Public Buildings Authority (“PBA”) 22
VIII. 25 Cardiovascular Center of Puerto Rico and the Caribbean (“Cardio”) 24
IX. 27 Puerto Rico Industrial Development Corporation (“PRIDCO”) 26
X. 29 Puerto Rico Housing Finance Authority (“HFA”) 28
XI. 31 Tourism Company of Puerto Rico (“Tourism”) 30
XII. 33 Fiscal Agency and Financial Advisory Authority (“AAFAF”) 32
XIII. 35 Department of Economic Development and Commerce (“DDEC”) 34
XIV. 37 Puerto Rico Convention Center District Authority (“CCDA”) 36
XV. 39 Puerto Rico Administration for the Development of Agricultural Enterprises (“ADEA”) 38
XVI. 41 Automobile Accident Compensation Administration (“ACAA”) 40
XVII. 43 Public Housing Administration (“PHA”) 42
XVIII. 45 Central Recovery & Reconstruction Office (“COR3”) 44
XIX. 47 University of Puerto Rico (“UPR”) 46
Appendix A: Reconciliation between reported figures by CU and Bank Account Balances Report 49
Appendix B: Headcount Summary 50

9
EXECUTIVE SUMMARY – OPERATING LIQUIDITY AS OF AUGUST 30, 2019
Millions of US Dollar
FY20 BEG. ACTUAL FY20 F'CAST
COMPONENT UNIT HIGHLIGHTS BALANCE 7/26/2019 (a) Y/E BALANCE (b)
PUERTO RICO PORTS AUTHORITY
("PORTS")
YTD liquidity at Ports increased by $0.7M as a result of positive operating performance, especially at
Ports' maritime operations. PayGo expenses represent a significant portion of disbursements. Ports
continues to make investments related to the Culebra ferryboat ramp repair project and Aguadilla
Airport. Additionally, Ports anticipates to receive an insurance settlement related to Hurricanes
Maria and Irma of $14.0M in November.
32.7 33.4 53.6
MEDICAL SERVICES ADMINISTRATION ("ASEM") Component Unit has not provided data for August 2019
PUERTO RICO INTEGRATED TRANSIT AUTHORITY
("PRITA")
YTD liquidity at PRITA decreased by ($3.3M) as a result of high operating expenses, in addition to a
reduction in intergovernmental support in this year's budget. PRITA continues to have significant
liquidity risk due to operating receipts being less than operating disbursements, requiring general
fund appropriations to support its public transportation services.
15.6 12.3 11.7
STATE INSURANCE FUND CORPORATION
("FONDO")
YTD liquidity has increased by $158.6M primarily due to $242.2M in premiums collections year-to-
date, the majority of which was collected in Jul-19 related to the 2nd invoicing period of FY19. The
cash build is also a result of lower-than-normal spend on operating expenses due to delayed
payments as a result of the implementation of a new automatic billing system. Fondo expects to
build cash throughout FY20 as premiums collections exceed forecasted disbursements.
177.5 336.1 392.8
HEALTH INSURANCE ADMINISTRATION ("ASES") Component Unit has not provided data for August 2019
HIGHWAYS AND TRANSPORTATION AUTHORITY
("HTA")
YTD liquidity at HTA decreased by ($49.4M) primarily related to a delay in receipt of general fund
appropriations, now expected to begin in the latter part of Q1. Full year projected decrease in
liquidity is related to a reduction in central government funding for this year's budget.
303.8 254.4 24.3
PUERTO RICO PUBLIC BUILDINGS AUTHORITY
("PBA")
YTD liquidity at PBA decreased by ($14.8M) given PBA's receipts were limited YTD Aug-19. PBA
typically receives the first transfer from Hacienda for government entity rents in the third month of
the fiscal year. As such, cash flow for Sep-19 will depend heavily on start of the Haciends transfers.
70.7 55.9 66.8
CARDIOVASCULAR CENTER OF PUERTO RICO
AND THE CARIBBEAN ("CARDIO")Component Unit has not provided data for August 2019
PUERTO RICO INDUSTRIAL DEVELOPMENT
COMPANY ("PRIDCO")
YTD liquidity has reduced to $149.6M to end the month. Beginning cash balance for FY20 has
retroactively increased month over month due to the inclusion of additional bank accounts to the
cash flow forecast. Additionally, rental receipts have stayed consistent when comparing YTD in the
prior fiscal year, and have been sufficient for supporting general operating expenditures; however,
during the month of August PRIDCO made a $7.3M PayGo disbursement which has reduced its
current outstanding debt balance, in part, that has been carried historically.
158.4 149.6 164.8
HOUSING FINANCE AUTHORITY
("HFA")Component Unit has not provided data for August 2019
PUERTO RICO TOURISM COMPANY
("TOURISM")
YTD liquidity has decreased due to paydowns on prior year payables including room tax debts and
final amounts associated with prior years’ marketing contracts. Despite this, Tourism expects to
build cash throughout FY20 through continued performance of slot machine and room tax
operations.
48.7 43.3 53.1
FISCAL AGENCY AND FINANCIAL ADVISORY
AUTHORITY ("AAFAF")
YTD liquidity has increased due to fewer professional service payments than expected. In particular,
AAFAF has yet to make a payment pertaining to Title III fees, but has received an appropriation for
the first two months of the fiscal year.
57.6 69.5 58.3
DEPARTMENT OF ECONOMIC DEVELOPMENT
AND COMMERCE ("DDEC")
YTD liquidity has decreased due to increased payroll and related costs as a result of the DDEC
consolidation; however, this is the result of timing as receipts are expected increase in the coming
months to reverse the current trend of negative cash flow.
24.7 20.5 34.5
CONVENTION CENTER DISTRICT AUTHORITY
("CCDA")
YTD liquidity has increased due to a steady schedule of events taking place at the venues, yielding
consistent operating receipts. In addition, the Puerto Rico Tourism Company has made a $1.1M and a
$1.5M transfer YTD to catch up on prior fiscal year cash owed to CCDA, which has offset
expenditures.
8.1 8.8 8.1
PUERTO RICO AGRICULTURAL DEVELOPMENT
ADMINISTRATION ("ADEA")
YTD liquidity at ADEA increased $1.4M primarily related slower than anticipated disbursments of
subsidies and incentivesm, offset by operating expenses for the school cafeteria program, the
coffee market making program, and rural infrastructure spending.
66.8 68.2 72.4
AUTOMOBILE ACCIDENT COMPENSATION
ADMINISTRATION ("ACAA")
YTD liquidity has decreased due to ACAA not receiving any insurance premiums during the month of
July. Ordinary disbursements relating to payroll, insurance claims, and past-due PayGo were the
largest contributors for the decline in liquidity; however, liquidity position is expected to reverse as
prior month's collection are received in the coming months.
20.2 17.5 17.6
PUBLIC HOUSING ADMINISTRATION (“PHA”) Component Unit has not provided data for August 2019
CENTRAL RECOVERY & RECONSTRUCTION
OFFICE (“COR3”)
COR3 disbursed $2.7B in federal funds during FY19, and disbursed $121.5M though August of FY20.
The disbursements should continue to flow as the various instrumentalities and municipalities
continue to be reimbursed by FEMA for expenses incurred in recovery and reconstruction efforts
following hurricanes Irma and Maria.
91.8 95.6 N/A
UNIVERISTY OF PUERTO RICO ("UPR")
Through August-19, UPR generated $5.7M (after debt) in positive net cash flow and ended the month
with a cash balance of $319.0M. The cash increase is mostly due lower than projected scholarship
and donations, vendor payments, and capital expenditures outflows while operating receipts
remain relatively flat YTD.
313.3 319.0 313.3
---------------------------------------------------------------------------------------------------------------------------------------------------------------------------------------------------------------------------------------------------------------------------------------------------------------------------------
Notes:
(a) For 18 of the 19 CUs July month end actual balances were taken as of the last Friday of the month, or August 30, 2019. For UPR the reporting period is the end of the calendar month, or August 31, 2019.

10
SUMMARY – REPORTING COMPLIANCE FOR COMPONENT UNITS Each of the Component Units provided data for the month of August 2019. Data was broken into four sections, and included: A. Liquidity information, B. Headcount information, C. Sources / Uses of Funds, and D. Working Capital information. The 19 CUs included in this report were overall 73.7% compliant in providing data for: A. Liquidity and C. Sources / Uses. The 19 CUs included were overall 78.9% compliant in providing data for B. Headcount, and 66.7% compliant in providing data for D. Working Capital. CUs that provided insufficient information for reporting are mentioned in note (a) below.
Notes: (a) Liquidity and Sources/Uses data is missing for the following CU:
ASEM, ASES, Cardio, HFA, and PHA.
(b) Headcount data is missing for the following CU: ASEM, ASES, Cardio, and HFA.
(c) Working Capital data is missing for the following CU: ASEM, ASES, Cardio, HFA, ACAA, and PHA.
11
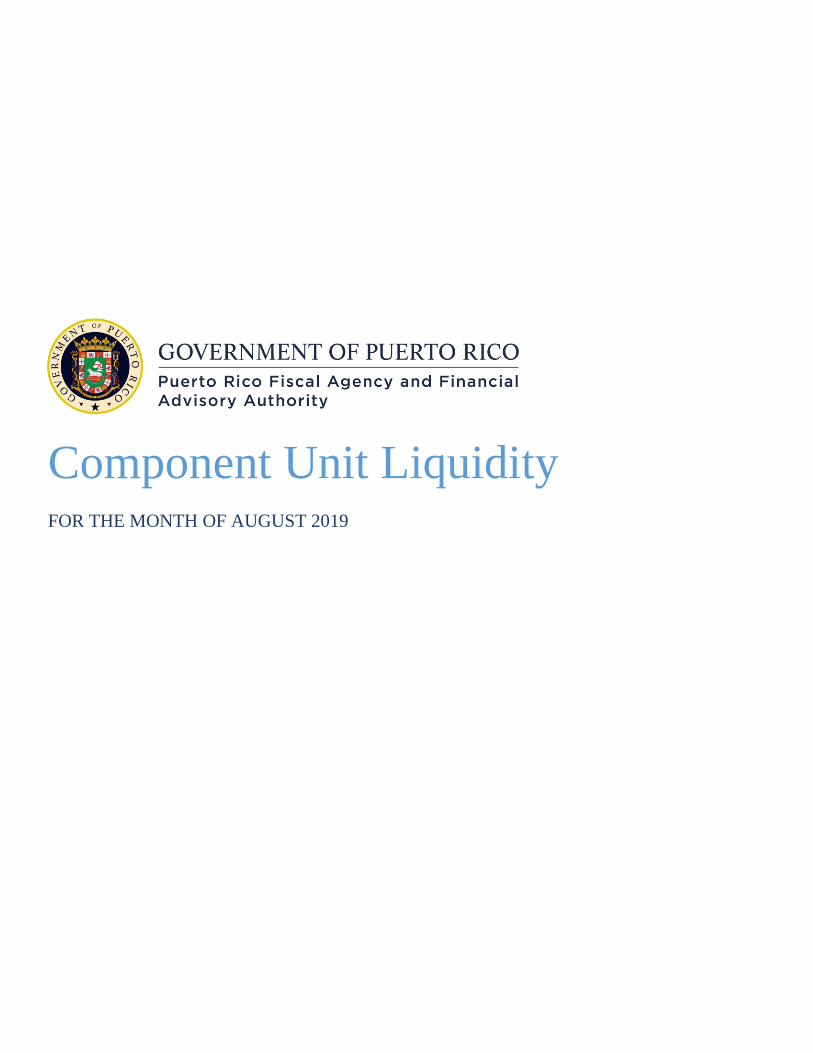
I. PUERTO RICO PORTS AUTHORITY (“Ports”) Primary Business Activity: The Puerto Rico Ports Authority is responsible for developing, improving, and administering all types of transportation facilities and air and sea services, as well as establishing and managing maritime collective transportation systems in, from, and to Puerto Rico. Key Takeaways: YTD Puerto Rico Ports Authority receipts are higher than the same period the previous year due to improved cruise ship and maritime cargo traffic. Airport receipts are lower as compared to last year due to timing. For this period, Ports has generated $0.7M in positive net cash flow, which increases its cash balance to $33.4M. Ports projects to end FY20 with $53.6M in cash. A. FY20 Operating Liquidity – Actuals3 and Draft FY20
Liquidity Plan 1. $0.7M YTD actuals:
a. $13.8M in YTD August receipts related to maritime operations, which is $1.5M higher than the same period the previous year due to improved cargo traffic and passenger volume.
b. $2.2M in YTD August receipts related to airport operations, which is $1.0M lower than the same period the previous year due to timing, which is expected to reverse.
c. $1.5M in other receipts, primarily related to federal funds for CapEx programs.
d. ($4.1M) in payroll expenses, which is ($0.2M) lower than the same period the previous year due to reduced headcount and benefits.
e. ($4.2M) in PayGo payments, which is $2.2M higher this year than last year due to timing.
f. ($2.4M) in professional services, primarily related to scanning of freight containers inbound at port terminals ($1.2M), and ($0.7M) in security at maritime and airport facilities.
g. ($2.0M) in facility payments, primarily related to PRASA ($1.0M) and PREPA ($0.9M). h. ($2.6M) in CapEx primarily related to the Culebra ferryboat ramp repair project and Aguadilla Airport. i. ($1.5M) in other expenses.
2. $20.2M cash build for the balance of the fiscal year based on the draft FY20 Liquidity Plan: a. $102.6M in forecast total receipts driven by $68.2M maritime operations, $16.7M airport operations including an estimated
$6.0M fee from Aerostar for the Luis Muñoz Marin Airport, $3.7M in federal grant and other receipts, and $14.0M in insurance payments.
b. ($82.4M) in forecast total disbursements driven by ($19.2M) in payroll, ($20.9M) in PayGo, ($16.9M) in CapEx, and ($25.4M) in other operating disbursements.
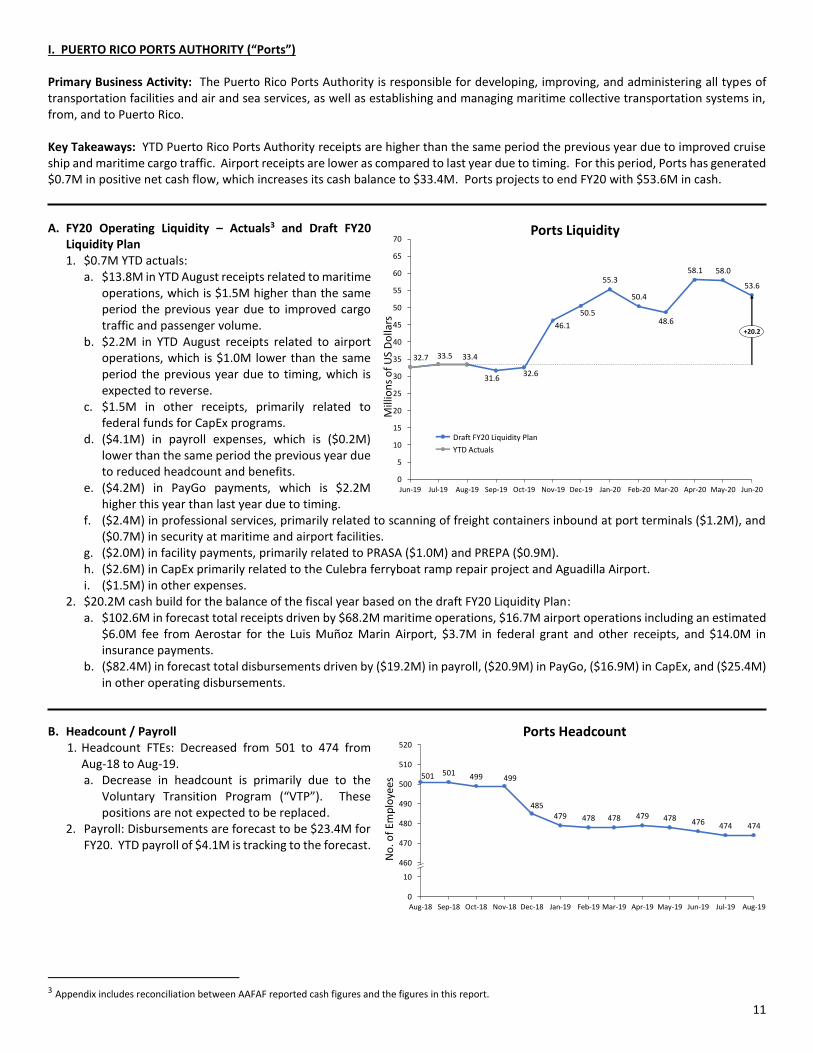
B. Headcount / Payroll
1. Headcount FTEs: Decreased from 501 to 474 from Aug-18 to Aug-19. a. Decrease in headcount is primarily due to the
Voluntary Transition Program (“VTP”). These positions are not expected to be replaced.
2. Payroll: Disbursements are forecast to be $23.4M for FY20. YTD payroll of $4.1M is tracking to the forecast.
3 Appendix includes reconciliation between AAFAF reported cash figures and the figures in this report.
Mar-19
510
Dec-18 Feb-19Aug-18 Sep-18 Oct-18 May-19Jan-19
520
Apr-19
490
Jun-190
10
480
470
500
Nov-18 Jul-19
460
Aug-19
478 479476478
501
474479
501
478474
499
485
499
Ports Headcount
No
. of
Emp
loye
es
45
60
Sep-19
20
Jul-19
65
Jun-19 Apr-20 Jun-20May-20Aug-19
50
Oct-19 Dec-19
70
Nov-19 Feb-20
10
Mar-20Jan-200
5
15
55
25
30
35
40
50.4
50.5
32.7
46.1
58.0
33.5
31.6
58.1
32.6
55.3
48.6
53.6
33.4
+20.2
Draft FY20 Liquidity Plan
YTD Actuals
Ports Liquidity
Mill
ion
s o
f U
S D
olla
rs
12
I. PUERTO RICO PORTS AUTHORITY (“Ports”) (Continued) C. Full Year FY20 Sources and Uses of Funds
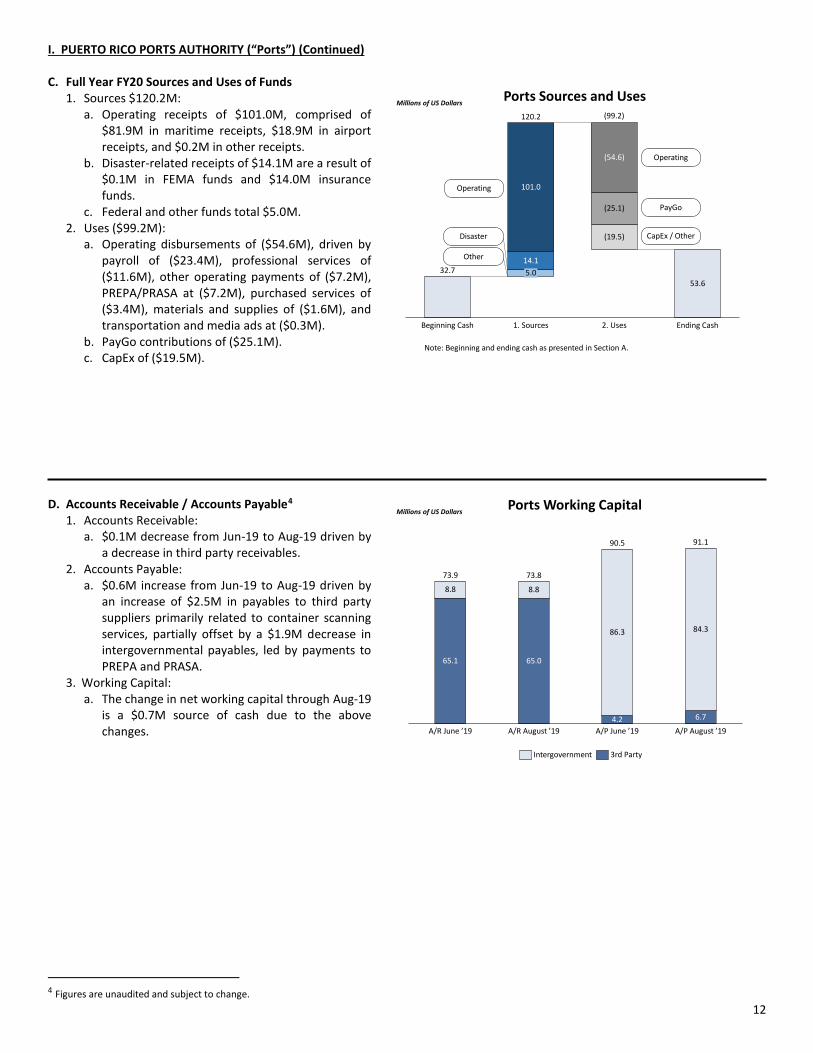
1. Sources $120.2M: a. Operating receipts of $101.0M, comprised of
$81.9M in maritime receipts, $18.9M in airport receipts, and $0.2M in other receipts.
b. Disaster-related receipts of $14.1M are a result of $0.1M in FEMA funds and $14.0M insurance funds.
c. Federal and other funds total $5.0M. 2. Uses ($99.2M):
a. Operating disbursements of ($54.6M), driven by payroll of ($23.4M), professional services of ($11.6M), other operating payments of ($7.2M), PREPA/PRASA at ($7.2M), purchased services of ($3.4M), materials and supplies of ($1.6M), and transportation and media ads at ($0.3M).
b. PayGo contributions of ($25.1M). c. CapEx of ($19.5M).
D. Accounts Receivable / Accounts Payable4
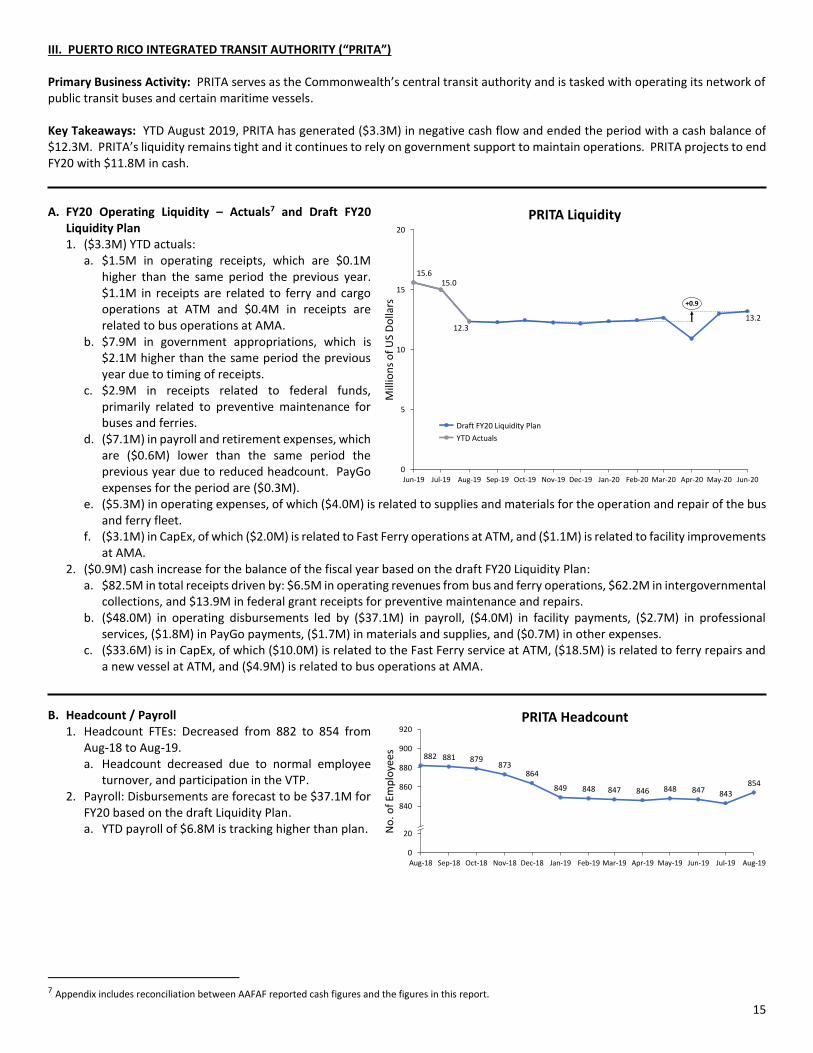
1. Accounts Receivable: a. $0.1M decrease from Jun-19 to Aug-19 driven by
a decrease in third party receivables. 2. Accounts Payable:
a. $0.6M increase from Jun-19 to Aug-19 driven by an increase of $2.5M in payables to third party suppliers primarily related to container scanning services, partially offset by a $1.9M decrease in intergovernmental payables, led by payments to PREPA and PRASA.
3. Working Capital: a. The change in net working capital through Aug-19
is a $0.7M source of cash due to the above changes.
4 Figures are unaudited and subject to change.
(19.5)
101.0
14.1
Beginning Cash
5.0
1. Sources
(54.6)
(25.1)
2. Uses
53.6
Ending Cash
32.7
120.2
Disaster
Other
CapEx / Other
Note: Beginning and ending cash as presented in Section A.
PayGo
Ports Sources and Uses
Operating
Operating
Millions of US Dollars
(99.2)
65.1
73.9
A/R August ’19
8.8
A/R June ’19
73.8
8.8
65.0
86.3
4.2
A/P June ’19
84.3
6.7
A/P August ’19
90.5 91.1
Intergovernment 3rd Party
Ports Working CapitalMillions of US Dollars

13
II. MEDICAL SERVICES ADMINISTRATION (“ASEM”) Primary Business Activity: ASEM plans, organizes, operates, and administers centralized health services, provided in support of the hospital and other functions, offered to member institutions and users of the medical complex, the Puerto Rico Medical Center. Key Takeaways: Information not available. A. FY20 Operating Liquidity – Actuals5 and Draft FY20 Liquidity Plan
1. Information not available. B. Headcount / Payroll
1. Information not available.
5 Appendix includes reconciliation between AAFAF reported cash figures and the figures in this report.

14
II. MEDICAL SERVICES ADMINISTRATION (“ASEM”) (Continued) C. Full Year FY20 Sources and Uses of Funds
1. Information not available. D. Accounts Receivable / Accounts Payable6
1. Information not available.
6 Figures are unaudited and subject to change.
15
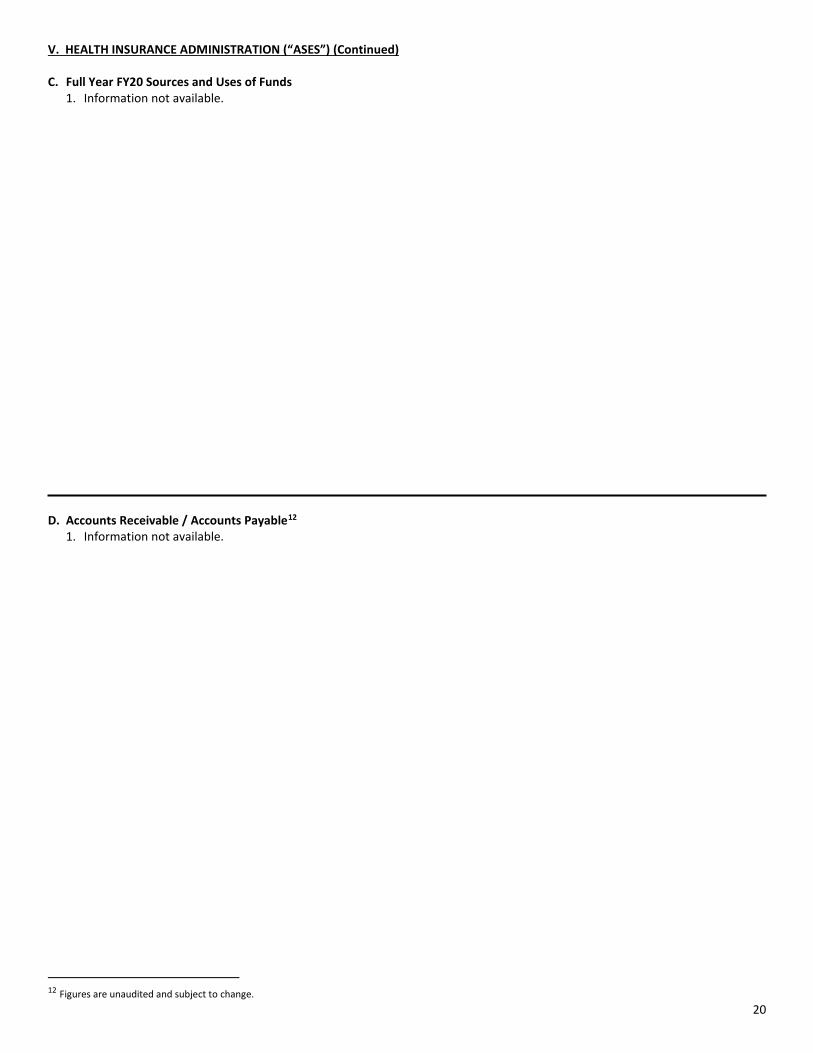
III. PUERTO RICO INTEGRATED TRANSIT AUTHORITY (“PRITA”) Primary Business Activity: PRITA serves as the Commonwealth’s central transit authority and is tasked with operating its network of public transit buses and certain maritime vessels. Key Takeaways: YTD August 2019, PRITA has generated ($3.3M) in negative cash flow and ended the period with a cash balance of $12.3M. PRITA’s liquidity remains tight and it continues to rely on government support to maintain operations. PRITA projects to end FY20 with $11.8M in cash. A. FY20 Operating Liquidity – Actuals7 and Draft FY20
Liquidity Plan 1. ($3.3M) YTD actuals:
a. $1.5M in operating receipts, which are $0.1M higher than the same period the previous year. $1.1M in receipts are related to ferry and cargo operations at ATM and $0.4M in receipts are related to bus operations at AMA.
b. $7.9M in government appropriations, which is $2.1M higher than the same period the previous year due to timing of receipts.
c. $2.9M in receipts related to federal funds, primarily related to preventive maintenance for buses and ferries.
d. ($7.1M) in payroll and retirement expenses, which are ($0.6M) lower than the same period the previous year due to reduced headcount. PayGo expenses for the period are ($0.3M).
e. ($5.3M) in operating expenses, of which ($4.0M) is related to supplies and materials for the operation and repair of the bus and ferry fleet.
f. ($3.1M) in CapEx, of which ($2.0M) is related to Fast Ferry operations at ATM, and ($1.1M) is related to facility improvements at AMA.
2. ($0.9M) cash increase for the balance of the fiscal year based on the draft FY20 Liquidity Plan: a. $82.5M in total receipts driven by: $6.5M in operating revenues from bus and ferry operations, $62.2M in intergovernmental
collections, and $13.9M in federal grant receipts for preventive maintenance and repairs. b. ($48.0M) in operating disbursements led by ($37.1M) in payroll, ($4.0M) in facility payments, ($2.7M) in professional
services, ($1.8M) in PayGo payments, ($1.7M) in materials and supplies, and ($0.7M) in other expenses. c. ($33.6M) is in CapEx, of which ($10.0M) is related to the Fast Ferry service at ATM, ($18.5M) is related to ferry repairs and
a new vessel at ATM, and ($4.9M) is related to bus operations at AMA. B. Headcount / Payroll
1. Headcount FTEs: Decreased from 882 to 854 from Aug-18 to Aug-19. a. Headcount decreased due to normal employee
turnover, and participation in the VTP. 2. Payroll: Disbursements are forecast to be $37.1M for
FY20 based on the draft Liquidity Plan. a. YTD payroll of $6.8M is tracking higher than plan.
7 Appendix includes reconciliation between AAFAF reported cash figures and the figures in this report.
Jan-19Oct-18 May-19
840
Apr-19Nov-18Aug-18 Sep-18 Jun-19
20
0Mar-19 Jul-19
860
Aug-19
880
Feb-19
900
Dec-18
920
849
882 879
864
847 846 848
873
843854
881
848 847
PRITA Headcount
No
. of
Emp
loye
es
Jun-19 Jul-19 Feb-20
5
Aug-19 Oct-19 Mar-20Jan-20Dec-19 Apr-20 May-20 Jun-20Nov-190
10
15
20
Sep-19
15.615.0
12.313.2
+0.9
YTD Actuals
Draft FY20 Liquidity Plan
PRITA Liquidity
Mill
ion
s o
f U
S D
olla
rs

16
III. PUERTO RICO INTEGRATED TRANSIT AUTHORITY (“PRITA”) (Continued) C. Full Year FY20 Sources and Uses of Funds
1. Sources $93.4M: a. Operating receipts of $8.0M, composed primarily
of $4.6M for ferries/cargo, $3.0M in bus fares, and $0.4M in miscellaneous receipts.
b. Intergovernmental receipts of $70.0M, with $28.4M in appropriations based on the amount of cigarette taxes, $13.0M from General Fund appropriations, and $28.6M from a special government appropriation earmarked for CapEx and the Fast Ferry service at ATM.
c. FTA federal fund grants of $15.4M. 2. Uses ($97.2M):
a. Operating disbursements total ($58.4M), of which payroll is ($44.0M), materials and supplies are ($5.7M), purchased services are ($3.1M), facilities for payments to public services are ($4.2M), and other at ($1.4M).
b. PayGo is ($2.1M). c. CapEx is projected to be ($36.7M), with YTD spend of $3.1M.
D. Accounts Receivable / Accounts Payable8
1. Accounts Receivable: a. $0.2M increase from Jun-19 to Aug-19 driven by
an increase in third party receivables at ATM. 2. Accounts Payable:
a. $1.3M net increase from Jun-19 to Aug-19 driven by a $2.0M increase in payables at AMA, partially offset by a ($0.7M) decrease in payables at ATM.
3. Working Capital: a. The change in net working capital through Aug-19
is a positive $1.1M due to the above changes.
8 Figures are unaudited and subject to change.
(2.1)
15.615.4
70.0
Beginning Cash
8.0
1. Sources
(58.4)
(36.7)
2. Uses
11.7
Ending Cash
93.4
CapEx / Other
PRITA Sources and Uses
Note: Beginning and ending cash as presented in Section A.
Millions of US Dollars
Operating
Operating
Intergovernmental Receipts
PayGo
Federal Funds
(97.2)
4.8
A/R June ’19 A/R August ’19
4.80.6 0.8
121.5
12.5
A/P June ’19
122.1
13.2
A/P August ’19
5.4 5.6
134.0 135.3
Intergovernment 3rd Party
PRITA Working CapitalMillions of US Dollars

17
IV. PUERTO RICO STATE INSURANCE FUND CORPORATION (“Fondo”) Primary Business Activity: Fondo provides workers’ compensation and disability insurance to public and private employees. Fondo is the only authorized workers’ compensation insurance company on the Island. Both public and private companies must obtain this security for their workforces by law. Key Takeaways: YTD, cash has increased from $177.5M to $336.1M. The cash build of $158.6M is primarily due to $242.2M in premiums collections year to date, the majority of which was collected in Jul-19. Premium collections are seasonal, and the majority of collections occur in July and January of each fiscal year, as the biannual invoices become due. A. FY20 Operating Liquidity – Actuals9 and Draft FY20
Liquidity Plan 1. $158.6M YTD actuals:
a. Premiums collections are $242.2M, which are favorable when compared to the prior year.
b. Payroll and related costs are ($33.8M), which are in line with the prior year.
c. PayGo retirement contributions are ($15.7M). d. Total non-payroll related operating disbursements
are ($34.2M), including: claims-related disbursements of ($11.5M); medical supplies and services disbursements of ($13.2M); contributions to other Gov’t entities of ($7.2M); and other operating disbursements of ($2.3M). Disbursements are anticipated to increase as unrecorded invoices are inputted into Fondo’s new automatic billing system and subsequent payments are made. Per management, outstanding data entries and reconciliations will be finalized over the next couple of months.
2. $56.9M cash build for the balance of the fiscal year based on the draft FY20 Liquidity Plan: a. Cash build is driven by increased premiums collections forecast in the Fiscal Plan relative to prior years, and lower projected
spend in the Certified Budget/Liquidity Plan. b. Higher-than-anticipated payroll-related and medical services costs in the Certified Budget/Liquidity Plan may reduce the
projected cash build due to both current run rates and unrecorded invoices resulting from the new systems implementation.
B. Headcount / Payroll 1. Headcount FTEs: Decreased from 2,858 to 2,702 from
Aug-18 to Aug-19. a. The decline in headcount is mostly due to 120+
employees entering the voluntary transition program in FY19. The remaining decline is due to normal turnover.
2. Payroll: Disbursements are forecast to be ($180.8M) for FY20. YTD payroll is ($33.8M). a. Current monthly run rate of ($16.9M) slightly
higher than the Certified Budget/Liquidity Plan payroll estimate, and not expected to reverse in FY20.
9 Appendix includes reconciliation between AAFAF reported cash figures and the figures in this report.
Mar-19
50
2,750
May-19 Jun-190
100
Apr-19
2,800
2,600
2,650
2,700
2,850
150
2,900
Aug-18
2,950
Sep-18
3,000
Oct-18
3,050
Dec-18 Jul-19 Aug-19
2,550
Nov-18 Jan-19 Feb-19
2,718
2,714
2,712
2,712 2,708 2,702
2,852
2,756
2,8582,844
2,717
2,714
2,765
Fondo Headcount
No
. of
Emp
loye
es
450
Sep-19Aug-19 Oct-19 Nov-19 Dec-19
240
0Jan-20 Mar-20Feb-20
180
Apr-20
420
May-20 Jun-20Jul-19
30
60
90
120
Jun-19
150
210
270
360
330
390
480
300
336.1
177.5
392.8
291.1
-14%
Draft FY20 Liquidity Plan
YTD Actuals
Fondo Liquidity
Mill
ion
s o
f U
S D
olla
rs

18
IV. PUERTO RICO STATE INSURANCE FUND CORPORATION (“Fondo”) (Continued) C. Full Year FY20 Sources and Uses of Funds
1. Sources $670.3M: a. Premium collections account for $669.1M of
operating receipts and are impacted by seasonality. The two primary invoice and collection periods are July and January of each fiscal year.
b. Other receipts total $1.2M pertain mostly to interest earnings.
2. Uses ($455M): a. Operating expenses total ($357.5M), of which
payroll is ($180.8M) and claims-related disbursements are ($59.9M). Excluding these two expenses, the majority of Fondo’s operating expenses consist of: payments made to other government entities as determined by laws, purchased services, and material and supplies expenses pertaining to medical services, equipment, and supplies, as Fondo is not just an insurance provider, but also provides medical services to its insured population.
b. PayGo disbursements are projected to amount to ($95.9M) in FY20. c. Other expenses are ($1.6M) for FY20.
D. Accounts Receivable / Accounts Payable10
1. Accounts Receivable: a. Accounts receivable reports are unavailable this
month due to systems issues at Fondo. 2. Accounts Payable:
a. $2.3M increase from Jun-19 to Aug-19 driven primarily by a $2.0M increase in intergovernmental A/P consisting of payables pertaining to PayGo. The remaining increase in A/P is due to third party accounts.
3. Working Capital: a. Unavailable.
10 Figures are unaudited and subject to change.
670.3
177.5
Beginning Cash 1. Sources
(357.5)
(95.9)
(1.6)
2. Uses
392.8
Ending Cash
PayGo
CapEx / Other
Fondo Sources and Uses
Operating
Operating
Note: Beginning and ending cash as presented in Section A.
Millions of US Dollars
670.3 (455.0)
45.9
A/P June ’19A/R June ’19
28.2
N/A
A/R August ’19
26.2
5.1 5.4
A/P August ’19
45.9
N/A
31.333.7
Intergovernment 3rd Party
Fondo Working CapitalMillions of US Dollars

19
V. HEALTH INSURANCE ADMINISTRATION (“ASES”) Primary Business Activity: ASES implements, administers, and negotiates the Medicaid Health Insurance System in Puerto Rico through contracts with third party insurance underwriters to provide quality medical and hospital care to the Puerto Rico Medicaid and Platino (Medicaid + Medicare dual-eligible) populations. Key Takeaways: Information not available.
A. FY20 Operating Liquidity – Actuals11 and Draft FY20 Liquidity Plan 1. Information not available.
B. Headcount / Payroll 1. Information not available.
11 Appendix includes reconciliation between AAFAF reported cash figures and the figures in this report.
20
V. HEALTH INSURANCE ADMINISTRATION (“ASES”) (Continued) C. Full Year FY20 Sources and Uses of Funds
1. Information not available. D. Accounts Receivable / Accounts Payable12
1. Information not available.
12 Figures are unaudited and subject to change.

21
VI. HIGHWAYS AND TRANSPORTATION AUTHORITY (“HTA”) Primary Business Activity: HTA controls and supervises highway facilities, sets tolls, issues bonds, and manages the construction of all major projects relating to the Commonwealth’s toll highway system. Key Takeaways: YTD operating revenues of $19.8M are $5.9M below plan, driven primarily by a delay in the opening of a toll plaza and an increase in unpaid tolls. YTD central government receipts for infrastructure projects of $8.1M are $5.6M behind plan, while federal receipts of $33.1M are $29.1M behind plan, both due to timing. HTA projects a further cash use of $230.1M by fiscal year end due to CapEx projects and expects to end the year with a $24.3M cash balance. A. FY20 Operating Liquidity – Actuals13 and FY20 Liquidity
Plan 1. ($49.5M) YTD actuals:
a. $19.8M in YTD receipts from tolls and other income, which are ($5.9M) behind plan due to the delay in the opening of a toll station, in addition to a higher amount of delinquent and unpaid tolls.
b. $8.1M in YTD receipts from the central government, which are ($5.6M) behind plan due to a delay in receipt of infrastructure funding. Transfers related to this year’s infrastructure budget are expected to commence in the third month of the fiscal year.
c. $33.1M in YTD receipts from the federal government, of which $26.8M is related to federal aid from FHWA and FTA, and $6.3M is related to an FHWA emergency reconstruction program. Federal receipts have had a ($29.1M) negative variance to plan, which is primarily timing related to requesting of funds and receiving certification.
d. ($8.6M) in payroll expenses. e. ($8.8M) in PayGo payments, which are $2.4M higher than plan, which is timing related and expected to reverse. f. ($19.2M) in operating expenses, which are $8.9M favorable to plan. Favorable operating variance is primarily timing related
due to a delay in the process of approval of invoices. g. ($73.9M) in CapEx, which is $18.4M higher than plan due to timing on payments during the period.
2. ($230.1M) cash reduction for the balance of the fiscal year based on the draft FY20 Liquidity Plan: a. $505.0M in receipts driven by: $320.4M in federal grants for infrastructure projects; $56.1M in receipts from the Puerto
Rico government for infrastructure projects; and $128.5M in operating receipts from toll collections, electronic fines, and other income.
b. ($735.1M) in disbursements driven by ($520.3M) in CapEx disbursements for both federal and locally funded projects and ($214.8M) in operating disbursements.
B. Headcount / Payroll
1. Headcount FTEs: Decreased from 991 to 883 from Aug-18 to Aug-19. a. The 108 headcount reduction is primarily due to
the VTP. These positions are not expected to be replaced.
2. Payroll: Disbursements are forecast to be $53.8M for FY20 based on the draft Liquidity Plan. YTD payroll of $8.6M is tracking to plan.
13 Appendix includes reconciliation between AAFAF reported cash figures and the figures in this report.
1,100
Aug-18 Aug-19
1,400
Dec-18
1,200
Sep-18 May-19Oct-18 Jan-19Nov-18 Feb-19 Jun-19
1,000
Mar-19 Apr-19
900
0
1,300
100
800
Jul-19
946 930892 890900
991
895 895 888 887 883895 894
No
. of
Emp
loye
es
HTA Headcount
Aug-19 Mar-20Jul-19 Dec-19 Feb-20 May-20Sep-19 Oct-19 Apr-20Jan-20
450
Nov-19
300
Jun-20Jun-190
250
50
100
150
200
350
400
500
24.3
296.6
303.9
307.3
254.4
77.2
288.7
(230.1)
FY20 Liquidity Plan
YTD Actuals
HTA Liquidity
Mill
ion
s o
f U
S D
olla
rs

22
VI. HIGHWAYS AND TRANSPORTATION AUTHORITY (“HTA”) (Continued) C. Full Year FY20 Sources and Uses of Funds
1. Sources $571.7M: a. $148.3M in operating receipts, with $129.0M
coming from toll fares and $19.3M coming from toll fines and other income.
b. $64.2M in receipts are from local government sources.
c. $353.5M is from federal programs, $303.7M from the Federal Highway Authority, and $49.8M from the Federal Transportation Authority and FEMA.
d. $5.7M in other inflows. 2. Uses ($851.3M):
a. ($213.6M) in operating disbursements, with the largest components comprised of payroll ($53.8M) and purchased services at ($91.7M).
b. PayGo totals ($37.8M). c. CapEx/other total ($599.9M), consisting of CapEx
($497.4M), emergency reconstruction ($96.7M), and other outflows of ($5.7M).
D. Accounts Receivable / Accounts Payable14
1. Accounts Receivable: a. $10.5M increase from Jun-19 to Aug-19 driven by
an increase in intergovernmental receivables related to the Department of Treasury receivable.
2. Accounts Payable: a. $28.1M increase from Jun-19 to Aug-19 driven by
increases in third party payables of $12.5M and intergovernmental payables of $15.5M from federal construction and CapEx projects. This is timing related and should reverse in September.
3. Working Capital: a. The change in net working capital through Aug-19
is a positive $17.6M due to the above changes.
14 Figures are unaudited and subject to change.
353.5
64.2303.9
Beginning Cash
148.3
5.7
1. Sources Ending Cash
(213.6)
(37.8)
(594.1)
2. Uses
24.3
571.7
5.7
Federal Funds
Other Outflows
PayGo
HTA Sources and Uses
OperatingOperating
Note: Beginning and ending cash as presented in Section A.
Millions of US Dollars
(851.3)
Intergovernmental Receipts
Other Inflows
CapEx / Other
A/R June ’19
21.127.5 27.5
49.960.4
8.6
A/R August ’19
59.4
A/P June ’19
75.0
A/P August ’19
77.4
87.9
68.0
96.1
3rd PartyIntergovernment
HTA Working CapitalMillions of US Dollars

23
VII. PUERTO RICO PUBLIC BUILDINGS AUTHORITY (“PBA”) Primary Business Activity: PBA constructs, purchases, or leases office, school, health, correctional, social welfare, and other facilities for lease to certain Commonwealth departments, component units, and instrumentalities. Key Takeaways: Puerto Rico Buildings Authority had limited receipts in August given that it typically begins to collect government entity rent paid through Hacienda in the third month of the fiscal year. As such, PBA ran a cash flow deficit of $14.8M for YTD August and ended the month with a cash balance of $55.9M. PBA projects to end FY20 with a cash balance of $66.8M.
A. FY20 Operating Liquidity – Actuals15 and Draft FY20
Liquidity Plan 1. ($14.8M) YTD actuals:
a. $2.2M in revenues from government entities paid via direct invoice, all related to FY19 invoices. PBA did not receive rent receipts from government agencies paid directly by Hacienda August YTD; typically, these transfers begin in the third month of the fiscal year.
b. $0.6M in other income, primarily from third party concessionaires.
c. ($8.2M) in payroll expenses, which are $2.6M lower than the same period the previous year due to reduced headcount and benefits.
d. ($3.8M) in PayGo payments. PBA is up to date on its FY20 PayGo payments.
e. ($2.9M) in payments for utilities, which are primarily related to a reduction in PREPA and PRASA payables.
f. ($2.4M) in other expenses, which include ($0.8M) of purchased services. 2. $11.0M cash build for the balance of the fiscal year based on the draft FY20 Liquidity Plan, offsetting a large part of the YTD
cash burn. a. $121.1M in forecast total receipts primarily driven by $116.5M in intergovernmental receipts, $1.2M in operating receipts,
and $3.4M in FEMA disaster-related receipts. b. ($109.4M) in operating disbursements led by payroll ($48.1M), PayGo ($19.5M), purchased services ($21.6M), facilities
payments ($16.5M), and other operating expenses ($3.7M). c. ($0.7M) in disaster-related project disbursements.
B. Headcount / Payroll
1. Headcount FTEs: Decreased from 1,094 to 985 from Aug-18 to Aug-19. a. Decrease in headcount is primarily due to the VTP;
these positions are not expected to be replaced. 2. Payroll: Disbursements are forecast to be $55.3M for
FY20 based on the draft Liquidity Plan. YTD payroll of $8.2M is tracking lower than plan.
15 Appendix includes reconciliation between AAFAF reported cash figures and the figures in this report.
1,000
1,020
Sep-18
1,180
1,060
1,100
1,120
1,140
Jul-19
1,160
1,200
Aug-18 Oct-18 Nov-18 Dec-18 Aug-19Jan-19 Feb-19 Mar-19 Apr-19 May-19 Jun-19
940
980
20
1,040
0
40
1,080
960
1,092
9921,002
9951,001
1,029
1,091
997 992
1,094
985
1,093
998
PBA Headcount
No
. of
Emp
loye
es
Oct-19Sep-19Aug-19 Nov-19 Dec-19 Jan-20
30
May-20Apr-20Feb-20 Mar-20Jun-19
70
20
Jun-20Jul-19
10
40
50
60
80
90
100
0
66.863.5
55.9
70.7
+11.0
Draft FY20 Liquidity Plan
YTD Actuals
PBA Liquidity
Mill
ion
s o
f U
S D
olla
rs

24
VII. PUERTO RICO PUBLIC BUILDINGS AUTHORITY (“PBA”) (Continued) C. Full Year FY20 Sources and Uses of Funds
1. Sources $123.9M: a. Intergovernmental receipts total $118.8M, of
which $108.4M is in rent transfers from Hacienda on behalf of agencies, while $10.4M is paid directly by other government entities.
b. Disaster-related receipts total $3.4M, which is related to FEMA claims from Hurricanes Irma and Maria.
c. Other operating receipts total $1.7M, of which $0.7M are related to income from third party occupancy and $1.0M is related to other income, including interest income.
2. Uses ($127.7M): a. Operating disbursements total ($103.4M),
consisting of payroll of ($56.3M), purchased services of ($22.3M), facilities and payments to public services of ($19.4M), professional services of ($2.1M), and other operating expenses of ($3.3M).
b. PayGo contributions of ($23.3M). c. Disaster related disbursements of ($1.0M), of which ($0.7M) is related to FEMA and ($0.3M) is related to insurance related
projects. D. Accounts Receivable / Accounts Payable16
1. Accounts Receivable: a. $2.5M decrease from Jun-19 to Aug-19 driven by
collections received on prior year invoices. 2. Accounts Payable:
a. $1.9M decrease from Jun-19 to Aug-19 driven by payments for utilities.
3. Working Capital: a. The change in net working capital through Aug-19
was a positive $0.6M due to the above changes.
16 Figures are unaudited and subject to change.
(23.3)3.4
118.7(103.4)
1. SourcesBeginning Cash
(0.9)
1.7
2. Uses
66.8
Ending Cash
123.9
70.7
Disaster
Operating
PayGo
PBA Sources and Uses
Intergovernmental
Disaster
Note: Beginning and ending cash as presented in Section A.
Millions of US Dollars
Operating
(127.7)
A/P June ’19A/R June ’19 A/R August ’19 A/P August ’19
1,069.61,072.1
23.725.6
Intergovernment
PBA Working CapitalMillions of US Dollars

25
VIII. CARDIOVASCULAR CENTER FOR PUERTO RICO AND THE CARIBBEAN (“Cardio”) Primary Business Activity: Cardio is a general acute care hospital providing specialized treatment to patients suffering from cardiovascular diseases. Key Takeaways: Information not available. A. FY20 Operating Liquidity – Actuals17 and Draft FY20 Liquidity Plan
1. Information not available. B. Headcount / Payroll
1. Information not available.
17 Appendix includes reconciliation between AAFAF reported cash figures and the figures in this report.

26
VIII. CARDIOVASCULAR CENTER FOR PUERTO RICO AND THE CARIBBEAN (“Cardio”) (Continued) C. Full Year FY20 Sources and Uses of Funds
1. Information not available. D. Accounts Receivable / Accounts Payable18
1. Information not available.
18 Figures are unaudited and subject to change.

27
IX. PUERTO RICO INDUSTRIAL DEVELOPMENT CORPORATION (“PRIDCO”) Primary Business Activity: PRIDCO is engaged in the development and promotion of industry within Puerto Rico. It accomplishes its mission through a variety of incentives to attract businesses to expand operations within Puerto Rico, but primarily through the offering of commercial lease spaces and industrial facilities on favorable terms to qualifying enterprises. Key Takeaways: PRIDCO began FY20 with $158.4M in operating cash, and has reduced its cash balance to $149.6M to end the month of August. Rental receipts have stayed consistent when comparing YTD in the prior fiscal year, and have been sufficient for supporting general operating expenditures; however, during the month of August PRIDCO made a $7.3M PayGo disbursement which has reduced its current outstanding debt from $17.9M to $10.6M. PRIDCO has been in negotiations to finalize a repayment plan for all of its outstanding PayGo obligation and debt restructuring. A. FY20 Operating Liquidity – Actuals19 and Draft FY20
Liquidity Plan 1. ($8.8M) YTD actuals:
a. $7.7M in operating receipts, representing rental income of $5.8M, other income of $1.3M, and $0.6M of asset sales.
b. $3.2M in intergovernmental receipts relating to FEDE funds.
c. $0.3M in federal grants. d. ($7.3M) in PayGo disbursements, consisting of
past-due invoices from prior fiscal years. e. ($6.1M) in operating expenses, the largest being a
($3.3M) insurance payment. f. ($0.6M) in payroll and related costs. g. ($6.0M) in Net Transfers between PRIDCO
operational to non-operational bank accounts. 2. $15.2M cash build for the balance of the fiscal year
based on the draft FY20 Liquidity Plan: a. Build in liquidity is due to strong collection of rental receipts, in addition to the assumption that no more large lump sum
payments relating to PayGo or outstanding debt will be taking place during FY20. B. Headcount / Payroll
1. Headcount FTEs: Decreased from 188 to 146 from Aug-18 to Aug-19. a. Decline in headcount is related to the transfer of
42 employees from PRIDCO’s business development department to DDEC.
b. Management is currently assessing optimal headcount to determine if re-hiring is necessary during the fiscal year.
2. Payroll: Disbursements are forecast to be $12.8M for FY20. YTD payroll is $0.6M. a. YTD run rate for payroll is behind FY20 forecast
due to timing of disbursements.
19 Appendix includes reconciliation between AAFAF reported cash figures and the figures in this report.
May-19Feb-19
20
Mar-19Aug-18 Dec-180
Apr-19
140
160
180
200
Jul-19Oct-18 Jan-19 Jun-19Nov-18Sep-18 Aug-19
147 147 148 146144
188
146 144
188
147
187
145148
PRIDCO Headcount
No
. of
Emp
loye
es
Feb-20Jan-20 Mar-20
150
180
Apr-20Jul-19 Jun-20
10
May-20Oct-19
120
0Jun-19
200
Aug-19
20
30
Sep-19 Nov-19
160
Dec-19
170
190
130
140
157.7
149.6
164.8158.4
+15.2
YTD Actuals
Draft FY20 Liquidity Plan
PRIDCO Liquidity
Mill
ion
s o
f U
S D
olla
rs

28
IX. PUERTO RICO INDUSTRIAL DEVELOPMENT CORPORATION (“PRIDCO”) (Continued) C. Full Year FY20 Sources and Uses of Funds
1. Sources $68.4M: a. Primary sources of cash are operating receipts of
$62.7M consisting of: rental receipts for $61.2M and asset sales of $1.5M.
b. Intergovernmental receipts of $3.2M, representing FEDE funds to PRIDCO from the TSA.
c. Other income of $2.1M, which consists of interest income on deposits.
d. Federal grants of $0.3M for FY20. 2. Uses ($62.0M):
a. Primary uses of cash are operating expenditures of ($15.5M), payroll and related expenses of ($12.8M), PRIDCO mortgage payments of ($12.3M), PayGo of ($15.5M), and CapEx of ($0.1M).
b. ($5.6M) in net transfers in/out between PRIDCO operating bank accounts to non-operating accounts.
D. Accounts Receivable / Accounts Payable20
1. Accounts Receivable: a. $0.8M increase from Jun-19 to Aug-19 driven by
collections due to PRIDCO from both government agencies and third party customers; however, no significant changes to the larger accounts.
2. Accounts Payable: a. $0.8M decrease from Jun-19 to Aug-19 driven by
payments made to third party customers for provided services.
3. Working Capital: a. $1.6M use of cash from Jun-19 to Aug-19 driven
by the working capital changes listed above.
20 Figures are unaudited and subject to change.
Beginning Cash
(164.8)
(15.5)
62.7
3.20.3
1. Sources
2.1
(15.3)
(12.8)
2. Uses
(12.3)(6.0)
Ending Cash
158.4
68.4
PRIDCO Sources and Uses
Operating
Payroll
Note: Beginning and ending cash as presented in Section A.
Millions of US Dollars
PayGo
CapEx / Net Transfers
(62.0)
FEDE Funds
Federal Funds
Other Receipts
Operating
Debt Related
0.70.0
6.2
A/R August ’19
28.6
6.5
21.5
A/P June ’19A/R June ’19
22.1
1.5 0.00.7
A/P August ’19
27.8
1.5
3rd PartyIntergovernment
PRIDCO Working CapitalMillions of US Dollars

29
X. PUERTO RICO HOUSING FINANCE AUTHORITY (“HFA”) Primary Business Activity: HFA promotes the development of low-income housing and provides financing, subsidies, and incentives to help those who qualify to acquire or lease a home. Key Takeaways: Information not available. A. FY20 Operating Liquidity – Actuals21 and Draft FY20 Liquidity Plan
1. Information not available. B. Headcount / Payroll
1. Information not available.
21 Appendix includes reconciliation between AAFAF reported cash figures and the figures in this report.

30
X. PUERTO RICO HOUSING FINANCE AUTHORITY (“HFA”) (Continued) C. Full Year FY20 Sources and Uses of Funds
1. Information not available. D. Accounts Receivable / Accounts Payable22
1. Information not available.
22 Figures are unaudited and subject to change.

31
XI. TOURISM COMPANY OF PUERTO RICO (“Tourism”) Primary Business Activity: Tourism’s purpose is to promote the tourism industry of Puerto Rico. Key Takeaways: Year to date, cash has decreased from $48.7M to $43.3M. The ($5.4M) cash reduction is driven primarily by Tourism making pay downs on prior-year payables including room tax waterfall payments to CCDA and amounts associated with prior years’ marketing contracts. Despite this, Tourism expects to build cash throughout FY20 through continued performance of slot machine operations. A. FY20 Operating Liquidity – Actuals23 and Draft FY20
Liquidity Plan 1. ($5.4M) YTD actuals:
a. $21.9M net collections after waterfall disbursements. Slot machine collections are likely to exceed fiscal plan projections considering the current run rate.
b. ($3.1M) in payroll and related costs, which is favorable when compared to the prior fiscal year due to savings from the voluntary retirement program.
c. ($1.5M) in PayGo retirement contributions, including the paydown of the May-19 previously deferred contribution, as well as contributions for Jun-19 and Jul-19.
d. ($16.8M) in operating disbursements. These disbursements comprise of ($3.2M) in media and advertisements, including ($2.0M) for remaining pay downs on the FY18 marketing contract; ($3.0M) in payments to the DMO; ($4.4M) in donations and subsidies primarily for cruise line incentives; ($2.8M) in professional and purchased services spend; and ($3.4M) in other.
e. ($6.1M) in transfers to restricted account, which occurs in fixed amounts of ($3.0M) per month over the first 10 months of the fiscal year.
f. $0.2M in miscellaneous receipts. 2. $9.7M cash build for the balance of the fiscal year based on the draft FY20 Liquidity Plan:
a. Driven primarily by improved performance of slot machine collections and Tourism not having to make ($6.1M) in transfers to a restricted account for the last two months of the fiscal year.
B. Headcount / Payroll
1. Headcount FTEs: Decreased from 376 to 369 from Aug-18 to Aug-19. a. Reduction in headcount is due to normal turnover. b. Headcount may increase subject to the pending
rollout of the Video Lottery Terminals (“VLTs”) pursuant to Act 257-2018. Tourism expects to hire up to 43 employees for the regulation and monetization of the “VLTs”, which is not considered in the Liquidity Plan.
2. Payroll: Disbursements are forecast to be $18.4M for FY20. YTD payroll is $3.1M. a. YTD payroll is currently in line with forecast.
23 Appendix includes reconciliation between AAFAF reported cash figures and the figures in this report.
Jul-19Dec-18Aug-18
450
Aug-19Sep-18 Feb-19Oct-18 Jan-19 Jun-19Apr-19 May-190
Mar-19Nov-18
350
400377
369373376 377 372377371 370373373376 372
Tourism Headcount
No
. of
Emp
loye
es
Jun-19 Sep-19 Mar-20Jul-19 Aug-19
10
Oct-19 Dec-19 Jun-20Nov-19 Jan-20
60
Feb-20 Apr-20 May-20
15
55
35
30
20
0
5
25
45
40
50
43.3
53.1
48.7 50.4
+9.7
Draft FY20 Liquidity Plan
YTD Actuals
Tourism Liquidity
Mill
ion
s o
f U
S D
olla
rs

32
XI. TOURISM COMPANY OF PUERTO RICO (“Tourism”) (Continued) C. Full Year FY20 Sources and Uses of Funds
1. Sources $380M: a. Tourism’s primary sources of funds are slot
machine revenues of $299.6M, or 79%, and room tax revenues of $78.5M, or 20%. There is seasonality in the receipt of these funds, which may create temporary timing variances. Through its collections from slot machine gambling revenues and room taxes, Tourism funds the entirety of its operations and intergovernmental obligations through various waterfall distributions explained below.
b. Other receipts total $1.8M, which consist mostly of fares and/or fines charged by Tourism to local street vendors.
2. Uses ($375.6M): a. Slot machines and room taxes have disbursements
per a waterfall: slot machine funds are disbursed to Hacienda, University of Puerto Rico, and casinos; room tax funds are disbursed to the Convention Center and intercompany marketing and promotion funds. Tourism retains leftover funds after waterfall disbursements of ($225.3M) and ($5.9M) are made from slot machines and room taxes respectively.
b. Operating expenses are projected to be ($108.4M), built from payroll at ($18.4M), DMO expenses of ($29.2M), subsidies/incentives at ($24.6M), purchased services at ($12.3M), media/ads at ($6.2M), professional service fees of ($3.1M), and other operating expenses of ($14.6M) consisting of event/promotions costs, air access incentives, utilities, and transportation costs.
c. Tourism has made three payments totaling ($1.5M) related to PayGo contributions, including one payment that was deferred in FY19. For FY20 purposes, PayGo disbursements are in line with forecast, which are expected to total ($5.4M) for the fiscal year.
d. Other disbursements are ($30.3M) in transfers to a restricted account. D. Accounts Receivable / Accounts Payable24
1. Accounts Receivable: a. $0.5M increase from Jun-19 to Aug-19 driven
entirely by third party A/R increases due to timing of invoicing and room tax and slot machine collections.
2. Accounts Payable: a. $7.7M decrease from Jun-19 to Aug-19 driven by
third party A/P decreases of ($4.3M) primarily due to further paydowns on the FY18 marketing contract and amounts owed to cruise lines incurred in FY19. Decrease in intergovernmental A/P of ($3.4M) driven primarily by paydowns to CCDA for amounts owed per room tax waterfall legislation for FY19, as well as prior years’ debts.
3. Working Capital: a. Working capital levels have been an unfavorable
$8.2M due to paydowns on major spend activities incurred in FY19 and prior years, including spend on marketing contracts delayed in FY18 due to the hurricanes.
24 Figures are unaudited and subject to change.
Beginning Cash
(5.7)
378.1
1. Sources
1.8(30.3)48.7
(231.3)
(108.4)
2. Uses
53.1
Ending Cash
380.0
Other
PayGo
Operating
Other
Slot Machine/ Room Tax
Slot Machine/ Room Tax
Tourism Sources and Uses
Note: Beginning and ending cash as presented in Section A.
Millions of US Dollars
(375.6)
13.2
13.2
0.0
27.2
12.7
0.0
A/R June ’19 A/R August ’19
13.0
21.9
A/P June ’19
12.7
34.9
A/P August ’19
17.6
9.6
Intergovernment 3rd Party
Tourism Working CapitalMillions of US Dollars

33
XII. FISCAL AGENCY AND FINANCIAL ADVISORY AUTHORITY (“AAFAF”) Primary Business Activity: AAFAF acts as fiscal agent, financial advisor, and reporting agent for the Government of Puerto Rico and certain related entities. It was established pursuant to the Puerto Rico Emergency Moratorium and Financial Rehabilitation Act. Key Takeaways: AAFAF began FY20 with $57.6M in operating cash, and has grown its cash balance to $69.5M at August month end. Similar to FY19, the largest expenditures made by AAFAF through August pertain to professional service fees. New for FY20 cash flow reporting, AAFAF will be receiving additional General Fund appropriations for Title III expenses; however, YTD no payments of Title III fees have taken place which has been the greatest contributor to the cash build so far this fiscal year. A. FY20 Operating Liquidity – Actuals25 and Draft FY20
Liquidity Plan 1. $11.9M YTD actuals:
a. $16.8M in General Fund appropriations, broken down into $8.7M as a part of AAFAF’s certified budget and $8.1M in Title III appropriations.
b. $0.8M in fiscal agency fees, MOU premiums, and interest income on deposits.
c. ($4.5M) in operating disbursements, with ($4.1M) in budgeted professional service fees.
d. ($1.3M) in payroll and related costs. e. AAFAF has not made any disbursements related to
Title III fees YTD. 2. ($11.3M) cash reduction for the balance of the fiscal
year based on the draft FY20 Liquidity Plan: a. Future reduction in liquidity is due to expected
catch up in disbursements relating to professional services, both budgeted and Title III expenses.
B. Headcount / Payroll
1. Headcount FTEs: Increased from 69 to 77 from Aug-18 to Aug-19. a. Increase in headcount was due to AAFAF needing
additional personnel to provide fiscal services to various government entities.
2. Payroll: Disbursements are forecast to be $7.8M for FY20. YTD payroll is $1.3M. a. YTD run rate for payroll is in line with AAFAF’s
budgeted expense for FY20.
25 Appendix includes reconciliation between AAFAF reported cash figures and the figures in this report.
Jun-19
95
Sep-18
15
10
0Aug-18
5
Oct-18 Mar-19Nov-18 Dec-18
70
Jan-19 Apr-19 May-19
55
60
65
75
80
85
90
100
Feb-19 Jul-19 Aug-19
77
80
69 6870
76 77
84
79
83
77
8179
No
. of
Emp
loye
es
AAFAF Headcount
Apr-20Jul-19 Sep-19Aug-19 Oct-19 Nov-19 Dec-19 Jan-20
30
Feb-20
80
Mar-20 May-20 Jun-20Jun-19
50
0
10
20
40
100
70
90
60
69.557.6
63.8
58.3
(11.3)
Draft FY20 Liquidity Plan
YTD Actuals
AAFAF Liquidity
Mill
ion
s o
f U
S D
olla
rs
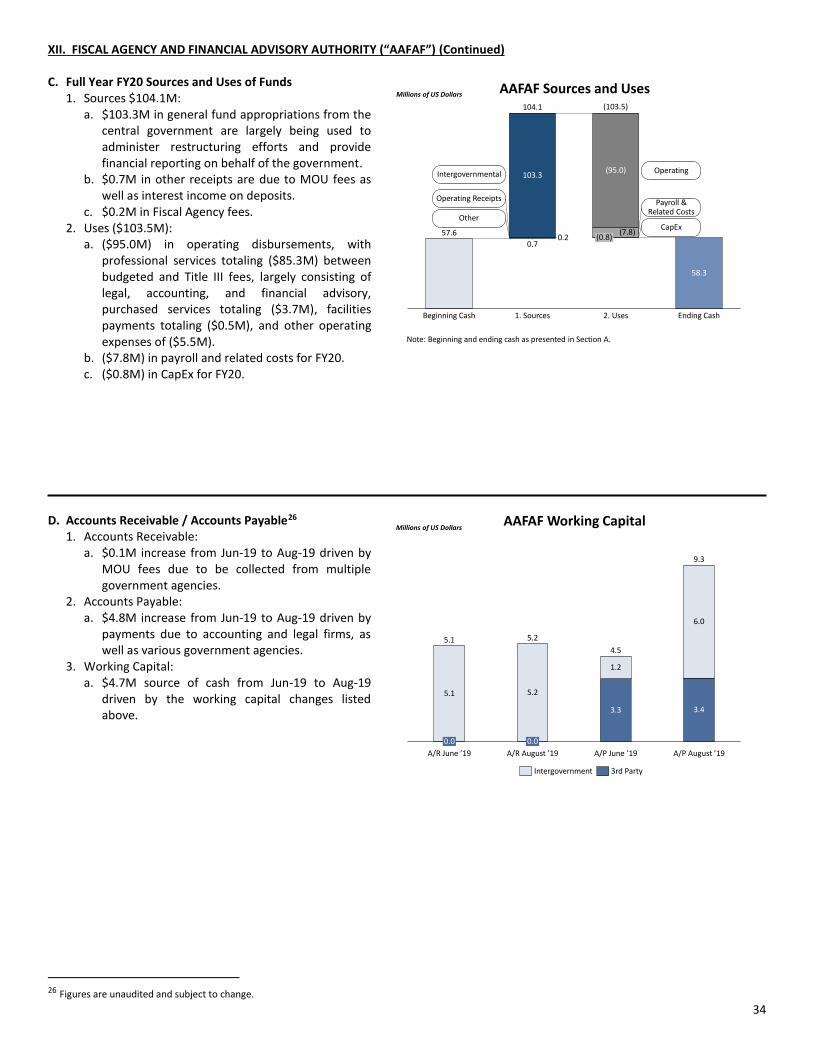
34
XII. FISCAL AGENCY AND FINANCIAL ADVISORY AUTHORITY (“AAFAF”) (Continued) C. Full Year FY20 Sources and Uses of Funds
1. Sources $104.1M: a. $103.3M in general fund appropriations from the
central government are largely being used to administer restructuring efforts and provide financial reporting on behalf of the government.
b. $0.7M in other receipts are due to MOU fees as well as interest income on deposits.
c. $0.2M in Fiscal Agency fees. 2. Uses ($103.5M):
a. ($95.0M) in operating disbursements, with professional services totaling ($85.3M) between budgeted and Title III fees, largely consisting of legal, accounting, and financial advisory, purchased services totaling ($3.7M), facilities payments totaling ($0.5M), and other operating expenses of ($5.5M).
b. ($7.8M) in payroll and related costs for FY20. c. ($0.8M) in CapEx for FY20.
D. Accounts Receivable / Accounts Payable26
1. Accounts Receivable: a. $0.1M increase from Jun-19 to Aug-19 driven by
MOU fees due to be collected from multiple government agencies.
2. Accounts Payable: a. $4.8M increase from Jun-19 to Aug-19 driven by
payments due to accounting and legal firms, as well as various government agencies.
3. Working Capital: a. $4.7M source of cash from Jun-19 to Aug-19
driven by the working capital changes listed above.
26 Figures are unaudited and subject to change.
103.3
0.7
Beginning Cash
(7.8)
(95.0)
0.2
2. Uses1. Sources
(0.8)
58.3
Ending Cash
57.6
104.1
Operating Receipts
CapEx
Intergovernmental Operating
AAFAF Sources and Uses
Note: Beginning and ending cash as presented in Section A.
Millions of US Dollars
Other
Payroll & Related Costs
(103.5)
5.2
1.2
A/R August ’19
5.1
5.1
3.3
0.0
A/R June ’19
0.0
A/P June ’19
6.0
3.4
9.3
A/P August ’19
5.2
4.5
Intergovernment 3rd Party
AAFAF Working CapitalMillions of US Dollars

35
XIII. DEPARTMENT OF ECONOMIC DEVELOPMENT AND COMMERCE (“DDEC”) Primary Business Activity: DDEC serves as the umbrella agency for key economic development entities in Puerto Rico. It leads efforts to drive competitiveness through structural reforms, promoting private sector investment, and job growth in critical sectors. Key Takeaways: DDEC began FY20 with $24.7M in operating cash, and has reduced its cash balance to $20.5M by August month end. Year to date, the largest reduction in cash is due to increased payroll disbursements and other operating expenses. DDEC’s headcount increased significantly throughout FY19 due to ongoing consolidation, so a budget reapportionment/consolidation of multiple budgets will be required to comply with the FY20 Certified Budget. Currently, all cash flow activity year to date reflects DDEC, the Permits Management Office, the Office of Industrial Tax Exemption, and the State Office of Energy Policy. A. FY20 Operating Liquidity – Actuals27 and Draft FY20
Liquidity Plan 1. ($4.2M) YTD actuals:
a. $2.9M in net federal funding, which is due to timing of disbursements.
b. $1.3M in operating receipts, due to $0.5M in management fees, $0.5M in Act 22 fees, and $0.3M in other income.
c. $1.0M General Fund appropriations. d. ($6.3M) in operating disbursements. e. ($2.8M) in payroll and related costs, which is
above budget for the individual DDEC entity. f. ($0.3M) in PayGo disbursements.
2. $14.0M cash build for the balance of the fiscal year based on the draft FY20 Liquidity Plan: a. Build in liquidity is due to expected cash transfers
from PRIDCO, relating to expenses incurred during prior fiscal years, in tandem with expected inflows resulting from a new tax incentive, “Act 60,” beginning in January 2020.
B. Headcount / Payroll
1. Headcount FTEs: Increased from 147 to 330 from Aug-18 to Aug-19. a. The increase in headcount throughout FY19 was
due to the transfer of 42 employees from PRIDCO, 132 employees from OGPE, and 12 employees from OECI as a result of DDEC consolidation. General employee turnover and VTP lowered the headcount down to 330 from a baseline of 342.
2. Payroll: Disbursements are forecast to be $18.1M for FY20. YTD payroll is $2.8M. a. YTD run rate for payroll is in line with
management’s board-approved budget; however, this projection differs significantly from the DDEC certified budget of $9.6M.
27 Appendix includes reconciliation between AAFAF reported cash figures and the figures in this report.
147 146 147
190 187 186
330 330 330 330 330 330 330
0
30
60
90
120
150
180
210
240
270
300
330
360
Aug-18 Sep-18 Oct-18 Nov-18 Jan-19 Jun-19Dec-18 Aug-19Feb-19 Mar-19 Apr-19 May-19 Jul-19
DDEC Headcount
No
. of
Emp
loye
es
Oct-19 Nov-19 Dec-19 Jan-20
25
5
Mar-20Feb-20Sep-19 Apr-20Jun-19 May-20 Jun-200
10
Aug-19
15
20
30
35
Jul-19
20.5
24.7
34.5
22.4
+14.0
Draft FY20 Liquidity Plan
YTD Actuals
DDEC Liquidity
Mill
ion
s o
f U
S D
olla
rs

36
XIII. DEPARTMENT OF ECONOMIC DEVELOPMENT AND COMMERCE (“DDEC”) (Continued) C. Full Year FY20 Sources and Uses of Funds
1. Sources $158.0M: a. Federal grants represent $113.3M, or 71.7%, of
total receipts, which are used for redevelopment efforts on the Island.
b. Intergovernmental receipts are $23.2M, or 14.7% of total receipts.
c. Operating receipts are $12.8M, or 8.1% of total receipts, which represents the management fee owed to DDEC and Act 22 fees.
d. Other receipts account for $8.7M, or 5.5% of total receipts, which relate to cash transferred from PRIDCO to pay for employees and other operating costs, fees for managing federal grants, and interest income.
2. Uses ($148.1M): a. Donations, subsidies, and distributions represent
($100.4M), or 67.8%, of total disbursements, which are provided to local areas for redevelopment and to the citizens through the various federal grants.
b. Operating expenses of ($25.4M), or 17.1%, primarily consist of professional and purchased services of ($15.1M) and additional operating expenses of ($10.3M).
c. Payroll and related costs of ($18.1M), or 12.2%, of total disbursements. d. PayGo disbursements of ($4.2M), or 2.8%, of total disbursements, which is a significant increase from the FY19 total due to
other entities being consolidated under DDEC. D. Accounts Receivable / Accounts Payable28
1. Accounts Receivable: a. $8.3M increase from Jun-19 to Aug-19 driven by
management fees owed to DDEC by PRIDCO and Tourism at the beginning of the fiscal year, expected to reverse once fees are paid during the year.
2. Accounts Payable: a. $3.3M increase from Jun-19 to Aug-19 driven by
increased purchases with various inter-governmental agencies.
3. Working Capital: a. $5M use of cash from Jun-19 to Aug-19 driven by
the working capital changes listed above.
28 Figures are unaudited and subject to change.
8.724.7
Beginning Cash
113.3
1. Sources
25.423.2
12.8
100.4
18.1
2. Uses
34.5
Ending Cash
158.0
4.2
Federal Funds
Operating
Intergovernmental
Donations
DDEC Sources and Uses
Note: Beginning and ending cash as presented in Section A.
Millions of US Dollars
Operating
Payroll & Related Costs
PayGo
(148.1)
Other Receipts
A/R August ’19
7.6
14.914.9
16.0
5.1
A/P June ’19A/R June ’19
1.30.5 0.3
4.8
A/P August ’19
22.6
30.9
1.8
Intergovernment 3rd Party
DDEC Working CapitalMillions of US Dollars

37
XIV. PUERTO RICO CONVENTION CENTER DISTRICT AUTHORITY (“CCDA”) Primary Business Activity: CCDA develops, manages, and oversees the Puerto Rico Convention Center, the Coliseo de Puerto Rico José Miguel Agrelot, Bahía Urbana, and other adjacent hospitality, commercial, and residential developments. Key Takeaways: CCDA began FY20 with $8.1M in operating cash, and has increased its cash balance to $8.8M by August month end. Liquidity has increased due to transfers from the Puerto Rico Tourism Company which pertain to deferred collections from the prior fiscal year. Consistent with the prior fiscal year, event schedules at the managed venues continue to be booked, yielding steady operating receipts from the Coliseum and Convention Center. A. FY20 Operating Liquidity – Actuals29 and Draft FY20
Liquidity Plan 1. $0.7M YTD actuals:
a. $4.6M in operating receipts, with $3.9M relating to the Coliseum and Convention Center, and the remainder attributable to district revenue.
b. $3.2M in Puerto Rico Tourism Room Tax transfers, in which $2.6M is due to the catch up in prior fiscal year payments owed to CCDA.
c. $0.5M in other receipts, due to inflows from Bahía Urbana and interest income.
d. ($6.9M) in operating disbursements, of which the majority relates to ($5.1M) in contracted services and ($1.6M) in facilities payments.
e. ($0.6M) in CapEx, which is solely due to prior fiscal year projects that were not completed by end of FY19.
f. ($0.2M) in payroll and related costs. 2. ($0.7M) cash reduction for the balance of the fiscal year based on the draft FY20 Liquidity Plan:
a. Liquidity position for the remainder of the year will decline, reversing the slight cash build YTD. B. Headcount / Payroll
1. Headcount FTEs: Increased from 8 to 10 from Aug-18 to Aug-19. a. Headcount has increased by three to fill positions
in accounting and operations by the end of FY19, and then declined by one position during July 2019 due to the prior Executive Director switching agencies within the government.
b. CCDA plans to make one additional hire to serve as the Deputy Director of the agency during the fiscal year.
2. Payroll: Disbursements are forecast to be $0.7M for FY20. YTD payroll is $0.2M. a. YTD run rate for payroll is slightly above FY20
forecast; however, it is in line with management’s board approved budget. CCDA has a pending reapportionment request to shift expenses from purchased services to payroll so they can disburse funds accordingly.
29 Appendix includes reconciliation between AAFAF reported cash figures and the figures in this report.
8
9 9
10 10 10 10
11 11 11 11
10 10
Aug-18 Mar-19Sep-18 Oct-18 May-19Nov-18 Dec-18 Jan-19 Jul-19Feb-19 Apr-19 Jun-190
5
10
15
20
Aug-19
No
. of
Emp
loye
es
CCDA Headcount
Aug-19 Jan-20Oct-19
14
Nov-19
12
Dec-19 Feb-20 May-20
16
Mar-20 Apr-20Jun-19 Sep-19 Jun-20Jul-190
2
4
6
8
10
18
20
8.1 8.3
8.1
8.8 (0.7)
Draft FY20 Liquidity Plan
YTD Actuals
CCDA Liquidity
Mill
ion
s o
f U
S D
olla
rs

38
XIV. PUERTO RICO CONVENTION CENTER DISTRICT AUTHORITY (“CCDA”) (Continued) C. Full Year FY20 Sources and Uses of Funds
1. Sources $40.0M: a. Operating receipts total $30.8M, consisting of
income from the PR Coliseum, the Convention Center, and other rental income.
b. Intergovernmental receipts make up $6.0M of total sources of funds, which relates to room tax payments made to CCDA by the Tourism Company of Puerto Rico.
c. Other receipts account for $3.1M of total receipts, which represent sale of land owned by CCDA.
2. Uses ($40.0M): a. Operating expenses combine to ($36.2M), with
purchased services and facilities payments accounting for ($35.6M) of total operating expenditures.
b. CapEx of ($3.1M), utilized for maintaining the quality of owned assets on the Island.
c. Payroll and related costs for FY20 are ($0.7M). D. Accounts Receivable / Accounts Payable30
1. Accounts Receivable: a. $1.5M decrease from Jun-19 to Aug-19 driven by
collection of Room Tax transfers (Law 272) from Tourism.
2. Accounts Payable: a. $2.4M increase from Jun-19 to Aug-19 driven by
increased purchases with various inter-governmental agencies to support event schedule.
3. Working Capital: a. $3.9M source of cash from Jun-19 to Aug-19
driven by the working capital changes listed above.
30 Figures are unaudited and subject to change.
0.7
Beginning Cash
6.0
30.8
Ending Cash
3.1
1. Sources
36.2
3.1
2. Uses
8.1
8.1
40.0
IntergovernmentalCapEx
CCDA Sources and Uses
Operating
Operating
Note: Beginning and ending cash as presented in Section A.
Millions of US Dollars
Other
(40.0)
Payroll & Related Costs
4.2
6.8
11.411.4
9.7
A/R August ’19A/R June ’19
1.8
7.9
2.02.6
A/P June ’19
6.2
3.0
A/P August ’19
9.9
9.2
Intergovernment 3rd Party
CCDA Working CapitalMillions of US Dollars

39
XV. PUERTO RICO ADMINISTRATION FOR THE DEVELOPMENT OF AGRICULTURAL ENTERPRISES (“ADEA”) Primary Business Activity: ADEA provides services to the agricultural sector, with the goal of supporting its economic development. Services include: rural infrastructure development, providing incentives and subsidies to the industry, agricultural product market making, and other related services. Key Takeaways: Operations at ADEA related to coffee market making are in line with trends established at the end of FY19, while school cafeteria receipts are ahead of last year due to timing. For the year-to-date period ending August 2019, ADEA had a $1.4M in positive cash flow and ended the period with a $68.2M cash balance. ADEA projects to end FY20 with $72.4M cash balance. A. FY20 Operating Liquidity – Actuals31 and Draft FY20
Liquidity Plan 1. $1.4M YTD actuals:
a. $10.8M in receipts from coffee market making operations, in line with the same period the previous year.
b. $6.0M in receipts from school cafeteria program, which was $3.9M ahead of the same period the previous year.
c. $8.5M in receipts from the General Fund. d. $1.4M in other receipts, including $1.1M related
to infrastructure, and $0.2M from production of seeds.
e. ($2.3M) in payroll-related expenses. f. ($3.2M) in subsidies and contributions to non-
government entities, which is below the ($9.1M) from the same period the previous year, primarily due to timing of payments.
g. ($10.5M) in other expenses, of which ($5.7M) is related to the coffee market making program, ($4.6M) is related to the school cafeteria program, and ($0.2M) is related to the seed distribution program.
h. ($7.5M) is related to rural infrastructure investments. i. ($1.8M) is related to other vendors, including WIC/OPPEA.
2. $4.2M cash build for the balance of the fiscal year based on the draft FY20 Liquidity Plan. a. $110.7M forecast in total receipts led by $66.6M in operating receipts and $44.1M in intergovernmental receipts.
Forecasted operating receipts are driven by $51.0M in coffee market making operations, $12.4M in school cafeteria programs, and $3.2M in other receipts.
b. ($106.5M) forecast in total disbursements, led by ($49.0M) in other operating expenses related to the coffee market making operations and school cafeteria programs, ($38.6M) in incentives and subsidy programs, ($5.6M) in payroll, ($3.8M) in PayGo, and ($9.5M) in other expenses.
B. Headcount / Payroll
1. Headcount FTEs: Decreased from 385 to 375 from Aug-18 to Aug-19. a. Drop in headcount over the trailing twelve months
is attributable to the VTP and attrition. 2. Payroll: Disbursements are forecast to be $7.2M for
FY20 based on the draft Liquidity Plan. a. YTD payroll of $2.3M is tracking inline with draft
Liquidity Plan.
31 Appendix includes reconciliation between AAFAF reported cash figures and the figures in this report.
May-19Nov-18 Dec-18 Jan-19
350
Feb-19 Mar-19
450
Jun-190
50
Jul-19Oct-18
400
Apr-19
500
Aug-18 Sep-18 Aug-19
380 372386
370385
370 372370 371 375371385
374
ADEA Headcount
No
. of
Emp
loye
es
Jul-19Jun-19
70
Sep-19 Oct-190
Nov-19 Dec-19 Jan-20 Jun-20Mar-20 Apr-20 May-20
80
75
5
65
Aug-19 Feb-20
66.0
68.2
72.4
66.8+4.2
Draft FY20 Liquidity Plan
YTD Actuals
ADEA Liquidity
Mill
ion
s o
f U
S D
olla
rs

40
XV. PUERTO RICO ADMINISTRATION FOR THE DEVELOPMENT OF AGRICULTURAL ENTERPRISES (“ADEA”) (Continued) C. Full Year FY20 Sources and Uses of Funds
1. Sources $137.4M: a. $84.8M in operating receipts comprised of
$61.7M in coffee market making operations, $18.4M in school cafeteria programs, and $4.7M in other receipts.
b. $52.6M in intergovernmental transfers. 2. Uses ($131.8M):
a. ($127.8M) in operating disbursements include ($59.5M) of other operating expenses primarily related to the school cafeteria and coffee programs, payroll of ($7.2M), incentives and subsidy programs of ($41.8M), other vendor payments of ($4.8M), rural infrastructure spending of ($11.3M), and facilities and payments to public services of ($0.8M). Other expenses, including pass-through disbursements tied to government programs, of ($2.4M).
b. ($3.8M) in PayGo charges. c. ($0.2M) in CapEx.
D. Accounts Receivable / Accounts Payable32
1. Accounts Receivable: a. $4.6M increase from Jun-19 to Aug-19.
2. Accounts Payable: a. $15.7M increase in A/P from Jun-19 to Aug-19
driven an increase in payables related to government services, including facilities, of $7.9M; a $4.7M increase in payables related to rural infrastructure development; and a $3.2M increase in payables related to subsidy and other payments. The last two are timing related and are expected to reverse.
3. Working Capital: a. The change in net working capital through Jul-19
is a positive $11.2M due to the above changes.
32 Figures are unaudited and subject to change.
1. SourcesBeginning Cash
(3.8)
84.8
52.6
(127.8)
2. Uses Ending Cash
137.4
66.8 0.2
72.4
CapEx / OtherIntergovernmental
Operating
Operating
ADEA Sources and Uses
Note: Beginning and ending cash as presented in Section A.
Millions of US Dollars
(131.8)
PayGo
A/R August ’19A/R June ’19 A/P June ’19
53.9
A/P August ’19
28.3
58.5
44.0
Total
ADEA Working CapitalMillions of US Dollars

41
XVI. AUTOMOBILE ACCIDENT COMPENSATION ADMINISTRATION (“ACAA”) Primary Business Activity: ACAA administers insurance for health services and compensation to benefit victims of car accidents and their dependents. ACAA pays for medical-hospital services offered by third party providers and compensates victims and dependents of deceased victims who were involved in an accident. Key Takeaways: ACAA began FY20 with $20.2.M in operating cash, and its cash balance has reduced to $17.5M by August month end. During the month of August, the cash position increased from the end of July due to receiving insurance premiums from both the current and prior month: as noted in last month’s commentary, no collections took place during July. Additionally, ACAA’s headcount decreased significantly throughout FY19 due to employees entering VTP III, and has experienced further turnover during August due to back-office employees entering a separate early retirement program offered by ACAA management. A. FY20 Operating Liquidity – Actuals and Draft FY20
Liquidity Plan 1. ($2.7M) YTD actuals:
a. $7.5M in operating receipts, consisting of $7.2M in insurance premiums, $0.2M in recoveries, and $0.1M of rental income.
b. ($4.9M) in operating disbursements, consisting of ($3.8M) in claims-related disbursements, ($0.6M) in professional service fees, and ($0.5M) in other operating expenses.
c. ($3.1M) in payroll and related costs, which is slightly under the budgeted run rate for FY20.
d. ($2.1M) of PayGo disbursements, which pertain to FY19 May and June invoices.
2. $0.1M cash build for the balance of the fiscal year based on the draft FY20 Liquidity Plan: a. Liquidity position for the remainder of the year
will primarily depend on the speed in which ACAA chooses to rehire positions for retired employees.
B. Headcount / Payroll
1. Headcount FTEs: Decreased from 341 to 312 from Aug-18 to Aug-19. a. Decline in headcount is due to back office
employees entering an early retirement program offered by ACAA.
2. Payroll: Disbursements are forecast to be $20.3M for FY20. YTD payroll is $3.1M. a. YTD run rate for payroll is slightly behind FY20
forecast, due to decline in headcount detailed above. Currently, there is no approved plan to rehire these positions.
340
Sep-18
350
Dec-18Aug-18
300
Oct-18 Nov-18 Jan-19 Feb-19 Jul-190
Mar-19 Apr-19 Aug-19
10
May-19 Jun-19
310
320
330326 326
317 317
330
317
341 342
317 317
312
341
317
No
. of
Emp
loye
es
ACAA Headcount
Sep-19 Apr-20Mar-20Jun-19 Jan-20Aug-19Jul-19
25
May-20Oct-19 Nov-19
20
Dec-19 Feb-20
5
Jun-200
10
15
30
17.5 17.6
20.2
16.7
+0.1
ACAA Liquidity
Mill
ion
s o
f U
S D
olla
rs
Draft FY20 Liquidity Plan
YTD Actuals

42
XVI. AUTOMOBILE ACCIDENT COMPENSATION ADMINISTRATION (“ACAA”) (Continued) C. Full Year FY20 Sources and Uses of Funds
1. Sources $85.1M: a. $83.6M in insurance premium collections,
representing 98.3% of total sources of cash. b. $1.0M in insurance recoveries, representing 1.2%
of total sources of cash. c. $0.5M in other operating receipts, which relates
to rental income ACAA generates from leasing floors in their building.
2. Uses ($87.7M): a. ($53.6M) in operating expenses, which consist of
($42.2M) in claims-related disbursements and contributions to other government entities, ($7.5M) in purchased services, ($2.5M) in professional service fees, and ($1.5M) in additional operating expenses.
b. ($20.3M) in payroll and related costs for 312 ACAA employees.
c. ($13.7M) of PayGo disbursements for retirement of previous employees. D. Accounts Receivable / Accounts Payable
1. Information not available.
0.5
Beginning Cash
(53.6)
83.6
(13.7)
1. Sources
1.0
17.6
(20.3)
2. Uses Ending Cash
20.2
85.1
PayGo
Premium Collections
Operating
ACAA Sources and Uses
Note: Beginning and ending cash as presented in Section A.
Millions of US Dollars
Other
Payroll & Related Costs
(87.7)
Recoveries

43
XVII. PUBLIC HOUSING ADMINISTRATION (“PHA”) Primary Business Activity: PHA provides affordable housing, rental assistance, and homeownership programs to families and persons with disabilities. PHA hires outside service providers to conduct various activities related to maintaining the livability of public housing on the Island. Key Takeaways: Information not available. A. FY20 Operating Liquidity – Actuals33 and Draft FY20 Liquidity Plan
1. Information not available.
B. Headcount / Payroll34
1. Headcount FTEs: Decreased from 350 to 321 from Aug-18 to Aug-19.
2. Payroll: YTD payroll is $2.5M.
33 Appendix includes reconciliation between AAFAF reported cash figures and the figures in this report. 34 PHA is a central government agency and reported on the 2(B) for headcount and payroll figures; the entity operates within the RHUM system.
Feb-19 Jul-19
260
280
Dec-18Aug-18
360
Oct-18Sep-18 Nov-18 Jan-19 Mar-19 Apr-19 May-19 Jun-19 Aug-190
20
40
300
320
340
380
400
321
343349 348
321
351343
321
350
324320
325320
No
. of
Emp
loye
es
PHA Headcount

44
XVII. PUBLIC HOUSING ADMINISTRATION (“PHA”) (Continued) C. Full Year FY20 Sources and Uses of Funds
1. Information not available. D. Accounts Receivable / Accounts Payable35
1. Information not available.
35 Figures are unaudited and subject to change.

45
XVIII. CENTRAL OFFICE FOR RECONSTRUCTION AND RECOVER OF PUERTO RICO (“COR3”) Primary Business Activity: COR3 manages FEMA Federal Public Assistance and disaster-related available resources for government entities and eligible sub-recipients and provides technical support regarding recovery-related resources and Federal compliance requirement matters. COR3 acts as a pass-through entity receiving federal funds and making disbursements for approved rebuilding activities. Key Takeaways: In August 2019, COR3 drew down and disbursed FEMA-approved funds of $2.0M and $5.4M respectively to numerous government instrumentalities, municipalities, and component units, including the Commonwealth’s Central Government. For FY20 through August, COR3 has drawn and disbursed FEMA-approved funds of $125.3M and $121.5M. These funds pertain to FEMA Public Assistance, and mainly relate to the two Programs ‘A’ and ‘B’ (see Section C) as FEMA Individual Assistance funds are not administered by COR3, and are disbursed by FEMA directly to the recipients. Management understands that during FY20, COR3 will experience noticeable activity and disbursements pertaining to the 5 Programs ‘C’ through ‘G’ (see Section C). No Liquidity Plan has been established for FY20, nor will a Liquidity Plan be necessary, as COR3 acts as a pass-through entity and does not disburse nor transfer out funds prior to having these transferred in from FEMA.
A. FY20 Operating Liquidity – Actuals36
1. $3.8M YTD actuals: a. $91.5M cash receipts pertaining to FEMA Public
Assistance. b. $33.8M cash receipts from state cost-share
contributions and other receipts. c. ($94.9M) in FEMA Public Assistance
disbursements to sub-grantees. d. ($26.6M) in state-funded disbursements to sub-
grantees. B. Headcount / Payroll
1. Headcount FTEs: Increased from 50 to 94 from Aug-18 to Aug-19. a. The increase in FTEs was expected, given the
buildup of required infrastructure for the tracking of FEMA projects and general compliance and monitoring of federal funds that will continue to be disbursed through COR3 for the recovery efforts.
b. Multiple FTEs are also tasked with providing guidance to sub-recipients on available FEMA programs as well as guidance on how to proceed with the required compliance documentation.
36 Appendix includes reconciliation between AAFAF reported cash figures and the figures in this report.
50 51 52 52 53 53
6063
72 72
88
93 94
Aug-18 Sep-18 Oct-18 Jul-19Nov-18
100
Dec-18 Jun-19
60
Jan-19 Apr-19Feb-19 May-190
10
20
Aug-19
50
30
40
70
80
90
Mar-19
No
. of
Emp
loye
es
COR3 Headcount
Aug-19 Jan-20Jul-19 May-20 Jun-20
10
5
Apr-200
Mar-20Feb-20
75
15
Dec-19Nov-19
105
80
Oct-19Sep-19
90
95
100
110
Jun-19
115
120
85
99.0
95.691.8
COR3 Liquidity
Mill
ion
s o
f U
S D
olla
rs
Draft FY20 Liquidity Plan
YTD Actuals

46
XVIII. CENTRAL OFFICE FOR RECONSTRUCTION AND RECOVER OF PUERTO RICO (“COR3”) (Continued) C. Full Year FY20 Sources and Uses of Funds
1. FEMA Public Assistance Programs are broken down into two different tranches. These tranches consist of Disaster Recovery programs and Permanent Work programs, both of which are outlined below: a. FEMA Public Assistance Programs ‘A’ and ‘B’ Disaster Recovery:
1. Category A – Debris Removal. 2. Category B – Emergency Protective Measures.
b. FEMA Public Assistance Programs: (‘C’ – ‘G’) Permanent Work: 1. Category C – Roads and Bridges. 2. Category D – Water Control Facilities. 3. Category E – Buildings and Equipment. 4. Category F – Utilities. 5. Category G – Parks, Recreational, and Other.
D. Accounts Receivable / Accounts Payable37
1. Not applicable.
37 Figures are unaudited and subject to change.

47
XIX. UNIVERSITY OF PUERTO RICO (“UPR”) Primary Business Activity: UPR is a state-supported university system created by the Law No. 1 of January 20, 1966, “Law of the University of Puerto Rico” (“Act No. 1”), as amended. UPR is responsible for serving the people of Puerto Rico to contribute to the development and enjoyment of the fundamental, ethical, and aesthetic values of Puerto Rican culture by providing high-quality education and creating new knowledge through research and exploration of the Arts, Sciences, and Technology. Key Takeaways: For the second month of fiscal year 2020, UPR generated positive $5.7M in net cash flow and ended the month of August with a cash balance of $319.0M. Year to date, UPR has had a positive net cash flow variance after debt service of $11.0M compared to forecast driven by lower-than-expected spending, and partially offset by lower campus-generated and federal fund receipts during the second month of the fiscal year. Technical system issues at the University also led to the delay in processing payments to vendors. Management is addressing the issues, and variances are expected to be more in line within the next month.
A. FY20 Operating Liquidity – Actuals38 and FY19 Actuals through the same time period (Aug-18)
1. $0.2M YTD actuals: a. ($13.5M) variance in total receipts, driven by:
1. ($8.1M) in central government appropriations due to a reduction of General Fund Appropriation designated for UPR from the Commonwealth’s Certified Budget.
2. $3.8M in operating receipts which are mostly in line with FY18.
3. ($9.2M) in federal fund receipts due to a timing variance.
b. $13.3M variance in total disbursements, driven by: 1. $9.6M in operating disbursements, with the
majority in payroll of $6.4M due to decreased headcount and $4.2M in Scholarships & Donations, due to timing variances.
2. $1.9M in CapEx due to timing variances in the projected start date of projects. 3. $1.7M in Debt related disbursements, which is in-line with FY18.
B. Headcount / Payroll
1. Headcount FTEs: Decreased from 11,449 to 10,520 from Aug-18 to Aug-19. a. By campus: Decrease in headcount is primarily
due to decreases at the Rio Piedras of (449) and at Mayaguez of (148).
b. By category: Decrease in headcount is primarily due decreases in permanent teachers at (591) and contracted teachers at (492), partially offset by increases in temporary staff at 170.
2. Payroll: Disbursements for Aug-19 are $57.3M.
38 Appendix includes reconciliation between AAFAF reported cash figures and the figures in this report.
9,600
9,200
9,800
May-19Aug-18
12,400
Jan-19Sep-18 Oct-18 Mar-19Nov-18
200
Dec-18 Aug-19
9,400
Apr-19
12,200
Feb-19
10,200
Jun-19 Jul-19
12,000
0
11,200
400
10,000
10,400
10,600
10,800
11,000
11,400
11,600
11,800
12,600
600
11,695
10,520
11,742
11,43211,504 11,514
10,400
11,109
9,806
11,745
11,449
11,068
11,503
No
. of
Emp
loye
es
UPR Headcount
Oct-19 Apr-20Dec-19 Jan-20
300
10
Feb-20 Mar-20 May-20 Jun-20Jun-190
Jul-19 Aug-19 Nov-19
280
Sep-19
310
320
340
330
290
302.8
308.0
302.6
313.3
319.0
313.3
321.4
UPR Liquidity
Mill
ion
s o
f U
S D
olla
rs
Draft FY20 Liquidity Plan
YTD Actuals

48
XIX. UNIVERSITY OF PUERTO RICO (“UPR”) (Continued) C. Full Year FY20 Sources and Uses of Funds
1. Sources $1,310.6: a. $559.9M in General Fund appropriations from the
central government. b. Operating receipts total $419.9M, comprised of
$195.6M in tuition receipts, $155.5M in campus-generated inflows, $66.3M in slot machine revenues remitted to UPR from Tourism, and $2.5M in all other.
c. Disaster-related receipts of $40.0M are a result of anticipated funding from FEMA. Inflows are completely offset by $40.0M in projected outflows.
d. Federal funds received for federally supported UPR projects and programs total $290.8M.
2. Uses ($1,310.6M): a. Operating disbursements total ($1,175.9M),
driven by gross payroll and pensions of ($709.3M), scholarships and donations of ($215.6M), vendor payments to PREPA ($27.5M), and all other vendor payments ($223.4M).
b. Total CapEx is ($46.5M), debt service totals ($48.2M), and projected pass-through outflows of FEMA funds totals ($40.0M). D. Accounts Receivable / Accounts Payable39
1. Accounts Receivable: a. $83.2M increase from Jun-19 to Aug-19, driven by
$60.8 increase in third party receivables, mostly due to the increase in tuition and student fees resulting from the commencement of a new school year.
2. Accounts Payable: a. $33.0M increase from Jun-19 to Aug-19 driven by
increases in supplier payables. 3. Working Capital:
a. The change in net working capital through Aug-19 was a use of cash at ($50.2M) due to the above changes.
39 Figures are unaudited and subject to change.
(1,175.9)
Beginning Cash 1. Sources
290.8
559.9
(94.7)
Ending Cash
419.9
40.0
2. Uses
313.3
1,310.6
313.3
40.0
Operating
Operating
UPR Sources and Uses
Note: Beginning and ending cash as presented in Section A.
Millions of US Dollars
Central Government Appropriations
CapEx / Other
(1,310.6)
Disaster-Related
OtherDisaster-Related
A/R August '19
35.9
120.7
21.3
2.9
76.9
16.1
43.8
A/R June '19
17.5
A/P June '19
17.6
A/P August '19
53.5
37.4
20.5
UPR Working CapitalMillions of US Dollars
Intergovernment 3rd Party

49
APPENDIX A: RECONCILIATION BETWEEN JULY 2019 AAFAF REPORTED FIGURES40 AND THE FIGURES IN THIS REPORT41
40 AAFAF reported figures as per "Summary of Bank Account Balances for the Government of Puerto Rico and its Instrumentalities" report dated
[Month] [Day], [Year]. 41 This report is prepared based on reported operational cash balances as of August 30, 2019, and there are two types of reconciliation differences between the sources of information: timing differences produced by the account delays, or cash being held in nonoperational bank accounts.
Millio
ns o
f US D
olla
rs
Varian
ce d
ue
to:
AA
FAF R
ep
orte
dA
ctual B
alance
No
no
pe
ration
al
CO
MP
ON
ENT U
NIT
Balan
ce (a)
8/30/19V
ariance
Timin
g A
ccou
nts
Co
mm
en
ts
PU
ERTO
RIC
O P
OR
TS AU
THO
RITY
("PO
RTS")
37.3
33.4
3.9
0.0
3.9
$3.9M o
f restricte
d cash
is exclu
de
d fro
m P
orts o
pe
rating cash
.
MED
ICA
L SERV
ICES A
DM
INISTR
ATIO
N
("ASEM
") (b)
44.2
-
44.2
44.2
-
CU
has n
ot p
rovid
ed
actual re
sults fo
r Au
g-19.
PU
ERTO
RIC
O IN
TEGR
ATED
TRA
NSIT A
UTH
OR
ITY
("PR
ITA")
10.0
12.3
(2.3)
0.0
(2.3)
$2.3M h
eld
in a n
on
-op
eratio
nal acco
un
t, wh
ich h
as yet to
be
accou
nte
d fo
r in A
AFA
F's inve
nto
ry of acco
un
ts.
STATE IN
SUR
AN
CE FU
ND
CO
RP
OR
ATIO
N
("FON
DO
") (b)
336.4
336.1
0.3
(0.0)
0.3
No
n-o
pe
ration
al accou
nts p
ertain
to p
etty lu
nch
/transp
ortatio
n e
xpe
nse
accou
nts fo
r inju
red
wo
rkers n
ot
con
side
red
in th
e cash
flow
.
HEA
LTH IN
SUR
AN
CE A
DM
INISTR
ATIO
N
("ASES") (b
)349.9
-
349.9
349.9
-
CU
has n
ot p
rovid
ed
actual re
sults fo
r Au
g-19.
HIG
HW
AYS A
ND
TRA
NSP
OR
TATIO
N A
UTH
OR
ITY
("HTA
")352.1
254.4
97.8
(0.2)
97.9
$84.0M in
no
n-o
pe
ration
al accou
nts p
rimarily e
armarke
d fo
r de
bt se
rvice an
d $13.9M
in re
stricted
accou
nts, b
oth
no
t inclu
de
d in
HTA
's cash flo
w.
PU
ERTO
RIC
O P
UB
LIC B
UILD
ING
S AU
THO
RITY
("PB
A")
80.4
55.9
24.5
(3.0)
27.5
Fun
ds h
eld
in n
on
-op
eratio
nal acco
un
ts at PB
A are
earm
arked
for th
e fo
llow
ing: $12.9M
for d
eb
t service
for
bo
nd
s pe
rtainin
g to R
eso
lutio
n 468, $7.3M
for d
eb
t service
for b
on
ds re
lated
to C
on
structio
n Se
ries R
and
N, an
d
$7.3M in
oth
er re
stricted
cash acco
un
ts.
CA
RD
IOV
ASC
ULA
R C
ENTER
OF P
UER
TO R
ICO
AN
D TH
E CA
RIB
BEA
N ("C
ardio
")12.1
-
12.1
12.1
-
CU
has n
ot p
rovid
ed
actual re
sults fo
r Au
g-19.
PU
ERTO
RIC
O IN
DU
STRIA
L DEV
ELOP
MEN
T
CO
MP
AN
Y ("PR
IDC
O")
169.9
149.6
20.3
-
20.3
Re
stricted
/no
n-o
pe
rating cash
no
t con
side
red
accou
nt fo
r $20.3M o
f AA
FAF w
eb
cash, re
pre
sen
ting In
cen
tive
Fun
ds an
d o
the
r PR
IDC
O n
on
-op
eratin
g/rese
rve acco
un
ts man
aged
on
be
half o
f the
cen
tral gove
rnm
en
t.
HO
USIN
G FIN
AN
CE A
UTH
OR
ITY
("HFA
") (b)
57.9
-
57.9
57.9
-
CU
has n
ot p
rovid
ed
actual re
sults fo
r Au
g-19.
PU
ERTO
RIC
O TO
UR
ISM C
OM
PA
NY
("TOU
RISM
")138.5
43.3
95.2
-
95.2
Fun
ds in
no
n-o
pe
ration
al accou
nts co
nsist o
f $79.9M in
restricte
d acco
un
ts and
$15.3M in
Tou
rism su
bsid
iary
accou
nts n
ot in
clud
ed
in To
urism
op
eratin
g cash.
FISCA
L AG
ENC
Y AN
D FIN
AN
CIA
L AD
VISO
RY
AU
THO
RITY ("A
AFA
F")62.4
69.5
(7.1)
1.0
(8.1)
AA
FAF Title
III Ban
k Acco
un
t is no
t con
side
red
in A
AFA
F's inve
nto
ry of acco
un
ts, accou
nt o
pe
ne
d d
urin
g Au
gust
2019.
DEP
AR
TMEN
T OF EC
ON
OM
IC D
EVELO
PM
ENT
AN
D C
OM
MER
CE ("D
DEC
")20.7
20.5
0.2
(0.2)
0.4
No
n-o
pe
ration
al cash d
oe
s no
t be
lon
g to D
DEC
, bu
t pe
rtains to
"Pu
erto
Las Am
ericas".
CO
NV
ENTIO
N C
ENTER
DISTR
ICT A
UTH
OR
ITY
("CC
DA
")15.4
8.8
6.6
-
6.6
No
n-o
pe
ration
al accou
nts in
clud
e $6.6M
in sp
ecial p
urp
ose
fun
ds fro
m ticke
t sales th
at do
no
t be
lon
g to C
CD
A.
PU
ERTO
RIC
O A
GR
ICU
LTUR
AL D
EVELO
PM
ENT
AD
MIN
ISTRA
TION
("AD
EA")
84.7
68.2
16.5
0.0
16.5
$16.5M in
no
n-o
pe
ration
al accou
nts n
ot re
po
rted
in C
U cash
balan
ces.
AU
TOM
OB
ILE AC
CID
ENT C
OM
PEN
SATIO
N
AD
MIN
ISTRA
TION
("AC
AA
")137.7
17.5
120.2
0.0
120.2
No
n-o
pe
ration
al accou
nts co
nsist o
f $120.2M, w
hich
are in
vestm
en
t accou
nts m
anage
d b
y a third
party to
main
tain A
CA
A's liq
uid
ity rese
rve.
PU
BLIC
HO
USIN
G A
DM
INISTR
ATIO
N ("P
HA
")513.6
-
513.6
-
-
CU
has n
ot p
rovid
ed
actual re
sults fo
r Au
g-19.
OFFIC
E FOR
REC
OV
ERY, R
ECO
NSTR
UC
TION
, AN
D
RESILEN
CY ("C
OR
3")95.6
95.6
-
-
-
UN
IVER
SITY OF P
UER
TO R
ICO
("UP
R")
427.7
319.0
108.7
2.4
106.3
Fun
ds h
eld
in n
on
-op
eratio
nal acco
un
ts at UP
R in
clud
e: $52.9M
for d
eb
t service
ob
ligation
s, $36.8 for th
e U
PR
Co
mp
on
en
t Un
its and
$ 16.6M in
oth
er re
stricted
cash acco
un
ts from
UP
R cam
pu
s.
----------------------------------------------------------------------------------------------------------------------------------------------------------------------------------------
No
tes (8/3
0/1
9):
(a) A
AFA
F repo
rted b
ala
nce a
s of 8
/30
/19
.
(b) A
SEM, Fo
nd
o, A
SES , an
d H
FA rep
ort b
oo
k ba
lan
ces, an
d th
erefore th
ere ma
y be va
rian
ces relatin
g to
timin
g o
f ou
tstan
din
g ch
ecks an
d o
ther a
ccou
ntin
g a
dju
stmen
ts.

50
APPENDIX B: HEADCOUNT SUMMARY FOR COMPONENT UNITS COVERED IN THIS REPORT
COMPONENT UNIT M/E Aug-18 M/E Sep-18 M/E Oct-18 M/E Nov-18 M/E Dec-18 M/E Jan-19 M/E Feb-19 M/E Mar-19 M/E Apr-19 M/E May-19 M/E Jun-19 M/E Jul-19 M/E Aug-19
PUERTO RICO PORTS AUTHORITY
("PORTS")
501 501 499 499 485 479 478 478 479 478 476 474 474
MEDICAL SERVICES ADMINISTRATION
("ASEM")
1,626 1,630 1,616 1,613 1,549 1,525 1,525 1,506 1,498 1,495 1,502 1,506 1,501
PUERTO RICO INTEGRATED TRANSIT AUTHORITY
("PRITA") (a)
876 881 879 873 864 849 848 847 846 848 847 843 854
STATE INSURANCE FUND CORPORATION
("FONDO")
2,858 2,852 2,844 2,756 2,765 2,717 2,714 2,718 2,714 2,712 2,712 2,708 2,702
HEALTH INSURANCE ADMINISTRATION
("ASES")
60 57 58 58 58 57 57 57 56 57 57 58 58
HIGHWAYS AND TRANSPORTATION AUTHORITY
("HTA")
991 946 930 900 895 895 895 894 892 890 888 887 883
PUERTO RICO PUBLIC BUILDINGS AUTHORITY
("PBA") (a)
1,094 1,093 1,092 1,091 1,029 1,002 1,001 998 997 995 992 992 985
CARDIOVASCULAR CENTER OF PUERTO RICO AND
THE CARIBBEAN ("CARDIO") (f)
563 561 568 551 542 536 536 551 546 544 551 548 548
PUERTO RICO INDUSTRIAL DEVELOPMENT
COMPANY ("PRIDCO") (b)
188 188 187 144 147 147 146 145 145 147 148 148 146
HOUSING FINANCE AUTHORITY
("HFA")
145 145 141 141 139 140 140 140 141 139 147 147 131
PUERTO RICO TOURISM COMPANY
("TOURISM")
376 376 377 378 z 377 z 373 z 372 z 372 z 373 z 373 z 371 z 370 z 369
FISCAL AGENCY AND FINANCIAL ADVISORY
AUTHORITY ("AAFAF")
69 68 70 76 77 77 79 79 81 84 83 80 77
DEPARTMENT OF ECONOMIC DEVELOPMENT AND
COMMERCE ("DDEC")
156 156 147 190 187 186 330 330 330 330 330 330 330
CONVENTION CENTER DISTRICT AUTHORITY
("CCDA") (f)
8 9 9 10 10 10 10 11 11 11 11 10 10
PUERTO RICO AGRICULTURAL DEVELOPMENT
ADMINISTRATION ("ADEA")
385 386 374 385 380 371 370 370 370 371 372 372 375
AUTOMOBILE ACCIDENT COMPENSATION
ADMINISTRATION ("ACAA") (d)
N/A N/A N/A N/A N/A 317 317 317 317 317 317 317 312
PUBLIC HOUSING ADMINISTRATION (“PHA”) (e) N/A N/A N/A N/A N/A N/A 335 335 336 336 335 335 321
CENTRAL RECOVERY AND RECONSTRUCTION
OFFICE (“COR3”) (e) (f)
N/A N/A N/A N/A N/A N/A 60 63 72 72 88 88 94
UNIVERSITY OF PUERTO RICO ("UPR") (g) N/A N/A N/A N/A N/A N/A N/A N/A N/A 11,109 10,400 10,400 10,520
TOTAL 9,896 9,849 9,791 9,665 9,504 9,681 10,213 10,211 10,204 21,308 20,627 20,613 20,690
-----------------------------------------------------------------------------------------------------------------------------------------------------------------------------------------------------------------------------------------------------------------------------------------------------------------------Notes:
(a) Estimate for June and July Month End.
(b) PRIDCO not a CU tracked in FY18.
(c) Not all CUs captured multiple pay periods in Oct-18, causing a timing variance and an expected increase in payroll in Nov-18.
(d) ACAA started reporting FY19 headcount in Jan-19. Prior month's payroll and headcount information not included.
(e) PHA and COR3 started reporting FY19 headcount in Feb-19.
(f) CARDIO, CCDA, and COR3 did not report payroll in Feb-19.
(g) UPR started reporting FY19 headcount in May-19. Prior month's payroll and headcount information not included.
51.3
56.3
63.0
56.3
40.0
58.4 59.8
54.8
48.6 49.8 50.7
134.6
110.6
94.9
107.6
10,073 10,220 9,896 9,849 9,791 9,665 9,504 9,681
10,213 10,211 10,204
21,308
20,627 20,690 20,690
-
20.0
40.0
60.0
80.0
100.0
120.0
140.0
160.0
8,000
10,000
12,000
14,000
16,000
18,000
20,000
22,000
24,000
M/EJUN-18
M/EJUL-18
M/EAUG-18
M/ESEP-18
M/EOct-18 (c)
M/ENov-18
M/EDec-18
M/EJan-19 (d)
M/EFeb-19 (e)
M/EMar-19
M/EApr-19
M/EMay-19 (g)
M/EJun-19
M/EJul-19
M/EAug-19
Mil
lio
ns
of U
S D
olla
rs
Nu
mb
er
of E
mp
loye
es
Component Unit Headcount and Payroll
Payroll Headcount