Embed Size (px)
Citation preview
Environment and Energy Statistics Workshop for the Arab Region.
Amman, Jordan 8-12 September 2013
Environment and Energy Statistics Branch, United Nations Statistics Division
2. Environmental
Resources and
their Use
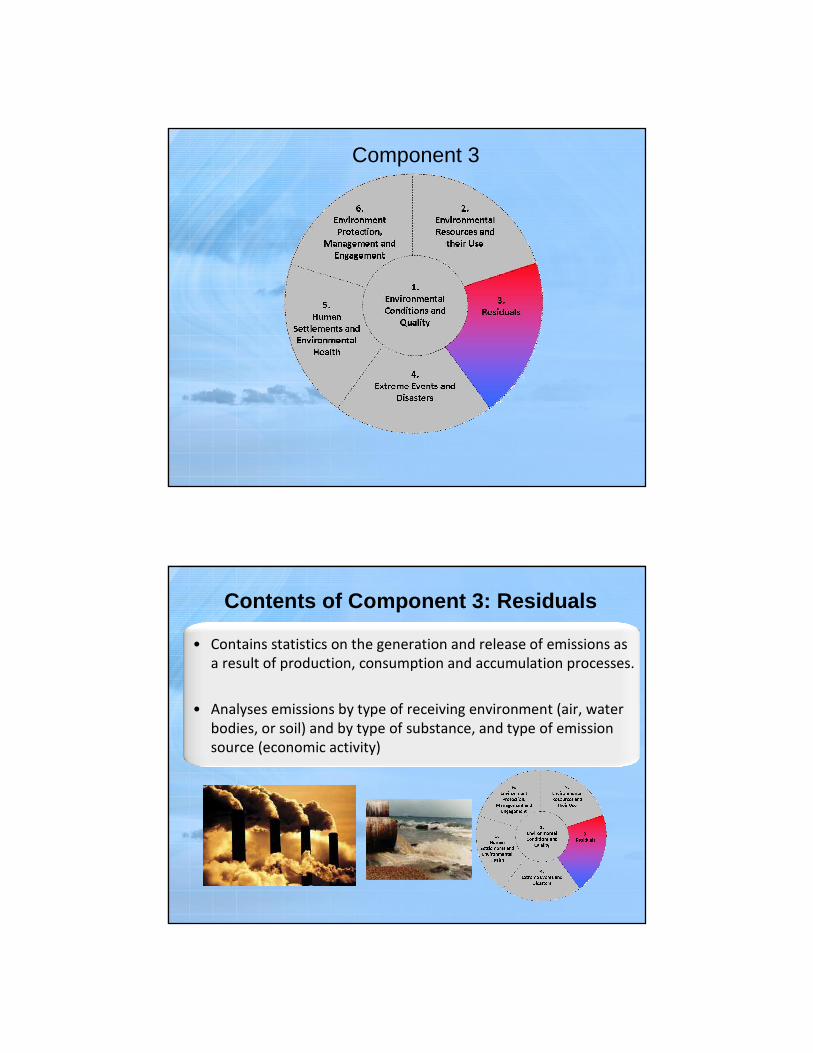
3.
Residuals
4.
Extreme Events
and Disasters
6.
Environment
Protection,
Management and
Engagement
5.
Human
Settlements and
Environmental
Health
1.
Environmental
Conditions and
Quality
Components, sub-components and statistical topics of the FDES 2013
Part 1
• This presentation has been elaborated by the Environment Statistics Section of the United Nations Statistics Division.
• It is mainly based on Chapter 3 of the Framework for the Development of Environment Statistics (FDES) 2013 that can be downloaded here: http://unstats.un.org/unsd/statcom/doc13/BG-FDES-Environment.pdf
• All presentations, handouts and background materials for the workshop can be downloaded here: http://unstats.un.org/unsd/ENVIRONMENT/otherworkshops.htm
2. Environmental
Resources and
their Use
3.
Residuals
4.
Extreme Events
and Disasters
6.
Environment
Protection,
Management and
Engagement
5.
Human
Settlements and
Environmental
Health
1.
Environmental
Conditions and
Quality
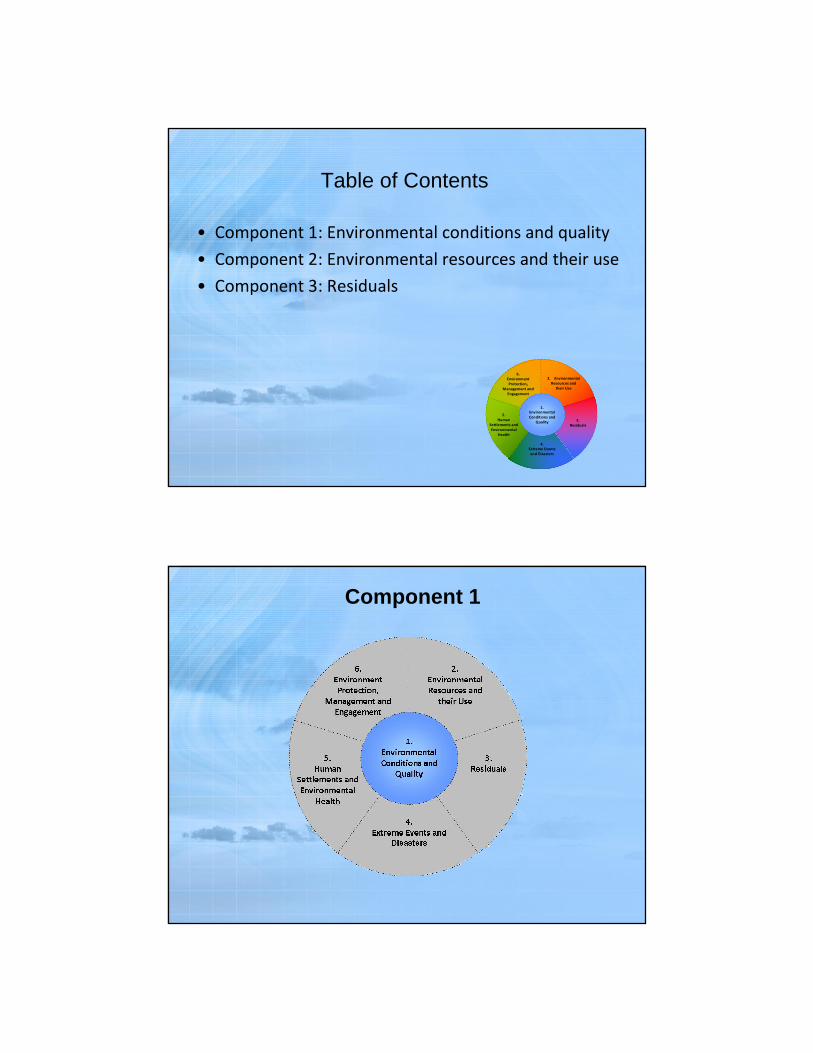
Table of Contents
• Component 1: Environmental conditions and quality
• Component 2: Environmental resources and their use
• Component 3: Residuals
2. Environmental
Resources and
their Use
3.
Residuals
4.
Extreme Events
and Disasters
6.
Environment
Protection,
Management and
Engagement
5.
Human
Settlements and
Environmental
Health
1.
Environmental
Conditions and
Quality
Component 1
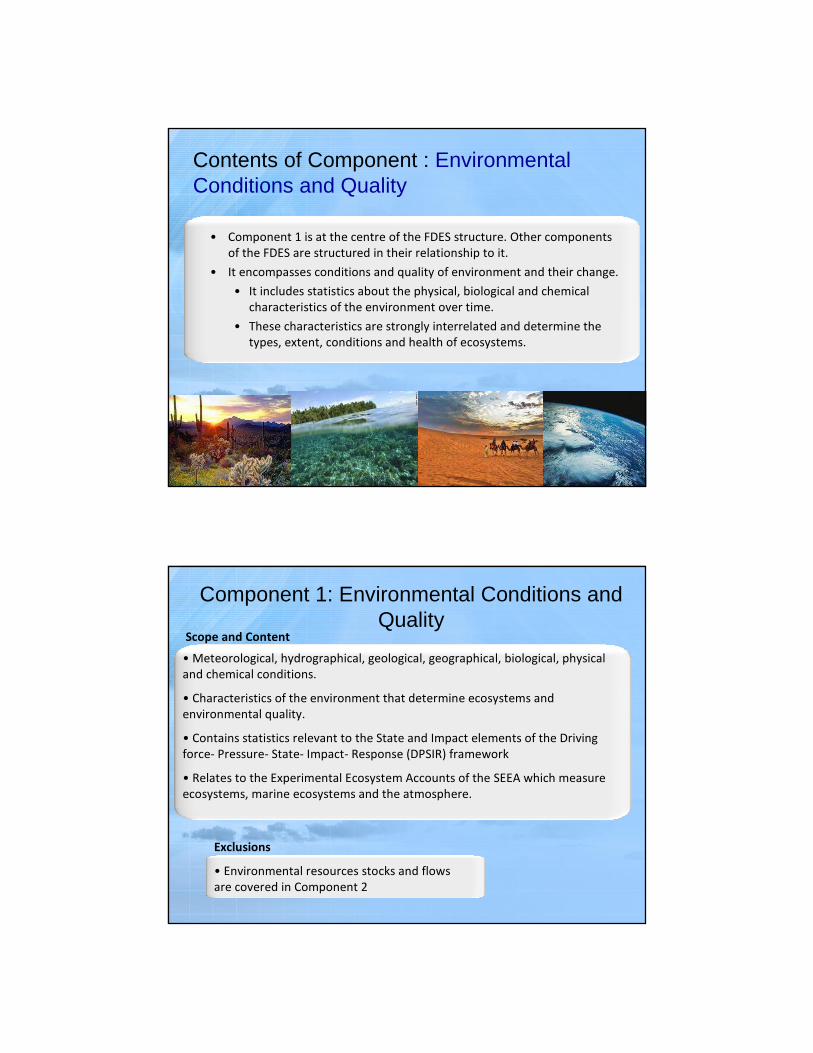
Contents of Component : Environmental Conditions and Quality
• Component 1 is at the centre of the FDES structure. Other components
of the FDES are structured in their relationship to it.
• It encompasses conditions and quality of environment and their change.
• It includes statistics about the physical, biological and chemical
characteristics of the environment over time.
• These characteristics are strongly interrelated and determine the
types, extent, conditions and health of ecosystems.
Component 1: Environmental Conditions and Quality
• Meteorological, hydrographical, geological, geographical, biological, physical
and chemical conditions.
• Characteristics of the environment that determine ecosystems and
environmental quality.
• Contains statistics relevant to the State and Impact elements of the Driving
force- Pressure- State- Impact- Response (DPSIR) framework
• Relates to the Experimental Ecosystem Accounts of the SEEA which measure
ecosystems, marine ecosystems and the atmosphere.
Scope and Content
Exclusions
• Environmental resources stocks and flows
are covered in Component 2
Component 1: Environmental Conditions and Quality
Main Sources
Types of Data
• Geospatial
• Physical
• Qualitative
• Monitoring and remote sensing data, cartographic data
• Inventories
• Environmental, meteorological, hydrological, geological and geographical
authorities or institutions.
Institutional partners• Environmental, meteorological, hydrological, geological and
geographical authorities or institutions.
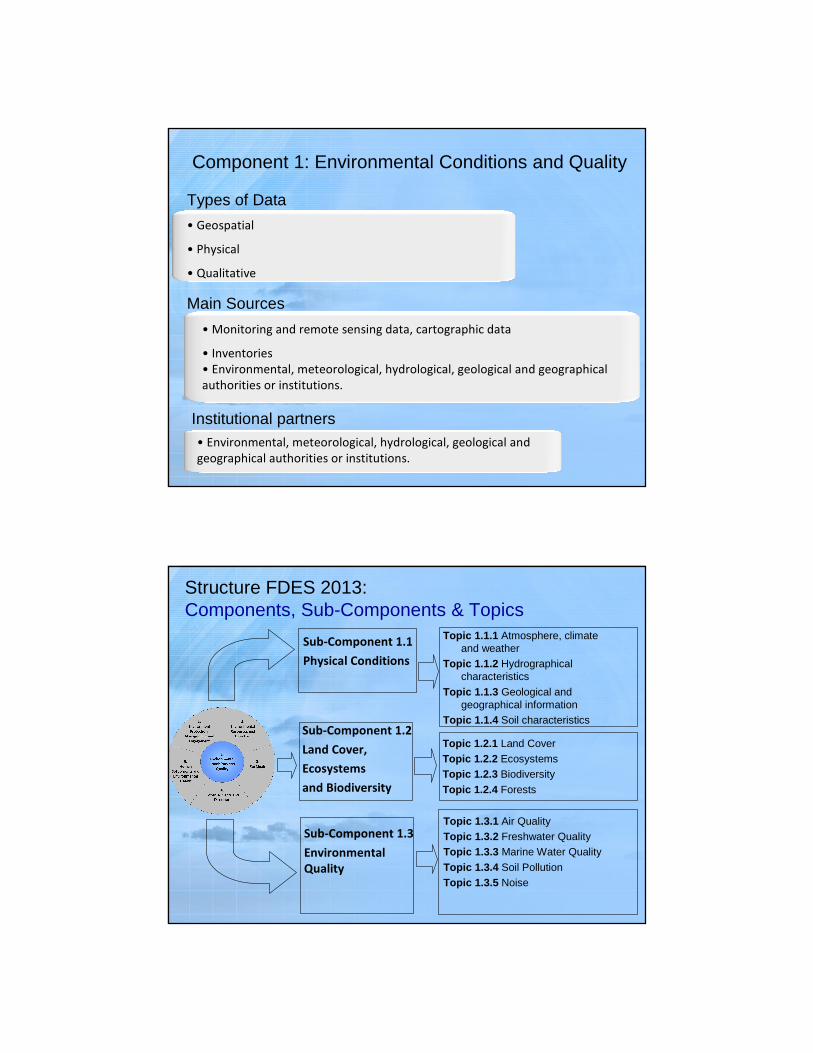
Structure FDES 2013:Components, Sub-Components & Topics
Sub-Component 1.3
Environmental
Quality
Sub-Component 1.1
Physical Conditions
Sub-Component 1.2
Land Cover,
Ecosystems
and Biodiversity
Topic 1.1.1 Atmosphere, climate and weather
Topic 1.1.2 Hydrographical characteristics
Topic 1.1.3 Geological and geographical information
Topic 1.1.4 Soil characteristics
Topic 1.2.1 Land CoverTopic 1.2.2 EcosystemsTopic 1.2.3 Biodiversity
Topic 1.2.4 Forests
Topic 1.3.1 Air QualityTopic 1.3.2 Freshwater QualityTopic 1.3.3 Marine Water Quality
Topic 1.3.4 Soil PollutionTopic 1.3.5 Noise
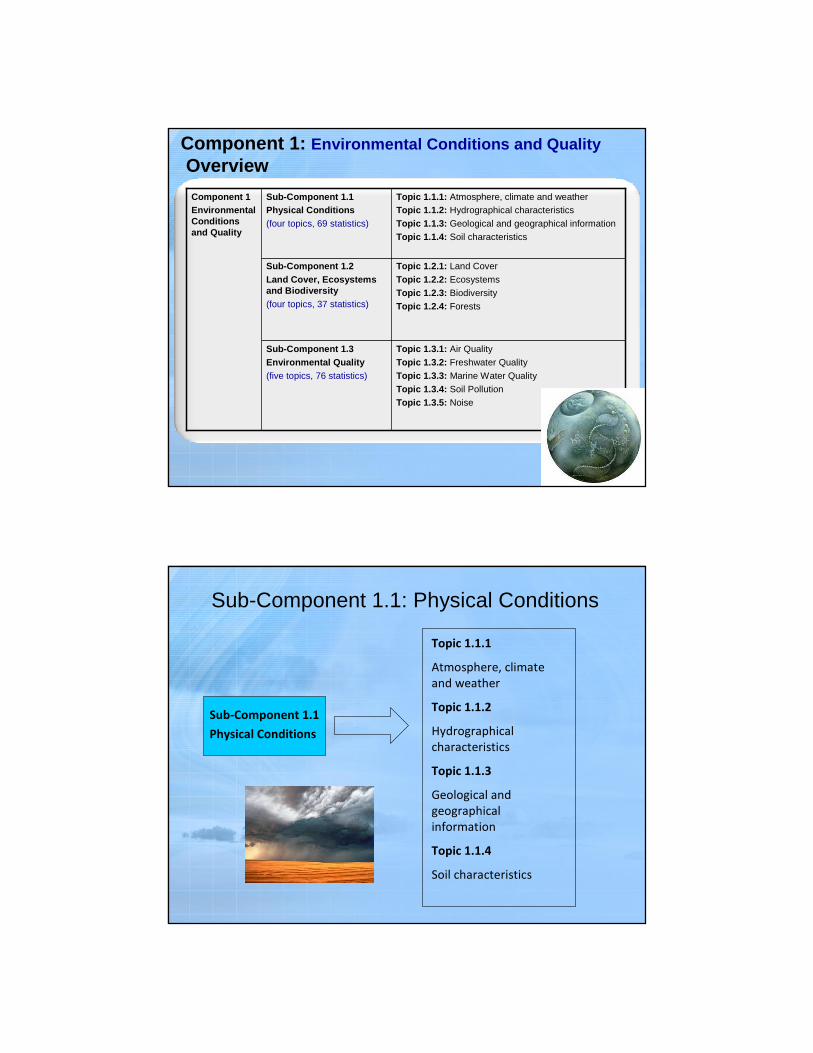
Component 1: Environmental Conditions and QualityOverview
Topic 1.3.1: Air Quality
Topic 1.3.2: Freshwater Quality
Topic 1.3.3: Marine Water Quality
Topic 1.3.4: Soil Pollution
Topic 1.3.5: Noise
Topic 1.2.1: Land Cover
Topic 1.2.2: Ecosystems
Topic 1.2.3: Biodiversity
Topic 1.2.4: Forests
Topic 1.1.1: Atmosphere, climate and weatherTopic 1.1.2: Hydrographical characteristics
Topic 1.1.3: Geological and geographical information
Topic 1.1.4: Soil characteristics
Sub-Component 1.3Environmental Quality (five topics, 76 statistics)
Sub-Component 1.2Land Cover, Ecosystems and Biodiversity (four topics, 37 statistics)
Component 1Environmental Conditions and Quality
Sub-Component 1.1Physical Conditions (four topics, 69 statistics)
Sub-Component 1.1: Physical Conditions
Topic 1.1.1
Atmosphere, climate
and weather
Topic 1.1.2
Hydrographical
characteristics
Topic 1.1.3
Geological and
geographical
information
Topic 1.1.4
Soil characteristics
Sub-Component 1.1
Physical Conditions
Sub-Component 1.1: Physical Conditions
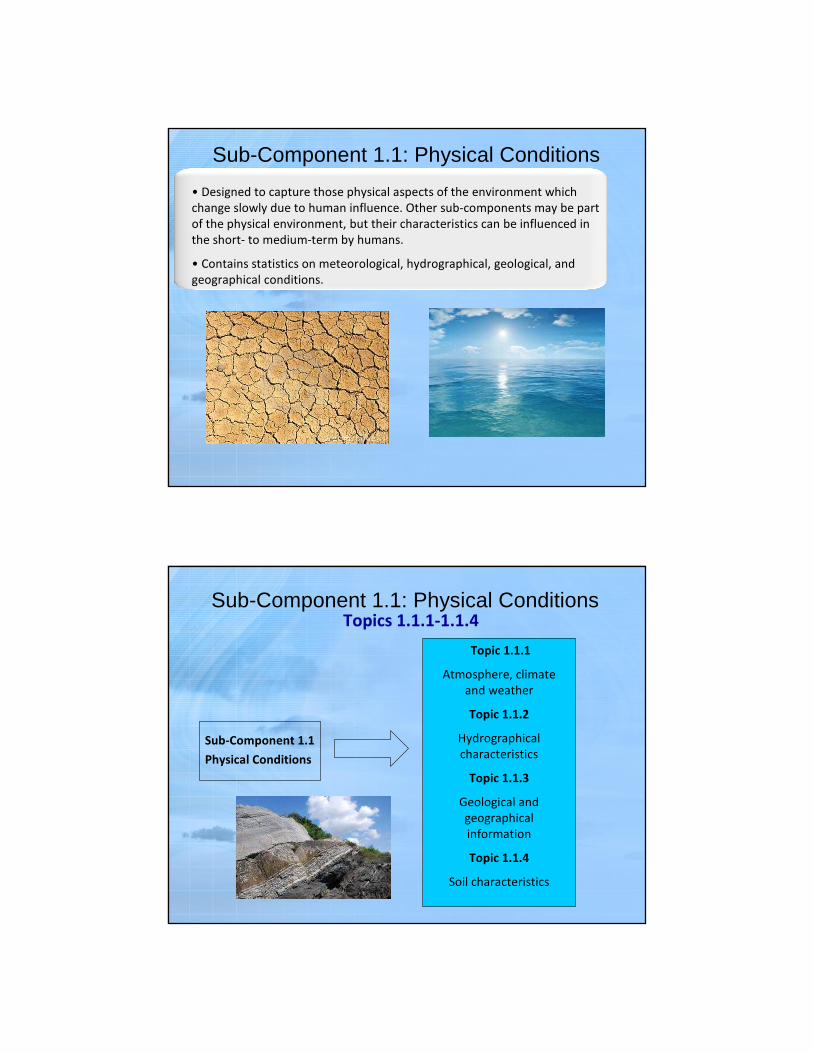
• Designed to capture those physical aspects of the environment which
change slowly due to human influence. Other sub-components may be part
of the physical environment, but their characteristics can be influenced in
the short- to medium-term by humans.
• Contains statistics on meteorological, hydrographical, geological, and
geographical conditions.
Sub-Component 1.1: Physical Conditions
Topic 1.1.1
Atmosphere, climate
and weather
Topic 1.1.2
Hydrographical
characteristics
Topic 1.1.3
Geological and
geographical
information
Topic 1.1.4
Soil characteristics
Sub-Component 1.1
Physical Conditions
Topics 1.1.1-1.1.4
Sub-Component 1.1: Physical ConditionsTopic 1.1.1: Atmosphere, climate and weatherTopic 1.1.1: Atmosphere, climate and weather
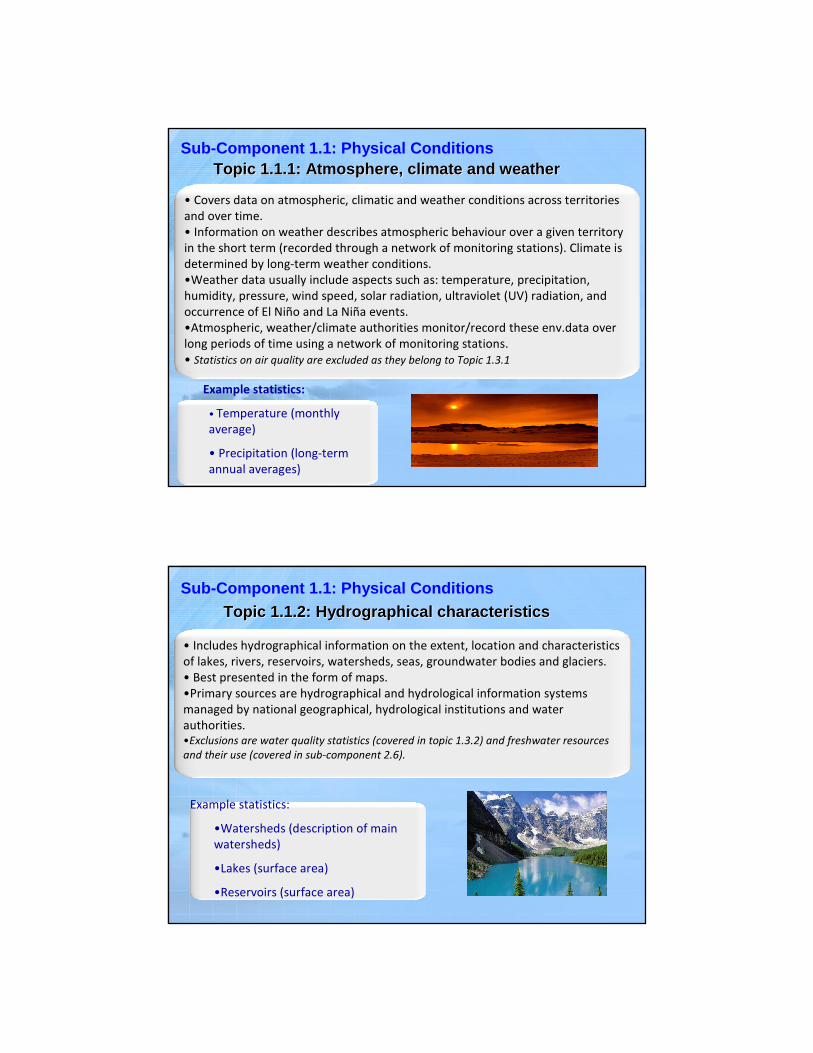
• Covers data on atmospheric, climatic and weather conditions across territories
and over time.
• Information on weather describes atmospheric behaviour over a given territory
in the short term (recorded through a network of monitoring stations). Climate is
determined by long-term weather conditions.
•Weather data usually include aspects such as: temperature, precipitation,
humidity, pressure, wind speed, solar radiation, ultraviolet (UV) radiation, and
occurrence of El Niño and La Niña events.
•Atmospheric, weather/climate authorities monitor/record these env.data over
long periods of time using a network of monitoring stations.
• Statistics on air quality are excluded as they belong to Topic 1.3.1
Example statistics:
• Temperature (monthly
average)
• Precipitation (long-term
annual averages)
Sub-Component 1.1: Physical Conditions
Topic 1.1.2: Hydrographical characteristicsTopic 1.1.2: Hydrographical characteristics
• Includes hydrographical information on the extent, location and characteristics
of lakes, rivers, reservoirs, watersheds, seas, groundwater bodies and glaciers.
• Best presented in the form of maps.
•Primary sources are hydrographical and hydrological information systems
managed by national geographical, hydrological institutions and water
authorities.
•Exclusions are water quality statistics (covered in topic 1.3.2) and freshwater resources
and their use (covered in sub-component 2.6).
Example statistics:
•Watersheds (description of main
watersheds)
•Lakes (surface area)
•Reservoirs (surface area)
Sub-Component 1.1: Physical ConditionsTopic 1.1.3: Geological and geographical Topic 1.1.3: Geological and geographical informationinformation
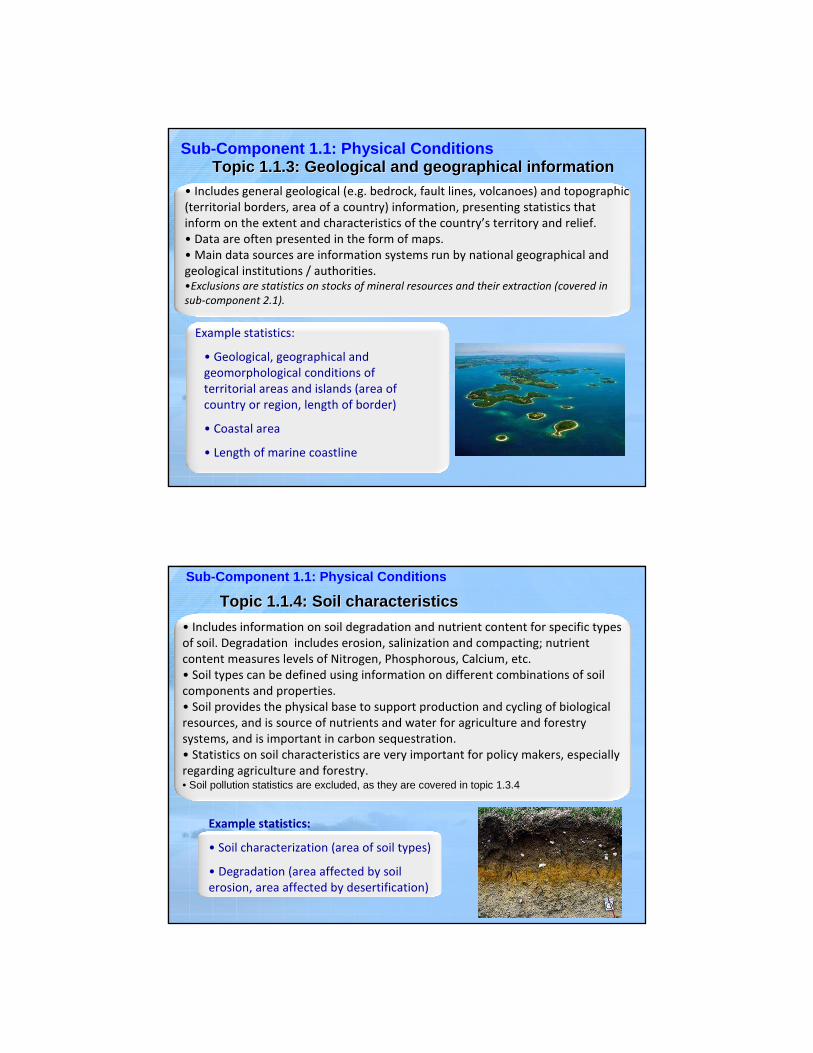
• Includes general geological (e.g. bedrock, fault lines, volcanoes) and topographic
(territorial borders, area of a country) information, presenting statistics that
inform on the extent and characteristics of the country’s territory and relief.
• Data are often presented in the form of maps.
• Main data sources are information systems run by national geographical and
geological institutions / authorities. •Exclusions are statistics on stocks of mineral resources and their extraction (covered in
sub-component 2.1).
Example statistics:
• Geological, geographical and
geomorphological conditions of
territorial areas and islands (area of
country or region, length of border)
• Coastal area
• Length of marine coastline
Sub-Component 1.1: Physical Conditions
Topic 1.1.4: Soil characteristicsTopic 1.1.4: Soil characteristics
• Includes information on soil degradation and nutrient content for specific types
of soil. Degradation includes erosion, salinization and compacting; nutrient
content measures levels of Nitrogen, Phosphorous, Calcium, etc.
• Soil types can be defined using information on different combinations of soil
components and properties.
• Soil provides the physical base to support production and cycling of biological
resources, and is source of nutrients and water for agriculture and forestry
systems, and is important in carbon sequestration.
• Statistics on soil characteristics are very important for policy makers, especially
regarding agriculture and forestry.• Soil pollution statistics are excluded, as they are covered in topic 1.3.4
Example statistics:
• Soil characterization (area of soil types)
• Degradation (area affected by soil
erosion, area affected by desertification)
Sub-Component 1.2: Land Cover, Ecosystems and Biodiversity
Sub-Component 1.2
Land Cover,
Ecosystems and
Biodiversity
Topic 1.2.1
Land Cover
Topic 1.2.2
Ecosystems
Topic 1.2.3
Biodiversity
Topic 1.2.4
Forests
Sub-Component 1.2: Land Cover, Ecosystems and Biodiversity
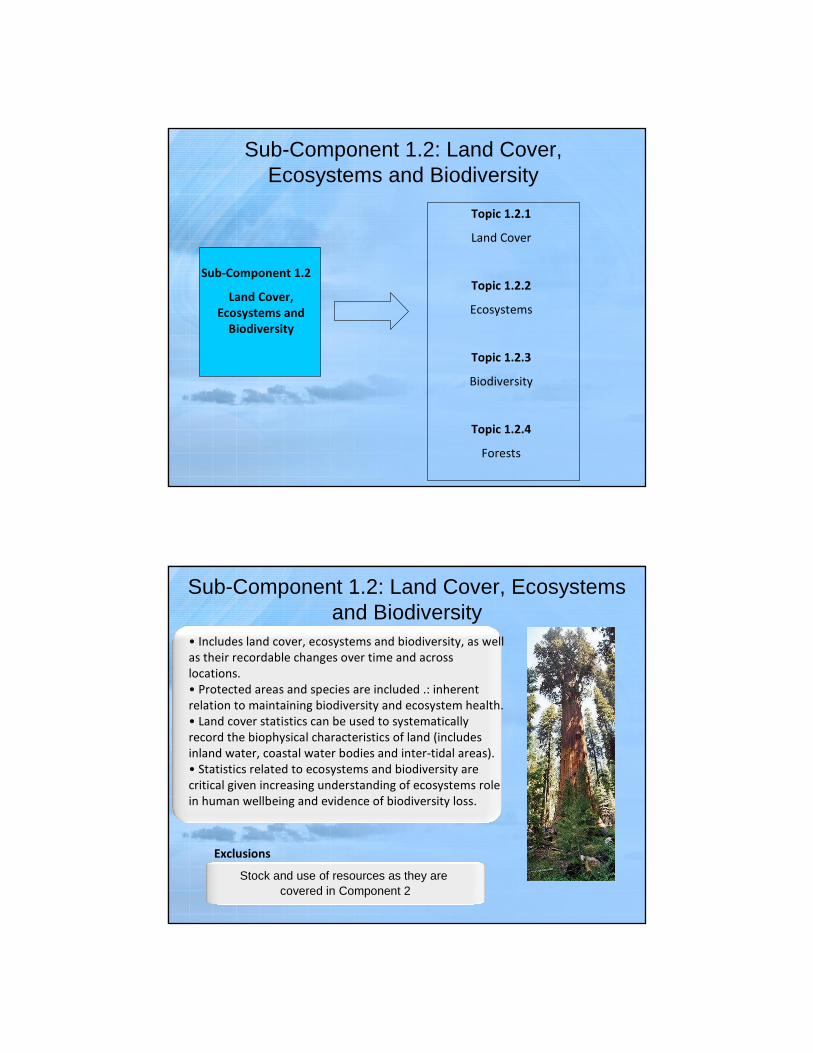
• Includes land cover, ecosystems and biodiversity, as well
as their recordable changes over time and across
locations.
• Protected areas and species are included .: inherent
relation to maintaining biodiversity and ecosystem health.
• Land cover statistics can be used to systematically
record the biophysical characteristics of land (includes
inland water, coastal water bodies and inter-tidal areas).
• Statistics related to ecosystems and biodiversity are
critical given increasing understanding of ecosystems role
in human wellbeing and evidence of biodiversity loss.
Stock and use of resources as they are covered in Component 2
Exclusions
Sub-Component 1.2: Land Cover, Ecosystems and Biodiversity
Sub-Component 1.2
Land Cover,
Ecosystems and
Biodiversity
Topic 1.2.1
Land Cover
Topic 1.2.2
Ecosystems
Topic 1.2.3
Biodiversity
Topic 1.2.4
Forests
Topics 1.2.1 – 1.2.4
Sub-Component 1.2: Land Cover, Ecosystems & BiodiversityTopic 1.2.1: Land CoverTopic 1.2.1: Land Cover
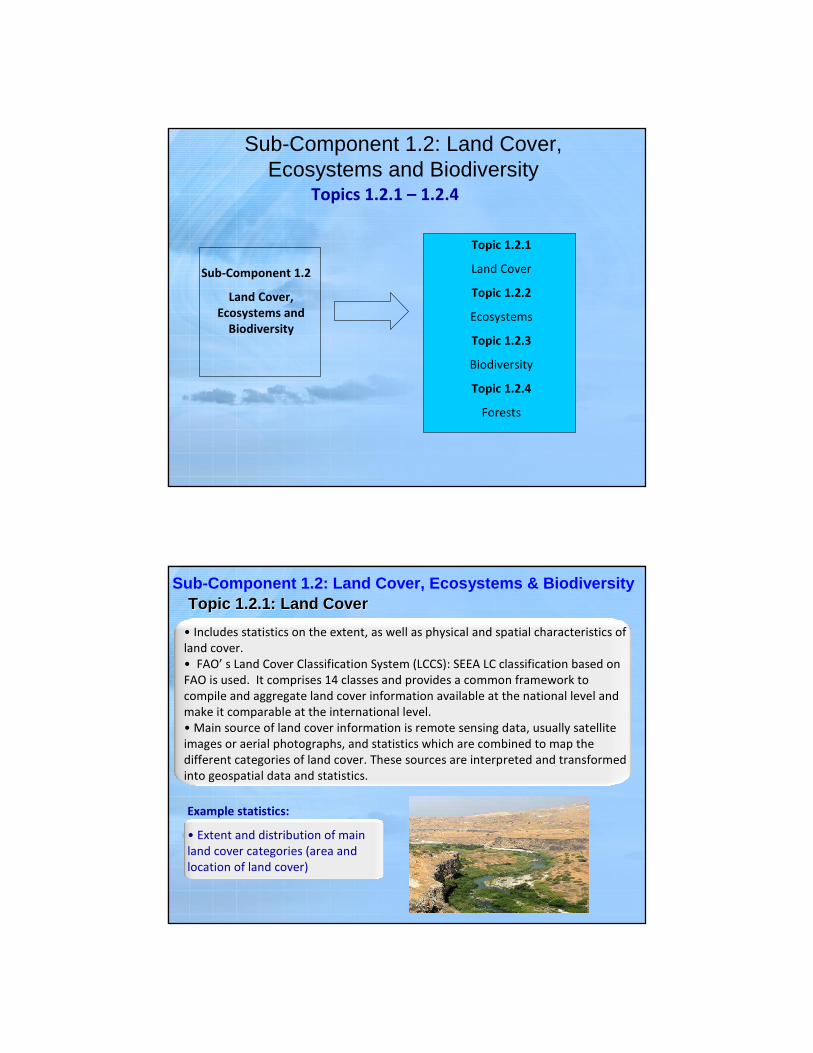
• Includes statistics on the extent, as well as physical and spatial characteristics of
land cover.
• FAO’ s Land Cover Classification System (LCCS): SEEA LC classification based on
FAO is used. It comprises 14 classes and provides a common framework to
compile and aggregate land cover information available at the national level and
make it comparable at the international level.
• Main source of land cover information is remote sensing data, usually satellite
images or aerial photographs, and statistics which are combined to map the
different categories of land cover. These sources are interpreted and transformed
into geospatial data and statistics.
Example statistics:
• Extent and distribution of main
land cover categories (area and
location of land cover)
Sub-Component 1.2: Land Cover, Ecosystems & Biodiversity
• Includes physical, descriptive and qualitative information and statistics about a
country’s main ecosystems and its conditions reflecting their state (extent –
location/area and patterns, chemical and physical characteristics, biological
components).
• The extent and conditions of ecosystems determine their capacity to produce
ecosystem services.
• National classifications could be used and described for statistical purposes or
internationally used ecosystem categories like the Millennium Ecosystem
Assessment (i.e. forest, mountain, cultivated, dryland, polar, inland water,
marine, coastal, island, urban, etc.). Ongoing work SEEA/EEA on e.classification.
• Ecosystems are complicated to describe (complexity, scale).
• Ecosystems can also be denominated as biomes, biogeographical regions,
ecoregions, habitats, etc.
Topic 1.2.2: EcosystemsTopic 1.2.2: Ecosystems
Sub-Component 1.2: Land Cover, Ecosystems & Biodiversity
Topic 1.2.3: BiodiversityTopic 1.2.3: Biodiversity
Contains statistics on the diversity of flora and fauna species (biota), on protected areas, and on protected flora and fauna species.
• Flora & fauna: descriptive information on their existence, variety and trends in various populations and communities. Also quantitative and complementary information on biodiversity in terrestrial and marine environments.
• Protected areas: physical and descriptive information and statistics on protected terrestrial and marine areas within the country. The IUCN Protected Area Management Categories are based on the strictness of protection and serve as the classification for protected areas.
• Status of vulnerability of species is also included.
• Main sources of data on protected areas are administrative records. Environmental authorities’ reports on the state of ecosystems or the state of the environment at the national and sub-national levels also provide data. Protected species’ data are often acquired on an ad-hoc basis from studies, assessments, NGO research, etc. Data can therefore be scattered and non-systematised.
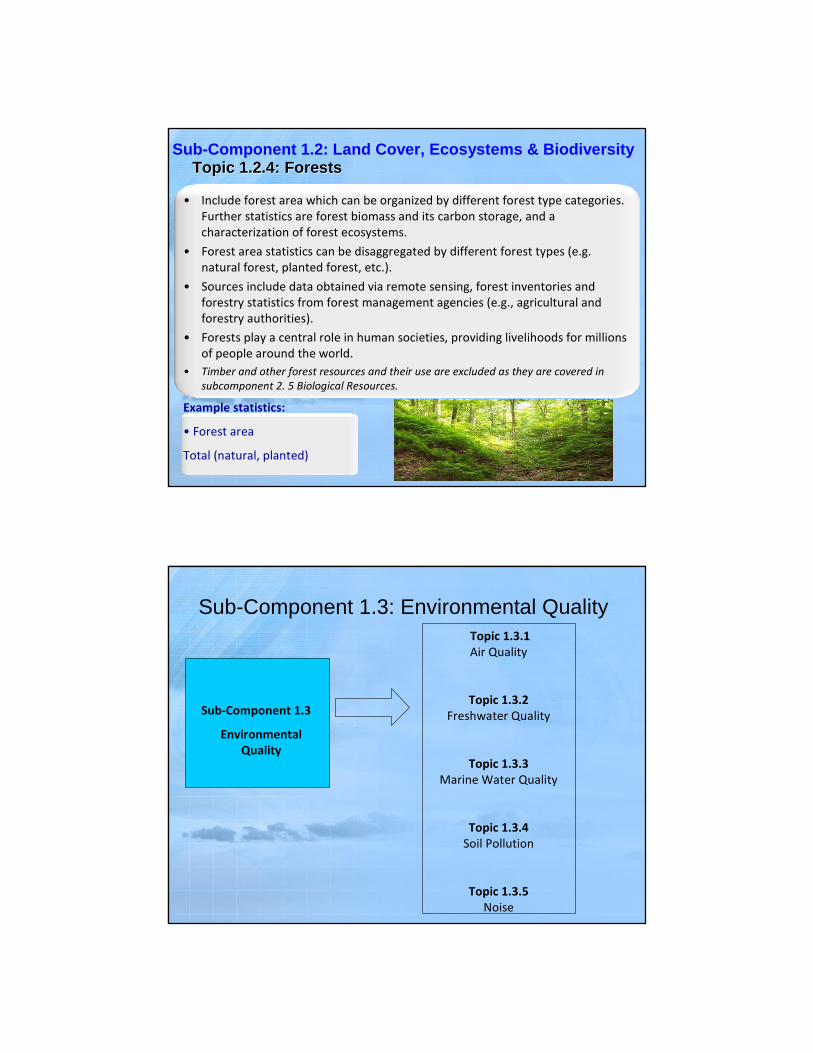
Sub-Component 1.2: Land Cover, Ecosystems & BiodiversityTopic 1.2.4: ForestsTopic 1.2.4: Forests
• Include forest area which can be organized by different forest type categories.
Further statistics are forest biomass and its carbon storage, and a
characterization of forest ecosystems.
• Forest area statistics can be disaggregated by different forest types (e.g.
natural forest, planted forest, etc.).
• Sources include data obtained via remote sensing, forest inventories and
forestry statistics from forest management agencies (e.g., agricultural and
forestry authorities).
• Forests play a central role in human societies, providing livelihoods for millions
of people around the world.
• Timber and other forest resources and their use are excluded as they are covered in
subcomponent 2. 5 Biological Resources.
Example statistics:
• Forest area
Total (natural, planted)
Sub-Component 1.3: Environmental Quality
Sub-Component 1.3
Environmental
Quality
Topic 1.3.1
Air Quality
Topic 1.3.2
Freshwater Quality
Topic 1.3.3
Marine Water Quality
Topic 1.3.4
Soil Pollution
Topic 1.3.5
Noise
• Organizes statistics on the concentration of pollutants in air,
freshwater, marine water, soil, as well as on noise levels.
• Statistics on environment quality are required by policy makers,
analysts and civil society to monitor and make evidence-based
policies to maintain and improve environmental quality.
• Pollution impacts both the human sub-system and ecosystems.
• Because of spatial and temporal considerations, and the fluidity of
pollution through environmental media, collaboration between
statistical offices and environmental agencies regarding design
(sampling pattern) is important.
Sub-Component 1.3: Environmental Quality
Exclusions
Emissions of pollutants from human activities (rather than
concentrations), they are covered in Component 3
Sub-Component 1.3: Environmental Quality
Sub-Component 1.3
Environmental
Quality
Topic 1.3.1
Air Quality
Topic 1.3.2
Freshwater Quality
Topic 1.3.3
Marine Water Quality
Topic 1.3.4
Soil Pollution
Topic 1.3.5
Noise
Topics 1.3.1 – 1.3.5
• Includes statistics on the ambient concentration of the most important air
pollutants (suspended solid particles, gases and other relevant pollutants) that
can have a negative effect on human and ecosystem health and climate
change.
• Monitoring of air quality is carried out in targeted ecosystems or habitats of
high vulnerability. Statistics based on these measurements can be used to
describe certain aspects of ecosystem health in specific locations.
• Sources are monitoring stations (impact, regional or background). National
monitoring of air quality is usually limited to urban settlements where polluting
activities affect a concentrated population.
Sub-Component 1.3: Environmental Quality
Topic 1.3.1: Air QualityTopic 1.3.1: Air Quality
• Described by concentrations of nutrients and chlorophyll, organic matter,
pathogens, metals, and organic contaminants, as well as by physical and
chemical characteristics in surface water and groundwater.
• Without good quality freshwater, ecosystems and humans cannot survive.
Precipitation, aquifers, groundwater, lakes, rivers, coastal zones and oceans
are all interconnected. Therefore, the choice of where to measure or monitor
the pollutants and which pollutants to monitor will depend on local and
national priorities, ecosystem characteristics and resources available.
• Data for water quality statistics are primarily produced by monitoring stations.
Sub-Component 1.3: Environmental QualityTopic 1.3.2: Freshwater QualityTopic 1.3.2: Freshwater Quality
Example statistics
• Nutrients and chlorophyll
• Organic matter in freshwater bodies
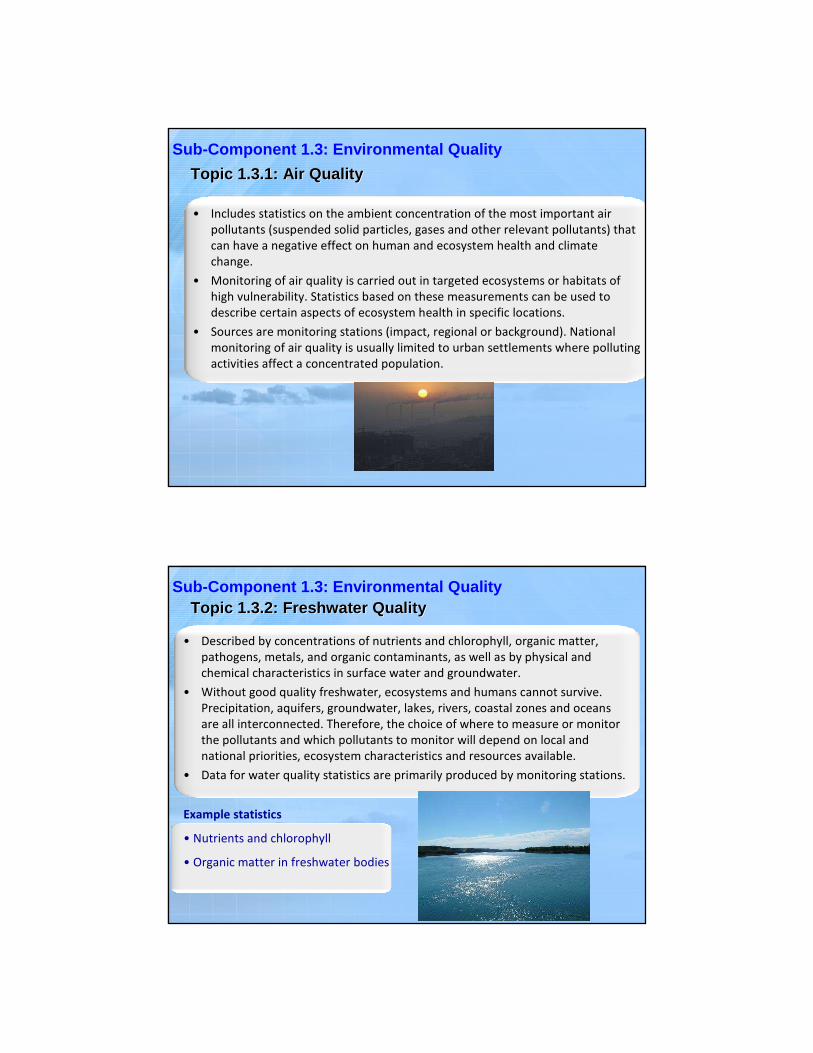
• Relevant statistics can include nutrients and chlorophyll, organic matter, pathogens, metals, organic contaminants, and physical and chemical characteristics, as well as coral bleaching.
• Analysed as locally, nationally or supranationally relevant, in terms of the type of pollution and effect (e.g. eutrophication and red tide)
• Sources are typically national or international monitoring stations associated with scientific research. Monitoring programmes are usually constructed when there is scientific interest for research
• Oceans cover about 70% of the earth surface. They play a critical role in regulating weather and atmospheric processes, absorb 30% of emitted CO
2, are
a fundamental part of the water cycle, and are home to species and varied ecosystems worldwide.
• Important to the health of ecosystems as well as to humans.
Sub-Component 1.3: Environmental QualityTopic 1.3.3: Marine Water QualityTopic 1.3.3: Marine Water Quality
Example statistics
• Concentration of nitrates in marine
water bodies
• Area affected by coral bleaching
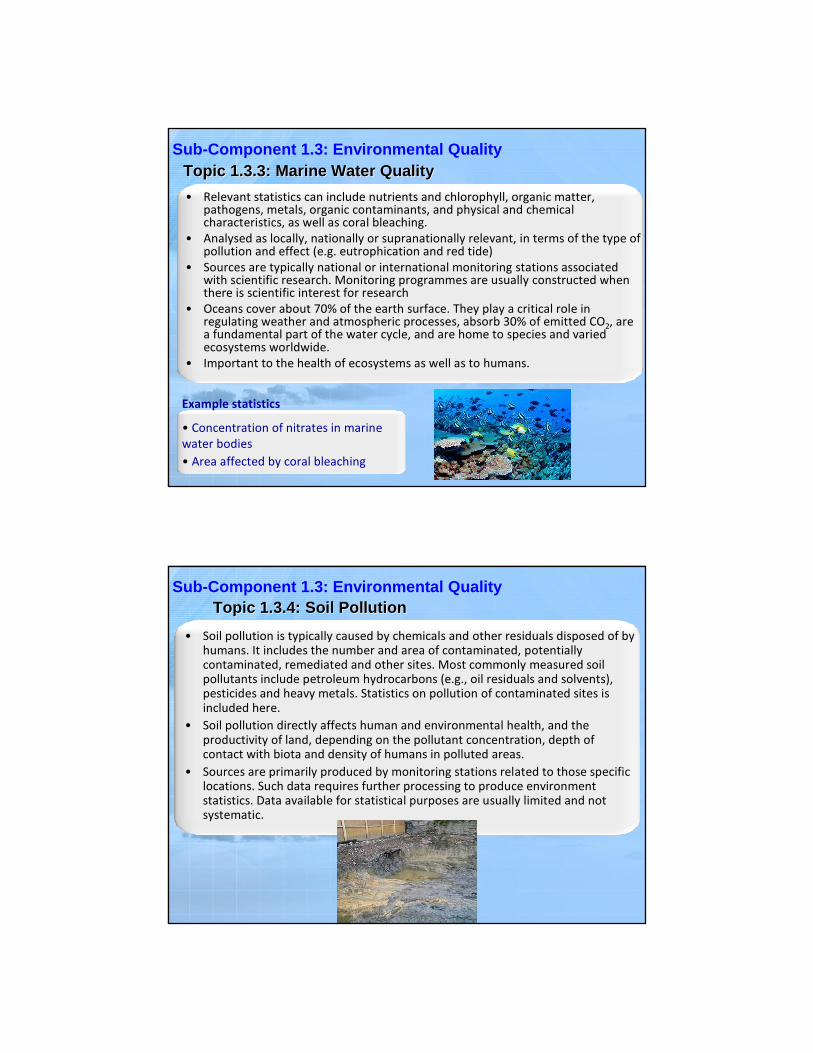
• Soil pollution is typically caused by chemicals and other residuals disposed of by humans. It includes the number and area of contaminated, potentially contaminated, remediated and other sites. Most commonly measured soil pollutants include petroleum hydrocarbons (e.g., oil residuals and solvents), pesticides and heavy metals. Statistics on pollution of contaminated sites is included here.
• Soil pollution directly affects human and environmental health, and the productivity of land, depending on the pollutant concentration, depth of contact with biota and density of humans in polluted areas.
• Sources are primarily produced by monitoring stations related to those specific locations. Such data requires further processing to produce environment statistics. Data available for statistical purposes are usually limited and not systematic.
Sub-Component 1.3: Environmental QualityTopic 1.3.4: Soil PollutionTopic 1.3.4: Soil Pollution
• Noise pollution exists in cities, adjacent to highways, near airports and marine ports and around manufacturing, metal processing and mining establishments and at construction sites.
• Statistics on noise levels and intensity, are produced for and are relevant to the specific local areas where the most problematic conditions of noise pollution exist.
• Noise pollution is typically measured using calibrated instruments in specific spatially located stations. Monitoring stations are typically run by pertinent national or local environment authority.
• Noise pollution negatively affects the welfare and health of humans and also affects and changes biota and fauna.
Sub-Component 1.3: Environmental Quality
Topic 1.3.5: NoiseTopic 1.3.5: Noise
Example statistics:
• Levels of noise from specific sources
• Levels of noise in specific locations
Questions, comments for Component 1?
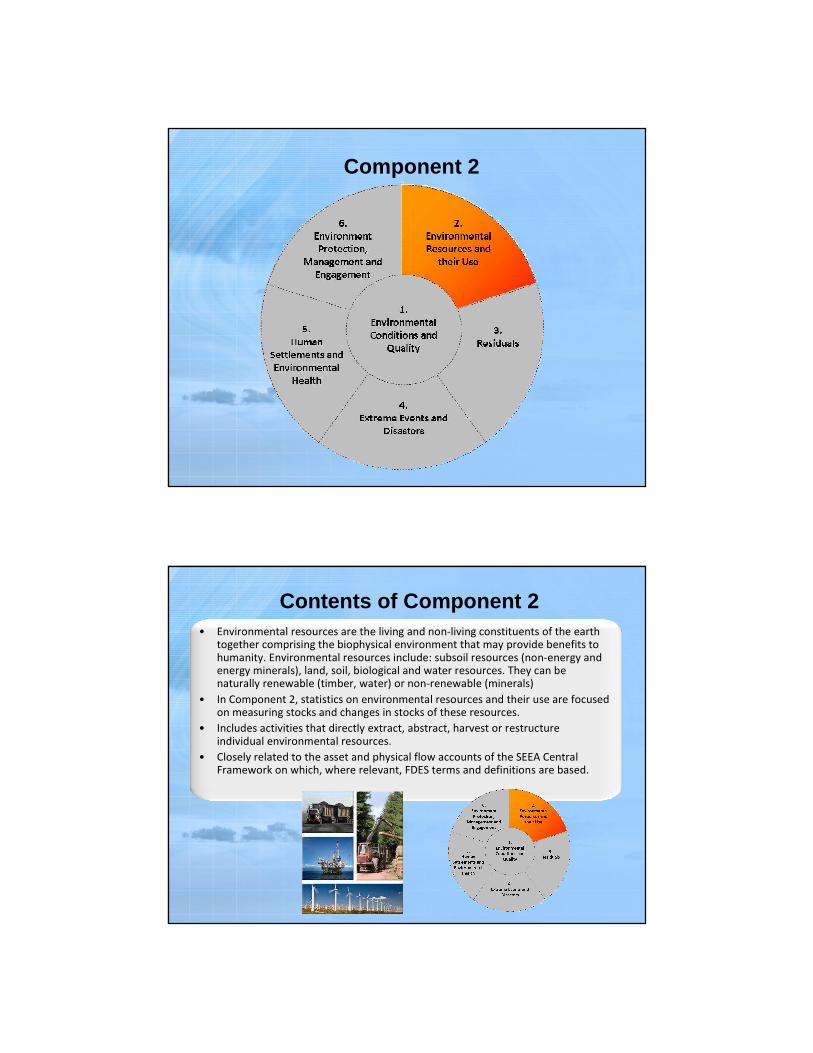
Component 2
• Environmental resources are the living and non-living constituents of the earth together comprising the biophysical environment that may provide benefits to humanity. Environmental resources include: subsoil resources (non-energy and energy minerals), land, soil, biological and water resources. They can be naturally renewable (timber, water) or non-renewable (minerals)
• In Component 2, statistics on environmental resources and their use are focused on measuring stocks and changes in stocks of these resources.
• Includes activities that directly extract, abstract, harvest or restructure individual environmental resources.
• Closely related to the asset and physical flow accounts of the SEEA Central Framework on which, where relevant, FDES terms and definitions are based.
Contents of Component 2
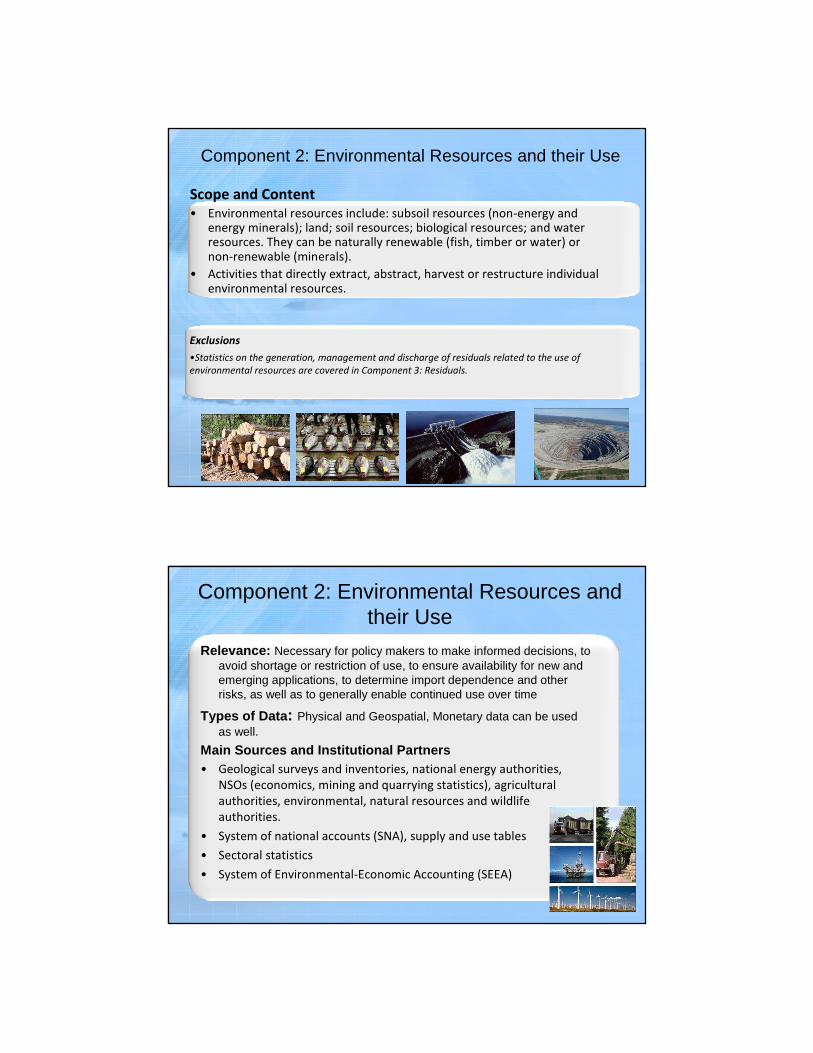
Scope and Content
• Environmental resources include: subsoil resources (non-energy and energy minerals); land; soil resources; biological resources; and water resources. They can be naturally renewable (fish, timber or water) or non-renewable (minerals).
• Activities that directly extract, abstract, harvest or restructure individual environmental resources.
Component 2: Environmental Resources and their Use
Exclusions
•Statistics on the generation, management and discharge of residuals related to the use of
environmental resources are covered in Component 3: Residuals.
Component 2: Environmental Resources and their Use
Relevance: Necessary for policy makers to make informed decisions, to avoid shortage or restriction of use, to ensure availability for new and emerging applications, to determine import dependence and other risks, as well as to generally enable continued use over time
Types of Data: Physical and Geospatial, Monetary data can be used as well.
Main Sources and Institutional Partners • Geological surveys and inventories, national energy authorities,
NSOs (economics, mining and quarrying statistics), agricultural
authorities, environmental, natural resources and wildlife
authorities.
• System of national accounts (SNA), supply and use tables
• Sectoral statistics
• System of Environmental-Economic Accounting (SEEA)
Sub-Component 2.3Land
Topic 2.2.1: Stocks and changes of mineral energy resources
Topic 2.2.2: Production and consumption of energy from non-renewable and renewable sources
Topic 2.3.1: Land use
Topic 2.1.1: Stocks and changes of non-energy mineral resources
Topic 2.1.2: Production and trade of non-energy minerals
Sub-Component 2.1
Non-energy Mineral Resources
Sub-Component 2.2Energy Resources
Sub-Component 2.4Soil Resources
2.4.1 Soil Resources
Sub-Component 2.5 Biological Resources
Sub-Component 2.6Water Resources
Topic 2.5.1: Timber resources
Topic 2.5.2: Aquatic resources
Topic 2.5.3: CropsTopic 2.5.4: Livestock
Topic 2.5.5: Wild, uncultivated biological resources (excludes fish and timber)
Topic 2.6.1: Water resources
Topic 2.6.2: Abstraction, use and returns of water
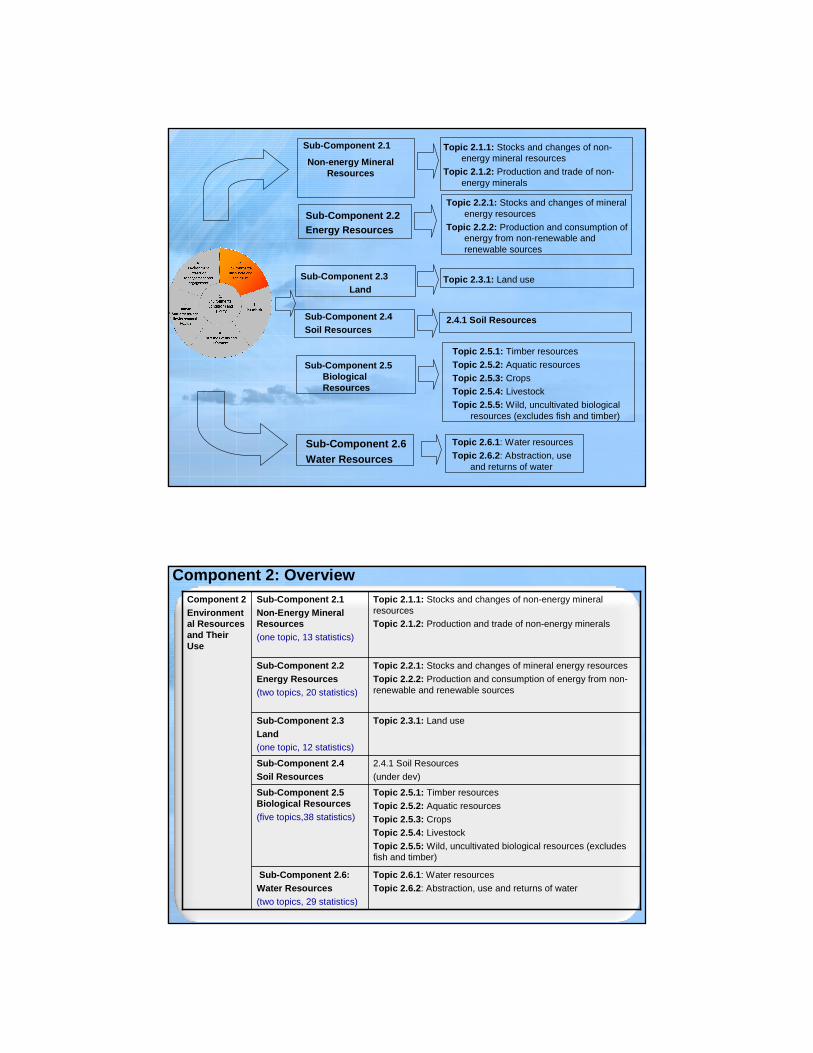
Component 2: Overview
2.4.1 Soil Resources
(under dev)
Sub-Component 2.4Soil Resources
Topic 2.5.1: Timber resources
Topic 2.5.2: Aquatic resources
Topic 2.5.3: Crops
Topic 2.5.4: Livestock
Topic 2.5.5: Wild, uncultivated biological resources (excludes fish and timber)
Sub-Component 2.5 Biological Resources(five topics,38 statistics)
Topic 2.3.1: Land useSub-Component 2.3Land (one topic, 12 statistics)
Topic 2.6.1: Water resources
Topic 2.6.2: Abstraction, use and returns of water
Topic 2.2.1: Stocks and changes of mineral energy resources
Topic 2.2.2: Production and consumption of energy from non-renewable and renewable sources
Topic 2.1.1: Stocks and changes of non-energy mineral resourcesTopic 2.1.2: Production and trade of non-energy minerals
Sub-Component 2.6:Water Resources(two topics, 29 statistics)
Sub-Component 2.2Energy Resources (two topics, 20 statistics)
Component 2Environmental Resources and Their Use
Sub-Component 2.1Non-Energy Mineral Resources (one topic, 13 statistics)
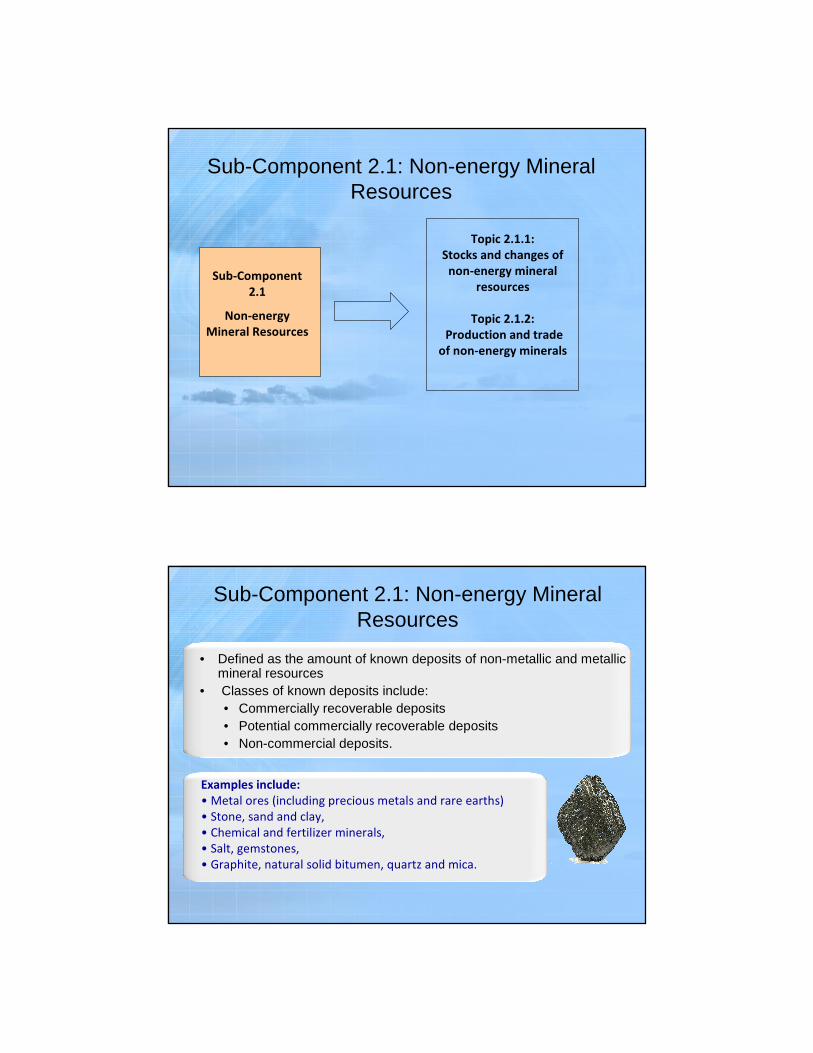
Sub-Component 2.1: Non-energy Mineral Resources
Sub-Component
2.1
Non-energy
Mineral Resources
Topic 2.1.1:
Stocks and changes of
non-energy mineral
resources
Topic 2.1.2:
Production and trade
of non-energy minerals
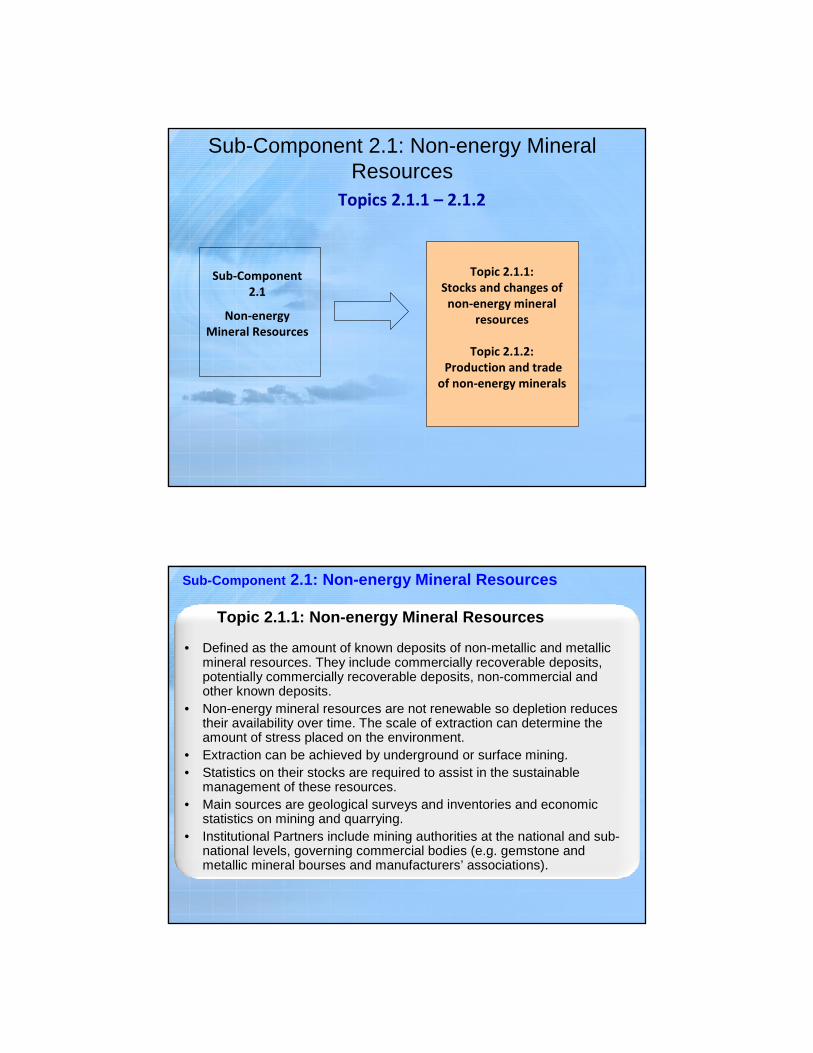
• Defined as the amount of known deposits of non-metallic and metallic mineral resources
• Classes of known deposits include: • Commercially recoverable deposits• Potential commercially recoverable deposits• Non-commercial deposits.
Sub-Component 2.1: Non-energy Mineral Resources
Examples include:
• Metal ores (including precious metals and rare earths)
• Stone, sand and clay,
• Chemical and fertilizer minerals,
• Salt, gemstones,
• Graphite, natural solid bitumen, quartz and mica.
Sub-Component 2.1: Non-energy Mineral Resources
Sub-Component
2.1
Non-energy
Mineral Resources
Topic 2.1.1:
Stocks and changes of
non-energy mineral
resources
Topic 2.1.2:
Production and trade
of non-energy minerals
Topics 2.1.1 – 2.1.2
• Defined as the amount of known deposits of non-metallic and metallic mineral resources. They include commercially recoverable deposits, potentially commercially recoverable deposits, non-commercial and other known deposits.
• Non-energy mineral resources are not renewable so depletion reduces their availability over time. The scale of extraction can determine the amount of stress placed on the environment.
• Extraction can be achieved by underground or surface mining.• Statistics on their stocks are required to assist in the sustainable
management of these resources.• Main sources are geological surveys and inventories and economic
statistics on mining and quarrying. • Institutional Partners include mining authorities at the national and sub-
national levels, governing commercial bodies (e.g. gemstone and metallic mineral bourses and manufacturers’ associations).
Sub-Component 2.1: Non-energy Mineral Resources
Topic 2.1.1: NonTopic 2.1.1: Non--energy Mineral Resourcesenergy Mineral Resources
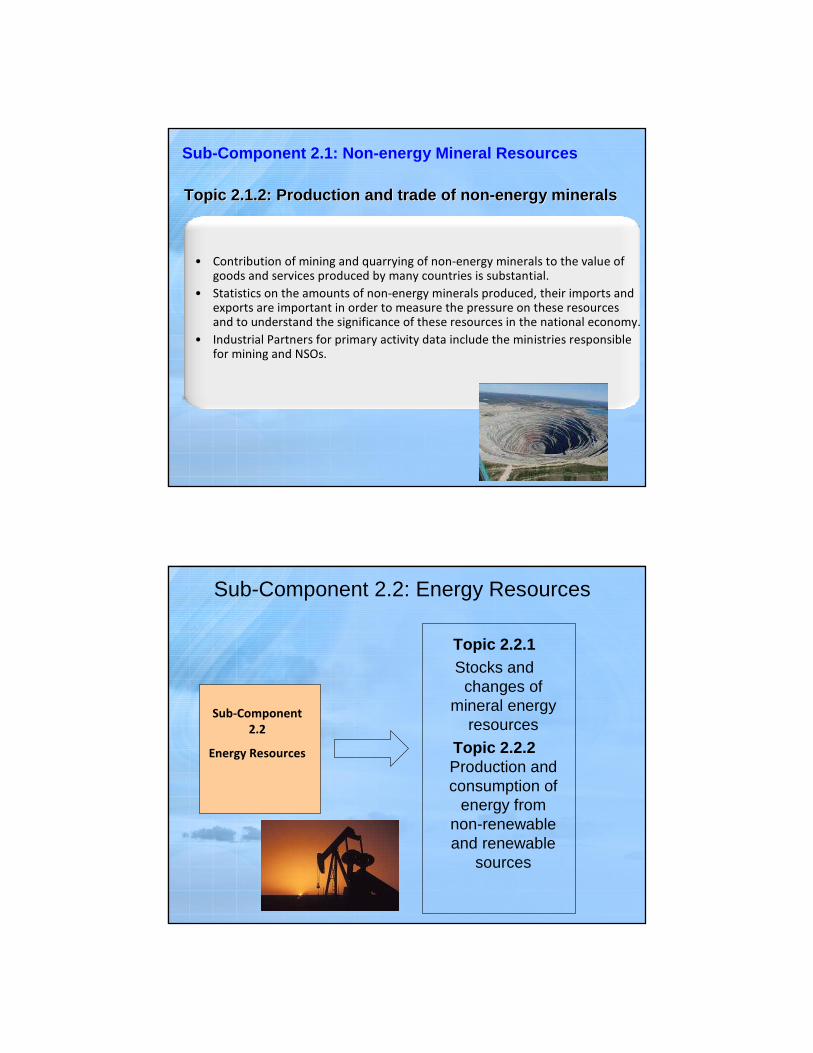
• Contribution of mining and quarrying of non-energy minerals to the value of goods and services produced by many countries is substantial.
• Statistics on the amounts of non-energy minerals produced, their imports and exports are important in order to measure the pressure on these resources and to understand the significance of these resources in the national economy.
• Industrial Partners for primary activity data include the ministries responsible for mining and NSOs.
Sub-Component 2.1: Non-energy Mineral Resources
Topic 2.1.2: Production and trade of nonTopic 2.1.2: Production and trade of non--energy mineralsenergy minerals
Sub-Component 2.2: Energy Resources
Sub-Component
2.2
Energy Resources
Topic 2.2.1 Stocks and
changes of mineral energy
resourcesTopic 2.2.2 Production and consumption of
energy from non-renewable and renewable
sources
• Refers to the capture, extraction or manufacture of fuels or energy in forms which are ready for general consumption.
Importance:• Energy production, transformation, distribution and
consumption are done with different efficiency rates and these processes cause distinct environmental impacts.
• Producing statistics to describe these activities is key to environmental sustainability policy.
Sub-Component 2.2: Energy Resources
Sub-Component
2.2
Energy Resources
Sub-Component 2.2: Energy Resources
Topic 2.2.1 Stocks and
changes of mineral energy
resourcesTopic 2.2.2 Production and consumption of
energy from non-renewable and renewable
sources
Topics 2.2.1 – 2.2.2
• Stocks of mineral energy resources are defined as the amount of
known deposits of mineral energy resources, including fossil
fuels, peat, uranium, thorium ores, etc. They cannot be renewed
on a human timescale, therefore depletion limits their availability
for future generations.
• Classes of known deposits include commercially recoverable
deposits, potential commercially recoverable deposits, and non-
commercial deposits.
• Sources are geological surveys and inventories, and national
economic and energy statistics departments.
• Institutional partners in data collection are mining and energy
authorities at the national and sub-national levels.
Sub-Component 2.2: Energy ResourcesTopic 2.2.1: Stocks and Changes of Mineral Energy ResourcesTopic 2.2.1: Stocks and Changes of Mineral Energy Resources
• Energy production refers to the capture, extraction or manufacture of fuels or energy in forms which are ready for general consumption.
• Includes total energy production from non-renewable and renewable sources.
• Provides environment statistics that can assist when analyzing the sustainability of the energy mix at the national level.
• Sources are energy statistics and energy balances from national energy authorities or NSOs.
• Energy production, transformation, distribution and consumption are done with different efficiency rates therefore statistics describing these activities are key to environmental sustainability policy.
Sub-Component 2.2: Energy Resources
Topic 2.2.2: Production & consumption of energy from nonTopic 2.2.2: Production & consumption of energy from non--renewable & renewable sourcesrenewable & renewable sources
Sub-Component
2.3
Land
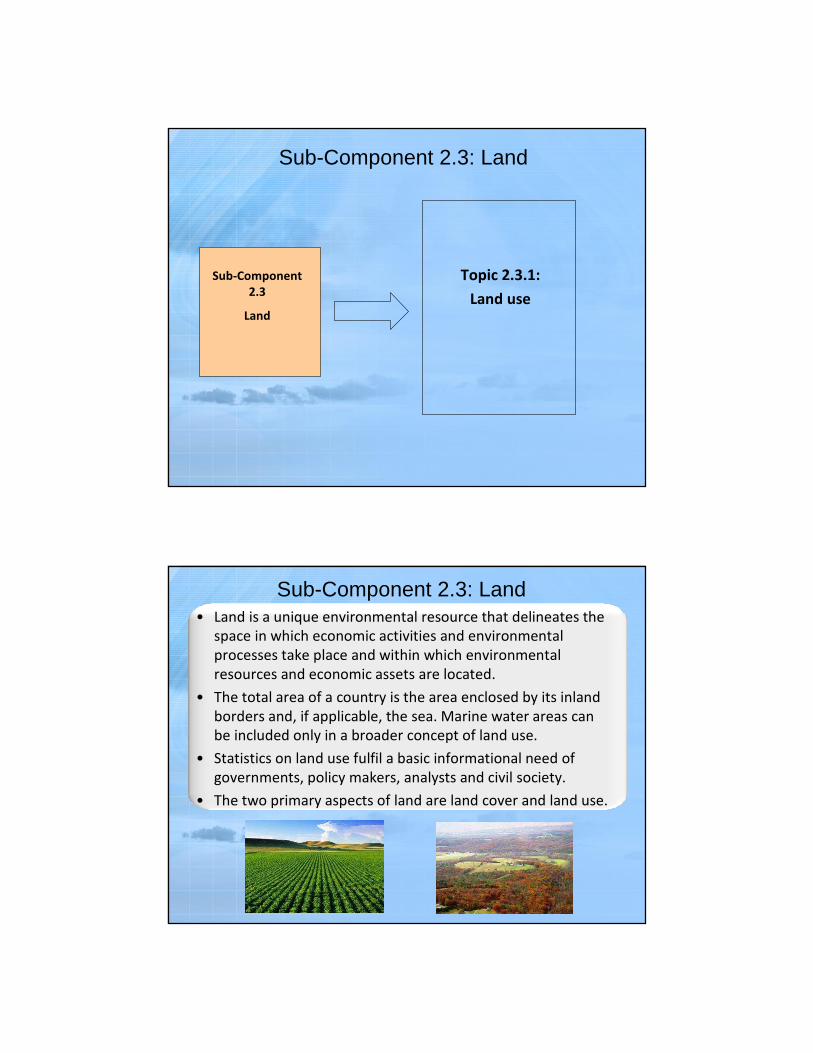
Sub-Component 2.3: Land
Topic 2.3.1:
Land use
• Land is a unique environmental resource that delineates the
space in which economic activities and environmental
processes take place and within which environmental
resources and economic assets are located.
• The total area of a country is the area enclosed by its inland
borders and, if applicable, the sea. Marine water areas can
be included only in a broader concept of land use.
• Statistics on land use fulfil a basic informational need of
governments, policy makers, analysts and civil society.
• The two primary aspects of land are land cover and land use.
Sub-Component 2.3: Land
Sub-Component
2.3
Land
Sub-Component 2.3: Land
Topic 2.3.1:
Land use
Topic 2.3.1
• Reflects both the activities undertaken and the institutional arrangements put in place for a given area for the purposes of economic production, or the maintenance and restoration of environmental functions. Land being “used”means the existence of some kind of human activity or management.
• There are areas of land that are “not in use” by human activities which are important from an ecological point of view. Land use statistics cover both land in use and land not in use.
• Statistics on land cover and its changes also give information about the extent of different ecosystems.
• Reference framework for the interim classification of land use is provided in the SEEA Central Framework
• Sources are field surveys and remote sensing, mostly satellite images, and administrative land registers
Sub-Component 2.3: Land
Topic 2.3.1: Land UseTopic 2.3.1: Land Use
Example statistics:
• Land use area
• Coastal area
Sub-Component
2.4
Soil Resources
Sub-Component 2.4: Soil Resources
Topic 2.4.1:
((Under Development)
Topic 2.4.1
• Accounting for soil resources provides information on area and volume of soil resources lost due to erosion, degradation, or made unavailable by changes in land cover and other sources.
• Accounting for soil resources in terms of their types, nutrient content, carbon content and other characteristics is relevant for more detailed examination of the health of soil systems, and their connections between soil resources and production in agriculture and forestry.
• Statistics related to the area, and changes in the area under soil types are covered under Topic 1.1.4: Soil characteristics.
• Changes in the volume of soil resources and other aspects of accounting for soil resources are conceptually included in the FDES but the development of the necessary statistics is subject to further research.
Sub-Component 2.4: Soil Resources
Sub-Component
2.5
Biological
Resources
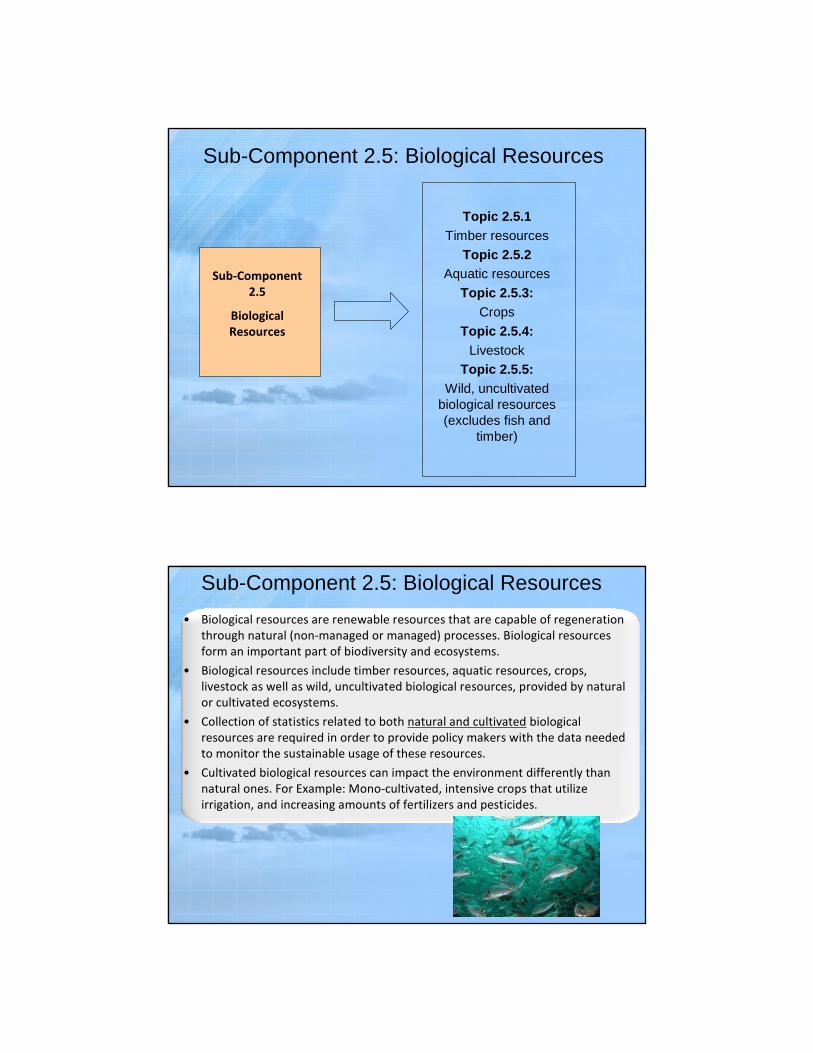
Sub-Component 2.5: Biological Resources
Topic 2.5.1Timber resources
Topic 2.5.2Aquatic resources
Topic 2.5.3: Crops
Topic 2.5.4: Livestock
Topic 2.5.5:Wild, uncultivated
biological resources (excludes fish and
timber)
• Biological resources are renewable resources that are capable of regeneration
through natural (non-managed or managed) processes. Biological resources
form an important part of biodiversity and ecosystems.
• Biological resources include timber resources, aquatic resources, crops,
livestock as well as wild, uncultivated biological resources, provided by natural
or cultivated ecosystems.
• Collection of statistics related to both natural and cultivated biological
resources are required in order to provide policy makers with the data needed
to monitor the sustainable usage of these resources.
• Cultivated biological resources can impact the environment differently than
natural ones. For Example: Mono-cultivated, intensive crops that utilize
irrigation, and increasing amounts of fertilizers and pesticides.
Sub-Component 2.5: Biological Resources
Sub-Component
2.5
Biological
Resources
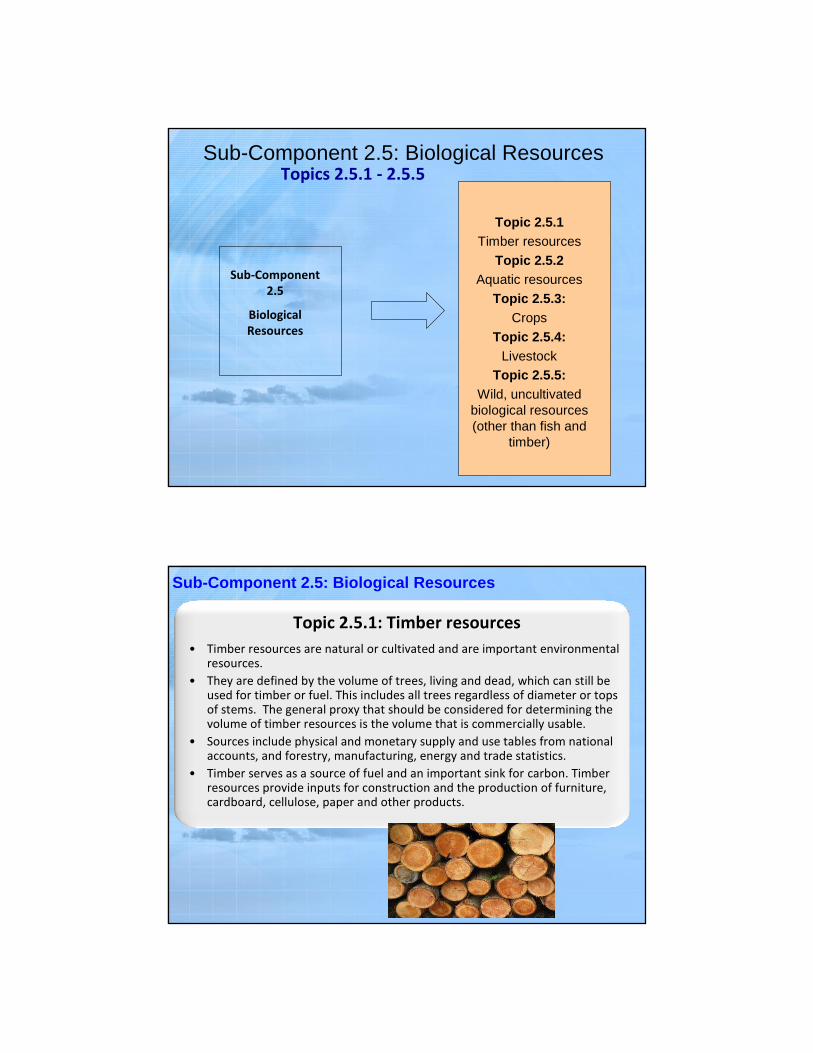
Sub-Component 2.5: Biological Resources
Topic 2.5.1Timber resources
Topic 2.5.2Aquatic resources
Topic 2.5.3: Crops
Topic 2.5.4: Livestock
Topic 2.5.5:Wild, uncultivated
biological resources (other than fish and
timber)
Topics 2.5.1 - 2.5.5
• Timber resources are natural or cultivated and are important environmental resources.
• They are defined by the volume of trees, living and dead, which can still be used for timber or fuel. This includes all trees regardless of diameter or tops of stems. The general proxy that should be considered for determining the volume of timber resources is the volume that is commercially usable.
• Sources include physical and monetary supply and use tables from national accounts, and forestry, manufacturing, energy and trade statistics.
• Timber serves as a source of fuel and an important sink for carbon. Timber resources provide inputs for construction and the production of furniture, cardboard, cellulose, paper and other products.
Sub-Component 2.5: Biological Resources
Topic 2.5.1: Timber resourcesTopic 2.5.1: Timber resources
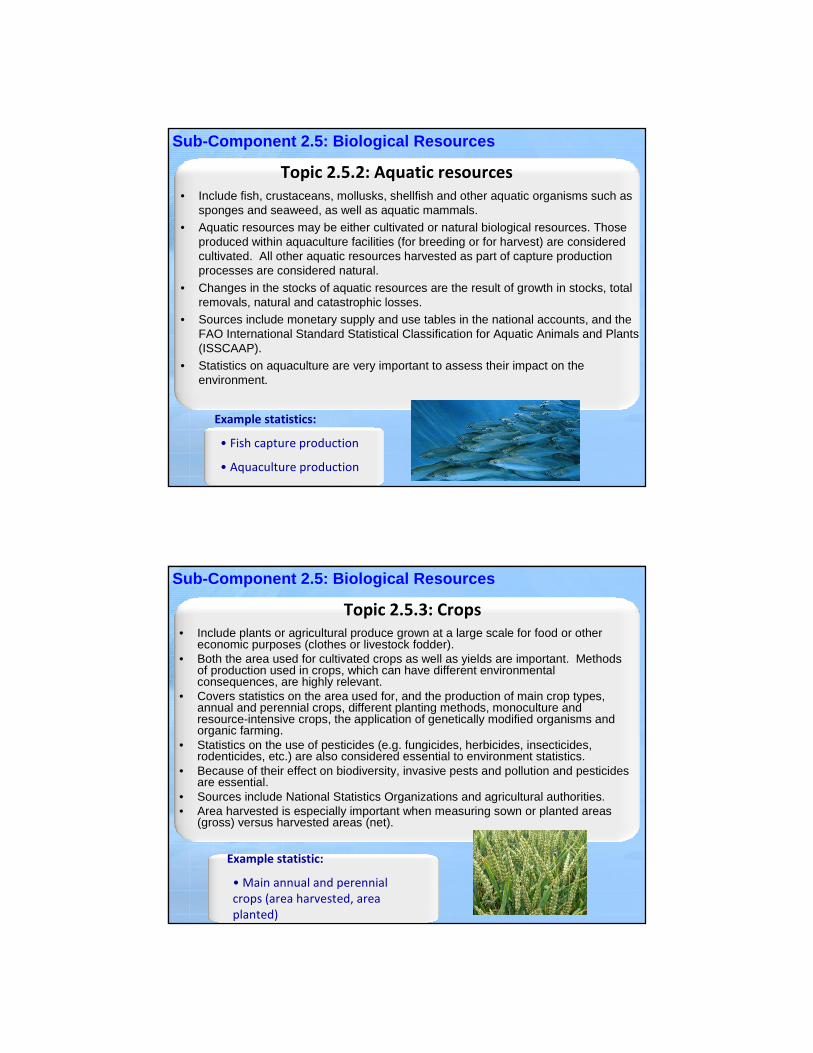
• Include fish, crustaceans, mollusks, shellfish and other aquatic organisms such as sponges and seaweed, as well as aquatic mammals.
• Aquatic resources may be either cultivated or natural biological resources. Those produced within aquaculture facilities (for breeding or for harvest) are considered cultivated. All other aquatic resources harvested as part of capture production processes are considered natural.
• Changes in the stocks of aquatic resources are the result of growth in stocks, total removals, natural and catastrophic losses.
• Sources include monetary supply and use tables in the national accounts, and theFAO International Standard Statistical Classification for Aquatic Animals and Plants (ISSCAAP).
• Statistics on aquaculture are very important to assess their impact on the environment.
Sub-Component 2.5: Biological Resources
Topic 2.5.2: Aquatic resourcesTopic 2.5.2: Aquatic resources
Example statistics:
• Fish capture production
• Aquaculture production
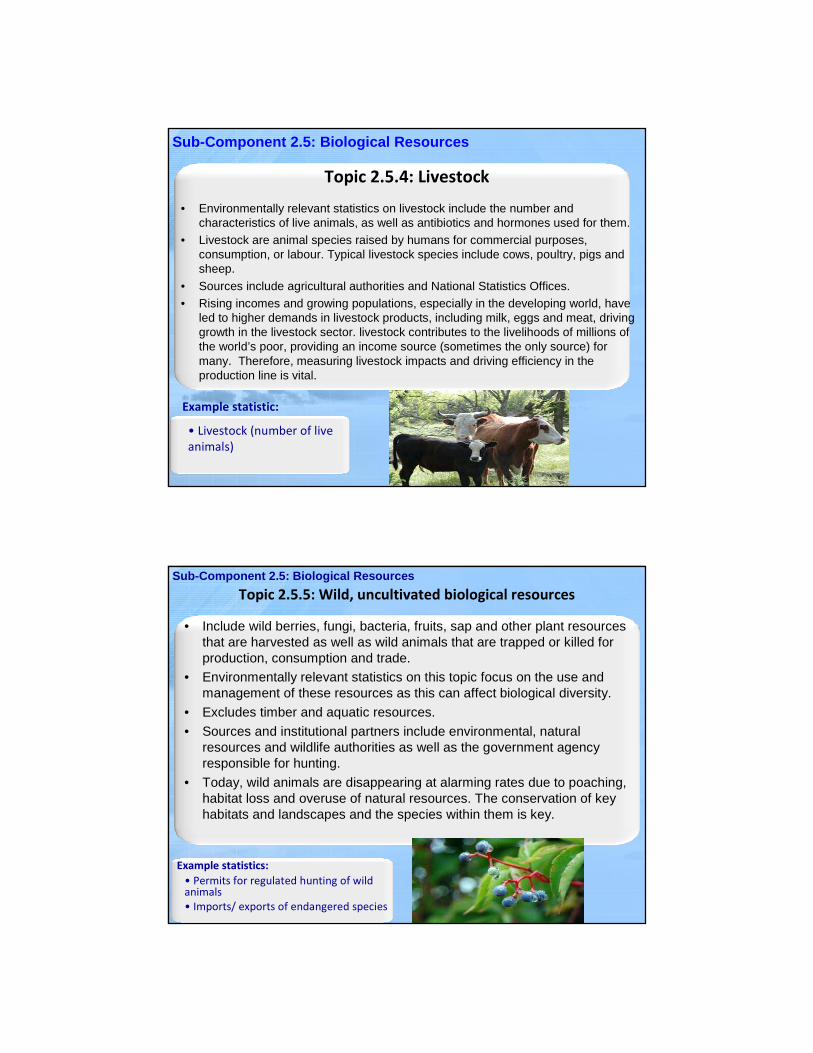
• Include plants or agricultural produce grown at a large scale for food or other economic purposes (clothes or livestock fodder).
• Both the area used for cultivated crops as well as yields are important. Methods of production used in crops, which can have different environmental consequences, are highly relevant.
• Covers statistics on the area used for, and the production of main crop types, annual and perennial crops, different planting methods, monoculture and resource-intensive crops, the application of genetically modified organisms and organic farming.
• Statistics on the use of pesticides (e.g. fungicides, herbicides, insecticides, rodenticides, etc.) are also considered essential to environment statistics.
• Because of their effect on biodiversity, invasive pests and pollution and pesticides are essential.
• Sources include National Statistics Organizations and agricultural authorities.• Area harvested is especially important when measuring sown or planted areas
(gross) versus harvested areas (net).
Sub-Component 2.5: Biological Resources
Topic 2.5.3: CropsTopic 2.5.3: Crops
Example statistic:
• Main annual and perennial
crops (area harvested, area
planted)
• Environmentally relevant statistics on livestock include the number and characteristics of live animals, as well as antibiotics and hormones used for them.
• Livestock are animal species raised by humans for commercial purposes, consumption, or labour. Typical livestock species include cows, poultry, pigs and sheep.
• Sources include agricultural authorities and National Statistics Offices.• Rising incomes and growing populations, especially in the developing world, have
led to higher demands in livestock products, including milk, eggs and meat, driving growth in the livestock sector. livestock contributes to the livelihoods of millions of the world’s poor, providing an income source (sometimes the only source) for many. Therefore, measuring livestock impacts and driving efficiency in the production line is vital.
Sub-Component 2.5: Biological Resources
Topic 2.5.4: Topic 2.5.4: LivestockLivestock
Example statistic:
• Livestock (number of live
animals)
• Include wild berries, fungi, bacteria, fruits, sap and other plant resources that are harvested as well as wild animals that are trapped or killed for production, consumption and trade.
• Environmentally relevant statistics on this topic focus on the use and management of these resources as this can affect biological diversity.
• Excludes timber and aquatic resources.
• Sources and institutional partners include environmental, natural resources and wildlife authorities as well as the government agency responsible for hunting.
• Today, wild animals are disappearing at alarming rates due to poaching, habitat loss and overuse of natural resources. The conservation of key habitats and landscapes and the species within them is key.
Sub-Component 2.5: Biological Resources
Topic 2.5.5: Wild, uncultivated biological resources
Example statistics:
• Permits for regulated hunting of wild animals
• Imports/ exports of endangered species
Sub-Component
2.6
Water Resources
Sub-Component 2.6: Water Resources
Topic 2.6.1Water resources
Topic 2.6.2Abstraction, use and returns of
water
• Statistics on water resources, their abstraction, use and returns are
needed by policy makers for use in:
• Estimating the amount of available freshwater resources;
• Monitoring abstraction from key water bodies to prevent overutilization;
• Ensuring equitable usage of abstracted water; and
• Tracking the volume of water returned to the environment.
• International Recommendations for Water Statistics (IRWS) provides definitions and groupings for the purposes of statistics on
water resources and their use.
Sub-Component 2.6: Water Resources
Sub-Component
2.6
Water Resources
Topic 2.6.1Water resources
Topic 2.6.2Abstraction, use and returns of
water
Sub-Component 2.6: Water ResourcesTopics 2.6.1 – 2.6.2
• Include volume of water generated within country or territory as result of precipitation, volume of water lost to evapotranspiration, inflow of water from other territories, and outflow of water to other territories or the sea.
• Water resources consist of fresh and brackish water, regardless of their quality, in inland water bodies including surface water, groundwater and soil water.
• Inland water stocks are the volume of water contained in surface and groundwater bodies and in the soil at a point in time.
• Surface water includes water in artificial reservoirs, lakes, rivers and streams, snow, ice and glaciers.
• Groundwater comprises water that collects in porous layers of underground formations known as aquifers.
• Renewable water resources of a country are generated by precipitation and inflows of water from other countries and reduced by evapotranspiration.
• Sources include hydrometeorological and hydrological authorities, monitoring• Exclusions are freshwater and marine water quality as they are covered by topics 1.3.2
and 1.3.3
Sub-Component 2.6: Water Resources
Topic 2.6.1: Water ResourcesTopic 2.6.1: Water Resources
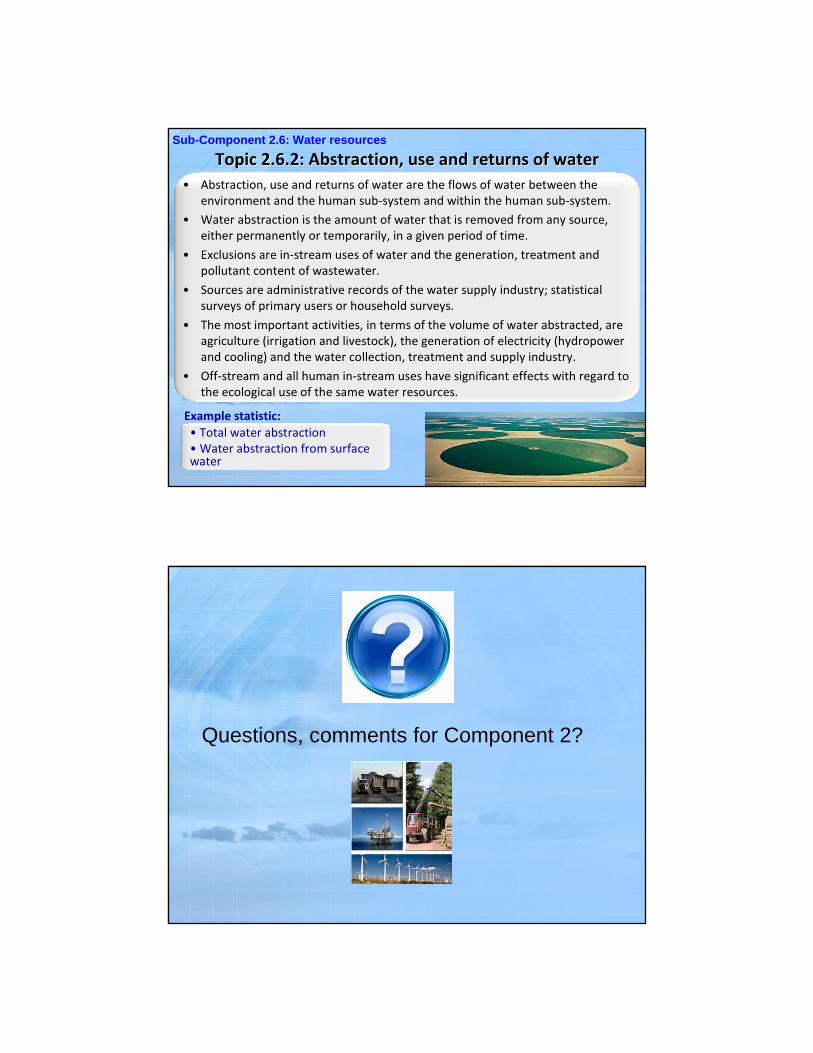
• Abstraction, use and returns of water are the flows of water between the
environment and the human sub-system and within the human sub-system.
• Water abstraction is the amount of water that is removed from any source,
either permanently or temporarily, in a given period of time.
• Exclusions are in-stream uses of water and the generation, treatment and
pollutant content of wastewater.
• Sources are administrative records of the water supply industry; statistical
surveys of primary users or household surveys.
• The most important activities, in terms of the volume of water abstracted, are
agriculture (irrigation and livestock), the generation of electricity (hydropower
and cooling) and the water collection, treatment and supply industry.
• Off-stream and all human in-stream uses have significant effects with regard to
the ecological use of the same water resources.
Sub-Component 2.6: Water resources
Topic 2.6.2: Abstraction, use and returns of waterTopic 2.6.2: Abstraction, use and returns of water
Example statistic:
• Total water abstraction
• Water abstraction from surface water
Questions, comments for Component 2?
Component 3
Contents of Component 3: Residuals
• Contains statistics on the generation and release of emissions as
a result of production, consumption and accumulation processes.
• Analyses emissions by type of receiving environment (air, water
bodies, or soil) and by type of substance, and type of emission
source (economic activity)
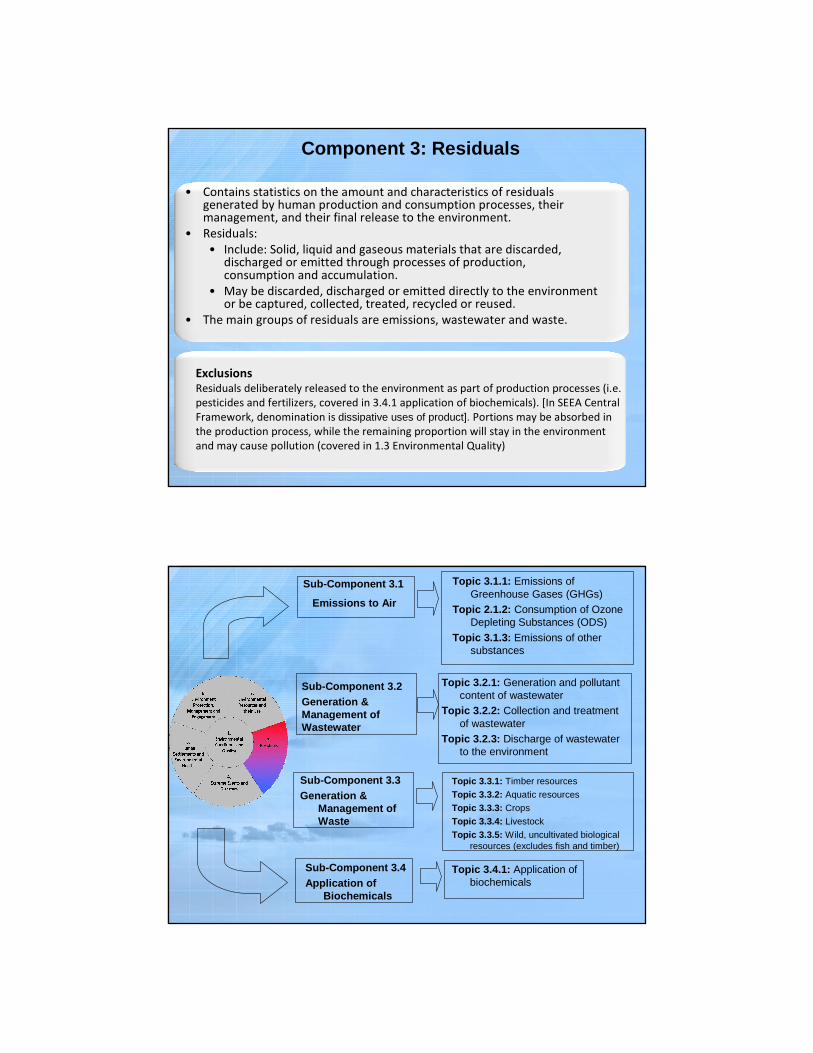
• Contains statistics on the amount and characteristics of residuals generated by human production and consumption processes, their management, and their final release to the environment.
• Residuals:
• Include: Solid, liquid and gaseous materials that are discarded,discharged or emitted through processes of production, consumption and accumulation.
• May be discarded, discharged or emitted directly to the environment or be captured, collected, treated, recycled or reused.
• The main groups of residuals are emissions, wastewater and waste.
Component 3: Residuals
Exclusions
Residuals deliberately released to the environment as part of production processes (i.e.
pesticides and fertilizers, covered in 3.4.1 application of biochemicals). [In SEEA Central
Framework, denomination is dissipative uses of product]. Portions may be absorbed in
the production process, while the remaining proportion will stay in the environment
and may cause pollution (covered in 1.3 Environmental Quality)
Sub-Component 3.2Generation & Management of Wastewater
Topic 3.2.1: Generation and pollutant content of wastewater
Topic 3.2.2: Collection and treatment of wastewater
Topic 3.2.3: Discharge of wastewater to the environment
Topic 3.1.1: Emissions of Greenhouse Gases (GHGs)
Topic 2.1.2: Consumption of Ozone Depleting Substances (ODS)
Topic 3.1.3: Emissions of other substances
Sub-Component 3.1
Emissions to Air
Sub-Component 3.3Generation &
Management of Waste
Sub-Component 3.4Application of
Biochemicals
Topic 3.3.1: Timber resources
Topic 3.3.2: Aquatic resources
Topic 3.3.3: Crops
Topic 3.3.4: Livestock
Topic 3.3.5: Wild, uncultivated biological resources (excludes fish and timber)
Topic 3.4.1: Application of biochemicals
Topic 3.4.1: Application of biochemicalsSub-Component 3.4Application of Biochemicals(one topic, 5 statistics)
Topic 3.3.1: Generation of wasteTopic 3.3.2: Management of waste
Sub-Component 3.3Generation and
Management of Waste(two topics, 20 statistics)
Topic 3.2.1: Generation and pollutant content of wastewater
Topic 3.2.2: Collection and treatment of wastewater
Topic 3.2.3: Discharge of wastewater to the environment
Topic 3.1.1: Emissions of Greenhouse Gases (GHGs)
Topic 2.1.2: Consumption of Ozone Depleting Substances (ODS)
Topic 3.1.3: Emissions of other substances
Sub-Component 3.2Generation and Management of Wastewater (three topics, 11 statistics)
Component 3Residuals
Sub-Component 3.1Emissions to Air (three topics, 20 statistics)
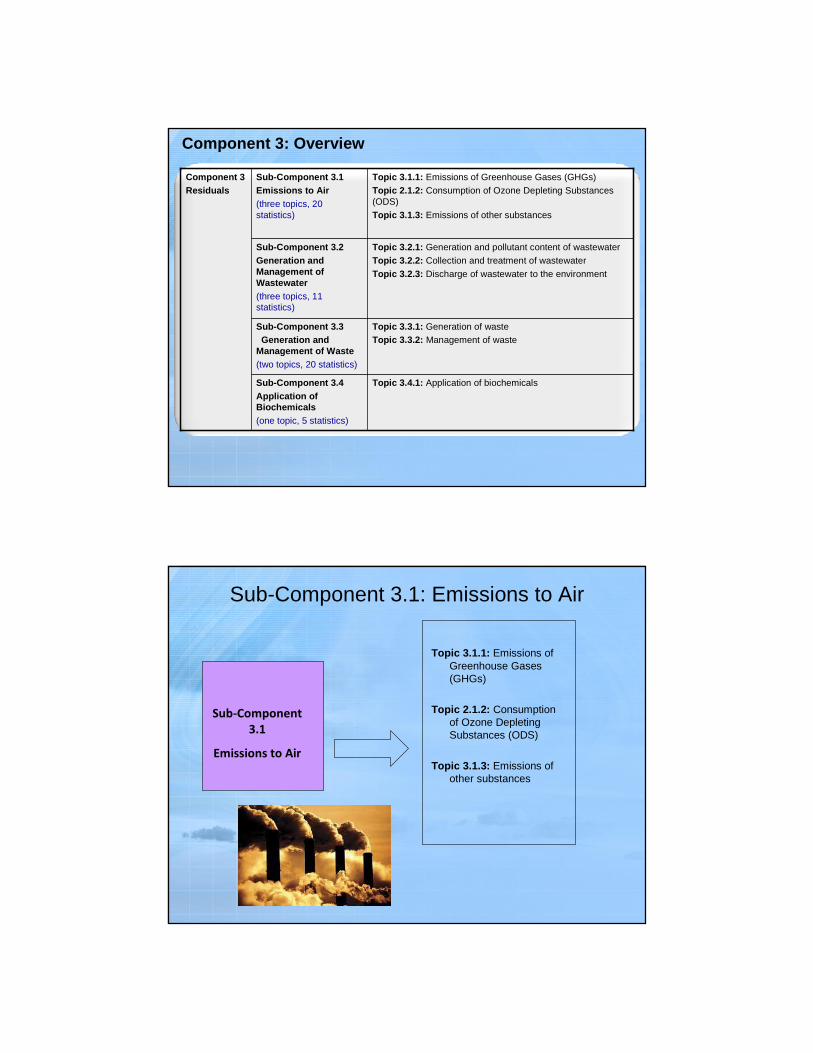
Component 3: Overview
Sub-Component
3.1
Emissions to Air
Sub-Component 3.1: Emissions to Air
Topic 3.1.1: Emissions of Greenhouse Gases (GHGs)
Topic 2.1.2: Consumption of Ozone Depleting Substances (ODS)
Topic 3.1.3: Emissions of other substances
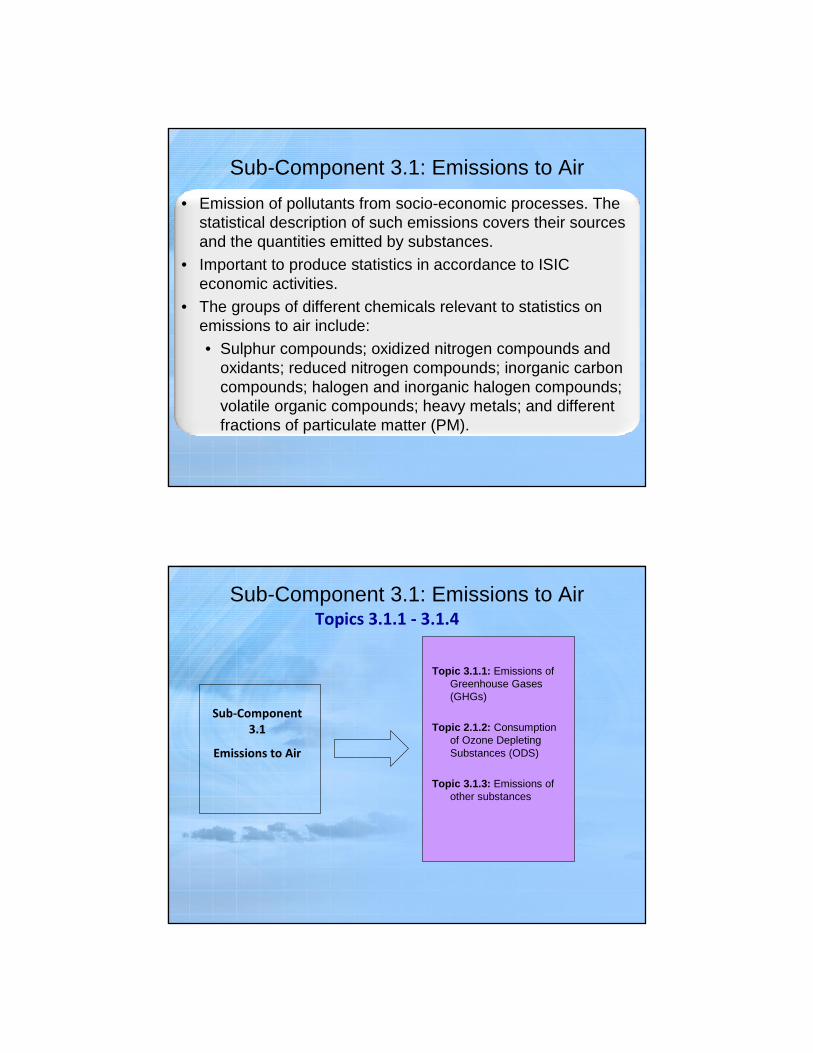
• Emission of pollutants from socio-economic processes. The statistical description of such emissions covers their sources and the quantities emitted by substances.
• Important to produce statistics in accordance to ISIC economic activities.
• The groups of different chemicals relevant to statistics on emissions to air include: • Sulphur compounds; oxidized nitrogen compounds and
oxidants; reduced nitrogen compounds; inorganic carbon compounds; halogen and inorganic halogen compounds; volatile organic compounds; heavy metals; and different fractions of particulate matter (PM).
Sub-Component 3.1: Emissions to Air
Sub-Component
3.1
Emissions to Air
Sub-Component 3.1: Emissions to Air
Topic 3.1.1: Emissions of Greenhouse Gases (GHGs)
Topic 2.1.2: Consumption of Ozone Depleting Substances (ODS)
Topic 3.1.3: Emissions of other substances
Topics 3.1.1 - 3.1.4
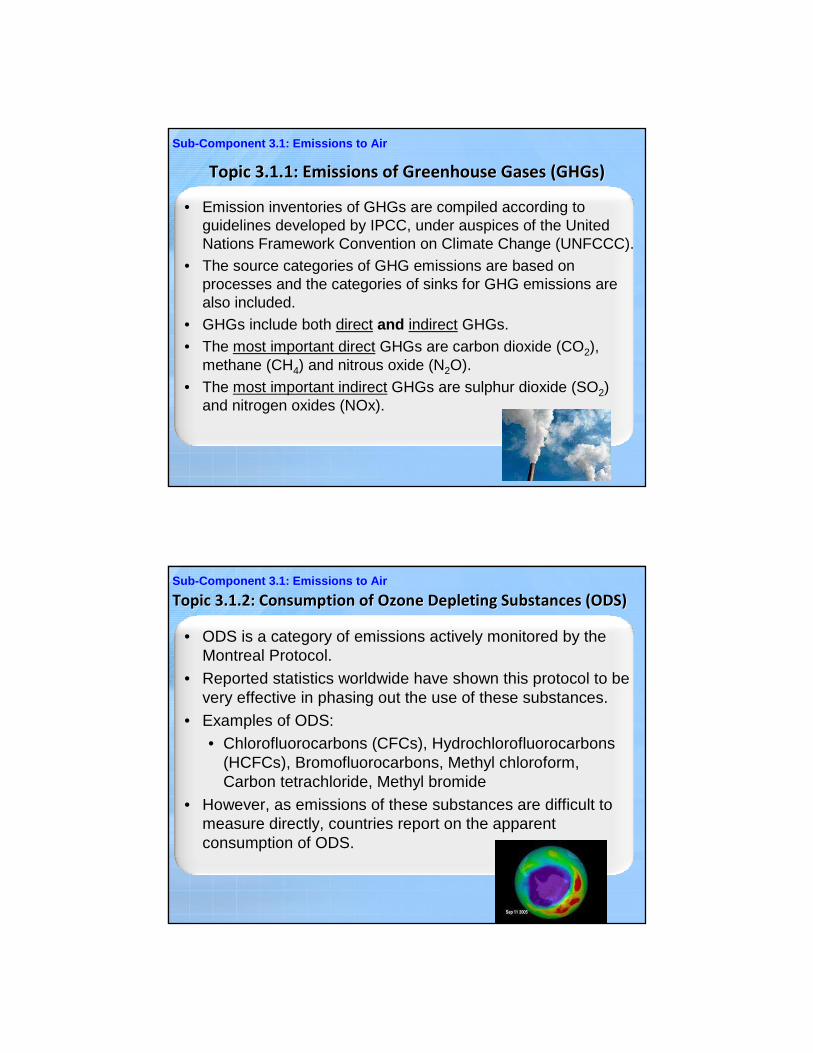
• Emission inventories of GHGs are compiled according to guidelines developed by IPCC, under auspices of the United Nations Framework Convention on Climate Change (UNFCCC).
• The source categories of GHG emissions are based on processes and the categories of sinks for GHG emissions are also included.
• GHGs include both direct and indirect GHGs. • The most important direct GHGs are carbon dioxide (CO2),
methane (CH4) and nitrous oxide (N2O).• The most important indirect GHGs are sulphur dioxide (SO2)
and nitrogen oxides (NOx).
Sub-Component 3.1: Emissions to Air
Topic 3.1.1: Emissions of Greenhouse Gases (Topic 3.1.1: Emissions of Greenhouse Gases (GHGsGHGs))
• ODS is a category of emissions actively monitored by the Montreal Protocol.
• Reported statistics worldwide have shown this protocol to be very effective in phasing out the use of these substances.
• Examples of ODS:• Chlorofluorocarbons (CFCs), Hydrochlorofluorocarbons
(HCFCs), Bromofluorocarbons, Methyl chloroform, Carbon tetrachloride, Methyl bromide
• However, as emissions of these substances are difficult to measure directly, countries report on the apparent consumption of ODS.
Sub-Component 3.1: Emissions to Air
Topic 3.1.2: Consumption of Ozone Depleting Substances (ODS)Topic 3.1.2: Consumption of Ozone Depleting Substances (ODS)
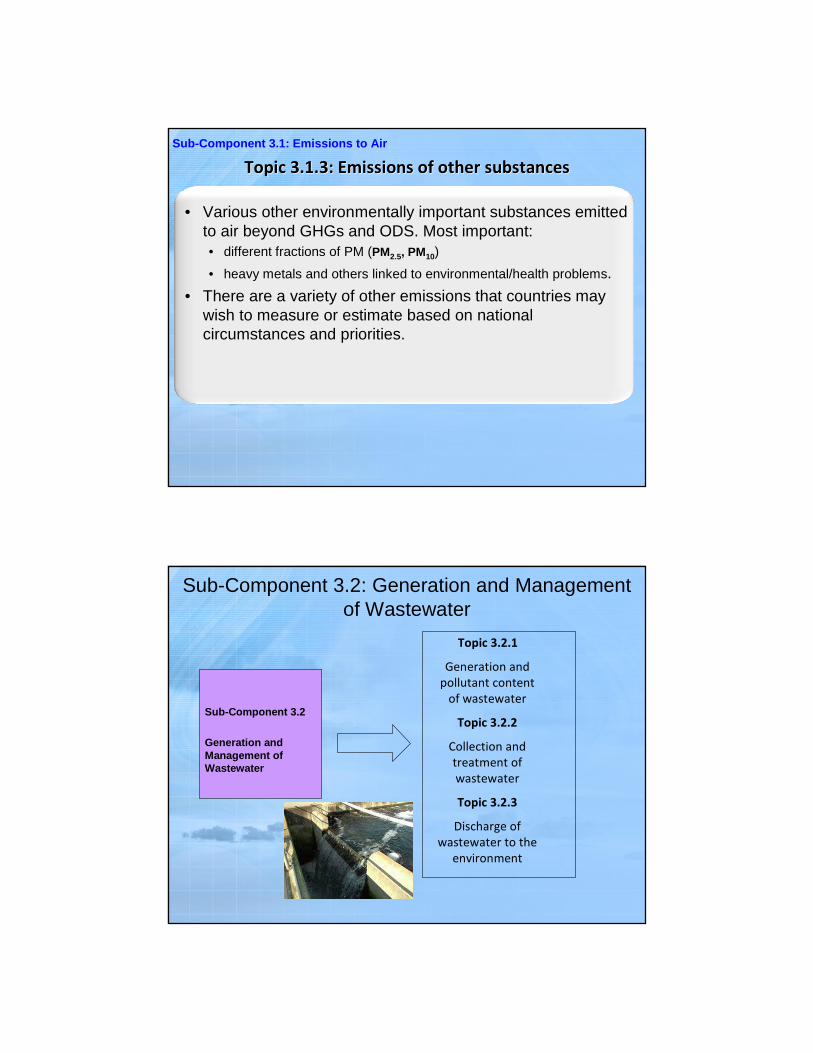
• Various other environmentally important substances emitted to air beyond GHGs and ODS. Most important: • different fractions of PM (PM2.5, PM10)
• heavy metals and others linked to environmental/health problems.• There are a variety of other emissions that countries may
wish to measure or estimate based on national circumstances and priorities.
Sub-Component 3.1: Emissions to Air
Topic 3.1.3: Emissions of other substancesTopic 3.1.3: Emissions of other substances
Sub-Component 3.2
Generation and Management of Wastewater
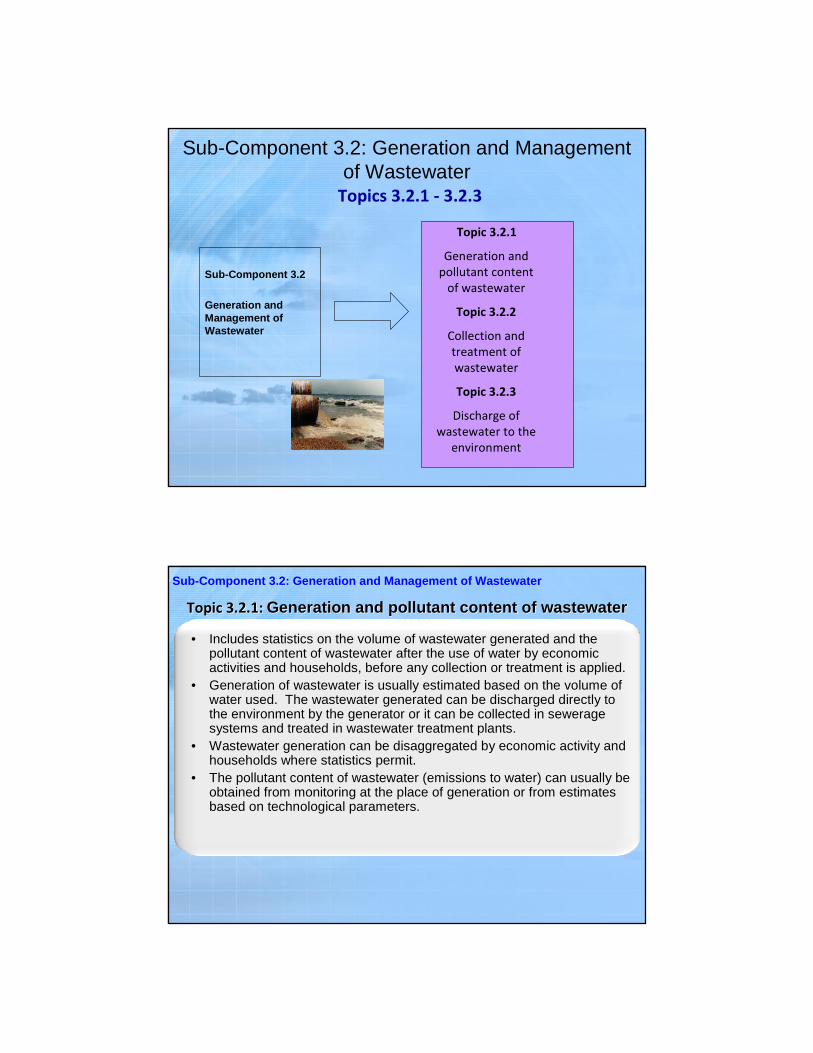
Sub-Component 3.2: Generation and Management of Wastewater
Topic 3.2.1
Generation and
pollutant content
of wastewater
Topic 3.2.2
Collection and
treatment of
wastewater
Topic 3.2.3
Discharge of
wastewater to the
environment
Includes:
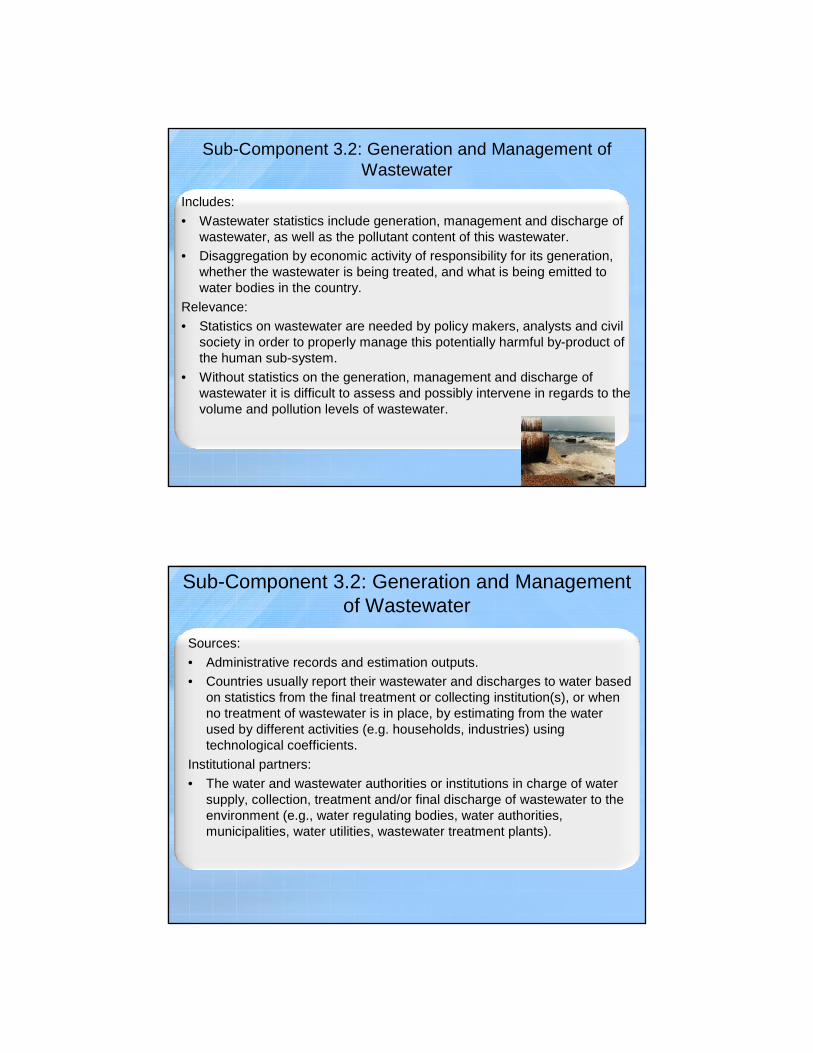
• Wastewater statistics include generation, management and discharge of wastewater, as well as the pollutant content of this wastewater.
• Disaggregation by economic activity of responsibility for its generation, whether the wastewater is being treated, and what is being emitted to water bodies in the country.
Relevance:
• Statistics on wastewater are needed by policy makers, analysts and civil society in order to properly manage this potentially harmful by-product of the human sub-system.
• Without statistics on the generation, management and discharge of wastewater it is difficult to assess and possibly intervene in regards to the volume and pollution levels of wastewater.
Sub-Component 3.2: Generation and Management of Wastewater
Sources:
• Administrative records and estimation outputs. • Countries usually report their wastewater and discharges to water based
on statistics from the final treatment or collecting institution(s), or when no treatment of wastewater is in place, by estimating from the water used by different activities (e.g. households, industries) usingtechnological coefficients.
Institutional partners:
• The water and wastewater authorities or institutions in charge of water supply, collection, treatment and/or final discharge of wastewater to the environment (e.g., water regulating bodies, water authorities, municipalities, water utilities, wastewater treatment plants).
Sub-Component 3.2: Generation and Management of Wastewater
Sub-Component 3.2
Generation and Management of Wastewater
Sub-Component 3.2: Generation and Management of Wastewater
Topic 3.2.1
Generation and
pollutant content
of wastewater
Topic 3.2.2
Collection and
treatment of
wastewater
Topic 3.2.3
Discharge of
wastewater to the
environment
Topics 3.2.1 - 3.2.3
• Includes statistics on the volume of wastewater generated and the pollutant content of wastewater after the use of water by economic activities and households, before any collection or treatment is applied.
• Generation of wastewater is usually estimated based on the volume of water used. The wastewater generated can be discharged directly to the environment by the generator or it can be collected in sewerage systems and treated in wastewater treatment plants.
• Wastewater generation can be disaggregated by economic activity and households where statistics permit.
• The pollutant content of wastewater (emissions to water) can usually be obtained from monitoring at the place of generation or from estimates based on technological parameters.
Sub-Component 3.2: Generation and Management of Wastewater
Topic 3.2.1: Topic 3.2.1: Generation and pollutant content of wastewaterGeneration and pollutant content of wastewater
Include statistics describing: (i) Volumes of collected and transported wastewater to their final
place of discharge or to treatment facilities(ii) Volume of wastewater treated by type of treatment (primary,
secondary and tertiary)(iii) Physical infrastructure related to wastewater collection and
treatment (e.g., number of treatment plants, capacities of plants, etc.)
(iv) Pollutant content extracted in the treatment facilities
Establishments engaged in the collection and treatment of wastewater are grouped under ISIC Rev.4, Section E, Division 37 Sewerage.
Sub-Component 3.2: Generation and Management of Wastewater
Topic 3.2.2: Topic 3.2.2: Collection and treatment of wastewaterCollection and treatment of wastewater
Scope:• This topic captures information at the stage of final discharge of wastewater to
the environment. It includes: (i) volume of wastewater discharged to the environment without treatment(ii) volume of wastewater discharged to the environment after treatment, by type
of treatment (primary, secondary and tertiary) and type of treatment facility (public, private, municipal, industrial)
(iii) effluent quality
Source:• Statistics on the volume of wastewater discharged after treatment can be
obtained from administrative records of the treatment plants. • Statistics on the volume of wastewater released without treatment can be
obtained from economic units and records of sewerage companies, or estimated on the basis of water use. The volume of discharged wastewater should also be disaggregated according to the recipient water body.
Sub-Component 3.2: Generation and Management of Wastewater
Topic 3.2.3: Topic 3.2.3: Discharge of wastewater to the environmentDischarge of wastewater to the environment
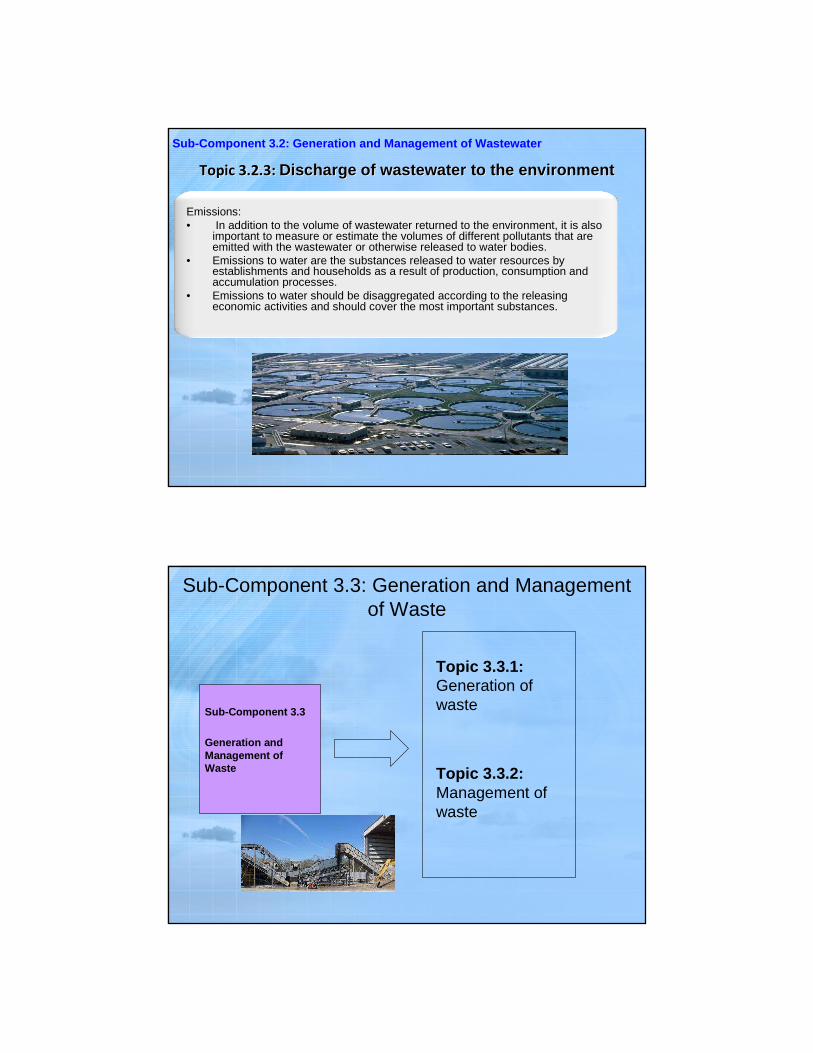
Emissions:• In addition to the volume of wastewater returned to the environment, it is also
important to measure or estimate the volumes of different pollutants that are emitted with the wastewater or otherwise released to water bodies.
• Emissions to water are the substances released to water resources by establishments and households as a result of production, consumption and accumulation processes.
• Emissions to water should be disaggregated according to the releasing economic activities and should cover the most important substances.
Sub-Component 3.2: Generation and Management of Wastewater
Topic 3.2.3: Topic 3.2.3: Discharge of wastewater to the environmentDischarge of wastewater to the environment
Sub-Component 3.3
Generation and Management of Waste
Sub-Component 3.3: Generation and Management of Waste
Topic 3.3.1: Generation of waste
Topic 3.3.2: Management of waste
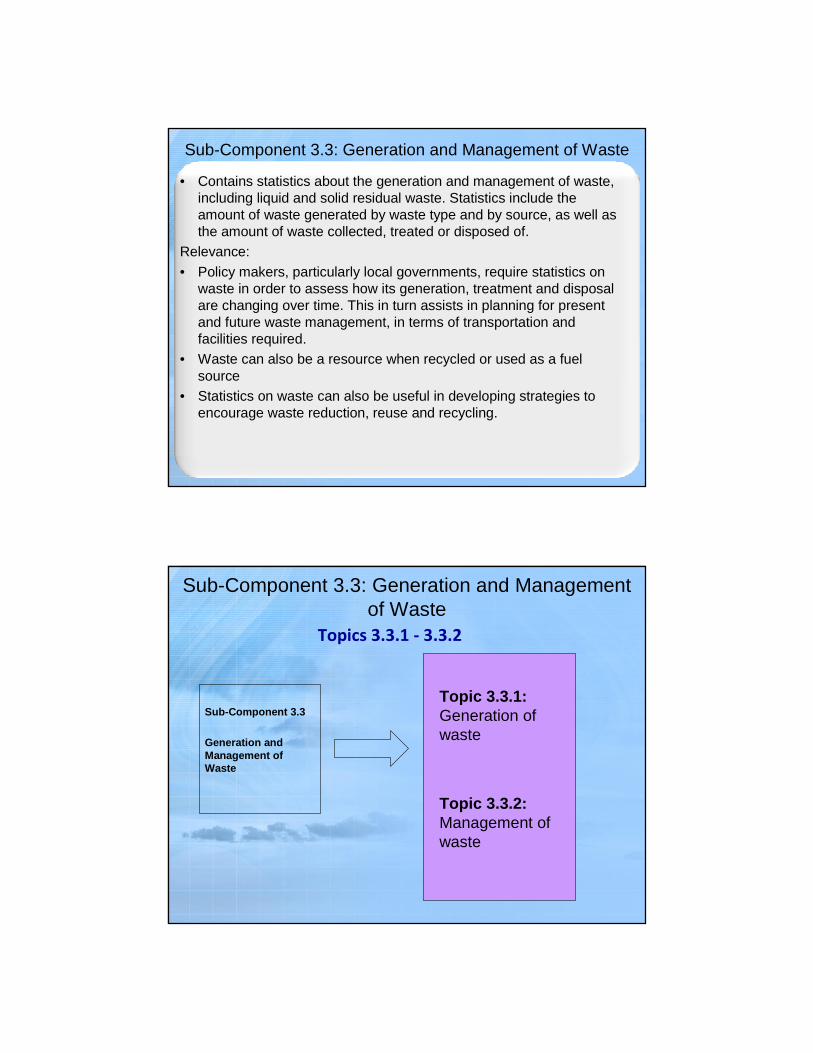
• Contains statistics about the generation and management of waste, including liquid and solid residual waste. Statistics include the amount of waste generated by waste type and by source, as well as the amount of waste collected, treated or disposed of.
Relevance:• Policy makers, particularly local governments, require statistics on
waste in order to assess how its generation, treatment and disposal are changing over time. This in turn assists in planning for present and future waste management, in terms of transportation and facilities required.
• Waste can also be a resource when recycled or used as a fuel source
• Statistics on waste can also be useful in developing strategies to encourage waste reduction, reuse and recycling.
Sub-Component 3.3: Generation and Management of Waste
Sub-Component 3.3
Generation and Management of Waste
Sub-Component 3.3: Generation and Management of Waste
Topic 3.3.1: Generation of waste
Topic 3.3.2: Management of waste
Topics 3.3.1 - 3.3.2
Content:• This topic includes statistics describing the amount of waste generated before
any collection or treatment is applied, by waste type, economic activity and households.
Scope:• The waste lists used by countries and international organizations are usually
based either on the generating process or the material content of the waste, or on the combination of these two aspects.
• Hazardous waste is a special group of waste that due to its toxic or other hazardous character needs special management; statistics on the generation of hazardous waste should also be included in this topic.
• Statistics on waste generation (can be estimated) are usually less available than the ones describing their collection and disposal.
The Basel Convention focuses on the control of transboundary movements of hazardous waste across international borders and sets up criteria for the environmentally sound management of such waste.
• Reporting needs originating in this convention include generation, exports and imports of hazardous waste.
Sub-Component 3.3: Generation and Management of Waste
Topic 3.3.1: Topic 3.3.1: Generation of wasteGeneration of waste
Includes statistics on: (i) The amount of waste collected and transported to treatment
facilities or to their final disposal(ii) The amount treated by type of treatment or disposal (e.g.,
recycling, composting, incineration, landfilling)(iii)The physical infrastructure for waste treatment, including the
number and capacity of treatment plants
Sub-Component 3.3: Generation and Management of Waste
Topic 3.3.2: Topic 3.3.2: Management of wasteManagement of waste
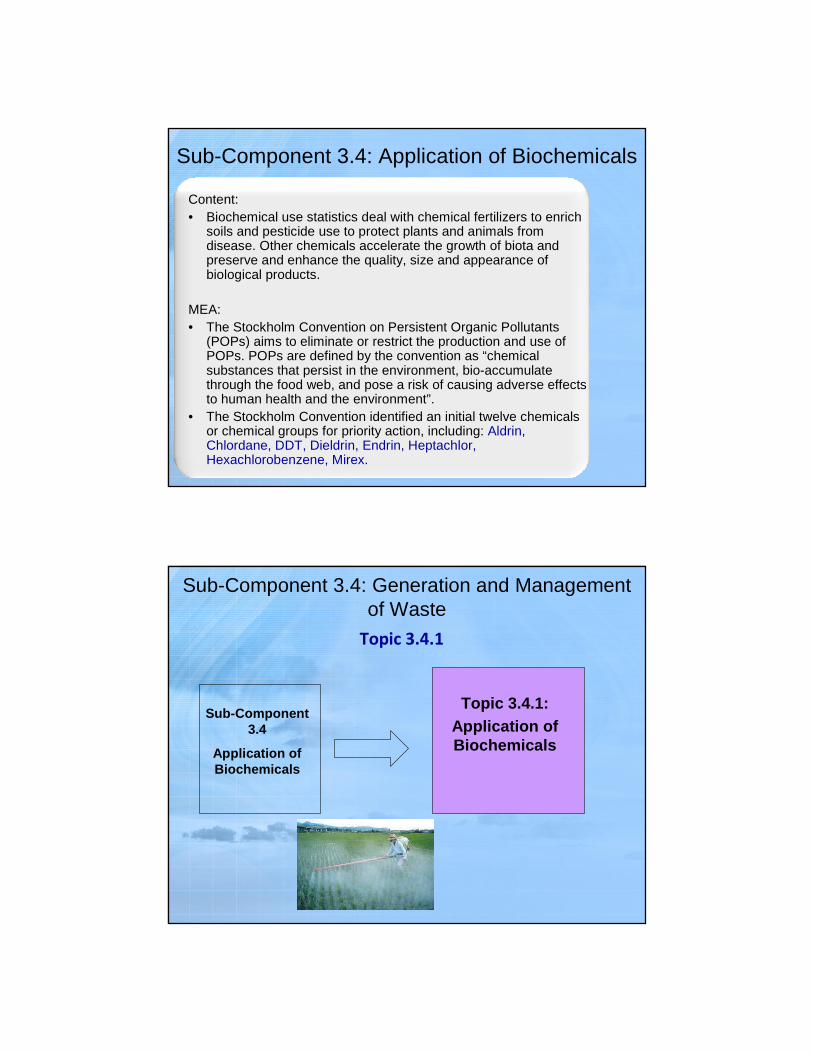
Content:• Biochemical use statistics deal with chemical fertilizers to enrich
soils and pesticide use to protect plants and animals from disease. Other chemicals accelerate the growth of biota and preserve and enhance the quality, size and appearance of biological products.
MEA:• The Stockholm Convention on Persistent Organic Pollutants
(POPs) aims to eliminate or restrict the production and use of POPs. POPs are defined by the convention as “chemical substances that persist in the environment, bio-accumulate through the food web, and pose a risk of causing adverse effectsto human health and the environment”.
• The Stockholm Convention identified an initial twelve chemicals or chemical groups for priority action, including: Aldrin, Chlordane, DDT, Dieldrin, Endrin, Heptachlor, Hexachlorobenzene, Mirex.
Sub-Component 3.4: Application of Biochemicals
Sub-Component 3.4
Application of Biochemicals
Sub-Component 3.4: Generation and Management of Waste
Topic 3.4.1:Application of Biochemicals
Topic 3.4.1
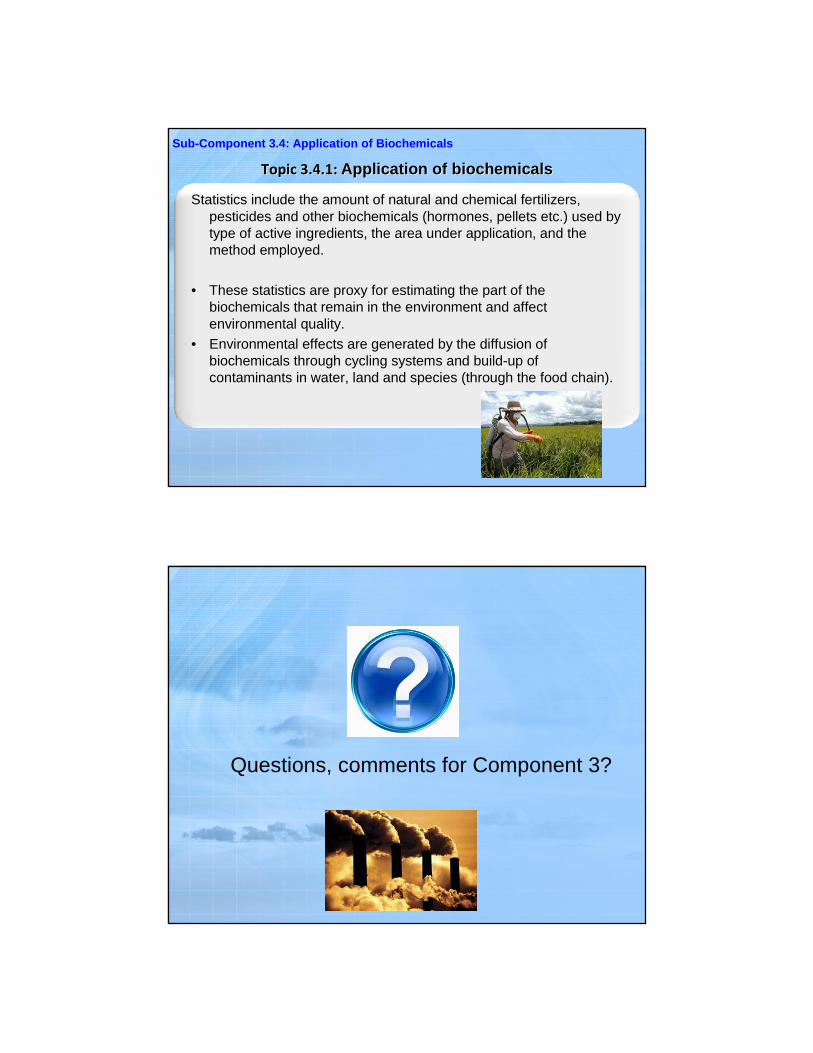
Statistics include the amount of natural and chemical fertilizers, pesticides and other biochemicals (hormones, pellets etc.) used by type of active ingredients, the area under application, and the method employed.
• These statistics are proxy for estimating the part of the biochemicals that remain in the environment and affect environmental quality.
• Environmental effects are generated by the diffusion of biochemicals through cycling systems and build-up of contaminants in water, land and species (through the food chain).
Sub-Component 3.4: Application of Biochemicals
Topic 3.4.1: Topic 3.4.1: Application of biochemicalsApplication of biochemicals
Questions, comments for Component 3?

Thank you for your attention!
For more information please contact the Environment Statistics Section at the UN Statistics Division:
E-mail: [email protected]: http://unstats.un.org/unsd/ENVIRONMENT/


![16662073 Dynamic Ecosystem Endangered Ecosystem[1]](https://img.pdfslide.net/doc/110x75/577d295b1a28ab4e1ea691a3/16662073-dynamic-ecosystem-endangered-ecosystem1.jpg)