Embed Size (px)
Citation preview
Abstract An existing finite element head model is enhanced in terms of composite modeling and new
constitutive law for the skull. The advanced FE head model is validated against the entire time domain response
obtained from 15 side impact experiments conducted with postmortem human surrogates. The new skull model
is capable of reproducing skull fracture in a realistic way. Further, 70 well‐documented head trauma cases are
reconstructed. The 15 experimental cases plus the 70 real‐world head trauma cases are finally put together to
derive a skull fracture injury risk curve. Based on the statistical analysis of different mechanical parameters, the
skull internal energy was the best candidate parameter to predict the skull failure. The proposed tolerance limit
for 50% risk of skull fracture is 448mJ of skull internal energy.
Keywords Finite element head modeling, skull fracture criteria, statistical analysis
I. INTRODUCTION
Mechanical insult to the head exceeding the tolerance limit results in head injury. Head injury is one of the
most frequent causes of death and impairment sustained by vulnerable road users, vehicle occupants and
sportsmen. About 1.24 million people die each year as a result of road traffic crashes [1]. Among all head
injuries, skull fracture accounts for 32% [2]. Fractures occur when the dynamic input exceeds the tolerance of
the skull. The biomechanical response of the human head in pedestrian accidents and side‐impact motor vehicle
crashes can lead to temporo‐parietal skull fractures [3]. Limited studies are reported in the literature in the
context of lateral head impacts [4‐6]. In contrast to the other regions of the head, frontal impact has been
investigated more often and injury criteria have been derived from the integration of the resultant linear
acceleration at the center of gravity of the dummy head [7]. However, injury criteria derived for frontal impacts
may exceed their limits during other impact directions and the applicability of these criteria to temporo‐parietal
impacts is not promising [5]. Improved head injury assessment is necessary to predict the potential head injury
risk under various impact conditions.
In the context of head trauma biomechanics, computational head modeling is an efficient tool for both the
establishment of head injury criteria and studies on head injury mitigation in contrast to experiments on post‐
mortem human surrogates (PMHS). Most of the previous models reported in the literature are less efficient to
predict skull fracture due to the lack of a composite fracture material model [8‐11]. Few researchers have
considered the skull as rigid [12]. Further, fully validated Human FE head models for lateral skull impacts do not
exist. In most of the existing models, the output of the stress analysis is validated against maximum force during
frontal impact and few are validated for force‐deflection curve until the fracture point during vertex impact
[10][13], but not actual force‐time curves from tests on PMHS. A skull model validated against force‐time curves
in the entire time domain at different velocities and for different boundary conditions is more reliable and
promising to establish new injury criteria based on accident reconstruction. This is the objective of the present
study.
With the help of advanced finite element head models (FEHM), real world accidents can be replicated to get
a thorough knowledge of injury tolerance and injury mechanism. Accident reconstruction is a scientific method
for investigating, analyzing and drawing conclusions about the causes and events during different real‐world
accident scenarios. In accident reconstruction, in‐depth collision analysis of vehicles, and causes and factors
responsible for injury are studied. Based on the statistical analysis of numerical accident reconstruction results,
suitable candidate parameters can be selected to predict specific injuries for the development of model‐based
D. Sahoo is a Doctoral student, C. Deck is a PhD Researcher in Biomechanics and R. Willinger is a Professor in Biomechanics at the Icube, University of Strasbourg, France. (tel: 00 333 68 85 29 23, fax: 00 33 3 68 85 29 36, email: [email protected]), N. Yoganandan is a Professor in Department of Neurosurgery, Medical College of Wisconsin, Milwaukee, WI, USA .
Composite FE Human Skull Model Validation and Development of Skull Fracture Criteria.
Debasis Sahoo, CarolineDeck, Narayan Yoganandan, RémyWillinger
IRC-14-20 IRCOBI Conference 2014
- 106 -
injury criteria. This can provide a better path for the development of pedestrian safety mechanisms.
In the present study a composite material model for the skull, taking into account damage, is implemented in
the Strasbourg University Finite Element Head Model (SUFEHM) in order to enhance the existing skull
mechanical constitutive law. The skull behavior is validated in terms of fracture patterns and contact forces by
reconstructing 15 experimental cases. The new skull model is capable of reproducing skull fracture in a realistic
way. The composite skull model is validated not only for maximum forces, but also for lateral impact against
actual force‐time curves from PMHS. Further, 70 well‐documented head trauma cases are reconstructed. The 15
experimental cases plus the 70 real‐world head trauma cases are finally put together to derive a skull fracture
injury risk curve. Different mechanical parameters are extracted and statistical (binary logistical regression)
analysis is performed to get the best suitable parameter to predict the skull failure. This study leads to a better
understanding of skull fracture mechanism and an efficient parameter for skull fracture tolerance limit.
II. MATERIALS AND METHODS
This section describes the finite element head model (FEHM) in which the constitutive law for a skull material
model is enhanced, followed by its utilization to reconstruct real world accident cases. A brief description about
the accident database and statistical analysis is reported.
Presentation of FEHM and Enhancement in Skull Model
A state‐of‐the‐art validated FEHM developed in Strasbourg University [13‐14] was used to develop model‐based skull fracture criteria. The advanced model was enhanced in terms of new constitutive material laws for brain and skull [15‐16]. The previous FEHM was equivalent to a 50th percentile adult human head. The main anatomical features included the scalp, brain, brainstem and cerebrospinal fluid (CSF), represented by brick elements, and the skull, face and two membranes (the falx and the tentorium) modeled with shell elements [8]. The SUFEHM presents a continuous mesh that is made up of 13,208 elements, including 1797 shell elements utilized to compose the skull and 5320 brick elements for the brain. The total mass of the head model is 4.7 kg. The geometry of the inner and outer surfaces of the skull was digitized from a human adult male skull to ensure anatomical accuracy. Isotropic, homogeneous and elastic mechanical constitutive material models were applied to each of the SUFEHM parts except for the brain. The brain model was enhanced by implementing anisotropy and fiber data (fractional anisotropy and fiber orientation) from medical imaging (diffuse tensor imaging) into new constitutive law [17] and was recently validated by Sahoo et al. [15] against local brain motion data from Hardy et al. [18‐19] and intracranial pressure data from Nahum et al. [20] and Trosseille et al. [21]. In the current study the skull model was improved by using an appropriate composite material model by
taking into account fracture [16]. The skull was modeled with three‐layered composite shell representing the inner table, diploe and outer table of human cranial bone. Under the LS‐DYNA platform, INTEGRATION_SHELL card has been implemented in order to define the three skull layers (thickness of 2mm each for the two cortical layers and 3mm for the diploe layer). The material model 55 that is available in LS‐DYNA named as MAT_ENHANCED COMPOSITE_DAMAGE was used to represent the material behavior of skull bones. The material model 55 has three failure criteria for four different types of in plane damage mechanism based on Tsai and Wu criterion [22] which is an operationally simple strength criterion for anisotropic materials developed from a scalar function of two strength tensors. The parameters for the composite material model for the skull are identified from various in vitro experimental data reported in the literature. For the elastic material properties like Young’s modulus and Poisson’s ratio, parameters remain the same as in the previous model [13‐14]. The density parameter for the diploe and outer/inner table were obtained from experimental in vitro data on human skull. The experiments were compression; shear by Melvin et al. [23] and measurement of fluctuation of acoustical properties by skull section by Fry et al. [24]. For different strength tensors (longitudinal/transverse tensile and compressive strength and shear strengths), a range of values are acquired from in vitro experimental tests conducted by Wood et al. [25] and McElhaney et al. [26]. The skull mechanical parameters implemented under LS‐DYNA are represented in TABLE 1. More information about the constitutive law and failure modes are available [16].
IRC-14-20 IRCOBI Conference 2014
- 107 -
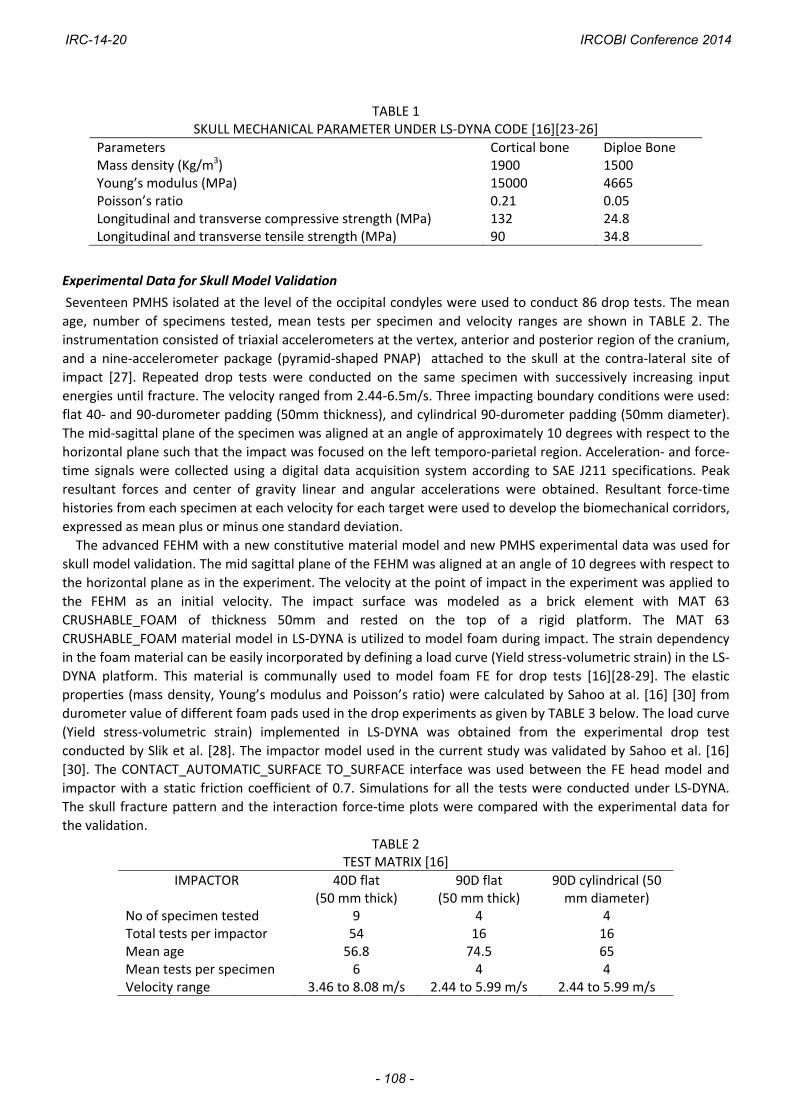
TABLE 1 SKULL MECHANICAL PARAMETER UNDER LS‐DYNA CODE [16][23‐26]
Parameters Cortical bone Diploe Bone Mass density (Kg/m3) 1900 1500 Young’s modulus (MPa) 15000 4665 Poisson’s ratio 0.21 0.05 Longitudinal and transverse compressive strength (MPa) 132 24.8 Longitudinal and transverse tensile strength (MPa) 90 34.8
Experimental Data for Skull Model Validation
Seventeen PMHS isolated at the level of the occipital condyles were used to conduct 86 drop tests. The mean
age, number of specimens tested, mean tests per specimen and velocity ranges are shown in TABLE 2. The
instrumentation consisted of triaxial accelerometers at the vertex, anterior and posterior region of the cranium,
and a nine‐accelerometer package (pyramid‐shaped PNAP) attached to the skull at the contra‐lateral site of
impact [27]. Repeated drop tests were conducted on the same specimen with successively increasing input
energies until fracture. The velocity ranged from 2.44‐6.5m/s. Three impacting boundary conditions were used:
flat 40‐ and 90‐durometer padding (50mm thickness), and cylindrical 90‐durometer padding (50mm diameter).
The mid‐sagittal plane of the specimen was aligned at an angle of approximately 10 degrees with respect to the
horizontal plane such that the impact was focused on the left temporo‐parietal region. Acceleration‐ and force‐
time signals were collected using a digital data acquisition system according to SAE J211 specifications. Peak
resultant forces and center of gravity linear and angular accelerations were obtained. Resultant force‐time
histories from each specimen at each velocity for each target were used to develop the biomechanical corridors,
expressed as mean plus or minus one standard deviation.
The advanced FEHM with a new constitutive material model and new PMHS experimental data was used for
skull model validation. The mid sagittal plane of the FEHM was aligned at an angle of 10 degrees with respect to
the horizontal plane as in the experiment. The velocity at the point of impact in the experiment was applied to
the FEHM as an initial velocity. The impact surface was modeled as a brick element with MAT 63
CRUSHABLE_FOAM of thickness 50mm and rested on the top of a rigid platform. The MAT 63
CRUSHABLE_FOAM material model in LS‐DYNA is utilized to model foam during impact. The strain dependency
in the foam material can be easily incorporated by defining a load curve (Yield stress‐volumetric strain) in the LS‐
DYNA platform. This material is communally used to model foam FE for drop tests [16][28‐29]. The elastic
properties (mass density, Young’s modulus and Poisson’s ratio) were calculated by Sahoo at al. [16] [30] from
durometer value of different foam pads used in the drop experiments as given by TABLE 3 below. The load curve
(Yield stress‐volumetric strain) implemented in LS‐DYNA was obtained from the experimental drop test
conducted by Slik et al. [28]. The impactor model used in the current study was validated by Sahoo et al. [16]
[30]. The CONTACT_AUTOMATIC_SURFACE TO_SURFACE interface was used between the FE head model and
impactor with a static friction coefficient of 0.7. Simulations for all the tests were conducted under LS‐DYNA.
The skull fracture pattern and the interaction force‐time plots were compared with the experimental data for
the validation.
TABLE 2 TEST MATRIX [16]
IMPACTOR 40D flat (50 mm thick)
90D flat (50 mm thick)
90D cylindrical (50 mm diameter)
No of specimen tested 9 4 4 Total tests per impactor 54 16 16 Mean age 56.8 74.5 65 Mean tests per specimen 6 4 4 Velocity range 3.46 to 8.08 m/s 2.44 to 5.99 m/s 2.44 to 5.99 m/s
IRC-14-20 IRCOBI Conference 2014
- 108 -
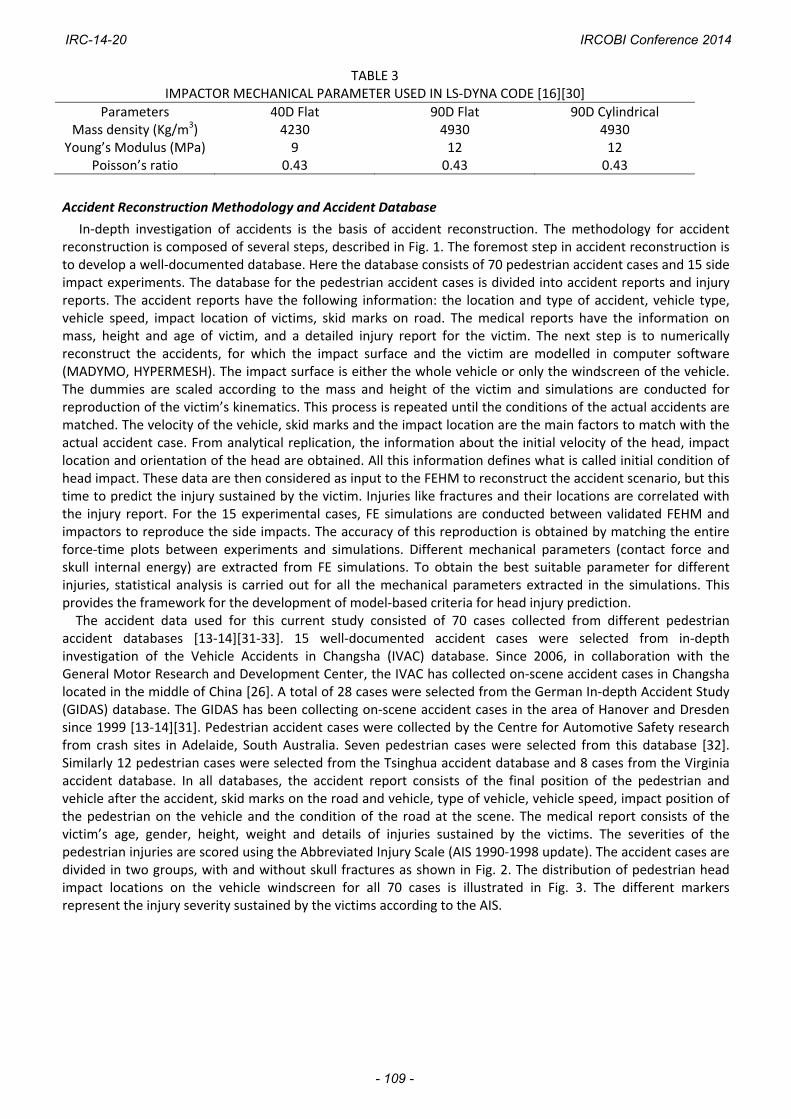
TABLE 3 IMPACTOR MECHANICAL PARAMETER USED IN LS‐DYNA CODE [16][30]
Parameters 40D Flat 90D Flat 90D Cylindrical Mass density (Kg/m3) 4230 4930 4930
Young’s Modulus (MPa) 9 12 12 Poisson’s ratio 0.43 0.43 0.43
Accident Reconstruction Methodology and Accident Database
In‐depth investigation of accidents is the basis of accident reconstruction. The methodology for accident reconstruction is composed of several steps, described in Fig. 1. The foremost step in accident reconstruction is to develop a well‐documented database. Here the database consists of 70 pedestrian accident cases and 15 side impact experiments. The database for the pedestrian accident cases is divided into accident reports and injury reports. The accident reports have the following information: the location and type of accident, vehicle type, vehicle speed, impact location of victims, skid marks on road. The medical reports have the information on mass, height and age of victim, and a detailed injury report for the victim. The next step is to numerically reconstruct the accidents, for which the impact surface and the victim are modelled in computer software (MADYMO, HYPERMESH). The impact surface is either the whole vehicle or only the windscreen of the vehicle. The dummies are scaled according to the mass and height of the victim and simulations are conducted for reproduction of the victim’s kinematics. This process is repeated until the conditions of the actual accidents are matched. The velocity of the vehicle, skid marks and the impact location are the main factors to match with the actual accident case. From analytical replication, the information about the initial velocity of the head, impact location and orientation of the head are obtained. All this information defines what is called initial condition of head impact. These data are then considered as input to the FEHM to reconstruct the accident scenario, but this time to predict the injury sustained by the victim. Injuries like fractures and their locations are correlated with the injury report. For the 15 experimental cases, FE simulations are conducted between validated FEHM and impactors to reproduce the side impacts. The accuracy of this reproduction is obtained by matching the entire force‐time plots between experiments and simulations. Different mechanical parameters (contact force and skull internal energy) are extracted from FE simulations. To obtain the best suitable parameter for different injuries, statistical analysis is carried out for all the mechanical parameters extracted in the simulations. This provides the framework for the development of model‐based criteria for head injury prediction. The accident data used for this current study consisted of 70 cases collected from different pedestrian
accident databases [13‐14][31‐33]. 15 well‐documented accident cases were selected from in‐depth investigation of the Vehicle Accidents in Changsha (IVAC) database. Since 2006, in collaboration with the General Motor Research and Development Center, the IVAC has collected on‐scene accident cases in Changsha located in the middle of China [26]. A total of 28 cases were selected from the German In‐depth Accident Study (GIDAS) database. The GIDAS has been collecting on‐scene accident cases in the area of Hanover and Dresden since 1999 [13‐14][31]. Pedestrian accident cases were collected by the Centre for Automotive Safety research from crash sites in Adelaide, South Australia. Seven pedestrian cases were selected from this database [32]. Similarly 12 pedestrian cases were selected from the Tsinghua accident database and 8 cases from the Virginia accident database. In all databases, the accident report consists of the final position of the pedestrian and vehicle after the accident, skid marks on the road and vehicle, type of vehicle, vehicle speed, impact position of the pedestrian on the vehicle and the condition of the road at the scene. The medical report consists of the victim’s age, gender, height, weight and details of injuries sustained by the victims. The severities of the pedestrian injuries are scored using the Abbreviated Injury Scale (AIS 1990‐1998 update). The accident cases are divided in two groups, with and without skull fractures as shown in Fig. 2. The distribution of pedestrian head impact locations on the vehicle windscreen for all 70 cases is illustrated in Fig. 3. The different markers represent the injury severity sustained by the victims according to the AIS.
IRC-14-20 IRCOBI Conference 2014
- 109 -
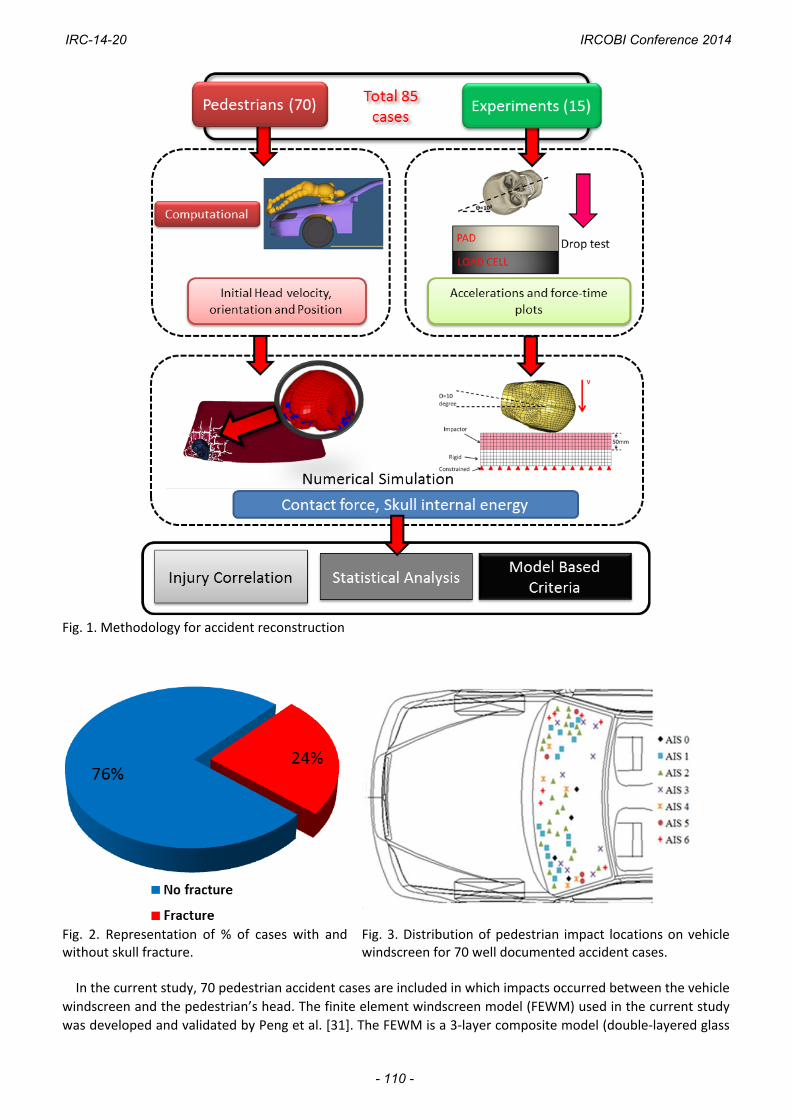
Fig. 1. Methodology for accident reconstruction
Fig. 2. Representation of % of cases with and without skull fracture.
Fig. 3. Distribution of pedestrian impact locations on vehicle windscreen for 70 well documented accident cases.
In the current study, 70 pedestrian accident cases are included in which impacts occurred between the vehicle
windscreen and the pedestrian’s head. The finite element windscreen model (FEWM) used in the current study
was developed and validated by Peng et al. [31]. The FEWM is a 3‐layer composite model (double‐layered glass
IRC-14-20 IRCOBI Conference 2014
- 110 -
and PBV‐tied model). The glass was modeled using MAT‐PIECEWISE‐LINEAR‐PLASTICITY material model in LS‐
DYNA code and the rupture was defined as 0.001. The PVB was modeled with MAT‐MOONEY‐RIVLIN‐RUBBER.
The mesh size of the model was optimized and 5mm element size is the most favorable. Validation of FEWM
was done by comparing the acceleration at the center of gravity of the head form and crack propagation in
simulation and experiments. More information about the FEWM and its validations are presented in Peng et al.
[31].
The reconstructions of 85 accident cases were done in LS‐DYNA platform. The cases were divided into two
categories: cases in which the windscreen was involved and the cases in which the windscreen was not involved.
For the cases where the head struck the windscreen, the head model was impacted on the windscreen model.
The loading condition is the relative position and the initial velocity between the head and the impacted surface
at the time just prior to the impact. The loading data were collected from the MADYMO simulation conducted
by the biomechanics team of Strasbourg University [13‐14][31‐32]. The new FEHM was translated and rotated in
LS‐DYNA to achieve the accurate positioning of the head relative to the windscreen in actual accident cases.
Then the initial velocity field was applied to all the nodes of the FEHM. The outer nodes of the windscreen were
constrained in all directions. Gravity field was also implemented throughout the simulation. The 15
experimental cases were also included along with the 70 pedestrian accident cases. Parameters like contact
force and skull internal energy were extracted from all simulations. Internal energy (IE) is computed in LS‐DYNA
for the whole part (skull) based on the six components of stress and strain (tensorial values). The calculation is
done incrementally for each element as described in Eq 1 [34]:
(IE)new = (IE)old + sum over all six directions of (stress X incremental strain X volume)
(1)
The internal energies of all the elements are summed to obtain the internal energy of the corresponding part
(skull).
To obtain the best suitable parameter to predict skull fracture, statistical analysis was carried out for the
mechanical parameters (contact force and skull internal energy) extracted in the simulation. The aim of the
statistical analysis is to provide a means of assessing the accuracy of a number of variables to predict head
injuries. According to studies by Hynd et al. [35], it was determined that the Nagelkerke r2 value based on
logistical regression provided the best statistical assessment over the other measures. The benefits of this
method are:
It provides comparable results to methods such as Probit analysis.
It is an appropriate analysis for the amount and type of data under investigation.
It provides a more rigorous assessment of the data as no underlying assumptions are made regarding the
outcome of the analysis, e.g. no injury response under zero loads as is assumed in the Modified
Maximum Likelihood Method.
Binary logistical regression was used for this assessment and carried out using the version 14.0 release of the
statistical software package SPSS. This method involved fitting a regression model between a number of
possible skull injury metrics (x=force or peak strain energy values calculated in our study). The probability of
injury (skull fracture) is defined as in Eq 2
bxa
bxa
e
exP
1)(
(2)
where a and b are two parameters calculated by regression. The candidate parameters were then compared
using the Nagelkerke R2 statistic (where the limits for this measure are 0 for a poor fit and 1 for a good fit) to
determine which head injury metric provides the best injury prediction.
III. RESULTS
Finite Element Skull Model Validation
The impact simulations for 15 experimental cases were conducted and the resultant contact forces between
IRC-14-20 IRCOBI Conference 2014
- 111 -
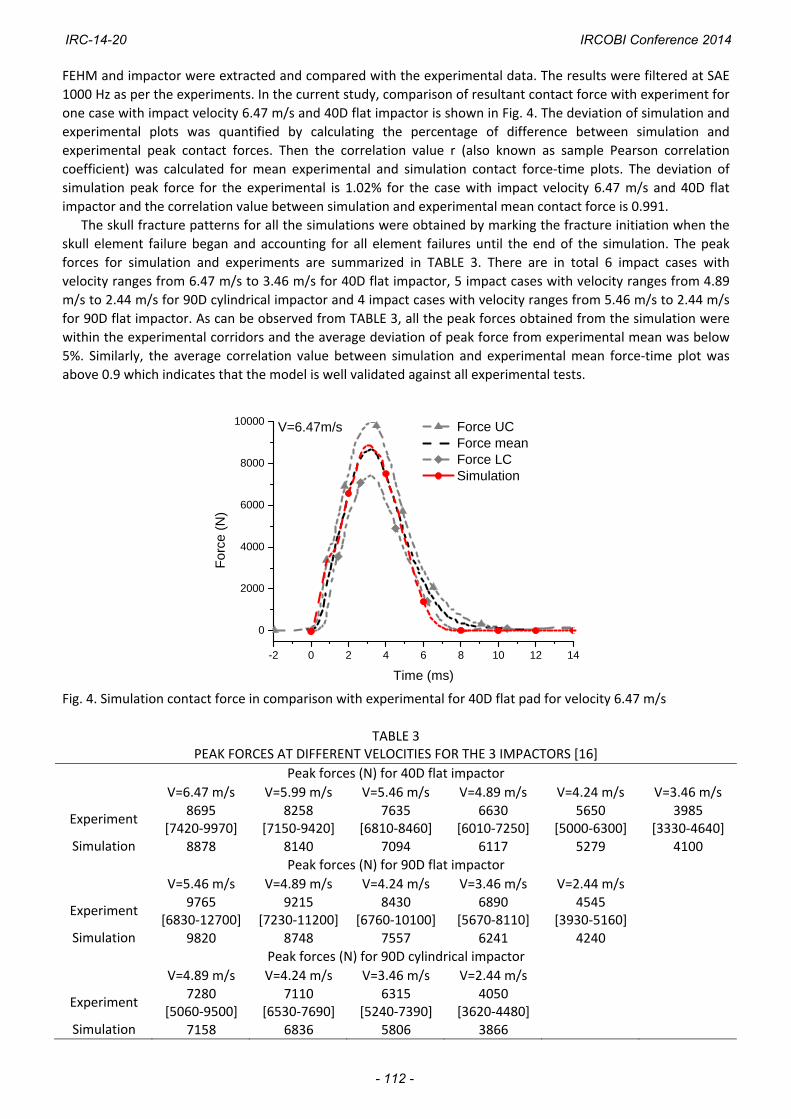
FEHM and impactor were extracted and compared with the experimental data. The results were filtered at SAE
1000 Hz as per the experiments. In the current study, comparison of resultant contact force with experiment for
one case with impact velocity 6.47 m/s and 40D flat impactor is shown in Fig. 4. The deviation of simulation and
experimental plots was quantified by calculating the percentage of difference between simulation and
experimental peak contact forces. Then the correlation value r (also known as sample Pearson correlation
coefficient) was calculated for mean experimental and simulation contact force‐time plots. The deviation of
simulation peak force for the experimental is 1.02% for the case with impact velocity 6.47 m/s and 40D flat
impactor and the correlation value between simulation and experimental mean contact force is 0.991.
The skull fracture patterns for all the simulations were obtained by marking the fracture initiation when the
skull element failure began and accounting for all element failures until the end of the simulation. The peak
forces for simulation and experiments are summarized in TABLE 3. There are in total 6 impact cases with
velocity ranges from 6.47 m/s to 3.46 m/s for 40D flat impactor, 5 impact cases with velocity ranges from 4.89
m/s to 2.44 m/s for 90D cylindrical impactor and 4 impact cases with velocity ranges from 5.46 m/s to 2.44 m/s
for 90D flat impactor. As can be observed from TABLE 3, all the peak forces obtained from the simulation were
within the experimental corridors and the average deviation of peak force from experimental mean was below
5%. Similarly, the average correlation value between simulation and experimental mean force‐time plot was
above 0.9 which indicates that the model is well validated against all experimental tests.
-2 0 2 4 6 8 10 12 14
0
2000
4000
6000
8000
10000 Force UC Force mean Force LC Simulation
V=6.47m/s
For
ce (
N)
Time (ms)
Fig. 4. Simulation contact force in comparison with experimental for 40D flat pad for velocity 6.47 m/s
TABLE 3 PEAK FORCES AT DIFFERENT VELOCITIES FOR THE 3 IMPACTORS [16]
Peak forces (N) for 40D flat impactor
V=6.47 m/s V=5.99 m/s V=5.46 m/s V=4.89 m/s V=4.24 m/s V=3.46 m/s
Experiment 8695
[7420‐9970] 8258
[7150‐9420] 7635
[6810‐8460] 6630
[6010‐7250] 5650
[5000‐6300] 3985
[3330‐4640] Simulation 8878 8140 7094 6117 5279 4100
Peak forces (N) for 90D flat impactor
V=5.46 m/s V=4.89 m/s V=4.24 m/s V=3.46 m/s V=2.44 m/s
Experiment 9765
[6830‐12700] 9215
[7230‐11200] 8430
[6760‐10100] 6890
[5670‐8110] 4545
[3930‐5160]
Simulation 9820 8748 7557 6241 4240
Peak forces (N) for 90D cylindrical impactor
V=4.89 m/s V=4.24 m/s V=3.46 m/s V=2.44 m/s
Experiment 7280
[5060‐9500] 7110
[6530‐7690] 6315
[5240‐7390] 4050
[3620‐4480]
Simulation 7158 6836 5806 3866
IRC-14-20 IRCOBI Conference 2014
- 112 -
[Min‐Max]=corridors of Experiment
Real‐world Accident Reconstruction
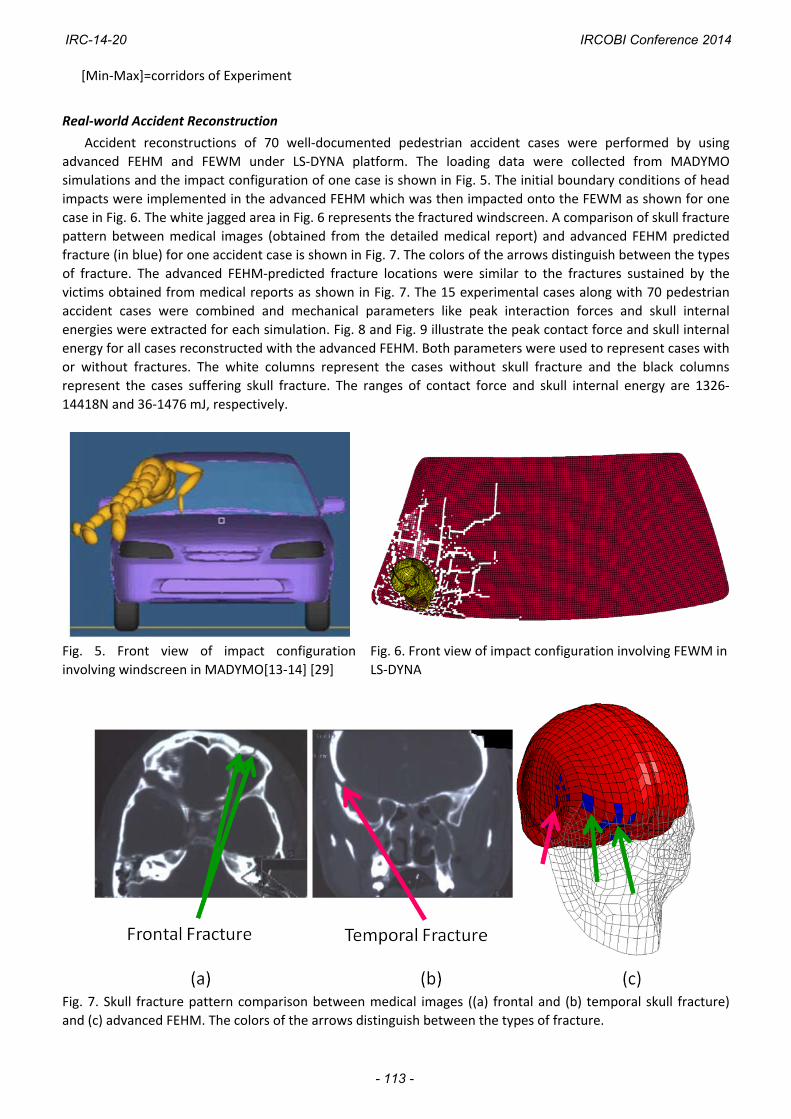
Accident reconstructions of 70 well‐documented pedestrian accident cases were performed by using
advanced FEHM and FEWM under LS‐DYNA platform. The loading data were collected from MADYMO
simulations and the impact configuration of one case is shown in Fig. 5. The initial boundary conditions of head
impacts were implemented in the advanced FEHM which was then impacted onto the FEWM as shown for one
case in Fig. 6. The white jagged area in Fig. 6 represents the fractured windscreen. A comparison of skull fracture
pattern between medical images (obtained from the detailed medical report) and advanced FEHM predicted
fracture (in blue) for one accident case is shown in Fig. 7. The colors of the arrows distinguish between the types
of fracture. The advanced FEHM‐predicted fracture locations were similar to the fractures sustained by the
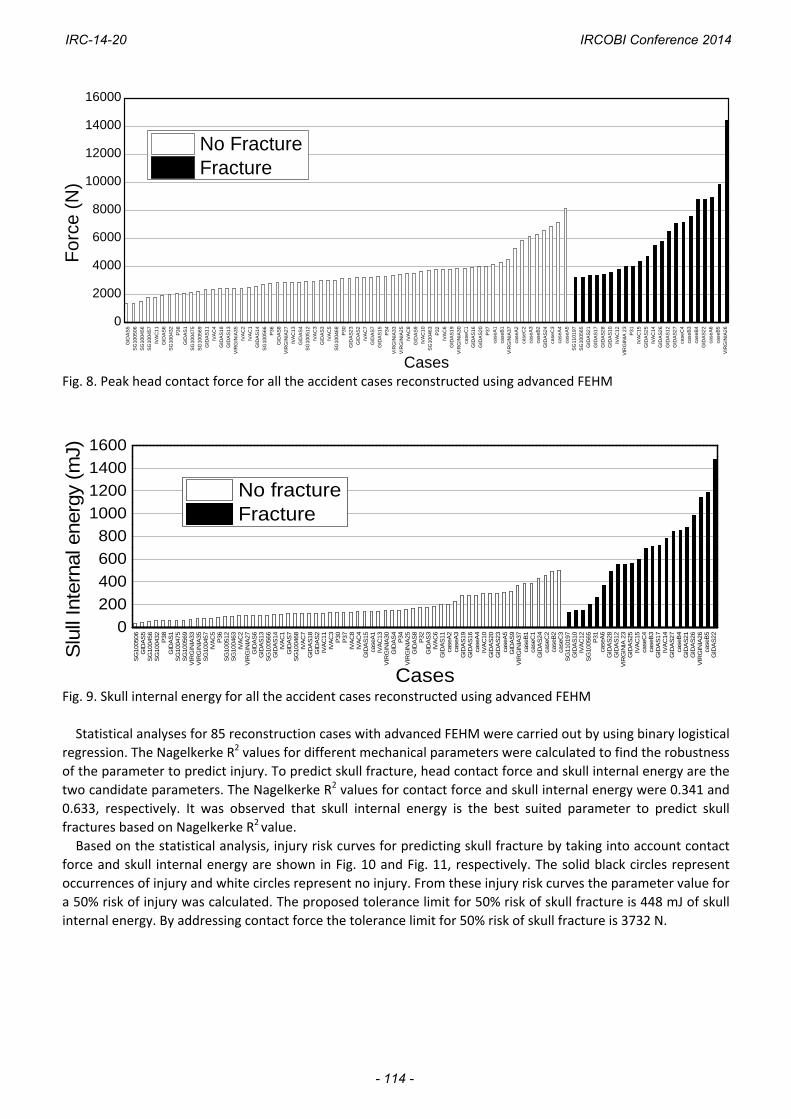
victims obtained from medical reports as shown in Fig. 7. The 15 experimental cases along with 70 pedestrian
accident cases were combined and mechanical parameters like peak interaction forces and skull internal
energies were extracted for each simulation. Fig. 8 and Fig. 9 illustrate the peak contact force and skull internal
energy for all cases reconstructed with the advanced FEHM. Both parameters were used to represent cases with
or without fractures. The white columns represent the cases without skull fracture and the black columns
represent the cases suffering skull fracture. The ranges of contact force and skull internal energy are 1326‐
14418N and 36‐1476 mJ, respectively.
Fig. 5. Front view of impact configuration
involving windscreen in MADYMO[13‐14] [29]
Fig. 6. Front view of impact configuration involving FEWM in
LS‐DYNA
Fig. 7. Skull fracture pattern comparison between medical images ((a) frontal and (b) temporal skull fracture)
and (c) advanced FEHM. The colors of the arrows distinguish between the types of fracture.
IRC-14-20 IRCOBI Conference 2014
- 113 -
GID
AS
5
SG
1005
06
SG
1004
56
SG
1004
57
IVA
C1
1
GID
AS
6
SG
1004
32
P3
8
GID
AS
1
SG
1004
75
SG
1005
69
GID
AS
11
IVA
C4
GID
AS
18
GID
AS
13
VIR
GIN
IA3
5
IVA
C2
IVA
C1
GID
AS
14
SG
1005
66
P3
6
GID
AS
8
VIR
GIN
IA2
7
IVA
C1
3
GID
AS
4
SG
1005
12
IVA
C3
GID
AS
3
IVA
C5
SG
1004
68
P3
0
GID
AS
23
GID
AS
2
IVA
C7
GID
AS
7
GID
AS
15
P3
4
VIR
GIN
IA3
3
VIR
GIN
IA2
5
IVA
C8
GID
AS
9
IVA
C1
0
SG
1004
63
P3
2
IVA
C6
GID
AS
19
VIR
GIN
IA3
0
case
C1
GID
AS
16
GID
AS
20
P3
7
case
A1
case
B1
VIR
GIN
IA3
7
case
A2
case
C2
case
A3
case
B2
GID
AS
24
case
C3
case
A4
case
A5
SG
1101
97
SG
1005
65
GID
AS
21
GID
AS
17
GID
AS
28
GID
AS
10
IVA
C1
2
VIR
GIN
IA 2
3
P3
1
IVA
C1
5
GID
AS
25
IVA
C1
4
GID
AS
26
GID
AS
12
GID
AS
27
case
C4
case
B3
case
B4
GID
AS
22
case
A6
case
B5
VIR
GIN
IA2
6
0
2000
4000
6000
8000
10000
12000
14000
16000
Fo
rce
(N)
Cases
No Fracture Fracture
Fig. 8. Peak head contact force for all the accident cases reconstructed using advanced FEHM
SG
1005
06G
IDA
S5
SG
1004
56S
G10
0432
P38
GID
AS
1S
G10
0475
SG
1005
69V
IRG
INIA
33V
IRG
INIA
35S
G10
0457
IVA
C5
P36
SG
1005
12S
G10
0463
IVA
C2
VIR
GIN
IA27
GID
AS
6G
IDA
S13
SG
1005
66G
IDA
S14
IVA
C1
GID
AS
7S
G10
0468
IVA
C7
GID
AS
18G
IDA
S2
IVA
C11
IVA
C3
P30
P37
IVA
C8
IVA
C4
GID
AS
15ca
seA
1IV
AC
13V
IRG
INIA
30G
IDA
S4
P34
VIR
GIN
IA25
GID
AS
8P
32G
IDA
S3
IVA
C6
GID
AS
11ca
seA
2ca
seA
3G
IDA
S19
GID
AS
16ca
seA
4IV
AC
10G
IDA
S20
GID
AS
23ca
seA
5G
IDA
S9
VIR
GIN
IA37
case
B1
case
C1
GID
AS
24ca
seC
2ca
seB
2ca
seC
3S
G11
0197
GID
AS
10IV
AC
12S
G10
0565
P31
case
A6
GID
AS
28G
IDA
S12
VIR
GIN
IA 2
3G
IDA
S25
IVA
C15
case
C4
case
B3
GID
AS
17IV
AC
14G
IDA
S27
case
B4
GID
AS
21G
IDA
S26
VIR
GIN
IA26
case
B5
GID
AS
22
0
200
400
600
800
1000
1200
1400
1600
Slu
ll In
tern
al e
nerg
y (m
J)
Cases
No fracture Fracture
Fig. 9. Skull internal energy for all the accident cases reconstructed using advanced FEHM
Statistical analyses for 85 reconstruction cases with advanced FEHM were carried out by using binary logistical
regression. The Nagelkerke R2 values for different mechanical parameters were calculated to find the robustness
of the parameter to predict injury. To predict skull fracture, head contact force and skull internal energy are the
two candidate parameters. The Nagelkerke R2 values for contact force and skull internal energy were 0.341 and
0.633, respectively. It was observed that skull internal energy is the best suited parameter to predict skull
fractures based on Nagelkerke R2 value.
Based on the statistical analysis, injury risk curves for predicting skull fracture by taking into account contact
force and skull internal energy are shown in Fig. 10 and Fig. 11, respectively. The solid black circles represent
occurrences of injury and white circles represent no injury. From these injury risk curves the parameter value for
a 50% risk of injury was calculated. The proposed tolerance limit for 50% risk of skull fracture is 448 mJ of skull
internal energy. By addressing contact force the tolerance limit for 50% risk of skull fracture is 3732 N.
IRC-14-20 IRCOBI Conference 2014
- 114 -
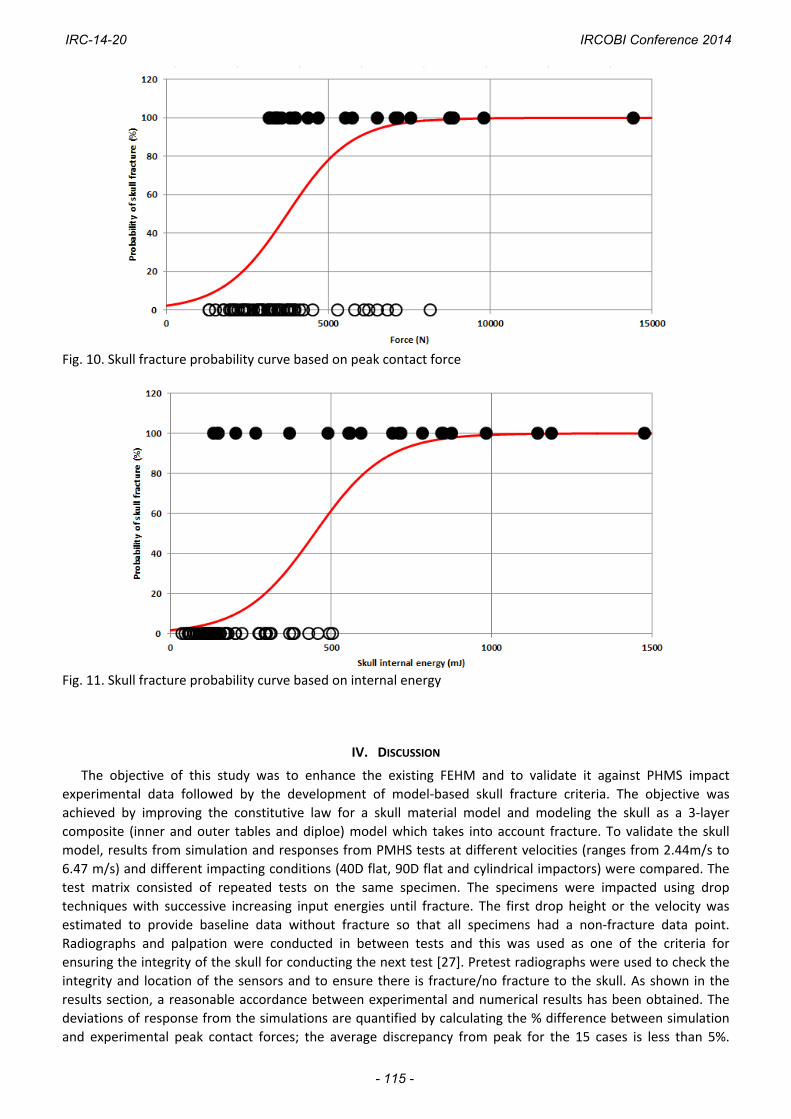
Fig. 10. Skull fracture probability curve based on peak contact force
Fig. 11. Skull fracture probability curve based on internal energy
IV. DISCUSSION
The objective of this study was to enhance the existing FEHM and to validate it against PHMS impact
experimental data followed by the development of model‐based skull fracture criteria. The objective was
achieved by improving the constitutive law for a skull material model and modeling the skull as a 3‐layer
composite (inner and outer tables and diploe) model which takes into account fracture. To validate the skull
model, results from simulation and responses from PMHS tests at different velocities (ranges from 2.44m/s to
6.47 m/s) and different impacting conditions (40D flat, 90D flat and cylindrical impactors) were compared. The
test matrix consisted of repeated tests on the same specimen. The specimens were impacted using drop
techniques with successive increasing input energies until fracture. The first drop height or the velocity was
estimated to provide baseline data without fracture so that all specimens had a non‐fracture data point.
Radiographs and palpation were conducted in between tests and this was used as one of the criteria for
ensuring the integrity of the skull for conducting the next test [27]. Pretest radiographs were used to check the
integrity and location of the sensors and to ensure there is fracture/no fracture to the skull. As shown in the
results section, a reasonable accordance between experimental and numerical results has been obtained. The
deviations of response from the simulations are quantified by calculating the % difference between simulation
and experimental peak contact forces; the average discrepancy from peak for the 15 cases is less than 5%.
IRC-14-20 IRCOBI Conference 2014
- 115 -
Further, results are correlated both in terms of time histories and very strong statistical measures (Pearson
correlation coefficients ranging from 0.987 to 0.993 for the 40D flat, 0.941 to 0.972 for the 90D flat, and 0.0.886
to 0.923 for the 90D cylindrical pads. While the use of the peak force is acceptable [13‐14], any model validation
that takes into account the entire force‐time history is superior as the progression in the development of the
peak force is considered.
A total of 85 well‐documented accident cases and experimental data were reconstructed using advanced
FEHM. For the 70 pedestrian accident cases, a validated FEWM was used to conduct the head impact simulation
in LS‐DYNA as in the real accident cases. The initial boundary condition data were obtained from previously
done MADYMO simulations by the biomechanics team of Strasbourg University [13‐14][31‐33]. The accuracy of
the whole reconstruction process was also greatly influenced by the robustness in MADYMO simulations.
Limitations to the study include the use of exact mass of the head in different accident scenarios. The effect of
size variation in the validated FEWM was assumed to be negligible.
Recent studies on accident reconstructions indicate that the ground impact energy is lower compared to
windscreen or hood impact. The velocity of impact during the ground contact is lower than the impact of the
head on the windscreen and mostly tangential during impact to the ground as reported in Luttenberger et al.
[36]. Moreover, for the second impact, the head is not systematically the first body segment which impacts the
road. Hence, it was assumed that the fracture occurring to the skull was due to the impact of the head with the
windscreen.
Different potential parameters to predict skull fracture were selected and their values were extracted from
the simulation. Binary logistic regression was used for statistical analysis. The Nagelkerke R2 values for both
contact force and skull internal energy were calculated. Based on the higher R2 value of 0.633 obtained for skull
internal energy than the R2 value of 0.341 for contact force, the skull internal energy was determined to be the
best parameter to predict skull failure. The skull internal energy metric to predict skull fracture was introduced
previously by Deck et al. [13‐14] and Sahoo et al. [16] in FE simulations. Delye et al. [37] also proposed to
quantify skull fracture by measuring the energy absorbed by the skull up to fracture. The skull internal energy
obtained under the LS‐DYNA platform is a global parameter for the whole part as mentioned in the previous
section. It is common in FEM to study effects such as sensitivity of the output to mesh size and refinement. This
effort was carried out during the initial stages of developing the FEM wherein failure criteria were not included
[8] [13‐14]. For the purpose of this study, the authors extended this model to include failure criteria without
redoing this type of analysis. From this viewpoint, this is a limitation of the present study. This can be easily
studied by refining the mesh and analyzing simulation outcomes such as force and skull internal energy.
However, given the good correlation between the fracture seen in the reconstruction from real‐world and FEM
output as shown in Fig. 7, the present FEM can be considered as a first step in the full analysis that includes
these current limitations. In future the effect of the energy metric to FE element size will be studied for better
understanding of the skull fracture mechanism.
V. CONCLUSIONS
The present study validated an enhanced FEHM in the entire time domain for temporo‐parietal impact experimental data from 15 PMHS experiments. The composite modeling of the skull along with improved constitutive law is capable of predicting fracture in the skull. Force‐time histories instead of peak forces were obtained from tests for each case and used for the validation process. A good agreement was found between experimental and simulation results. 70 well‐documented pedestrian accident cases were reconstructed by using the advanced FEHM. Statistical analysis (binary logistic regression) of the parameters to predict skull fracture was done for all 85 experimental and accident cases. Based on the higher Nagelkerke R2 value, the skull internal energy was the best candidate parameter to predict the skull failure. The proposed tolerance limit for a 50% risk of skull fracture is 448 mJ of skull internal energy. Skull fracture patterns extracted enhanced the understanding of skull injury. This study provides realistic methods and tools for advanced head injury assessment and mitigations.
VI. ACKNOWLEDGEMENT
The authors acknowledge the ANR‐12‐EMMA‐0026‐0 (SUFEHM‐13) and VA Medical Research for their
research support to this work.
IRC-14-20 IRCOBI Conference 2014
- 116 -
VII. REFERENCES
[1] WHO report, Fact sheet No. 358, Internet: [http://www.who.int/mediacentre/factsheets/fs358/en/], March 2013.
[2] Fredriksson R, Haland Y, Yang J. Evaluation of a new pedestrian head injury protection system with a sensor in the bumper and lifting of the bonnet’s rear part. Proceedings of 17th International Technical Conference on the Enhanced Safety of Vehicles, 2001, Amsterdam, Netherlands.
[3] Gennarelli T, Pintar F, Yoganandan N, Beuse N, Morgan R. Head injuries to nearside occupants in lateral impacts: epidemiological and full‐scale crash test analyses. Proceedings of the IRCOBI Conference, 2002, Munich, Germany.
[4] Allsop DL, Perl TR, Warner CY. Force/deflection and fracture characteristics of the temporoparietal region of the human head. Society of Automotive Engineering, SAE paper No. 912907.
[5] Yoganandan N, Pintar FA. Biomechanics of temporo‐parietal fracture. Clin. Biomech, 2004, 19:225–239.
[6] Yoganandan N, Gennarelli TA, Zhang J, Pintar FA, Takhounts E, Ridella SA. Association of contact loading in diffuse axonal injuries from motor vehicle crashes. The Journal of Trauma. 2009, 66:309‐315.
[7] NHTSA Code of Federal Regulations, Title 49, Part 571. National Highway Traffic Safety Administration, Federal Motor Vehicle Safety Standards, 2002, Washington, DC.
[8] Kang HS, Willinger R, Diaw BM, Chinn B. Validation of a 3D human head model and replication of head impact in motorcycle accident by finite element modeling. Proceedings of the 41th Stapp Car Crash Conference, Society of Automotive Engineers, 1997, Lake Buena Vista, USA.
[9] Zhang L, Yang K, et al. Recent advances in brain injury research: a new human head model development and validation. Stapp Car Crash Journal, 2001, 45: 369‐394.
[10] Kleiven, S. Predictors for traumatic brain injuries evaluated through accident reconstruction. Proceedings of the 51th Stapp Car Crash Conference, Society of Automotive Engineers, 2007, Paper 2007‐22‐0003, pp. 81–114.
[11] Iwamoto M, Nakahira Y, Tamura A, Kimpara H, Watanabe I, Miki K. Development of advanced human models in THUMS. Proceedings of the 6th European LS‐DYNA Users’ Conference, 2007, pp. 47–56.
[12] Takhounts EG, Hasija V, et al. Investigation of traumatic brain injuries using the next generation of simulated injury monitor (SIMon) finite element head model. Stapp Car Crash Journal, 2008, 52:1–32.
[13] Deck C, Willinger R. Improved head injury criteria based on head FE model. Int. J. Crashworthiness, 2008a, 13 (6):667–678.
[14] Deck C, Willinger R. Head injury prediction tool for predictive systems optimization. Proceedings of the 7th European LS‐DYNA Conference, 2008b.
[15] Sahoo D, Deck C, Willinger R. Development and validation of an advanced anisotropic visco‐hyperelastic human brain FE model. JMBBM. 2013a, 33:24‐42.
[16] Sahoo D, Deck C, Yoganandan N, Willinger R. Anisotropic composite human skull model and skull fracture validation against temporo‐parietal skull fracture. JMBBM. 2013b, 28:340‐353.
[17] Chatelin S, Deck C, Willinger R. An anisotropic viscous hyperelastic constitutive law for brain material finite element modeling. Journal of Biorheology.2013, 27(1‐2):26‐37.
[18] Hardy WN, Foster CD, Mason MJ, Yang KH, King AI, Tashman S. Investigation of head injury mechanisms using neutral density technology and high‐speed biplanar X‐ray. Stapp Car Crash Journal, 2001, 45: 337‐368.
[19] Hardy WN, Mason MJ, et al. A study of the response of the human cadaver head to impact. Stapp Car Crash Journal, 2007, 51:17‐80.
[20] Nahum A, Smith R, Ward C. Intracranial pressure dynamics during head impact. Proceedings of the 21st Stapp Car Crash Conference, 1977, SAE Paper No. 770922.
[21] Trosseille X, Tarriere C, Lavaste F, Guillon F, Domont A. Development of a F.E.M. of the human head according to a specific test protocol. Proceedings of the 36th Stapp Car Crash Conference, 1992, SAE Paper No. 922527.
IRC-14-20 IRCOBI Conference 2014
- 117 -
[22] Tsai SW, Wu EM. A general theory of strength for anisotropic materials. J. Composite Materials, 1971, 5: 58‐80.
[23] Melvin JW, Robbins DH, Roberts VL. The mechanical behavior of the diploë layer of the human skull in
compression. Dev. Mech., 1969, 5:811–818.
[24] Fry FJ, Barger JE. Acoustical properties of the human skull. Journal of Acoustical Society of America, 1978,
63(5):1576‐1590. [25] Wood JL. Dynamic response of human cranial bone. Journal of Biomechanics, 1971, 4:1–12. [26] McElhaney JH, Fogle JL, Melvin JW, Haynes RR, Roberts VL, Alem NM. Mechanical properties of cranial bone.
Journal of Biomechanics, 1970, 3:495‐511. [27] Yoganandan N, Zhang J, Pintar FA, King Liu Y. Lightweight low‐profile nine‐accelerometer package to obtain
head angular accelerations in short‐duration impacts. Journal of Biomechanics, 2006, 39:1347‐1354. [28] Slik G, Vogel G, Chawda V. Material model validation of a high efficient energy absorbing foam. Proceedings
of the 5th LS‐DYNA User Forum, 2006, Ulm, Germany. [29] Kleiven S. A parametric study of energy absorbing foams for head injury prevention. Proceedings of the 20th
International Technical Conference on the Enhanced Safety of Vehicles Conference (ESV), 2007, Lyon, France.
[30] Sahoo D. Brain injury criteria based on computation of axonal elongation. Doctoral thesis, Université de
Strasbourg. 19th December, 2013, Strasbourg, France. [31] Peng Y, Yang J, Deck C, Willinger R. Finite element modeling of crash test behavior for windshield laminated
glass. International Journal of Impact Engineering, 2013, 57:27‐35. [32] Willinger R, Munsch M, Anderson RWG, Deck C, Ludes B. Influence of head boundary conditions in
pedestrian real world head trauma simulations. Proceedings of the IRCOBI Conference, 2009, York, United Kingdom.
[33] Bourdet N, Deck C, Serre T, Perrin C, Llari M, Willinger R. In depth real world bicycle accident reconstructions, Int. J. Crashworthiness, 2013, DOI: 10.1080/13588265.2013.805293
[34] Livermore Software Technology corporation, LS‐Dyna keyword User’s Manual, Version 971 and LS‐Dyna theory manual, 2007, Livermore, CA, USA.
[35] Hynd D, Sexton B, Walter L. APROSYS‐ Review of injury risk calculation techniques. APROSYS deliverable
5.1.2B. AP‐SP51–0036, 2004.
[36] Luttenberger P, Tomasch E, Willinger R, Bourdet N, Mayer C, Ewald C. Deliverable D 1.1 Methodical analysis
on future accident scenarios involving SEV´s, SafeEV Proj. Safe Small Electr. Veh. Adv. Simul. Methodol.
Collab. Proj. Grant Agreem. Number 314265, Apr. 2013.
[37] Delye H, Verschueren P, Depreitere B, Verpoest I, Berckmans D, Sloten JS, Perre GV, Goffin J. Biomechanics
of frontal skull fracture. Journal of Neurotrauma, 2007, 24(10): 1576‐1586.
IRC-14-20 IRCOBI Conference 2014
- 118 -


![Transcranial Focused Ultrasound Generates Skull-Conducted … · skull and brain (Fig. 1). We employ a high-resolution solid model from the SCI Head Model project [ 45] constructed](https://img.pdfslide.net/doc/110x75/5f05410b7e708231d4120c5a/transcranial-focused-ultrasound-generates-skull-conducted-skull-and-brain-fig.jpg)