Embed Size (px)
Citation preview
Composites: Part A 84 (2016) 103–113
Contents lists available at ScienceDirect
Composites: Part A
journal homepage: www.elsevier .com/locate /composi tesa
Matrix failure in composite laminates under compressive loading
http://dx.doi.org/10.1016/j.compositesa.2016.01.0071359-835X/Crown Copyright � 2016 Published by Elsevier Ltd. All rights reserved.
⇑ Corresponding author.E-mail address: [email protected] (N.T. Chowdhury).
Nayeem Tawqir Chowdhury a,⇑, John Wang b, Wing Kong Chiu a, Wenyi Yan a
aDepartment of Mechanical and Aerospace Engineering, Monash University, Clayton, VIC 3800, AustraliabAerospace Division, Defence Science and Technology Group, 506 Lorimer St., Fishermans Bend, Vic. 3207, Australia
a r t i c l e i n f o a b s t r a c t
Article history:Received 11 July 2015Received in revised form 8 January 2016Accepted 11 January 2016Available online 18 January 2016
Keywords:A. Polymer-matrix composites (PMCs)A. ResinsD. Mechanical testingMicrostructural analysis
The failure envelope of the matrix in composite laminates under compressive loads has not receivedmuch attention in literature. There are very little to no experimental results to show a suitable failureenvelope for this constituent found in composites. With increasing popularity in the use of micromechan-ical analysis to predict progressive damage of composite structures which requires the use of individualfailure criteria for the fibre and matrix, it is important that matrix behaviour under compression ismodelled correctly.In this study, off-axis compression tests under uniaxial compression loading are used to promote
matrix failure. Through the use of micromechanical analysis involving Representative VolumeElements, the authors were able to extract the principal stresses on the matrix at failure. The results indi-cated that hydrostatic stresses play an important role in the failure of the matrix. Thus, Drucker–Pragerfailure criterion is recommended when modelling compressive matrix failure in composite structures.
Crown Copyright � 2016 Published by Elsevier Ltd. All rights reserved.
1. Introduction
Fibre reinforced polymer materials commonly known as com-posites are increasingly being used due to their high strength toweight ratio and high fatigue resistance. In order to ensure struc-tural integrity of the components which they form, it is importantto understand their behaviour at failure. However as failure incomposites are characterised by different modes, namely fibre,matrix and interfacial failure [1], this has complicated the under-standing of the failure behaviour. For this reason there are stillmany unanswered questions as to the materials’ failure character-istics, one of which includes matrix compression failure.
In an ideal situation, a composite would be modelled with eachstrand of fibre surrounded by a polymeric matrix. This would allowfor the stress and strain states of the fibre,matrix and interface to beextracted separately. However, this is obviously computationallyprohibitive. Onemethod that has greatly assisted in simplifying thisanalysis is Classical Laminate Theory (or CLT) [2]. This theory com-bines the properties of the fibre and the matrix through an averag-ing approach to form what is considered to be a new homogenousmaterial called a lamina. CLT is widely used by researchers in thefield and given its simplicity, it does a good job at modellingthe stiffness of a laminate including linear load behaviour up to thepoint of failure. One improvement that can be made to this theory
would be the ability to separately examine the fibre and the matrix.This can be done using micromechanical analysis.
For failure assessment, micromechanical analysis can be used toseparate the stress–strain states in the matrix and fibre compo-nents from a Representative Volume Element (or RVE). The rela-tionship can then be used in a structural analysis to predictmatrix or fibre failure. One popular analysis method that usesmicromechanical analysis is Multicontinuum Theory (or MCT)[3,4]. MCT predicts failure at the fibre andmatrix level by obtainingthe volume averaged stress states in the fibre and the matrix. Here,matrix failure is assumed to be influenced by all six of the matrixaverage stress components in a 3D analysis, whilst a quadraticfunction is used to find the average stress of the fibre [3]. This par-ticular theory greatly assists with understanding matrix failure andfibre failure in a composite, especially when it comes to progres-sive damage models [5–8]. However, the assumption of averagingthe overall stresses in the individual constituents can be improvedon. An analysis method that does this is the Amplification Tech-nique [9–11]. Unlike MCT, where the stresses in each constituentare averaged, the amplification technique calculates the principalstresses and strains at several locations to identify a critical loca-tion. Using this separation technique allows the fibre and matrixfailure to be examined in detail.
Fibre failure has been quite extensively researched in the fieldof composites, whilst at a micromechanical level, matrix failurehas not received the same amount of attention. Matrix failure istypically known to take place well before the fibre in matrix
104 N.T. Chowdhury et al. / Composites: Part A 84 (2016) 103–113
dominated load cases and can be characterised by three mainmodes; tension, compression and shear failure. Some authors haveproposed these modes of failure to be characterised by dilatationalfailure and distortional failure [10,12]. In this paper the authorsfocus on distortional matrix failure in composites.
Matrix failure under tension loading has received some atten-tion in literature. The most commonly known form of this test isthe 10� off-axis tension test on a uniaxial composite to find theshear modulus of the lamina [13,14,15]. Others have alsoperformed a range of off-axis tests on uniaxial composites wherethe fibre direction changes [14,15]. The authors have also exploredthis form of failure through several biaxial tension tests under dif-ferent loading ratios [16,17]. Through the use of micromechanicalanalysis, some have proposed the tension quadrant of a principalstress based failure envelope to be truncated [9,10,16,17]. This ideais not new in the field of isotropic materials, where existing failurecriteria have proposed this. The simplest example is maximumstress theory which predicts failure when the stress state in thematerial exceeds its tensile strength. Others include: Drucker–Prager, Mohr–Coulomb, and recently, SIFT (First Strain Invariant)or Onset Theory [18].
Unlike matrix tensile failure, there are few papers that exploreshear and compression failure of the matrix at a micromechanicslevel. One of the few failure criteria that utilises micromechanicalanalysis to predict matrix failure is that proposed by Gosse andChristensen called Onset Theory [9,10]. Their criterion uses vonMises failure criterion to predict what they term as distortionalfailure of the matrix [9]. This implies that they consider both shearand compressive failure in composites to be modelled by vonMises. With the assumption that a matrix can be treated as an iso-tropic material, literature has shown that in the shear quadrants ofa stress based material failure envelope, von Mises failure criteriondoes a good job in predicting failure [17]. However, it should benoted that von Mises theory does not consider hydrostatic stresses,which is known to play an important role in the failure of isotropicmaterials under compression. To account for this phenomenon,von Mises failure criterion was modified to account for hydrostaticstresses. One of these theories is Drucker–Prager failure criterionwhich has been quite successful in modelling shear and compres-sion failure in monolithic isotropic materials [19]. Thus, theauthors aim to perform a set of experiments using ClassicalLaminate Theory and micromechanical analysis to examine theimportance of considering hydrostatic stresses when a matrix failsdue to compression.
2. Uniaxial compression
2.1. Experiment methodology
There are three main types of antibuckling rigs used forcompression tests: (1) the modified ASTM D 695 standard; (2)the IITRI compression test method; and (3) the combined loadingtest methods [20]. Out of the three test methods, the latter twohave been shown to considerably reduce end crushing when com-pared to the modified ASTM D695 test method. This is due to thefixture’s ability to transfer the loads through shear. In the case ofthe experiments considered in this study, the authors are inter-ested in matrix failure, which occurs at much lower loads com-pared to layups examining fibre failure. Thus, end crushing is notas prominent in these set of experiments which enabled theauthors to use the modified ASTM D695 test fixture. The procedureoutlined in the modified ASTM D695 standard was followed forthese experiments [21]. Failure was confined to the gauge regionfor all the specimens (shown in Fig. 2), which demonstrated thatthe tests were successful.
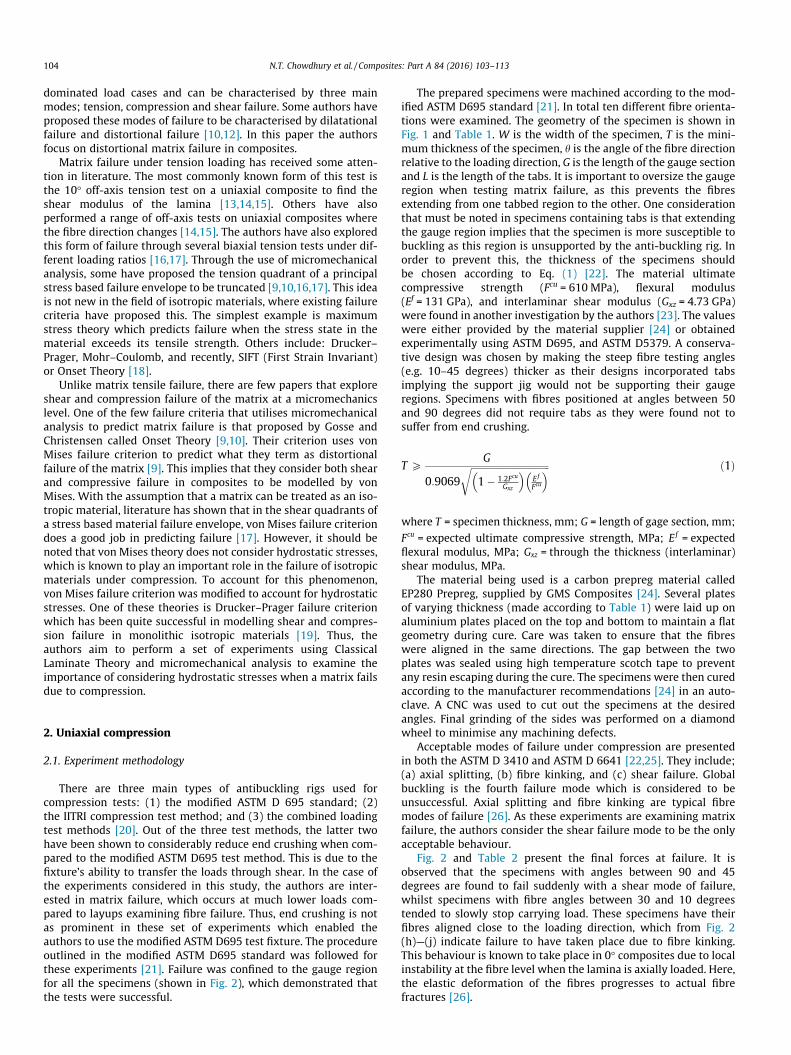
The prepared specimens were machined according to the mod-ified ASTM D695 standard [21]. In total ten different fibre orienta-tions were examined. The geometry of the specimen is shown inFig. 1 and Table 1. W is the width of the specimen, T is the mini-mum thickness of the specimen, h is the angle of the fibre directionrelative to the loading direction, G is the length of the gauge sectionand L is the length of the tabs. It is important to oversize the gaugeregion when testing matrix failure, as this prevents the fibresextending from one tabbed region to the other. One considerationthat must be noted in specimens containing tabs is that extendingthe gauge region implies that the specimen is more susceptible tobuckling as this region is unsupported by the anti-buckling rig. Inorder to prevent this, the thickness of the specimens shouldbe chosen according to Eq. (1) [22]. The material ultimatecompressive strength (Fcu = 610 MPa), flexural modulus(Ef = 131 GPa), and interlaminar shear modulus (Gxz = 4.73 GPa)were found in another investigation by the authors [23]. The valueswere either provided by the material supplier [24] or obtainedexperimentally using ASTM D695, and ASTM D5379. A conserva-tive design was chosen by making the steep fibre testing angles(e.g. 10–45 degrees) thicker as their designs incorporated tabsimplying the support jig would not be supporting their gaugeregions. Specimens with fibres positioned at angles between 50and 90 degrees did not require tabs as they were found not tosuffer from end crushing.
T PG
0:9069ffiffiffiffiffiffiffiffiffiffiffiffiffiffiffiffiffiffiffiffiffiffiffiffiffiffiffiffiffiffiffiffiffiffi1� 1:2Fcu
Gxz
� �E f
Fcu
� �r ð1Þ
where T = specimen thickness, mm; G = length of gage section, mm;
Fcu = expected ultimate compressive strength, MPa; Ef = expectedflexural modulus, MPa; Gxz = through the thickness (interlaminar)shear modulus, MPa.
The material being used is a carbon prepreg material calledEP280 Prepreg, supplied by GMS Composites [24]. Several platesof varying thickness (made according to Table 1) were laid up onaluminium plates placed on the top and bottom to maintain a flatgeometry during cure. Care was taken to ensure that the fibreswere aligned in the same directions. The gap between the twoplates was sealed using high temperature scotch tape to preventany resin escaping during the cure. The specimens were then curedaccording to the manufacturer recommendations [24] in an auto-clave. A CNC was used to cut out the specimens at the desiredangles. Final grinding of the sides was performed on a diamondwheel to minimise any machining defects.
Acceptable modes of failure under compression are presentedin both the ASTM D 3410 and ASTM D 6641 [22,25]. They include;(a) axial splitting, (b) fibre kinking, and (c) shear failure. Globalbuckling is the fourth failure mode which is considered to beunsuccessful. Axial splitting and fibre kinking are typical fibremodes of failure [26]. As these experiments are examining matrixfailure, the authors consider the shear failure mode to be the onlyacceptable behaviour.
Fig. 2 and Table 2 present the final forces at failure. It isobserved that the specimens with angles between 90 and 45degrees are found to fail suddenly with a shear mode of failure,whilst specimens with fibre angles between 30 and 10 degreestended to slowly stop carrying load. These specimens have theirfibres aligned close to the loading direction, which from Fig. 2(h)—(j) indicate failure to have taken place due to fibre kinking.This behaviour is known to take place in 0� composites due to localinstability at the fibre level when the lamina is axially loaded. Here,the elastic deformation of the fibres progresses to actual fibrefractures [26].
Fig. 1. Dimensions of the off-axis compression specimen.
Table 1Dimensions of off-axis compression specimens.
Fibre angle (�) W (mm) G (mm) T (mm) L (mm)
10 6.0 41 4.75 2020 12.7 37 4.75 2230 12.7 23 3 2940 12.7 17 3 3245 12.7 17 2 3250 12.7 81 (no tabs) 2 0 (no tabs)60 12.7 81 (no tabs) 2 0 (no tabs)70 12.7 81 (no tabs) 1.5 0 (no tabs)80 12.7 81 (no tabs) 1.5 0 (no tabs)90 12.7 81 (no tabs) 1.5 0 (no tabs)
N.T. Chowdhury et al. / Composites: Part A 84 (2016) 103–113 105
In this study, the authors are interested in understanding thefailure behaviour of matrix, which has had little attention in thepast. The experiment results highlight one of the first full set ofexperiments performed on composites under compression for alarge range of fibre orientation. Given the two distinct observationsshown in Fig. 2, the specimens with fibres arranged between 90and 45 degrees are considered successful, whilst the others areignored for the remainder of the analysis.
2.2. Finite element analysis
Current experimental techniques are not able to distinguishstress or strain states on the matrix and fibre independently andusually stop at the lamina (global) level. Obtaining stress and straindata for the matrix requires post processing of the experimentalresults. This is done in a finite element analysis study. The tech-nique separates the global stresses in the laminate to find individ-ual stresses on the fibre and the matrix. Once the matrix stressesare obtained, they are compared against the von Mises andDrucker–Prager failure criteria [18].
One ideal method in which the failure stresses on the matrixcan be obtained is to create a large analysis with each individualstrand of fibre modelled, surrounded by the matrix for the entiretest specimen. However using todays computing power; this isalmost impossible to perform in a reasonable amount of time.The next best alternative is to extract the stress and strain stateat a critical location in the global (macro) model, then impose theseas boundary conditions to a unit cell. The unit cell is a Representa-tive Volume Element (RVE) of the fibre and the matrix that can befound at the micro scale [9–11,27]. This method has started to gainpopularity and is considered to be an acceptable means of estab-lishing the micromechanical stress state in the fibre and thematrix. In order to account for the random arrangement of fibreswithin a lamina; the process performed on a square unit cell isrepeated for a diamond and hexagonal fibre configuration. Theprocedure is summarised in Fig. 3.
The first stage in this approach is to obtain the stress and strainstate in a global macromechanical model. Strain gauges in severalexperiments were used to check that the FE model gave a good pre-diction of this. However, a strain gauge cannot solely be used forthis stage as both in-plane and out of plane stress states arerequired. Thus FEA aids in this process.
The stress and strain state in the centre of the specimen is foundusing the finite element analysis package: ABAQUS v6.13. Straingauges were bonded onto the centre gauge region of several spec-imens. Classical Laminate Theory was used to model the specimenfor the global macromechanical analysis. As the fibres are allarranged in the same direction, each specimen was modelled as asingle lamina with material properties listed in Table 3. The FEAmodel was found to match the strain gauge results with a differ-ence of less than 10%. Thus the material properties in the FE modelwere kept the same as those presented in Table 3. The fibre and thematrix are assumed to have isotropic properties given in Table 4[23] which have been obtained using an inverse method of the ruleof mixtures [18]. Where the lamina and matrix properties are usedto obtain the fibre properties.
8-noded linear brick elements with reduced integration andhourglass control (C3D8R) were used for the micromechanicalRVE models. One of the underlying conditions to enforce when per-forming RVE analysis is ensuring that periodic boundary conditionsare maintained. This means that as the unit cell deforms, theopposing faces of the RVE must remain parallel to each other. Thiscan be quite difficult to maintain depending on the loading condi-tions. For example when normal strains are applied to a unit cellshown in Fig. 3, the boundary conditions are straight forward toimplement. The same case is applicable for a unit cell experiencinga pure shear load in any one of its planes. However it is difficult tocombine both normal and shear loads into the same RVE analysis.This difficulty is experienced in this study, where although themain purpose of using off-axis compression specimens was toobtain a biaxial compressive stress state, significant in-plane shearstresses are also experienced due to the unbalanced specimenlayup. These in-plane shear stresses need to be incorporated intothe RVE analysis along with the normal strains. An approach todo this is to superimpose the results of individual RVE models[9,11,23]. This requires performing several RVE analyses (one foreach load case) which can be time consuming to setup. Alterna-tively the authors performed a sub-modelling approach using abuilt in module in ABAQUS v6.13. This method passes on the strainstates from the global model as displacement boundary conditionswhich are applied on each node of the corresponding sides of theRVE placed in the centre of the specimen. This procedure greatlyshortens the time required to setup a model to perform the analy-sis. Fig. 4 shows the unit cell model for a square RVE before andafter deformation. The unit cells were positioned in the centre ofthe gauge region for all the specimens as failure from the
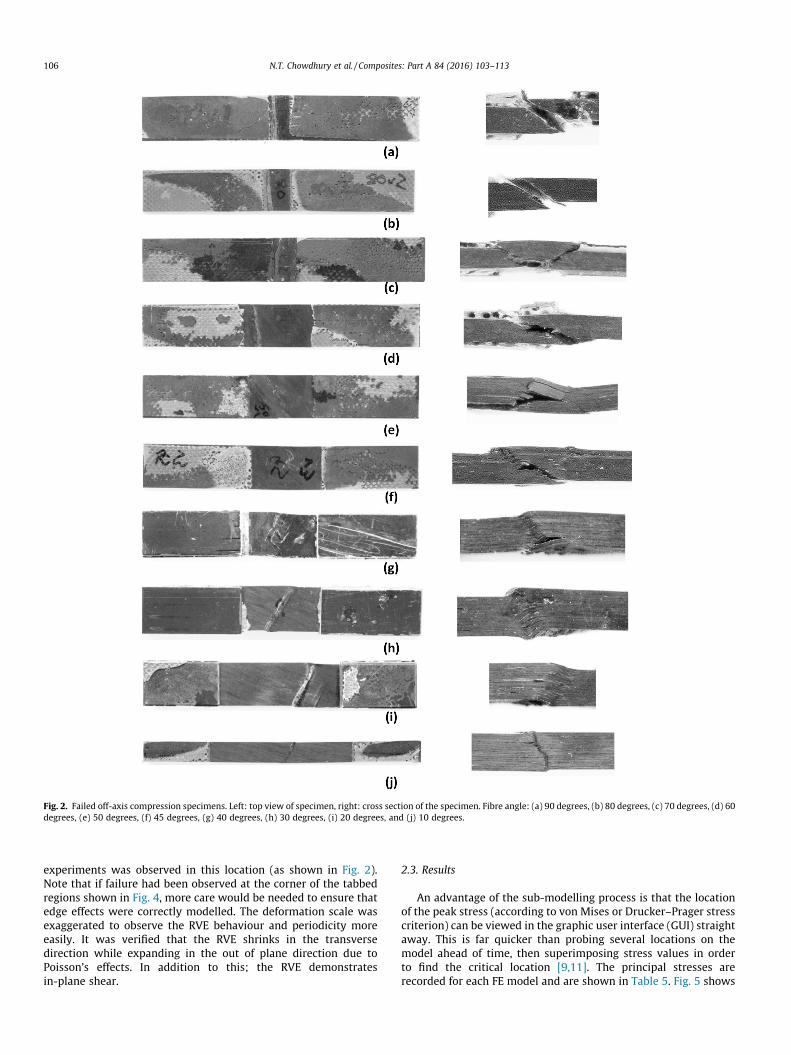
Fig. 2. Failed off-axis compression specimens. Left: top view of specimen, right: cross section of the specimen. Fibre angle: (a) 90 degrees, (b) 80 degrees, (c) 70 degrees, (d) 60degrees, (e) 50 degrees, (f) 45 degrees, (g) 40 degrees, (h) 30 degrees, (i) 20 degrees, and (j) 10 degrees.
106 N.T. Chowdhury et al. / Composites: Part A 84 (2016) 103–113
experiments was observed in this location (as shown in Fig. 2).Note that if failure had been observed at the corner of the tabbedregions shown in Fig. 4, more care would be needed to ensure thatedge effects were correctly modelled. The deformation scale wasexaggerated to observe the RVE behaviour and periodicity moreeasily. It was verified that the RVE shrinks in the transversedirection while expanding in the out of plane direction due toPoisson’s effects. In addition to this; the RVE demonstratesin-plane shear.
2.3. Results
An advantage of the sub-modelling process is that the locationof the peak stress (according to von Mises or Drucker–Prager stresscriterion) can be viewed in the graphic user interface (GUI) straightaway. This is far quicker than probing several locations on themodel ahead of time, then superimposing stress values in orderto find the critical location [9,11]. The principal stresses arerecorded for each FE model and are shown in Table 5. Fig. 5 shows
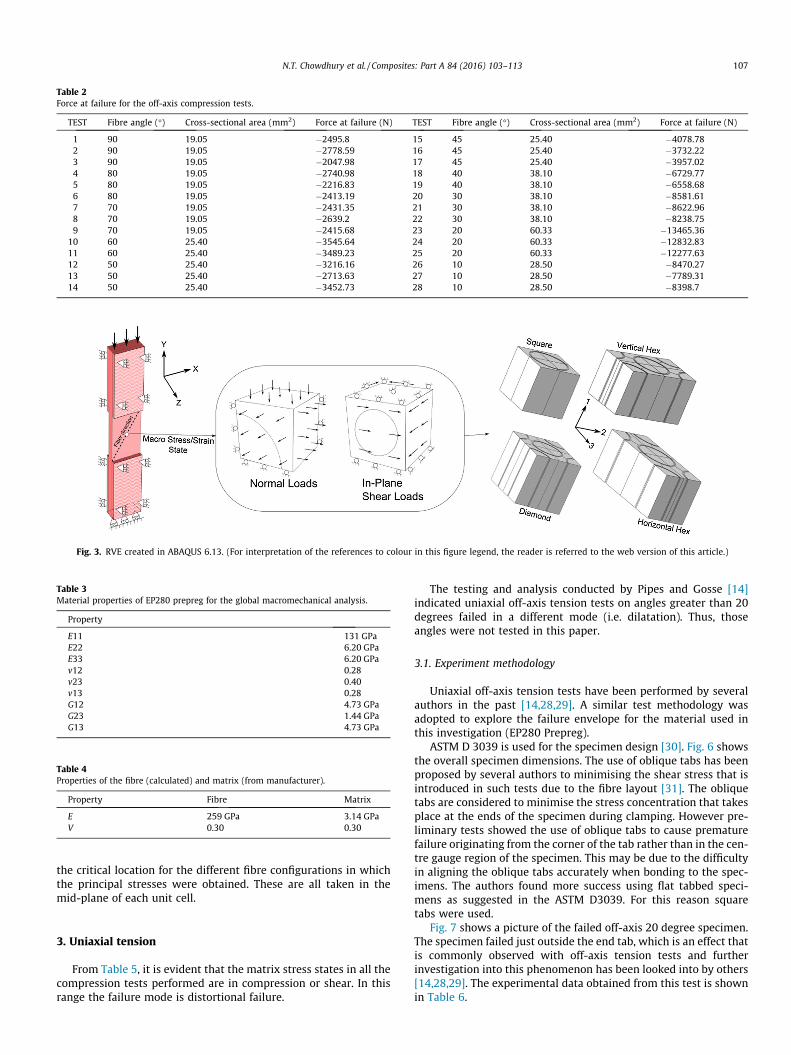
Table 2Force at failure for the off-axis compression tests.
TEST Fibre angle (�) Cross-sectional area (mm2) Force at failure (N) TEST Fibre angle (�) Cross-sectional area (mm2) Force at failure (N)
1 90 19.05 �2495.8 15 45 25.40 �4078.782 90 19.05 �2778.59 16 45 25.40 �3732.223 90 19.05 �2047.98 17 45 25.40 �3957.024 80 19.05 �2740.98 18 40 38.10 �6729.775 80 19.05 �2216.83 19 40 38.10 �6558.686 80 19.05 �2413.19 20 30 38.10 �8581.617 70 19.05 �2431.35 21 30 38.10 �8622.968 70 19.05 �2639.2 22 30 38.10 �8238.759 70 19.05 �2415.68 23 20 60.33 �13465.36
10 60 25.40 �3545.64 24 20 60.33 �12832.8311 60 25.40 �3489.23 25 20 60.33 �12277.6312 50 25.40 �3216.16 26 10 28.50 �8470.2713 50 25.40 �2713.63 27 10 28.50 �7789.3114 50 25.40 �3452.73 28 10 28.50 �8398.7
Fig. 3. RVE created in ABAQUS 6.13. (For interpretation of the references to colour in this figure legend, the reader is referred to the web version of this article.)
Table 3Material properties of EP280 prepreg for the global macromechanical analysis.
Property
E11 131 GPaE22 6.20 GPaE33 6.20 GPav12 0.28v23 0.40v13 0.28G12 4.73 GPaG23 1.44 GPaG13 4.73 GPa
Table 4Properties of the fibre (calculated) and matrix (from manufacturer).
Property Fibre Matrix
E 259 GPa 3.14 GPaV 0.30 0.30
N.T. Chowdhury et al. / Composites: Part A 84 (2016) 103–113 107
the critical location for the different fibre configurations in whichthe principal stresses were obtained. These are all taken in themid-plane of each unit cell.
3. Uniaxial tension
From Table 5, it is evident that the matrix stress states in all thecompression tests performed are in compression or shear. In thisrange the failure mode is distortional failure.
The testing and analysis conducted by Pipes and Gosse [14]indicated uniaxial off-axis tension tests on angles greater than 20degrees failed in a different mode (i.e. dilatation). Thus, thoseangles were not tested in this paper.
3.1. Experiment methodology
Uniaxial off-axis tension tests have been performed by severalauthors in the past [14,28,29]. A similar test methodology wasadopted to explore the failure envelope for the material used inthis investigation (EP280 Prepreg).
ASTM D 3039 is used for the specimen design [30]. Fig. 6 showsthe overall specimen dimensions. The use of oblique tabs has beenproposed by several authors to minimising the shear stress that isintroduced in such tests due to the fibre layout [31]. The obliquetabs are considered to minimise the stress concentration that takesplace at the ends of the specimen during clamping. However pre-liminary tests showed the use of oblique tabs to cause prematurefailure originating from the corner of the tab rather than in the cen-tre gauge region of the specimen. This may be due to the difficultyin aligning the oblique tabs accurately when bonding to the spec-imens. The authors found more success using flat tabbed speci-mens as suggested in the ASTM D3039. For this reason squaretabs were used.
Fig. 7 shows a picture of the failed off-axis 20 degree specimen.The specimen failed just outside the end tab, which is an effect thatis commonly observed with off-axis tension tests and furtherinvestigation into this phenomenon has been looked into by others[14,28,29]. The experimental data obtained from this test is shownin Table 6.
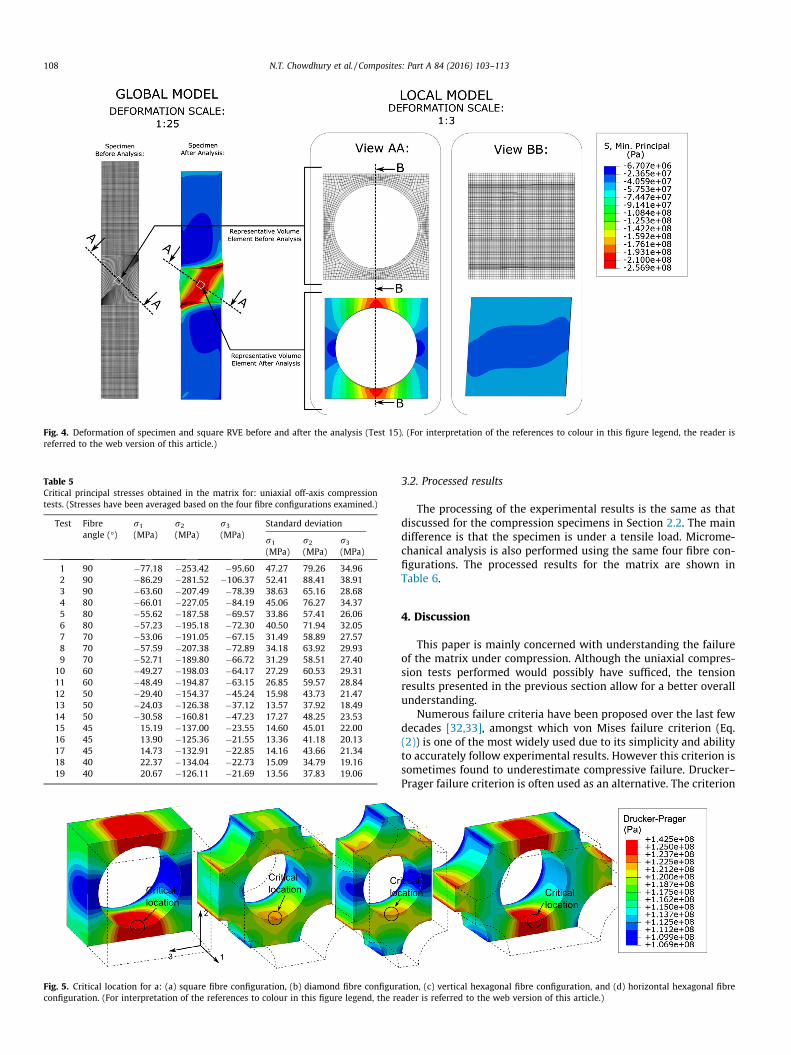
Fig. 4. Deformation of specimen and square RVE before and after the analysis (Test 15). (For interpretation of the references to colour in this figure legend, the reader isreferred to the web version of this article.)
Table 5Critical principal stresses obtained in the matrix for: uniaxial off-axis compressiontests. (Stresses have been averaged based on the four fibre configurations examined.)
Test Fibreangle (�)
r1
(MPa)r2
(MPa)r3
(MPa)Standard deviation
r1
(MPa)r2
(MPa)r3
(MPa)
1 90 �77.18 �253.42 �95.60 47.27 79.26 34.962 90 �86.29 �281.52 �106.37 52.41 88.41 38.913 90 �63.60 �207.49 �78.39 38.63 65.16 28.684 80 �66.01 �227.05 �84.19 45.06 76.27 34.375 80 �55.62 �187.58 �69.57 33.86 57.41 26.066 80 �57.23 �195.18 �72.30 40.50 71.94 32.057 70 �53.06 �191.05 �67.15 31.49 58.89 27.578 70 �57.59 �207.38 �72.89 34.18 63.92 29.939 70 �52.71 �189.80 �66.72 31.29 58.51 27.40
10 60 �49.27 �198.03 �64.17 27.29 60.53 29.3111 60 �48.49 �194.87 �63.15 26.85 59.57 28.8412 50 �29.40 �154.37 �45.24 15.98 43.73 21.4713 50 �24.03 �126.38 �37.12 13.57 37.92 18.4914 50 �30.58 �160.81 �47.23 17.27 48.25 23.5315 45 15.19 �137.00 �23.55 14.60 45.01 22.0016 45 13.90 �125.36 �21.55 13.36 41.18 20.1317 45 14.73 �132.91 �22.85 14.16 43.66 21.3418 40 22.37 �134.04 �22.73 15.09 34.79 19.1619 40 20.67 �126.11 �21.69 13.56 37.83 19.06
Fig. 5. Critical location for a: (a) square fibre configuration, (b) diamond fibre configurconfiguration. (For interpretation of the references to colour in this figure legend, the re
108 N.T. Chowdhury et al. / Composites: Part A 84 (2016) 103–113
3.2. Processed results
The processing of the experimental results is the same as thatdiscussed for the compression specimens in Section 2.2. The maindifference is that the specimen is under a tensile load. Microme-chanical analysis is also performed using the same four fibre con-figurations. The processed results for the matrix are shown inTable 6.
4. Discussion
This paper is mainly concerned with understanding the failureof the matrix under compression. Although the uniaxial compres-sion tests performed would possibly have sufficed, the tensionresults presented in the previous section allow for a better overallunderstanding.
Numerous failure criteria have been proposed over the last fewdecades [32,33], amongst which von Mises failure criterion (Eq.(2)) is one of the most widely used due to its simplicity and abilityto accurately follow experimental results. However this criterion issometimes found to underestimate compressive failure. Drucker–Prager failure criterion is often used as an alternative. The criterion
ation, (c) vertical hexagonal fibre configuration, and (d) horizontal hexagonal fibreader is referred to the web version of this article.)
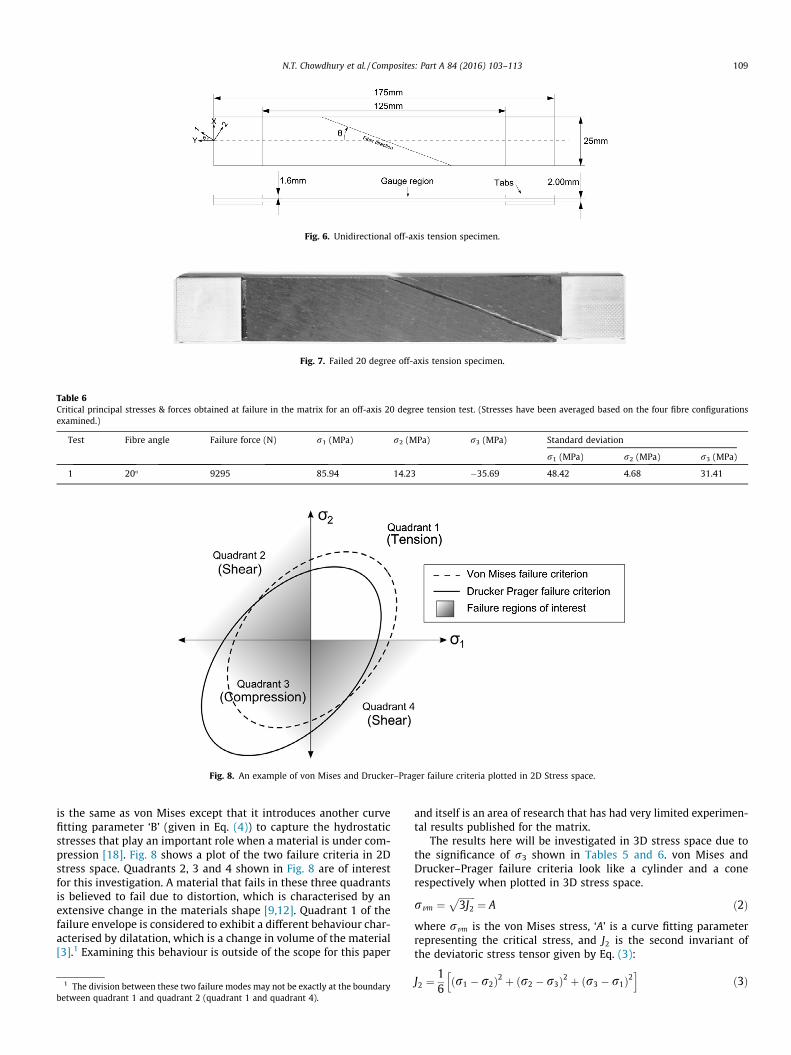
Fig. 6. Unidirectional off-axis tension specimen.
Fig. 7. Failed 20 degree off-axis tension specimen.
Table 6Critical principal stresses & forces obtained at failure in the matrix for an off-axis 20 degree tension test. (Stresses have been averaged based on the four fibre configurationsexamined.)
Test Fibre angle Failure force (N) r1 (MPa) r2 (MPa) r3 (MPa) Standard deviation
r1 (MPa) r2 (MPa) r3 (MPa)
1 20� 9295 85.94 14.23 �35.69 48.42 4.68 31.41
Fig. 8. An example of von Mises and Drucker–Prager failure criteria plotted in 2D Stress space.
N.T. Chowdhury et al. / Composites: Part A 84 (2016) 103–113 109
is the same as von Mises except that it introduces another curvefitting parameter ‘B’ (given in Eq. (4)) to capture the hydrostaticstresses that play an important role when a material is under com-pression [18]. Fig. 8 shows a plot of the two failure criteria in 2Dstress space. Quadrants 2, 3 and 4 shown in Fig. 8 are of interestfor this investigation. A material that fails in these three quadrantsis believed to fail due to distortion, which is characterised by anextensive change in the materials shape [9,12]. Quadrant 1 of thefailure envelope is considered to exhibit a different behaviour char-acterised by dilatation, which is a change in volume of the material[3].1 Examining this behaviour is outside of the scope for this paper
1 The division between these two failure modes may not be exactly at the boundarybetween quadrant 1 and quadrant 2 (quadrant 1 and quadrant 4).
and itself is an area of research that has had very limited experimen-tal results published for the matrix.
The results here will be investigated in 3D stress space due tothe significance of r3 shown in Tables 5 and 6. von Mises andDrucker–Prager failure criteria look like a cylinder and a conerespectively when plotted in 3D stress space.
rvm ¼ffiffiffiffiffiffiffi3J2
p¼ A ð2Þ
where rvm is the von Mises stress, ‘A’ is a curve fitting parameterrepresenting the critical stress, and J2 is the second invariant ofthe deviatoric stress tensor given by Eq. (3):
J2 ¼ 16
r1 � r2ð Þ2 þ r2 � r3ð Þ2 þ r3 � r1ð Þ2h i
ð3Þ
110 N.T. Chowdhury et al. / Composites: Part A 84 (2016) 103–113
ffiffiffiffiJ2
p¼ Aþ BJ1 ð4Þ
where J2 is the second invariant of the deviatoric stress tensor givenby Eq. (3). ‘A’ and ‘B’ are curve fitting parameters, and J1 is the firstinvariant of the deviatoric stress tensor given by Eq. (5):
J1 ¼ r1 þ r2 þ r3 ð5ÞIn order to assist in the selection of a suitable failure criterion to
accurately model the compressive and shear quadrants of thematrix failure envelope; six comparisons are made:
(1) Compare compression test results against the von Mises fail-ure criterion fitted using compression test results.
(2) Compare compression results against the Drucker–Pragerfailure criterion fitted using compression test results.
(3) Compare compression and tension results against the vonMises failure criterion fitted using compression and tensiontest results.
(4) Compare compression and tension results against theDrucker–Prager failure criterion fitted using compressionand tension test results.
(5) Compare compression and tension results against the vonMises criterion fitted using only compress test results
(6) Compare compression and tension results against theDrucker–Prager criterion fitted using only compress testresults.
Table 7 summarises the differences in prediction given from thevarious regression models using the six comparisons. Eq. (6) showsthe formula used for the sum of least squares analysis.
RSS ¼Xn
i¼1
yi � f ðxiÞð Þ2 ð6Þ
4.1. Comparison 1
von Mises failure criterion is given by Eq. (2). It is the same asthat given by Eq. (4), except that the term ‘B’ is equal to zero. Eq.(6) is used to calculate the residual sum of squares which is min-imised by solving for values of ‘A’. Eq. (7) shows the final criterionwhen examining only the off-axis compression results. A plot ofthe points on the failure criterion given by von Mises is shown inFig. 9.ffiffiffiffiJ2
p¼ 78:7 ð7Þ
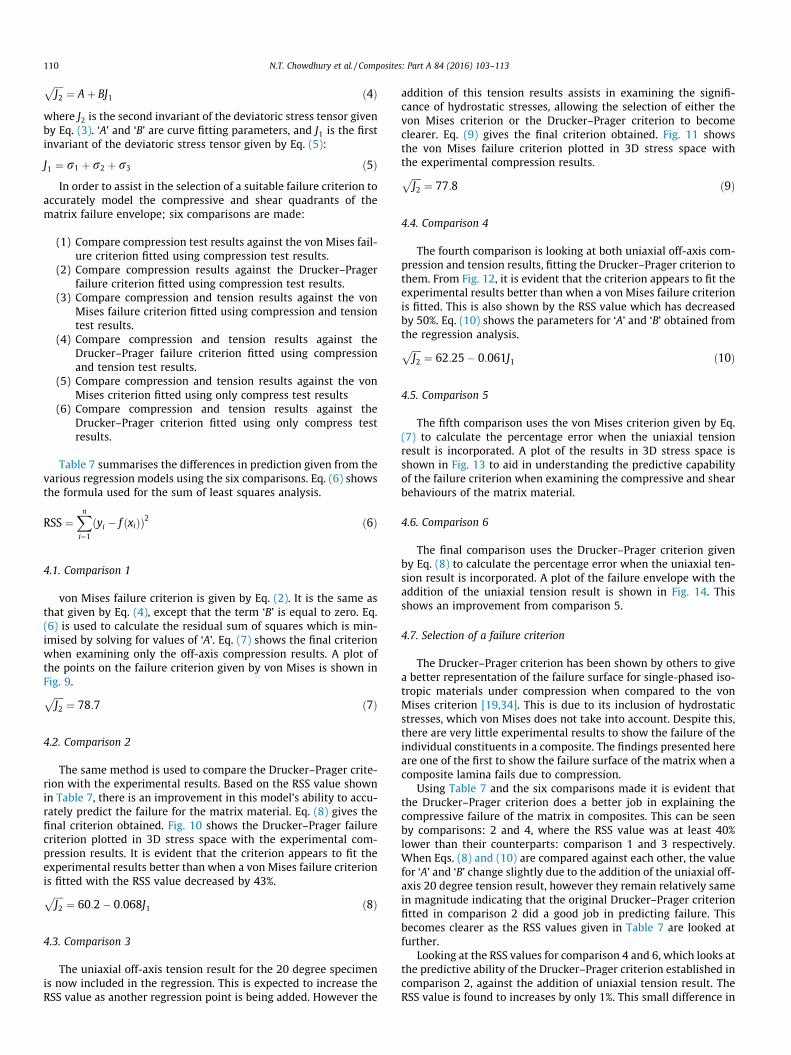
4.2. Comparison 2
The same method is used to compare the Drucker–Prager crite-rion with the experimental results. Based on the RSS value shownin Table 7, there is an improvement in this model’s ability to accu-rately predict the failure for the matrix material. Eq. (8) gives thefinal criterion obtained. Fig. 10 shows the Drucker–Prager failurecriterion plotted in 3D stress space with the experimental com-pression results. It is evident that the criterion appears to fit theexperimental results better than when a von Mises failure criterionis fitted with the RSS value decreased by 43%.ffiffiffiffiJ2
p¼ 60:2� 0:068J1 ð8Þ
4.3. Comparison 3
The uniaxial off-axis tension result for the 20 degree specimenis now included in the regression. This is expected to increase theRSS value as another regression point is being added. However the
addition of this tension results assists in examining the signifi-cance of hydrostatic stresses, allowing the selection of either thevon Mises criterion or the Drucker–Prager criterion to becomeclearer. Eq. (9) gives the final criterion obtained. Fig. 11 showsthe von Mises failure criterion plotted in 3D stress space withthe experimental compression results.ffiffiffiffiJ2
p¼ 77:8 ð9Þ
4.4. Comparison 4
The fourth comparison is looking at both uniaxial off-axis com-pression and tension results, fitting the Drucker–Prager criterion tothem. From Fig. 12, it is evident that the criterion appears to fit theexperimental results better than when a von Mises failure criterionis fitted. This is also shown by the RSS value which has decreasedby 50%. Eq. (10) shows the parameters for ‘A’ and ‘B’ obtained fromthe regression analysis.ffiffiffiffiJ2
p¼ 62:25� 0:061J1 ð10Þ
4.5. Comparison 5
The fifth comparison uses the von Mises criterion given by Eq.(7) to calculate the percentage error when the uniaxial tensionresult is incorporated. A plot of the results in 3D stress space isshown in Fig. 13 to aid in understanding the predictive capabilityof the failure criterion when examining the compressive and shearbehaviours of the matrix material.
4.6. Comparison 6
The final comparison uses the Drucker–Prager criterion givenby Eq. (8) to calculate the percentage error when the uniaxial ten-sion result is incorporated. A plot of the failure envelope with theaddition of the uniaxial tension result is shown in Fig. 14. Thisshows an improvement from comparison 5.
4.7. Selection of a failure criterion
The Drucker–Prager criterion has been shown by others to givea better representation of the failure surface for single-phased iso-tropic materials under compression when compared to the vonMises criterion [19,34]. This is due to its inclusion of hydrostaticstresses, which von Mises does not take into account. Despite this,there are very little experimental results to show the failure of theindividual constituents in a composite. The findings presented hereare one of the first to show the failure surface of the matrix when acomposite lamina fails due to compression.
Using Table 7 and the six comparisons made it is evident thatthe Drucker–Prager criterion does a better job in explaining thecompressive failure of the matrix in composites. This can be seenby comparisons: 2 and 4, where the RSS value was at least 40%lower than their counterparts: comparison 1 and 3 respectively.When Eqs. (8) and (10) are compared against each other, the valuefor ‘A’ and ‘B’ change slightly due to the addition of the uniaxial off-axis 20 degree tension result, however they remain relatively samein magnitude indicating that the original Drucker–Prager criterionfitted in comparison 2 did a good job in predicting failure. Thisbecomes clearer as the RSS values given in Table 7 are looked atfurther.
Looking at the RSS values for comparison 4 and 6, which looks atthe predictive ability of the Drucker–Prager criterion established incomparison 2, against the addition of uniaxial tension result. TheRSS value is found to increases by only 1%. This small difference in
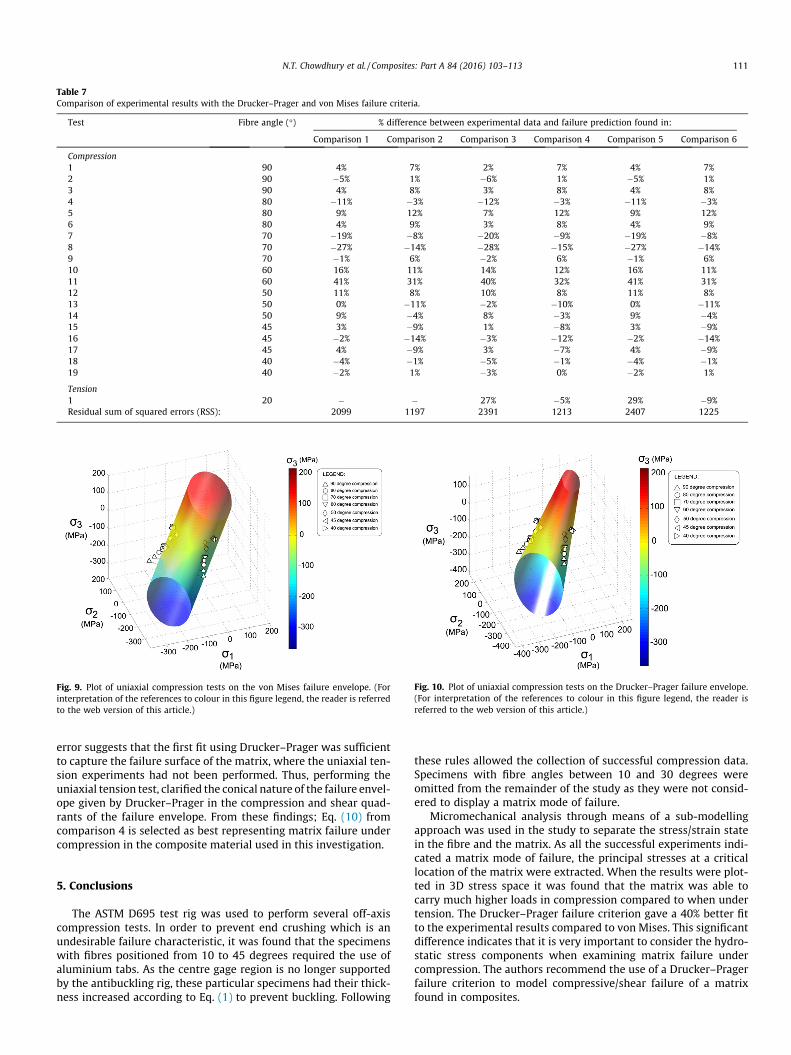
Table 7Comparison of experimental results with the Drucker–Prager and von Mises failure criteria.
Test Fibre angle (�) % difference between experimental data and failure prediction found in:
Comparison 1 Comparison 2 Comparison 3 Comparison 4 Comparison 5 Comparison 6
Compression1 90 4% 7% 2% 7% 4% 7%2 90 �5% 1% �6% 1% �5% 1%3 90 4% 8% 3% 8% 4% 8%4 80 �11% �3% �12% �3% �11% �3%5 80 9% 12% 7% 12% 9% 12%6 80 4% 9% 3% 8% 4% 9%7 70 �19% �8% �20% �9% �19% �8%8 70 �27% �14% �28% �15% �27% �14%9 70 �1% 6% �2% 6% �1% 6%10 60 16% 11% 14% 12% 16% 11%11 60 41% 31% 40% 32% 41% 31%12 50 11% 8% 10% 8% 11% 8%13 50 0% �11% �2% �10% 0% �11%14 50 9% �4% 8% �3% 9% �4%15 45 3% �9% 1% �8% 3% �9%16 45 �2% �14% �3% �12% �2% �14%17 45 4% �9% 3% �7% 4% �9%18 40 �4% �1% �5% �1% �4% �1%19 40 �2% 1% �3% 0% �2% 1%
Tension1 20 � � 27% �5% 29% �9%Residual sum of squared errors (RSS): 2099 1197 2391 1213 2407 1225
Fig. 9. Plot of uniaxial compression tests on the von Mises failure envelope. (Forinterpretation of the references to colour in this figure legend, the reader is referredto the web version of this article.)
Fig. 10. Plot of uniaxial compression tests on the Drucker–Prager failure envelope.(For interpretation of the references to colour in this figure legend, the reader isreferred to the web version of this article.)
N.T. Chowdhury et al. / Composites: Part A 84 (2016) 103–113 111
error suggests that the first fit using Drucker–Prager was sufficientto capture the failure surface of the matrix, where the uniaxial ten-sion experiments had not been performed. Thus, performing theuniaxial tension test, clarified the conical nature of the failure envel-ope given by Drucker–Prager in the compression and shear quad-rants of the failure envelope. From these findings; Eq. (10) fromcomparison 4 is selected as best representing matrix failure undercompression in the composite material used in this investigation.
5. Conclusions
The ASTM D695 test rig was used to perform several off-axiscompression tests. In order to prevent end crushing which is anundesirable failure characteristic, it was found that the specimenswith fibres positioned from 10 to 45 degrees required the use ofaluminium tabs. As the centre gage region is no longer supportedby the antibuckling rig, these particular specimens had their thick-ness increased according to Eq. (1) to prevent buckling. Following
these rules allowed the collection of successful compression data.Specimens with fibre angles between 10 and 30 degrees wereomitted from the remainder of the study as they were not consid-ered to display a matrix mode of failure.
Micromechanical analysis through means of a sub-modellingapproach was used in the study to separate the stress/strain statein the fibre and the matrix. As all the successful experiments indi-cated a matrix mode of failure, the principal stresses at a criticallocation of the matrix were extracted. When the results were plot-ted in 3D stress space it was found that the matrix was able tocarry much higher loads in compression compared to when undertension. The Drucker–Prager failure criterion gave a 40% better fitto the experimental results compared to von Mises. This significantdifference indicates that it is very important to consider the hydro-static stress components when examining matrix failure undercompression. The authors recommend the use of a Drucker–Pragerfailure criterion to model compressive/shear failure of a matrixfound in composites.
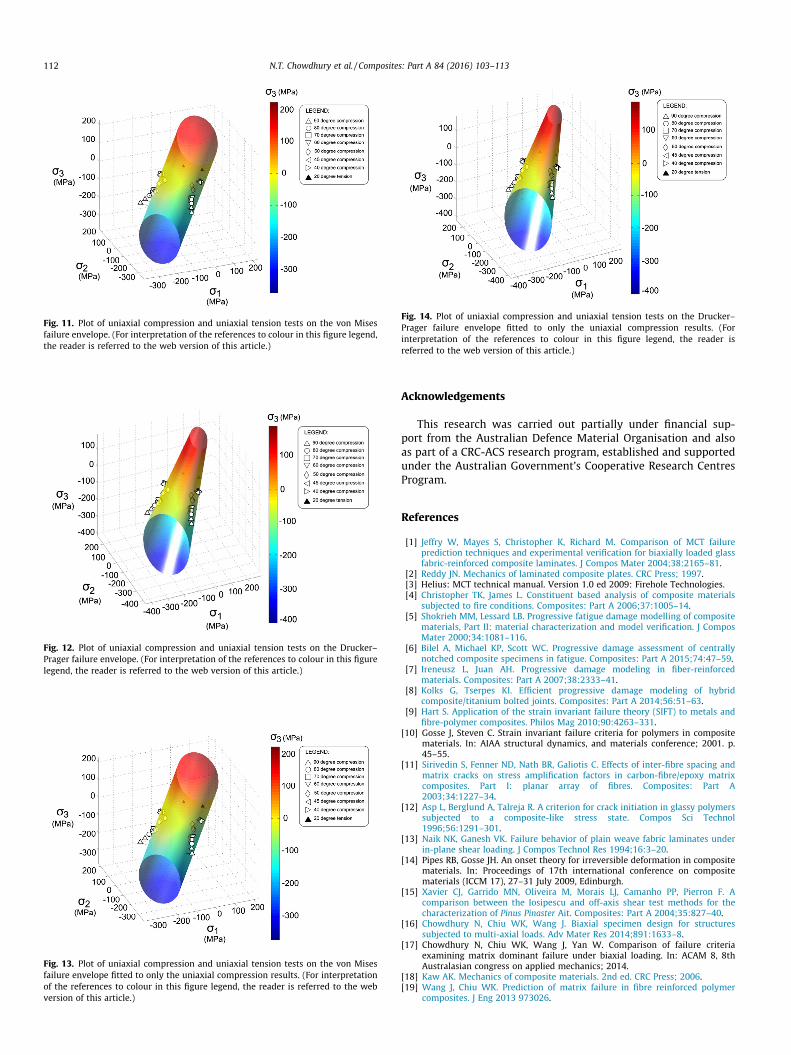
Fig. 11. Plot of uniaxial compression and uniaxial tension tests on the von Misesfailure envelope. (For interpretation of the references to colour in this figure legend,the reader is referred to the web version of this article.)
Fig. 12. Plot of uniaxial compression and uniaxial tension tests on the Drucker–Prager failure envelope. (For interpretation of the references to colour in this figurelegend, the reader is referred to the web version of this article.)
Fig. 13. Plot of uniaxial compression and uniaxial tension tests on the von Misesfailure envelope fitted to only the uniaxial compression results. (For interpretationof the references to colour in this figure legend, the reader is referred to the webversion of this article.)
Fig. 14. Plot of uniaxial compression and uniaxial tension tests on the Drucker–Prager failure envelope fitted to only the uniaxial compression results. (Forinterpretation of the references to colour in this figure legend, the reader isreferred to the web version of this article.)
112 N.T. Chowdhury et al. / Composites: Part A 84 (2016) 103–113
Acknowledgements
This research was carried out partially under financial sup-port from the Australian Defence Material Organisation and alsoas part of a CRC-ACS research program, established and supportedunder the Australian Government’s Cooperative Research CentresProgram.
References
[1] Jeffry W, Mayes S, Christopher K, Richard M. Comparison of MCT failureprediction techniques and experimental verification for biaxially loaded glassfabric-reinforced composite laminates. J Compos Mater 2004;38:2165–81.
[2] Reddy JN. Mechanics of laminated composite plates. CRC Press; 1997.[3] Helius: MCT technical manual. Version 1.0 ed 2009: Firehole Technologies.[4] Christopher TK, James L. Constituent based analysis of composite materials
subjected to fire conditions. Composites: Part A 2006;37:1005–14.[5] Shokrieh MM, Lessard LB. Progressive fatigue damage modelling of composite
materials, Part II: material characterization and model verification. J ComposMater 2000;34:1081–116.
[6] Bilel A, Michael KP, Scott WC. Progressive damage assessment of centrallynotched composite specimens in fatigue. Composites: Part A 2015;74:47–59.
[7] Ireneusz L, Juan AH. Progressive damage modeling in fiber-reinforcedmaterials. Composites: Part A 2007;38:2333–41.
[8] Kolks G, Tserpes KI. Efficient progressive damage modeling of hybridcomposite/titanium bolted joints. Composites: Part A 2014;56:51–63.
[9] Hart S. Application of the strain invariant failure theory (SIFT) to metals andfibre-polymer composites. Philos Mag 2010;90:4263–331.
[10] Gosse J, Steven C. Strain invariant failure criteria for polymers in compositematerials. In: AIAA structural dynamics, and materials conference; 2001. p.45–55.
[11] Sirivedin S, Fenner ND, Nath BR, Galiotis C. Effects of inter-fibre spacing andmatrix cracks on stress amplification factors in carbon-fibre/epoxy matrixcomposites. Part I: planar array of fibres. Composites: Part A2003;34:1227–34.
[12] Asp L, Berglund A, Talreja R. A criterion for crack initiation in glassy polymerssubjected to a composite-like stress state. Compos Sci Technol1996;56:1291–301.
[13] Naik NK, Ganesh VK. Failure behavior of plain weave fabric laminates underin-plane shear loading. J Compos Technol Res 1994;16:3–20.
[14] Pipes RB, Gosse JH. An onset theory for irreversible deformation in compositematerials. In: Proceedings of 17th international conference on compositematerials (ICCM 17), 27–31 July 2009, Edinburgh.
[15] Xavier CJ, Garrido MN, Oliveira M, Morais LJ, Camanho PP, Pierron F. Acomparison between the Iosipescu and off-axis shear test methods for thecharacterization of Pinus Pinaster Ait. Composites: Part A 2004;35:827–40.
[16] Chowdhury N, Chiu WK, Wang J. Biaxial specimen design for structuressubjected to multi-axial loads. Adv Mater Res 2014;891:1633–8.
[17] Chowdhury N, Chiu WK, Wang J, Yan W. Comparison of failure criteriaexamining matrix dominant failure under biaxial loading. In: ACAM 8, 8thAustralasian congress on applied mechanics; 2014.
[18] Kaw AK. Mechanics of composite materials. 2nd ed. CRC Press; 2006.[19] Wang J, Chiu WK. Prediction of matrix failure in fibre reinforced polymer
composites. J Eng 2013 973026.

N.T. Chowdhury et al. / Composites: Part A 84 (2016) 103–113 113
[20] Orifici AC, Herszberg I, Thomson RS. Review of methodologies for compositematerial modelling incorporating failure. Compos Struct 2008;86:194–210.
[21] Modified ASTM D 695. Standard test method for compressive properties ofrigid plastics. West Conshohocken (PA): ASTM International; 2002.
[22] ASTM D 6641. Standard test method for compressive properties of polymermatrix composite materials using a combined loading compression (CLC) testfixture. West Conshohocken (PA): ASTM International; 2009.
[23] Chowdhury N, Wang J, Chiu WK, YanW. Predicting matrix failure in compositestructures using a hybrid failure criterion. Compos Struct 2016;137:148–58.
[24] GMS composites, <http://www.gmscomposites.com/prepreg-range>.[25] ASTM D 3410. Standard test method for compressive properties of polymer
matrix composite materials with unsupported gage section by shear loading.West Conshohocken (PA): ASTM International; 2003.
[26] Leif AC, Adams DF, Pipes RB. Experimental characterization of advancedcomposite materials. 3rd ed. CRC Press; 2002.
[27] Okabe T, Imamura H, Sato Y, Higuchi R, Koyanagi J, Talreja R. Experimental andnumerical studies of initial cracking in CFRP cross-ply laminates. Composites:Part A 2015;68:81–9.
[28] Xiao Y, Kawai M, Hatta H. An integrated method for off-axis tension andcompression testing of unidirectional composites. J Compos Mater2010;45:657–69.
[29] Sun CT, Berreth SP. A new end tab design for off-axis tension test of compositematerials. J Compos Mater 1988;22:766–79.
[30] ASTM D 3039. Standard test method for tensile properties of polymer matrixcomposite materials. West Conshohocken (PA): ASTM International; 1995.
[31] Sun CT, Chung I. An oblique end-tab design for testing off-axis compositespecimens. J Compos Mater 1992;24:619–23.
[32] Soden DP, Hinton JM, Kaddour SA. Failure criteria in fibre reinforced polymercomposites: additional theories, comparison and recommendations. Spec IssueCompos Sci Technol 2004;64.
[33] Mao HY. Advances in strength theories for materials under complex stressstate in the 20th century. Am Soc Mech Eng 2002;55:169–98.
[34] Wang J, Chiu WK. Enhancing prediction accuracy in sift theory. In: 18th ICCM,Jeju Island, Korea 21–26 August 2011.


![Durbhog - Golam Mawla Nayeem [Suvos Collection]](https://img.pdfslide.net/doc/110x75/577c84871a28abe054b95988/durbhog-golam-mawla-nayeem-suvos-collection.jpg)