Embed Size (px)
Citation preview
Bulletin of Insectology 67 (2): 255-264, 2014 ISSN 1721-8861
Compositional changes in spider (Araneae) assemblages along an urbanisation gradient near a Danish town
Roland HORVÁTH1, Zoltán ELEK
2,3, Gábor L. LÖVEI
1,2
1Department of Ecology, University of Debrecen, Hungary
2Aarhus University, Department of Agroecology, Flakkebjerg Research Centre, Slagelse, Denmark
3MTA-ELTE-MTM Ecology Research Group, Biological Institute, Eötvös Loránd University, Budapest, Hungary
Abstract
Spider (Araneae) assemblages were studied over two years by pitfall trapping along an urbanisation gradient of forested habitats
(rural forest - suburban forest fragment - urban forest fragment) in a Danish town, using the Globenet protocol. During the two
years, we collected 4340 individuals of 90 species, with money spiders (Linyphiidae) and wolf spiders (Lycosidae) being most
numerous. One species, Ero aphana, was new to the Danish fauna. In 2004, 45-47 species were captured in the habitats in various
stages of urbanisation, while in 2005 (with a smaller collection effort), 28 (urban) - 37 (rural) species were captured. Twenty-five
percent of the collected species occurred in all habitats, but about half of them were only collected in one of the urbanisation
stages. The number of shared species was the highest between the suburban and urban habitats. The highest similarities between
assemblages (characterized by the Renkonen-index) were the within-habitat, between-year comparisons, indicating assemblage
stability. Species turnover between years was lowest in the rural forest and highest in the urban forest patch (56.6% vs. 41.5%).
Urbanisation did not reduce diversity in terms of species richness but only a minority of the species present in forests was able to
remain attached to the reduced-size forest fragments as urbanisation progressed.
Key words: Globenet, disturbance, biodiversity, arachnids.
Introduction
Humans emerged as one of the major forces shaping the
Earth's biota. Now the most numerous mammal on
Earth, humans use an enormous amount of natural re-
sources, extant as well as fossil ones. One particular fea-
ture of this resource use is profound redistribution of
materials and energy, often achieved while eliminating,
converting and/or fragmenting original habitats. In the
process, space and resources for all other living beings
diminish (Haberl et al., 2007). This has created an ex-
tinction wave, the 6th
in the history of the Earth (Wilson,
1999).
Urbanisation, the establishment and growth of settle-
ments with a large number of people is a recurring fea-
ture of human societies. Today, more than half of hu-
mankind lives in large urban settlements (UNDP, 2000).
While cities in different parts of the world are diverse,
urbanisation as a process has several characteristics that
seem very similar (Gilbert, 1989).
During the development of a city, the original habitat
is mostly converted, and by the time a city is "devel-
oped", only small and fragmented patches of the origi-
nal habitats remain (Gilbert, 1989). However, cities are
not bereft of plants and animals, because human pres-
ence also means resource concentration, and in several
respects a more benign environment (Parlow, 2011).
Transport of resources, in turn, increases the chances of
assisted dispersal (Lundholm and Richardson, 2010).
Understanding the overall impact of urbanisation on
biodiversity, human inhabitants and the level of benefits
provided by nature in urban settings constitutes a chal-
lenging research agenda (Magura et al., 2010a).
Most urbanisation research has focused on the patterns
of biodiversity in urban areas, and more on vertebrates
than invertebrates (Clergeau et al., 2006; Trollope et al.,
2009; Garden et al., 2010; Stagoll et al., 2010). The
largest body of evidence on the response of inverte-
brates to urbanisation emerges from the multi-location
Globenet project concerned with forests (Niemelä et al.,
2002, details see in material and methods section). Most
published Globenet studies deal with the beetle family
Carabidae (ground beetles). A synthetic evaluation of
the studies published up to 2008 (Magura et al., 2010a)
concluded that 1) overall, the diversity of ground beetles
does not necessarily decrease along the urbanisation
gradient from the original forest to urban forest frag-
ments, 2) there seems to be no faunal homogenization of
ground beetle assemblages as urbanisation progresses,
and 3) forest specialists seem to react negatively to the
changes that occur as a continuous forest becomes a
forest fragment in an urban park.
However, there are differing opinions concerning how
can one generalize from ground beetle studies to general
ecological trends (Saetersdal et al., 2004), and studying
other invertebrate groups is useful to assess the general-
ity of the response to urbanisation.
The study of spiders (Araneae) is worthwhile because
they form a species-rich group that is ecologically more
homogeneous than ground beetles (which have preda-
tory, mixed feeder, and herbivorous species, Lövei and
Sunderland, 1996), and are common in many habitats.
Spiders are overwhelmingly predators, are important
natural enemies (Wise, 1993), and thus provide a valu-
able ecosystem service of pest control. They are very
good dispersers (Pywell et al., 2005), adapted to food
scarcity (Provencher and Riechert, 1991), and usually
prey on several species (Riechert and Lockley, 1984). In
spite of the above, there are only a few published arti-
cles on the effect of urbanisation on spiders (Finland:
256
Alaruikka et al., 2002; Hungary: Horváth and Szinetár,
2007; Magura et al., 2010b). In Hungary, the share of
generalist species increases, while those of forest spe-
cialist decreases as urbanisation progresses, even if sig-
nificantly more species are captured in the urban area
vs. suburban or the original forest habitat (Magura et al.,
2010b). In Finland, however, no such differences are
present (Alaruikka et al., 2002).
In this paper, we report on the composition of the for-
est spider assemblages in different urbanisation stages
in a small Danish town, and compare species richness
patterns, turnover and assemblage similarity. We hy-
pothesized that as a result of the urbanisation proceeds,
conditions for the original, forest-inhabiting spider
fauna will become less suitable, and this will be re-
flected in the assemblage composition: forest specialists
were expected to decrease, and in general, evenness to
decline as urbanisation advances (Shochat et al., 2010).
Our results indicate that this predatory group shows
more distinct responses to urbanisation than was de-
tected in ground beetles, a higher share of the original,
rural fauna is retained under urban conditions, and the
share of singletons is higher than in ground beetle as-
semblages.
Materials and methods
Study area The study areas lie in and around the city of Sorø
(7743 inhabitants, Anonymous, 2010), a regional centre
on the island of Zealand (Sjælland) in Denmark
(55°26'N 11°34'E). Three differently fragmented areas
of the original forest (conforming to an urbanisation
gradient with rural, suburban, urban stages) were se-
lected in the city and in the adjacent forests.
The rural (forest) sampling sites were located 3 km
west from the town centre, in the extensive forests cov-
ering the area around the town. Beech (Fagus sylvatica)
was the dominant tree species at all sampling sites; with
dense canopy and a scarce shrub layer. The forestry
management was limited and occasional; during those
operations, the understory was not thinned, and the
fallen or cut branches were left to rot on the ground. The
herb layer was dense in the spring.
The suburban sampling sites were at the northeastern
edge of the town, with fewer beeches but with other de-
ciduous trees (Fraxinus excelsior and Quercus robur)
present. There was a thicket of sapling beeches, bushes
(Crategus monogyna, Sorbus spp., Sambucus nigra), a
rich herb layer and dense stands of nettle (Urtica
dioica), indicating nitrogen-rich soil (Ellenberg, 1974).
The surface of the built-up area was about 20%, and in-
cluded single houses, gardens, the city cemetery, several
unpaved roads and an old, partially dried-out irrigation
canal. This habitat was considered more disturbed with
respect to the original forest, with more human visitors,
partial habitat alteration and fragmentation, an increase
in management operations, and nutrient influx.
The urban sampling sites were in the Sorø Akademi
park complex, bordered on one side by Sorø Lake, and
by the town centre on the other. The built-up area was
circa 40%, including several buildings and (mostly un-
paved) roads. The forest patches cover an estimated
20%, the rest (40%) being lawn. The forest patches still
contained old beech specimens, mixed with other,
planted trees such as Taxus baccata and Tilia argentea,
a dense shrub layer with Crataegus monogyna and
Buxus sempervirens. The park management was more
intensive than the other two stages of the urbanisation
gradient, but it was "soft": paths were graveled (not
paved), and the mowed grass, collected fallen leaves
and branches cut during park maintenance work were
returned to the understory of the forest patches. In spite
of this, this was the most disturbed habitat type, with the
largest number of human visitors, the most frequent
management operations, the highest share of non-native
plant species, nutrient influx via fertilizers, predator
control (especially of small mammals via poisoning),
and the highest share of built-in surface.
Spider collection, handling and identification Spiders were collected using pitfall traps, set accord-
ing to the Globenet protocol (Niemelä et al., 2002).
Four sites were selected in each of the three habitats (ru-
ral, suburban, urban). The distance between the edges of
sites within a given urbanisation stage was at least 50 m
to avoid pseudoreplication. Ten traps were placed at
each site with an inter-trap distance of ≥ 10 m. There
were 120 traps overall along the rural-suburban-urban
gradient (3 areas × 4 sites × 10 traps). Traps consisted
of 70 mm diameter plastic cups and contained about 200
ml of killing-preserving solution, 70% ethylene glycol
with a drop of odourless detergent. Traps were protected
by 20 × 20 cm galvanized iron plates from litter, rain,
and bycatch. Spiders were collected fortnightly from
early May to mid- October in 2004, and at alternating
fortnightly intervals (traps closed during every second
fortnight) during the same period in 2005.
In the field, the catch was removed from the trap,
sieved and washed into glass vials using 70% ethyl al-
cohol, and kept at 4 °C until sorting. Spiders were iden-
tified to species using keys by Loksa (1969; 1972),
Heimer and Nentwig (1991) and Roberts (1995). The
nomenclature follows Platnick (2011). Voucher speci-
mens are deposited in the Department of Ecology, Uni-
versity of Debrecen, Hungary. For evaluation, catches
were pooled by trap and year.
Evaluation Assemblage structure was characterized and compared
as suggested by Southwood and Henderson (2000). We
calculated species turnover and assemblage similarity
using the Renkonen index (Renkonen, 1938).
We estimated the species richness in each habitat type
with the Chao estimator (Chao, 1987) using the vegan
package (Oksanen et al., 2011) in R version 2.13 (R
Development Core Team, 2011). The standard devia-
tions were generated from 10,000 reshufflings of the
sample order.
Diversity ordering The diversity of the spider assemblages was evaluated
by a scalable diversity comparison using the Rényi di-
257
versity function (Southwood and Henderson, 2000), cal-
culated by the DivOrd program package (Tóthmérész,
1993). The Rényi diversity, HR(α) is defined as:
𝐻𝑅 𝑎 =1
1 − 𝑎(log 𝑝𝑖
𝑎
𝑠
𝑖=1
)
where pi is the relative frequency of the i-th species, S
the total number of species and α is the scale parameter
(α ≥ 0, α ≠ 1).
At four values of the scale parameter α, the Rényi di-
versity index value corresponds to commonly used di-
versity indices (Lövei, 2005): (i) at α = 0, the value of
the Rényi diversity is equal to the logarithm of the num-
ber of species of the community; (ii) at α → 1 (it cannot
take that value due to producing a division with zero,
but as a continuous function, α can take values indefi-
nitely close to 1), the Rényi diversity is identical to the
Shannon diversity; (iii) at α = 2, the value of the Rényi
diversity is related to the Simpson diversity, and (iv) at
α → + ∞, the value of the Rényi diversity is the inverse
of the Berger-Parker dominance index (Berger and
Parker, 1970).
At small values of the scale parameter, the Rényi di-
versity value is influenced by rare species; as the scale
parameter increases, the diversity value is increasingly
influenced by the common species (see above). Near
infinity, only the abundance of the most common spe-
cies will determine the diversity (Tóthmérész, 1998).
This approach produces a diversity profile, allowing a
synthetic assessment of diversity relations among dif-
ferent assemblages than the often-used single-value di-
versity indices (Patil and Taillie, 1982; Lövei, 2005).
If two diversity profiles do not intersect each other, the
assemblage whose diversity profile runs above the other
one is unequivocally more diverse. If the profiles cross,
the assemblages cannot be unequivocally ordered, as one
assemblage is more diverse for the rare species, while
the other one is more diverse for the common species.
Results
Taxonomic composition Spiders belonging to 16 families were captured in the
two years. At the species level, the families with most
species present were Linyphiidae and Lycosidae. The
families with most individuals collected were Linyphii-
dae, Lycosidae and Amaurobiidae.
The total capture was 4340 individuals belonging to
90 species. One of them, Ero aphana was new to the
Danish fauna, 11 species were new to the South Zealand
region (Labulla thoracica, Micrargus apertus, Philo-
dromus albidus, Philodromus collinus, Porrhomma er-
rans, Porrhomma microphthalmum, Porrhomma mi-
crops, Porrhomma oblitum, Porrhomma pallidum,
Walckenaeria incisa and Xysticus lanio) and a further
nine were rare nationwide (Coelotes atropos, Coelotes
terrestris, Haplodrassus silvestris, Philodromus albidus,
Philodromus praedatus, Porhomma errans, Porhomma
microps, Walckenaeria corniculans and Walckenaeria
incisa).
Assemblage diversity In 2004, we caught 3075 individuals, belonging to 80
species while 1265 individuals of 55 species were col-
lected in 2005 (table 1). In 2004, there were nearly equal
numbers of species in the three habitats (table 1). Of
these, 12, 14 and 17 species were singletons in the rural,
suburban and urban stages, respectively 26, 31 and 36%.
In 2005, the rural habitat was the most species rich, fol-
lowed by the suburban and urban habitats (table 1). The
number of singletons was 13 (35%) in the rural, 15 (45%)
in the suburban habitat and 8 (28.5%) at the urban sites.
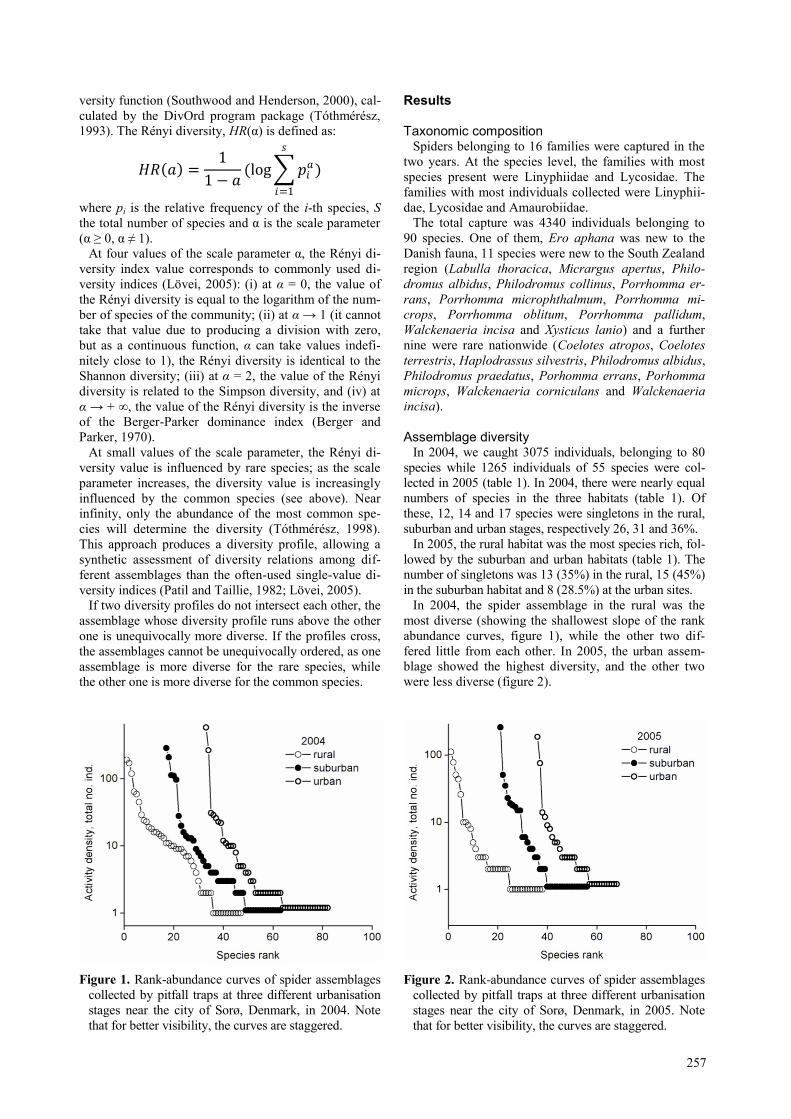
In 2004, the spider assemblage in the rural was the
most diverse (showing the shallowest slope of the rank
abundance curves, figure 1), while the other two dif-
fered little from each other. In 2005, the urban assem-
blage showed the highest diversity, and the other two
were less diverse (figure 2).
Figure 1. Rank-abundance curves of spider assemblages
collected by pitfall traps at three different urbanisation
stages near the city of Sorø, Denmark, in 2004. Note
that for better visibility, the curves are staggered.
Figure 2. Rank-abundance curves of spider assemblages
collected by pitfall traps at three different urbanisation
stages near the city of Sorø, Denmark, in 2005. Note
that for better visibility, the curves are staggered.
258
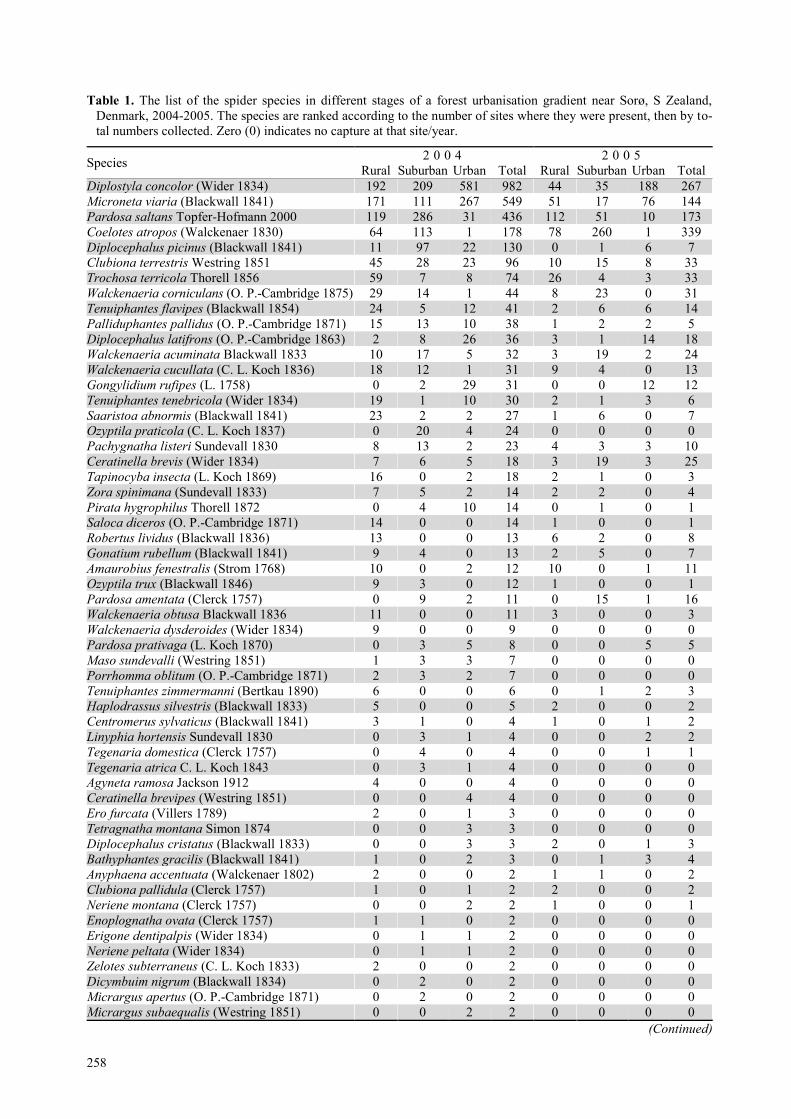
Table 1. The list of the spider species in different stages of a forest urbanisation gradient near Sorø, S Zealand,
Denmark, 2004-2005. The species are ranked according to the number of sites where they were present, then by to-
tal numbers collected. Zero (0) indicates no capture at that site/year.
Species 2 0 0 4 2 0 0 5
Rural Suburban Urban Total Rural Suburban Urban Total
Diplostyla concolor (Wider 1834) 192 209 581 982 44 35 188 267
Microneta viaria (Blackwall 1841) 171 111 267 549 51 17 76 144
Pardosa saltans Topfer-Hofmann 2000 119 286 31 436 112 51 10 173
Coelotes atropos (Walckenaer 1830) 64 113 1 178 78 260 1 339
Diplocephalus picinus (Blackwall 1841) 11 97 22 130 0 1 6 7
Clubiona terrestris Westring 1851 45 28 23 96 10 15 8 33
Trochosa terricola Thorell 1856 59 7 8 74 26 4 3 33
Walckenaeria corniculans (O. P.-Cambridge 1875) 29 14 1 44 8 23 0 31
Tenuiphantes flavipes (Blackwall 1854) 24 5 12 41 2 6 6 14
Palliduphantes pallidus (O. P.-Cambridge 1871) 15 13 10 38 1 2 2 5
Diplocephalus latifrons (O. P.-Cambridge 1863) 2 8 26 36 3 1 14 18
Walckenaeria acuminata Blackwall 1833 10 17 5 32 3 19 2 24
Walckenaeria cucullata (C. L. Koch 1836) 18 12 1 31 9 4 0 13
Gongylidium rufipes (L. 1758) 0 2 29 31 0 0 12 12
Tenuiphantes tenebricola (Wider 1834) 19 1 10 30 2 1 3 6
Saaristoa abnormis (Blackwall 1841) 23 2 2 27 1 6 0 7
Ozyptila praticola (C. L. Koch 1837) 0 20 4 24 0 0 0 0
Pachygnatha listeri Sundevall 1830 8 13 2 23 4 3 3 10
Ceratinella brevis (Wider 1834) 7 6 5 18 3 19 3 25
Tapinocyba insecta (L. Koch 1869) 16 0 2 18 2 1 0 3
Zora spinimana (Sundevall 1833) 7 5 2 14 2 2 0 4
Pirata hygrophilus Thorell 1872 0 4 10 14 0 1 0 1
Saloca diceros (O. P.-Cambridge 1871) 14 0 0 14 1 0 0 1
Robertus lividus (Blackwall 1836) 13 0 0 13 6 2 0 8
Gonatium rubellum (Blackwall 1841) 9 4 0 13 2 5 0 7
Amaurobius fenestralis (Strom 1768) 10 0 2 12 10 0 1 11
Ozyptila trux (Blackwall 1846) 9 3 0 12 1 0 0 1
Pardosa amentata (Clerck 1757) 0 9 2 11 0 15 1 16
Walckenaeria obtusa Blackwall 1836 11 0 0 11 3 0 0 3
Walckenaeria dysderoides (Wider 1834) 9 0 0 9 0 0 0 0
Pardosa prativaga (L. Koch 1870) 0 3 5 8 0 0 5 5
Maso sundevalli (Westring 1851) 1 3 3 7 0 0 0 0
Porrhomma oblitum (O. P.-Cambridge 1871) 2 3 2 7 0 0 0 0
Tenuiphantes zimmermanni (Bertkau 1890) 6 0 0 6 0 1 2 3
Haplodrassus silvestris (Blackwall 1833) 5 0 0 5 2 0 0 2
Centromerus sylvaticus (Blackwall 1841) 3 1 0 4 1 0 1 2
Linyphia hortensis Sundevall 1830 0 3 1 4 0 0 2 2
Tegenaria domestica (Clerck 1757) 0 4 0 4 0 0 1 1
Tegenaria atrica C. L. Koch 1843 0 3 1 4 0 0 0 0
Agyneta ramosa Jackson 1912 4 0 0 4 0 0 0 0
Ceratinella brevipes (Westring 1851) 0 0 4 4 0 0 0 0
Ero furcata (Villers 1789) 2 0 1 3 0 0 0 0
Tetragnatha montana Simon 1874 0 0 3 3 0 0 0 0
Diplocephalus cristatus (Blackwall 1833) 0 0 3 3 2 0 1 3
Bathyphantes gracilis (Blackwall 1841) 1 0 2 3 0 1 3 4
Anyphaena accentuata (Walckenaer 1802) 2 0 0 2 1 1 0 2
Clubiona pallidula (Clerck 1757) 1 0 1 2 2 0 0 2
Neriene montana (Clerck 1757) 0 0 2 2 1 0 0 1
Enoplognatha ovata (Clerck 1757) 1 1 0 2 0 0 0 0
Erigone dentipalpis (Wider 1834) 0 1 1 2 0 0 0 0
Neriene peltata (Wider 1834) 0 1 1 2 0 0 0 0
Zelotes subterraneus (C. L. Koch 1833) 2 0 0 2 0 0 0 0
Dicymbuim nigrum (Blackwall 1834) 0 2 0 2 0 0 0 0
Micrargus apertus (O. P.-Cambridge 1871) 0 2 0 2 0 0 0 0
Micrargus subaequalis (Westring 1851) 0 0 2 2 0 0 0 0
(Continued)
259
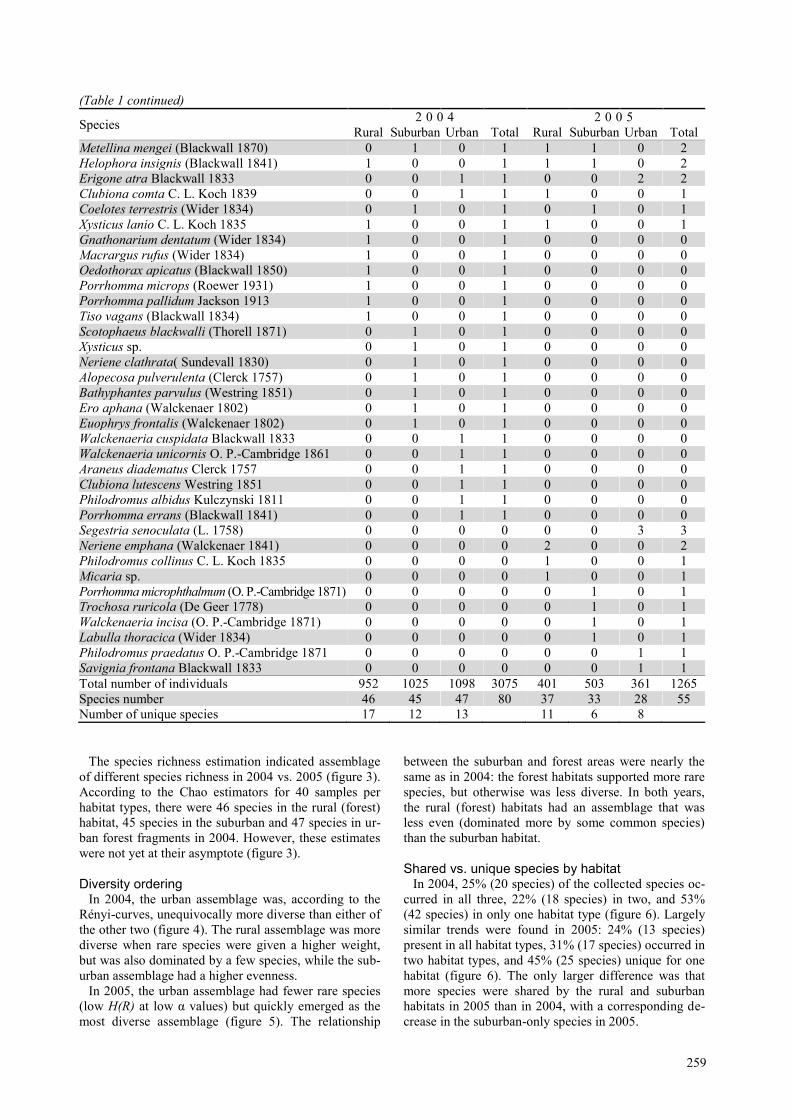
(Table 1 continued)
Species 2 0 0 4 2 0 0 5
Rural Suburban Urban Total Rural Suburban Urban Total
Metellina mengei (Blackwall 1870) 0 1 0 1 1 1 0 2
Helophora insignis (Blackwall 1841) 1 0 0 1 1 1 0 2
Erigone atra Blackwall 1833 0 0 1 1 0 0 2 2
Clubiona comta C. L. Koch 1839 0 0 1 1 1 0 0 1
Coelotes terrestris (Wider 1834) 0 1 0 1 0 1 0 1
Xysticus lanio C. L. Koch 1835 1 0 0 1 1 0 0 1
Gnathonarium dentatum (Wider 1834) 1 0 0 1 0 0 0 0
Macrargus rufus (Wider 1834) 1 0 0 1 0 0 0 0
Oedothorax apicatus (Blackwall 1850) 1 0 0 1 0 0 0 0
Porrhomma microps (Roewer 1931) 1 0 0 1 0 0 0 0
Porrhomma pallidum Jackson 1913 1 0 0 1 0 0 0 0
Tiso vagans (Blackwall 1834) 1 0 0 1 0 0 0 0
Scotophaeus blackwalli (Thorell 1871) 0 1 0 1 0 0 0 0
Xysticus sp. 0 1 0 1 0 0 0 0
Neriene clathrata( Sundevall 1830) 0 1 0 1 0 0 0 0
Alopecosa pulverulenta (Clerck 1757) 0 1 0 1 0 0 0 0
Bathyphantes parvulus (Westring 1851) 0 1 0 1 0 0 0 0
Ero aphana (Walckenaer 1802) 0 1 0 1 0 0 0 0
Euophrys frontalis (Walckenaer 1802) 0 1 0 1 0 0 0 0
Walckenaeria cuspidata Blackwall 1833 0 0 1 1 0 0 0 0
Walckenaeria unicornis O. P.-Cambridge 1861 0 0 1 1 0 0 0 0
Araneus diadematus Clerck 1757 0 0 1 1 0 0 0 0
Clubiona lutescens Westring 1851 0 0 1 1 0 0 0 0
Philodromus albidus Kulczynski 1811 0 0 1 1 0 0 0 0
Porrhomma errans (Blackwall 1841) 0 0 1 1 0 0 0 0
Segestria senoculata (L. 1758) 0 0 0 0 0 0 3 3
Neriene emphana (Walckenaer 1841) 0 0 0 0 2 0 0 2
Philodromus collinus C. L. Koch 1835 0 0 0 0 1 0 0 1
Micaria sp. 0 0 0 0 1 0 0 1
Porrhomma microphthalmum (O. P.-Cambridge 1871) 0 0 0 0 0 1 0 1
Trochosa ruricola (De Geer 1778) 0 0 0 0 0 1 0 1
Walckenaeria incisa (O. P.-Cambridge 1871) 0 0 0 0 0 1 0 1
Labulla thoracica (Wider 1834) 0 0 0 0 0 1 0 1
Philodromus praedatus O. P.-Cambridge 1871 0 0 0 0 0 0 1 1
Savignia frontana Blackwall 1833 0 0 0 0 0 0 1 1
Total number of individuals 952 1025 1098 3075 401 503 361 1265
Species number 46 45 47 80 37 33 28 55
Number of unique species 17 12 13 11 6 8
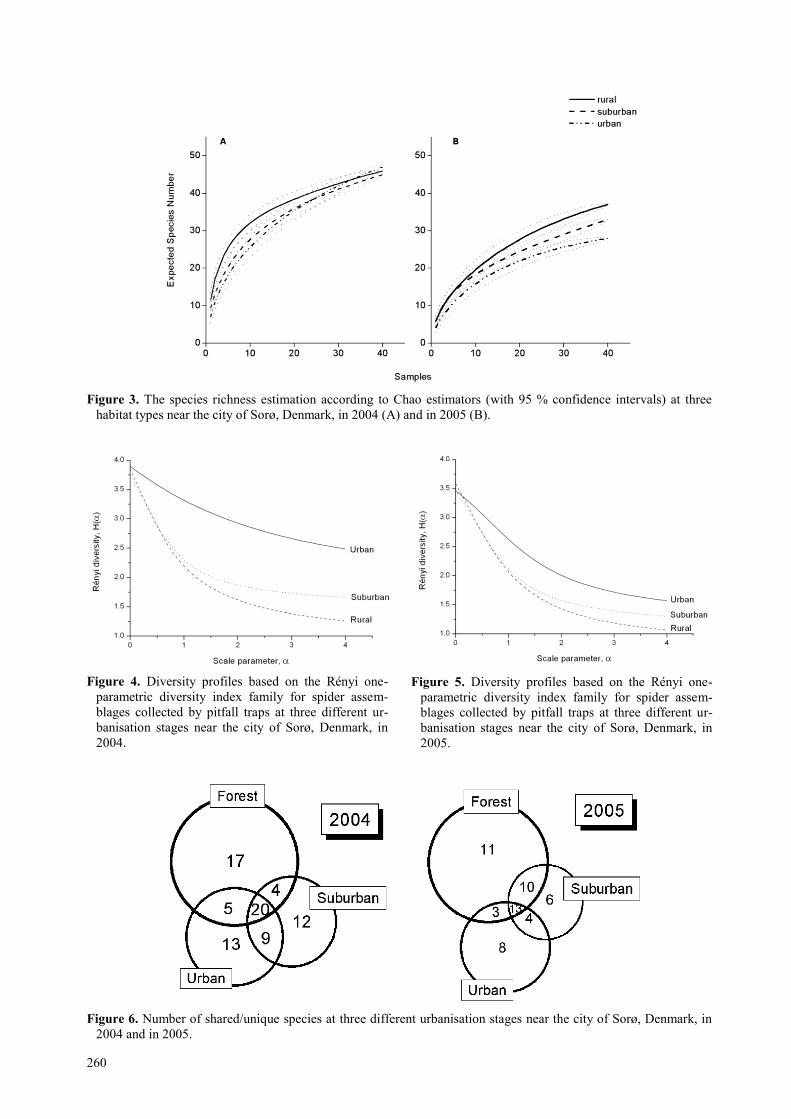
The species richness estimation indicated assemblage
of different species richness in 2004 vs. 2005 (figure 3).
According to the Chao estimators for 40 samples per
habitat types, there were 46 species in the rural (forest)
habitat, 45 species in the suburban and 47 species in ur-
ban forest fragments in 2004. However, these estimates
were not yet at their asymptote (figure 3).
Diversity ordering In 2004, the urban assemblage was, according to the
Rényi-curves, unequivocally more diverse than either of
the other two (figure 4). The rural assemblage was more
diverse when rare species were given a higher weight,
but was also dominated by a few species, while the sub-
urban assemblage had a higher evenness.
In 2005, the urban assemblage had fewer rare species
(low H(R) at low α values) but quickly emerged as the
most diverse assemblage (figure 5). The relationship
between the suburban and forest areas were nearly the
same as in 2004: the forest habitats supported more rare
species, but otherwise was less diverse. In both years,
the rural (forest) habitats had an assemblage that was
less even (dominated more by some common species)
than the suburban habitat.
Shared vs. unique species by habitat In 2004, 25% (20 species) of the collected species oc-
curred in all three, 22% (18 species) in two, and 53%
(42 species) in only one habitat type (figure 6). Largely
similar trends were found in 2005: 24% (13 species)
present in all habitat types, 31% (17 species) occurred in
two habitat types, and 45% (25 species) unique for one
habitat (figure 6). The only larger difference was that
more species were shared by the rural and suburban
habitats in 2005 than in 2004, with a corresponding de-
crease in the suburban-only species in 2005.
260
Figure 3. The species richness estimation according to Chao estimators (with 95 % confidence intervals) at three
habitat types near the city of Sorø, Denmark, in 2004 (A) and in 2005 (B).
Figure 4. Diversity profiles based on the Rényi one-
parametric diversity index family for spider assem-
blages collected by pitfall traps at three different ur-
banisation stages near the city of Sorø, Denmark, in
2004.
Figure 5. Diversity profiles based on the Rényi one-
parametric diversity index family for spider assem-
blages collected by pitfall traps at three different ur-
banisation stages near the city of Sorø, Denmark, in
2005.
Figure 6. Number of shared/unique species at three different urbanisation stages near the city of Sorø, Denmark, in
2004 and in 2005.
261
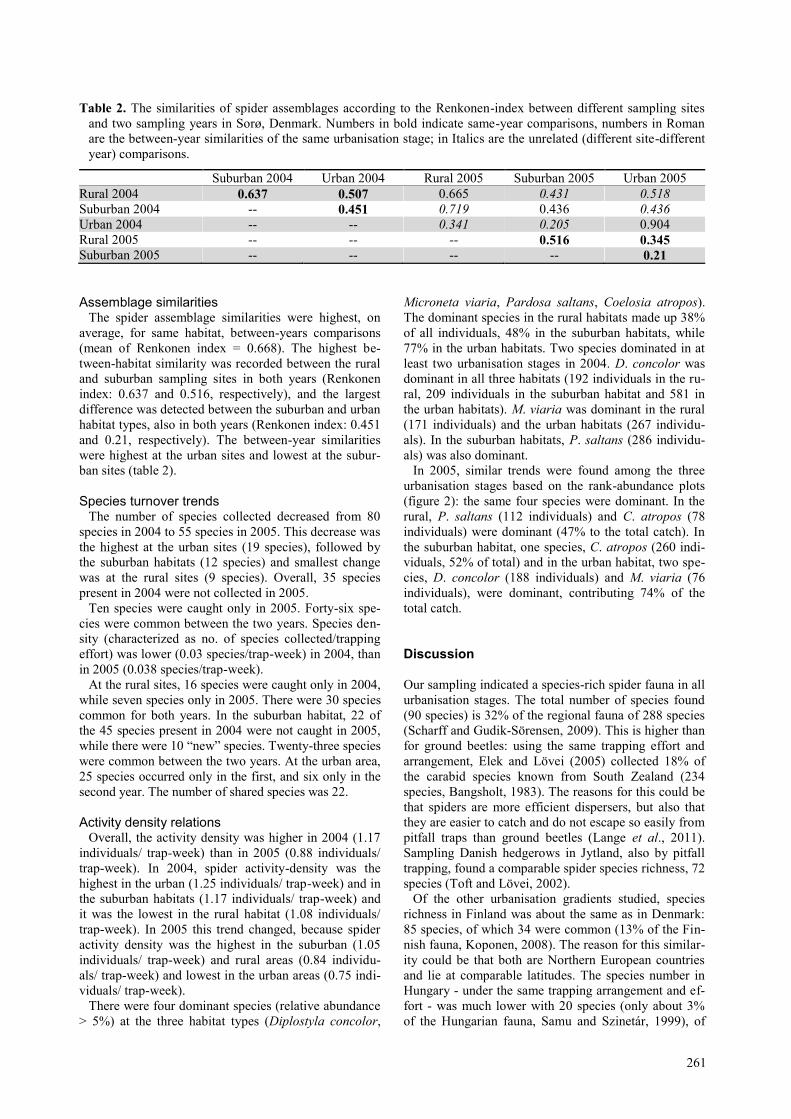
Table 2. The similarities of spider assemblages according to the Renkonen-index between different sampling sites
and two sampling years in Sorø, Denmark. Numbers in bold indicate same-year comparisons, numbers in Roman
are the between-year similarities of the same urbanisation stage; in Italics are the unrelated (different site-different
year) comparisons.
Suburban 2004 Urban 2004 Rural 2005 Suburban 2005 Urban 2005
Rural 2004 0.637 0.507 0.665 0.431 0.518
Suburban 2004 -- 0.451 0.719 0.436 0.436
Urban 2004 -- -- 0.341 0.205 0.904
Rural 2005 -- -- -- 0.516 0.345 Suburban 2005 -- -- -- -- 0.21
Assemblage similarities The spider assemblage similarities were highest, on
average, for same habitat, between-years comparisons
(mean of Renkonen index = 0.668). The highest be-
tween-habitat similarity was recorded between the rural
and suburban sampling sites in both years (Renkonen
index: 0.637 and 0.516, respectively), and the largest
difference was detected between the suburban and urban
habitat types, also in both years (Renkonen index: 0.451
and 0.21, respectively). The between-year similarities
were highest at the urban sites and lowest at the subur-
ban sites (table 2).
Species turnover trends The number of species collected decreased from 80
species in 2004 to 55 species in 2005. This decrease was
the highest at the urban sites (19 species), followed by
the suburban habitats (12 species) and smallest change
was at the rural sites (9 species). Overall, 35 species
present in 2004 were not collected in 2005.
Ten species were caught only in 2005. Forty-six spe-
cies were common between the two years. Species den-
sity (characterized as no. of species collected/trapping
effort) was lower (0.03 species/trap-week) in 2004, than
in 2005 (0.038 species/trap-week).
At the rural sites, 16 species were caught only in 2004,
while seven species only in 2005. There were 30 species
common for both years. In the suburban habitat, 22 of
the 45 species present in 2004 were not caught in 2005,
while there were 10 “new” species. Twenty-three species
were common between the two years. At the urban area,
25 species occurred only in the first, and six only in the
second year. The number of shared species was 22.
Activity density relations Overall, the activity density was higher in 2004 (1.17
individuals/ trap-week) than in 2005 (0.88 individuals/
trap-week). In 2004, spider activity-density was the
highest in the urban (1.25 individuals/ trap-week) and in
the suburban habitats (1.17 individuals/ trap-week) and
it was the lowest in the rural habitat (1.08 individuals/
trap-week). In 2005 this trend changed, because spider
activity density was the highest in the suburban (1.05
individuals/ trap-week) and rural areas (0.84 individu-
als/ trap-week) and lowest in the urban areas (0.75 indi-
viduals/ trap-week).
There were four dominant species (relative abundance
> 5%) at the three habitat types (Diplostyla concolor,
Microneta viaria, Pardosa saltans, Coelosia atropos).
The dominant species in the rural habitats made up 38%
of all individuals, 48% in the suburban habitats, while
77% in the urban habitats. Two species dominated in at
least two urbanisation stages in 2004. D. concolor was
dominant in all three habitats (192 individuals in the ru-
ral, 209 individuals in the suburban habitat and 581 in
the urban habitats). M. viaria was dominant in the rural
(171 individuals) and the urban habitats (267 individu-
als). In the suburban habitats, P. saltans (286 individu-
als) was also dominant.
In 2005, similar trends were found among the three
urbanisation stages based on the rank-abundance plots
(figure 2): the same four species were dominant. In the
rural, P. saltans (112 individuals) and C. atropos (78
individuals) were dominant (47% to the total catch). In
the suburban habitat, one species, C. atropos (260 indi-
viduals, 52% of total) and in the urban habitat, two spe-
cies, D. concolor (188 individuals) and M. viaria (76
individuals), were dominant, contributing 74% of the
total catch.
Discussion
Our sampling indicated a species-rich spider fauna in all
urbanisation stages. The total number of species found
(90 species) is 32% of the regional fauna of 288 species
(Scharff and Gudik-Sörensen, 2009). This is higher than
for ground beetles: using the same trapping effort and
arrangement, Elek and Lövei (2005) collected 18% of
the carabid species known from South Zealand (234
species, Bangsholt, 1983). The reasons for this could be
that spiders are more efficient dispersers, but also that
they are easier to catch and do not escape so easily from
pitfall traps than ground beetles (Lange et al., 2011).
Sampling Danish hedgerows in Jytland, also by pitfall
trapping, found a comparable spider species richness, 72
species (Toft and Lövei, 2002).
Of the other urbanisation gradients studied, species
richness in Finland was about the same as in Denmark:
85 species, of which 34 were common (13% of the Fin-
nish fauna, Koponen, 2008). The reason for this similar-
ity could be that both are Northern European countries
and lie at comparable latitudes. The species number in
Hungary - under the same trapping arrangement and ef-
fort - was much lower with 20 species (only about 3%
of the Hungarian fauna, Samu and Szinetár, 1999), of
262
which five were abundant. This goes against a general
species richness gradient that should increase towards
the south (Hawkins et al., 2007). The causes can include
a drier climate as well as management differences. The
forests in the eastern lowlands of Hungary have histori-
cally been subjected to isolation, destruction and distur-
bance (Meglécz et al., 1999), which did not favour a
species-rich assemblage of forest-associated ground
dwellers.
We found a high share of rare species (singletons and
doubletons), which is a common phenomenon in spider
assemblages (figure 6). On the basis of three studies, no
generalization is possible about rarity patterns. The
highest number of singleton species was in the suburban
forest (26 species) in Denmark (this study), in the urban
habitat (eight species) in Hungary (Magura et al.,
2010b) and the rural habitat (coniferous forest) in
Finland (17 species, Alaruikka et al., 2002). The second
most singleton- rich were the urban forest fragments in
both Denmark (24 species) and Finland (16 species).
The number of singleton species was high in urban for-
est fragments in all countries. This could be an effect of
the matrix - the forest becomes a fragment in the urban
setting, with extensive surrounding matrix areas, which
influences the faunal composition of the fragments as
well (Lövei et al., 2006). The diversity ordering indi-
cated that urbanisation did not decrease overall spider
diversity occurring in forest habitats, but this may be
only part of the answer when the effects of urbanisation
on diversity are examined (Horváth et al., 2012).
The activity density was higher in Denmark (0.88-
1.17 specimens/trap-week) and Finland (1.21 speci-
men/trap-week) than in Hungary (0.13 specimen/trap-
week). This ratio remains the same when we only con-
sider activity densities in the original forest habitat. We
believe the reason for this is the lack of sufficient hu-
midity in Hungary, where the climate during the grow-
ing season is often warm and dry (Fábián and Matyas-
ovszky, 2010), which is unfavourable to spiders, espe-
cially young ones, so there may be low development
success. A similar activity density relationship between
the northern countries and Hungary was observed in
ground beetles (Magura et al., 2010a).
Our method, pitfall trapping, has recognized limita-
tions. Ground-active species are easily trapped, but
web-builders are less so. Also, sampling effort was dif-
ferent in the two years (even though the same spatial
setup was used), and while the specific sampling regime
results in comparable patterns in ground beetles (Sapia
et al., 2006), comparisons between the two years should
be made cautiously.
In conclusion, a purely predatory group of ground-
active arthropods also demonstrated that urbanisation,
while taking away existence opportunities from some
species, also provides suitable conditions for others. It
should be examined, once suitable material is available,
whether urbanisation creates homogenization in spider
assemblages like found in some other groups (Olden
and Poff, 2004) or whether the lack of homogenization
found for ground beetles (Magura et al., 2010a) is also
valid for spiders? From the limited data available, it
seems that many rare (forest) species disappear as ur-
banisation progresses, but some of these species may
remain in the fragments depending on urban park condi-
tions. Our result showed that the suburban and urban
habitat type can play a role in the preservation of
ground-dwelling spider assemblages, because several
rare species occurred only in those sites.
Another unexplored question is whether assemblages
in more urbanised habitats are subject to larger year-to-
year compositional changes than less disturbed forest
habitats? We found some evidence that this may be the
case, at least under Danish conditions but current evi-
dence is far from sufficient.
Acknowledgements
We thank the Sorø Akademi Stilftelse for permission to
work on their land, Jens Thomsen and Anders Grube, J.
Jakobsen for support, H-B. Christiansen for technical
assistance, Cs. Szinetár and N. Scharff for help with
taxonomic identification, S. Toft and three anonymous
reviewers for valuable comments on the manuscript.
This study was partially funded by a Bolyai Fellowship
of the Hungarian Academy of Sciences (RH), the Dan-
ish International School for Biodiversity Studies (ISO-
BIS) (ZE), the Hungarian Scholarship Board (ZE), Aar-
hus University, Flakkebjerg Research Centre, and the
Domus Hungarica Foundation, Budapest, Hungary
(GLL). This is publication no. 10 of the Danglobe Pro-
ject. Author contributions: GL & EZ designed the study,
RH, EZ and GL did the field sampling and sample proc-
essing, RH identified the spiders, GL, EZ and RH ana-
lysed data and shared the writing tasks.
References
ALARUIKKA D. M., KOTZE D. J., MATVEINEN K., NIEMELÄ J.,
2002.- Carabid and spider assemblages along an urban to ru-
ral gradient in Southern Finland.- Journal of Insect Conser-
vation, 6: 195-206.
ANONYMOUS, 2010.- Denmark-Sjælland.- [online] URL:
http://www.citypopulation.de/php/denmark-sjalland.php.
(accessed July 20, 2013).
BANGSHOLT F., 1983.- The distribution and occurrence of tiger
beetles and ground beetles in Denmark from about 1830 to
1981.- Scandinavian Science Press, Copenhagen, Denmark.
BERGER W. H., PARKER F. L., 1970.- Diversity of planktonic Fo-
raminifera in deep sea sediments.- Science, 168: 1345-1347.
CHAO A., 1987.- Estimating the population size for capture-
recapture data with unequal catchability.- Biometrics, 43:
783-791.
CLERGEAU P., CROCI S., JOKIMAKI J., KAISANLAHTI-JOKIMAKI
M. L., DINETTI M., 2006.- Avifauna homogenisation by ur-
banisation: analysis at different European latitudes.- Bio-
logical Conservation, 127: 336-344.
ELEK Z., LÖVEI G. L., 2005.- Ground beetle (Coleoptera,
Carabidae) assemblages along an urbanisation gradient near
Sorø, Zealand, Denmark.- Entomologiske Meddelelser, 73:
17-23.
ELLENBERG H., 1974.- Zeigerwerte der Gefässpflanzen Mit-
teleuropas.- Scripta Geobotanica IX, Göttingen, Germany.
FÁBIÁN P. Á., MATYASOVSZKY I., 2010.- Analysis of climate
change in Hungary according to an extended Köppen classi-
fication system, 1971-2060.- Időjárás, 114: 251-261.
263
GARDEN J. G., MCALPINE C. A., POSSINGHAM H. P., 2010.-
Multi-scaled habitat considerations for conserving urban
biodiversity: native reptiles and small mammals in Brisbane,
Australia.- Landscape Ecology, 25: 1013-1028.
GILBERT O. L., 1989.- The ecology of urban habitats.- Chap-
man and Hall, New York, USA.
HABERL H., SCHULZ N. B., PLUTZAR C., ERB K. H., KRAUS-
MANN F., LOIBL W., MOSER D., SAUBERER N., WEISZ H.,
ZECHMEISTER H. G., ZULKA P., 2007.- Quantifying and map-
ping the human appropriation of net primary production in
earth's terrestrial ecosystems.- Proceedings of the National
Academy of Sciences of the United States of America, 104:
12942-12947.
HAWKINS B. A., ALBUQUERQUE F. S., ARAUJO M. B., BECK J.,
BINI L. M., CABRERO-SANUDO F. J., CASTRO-PARGA I., DINIZ
J. A. F., FERRER-CASTAN D., FIELD R., GOMEZ J. F., HORTAL
J., KERR J. T., KITCHING I. J., LEON-CORTES J. L., LOBO J. M.,
MONTOYA D., MORENO J. C., OLALLA-TARRAGA M. A.,
PAUSAS J. G., QIAN H., RAHBEK C., RODRIGUEZ M. A.,
SANDERS N. J., WILLIAMS P., 2007.- A global evaluation of
metabolic theory as an explanation for terrestrial species
richness gradients.- Ecology, 88: 1877-1888.
HEIMER S., NENTWIG W., 1991.- Spinnen Mitteleuropas.- Ver-
lag Paul Parey, Berlin and Hamburg, Germany.
HORVÁTH R., SZINETÁR C., 2007.- The effect of urbanisation
on ground-living spiders in lowland forest pathces.- Állat-
tani Közlemények, 92:11-25. (in Hungarian)
HORVÁTH R., MAGURA T., TÓTHMÉRÉSZ B., 2012.- Ignoring
ecological demands masks the real effect of urbanization: a
case study of ground-dwelling spiders along a rural-urban
gradient in a lowland forest in Hungary.- Ecological Re-
search, 27: 1069-1077.
KOPONEN S., 2008.- Checklist of spiders in Finland (Araneae).-
Zoological Museum, University of Turku. [online] URL:
http://users.utu.fi/sepkopo/checklist_of_spiders_in_Finland.htm.
(accessed July 20, 2013).
LANGE M., GOSSNER M. M., WEISSER W. W., 2011.- Effect of
pitfall trap type and diameter on vertebrate by-catches and
ground beetle (Coleoptera: Carabidae) and spider (Araneae)
sampling.- Methods in Ecology and Evolution, 2: 185-190.
LOKSA I., 1969.- Pókok I. - Araneae I.- Akadémiai Kiadó, Bu-
dapest, Hungary.
LOKSA I., 1972.- Pókok II. - Araneae II.- Akadémiai Kiadó,
Budapest, Hungary.
LÖVEI G. L., 2005.- Generalised entropy indices have a long
history in ecology - a comment.- Community Ecology, 6:
245-247.
LÖVEI G. L., SUNDERLAND K. D., 1996.- The ecology and be-
havior of ground beetles.- Annual Review of Entomology,
41: 231-256.
LÖVEI G. L., MAGURA T., TÓTHMÉRÉSZ B., KÖDÖBÖCZ V.,
2006.- The influence of matrix and edges on species rich-
ness patterns of ground beetles (Coleoptera : Carabidae) in
habitat islands.- Global Ecology and Biogeography, 15:
283-289.
LUNDHOLM J. T., RICHARDSON P. J., 2010.- Habitat analogues
for reconciliation ecology in urban and industrial environ-
ments.- Journal of Applied Ecology, 47: 966-975.
MAGURA T., LÖVEI G.L., TÓTHMÉRÉSZ B., 2010a. - Does ur-
banization decrease diversity in ground beetle (Carabidae) as-
semblages? - Global Ecology and Biogeography 19: 16-26.
MAGURA T., HORVÁTH R., TÓTHMÉRÉSZ B., 2010b.- Effects of
urbanization on ground-dwelling spiders in forest patches, in
Hungary.- Landscape Ecology, 25: 621-629.
MEGLÉCZ E., NEVE G., PECSENYE K., VARGA Z., 1999.- Ge-
netic variations in space and time in Parnassius mnemosyne
(L.) (Lepidoptera) populations in north-east Hungary: impli-
cations for conservation.- Biological Conservation, 89: 251-
259.
NIEMELÄ J., KOTZE D. J., VENN S., PENEV L., STOYANOV I.,
SPENCE J. R., HARTLEY D., DE OCA E. M., 2002.- Carabid
beetle assemblages (Coleoptera, Carabidae) across urban-
rural gradients: an international comparison.- Landscape
Ecology, 17: 387-401.
OKSANEN J., BLANCHET F. G., KINDT R., LEGENDRE P., O'HARA
R. B., SIMPSON G. L., SOLYMOS P., STEVENS M. H. M., WAG-
NER H., 2011.- Vegan: community ecology package. R pack-
age version 1.17-10.- [online] URL: http://CRAN.R-
project.org/package=vegan. (accessed July 20, 2013).
OLDEN J. D., POFF N. L., 2004.- Ecological processes driving
biotic homogenization: testing a mechanistic model using
fish faunas.- Ecology, 85: 1867-1875.
PATIL G. P., TAILLIE C., 1982.- Diversity as a concept and its
measurement.- Journal of the American Statistical Associa-
tion, 77: 548-567.
PARLOW E., 2011.- Urban climate, pp. 31-44. In: Urban ecology
(NIEMELÄ J., Ed.).- Oxford University Press, Oxford, UK.
PLATNICK N. I., 2011.- The world spider catalog, version
11.5.- American Museum of Natural History, New York.
[online] URL:
http://research.amnh.org/entomology/spiders/catalog/INTRO1.html.
(accessed July 20, 2013).
PROVENCHER L., RIECHERT S. E., 1991.- Short-term effects of
hunger conditioning on spider behavior, predation, and gain
of weight.- Oikos, 62: 160-166.
PYWELL R. F., JAMES K. L., HERBERT I., MEEK W. R., CARVELL
C., BELL D., SPARKS T. H., 2005.- Determinants of overwin-
tering habitat quality for beetles and spiders on arable farm-
land.- Biological Conservation, 123: 79-90.
R DEVELOPMENT CORE TEAM, 2011.- R: a language and envi-
ronment for statistical computing. Version 2.13.- R Founda-
tion for Statistical Computing, Vienna, Austria [online]
URL: http://www.R-project.org/ (accessed July 20, 2013).
RENKONEN O., 1938.- Statistisch-ökologische Untersuchungen
über die terrestrische Kaferwelt der finnischen
Bruchmoore.- Annales Zoologici Societatis Zooligicae
Botanicae Fennici, 6: 1-226.
RIECHERT S. E., LOCKLEY T., 1984.- Spiders as biological-
control agents.- Annual Review of Entomology, 29: 299-320.
ROBERTS M. J., 1995.- Spiders of Britain and Northern
Europe.- Harper Collins Publishers, London, UK.
SAMU F., SZINETÁR C., 1999.- Bibliographic check list of the
Hungarian spider fauna.- Bulletin of the British Arach-
nological Society, 11: 161-184.
SAETERSDAL M., GJERDE I., BLOM H. H., IHLEN P. G.,
MYRSETH E. W., POMMERESCHE R., SKARTVEIT J., SOLHOY
T., AAS O., 2004.- Vascular plants as a surrogate species
group in complementary site selection for bryophytes, mac-
rolichens, spiders, carabids, staphylinids, snails, and wood
living polypore fungi in a northern forest.- Biological Con-
servation, 115: 21-31.
SAPIA M., LÖVEI G. L., ELEK Z., 2006.- Effects of varying
sampling effort on the observed diversity of carabid (Col-
eoptera: Carabidae) assemblages in the Danglobe Project,
Denmark.- Entomologica Fennica, 17: 345-350.
SCHARFF N., GUDIK-SÖRENSEN O., 2009.- Checklist of Danish
spiders (Araneae).- [online] URL:
http://www.zmuc.dk/entoweb/arachnology/dkchecklist.htm.
(accessed July 20, 2013).
SHOCHAT E., LERMAN S. B.; ANDERIES J. M.; WARREN P. S.,
FAETH STANLEY H., NILON C. H., 2010.- Invasion, competi-
tion, and biodiversity loss in urban ecosystems.- Bioscience,
60: 199-208.
SOUTHWOOD T. R. E., HENDERSON, P. A., 2000.- Ecological
Methods. 3rd edition.- Blackwell, Oxford, UK.
STAGOLL K., MANNING A. D., KNIGHT E., FISCHE J., LINDEN-
MAYER D. B., 2010.- Using bird-habitat relationships to inform
urban planning.- Landscape and Urban Planning, 98: 13-25.
264
TOFT S., LÖVEI G. L., 2002.- The epigeic spider fauna of sin-
gle-row hedges in a Danish agricultural landscape, pp. 237-
242. In: European arachnology 2000 (TOFT S., SCHARFF N.,
Eds).- Aarhus University Press, Aarhus, Denmark.
TÓTHMÉRÉSZ B., 1993.- DivOrd 1.50: a program for diversity
ordering.- Tiscia, 27: 33-44.
TÓTHMÉRÉSZ B., 1998.- On the characterization of scale-
dependent diversity.- Abstracta Botánica, 22: 149-156.
TROLLOPE S. T., WHITE J. G., COOKE R., 2009.- The response
of ground and bark foraging insectivorous birds across an
urban-forest gradient.- Landscape and Urban Planning, 93:
142-150.
UNDP (UNITED NATIONS DEVELOPMENT PROGRAMME), 2000.-
World resources 2000-2001: people and ecosystems: the
fraying web of life.- Elsevier, Amsterdam, The Netherlands.
WILSON E. O., 1999.- The diversity of life.- W.W. Norton &
Company, New York, USA.
WISE D. H., 1993.- Spiders in ecological webs.- Cambridge
University Press, Cambridge, New York, USA.
Authors’ addresses: Gábor L. LÖVEI (corresponding au-
thor: [email protected]), Department of Agroecology,
Aarhus University, Flakkebjerg Research Centre, Forsøgsvej 1,
DK-4200 Slagelse, Denmark; Roland HORVÁTH, Department
of Ecology, University of Debrecen, P.O. Box 71, H-4010
Debrecen, Hungary; Zoltán ELEK, MTA-ELTE-MTM Ecology
Research Group, Biological Institute, Eötvös Loránd Univer-
sity, Pázmány Péter sétány 1C, H-1117 Budapest, Hungary.
Received May 31, 2014. Accepted September 19, 2014.