Embed Size (px)
Citation preview
San Rafael, California
Comprehensive Annual Financial Report
Fiscal Years Ended June 30, 2017 and 2016
Las Gallinas Valley Sanitary District
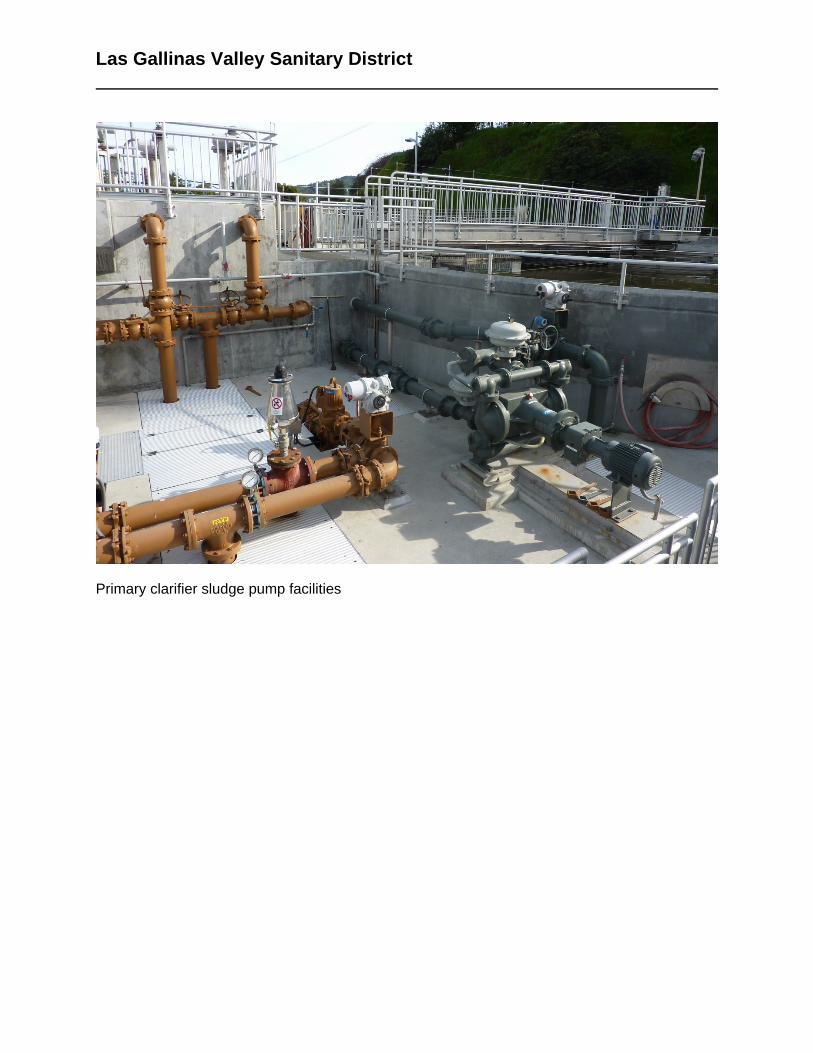
Primary clarifier sludge pump facilities
San Rafael, California
Comprehensive Annual Financial Report
Fiscal Years Ended June 30, 2017 and 2016
Mark R. Williams, General Manager
Prepared by:
Susan M. McGuire, CPA – Administrative Services Manager
Las Gallinas Valley Sanitary District
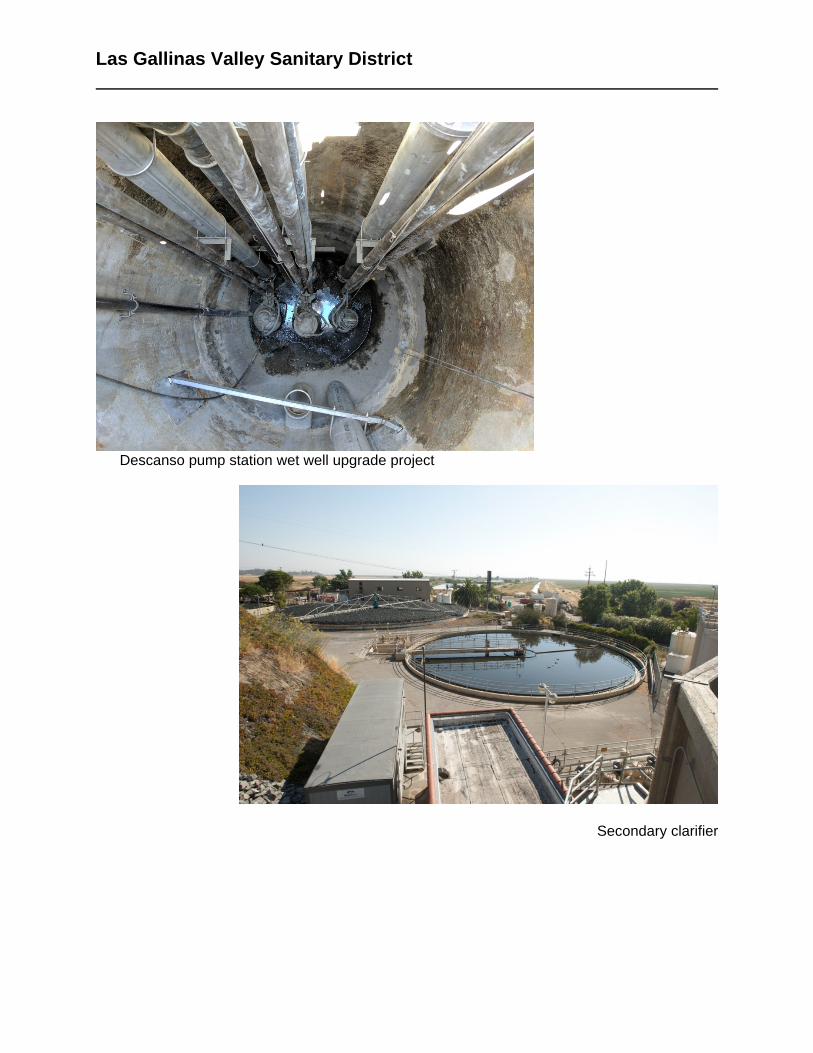
Descanso pump station wet well upgrade project
Secondary clarifier
Las Gallinas Valley Sanitary District
Table of Contents
Page Introductory Section
Transmittal Letter ................................................................................................................................. i-vi
GFOA Certificate of Achievement ........................................................................................................ vii
Mission Statement ............................................................................................................................... viii
Organizational Chart .............................................................................................................................. ix
Directory of Officials .............................................................................................................................. x
District Service Area .............................................................................................................................. xi
Financial Section
Independent Auditors’ Report ............................................................................................................. 1-2
Management’s Discussion and Analysis .......................................................................................... 3-13
Basic Financial Statements:
Statements of Net Position ...................................................................................................... 14-15
Statements of Revenues, Expenses and Changes in Net Position ............................................... 16
Statements of Cash Flows ....................................................................................................... 17-18
Notes to Financial Statements ................................................................................................. 19-55
Required Supplementary Information:
Schedule of District’s Proportionate Share of the Net Pension Liability .......................................... 56
Schedule of Contributions ................................................................................................................. 56
Other Post-Employment Benefits Schedule of Funding Progress – CERBT .................................... 57
Supplementary Information:
Budgetary Comparison Schedule ............................................................................. ………… 58-59
Note to Budgetary Comparison Schedule...................................................................................... 60
Glossary of Acronyms .............................................................................................................. 61-63
Las Gallinas Valley Sanitary District
Table of Contents (continued)
Page Statistical Section
Introduction to the Statistical Section… ................................................................................................ 64
Statements of Net Position .................................................................................................................... 65
Statements of Revenues, Expenses and Changes in Net Position ................................................. 66-67
Sewer Service Charge Revenue ........................................................................................................... 68
Sewer Service Rates Per Eligible Dwelling Unit ................................................................................... 69
Principal Revenue Payers ..................................................................................................................... 70
Summary of Sewer Customers by Class .............................................................................................. 71
Revenues, Expenditures, Debt Service Coverage and Cash Flows From Operations ................... 72-73
Outstanding Debt Per Connection ........................................................................................................ 74
Other Post-Employment Benefits Funding Status and Covered Lives ................................................. 75
Demographic and Economic Statistics ................................................................................................... 76
Principal Employers in Marin County .................................................................................................... 77
Recycled Water Production ................................................................................................................... 78
Daily Average Influent Flow .................................................................................................................. 79
Private Sewer Lateral Assistance Program ........................................................................................... 80
Collection System Services ................................................................................................................... 81
Full-Time Equivalent Employees by Function ....................................................................................... 82
Las Gallinas Valley Sanitary District
INTRODUCTORY SECTION
This page left intentionally blank.
DISTRICT BOARD
Megan Clark
Rabi Elias
Russ Greenfield
Craig K. Murray
Judy Schriebman
DISTRICT ADMINISTRATION
Mark R. Williams, General Manager
Michael Cortez, District Engineer
Mel Liebmann Plant Manager
Susan McGuire, Administrative Services Manager Greg Pease, Collection System/Safety Manager
300 Smith Ranch Road • San Rafael, CA 94903 • 415.472-1734 • Fax 415.499-7715 • WWW.LGVSD.ORG
October 27, 2017
To the Ratepayers and Honorable Board of Directors of Las Gallinas Valley Sanitary District San Rafael, California It is our pleasure to submit this Comprehensive Annual Financial Report (CAFR) of the Las Gallinas Valley Sanitary District (the District) for the fiscal year ended June 30, 2017. This report was prepared by the District staff that collected and analyzed the financial statements and other information presented herein.
This CAFR was prepared by District staff in conformance with the principles and standards for financial reporting set forth by the Governmental Accounting Standards Board (GASB) and Generally Accepted Accounting Principles (GAAP). Recommended guidelines by the Government Finance Officers Association (GFOA) of the United States and Canada were also followed.
California law requires that every local government publish a complete set of audited financial statements. This report is published to fulfill that requirement for the fiscal year ended June 30, 2017.
The management of the District assumes full responsibility for the completeness and reliability of the information contained in this report, based upon a comprehensive system of internal controls that is established for this purpose. Because the cost of internal control should not exceed anticipated benefits, the objective is to provide reasonable, rather than absolute, assurance that the financial statements are free of any material misstatements.
The District’s basic financial statements have been audited by Cropper Accountancy Corporation, a registered public accounting firm. The goal of the independent audit was to provide reasonable assurance that the financial statements of the District for the fiscal year ended June 30, 2017 are fairly presented in conformity with GAAP, and are free of material misstatements. The independent audit involved examining, on a test basis, evidence supporting the amounts and disclosures in the basic financial statements, assessing the accounting principles used and significant estimates made by management, and evaluating the overall financial statements presentation. The independent auditors have issued an unqualified (“clean”) opinion on the Las Gallinas Valley Sanitary District’s financial statements for the fiscal year ended June 30, 2017. Their audit report is presented as the first component of the financial section of this report.

ii
The CAFR represents the culmination of all budgeting and accounting activities engaged in by management during the fiscal year. GAAP requires that management provide a narrative introduction, overview, and analysis to accompany the basic financial statements in the form of Management’s Discussion and Analysis (MD&A) which is presented after the independent auditors’ report. This letter of transmittal and introduction is designed to complement the MD&A and should be read in conjunction with it.
FINANCIAL CONTROLS AND ACCOUNTING SYSTEMS
Internal Controls
To ensure that accounting data is compiled and properly recorded, and to permit the preparation of financial statements in accordance with generally accepted accounting principles, the management staff of the District is responsible for establishing and maintaining an accounting system and internal controls structure. These controls are designed to ensure that the assets of the District are adequately protected from loss, theft, unauthorized use or disposition, or other misuse. The internal controls structure is designed to provide reasonable, but not absolute, assurance that this objective is met while recognizing that: (1) the cost of the controls should not exceed the benefits likely to be derived; and (2) the valuation of costs and benefits requires estimates and judgment by management. We believe that the District’s internal accounting controls adequately safeguard its assets and provide reasonable assurance that financial transactions are recorded properly and are free of any material misstatements.
Budgetary Controls
The District is not required by statute to adopt a budget; however, in its commitment to maintain fiscal responsibility, the District adopts an annual budget prior to June 30th each year. In preparation for drafting a budget, management staff meets with the District’s Board of Directors (the Board) to update the Strategic Plan to determine the strategic goals and visions for the upcoming year. The budget outlines and reflects the major elements of the upcoming fiscal year operating and capital plans, from which management allocates funds that are necessary for specific departmental activities and capital projects. In June 2015, the Board adopted a five year capital improvement budget for 2016 through 2020, which includes a significant upgrade to the wastewater treatment plant and expansion of the recycled water treatment facility. Management integrates these priorities into the annual budget. Budgetary control is maintained at the detailed line item level. The General Manager may approve expenditures in excess of budgeted amounts up to $15,000; items in excess of this must be approved by the Board.
Accounting System
Las Gallinas Valley Sanitary District is an independent special district. The District’s accounting structure, insofar as practical and in accordance with GAAP, complies with the Uniform System of Accounts for Waste Disposal Districts provided by the California State Controller’s office.
The District reports its activities as an Enterprise Fund under the broad category of funds called proprietary funds. The District uses the full accrual basis of accounting. The District tracks expenditures by department, with each department delineated by function and specific activity, in order to provide management and the Board with better cost control measures. At the end of
iii
each fiscal year, these costs are combined to arrive at the financial position and results of operations reflected in the District’s basic financial statements.
HISTORY AND PROFILE OF THE DISTRICT
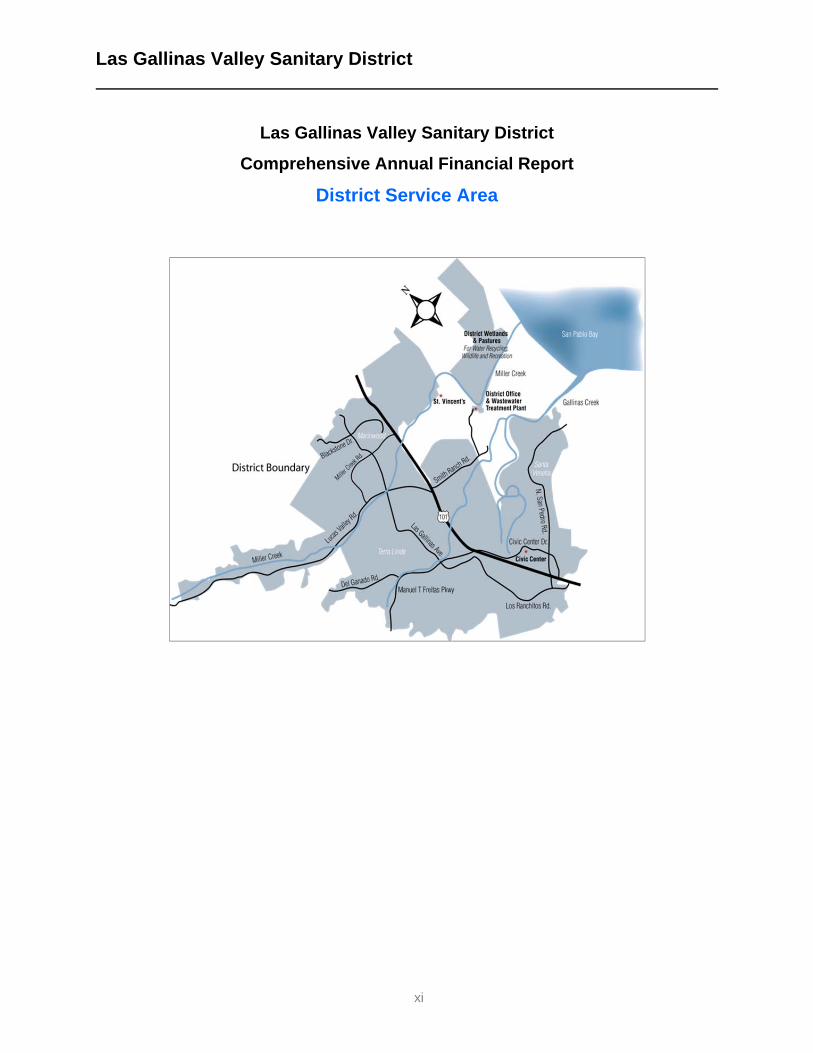
The District was established on April 6, 1954 pursuant to the California Health and Safety Code, Division 6 – Sanitary District Act of 1923. It is located approximately two miles northeast of the City of San Rafael and 20 miles north of San Francisco. It covers an area of about sixteen square miles in the northern part of the City of San Rafael and surrounding unincorporated areas in Marin County, California, including the communities of Lucas Valley, Marinwood, Santa Venetia and Terra Linda. The District’s boundaries are Hamilton Field (a former air force base) to the north, San Pablo Bay to the east, and central San Rafael to the south. The District serves a population of approximately 30,000 people. The District is primarily residential and built out, resulting in a fairly stable customer base. As of July 1, 2016, the connections are 97.5% residential (12,947 units) and 2.6% commercial/industrial (351 units); however the revenue from these connections is 79.63% residential and 20.37% commercial.
Financing Activities
The District has been planning a multi-year, multi-million dollar Treatment Plant Upgrade, Recycled Water Treatment Plant Expansion and Operations and Control Center construction project for several years. These projects will upgrade the treatment plant to meet more stringent regulatory requirements; allow the District to fully serve Marin Municipal Water District’s recycled water customers; and replace a 1955 operations center to meet 21st century and beyond operational needs. To finance these projects, the District issued $41 million in Standard and Poor’s AAA rated bonds in April 2017. The bonds are to be repaid over 25 years beginning in October 2017 and have a true interest cost to maturity of 3.37%. Due to the District’s exceptional credit rating, the issue resulted in a premium being paid by the purchaser of $3,023,718 so the principal amount of the bonds was reduced to $38,365,000.
Sewage Collection
The District operates a sanitary sewer collection system comprised of approximately 105 miles of gravity sewer lines, 6.72 miles of force mains, and 28 pump stations. There are 2,985 manholes and approximately 52.5 miles of privately owned laterals.
The District regularly performs smoke testing of the District to detect leaks in sewer mains and laterals. It is a process whereby smoke is blown into the sewer mains, lower and upper laterals, to determine where there may be cracked pipes or storm water cross connections. This process helps to identify where there may be Infiltration and Inflow (I&I) into the sewage collection system. I&I is a major concern for wastewater treatment plants since large storms may produce flows that overwhelm the capacity of the sewage collection system and possibly the plant, resulting in sewage spills, plant violations, overflows and fines.
The District continuously televises its sewer mains; the process requires four years to televise all of the system. Televising these lines allows District staff to identify future repair and replacement projects, as well as monitor the integrity of the system.
iv
Sewage Treatment
The District operates a sewage treatment plant with a permitted dry weather average capacity of 2.92 million gallons per day (MGD).
The District treated an average daily flow of 3.32 MGD of sewage per day in 2017. The District’s treatment plant uses primary treatment to separate the solids from the
wastewater; trickling filters and deep bed filters to provide secondary treatment. Treated effluent is disposed of through discharge pipes into Miller Creek which flows to San Pablo Bay during discharge season, November through May. Discharge coincides with wet weather when treated effluent can be diluted by higher levels of bay water due to rain.
All readily settable solids and grit are removed from the wastewater stream; grit is then disposed of in a landfill. The solids are treated by gravity thickening and anaerobic digestion, and then pumped to one or more of three storage ponds, where they are typically retained for one year prior to surface disposal. The treatment plant produced 420 dry tons of biosolids during the calendar year 2016.
Reuse of Treated Wastewater
The District is producing recycled water year round to meet increasing demand during the dry months of summer and fall. In the past, recycled water was predominately used during the summer months, which aligned with the District’s non discharge period of June through October.
The District has a water reclamation project on 385 acres of diked bay lands located to the northeast of the treatment plant. This project includes a 20 acre wildlife marsh pond, 40 acres of storage ponds, 200 acres of irrigated pasture, and 3.5 miles of public trails which are part of the San Francisco Bay Trail. During 2017, 29.3 million gallons were diverted to the District’s water reclamation project; this is substantially less than the prior year amount of 94.2 million gallons due to the exceptionally rainy fall and late spring rains.
The District delivers effluent to Marin Municipal Water District (MMWD), which further treats it so that it can be used for irrigation of landscapes, including golf courses and playing/ recreation fields, dual plumbing, toilet flushing, cooling water uses, and car washes within the District’s boundaries. During 2017, 143.8 million gallons were delivered to MMWD.
During 2017, the District reached an agreement with MMWD to expand the District’s recycled water treatment plant to provide tertiary treated wastewater which can then be distributed to MMWD’s customers. MMWD will decommission its existing plant which is located on the District’s site. This site is needed by the District for the treatment plant upgrade. As part of the agreement, MMWD made a capital contribution towards the existing facility and will continue to make payments towards outstanding debt which was issued to build the existing facility and for the expansion. The expansion is expected to begin construction in the fall of 2017 and be completed by September 2018.
The District’s recycled water treatment facility, online since September 2012, has a capacity of 0.7 mgd with redundant systems to produce up to 1.4 mgd. The District is planning an expansion of the facility to provide for an additional 4 mgd of capacity. The facility takes the plant effluent not utilized by MMWD and treats it to recycled water standards so that it can
v
be distributed by North Marin Water District (NMWD). The District produced 45.5 million gallons for NMWD during 2017.
Lab and Public Outreach
The District operates its own lab which collects samples, completes analysis, and performs other testing to comply with the plant discharge permit issued by the State Water Resources Control Board.
Central Marin Sanitation Agency and District lab staff members manage the source control program. This includes a Fats Oils and Grease (FOG) Program that is designed to prevent customers from discharging substances that are harmful to the sewage treatment process or that may cause clogs to sewer mains and pump stations.
Lab staff members participate in the Marin County Sanitation Agencies Public Education Program. This program allows participating agencies to combine resources and have a unified message to educate the public about the proper disposal of and to collect pharmaceuticals, mercury, batteries and other household hazardous waste in the County. They participate in programs with school children, the Marin County Fair and various farmers’ markets and festivals. The participating agencies won the Redwood Empire Community Engagements and Outreach Award Large Budget from the California Water Environment Association for 2016.
The District offers tours of the plant treatment works and enhanced wetlands upon request from schools, community groups and other members of the public.
The District produces a newsletter twice a year to educate the public about the sewer collection system, treatment plant and their sewer laterals. Staff has noted an increase in knowledge by homeowners regarding maintaining their sewer laterals.
The District has a website at www.lgvsd.org where it posts current developments, public education topics and information about what is happening at the Board meetings, the plant and in the District.
The District was awarded the District Transparency Certificate of Excellence by the Special District Leadership Foundation during July 2015 and 2017 in recognition of its outstanding efforts to promote transparency and good governance.
Solid Waste (Garbage) Services and Recycling
The District manages the refuse hauling service for the unincorporated areas in its District. The franchise has been awarded to Marin Sanitary Service which provides curbside recycling, solid waste, yard waste and food scraps hauling, and safe hazardous waste disposal services that are helping achieve Marin County’s goal of zero waste. ECONOMIC CONDITIONS AND OUTLOOK
The District is comprised primarily of residential units with commercial and some light industrial areas. It is substantially built out with in-fill developments in pockets of undeveloped land and redevelopment of commercial areas that were built over twenty years ago. The District does not expect significant new, customers in the near future. A capital facilities charge study was performed during 2015. The study reviewed the capital facilities plan developed by staff and the
vi
Board during 2015, which will be undertaken during the upcoming five years. The capital facilities charge is $5,761 effective July 1, 2016 and will be adjusted by the Engineering News Record Construction Cost Index for San Francisco each July.
The Board adopted a five year rate review and capital improvement plan in June 2015, which provides for an annual sewer user charge rate of $732 effective July 1, 2015 up to $927 as of July 1, 2019. The adopted rate as of July 1, 2016 was $835. This rate, when combined with average property taxes received by the District, is below the average for neighboring agencies in Marin County. Each year, the Board reviews the operating and capital needs of the District to determine the revenue requirements in setting the upcoming rate.
Compared to neighboring jurisdictions, the District’s customers in the unincorporated area enjoy one of the lowest garbage and recycling rates. As of January 1, 2017, customers pay a monthly service fee of $26.62 for a 20-gallon cart and $31.31 for a 32-gallon cart. This is below the Marin County average of $36.32 per month for a 32-gallon cart.
AWARDS AND ACKNOWLEDGMENTS
The Government Finance Officers Association of the United States and Canada (GFOA) awarded a Certificate of Achievement for Excellence in Financial Reporting to Las Gallinas Valley Sanitary District for its CAFR for the year ended June 30, 2016. In order to be awarded a Certificate of Achievement, a governmental entity must publish an easily readable and efficiently organized CAFR. This report must satisfy both GAAP and applicable legal requirements.
A Certificate of Achievement is valid for a period of one year only. We believe that our current CAFR continues to meet the Certificate of Achievement Program’s requirements and we are submitting it to the GFOA to determine its eligibility for another certificate.
This CAFR is the culmination of the hard work and dedication of many District employees and the audit team under the direction of John Cropper, CPA of the accounting firm Cropper Accountancy Corporation. Las Gallinas Valley Sanitary District staff would like to acknowledge the support of the Board for its continuing direction and oversight in providing value to the community of San Rafael.
Mark R. Williams Susan McGuire, CPA General Manager Administrative Services Manager
viii
Las Gallinas Valley Sanitary District
Comprehensive Annual Financial Report
Mission Statement
Our Mission
The Mission of the Las Gallinas Valley Sanitary District is to protect public health and our environment, providing effective wastewater collection, treatment, and recycling services.
Vision
Recognizing that sanitation and wastewater treatment is vital to protecting the public health, the District will:
manage our treatment and collection infrastructure in a planned and sustainable way;
strive toward beneficial recycling of wastewater, biosolids and other resources using safe and effective processes and systems to achieve our zero waste vision;
collaborate with neighboring agencies to achieve efficiencies for the public;
cooperate with stakeholders to leverage opportunities for protecting the bay and regional water resources for the people we serve;
maintain a safe, high quality workplace to promote a sustainable, motivated, long-term and cohesive workforce;
increase public participation, acceptance and understanding of what we do;
responsibly manage the refuse franchise;
maintain our zero spill goal;
consider climate change, sea level rise and flooding when developing and designing new projects;
reduce our impact on natural resources;
optimize and promote the use of recycled water; and
collaborate with public and private parties to improve watersheds within the District’s boundaries
Our Core Values
Does it reflect our commitment to the public health and to the environment?
Will it support high quality customer service and public outreach and education?
Does it enhance our infrastructure, facility maintenance and system reliability?
Does it seek opportunities to reuse resources where possible?
Will it support best workforce practices?
Does it establish equitable, reasonable, and necessary rates by responsible use of the public’s funds now and in the future?
Does it build on and leverage our network of Partners and regulatory authorities?
Will it support our ability to govern as a Board team with honesty, transparency, and respect?
Does it support domestically produced products where possible?
Will it support our commitment to practical innovative methods and resource recovery?

ix
Las Gallinas Valley Sanitary District
Comprehensive Annual Financial Report
Organizational Chart
x
Las Gallinas Valley Sanitary District
Comprehensive Annual Financial Report
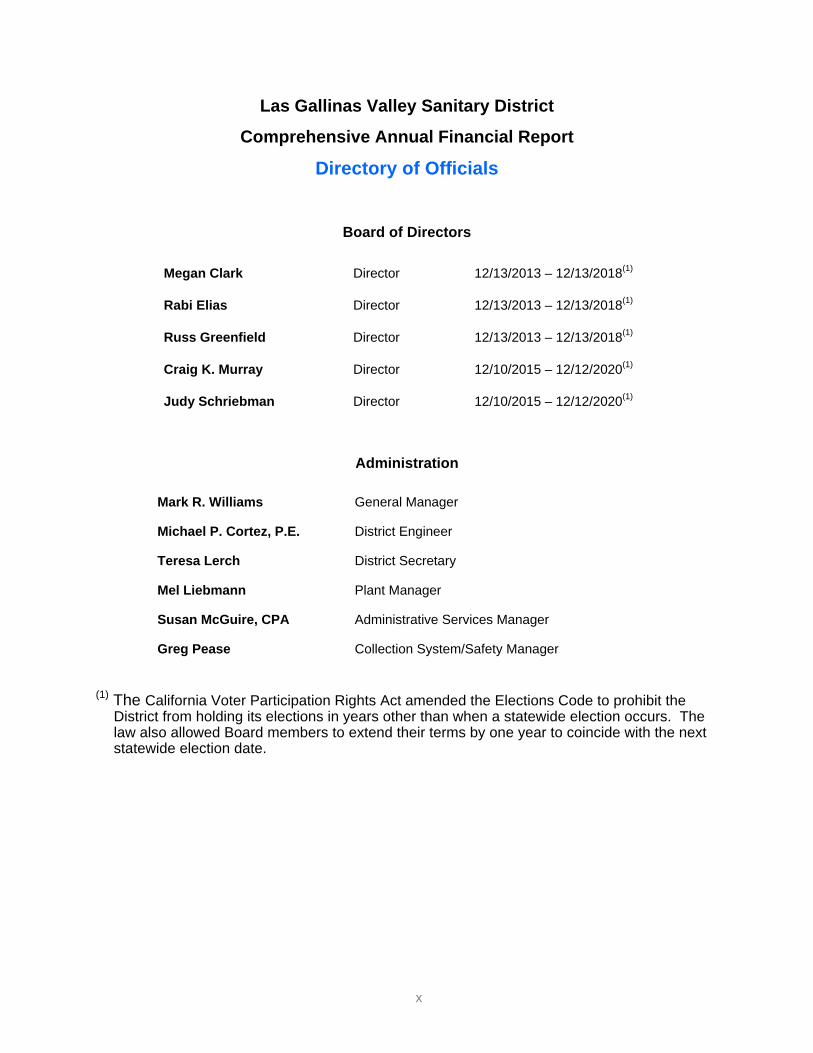
Directory of Officials
Board of Directors
Megan Clark Director 12/13/2013 – 12/13/2018(1)
Rabi Elias Director 12/13/2013 – 12/13/2018(1)
Russ Greenfield Director 12/13/2013 – 12/13/2018(1)
Craig K. Murray Director 12/10/2015 – 12/12/2020(1)
Judy Schriebman Director 12/10/2015 – 12/12/2020(1)
Administration
Mark R. Williams General Manager
Michael P. Cortez, P.E. District Engineer
Teresa Lerch District Secretary
Mel Liebmann Plant Manager
Susan McGuire, CPA Administrative Services Manager
Greg Pease Collection System/Safety Manager
(1) The California Voter Participation Rights Act amended the Elections Code to prohibit the District from holding its elections in years other than when a statewide election occurs. The law also allowed Board members to extend their terms by one year to coincide with the next statewide election date.
Las Gallinas Valley Sanitary District
xi
Las Gallinas Valley Sanitary District
Comprehensive Annual Financial Report
District Service Area
Las Gallinas Valley Sanitary District
Walkers in reclamation
Las Gallinas Valley Sanitary District
FINANCIAL SECTION
Las Gallinas Valley Sanitary District
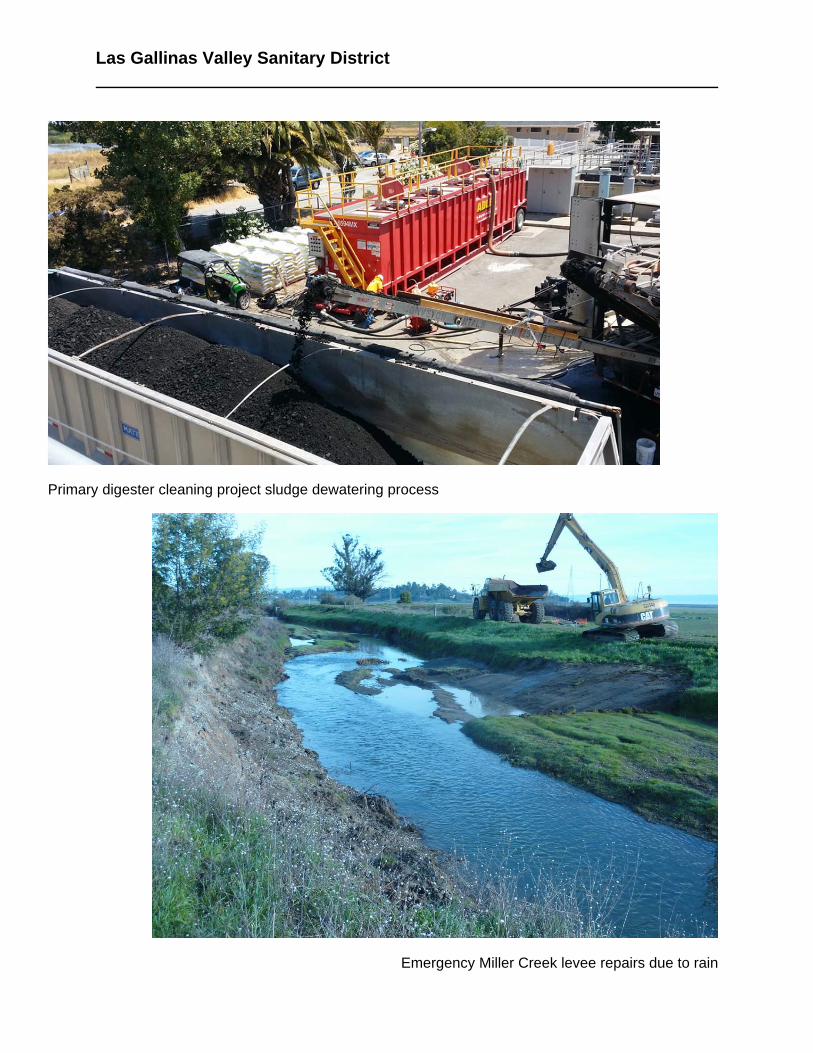
Primary digester cleaning project sludge dewatering process
Emergency Miller Creek levee repairs due to rain
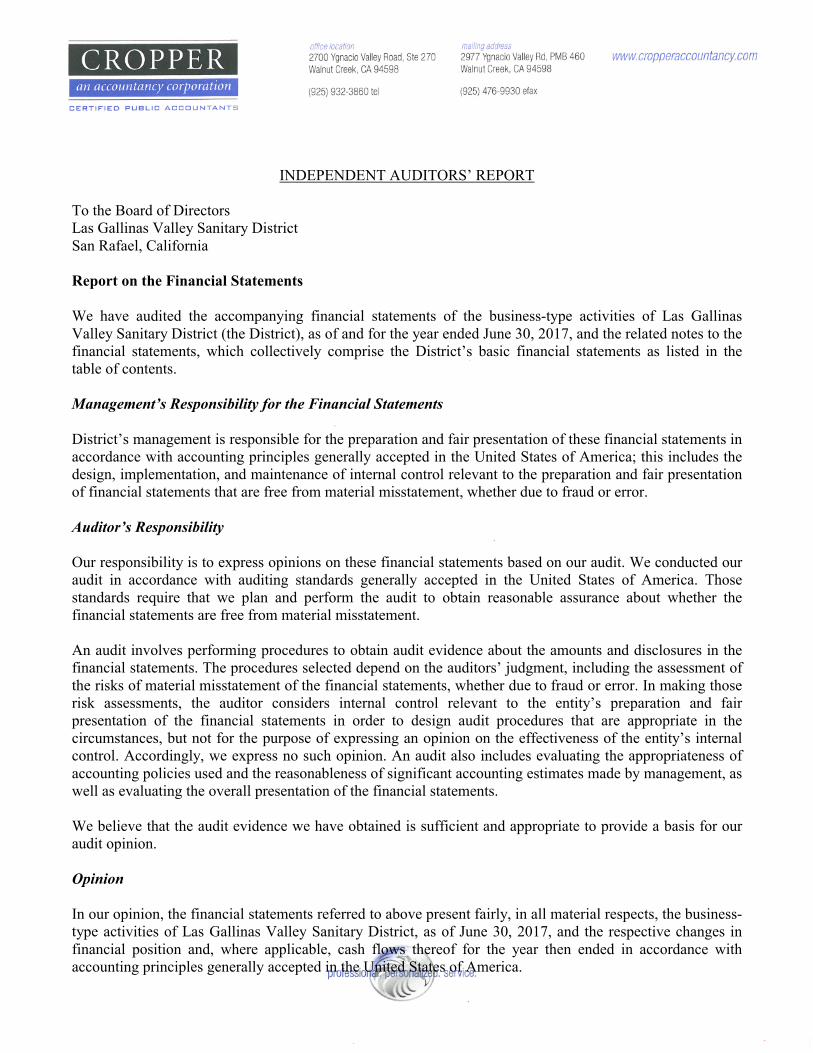
INDEPENDENT AUDITORS’ REPORT
To the Board of DirectorsLas Gallinas Valley Sanitary DistrictSan Rafael, California
Report on the Financial Statements
We have audited the accompanying financial statements of the business-type activities of Las Gallinas Valley Sanitary District (the District), as of and for the year ended June 30, 2017, and the related notes to the financial statements, which collectively comprise the District’s basic financial statements as listed in the table of contents.
Management’s Responsibility for the Financial Statements
District’s management is responsible for the preparation and fair presentation of these financial statements in accordance with accounting principles generally accepted in the United States of America; this includes the design, implementation, and maintenance of internal control relevant to the preparation and fair presentation of financial statements that are free from material misstatement, whether due to fraud or error.
Auditor’s Responsibility
Our responsibility is to express opinions on these financial statements based on our audit. We conducted our audit in accordance with auditing standards generally accepted in the United States of America. Those standards require that we plan and perform the audit to obtain reasonable assurance about whether the financial statements are free from material misstatement.
An audit involves performing procedures to obtain audit evidence about the amounts and disclosures in the financial statements. The procedures selected depend on the auditors’ judgment, including the assessment of the risks of material misstatement of the financial statements, whether due to fraud or error. In making those risk assessments, the auditor considers internal control relevant to the entity’s preparation and fair presentation of the financial statements in order to design audit procedures that are appropriate in the circumstances, but not for the purpose of expressing an opinion on the effectiveness of the entity’s internal control. Accordingly, we express no such opinion. An audit also includes evaluating the appropriateness of accounting policies used and the reasonableness of significant accounting estimates made by management, as well as evaluating the overall presentation of the financial statements.
We believe that the audit evidence we have obtained is sufficient and appropriate to provide a basis for our audit opinion.
Opinion
In our opinion, the financial statements referred to above present fairly, in all material respects, the business-type activities of Las Gallinas Valley Sanitary District, as of June 30, 2017, and the respective changes in financial position and, where applicable, cash flows thereof for the year then ended in accordance with accounting principles generally accepted in the United States of America.
Las Gallinas Valley Sanitary District
MANAGEMENT’S DISCUSSION AND ANALYSIS
Las Gallinas Valley Sanitary District
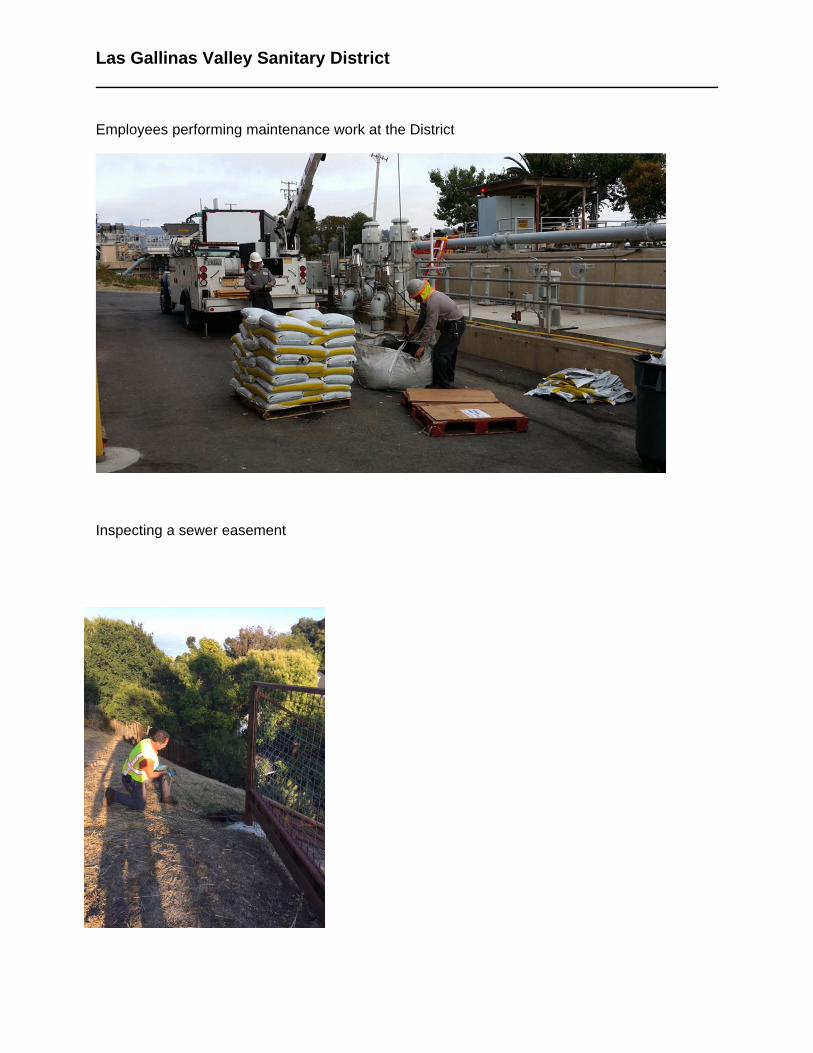
Employees performing maintenance work at the District
Inspecting a sewer easement
Las Gallinas Valley Sanitary District
Management’s Discussion and Analysis
Fiscal Years Ended June 30, 2017 and 2016
3
The following discussion and analysis of the Las Gallinas Valley Sanitary District’s (the District) financial performance provides an overview and analysis of the District’s financial activities for the fiscal years ended June 30, 2017 and 2016. Please read it in conjunction with the District financial statements and accompanying notes, which follow this section.
HIGHLIGHTS
Financial Highlights
The District along with Sausalito-Marin City Sanitary District formed the Marin Public Financing Authority (MPFA) in January 2017. This is a joint power authority created to issue publicly financed debt for its members. The MPFA has no assets or liabilities and acts as an administrative body for its members. In April 2017, through the MPFA, the District issued $38,365,000 in AAA rated bonds. A premium of $3,023,718 was paid by the successful bidder, Morgan Stanley & Company LLC, resulting in the District receiving cash proceeds of $41,388,718 less underwriting and issuance costs of $388,709.
Operating revenues increased by approximately $1,404,000 over the previous year. This increase was due to a 13% increase in the sewer service revenue which was offset by a decrease in recycled water revenue. Recycled water revenue is from a cost reimbursement agreement. During 2017, the reimbursable costs were lower and there was less demand due to overall conservation and a rainy spring.
Operating expenses, net of depreciation, increased by approximately $1,009,000 or 13%. The primary components of the increase were personnel which costs increased by $450,750 due to increases in wages and the actuarially determined pension expense; utility power charges increased by $249,360 due to increased demand for pumping and processing during storm events, less solar output due to more cloudy days, operational issues, and the fact the cogeneration system was offline for a major upgrade and cleaning; other operating costs incurred for chemicals and lab analysis due to high plant flows; and legal fees related to pending matters.
Nonoperating expenses are comprised primarily of interest expense and certain bond issuance costs which are charged to expense of $349,204. The total interest incurred in 2017 was $732,302; however, $379,663 was capitalized as part of the cost of constructing fixed assets.
Capital contributions from Connection Fees are dependent on the level of development within the District. In recent years, the development has consisted of the expansion of existing facilities rather than new housing. The Intergovernmental contributions are from MMWD for its allocation of capacity in the existing recycled water treatment facility.
Las Gallinas Valley Sanitary District
Management’s Discussion and Analysis
Fiscal Years Ended June 30, 2017 and 2016
4
District Highlights
The District treated 1,204 million gallons of wastewater and produced 189 million gallons of effluent for recycled water treatment and distribution by Marin Municipal Water District (MMWD) and North Marin Water District (NMWD) during 2017.
The District has two photovoltaic systems which power the reclamation pump station and the treatment plant. These systems generate power to offset the District’s demand for energy. In prior years, the District has been a net power generator and received credits or refunds for power exported to the power grid; however, in 2017 and 2016 more power was used than generated. This was due to issues with the inverters in the system and a capital improvement project which took the District’s co-generation system offline in December, 2015. The project is slated for completion during 2017.
The District was awarded a $999,070 grant from the California Energy Commission in May 2015 for its Biogas Energy Recovery System (BERS) project. This closed-loop system will be installed at the treatment plant and allow the District to recover 100 percent of the methane produced from the mesophilic anaerobic digestion of wastewater sludge at the facility and condition it for on-site combined heat and power generation and transportation fuel use. In August 2015, the District received a $250,000 grant from the California Energy Commission for fueling station equipment for the BERS project. Both of these grants are reimbursement grants that require expenditure of funds by the District before any grant funds are received. In July 2015, the District was awarded a sales tax exclusion grant on the purchase of equipment for the project. The grant is based on the equipment having a maximum purchase price of $788,757, resulting in a maximum sales and use tax exemption of $72,960. This grant relieves the District from paying sales tax to the seller of the equipment as part of the purchase price.
The District was awarded an $847,000 federal grant from the United States Bureau of Reclamation under its Title XVI program to expand the recycled water treatment facility. Design of the expansion is currently underway and construction is expected to begin in the fall of 2017.
The District has a Private Sewer Lateral Assistance Program which allows property owners to apply for low interest loans, currently 2% interest, to obtain up to $10,000 to replace their upper, lower or both laterals. The loans are repaid through special assessments through the property taxes over ten years. During 2017, the District advanced $116,092 to sixteen property owners to repair or replace their laterals.
The District maintained its achievement of having among the lowest reported sewer overflow rate in Marin County.
Las Gallinas Valley Sanitary District
Management’s Discussion and Analysis
Fiscal Years Ended June 30, 2017 and 2016
5
USING THIS ANNUAL REPORT
This annual report consists of five parts: Management’s Discussion and Analysis, Financial Statements, Required Supplementary Information, Supplementary Information and Statistical Section. The Financial Statements also include notes that explain in more detail some of the information contained in those statements.
REQUIRED FINANCIAL STATEMENTS
District financial statements report information about the District’s use of accounting methods similar to those used by private sector companies. The Statement of Net Position includes all District assets and liabilities that provide information about the nature and amounts of investments in resources and obligations to creditors. It also provides the basis for computing rate of return, evaluating the capital structure of the District, and assessing the liquidity and financial flexibility of the District. All of the current year’s revenues and expenses are accounted for in the Statement of Revenues, Expenses and Changes in Net Position. This statement measures the success of the District operations and management of investments over the past year and can be used to determine whether the District has successfully recovered all of its costs through its user fees and other charges. The final required financial statement is the Statement of Cash Flows. The primary purpose of this statement is to provide information about the District’s cash receipts, cash disbursements and net changes in cash resulting from operations, investing, and capital and noncapital financing activities.
FINANCIAL ANALYSIS OF THE DISTRICT
One of the most important questions asked about the District’s finances is whether or not the District’s overall financial position has improved or deteriorated. The Statement of Net Position and the Statement of Revenues, Expenses and Changes in Net Position report information about the District activities in a way that will help answer this question. These two statements report the net position of the District and changes from year to year. The difference between assets and liabilities (net position) is one way to measure financial health or financial position. Over time, increases or decreases in the District’s net position are one indicator of whether the financial health is improving or deteriorating. Other factors to consider include changes in economic conditions, population growth, and new or changed legislation.
Las Gallinas Valley Sanitary District
Management’s Discussion and Analysis
Fiscal Years Ended June 30, 2017 and 2016
6
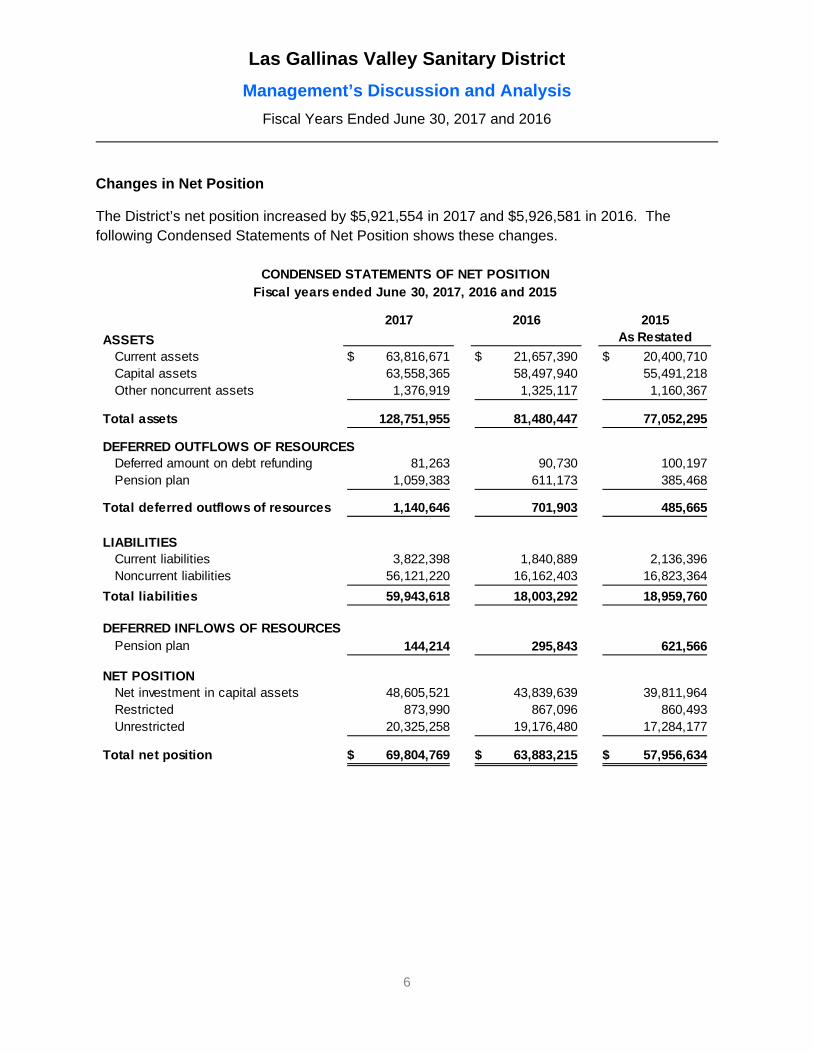
Changes in Net Position
The District’s net position increased by $5,921,554 in 2017 and $5,926,581 in 2016. The following Condensed Statements of Net Position shows these changes.
2017 2016 2015
ASSETS As Restated
Current assets 63,816,671$ 21,657,390$ 20,400,710$ Capital assets 63,558,365 58,497,940 55,491,218 Other noncurrent assets 1,376,919 1,325,117 1,160,367
Total assets 128,751,955 81,480,447 77,052,295
DEFERRED OUTFLOWS OF RESOURCESDeferred amount on debt refunding 81,263 90,730 100,197 Pension plan 1,059,383 611,173 385,468
Total deferred outflows of resources 1,140,646 701,903 485,665
LIABILITIESCurrent liabilities 3,822,398 1,840,889 2,136,396 Noncurrent liabilities 56,121,220 16,162,403 16,823,364
Total liabilities 59,943,618 18,003,292 18,959,760
DEFERRED INFLOWS OF RESOURCESPension plan 144,214 295,843 621,566
NET POSITIONNet investment in capital assets 48,605,521 43,839,639 39,811,964 Restricted 873,990 867,096 860,493 Unrestricted 20,325,258 19,176,480 17,284,177
Total net position 69,804,769$ 63,883,215$ 57,956,634$
CONDENSED STATEMENTS OF NET POSITIONFiscal years ended June 30, 2017, 2016 and 2015
Las Gallinas Valley Sanitary District
Management’s Discussion and Analysis
Fiscal Years Ended June 30, 2017 and 2016
7
Analysis of Changes in Statements of Net Position
Current assets increased by $42,159,281 in 2017 primarily due to the bond proceeds, net of issuance costs of $41 million which are invested in the California State Treasurer’s Local Area Investment fund. These proceeds are restricted for use in funding capital projects of the District. Current assets increased in 2016 by $1,256,680 due to increases in cash and accounts receivable, primarily for the grant related to the BERS project. The District has built up cash to pay for future construction. Capital assets, net of accumulated depreciation, increased by $5,060,425 in 2017 and by $3,006,722 in 2016. During 2017, spending on projects was $7,586,602 which was offset by depreciation of $2,526,177. During 2016 spending on projects was $5,556,368; this was offset by depreciation of $2,429,063. Other noncurrent assets increased by $51,802 in 2017 and $164,750 in 2016 due to additional advances under the private sewer lateral assistance program. Deferred outflows of resources increased by in 2017 by $438,743 and in 2016 by $216,238 due to the changes in the pension related items in accordance Government Accounting Standards Board No. 68, Financial Reporting for Pension Plans – an Amendment of GASB Statement No. 27 (GASB No. 68).
Current liabilities increased in 2017 $1,981,509 due to an increase in accounts payable; and increases in accrued interest and the current portion of long-term debt as a result of the new borrowings. In 2016 it decreased by $295,507 due to a decrease in accounts payable and an increase in the current portion of accrued compensated absences. Noncurrent liabilities increased by $39,958,817 due to the new borrowings and related original issue premium and an increase in the collective net pension liability. In 2016 noncurrent liabilities decreased by $660,961 due to a decrease in the long-term portion of the accrued compensated absences and regularly scheduled principal payments on long-term debt, which was offset by an increase in the collective net pension liability of $404,505. Deferred inflows of resources related to the pension plan decreased by $151,629 in 2017 and $325,723 in 2016 due to scheduled amortization and an increase in the difference between projected and actual earnings on plan investments.
Net Position as of June 30, 2015 was previously reported as $58,063,598; however, as part of recording the activity for 2016, it was determined that the effects of implementing GASB No. 68 should be revised for 2015. The components of the change are as follows:
Net position - end of the year, June 30, 2015as originally reported 58,063,598$
Correction of GASB No. 68 impact (106,964)
Net position - end of the year, June 30, 2015,as restated 57,956,634$
Las Gallinas Valley Sanitary District
Management’s Discussion and Analysis
Fiscal Years Ended June 30, 2017 and 2016
8
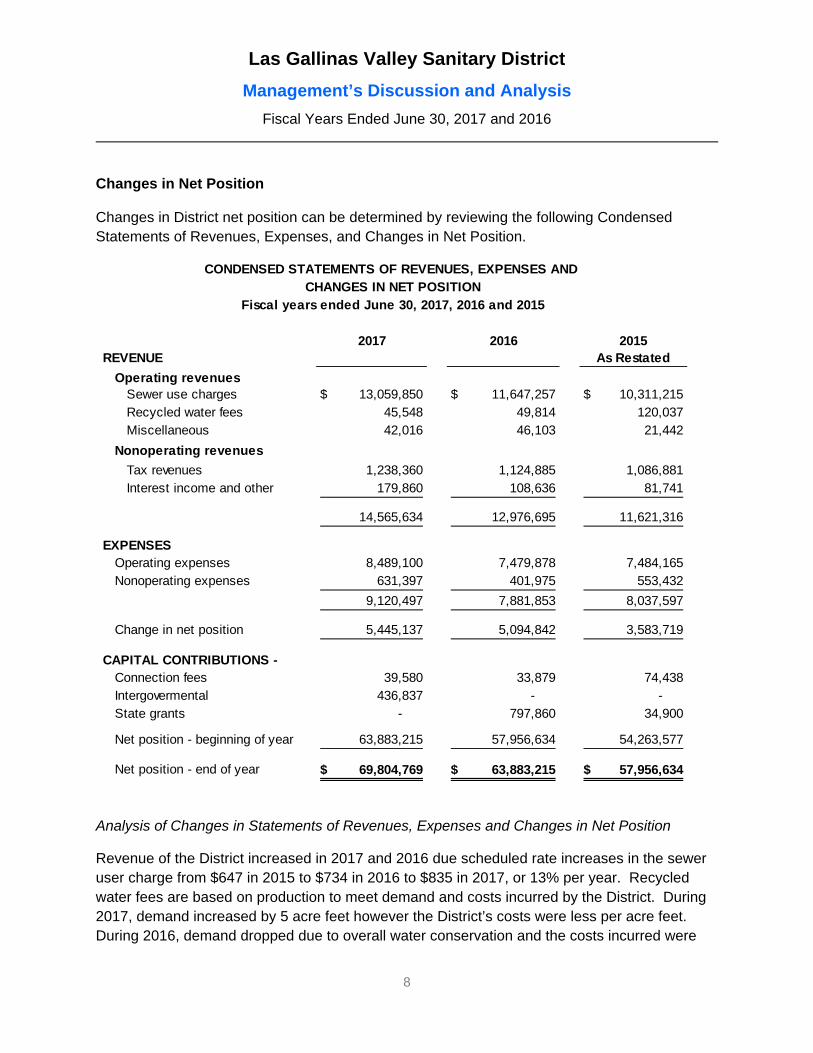
Changes in Net Position Changes in District net position can be determined by reviewing the following Condensed Statements of Revenues, Expenses, and Changes in Net Position.
2017 2016 2015REVENUE As Restated
Operating revenuesSewer use charges 13,059,850$ 11,647,257$ 10,311,215$ Recycled water fees 45,548 49,814 120,037 Miscellaneous 42,016 46,103 21,442
Nonoperating revenues
Tax revenues 1,238,360 1,124,885 1,086,881 Interest income and other 179,860 108,636 81,741
14,565,634 12,976,695 11,621,316
EXPENSESOperating expenses 8,489,100 7,479,878 7,484,165 Nonoperating expenses 631,397 401,975 553,432
9,120,497 7,881,853 8,037,597
Change in net position 5,445,137 5,094,842 3,583,719
CAPITAL CONTRIBUTIONS - Connection fees 39,580 33,879 74,438 Intergovermental 436,837 - - State grants - 797,860 34,900
Net position - beginning of year 63,883,215 57,956,634 54,263,577
Net position - end of year 69,804,769$ 63,883,215$ 57,956,634$
CONDENSED STATEMENTS OF REVENUES, EXPENSES AND CHANGES IN NET POSITION
Fiscal years ended June 30, 2017, 2016 and 2015
Analysis of Changes in Statements of Revenues, Expenses and Changes in Net Position
Revenue of the District increased in 2017 and 2016 due scheduled rate increases in the sewer user charge from $647 in 2015 to $734 in 2016 to $835 in 2017, or 13% per year. Recycled water fees are based on production to meet demand and costs incurred by the District. During 2017, demand increased by 5 acre feet however the District’s costs were less per acre feet. During 2016, demand dropped due to overall water conservation and the costs incurred were
Las Gallinas Valley Sanitary District
Management’s Discussion and Analysis
Fiscal Years Ended June 30, 2017 and 2016
9
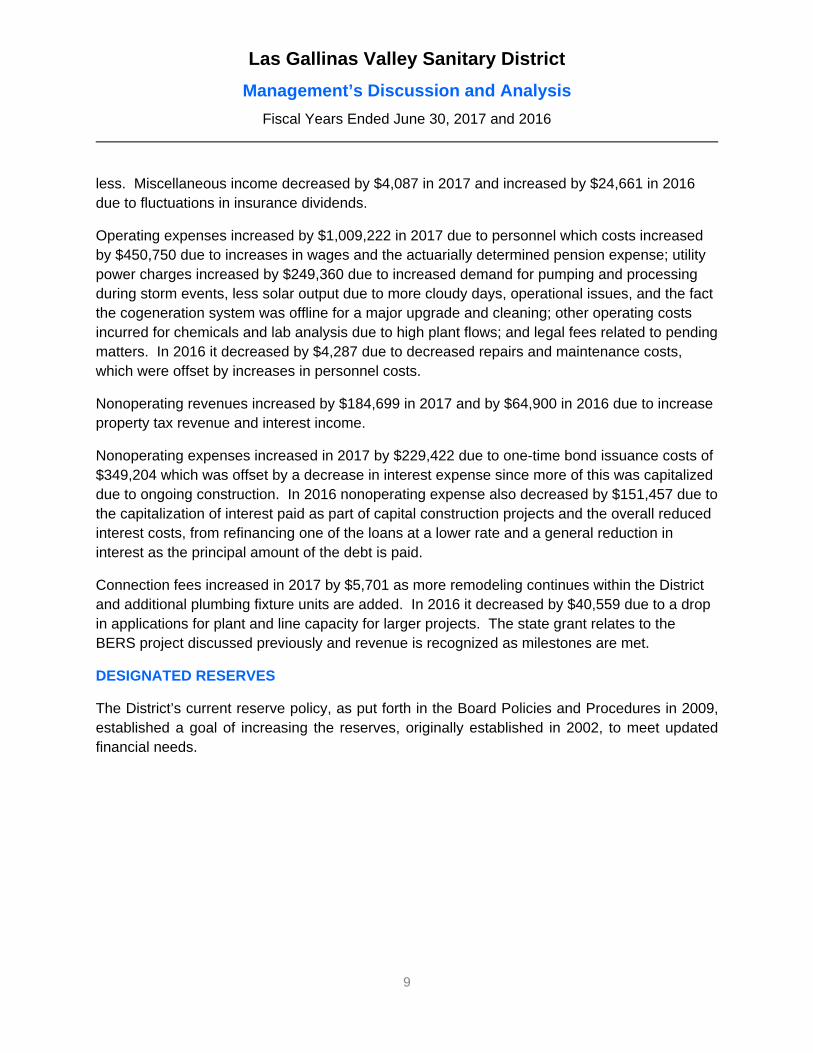
less. Miscellaneous income decreased by $4,087 in 2017 and increased by $24,661 in 2016 due to fluctuations in insurance dividends.
Operating expenses increased by $1,009,222 in 2017 due to personnel which costs increased by $450,750 due to increases in wages and the actuarially determined pension expense; utility power charges increased by $249,360 due to increased demand for pumping and processing during storm events, less solar output due to more cloudy days, operational issues, and the fact the cogeneration system was offline for a major upgrade and cleaning; other operating costs incurred for chemicals and lab analysis due to high plant flows; and legal fees related to pending matters. In 2016 it decreased by $4,287 due to decreased repairs and maintenance costs, which were offset by increases in personnel costs.
Nonoperating revenues increased by $184,699 in 2017 and by $64,900 in 2016 due to increase property tax revenue and interest income.
Nonoperating expenses increased in 2017 by $229,422 due to one-time bond issuance costs of $349,204 which was offset by a decrease in interest expense since more of this was capitalized due to ongoing construction. In 2016 nonoperating expense also decreased by $151,457 due to the capitalization of interest paid as part of capital construction projects and the overall reduced interest costs, from refinancing one of the loans at a lower rate and a general reduction in interest as the principal amount of the debt is paid.
Connection fees increased in 2017 by $5,701 as more remodeling continues within the District and additional plumbing fixture units are added. In 2016 it decreased by $40,559 due to a drop in applications for plant and line capacity for larger projects. The state grant relates to the BERS project discussed previously and revenue is recognized as milestones are met.
DESIGNATED RESERVES
The District’s current reserve policy, as put forth in the Board Policies and Procedures in 2009, established a goal of increasing the reserves, originally established in 2002, to meet updated financial needs.
Las Gallinas Valley Sanitary District
Management’s Discussion and Analysis
Fiscal Years Ended June 30, 2017 and 2016
10
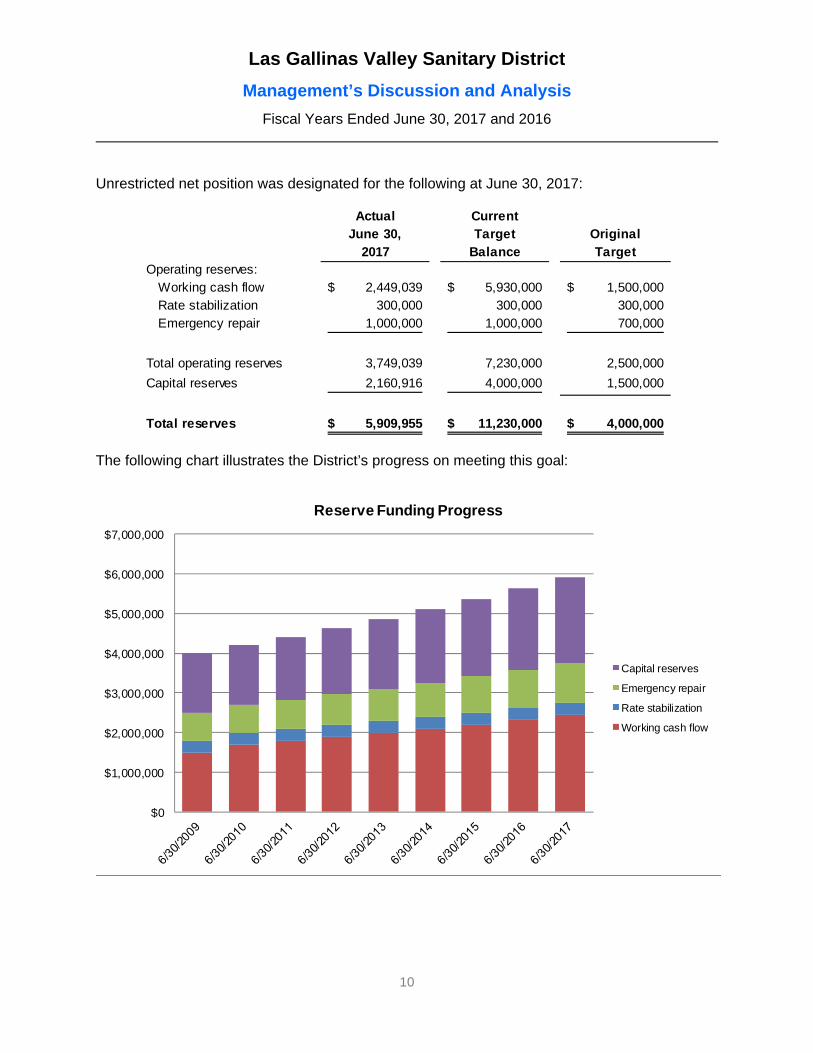
Unrestricted net position was designated for the following at June 30, 2017:
Actual CurrentJune 30, Target Original
2017 Balance TargetOperating reserves:
Working cash flow 2,449,039$ 5,930,000$ 1,500,000$ Rate stabilization 300,000 300,000 300,000 Emergency repair 1,000,000 1,000,000 700,000
Total operating reserves 3,749,039 7,230,000 2,500,000
Capital reserves 2,160,916 4,000,000 1,500,000
Total reserves 5,909,955$ 11,230,000$ 4,000,000$
The following chart illustrates the District’s progress on meeting this goal:
$0
$1,000,000
$2,000,000
$3,000,000
$4,000,000
$5,000,000
$6,000,000
$7,000,000
Reserve Funding Progress
Capital reserves
Emergency repair
Rate stabilization
Working cash flow
Las Gallinas Valley Sanitary District
Management’s Discussion and Analysis
Fiscal Years Ended June 30, 2017 and 2016
11
CAPITAL ASSETS AND DEBT ADMINISTRATION
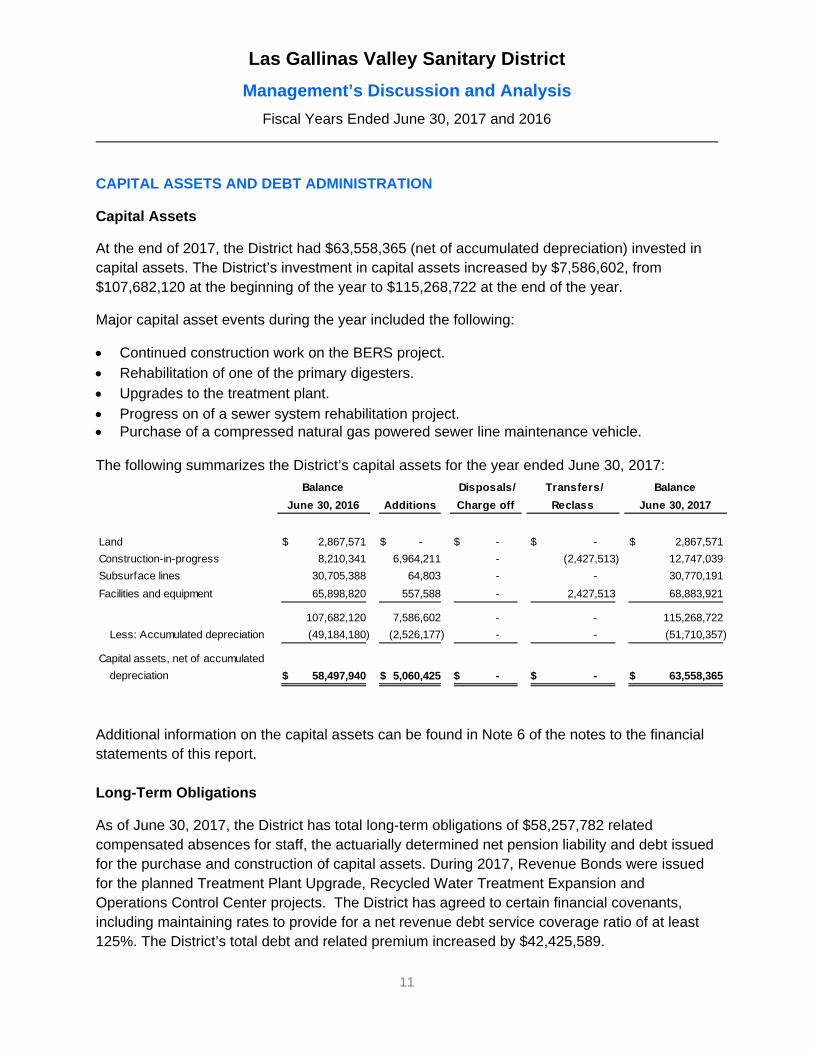
Capital Assets At the end of 2017, the District had $63,558,365 (net of accumulated depreciation) invested in capital assets. The District’s investment in capital assets increased by $7,586,602, from $107,682,120 at the beginning of the year to $115,268,722 at the end of the year.
Major capital asset events during the year included the following: Continued construction work on the BERS project. Rehabilitation of one of the primary digesters. Upgrades to the treatment plant.
Progress on of a sewer system rehabilitation project. Purchase of a compressed natural gas powered sewer line maintenance vehicle. The following summarizes the District’s capital assets for the year ended June 30, 2017:
Balance
June 30, 2016 Additions
Disposals/
Charge off
Transfers/
Reclass
Balance
June 30, 2017
Land 2,867,571$ -$ -$ -$ 2,867,571$
Construction-in-progress 8,210,341 6,964,211 - (2,427,513) 12,747,039
Subsurface lines 30,705,388 64,803 - - 30,770,191
Facilities and equipment 65,898,820 557,588 - 2,427,513 68,883,921
107,682,120 7,586,602 - - 115,268,722
Less: Accumulated depreciation (49,184,180) (2,526,177) - - (51,710,357)
Capital assets, net of accumulated
depreciation 58,497,940$ 5,060,425$ -$ -$ 63,558,365$
Additional information on the capital assets can be found in Note 6 of the notes to the financial statements of this report.
Long-Term Obligations
As of June 30, 2017, the District has total long-term obligations of $58,257,782 related compensated absences for staff, the actuarially determined net pension liability and debt issued for the purchase and construction of capital assets. During 2017, Revenue Bonds were issued for the planned Treatment Plant Upgrade, Recycled Water Treatment Expansion and Operations Control Center projects. The District has agreed to certain financial covenants, including maintaining rates to provide for a net revenue debt service coverage ratio of at least 125%. The District’s total debt and related premium increased by $42,425,589.
Las Gallinas Valley Sanitary District
Management’s Discussion and Analysis
Fiscal Years Ended June 30, 2017 and 2016
12
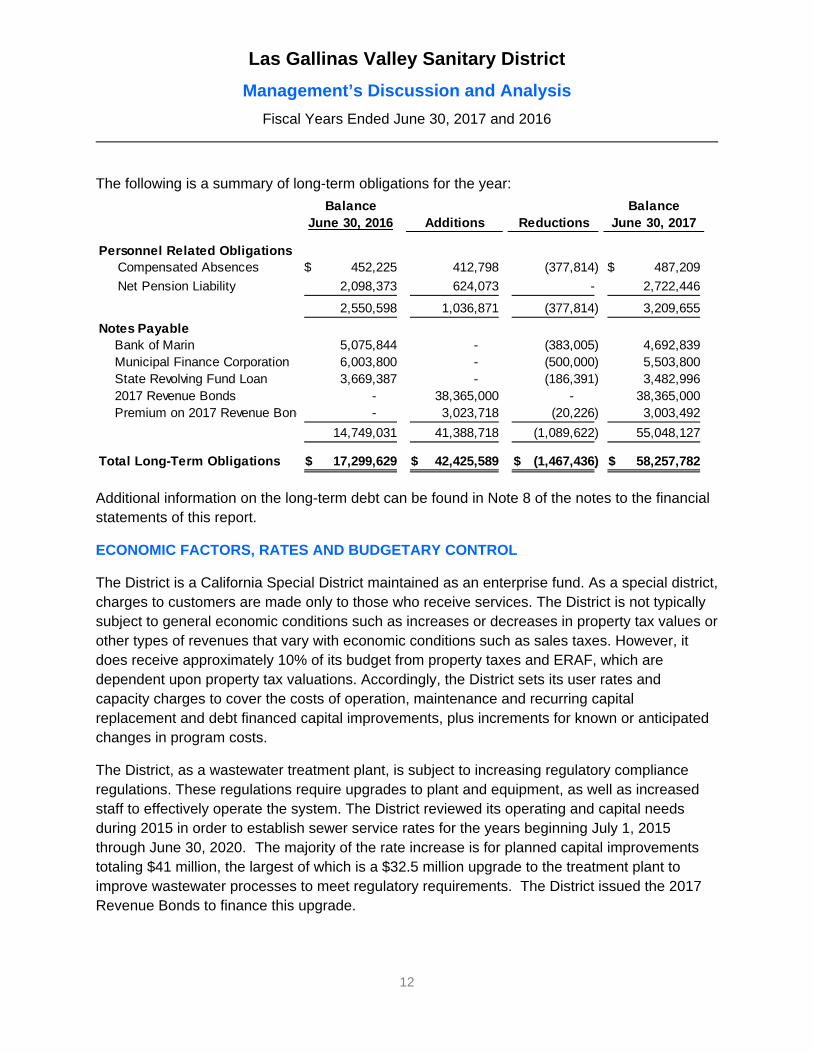
The following is a summary of long-term obligations for the year:
Balance BalanceJune 30, 2016 Additions Reductions June 30, 2017
Personnel Related ObligationsCompensated Absences 452,225$ 412,798 (377,814) 487,209$
Net Pension Liability 2,098,373 624,073 - 2,722,446
2,550,598 1,036,871 (377,814) 3,209,655
Notes PayableBank of Marin 5,075,844 - (383,005) 4,692,839 Municipal Finance Corporation 6,003,800 - (500,000) 5,503,800 State Revolving Fund Loan 3,669,387 - (186,391) 3,482,996 2017 Revenue Bonds - 38,365,000 - 38,365,000 Premium on 2017 Revenue Bond - 3,023,718 (20,226) 3,003,492
14,749,031 41,388,718 (1,089,622) 55,048,127
Total Long-Term Obligations 17,299,629$ 42,425,589$ (1,467,436)$ 58,257,782$
Additional information on the long-term debt can be found in Note 8 of the notes to the financial statements of this report.
ECONOMIC FACTORS, RATES AND BUDGETARY CONTROL
The District is a California Special District maintained as an enterprise fund. As a special district, charges to customers are made only to those who receive services. The District is not typically subject to general economic conditions such as increases or decreases in property tax values or other types of revenues that vary with economic conditions such as sales taxes. However, it does receive approximately 10% of its budget from property taxes and ERAF, which are dependent upon property tax valuations. Accordingly, the District sets its user rates and capacity charges to cover the costs of operation, maintenance and recurring capital replacement and debt financed capital improvements, plus increments for known or anticipated changes in program costs.
The District, as a wastewater treatment plant, is subject to increasing regulatory compliance regulations. These regulations require upgrades to plant and equipment, as well as increased staff to effectively operate the system. The District reviewed its operating and capital needs during 2015 in order to establish sewer service rates for the years beginning July 1, 2015 through June 30, 2020. The majority of the rate increase is for planned capital improvements totaling $41 million, the largest of which is a $32.5 million upgrade to the treatment plant to improve wastewater processes to meet regulatory requirements. The District issued the 2017 Revenue Bonds to finance this upgrade.
Las Gallinas Valley Sanitary District
Management’s Discussion and Analysis
Fiscal Years Ended June 30, 2017 and 2016
13
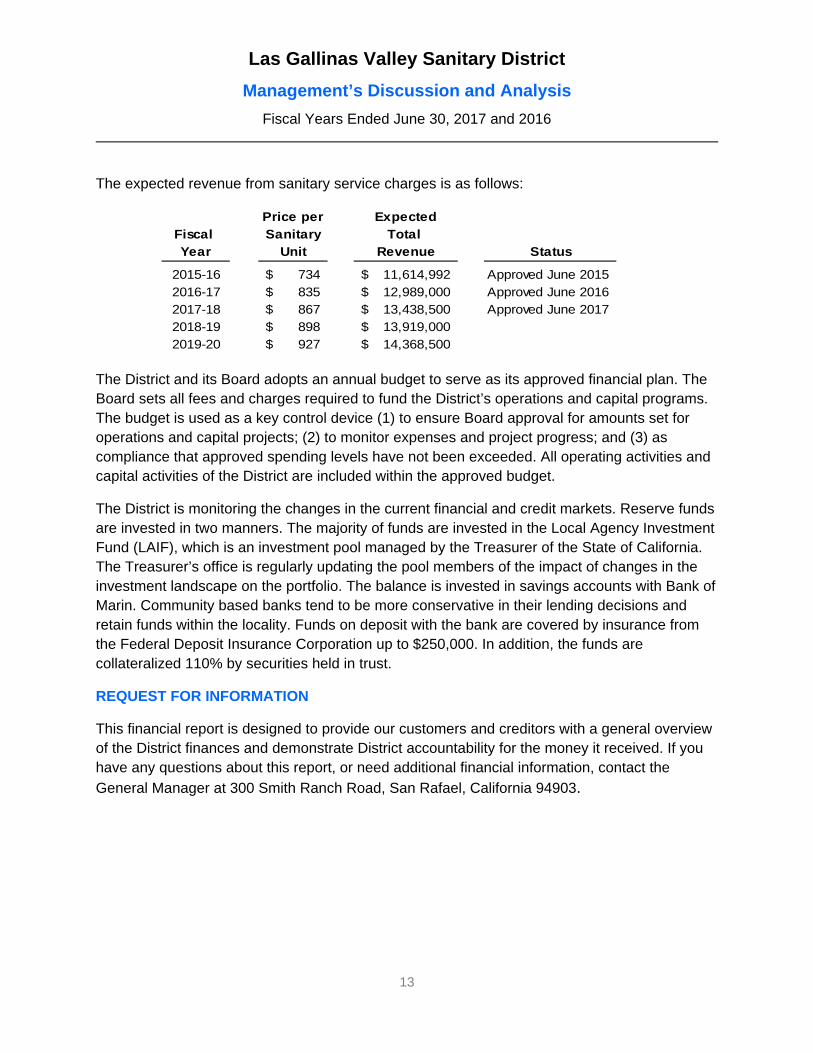
The expected revenue from sanitary service charges is as follows:
Price per ExpectedFiscal Sanitary Total Year Unit Revenue
2015-16 734$ 11,614,992$ Approved June 20152016-17 835$ 12,989,000$ Approved June 20162017-18 867$ 13,438,500$ Approved June 20172018-19 898$ 13,919,000$ 2019-20 927$ 14,368,500$
Status
The District and its Board adopts an annual budget to serve as its approved financial plan. The Board sets all fees and charges required to fund the District’s operations and capital programs. The budget is used as a key control device (1) to ensure Board approval for amounts set for operations and capital projects; (2) to monitor expenses and project progress; and (3) as compliance that approved spending levels have not been exceeded. All operating activities and capital activities of the District are included within the approved budget.
The District is monitoring the changes in the current financial and credit markets. Reserve funds are invested in two manners. The majority of funds are invested in the Local Agency Investment Fund (LAIF), which is an investment pool managed by the Treasurer of the State of California. The Treasurer’s office is regularly updating the pool members of the impact of changes in the investment landscape on the portfolio. The balance is invested in savings accounts with Bank of Marin. Community based banks tend to be more conservative in their lending decisions and retain funds within the locality. Funds on deposit with the bank are covered by insurance from the Federal Deposit Insurance Corporation up to $250,000. In addition, the funds are collateralized 110% by securities held in trust.
REQUEST FOR INFORMATION
This financial report is designed to provide our customers and creditors with a general overview of the District finances and demonstrate District accountability for the money it received. If you have any questions about this report, or need additional financial information, contact the
General Manager at 300 Smith Ranch Road, San Rafael, California 94903.
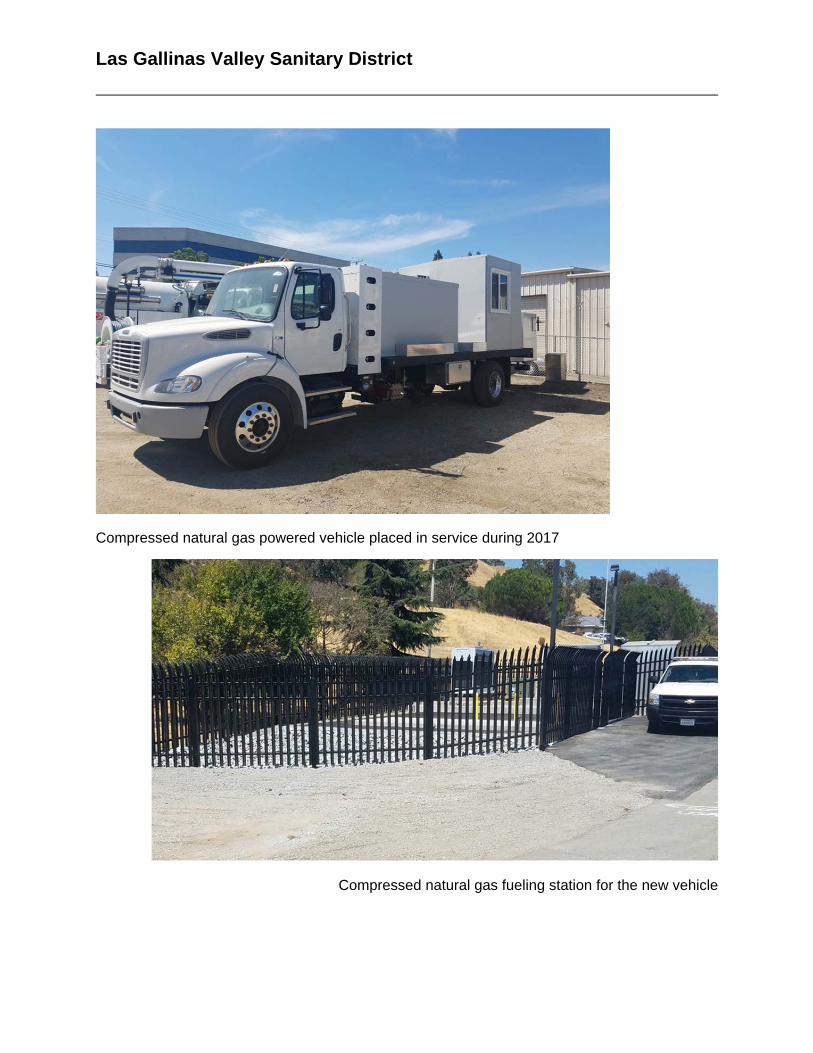
Las Gallinas Valley Sanitary District
Compressed natural gas powered vehicle placed in service during 2017
Compressed natural gas fueling station for the new vehicle
Las Gallinas Valley Sanitary District
BASIC FINANCIAL STATEMENTS
Las Gallinas Valley Sanitary District
Wildlife in the reclamation area
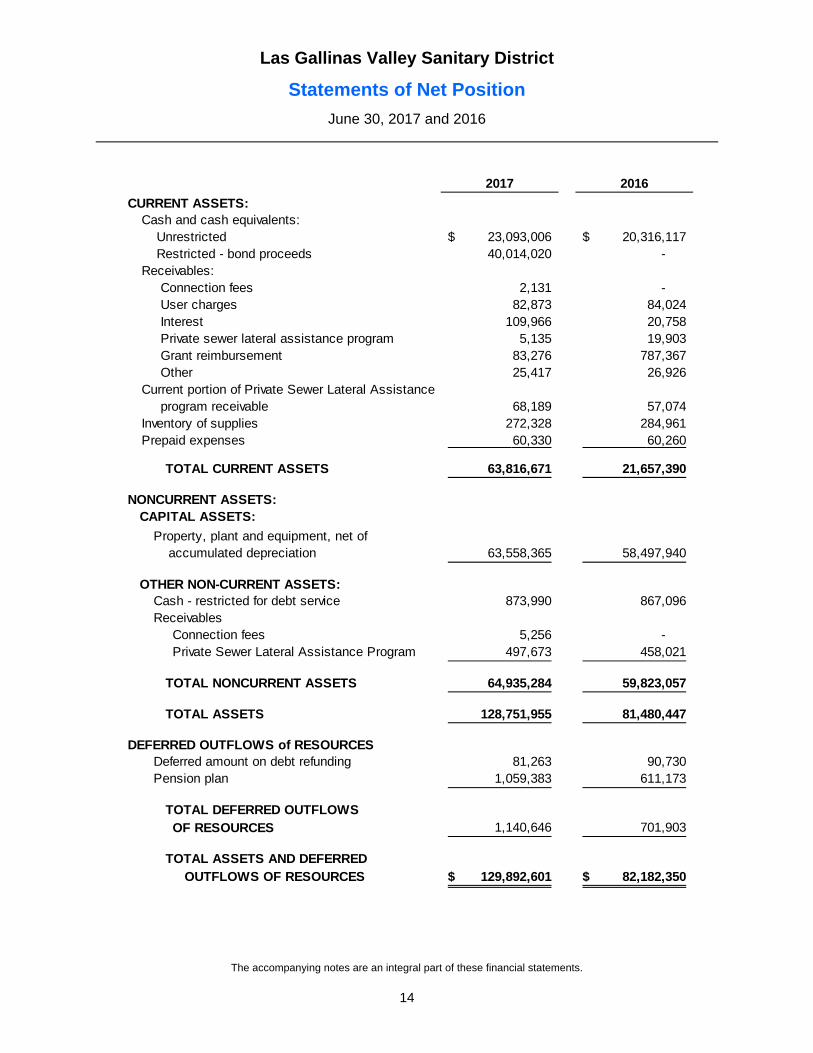
Las Gallinas Valley Sanitary District
Statements of Net Position
June 30, 2017 and 2016
The accompanying notes are an integral part of these financial statements.
14
2017 2016
CURRENT ASSETS:Cash and cash equivalents:
Unrestricted 23,093,006$ 20,316,117$ Restricted - bond proceeds 40,014,020 -
Receivables:Connection fees 2,131 - User charges 82,873 84,024 Interest 109,966 20,758 Private sewer lateral assistance program 5,135 19,903 Grant reimbursement 83,276 787,367 Other 25,417 26,926
Current portion of Private Sewer Lateral Assistance program receivable 68,189 57,074
Inventory of supplies 272,328 284,961 Prepaid expenses 60,330 60,260
TOTAL CURRENT ASSETS 63,816,671 21,657,390
NONCURRENT ASSETS:CAPITAL ASSETS:
Property, plant and equipment, net of accumulated depreciation 63,558,365 58,497,940
OTHER NON-CURRENT ASSETS:Cash - restricted for debt service 873,990 867,096 Receivables
Connection fees 5,256 - Private Sewer Lateral Assistance Program 497,673 458,021
TOTAL NONCURRENT ASSETS 64,935,284 59,823,057
TOTAL ASSETS 128,751,955 81,480,447
DEFERRED OUTFLOWS of RESOURCESDeferred amount on debt refunding 81,263 90,730 Pension plan 1,059,383 611,173
TOTAL DEFERRED OUTFLOWS OF RESOURCES 1,140,646 701,903
TOTAL ASSETS AND DEFERRED OUTFLOWS OF RESOURCES 129,892,601$ 82,182,350$
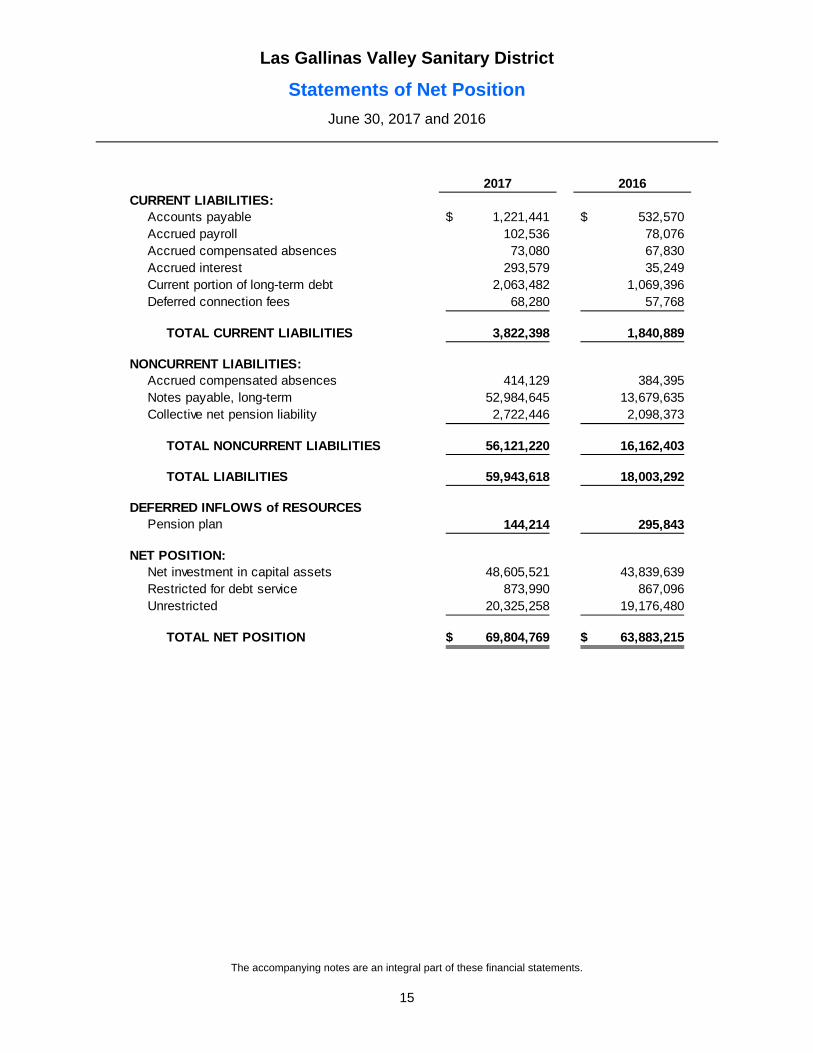
Las Gallinas Valley Sanitary District
Statements of Net Position
June 30, 2017 and 2016
The accompanying notes are an integral part of these financial statements.
15
2017 2016CURRENT LIABILITIES:
Accounts payable 1,221,441$ 532,570$ Accrued payroll 102,536 78,076 Accrued compensated absences 73,080 67,830 Accrued interest 293,579 35,249 Current portion of long-term debt 2,063,482 1,069,396 Deferred connection fees 68,280 57,768
TOTAL CURRENT LIABILITIES 3,822,398 1,840,889
NONCURRENT LIABILITIES: Accrued compensated absences 414,129 384,395 Notes payable, long-term 52,984,645 13,679,635 Collective net pension liability 2,722,446 2,098,373
TOTAL NONCURRENT LIABILITIES 56,121,220 16,162,403
TOTAL LIABILITIES 59,943,618 18,003,292
DEFERRED INFLOWS of RESOURCESPension plan 144,214 295,843
NET POSITION:Net investment in capital assets 48,605,521 43,839,639 Restricted for debt service 873,990 867,096 Unrestricted 20,325,258 19,176,480
TOTAL NET POSITION 69,804,769$ 63,883,215$
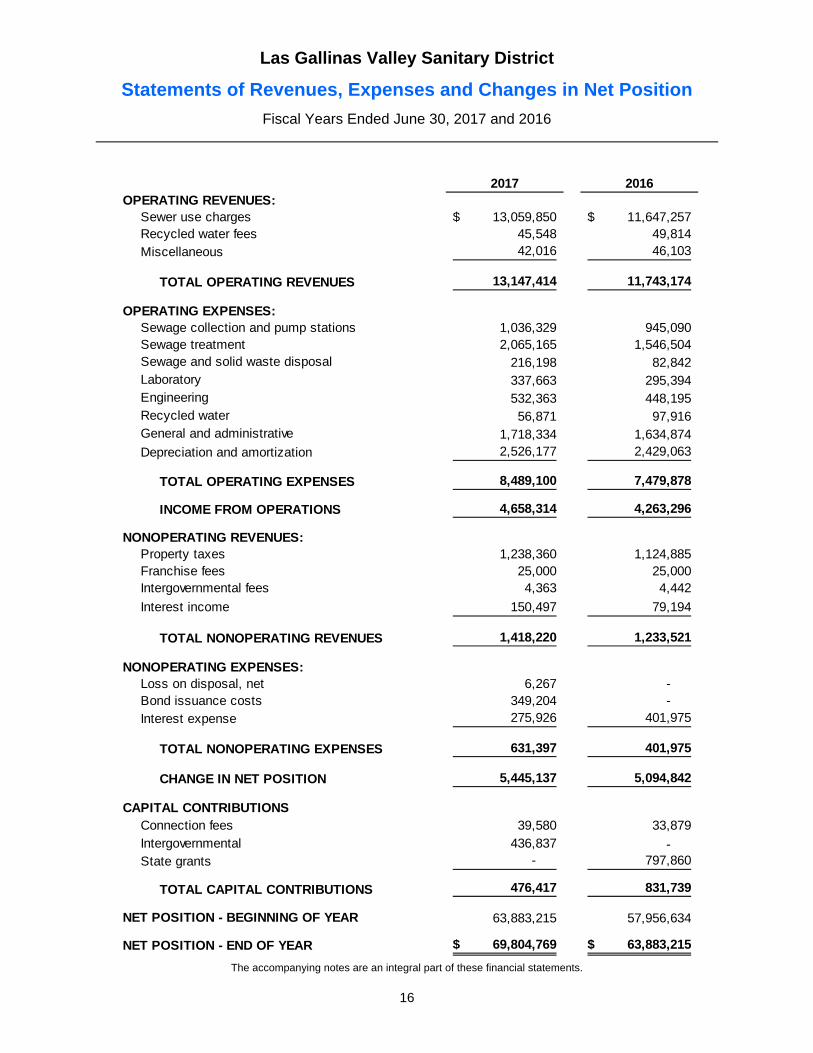
Las Gallinas Valley Sanitary District
Statements of Revenues, Expenses and Changes in Net Position
Fiscal Years Ended June 30, 2017 and 2016
The accompanying notes are an integral part of these financial statements.
16
2017 2016OPERATING REVENUES:
Sewer use charges 13,059,850$ 11,647,257$ Recycled water fees 45,548 49,814 Miscellaneous 42,016 46,103
TOTAL OPERATING REVENUES 13,147,414 11,743,174
OPERATING EXPENSES:Sewage collection and pump stations 1,036,329 945,090 Sewage treatment 2,065,165 1,546,504 Sewage and solid waste disposal 216,198 82,842 Laboratory 337,663 295,394 Engineering 532,363 448,195 Recycled water 56,871 97,916 General and administrative 1,718,334 1,634,874 Depreciation and amortization 2,526,177 2,429,063
TOTAL OPERATING EXPENSES 8,489,100 7,479,878
INCOME FROM OPERATIONS 4,658,314 4,263,296
NONOPERATING REVENUES:Property taxes 1,238,360 1,124,885 Franchise fees 25,000 25,000 Intergovernmental fees 4,363 4,442
Interest income 150,497 79,194
TOTAL NONOPERATING REVENUES 1,418,220 1,233,521
NONOPERATING EXPENSES:Loss on disposal, net 6,267 - Bond issuance costs 349,204 - Interest expense 275,926 401,975
TOTAL NONOPERATING EXPENSES 631,397 401,975
CHANGE IN NET POSITION 5,445,137 5,094,842
CAPITAL CONTRIBUTIONSConnection fees 39,580 33,879 Intergovernmental 436,837 - State grants - 797,860
TOTAL CAPITAL CONTRIBUTIONS 476,417 831,739
NET POSITION - BEGINNING OF YEAR 63,883,215 57,956,634
NET POSITION - END OF YEAR 69,804,769$ 63,883,215$
Las Gallinas Valley Sanitary District
Statements of Cash Flows
Fiscal Years Ended June 30, 2017 and 2016
The accompanying notes are an integral part of these financial statements.
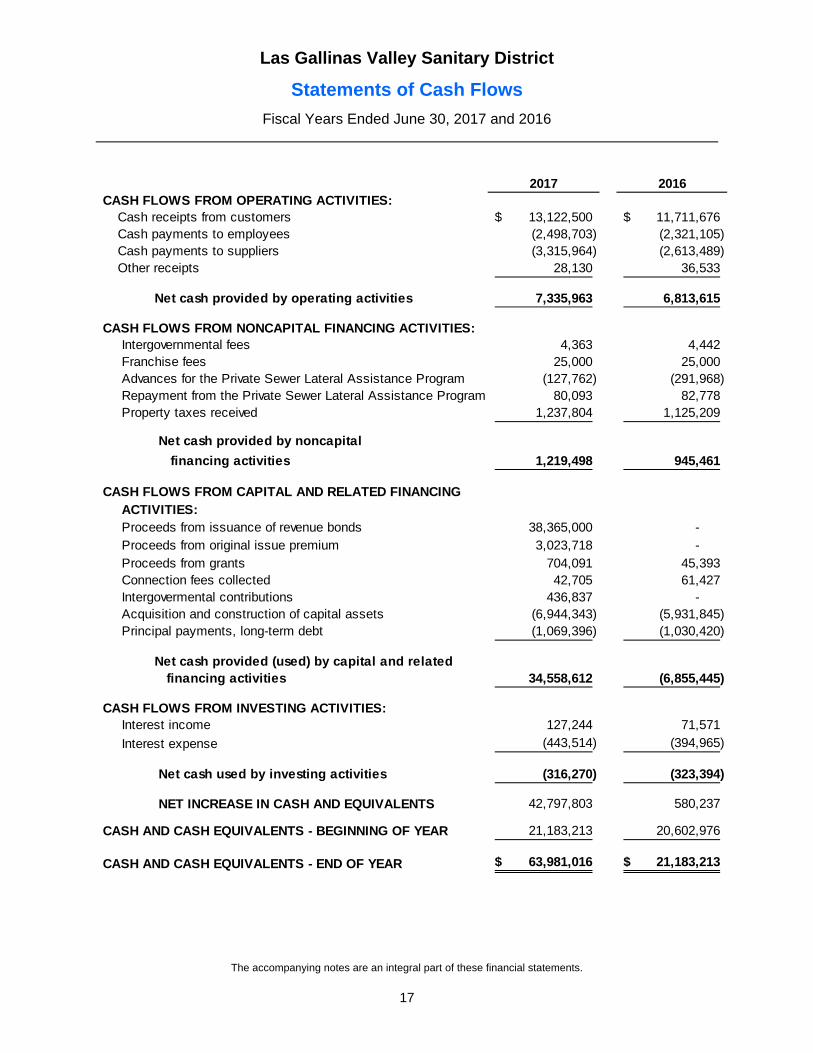
17
2017 2016CASH FLOWS FROM OPERATING ACTIVITIES:
Cash receipts from customers 13,122,500$ 11,711,676$ Cash payments to employees (2,498,703) (2,321,105) Cash payments to suppliers (3,315,964) (2,613,489) Other receipts 28,130 36,533
Net cash provided by operating activities 7,335,963 6,813,615
CASH FLOWS FROM NONCAPITAL FINANCING ACTIVITIES:Intergovernmental fees 4,363 4,442 Franchise fees 25,000 25,000 Advances for the Private Sewer Lateral Assistance Program (127,762) (291,968) Repayment from the Private Sewer Lateral Assistance Program 80,093 82,778 Property taxes received 1,237,804 1,125,209
Net cash provided by noncapital
financing activities 1,219,498 945,461
CASH FLOWS FROM CAPITAL AND RELATED FINANCINGACTIVITIES:Proceeds from issuance of revenue bonds 38,365,000 - Proceeds from original issue premium 3,023,718 - Proceeds from grants 704,091 45,393 Connection fees collected 42,705 61,427 Intergovermental contributions 436,837 - Acquisition and construction of capital assets (6,944,343) (5,931,845) Principal payments, long-term debt (1,069,396) (1,030,420)
Net cash provided (used) by capital and related financing activities 34,558,612 (6,855,445)
CASH FLOWS FROM INVESTING ACTIVITIES:Interest income 127,244 71,571
Interest expense (443,514) (394,965)
Net cash used by investing activities (316,270) (323,394)
NET INCREASE IN CASH AND EQUIVALENTS 42,797,803 580,237
CASH AND CASH EQUIVALENTS - BEGINNING OF YEAR 21,183,213 20,602,976
CASH AND CASH EQUIVALENTS - END OF YEAR 63,981,016$ 21,183,213$
Las Gallinas Valley Sanitary District
Statements of Cash Flows (continued)
Fiscal Years Ended June 30, 2017 and 2016
The accompanying notes are an integral part of these financial statements.
18
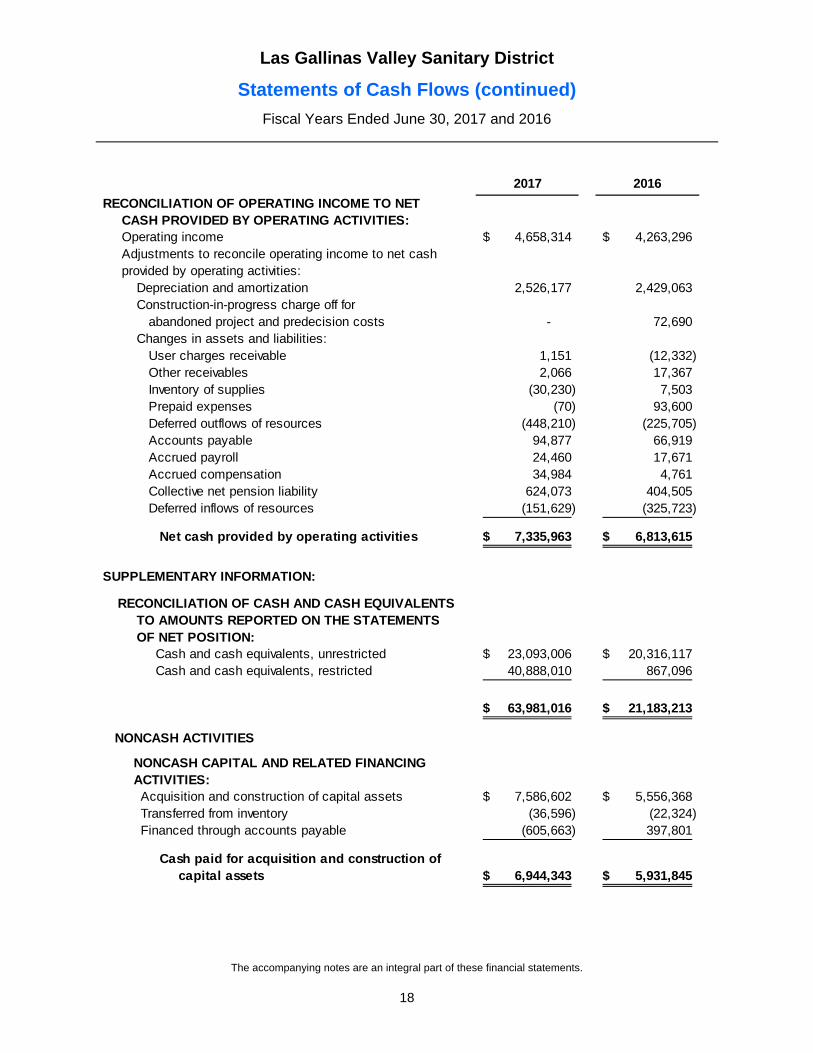
2017 2016
RECONCILIATION OF OPERATING INCOME TO NET CASH PROVIDED BY OPERATING ACTIVITIES:Operating income 4,658,314$ 4,263,296$ Adjustments to reconcile operating income to net cash provided by operating activities:
Depreciation and amortization 2,526,177 2,429,063 Construction-in-progress charge off for
abandoned project and predecision costs - 72,690 Changes in assets and liabilities:
User charges receivable 1,151 (12,332) Other receivables 2,066 17,367 Inventory of supplies (30,230) 7,503 Prepaid expenses (70) 93,600 Deferred outflows of resources (448,210) (225,705) Accounts payable 94,877 66,919 Accrued payroll 24,460 17,671 Accrued compensation 34,984 4,761 Collective net pension liability 624,073 404,505 Deferred inflows of resources (151,629) (325,723)
Net cash provided by operating activities 7,335,963$ 6,813,615$
SUPPLEMENTARY INFORMATION:
RECONCILIATION OF CASH AND CASH EQUIVALENTSTO AMOUNTS REPORTED ON THE STATEMENTSOF NET POSITION:
Cash and cash equivalents, unrestricted 23,093,006$ 20,316,117$ Cash and cash equivalents, restricted 40,888,010 867,096
63,981,016$ 21,183,213$
NONCASH ACTIVITIES
NONCASH CAPITAL AND RELATED FINANCINGACTIVITIES:Acquisition and construction of capital assets 7,586,602$ 5,556,368$ Transferred from inventory (36,596) (22,324) Financed through accounts payable (605,663) 397,801
Cash paid for acquisition and construction of capital assets 6,944,343$ 5,931,845$
Las Gallinas Valley Sanitary District
Notes to Financial Statements
Fiscal Years Ended June 30, 2017 and 2016
19
1. Reporting Entity
The Las Gallinas Valley Sanitary District (the District) was formed on April 6, 1954 as a special district of the State of California. The District provides sewage collection, treatment, disposal, and wastewater recycling services, as well as manages the refuse hauling and recycling services franchise. The District provides these services to approximately 30,000 people in an area of twelve square miles, from Santa Venetia to Lucas Valley and the Marin County Civic Center to Marinwood, in Marin County, California. Revenues are derived principally from sewer charges collected from commercial and residential users within the District.
The scope of this report extends exclusively to the financial information presented for the District. The District is governed by a five person Board of Directors (the Board) elected for four year terms. The Board has no oversight responsibility for any other governmental unit or agency. As such, the Board's governing authority, designation of management, ability to significantly influence operations, and accountability for fiscal matters extends only to the affairs of the District.
2. Summary of Significant Accounting Policies
Financial Reporting Entity, Measurement Focus, and Financial Statement Presentation
The District reports its activities as an enterprise fund, which is used to account for operations that are financed and operated in a manner similar to a private business enterprise, where the intent of the District is that the costs (including depreciation) of providing goods or services to the general public on a continuing basis be financed or recovered primarily through user charges. Revenues and expenses are recognized on the accrual basis. Revenues are recognized in the accounting period in which they are earned and expenses are recognized in the period incurred, regardless of when the related cash flow takes place.
Operating revenues, such as charges for sewer services and recycled water fees, result from exchange transactions associated with the principal activity of the District. Exchange transactions are those in which each party receives and gives up essentially equal values. Nonoperating revenues, such as property taxes and investment income, result from nonexchange transactions or ancillary activities in which the District gives (receives) value without directly receiving (giving) equal value in exchange.
The District receives the majority of its revenue from sewer use charges and property taxes that are collected by the County of Marin through the annual property tax bills. The County has implemented the Teeter policy, whereby the District receives all of the amounts billed whether or not the County collects the monies from the assessed property owners. This ensures that the District has the funds to operate without being dependent upon the timing of the collection of the remittances from the covered property owners.
Las Gallinas Valley Sanitary District
Notes to Financial Statements
Fiscal Years Ended June 30, 2017 and 2016
20
2. Summary of Significant Accounting Policies (continued)
Net Position
Net position is measured on the full accrual basis and is the excess of all the District’s assets and deferred outflows over all its liabilities and deferred inflows. Net position is classified into the following components: net investment in capital assets, restricted and unrestricted.
Net investment in capital assets - This component of net position consists of capital assets, including restricted capital assets, net of accumulated depreciation and reduced by the outstanding balances of any bonds, mortgages, notes or other borrowings attributable to the acquisition, construction, or improvement of those assets. If there are significant unspent related debt proceeds at year end, the portion of the debt attributable to the unspent proceeds are not included in the calculation of invested in capital assets, net of related debt. Rather, that portion of the debt is included in the same net position component as the unspent proceeds.
Restricted - This component of net position consists of constraints placed on net asset use through external constraints imposed by creditors (such as through debt covenants), grantors, contributors, or laws or regulations of other governments or constraints imposed by law through constitutional provisions or enabling legislation.
Unrestricted - This component of net position consists of net position that does not meet the definition of "invested in capital assets, net of related debts" or "restricted."
Budgetary Accounting
The District is not required by statute to adopt a budget; however, in its commitment to maintain fiscal responsibility, the District adopts an annual budget prior to June 30th each year. Budgets are adopted on a basis consistent with accounting principles generally accepted in the United States of America, except for depreciation which is not included and annual principal payments on debt service which are included. All annual, noncapital appropriations lapse at year-end.
Budgetary control is maintained at the detailed line item level. The General Manager may approve expenditures in excess of budgeted amounts up to $15,000; items in excess of this must be approved by the Board. A budget revision is usually presented to the Board in the fall to adjust for changes in capital project funding after the close of the prior year.
Las Gallinas Valley Sanitary District
Notes to Financial Statements
Fiscal Years Ended June 30, 2017 and 2016
21
2. Summary of Significant Accounting Policies (continued)
Cash and Cash Equivalents
Cash and cash equivalents are considered to be cash-on-hand, demand deposits, and short-term investments, with original maturities of three months or less from the date of acquisition. These items are valued at cost. Please see Note 3 for additional information on investment policies and practices for both the State of California and the District.
Cash that is restricted for debt service is invested in certificates of deposit. It is classified as a noncurrent asset based on two factors: 1) due to a maturity date that is more than one year from the date of the Statement of Net Position or 2) due to the final maturity date of the related loan, which will require that the funds be maintained until a date that is more than one year from the date of the Statement of Net Position.
Inventory of Supplies
Inventory consists of materials and supplies, such as chemicals, pipe fittings, valves, pumps and filters, which are stated at cost, using the first-in, first-out method.
Capital Assets
Capital assets consist of property, plant and equipment owned by the District, which are recorded at cost or at estimated historical cost if cost information is not practically determinable. The District’s policy is to include in construction-in-progress the capitalized interest cost of related borrowings, net of interest earned on unspent proceeds of the related borrowings.
The District defines capital assets as assets with an initial individual cost of more than $5,000 and an estimated useful life in excess of one year. The cost of normal repairs and maintenance is recorded as expense. Improvements that add to the value or extend the life of assets are capitalized. Depreciation has been calculated on each class of depreciable property using the straight-line method. Estimated useful lives are as follows:
Subsurface lines 50 - 75 years
Facilities and structures 15 - 40 years
Equipment 5 - 20 years
Intangible Assets
Intangible assets consist of easements and internally generated computer software. All intangible assets are recognized in the Statement of Net Position only if they are considered identifiable. They are amortized over their estimated useful life unless the life is indefinite.
Las Gallinas Valley Sanitary District
Notes to Financial Statements
Fiscal Years Ended June 30, 2017 and 2016
22
2. Summary of Significant Accounting Policies (continued)
Compensated Absences
The District provides vacation and sick leave benefits to its employees. Upon separation from employment, employees are paid for accumulated vacation days and accrued administrative and compensated time off (overtime hours for which pay is not taken). Employees who have been with the District for at least three years are also paid for one-half of their accumulated sick days. The District recognizes the related expense as the benefits are earned.
The District has accrued a liability for accumulated earned, but unused, leave.
Balance at June 30, 2016 452,225$ Accrued compensated absences earned 412,798 Accrued compensated absences used (377,814)
Net change in accrued compensated absences 34,984
Balance at June 30, 2017 487,209$
The current portion of the noncurrent liability to be used within the next year is estimated by management to be approximately $73,080, or 15%.
Deferred Outflows and Inflows of Resources
In addition to assets and liabilities, the Statement of Financial Position will sometimes report a separate section for deferred outflows of resources and deferred inflows of resources.
Deferred amount on debt refunding – Unamortized gains and losses from current or advance debt refunding result in deferred outflows of resources. This amount is amortized as a component of interest expense over the remaining life of the old debt or the life of the new debt, whichever is shorter.
Pension plan – The accounting valuation for the pension plan results in deferred outflows and deferred inflows of resources from several sources. In performing the actuarial valuation for the deferred compensation plan, changes in projected and actual earning on pension plan investments and adjustment due to differences in proportions for members of cost-sharing multiple-employer plans are calculated. The difference in proportions results from the California Public Employees Retirement System (CalPERS) allocation methodology. Rather than a single proportionate share applied to all components of pension expense, the CalPERS method applies employer proportions to various pension-related items such as assets, liabilities and service cost. This adjustment reconciles the difference in proportions for these various items with the employer’s change in net pension liability during the plan measurement period. The
Las Gallinas Valley Sanitary District
Notes to Financial Statements
Fiscal Years Ended June 30, 2017 and 2016
23
2. Summary of Significant Accounting Policies (continued)
amounts will be recognized over future periods equal to the expected average remaining service lifetime of the pool or 3.7 years for the June 30, 2016 measurement date (3.8 years for June 30, 2015.). In addition, since the measurement date of the pension plan is one year in advance of the financial statement reporting period (i.e. valuation of the pension plan assets has a measurement date of June 30, 2016 with the results reported in the District’s June 30, 2017 financial statements) contributions by the employer for 2017 and 2016 are deferred outflows at June 30, 2017 and 2016, respectively. These amounts will be recognized in the years subsequent to payment.
Restricted Assets and Liabilities
Restricted assets are items that have been restricted by either bond indentures, loan agreements or are to be used for specified purposes based on contract provisions, such as debt service. Restricted liabilities relate to assets restricted for their payment.
Property Taxes
The County of Marin levies taxes and places liens on real property as of January 1st on behalf of the District. Property taxes are due on the following November 1st and March 1st and become delinquent December 10th and April 10th for the first and second installments, respectively. All taxes collected for debt service are maintained in separate funds designated for payment of the debt (see Note 8).The District receives property taxes and Education Revenue Augmentation Funds (ERAF) from the County of Marin. The ERAF allows the state legislature to reallocate property tax amounts to local governments. For the years ended June 30, 2017 and 2016, the District received $872,282 and $826,906, respectively, in property taxes and $366,078 and $297,979, respectively, in ERAF.
Grants
The District's grants are cost-reimbursement grants, which are earned as the allowable expenditures under the agreement are made. A receivable is recorded when the criteria established for requesting reimbursement under the grant agreement has been satisfied and the amount of reimbursement is determinable. Grants for feasibility studies are recorded as nonoperating income. Grants for capital purposes are reported as capital contributions.
Connection Fees
The District charges connection fees to developers to reserve system capacity. Amounts charged are recorded as liabilities (deferred connection fees) until connections are actually made. Once connections are made, the fees are recognized as increases to capital contributions. In accordance with GASB No. 33, Accounting and Financial Reporting for
Las Gallinas Valley Sanitary District
Notes to Financial Statements
Fiscal Years Ended June 30, 2017 and 2016
24
2. Summary of Significant Accounting Policies (continued)
Nonexchange Transactions, the capital contributions are recorded in the Statements of Revenues, Expenses and Changes in Net Position.
Pensions
For purposes of measuring the net pension liability and deferred outflows/inflows of resources related to pensions and pension expense, information about the fiduciary net position of the District’s CalPERS plan (the Plan) and additions to/deductions from the Plan’s fiduciary net position have been determined on the same basis as they are reported by CalPERS. For this purpose, benefit payments (including refunds of employee contributions) are recognized when due and payable in accordance with the benefit terms. Investments are reported at fair value.
Interest
The District capitalizes the interest cost incurred for assets that require an acquisition period to get them ready for use. The interest cost capitalization period begins when the following three conditions are met: expenditures have occurred; activities necessary to prepare the asset, including administrative activities before construction, have begun; and interest cost has been incurred. Interest cost is not capitalized during delays or interruptions, other than for brief periods. For assets that are financed with tax-exempt debt, the interest income earned on unexpended funds is offset against the interest expenditures in determining the amount of interest to capitalize. When the project is completed, the interest cost will be included in the amount of the asset that is capitalized and depreciated over the assets’ useful life.
Use of Estimates
The preparation of financial statements in conformity with accounting principles generally accepted in the United States of America requires management to make estimates and assumptions that affect certain reported amounts of assets and liabilities and disclosure of contingent assets and liabilities at the date of the financial statements and certain reported amounts of revenues and expenses during the reporting period. Actual results could differ from those estimates.
New Accounting Pronouncements
In November 2016, the Governmental Accounting Standards Board (GASB) issued Statement No. 83, Certain Asset Retirement Obligations (GASB No. 83). GASB No. 83 addresses accounting and financial reporting for certain asset retirement obligations (AROs). An ARO is a legally enforceable liability associated with the retirement of a tangible capital asset. A government that has legal obligations to perform future asset retirement activities related to its tangible capital assets should recognize a liability based on the guidance in GASB No. 83.
Las Gallinas Valley Sanitary District
Notes to Financial Statements
Fiscal Years Ended June 30, 2017 and 2016
25
2. Summary of Significant Accounting Policies (continued)
GASB No. 83 will enhance comparability of financial statements among governments by establishing uniform criteria for governments to recognize and measure certain AROs, including obligations that may not have been previously reported. GASB No. 83 will enhance the decision-usefulness of the information provided to financial statement users by requiring disclosures related to those AROs. The requirements of GASB No. 83 are effective for reporting periods beginning after June 15, 2018. The District does not believe that there will be any financial statement effect related to GASB No. 83. In January 2017 GASB issued Statement No. 84, Fiduciary Activities (GASB No. 84). The objective of which is to improve guidance regarding the identification of fiduciary activities for accounting and financial reporting purposes and how those activities should be reported. The requirements of GASB No. 84 will enhance consistency and comparability by (1) establishing specific criteria for identifying activities that should be reported as fiduciary activities and (2) clarifying whether and how business-type activities should report their fiduciary activities. The requirements of GASB No. 84 are effective for reporting periods beginning after December 15, 2018. The District does not believe that there will be any financial statement effect related to GASB No. 84. In March 2017, GASB issued Statement No. 85, Omnibus 2017 (GASB No. 85). The objective of this Statement is to address practice issues that have been identified during implementation and application of certain GASB Statements. GASB No. 85 addresses a variety of topics including issues related to blending component units, goodwill, fair value measurement and application, and postemployment benefits (pensions and other postemployment benefits [OPEB]). Specifically, the following topics are addressed:
Blending a component unit in circumstances in which the primary government is a business-type activity that reports in a single column for financial statement presentation
Reporting amounts previously reported as goodwill and “negative” goodwill Classifying real estate held by insurance entities Measuring certain money market investments and participating interest-earning
investment contracts at amortized cost Timing of the measurement of pension or OPEB liabilities and expenditures recognized
in financial statements prepared using the current financial resources measurement focus
Recognizing on-behalf payments for pensions or OPEB in employer financial statements Presenting payroll-related measures in required supplementary information for purposes
of reporting by OPEB plans and employers that provide OPEB Classifying employer-paid member contributions for OPEB Simplifying certain aspects of the alternative measurement method for OPEB
Las Gallinas Valley Sanitary District
Notes to Financial Statements
Fiscal Years Ended June 30, 2017 and 2016
26
2. Summary of Significant Accounting Policies (continued)
Accounting and financial reporting for OPEB provided through certain multiple-employer defined benefit OPEB plans.
The requirements of GASB No. 85 are effective for reporting periods beginning after June 15, 2017. The District is evaluating the impact of GASB No. 85 on its financial statements. In May 2017, GASB issued Statement No. 86, Certain Debt Extinguishment Issues (GASB No. 86). The primary objective of GASB No. 86 is to improve consistency in accounting and financial reporting for in-substance defeasance of debt by providing guidance for transactions in which cash and other monetary assets acquired with only existing resources—resources other than the proceeds of refunding debt—are placed in an irrevocable trust for the sole purpose of extinguishing debt. GASB No. 86 also improves accounting and financial reporting for prepaid insurance on debt that is extinguished and notes to financial statements for debt that is defeased in substance. The requirements of GASB No. 86 are effective for reporting periods beginning after June 15, 2017. The District does not believe that there will be any financial statement effect related to GASB No. 86. In June 2017, GASB issued Statement No. 87, Leases (GASB No. 87). The objective of GASB No. 87 is to better meet the information needs of financial statement users by improving accounting and financial reporting for leases by governments. GASB No. 87 increases the usefulness of governments’ financial statements by requiring recognition of certain lease assets and liabilities for leases that previously were classified as operating leases and recognized as inflows of resources or outflows of resources based on the payment provisions of the contract. It establishes a single model for lease accounting based on the foundational principle that leases are financings of the right to use an underlying asset. Under GASB No. 87, a lessee is required to recognize a lease liability and an intangible right-to-use lease asset, and a lessor is required to recognize a lease receivable and a deferred inflow of resources, thereby enhancing the relevance and consistency of information about governments’ leasing activities. GASB No. 87 will increase the usefulness of governments’ financial statements by requiring reporting of certain lease liabilities that currently are not reported. It will enhance comparability of financial statements among governments by requiring lessees and lessors to report leases under a single model. GASB No. 87 also will enhance the decision-usefulness of the information provided to financial statement users by requiring notes to financial statements related to the timing, significance, and purpose of a government’s leasing arrangements. The requirements of GASB No. 87 are effective for reporting periods beginning after December 15, 2019. The District is evaluating the impact of GASB No. 85 on its financial statements.
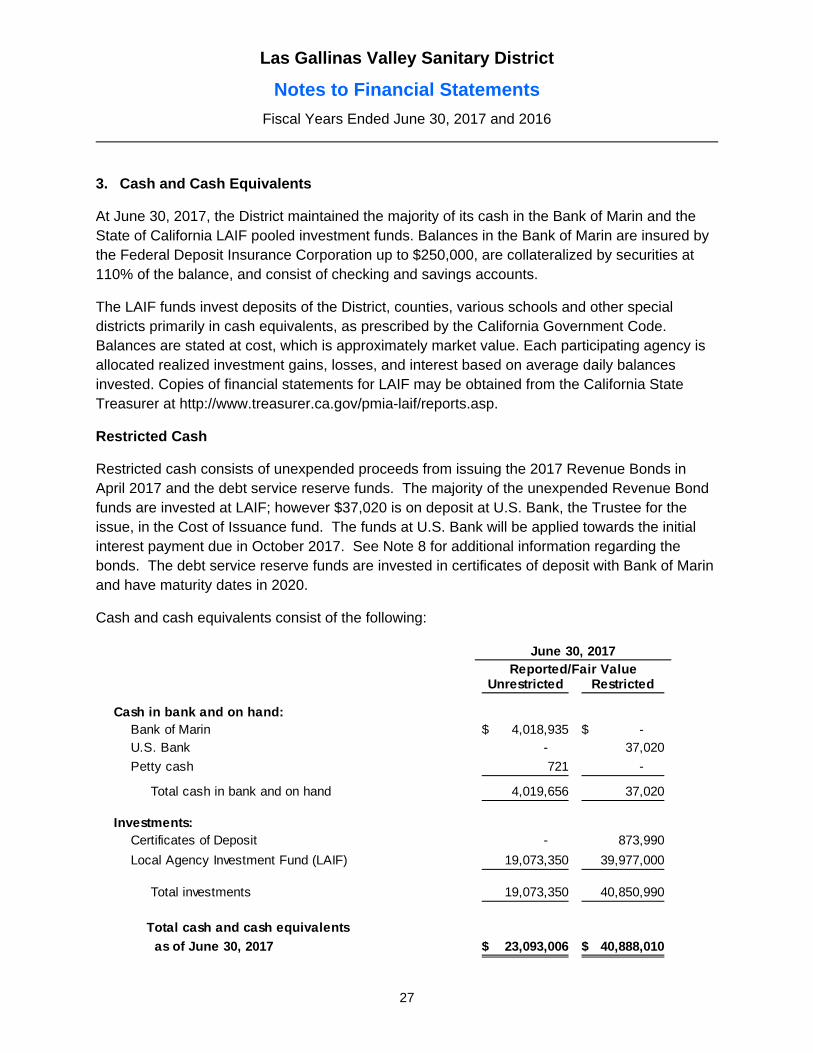
Las Gallinas Valley Sanitary District
Notes to Financial Statements
Fiscal Years Ended June 30, 2017 and 2016
27
3. Cash and Cash Equivalents
At June 30, 2017, the District maintained the majority of its cash in the Bank of Marin and the State of California LAIF pooled investment funds. Balances in the Bank of Marin are insured by the Federal Deposit Insurance Corporation up to $250,000, are collateralized by securities at 110% of the balance, and consist of checking and savings accounts.
The LAIF funds invest deposits of the District, counties, various schools and other special districts primarily in cash equivalents, as prescribed by the California Government Code. Balances are stated at cost, which is approximately market value. Each participating agency is allocated realized investment gains, losses, and interest based on average daily balances invested. Copies of financial statements for LAIF may be obtained from the California State Treasurer at http://www.treasurer.ca.gov/pmia-laif/reports.asp.
Restricted Cash
Restricted cash consists of unexpended proceeds from issuing the 2017 Revenue Bonds in April 2017 and the debt service reserve funds. The majority of the unexpended Revenue Bond funds are invested at LAIF; however $37,020 is on deposit at U.S. Bank, the Trustee for the issue, in the Cost of Issuance fund. The funds at U.S. Bank will be applied towards the initial interest payment due in October 2017. See Note 8 for additional information regarding the bonds. The debt service reserve funds are invested in certificates of deposit with Bank of Marin and have maturity dates in 2020.
Cash and cash equivalents consist of the following:
Unrestricted Restricted
Cash in bank and on hand:Bank of Marin 4,018,935$ -$ U.S. Bank - 37,020
Petty cash 721 -
Total cash in bank and on hand 4,019,656 37,020
Investments:Certificates of Deposit - 873,990
Local Agency Investment Fund (LAIF) 19,073,350 39,977,000
Total investments 19,073,350 40,850,990
Total cash and cash equivalents
as of June 30, 2017 23,093,006$ 40,888,010$
Reported/Fair ValueJune 30, 2017

Las Gallinas Valley Sanitary District
Notes to Financial Statements
Fiscal Years Ended June 30, 2017 and 2016
28
3. Cash and Cash Equivalents (continued)
Unrestricted RestrictedCash in bank and on hand:
Bank of Marin 4,148,074$ -$ Petty cash 851 -
Total cash in bank and on hand 4,148,925 -
Investments:Certificates of Deposit - 867,096 Local Agency Investment Fund (LAIF) 16,167,192 -
Total investments 16,167,192 867,096
Total cash and cash equivalents as of June 30, 2016 20,316,117$ 867,096$
Reported/Fair ValueJune 30, 2016
For the purpose of the statements of cash flows, cash and cash equivalents include all items of cash and investments with original maturities of three months or less.
Investments Authorized by the District's Investment Policy
The table below identifies the investment types that are authorized by the District. The table also identifies certain provisions of the District's investment policy that addresses interest rate risk, credit risk and concentration of credit risk. This table does not address investments of debt proceeds held by the bond trustee that are governed by the provisions of debt agreements of the District, rather than the general provisions of the California Government Code or the District's investment policy.
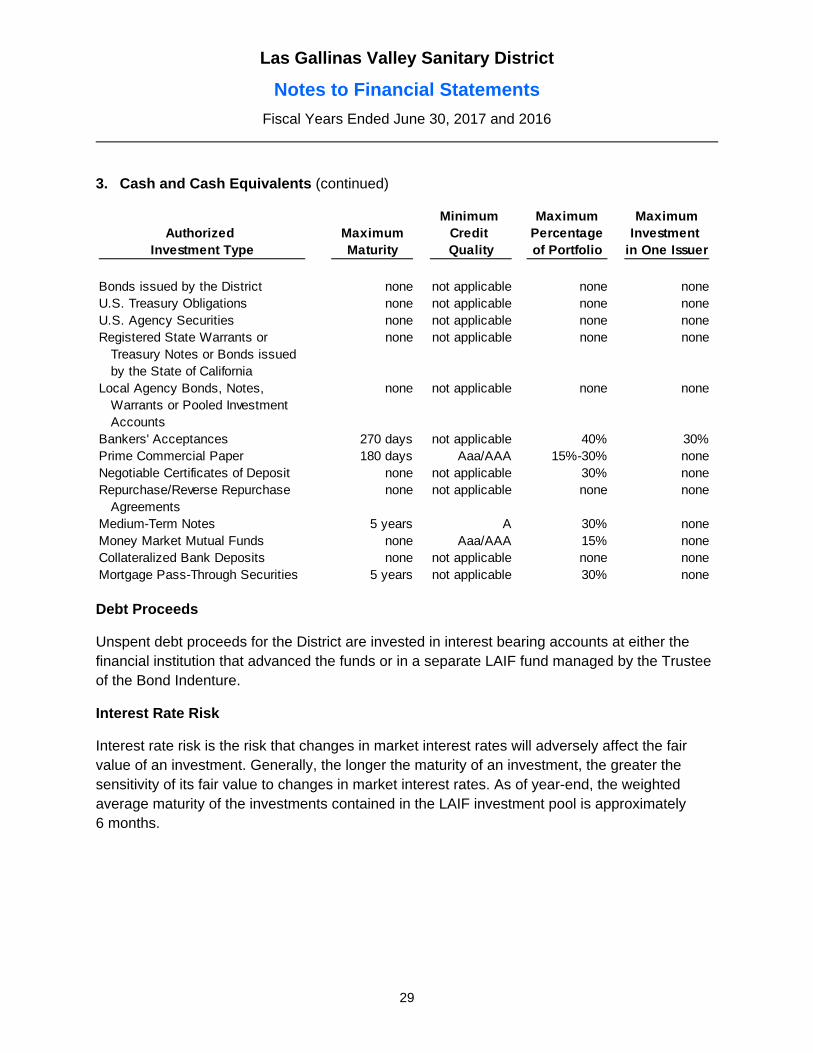
Las Gallinas Valley Sanitary District
Notes to Financial Statements
Fiscal Years Ended June 30, 2017 and 2016
29
3. Cash and Cash Equivalents (continued)
Minimum Maximum MaximumAuthorized Maximum Credit Percentage Investment
Investment Type Maturity Quality of Portfolio in One Issuer
Bonds issued by the District none not applicable none noneU.S. Treasury Obligations none not applicable none noneU.S. Agency Securities none not applicable none noneRegistered State Warrants or none not applicable none none
Treasury Notes or Bonds issued by the State of California
Local Agency Bonds, Notes, none not applicable none noneWarrants or Pooled InvestmentAccounts
Bankers' Acceptances 270 days not applicable 40% 30%Prime Commercial Paper 180 days Aaa/AAA 15%-30% noneNegotiable Certificates of Deposit none not applicable 30% noneRepurchase/Reverse Repurchase none not applicable none none
AgreementsMedium-Term Notes 5 years A 30% noneMoney Market Mutual Funds none Aaa/AAA 15% noneCollateralized Bank Deposits none not applicable none noneMortgage Pass-Through Securities 5 years not applicable 30% none
Debt Proceeds
Unspent debt proceeds for the District are invested in interest bearing accounts at either the financial institution that advanced the funds or in a separate LAIF fund managed by the Trustee of the Bond Indenture.
Interest Rate Risk
Interest rate risk is the risk that changes in market interest rates will adversely affect the fair value of an investment. Generally, the longer the maturity of an investment, the greater the sensitivity of its fair value to changes in market interest rates. As of year-end, the weighted average maturity of the investments contained in the LAIF investment pool is approximately 6 months.
Las Gallinas Valley Sanitary District
Notes to Financial Statements
Fiscal Years Ended June 30, 2017 and 2016
30
3. Cash and Cash Equivalents (continued)
Information about the sensitivity of the fair values of the District's investments to market interest rate fluctuations is provided by the following table that shows the maturity date of its investments at June 30, 2017:
MaturityDate
Certificates of Deposit 873,990$ 1,127 days averageLAIF 59,050,350 194 days average
59,924,340$
Credit Risk
Generally, credit risk is the risk of an issuer that an investment will not fulfill its obligation to the holder of the investment. This is measured by the assignment of a rating by a nationally recognized statistical rating organization. LAIF does not have a rating provided by a nationally recognized statistical rating organization.
Custodial Credit Risk
Custodial credit risk for deposits is the risk that, in the event of the failure of a depository financial institution, a government will not be able to recover its deposits nor will it be able to recover collateral securities that are in the possession of an outside party. The custodial credit risk for investments is the risk that, in the event of the failure of the counterparty to a transaction, a government will not be able to recover the value of its investment or collateral securities that are in the possession of another party. The California Government Code and the District's investment policy do not contain legal or policy requirements that would limit the exposure to custodial credit risk for deposits or investments, other than the following provision for deposits: The California Government Code requires that a financial institution secure deposits made by state or local governmental units by pledging securities in an undivided collateral pool held by a depository regulated under state law (unless so waived by the governmental unit). The market value of the pledged securities in the collateral pool must equal at least 110% of the total amount deposited by the public agencies. California law also allows financial institutions to secure District deposits by pledging first trust deed mortgage notes having a value of 150% of the secured public deposits. With respect to investments, custodial credit risk generally applies only to direct investment in marketable securities. Custodial credit risk does not apply to a local government's indirect investment in securities through the use of mutual funds or government investment pools (such as LAIF). The State of California has no additional requirements for custodial credit risk, nor does the District.
Las Gallinas Valley Sanitary District
Notes to Financial Statements
Fiscal Years Ended June 30, 2017 and 2016
31
3. Cash and Cash Equivalents (continued)
Certificates of Deposit
The District is required to maintain cash of $853,491 in debt reserve funds, equal to one year’s debt service for the State Revolving Fund and for the loans from Bank of Marin. Since these funds will not be needed until the final year of maturity of the loans, the District has invested them in certificates of deposit. These accounts pay interest at 0.792% and mature in July and August 2020, respectively.
Investment in State Investment Pool
The District is a voluntary participant in the LAIF that is regulated by the California Government Code under the oversight of the Treasurer of the State of California. The fair value of the District's investment in this pool is based upon the District's pro-rata share of the fair value provided by LAIF for the entire LAIF portfolio (in relation to the amortized cost of that portfolio). The District's proportionate share of that value was $58,987,796 and $16,527,051 as of June 30, 2017 and 2016, respectively. There are no derivatives included in the portfolio. Included in LAIF's investment portfolio are asset-backed securities totaling $1,419 million and $1,718 million as of June 30, 2017 and 2016, respectively, and $825 million and $400 million in structured notes as of June 30, 2017 and 2016, respectively. The balance available for withdrawal is based on the accounting records maintained by LAIF, which are recorded on an amortized cost basis. The current and prior year changes in fair value were not material to the financial statements as a whole and, therefore, have not been presented.
4. Accounts Receivable
The majority of the District's sewer user charge revenue and all of the property tax revenue is collected by the County of Marin through charges on the tax rolls. The collections are remitted to the District as follows: 55% in December, 40% in April, and the balance of 5% during June and July. The June and July remittances allow the County as the collection agent to true-up any changes for revisions in the sewer charges after the initial calculation in August.
5. Private Sewer Lateral Assistance Program
The District has a private sewer lateral assistance program which allows property owners to receive an advance to repair or replace their sewer laterals. The maximum that may be advanced under the program is $10,000 per property, with interest charged at 2%, and the amount is repaid over 10 years through the property tax collections.
As of June 30, 2017 and 2016, collections made by the County of Marin, but remitted to the District subsequently, were $5,135 and $19,903, respectively.
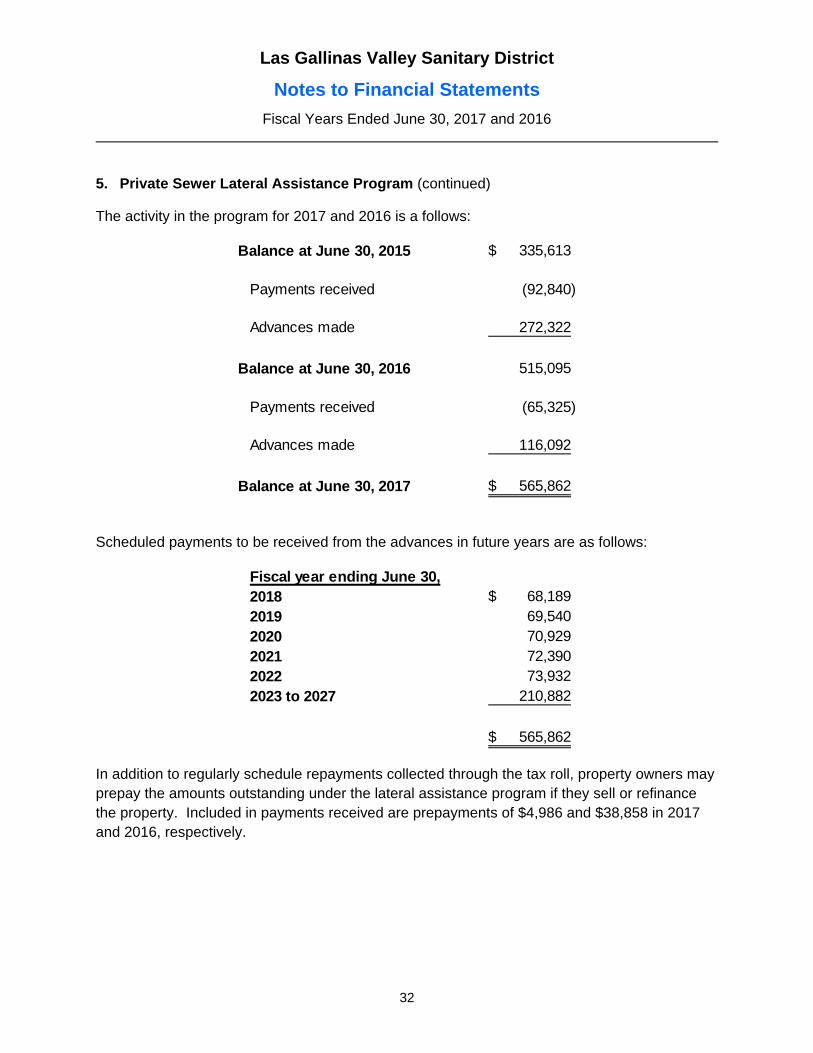
Las Gallinas Valley Sanitary District
Notes to Financial Statements
Fiscal Years Ended June 30, 2017 and 2016
32
5. Private Sewer Lateral Assistance Program (continued)
The activity in the program for 2017 and 2016 is a follows:
Balance at June 30, 2015 335,613$
Payments received (92,840)
Advances made 272,322
Balance at June 30, 2016 515,095
Payments received (65,325)
Advances made 116,092
Balance at June 30, 2017 565,862$
Scheduled payments to be received from the advances in future years are as follows:
Fiscal year ending June 30,2018 68,189$ 2019 69,540 2020 70,929 2021 72,390 2022 73,932 2023 to 2027 210,882
565,862$
In addition to regularly schedule repayments collected through the tax roll, property owners may prepay the amounts outstanding under the lateral assistance program if they sell or refinance the property. Included in payments received are prepayments of $4,986 and $38,858 in 2017 and 2016, respectively.
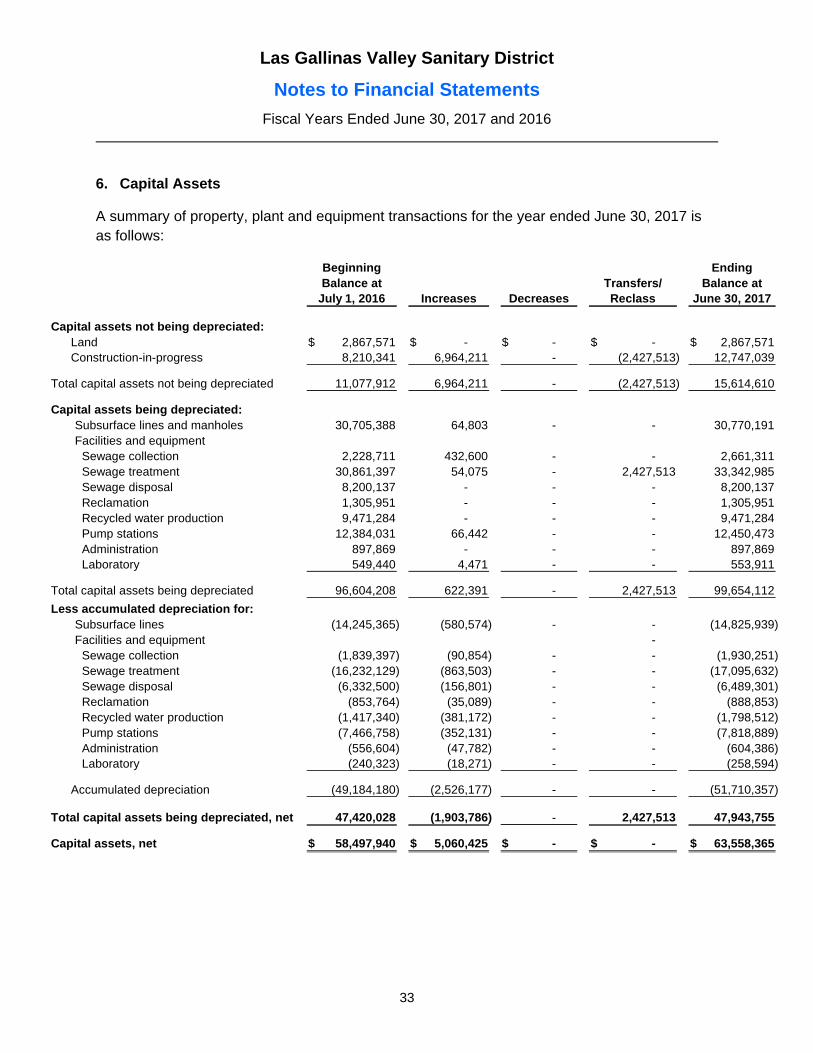
Las Gallinas Valley Sanitary District
Notes to Financial Statements
Fiscal Years Ended June 30, 2017 and 2016
33
6. Capital Assets
A summary of property, plant and equipment transactions for the year ended June 30, 2017 is as follows:
Beginning EndingBalance at Transfers/ Balance at
July 1, 2016 Increases Decreases Reclass June 30, 2017
Capital assets not being depreciated:Land 2,867,571$ -$ -$ -$ 2,867,571$ Construction-in-progress 8,210,341 6,964,211 - (2,427,513) 12,747,039
Total capital assets not being depreciated 11,077,912 6,964,211 - (2,427,513) 15,614,610
Capital assets being depreciated:Subsurface lines and manholes 30,705,388 64,803 - - 30,770,191 Facilities and equipment
Sewage collection 2,228,711 432,600 - - 2,661,311 Sewage treatment 30,861,397 54,075 - 2,427,513 33,342,985 Sewage disposal 8,200,137 - - - 8,200,137 Reclamation 1,305,951 - - - 1,305,951 Recycled water production 9,471,284 - - - 9,471,284 Pump stations 12,384,031 66,442 - - 12,450,473 Administration 897,869 - - - 897,869 Laboratory 549,440 4,471 - - 553,911
Total capital assets being depreciated 96,604,208 622,391 - 2,427,513 99,654,112
Less accumulated depreciation for:Subsurface lines (14,245,365) (580,574) - - (14,825,939) Facilities and equipment -
Sewage collection (1,839,397) (90,854) - - (1,930,251) Sewage treatment (16,232,129) (863,503) - - (17,095,632) Sewage disposal (6,332,500) (156,801) - - (6,489,301) Reclamation (853,764) (35,089) - - (888,853) Recycled water production (1,417,340) (381,172) - - (1,798,512) Pump stations (7,466,758) (352,131) - - (7,818,889) Administration (556,604) (47,782) - - (604,386) Laboratory (240,323) (18,271) - - (258,594)
Accumulated depreciation (49,184,180) (2,526,177) - - (51,710,357)
Total capital assets being depreciated, net 47,420,028 (1,903,786) - 2,427,513 47,943,755
Capital assets, net 58,497,940$ 5,060,425$ -$ -$ 63,558,365$
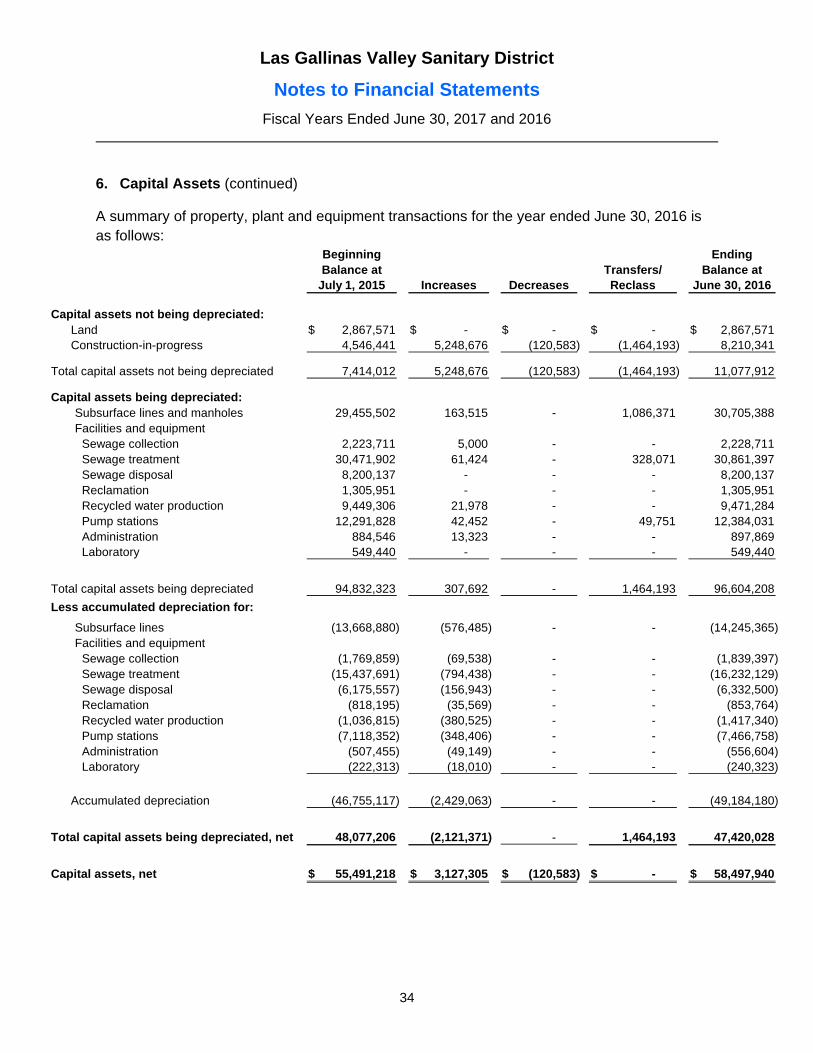
Las Gallinas Valley Sanitary District
Notes to Financial Statements
Fiscal Years Ended June 30, 2017 and 2016
34
6. Capital Assets (continued)
A summary of property, plant and equipment transactions for the year ended June 30, 2016 is as follows:
Beginning EndingBalance at Transfers/ Balance at
July 1, 2015 Increases Decreases Reclass June 30, 2016
Capital assets not being depreciated:Land 2,867,571$ -$ -$ -$ 2,867,571$ Construction-in-progress 4,546,441 5,248,676 (120,583) (1,464,193) 8,210,341
Total capital assets not being depreciated 7,414,012 5,248,676 (120,583) (1,464,193) 11,077,912
Capital assets being depreciated:Subsurface lines and manholes 29,455,502 163,515 - 1,086,371 30,705,388 Facilities and equipment
Sewage collection 2,223,711 5,000 - - 2,228,711 Sewage treatment 30,471,902 61,424 - 328,071 30,861,397 Sewage disposal 8,200,137 - - - 8,200,137 Reclamation 1,305,951 - - - 1,305,951 Recycled water production 9,449,306 21,978 - - 9,471,284 Pump stations 12,291,828 42,452 - 49,751 12,384,031 Administration 884,546 13,323 - - 897,869 Laboratory 549,440 - - - 549,440
Total capital assets being depreciated 94,832,323 307,692 - 1,464,193 96,604,208
Less accumulated depreciation for:
Subsurface lines (13,668,880) (576,485) - - (14,245,365) Facilities and equipment
Sewage collection (1,769,859) (69,538) - - (1,839,397) Sewage treatment (15,437,691) (794,438) - - (16,232,129) Sewage disposal (6,175,557) (156,943) - - (6,332,500) Reclamation (818,195) (35,569) - - (853,764) Recycled water production (1,036,815) (380,525) - - (1,417,340) Pump stations (7,118,352) (348,406) - - (7,466,758) Administration (507,455) (49,149) - - (556,604) Laboratory (222,313) (18,010) - - (240,323)
Accumulated depreciation (46,755,117) (2,429,063) - - (49,184,180)
Total capital assets being depreciated, net 48,077,206 (2,121,371) - 1,464,193 47,420,028
Capital assets, net 55,491,218$ 3,127,305$ (120,583)$ -$ 58,497,940$

Las Gallinas Valley Sanitary District
Notes to Financial Statements
Fiscal Years Ended June 30, 2017 and 2016
35
7. Water Disposal and Recycled Water
In 1988, the District entered into a water-reclamation agreement with MMWD to provide for the disposal of treated wastewater. At a facility located on the District’s property, MMWD provides further treatment to the wastewater in order to distribute it as recycled water. The contract, which was set to expire in December 2016, has been extended until December 31, 2018.
In 2017, the District entered into a purchase and sale of recycled water agreement with MMWD. The District will provide MMWD with 2.5 million gallons per day of plant capacity to produce a minimum of 600 acre fee per year, for 30 years. As part of the agreement, MMWD made an initial payment towards the cost of the existing facility of $333,563 and will make quarterly payments of $51,637 through October 1, 2022 and after that $26,890 per quarter through July 1, 2031. In addition, the District is designing an expansion of the existing facility in order to serve MMWD. Funding for the expansion is from part of the proceeds of the 2017 Revenue Bonds and a WaterSmart Grant awarded in 2015. The project has not been awarded as of June 30, 2017 so a firm construction cost is not known; however per the agreement it is expected that cost of the portion of the expansion ascribed to MMWD is $4.6 million. The first payment is due October 1, 2017 and semi-annually after that through April 1, 2042. See Note 8E for further information regarding the bonds. The agreement with MMWD may be modified to revise the payment amounts once the construction contract is awarded and after construction is completed and all costs are known. MMWD is responsible for demolishing the existing facility which is located on the District’s site. The agreement also provides that should MMWD decide based on financial concerns, at the 100% design phase of the expansion to terminate the agreement that it will pay its proportionate share of costs incurred to date including bond issuance costs and associated bond call premium. If after the bids for construction are received both parties agree not to proceed, each party will pay their proportionated share of costs incurred.
Future minimum payments expected to be received from MMWD are as follows:
TotalFiscal year ending June 30,2018 455,057$ 2019 463,143 2020 463,352 2021 463,394 2022 463,268 2023 to 2027 1,870,200
2028 to 2032 1,740,582
Thereafter 2,585,077
8,504,073$
Las Gallinas Valley Sanitary District
Notes to Financial Statements
Fiscal Years Ended June 30, 2017 and 2016
36
7. Water Disposal and Recycled Water (continued)
In addition to these payments, MMWD will be charged for deliveries of recycled water based on the District’s regular, ongoing operations and maintenance costs and deposits into a capital repair and replacement fund equal to 10% of annual operations and maintenance costs.
In 2011, the District entered into an agreement with NMWD to annually produce at least 220 acre feet of recycled water for 20 years. NMWD will reimburse the District for its operating and maintenance costs associated with producing the recycled water.
8. Long-Term Obligations
A. Wastewater Revenue Certificates of Participation, Series 2005 and Note Payable with Municipal Finance Corporation
The District issued $10,000,000 of Wastewater Revenue Certificates of Participation Bonds rated AA on November 15, 2005. The bonds had maturity dates ranging from December 1, 2006 through December 1, 2025 and carried an average interest rate of 4%. The net proceeds from the sale, after paying issuance costs, underwriter fees, and the reserve surety bond premium was $9,774,000.
In April 2014, the bonds were refinanced with Municipal Finance Corporation, a private lender. The principal balance outstanding was $6,880,000 and a 1% early call premium of $68,800 was required to retire the bonds. The new note payable of $6,948,800 will be paid over the remaining term of the old debt, with principal payments due each December 1st; and interest payments are due each December 1st and June 1st through 2025. The interest rate on the new debt is 3.3%.
The discount of $42,442 and the call premium of $68,800 are recorded as a Deferred Outflow of Resources – Deferred amount on debt refunding and are being amortized over the life of the loan. The accumulated amortization is $29,979 at June 30, 2017 and $20,512 at June 20, 2016; the amount charged to interest expense was $9,467 for both June 30, 2017 and 2016.
The debt is payable solely from net revenues of the District. Net revenues consist generally of all revenues after payment of adjusted operation and maintenance costs and include property taxes received by the District.
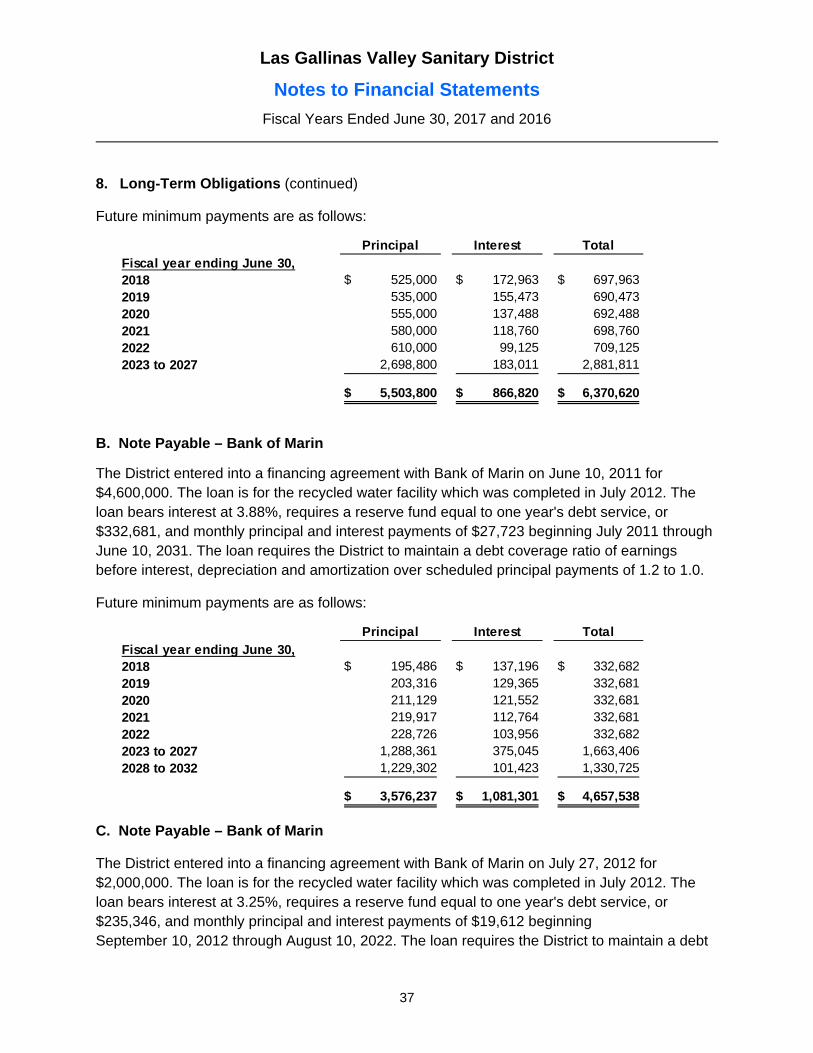
Las Gallinas Valley Sanitary District
Notes to Financial Statements
Fiscal Years Ended June 30, 2017 and 2016
37
8. Long-Term Obligations (continued)
Future minimum payments are as follows:
Principal Interest TotalFiscal year ending June 30,2018 525,000$ 172,963$ 697,963$ 2019 535,000 155,473 690,473 2020 555,000 137,488 692,488 2021 580,000 118,760 698,760 2022 610,000 99,125 709,125 2023 to 2027 2,698,800 183,011 2,881,811
5,503,800$ 866,820$ 6,370,620$
B. Note Payable – Bank of Marin
The District entered into a financing agreement with Bank of Marin on June 10, 2011 for $4,600,000. The loan is for the recycled water facility which was completed in July 2012. The loan bears interest at 3.88%, requires a reserve fund equal to one year's debt service, or $332,681, and monthly principal and interest payments of $27,723 beginning July 2011 through June 10, 2031. The loan requires the District to maintain a debt coverage ratio of earnings before interest, depreciation and amortization over scheduled principal payments of 1.2 to 1.0.
Future minimum payments are as follows:
Principal Interest TotalFiscal year ending June 30,2018 195,486$ 137,196$ 332,682$ 2019 203,316 129,365 332,681 2020 211,129 121,552 332,681 2021 219,917 112,764 332,681 2022 228,726 103,956 332,682 2023 to 2027 1,288,361 375,045 1,663,406 2028 to 2032 1,229,302 101,423 1,330,725
3,576,237$ 1,081,301$ 4,657,538$
C. Note Payable – Bank of Marin
The District entered into a financing agreement with Bank of Marin on July 27, 2012 for $2,000,000. The loan is for the recycled water facility which was completed in July 2012. The loan bears interest at 3.25%, requires a reserve fund equal to one year's debt service, or $235,346, and monthly principal and interest payments of $19,612 beginning September 10, 2012 through August 10, 2022. The loan requires the District to maintain a debt
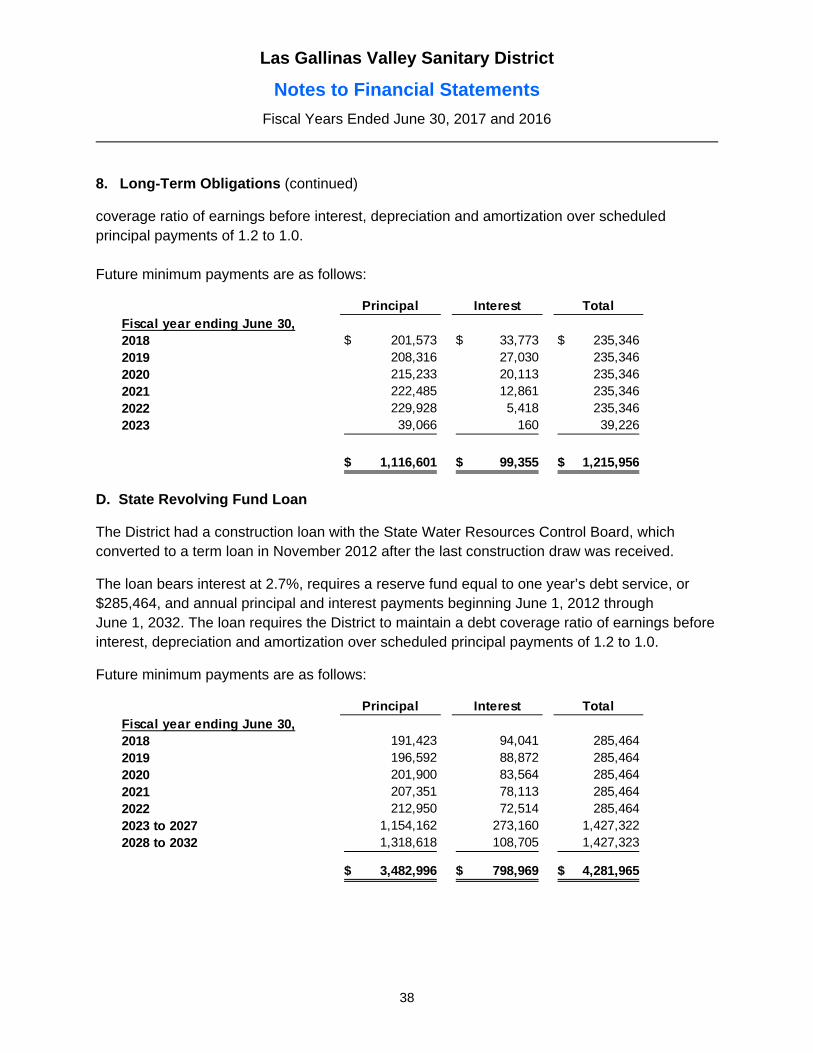
Las Gallinas Valley Sanitary District
Notes to Financial Statements
Fiscal Years Ended June 30, 2017 and 2016
38
8. Long-Term Obligations (continued)
coverage ratio of earnings before interest, depreciation and amortization over scheduled principal payments of 1.2 to 1.0. Future minimum payments are as follows:
Principal Interest TotalFiscal year ending June 30,2018 201,573$ 33,773$ 235,346$ 2019 208,316 27,030 235,346 2020 215,233 20,113 235,346 2021 222,485 12,861 235,346 2022 229,928 5,418 235,346 2023 39,066 160 39,226
1,116,601$ 99,355$ 1,215,956$
D. State Revolving Fund Loan
The District had a construction loan with the State Water Resources Control Board, which converted to a term loan in November 2012 after the last construction draw was received.
The loan bears interest at 2.7%, requires a reserve fund equal to one year’s debt service, or $285,464, and annual principal and interest payments beginning June 1, 2012 through June 1, 2032. The loan requires the District to maintain a debt coverage ratio of earnings before interest, depreciation and amortization over scheduled principal payments of 1.2 to 1.0.
Future minimum payments are as follows:
Principal Interest TotalFiscal year ending June 30,2018 191,423 94,041 285,464 2019 196,592 88,872 285,464 2020 201,900 83,564 285,464 2021 207,351 78,113 285,464 2022 212,950 72,514 285,464 2023 to 2027 1,154,162 273,160 1,427,322 2028 to 2032 1,318,618 108,705 1,427,323
3,482,996$ 798,969$ 4,281,965$
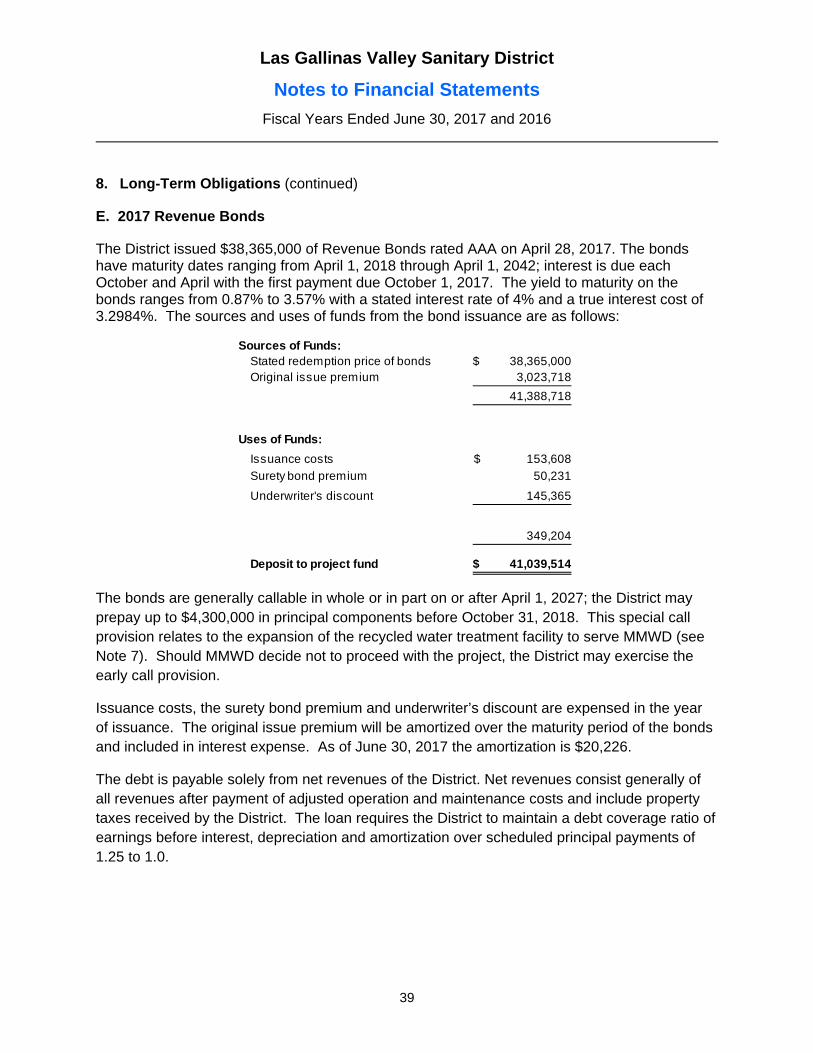
Las Gallinas Valley Sanitary District
Notes to Financial Statements
Fiscal Years Ended June 30, 2017 and 2016
39
8. Long-Term Obligations (continued)
E. 2017 Revenue Bonds
The District issued $38,365,000 of Revenue Bonds rated AAA on April 28, 2017. The bonds have maturity dates ranging from April 1, 2018 through April 1, 2042; interest is due each October and April with the first payment due October 1, 2017. The yield to maturity on the bonds ranges from 0.87% to 3.57% with a stated interest rate of 4% and a true interest cost of 3.2984%. The sources and uses of funds from the bond issuance are as follows:
Sources of Funds:Stated redemption price of bonds 38,365,000$ Original issue premium 3,023,718
41,388,718
Uses of Funds:
Issuance costs 153,608$
Surety bond premium 50,231
Underwriter's discount 145,365
349,204
Deposit to project fund 41,039,514$
The bonds are generally callable in whole or in part on or after April 1, 2027; the District may prepay up to $4,300,000 in principal components before October 31, 2018. This special call provision relates to the expansion of the recycled water treatment facility to serve MMWD (see Note 7). Should MMWD decide not to proceed with the project, the District may exercise the early call provision.
Issuance costs, the surety bond premium and underwriter’s discount are expensed in the year of issuance. The original issue premium will be amortized over the maturity period of the bonds and included in interest expense. As of June 30, 2017 the amortization is $20,226.
The debt is payable solely from net revenues of the District. Net revenues consist generally of all revenues after payment of adjusted operation and maintenance costs and include property taxes received by the District. The loan requires the District to maintain a debt coverage ratio of earnings before interest, depreciation and amortization over scheduled principal payments of 1.25 to 1.0.
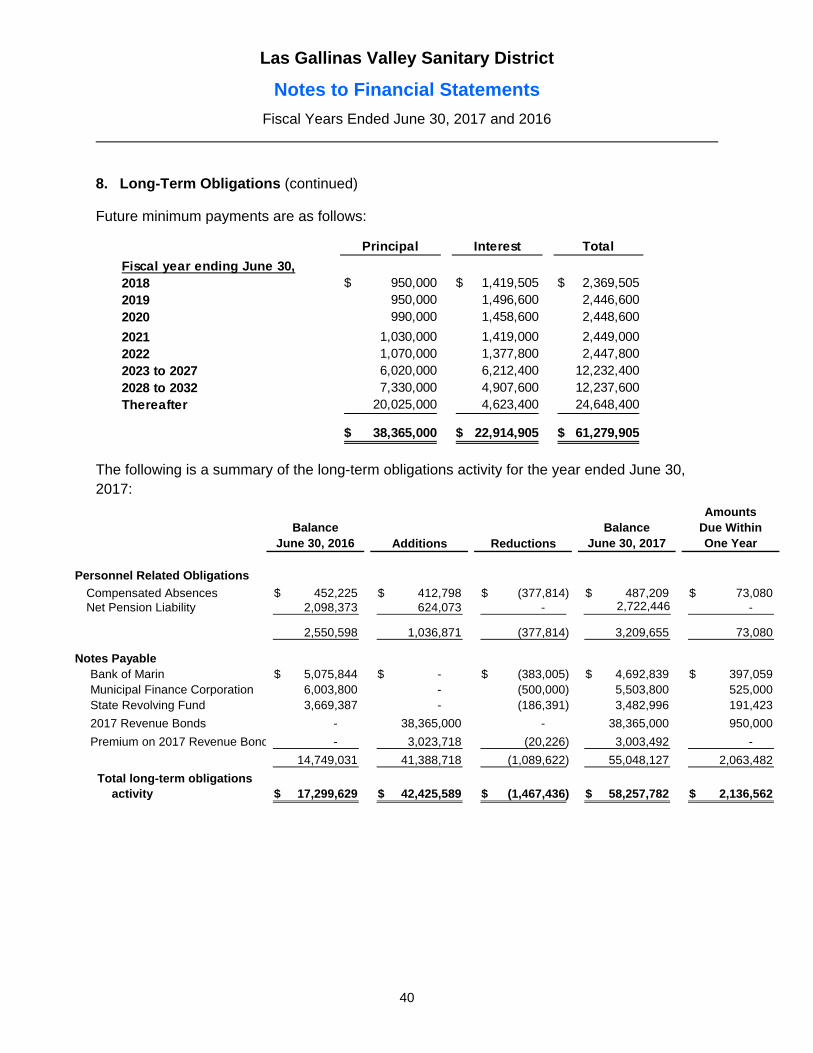
Las Gallinas Valley Sanitary District
Notes to Financial Statements
Fiscal Years Ended June 30, 2017 and 2016
40
8. Long-Term Obligations (continued)
Future minimum payments are as follows:
Principal Interest Total
Fiscal year ending June 30,2018 950,000$ 1,419,505$ 2,369,505$ 2019 950,000 1,496,600 2,446,600 2020 990,000 1,458,600 2,448,600
2021 1,030,000 1,419,000 2,449,000 2022 1,070,000 1,377,800 2,447,800 2023 to 2027 6,020,000 6,212,400 12,232,400 2028 to 2032 7,330,000 4,907,600 12,237,600 Thereafter 20,025,000 4,623,400 24,648,400
38,365,000$ 22,914,905$ 61,279,905$
The following is a summary of the long-term obligations activity for the year ended June 30, 2017:
BalanceJune 30, 2016 Additions Reductions
BalanceJune 30, 2017
AmountsDue WithinOne Year
Personnel Related Obligations
Compensated Absences 452,225$ 412,798$ (377,814)$ 487,209$ 73,080$ Net Pension Liability 2,098,373 624,073 - 2,722,446 -
2,550,598 1,036,871 (377,814) 3,209,655 73,080
Notes PayableBank of Marin 5,075,844$ -$ (383,005)$ 4,692,839$ 397,059$ Municipal Finance Corporation 6,003,800 - (500,000) 5,503,800 525,000 State Revolving Fund 3,669,387 - (186,391) 3,482,996 191,423
2017 Revenue Bonds - 38,365,000 - 38,365,000 950,000
Premium on 2017 Revenue Bond - 3,023,718 (20,226) 3,003,492 -
14,749,031 41,388,718 (1,089,622) 55,048,127 2,063,482
Total long-term obligations activity 17,299,629$ 42,425,589$ (1,467,436)$ 58,257,782$ 2,136,562$
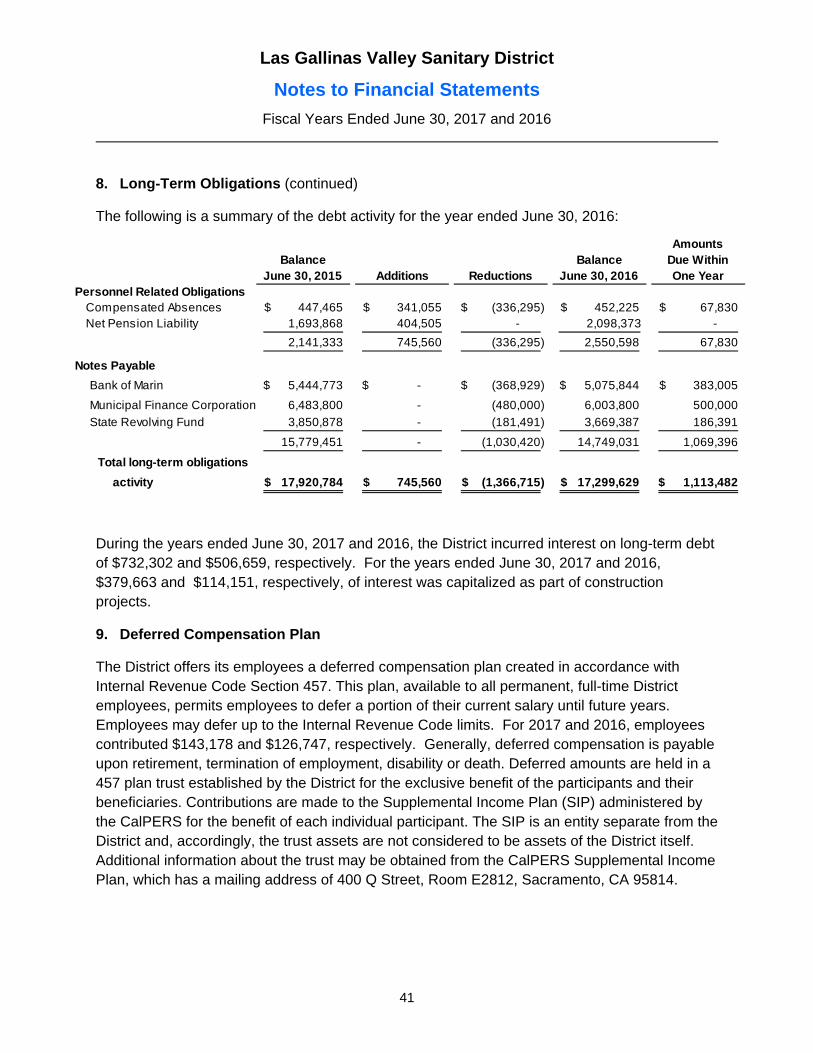
Las Gallinas Valley Sanitary District
Notes to Financial Statements
Fiscal Years Ended June 30, 2017 and 2016
41
8. Long-Term Obligations (continued)
The following is a summary of the debt activity for the year ended June 30, 2016:
BalanceJune 30, 2015 Additions Reductions
BalanceJune 30, 2016
AmountsDue WithinOne Year
Personnel Related ObligationsCompensated Absences 447,465$ 341,055$ (336,295)$ 452,225$ 67,830$ Net Pension Liability 1,693,868 404,505 - 2,098,373 -
2,141,333 745,560 (336,295) 2,550,598 67,830
Notes Payable
Bank of Marin 5,444,773$ -$ (368,929)$ 5,075,844$ 383,005$
Municipal Finance Corporation 6,483,800 - (480,000) 6,003,800 500,000
State Revolving Fund 3,850,878 - (181,491) 3,669,387 186,391
15,779,451 - (1,030,420) 14,749,031 1,069,396
Total long-term obligations
activity 17,920,784$ 745,560$ (1,366,715)$ 17,299,629$ 1,113,482$
During the years ended June 30, 2017 and 2016, the District incurred interest on long-term debt of $732,302 and $506,659, respectively. For the years ended June 30, 2017 and 2016, $379,663 and $114,151, respectively, of interest was capitalized as part of construction projects.
9. Deferred Compensation Plan
The District offers its employees a deferred compensation plan created in accordance with Internal Revenue Code Section 457. This plan, available to all permanent, full-time District employees, permits employees to defer a portion of their current salary until future years. Employees may defer up to the Internal Revenue Code limits. For 2017 and 2016, employees contributed $143,178 and $126,747, respectively. Generally, deferred compensation is payable upon retirement, termination of employment, disability or death. Deferred amounts are held in a 457 plan trust established by the District for the exclusive benefit of the participants and their beneficiaries. Contributions are made to the Supplemental Income Plan (SIP) administered by the CalPERS for the benefit of each individual participant. The SIP is an entity separate from the District and, accordingly, the trust assets are not considered to be assets of the District itself. Additional information about the trust may be obtained from the CalPERS Supplemental Income Plan, which has a mailing address of 400 Q Street, Room E2812, Sacramento, CA 95814.
Las Gallinas Valley Sanitary District
Notes to Financial Statements
Fiscal Years Ended June 30, 2017 and 2016
42
10. Commitments
The District was contractually committed to contractors and vendors for various projects totaling $9,209,279 and $4,930,747 as of June 30, 2017 and 2016, respectively.
11. Defined Benefit Pension Plan
Plan Description and Benefits Provided
The District contributes to the CalPERS, a cost sharing multiple-employer defined benefit pension plan. The contribution requirements of the plan members are established by state statute and the employer contribution rates are established and may be amended by CalPERS. The actuarial methods and assumptions used are those adopted by the CalPERS Board of Administration. Contributions by the employer and the employee are based on eligible employees’ regular rate of pay without inclusion of overtime, stand-by pay, or separation pay of accrued time off, which prevents spiking of retirement benefits.
CalPERS provides retirement and disability benefits, annual cost-of-living adjustments, and death benefits to plan members and beneficiaries. CalPERS acts as a common investment and administrative agent for participating public entities within the State of California. Benefit provisions and all other requirements are established by state statute. The benefits are based on the plan formulas, and the member’s years of service, age and final compensation. Because the District has less than 100 active members, it is required by CalPERS to participate in a cost sharing multiple-employer risk pool of similar agencies that all have the same contract formula. Copies of CalPERS' annual financial report may be obtained from its Executive Office at 400 P Street, Sacramento, CA 95814.
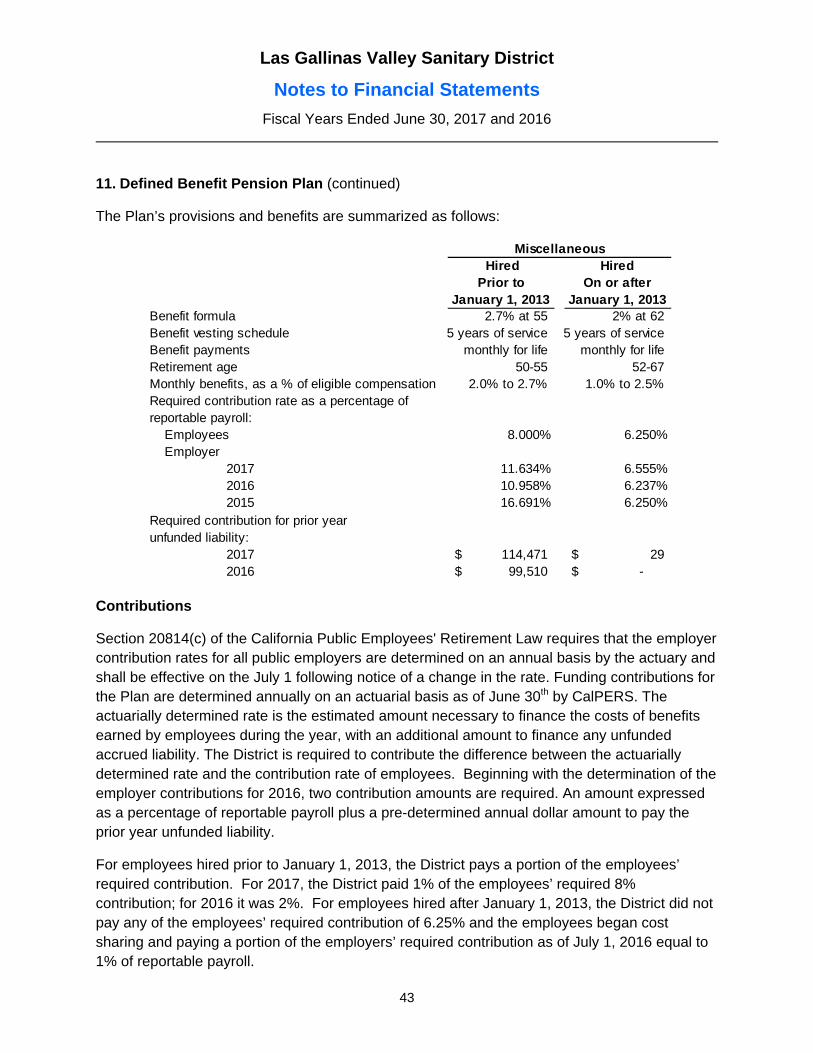
Las Gallinas Valley Sanitary District
Notes to Financial Statements
Fiscal Years Ended June 30, 2017 and 2016
43
11. Defined Benefit Pension Plan (continued)
The Plan’s provisions and benefits are summarized as follows:
HiredPrior to
January 1, 2013
HiredOn or after
January 1, 2013Benefit formula 2.7% at 55 2% at 62Benefit vesting schedule 5 years of service 5 years of serviceBenefit payments monthly for life monthly for lifeRetirement age 50-55 52-67Monthly benefits, as a % of eligible compensation 2.0% to 2.7% 1.0% to 2.5%
Employees 8.000% 6.250%Employer
2017 11.634% 6.555%2016 10.958% 6.237%2015 16.691% 6.250%
2017 114,471$ 29$ 2016 99,510$ -$
Miscellaneous
Required contribution rate as a percentage of reportable payroll:
Required contribution for prior year unfunded liability:
Contributions
Section 20814(c) of the California Public Employees' Retirement Law requires that the employer contribution rates for all public employers are determined on an annual basis by the actuary and shall be effective on the July 1 following notice of a change in the rate. Funding contributions for the Plan are determined annually on an actuarial basis as of June 30th by CalPERS. The actuarially determined rate is the estimated amount necessary to finance the costs of benefits earned by employees during the year, with an additional amount to finance any unfunded accrued liability. The District is required to contribute the difference between the actuarially determined rate and the contribution rate of employees. Beginning with the determination of the employer contributions for 2016, two contribution amounts are required. An amount expressed as a percentage of reportable payroll plus a pre-determined annual dollar amount to pay the prior year unfunded liability.
For employees hired prior to January 1, 2013, the District pays a portion of the employees’ required contribution. For 2017, the District paid 1% of the employees’ required 8% contribution; for 2016 it was 2%. For employees hired after January 1, 2013, the District did not pay any of the employees’ required contribution of 6.25% and the employees began cost sharing and paying a portion of the employers’ required contribution as of July 1, 2016 equal to 1% of reportable payroll.

Las Gallinas Valley Sanitary District
Notes to Financial Statements
Fiscal Years Ended June 30, 2017 and 2016
44
11. Defined Benefit Pension Plan (continued)
For the years ended June 30, 2017 and 2016, the contributions recognized as part of pension expense for each Plan were as follows:
June 30, 2017 June 30, 2016
Contributions - employer 331,133$ 295,427$ Contributions - employee (paid by employer) 14,731 27,985
345,864$ 323,412$
Pension Liabilities, Pension Expense and Deferred Outflows and Inflows of Resources Related to Pension
The District’s proportionate share of the net pension liability is $2,722,446 and $2,098,373 as of June 30, 2017 and 2016, respectively.
The District's net pension liability for the Plan is measured as the proportionate share of the net pension liability. The liability and deferred outflows and inflows of resources are determined from actuarial valuations that are prepared at dates that differ from the financial statement reporting periods in these statements. For June 30, 2017 (measurement date June 30, 2016), the CalPERS actuarial valuation is dated June 30, 2015 and the liabilities are rolled forward to June 30, 2016. For June 30, 2016, the CalPERS actuarial valuation is dated June 30, 2014 and the liabilities are rolled forward to June 30, 2015. The District's proportion of the net pension liability was based on a projection of the District's long-term share of contributions to the pension plan relative to the projected contributions of all participating employers, actuarially determined.
The District's proportionate share of the net pension liability was as follows:
Dollars PercentageProportion - June 30, 2015 2,098,373$ 0.030571%Proportion - June 30, 2016 2,722,446 0.031462%
Change - Increase (Decrease) 624,073$ 0.000891%
Dollars PercentageProportion - June 30, 2014 1,693,868$ 0.027220%Proportion - June 30, 2015 2,098,373 0.030571%
Change - Increase (Decrease) 404,505$ 0.007950%
Financial Statement Report as of June 30, 2017
Financial Statement Report as of June 30, 2016
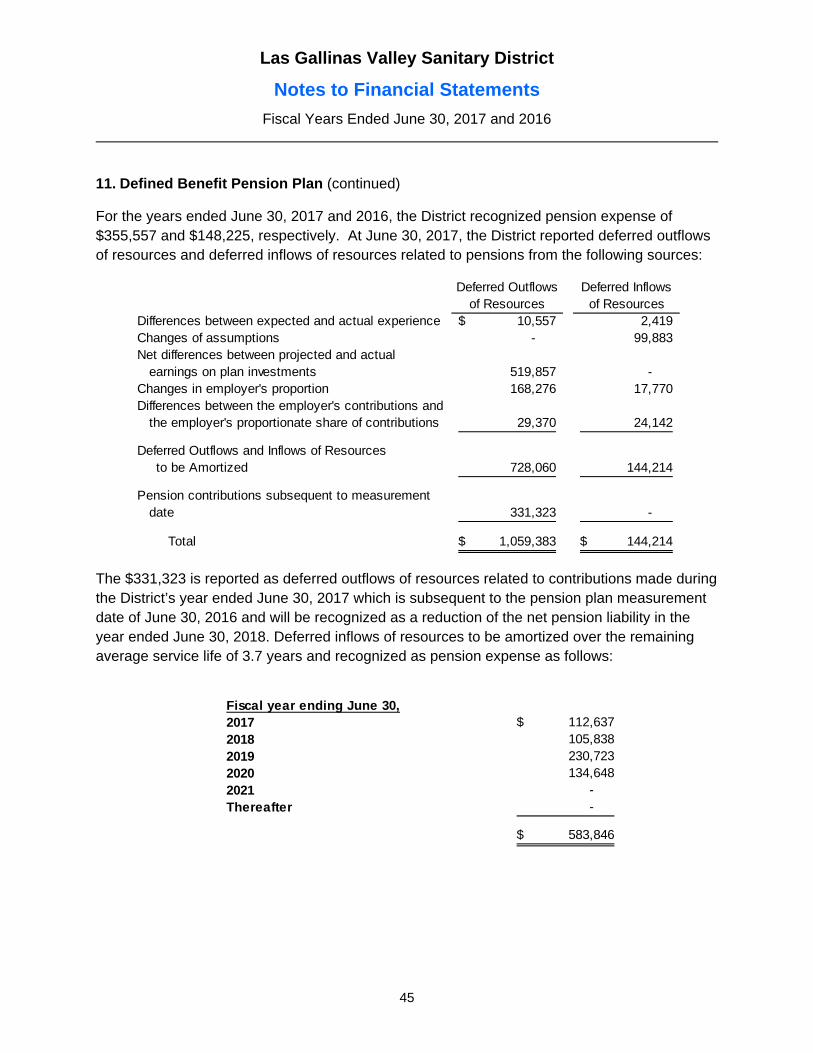
Las Gallinas Valley Sanitary District
Notes to Financial Statements
Fiscal Years Ended June 30, 2017 and 2016
45
11. Defined Benefit Pension Plan (continued)
For the years ended June 30, 2017 and 2016, the District recognized pension expense of $355,557 and $148,225, respectively. At June 30, 2017, the District reported deferred outflows of resources and deferred inflows of resources related to pensions from the following sources:
Deferred Outflowsof Resources
Deferred Inflowsof Resources
Differences between expected and actual experience 10,557$ 2,419 Changes of assumptions - 99,883 Net differences between projected and actual
earnings on plan investments 519,857 - Changes in employer's proportion 168,276 17,770 Differences between the employer's contributions and
the employer's proportionate share of contributions 29,370 24,142
Deferred Outflows and Inflows of Resources to be Amortized 728,060 144,214
Pension contributions subsequent to measurementdate 331,323 -
Total 1,059,383$ 144,214$
The $331,323 is reported as deferred outflows of resources related to contributions made during the District’s year ended June 30, 2017 which is subsequent to the pension plan measurement date of June 30, 2016 and will be recognized as a reduction of the net pension liability in the year ended June 30, 2018. Deferred inflows of resources to be amortized over the remaining average service life of 3.7 years and recognized as pension expense as follows:
Fiscal year ending June 30,2017 112,637$ 2018 105,838 2019 230,723 2020 134,648 2021 - Thereafter -
583,846$
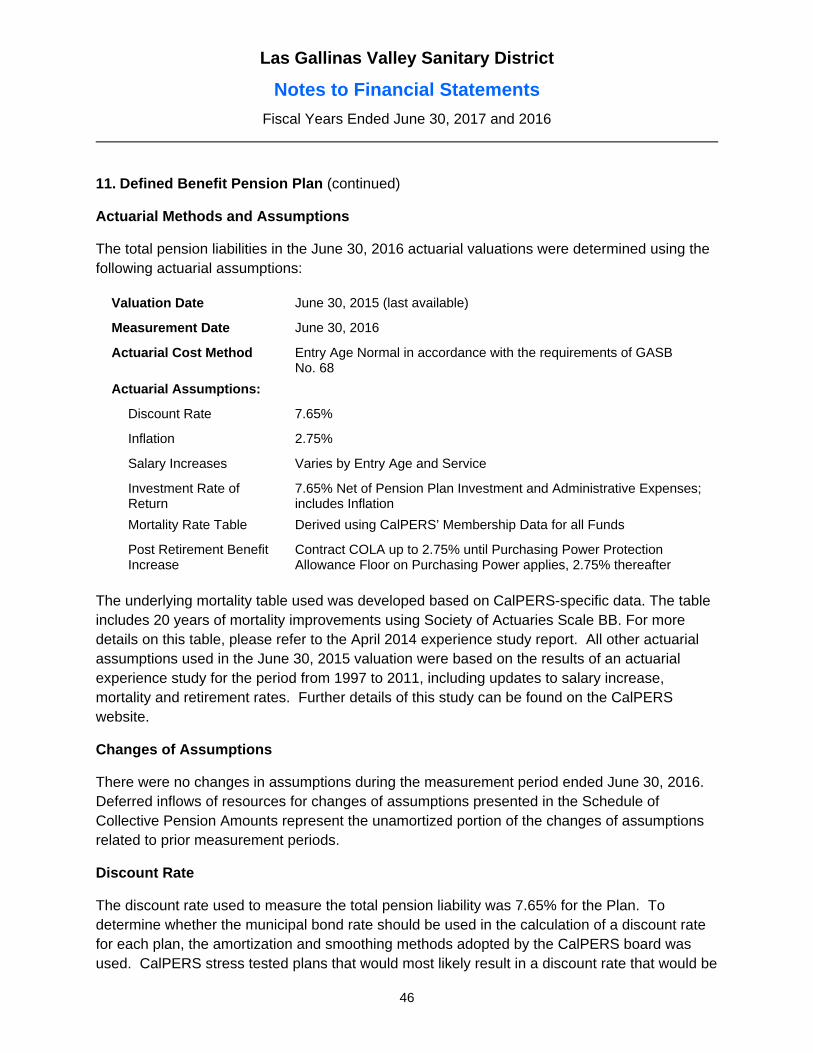
Las Gallinas Valley Sanitary District
Notes to Financial Statements
Fiscal Years Ended June 30, 2017 and 2016
46
11. Defined Benefit Pension Plan (continued)
Actuarial Methods and Assumptions
The total pension liabilities in the June 30, 2016 actuarial valuations were determined using the following actuarial assumptions:
Valuation Date June 30, 2015 (last available)
Measurement Date June 30, 2016
Actuarial Cost Method Entry Age Normal in accordance with the requirements of GASB No. 68
Actuarial Assumptions:
Discount Rate 7.65%
Inflation 2.75%
Salary Increases Varies by Entry Age and Service
Investment Rate of Return
7.65% Net of Pension Plan Investment and Administrative Expenses; includes Inflation
Mortality Rate Table Derived using CalPERS’ Membership Data for all Funds
Post Retirement Benefit Increase
Contract COLA up to 2.75% until Purchasing Power Protection Allowance Floor on Purchasing Power applies, 2.75% thereafter
The underlying mortality table used was developed based on CalPERS-specific data. The table includes 20 years of mortality improvements using Society of Actuaries Scale BB. For more details on this table, please refer to the April 2014 experience study report. All other actuarial assumptions used in the June 30, 2015 valuation were based on the results of an actuarial experience study for the period from 1997 to 2011, including updates to salary increase, mortality and retirement rates. Further details of this study can be found on the CalPERS website.
Changes of Assumptions
There were no changes in assumptions during the measurement period ended June 30, 2016. Deferred inflows of resources for changes of assumptions presented in the Schedule of Collective Pension Amounts represent the unamortized portion of the changes of assumptions related to prior measurement periods.
Discount Rate
The discount rate used to measure the total pension liability was 7.65% for the Plan. To determine whether the municipal bond rate should be used in the calculation of a discount rate for each plan, the amortization and smoothing methods adopted by the CalPERS board was used. CalPERS stress tested plans that would most likely result in a discount rate that would be

Las Gallinas Valley Sanitary District
Notes to Financial Statements
Fiscal Years Ended June 30, 2017 and 2016
47
11. Defined Benefit Pension Plan (continued)
different from the actuarially assumed discount rate. Based on the testing, none of the tested plans run out of assets. Therefore, the current 7.65% discount rate is adequate and the use of the municipal bond rate calculation is not necessary. The long term expected rate of return will be applied to all plans in the Public Employees Retirement Fund (PERF). The stress test results are presented in a detailed report that can be obtained from the CalPERS website.
CalPERS is scheduled to review all actuarial assumptions as part of its regular Asset Liability Management (ALM) review cycle that is scheduled to be completed in February 2018. Any changes to the discount rate will require Board action and proper stakeholder outreach. CalPERS will continue to check the materiality of the difference in calculation until such time as it has changed their methodology.
The long-term expected rate of return on pension plan investments was determined using a building-block method in which best-estimate ranges of expected future real rates of return (expected returns, net of pension plan investment expense and inflation) are developed for each major asset class.
In determining the long-term expected rate of return, CalPERS took into account both short-term and long-term market return expectations as well as the expected pension fund cash flows. Using historical returns of all the funds' asset classes, expected compound returns were calculated over the short-term (first 10 years) and the long-term (11-60 years) using a building-block approach. Using the expected nominal returns for both short-term and long-term, the present value of benefits was calculated for each fund. The expected rate of return was set by calculating the single equivalent expected return that arrived at the same present value of benefits for cash flows as the one calculated using both short-term and long-term returns. The expected rate of return was then set equivalent to the single equivalent rate calculated above and rounded down to the nearest one quarter of one percent.
The following table reflects the long-term expected real rate of return by asset class. The rate of return was calculated using the capital market assumptions applied to determine the discount rate and asset allocation. These rates of return are net of administrative expenses.
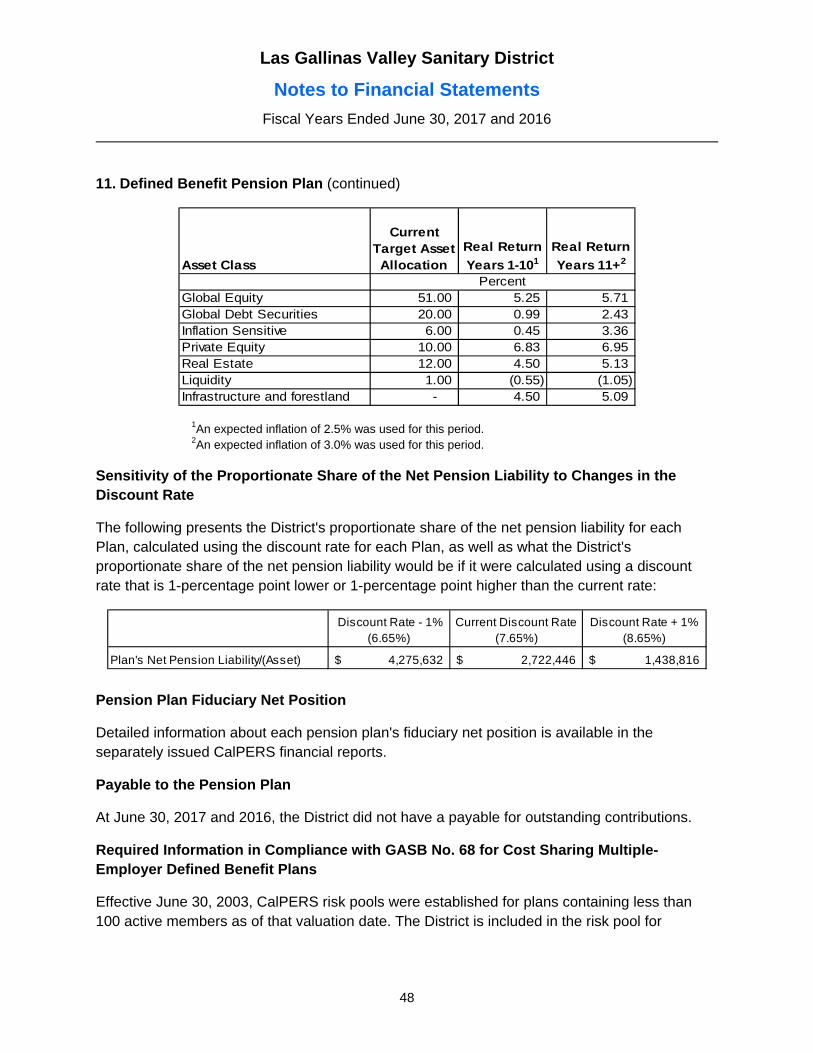
Las Gallinas Valley Sanitary District
Notes to Financial Statements
Fiscal Years Ended June 30, 2017 and 2016
48
11. Defined Benefit Pension Plan (continued)
Asset Class
Current Target Asset Allocation
Real Return
Years 1-101
Real Return
Years 11+2
Global Equity 51.00 5.25 5.71 Global Debt Securities 20.00 0.99 2.43 Inflation Sensitive 6.00 0.45 3.36 Private Equity 10.00 6.83 6.95 Real Estate 12.00 4.50 5.13 Liquidity 1.00 (0.55) (1.05) Infrastructure and forestland - 4.50 5.09
Percent
1An expected inflation of 2.5% was used for this period. 2An expected inflation of 3.0% was used for this period.
Sensitivity of the Proportionate Share of the Net Pension Liability to Changes in the Discount Rate
The following presents the District's proportionate share of the net pension liability for each Plan, calculated using the discount rate for each Plan, as well as what the District's proportionate share of the net pension liability would be if it were calculated using a discount rate that is 1-percentage point lower or 1-percentage point higher than the current rate:
Discount Rate - 1%(6.65%)
Current Discount Rate(7.65%)
Discount Rate + 1%(8.65%)
Plan's Net Pension Liability/(Asset) 4,275,632$ 2,722,446$ 1,438,816$ Pension Plan Fiduciary Net Position
Detailed information about each pension plan's fiduciary net position is available in the separately issued CalPERS financial reports.
Payable to the Pension Plan
At June 30, 2017 and 2016, the District did not have a payable for outstanding contributions.
Required Information in Compliance with GASB No. 68 for Cost Sharing Multiple-Employer Defined Benefit Plans
Effective June 30, 2003, CalPERS risk pools were established for plans containing less than 100 active members as of that valuation date. The District is included in the risk pool for
Las Gallinas Valley Sanitary District
Notes to Financial Statements
Fiscal Years Ended June 30, 2017 and 2016
49
11. Defined Benefit Pension Plan (continued)
“Miscellaneous Retirement Plan 2.7% at 55” and/or “Miscellaneous Retirement Plan 2.0% at 62.” In the latest Annual Valuation Report as of June 30, 2016, the CalPERS Board approved certain assumptions and methods used to determine the contractually required contributions for the cost sharing multiple-employer defined benefit plan.
Public Employees’ Pension Reform Act of 2013 (PEPRA)
On January 1, 2013, the Public Employees’ Pension Reform Act of 2013 (PEPRA) took effect. In addition to creating new retirement formulas for newly hired members, PEPRA also effectively closed all existing active risk pools to new employees. As such, it is no longer appropriate to assume that the payroll of the risk pools for the classic formulas will continue to grow at 3 percent annually. Funding the promised pension benefits as a percentage of payrolls would lead to the underfunding of the plans. In addition, the current allocation of the existing unfunded liabilities based on payroll would create equity issues for employers within the risk pools. Furthermore, the declining payroll of the classic formula risk pools will lead to unacceptable levels of employer rate volatility.
In order to address these issues, the CalPERS Board of Administration structural changes to the risk pools approved at their May 21, 2014 meeting. All pooled plans will be combined into two active risk pools, one for all miscellaneous groups and one for all safety groups, effective with the 2013 valuations. By combining the risk pools this way, the payroll of the risk pools and the employers within the risk pools can once again be expected to increase at the assumed 3 percent annual growth. This change will allow the continuation of current level percent of payroll amortization schedule. However, two important changes are being made which that affect employers.
Beginning in 2016, CalPERS collected employer contributions toward the unfunded liability and side fund as dollar amounts instead of the prior method of a contribution rate. This change will address the funding issue that would still arise from the declining population of classic formula members. Although employers will be invoiced at the beginning of the fiscal year for their unfunded liability and side fund payments, the plan’s normal cost contribution will continue to be collected as a percentage of each payroll.
The risk pool’s unfunded liability will be allocated to each individual plan based on the plan’s total liability rather than by the plan’s individual payroll. This will allow employers to track their own unfunded liability and pay it down faster if they choose. The change in the allocation of unfunded liabilities will result in some employers paying more towards their unfunded liability and some paying less.
Las Gallinas Valley Sanitary District
Notes to Financial Statements
Fiscal Years Ended June 30, 2017 and 2016
50
11. Defined Benefit Pension Plan (continued)
The impact of most of the PEPRA changes will first show up in the rates and the benefit provision listings of the June 30, 2013 valuation that sets the contribution rates for the 2016 fiscal year. For more detailed information on changes due to PEPRA, please refer to the CalPERS website.
The Schedule of Funding Progress, presented as required supplementary information following the notes to the financial statements, presents multiyear trend information about whether the actuarial value of plan assets is increasing or decreasing relative to the actuarial accrued liability for benefits.
12. Other Post-employment Benefits
Plan Description
In addition to the pension benefits described in Note 11, the District provides other post-employment benefits (OPEB) in the form of health insurance to employees in accordance with the Memorandum of Understanding between the District and its employees. These employees must meet certain service requirements and retire directly from employment with the District. According to the most current post-employment medical benefits plan, effective July 1, 2014 there are four tiers of benefits.
Tier 1 – Employees who retired prior to January 1, 2003, with five years of service, receive a benefit that is indexed by 6% each year and are eligible for spousal coverage up to the benefit cap. The monthly cap was $734 as of January 1, 2017, $694 as of January 1, 2016, and $654 as of January 1, 2015.
Tier 2 – Employees who were employed prior to January 1, 2003, and retire with five years of District service, receive a monthly benefit that is set by the California Department of Personnel Administration. The monthly benefit cap was $707 as of January 1, 2017, $705 as of January 1, 2016, and $655 as of January 1, 2015. This benefit is available to the employee only without any spousal coverage.
Tier 3 – Employees hired after January 1, 2003 are eligible for benefits from 50% to 100% of the rate established by the California Department of Personnel Administration. They have to work for the District for at least five years, retire from the District, and have a minimum of 10 years of CalPERS agency service to receive a 50% benefit. The benefit increases 5% each year after that until the maximum coverage is reached at 20 years of service.
Tier 4 – Employees who are hired after July 1, 2014 and retire from the District after 10 years of service are eligible for benefits from 50% to 100% of the rate established by the California
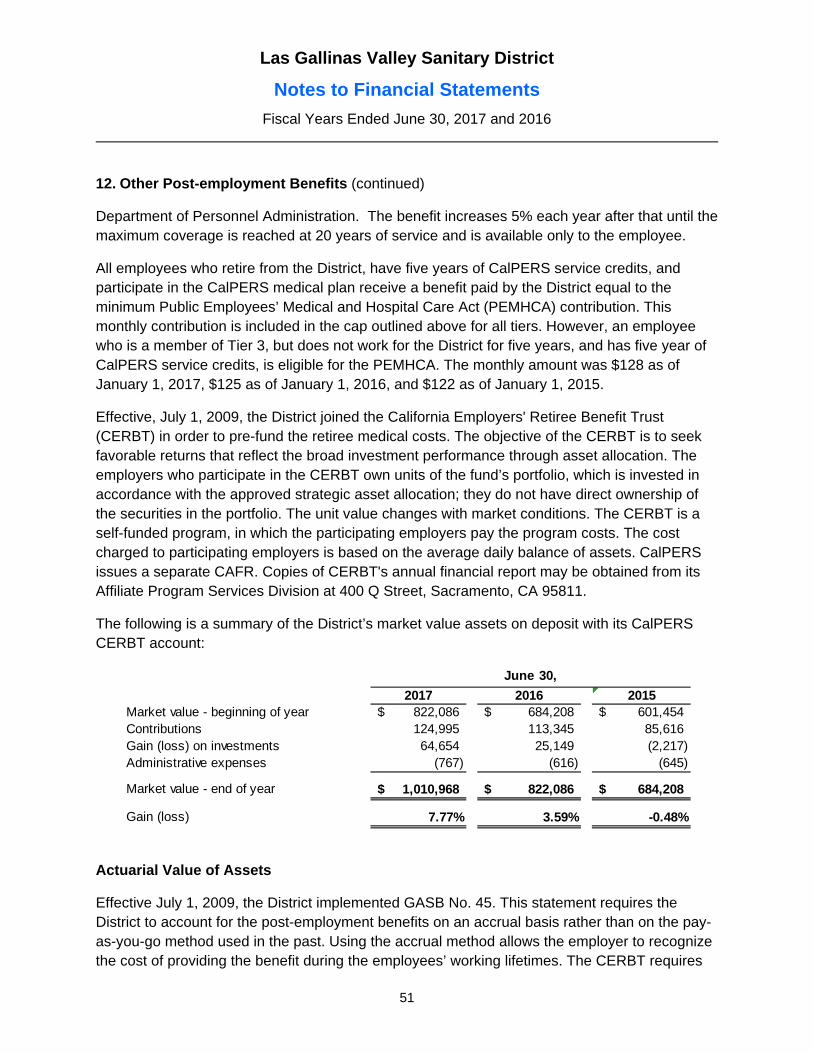
Las Gallinas Valley Sanitary District
Notes to Financial Statements
Fiscal Years Ended June 30, 2017 and 2016
51
12. Other Post-employment Benefits (continued)
Department of Personnel Administration. The benefit increases 5% each year after that until the maximum coverage is reached at 20 years of service and is available only to the employee.
All employees who retire from the District, have five years of CalPERS service credits, and participate in the CalPERS medical plan receive a benefit paid by the District equal to the minimum Public Employees’ Medical and Hospital Care Act (PEMHCA) contribution. This monthly contribution is included in the cap outlined above for all tiers. However, an employee who is a member of Tier 3, but does not work for the District for five years, and has five year of CalPERS service credits, is eligible for the PEMHCA. The monthly amount was $128 as of January 1, 2017, $125 as of January 1, 2016, and $122 as of January 1, 2015.
Effective, July 1, 2009, the District joined the California Employers' Retiree Benefit Trust (CERBT) in order to pre-fund the retiree medical costs. The objective of the CERBT is to seek favorable returns that reflect the broad investment performance through asset allocation. The employers who participate in the CERBT own units of the fund’s portfolio, which is invested in accordance with the approved strategic asset allocation; they do not have direct ownership of the securities in the portfolio. The unit value changes with market conditions. The CERBT is a self-funded program, in which the participating employers pay the program costs. The cost charged to participating employers is based on the average daily balance of assets. CalPERS issues a separate CAFR. Copies of CERBT's annual financial report may be obtained from its Affiliate Program Services Division at 400 Q Street, Sacramento, CA 95811.
The following is a summary of the District’s market value assets on deposit with its CalPERS CERBT account:
2017 2016 2015Market value - beginning of year 822,086$ 684,208$ 601,454$ Contributions 124,995 113,345 85,616 Gain (loss) on investments 64,654 25,149 (2,217) Administrative expenses (767) (616) (645)
Market value - end of year 1,010,968$ 822,086$ 684,208$
Gain (loss) 7.77% 3.59% -0.48%
June 30,
Actuarial Value of Assets
Effective July 1, 2009, the District implemented GASB No. 45. This statement requires the District to account for the post-employment benefits on an accrual basis rather than on the pay-as-you-go method used in the past. Using the accrual method allows the employer to recognize the cost of providing the benefit during the employees’ working lifetimes. The CERBT requires
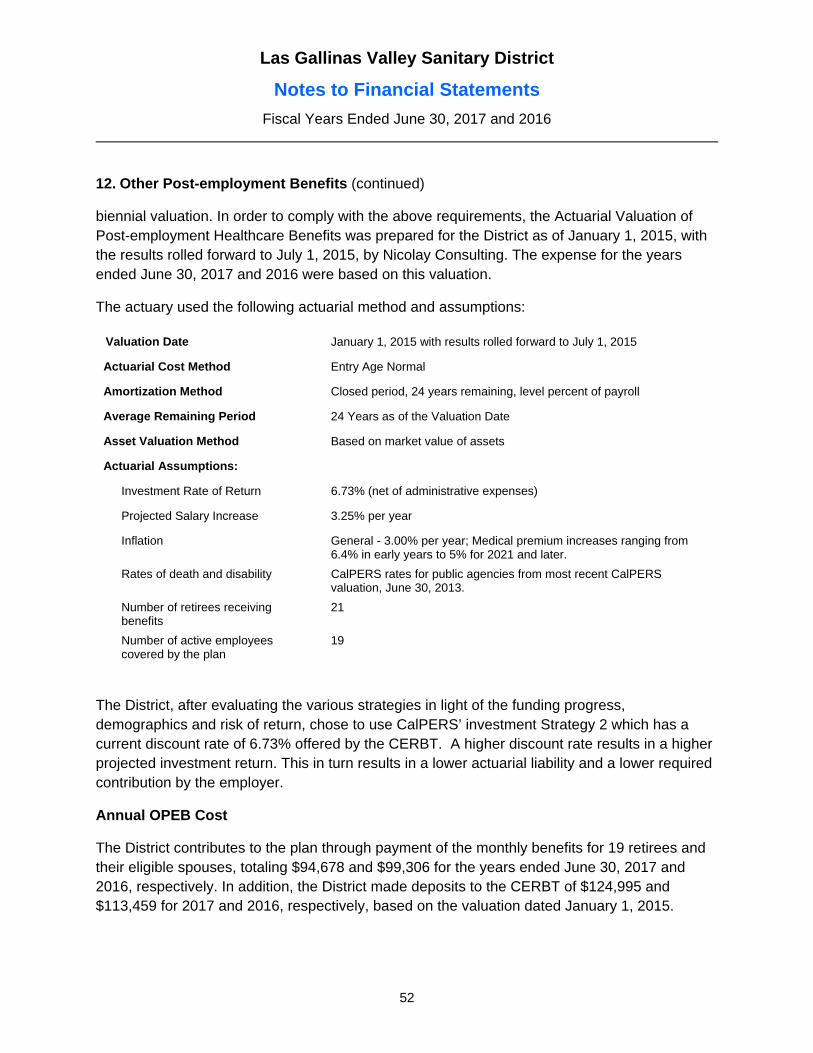
Las Gallinas Valley Sanitary District
Notes to Financial Statements
Fiscal Years Ended June 30, 2017 and 2016
52
12. Other Post-employment Benefits (continued)
biennial valuation. In order to comply with the above requirements, the Actuarial Valuation of Post-employment Healthcare Benefits was prepared for the District as of January 1, 2015, with the results rolled forward to July 1, 2015, by Nicolay Consulting. The expense for the years ended June 30, 2017 and 2016 were based on this valuation.
The actuary used the following actuarial method and assumptions:
Valuation Date January 1, 2015 with results rolled forward to July 1, 2015
Actuarial Cost Method Entry Age Normal
Amortization Method Closed period, 24 years remaining, level percent of payroll
Average Remaining Period 24 Years as of the Valuation Date
Asset Valuation Method Based on market value of assets
Actuarial Assumptions:
Investment Rate of Return 6.73% (net of administrative expenses)
Projected Salary Increase 3.25% per year
Inflation General - 3.00% per year; Medical premium increases ranging from 6.4% in early years to 5% for 2021 and later.
Rates of death and disability CalPERS rates for public agencies from most recent CalPERS valuation, June 30, 2013.
Number of retirees receiving benefits
21
Number of active employees covered by the plan
19
The District, after evaluating the various strategies in light of the funding progress, demographics and risk of return, chose to use CalPERS’ investment Strategy 2 which has a current discount rate of 6.73% offered by the CERBT. A higher discount rate results in a higher projected investment return. This in turn results in a lower actuarial liability and a lower required contribution by the employer.
Annual OPEB Cost
The District contributes to the plan through payment of the monthly benefits for 19 retirees and their eligible spouses, totaling $94,678 and $99,306 for the years ended June 30, 2017 and 2016, respectively. In addition, the District made deposits to the CERBT of $124,995 and $113,459 for 2017 and 2016, respectively, based on the valuation dated January 1, 2015.
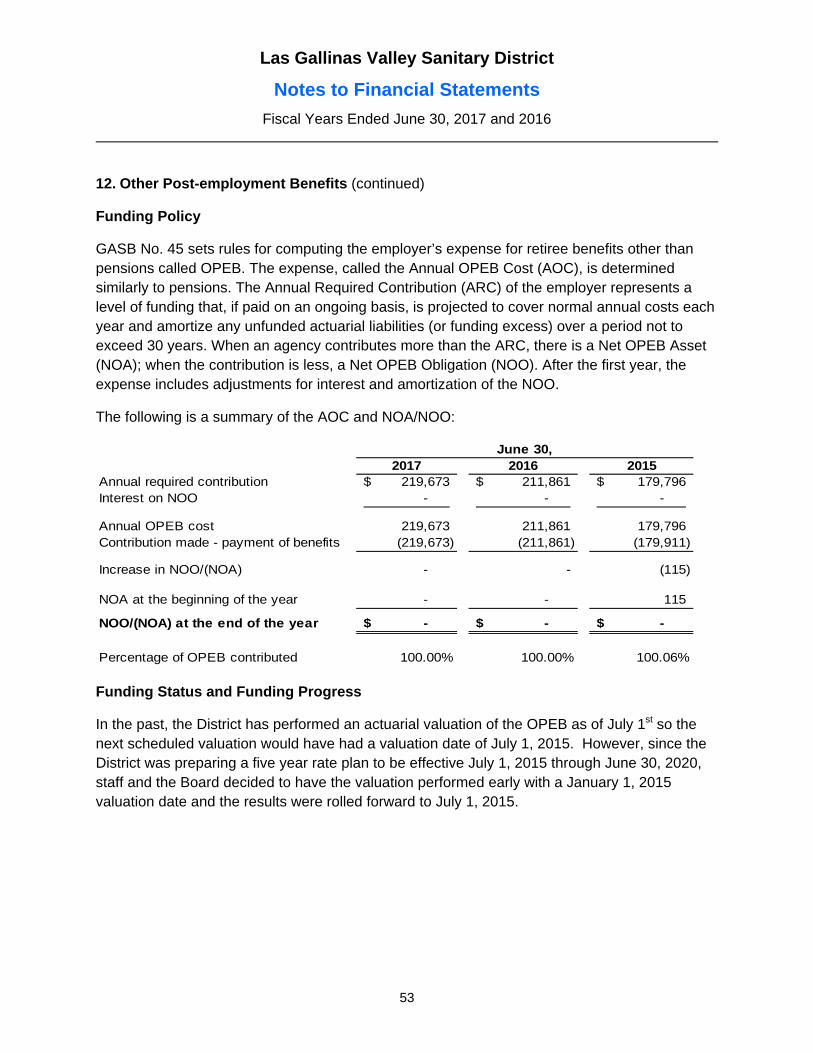
Las Gallinas Valley Sanitary District
Notes to Financial Statements
Fiscal Years Ended June 30, 2017 and 2016
53
12. Other Post-employment Benefits (continued)
Funding Policy
GASB No. 45 sets rules for computing the employer’s expense for retiree benefits other than pensions called OPEB. The expense, called the Annual OPEB Cost (AOC), is determined similarly to pensions. The Annual Required Contribution (ARC) of the employer represents a level of funding that, if paid on an ongoing basis, is projected to cover normal annual costs each year and amortize any unfunded actuarial liabilities (or funding excess) over a period not to exceed 30 years. When an agency contributes more than the ARC, there is a Net OPEB Asset (NOA); when the contribution is less, a Net OPEB Obligation (NOO). After the first year, the expense includes adjustments for interest and amortization of the NOO.
The following is a summary of the AOC and NOA/NOO:
2017 2016 2015Annual required contribution 219,673$ 211,861$ 179,796$ Interest on NOO - - -
Annual OPEB cost 219,673 211,861 179,796 Contribution made - payment of benefits (219,673) (211,861) (179,911)
Increase in NOO/(NOA) - - (115)
NOA at the beginning of the year - - 115
NOO/(NOA) at the end of the year -$ -$ -$
Percentage of OPEB contributed 100.00% 100.00% 100.06%
June 30,
Funding Status and Funding Progress
In the past, the District has performed an actuarial valuation of the OPEB as of July 1st so the next scheduled valuation would have had a valuation date of July 1, 2015. However, since the District was preparing a five year rate plan to be effective July 1, 2015 through June 30, 2020, staff and the Board decided to have the valuation performed early with a January 1, 2015 valuation date and the results were rolled forward to July 1, 2015.
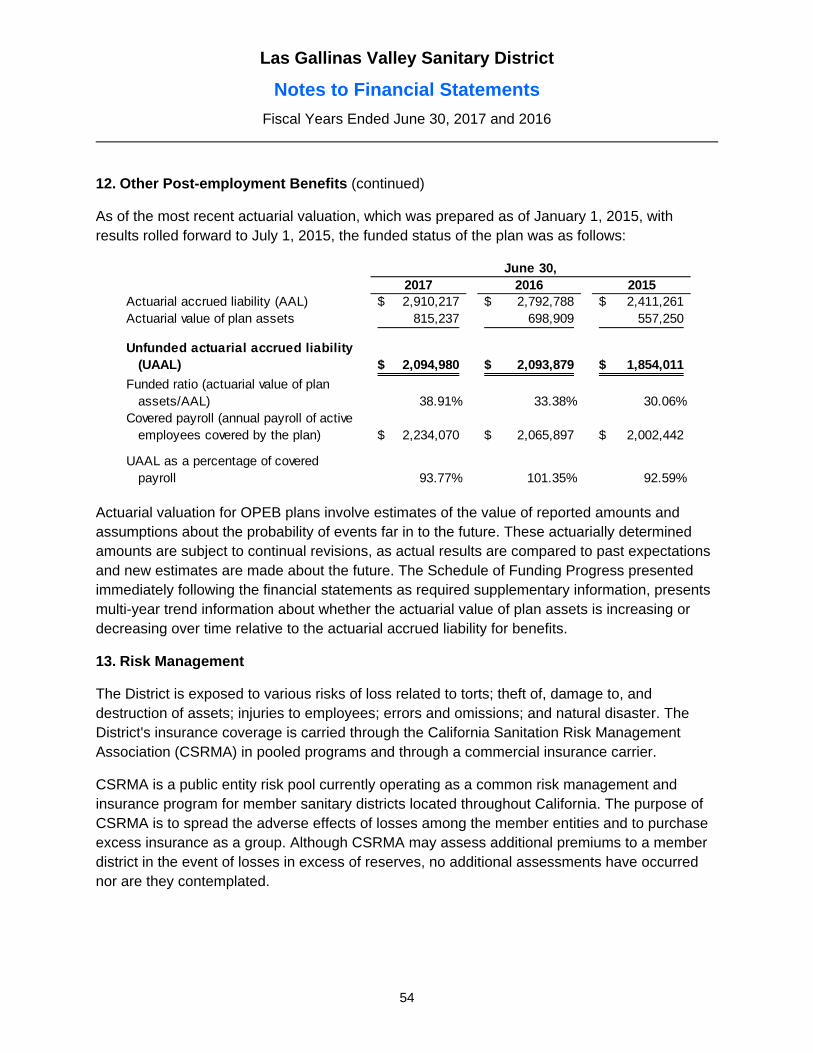
Las Gallinas Valley Sanitary District
Notes to Financial Statements
Fiscal Years Ended June 30, 2017 and 2016
54
12. Other Post-employment Benefits (continued)
As of the most recent actuarial valuation, which was prepared as of January 1, 2015, with results rolled forward to July 1, 2015, the funded status of the plan was as follows:
2017 2016 2015Actuarial accrued liability (AAL) 2,910,217$ 2,792,788$ 2,411,261$ Actuarial value of plan assets 815,237 698,909 557,250
Unfunded actuarial accrued liability(UAAL) 2,094,980$ 2,093,879$ 1,854,011$
Funded ratio (actuarial value of plan assets/AAL) 38.91% 33.38% 30.06%
Covered payroll (annual payroll of active employees covered by the plan) 2,234,070$ 2,065,897$ 2,002,442$
UAAL as a percentage of coveredpayroll 93.77% 101.35% 92.59%
June 30,
Actuarial valuation for OPEB plans involve estimates of the value of reported amounts and assumptions about the probability of events far in to the future. These actuarially determined amounts are subject to continual revisions, as actual results are compared to past expectations and new estimates are made about the future. The Schedule of Funding Progress presented immediately following the financial statements as required supplementary information, presents multi-year trend information about whether the actuarial value of plan assets is increasing or decreasing over time relative to the actuarial accrued liability for benefits.
13. Risk Management
The District is exposed to various risks of loss related to torts; theft of, damage to, and destruction of assets; injuries to employees; errors and omissions; and natural disaster. The District's insurance coverage is carried through the California Sanitation Risk Management Association (CSRMA) in pooled programs and through a commercial insurance carrier.
CSRMA is a public entity risk pool currently operating as a common risk management and insurance program for member sanitary districts located throughout California. The purpose of CSRMA is to spread the adverse effects of losses among the member entities and to purchase excess insurance as a group. Although CSRMA may assess additional premiums to a member district in the event of losses in excess of reserves, no additional assessments have occurred nor are they contemplated.
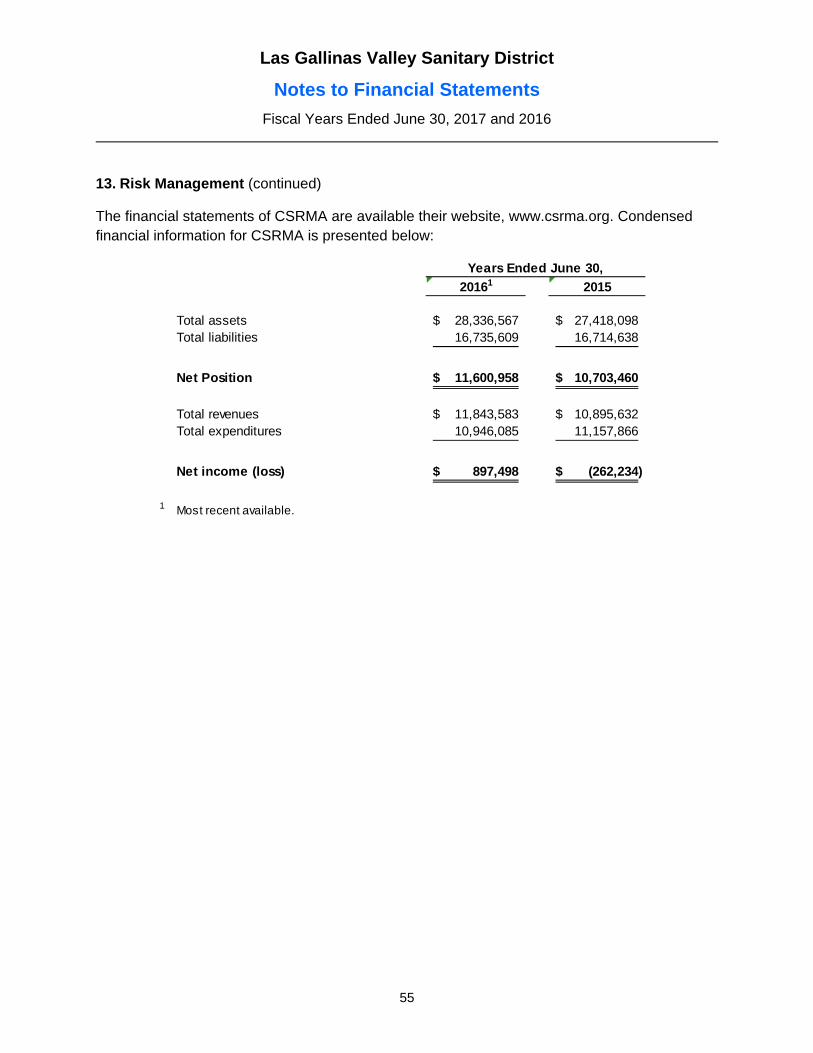
Las Gallinas Valley Sanitary District
Notes to Financial Statements
Fiscal Years Ended June 30, 2017 and 2016
55
13. Risk Management (continued)
The financial statements of CSRMA are available their website, www.csrma.org. Condensed financial information for CSRMA is presented below:
20161 2015
Total assets 28,336,567$ 27,418,098$ Total liabilities 16,735,609 16,714,638
Net Position 11,600,958$ 10,703,460$
Total revenues 11,843,583$ 10,895,632$ Total expenditures 10,946,085 11,157,866
Net income (loss) 897,498$ (262,234)$
1 Most recent available.
Years Ended June 30,
Las Gallinas Valley Sanitary District
REQUIRED SUPPLEMENTARY INFORMATION
Las Gallinas Valley Sanitary District
Miller Creek
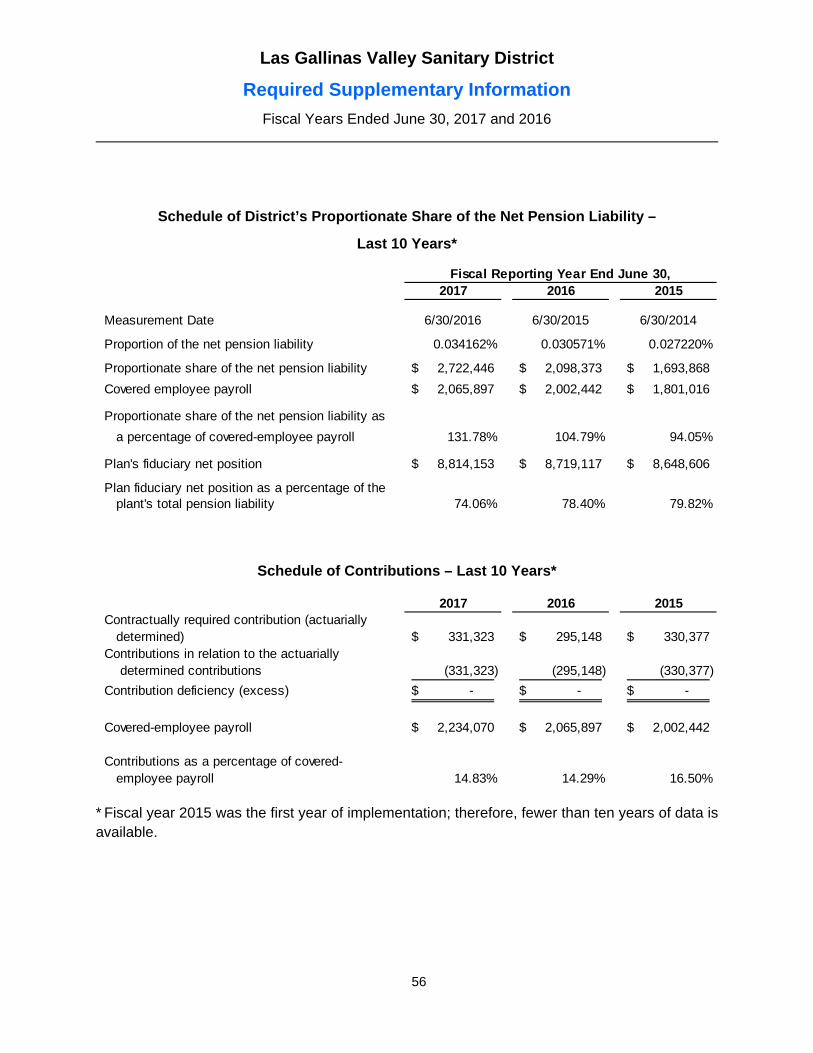
Las Gallinas Valley Sanitary District
Required Supplementary Information
Fiscal Years Ended June 30, 2017 and 2016
56
Schedule of District’s Proportionate Share of the Net Pension Liability –
Last 10 Years*
2017 2016 2015
Measurement Date 6/30/2016 6/30/2015 6/30/2014
Proportion of the net pension liability 0.034162% 0.030571% 0.027220%
Proportionate share of the net pension liability 2,722,446$ 2,098,373$ 1,693,868$
Covered employee payroll 2,065,897$ 2,002,442$ 1,801,016$
Proportionate share of the net pension liability as
a percentage of covered-employee payroll 131.78% 104.79% 94.05%
Plan's fiduciary net position 8,814,153$ 8,719,117$ 8,648,606$
Plan fiduciary net position as a percentage of theplant's total pension liability 74.06% 78.40% 79.82%
Fiscal Reporting Year End June 30,
Schedule of Contributions – Last 10 Years*
2017 2016 2015 Contractually required contribution (actuarially
determined) 331,323$ 295,148$ 330,377$ Contributions in relation to the actuarially
determined contributions (331,323) (295,148) (330,377)
Contribution deficiency (excess) -$ -$ -$
Covered-employee payroll 2,234,070$ 2,065,897$ 2,002,442$
Contributions as a percentage of covered-employee payroll 14.83% 14.29% 16.50%
* Fiscal year 2015 was the first year of implementation; therefore, fewer than ten years of data is available.

Las Gallinas Valley Sanitary District
Required Supplementary Information
Fiscal Years Ended June 30, 2017 and 2016
57
Other Post-employment Benefits Schedule of Funding Progress - CERBT
(1) (2) (3) (4) (5) (6)
Unfunded Unfunded
Actuarial Liability/ Actuarial Liability
Actuarial Accrued (excess Funded Annual as a % of
Valuation Actuarial Liability (AAL) Assets) Ratio Covered Covered Payroll
Date Asset Value Entry Age (2) - (1) (1)/(2) Payroll ((2) - (1))/(5)
7/1/2011 160,698$ 2,146,184$ 1,985,486$ 7.5% 1,756,886$ 113.0%
7/1/2013 433,543$ 2,278,516$ 1,844,973$ 19.0% 1,723,049$ 107.1%
1/1/2015 ^ 698,909$ 2,792,788$ 2,093,879$ 25.0% 2,002,442$ 104.6%
The requirements of GASB No. 45 were implemented in 2010; accordingly, there are no factors that significantly affect the identification of trends in the amounts reported. Note 12 describes additional funding information. ^ Most recent available valuation.
Las Gallinas Valley Sanitary District
SUPPLEMENTARY INFORMATION
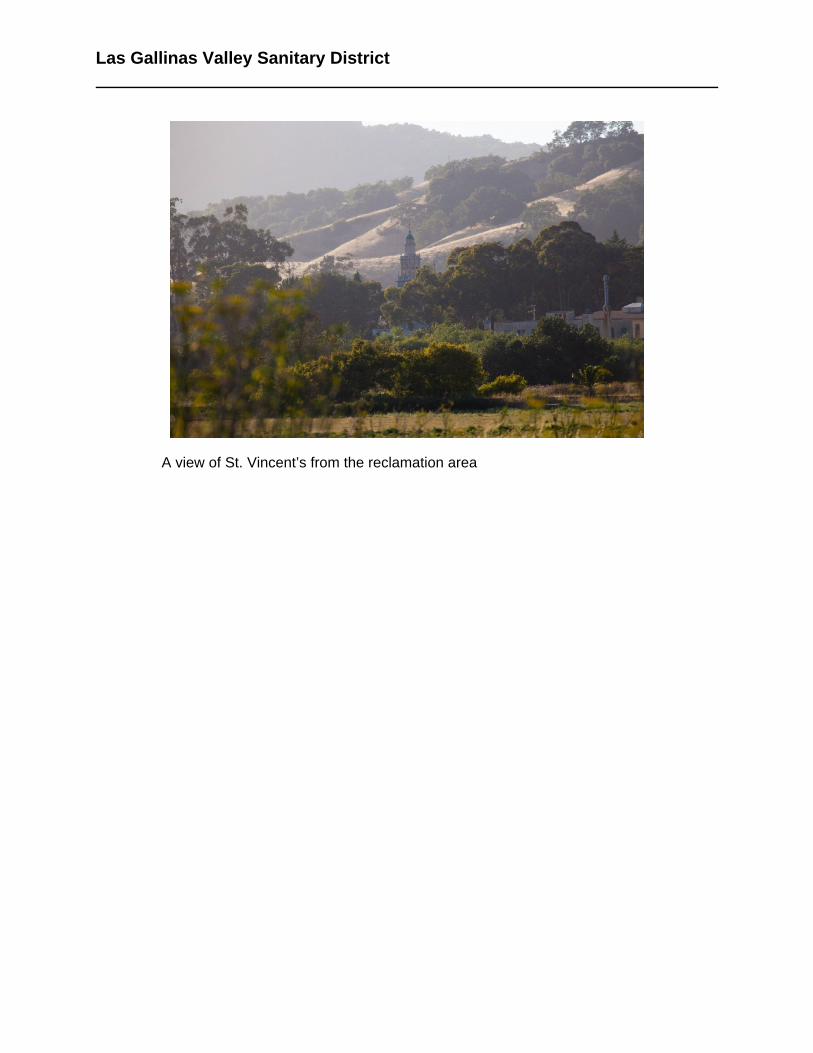
Las Gallinas Valley Sanitary District
A view of St. Vincent’s from the reclamation area
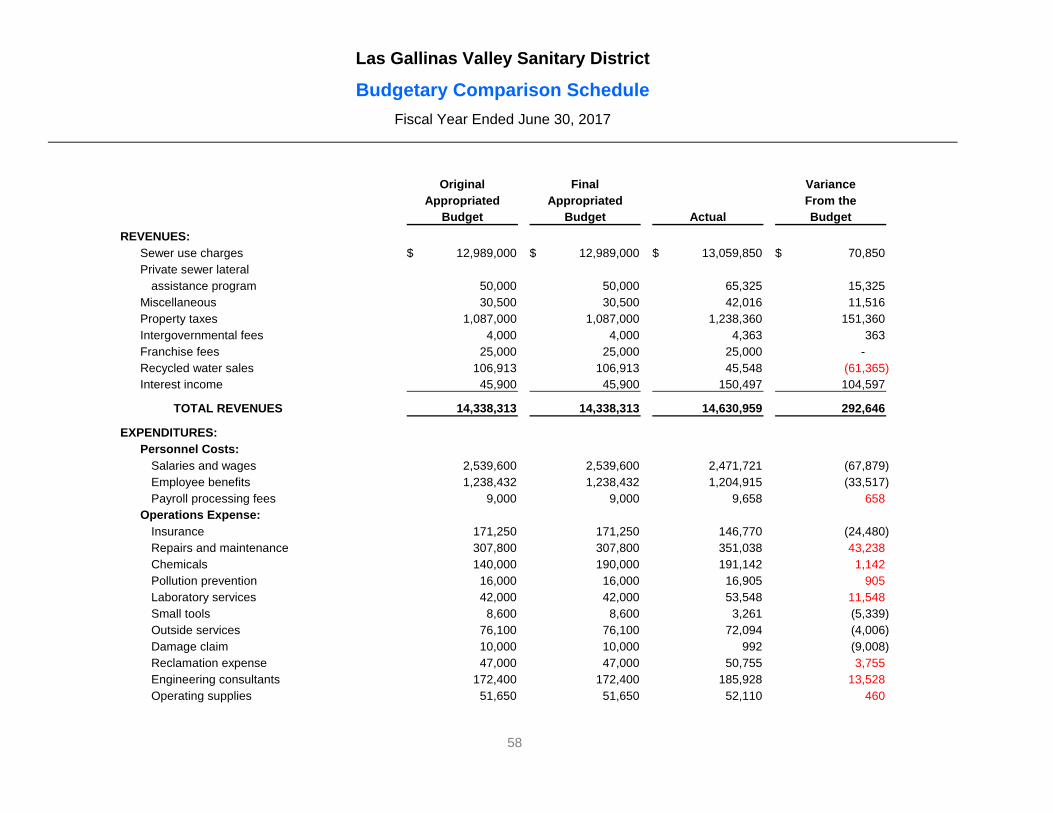
Las Gallinas Valley Sanitary District
Budgetary Comparison Schedule
Fiscal Year Ended June 30, 2017
58
Original Final VarianceAppropriated Appropriated From the
Budget Budget Actual Budget
REVENUES:Sewer use charges 12,989,000$ 12,989,000$ 13,059,850$ 70,850$ Private sewer lateral
assistance program 50,000 50,000 65,325 15,325 Miscellaneous 30,500 30,500 42,016 11,516 Property taxes 1,087,000 1,087,000 1,238,360 151,360 Intergovernmental fees 4,000 4,000 4,363 363 Franchise fees 25,000 25,000 25,000 - Recycled water sales 106,913 106,913 45,548 (61,365) Interest income 45,900 45,900 150,497 104,597
TOTAL REVENUES 14,338,313 14,338,313 14,630,959 292,646
EXPENDITURES:Personnel Costs:
Salaries and wages 2,539,600 2,539,600 2,471,721 (67,879) Employee benefits 1,238,432 1,238,432 1,204,915 (33,517) Payroll processing fees 9,000 9,000 9,658 658
Operations Expense:Insurance 171,250 171,250 146,770 (24,480) Repairs and maintenance 307,800 307,800 351,038 43,238 Chemicals 140,000 190,000 191,142 1,142 Pollution prevention 16,000 16,000 16,905 905 Laboratory services 42,000 42,000 53,548 11,548 Small tools 8,600 8,600 3,261 (5,339) Outside services 76,100 76,100 72,094 (4,006) Damage claim 10,000 10,000 992 (9,008) Reclamation expense 47,000 47,000 50,755 3,755 Engineering consultants 172,400 172,400 185,928 13,528 Operating supplies 51,650 51,650 52,110 460
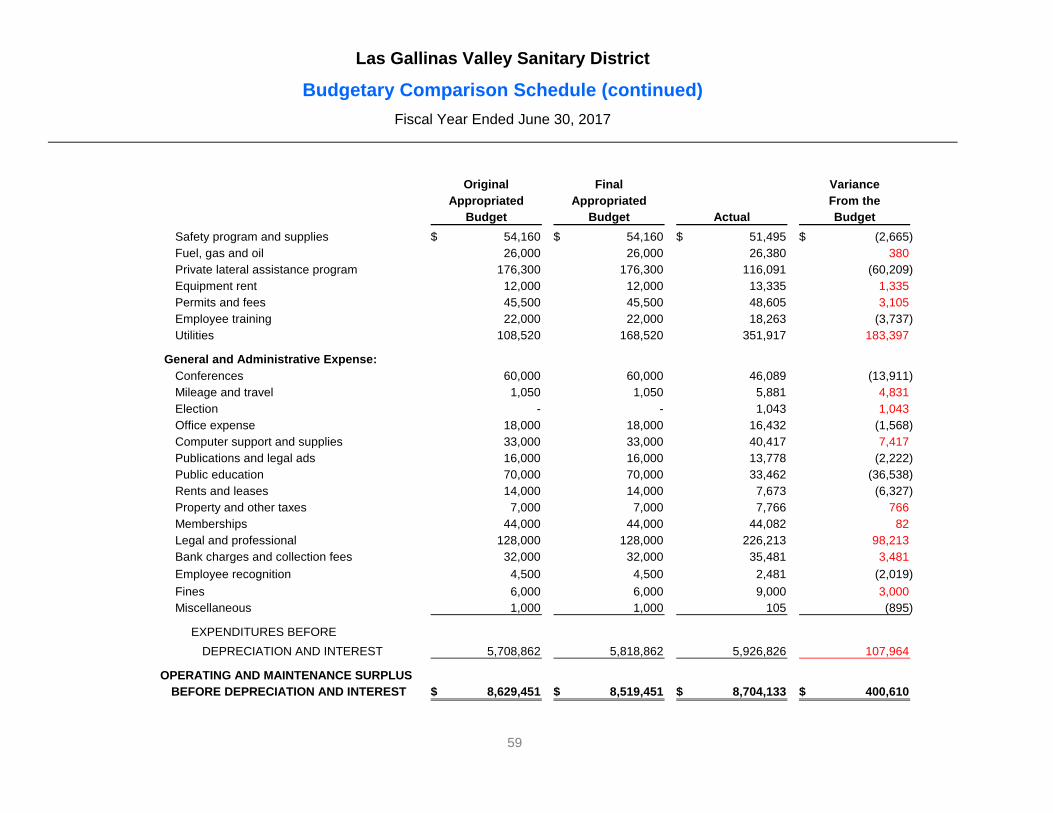
Las Gallinas Valley Sanitary District
Budgetary Comparison Schedule (continued)
Fiscal Year Ended June 30, 2017
59
Original Final VarianceAppropriated Appropriated From the
Budget Budget Actual Budget
Safety program and supplies 54,160$ 54,160$ 51,495$ (2,665)$ Fuel, gas and oil 26,000 26,000 26,380 380 Private lateral assistance program 176,300 176,300 116,091 (60,209) Equipment rent 12,000 12,000 13,335 1,335 Permits and fees 45,500 45,500 48,605 3,105 Employee training 22,000 22,000 18,263 (3,737) Utilities 108,520 168,520 351,917 183,397
General and Administrative Expense:Conferences 60,000 60,000 46,089 (13,911) Mileage and travel 1,050 1,050 5,881 4,831 Election - - 1,043 1,043 Office expense 18,000 18,000 16,432 (1,568) Computer support and supplies 33,000 33,000 40,417 7,417 Publications and legal ads 16,000 16,000 13,778 (2,222) Public education 70,000 70,000 33,462 (36,538) Rents and leases 14,000 14,000 7,673 (6,327) Property and other taxes 7,000 7,000 7,766 766 Memberships 44,000 44,000 44,082 82 Legal and professional 128,000 128,000 226,213 98,213 Bank charges and collection fees 32,000 32,000 35,481 3,481
Employee recognition 4,500 4,500 2,481 (2,019)
Fines 6,000 6,000 9,000 3,000 Miscellaneous 1,000 1,000 105 (895)
EXPENDITURES BEFORE
DEPRECIATION AND INTEREST 5,708,862 5,818,862 5,926,826 107,964
OPERATING AND MAINTENANCE SURPLUSBEFORE DEPRECIATION AND INTEREST 8,629,451$ 8,519,451$ 8,704,133$ 400,610$
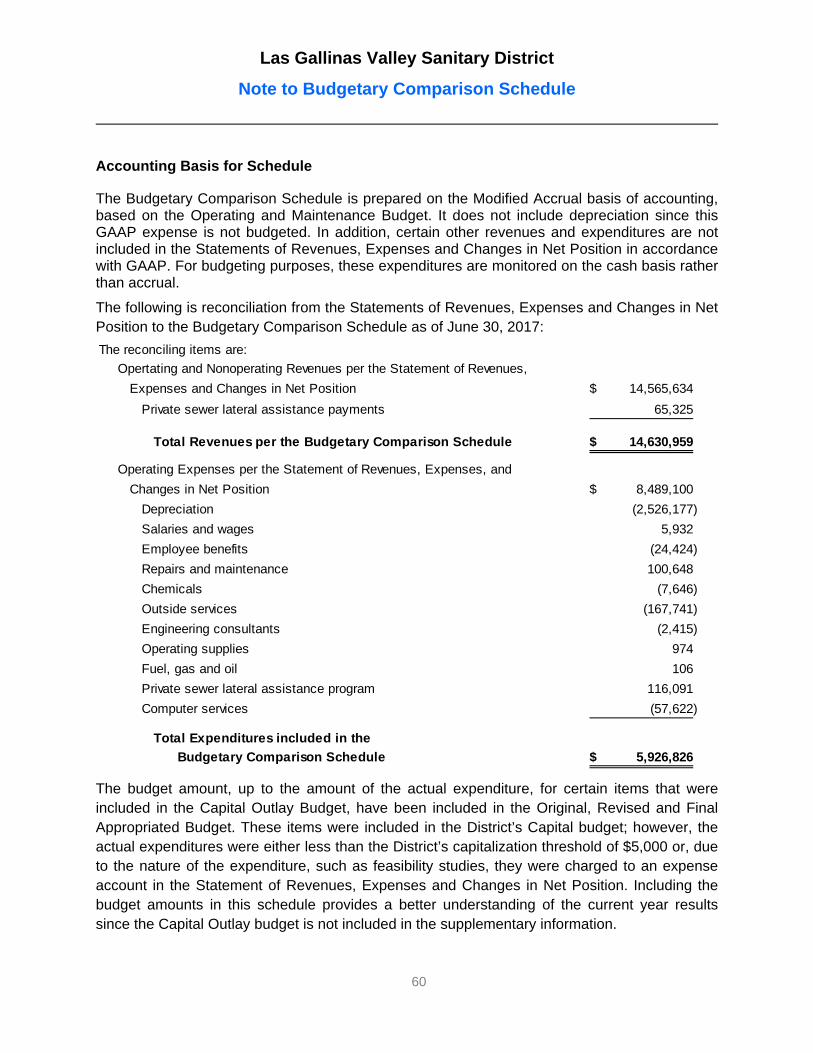
Las Gallinas Valley Sanitary District
Note to Budgetary Comparison Schedule
60
Accounting Basis for Schedule
The Budgetary Comparison Schedule is prepared on the Modified Accrual basis of accounting, based on the Operating and Maintenance Budget. It does not include depreciation since this GAAP expense is not budgeted. In addition, certain other revenues and expenditures are not included in the Statements of Revenues, Expenses and Changes in Net Position in accordance with GAAP. For budgeting purposes, these expenditures are monitored on the cash basis rather than accrual.
The following is reconciliation from the Statements of Revenues, Expenses and Changes in Net Position to the Budgetary Comparison Schedule as of June 30, 2017:
The reconciling items are:
Opertating and Nonoperating Revenues per the Statement of Revenues,
Expenses and Changes in Net Position 14,565,634$
Private sewer lateral assistance payments 65,325
Total Revenues per the Budgetary Comparison Schedule 14,630,959$
Operating Expenses per the Statement of Revenues, Expenses, and
Changes in Net Position 8,489,100$
Depreciation (2,526,177)
Salaries and wages 5,932
Employee benefits (24,424)
Repairs and maintenance 100,648
Chemicals (7,646)
Outside services (167,741)
Engineering consultants (2,415)
Operating supplies 974
Fuel, gas and oil 106
Private sewer lateral assistance program 116,091
Computer services (57,622)
Total Expenditures included in the
Budgetary Comparison Schedule 5,926,826$
The budget amount, up to the amount of the actual expenditure, for certain items that were included in the Capital Outlay Budget, have been included in the Original, Revised and Final Appropriated Budget. These items were included in the District’s Capital budget; however, the actual expenditures were either less than the District’s capitalization threshold of $5,000 or, due to the nature of the expenditure, such as feasibility studies, they were charged to an expense account in the Statement of Revenues, Expenses and Changes in Net Position. Including the budget amounts in this schedule provides a better understanding of the current year results since the Capital Outlay budget is not included in the supplementary information.
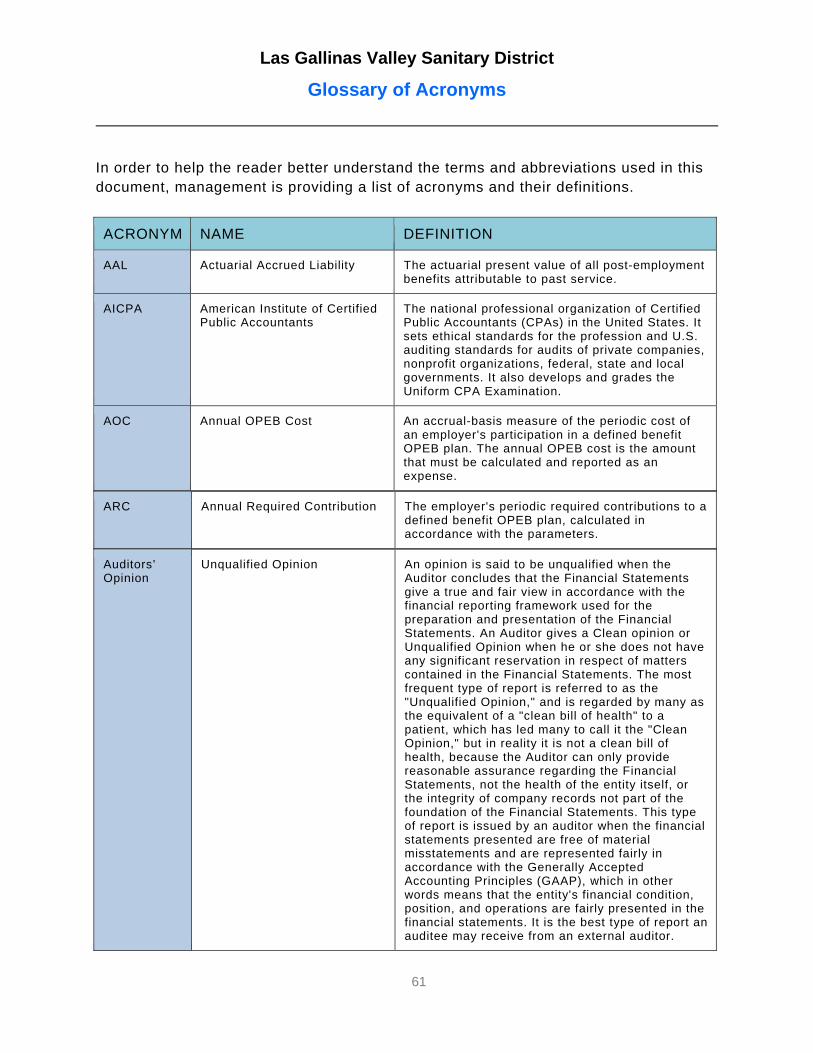
Las Gallinas Valley Sanitary District
Glossary of Acronyms
61
In order to help the reader better understand the terms and abbreviations used in this document, management is providing a list of acronyms and their definitions.
ACRONYM NAME DEFINITION
AAL Actuarial Accrued Liability The actuarial present value of all post-employment benefits attributable to past service.
AICPA American Institute of Certified Public Accountants
The national professional organization of Certified Public Accountants (CPAs) in the United States. It sets ethical standards for the profession and U.S. auditing standards for audits of private companies, nonprofit organizations, federal, state and local governments. It also develops and grades the Uniform CPA Examination.
AOC Annual OPEB Cost An accrual-basis measure of the periodic cost of an employer's participation in a defined benefit OPEB plan. The annual OPEB cost is the amount that must be calculated and reported as an expense.
ARC Annual Required Contribution The employer's periodic required contributions to a defined benefit OPEB plan, calculated in accordance with the parameters.
Auditors’ Opinion
Unqualified Opinion An opinion is said to be unqualified when the Auditor concludes that the Financial Statements give a true and fair view in accordance with the financial reporting framework used for the preparation and presentation of the Financial Statements. An Auditor gives a Clean opinion or Unqualified Opinion when he or she does not have any significant reservation in respect of matters contained in the Financial Statements. The most frequent type of report is referred to as the "Unqualified Opinion," and is regarded by many as the equivalent of a "clean bill of health" to a patient, which has led many to call it the "Clean Opinion," but in reality it is not a clean bill of health, because the Auditor can only provide reasonable assurance regarding the Financial Statements, not the health of the entity itself, or the integrity of company records not part of the foundation of the Financial Statements. This type of report is issued by an auditor when the financial statements presented are free of material misstatements and are represented fairly in accordance with the Generally Accepted Accounting Principles (GAAP), which in other words means that the entity's financial condition, position, and operations are fairly presented in the financial statements. It is the best type of report an auditee may receive from an external auditor.

Las Gallinas Valley Sanitary District
Glossary of Acronyms (continued)
62
ACRONYM NAME DEFINITION
CAFR Comprehensive Annual Financial Report
A set of U.S. government financial statements comprising the financial report of a state, municipal or other governmental entity that complies with the accounting requirements promulgated by the GASB.
CalPERS California Public Employees Retirement System
The California Public Employees' Retirement System is an agency in the California executive branch that "manages pension and health benefits for more than 1.6 million California public employees, retirees, and their families.”
CERBT California Employers’ Retiree Benefit Trust
An investment vehicle that can be used by all California public employers to prefund future retiree health and OPEB.
CSRMA California Sanitation Risk Management Association
A joint powers authority which provides broad coverage and risk management services to its members who are primarily local government agencies that provide water and wastewater services.
COP Certificates of Participation A financial document that is used by a municipal government or other government entity creates a bond issue. Revenues of the issuer are pledged to repay the bonds rather than being secured by property.
ERAF Education Revenue Augmentation Funds
A fund used to collect the property taxes in each county that are shifted from cities, the county and special districts prior to their reallocation to K-14 school agencies. The county treasurer maintains the ERAF on behalf of the county auditor.
FASB Financial Accounting Standards Board
Financial Accounting Standards Board (FASB) is a private, not-for-profit organization whose primary purpose is to develop generally accepted accounting principles (GAAP) within the United States in the public's interest.
FOG Fats, Oils and Grease Substances than can cause overflows of sanitary sewer systems if not disposed of properly.
GAAP Generally Accepted Accounting Principles
The standard framework of guidelines for financial accounting used in any given jurisdiction; generally known as accounting standards or standard accounting practice. These include the standards, conventions, and rules that accountants follow in recording and summarizing and in the preparation of financial statements.

Las Gallinas Valley Sanitary District
Glossary of Acronyms (continued)
63
ACRONYM NAME DEFINITION
GASB Governmental Accounting Standards Board
Currently the source of generally accepted accounting principles (GAAP) used by state and local governments in the United States of America.
I&I Infiltration and Inflow Infiltration is groundwater entering sanitary sewers through defective pipe joints and broken pipes. Inflow is water entering sanitary sewers from inappropriate connections such as roof drains, cellar drains, and yard drains.
LAIF Local Agency Investment Fund A fund managed by the Office of the Treasurer of the State of California, which is available for local governments.
MD&A Management Discussion and Analysis
An integrated part of the annual financial statements. The purpose of the MD&A is to provide a narrative explanation, through the eyes of management, of how an entity has performed in the past, its financial condition, and its future prospects.
MGD Million Gallons per Day Measurement unit used for calculating volume of wastewater treated at the plant.
MMWD Marin Municipal Water District Water agency for Marin County serving areas south of Ignacio.
NBWRA North Bay Water Reuse Authority
A coordinated regional group of water and sanitation agencies in Sonoma, Marin, and Napa Counties to offset potable water demand by promoting water reuse for agriculture, urban, and environmental uses.
NMWD North Marin Water District Water agency for Marin County serving areas north of Ignacio and some coastal communities.
NOO Net OPEB Obligation The cumulative difference, since the effective date of GASB No. 45, between annual OPEB cost and the employer's contributions to the plan, including the OPEB liability (asset) at transition, if any, and excluding (a) short-term differences and (b) unpaid contributions that have been converted to OPEB-related debt.
OPEB Other Post-Employment Benefits
Post-employment benefits other than pension benefits. Other post-employment benefits (OPEB) include post-employment healthcare benefits, regardless of the type of plan that provides them, and all post-employment benefits provided separately from a pension plan, except benefits defined as special termination benefits.
Las Gallinas Valley Sanitary District
STATISTICAL SECTION
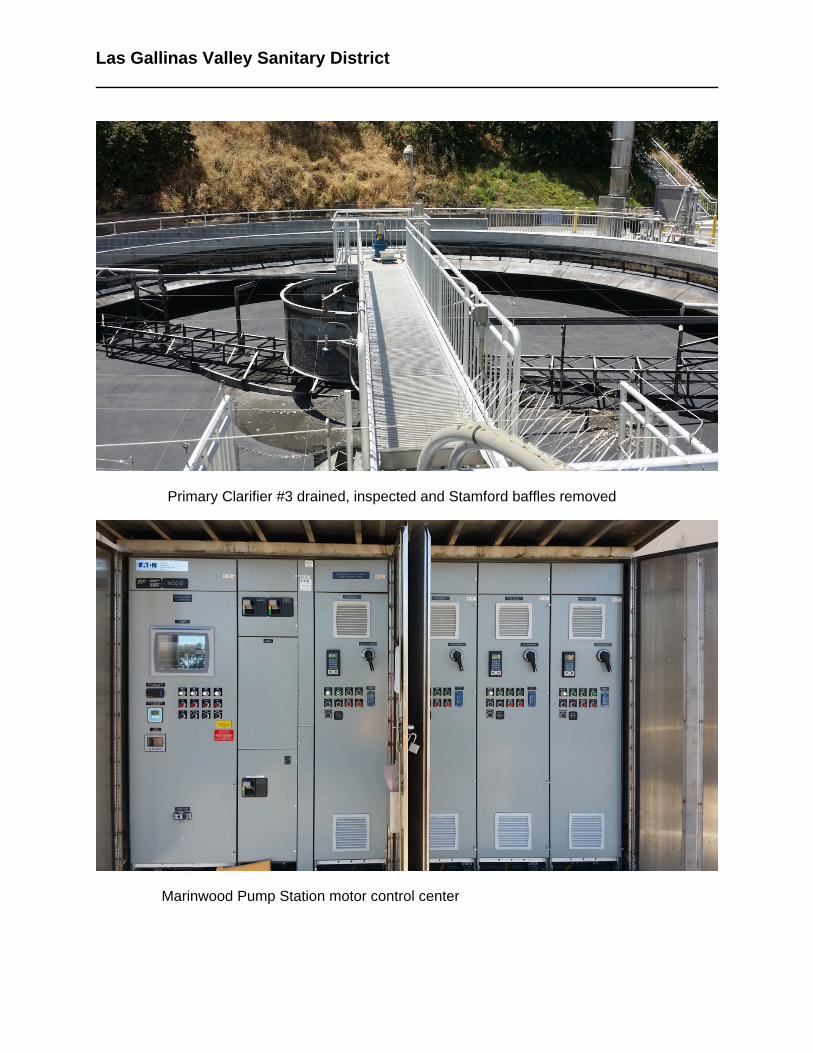
Las Gallinas Valley Sanitary District
Primary Clarifier #3 drained, inspected and Stamford baffles removed
Marinwood Pump Station motor control center
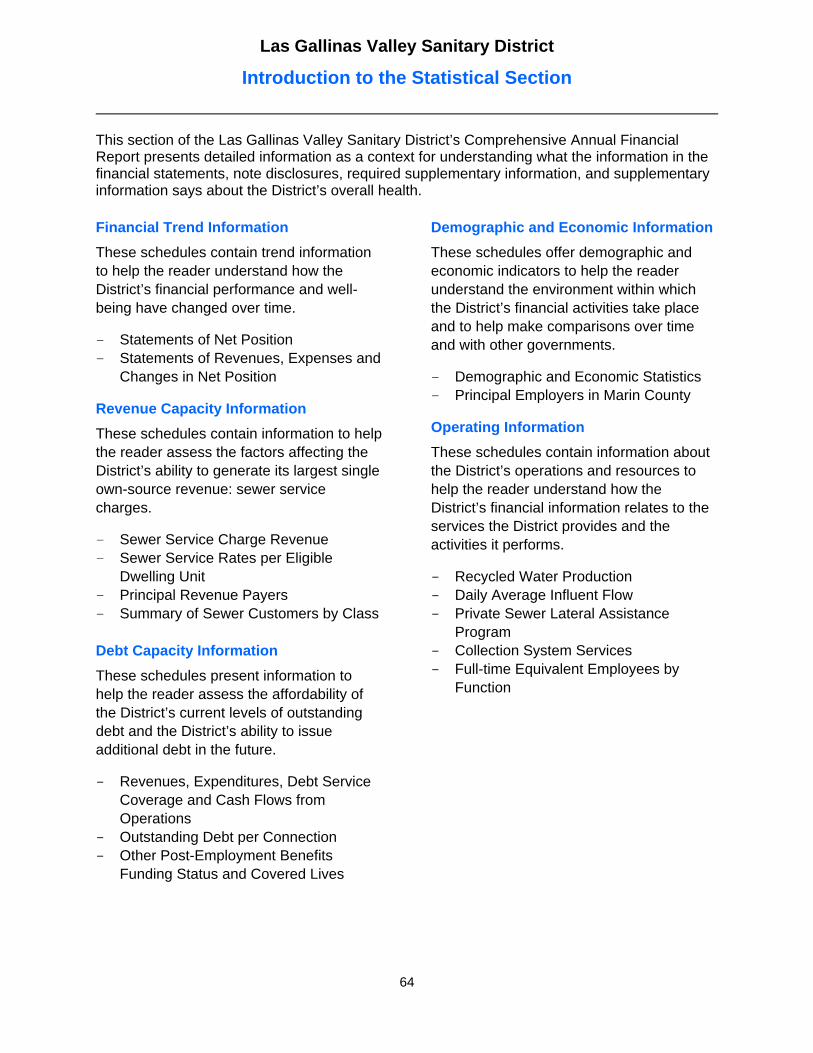
Las Gallinas Valley Sanitary District
Introduction to the Statistical Section
64
This section of the Las Gallinas Valley Sanitary District’s Comprehensive Annual Financial Report presents detailed information as a context for understanding what the information in the financial statements, note disclosures, required supplementary information, and supplementary information says about the District’s overall health.
Financial Trend Information
These schedules contain trend information to help the reader understand how the District’s financial performance and well-being have changed over time.
− Statements of Net Position − Statements of Revenues, Expenses and
Changes in Net Position
Revenue Capacity Information
These schedules contain information to help the reader assess the factors affecting the District’s ability to generate its largest single own-source revenue: sewer service charges.
− Sewer Service Charge Revenue − Sewer Service Rates per Eligible
Dwelling Unit − Principal Revenue Payers − Summary of Sewer Customers by Class
Debt Capacity Information
These schedules present information to help the reader assess the affordability of the District’s current levels of outstanding debt and the District’s ability to issue additional debt in the future.
- Revenues, Expenditures, Debt Service Coverage and Cash Flows from Operations
- Outstanding Debt per Connection - Other Post-Employment Benefits
Funding Status and Covered Lives
Demographic and Economic Information
These schedules offer demographic and economic indicators to help the reader understand the environment within which the District’s financial activities take place and to help make comparisons over time and with other governments.
− Demographic and Economic Statistics − Principal Employers in Marin County
Operating Information
These schedules contain information about the District’s operations and resources to help the reader understand how the District’s financial information relates to the services the District provides and the activities it performs.
- Recycled Water Production - Daily Average Influent Flow - Private Sewer Lateral Assistance
Program - Collection System Services - Full-time Equivalent Employees by
Function
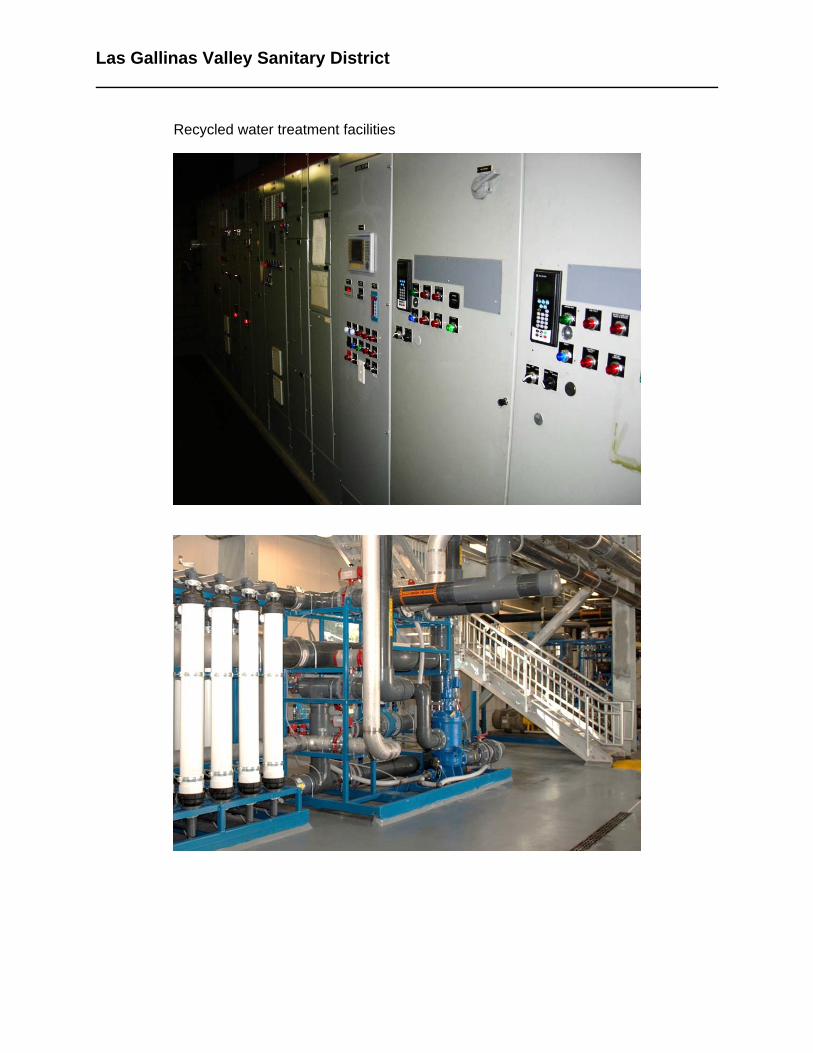
Las Gallinas Valley Sanitary District
Recycled water treatment facilities
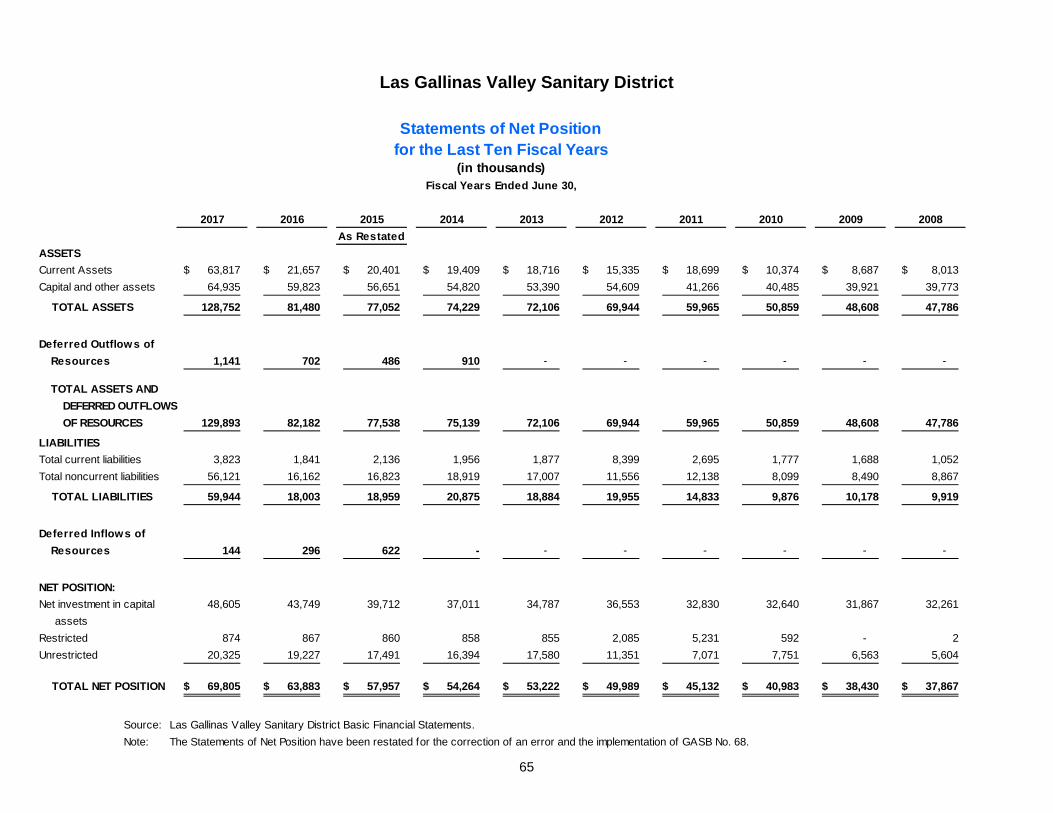
Las Gallinas Valley Sanitary District
65
2017 2016 2015 2014 2013 2012 2011 2010 2009 2008
As Restated
ASSETS
Current Assets 63,817$ 21,657$ 20,401$ 19,409$ 18,716$ 15,335$ 18,699$ 10,374$ 8,687$ 8,013$
Capital and other assets 64,935 59,823 56,651 54,820 53,390 54,609 41,266 40,485 39,921 39,773
TOTAL ASSETS 128,752 81,480 77,052 74,229 72,106 69,944 59,965 50,859 48,608 47,786
Deferred Outflows of
Resources 1,141 702 486 910 - - - - - -
TOTAL ASSETS AND
DEFERRED OUTFLOWS
OF RESOURCES 129,893 82,182 77,538 75,139 72,106 69,944 59,965 50,859 48,608 47,786
LIABILITIES
Total current liabilities 3,823 1,841 2,136 1,956 1,877 8,399 2,695 1,777 1,688 1,052
Total noncurrent liabilities 56,121 16,162 16,823 18,919 17,007 11,556 12,138 8,099 8,490 8,867
TOTAL LIABILITIES 59,944 18,003 18,959 20,875 18,884 19,955 14,833 9,876 10,178 9,919
Deferred Inflows of
Resources 144 296 622 - - - - - - -
NET POSITION:
Net investment in capital 48,605 43,749 39,712 37,011 34,787 36,553 32,830 32,640 31,867 32,261
assets
Restricted 874 867 860 858 855 2,085 5,231 592 - 2
Unrestricted 20,325 19,227 17,491 16,394 17,580 11,351 7,071 7,751 6,563 5,604
TOTAL NET POSITION 69,805$ 63,883$ 57,957$ 54,264$ 53,222$ 49,989$ 45,132$ 40,983$ 38,430$ 37,867$
Source: Las Gallinas Valley Sanitary District Basic Financial Statements.
Note: The Statements of Net Position have been restated for the correction of an error and the implementation of GASB No. 68.
Fiscal Years Ended June 30,
Statements of Net Positionfor the Last Ten Fiscal Years
(in thousands)
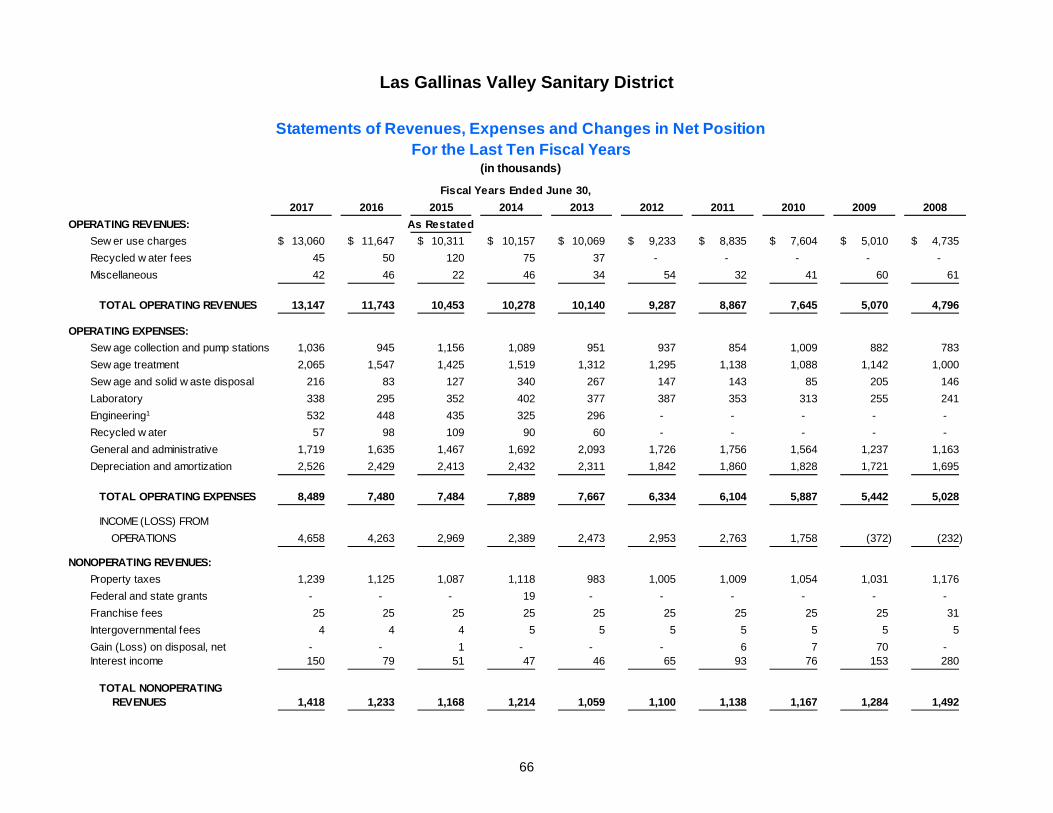
Las Gallinas Valley Sanitary District
66
2017 2016 2015 2014 2013 2012 2011 2010 2009 2008
OPERATING REVENUES: As Restated
Sew er use charges 13,060$ 11,647$ 10,311$ 10,157$ 10,069$ 9,233$ 8,835$ 7,604$ 5,010$ 4,735$
Recycled w ater fees 45 50 120 75 37 - - - - -
Miscellaneous 42 46 22 46 34 54 32 41 60 61
TOTAL OPERATING REVENUES 13,147 11,743 10,453 10,278 10,140 9,287 8,867 7,645 5,070 4,796
OPERATING EXPENSES:
Sew age collection and pump stations 1,036 945 1,156 1,089 951 937 854 1,009 882 783
Sew age treatment 2,065 1,547 1,425 1,519 1,312 1,295 1,138 1,088 1,142 1,000
Sew age and solid w aste disposal 216 83 127 340 267 147 143 85 205 146
Laboratory 338 295 352 402 377 387 353 313 255 241
Engineering1 532 448 435 325 296 - - - - -
Recycled w ater 57 98 109 90 60 - - - - -
General and administrative 1,719 1,635 1,467 1,692 2,093 1,726 1,756 1,564 1,237 1,163
Depreciation and amortization 2,526 2,429 2,413 2,432 2,311 1,842 1,860 1,828 1,721 1,695
TOTAL OPERATING EXPENSES 8,489 7,480 7,484 7,889 7,667 6,334 6,104 5,887 5,442 5,028
INCOME (LOSS) FROM
OPERATIONS 4,658 4,263 2,969 2,389 2,473 2,953 2,763 1,758 (372) (232)
NONOPERATING REVENUES:
Property taxes 1,239 1,125 1,087 1,118 983 1,005 1,009 1,054 1,031 1,176
Federal and state grants - - - 19 - - - - - -
Franchise fees 25 25 25 25 25 25 25 25 25 31
Intergovernmental fees 4 4 4 5 5 5 5 5 5 5
Gain (Loss) on disposal, net - - 1 - - - 6 7 70 - Interest income 150 79 51 47 46 65 93 76 153 280
TOTAL NONOPERATING REVENUES 1,418 1,233 1,168 1,214 1,059 1,100 1,138 1,167 1,284 1,492
Fiscal Years Ended June 30,
Statements of Revenues, Expenses and Changes in Net PositionFor the Last Ten Fiscal Years
(in thousands)
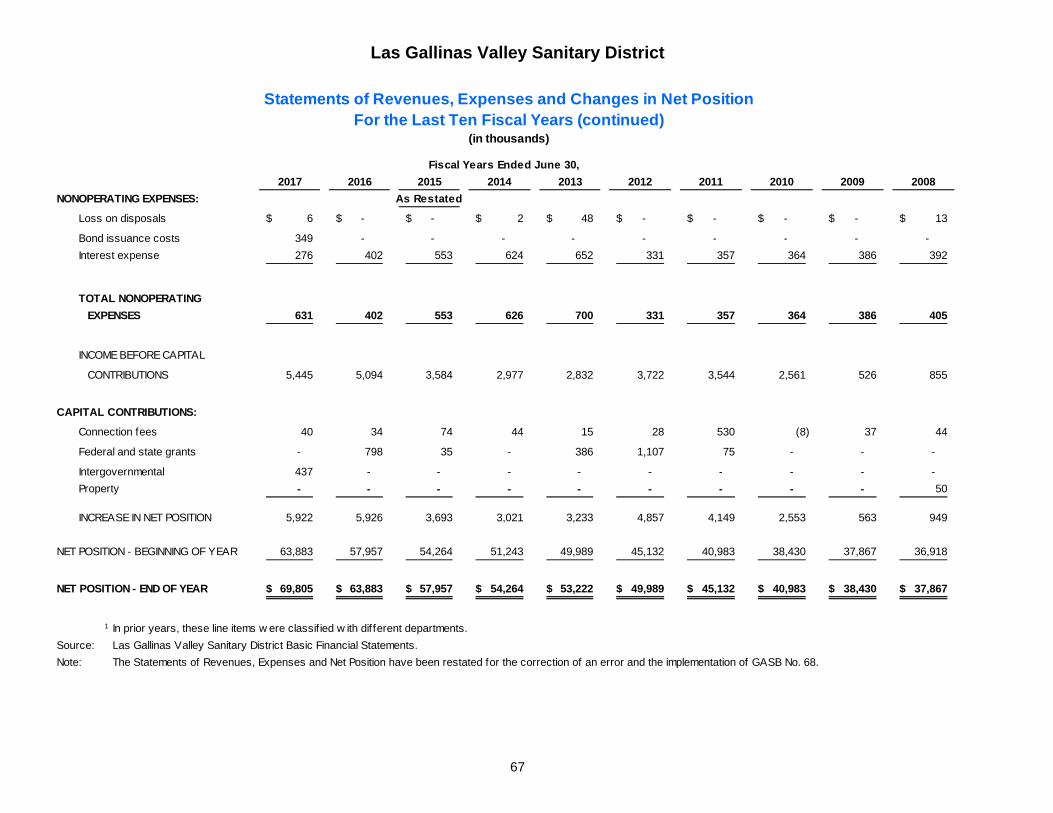
Las Gallinas Valley Sanitary District
67
2017 2016 2015 2014 2013 2012 2011 2010 2009 2008
NONOPERATING EXPENSES: As Restated
Loss on disposals 6$ -$ -$ 2$ 48$ -$ -$ -$ -$ 13$
Bond issuance costs 349 - - - - - - - - -
Interest expense 276 402 553 624 652 331 357 364 386 392
TOTAL NONOPERATING
EXPENSES 631 402 553 626 700 331 357 364 386 405
INCOME BEFORE CAPITAL
CONTRIBUTIONS 5,445 5,094 3,584 2,977 2,832 3,722 3,544 2,561 526 855
CAPITAL CONTRIBUTIONS:
Connection fees 40 34 74 44 15 28 530 (8) 37 44
Federal and state grants - 798 35 - 386 1,107 75 - - -
Intergovernmental 437 - - - - - - - - -
Property - - - - - - - - - 50
INCREASE IN NET POSITION 5,922 5,926 3,693 3,021 3,233 4,857 4,149 2,553 563 949
NET POSITION - BEGINNING OF YEAR 63,883 57,957 54,264 51,243 49,989 45,132 40,983 38,430 37,867 36,918
NET POSITION - END OF YEAR 69,805$ 63,883$ 57,957$ 54,264$ 53,222$ 49,989$ 45,132$ 40,983$ 38,430$ 37,867$
1 In prior years, these line items w ere classif ied w ith different departments.
Source: Las Gallinas Valley Sanitary District Basic Financial Statements.
Note: The Statements of Revenues, Expenses and Net Position have been restated for the correction of an error and the implementation of GASB No. 68.
(in thousands)
Fiscal Years Ended June 30,
Statements of Revenues, Expenses and Changes in Net PositionFor the Last Ten Fiscal Years (continued)
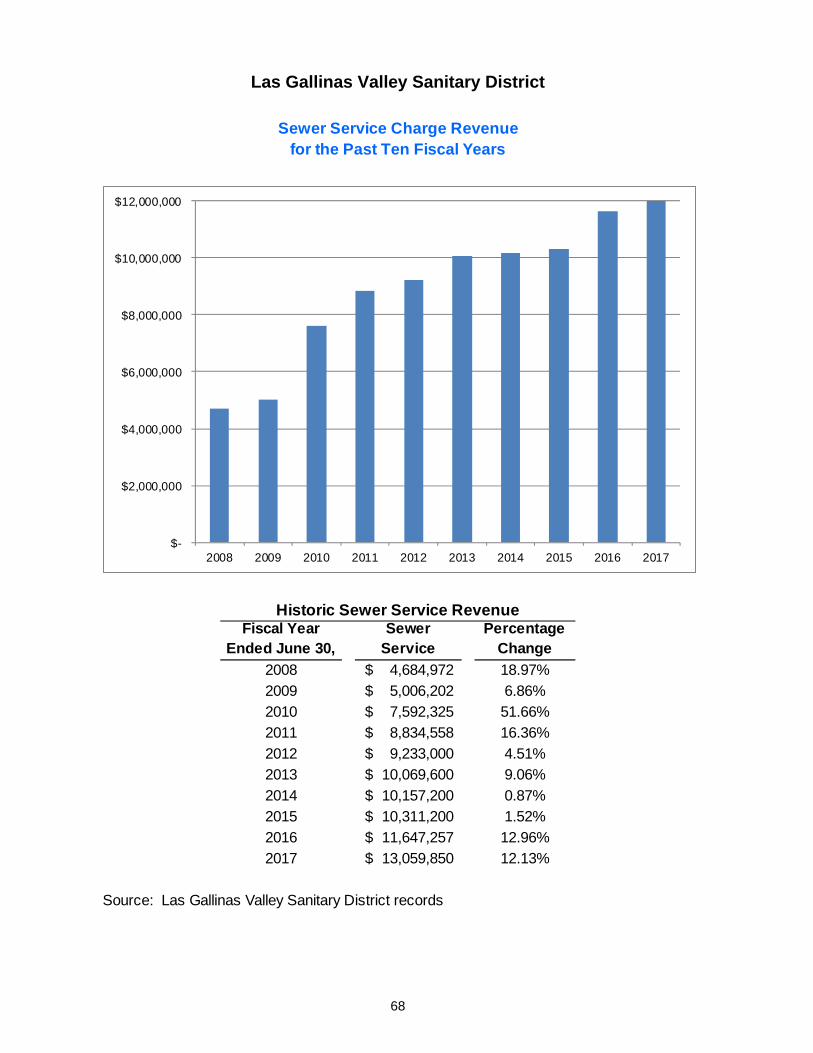
Las Gallinas Valley Sanitary District
68
Fiscal Year Ended June 30,
Sewer Service
Percentage Change
2008 4,684,972$ 18.97%
2009 5,006,202$ 6.86%
2010 7,592,325$ 51.66%
2011 8,834,558$ 16.36%
2012 9,233,000$ 4.51%
2013 10,069,600$ 9.06%
2014 10,157,200$ 0.87%
2015 10,311,200$ 1.52%
2016 11,647,257$ 12.96%
2017 13,059,850$ 12.13%
Source: Las Gallinas Valley Sanitary District records
Sewer Service Charge Revenuefor the Past Ten Fiscal Years
Historic Sewer Service Revenue
$-
$2,000,000
$4,000,000
$6,000,000
$8,000,000
$10,000,000
$12,000,000
2008 2009 2010 2011 2012 2013 2014 2015 2016 2017
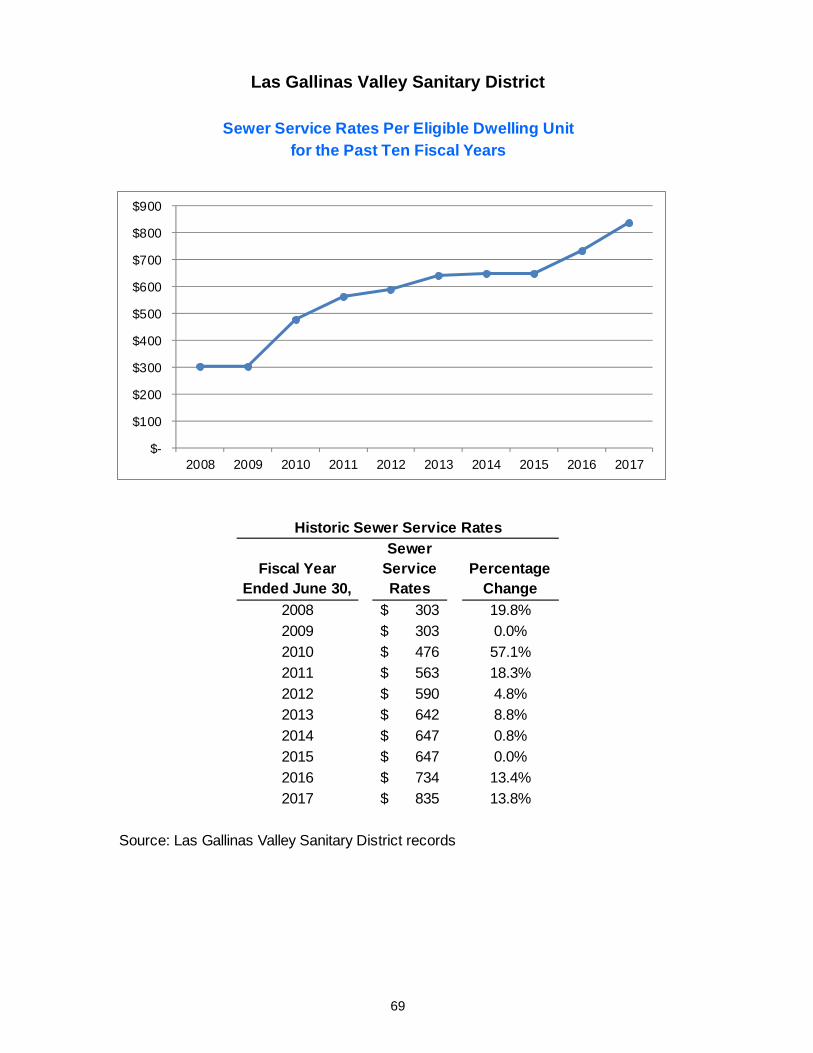
Las Gallinas Valley Sanitary District
69
Fiscal Year Ended June 30,
Sewer Service Rates
Percentage Change
2008 303$ 19.8%
2009 303$ 0.0%
2010 476$ 57.1%
2011 563$ 18.3%
2012 590$ 4.8%
2013 642$ 8.8%
2014 647$ 0.8%
2015 647$ 0.0%
2016 734$ 13.4%
2017 835$ 13.8%
Source: Las Gallinas Valley Sanitary District records
Sewer Service Rates Per Eligible Dwelling Unitfor the Past Ten Fiscal Years
Historic Sewer Service Rates
$-
$100
$200
$300
$400
$500
$600
$700
$800
$900
2008 2009 2010 2011 2012 2013 2014 2015 2016 2017
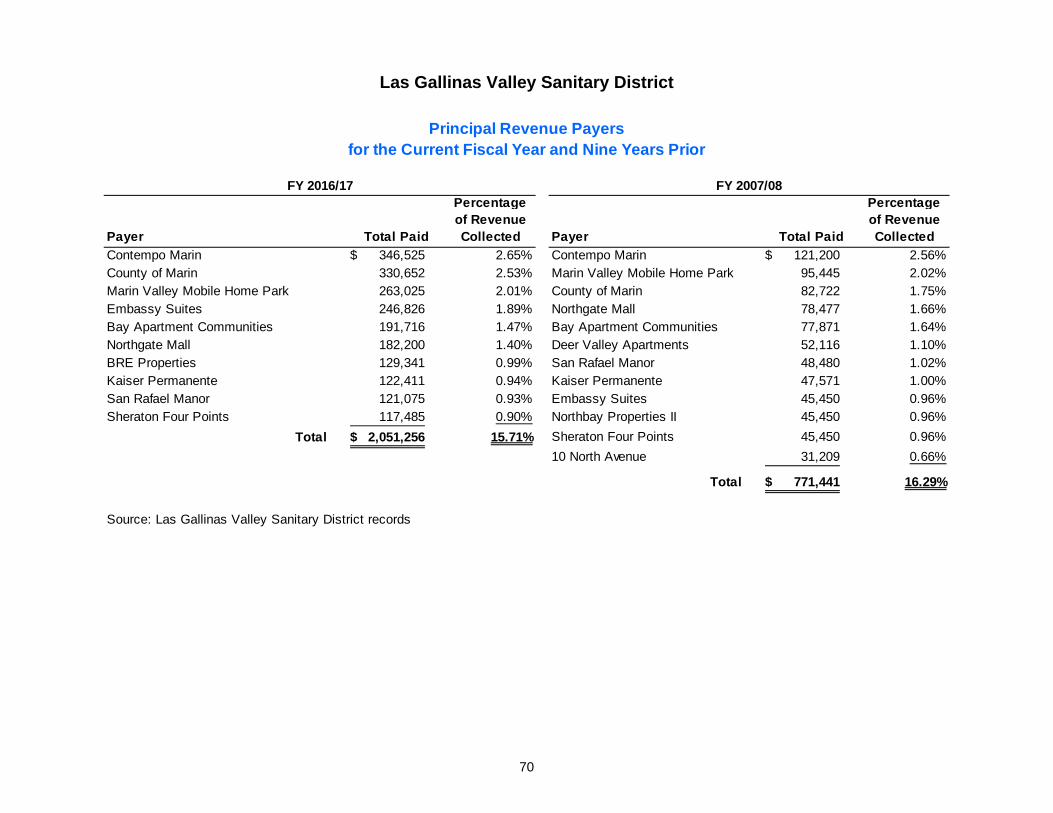
Las Gallinas Valley Sanitary District
70
Payer Total Paid
Percentage of Revenue Collected Payer Total Paid
Percentage of Revenue Collected
Contempo Marin 346,525$ 2.65% Contempo Marin 121,200$ 2.56%County of Marin 330,652 2.53% Marin Valley Mobile Home Park 95,445 2.02%Marin Valley Mobile Home Park 263,025 2.01% County of Marin 82,722 1.75%Embassy Suites 246,826 1.89% Northgate Mall 78,477 1.66%Bay Apartment Communities 191,716 1.47% Bay Apartment Communities 77,871 1.64%Northgate Mall 182,200 1.40% Deer Valley Apartments 52,116 1.10%BRE Properties 129,341 0.99% San Rafael Manor 48,480 1.02%Kaiser Permanente 122,411 0.94% Kaiser Permanente 47,571 1.00%San Rafael Manor 121,075 0.93% Embassy Suites 45,450 0.96%Sheraton Four Points 117,485 0.90% Northbay Properties II 45,450 0.96%
Total 2,051,256$ 15.71% Sheraton Four Points 45,450 0.96%
10 North Avenue 31,209 0.66%
Total 771,441$ 16.29%
Source: Las Gallinas Valley Sanitary District records
Principal Revenue Payersfor the Current Fiscal Year and Nine Years Prior
FY 2016/17 FY 2007/08
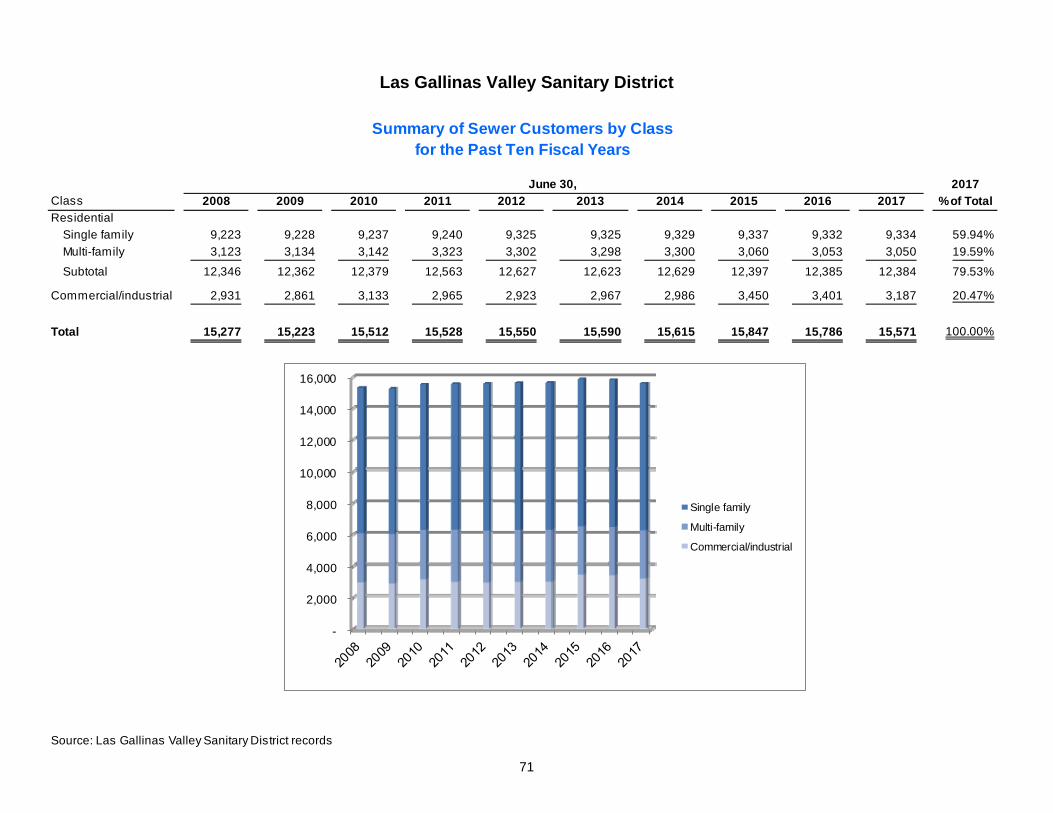
Las Gallinas Valley Sanitary District
71
2017Class 2008 2009 2010 2011 2012 2013 2014 2015 2016 2017 % of TotalResidential
Single family 9,223 9,228 9,237 9,240 9,325 9,325 9,329 9,337 9,332 9,334 59.94%
Multi-family 3,123 3,134 3,142 3,323 3,302 3,298 3,300 3,060 3,053 3,050 19.59%
Subtotal 12,346 12,362 12,379 12,563 12,627 12,623 12,629 12,397 12,385 12,384 79.53%
Commercial/industrial 2,931 2,861 3,133 2,965 2,923 2,967 2,986 3,450 3,401 3,187 20.47%
Total 15,277 15,223 15,512 15,528 15,550 15,590 15,615 15,847 15,786 15,571 100.00%
Source: Las Gallinas Valley Sanitary District records
June 30,
Summary of Sewer Customers by Classfor the Past Ten Fiscal Years
-
2,000
4,000
6,000
8,000
10,000
12,000
14,000
16,000
Single family
Multi-family
Commercial/industrial
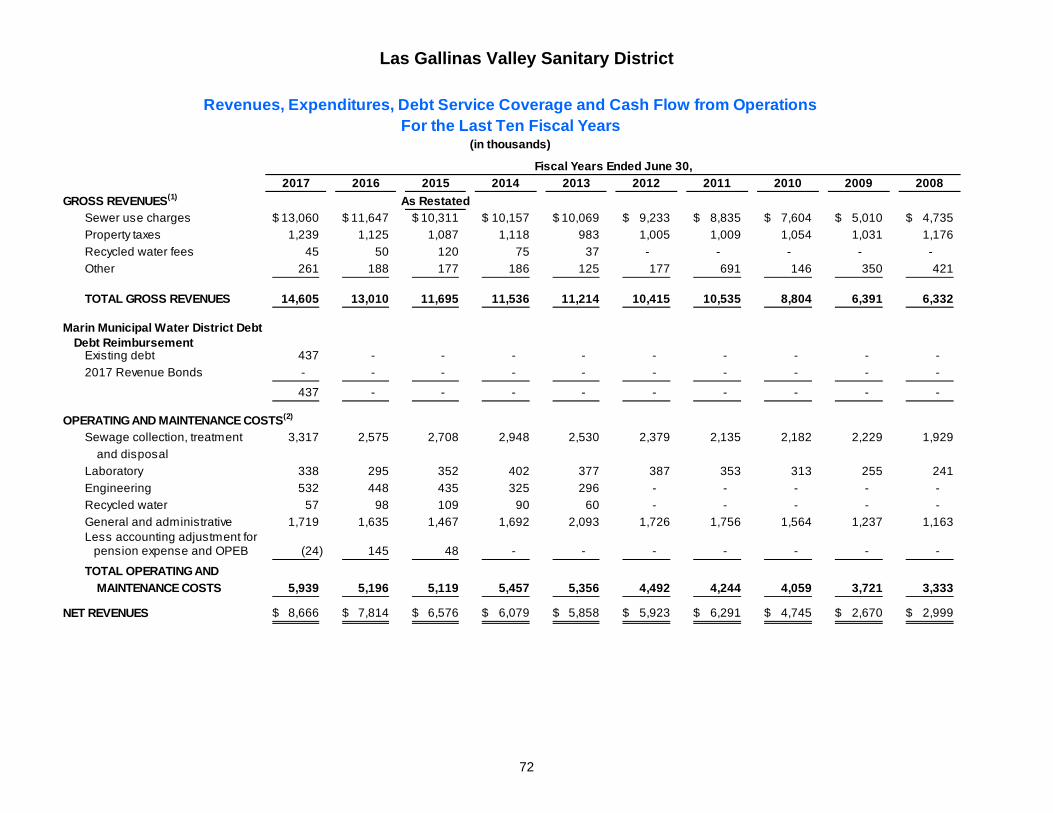
Las Gallinas Valley Sanitary District
72
2017 2016 2015 2014 2013 2012 2011 2010 2009 2008
GROSS REVENUES(1) As RestatedSewer use charges 13,060$ 11,647$ 10,311$ 10,157$ 10,069$ 9,233$ 8,835$ 7,604$ 5,010$ 4,735$
Property taxes 1,239 1,125 1,087 1,118 983 1,005 1,009 1,054 1,031 1,176
Recycled water fees 45 50 120 75 37 - - - - -
Other 261 188 177 186 125 177 691 146 350 421
TOTAL GROSS REVENUES 14,605 13,010 11,695 11,536 11,214 10,415 10,535 8,804 6,391 6,332
Marin Municipal Water District Debt Debt Reimbursement
Existing debt 437 - - - - - - - - -
2017 Revenue Bonds - - - - - - - - - -
437 - - - - - - - - -
OPERATING AND MAINTENANCE COSTS(2)
Sewage collection, treatment 3,317 2,575 2,708 2,948 2,530 2,379 2,135 2,182 2,229 1,929
and disposal
Laboratory 338 295 352 402 377 387 353 313 255 241
Engineering 532 448 435 325 296 - - - - -
Recycled water 57 98 109 90 60 - - - - -
General and administrative 1,719 1,635 1,467 1,692 2,093 1,726 1,756 1,564 1,237 1,163 Less accounting adjustment for
pension expense and OPEB (24) 145 48 - - - - - - -
TOTAL OPERATING AND
MAINTENANCE COSTS 5,939 5,196 5,119 5,457 5,356 4,492 4,244 4,059 3,721 3,333
NET REVENUES 8,666$ 7,814$ 6,576$ 6,079$ 5,858$ 5,923$ 6,291$ 4,745$ 2,670$ 2,999$
Revenues, Expenditures, Debt Service Coverage and Cash Flow from OperationsFor the Last Ten Fiscal Years
(in thousands)
Fiscal Years Ended June 30,
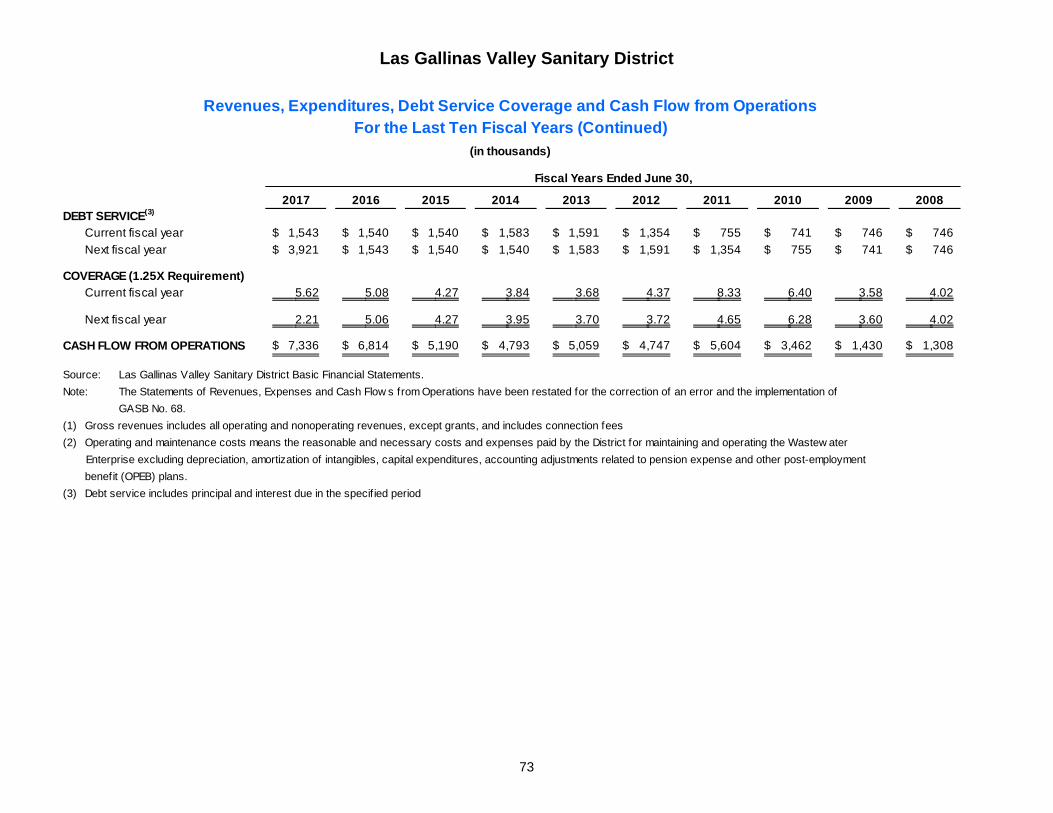
Las Gallinas Valley Sanitary District
73
2017 2016 2015 2014 2013 2012 2011 2010 2009 2008DEBT SERVICE(3)
Current fiscal year 1,543$ 1,540$ 1,540$ 1,583$ 1,591$ 1,354$ 755$ 741$ 746$ 746$
Next fiscal year 3,921$ 1,543$ 1,540$ 1,540$ 1,583$ 1,591$ 1,354$ 755$ 741$ 746$
COVERAGE (1.25X Requirement)Current fiscal year 5.62 5.08 4.27 3.84 3.68 4.37 8.33 6.40 3.58 4.02
Next fiscal year 2.21 5.06 4.27 3.95 3.70 3.72 4.65 6.28 3.60 4.02
CASH FLOW FROM OPERATIONS 7,336$ 6,814$ 5,190$ 4,793$ 5,059$ 4,747$ 5,604$ 3,462$ 1,430$ 1,308$
Source: Las Gallinas Valley Sanitary District Basic Financial Statements.
Note: The Statements of Revenues, Expenses and Cash Flow s from Operations have been restated for the correction of an error and the implementation of
GASB No. 68.
(1) Gross revenues includes all operating and nonoperating revenues, except grants, and includes connection fees
(2) Operating and maintenance costs means the reasonable and necessary costs and expenses paid by the District for maintaining and operating the Wastew ater
Enterprise excluding depreciation, amortization of intangibles, capital expenditures, accounting adjustments related to pension expense and other post-employment
benefit (OPEB) plans.
(3) Debt service includes principal and interest due in the specif ied period
Revenues, Expenditures, Debt Service Coverage and Cash Flow from OperationsFor the Last Ten Fiscal Years (Continued)
(in thousands)
Fiscal Years Ended June 30,
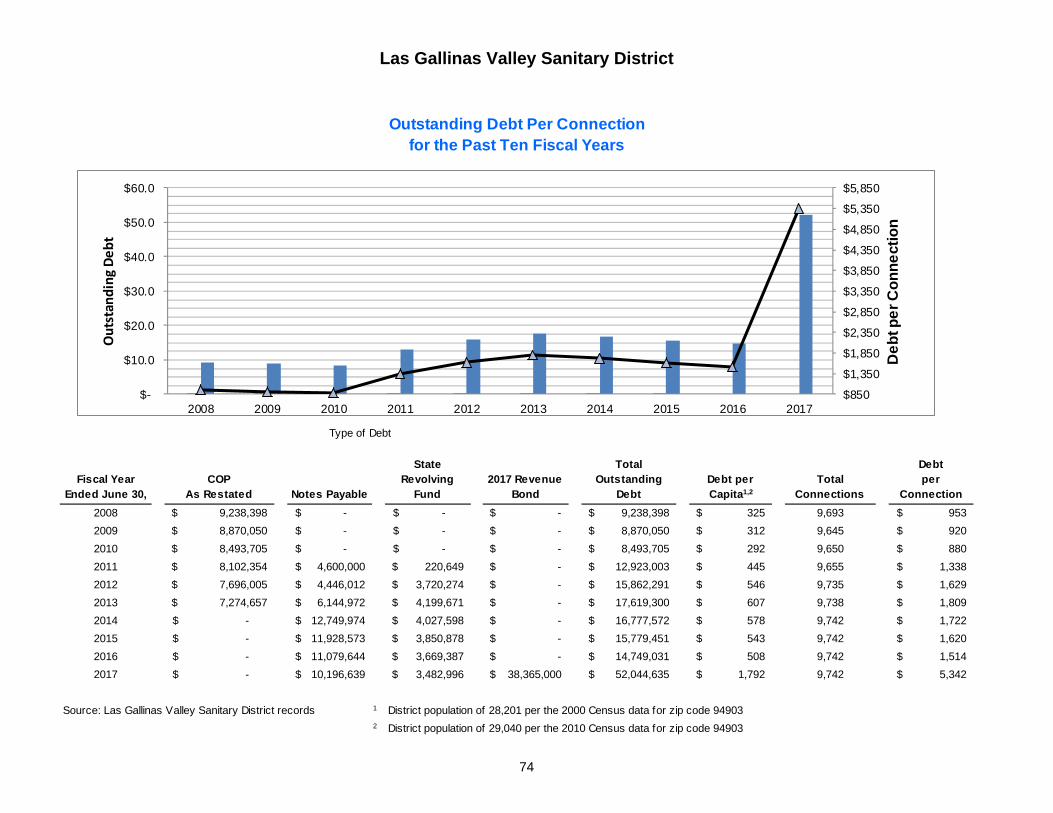
Las Gallinas Valley Sanitary District
74
Fiscal Year Ended June 30,
COPAs Restated Notes Payable
State Revolving
Fund2017 Revenue
Bond
Total Outstanding
DebtDebt per Capita1,2
Total Connections
Debt per
Connection
2008 9,238,398$ -$ -$ -$ 9,238,398$ 325$ 9,693 953$
2009 8,870,050$ -$ -$ -$ 8,870,050$ 312$ 9,645 920$
2010 8,493,705$ -$ -$ -$ 8,493,705$ 292$ 9,650 880$
2011 8,102,354$ 4,600,000$ 220,649$ -$ 12,923,003$ 445$ 9,655 1,338$
2012 7,696,005$ 4,446,012$ 3,720,274$ -$ 15,862,291$ 546$ 9,735 1,629$
2013 7,274,657$ 6,144,972$ 4,199,671$ -$ 17,619,300$ 607$ 9,738 1,809$
2014 -$ 12,749,974$ 4,027,598$ -$ 16,777,572$ 578$ 9,742 1,722$
2015 -$ 11,928,573$ 3,850,878$ -$ 15,779,451$ 543$ 9,742 1,620$
2016 -$ 11,079,644$ 3,669,387$ -$ 14,749,031$ 508$ 9,742 1,514$
2017 -$ 10,196,639$ 3,482,996$ 38,365,000$ 52,044,635$ 1,792$ 9,742 5,342$
Source: Las Gallinas Valley Sanitary District records 1 District population of 28,201 per the 2000 Census data for zip code 949032 District population of 29,040 per the 2010 Census data for zip code 94903
Outstanding Debt Per Connectionfor the Past Ten Fiscal Years
Type of Debt
$850
$1,350
$1,850
$2,350
$2,850
$3,350
$3,850
$4,350
$4,850
$5,350
$5,850
$-
$10.0
$20.0
$30.0
$40.0
$50.0
$60.0
2008 2009 2010 2011 2012 2013 2014 2015 2016 2017
De
bt p
er
Co
nn
ect
ion
Outstanding Debt
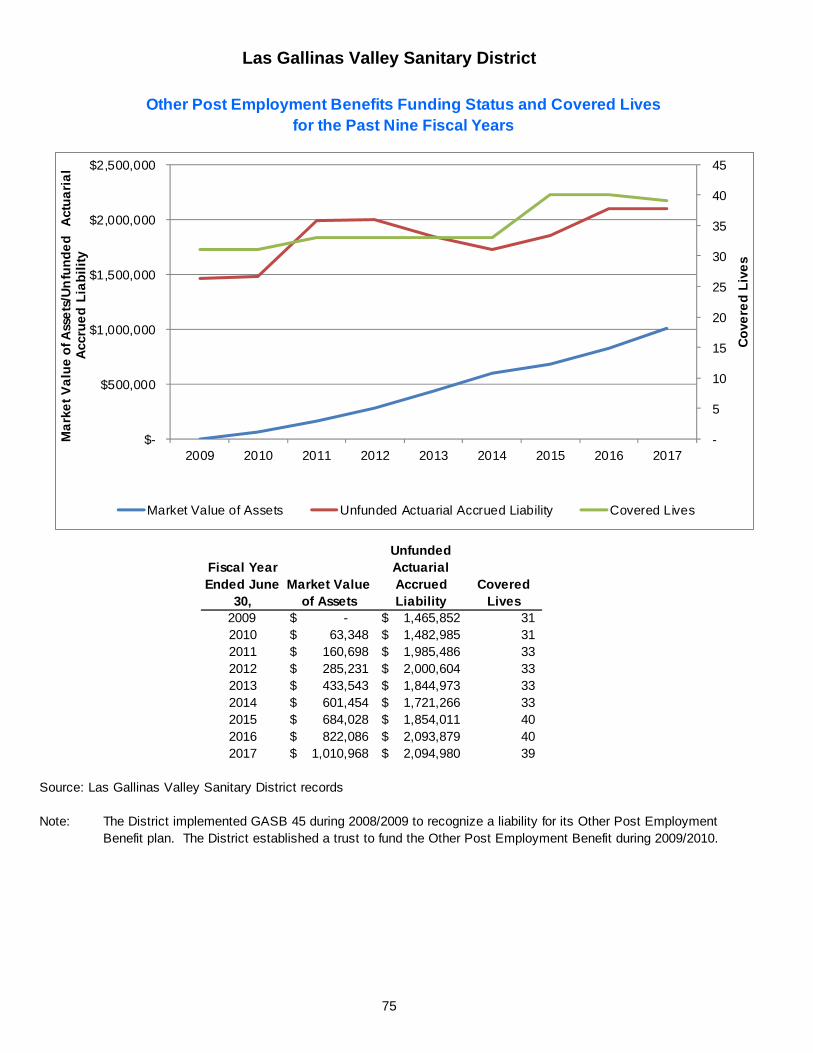
Las Gallinas Valley Sanitary District
75
Fiscal Year Ended June
30,Market Value
of Assets
Unfunded Actuarial Accrued Liability
Covered Lives
2009 -$ 1,465,852$ 31 2010 63,348$ 1,482,985$ 31 2011 160,698$ 1,985,486$ 33 2012 285,231$ 2,000,604$ 33 2013 433,543$ 1,844,973$ 33 2014 601,454$ 1,721,266$ 33 2015 684,028$ 1,854,011$ 40 2016 822,086$ 2,093,879$ 40 2017 1,010,968$ 2,094,980$ 39
Source: Las Gallinas Valley Sanitary District records
Note: The District implemented GASB 45 during 2008/2009 to recognize a liability for its Other Post EmploymentBenefit plan. The District established a trust to fund the Other Post Employment Benefit during 2009/2010.
Other Post Employment Benefits Funding Status and Covered Livesfor the Past Nine Fiscal Years
-
5
10
15
20
25
30
35
40
45
$-
$500,000
$1,000,000
$1,500,000
$2,000,000
$2,500,000
2009 2010 2011 2012 2013 2014 2015 2016 2017
Co
vere
d L
ive
s
Ma
rke
t V
alu
e o
f Ass
ets
/Un
fun
de
d
Act
ua
ria
l A
ccru
ed
Lia
bil
ity
Market Value of Assets Unfunded Actuarial Accrued Liability Covered Lives
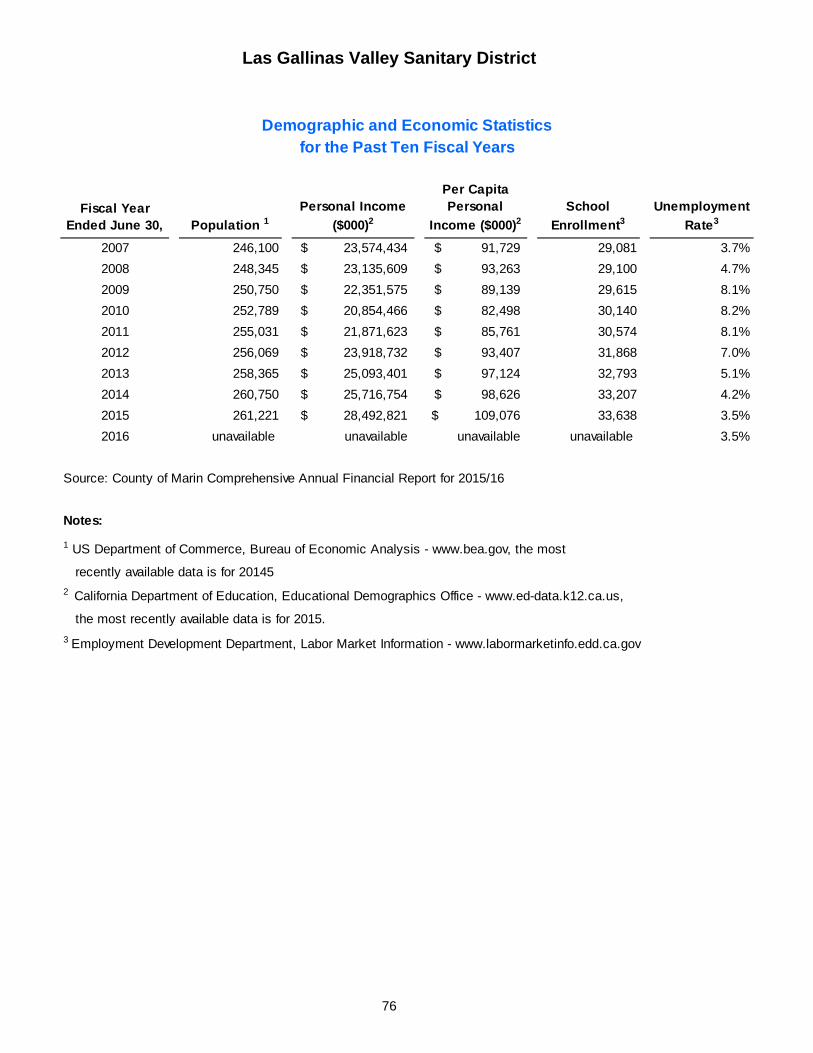
Las Gallinas Valley Sanitary District
76
Fiscal Year Ended June 30, Population 1
Personal Income
($000)2
Per Capita Personal
Income ($000)2School
Enrollment3Unemployment
Rate3
2007 246,100 23,574,434$ 91,729$ 29,081 3.7%
2008 248,345 23,135,609$ 93,263$ 29,100 4.7%
2009 250,750 22,351,575$ 89,139$ 29,615 8.1%
2010 252,789 20,854,466$ 82,498$ 30,140 8.2%
2011 255,031 21,871,623$ 85,761$ 30,574 8.1%
2012 256,069 23,918,732$ 93,407$ 31,868 7.0%
2013 258,365 25,093,401$ 97,124$ 32,793 5.1%
2014 260,750 25,716,754$ 98,626$ 33,207 4.2%
2015 261,221 28,492,821$ 109,076$ 33,638 3.5%
2016 unavailable unavailable unavailable unavailable 3.5%
Source: County of Marin Comprehensive Annual Financial Report for 2015/16
Notes:
1 US Department of Commerce, Bureau of Economic Analysis - www.bea.gov, the most
recently available data is for 20145
2 California Department of Education, Educational Demographics Office - www.ed-data.k12.ca.us,
the most recently available data is for 2015.
3 Employment Development Department, Labor Market Information - www.labormarketinfo.edd.ca.gov
Demographic and Economic Statisticsfor the Past Ten Fiscal Years
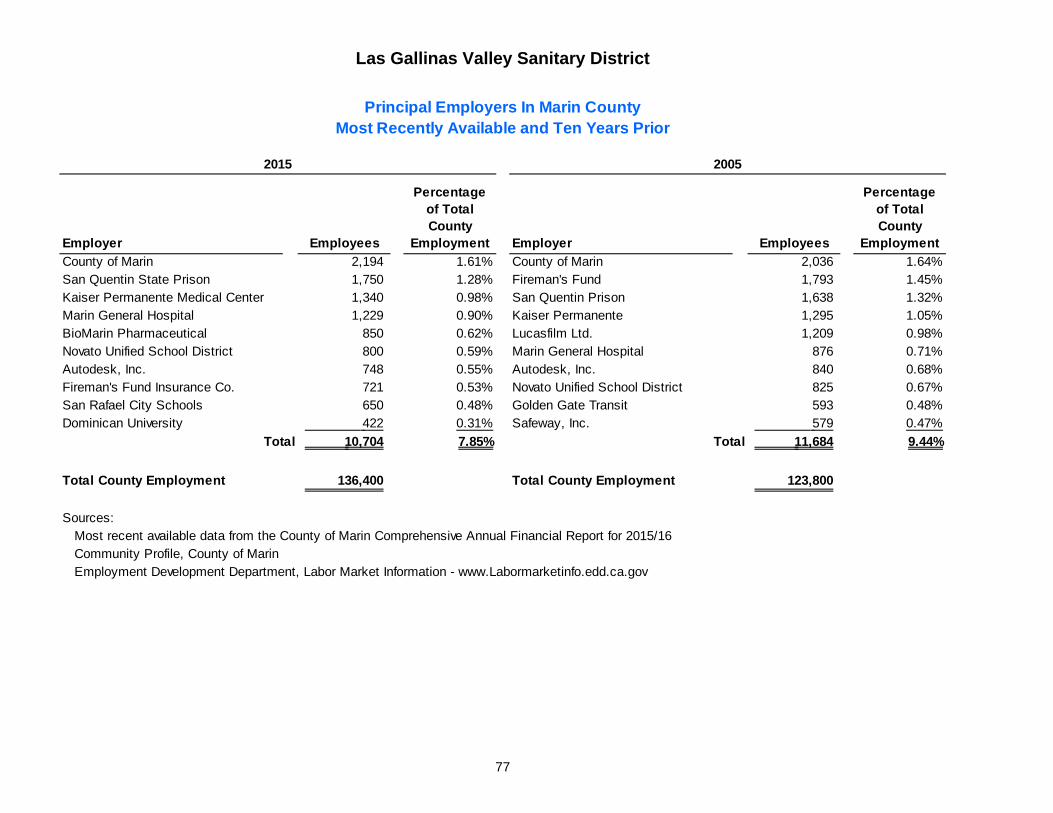
Las Gallinas Valley Sanitary District
77
Employer Employees
Percentage of Total County
Employment Employer Employees
Percentage of Total County
Employment
County of Marin 2,194 1.61% County of Marin 2,036 1.64%San Quentin State Prison 1,750 1.28% Fireman's Fund 1,793 1.45%Kaiser Permanente Medical Center 1,340 0.98% San Quentin Prison 1,638 1.32%Marin General Hospital 1,229 0.90% Kaiser Permanente 1,295 1.05%BioMarin Pharmaceutical 850 0.62% Lucasfilm Ltd. 1,209 0.98%Novato Unified School District 800 0.59% Marin General Hospital 876 0.71%Autodesk, Inc. 748 0.55% Autodesk, Inc. 840 0.68%Fireman's Fund Insurance Co. 721 0.53% Novato Unified School District 825 0.67%San Rafael City Schools 650 0.48% Golden Gate Transit 593 0.48%Dominican University 422 0.31% Safeway, Inc. 579 0.47%
Total 10,704 7.85% Total 11,684 9.44%
Total County Employment 136,400 Total County Employment 123,800
Sources: Most recent available data from the County of Marin Comprehensive Annual Financial Report for 2015/16Community Profile, County of MarinEmployment Development Department, Labor Market Information - www.Labormarketinfo.edd.ca.gov
Principal Employers In Marin CountyMost Recently Available and Ten Years Prior
2015 2005
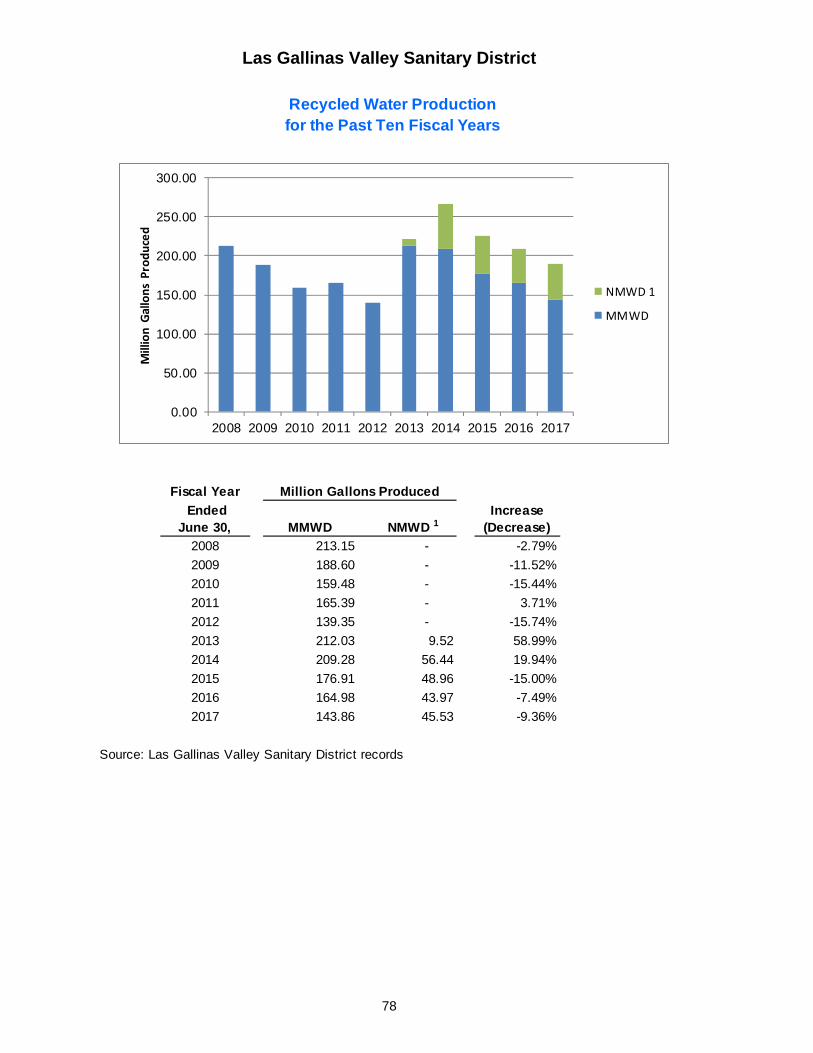
Las Gallinas Valley Sanitary District
78
Fiscal Year
EndedJune 30, MMWD NMWD 1
Increase (Decrease)
2008 213.15 - -2.79%
2009 188.60 - -11.52%
2010 159.48 - -15.44%
2011 165.39 - 3.71%
2012 139.35 - -15.74%
2013 212.03 9.52 58.99%
2014 209.28 56.44 19.94%
2015 176.91 48.96 -15.00%
2016 164.98 43.97 -7.49%
2017 143.86 45.53 -9.36%
Source: Las Gallinas Valley Sanitary District records
Recycled Water Productionfor the Past Ten Fiscal Years
Million Gallons Produced
0.00
50.00
100.00
150.00
200.00
250.00
300.00
2008 2009 2010 2011 2012 2013 2014 2015 2016 2017
Million Gallons Produced
NMWD 1
MMWD
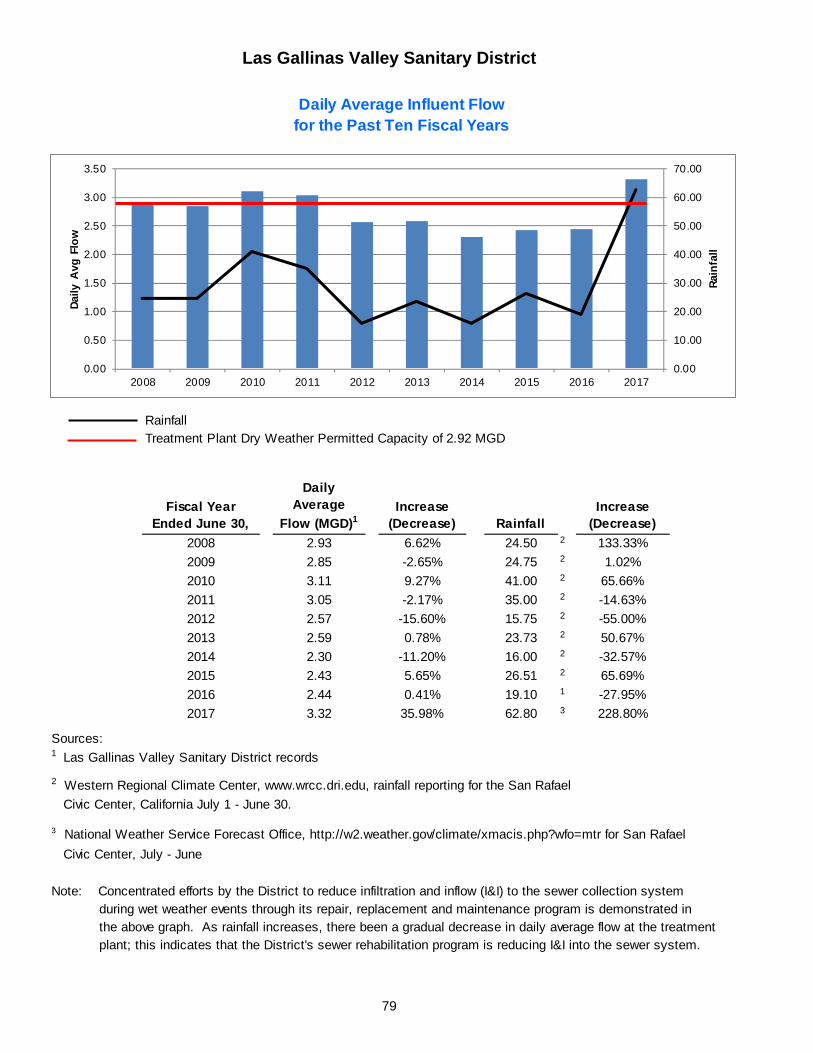
Las Gallinas Valley Sanitary District
79
RainfallTreatment Plant Dry Weather Permitted Capacity of 2.92 MGD
Fiscal Year Ended June 30,
Daily Average
Flow (MGD)1Increase
(Decrease) RainfallIncrease
(Decrease)
2008 2.93 6.62% 24.50 2 133.33%
2009 2.85 -2.65% 24.75 2 1.02%
2010 3.11 9.27% 41.00 2 65.66%
2011 3.05 -2.17% 35.00 2 -14.63%
2012 2.57 -15.60% 15.75 2 -55.00%
2013 2.59 0.78% 23.73 2 50.67%
2014 2.30 -11.20% 16.00 2 -32.57%
2015 2.43 5.65% 26.51 2 65.69%
2016 2.44 0.41% 19.10 1 -27.95%
2017 3.32 35.98% 62.80 3 228.80%
Sources: 1 Las Gallinas Valley Sanitary District records
2 Western Regional Climate Center, www.wrcc.dri.edu, rainfall reporting for the San Rafael
Civic Center, California July 1 - June 30.
3 National Weather Service Forecast Office, http://w2.weather.gov/climate/xmacis.php?wfo=mtr for San Rafael
Civic Center, July - June
Note: Concentrated efforts by the District to reduce infiltration and inflow (I&I) to the sewer collection systemduring wet weather events through its repair, replacement and maintenance program is demonstrated inthe above graph. As rainfall increases, there been a gradual decrease in daily average flow at the treatmentplant; this indicates that the District's sewer rehabilitation program is reducing I&I into the sewer system.
Daily Average Influent Flowfor the Past Ten Fiscal Years
0.00
10.00
20.00
30.00
40.00
50.00
60.00
70.00
0.00
0.50
1.00
1.50
2.00
2.50
3.00
3.50
2008 2009 2010 2011 2012 2013 2014 2015 2016 2017
Rai
nfa
ll
Dai
ly A
vg F
low
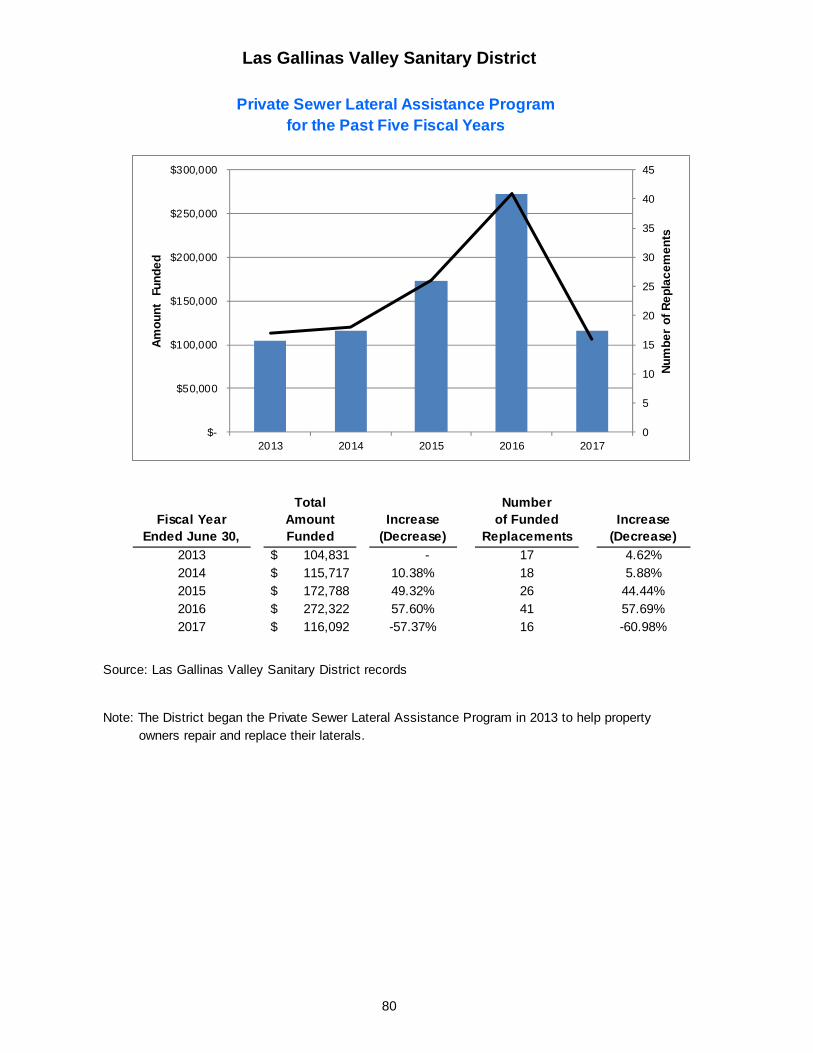
Las Gallinas Valley Sanitary District
80
Fiscal Year Ended June 30,
TotalAmountFunded
Increase (Decrease)
Numberof Funded
ReplacementsIncrease
(Decrease)
2013 104,831$ - 17 4.62%2014 115,717$ 10.38% 18 5.88%2015 172,788$ 49.32% 26 44.44%2016 272,322$ 57.60% 41 57.69%2017 116,092$ -57.37% 16 -60.98%
Source: Las Gallinas Valley Sanitary District records
Note: The District began the Private Sewer Lateral Assistance Program in 2013 to help propertyowners repair and replace their laterals.
Private Sewer Lateral Assistance Programfor the Past Five Fiscal Years
0
5
10
15
20
25
30
35
40
45
$-
$50,000
$100,000
$150,000
$200,000
$250,000
$300,000
2013 2014 2015 2016 2017
Nu
mb
er
of
Re
pla
ce
me
nts
Am
ou
nt
Fu
nd
ed
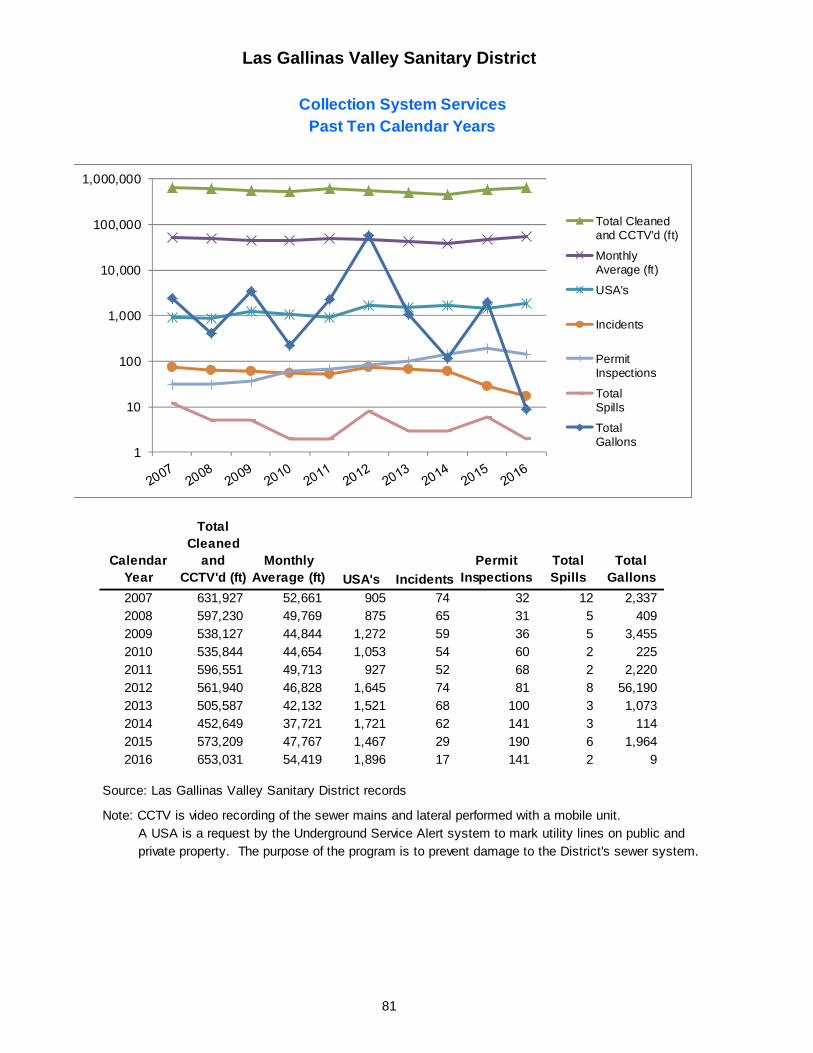
Las Gallinas Valley Sanitary District
81
CalendarYear
Total Cleaned
and CCTV'd (ft)
MonthlyAverage (ft) USA's Incidents
PermitInspections
TotalSpills
TotalGallons
2007 631,927 52,661 905 74 32 12 2,337 2008 597,230 49,769 875 65 31 5 409 2009 538,127 44,844 1,272 59 36 5 3,455 2010 535,844 44,654 1,053 54 60 2 225 2011 596,551 49,713 927 52 68 2 2,220 2012 561,940 46,828 1,645 74 81 8 56,190 2013 505,587 42,132 1,521 68 100 3 1,073 2014 452,649 37,721 1,721 62 141 3 114 2015 573,209 47,767 1,467 29 190 6 1,964 2016 653,031 54,419 1,896 17 141 2 9
Source: Las Gallinas Valley Sanitary District records
Note: CCTV is video recording of the sewer mains and lateral performed with a mobile unit.A USA is a request by the Underground Service Alert system to mark utility lines on public andprivate property. The purpose of the program is to prevent damage to the District's sewer system.
Collection System ServicesPast Ten Calendar Years
1
10
100
1,000
10,000
100,000
1,000,000
Total Cleanedand CCTV'd (ft)
MonthlyAverage (ft)
USA's
Incidents
PermitInspections
TotalSpills
TotalGallons
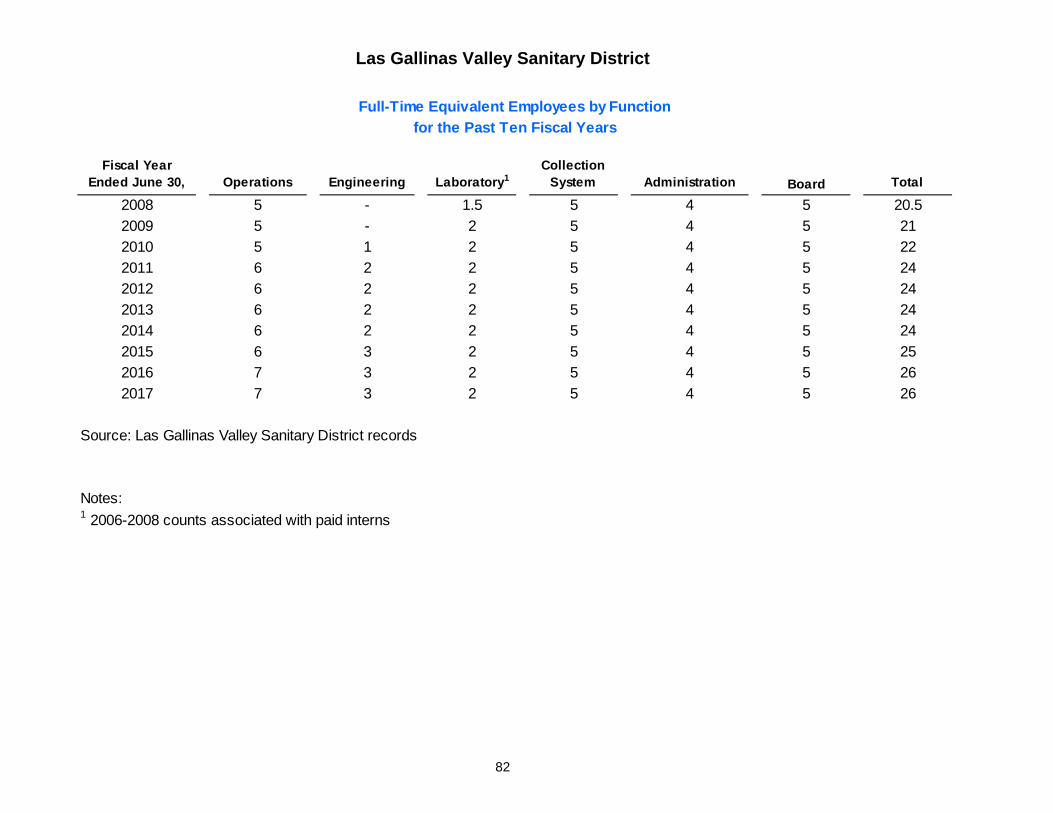
Las Gallinas Valley Sanitary District
82
Fiscal Year Ended June 30, Operations Engineering Laboratory1
Collection System Administration Board Total
2008 5 - 1.5 5 4 5 20.5
2009 5 - 2 5 4 5 21
2010 5 1 2 5 4 5 22
2011 6 2 2 5 4 5 24
2012 6 2 2 5 4 5 24
2013 6 2 2 5 4 5 24
2014 6 2 2 5 4 5 24
2015 6 3 2 5 4 5 25
2016 7 3 2 5 4 5 26
2017 7 3 2 5 4 5 26
Source: Las Gallinas Valley Sanitary District records
Notes:1 2006-2008 counts associated with paid interns
Full-Time Equivalent Employees by Function
for the Past Ten Fiscal Years