Embed Size (px)
Citation preview

COMPREHENSIVE ANNUAL FINANCIAL REPORTFOR THE FISCAL YEARS ENDING JUNE 30, 2014 AND 2013A Component Unit of the Metropolitan Government
of Nashville and Davidson County, Tennessee

Comprehensive AnnualFinancial Report
For the Fiscal Years Ended June 30, 2014 and 2013Prepared by the Finance Department
2 Metropolitan Nashville Airport Authority | Comprehensive Annnual Financial Report
Table of ContentsMetropolitan Nashville Airport Authority | Comprehensive Annual Financial Report
INTRODUCTORY SECTION Letter of Transmittal ................................................................................................................................ 4 - 10 Board of Commissioners and Executive Staff ...............................................................................................11 Organization Chart ...................................................................................................................................... 12 Certifi cate of Achievement for Excellence in Financial Reporting ............................................................... 13
FINANCIAL SECTION Independent Auditor’s Report ..................................................................................................................16 - 17 Management’s Discssion and Analysis ...................................................................................................18 - 29 Financial Statements as of and for the Years Ended June 30, 2014 and 2013 Statements of Net Position ............................................................................................................ 30 - 31 Statements of Revenues, Expenses and Changes in Net Position ..................................................... 33 Statements of Cash Flows ............................................................................................................ 34 - 35 Notes to Financial Statements ...................................................................................................... 36 - 68
REQUIRED SUPPLEMENTARY INFORMATION Schedules of Funding Progress - Pension and OPEB Plans ......................................................................... 69
OTHER INFORMATION Schedule of Net Position Information by Entity ...................................................................................... 72 - 73 Schedule of Revenues, Expenses and Changes in Net Position Information by Entity................................. 75 Schedule of Airport Revenue Bonds, Principal and Interest Requirements by Fiscal Year ................... 76 - 77
STATISTICAL SECTION Airport-specifi c Statistics Operating Revenues Analysis .............................................................................................................. 80 Cost per Enplaned Passenger ............................................................................................................. 81 Operating Revenues Analysis - Activity Detail ...................................................................................... 82 Public Parking Analysis ........................................................................................................................ 82 Operating Expenses Analysis ............................................................................................................... 83 Capital Assets ....................................................................................................................................... 84 Ratios of Outstanding Revenue Bonds as a Percentage of Total Revenue Bond Debt ...................... 84 Net Position ................................................................................................................................... 85 - 86 Debt Service Coverage .................................................................................................................. 87 - 88 Passenger Enplanements Market Share ............................................................................................. 89 Enplanement History ............................................................................................................................ 89 Airline Landed Weights Market Share .................................................................................................. 90 Aircraft Activity and Weights ................................................................................................................. 91 Airport Tenants ...................................................................................................................................... 92 Staffi ng - Full-time Equivalents ............................................................................................................. 93 Local Economy Statistics Population Analysis .............................................................................................................................. 93 Unemployment Analysis ....................................................................................................................... 94 Top 25 Local Employers ....................................................................................................................... 95 Top 25 Middle Tennessee Public Companies ...................................................................................... 95
Introductory SectionMetropolitan Nashville Airport Authority | Comprehensive Annual Financial Report
This section contains the following subsections:
Letter of Transmittal
Board of Commissioners and Executive Staff
Organization Chart
Certifi cate of Achievement for Excellence in Financial Reporting
LETTER OF TRANSMITTAL
4 Metropolitan Nashville Airport Authority | Comprehensive Annnual Financial Report
October 31, 2014
To the Board of Commissioners of the Metropolitan Nashville Airport Authority,
The Comprehensive Annual Financial Report (“CAFR”) of the Metropolitan Nashville Airport Authority (the “Authority” or “MNAA”) for the fiscal year ended June 30, 2014, is hereby submitted. Responsibility for both the accuracy of the data and the completeness and fairness of the presentation, including all disclosures, rests with the Finance Department of the Authority. To the best of our knowledge and belief, the enclosed data are accurate in all material respects and are reported in a manner designed to present fairly the financial position and results of operations of the Authority. All disclosures necessary to enable the reader to gain an understanding of the Authority’s financial activities have been included.
The Authority is a metropolitan airport authority created on February 9, 1970, pursuant to state statute and is an independent political subdivision of the State of Tennessee. The major purposes of the Authority are the operation, financing and development of Nashville International Airport (“BNA”) and John C. Tune Airport (“JWN”), a general aviation reliever airport. These activities collectively provided the framework to deliver the Nashville Airports Experience, the Authority’s core competency, to 10.6 million passengers and many other stakeholders in fiscal year 2014.
The Authority also owns MNAA Properties Corporation (“MPC”), a Tennessee nonprofit corporation, whose purpose is to support and facilitate the operations of the Authority and to help the economic development of the surrounding area. The Authority has all the powers of a governmental entity necessary to accomplish its purpose, such as acquiring land and constructing airport facilities; issuing revenue bonds and other tax-exempt indebtedness; maintaining its own police and aircraft rescue and firefighting (“ARFF”); and setting rates, charges and rentals for activities on airport properties. Based upon the criteria set forth in Governmental Accounting Standards Board, it has been determined that the Authority is a component unit of the Metropolitan Government of Nashville and Davidson County, Tennessee.
A Board of Commissioners governs the Authority and serves without compensation. The Board of Commissioners is made up of ten members, nine of whom are appointed by the Mayor with the tenth being the Mayor. The Metropolitan Council of Nashville and Davidson County confirms all appointments. The appointments are four-year terms. Terms are staggered to provide for continuity of airport development and management. By state law, the Commissioners represent different professional and management disciplines, including engineering, aviation, law, commerce, finance and industry. The Board appoints the Authority’s President and CEO, who is the chief executive and administrative officer responsible for day-to-day operations and planning for both airports and MPC. The President and CEO leads a full-time staff of professional and technical personnel, with a budgeted headcount of 294 positions for fiscal year 2014.
LETTER OF TRANSMITTAL
Metropolitan Nashville Airport Authority | Comprehensive Annnual Financial Report 5
A significant portion of day-to-day operations and planning relates to fiscal management. Staff-prepared operating and capital budgets are reviewed by various committees of the Board of Commissioners and adopted by the full Board of Commissioners. In the case of Nashville International Airport, the annual capital and operating budgets are additionally reviewed and approved by the signatory airlines that have committed to the residual lease agreement, which expires September 30, 2017. Although budget programs are approved by the Board of Commissioners, individual expenditures, whether for capital or operating purposes, must comply with the Authority’s bylaws and policies and procedural requirements for competitive acquisition, as well as statutory and revenue bond trust indenture requirements.
The Authority utilizes a cash management and investment policy intended to achieve maximum financial return while minimizing risk of loss on all available funds. The trust indenture and supplemental resolutions, which govern the investment of bond proceeds, generally authorize the Authority to invest in direct obligations of or obligations guaranteed by the U.S. Government, obligations issued or guaranteed by specific agencies of the U.S. Government, secured certificates of deposit, secured repurchase agreements, and specifically rated obligations of state governments, commercial paper, and money market funds. The carrying amount and market value of the investments at June 30, 2014 and 2013 were $7,706,000 and $10,872,000, respectively, as the Authority chose to maintain higher cash balances rather than investing during the year. For more detailed information relating to the Authority’s cash and investments, refer to Note 3, Cash and Cash Equivalents and Investments, to the Authority’s financial statements included in the financial section of this CAFR.
Another top priority of the Authority is to manage risk to minimize losses in order to protect and preserve MNAA assets. The Authority recently implemented an Enterprise Risk Management system to identify and mitigate potential risk exposures. To further protect the Authority’s exposure to loss, MNAA maintains various lines of insurance, including a $500 million general liability policy with self-retention of $5,000 per occurrence and a $25,000 aggregate deductible. Additionally, real and personal property is insured for $400 million with various deductibles depending upon the loss category involved. The Authority’s tenant and contractor insurance requirements and indemnifications have been coordinated with the aforementioned policies to further reduce the risk of loss through actions beyond management’s control.
ECONOMIC CONDITIONS AND OUTLOOK OF THE METROPOLITAN STATISTICAL AREA (“MSA”)
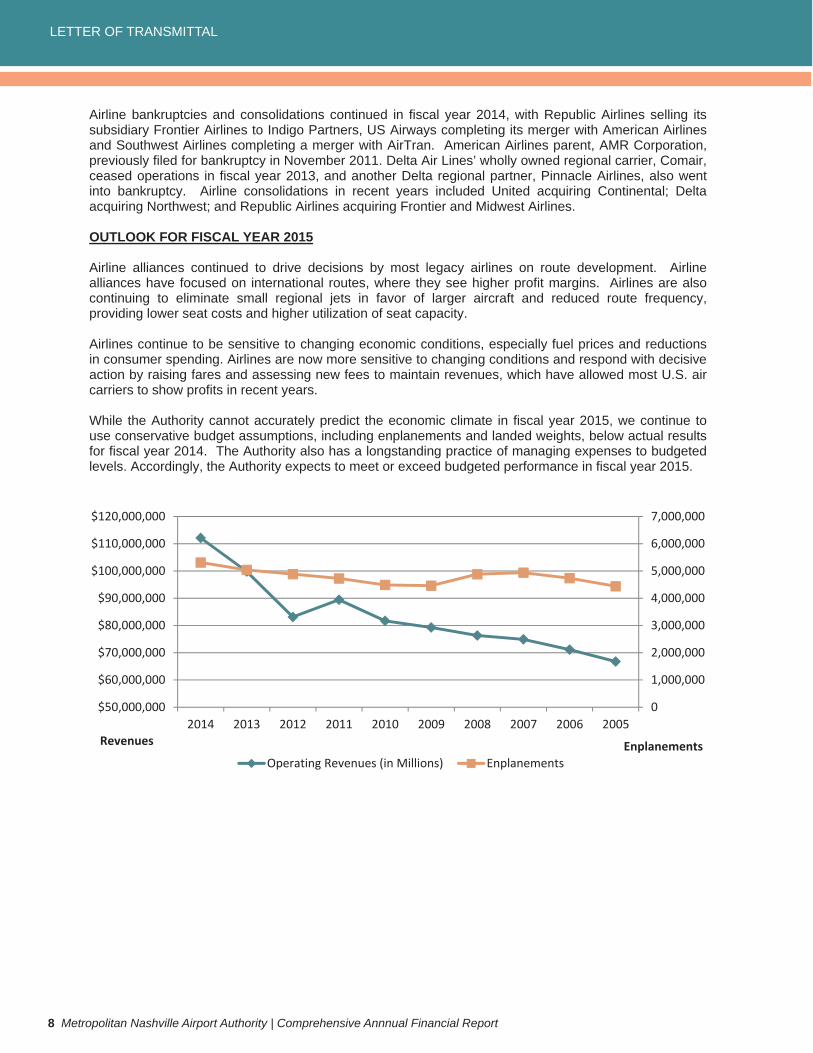
Nashville International Airport continued to experience growth in fiscal year 2014, with over 10.6 million passengers served and 5.3 million enplanements. Enplanements were up 5.4%, 3.2%, 3.4% and 5.3% respectively in fiscal years 2014, 2013, 2012 and 2011. Over the past ten years, this growth has caused Nashville International to jump from the 43rd largest airport in 2005 to the 33rd largest airport by total enplanements in 2013.
The region continued to experience strong economic growth in fiscal year 2014, with Nashville outpacing both the state and the nation. Forbes named Nashville one of the “Best Cities in U.S. for jobs in 2013” and “U.S. Regions to Watch in 2014” (Forbes.com). Nashville was ranked No. 1 in job creation in the U.S. in 2012, according to the U.S. Bureau of Labor Statistics. Time named Nashville “The South’s Red Hot Town” (March 2014), Corporate and Incentive Travel said Nashville was a “National Hot Spot” and Business Insider said it was one of the “15 Hottest American Cities of the Future.”
Nashville is increasingly becoming known as a travel destination, with accolades that include “Best Places to Go In 2014” (Travel + Leisure, Conde Nast, Fodor’s and The New York Times); “Best Summer Vacation Spots” (Money Magazine - May 2014); “Adventure Town” (National Geographic); “22 Reasons you Should Visit Nashville Now” (Huffington Post); “Best Places to Go in 2013” (Conde Nast, Fodor’s, Yahoo! Travel, Business Insider, Budget Travel); “10 Must-Visit Cities” - USA Today; “10 Best Budget Destinations” - Budget Travel; and “The Coolest, Tastiest City in the South” - Bon Appetit.
LETTER OF TRANSMITTAL
6 Metropolitan Nashville Airport Authority | Comprehensive Annnual Financial Report
Many leading publications have recently highlighted Nashville, including “2014’s Hottest Travel Destinations for Food” (The Daily Meal); “Nashville’s Rising Stars: The Kitchen Is Their Studio” (The New York Times); “South’s Best Neighborhoods: 12South, Nashville” (Southern Living); “How Hot Chicken Became Nashville’s Signature Dish” (Time); “Eat Your Way Through Nashville” (St. Louis Post-Dispatch);“Nashville Strikes New Chords for Visitors” (USA Today Travel). GQ Magazine noted, “Nashville, Tennessee, used to be just a city of ten-gallon hats and the Grand Ole Opry. Now it’s the most electric spot in the South, thanks to a cast of transplanted designers, architects, chefs, and rock ‘n’ rollers.”
While there are too many accolades and articles about Nashville to list them all, a current list may be found online at http://www.visitmusiccity.com/Media/inthenewslistings.
Nashville also played host to many music events and celebrations in 2013 and 2014. In only its fifth year, the New Year’s Eve “Bash on Broadway” has become one of the most celebrated New Year’s venues in the nation, with over 80,000 in attendance in 2013. The 2013 CMA Music Festival also set new attendance records, with over 80,000 fans. The attendance at the annual Bonnaroo Music Festival, held in Manchester, Tennessee, exceeded 90,000 fans.
In May 2013, Nashville’s new convention center, located on a 16-acre site and known as Music City Center, opened with more than 1.2 million square feet of meeting and exhibition space. Since opening, the building has been in constant use, hosting many national conventions. In July 2014 alone, the Music City Center hosted 24 events with 81,548 attendees, generating 19,128 room nights for a total $28.7 million economic impact. Music City Center currently has over 240 events and 2 million room nights booked through 2026 and is working on an additional 289 tentative events.
ABC TV’s drama series “Nashville” continued filming on location during the year and was renewed for another season. The show filmed at many prominent locations throughout the Nashville area. Yahoo News states: “The series offers up glitzy country stars -- and their deceptive pasts -- living Faith Hill-like existences in the South’s hottest city. Episodes are chock full of original catchy tracks, which have become instant hits on iTunes.” It also said: “… there’s another star of the mega-watt show -- and that’s Nashville itself.” Several reality shows are also making Nashville their home, which was highlighted by the Wall Street Journal (January 23, 2014) in “Nashville’s Reality TV Invasion.” The article discusses A&E’s launch of “Crazy Hearts” and TNT’s “The Private Lives of Nashville Wives.”
Nashville International Airport continues to receive top awards for customer service and its concession programs. In 2014, Airport Revenue News (“ARN”), a leading concessions trade publication, awarded BNA with the Best Customer Service medium-sized hub award. In 2012, ARN awarded BNA with the recognitions shown below in the medium-sized airport category during its 2012 Best Airport and Concessionaire Awards. Nashville was also a winner of these three awards in 2010:
• Airport with the Best Customer Service • Airport with the Most Unique Airport Services • Best Overall Concession Program
Airports Council International-North America (“ACI-NA”) awarded Nashville International Airport the Richard A. Griesbach Award of Excellence for the Best Concession Program in 2011. Nashville International Airport was also named the 8th best airport by Travel & Leisure.
The Authority also earned the prestigious Excellence Award in the annual Excellence in Tennessee recognition program administered by the Tennessee Center for Performance Excellence. The Authority is the first airport in the U.S. to earn this award at its state’s highest level. Since the program was founded in 1993, only 22 organizations have attained the Excellence designation, with the Authority being one of only two organizations in Tennessee that was recognized with the Excellence Award in 2012. The Authority has also been recognized as a Gold Level Recipient of the American Heart Association’s Fit-Friendly Worksites Recognition program. The Fit-Friendly Worksites program is intended to be a catalyst for positive change. Worksites throughout the nation can be part of the initiative by making the health and wellness of their employees a priority.
LETTER OF TRANSMITTAL
Metropolitan Nashville Airport Authority | Comprehensive Annnual Financial Report 7
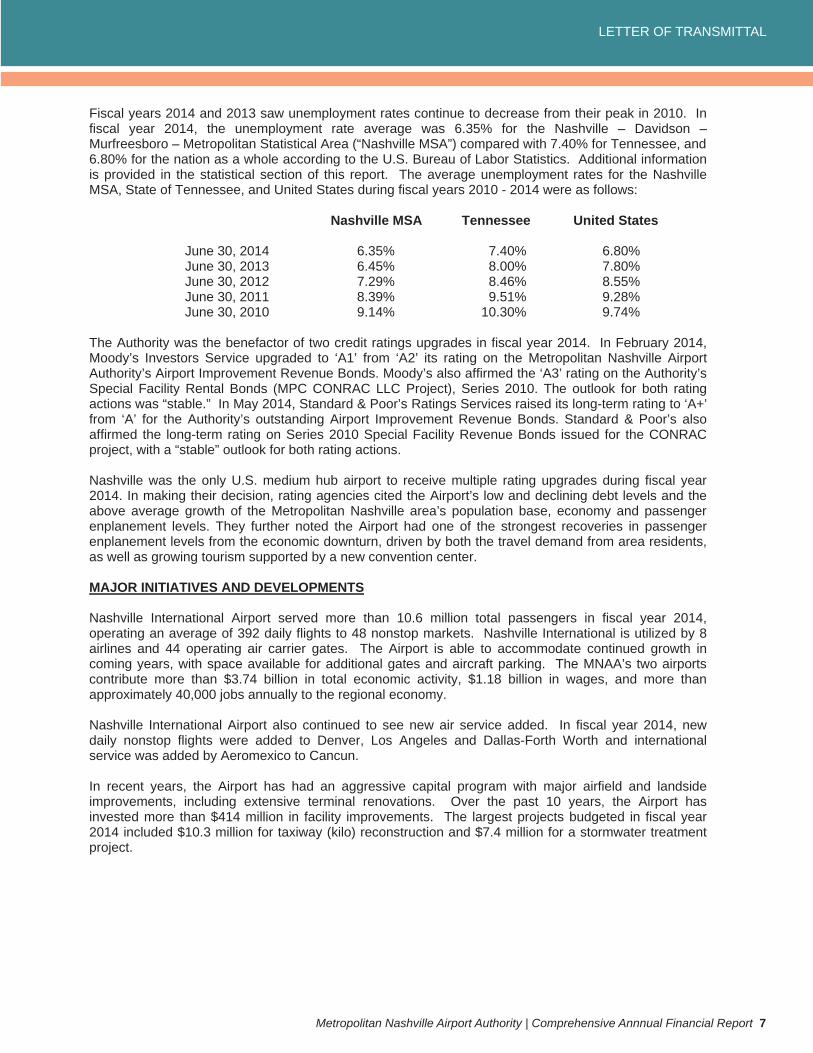
Fiscal years 2014 and 2013 saw unemployment rates continue to decrease from their peak in 2010. In fiscal year 2014, the unemployment rate average was 6.35% for the Nashville – Davidson – Murfreesboro – Metropolitan Statistical Area (“Nashville MSA”) compared with 7.40% for Tennessee, and 6.80% for the nation as a whole according to the U.S. Bureau of Labor Statistics. Additional information is provided in the statistical section of this report. The average unemployment rates for the Nashville MSA, State of Tennessee, and United States during fiscal years 2010 - 2014 were as follows:
Nashville MSA Tennessee United States
June 30, 2014 6.35% 7.40% 6.80% June 30, 2013 6.45% 8.00% 7.80% June 30, 2012 7.29% 8.46% 8.55% June 30, 2011 8.39% 9.51% 9.28% June 30, 2010 9.14% 10.30% 9.74%
The Authority was the benefactor of two credit ratings upgrades in fiscal year 2014. In February 2014, Moody’s Investors Service upgraded to ‘A1’ from ‘A2’ its rating on the Metropolitan Nashville Airport Authority’s Airport Improvement Revenue Bonds. Moody’s also affirmed the ‘A3’ rating on the Authority’s Special Facility Rental Bonds (MPC CONRAC LLC Project), Series 2010. The outlook for both rating actions was “stable.” In May 2014, Standard & Poor’s Ratings Services raised its long-term rating to ‘A+’ from ‘A’ for the Authority’s outstanding Airport Improvement Revenue Bonds. Standard & Poor’s also affirmed the long-term rating on Series 2010 Special Facility Revenue Bonds issued for the CONRAC project, with a “stable” outlook for both rating actions.
Nashville was the only U.S. medium hub airport to receive multiple rating upgrades during fiscal year 2014. In making their decision, rating agencies cited the Airport’s low and declining debt levels and the above average growth of the Metropolitan Nashville area’s population base, economy and passenger enplanement levels. They further noted the Airport had one of the strongest recoveries in passenger enplanement levels from the economic downturn, driven by both the travel demand from area residents, as well as growing tourism supported by a new convention center.
MAJOR INITIATIVES AND DEVELOPMENTS
Nashville International Airport served more than 10.6 million total passengers in fiscal year 2014, operating an average of 392 daily flights to 48 nonstop markets. Nashville International is utilized by 8 airlines and 44 operating air carrier gates. The Airport is able to accommodate continued growth in coming years, with space available for additional gates and aircraft parking. The MNAA’s two airports contribute more than $3.74 billion in total economic activity, $1.18 billion in wages, and more than approximately 40,000 jobs annually to the regional economy.
Nashville International Airport also continued to see new air service added. In fiscal year 2014, new daily nonstop flights were added to Denver, Los Angeles and Dallas-Forth Worth and international service was added by Aeromexico to Cancun.
In recent years, the Airport has had an aggressive capital program with major airfield and landside improvements, including extensive terminal renovations. Over the past 10 years, the Airport has invested more than $414 million in facility improvements. The largest projects budgeted in fiscal year 2014 included $10.3 million for taxiway (kilo) reconstruction and $7.4 million for a stormwater treatment project.
LETTER OF TRANSMITTAL
8 Metropolitan Nashville Airport Authority | Comprehensive Annnual Financial Report
Airline bankruptcies and consolidations continued in fiscal year 2014, with Republic Airlines selling its subsidiary Frontier Airlines to Indigo Partners, US Airways completing its merger with American Airlines and Southwest Airlines completing a merger with AirTran. American Airlines parent, AMR Corporation, previously filed for bankruptcy in November 2011. Delta Air Lines’ wholly owned regional carrier, Comair, ceased operations in fiscal year 2013, and another Delta regional partner, Pinnacle Airlines, also went into bankruptcy. Airline consolidations in recent years included United acquiring Continental; Delta acquiring Northwest; and Republic Airlines acquiring Frontier and Midwest Airlines.
OUTLOOK FOR FISCAL YEAR 2015
Airline alliances continued to drive decisions by most legacy airlines on route development. Airline alliances have focused on international routes, where they see higher profit margins. Airlines are also continuing to eliminate small regional jets in favor of larger aircraft and reduced route frequency, providing lower seat costs and higher utilization of seat capacity.
Airlines continue to be sensitive to changing economic conditions, especially fuel prices and reductions in consumer spending. Airlines are now more sensitive to changing conditions and respond with decisive action by raising fares and assessing new fees to maintain revenues, which have allowed most U.S. air carriers to show profits in recent years.
While the Authority cannot accurately predict the economic climate in fiscal year 2015, we continue to use conservative budget assumptions, including enplanements and landed weights, below actual results for fiscal year 2014. The Authority also has a longstanding practice of managing expenses to budgeted levels. Accordingly, the Authority expects to meet or exceed budgeted performance in fiscal year 2015.
0
1,000,000
2,000,000
3,000,000
4,000,000
5,000,000
6,000,000
7,000,000
$50,000,000
$60,000,000
$70,000,000
$80,000,000
$90,000,000
$100,000,000
$110,000,000
$120,000,000
2014 2013 2012 2011 2010 2009 2008 2007 2006 2005
EnplanementsRevenues
Operating Revenues (in Millions) Enplanements
LETTER OF TRANSMITTAL
Metropolitan Nashville Airport Authority | Comprehensive Annnual Financial Report 9
FINANCIAL INFORMATION
Financial Position and Results of Operations
Management’s Discussion and Analysis (“MD&A”), starting on page 18 summarizes the Authority’s Statement of Net Position and Statement of Revenues, Expenses, and Changes in Net Position and reviews the changes from the beginning to the end of fiscal year 2014 as well as certain comparisons of the current year to the prior year. The actual financial statements and related footnotes are presented on pages 30 to 68. The information contained in the MD&A should be considered in conjunction with the information contained in this report.
Internal Control Structure Framework
The financial statements of the Authority are prepared following U.S. generally accepted accounting principles applicable to governmental unit enterprise funds. This results in financial statements prepared on the full accrual basis.
Internal control is a process affected by an entity’s governing board, management and other personnel are designed to provide reasonable assurance regarding the achievement of objectives in the following categories: (a) safeguarding of assets from loss from unauthorized use or disposition; (b) execution of transactions in accordance with management’s authorization; (c) reliability of financial records for preparing financial statements and maintaining accountability for assets; (d) effectiveness and efficiency of operations and (e) compliance with applicable laws and regulations, including contracts and grant agreements.
Internal controls, no matter how well designed and operated, can provide only reasonable assurance to management and the board regarding achievement of an entity’s control objectives. The likelihood of achievement is affected by limitations inherent to internal control. Such limitations include:
• Human judgment in decision-making can be faulty;
• Breakdowns in internal controls can occur due to errors or mistakes;
• Controls can be circumvented by the collusion of two or more people or management override of internal controls;
• Costs of an entity’s internal controls should not exceed the benefits that are expected to be derived; and
• Custom, culture and the corporate governance system inhibit irregularities by management, but they are not absolute deterrents.
All internal control evaluations occur within the above framework. We believe that the Authority’s internal controls adequately meet the objectives listed above and have devoted considerable time this past year to attract and retain individuals in our Finance Department who embrace the concept of a healthy internal control environment.
LETTER OF TRANSMITTAL
10 Metropolitan Nashville Airport Authority | Comprehensive Annnual Financial Report
OTHER I
Independ
The Auththat the Afairly, in The AuthfederallymandatoAssociateAct of 19reports ismaterialfiscal yea
Certifica
The GovCertificatAuthority2013. Ireadablegenerallyan impardisclosur
A CertifiComprehrequirem
Acknowl
The prepCommissexcellencPropertieTenness
Respectf
Stan VanVice Pres
INFORMATIO
dent Audit
hority’s indepAuthority’s finall material rehority participfunded prog
ry as a condes, P.C., met 996 and relatssued based noncomplian
ars ending Ju
ate of Achiev
vernment Finate of Achievey for its Compn order to b and efficient
y accepted acrtial panel to mre” to clearly c
cate of Achihensive Annu
ments and are
ledgements
paration of thisioners and sce in the maes Corporatioee and the su
fully submitted
n Ostran sident and Ch
ON
endent auditonancial statemespects, the
pates in the Fgrams adminidition for conthe requirem
ted Office of upon work pece by the Autne 30, 2014 a
vement for Ex
ance Officersement for Excprehensive A
be awarded atly organized ccounting prinmeet the highcommunicate
evement is ual Financial submitting it
is CAFR wousenior manaanagement on, all in an efurrounding co
d,
hief Financial
or, Crosslin &ments as of aAuthority’s finFederal singlstered by the
ntinued fundinments set forth
Managementerformed in athority with aand 2013.
xcellence in
s Association cellence in F
Annual Financa Certificate comprehens
nciples and a standards of its financial s
valid for a pReport contito GFOA to d
uld not be posgement and
of Nashville Iffort to meet t
ommunities.
Officer
& Associatesnd for the yeanancial positie audit progre Authority. ng eligibility. h by the Statet and Budget ccordance winy applicable
Financial Re
of the UniteFinancial Repcial Report (“of Achievemive annual fin
applicable legf the programstory and mot
period of onnues to mee
determine its
ssible withouttheir desire nternationalthe air servic
, P.C., has rears ended Juon, changes ram, which cParticipation The single
e of Tennesset Circular A-1ith those reque state or Fed
eporting
ed States andporting to the“CAFR”) for t
ment, a governancial reportal requireme
m and demonstivate users to
ne year only.et the Certificeligibility for a
t the coopera to maintain Airport, John
ce needs surr
endered an uune 30, 2014
in net positioconsists of a in the singleaudit perform
ee and the Fe33. The inde
uirements notderal laws or
d Canada (“Ge Metropolitanthe fiscal yearnment must t. This repornts. The CA
strate a consto read the CA
. We believecate of Achieanother certifi
ation of the A the Authorit
n C. Tune Arounding com
unmodified opand 2013, pr
on and cash single audit
e audit progrmed by Crossederal Single Aependent audted no instancregulations fo
GFOA”) awardn Nashville Aar ended Jun
publish an rt must satisfy
AFR was judgructive “spirit
AFR.
e that our cvement Progicate.
Authority’s Boaty as a mod
Airport, and Mmmunities of M
pinionresent flows. of all
ram is slin & Auditditor’s ces of for the
ded a Airportne 30, easilyy both ed by of full
urrent gram’s
ard of del of MNAAMiddle
BOARD OF COMMISSIONERS AND EXECUTIVE STAFF
Metropolitan Nashville Airport Authority | Comprehensive Annnual Financial Report 11
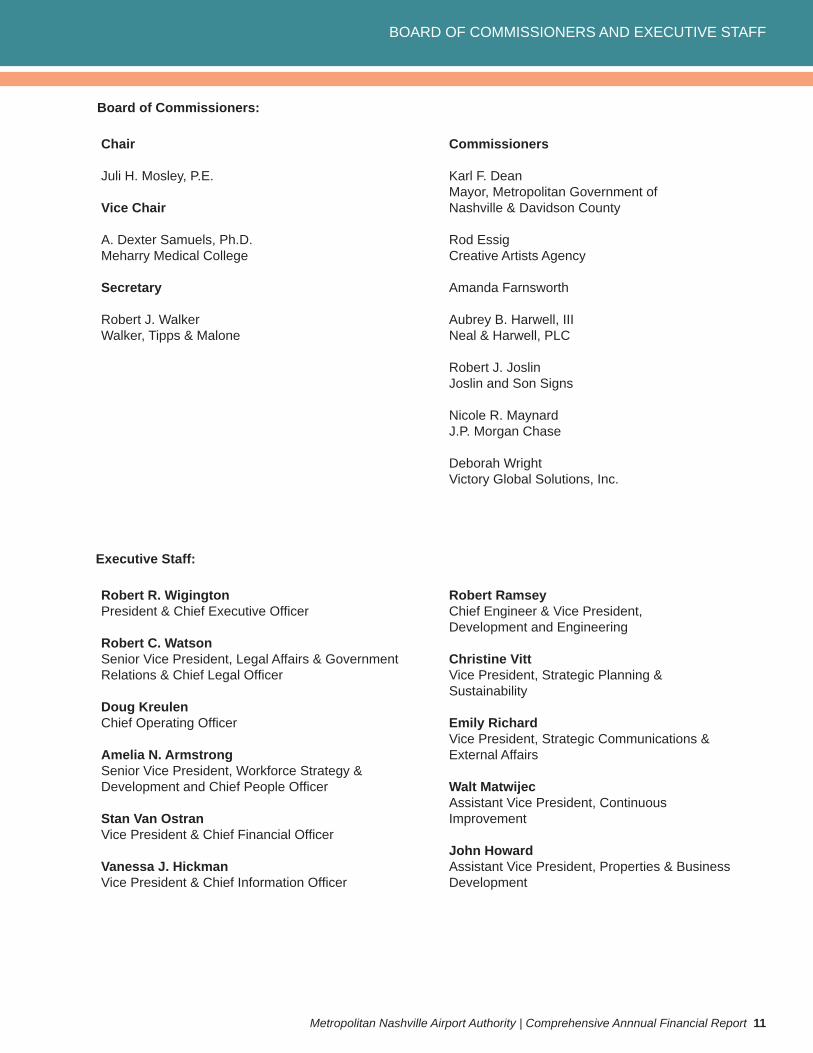
Board of Commissioners:
Chair
Juli H. Mosley, P.E.
Vice Chair
A. Dexter Samuels, Ph.D.Meharry Medical College
Secretary
Robert J. WalkerWalker, Tipps & Malone
Commissioners
Karl F. DeanMayor, Metropolitan Government of Nashville & Davidson County
Rod EssigCreative Artists Agency
Amanda Farnsworth
Aubrey B. Harwell, IIINeal & Harwell, PLC
Robert J. JoslinJoslin and Son Signs
Nicole R. MaynardJ.P. Morgan Chase
Deborah WrightVictory Global Solutions, Inc.
Executive Staff:
Robert R. WigingtonPresident & Chief Executive Offi cer
Robert C. WatsonSenior Vice President, Legal Affairs & Government Relations & Chief Legal Offi cer
Doug KreulenChief Operating Offi cer
Amelia N. ArmstrongSenior Vice President, Workforce Strategy &Development and Chief People Offi cer
Stan Van OstranVice President & Chief Financial Offi cer
Vanessa J. HickmanVice President & Chief Information Offi cer
Robert RamseyChief Engineer & Vice President,Development and Engineering
Christine VittVice President, Strategic Planning & Sustainability
Emily RichardVice President, Strategic Communications & External Affairs
Walt MatwijecAssistant Vice President, Continuous Improvement
John HowardAssistant Vice President, Properties & Business Development
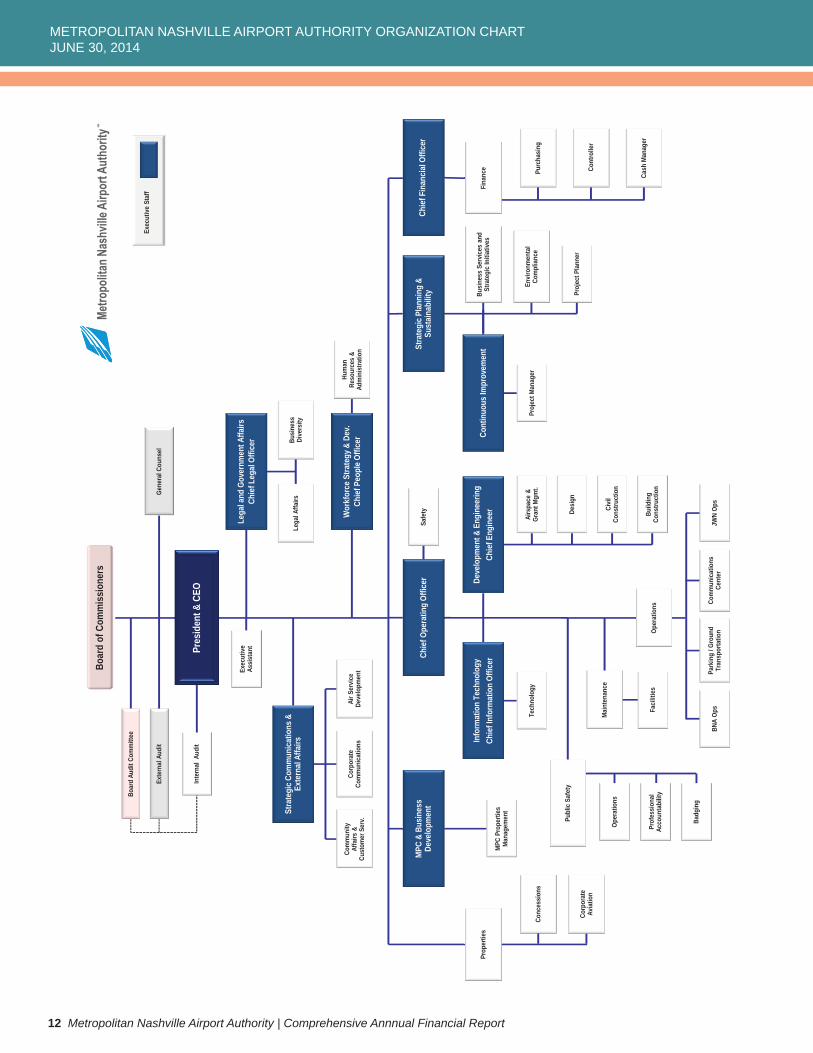
METROPOLITAN NASHVILLE AIRPORT AUTHORITY ORGANIZATION CHARTJUNE 30, 2014
12 Metropolitan Nashville Airport Authority | Comprehensive Annnual Financial Report
Info
rmat
ion
Tech
nolo
gyCh
ief I
nfor
mat
ion
Offic
er
Effe
ctive
: Au
gust
1, 2
014
Inte
rnal
Aud
it
Busi
ness
Ser
vice
s an
d St
rate
gic
Initi
ativ
es
Conc
essi
ons
Prop
ertie
s
Corp
orat
e Av
iatio
nCo
ntro
ller
Cash
Man
ager
Purc
hasi
ng
MPC
& B
usin
ess
Deve
lopm
ent
Chie
f Ope
ratin
g Of
ficer
Hum
an
Reso
urce
s &
Adm
inis
tratio
n
Stra
tegi
c Com
mun
icat
ions
&
Exte
rnal
Affa
irs
Safe
ty
Corp
orat
e Co
mm
unic
atio
ns
Boar
d of
Com
mis
sion
ers
Pres
iden
t & C
EO
Air S
ervi
ce
Deve
lopm
ent
Com
mun
ity
Affa
irs &
Cu
stom
er S
erv.
Proj
ect P
lann
er
Airs
pace
&
Gran
t Mgm
t.
Civi
lCo
nstru
ctio
n
Build
ing
Cons
truct
ion
Desi
gn
Exec
utiv
e As
sist
ant
Busi
ness
Dive
rsity
Lega
l Affa
irs
Tech
nolo
gy
MPC
Pro
perti
es
Man
agem
ent
Exec
utiv
e St
aff
Lega
l and
Gov
ernm
ent A
ffairs
Chie
f Leg
al O
ffice
r
Wor
kfor
ce S
trate
gy &
Dev
.Ch
ief P
eopl
e Offi
cer Co
ntin
uous
Impr
ovem
ent
Chie
f Fin
anci
al O
ffice
rSt
rate
gic P
lann
ing
& Su
stai
nabi
lity
Deve
lopm
ent &
Eng
inee
ring
Chie
f Eng
inee
r
Exte
rnal
Aud
itGe
nera
l Cou
nsel
Proj
ect M
anag
er
Boar
d Au
dit C
omm
ittee
Fina
nce
Envi
ronm
enta
l Co
mpl
ianc
e
Oper
atio
ns
Publ
ic S
afet
y
Com
mun
icat
ions
Ce
nter
JWN
Ops
Park
ing
/ Gro
und
Tran
spor
tatio
n
Oper
atio
ns
Badg
ing
Mai
nten
ance
Faci
litie
sPr
ofes
sion
al
Acco
unta
bilit
y
BNA
Ops
CERTIFICATE OF ACHIEVEMENT FOR EXCELLENCE IN FINANCIAL REPORTING
Metropolitan Nashville Airport Authority | Comprehensive Annnual Financial Report 13

Financial SectionMetropolitan Nashville Airport Authority | Comprehensive Annual Financial Report
This section contains the following subsections:
Independent Auditor’s Report
Management’s Discussion & Analysis
Financial Statements
INDEPENDENT AUDITOR’S REPORT
16 Metropolitan Nashville Airport Authority | Comprehensive Annnual Financial Report
The Astoria • 3803 Bedford Avenue, Suite 103 • Nashville, Tennessee 37215 • phone: 615-320-5500 • fax: 615-329-9465 • www.crosslinpc.comAn Independent Member of The BDO Alliance USA
INDEPENDENT AUDITOR’S REPORT
To the Board of Commissioners Metropolitan Nashville Airport Authority Nashville, Tennessee
Report on the Financial Statements
We have audited the accompanying financial statements of the Metropolitan Nashville Airport Authority (the “Authority”), a component unit of the Metropolitan Government of Nashville and Davidson County, Tennessee as of and for the years ended June 30, 2014 and 2013, and the related notes to the financial statements, which collectively comprise the Authority’s basic financial statements as listed in the table of contents.
Management’s Responsibility for the Financial Statements
Management is responsible for the preparation and fair presentation of these financial statements in accordance with accounting principles generally accepted in the United States of America; this includes the design, implementation, and maintenance of internal control relevant to the preparation and fair presentation of financial statements that are free from material misstatement, whether due to fraud or error.
Auditor’s Responsibility
Our responsibility is to express an opinion on these financial statements based on our audits. We conducted our audits in accordance with auditing standards generally accepted in the United States of America and the standards applicable to financial audits contained in Government Auditing Standards,issued by the Comptroller General of the United States. Those standards require that we plan and perform the audit to obtain reasonable assurance about whether the financial statements are free from material misstatement.
An audit involves performing procedures to obtain audit evidence about the amounts and disclosures in the financial statements. The procedures selected depend on the auditor’s judgment, including the assessment of the risks of material misstatement of the financial statements, whether due to fraud or error. In making those risk assessments, the auditor considers internal control relevant to the entity’s preparation and fair presentation of the financial statements in order to design audit procedures that are appropriate in the circumstances, but not for the purpose of expressing an opinion on the effectiveness of the entity’s internal control. Accordingly, we express no such opinion. An audit also includes evaluating the appropriateness of accounting policies used and the reasonableness of significant accounting estimates made by management, as well as evaluating the overall presentation of the financial statements.
We believe that the audit evidence we have obtained is sufficient and appropriate to provide a basis for our audit opinion.
Opinion
In our opinion, the financial statements referred to above present fairly, in all material respects, the financial position of the Metropolitan Nashville Airport Authority as of June 30, 2014 and 2013, and the changes in financial position and cash flows for the years then ended in accordance with accounting principles generally accepted in the United States of America.
INDEPENDENT AUDITOR’S REPORT
Metropolitan Nashville Airport Authority | Comprehensive Annnual Financial Report 17
To the BoMetropol
Other Ma
Required
Accountidiscussiopresentebasic finait to be aoperationsupplemeStates oinformatiinquiries,financial because provide a
Other Inf
Our audcollectivenet posiinformatiyear, anadditiona
The scheposition requiremdirectly toSuch infofinancial informatistatemenaccordanthis inforwhole.
The introthe audit assuranc
Other Re
In accord2014, onits compmatters. financial internal cperformecontrol ov
NashvilleOctober
oard of Commitan Nashville
atters
d Supplement
ng principles on and analyd to supplemancial statem
an essential pnal, economicentary informf America, won and com, the basic finstatements. the limited p
any assurance
formation
its were conely comprise ttion informaton by entity, d the statist
al analysis an
edule of net pinformation
ments by fiscao the underlyormation has
statements on directly tonts or to thence with auditmation is fair
oductory and of the basic
ce on them.
eporting Req
dance with Gn our consideliance with c The purposreporting an
control over ed in accordaver financial r
e, Tennessee 31, 2014
missioners e Airport Auth
tary Informatio
generally accsis and the s
ment the basients, is requiart of financiac, or historica
mation in accwhich consistemparing the nancial statem
We do not procedures de.
nducted for ththe Authority’tion by entityschedule of
ical section, d are not a re
position informby entity an
al year are thying accountin
been subjecand certain
o the underlyie basic finating standardrly stated, in a
statistical secfinancial state
quired by Go
Government Aration of the Aertain provisise of that repnd compliancefinancial repo
ance with Goreporting and
ority
on
cepted in the schedules of ic financial stred by the Goal reporting foal context. Wecordance withed of inquirieinformation f
ments, and otexpress an
do not provid
he purpose os basic financy, schedule airport revenas listed in
equired part o
mation by entnd the schedhe responsibng and other
cted to the auadditional p
ing accountinncial statem
ds generally aall material re
ctions have nements and,
overnment Au
Auditing StandAuthority’s inons of laws, port is to dee and the reorting or on overnment Au compliance.
United Statefunding prog
tatements. Sovernmental Aor placing thee have applieh auditing stes of managefor consistenther knowledg
opinion or pde us with su
of forming acial statemenof revenues
nue bonds, pthe table of
of the basic fin
tity, scheduledule of airpo
bility of manar records useuditing procedprocedures, ing and other ents themse
accepted in thespects, in re
not been subjaccordingly, w
uditing Stand
dards, we havternal controregulations, scribe the sc
esults of that compliance. uditing Stand
es of Americagress, as listeuch informatAccounting S basic financ
ed certain limtandards genement about ncy with mage we obtaineprovide any ufficient evide
n opinion onnts. The introds, expenses principal and f contents, anancial statem
e of revenuesort revenue
agement and d to prepare dures appliedincluding comrecords used
elves, and ohe United Staelation to the
bjected to the we do not exp
dards
ve also issuel over financicontracts, an
cope of our testing, and
That report dards in cons
a require that ed in the tabtion, althoughStandards Boaial statements
mited procedunerally accep
the methodsnagement’s ed during ourassurance o
ence to expr
n the financiaductory sectio
and changeinterest requ
are presentedments.
s, expenses abonds, prinwere derivethe basic fin
d in the 2014mparing andd to prepare other additionates of Ameribasic financia
auditing propress an opin
ed our report al reporting a
nd grant agretesting of int
d not to provis an integra
sidering the A
the managemble of contenh not a part oard, who conss in an approres to the req
pted in the Us of preparinresponses tor audit of the on the informress an opini
al statementson, the schedes in net pouirements by d for purpos
and changes cipal and in
ed from and nancial statem4 audit of the d reconciling
the basic finnal procedurica. In our opal statements
cedures applnion or provid
dated Octobeand on our teeements and ternal control
vide an opinioal part of an Authority’s in
ment’s ts, be of the siders
opriate quired United ng the o our basic
mationion or
s that dule of osition
fiscal ses of
in net nterest relate
ments. basic such
ancial res in pinion,s as a
lied in de any
er 31, ests of
other l over on on audit
nternal
METROPOLITAN NASHVILLE AIRPORT AUTHORITY MANAGEMENT’S DISCUSSION AND ANALYSIS
18 Metropolitan Nashville Airport Authority | Comprehensive Annnual Financial Report
The following Management’s Discussion and Analysis (“MD&A”) of the Metropolitan Nashville Airport Authority (the “Authority” or “MNAA”) is presented to assist the reader in focusing on significant financial issues, by providing an overview of the Authority’s financial activity, and in identifying changes in the Authority’s financial position. Management encourages the reader to consider the MD&A in conjunction with the information contained in the Authority’s financial statements.
BASIC FINANCIAL STATEMENTS
The Authority’s financial statements are prepared on the accrual basis of accounting in accordance with U.S. generally accepted accounting principles promulgated by the Governmental Accounting Standards Board. The Authority is structured as a single enterprise fund with revenues recognized when earned, not when received. Expenses are recognized when incurred, not when paid. Capital assets are capitalized and (except land and construction in progress) are depreciated over their useful lives. Please refer to Note 2 to the financial statements for a summary of the Authority’s significant accounting policies.
The Statement of Net Position presents information on all of the Authority’s assets, deferred outflows of resources, liabilities and deferred inflows of resources, with the residual reported as net position. Over time, increases or decreases in net position may serve as a useful indicator of the Authority’s financial position.
The Statement of Revenues, Expenses and Changes in Net Position presents information showing the change in the Authority’s net position during the fiscal year. All changes in net position are reported when the underlying events occur, regardless of timing of related cash flows. Thus, revenues and expenses are recorded and reported in this statement for some items that will result in cash flows in future periods.
The Statement of Cash Flows relates to the inflows and outflows of cash and cash equivalents. Consequently, only transactions that affect the Authority’s cash accounts are recorded in this statement. A reconciliation is provided within the Statement of Cash Flows to assist in understanding the difference between cash flows from operating activities and operating income.
The notes to the financial statements provide additional information that is essential to a full understanding of the data provided in the basic financial statements.
AIRPORT ACTIVITY HIGHLIGHTS
Nashville International Airport (“BNA”) experienced another year of record growth in fiscal year 2014, surpassing 10.6 million passengers and more than 5.3 million enplanements. Enplanements were up 5.4% 3.2%, 3.4% and 5.3%, respectively, in fiscal years 2014, 2013, 2012 and 2011, reflecting consistent growth in recent years. Over the past ten years, this growth has caused Nashville International to jump from the 43rd largest airport in 2005 to the 33rd largest airport by total enplanements in 2013. Nashville International Airport currently has 392 daily flights to 48 nonstop markets.
In December 2013, CNN named Nashville International Airport one of the “7 Most Entertaining Airports in the World”. Nashville was one of only two U.S. airports to receive that honor. Nashville International Airport has also received top awards for customer service and its concession programs in recent years. In March 2012, Airport Revenue News, a leading concessions trade publication, awarded BNA with the recognitions shown below in the medium-sized airport category during its 2012 Best Airport and Concessionaire Awards. Nashville was also a winner of these awards in 2010.
Airport with the Best Customer Service Airport with the Most Unique Airport Services Best Overall Concession Program
Airports Council International-North America (“ACI-NA”) awarded Nashville International Airport the Richard A. Greisbach Award of Excellence for the Best Concession Program in 2011. In 2010, Nashville International Airport was also named the 7th best airport by Travel & Leisure.
METROPOLITAN NASHVILLE AIRPORT AUTHORITY MANAGEMENT’S DISCUSSION AND ANALYSIS
Metropolitan Nashville Airport Authority | Comprehensive Annnual Financial Report 19
The Authority also recently earned the prestigious Excellence Award in the annual Excellence in Tennessee recognition program administered by the Tennessee Center for Performance Excellence (“TNCPE”). The Authority is the first airport in the U.S. to earn this award at its state’s highest level. Since the program was founded in 1993, only 22 organizations have attained the Excellence designation, with the Authority being one of only two organizations in Tennessee that was recognized with the Excellence Award this year. The Excellence Award makes the Authority eligible to apply for the Malcolm Baldridge National Quality Award.
The Authority was also recently recognized as a Gold Level Recipient of the American Heart Association’s Fit-Friendly Worksites Recognition program. The Fit-Friendly Worksites program is intended to be a catalyst for positive change. Worksites throughout the nation can be part of the initiative by making the health and wellness of their employees a priority. The American Heart Association’s program requires employers to:
Offer employees physical activity support; Provide healthy eating options at the worksite; Promote a wellness culture; and Implement at least nine criteria as outlined by the American Heart Association in the areas of
physical activity, nutrition and culture.
Nashville was the only U.S. airport to receive a rating upgrade from more than one rating agency for its general airport revenue bonds (“GARB”) during fiscal year 2014. In making their decisions, rating agencies cited the Airport's low and declining debt levels and the above average growth of the Metropolitan Nashville area's population base, economy and passenger enplanement levels. They further noted that the Airport had one of the strongest recoveries in passenger enplanement levels from the economic downturn, driven by both travel demand from area residents, as well as growing tourism supported by a new convention center.
The first ratings action occurred in February 2014, when Moody's Investors Service upgraded to A1 from A2 its rating on the Authority's Airport Improvement Revenue Bonds. Moody's also affirmed the A3 rating on the Authority's Special Facility Rental Bonds (MPC CONRAC LLC Project), Series 2010, which were issued for BNA’s consolidated rental car (“CONRAC”) facility. The outlook for both rating actions was “stable.” In May 2014, Standard & Poor's Ratings Services raised its long-term rating to 'A+' from 'A' for the Authority’s outstanding Airport Improvement Revenue Bonds. Standard & Poor's also affirmed the long-term rating on the Series 2010 Special Facility Revenue Bonds for the CONRAC project, with a “stable” outlook for both rating actions.
The airport recently underwent an aggressive capital program with major airfield and landside improvements, including extensive terminal renovations. Over the past 10 years, the Authority has invested more than $414 million in facility improvements, with $24.4 million invested in fiscal year 2014. The largest projects budgeted in 2014 were taxiway reconstruction (Kilo) at $10.3 million and the stormwater treatment center at $7.4 million. The Authority completed work in 2012 on a second phase of terminal renovations, with more than $70 million in terminal renovations completed to date. Large projects budgeted in fiscal year 2013 included $17.3 million for taxiway and runway reconstruction, $14.7 million for replacement of the outbound baggage system and $2.8 million for a new data center.
Airline bankruptcies and consolidations continued in fiscal year 2014 with Republic Airlines selling its subsidiary Frontier Airlines to Indigo Partners, US Airways completing its merger with American Airlines and Southwest completing a merger with AirTran. American Airline’s parent, AMR Corporation, previously filed for bankruptcy in November 2011. Delta’s wholly owned regional carrier, Comair, ceased operations in fiscal year 2013, and another Delta regional partner, Pinnacle Airlines, also went into bankruptcy. Airline mergers in the preceding years included United acquiring Continental; Delta acquiring Northwest; and Republic Airlines acquiring Frontier and Midwest Airlines.
Nashville International Airport also continued to see new air service added. In fiscal year 2014, new daily nonstop flights were added to Denver, Los Angeles and Dallas-Fort Worth. New international service has been added by Aeromexico to Cancun. Additionally, nonstop markets were added, including Boston, Pittsburgh, Pensacola and Trenton.
METROPOLITAN NASHVILLE AIRPORT AUTHORITY MANAGEMENT’S DISCUSSION AND ANALYSIS
20 Metropolitan Nashville Airport Authority | Comprehensive Annnual Financial Report
John C. Tune (“JWN”), BNA’s reliever airport on the west side of Nashville, is currently undergoing a long-awaited project to extend its runway and add safety improvements at each end of the runway. JWN will continue making improvements in 2015 by completing the runway project, a major terminal renovation and making repairs and improvements to many of its existing buildings.
The property development organization of the Authority, MNAA Properties Corporation (“MPC”), continued its efforts to refurbish it largest property, International Plaza. It continued to add several new tenants in fiscal year 2014, which has increased operating revenues and the occupancy level to more than 89%.
OPERATIONAL HIGHLIGHTS
Enplanements rose 5.4%, 3.2% and 3.4%, respectively, in fiscal years 2014, 2013 and 2012. Since 2011, Nashville has jumped from 38th to the 33rd largest airport by total passengers. Certified gross landed weights were also up 3.4%, totaling almost 6.6 billion pounds in 2014. Nashville International Airport served more than 10.6 million total passengers in fiscal year 2014, operating an average of 392 daily flights to approximately 48 nonstop markets. Nashville International Airport is able to accommodate continued growth in coming years, with space available for additional gates and aircraft parking. The MNAA’s two airports contribute more than $3.74 billion in total economic activity, $1.18 billion in wages and 39,700 jobs annually to the regional economy.
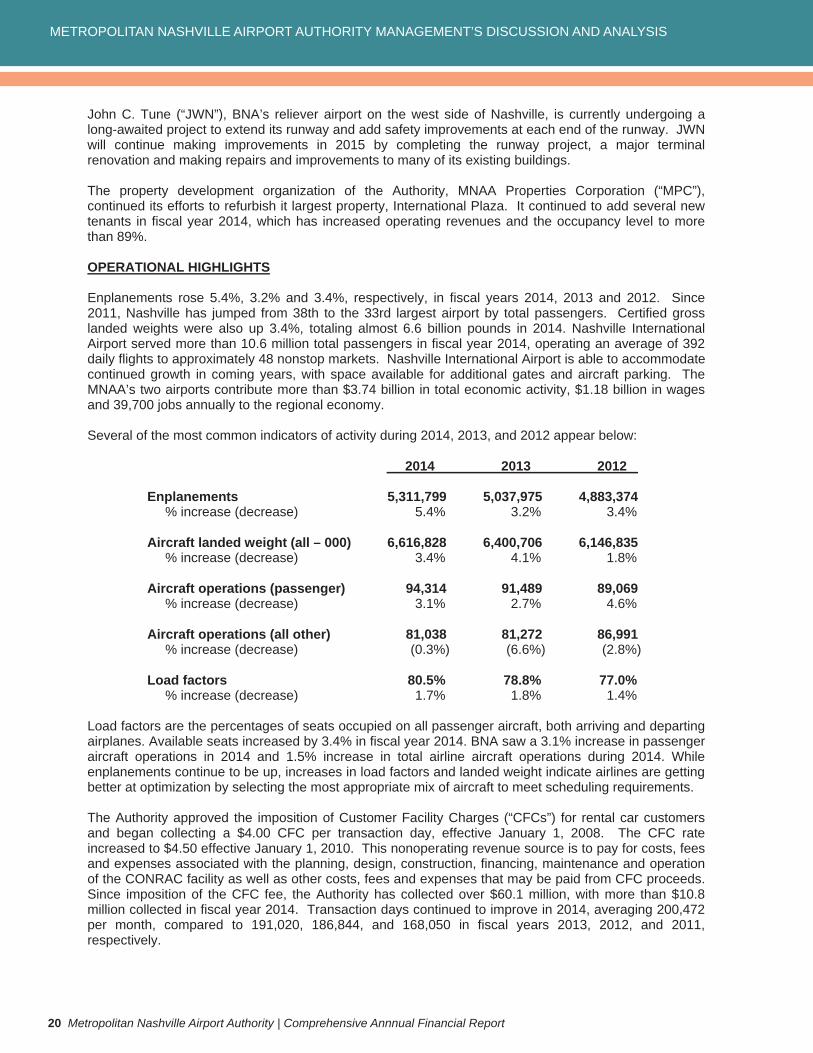
Several of the most common indicators of activity during 2014, 2013, and 2012 appear below:
2014 2013 2012
Enplanements 5,311,799 5,037,975 4,883,374 % increase (decrease) 5.4% 3.2% 3.4%
Aircraft landed weight (all – 000) 6,616,828 6,400,706 6,146,835 % increase (decrease) 3.4% 4.1% 1.8%
Aircraft operations (passenger) 94,314 91,489 89,069 % increase (decrease) 3.1% 2.7% 4.6%
Aircraft operations (all other) 81,038 81,272 86,991 % increase (decrease) (0.3%) (6.6%) (2.8%)
Load factors 80.5% 78.8% 77.0% % increase (decrease) 1.7% 1.8% 1.4%
Load factors are the percentages of seats occupied on all passenger aircraft, both arriving and departing airplanes. Available seats increased by 3.4% in fiscal year 2014. BNA saw a 3.1% increase in passenger aircraft operations in 2014 and 1.5% increase in total airline aircraft operations during 2014. While enplanements continue to be up, increases in load factors and landed weight indicate airlines are getting better at optimization by selecting the most appropriate mix of aircraft to meet scheduling requirements.
The Authority approved the imposition of Customer Facility Charges (“CFCs”) for rental car customers and began collecting a $4.00 CFC per transaction day, effective January 1, 2008. The CFC rate increased to $4.50 effective January 1, 2010. This nonoperating revenue source is to pay for costs, fees and expenses associated with the planning, design, construction, financing, maintenance and operation of the CONRAC facility as well as other costs, fees and expenses that may be paid from CFC proceeds. Since imposition of the CFC fee, the Authority has collected over $60.1 million, with more than $10.8 million collected in fiscal year 2014. Transaction days continued to improve in 2014, averaging 200,472 per month, compared to 191,020, 186,844, and 168,050 in fiscal years 2013, 2012, and 2011, respectively.
METROPOLITAN NASHVILLE AIRPORT AUTHORITY MANAGEMENT’S DISCUSSION AND ANALYSIS
Metropolitan Nashville Airport Authority | Comprehensive Annnual Financial Report 21
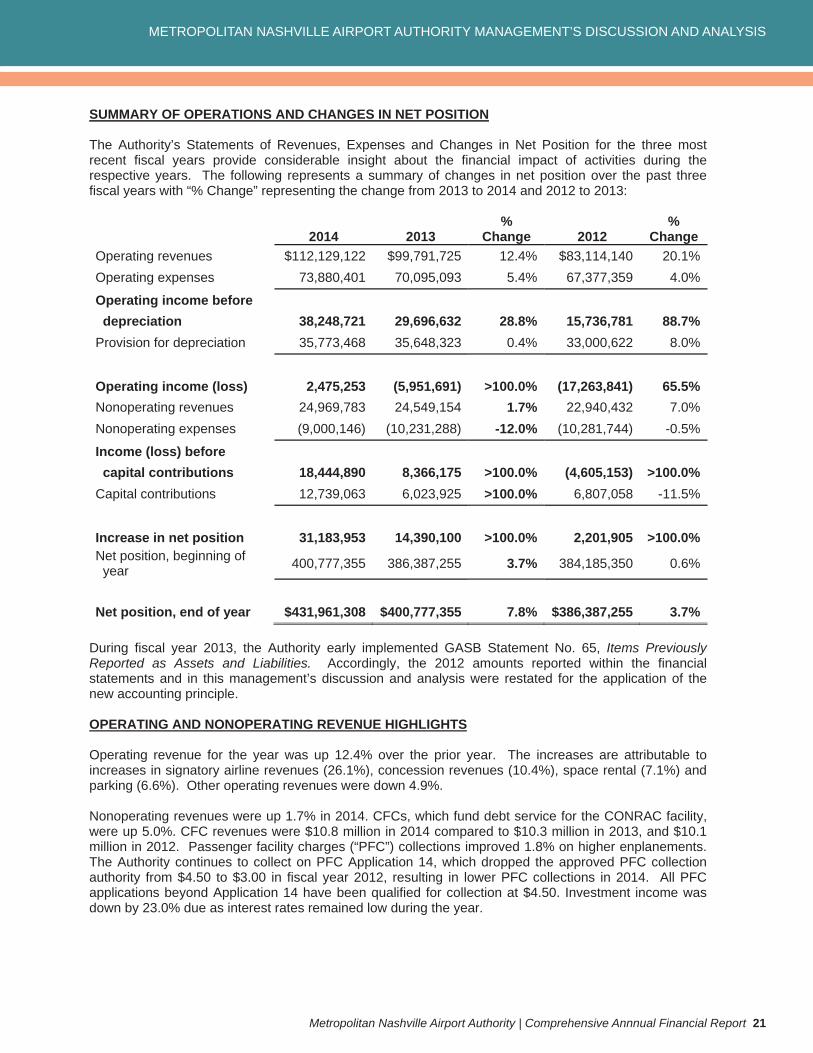
SUMMARY OF OPERATIONS AND CHANGES IN NET POSITION
The Authority’s Statements of Revenues, Expenses and Changes in Net Position for the three most recent fiscal years provide considerable insight about the financial impact of activities during the respective years. The following represents a summary of changes in net position over the past three fiscal years with “% Change” representing the change from 2013 to 2014 and 2012 to 2013:
2014 2013 %
Change 2012 %
Change Operating revenues $112,129,122 $99,791,725 12.4% $83,114,140 20.1%Operating expenses 73,880,401 70,095,093 5.4% 67,377,359 4.0%
Operating income before depreciation 38,248,721 29,696,632 28.8% 15,736,781 88.7%Provision for depreciation 35,773,468 35,648,323 0.4% 33,000,622 8.0%
Operating income (loss) 2,475,253 (5,951,691) >100.0% (17,263,841) 65.5%Nonoperating revenues 24,969,783 24,549,154 1.7% 22,940,432 7.0%Nonoperating expenses (9,000,146) (10,231,288) -12.0% (10,281,744) -0.5%
Income (loss) before capital contributions 18,444,890 8,366,175 >100.0% (4,605,153) >100.0%Capital contributions 12,739,063 6,023,925 >100.0% 6,807,058 -11.5%
Increase in net position 31,183,953 14,390,100 >100.0% 2,201,905 >100.0%Net position, beginning of year 400,777,355 386,387,255 3.7% 384,185,350 0.6%
Net position, end of year $431,961,308 $400,777,355 7.8% $386,387,255 3.7%
During fiscal year 2013, the Authority early implemented GASB Statement No. 65, Items Previously Reported as Assets and Liabilities. Accordingly, the 2012 amounts reported within the financial statements and in this management’s discussion and analysis were restated for the application of the new accounting principle.
OPERATING AND NONOPERATING REVENUE HIGHLIGHTS
Operating revenue for the year was up 12.4% over the prior year. The increases are attributable to increases in signatory airline revenues (26.1%), concession revenues (10.4%), space rental (7.1%) and parking (6.6%). Other operating revenues were down 4.9%.
Nonoperating revenues were up 1.7% in 2014. CFCs, which fund debt service for the CONRAC facility, were up 5.0%. CFC revenues were $10.8 million in 2014 compared to $10.3 million in 2013, and $10.1 million in 2012. Passenger facility charges (“PFC”) collections improved 1.8% on higher enplanements. The Authority continues to collect on PFC Application 14, which dropped the approved PFC collection authority from $4.50 to $3.00 in fiscal year 2012, resulting in lower PFC collections in 2014. All PFC applications beyond Application 14 have been qualified for collection at $4.50. Investment income was down by 23.0% due as interest rates remained low during the year.
METROPOLITAN NASHVILLE AIRPORT AUTHORITY MANAGEMENT’S DISCUSSION AND ANALYSIS
22 Metropolitan Nashville Airport Authority | Comprehensive Annnual Financial Report
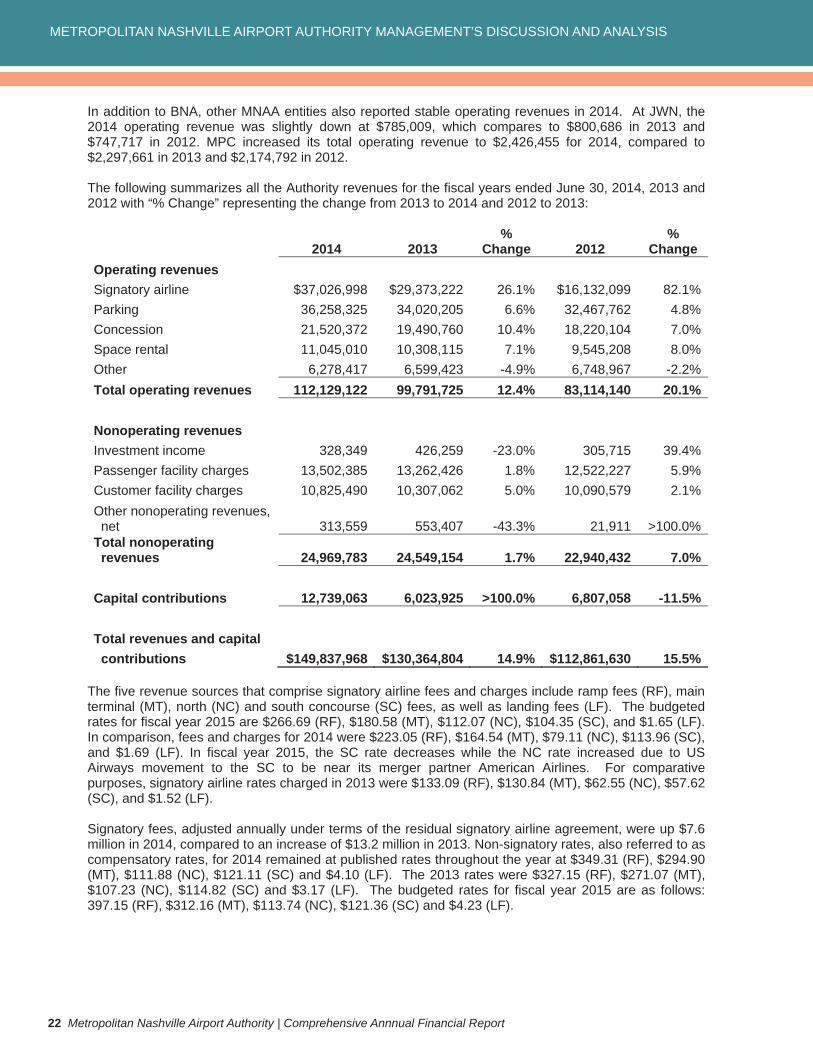
In addition to BNA, other MNAA entities also reported stable operating revenues in 2014. At JWN, the 2014 operating revenue was slightly down at $785,009, which compares to $800,686 in 2013 and $747,717 in 2012. MPC increased its total operating revenue to $2,426,455 for 2014, compared to $2,297,661 in 2013 and $2,174,792 in 2012.
The following summarizes all the Authority revenues for the fiscal years ended June 30, 2014, 2013 and 2012 with “% Change” representing the change from 2013 to 2014 and 2012 to 2013:
2014 2013 %
Change 2012 %
Change Operating revenues Signatory airline $37,026,998 $29,373,222 26.1% $16,132,099 82.1%Parking 36,258,325 34,020,205 6.6% 32,467,762 4.8%Concession 21,520,372 19,490,760 10.4% 18,220,104 7.0%Space rental 11,045,010 10,308,115 7.1% 9,545,208 8.0%Other 6,278,417 6,599,423 -4.9% 6,748,967 -2.2%Total operating revenues 112,129,122 99,791,725 12.4% 83,114,140 20.1%
Nonoperating revenues Investment income 328,349 426,259 -23.0% 305,715 39.4%Passenger facility charges 13,502,385 13,262,426 1.8% 12,522,227 5.9%Customer facility charges 10,825,490 10,307,062 5.0% 10,090,579 2.1%Other nonoperating revenues, net 313,559 553,407 -43.3% 21,911 >100.0%Total nonoperating revenues 24,969,783 24,549,154 1.7% 22,940,432 7.0%
Capital contributions 12,739,063 6,023,925 >100.0% 6,807,058 -11.5%
Total revenues and capital contributions $149,837,968 $130,364,804 14.9% $112,861,630 15.5%
The five revenue sources that comprise signatory airline fees and charges include ramp fees (RF), main terminal (MT), north (NC) and south concourse (SC) fees, as well as landing fees (LF). The budgeted rates for fiscal year 2015 are $266.69 (RF), $180.58 (MT), $112.07 (NC), $104.35 (SC), and $1.65 (LF). In comparison, fees and charges for 2014 were $223.05 (RF), $164.54 (MT), $79.11 (NC), $113.96 (SC), and $1.69 (LF). In fiscal year 2015, the SC rate decreases while the NC rate increased due to US Airways movement to the SC to be near its merger partner American Airlines. For comparative purposes, signatory airline rates charged in 2013 were $133.09 (RF), $130.84 (MT), $62.55 (NC), $57.62 (SC), and $1.52 (LF).
Signatory fees, adjusted annually under terms of the residual signatory airline agreement, were up $7.6 million in 2014, compared to an increase of $13.2 million in 2013. Non-signatory rates, also referred to as compensatory rates, for 2014 remained at published rates throughout the year at $349.31 (RF), $294.90 (MT), $111.88 (NC), $121.11 (SC) and $4.10 (LF). The 2013 rates were $327.15 (RF), $271.07 (MT), $107.23 (NC), $114.82 (SC) and $3.17 (LF). The budgeted rates for fiscal year 2015 are as follows: 397.15 (RF), $312.16 (MT), $113.74 (NC), $121.36 (SC) and $4.23 (LF).
METROPOLITAN NASHVILLE AIRPORT AUTHORITY MANAGEMENT’S DISCUSSION AND ANALYSIS
Metropolitan Nashville Airport Authority | Comprehensive Annnual Financial Report 23
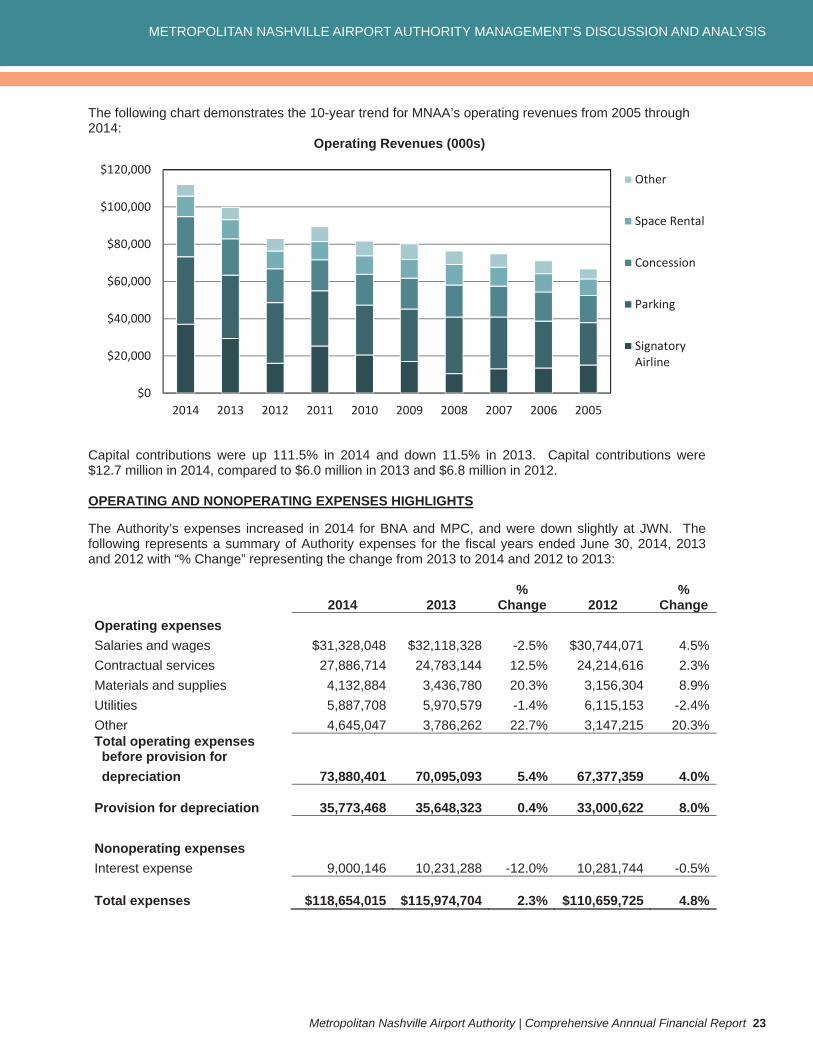
The following chart demonstrates the 10-year trend for MNAA’s operating revenues from 2005 through 2014: Operating Revenues (000s)
$0
$20,000
$40,000
$60,000
$80,000
$100,000
$120,000
2014 2013 2012 2011 2010 2009 2008 2007 2006 2005
Other
Space Rental
Concession
Parking
SignatoryAirline
Capital contributions were up 111.5% in 2014 and down 11.5% in 2013. Capital contributions were $12.7 million in 2014, compared to $6.0 million in 2013 and $6.8 million in 2012.
OPERATING AND NONOPERATING EXPENSES HIGHLIGHTS
The Authority’s expenses increased in 2014 for BNA and MPC, and were down slightly at JWN. The following represents a summary of Authority expenses for the fiscal years ended June 30, 2014, 2013 and 2012 with “% Change” representing the change from 2013 to 2014 and 2012 to 2013:
2014 2013 %
Change 2012 %
Change Operating expenses Salaries and wages $31,328,048 $32,118,328 -2.5% $30,744,071 4.5%Contractual services 27,886,714 24,783,144 12.5% 24,214,616 2.3%Materials and supplies 4,132,884 3,436,780 20.3% 3,156,304 8.9%Utilities 5,887,708 5,970,579 -1.4% 6,115,153 -2.4%Other 4,645,047 3,786,262 22.7% 3,147,215 20.3%Total operating expenses before provision for depreciation 73,880,401 70,095,093 5.4% 67,377,359 4.0%
Provision for depreciation 35,773,468 35,648,323 0.4% 33,000,622 8.0%
Nonoperating expenses Interest expense 9,000,146 10,231,288 -12.0% 10,281,744 -0.5%
Total expenses $118,654,015 $115,974,704 2.3% $110,659,725 4.8%
METROPOLITAN NASHVILLE AIRPORT AUTHORITY MANAGEMENT’S DISCUSSION AND ANALYSIS
24 Metropolitan Nashville Airport Authority | Comprehensive Annnual Financial Report
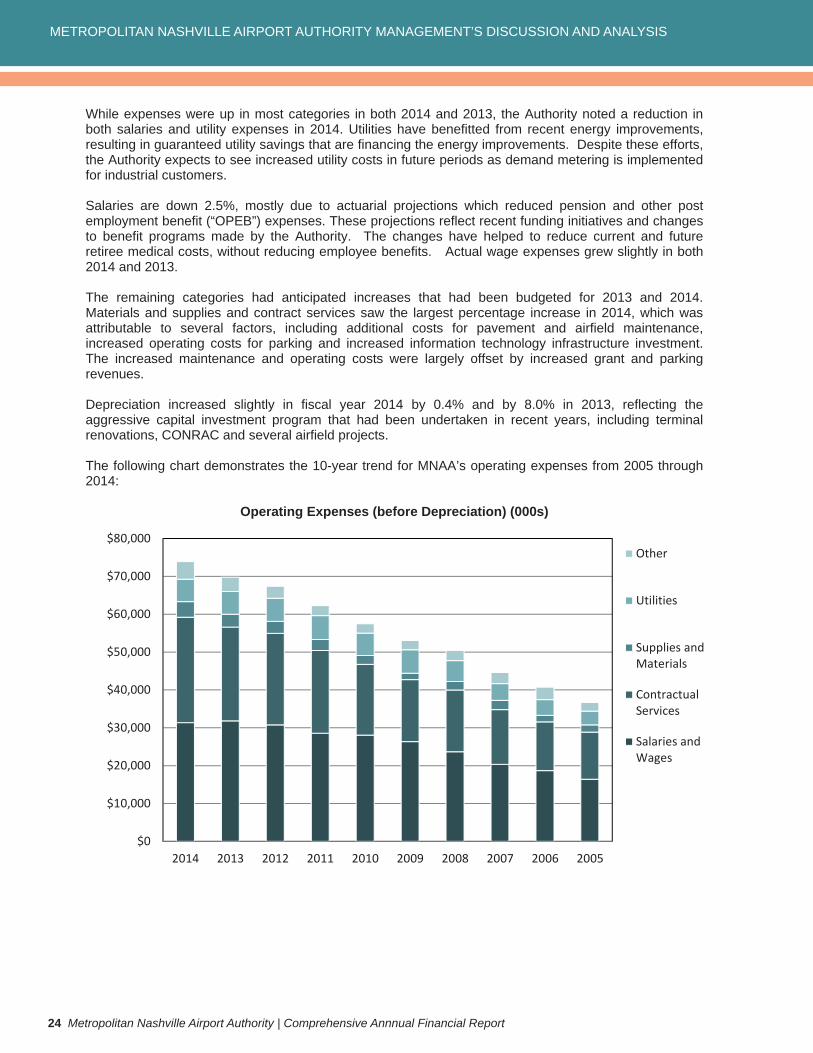
While expenses were up in most categories in both 2014 and 2013, the Authority noted a reduction in both salaries and utility expenses in 2014. Utilities have benefitted from recent energy improvements, resulting in guaranteed utility savings that are financing the energy improvements. Despite these efforts, the Authority expects to see increased utility costs in future periods as demand metering is implemented for industrial customers.
Salaries are down 2.5%, mostly due to actuarial projections which reduced pension and other post employment benefit (“OPEB”) expenses. These projections reflect recent funding initiatives and changes to benefit programs made by the Authority. The changes have helped to reduce current and future retiree medical costs, without reducing employee benefits. Actual wage expenses grew slightly in both 2014 and 2013.
The remaining categories had anticipated increases that had been budgeted for 2013 and 2014. Materials and supplies and contract services saw the largest percentage increase in 2014, which was attributable to several factors, including additional costs for pavement and airfield maintenance, increased operating costs for parking and increased information technology infrastructure investment. The increased maintenance and operating costs were largely offset by increased grant and parking revenues.
Depreciation increased slightly in fiscal year 2014 by 0.4% and by 8.0% in 2013, reflecting the aggressive capital investment program that had been undertaken in recent years, including terminal renovations, CONRAC and several airfield projects.
The following chart demonstrates the 10-year trend for MNAA’s operating expenses from 2005 through 2014:
Operating Expenses (before Depreciation) (000s)
$0
$10,000
$20,000
$30,000
$40,000
$50,000
$60,000
$70,000
$80,000
2014 2013 2012 2011 2010 2009 2008 2007 2006 2005
Other
Utilities
Supplies andMaterials
ContractualServices
Salaries andWages
METROPOLITAN NASHVILLE AIRPORT AUTHORITY MANAGEMENT’S DISCUSSION AND ANALYSIS
Metropolitan Nashville Airport Authority | Comprehensive Annnual Financial Report 25
METROPOLITAN NASHVILLE AIRPORT AUTHORITY MANAGEMENT’S DISCUSSION AND ANALYSIS (Unaudited) - Continued
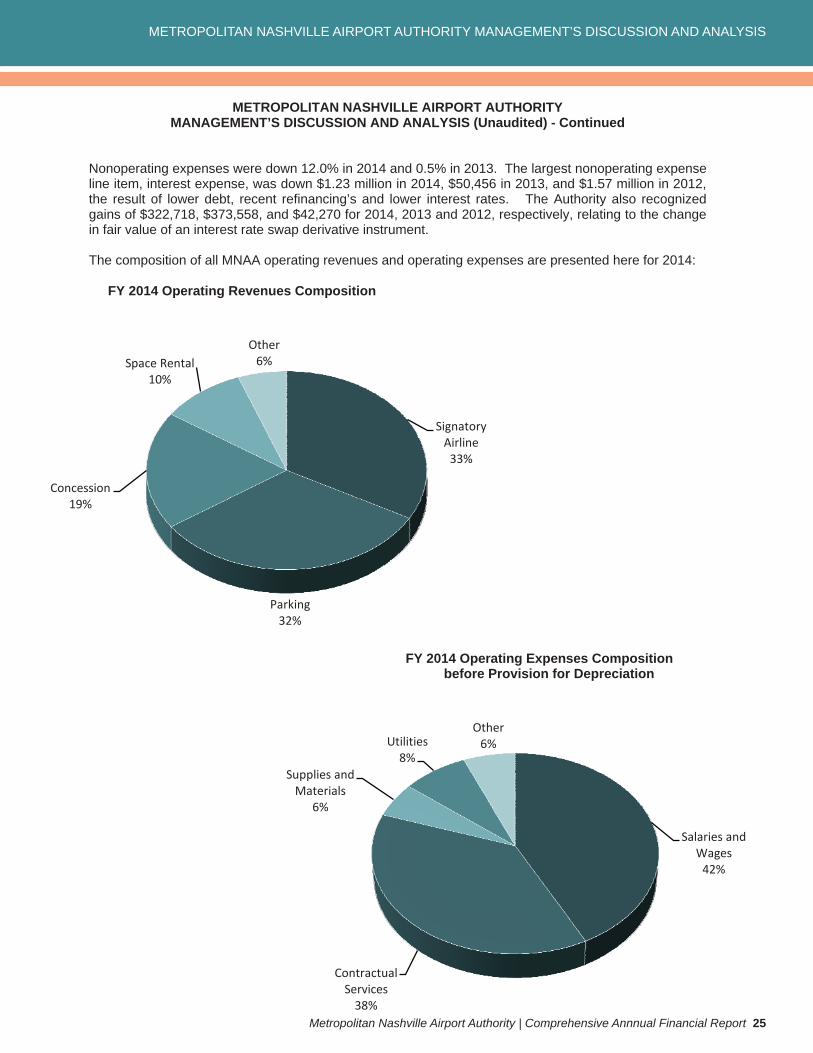
Nonoperating expenses were down 12.0% in 2014 and 0.5% in 2013. The largest nonoperating expense line item, interest expense, was down $1.23 million in 2014, $50,456 in 2013, and $1.57 million in 2012, the result of lower debt, recent refinancing’s and lower interest rates. The Authority also recognized gains of $322,718, $373,558, and $42,270 for 2014, 2013 and 2012, respectively, relating to the change in fair value of an interest rate swap derivative instrument.
The composition of all MNAA operating revenues and operating expenses are presented here for 2014:
FY 2014 Operating Revenues Composition
SignatoryAirline33%
Parking32%
Concession19%
Space Rental10%
Other6%
FY 2014 Operating Expenses Composition before Provision for Depreciation
Salaries andWages42%
ContractualServices38%
Supplies andMaterials
6%
Utilities8%
Other6%
METROPOLITAN NASHVILLE AIRPORT AUTHORITY MANAGEMENT’S DISCUSSION AND ANALYSIS
26 Metropolitan Nashville Airport Authority | Comprehensive Annnual Financial Report
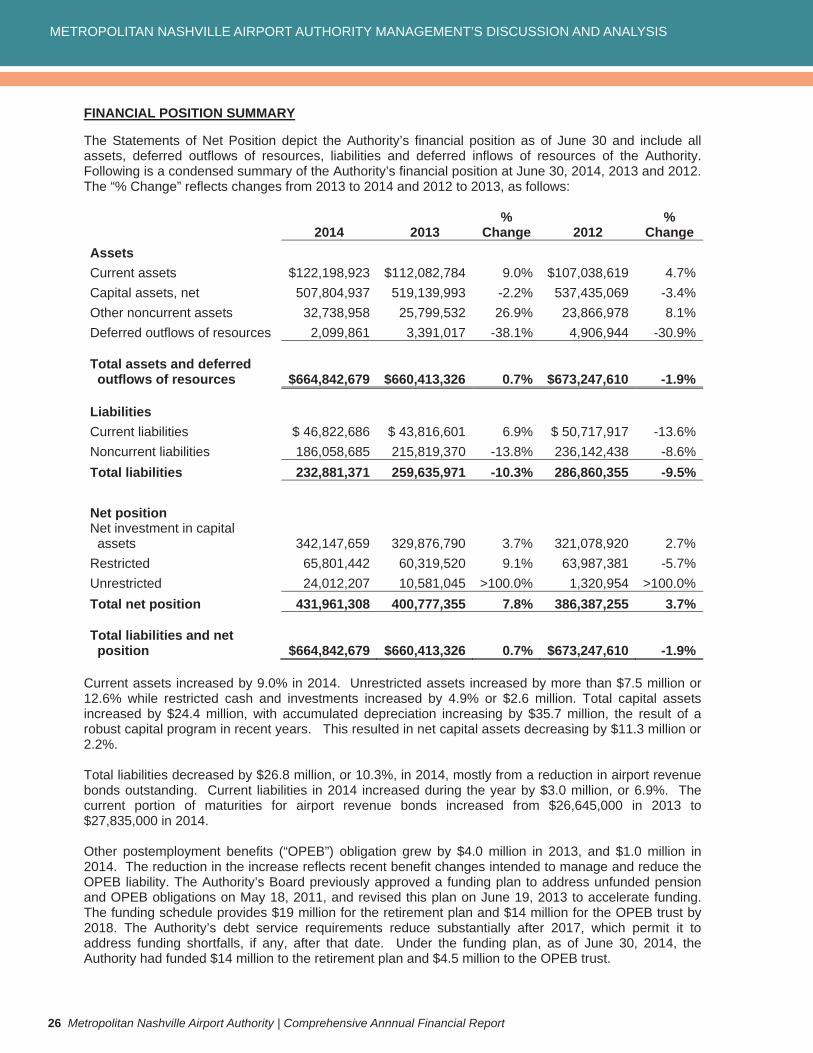
FINANCIAL POSITION SUMMARY
The Statements of Net Position depict the Authority’s financial position as of June 30 and include all assets, deferred outflows of resources, liabilities and deferred inflows of resources of the Authority. Following is a condensed summary of the Authority’s financial position at June 30, 2014, 2013 and 2012. The “% Change” reflects changes from 2013 to 2014 and 2012 to 2013, as follows:
2014 2013 %
Change 2012 %
Change Assets Current assets $122,198,923 $112,082,784 9.0% $107,038,619 4.7%Capital assets, net 507,804,937 519,139,993 -2.2% 537,435,069 -3.4%Other noncurrent assets 32,738,958 25,799,532 26.9% 23,866,978 8.1%Deferred outflows of resources 2,099,861 3,391,017 -38.1% 4,906,944 -30.9%
Total assets and deferred outflows of resources $664,842,679 $660,413,326 0.7% $673,247,610 -1.9%
LiabilitiesCurrent liabilities $ 46,822,686 $ 43,816,601 6.9% $ 50,717,917 -13.6%Noncurrent liabilities 186,058,685 215,819,370 -13.8% 236,142,438 -8.6%Total liabilities 232,881,371 259,635,971 -10.3% 286,860,355 -9.5%
Net position Net investment in capital assets 342,147,659 329,876,790 3.7% 321,078,920 2.7%Restricted 65,801,442 60,319,520 9.1% 63,987,381 -5.7%Unrestricted 24,012,207 10,581,045 >100.0% 1,320,954 >100.0%Total net position 431,961,308 400,777,355 7.8% 386,387,255 3.7%
Total liabilities and net position $664,842,679 $660,413,326 0.7% $673,247,610 -1.9%
Current assets increased by 9.0% in 2014. Unrestricted assets increased by more than $7.5 million or 12.6% while restricted cash and investments increased by 4.9% or $2.6 million. Total capital assets increased by $24.4 million, with accumulated depreciation increasing by $35.7 million, the result of a robust capital program in recent years. This resulted in net capital assets decreasing by $11.3 million or 2.2%.
Total liabilities decreased by $26.8 million, or 10.3%, in 2014, mostly from a reduction in airport revenue bonds outstanding. Current liabilities in 2014 increased during the year by $3.0 million, or 6.9%. The current portion of maturities for airport revenue bonds increased from $26,645,000 in 2013 to $27,835,000 in 2014.
Other postemployment benefits (“OPEB”) obligation grew by $4.0 million in 2013, and $1.0 million in 2014. The reduction in the increase reflects recent benefit changes intended to manage and reduce the OPEB liability. The Authority’s Board previously approved a funding plan to address unfunded pension and OPEB obligations on May 18, 2011, and revised this plan on June 19, 2013 to accelerate funding. The funding schedule provides $19 million for the retirement plan and $14 million for the OPEB trust by 2018. The Authority’s debt service requirements reduce substantially after 2017, which permit it to address funding shortfalls, if any, after that date. Under the funding plan, as of June 30, 2014, the Authority had funded $14 million to the retirement plan and $4.5 million to the OPEB trust.
METROPOLITAN NASHVILLE AIRPORT AUTHORITY MANAGEMENT’S DISCUSSION AND ANALYSIS
Metropolitan Nashville Airport Authority | Comprehensive Annnual Financial Report 27
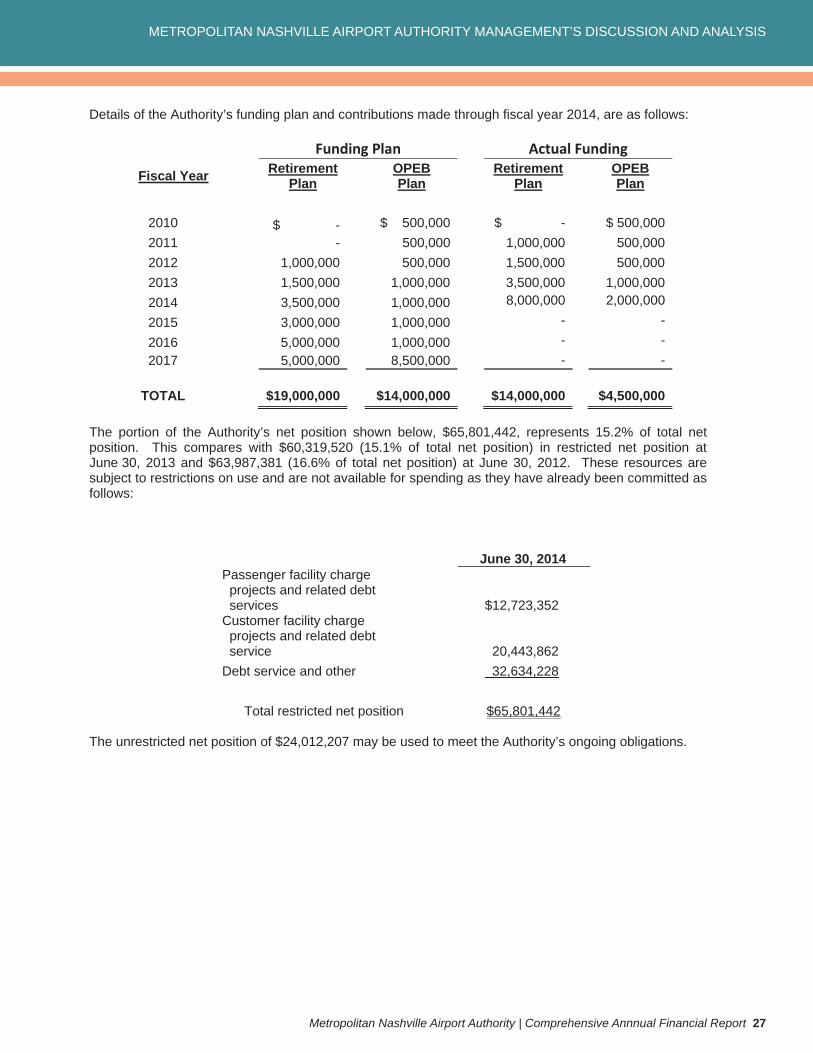
Details of the Authority’s funding plan and contributions made through fiscal year 2014, are as follows:
Funding Plan Actual Funding
Fiscal Year Retirement Plan
OPEBPlan
Retirement Plan
OPEBPlan
2010 $ - $ 500,000 $ - $ 500,000 2011 - 500,000 1,000,000 500,0002012 1,000,000 500,000 1,500,000 500,0002013 1,500,000 1,000,000 3,500,000 1,000,0002014 3,500,000 1,000,000 8,000,000 2,000,000
2015 3,000,000 1,000,000 - -
2016 5,000,000 1,000,000 - -2017 5,000,000 8,500,000 - -
TOTAL $19,000,000 $14,000,000 $14,000,000 $4,500,000
The portion of the Authority’s net position shown below, $65,801,442, represents 15.2% of total net position. This compares with $60,319,520 (15.1% of total net position) in restricted net position at June 30, 2013 and $63,987,381 (16.6% of total net position) at June 30, 2012. These resources are subject to restrictions on use and are not available for spending as they have already been committed as follows:
June 30, 2014 Passenger facility charge projects and related debt services $12,723,352 Customer facility charge projects and related debt service 20,443,862 Debt service and other 32,634,228
Total restricted net position $65,801,442
The unrestricted net position of $24,012,207 may be used to meet the Authority’s ongoing obligations.
METROPOLITAN NASHVILLE AIRPORT AUTHORITY MANAGEMENT’S DISCUSSION AND ANALYSIS
28 Metropolitan Nashville Airport Authority | Comprehensive Annnual Financial Report
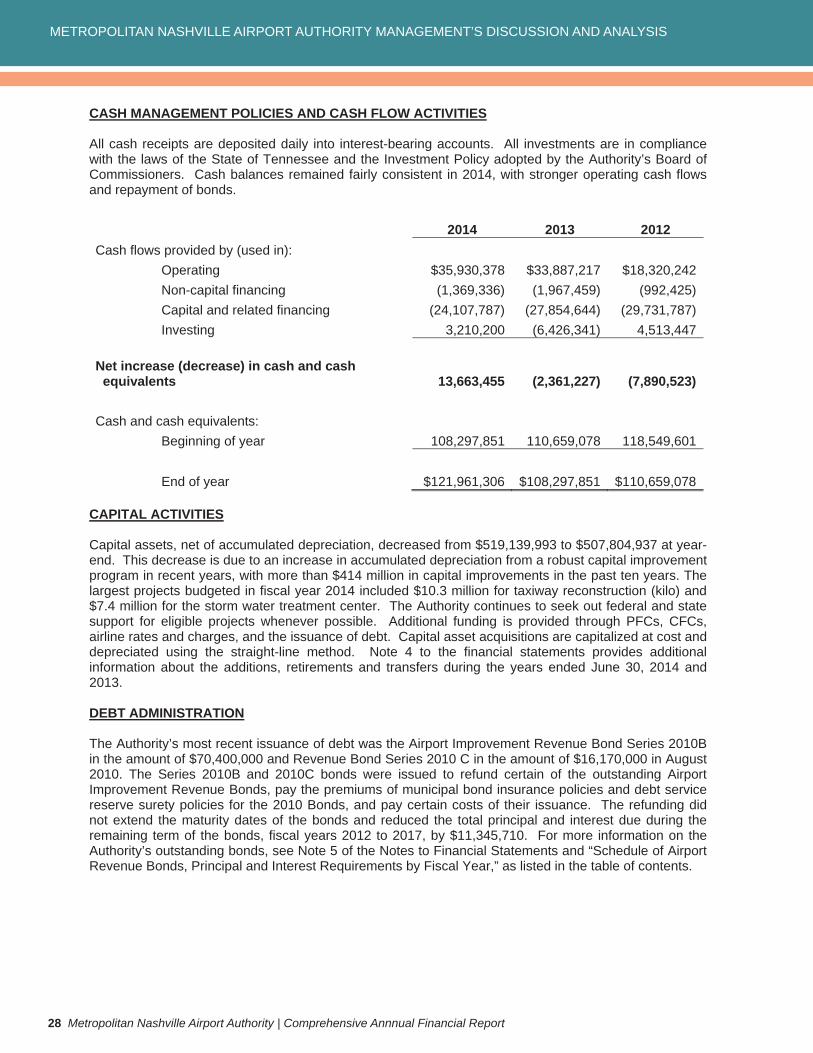
CASH MANAGEMENT POLICIES AND CASH FLOW ACTIVITIES
All cash receipts are deposited daily into interest-bearing accounts. All investments are in compliance with the laws of the State of Tennessee and the Investment Policy adopted by the Authority’s Board of Commissioners. Cash balances remained fairly consistent in 2014, with stronger operating cash flows and repayment of bonds.
2014 2013 2012 Cash flows provided by (used in):
Operating $35,930,378 $33,887,217 $18,320,242 Non-capital financing (1,369,336) (1,967,459) (992,425)Capital and related financing (24,107,787) (27,854,644) (29,731,787)Investing 3,210,200 (6,426,341) 4,513,447
Net increase (decrease) in cash and cash equivalents 13,663,455 (2,361,227) (7,890,523)
Cash and cash equivalents: Beginning of year 108,297,851 110,659,078 118,549,601
End of year $121,961,306 $108,297,851 $110,659,078
CAPITAL ACTIVITIES
Capital assets, net of accumulated depreciation, decreased from $519,139,993 to $507,804,937 at year-end. This decrease is due to an increase in accumulated depreciation from a robust capital improvement program in recent years, with more than $414 million in capital improvements in the past ten years. The largest projects budgeted in fiscal year 2014 included $10.3 million for taxiway reconstruction (kilo) and $7.4 million for the storm water treatment center. The Authority continues to seek out federal and state support for eligible projects whenever possible. Additional funding is provided through PFCs, CFCs, airline rates and charges, and the issuance of debt. Capital asset acquisitions are capitalized at cost and depreciated using the straight-line method. Note 4 to the financial statements provides additional information about the additions, retirements and transfers during the years ended June 30, 2014 and 2013.
DEBT ADMINISTRATION
The Authority’s most recent issuance of debt was the Airport Improvement Revenue Bond Series 2010B in the amount of $70,400,000 and Revenue Bond Series 2010 C in the amount of $16,170,000 in August 2010. The Series 2010B and 2010C bonds were issued to refund certain of the outstanding Airport Improvement Revenue Bonds, pay the premiums of municipal bond insurance policies and debt service reserve surety policies for the 2010 Bonds, and pay certain costs of their issuance. The refunding did not extend the maturity dates of the bonds and reduced the total principal and interest due during the remaining term of the bonds, fiscal years 2012 to 2017, by $11,345,710. For more information on the Authority’s outstanding bonds, see Note 5 of the Notes to Financial Statements and “Schedule of Airport Revenue Bonds, Principal and Interest Requirements by Fiscal Year,” as listed in the table of contents.
METROPOLITAN NASHVILLE AIRPORT AUTHORITY MANAGEMENT’S DISCUSSION AND ANALYSIS
Metropolitan Nashville Airport Authority | Comprehensive Annnual Financial Report 29
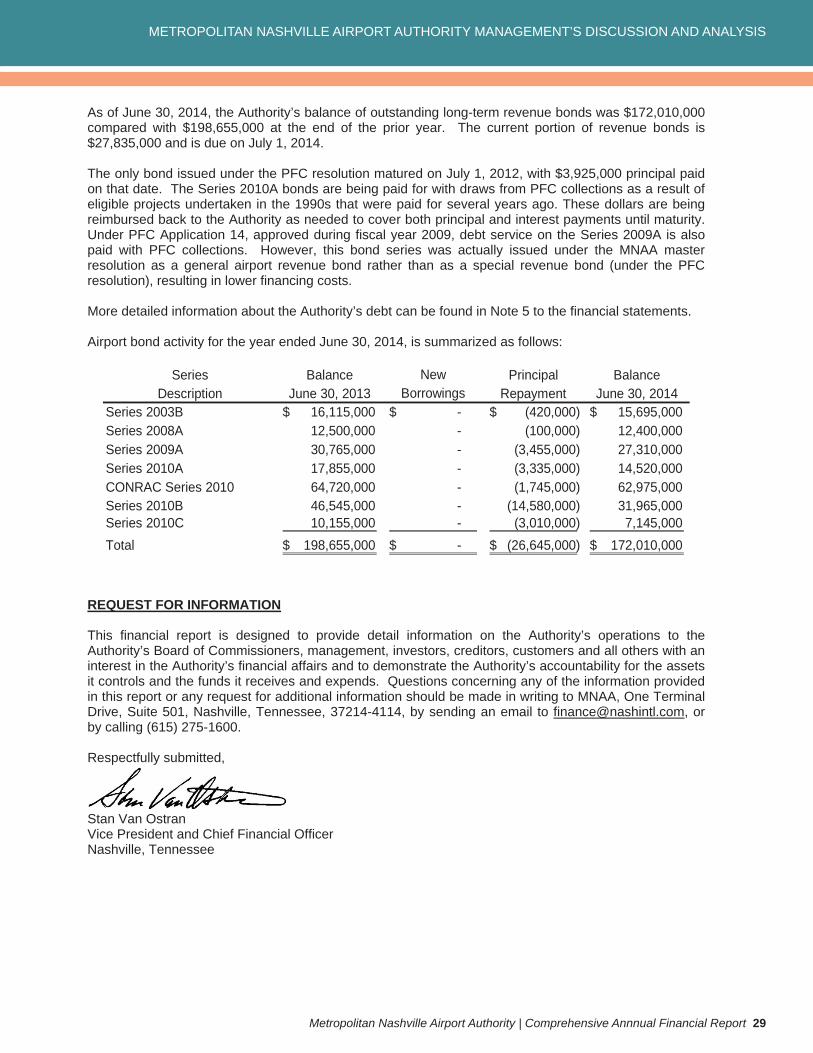
As of June 30, 2014, the Authority’s balance of outstanding long-term revenue bonds was $172,010,000 compared with $198,655,000 at the end of the prior year. The current portion of revenue bonds is $27,835,000 and is due on July 1, 2014.
The only bond issued under the PFC resolution matured on July 1, 2012, with $3,925,000 principal paid on that date. The Series 2010A bonds are being paid for with draws from PFC collections as a result of eligible projects undertaken in the 1990s that were paid for several years ago. These dollars are being reimbursed back to the Authority as needed to cover both principal and interest payments until maturity. Under PFC Application 14, approved during fiscal year 2009, debt service on the Series 2009A is also paid with PFC collections. However, this bond series was actually issued under the MNAA master resolution as a general airport revenue bond rather than as a special revenue bond (under the PFC resolution), resulting in lower financing costs.
More detailed information about the Authority’s debt can be found in Note 5 to the financial statements.
Airport bond activity for the year ended June 30, 2014, is summarized as follows:
Series Balance New Principal BalanceDescription June 30, 2013 Borrowings Repayment June 30, 2014
Series 2003B 16,115,000$ -$ (420,000)$ 15,695,000$Series 2008A 12,500,000 - (100,000) 12,400,000Series 2009A 30,765,000 - (3,455,000) 27,310,000Series 2010A 17,855,000 - (3,335,000) 14,520,000CONRAC Series 2010 64,720,000 - (1,745,000) 62,975,000Series 2010B 46,545,000 - (14,580,000) 31,965,000Series 2010C 10,155,000 - (3,010,000) 7,145,000Total 198,655,000$ -$ (26,645,000)$ 172,010,000$
REQUEST FOR INFORMATION
This financial report is designed to provide detail information on the Authority’s operations to the Authority’s Board of Commissioners, management, investors, creditors, customers and all others with an interest in the Authority’s financial affairs and to demonstrate the Authority’s accountability for the assets it controls and the funds it receives and expends. Questions concerning any of the information provided in this report or any request for additional information should be made in writing to MNAA, One Terminal Drive, Suite 501, Nashville, Tennessee, 37214-4114, by sending an email to [email protected], or by calling (615) 275-1600.
Respectfully submitted,
Stan Van Ostran Vice President and Chief Financial Officer Nashville, Tennessee
STATEMENTS OF NET POSITIONJUNE 30, 2014 AND 2013
30 Metropolitan Nashville Airport Authority | Comprehensive Annnual Financial Report
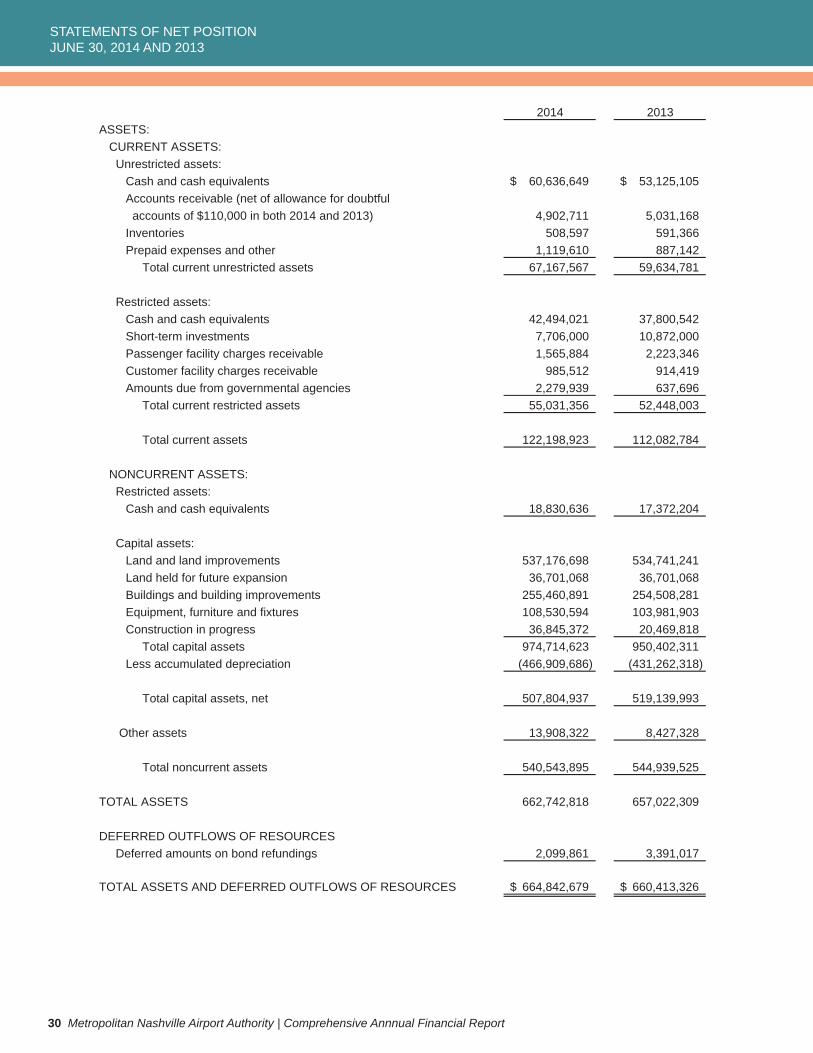
2014 2013ASSETS:
CURRENT ASSETS: Unrestricted assets: Cash and cash equivalents 60,636,649$ 53,125,105$ Accounts receivable (net of allowance for doubtful accounts of $110,000 in both 2014 and 2013) 4,902,711 5,031,168 Inventories 508,597 591,366 Prepaid expenses and other 1,119,610 887,142 Total current unrestricted assets 67,167,567 59,634,781
Restricted assets: Cash and cash equivalents 42,494,021 37,800,542 Short-term investments 7,706,000 10,872,000 Passenger facility charges receivable 1,565,884 2,223,346 Customer facility charges receivable 985,512 914,419 Amounts due from governmental agencies 2,279,939 637,696 Total current restricted assets 55,031,356 52,448,003
Total current assets 122,198,923 112,082,784
NONCURRENT ASSETS: Restricted assets: Cash and cash equivalents 18,830,636 17,372,204
Capital assets: Land and land improvements 537,176,698 534,741,241 Land held for future expansion 36,701,068 36,701,068 Buildings and building improvements 255,460,891 254,508,281 Equipment, furniture and fixtures 108,530,594 103,981,903 Construction in progress 36,845,372 20,469,818 Total capital assets 974,714,623 950,402,311 Less accumulated depreciation (466,909,686) (431,262,318)
Total capital assets, net 507,804,937 519,139,993
Other assets 13,908,322 8,427,328
Total noncurrent assets 540,543,895 544,939,525
TOTAL ASSETS 662,742,818 657,022,309
DEFERRED OUTFLOWS OF RESOURCES Deferred amounts on bond refundings 2,099,861 3,391,017
TOTAL ASSETS AND DEFERRED OUTFLOWS OF RESOURCES 664,842,679$ 660,413,326$
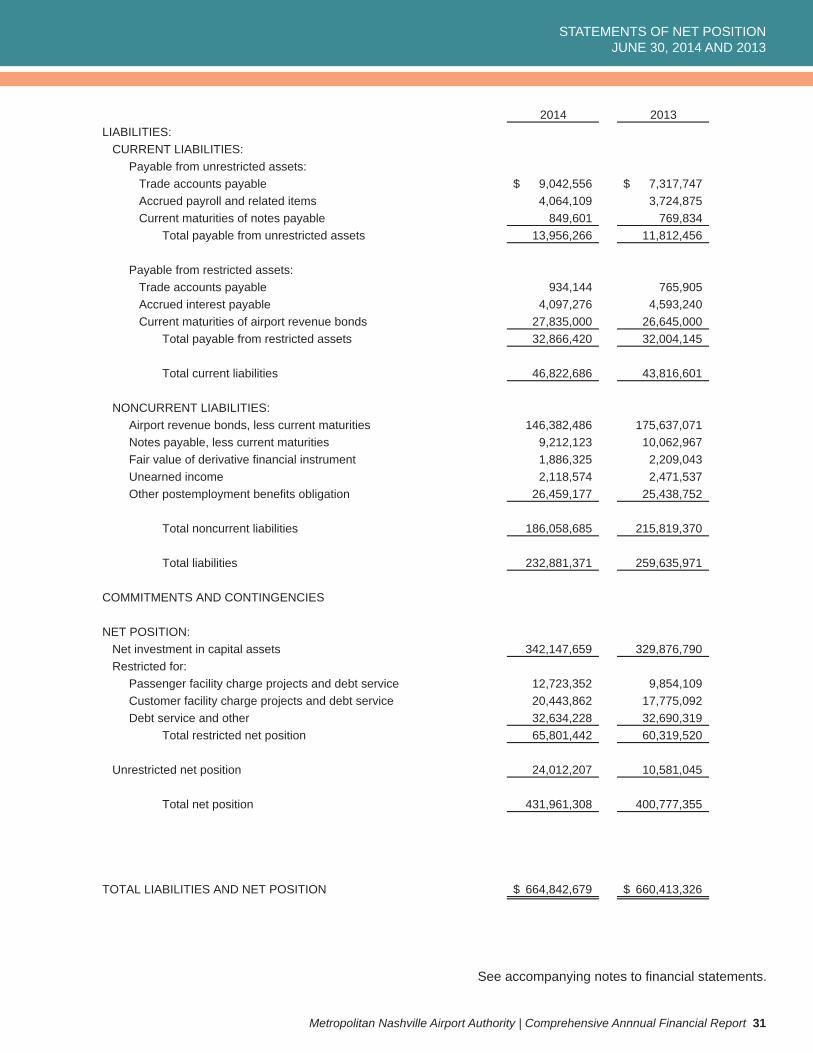
STATEMENTS OF NET POSITIONJUNE 30, 2014 AND 2013
Metropolitan Nashville Airport Authority | Comprehensive Annnual Financial Report 31
2014 2013LIABILITIES:
CURRENT LIABILITIES: Payable from unrestricted assets: Trade accounts payable 9,042,556$ 7,317,747$ Accrued payroll and related items 4,064,109 3,724,875 Current maturities of notes payable 849,601 769,834 Total payable from unrestricted assets 13,956,266 11,812,456
Payable from restricted assets: Trade accounts payable 934,144 765,905 Accrued interest payable 4,097,276 4,593,240 Current maturities of airport revenue bonds 27,835,000 26,645,000 Total payable from restricted assets 32,866,420 32,004,145
Total current liabilities 46,822,686 43,816,601
NONCURRENT LIABILITIES: Airport revenue bonds, less current maturities 146,382,486 175,637,071 Notes payable, less current maturities 9,212,123 10,062,967 Fair value of derivative financial instrument 1,886,325 2,209,043 Unearned income 2,118,574 2,471,537 Other postemployment benefits obligation 26,459,177 25,438,752
Total noncurrent liabilities 186,058,685 215,819,370
Total liabilities 232,881,371 259,635,971
COMMITMENTS AND CONTINGENCIES - -
NET POSITION: Net investment in capital assets 342,147,659 329,876,790 Restricted for:
Passenger facility charge projects and debt service 12,723,352 9,854,109 Customer facility charge projects and debt service 20,443,862 17,775,092 Debt service and other 32,634,228 32,690,319 Total restricted net position 65,801,442 60,319,520
Unrestricted net position 24,012,207 10,581,045
Total net position 431,961,308 400,777,355
TOTAL LIABILITIES AND NET POSITION 664,842,679$ 660,413,326$
See accompanying notes to fi nancial statements.

This page intentionally left blank.
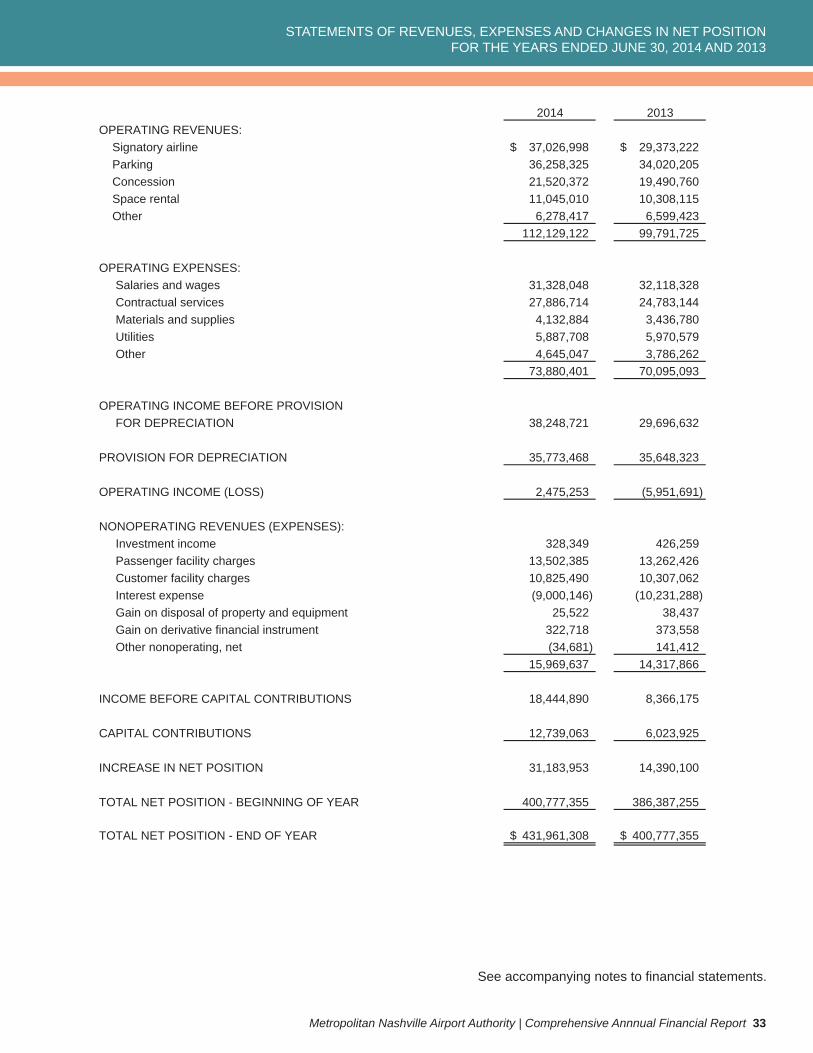
STATEMENTS OF REVENUES, EXPENSES AND CHANGES IN NET POSITIONFOR THE YEARS ENDED JUNE 30, 2014 AND 2013
Metropolitan Nashville Airport Authority | Comprehensive Annnual Financial Report 33
See accompanying notes to fi nancial statements.
2014 2013OPERATING REVENUES: Signatory airline 37,026,998$ 29,373,222$ Parking 36,258,325 34,020,205 Concession 21,520,372 19,490,760 Space rental 11,045,010 10,308,115 Other 6,278,417 6,599,423
112,129,122 99,791,725
OPERATING EXPENSES: Salaries and wages 31,328,048 32,118,328 Contractual services 27,886,714 24,783,144 Materials and supplies 4,132,884 3,436,780 Utilities 5,887,708 5,970,579 Other 4,645,047 3,786,262
73,880,401 70,095,093
OPERATING INCOME BEFORE PROVISION FOR DEPRECIATION 38,248,721 29,696,632
PROVISION FOR DEPRECIATION 35,773,468 35,648,323
OPERATING INCOME (LOSS) 2,475,253 (5,951,691)
NONOPERATING REVENUES (EXPENSES): Investment income 328,349 426,259 Passenger facility charges 13,502,385 13,262,426 Customer facility charges 10,825,490 10,307,062 Interest expense (9,000,146) (10,231,288) Gain on disposal of property and equipment 25,522 38,437 Gain on derivative financial instrument 322,718 373,558 Other nonoperating, net (34,681) 141,412
15,969,637 14,317,866
INCOME BEFORE CAPITAL CONTRIBUTIONS 18,444,890 8,366,175
CAPITAL CONTRIBUTIONS 12,739,063 6,023,925
INCREASE IN NET POSITION 31,183,953 14,390,100
TOTAL NET POSITION - BEGINNING OF YEAR 400,777,355 386,387,255
TOTAL NET POSITION - END OF YEAR 431,961,308$ 400,777,355$
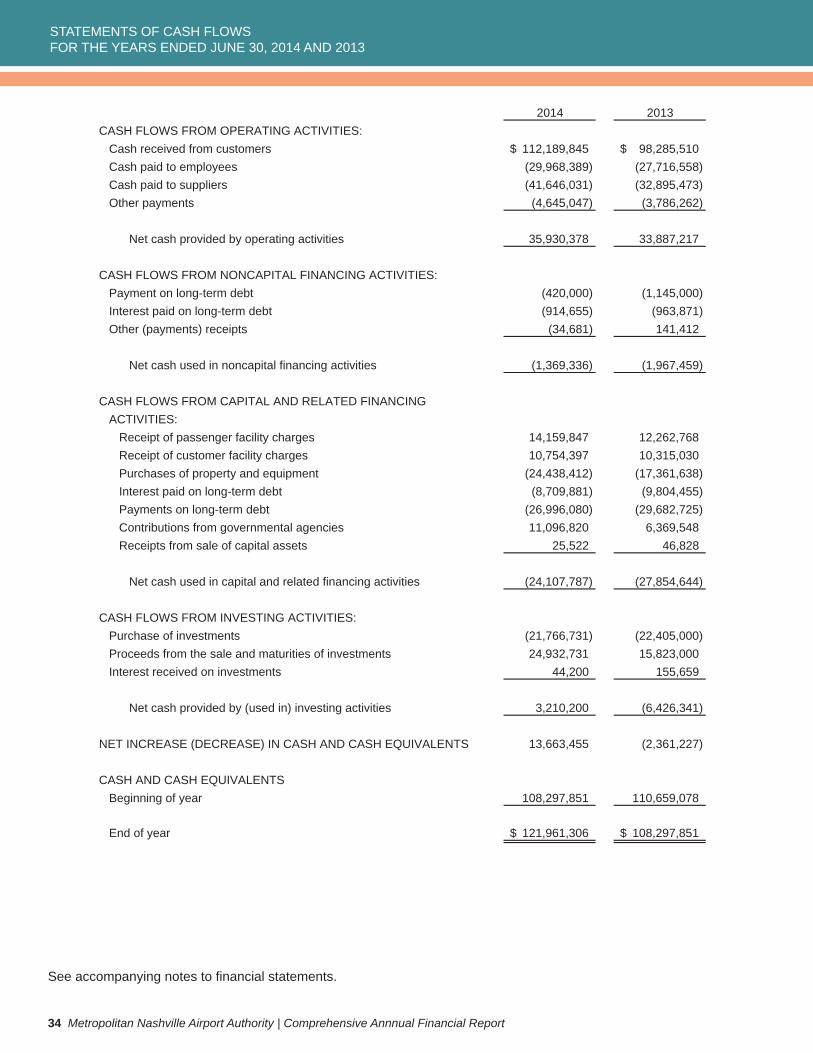
STATEMENTS OF CASH FLOWSFOR THE YEARS ENDED JUNE 30, 2014 AND 2013
34 Metropolitan Nashville Airport Authority | Comprehensive Annnual Financial Report
See accompanying notes to fi nancial statements.
2014 2013CASH FLOWS FROM OPERATING ACTIVITIES:
Cash received from customers 112,189,845$ 98,285,510$ Cash paid to employees (29,968,389) (27,716,558) Cash paid to suppliers (41,646,031) (32,895,473) Other payments (4,645,047) (3,786,262)
Net cash provided by operating activities 35,930,378 33,887,217
CASH FLOWS FROM NONCAPITAL FINANCING ACTIVITIES:Payment on long-term debt (420,000) (1,145,000) Interest paid on long-term debt (914,655) (963,871) Other (payments) receipts (34,681) 141,412
Net cash used in noncapital financing activities (1,369,336) (1,967,459)
CASH FLOWS FROM CAPITAL AND RELATED FINANCINGACTIVITIES:
Receipt of passenger facility charges 14,159,847 12,262,768 Receipt of customer facility charges 10,754,397 10,315,030 Purchases of property and equipment (24,438,412) (17,361,638) Interest paid on long-term debt (8,709,881) (9,804,455) Payments on long-term debt (26,996,080) (29,682,725) Contributions from governmental agencies 11,096,820 6,369,548 Receipts from sale of capital assets 25,522 46,828
Net cash used in capital and related financing activities (24,107,787) (27,854,644)
CASH FLOWS FROM INVESTING ACTIVITIES:Purchase of investments (21,766,731) (22,405,000) Proceeds from the sale and maturities of investments 24,932,731 15,823,000 Interest received on investments 44,200 155,659
Net cash provided by (used in) investing activities 3,210,200 (6,426,341)
NET INCREASE (DECREASE) IN CASH AND CASH EQUIVALENTS 13,663,455 (2,361,227)
CASH AND CASH EQUIVALENTSBeginning of year 108,297,851 110,659,078
End of year 121,961,306$ 108,297,851$
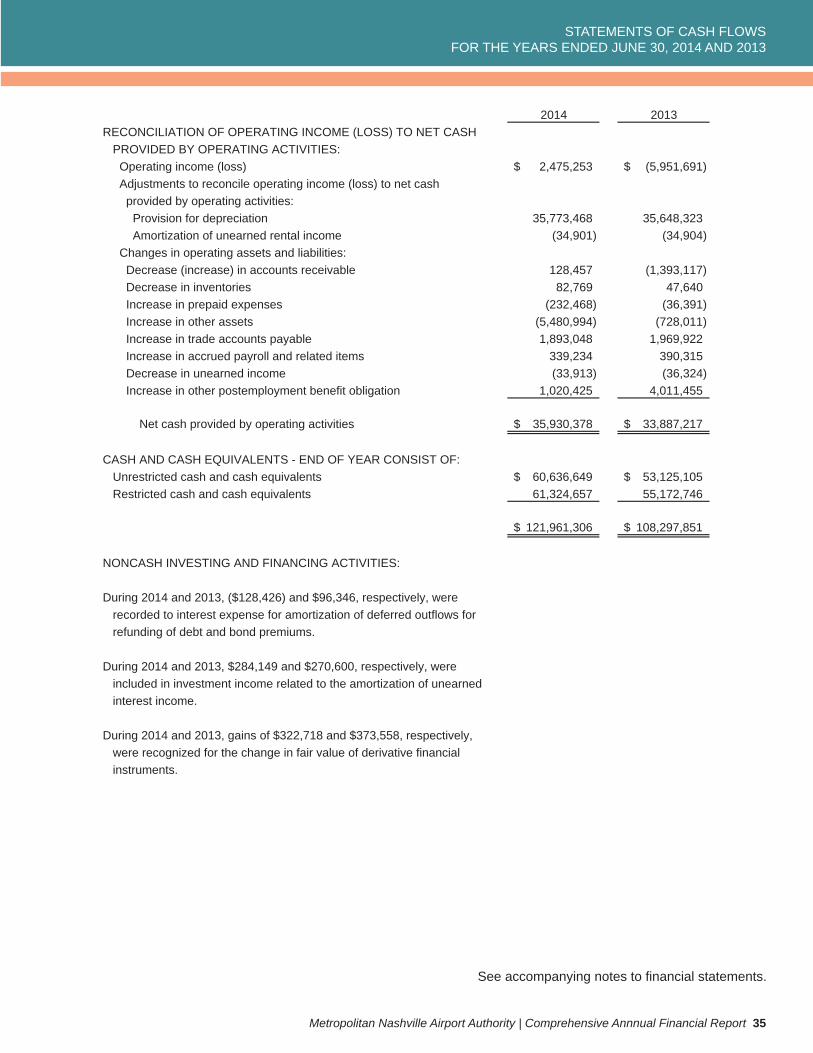
STATEMENTS OF CASH FLOWSFOR THE YEARS ENDED JUNE 30, 2014 AND 2013
Metropolitan Nashville Airport Authority | Comprehensive Annnual Financial Report 35
See accompanying notes to fi nancial statements.
2014 2013RECONCILIATION OF OPERATING INCOME (LOSS) TO NET CASH
PROVIDED BY OPERATING ACTIVITIES: Operating income (loss) 2,475,253$ (5,951,691)$ Adjustments to reconcile operating income (loss) to net cash provided by operating activities: Provision for depreciation 35,773,468 35,648,323 Amortization of unearned rental income (34,901) (34,904) Changes in operating assets and liabilities: Decrease (increase) in accounts receivable 128,457 (1,393,117) Decrease in inventories 82,769 47,640 Increase in prepaid expenses (232,468) (36,391) Increase in other assets (5,480,994) (728,011) Increase in trade accounts payable 1,893,048 1,969,922 Increase in accrued payroll and related items 339,234 390,315 Decrease in unearned income (33,913) (36,324) Increase in other postemployment benefit obligation 1,020,425 4,011,455
Net cash provided by operating activities 35,930,378$ 33,887,217$
CASH AND CASH EQUIVALENTS - END OF YEAR CONSIST OF:Unrestricted cash and cash equivalents 60,636,649$ 53,125,105$ Restricted cash and cash equivalents 61,324,657 55,172,746
121,961,306$ 108,297,851$
NONCASH INVESTING AND FINANCING ACTIVITIES:
During 2014 and 2013, ($128,426) and $96,346, respectively, wererecorded to interest expense for amortization of deferred outflows forrefunding of debt and bond premiums.
During 2014 and 2013, $284,149 and $270,600, respectively, wereincluded in investment income related to the amortization of unearnedinterest income.
During 2014 and 2013, gains of $322,718 and $373,558, respectively,were recognized for the change in fair value of derivative financialinstruments.
NOTES TO FINANCIAL STATEMENTSAS OF AND FOR THE YEARS ENDED JUNE 30, 2014 AND 2013
36 Metropolitan Nashville Airport Authority | Comprehensive Annnual Financial Report
1. METROPOLITAN NASHVILLE AIRPORT AUTHORITY
The creation of the Metropolitan Nashville Airport Authority (the “Authority”) was authorized by Public Chapter 174 of the Public Acts of the 86th General Assembly of the State of Tennessee, 1969 Session. The Metropolitan Council of the Metropolitan Government of Nashville and Davidson County, Tennessee (“Metropolitan Government”) created the Authority to operate as a separate enterprise. The Authority owns and operates Nashville International Airport and John C. Tune Airport, a general aviation reliever airport. Based upon the criteria set forth by the Governmental Accounting Standards Board (“GASB”), it has been determined that the Authority is a component unit of the Metropolitan Government.
The Authority’s Board of Commissioners consists of ten members who serve without compensation, nine of whom are appointed by the Metropolitan Government Mayor and approved by the Metropolitan Government Council, with the tenth being the Mayor (or his designee). There are provisions whereby commissioners may be removed by vote of the Metropolitan Government Council. All appointments to the Authority are for a term of four years. The terms are staggered to provide for continuity of Authority development and management. The Board of Commissioners appoints a President and charges him with the responsibility for day-to-day operations.
During April 2007, the Board of Commissioners of the Authority approved an interlocal cooperation agreement with the Industrial Development Board of the Metropolitan Government. As a result of this action, MNAA Properties Corporation (“MPC”), a Tennessee nonprofit corporation, was formed for the purpose of supporting and facilitating the operations of the Authority and to help the economic development of the surrounding area. The Commissioners of the Authority constitute the Board of Directors of MPC. During fiscal year 2008, MPC Holdings, LLC, a limited liability company in which MPC is the sole member, purchased two separate multi-tenant buildings and commenced operation. Both facilities are on Nashville International Airport property. In July 2012, MPC Holdings, LLC, purchased a small commercial building adjoining Nashville International Airport.
During November 2009, the Board of Commissioners approved the formation of a Tennessee nonprofit limited liability company, MPC CONRAC, LLC. This entity was created in connection with the special facilities financing for the Authority’s consolidated rental car facility. MPC CONRAC, LLC, is a single-member LLC, wholly owned by MPC. The formation of MPC CONRAC, LLC, created an appropriate entity to execute various agreements and secure financing and services for the consolidated rental car (“CONRAC”) facility, which was completed in November 2011, and is located at Nashville International Airport.
MPC, including its subsidiaries MPC Holdings, LLC, and MPC CONRAC, LLC, is considered to be a blended component unit for financial reporting purposes based on the following: (i) the Authority’s Board of Commissioners constitutes the Board of Directors of MPC; (ii) management of the Authority has operational responsibility for MPC; (iii) the Authority is financially accountable for MPC, including MPC’s fiscal dependence on the Authority and MPC’s potential to provide specific financial benefits or burden to the Authority; and (iv) MPC was created for the benefit of the Authority. The Authority does not issue separate financial statements for the blended component unit (See Note 21).
The accompanying financial statements also include the accounts of the Arts at the Airport Foundation, a nonprofit organization that facilitates the display and performance of artists within the Nashville International Airport terminal. The Arts at the Airport Foundation qualifies as a blended component unit of the Authority due to it being fiscally dependent on the Authority and the Authority’s appointment of the voting majority of its governing board. The financial operations of the Arts at the Airport Foundation are generally immaterial to the Authority’s financial statements.
NOTES TO FINANCIAL STATEMENTSAS OF AND FOR THE YEARS ENDED JUNE 30, 2014 AND 2013
Metropolitan Nashville Airport Authority | Comprehensive Annnual Financial Report 37
2. SUMMARY OF SIGNIFICANT ACCOUNTING POLICIES
Measurement Focus, Basis of Accounting, and Basis of Presentation
The financial statements of the Authority are presented using the economic resources measurement focus and the accrual basis of accounting in accordance with accounting principles generally accepted in the United States of America. Under the accrual basis of accounting, revenues are recorded when earned and expenses are recorded when incurred. The financial statements include the operations of Nashville International Airport, John C. Tune Airport, and MPC, including MPC CONRAC, LLC, as noted above.
Use of Estimates in the Preparation of Financial Statements
The preparation of financial statements in conformity with accounting principles generally accepted in the United States of America requires management to make assumptions that affect the reported amounts of assets and liabilities, disclosure of contingent assets and liabilities at the date of the financial statements and the reported amounts of revenues and expenses during the reporting period. Significant estimates include the useful lives of capital assets, the fair value of the derivative financial instrument, the allowance for doubtful accounts, pension valuation, other postemployment benefits obligation, and certain self-insured liabilities. Actual results could differ from those estimates.
Budgets
The Authority is required to prepare an annual operating budget and capital improvement budget to obtain the support of the Airline Affairs Committee, which is composed of the signatory airlines operating at Nashville International Airport, and the approval of the Board of Commissioners. A five-year capital improvement program, including modifications and reasons therefore, is also required to be submitted each year. In addition, an annual operating budget and capital improvement budget are submitted to the Board of Commissioners for approval for John C. Tune Airport and to the Board of Directors for MPC.
The Authority is not required to demonstrate statutory compliance with its annual operating budget. Accordingly, budgetary data is not included in the basic financial statements. All budgets are prepared in accordance with bond covenants and airport lease and use agreements. Unexpended operating appropriations lapse at year end.
Operating and Nonoperating Revenues and Expenses
The Authority distinguishes operating revenues and operating expenses from nonoperating items. Operating revenues and expenses generally result from providing services in connection with the principal ongoing operations. Revenues from space rental and fees, landing fees, parking and other miscellaneous income are reported as operating revenues. Transactions that are capital, financing or investing related are reported as nonoperating revenues. Such nonoperating revenues include passenger facility charges (“PFCs”), as described in Note 9, and customer facility charges (“CFCs”), as described in Note 10. Expenses from employee wages and benefits, purchases of services, materials and supplies and other miscellaneous expenses are reported as operating expenses. Interest expense and financing costs are reported as nonoperating expenses.
NOTES TO FINANCIAL STATEMENTSAS OF AND FOR THE YEARS ENDED JUNE 30, 2014 AND 2013
38 Metropolitan Nashville Airport Authority | Comprehensive Annnual Financial Report
2. SUMMARY OF SIGNIFICANT ACCOUNTING POLICIES - Continued
The Authority’s operating revenues are presented in five components as follows:
Signatory Airline - Signatory airline revenue consists of the revenues earned from the signatory airlines operating at Nashville International Airport primarily for terminal space rentals and landing fees. Terminal rents and landing fees charged to the signatory airlines are based on a residual agreement which takes into account all eligible revenues, expenses and debt service of the Authority. The residual agreement is designed to minimize the landing fees and terminal rents of the signatory airlines while assuring the payment of all net operating costs and debt service relating to the Authority (See Note 12).
Parking - Parking revenue is generated primarily from the operation of Authority-owned parking facilities at Nashville International Airport. This amount is presented net of ‘frequent parker’ and other incentive programs.
Concession - Concession revenue is generated through concessionaires and tenants who pay monthly fees for using airport facilities to offer their goods and services to the public. Payments to the Authority are based on negotiated agreements with concessionaires to remit amounts usually based either on a minimum guarantee or on a percentage of gross receipts.
Space Rental - Space rental revenue includes nonsignatory airline terminal space rental, car rental companies’ space rental, and certain other income received from leases of Authority-owned property.
Other - Other revenue consists primarily of nonsignatory airline landing fees, cargo airline landing fees and the Authority’s portion of fixed-based operators’ fuel sales.
Cash and Cash Equivalents
Cash and cash equivalents include cash on hand and short-term investments with original maturities of three months or less.
Investments
Investments consist primarily of securities of U.S. Agencies. Investments are accounted for in accordance with GASB Statement No. 31, Accounting and Financial Reporting for Certain Investments and for External Investment Pools, which requires that certain investments be recorded at fair value (e.g., quoted market prices). Short-term, highly liquid debt instruments that have a remaining maturity, at time of purchase, of one year or less are reported at amortized cost, provided that the fair value of those investments is not significantly affected by the impairment of the credit standing of the issuer or by other factors.
Amounts Due from Governmental Agencies
The Authority has grants for aid in construction and equipment from the Federal Airport Improvement Program (“AIP”) of the Federal Aviation Administration (“FAA”), the U.S. Department of Homeland Security (“DHS”), and the Tennessee Department of Transportation. Amounts due from governmental agencies under the terms of grant agreements are accrued as the related reimbursable costs are incurred.
Inventories
Inventories are stated at the lower of cost or market under the first-in, first-out method and consist primarily of supplies and maintenance repair parts.
NOTES TO FINANCIAL STATEMENTSAS OF AND FOR THE YEARS ENDED JUNE 30, 2014 AND 2013
Metropolitan Nashville Airport Authority | Comprehensive Annnual Financial Report 39
2. SUMMARY OF SIGNIFICANT ACCOUNTING POLICIES - Continued
Restricted Assets
Restricted assets consist of cash and cash equivalents, investments and other resources which are restricted legally or by enabling legislation. The Authority’s restricted assets are to be used for purposes specified in the respective bond indentures or other authoritative or legal documents as is the case with the collection of CFCs for the consolidated rental car facility or for purposes specified by the PFC program, as administered by the FAA. Restricted assets not generally available for use within the next fiscal year are reported as noncurrent assets.
When both restricted and unrestricted resources are available for use, it is the Authority’s policy to use restricted resources first, then use unrestricted resources as needed.
Capital Assets
Capital assets are stated at cost, except for contributions of property received from governmental agencies, which are recorded at fair value at the time of contribution. The Authority’s policy is to capitalize assets with a cost of $25,000 or more at Nashville International Airport and $10,000 at John C. Tune Airport and MPC. Routine maintenance and repairs are expensed as incurred. Interest cost incurred during the construction of facilities is capitalized as part of project costs if funding is not from grants. Provision for depreciation of property and equipment is made on a basis considered adequate to depreciate the cost of depreciable assets over their estimated useful lives and is computed on the straight-line method.
Asset lives used in the calculation of depreciation are generally as follows:
Land improvements 10 to 30 years Buildings and building improvements 10 to 30 years Equipment, furniture and fixtures 3 to 15 years
Derivative Financial Instrument
The Authority’s derivative financial instrument consists of an interest rate swap agreement, which is accounted for at fair value in accordance with GASB Statement No. 53, Accounting and Financial Reporting for Derivative Instruments.
Postemployment Benefits
Postemployment pension benefits are accounted for under GASB Statement No. 27, Accounting for Pensions by State and Local Governmental Employers, which establishes standards for the measurement, recognition and display of pension expense and related liabilities, assets, note disclosures, and, if applicable, required supplementary information. Note disclosures regarding pension information are made in accordance with GASB Statement No. 50, Pension Disclosure, an Amendment of GASB Statements No. 25 and 27. See additional information regarding the Authority’s pension benefits in Recent Accounting Pronouncements below and in Note 15. The Authority’s Retirement Plan issues a separate, publically available financial report under the requirements of GASB Statement No. 67, as further described in Note 15.
Postemployment healthcare benefits other than pension benefits are accounted for under GASB Statement No. 45, Accounting and Financial Reporting by Employers for Postemployment Benefits Other than Pensions, which establishes standards for the measurement, recognition, and display of postemployment healthcare benefits expense and related liabilities, assets, note disclosures, and, if applicable, required supplementary information.
NOTES TO FINANCIAL STATEMENTSAS OF AND FOR THE YEARS ENDED JUNE 30, 2014 AND 2013
40 Metropolitan Nashville Airport Authority | Comprehensive Annnual Financial Report
2. SUMMARY OF SIGNIFICANT ACCOUNTING POLICIES - Continued
Compensated Absences
Compensated absences are accrued as payable when earned by employees and are cumulative from one fiscal year to the next. The compensated absences liability is reported with accrued payroll and related items in the financial statements.
Self-insurance
The Authority is self-insured, up to certain limits, for employee group health insurance claims. The Authority has purchased reinsurance in order to limit its exposure. The cost of claims reported and an estimate of claims incurred but not reported are charged to operating expenses. Liabilities for unpaid claims are accrued based on management’s estimate using historical experience and current trends. The appropriateness of the self-insurance accrued liabilities is continually reviewed and updated by management.
Deferred Outflows/Inflows of Resources
In addition to assets, the statements of net position will sometimes report a separate section for deferred outflows of resources. Deferred outflows of resources represent a consumption of net position that applies to a future period and so will not be recognized as an outflow of resources (expense) until then. The Authority has one item that qualifies for reporting in this category. It includes the deferred amounts on bond refundings, as reported in the statements of net position. A deferred charge on refunding results from the difference between the net carrying amount of the original debt and the reacquisition price. This amount is deferred and amortized over the term of the new bonds or old bonds, whichever is shorter, using the effective interest method or the straight-line method, when not materially different.
In addition to liabilities, the statements of net position will sometimes report a separate section for deferred inflows of resources. Deferred inflows of resources represent an acquisition of net position that applies to a future period and so will not be recognized as an inflow of resources (revenue) until then. The Authority does not have any items that qualify for reporting in this category at June 30, 2014 and 2013.
Unearned Income
Unearned income consists of unearned interest income and unearned rental income. Unearned interest income relates to the Authority’s debt forward delivery agreement entered into in connection with certain bond-financing transactions (See Note 3). The unearned interest income is being amortized to nonoperating income using the effective interest method over the term of the related agreements. Unearned rental income represents lease rentals, received in advance, for certain ground leases entered into with developers. The unearned rental income is being recognized in nonoperating income on a straight-line basis over the terms of the related leases. Unearned income is included within liabilities in the accompanying statements of net position as such amounts may be returned to the counterparty if the related agreements were terminated.
NOTES TO FINANCIAL STATEMENTSAS OF AND FOR THE YEARS ENDED JUNE 30, 2014 AND 2013
Metropolitan Nashville Airport Authority | Comprehensive Annnual Financial Report 41
2. SUMMARY OF SIGNIFICANT ACCOUNTING POLICIES - Continued
Components of Net Position
The Authority’s net position classifications are defined as follows:
Net investment in capital assets - This component of net position consists of capital assets, net of accumulated depreciation and reduced by the outstanding balances of any bonds, mortgages, notes, capital lease obligations or other borrowings that are attributable to the acquisition, construction or improvement of those assets. If there are significant unspent related debt proceeds at year end, the portion of the debt attributable to the unspent proceeds is not included in the calculation of net investment in capital assets. Rather, that portion of the debt is included in the same net position component as the unspent proceeds.
Restricted net position - This component of net position represents restrictions imposed by creditors, grantors, contributors or laws or regulations of other governments and restrictions imposed by law or through constitutional provisions or enabling legislation.
Unrestricted net position - This component of net position consists of net position that does not meet the definition of “restricted” or “net investment in capital assets.”
Taxes
The Authority is exempt from payment of federal and state income, property and certain other taxes.
Fair Value Measurements
Assets and liabilities recorded at fair value in the statements of net position are categorized based on the level of judgment associated with the inputs used to measure their fair value. Level inputs are as follows:
Level 1 - Values are unadjusted quoted prices for identical assets in active markets accessible at the measurement date.
Level 2 - Inputs include quoted prices for similar assets in active markets, quoted prices from those willing to trade in markets that are not active, or other inputs that are observable or can be corroborated by market data for the term of the instrument. Such inputs include market interest rates and volatilities, spreads and yield curves.
Level 3 - Certain inputs are unobservable (supported by little or no market activity) and significant to the fair value measurement. Unobservable inputs reflect the Authority’s best estimate of what hypothetical market participants would use to determine a transaction price for the asset or liability at the reporting date.
Reclassifications
Certain reclassifications have been made to the 2013 amounts in the financial statements to conform to the method of presentation adopted for 2014.
NOTES TO FINANCIAL STATEMENTSAS OF AND FOR THE YEARS ENDED JUNE 30, 2014 AND 2013
42 Metropolitan Nashville Airport Authority | Comprehensive Annnual Financial Report
2. SUMMARY OF SIGNIFICANT ACCOUNTING POLICIES - Continued
Recent Accounting Pronouncements
In June 2012, the GASB issued Statement No. 68, Accounting and Financial Reporting for Pensions, which is intended to improve the usefulness of information in employer and governmental nonemployer contributing entity financial reports and enhance value for assessing accountability by requiring recognition of the entire net pension liability and more comprehensive measure of pension expense. The provisions of Statement No. 68 are effective in fiscal year 2015 for the Authority.
The new standard intends to improve the accounting and financial reporting by state and local governments for pensions and by providing more transparency about the pension plan through new note disclosures and supplementary information. It will result in the Authority recognizing the net pension liability on the statement of net position for its pension plan. The net pension liability is the discounted liability determined based on the expected benefit payments for past periods of service (i.e., the Total Pension Liability) less the net position of the plan based on the fair value of assets at the measurement date (i.e., the Fiduciary Net Position). The statement requires retroactive application through restatement of beginning net position. Additionally, the new standard computes the annual actuarially determined contribution in a new manner. Other measurement changes include recognizing annual pension cost.
In November 2013, the GASB issued Statement No. 71, Pension Transition for Contributions Made Subsequent to the Measurement Date, an amendment of GASB Statement No. 68. This Statement amends GASB 68 to require that, at transition, a government recognize a beginning deferred outflow of resources for its pension contributions, if any, made subsequent to the measurement date of the beginning net pension liability. The provisions of this Statement are required to be applied simultaneously with the provisions of Statement 68, which the Authority will implement in fiscal year 2015.
Authority management is evaluating the impact of these Statements on financial condition and operations.
3. CASH AND CASH EQUIVALENTS AND INVESTMENTS
The Authority’s deposit and investment policy is governed by the laws of the State of Tennessee and bond trust indentures and supplemental resolutions, which govern the investment of bond proceeds. Permissible investments generally include direct obligations of, or obligations guaranteed by, the U.S. Government, obligations issued or guaranteed by specific agencies of the U.S. Government, secured certificates of deposit, secured repurchase agreements, and specifically rated obligations of state governments, commercial paper and money market funds.
Cash and Cash Equivalents
The Authority’s unrestricted and restricted cash and cash equivalent bank balances totaling $124,084,735 and $109,411,720 at June 30, 2014 and 2013, respectively, (with a carrying value of $121,961,306 and $108,297,851) represent a variety of time deposits and cash equivalents.
Cash deposits are maintained at two financial institutions and are carried at cost plus interest, which approximates fair value. Cash deposits are required by State statute to be secured and collateralized by such institutions. The collateral must meet certain requirements and must have a total minimum market value of 105% of the value of the deposits placed in the institutions less the amount protected by federal depository insurance.
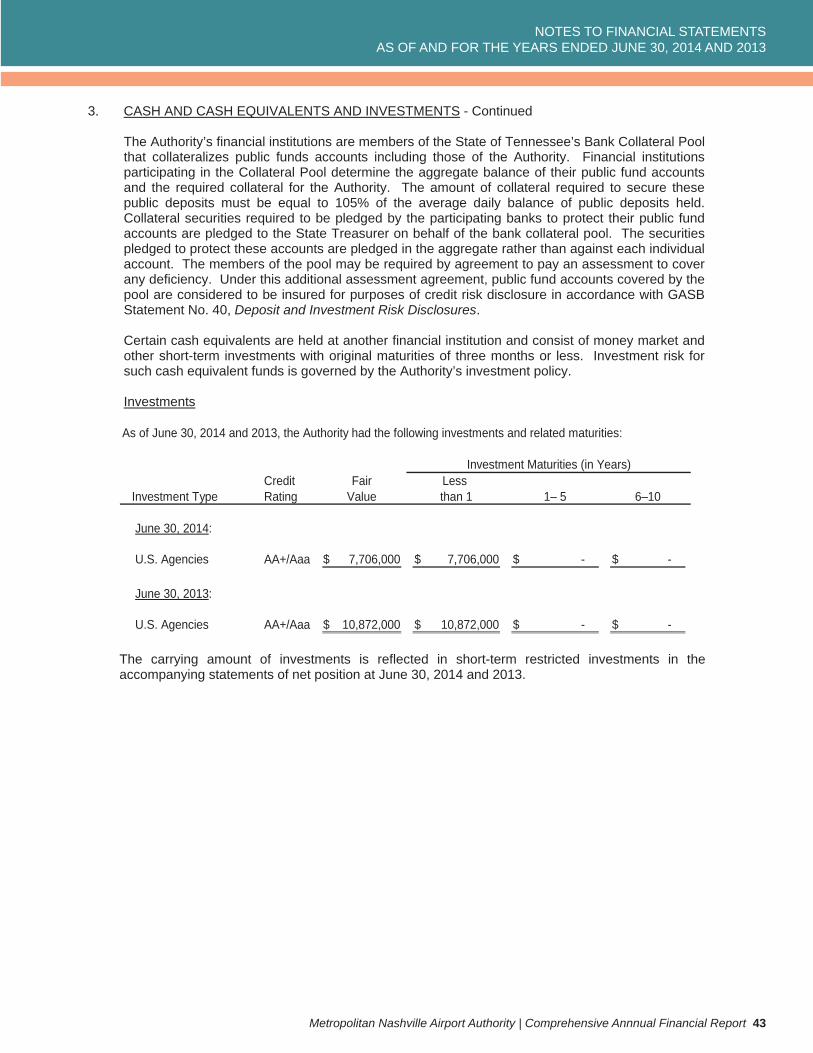
NOTES TO FINANCIAL STATEMENTSAS OF AND FOR THE YEARS ENDED JUNE 30, 2014 AND 2013
Metropolitan Nashville Airport Authority | Comprehensive Annnual Financial Report 43
3. CASH AND CASH EQUIVALENTS AND INVESTMENTS - Continued
The Authority’s financial institutions are members of the State of Tennessee’s Bank Collateral Pool that collateralizes public funds accounts including those of the Authority. Financial institutions participating in the Collateral Pool determine the aggregate balance of their public fund accounts and the required collateral for the Authority. The amount of collateral required to secure these public deposits must be equal to 105% of the average daily balance of public deposits held. Collateral securities required to be pledged by the participating banks to protect their public fund accounts are pledged to the State Treasurer on behalf of the bank collateral pool. The securities pledged to protect these accounts are pledged in the aggregate rather than against each individual account. The members of the pool may be required by agreement to pay an assessment to cover any deficiency. Under this additional assessment agreement, public fund accounts covered by the pool are considered to be insured for purposes of credit risk disclosure in accordance with GASB Statement No. 40, Deposit and Investment Risk Disclosures.
Certain cash equivalents are held at another financial institution and consist of money market and other short-term investments with original maturities of three months or less. Investment risk for such cash equivalent funds is governed by the Authority’s investment policy.
Investments
Credit Fair Less Investment Type Rating Value than 1 1– 5 6–10
June 30, 2014:
U.S. Agencies AA+/Aaa 7,706,000$ 7,706,000$ -$ -$
June 30, 2013:
U.S. Agencies AA+/Aaa 10,872,000$ 10,872,000$ -$ -$
Investment Maturities (in Years)
As of June 30, 2014 and 2013, the Authority had the following investments and related maturities:
The carrying amount of investments is reflected in short-term restricted investments in the accompanying statements of net position at June 30, 2014 and 2013.
NOTES TO FINANCIAL STATEMENTSAS OF AND FOR THE YEARS ENDED JUNE 30, 2014 AND 2013
44 Metropolitan Nashville Airport Authority | Comprehensive Annnual Financial Report
3. CASH AND CASH EQUIVALENTS AND INVESTMENTS - Continued
Interest Rate Risk - The Authority’s investment policy states that the investment portfolio may be allocated among U.S. Treasury Obligations (0 - 100%), U.S. Agency Instruments (0 - 100%), Repurchase Agreements (0 - 20%), Commercial Paper (0 - 25%), Money Market Mutual Funds (0 - 25%), Corporate Debt (0 - 15%), Asset-Backed Securities (0 - 25%), CMOs/Mortgage-Backed Securities (0 - 25%), and Cash Equivalents (0 - 100%). In addition, the maximum maturity of investments is 270 days (commercial paper), 180 days (repurchase agreements), 365 days (certificates of deposit, time deposits and bankers acceptances), five years (all other corporate debt), and ten years (all other investments). To control the volatility of the portfolio and limit exposure to interest rate risk, the Authority’s Chief Financial Officer (“CFO”) determines a duration target for the portfolio, which typically does not exceed three years.
Credit Risk - The investment policy specifies acceptable credit ratings by instrument type but overall long-term credit ratings range from “A2” to “AAA” by Moody’s and “A” to “AAA” by Standard & Poor’s. Acceptable short-term credit rating levels are “A1“ or better by Standard & Poor’s and “P1” or better by Moody’s.
Custodial Credit Risk - All investment securities purchased by the Authority, or held as collateral on either deposits or investments, are held in third-party safekeeping at a financial institution, acting solely as agent of the Authority and qualified to act in this capacity. As a means to limit custodial credit risk, all trades of marketable securities are executed on the basis of delivery versus payment and avoid the physical delivery of securities (bearer form) to ensure that securities are deposited with a custodian prior to the release of Authority funds. The Authority’s investments at June 30, 2014 and 2013, were collateralized by securities held by the Authority’s agent in the Authority’s name.
Concentration of Credit Risk - The investment policy requires that no more than 10% of the Authority’s portfolio may be invested in the securities of any single issuer with a maturity of less than 365 days and not more than 5% of the Authority’s portfolio may be invested in the securities of any single issuer with a maturity greater than one year except that 100% of the Authority’s portfolio may be invested in U.S. Treasury Obligations and U.S. Agency Instruments.
Forward Delivery Agreement
In November 1999, the Authority entered into a Debt Service Forward Delivery Agreement (“1999 DSFDA”) with a financial institution for the continuous investment of certain bond principal and interest investments through the term of the respective bonds. The present value of future investment earnings under the 1999 DSFDA was received by the Authority in an upfront, lump sum payment of $3,275,000. The amount of the upfront payment was recorded as unearned interest income and is being amortized into income over the term of the agreement. Certain bond refundings have occurred since the Authority entered into the 1999 DSFDA. The principal and interest investments of the new bonds have replaced the investments of the former bond series. As of June 30, 2014, the bonds subject to the 1999 DSFDA include Series 2008A, Series 2010B, and Series 2010C.
The remaining unearned amounts relating to the forward delivery agreement were $362,047 and $646,196 at June 30, 2014 and 2013, respectively. Such amounts are reported as unearned income in the accompanying statements of net position.
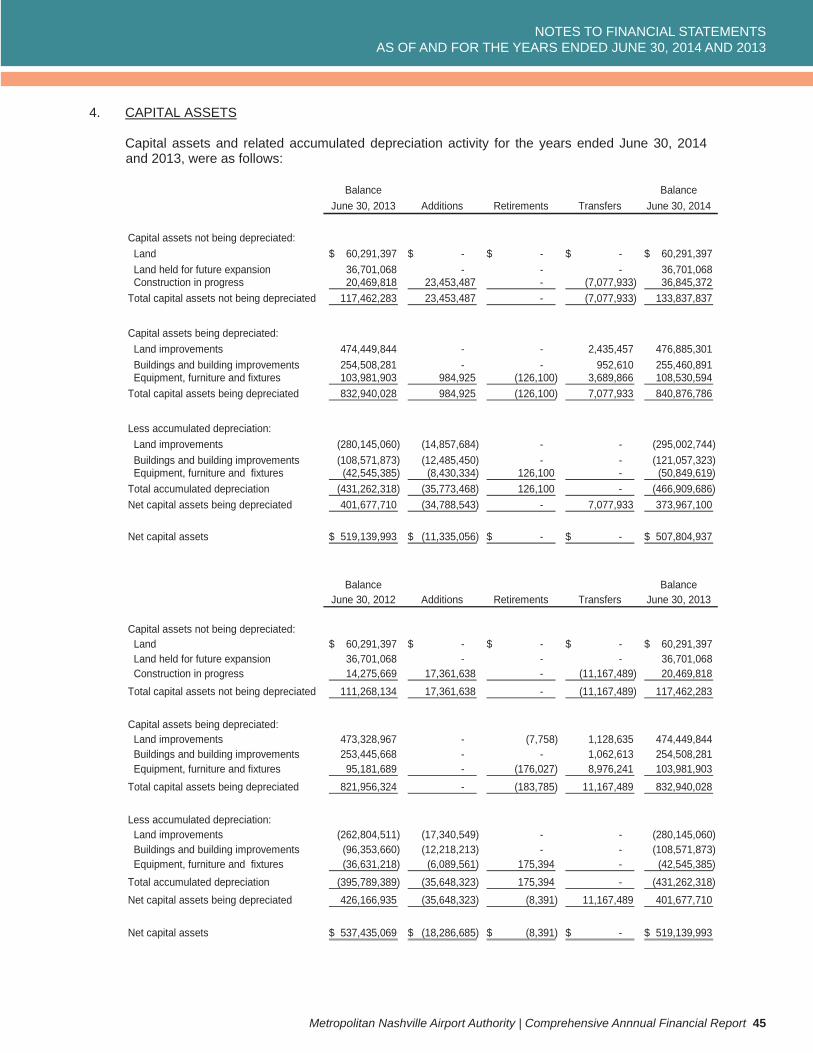
NOTES TO FINANCIAL STATEMENTSAS OF AND FOR THE YEARS ENDED JUNE 30, 2014 AND 2013
Metropolitan Nashville Airport Authority | Comprehensive Annnual Financial Report 45
4. CAPITAL ASSETS
Capital assets and related accumulated depreciation activity for the years ended June 30, 2014 and 2013, were as follows:
Balance BalanceJune 30, 2013 Additions Retirements Transfers June 30, 2014
Capital assets not being depreciated: Land 60,291,397$ -$ -$ -$ 60,291,397$ Land held for future expansion 36,701,068 - - - 36,701,068 Construction in progress 20,469,818 23,453,487 - (7,077,933) 36,845,372 Total capital assets not being depreciated 117,462,283 23,453,487 - (7,077,933) 133,837,837
Capital assets being depreciated: Land improvements 474,449,844 - - 2,435,457 476,885,301 Buildings and building improvements 254,508,281 - - 952,610 255,460,891 Equipment, furniture and fixtures 103,981,903 984,925 (126,100) 3,689,866 108,530,594 Total capital assets being depreciated 832,940,028 984,925 (126,100) 7,077,933 840,876,786
Less accumulated depreciation: Land improvements (280,145,060) (14,857,684) - - (295,002,744) Buildings and building improvements (108,571,873) (12,485,450) - - (121,057,323) Equipment, furniture and fixtures (42,545,385) (8,430,334) 126,100 - (50,849,619) Total accumulated depreciation (431,262,318) (35,773,468) 126,100 - (466,909,686)Net capital assets being depreciated 401,677,710 (34,788,543) - 7,077,933 373,967,100
Net capital assets 519,139,993$ (11,335,056)$ -$ -$ 507,804,937$
Balance BalanceJune 30, 2012 Additions Retirements Transfers June 30, 2013
Capital assets not being depreciated: Land 60,291,397$ -$ -$ -$ 60,291,397$ Land held for future expansion 36,701,068 - - - 36,701,068 Construction in progress 14,275,669 17,361,638 - (11,167,489) 20,469,818 Total capital assets not being depreciated 111,268,134 17,361,638 - (11,167,489) 117,462,283
Capital assets being depreciated: Land improvements 473,328,967 - (7,758) 1,128,635 474,449,844 Buildings and building improvements 253,445,668 - - 1,062,613 254,508,281 Equipment, furniture and fixtures 95,181,689 - (176,027) 8,976,241 103,981,903 Total capital assets being depreciated 821,956,324 - (183,785) 11,167,489 832,940,028
Less accumulated depreciation: Land improvements (262,804,511) (17,340,549) - - (280,145,060) Buildings and building improvements (96,353,660) (12,218,213) - - (108,571,873) Equipment, furniture and fixtures (36,631,218) (6,089,561) 175,394 - (42,545,385) Total accumulated depreciation (395,789,389) (35,648,323) 175,394 - (431,262,318)Net capital assets being depreciated 426,166,935 (35,648,323) (8,391) 11,167,489 401,677,710
Net capital assets 537,435,069$ (18,286,685)$ (8,391)$ -$ 519,139,993$
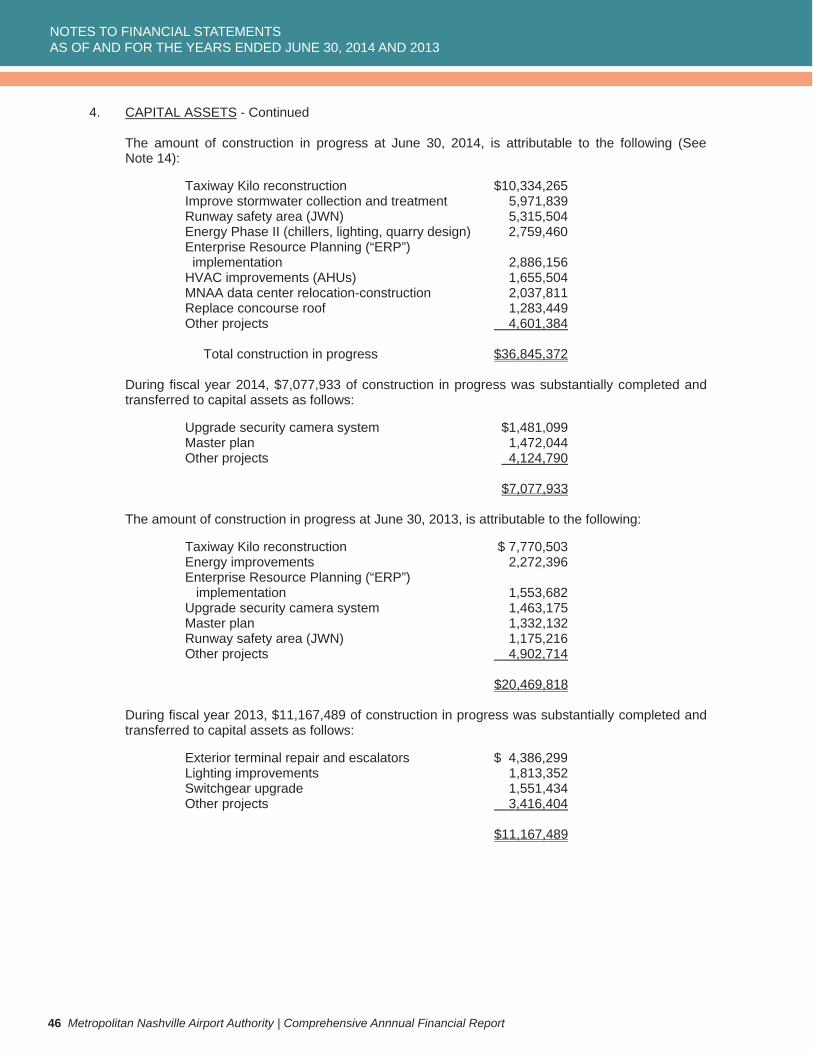
NOTES TO FINANCIAL STATEMENTSAS OF AND FOR THE YEARS ENDED JUNE 30, 2014 AND 2013
46 Metropolitan Nashville Airport Authority | Comprehensive Annnual Financial Report
4. CAPITAL ASSETS - Continued
The amount of construction in progress at June 30, 2014, is attributable to the following (See Note 14):
Taxiway Kilo reconstruction $10,334,265 Improve stormwater collection and treatment 5,971,839 Runway safety area (JWN) 5,315,504 Energy Phase II (chillers, lighting, quarry design) 2,759,460 Enterprise Resource Planning (“ERP”) implementation 2,886,156 HVAC improvements (AHUs) 1,655,504 MNAA data center relocation-construction 2,037,811 Replace concourse roof 1,283,449 Other projects 4,601,384
Total construction in progress $36,845,372
During fiscal year 2014, $7,077,933 of construction in progress was substantially completed and transferred to capital assets as follows:
Upgrade security camera system $1,481,099 Master plan 1,472,044 Other projects 4,124,790
$7,077,933
The amount of construction in progress at June 30, 2013, is attributable to the following:
Taxiway Kilo reconstruction $ 7,770,503 Energy improvements 2,272,396 Enterprise Resource Planning (“ERP”) implementation 1,553,682 Upgrade security camera system 1,463,175 Master plan 1,332,132 Runway safety area (JWN) 1,175,216 Other projects 4,902,714
$20,469,818
During fiscal year 2013, $11,167,489 of construction in progress was substantially completed and transferred to capital assets as follows:
Exterior terminal repair and escalators $ 4,386,299 Lighting improvements 1,813,352 Switchgear upgrade 1,551,434 Other projects 3,416,404
$11,167,489
NOTES TO FINANCIAL STATEMENTSAS OF AND FOR THE YEARS ENDED JUNE 30, 2014 AND 2013
Metropolitan Nashville Airport Authority | Comprehensive Annnual Financial Report 47
5. AIRPORT BONDS
Airport Improvement Revenue Bonds, Series 2003B
During November 2003, the Authority issued Series 2003B taxable bonds in the principal amount of $19,585,000. These bonds were issued to provide funding for a portion of the projected unfunded liability of the Metropolitan Nashville Airport Authority Retirement Plan for Employees (See Note 15).
The remaining Series 2003B bonds contain serial bonds at interest rates ranging from 5.12% to 5.94%, with annual sinking fund requirements in progressive annual amounts ranging from $445,000 on July 1, 2014, to $1,280,000 on July 1, 2033. The annual amounts accumulated in the sinking fund will be used to pay bond holders on July 1, 2014, 2015, 2018, 2023 and 2033. The 2003B bonds are subject to an extraordinary optional redemption, in whole at any time, at a redemption price equal to the principal amount plus accrued interest to the date of redemption only in the event of the destruction or damage to all or substantially all of the Nashville International Airport or the condemnation of the airport facility.
Airport Improvement Revenue Bonds, Refunding Series 2008A
During June 2008, the Authority issued Refunding Series 2008A in the principal amount of $37,600,000. These bonds were issued to provide funds to refund $37,600,000 of aggregate outstanding principal amount of the Authority’s Series 1993 bonds. The purpose of the refunding was to replace the liquidity facility agreement with a direct pay letter of credit. There was no significant economic gain as a result of the refunding, and there were no changes to the debt service schedule or other terms of the bonds. The refunding of the Series 1993 bonds resulted in a difference between the reacquisition price and the net carrying amount of the old debt of $2,124,070. This difference, reported in the accompanying financial statements as a deferred outflow of resources, is being amortized through fiscal year 2020.
The Series 2008A issue contains serial bonds bearing interest at a weekly variable rate. In order to limit its exposure to changes in interest rates, the Authority transferred its existing 1993 interest rate swap agreement to the 2008A bonds (“2008A Swap Agreement”), resulting in a fixed interest rate of 4.49% (See Note 8). The 2008A bonds mature in progressive annual amounts ranging from $200,000 on July 1, 2014, to $3,800,000 on July 1, 2019.
Airport Improvement Revenue Bonds, Series 2009A
During March 2009, the Authority issued Series 2009A bonds in the principal amount of $36,000,000. The bonds were issued to provide funds for the majority of the costs associated with the second phase of the terminal renovation project, and to fund a deposit to the debt service reserve account for the Series 2009A bonds.
The remaining Series 2009A bonds contain serial bonds at interest rates ranging from 3.75% to 5.25%, maturing in progressive annual amounts ranging from $3,555,000 on July 1, 2014, to $7,970,000 on July 1, 2019. The debt service reserve account and interest earned on that account will be used to pay a portion of the final principal payment on July 1, 2019.
NOTES TO FINANCIAL STATEMENTSAS OF AND FOR THE YEARS ENDED JUNE 30, 2014 AND 2013
48 Metropolitan Nashville Airport Authority | Comprehensive Annnual Financial Report
5. AIRPORT BONDS - Continued
Airport Improvement Revenue Bonds, Series 2010A
During February 2010, the Authority issued Series 2010A bonds in the principal amount of $25,770,000. The bonds were issued to provide funds to refund $25,050,000 aggregate outstanding principal amount of the Authority’s Series 2008B bonds and to pay issuance costs. The purpose of the refunding was to replace variable-rate bonds with fixed-rate bonds thereby terminating an interest rate swap with a financial institution. There were no significant changes to the terms of the bonds, and there was no significant economic gain as a result of the refunding.
The refunding of the Series 2008B bonds resulted in a difference between the reacquisition price and the net carrying amount of the old debt of $948,838. This difference, reported in the accompanying financial statements as a deferred outflow of resources, is being amortized through fiscal year 2018.
The remaining Series 2010A issue contains serial bonds at interest rates ranging from 4.75% to 5.00%, maturing in amounts ranging from $3,435,000 on July 1, 2014, to $3,835,000 on July 1, 2017.
Special Facility Revenue Bonds (MPC CONRAC LLC Project) Series 2010 Bonds
During February 2010, the Authority issued CONRAC Series 2010 bonds in the principal amount of $66,300,000. The bonds, together with customer facility charge (“CFC”) collections on hand and collected during the construction period, were used for the development and construction of a new consolidated rental car (“CONRAC”) facility and related improvements, including quick turnaround facilities at the Airport, to fund certain deposits to the debt service reserve fund and coverage fund, and to pay bond issue costs of $2,268,828. The CONRAC Series 2010 bonds are payable from and secured by a pledge of certain rental payments derived from CFC’s under leases with rental car agencies (See Note 10).
The remaining CONRAC Series 2010 bonds contain serial bonds at interest rates ranging from 3.73% to 6.19%, maturing in progressive annual amounts ranging from $1,905,000 on July 1, 2014, to $3,800,000 on July 1, 2024. The CONRAC Series 2010 bonds also contain term bonds of $31,765,000, bearing interest at 6.79% and maturing on July 1, 2029. The CONRAC term bonds are subject to mandatory annual sinking fund requirements of $4,055,000 on July 1, 2025, to $13,755,000 on July 1, 2029.
Airport Improvement Revenue Bonds, Series 2010B&C
During August 2010, the Authority issued Series 2010B bonds in the principal amount of $70,400,000 and Series 2010C in the principal amount of $16,170,000, collectively the “Series 2010B&C Bonds.” These bonds, together with other funds of the Authority, were issued to provide funds to refund $92,925,000 aggregate outstanding principal amount of the Authority’s Series 1995, 1998A, 1998C and 2001A bonds, to pay the premiums of municipal bond insurance policies and debt service reserve fund surety policies, and to pay certain costs of their issuance. Interest on the 2010C bonds is treated as a preference item in calculating alternative minimum tax. The 2010B&C bonds were issued at a premium totaling $5,755,919. The refunding resulted in an economic gain of approximately $8,500,000.
The refunding of the Series 1995, 1998A, 1998C and 2001A bonds resulted in a difference between the reacquisition price and the net carrying amount of the refunded debt of $4,918,969, including a 3.00%, or $1,274,700, repayment premium on the 2001A bonds. This difference, reported as a deferred outflows of resources, is being amortized through fiscal year 2017.
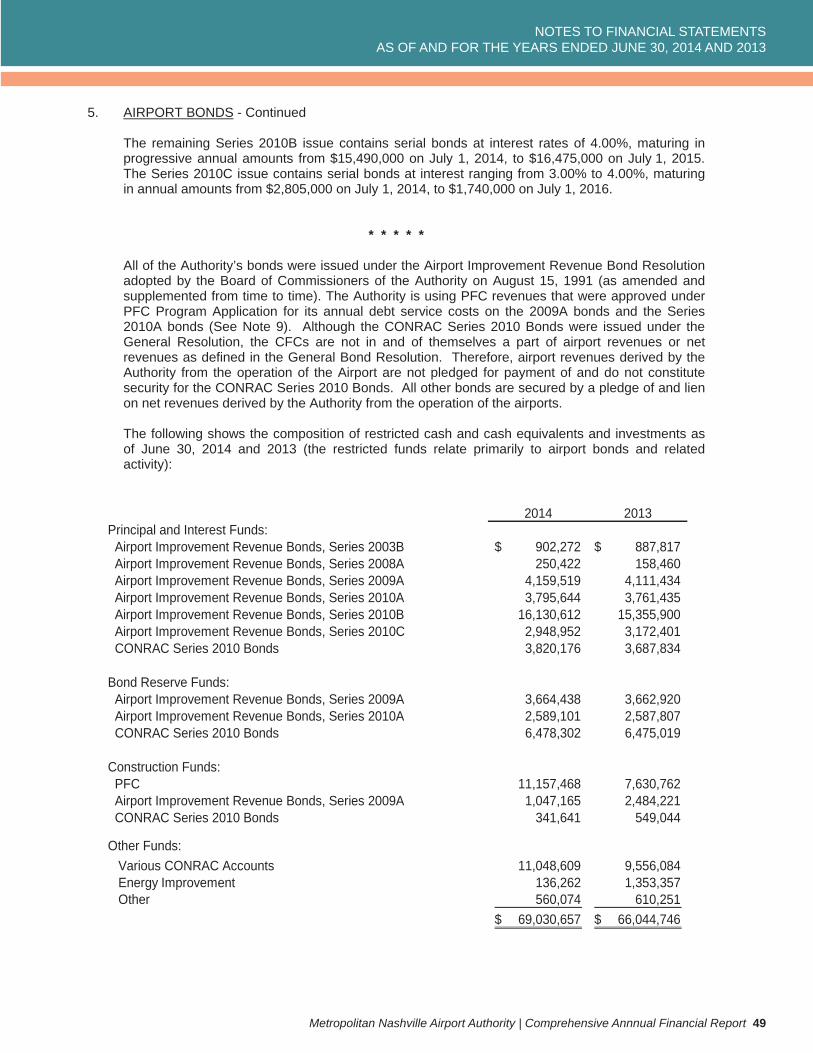
NOTES TO FINANCIAL STATEMENTSAS OF AND FOR THE YEARS ENDED JUNE 30, 2014 AND 2013
Metropolitan Nashville Airport Authority | Comprehensive Annnual Financial Report 49
5. AIRPORT BONDS - Continued
The remaining Series 2010B issue contains serial bonds at interest rates of 4.00%, maturing in progressive annual amounts from $15,490,000 on July 1, 2014, to $16,475,000 on July 1, 2015. The Series 2010C issue contains serial bonds at interest ranging from 3.00% to 4.00%, maturing in annual amounts from $2,805,000 on July 1, 2014, to $1,740,000 on July 1, 2016.
* * * * *
All of the Authority’s bonds were issued under the Airport Improvement Revenue Bond Resolution adopted by the Board of Commissioners of the Authority on August 15, 1991 (as amended and supplemented from time to time). The Authority is using PFC revenues that were approved under PFC Program Application for its annual debt service costs on the 2009A bonds and the Series 2010A bonds (See Note 9). Although the CONRAC Series 2010 Bonds were issued under the General Resolution, the CFCs are not in and of themselves a part of airport revenues or net revenues as defined in the General Bond Resolution. Therefore, airport revenues derived by the Authority from the operation of the Airport are not pledged for payment of and do not constitute security for the CONRAC Series 2010 Bonds. All other bonds are secured by a pledge of and lien on net revenues derived by the Authority from the operation of the airports.
The following shows the composition of restricted cash and cash equivalents and investments as of June 30, 2014 and 2013 (the restricted funds relate primarily to airport bonds and related activity):
2014 2013Principal and Interest Funds: Airport Improvement Revenue Bonds, Series 2003B 902,272$ 887,817$ Airport Improvement Revenue Bonds, Series 2008A 250,422 158,460 Airport Improvement Revenue Bonds, Series 2009A 4,159,519 4,111,434 Airport Improvement Revenue Bonds, Series 2010A 3,795,644 3,761,435 Airport Improvement Revenue Bonds, Series 2010B 16,130,612 15,355,900 Airport Improvement Revenue Bonds, Series 2010C 2,948,952 3,172,401 CONRAC Series 2010 Bonds 3,820,176 3,687,834
Bond Reserve Funds: Airport Improvement Revenue Bonds, Series 2009A 3,664,438 3,662,920 Airport Improvement Revenue Bonds, Series 2010A 2,589,101 2,587,807 CONRAC Series 2010 Bonds 6,478,302 6,475,019
Construction Funds: PFC 11,157,468 7,630,762 Airport Improvement Revenue Bonds, Series 2009A 1,047,165 2,484,221 CONRAC Series 2010 Bonds 341,641 549,044
Other Funds: Various CONRAC Accounts 11,048,609 9,556,084 Energy Improvement 136,262 1,353,357 Other 560,074 610,251
69,030,657$ 66,044,746$
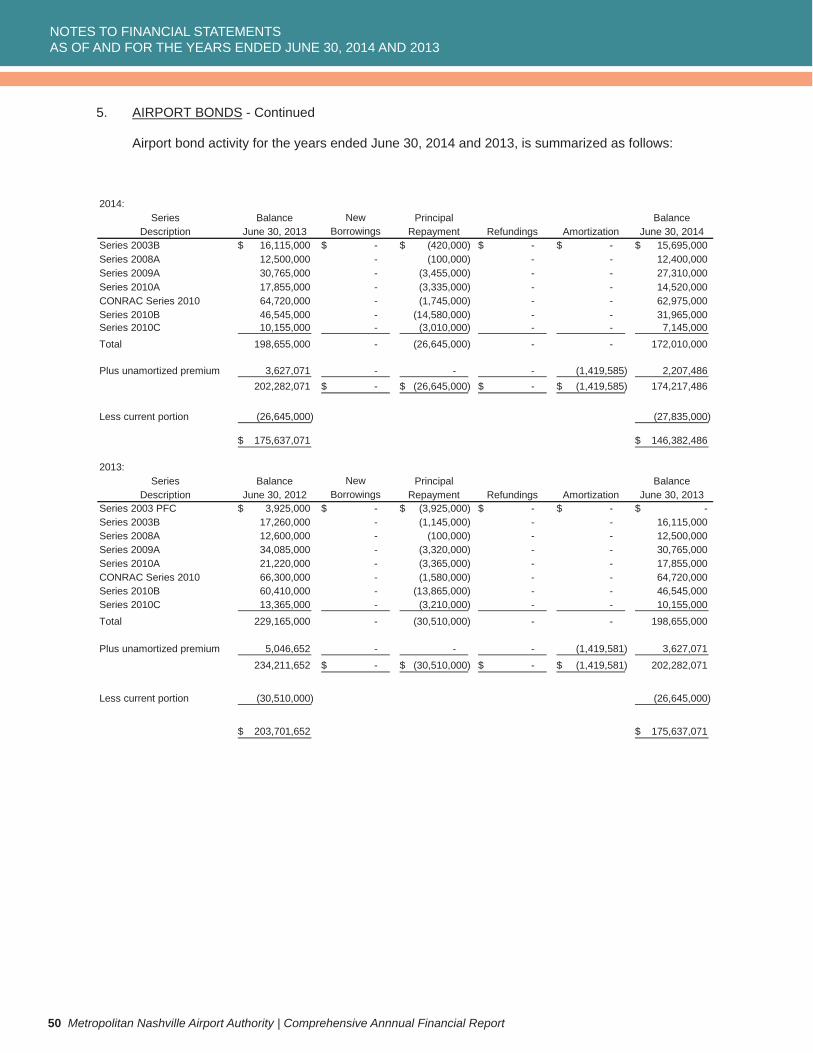
NOTES TO FINANCIAL STATEMENTSAS OF AND FOR THE YEARS ENDED JUNE 30, 2014 AND 2013
50 Metropolitan Nashville Airport Authority | Comprehensive Annnual Financial Report
5. AIRPORT BONDS - Continued
Airport bond activity for the years ended June 30, 2014 and 2013, is summarized as follows:
2014:Series Balance New Principal Balance
Description June 30, 2013 Borrowings Repayment Refundings Amortization June 30, 2014Series 2003B 16,115,000$ -$ (420,000)$ -$ -$ 15,695,000$Series 2008A 12,500,000 - (100,000) - - 12,400,000Series 2009A 30,765,000 - (3,455,000) - - 27,310,000Series 2010A 17,855,000 - (3,335,000) - - 14,520,000CONRAC Series 2010 64,720,000 - (1,745,000) - - 62,975,000Series 2010B 46,545,000 - (14,580,000) - - 31,965,000Series 2010C 10,155,000 - (3,010,000) - - 7,145,000Total 198,655,000 - (26,645,000) - - 172,010,000
Plus unamortized premium 3,627,071 - - - (1,419,585) 2,207,486202,282,071 -$ (26,645,000)$ -$ (1,419,585)$ 174,217,486
Less current portion (26,645,000) (27,835,000)
175,637,071$ 146,382,486$
2013:Series Balance New Principal Balance
Description June 30, 2012 Borrowings Repayment Refundings Amortization June 30, 2013Series 2003 PFC 3,925,000$ -$ (3,925,000)$ -$ -$ -$Series 2003B 17,260,000 - (1,145,000) - - 16,115,000Series 2008A 12,600,000 - (100,000) - - 12,500,000Series 2009A 34,085,000 - (3,320,000) - - 30,765,000Series 2010A 21,220,000 - (3,365,000) - - 17,855,000CONRAC Series 2010 66,300,000 - (1,580,000) - - 64,720,000Series 2010B 60,410,000 - (13,865,000) - - 46,545,000Series 2010C 13,365,000 - (3,210,000) - - 10,155,000Total 229,165,000 - (30,510,000) - - 198,655,000
Plus unamortized premium 5,046,652 - - - (1,419,581) 3,627,071234,211,652 -$ (30,510,000)$ -$ (1,419,581)$ 202,282,071
Less current portion (30,510,000) (26,645,000)
203,701,652$ 175,637,071$
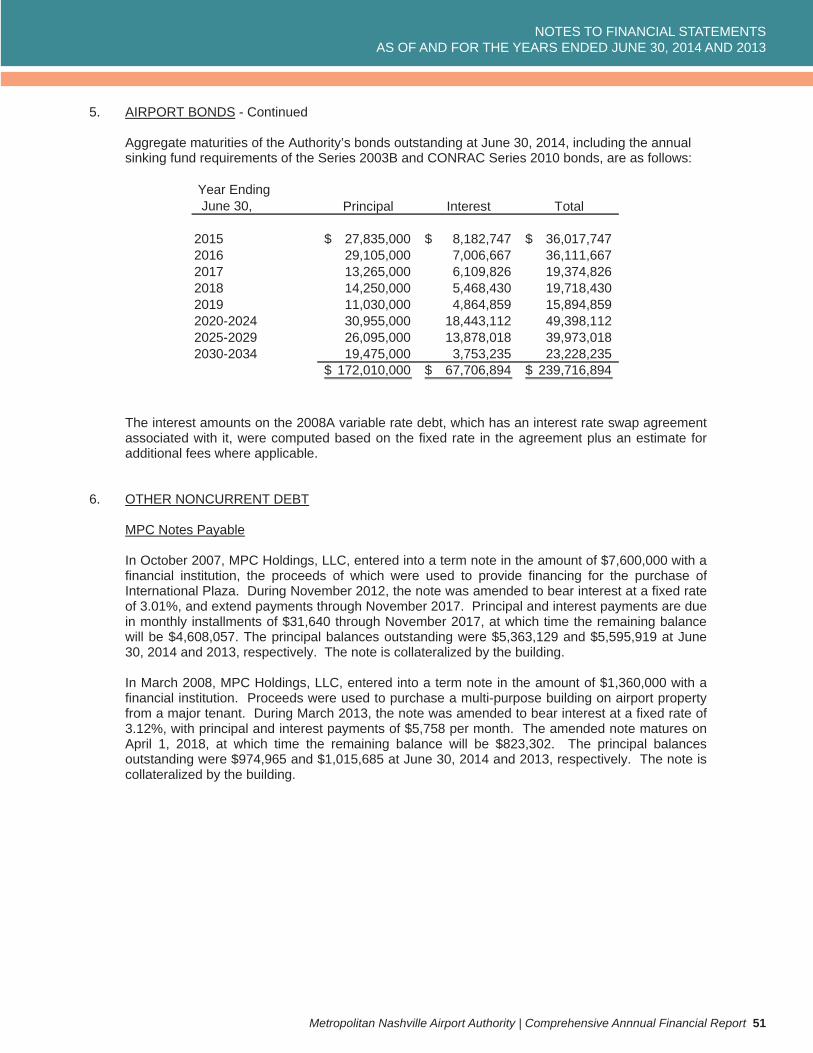
NOTES TO FINANCIAL STATEMENTSAS OF AND FOR THE YEARS ENDED JUNE 30, 2014 AND 2013
Metropolitan Nashville Airport Authority | Comprehensive Annnual Financial Report 51
5. AIRPORT BONDS - Continued
Aggregate maturities of the Authority’s bonds outstanding at June 30, 2014, including the annual sinking fund requirements of the Series 2003B and CONRAC Series 2010 bonds, are as follows:
Year Ending June 30, Principal Interest Total
2015 27,835,000$ 8,182,747$ 36,017,747$ 2016 29,105,000 7,006,667 36,111,667 2017 13,265,000 6,109,826 19,374,826 2018 14,250,000 5,468,430 19,718,430 2019 11,030,000 4,864,859 15,894,859 2020-2024 30,955,000 18,443,112 49,398,112 2025-2029 26,095,000 13,878,018 39,973,018 2030-2034 19,475,000 3,753,235 23,228,235
172,010,000$ 67,706,894$ 239,716,894$
The interest amounts on the 2008A variable rate debt, which has an interest rate swap agreement associated with it, were computed based on the fixed rate in the agreement plus an estimate for additional fees where applicable.
6. OTHER NONCURRENT DEBT
MPC Notes Payable
In October 2007, MPC Holdings, LLC, entered into a term note in the amount of $7,600,000 with a financial institution, the proceeds of which were used to provide financing for the purchase of International Plaza. During November 2012, the note was amended to bear interest at a fixed rate of 3.01%, and extend payments through November 2017. Principal and interest payments are due in monthly installments of $31,640 through November 2017, at which time the remaining balance will be $4,608,057. The principal balances outstanding were $5,363,129 and $5,595,919 at June 30, 2014 and 2013, respectively. The note is collateralized by the building.
In March 2008, MPC Holdings, LLC, entered into a term note in the amount of $1,360,000 with a financial institution. Proceeds were used to purchase a multi-purpose building on airport property from a major tenant. During March 2013, the note was amended to bear interest at a fixed rate of 3.12%, with principal and interest payments of $5,758 per month. The amended note matures on April 1, 2018, at which time the remaining balance will be $823,302. The principal balances outstanding were $974,965 and $1,015,685 at June 30, 2014 and 2013, respectively. The note is collateralized by the building.
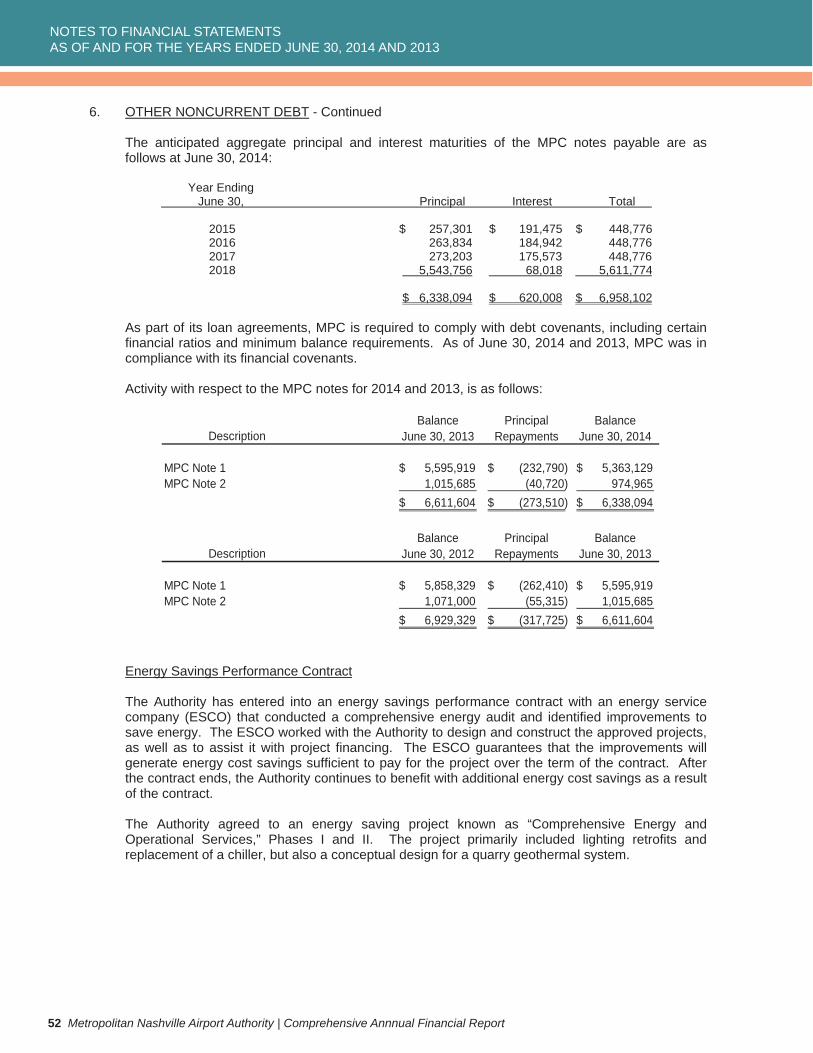
NOTES TO FINANCIAL STATEMENTSAS OF AND FOR THE YEARS ENDED JUNE 30, 2014 AND 2013
52 Metropolitan Nashville Airport Authority | Comprehensive Annnual Financial Report
6. OTHER NONCURRENT DEBT - Continued
The anticipated aggregate principal and interest maturities of the MPC notes payable are as follows at June 30, 2014:
Year Ending June 30, Principal Interest Total
2015 $ 257,301 $ 191,475 $ 448,776 2016 263,834 184,942 448,776 2017 273,203 175,573 448,776 2018 5,543,756 68,018 5,611,774
$ 6,338,094 $ 620,008 $ 6,958,102
As part of its loan agreements, MPC is required to comply with debt covenants, including certain financial ratios and minimum balance requirements. As of June 30, 2014 and 2013, MPC was in compliance with its financial covenants.
Activity with respect to the MPC notes for 2014 and 2013, is as follows:
Balance Principal BalanceDescription June 30, 2013 Repayments June 30, 2014
MPC Note 1 5,595,919$ (232,790)$ 5,363,129$ MPC Note 2 1,015,685 (40,720) 974,965
6,611,604$ (273,510)$ 6,338,094$
Balance Principal BalanceDescription June 30, 2012 Repayments June 30, 2013
MPC Note 1 5,858,329$ (262,410)$ 5,595,919$ MPC Note 2 1,071,000 (55,315) 1,015,685
6,929,329$ (317,725)$ 6,611,604$
Energy Savings Performance Contract
The Authority has entered into an energy savings performance contract with an energy service company (ESCO) that conducted a comprehensive energy audit and identified improvements to save energy. The ESCO worked with the Authority to design and construct the approved projects, as well as to assist it with project financing. The ESCO guarantees that the improvements will generate energy cost savings sufficient to pay for the project over the term of the contract. After the contract ends, the Authority continues to benefit with additional energy cost savings as a result of the contract.
The Authority agreed to an energy saving project known as “Comprehensive Energy and Operational Services,” Phases I and II. The project primarily included lighting retrofits and replacement of a chiller, but also a conceptual design for a quarry geothermal system.
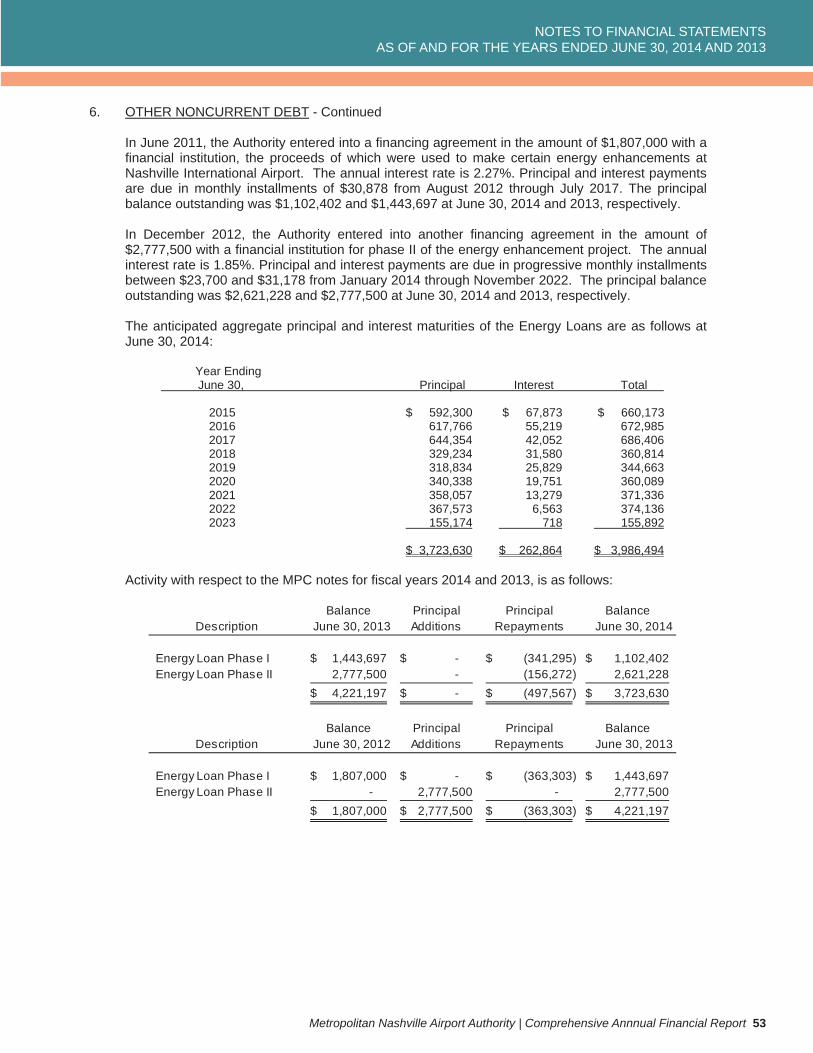
NOTES TO FINANCIAL STATEMENTSAS OF AND FOR THE YEARS ENDED JUNE 30, 2014 AND 2013
Metropolitan Nashville Airport Authority | Comprehensive Annnual Financial Report 53
6. OTHER NONCURRENT DEBT - Continued
In June 2011, the Authority entered into a financing agreement in the amount of $1,807,000 with a financial institution, the proceeds of which were used to make certain energy enhancements at Nashville International Airport. The annual interest rate is 2.27%. Principal and interest payments are due in monthly installments of $30,878 from August 2012 through July 2017. The principal balance outstanding was $1,102,402 and $1,443,697 at June 30, 2014 and 2013, respectively.
In December 2012, the Authority entered into another financing agreement in the amount of $2,777,500 with a financial institution for phase II of the energy enhancement project. The annual interest rate is 1.85%. Principal and interest payments are due in progressive monthly installments between $23,700 and $31,178 from January 2014 through November 2022. The principal balance outstanding was $2,621,228 and $2,777,500 at June 30, 2014 and 2013, respectively.
The anticipated aggregate principal and interest maturities of the Energy Loans are as follows at June 30, 2014:
Year Ending June 30, Principal Interest Total
2015 $ 592,300 $ 67,873 $ 660,173 2016 617,766 55,219 672,985 2017 644,354 42,052 686,406 2018 329,234 31,580 360,814 2019 318,834 25,829 344,663 2020 340,338 19,751 360,089 2021 358,057 13,279 371,336 2022 367,573 6,563 374,136 2023 155,174 718 155,892
$ 3,723,630 $ 262,864 $ 3,986,494
Activity with respect to the MPC notes for fiscal years 2014 and 2013, is as follows:
Balance Principal Principal BalanceDescription June 30, 2013 Additions Repayments June 30, 2014
Energy Loan Phase I 1,443,697$ -$ (341,295)$ 1,102,402$ Energy Loan Phase II 2,777,500 - (156,272) 2,621,228
4,221,197$ -$ (497,567)$ 3,723,630$
Balance Principal Principal BalanceDescription June 30, 2012 Additions Repayments June 30, 2013
Energy Loan Phase I 1,807,000$ -$ (363,303)$ 1,443,697$ Energy Loan Phase II - 2,777,500 - 2,777,500
1,807,000$ 2,777,500$ (363,303)$ 4,221,197$
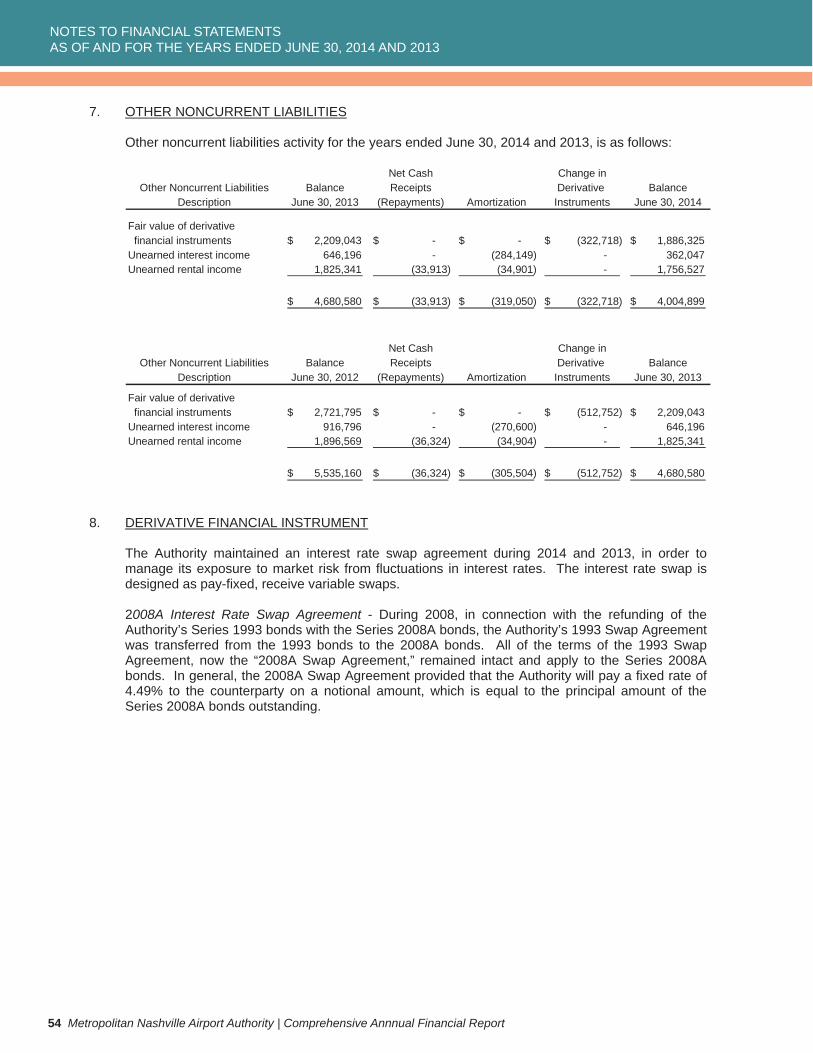
NOTES TO FINANCIAL STATEMENTSAS OF AND FOR THE YEARS ENDED JUNE 30, 2014 AND 2013
54 Metropolitan Nashville Airport Authority | Comprehensive Annnual Financial Report
7. OTHER NONCURRENT LIABILITIES
Other noncurrent liabilities activity for the years ended June 30, 2014 and 2013, is as follows:
Net Cash Change inOther Noncurrent Liabilities Balance Receipts Derivative Balance
Description June 30, 2013 (Repayments) Amortization Instruments June 30, 2014
Fair value of derivative financial instruments 2,209,043$ -$ -$ (322,718)$ 1,886,325$ Unearned interest income 646,196 - (284,149) - 362,047 Unearned rental income 1,825,341 (33,913) (34,901) - 1,756,527
4,680,580$ (33,913)$ (319,050)$ (322,718)$ 4,004,899$
Net Cash Change inOther Noncurrent Liabilities Balance Receipts Derivative Balance
Description June 30, 2012 (Repayments) Amortization Instruments June 30, 2013
Fair value of derivative financial instruments 2,721,795$ -$ -$ (512,752)$ 2,209,043$ Unearned interest income 916,796 - (270,600) - 646,196 Unearned rental income 1,896,569 (36,324) (34,904) - 1,825,341
5,535,160$ (36,324)$ (305,504)$ (512,752)$ 4,680,580$
8. DERIVATIVE FINANCIAL INSTRUMENT
The Authority maintained an interest rate swap agreement during 2014 and 2013, in order to manage its exposure to market risk from fluctuations in interest rates. The interest rate swap is designed as pay-fixed, receive variable swaps.
2008A Interest Rate Swap Agreement - During 2008, in connection with the refunding of the Authority’s Series 1993 bonds with the Series 2008A bonds, the Authority’s 1993 Swap Agreement was transferred from the 1993 bonds to the 2008A bonds. All of the terms of the 1993 Swap Agreement, now the “2008A Swap Agreement,” remained intact and apply to the Series 2008A bonds. In general, the 2008A Swap Agreement provided that the Authority will pay a fixed rate of 4.49% to the counterparty on a notional amount, which is equal to the principal amount of the Series 2008A bonds outstanding.
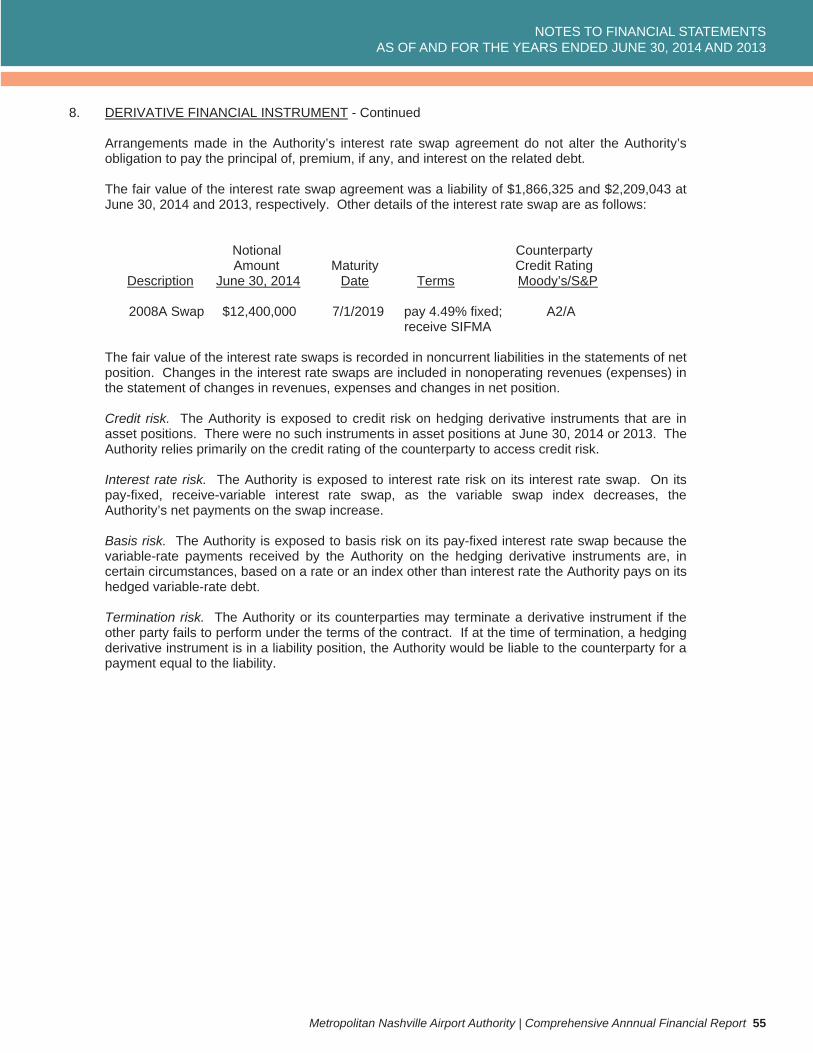
NOTES TO FINANCIAL STATEMENTSAS OF AND FOR THE YEARS ENDED JUNE 30, 2014 AND 2013
Metropolitan Nashville Airport Authority | Comprehensive Annnual Financial Report 55
8. DERIVATIVE FINANCIAL INSTRUMENT - Continued
Arrangements made in the Authority’s interest rate swap agreement do not alter the Authority’s obligation to pay the principal of, premium, if any, and interest on the related debt.
The fair value of the interest rate swap agreement was a liability of $1,866,325 and $2,209,043 at June 30, 2014 and 2013, respectively. Other details of the interest rate swap are as follows:
Notional Counterparty Amount Maturity Credit Rating Description June 30, 2014 Date Terms Moody’s/S&P
2008A Swap $12,400,000 7/1/2019 pay 4.49% fixed; A2/A receive SIFMA
The fair value of the interest rate swaps is recorded in noncurrent liabilities in the statements of net position. Changes in the interest rate swaps are included in nonoperating revenues (expenses) in the statement of changes in revenues, expenses and changes in net position.
Credit risk. The Authority is exposed to credit risk on hedging derivative instruments that are in asset positions. There were no such instruments in asset positions at June 30, 2014 or 2013. The Authority relies primarily on the credit rating of the counterparty to access credit risk.
Interest rate risk. The Authority is exposed to interest rate risk on its interest rate swap. On its pay-fixed, receive-variable interest rate swap, as the variable swap index decreases, the Authority’s net payments on the swap increase.
Basis risk. The Authority is exposed to basis risk on its pay-fixed interest rate swap because the variable-rate payments received by the Authority on the hedging derivative instruments are, in certain circumstances, based on a rate or an index other than interest rate the Authority pays on its hedged variable-rate debt.
Termination risk. The Authority or its counterparties may terminate a derivative instrument if the other party fails to perform under the terms of the contract. If at the time of termination, a hedging derivative instrument is in a liability position, the Authority would be liable to the counterparty for a payment equal to the liability.
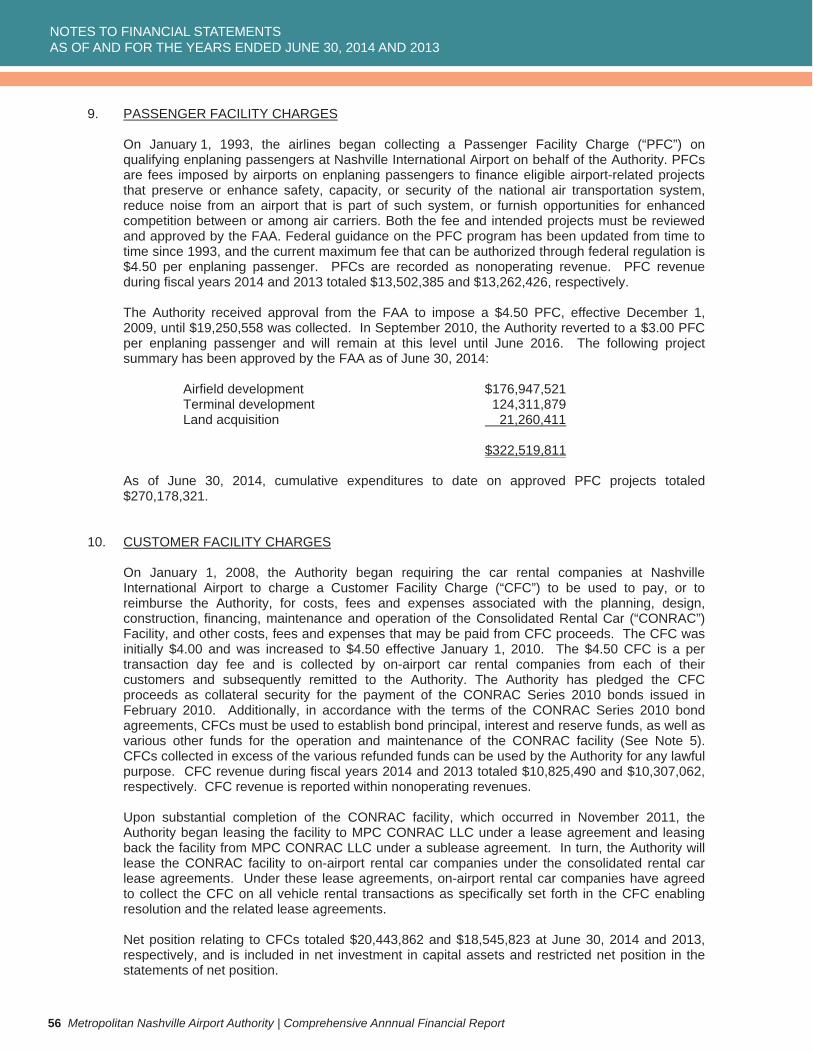
NOTES TO FINANCIAL STATEMENTSAS OF AND FOR THE YEARS ENDED JUNE 30, 2014 AND 2013
56 Metropolitan Nashville Airport Authority | Comprehensive Annnual Financial Report
9. PASSENGER FACILITY CHARGES
On January 1, 1993, the airlines began collecting a Passenger Facility Charge (“PFC”) on qualifying enplaning passengers at Nashville International Airport on behalf of the Authority. PFCs are fees imposed by airports on enplaning passengers to finance eligible airport-related projects that preserve or enhance safety, capacity, or security of the national air transportation system, reduce noise from an airport that is part of such system, or furnish opportunities for enhanced competition between or among air carriers. Both the fee and intended projects must be reviewed and approved by the FAA. Federal guidance on the PFC program has been updated from time to time since 1993, and the current maximum fee that can be authorized through federal regulation is $4.50 per enplaning passenger. PFCs are recorded as nonoperating revenue. PFC revenue during fiscal years 2014 and 2013 totaled $13,502,385 and $13,262,426, respectively.
The Authority received approval from the FAA to impose a $4.50 PFC, effective December 1, 2009, until $19,250,558 was collected. In September 2010, the Authority reverted to a $3.00 PFC per enplaning passenger and will remain at this level until June 2016. The following project summary has been approved by the FAA as of June 30, 2014:
Airfield development $176,947,521 Terminal development 124,311,879 Land acquisition 21,260,411
$322,519,811
As of June 30, 2014, cumulative expenditures to date on approved PFC projects totaled $270,178,321.
10. CUSTOMER FACILITY CHARGES
On January 1, 2008, the Authority began requiring the car rental companies at Nashville International Airport to charge a Customer Facility Charge (“CFC”) to be used to pay, or to reimburse the Authority, for costs, fees and expenses associated with the planning, design, construction, financing, maintenance and operation of the Consolidated Rental Car (“CONRAC”) Facility, and other costs, fees and expenses that may be paid from CFC proceeds. The CFC was initially $4.00 and was increased to $4.50 effective January 1, 2010. The $4.50 CFC is a per transaction day fee and is collected by on-airport car rental companies from each of their customers and subsequently remitted to the Authority. The Authority has pledged the CFC proceeds as collateral security for the payment of the CONRAC Series 2010 bonds issued in February 2010. Additionally, in accordance with the terms of the CONRAC Series 2010 bond agreements, CFCs must be used to establish bond principal, interest and reserve funds, as well as various other funds for the operation and maintenance of the CONRAC facility (See Note 5). CFCs collected in excess of the various refunded funds can be used by the Authority for any lawful purpose. CFC revenue during fiscal years 2014 and 2013 totaled $10,825,490 and $10,307,062, respectively. CFC revenue is reported within nonoperating revenues.
Upon substantial completion of the CONRAC facility, which occurred in November 2011, the Authority began leasing the facility to MPC CONRAC LLC under a lease agreement and leasing back the facility from MPC CONRAC LLC under a sublease agreement. In turn, the Authority will lease the CONRAC facility to on-airport rental car companies under the consolidated rental car lease agreements. Under these lease agreements, on-airport rental car companies have agreed to collect the CFC on all vehicle rental transactions as specifically set forth in the CFC enabling resolution and the related lease agreements.
Net position relating to CFCs totaled $20,443,862 and $18,545,823 at June 30, 2014 and 2013, respectively, and is included in net investment in capital assets and restricted net position in the statements of net position.
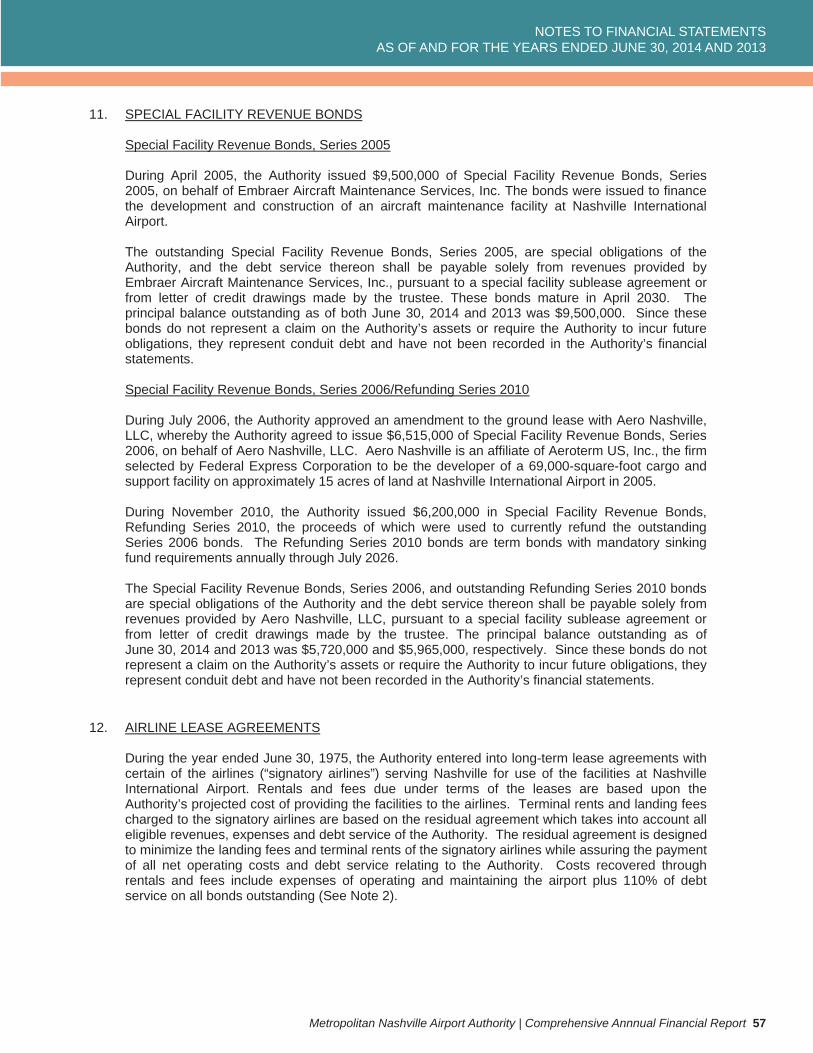
NOTES TO FINANCIAL STATEMENTSAS OF AND FOR THE YEARS ENDED JUNE 30, 2014 AND 2013
Metropolitan Nashville Airport Authority | Comprehensive Annnual Financial Report 57
11. SPECIAL FACILITY REVENUE BONDS
Special Facility Revenue Bonds, Series 2005
During April 2005, the Authority issued $9,500,000 of Special Facility Revenue Bonds, Series 2005, on behalf of Embraer Aircraft Maintenance Services, Inc. The bonds were issued to finance the development and construction of an aircraft maintenance facility at Nashville International Airport.
The outstanding Special Facility Revenue Bonds, Series 2005, are special obligations of the Authority, and the debt service thereon shall be payable solely from revenues provided by Embraer Aircraft Maintenance Services, Inc., pursuant to a special facility sublease agreement or from letter of credit drawings made by the trustee. These bonds mature in April 2030. The principal balance outstanding as of both June 30, 2014 and 2013 was $9,500,000. Since these bonds do not represent a claim on the Authority’s assets or require the Authority to incur future obligations, they represent conduit debt and have not been recorded in the Authority’s financial statements.
Special Facility Revenue Bonds, Series 2006/Refunding Series 2010
During July 2006, the Authority approved an amendment to the ground lease with Aero Nashville, LLC, whereby the Authority agreed to issue $6,515,000 of Special Facility Revenue Bonds, Series 2006, on behalf of Aero Nashville, LLC. Aero Nashville is an affiliate of Aeroterm US, Inc., the firm selected by Federal Express Corporation to be the developer of a 69,000-square-foot cargo and support facility on approximately 15 acres of land at Nashville International Airport in 2005.
During November 2010, the Authority issued $6,200,000 in Special Facility Revenue Bonds, Refunding Series 2010, the proceeds of which were used to currently refund the outstanding Series 2006 bonds. The Refunding Series 2010 bonds are term bonds with mandatory sinking fund requirements annually through July 2026.
The Special Facility Revenue Bonds, Series 2006, and outstanding Refunding Series 2010 bonds are special obligations of the Authority and the debt service thereon shall be payable solely from revenues provided by Aero Nashville, LLC, pursuant to a special facility sublease agreement or from letter of credit drawings made by the trustee. The principal balance outstanding as of June 30, 2014 and 2013 was $5,720,000 and $5,965,000, respectively. Since these bonds do not represent a claim on the Authority’s assets or require the Authority to incur future obligations, they represent conduit debt and have not been recorded in the Authority’s financial statements.
12. AIRLINE LEASE AGREEMENTS
During the year ended June 30, 1975, the Authority entered into long-term lease agreements with certain of the airlines (“signatory airlines”) serving Nashville for use of the facilities at Nashville International Airport. Rentals and fees due under terms of the leases are based upon the Authority’s projected cost of providing the facilities to the airlines. Terminal rents and landing fees charged to the signatory airlines are based on the residual agreement which takes into account all eligible revenues, expenses and debt service of the Authority. The residual agreement is designed to minimize the landing fees and terminal rents of the signatory airlines while assuring the payment of all net operating costs and debt service relating to the Authority. Costs recovered through rentals and fees include expenses of operating and maintaining the airport plus 110% of debt service on all bonds outstanding (See Note 2).
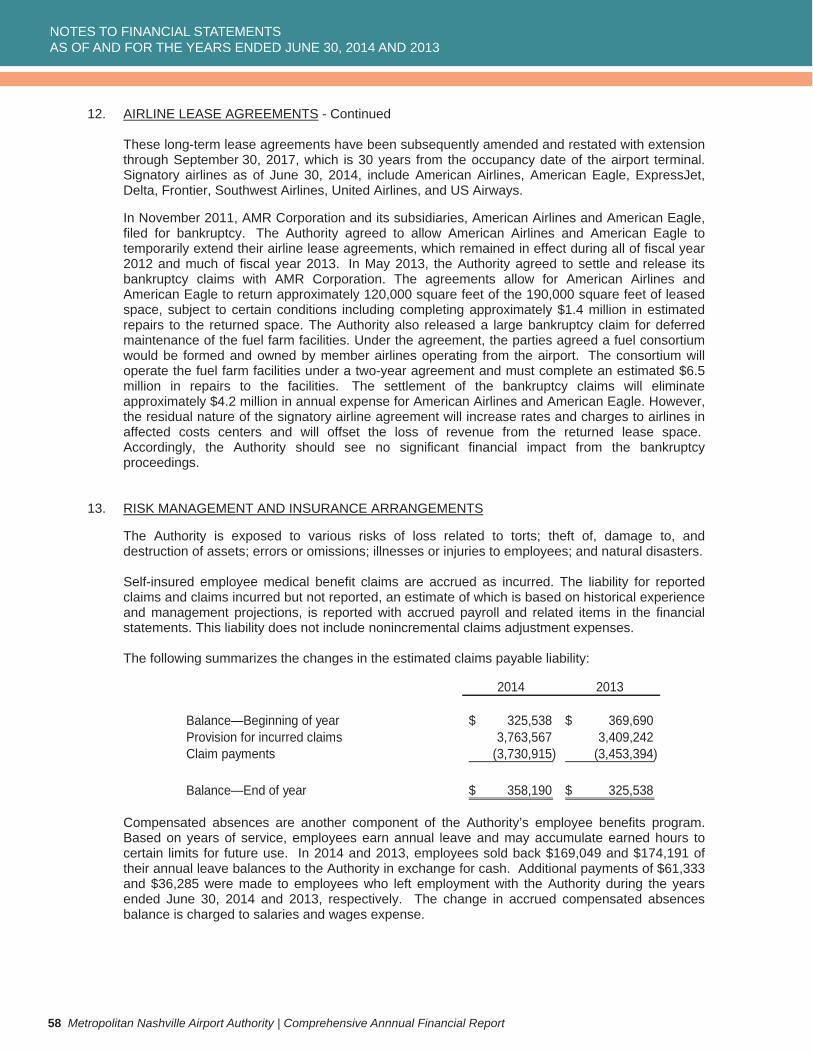
NOTES TO FINANCIAL STATEMENTSAS OF AND FOR THE YEARS ENDED JUNE 30, 2014 AND 2013
58 Metropolitan Nashville Airport Authority | Comprehensive Annnual Financial Report
12. AIRLINE LEASE AGREEMENTS - Continued
These long-term lease agreements have been subsequently amended and restated with extension through September 30, 2017, which is 30 years from the occupancy date of the airport terminal. Signatory airlines as of June 30, 2014, include American Airlines, American Eagle, ExpressJet, Delta, Frontier, Southwest Airlines, United Airlines, and US Airways.
In November 2011, AMR Corporation and its subsidiaries, American Airlines and American Eagle, filed for bankruptcy. The Authority agreed to allow American Airlines and American Eagle to temporarily extend their airline lease agreements, which remained in effect during all of fiscal year 2012 and much of fiscal year 2013. In May 2013, the Authority agreed to settle and release its bankruptcy claims with AMR Corporation. The agreements allow for American Airlines and American Eagle to return approximately 120,000 square feet of the 190,000 square feet of leased space, subject to certain conditions including completing approximately $1.4 million in estimated repairs to the returned space. The Authority also released a large bankruptcy claim for deferred maintenance of the fuel farm facilities. Under the agreement, the parties agreed a fuel consortium would be formed and owned by member airlines operating from the airport. The consortium will operate the fuel farm facilities under a two-year agreement and must complete an estimated $6.5 million in repairs to the facilities. The settlement of the bankruptcy claims will eliminate approximately $4.2 million in annual expense for American Airlines and American Eagle. However, the residual nature of the signatory airline agreement will increase rates and charges to airlines in affected costs centers and will offset the loss of revenue from the returned lease space. Accordingly, the Authority should see no significant financial impact from the bankruptcy proceedings.
13. RISK MANAGEMENT AND INSURANCE ARRANGEMENTS
The Authority is exposed to various risks of loss related to torts; theft of, damage to, and destruction of assets; errors or omissions; illnesses or injuries to employees; and natural disasters.
Self-insured employee medical benefit claims are accrued as incurred. The liability for reported claims and claims incurred but not reported, an estimate of which is based on historical experience and management projections, is reported with accrued payroll and related items in the financial statements. This liability does not include nonincremental claims adjustment expenses.
The following summarizes the changes in the estimated claims payable liability:
2014 2013
Balance—Beginning of year 325,538$ 369,690$ Provision for incurred claims 3,763,567 3,409,242 Claim payments (3,730,915) (3,453,394)
Balance—End of year 358,190$ 325,538$
Compensated absences are another component of the Authority’s employee benefits program. Based on years of service, employees earn annual leave and may accumulate earned hours to certain limits for future use. In 2014 and 2013, employees sold back $169,049 and $174,191 of their annual leave balances to the Authority in exchange for cash. Additional payments of $61,333 and $36,285 were made to employees who left employment with the Authority during the years ended June 30, 2014 and 2013, respectively. The change in accrued compensated absences balance is charged to salaries and wages expense.
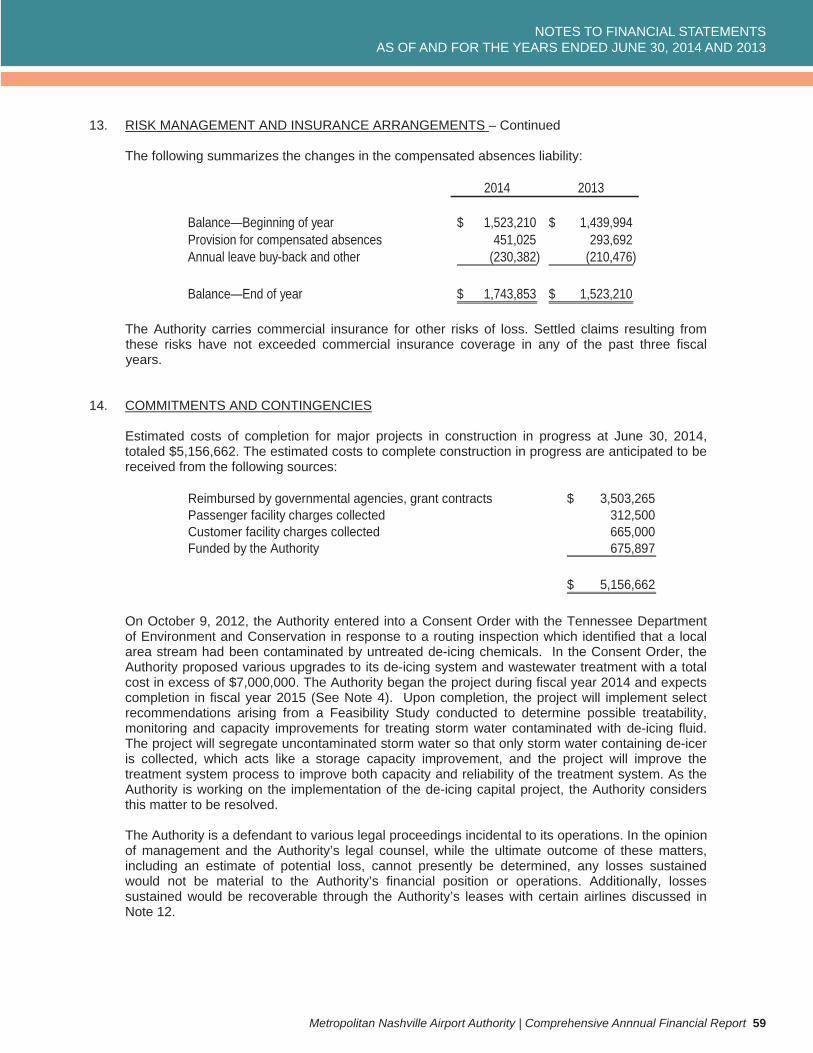
NOTES TO FINANCIAL STATEMENTSAS OF AND FOR THE YEARS ENDED JUNE 30, 2014 AND 2013
Metropolitan Nashville Airport Authority | Comprehensive Annnual Financial Report 59
13. RISK MANAGEMENT AND INSURANCE ARRANGEMENTS – Continued
The following summarizes the changes in the compensated absences liability:
2014 2013
Balance—Beginning of year 1,523,210$ 1,439,994$ Provision for compensated absences 451,025 293,692 Annual leave buy-back and other (230,382) (210,476)
Balance—End of year 1,743,853$ 1,523,210$
The Authority carries commercial insurance for other risks of loss. Settled claims resulting from these risks have not exceeded commercial insurance coverage in any of the past three fiscal years.
14. COMMITMENTS AND CONTINGENCIES
Estimated costs of completion for major projects in construction in progress at June 30, 2014, totaled $5,156,662. The estimated costs to complete construction in progress are anticipated to be received from the following sources:
Reimbursed by governmental agencies, grant contracts 3,503,265$ Passenger facility charges collected 312,500 Customer facility charges collected 665,000 Funded by the Authority 675,897
5,156,662$
On October 9, 2012, the Authority entered into a Consent Order with the Tennessee Department of Environment and Conservation in response to a routing inspection which identified that a local area stream had been contaminated by untreated de-icing chemicals. In the Consent Order, the Authority proposed various upgrades to its de-icing system and wastewater treatment with a total cost in excess of $7,000,000. The Authority began the project during fiscal year 2014 and expects completion in fiscal year 2015 (See Note 4). Upon completion, the project will implement select recommendations arising from a Feasibility Study conducted to determine possible treatability, monitoring and capacity improvements for treating storm water contaminated with de-icing fluid. The project will segregate uncontaminated storm water so that only storm water containing de-icer is collected, which acts like a storage capacity improvement, and the project will improve the treatment system process to improve both capacity and reliability of the treatment system. As the Authority is working on the implementation of the de-icing capital project, the Authority considers this matter to be resolved.
The Authority is a defendant to various legal proceedings incidental to its operations. In the opinion of management and the Authority’s legal counsel, while the ultimate outcome of these matters, including an estimate of potential loss, cannot presently be determined, any losses sustained would not be material to the Authority’s financial position or operations. Additionally, losses sustained would be recoverable through the Authority’s leases with certain airlines discussed in Note 12.
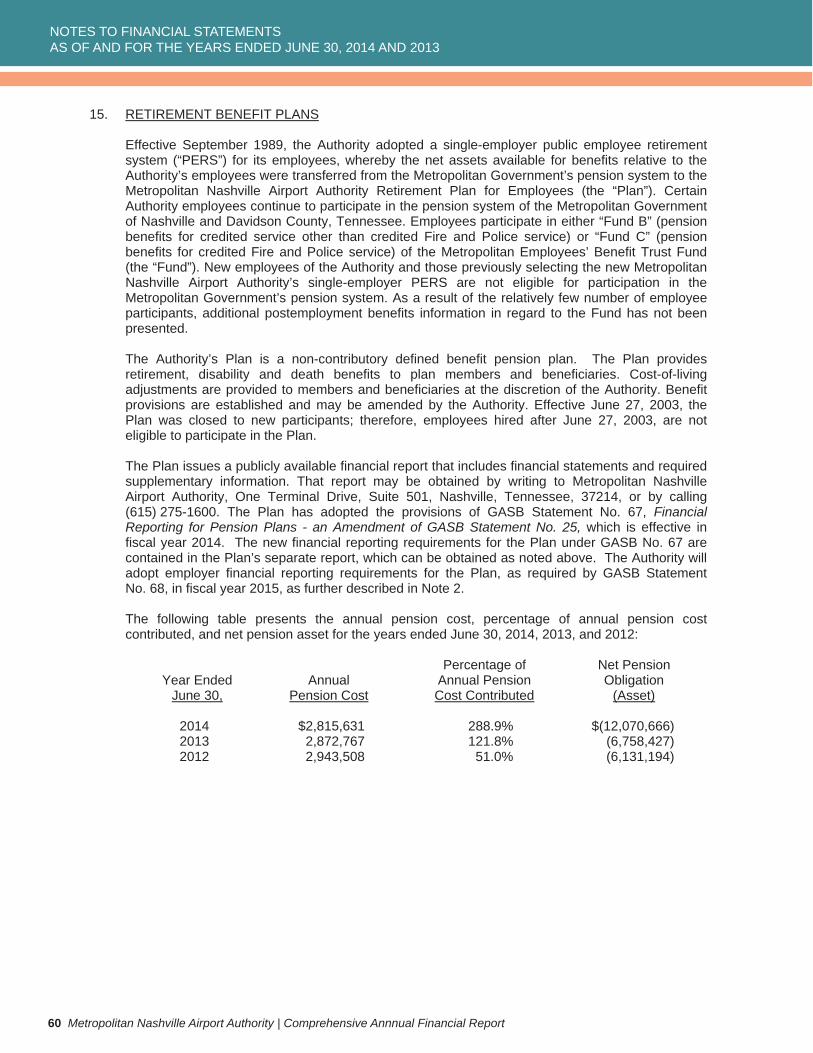
NOTES TO FINANCIAL STATEMENTSAS OF AND FOR THE YEARS ENDED JUNE 30, 2014 AND 2013
60 Metropolitan Nashville Airport Authority | Comprehensive Annnual Financial Report
15. RETIREMENT BENEFIT PLANS
Effective September 1989, the Authority adopted a single-employer public employee retirement system (“PERS”) for its employees, whereby the net assets available for benefits relative to the Authority’s employees were transferred from the Metropolitan Government’s pension system to the Metropolitan Nashville Airport Authority Retirement Plan for Employees (the “Plan”). Certain Authority employees continue to participate in the pension system of the Metropolitan Government of Nashville and Davidson County, Tennessee. Employees participate in either “Fund B” (pension benefits for credited service other than credited Fire and Police service) or “Fund C” (pension benefits for credited Fire and Police service) of the Metropolitan Employees’ Benefit Trust Fund (the “Fund”). New employees of the Authority and those previously selecting the new Metropolitan Nashville Airport Authority’s single-employer PERS are not eligible for participation in the Metropolitan Government’s pension system. As a result of the relatively few number of employee participants, additional postemployment benefits information in regard to the Fund has not been presented.
The Authority’s Plan is a non-contributory defined benefit pension plan. The Plan provides retirement, disability and death benefits to plan members and beneficiaries. Cost-of-living adjustments are provided to members and beneficiaries at the discretion of the Authority. Benefit provisions are established and may be amended by the Authority. Effective June 27, 2003, the Plan was closed to new participants; therefore, employees hired after June 27, 2003, are not eligible to participate in the Plan.
The Plan issues a publicly available financial report that includes financial statements and required supplementary information. That report may be obtained by writing to Metropolitan Nashville Airport Authority, One Terminal Drive, Suite 501, Nashville, Tennessee, 37214, or by calling (615) 275-1600. The Plan has adopted the provisions of GASB Statement No. 67, Financial Reporting for Pension Plans - an Amendment of GASB Statement No. 25, which is effective in fiscal year 2014. The new financial reporting requirements for the Plan under GASB No. 67 are contained in the Plan’s separate report, which can be obtained as noted above. The Authority will adopt employer financial reporting requirements for the Plan, as required by GASB Statement No. 68, in fiscal year 2015, as further described in Note 2.
The following table presents the annual pension cost, percentage of annual pension cost contributed, and net pension asset for the years ended June 30, 2014, 2013, and 2012:
Percentage of Net Pension Year Ended Annual Annual Pension Obligation June 30, Pension Cost Cost Contributed (Asset)
2014 $2,815,631 288.9% $(12,070,666) 2013 2,872,767 121.8% (6,758,427) 2012 2,943,508 51.0% (6,131,194)
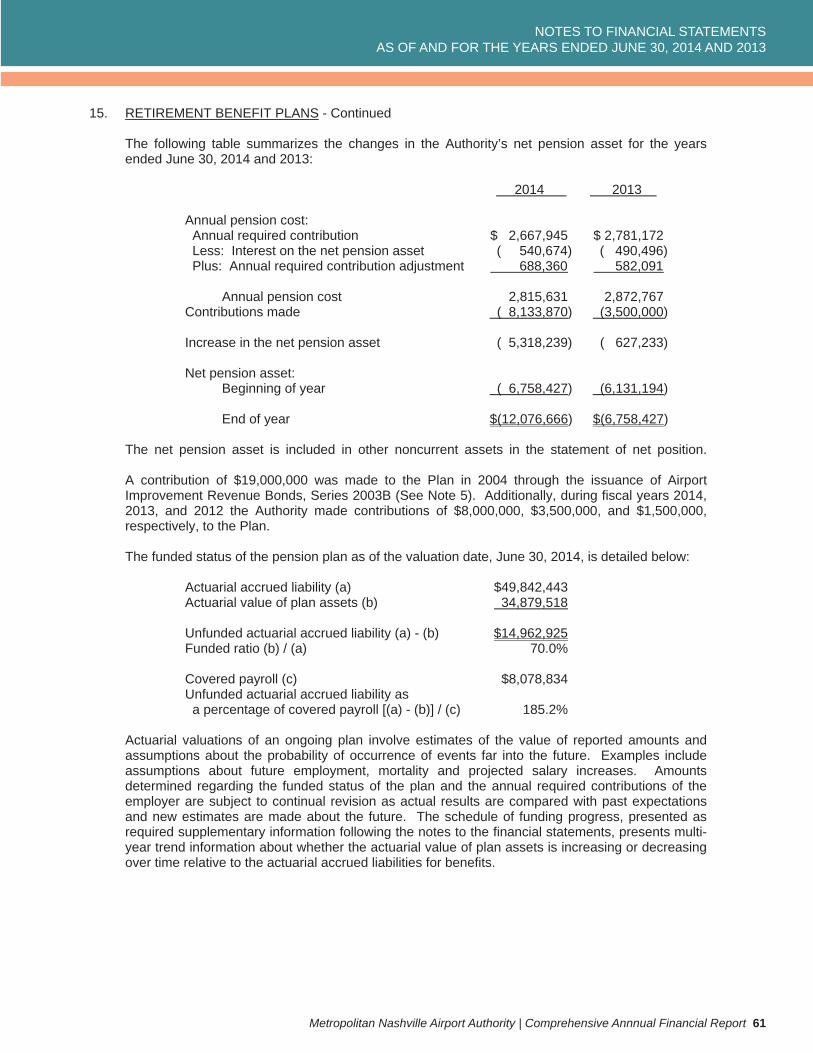
NOTES TO FINANCIAL STATEMENTSAS OF AND FOR THE YEARS ENDED JUNE 30, 2014 AND 2013
Metropolitan Nashville Airport Authority | Comprehensive Annnual Financial Report 61
15. RETIREMENT BENEFIT PLANS - Continued
The following table summarizes the changes in the Authority’s net pension asset for the years ended June 30, 2014 and 2013:
2014 2013
Annual pension cost: Annual required contribution $ 2,667,945 $ 2,781,172 Less: Interest on the net pension asset ( 540,674) ( 490,496) Plus: Annual required contribution adjustment 688,360 582,091
Annual pension cost 2,815,631 2,872,767 Contributions made ( 8,133,870) (3,500,000)
Increase in the net pension asset ( 5,318,239) ( 627,233)
Net pension asset: Beginning of year ( 6,758,427) (6,131,194)
End of year $(12,076,666) $(6,758,427)
The net pension asset is included in other noncurrent assets in the statement of net position.
A contribution of $19,000,000 was made to the Plan in 2004 through the issuance of Airport Improvement Revenue Bonds, Series 2003B (See Note 5). Additionally, during fiscal years 2014, 2013, and 2012 the Authority made contributions of $8,000,000, $3,500,000, and $1,500,000, respectively, to the Plan.
The funded status of the pension plan as of the valuation date, June 30, 2014, is detailed below:
Actuarial accrued liability (a) $49,842,443 Actuarial value of plan assets (b) 34,879,518
Unfunded actuarial accrued liability (a) - (b) $14,962,925 Funded ratio (b) / (a) 70.0%
Covered payroll (c) $8,078,834 Unfunded actuarial accrued liability as a percentage of covered payroll [(a) - (b)] / (c) 185.2%
Actuarial valuations of an ongoing plan involve estimates of the value of reported amounts and assumptions about the probability of occurrence of events far into the future. Examples include assumptions about future employment, mortality and projected salary increases. Amounts determined regarding the funded status of the plan and the annual required contributions of the employer are subject to continual revision as actual results are compared with past expectations and new estimates are made about the future. The schedule of funding progress, presented as required supplementary information following the notes to the financial statements, presents multi-year trend information about whether the actuarial value of plan assets is increasing or decreasing over time relative to the actuarial accrued liabilities for benefits.
NOTES TO FINANCIAL STATEMENTSAS OF AND FOR THE YEARS ENDED JUNE 30, 2014 AND 2013
62 Metropolitan Nashville Airport Authority | Comprehensive Annnual Financial Report
15. RETIREMENT BENEFIT PLANS - Continued
Significant actuarial methods and assumptions as of the June 30, 2014 actuarial valuation are detailed below:
Actuarial valuation method Entry age normal Amortization method Level dollar closed over 20 years Discount rate 8.0% Asset valuation method 3-year weighted average of asset gains and losses Rate of investment return 8.0% per annum for funding purposes Projected inflation 2.25% Cost-of-living adjustments None in the current year Salary increases 4% per annum, compounded annually
The actuarial valuation method was changed to the entry age normal method for the 2014 valuation. The previous method used was the projected unit credit method.
See further information in the Pension Plan Schedule of Funding Progress (unaudited) in the required supplementary information section.
16. OTHER POSTEMPLOYMENT BENEFITS (OPEB)
The Authority provides postemployment healthcare benefits to certain eligible employees who retire under either the Authority’s PERS or the Metropolitan Government’s PERS.
Under the Authority’s PERS, the Authority pays approximately 75% of the medical, dental, vision and prescription coverage cost, with retirees paying the remaining 25%. The Authority also pays 100% of the premium cost of a $10,000 life insurance policy on each retiree. In addition, the retirees have the option to pay 100% of the cost of supplemental life insurance coverage. Currently, 92 retirees and 65 retiree spouses are receiving benefits under the PERS. The monthly contribution requirements for participants in the Authority’s medical plan range from $4 (single “Core Wellness” premium) to $225 (family “Core Plus” premium). The plan was closed to new entrants on January 1, 2009. Therefore, any employee hired on or after this date is not eligible for any postemployment benefits through the Authority. The postemployment benefit plan does not issue separate financial statements.
The Authority’s annual OPEB cost, percentage of annual OPEB cost contributed, and the net OPEB obligation for 2014, 2013, and 2012 are as follows:
Year Ended Percentage of Annual Net OPEB
June 30, Annual OPEB Cost OPEB Cost Contributed Obligation
2014 $4,089,602 75.0% $26,459,177 2013 6,365,995 37.0% 25,438,752 2012 6,597,967 29.7% 21,427,297
NOTES TO FINANCIAL STATEMENTSAS OF AND FOR THE YEARS ENDED JUNE 30, 2014 AND 2013
Metropolitan Nashville Airport Authority | Comprehensive Annnual Financial Report 63
16. OTHER POSTEMPLOYMENT BENEFITS (OPEB) - Continued
The following table summarizes the changes in the Authority’s OPEB obligation for the years ended June 30, 2014 and 2013:
2014 2013
Annual OPEB cost: Annual required contribution $4,514,609 $ 6,723,983 Plus: Interest on the net OPEB obligation 1,017,550 857,092 Less: Amortization on the net OPEB obligation (1,442,557) (1,215,080)
Annual OPEB cost 4,089,602 6,365,995 Contributions made (3,069,177) (2,354,540)
Increase in the net OPEB obligation 1,020,425 4,011,455
Net OPEB obligation: Beginning of year 25,438,752 21,427,297
End of year $26,459,177 $25,438,752
The Authority’s contributions to the OPEB Plan during fiscal years 2014 and 2013 totaled $3,069,177 and $2,354,540, respectively. The amount contributed during fiscal years 2014 and 2013 included $2,000,000 and $1,000,000, respectively, to an OPEB Trust to fund plan assets as further described below.
The funded status of the postemployment healthcare plan as of the actuarial valuation date, July 1, 2013, is detailed below:
Actuarial accrued liability (a) $42,543,287 Actuarial value of plan assets (b) 2,748,267
Unfunded actuarial accrued liability (a) - (b) $39,795,020 Funded ratio (b) / (a) 6.5%
Covered payroll (c) $15,188,052 Unfunded actuarial accrued liability as a percentage of covered payroll [(a) - (b)] / (c) 262.0%
On April 22, 2009, the Board of Commissioners approved MNAA Resolution 2009-07 establishing an investment trust for the purpose of funding OPEB as provided in Tennessee Code Annotated, Title 8, Chapter 50, Part 12. The Tennessee State Funding Board approved the formation of the trust on June 17, 2009. There is no obligation to fund the trust; however, management has a plan whereby cash contributions are intended to be made to help offset the anticipated increased outflows in future years to cover retiree benefits. As described above, the Authority made $2,000,000 and $1,000,000 in contributions to the OPEB Trust during fiscal years 2014 and 2013, respectively. These contributions have been considered in the actuarial valuations.
NOTES TO FINANCIAL STATEMENTSAS OF AND FOR THE YEARS ENDED JUNE 30, 2014 AND 2013
64 Metropolitan Nashville Airport Authority | Comprehensive Annnual Financial Report
16. OTHER POSTEMPLOYMENT BENEFITS (OPEB) - Continued
Actuarial valuations of an ongoing plan involve estimates of the value of reported amounts and assumptions about the probability of occurrence of events far into the future. Examples include assumptions about future employment, mortality and the healthcare cost trend. Amounts determined regarding the funded status of the plan and the annual required contributions of the employer are subject to continual revision as actual results are compared with past expectations and new estimates are made about the future. The schedule of funding progress, presented as required supplementary information following the notes to the financial statements, presents multi-year trend information about whether the actuarial value of plan assets is increasing or decreasing over time relative to the actuarial accrued liabilities for benefits.
Projections of benefits for financial reporting purposes are based on the substantive plan (the plan as understood by the employer and the plan members) and include the types of benefits provided at the time of each valuation and the historical pattern of sharing of benefit costs between the employer and plan members to that point. The actuarial methods and assumptions used include techniques that are designed to reduce the effects of short-term volatility in actuarial accrued liabilities and the actuarial value of assets, consistent with the long-term perspective of the calculations.
Significant actuarial methods and assumptions as of the July 1, 2013 actuarial valuation are detailed below:
Actuarial valuation method Entry age normal method Amortization method Level dollar open over 30 years Discount rate 4% Health care cost trend rate 8% grading to 5% over 6 years Inflation rate 4% Mortality RP-2000 Combined Mortality Table (Generational) Retirement rates Varying rates beginning with 5% at age 50 to 100% retirement at age 65
See further information in the OPEB Plan Schedule of Funding Progress (unaudited) in the required supplementary information section.
As part of the OPEB actuarial evaluation on July 1, 2013, which is effective for the Authority’s 2014 fiscal year, certain changes to the OPEB Plan were considered, including the following: The Authority has adopted an Employer Group Waiver Plan (“EGWP”) for post-65 retiree pharmacy benefits effective January 1, 2014. Additionally, the Authority has adopted a policy to coordinate with Medicare for Medicare-eligible participants. Those participants will be provided a subsidy to purchase coverage on an exchange. Accordingly, the OPEB Plan is assumed to be the primary plan of benefits prior to age 65 and secondary thereafter. In the July 1, 2014, valuation, for the Authority’s fiscal year 2015, these changes have reduced the anticipated actuarial accrued liability to $30,435,000.
Under the Metropolitan Government’s PERS, the Authority pays 75% of the cost of medical and dental coverage, while the retirees pay the remaining 25%. The Authority also pays 100% of the premium cost of a $10,000 life insurance policy on each retiree. As of June 30, 2014 and 2013, there were 18 and 17 retirees, respectively, receiving benefits under the PERS. During the years ended June 30, 2014 and 2013, payments of $61,769 and $41,073, respectively, were made to the Metropolitan Government for postemployment benefits under this PERS.
NOTES TO FINANCIAL STATEMENTSAS OF AND FOR THE YEARS ENDED JUNE 30, 2014 AND 2013
Metropolitan Nashville Airport Authority | Comprehensive Annnual Financial Report 65
17. DEFINED CONTRIBUTION PLANS
The Authority offers its employees a deferred compensation plan created in accordance with Internal Revenue Code Section 457. The plan, available to all Authority employees, permits the deferral of a portion of salary until future years. Participation in the plan is optional. The deferred compensation is not available to employees until termination, retirement, death or unforeseeable emergency. The assets of the plan are held in custodial and annuity accounts for the exclusive benefit of plan participants, and accordingly, the related assets of the plan are not reflected on the Authority’s statement of net position. Beginning January 1, 2001, the Authority’s matching contributions have been made to a deferred compensation plan created in accordance with Internal Revenue Code Section 401(a). Amounts contributed by the Authority to the deferred compensation plan were $853,395 and $753,167 in 2014 and 2013, respectively. Employees contributed $1,011,842 and $861,450 to the plan in 2014 and 2013, respectively, through payroll deductions.
During May 2013, the Board of Commissioners approved an additional 401(a) defined contribution retirement plan. Under this additional plan, the Authority contributed 10% of an employee’s base compensation on an annual basis. The new 401(a) plan is available only to employees hired after June 27, 2003, who do not participate in the Authority’s defined benefit pension plan described in Note 15. All contributions by the Authority are discretionary. Amounts contributed by the Authority to the deferred retirement compensation plan were $715,515 and $701,830 in 2014 and 2013, respectively.
18. LAND LEASES AND LAND OPTIONS
The Authority leases, or has entered into options to lease, several tracts of land to developers. The leases expire in 2058. In accordance with the terms of the lease agreements, the Authority received advance rental payments totaling $2,533,613. This amount is being amortized into income over the terms of the leases. The unamortized amount was $1,527,248 and $1,562,153 at June 30, 2014 and 2013, respectively, and is included in unearned income in the statements of net position. The buildings and any other improvements constructed on the land become the property of the Authority upon the expiration or termination of the leases.
19. MAJOR CUSTOMERS
The largest airline serving Nashville International Airport accounted for approximately 54.2% and 54.1% of the total enplanements of 5,311,799 and 5,037,975 for fiscal years 2014 and 2013, respectively.
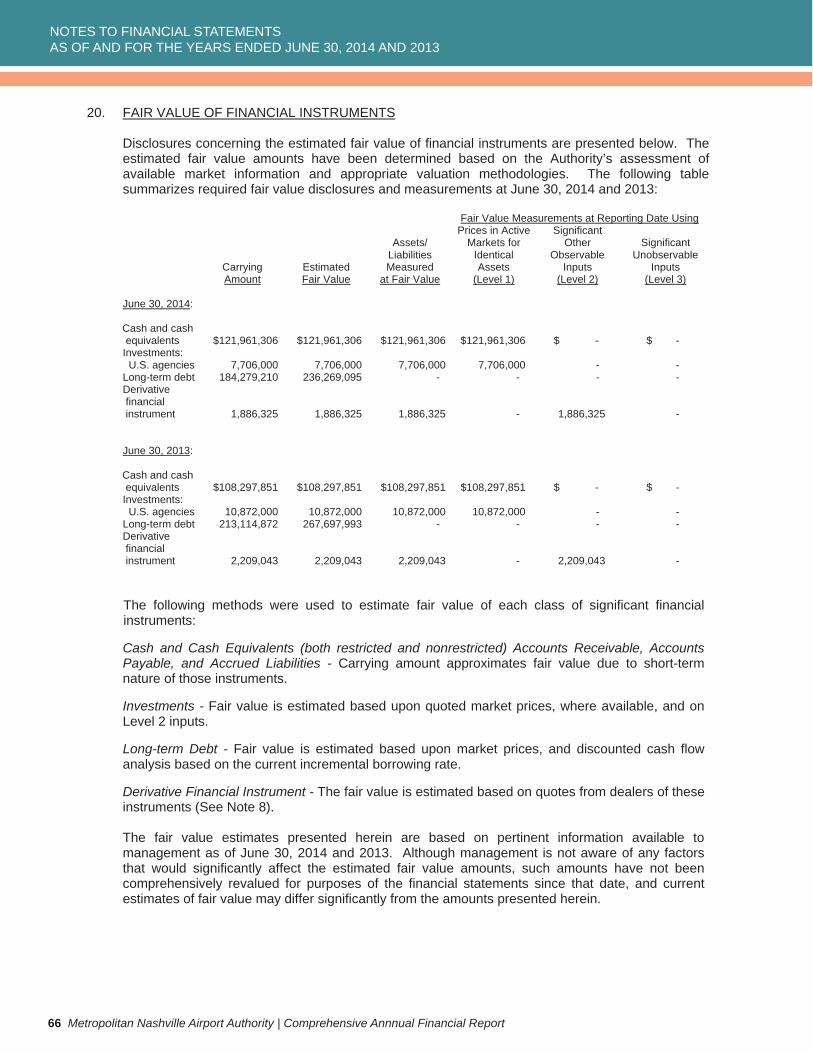
NOTES TO FINANCIAL STATEMENTSAS OF AND FOR THE YEARS ENDED JUNE 30, 2014 AND 2013
66 Metropolitan Nashville Airport Authority | Comprehensive Annnual Financial Report
20. FAIR VALUE OF FINANCIAL INSTRUMENTS
Disclosures concerning the estimated fair value of financial instruments are presented below. The estimated fair value amounts have been determined based on the Authority’s assessment of available market information and appropriate valuation methodologies. The following table summarizes required fair value disclosures and measurements at June 30, 2014 and 2013:
Fair Value Measurements at Reporting Date Using Prices in Active Significant Assets/ Markets for Other Significant Liabilities Identical Observable Unobservable Carrying Estimated Measured Assets Inputs Inputs Amount Fair Value at Fair Value (Level 1) (Level 2) (Level 3)
June 30, 2014:
Cash and cash equivalents $121,961,306 $121,961,306 $121,961,306 $121,961,306 $ - $ - Investments: U.S. agencies 7,706,000 7,706,000 7,706,000 7,706,000 - - Long-term debt 184,279,210 236,269,095 - - - - Derivative financial instrument 1,886,325 1,886,325 1,886,325 - 1,886,325 -
June 30, 2013:
Cash and cash equivalents $108,297,851 $108,297,851 $108,297,851 $108,297,851 $ - $ - Investments: U.S. agencies 10,872,000 10,872,000 10,872,000 10,872,000 - - Long-term debt 213,114,872 267,697,993 - - - - Derivative financial instrument 2,209,043 2,209,043 2,209,043 - 2,209,043 -
The following methods were used to estimate fair value of each class of significant financial instruments:
Cash and Cash Equivalents (both restricted and nonrestricted) Accounts Receivable, Accounts Payable, and Accrued Liabilities - Carrying amount approximates fair value due to short-term nature of those instruments.
Investments - Fair value is estimated based upon quoted market prices, where available, and on Level 2 inputs.
Long-term Debt - Fair value is estimated based upon market prices, and discounted cash flow analysis based on the current incremental borrowing rate.
Derivative Financial Instrument - The fair value is estimated based on quotes from dealers of these instruments (See Note 8).
The fair value estimates presented herein are based on pertinent information available to management as of June 30, 2014 and 2013. Although management is not aware of any factors that would significantly affect the estimated fair value amounts, such amounts have not been comprehensively revalued for purposes of the financial statements since that date, and current estimates of fair value may differ significantly from the amounts presented herein.
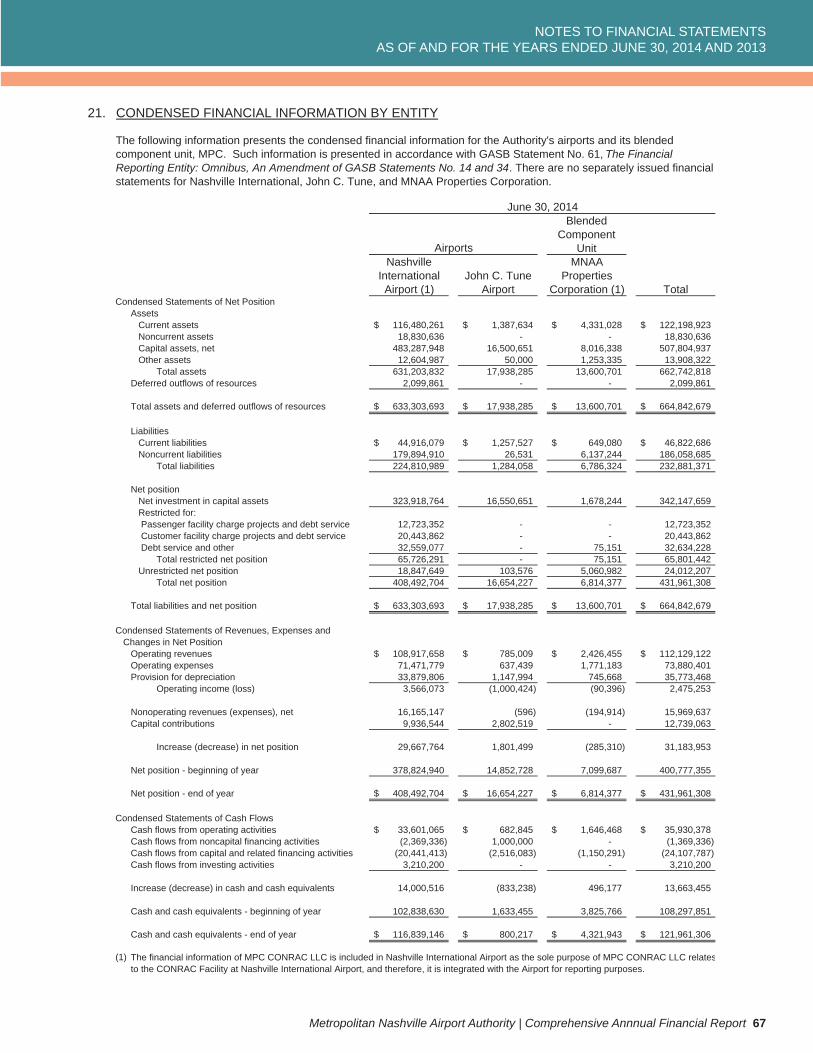
NOTES TO FINANCIAL STATEMENTSAS OF AND FOR THE YEARS ENDED JUNE 30, 2014 AND 2013
Metropolitan Nashville Airport Authority | Comprehensive Annnual Financial Report 67
21. CONDENSED FINANCIAL INFORMATION BY ENTITY
BlendedComponent
UnitNashville MNAA
International John C. Tune PropertiesAirport (1) Airport Corporation (1) Total
Condensed Statements of Net Position Assets
Current assets 116,480,261$ 1,387,634$ 4,331,028$ 122,198,923$ Noncurrent assets 18,830,636 - - 18,830,636 Capital assets, net 483,287,948 16,500,651 8,016,338 507,804,937 Other assets 12,604,987 50,000 1,253,335 13,908,322
Total assets 631,203,832 17,938,285 13,600,701 662,742,818 Deferred outflows of resources 2,099,861 - - 2,099,861
Total assets and deferred outflows of resources 633,303,693$ 17,938,285$ 13,600,701$ 664,842,679$
LiabilitiesCurrent liabilities 44,916,079$ 1,257,527$ 649,080$ 46,822,686$ Noncurrent liabilities 179,894,910 26,531 6,137,244 186,058,685
Total liabilities 224,810,989 1,284,058 6,786,324 232,881,371
Net position Net investment in capital assets 323,918,764 16,550,651 1,678,244 342,147,659 Restricted for: Passenger facility charge projects and debt service 12,723,352 - - 12,723,352 Customer facility charge projects and debt service 20,443,862 - - 20,443,862 Debt service and other 32,559,077 - 75,151 32,634,228 Total restricted net position 65,726,291 - 75,151 65,801,442 Unrestricted net position 18,847,649 103,576 5,060,982 24,012,207 Total net position 408,492,704 16,654,227 6,814,377 431,961,308
Total liabilities and net position 633,303,693$ 17,938,285$ 13,600,701$ 664,842,679$
Condensed Statements of Revenues, Expenses and Changes in Net Position
Operating revenues 108,917,658$ 785,009$ 2,426,455$ 112,129,122$ Operating expenses 71,471,779 637,439 1,771,183 73,880,401 Provision for depreciation 33,879,806 1,147,994 745,668 35,773,468 Operating income (loss) 3,566,073 (1,000,424) (90,396) 2,475,253
Nonoperating revenues (expenses), net 16,165,147 (596) (194,914) 15,969,637 Capital contributions 9,936,544 2,802,519 - 12,739,063
Increase (decrease) in net position 29,667,764 1,801,499 (285,310) 31,183,953
Net position - beginning of year 378,824,940 14,852,728 7,099,687 400,777,355
Net position - end of year 408,492,704$ 16,654,227$ 6,814,377$ 431,961,308$
Condensed Statements of Cash FlowsCash flows from operating activities 33,601,065$ 682,845$ 1,646,468$ 35,930,378$ Cash flows from noncapital financing activities (2,369,336) 1,000,000 - (1,369,336) Cash flows from capital and related financing activities (20,441,413) (2,516,083) (1,150,291) (24,107,787) Cash flows from investing activities 3,210,200 - - 3,210,200
Increase (decrease) in cash and cash equivalents 14,000,516 (833,238) 496,177 13,663,455
Cash and cash equivalents - beginning of year 102,838,630 1,633,455 3,825,766 108,297,851
Cash and cash equivalents - end of year 116,839,146$ 800,217$ 4,321,943$ 121,961,306$
(1) The financial information of MPC CONRAC LLC is included in Nashville International Airport as the sole purpose of MPC CONRAC LLC relatesto the CONRAC Facility at Nashville International Airport, and therefore, it is integrated with the Airport for reporting purposes.
June 30, 2014
The following information presents the condensed financial information for the Authority's airports and its blended component unit, MPC. Such information is presented in accordance with GASB Statement No. 61, The Financial Reporting Entity: Omnibus, An Amendment of GASB Statements No. 14 and 34. There are no separately issued financial statements for Nashville International, John C. Tune, and MNAA Properties Corporation.
Airports
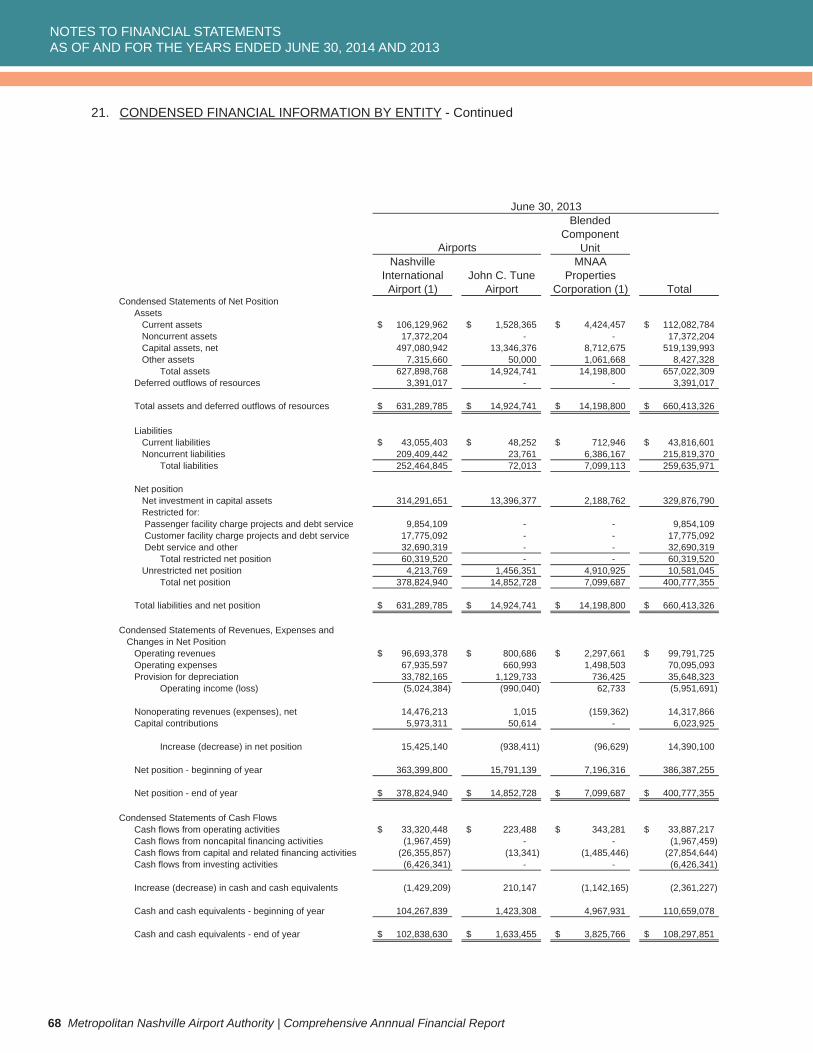
NOTES TO FINANCIAL STATEMENTSAS OF AND FOR THE YEARS ENDED JUNE 30, 2014 AND 2013
68 Metropolitan Nashville Airport Authority | Comprehensive Annnual Financial Report
21. CONDENSED FINANCIAL INFORMATION BY ENTITY - Continued
BlendedComponent
UnitNashville MNAA
International John C. Tune PropertiesAirport (1) Airport Corporation (1) Total
Condensed Statements of Net Position Assets
Current assets 106,129,962$ 1,528,365$ 4,424,457$ 112,082,784$ Noncurrent assets 17,372,204 - - 17,372,204 Capital assets, net 497,080,942 13,346,376 8,712,675 519,139,993 Other assets 7,315,660 50,000 1,061,668 8,427,328
Total assets 627,898,768 14,924,741 14,198,800 657,022,309 Deferred outflows of resources 3,391,017 - - 3,391,017
Total assets and deferred outflows of resources 631,289,785$ 14,924,741$ 14,198,800$ 660,413,326$
LiabilitiesCurrent liabilities 43,055,403$ 48,252$ 712,946$ 43,816,601$ Noncurrent liabilities 209,409,442 23,761 6,386,167 215,819,370
Total liabilities 252,464,845 72,013 7,099,113 259,635,971
Net position Net investment in capital assets 314,291,651 13,396,377 2,188,762 329,876,790 Restricted for: Passenger facility charge projects and debt service 9,854,109 - - 9,854,109 Customer facility charge projects and debt service 17,775,092 - - 17,775,092 Debt service and other 32,690,319 - - 32,690,319 Total restricted net position 60,319,520 - - 60,319,520 Unrestricted net position 4,213,769 1,456,351 4,910,925 10,581,045 Total net position 378,824,940 14,852,728 7,099,687 400,777,355
Total liabilities and net position 631,289,785$ 14,924,741$ 14,198,800$ 660,413,326$
Condensed Statements of Revenues, Expenses and Changes in Net Position
Operating revenues 96,693,378$ 800,686$ 2,297,661$ 99,791,725$ Operating expenses 67,935,597 660,993 1,498,503 70,095,093 Provision for depreciation 33,782,165 1,129,733 736,425 35,648,323 Operating income (loss) (5,024,384) (990,040) 62,733 (5,951,691)
Nonoperating revenues (expenses), net 14,476,213 1,015 (159,362) 14,317,866 Capital contributions 5,973,311 50,614 - 6,023,925
Increase (decrease) in net position 15,425,140 (938,411) (96,629) 14,390,100
Net position - beginning of year 363,399,800 15,791,139 7,196,316 386,387,255
Net position - end of year 378,824,940$ 14,852,728$ 7,099,687$ 400,777,355$
Condensed Statements of Cash FlowsCash flows from operating activities 33,320,448$ 223,488$ 343,281$ 33,887,217$ Cash flows from noncapital financing activities (1,967,459) - - (1,967,459) Cash flows from capital and related financing activities (26,355,857) (13,341) (1,485,446) (27,854,644) Cash flows from investing activities (6,426,341) - - (6,426,341)
Increase (decrease) in cash and cash equivalents (1,429,209) 210,147 (1,142,165) (2,361,227)
Cash and cash equivalents - beginning of year 104,267,839 1,423,308 4,967,931 110,659,078
Cash and cash equivalents - end of year 102,838,630$ 1,633,455$ 3,825,766$ 108,297,851$
June 30, 2013
Airports
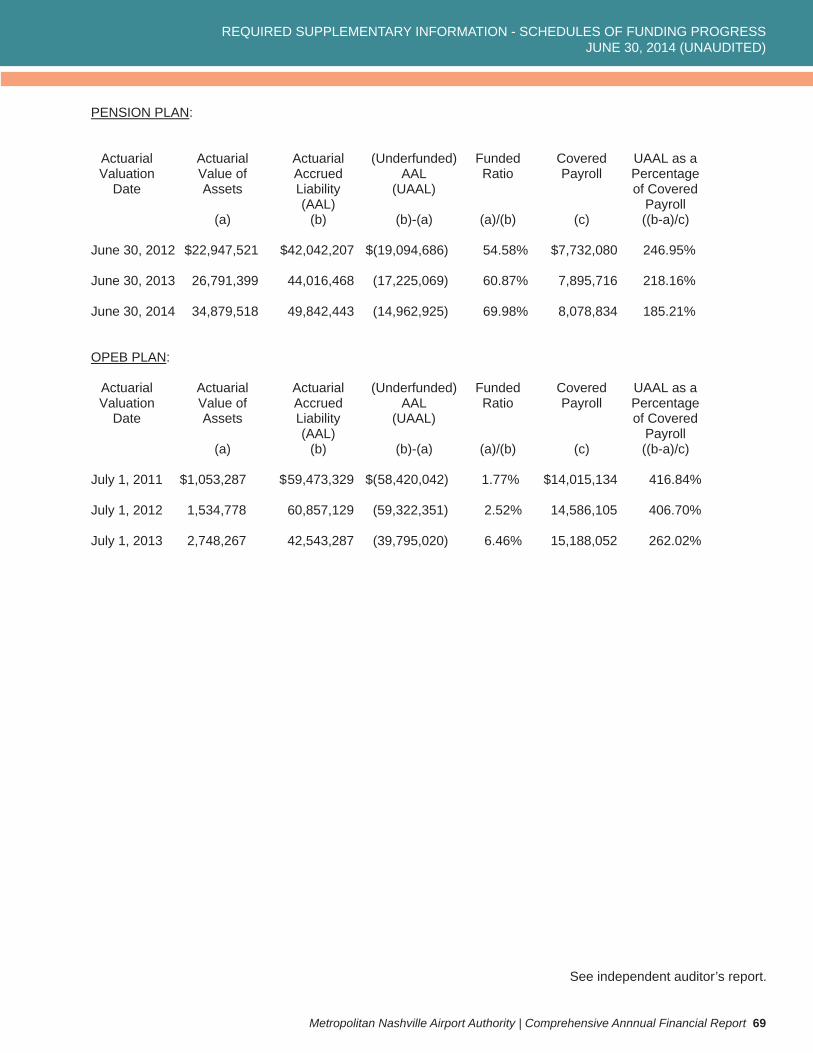
REQUIRED SUPPLEMENTARY INFORMATION - SCHEDULES OF FUNDING PROGRESSJUNE 30, 2014 (UNAUDITED)
Metropolitan Nashville Airport Authority | Comprehensive Annnual Financial Report 69
See independent auditor’s report.
PENSION PLAN:
Actuarial Actuarial Actuarial (Underfunded) Funded Covered UAAL as a Valuation Value of Accrued AAL Ratio Payroll Percentage Date Assets Liability (UAAL) of Covered (AAL) Payroll (a) (b) (b)-(a) (a)/(b) (c) ((b-a)/c)
June 30, 2012 $22,947,521 $42,042,207 $(19,094,686) 54.58% $7,732,080 246.95%
June 30, 2013 26,791,399 44,016,468 (17,225,069) 60.87% 7,895,716 218.16%
June 30, 2014 34,879,518 49,842,443 (14,962,925) 69.98% 8,078,834 185.21%
OPEB PLAN:
Actuarial Actuarial Actuarial (Underfunded) Funded Covered UAAL as a Valuation Value of Accrued AAL Ratio Payroll Percentage Date Assets Liability (UAAL) of Covered (AAL) Payroll (a) (b) (b)-(a) (a)/(b) (c) ((b-a)/c)
July 1, 2011 $1,053,287 $ 59,473,329 $(58,420,042) 1.77% $14,015,134 416.84%
July 1, 2012 1,534,778 60,857,129 (59,322,351) 2.52% 14,586,105 406.70%
July 1, 2013 2,748,267 42,543,287 (39,795,020) 6.46% 15,188,052 262.02%


Other InformationMetropolitan Nashville Airport Authority | Comprehensive Annual Financial Report
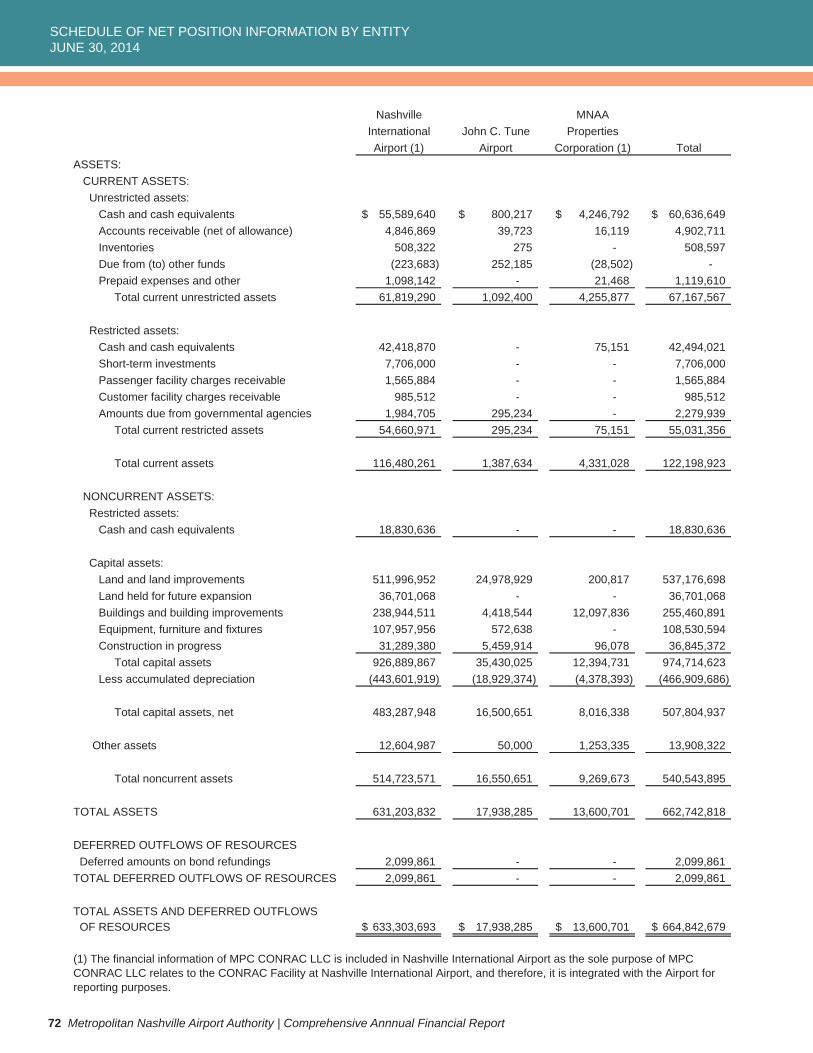
SCHEDULE OF NET POSITION INFORMATION BY ENTITYJUNE 30, 2014
72 Metropolitan Nashville Airport Authority | Comprehensive Annnual Financial Report
Nashville MNAAInternational John C. Tune PropertiesAirport (1) Airport Corporation (1) Total
ASSETS:CURRENT ASSETS: Unrestricted assets: Cash and cash equivalents 55,589,640$ 800,217$ 4,246,792$ 60,636,649$ Accounts receivable (net of allowance) 4,846,869 39,723 16,119 4,902,711 Inventories 508,322 275 - 508,597 Due from (to) other funds (223,683) 252,185 (28,502) - Prepaid expenses and other 1,098,142 - 21,468 1,119,610 Total current unrestricted assets 61,819,290 1,092,400 4,255,877 67,167,567
Restricted assets: Cash and cash equivalents 42,418,870 - 75,151 42,494,021 Short-term investments 7,706,000 - - 7,706,000 Passenger facility charges receivable 1,565,884 - - 1,565,884 Customer facility charges receivable 985,512 - - 985,512 Amounts due from governmental agencies 1,984,705 295,234 - 2,279,939 Total current restricted assets 54,660,971 295,234 75,151 55,031,356
Total current assets 116,480,261 1,387,634 4,331,028 122,198,923
NONCURRENT ASSETS: Restricted assets: Cash and cash equivalents 18,830,636 - - 18,830,636
Capital assets: Land and land improvements 511,996,952 24,978,929 200,817 537,176,698 Land held for future expansion 36,701,068 - - 36,701,068 Buildings and building improvements 238,944,511 4,418,544 12,097,836 255,460,891 Equipment, furniture and fixtures 107,957,956 572,638 - 108,530,594 Construction in progress 31,289,380 5,459,914 96,078 36,845,372 Total capital assets 926,889,867 35,430,025 12,394,731 974,714,623 Less accumulated depreciation (443,601,919) (18,929,374) (4,378,393) (466,909,686)
Total capital assets, net 483,287,948 16,500,651 8,016,338 507,804,937
Other assets 12,604,987 50,000 1,253,335 13,908,322
Total noncurrent assets 514,723,571 16,550,651 9,269,673 540,543,895
TOTAL ASSETS 631,203,832 17,938,285 13,600,701 662,742,818
DEFERRED OUTFLOWS OF RESOURCES Deferred amounts on bond refundings 2,099,861 - - 2,099,861 TOTAL DEFERRED OUTFLOWS OF RESOURCES 2,099,861 - - 2,099,861
TOTAL ASSETS AND DEFERRED OUTFLOWS OF RESOURCES 633,303,693$ 17,938,285$ 13,600,701$ 664,842,679$
(1) The financial information of MPC CONRAC LLC is included in Nashville International Airport as the sole purpose of MPC CONRAC LLC relates to the CONRAC Facility at Nashville International Airport, and therefore, it is integrated with the Airport forreporting purposes.
- 57 -
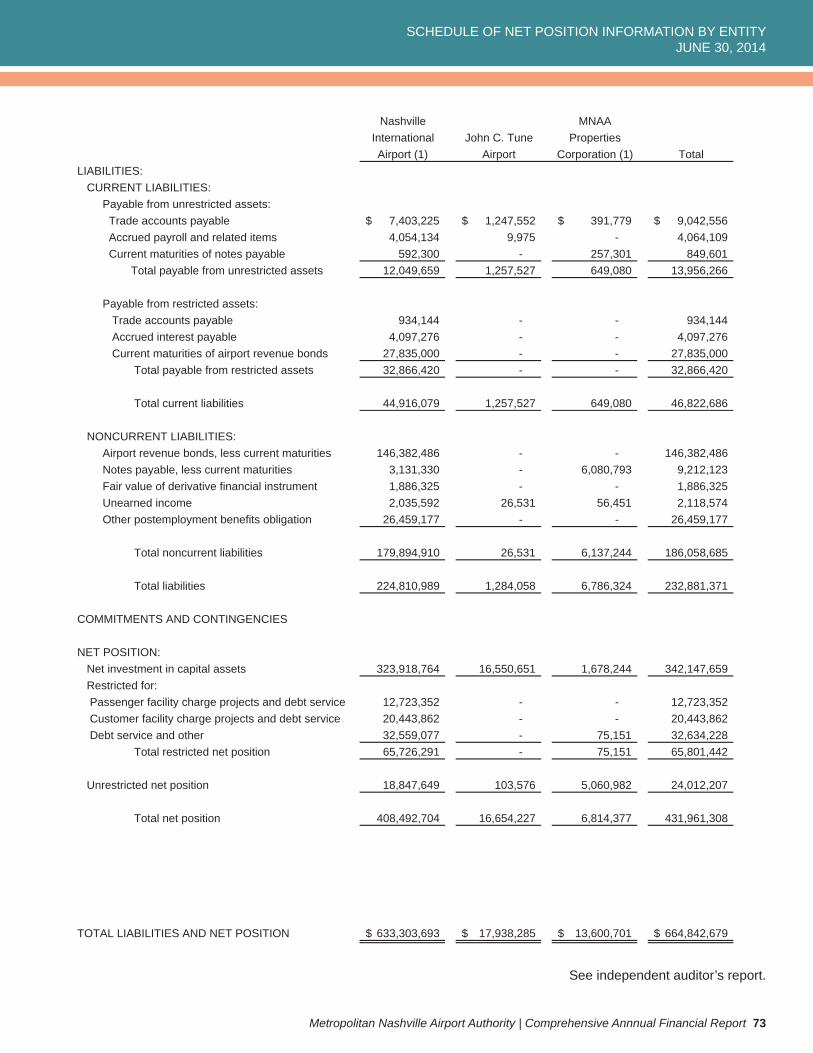
SCHEDULE OF NET POSITION INFORMATION BY ENTITYJUNE 30, 2014
Metropolitan Nashville Airport Authority | Comprehensive Annnual Financial Report 73
Nashville MNAAInternational John C. Tune PropertiesAirport (1) Airport Corporation (1) Total
LIABILITIES:CURRENT LIABILITIES: Payable from unrestricted assets: Trade accounts payable 7,403,225$ 1,247,552$ 391,779$ 9,042,556$ Accrued payroll and related items 4,054,134 9,975 - 4,064,109 Current maturities of notes payable 592,300 - 257,301 849,601 Total payable from unrestricted assets 12,049,659 1,257,527 649,080 13,956,266
Payable from restricted assets: Trade accounts payable 934,144 - - 934,144 Accrued interest payable 4,097,276 - - 4,097,276 Current maturities of airport revenue bonds 27,835,000 - - 27,835,000 Total payable from restricted assets 32,866,420 - - 32,866,420
Total current liabilities 44,916,079 1,257,527 649,080 46,822,686
NONCURRENT LIABILITIES: Airport revenue bonds, less current maturities 146,382,486 - - 146,382,486 Notes payable, less current maturities 3,131,330 - 6,080,793 9,212,123 Fair value of derivative financial instrument 1,886,325 - - 1,886,325 Unearned income 2,035,592 26,531 56,451 2,118,574 Other postemployment benefits obligation 26,459,177 - - 26,459,177
Total noncurrent liabilities 179,894,910 26,531 6,137,244 186,058,685
Total liabilities 224,810,989 1,284,058 6,786,324 232,881,371
COMMITMENTS AND CONTINGENCIES - - - -
NET POSITION: Net investment in capital assets 323,918,764 16,550,651 1,678,244 342,147,659 Restricted for: Passenger facility charge projects and debt service 12,723,352 - - 12,723,352 Customer facility charge projects and debt service 20,443,862 - - 20,443,862 Debt service and other 32,559,077 - 75,151 32,634,228
Total restricted net position 65,726,291 - 75,151 65,801,442
Unrestricted net position 18,847,649 103,576 5,060,982 24,012,207
Total net position 408,492,704 16,654,227 6,814,377 431,961,308
TOTAL LIABILITIES AND NET POSITION 633,303,693$ 17,938,285$ 13,600,701$ 664,842,679$
See independent auditor’s report.

This page intentionally left blank.
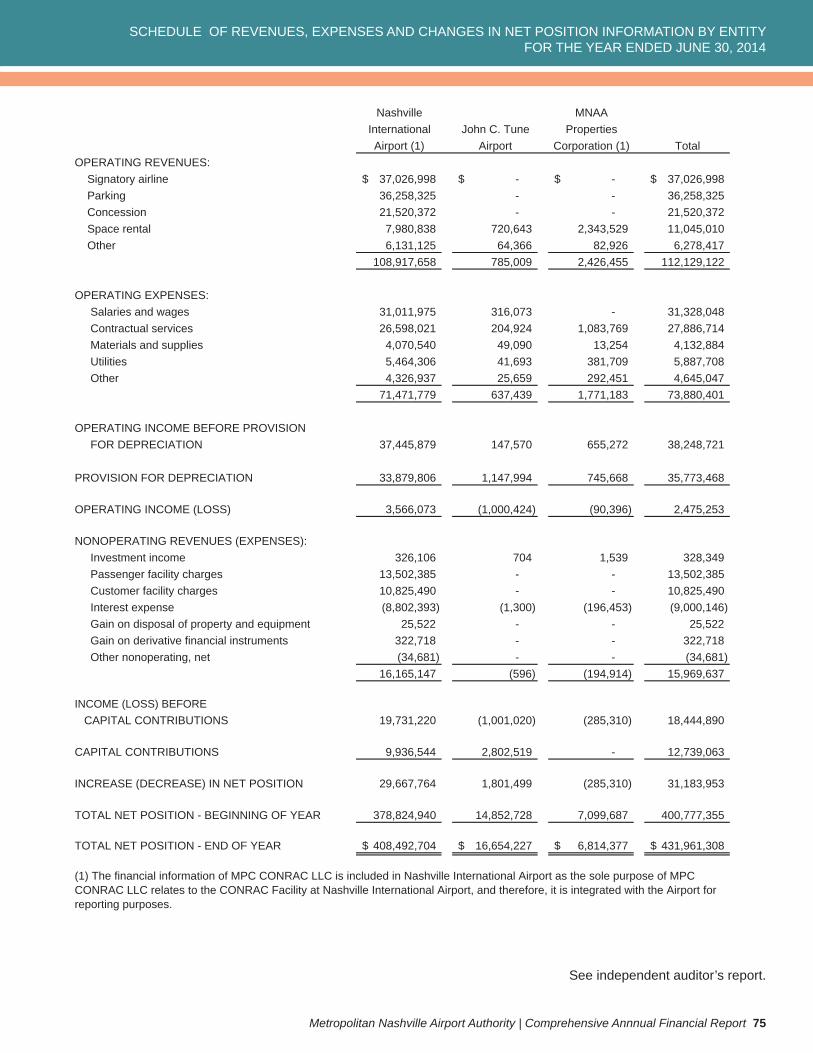
SCHEDULE OF REVENUES, EXPENSES AND CHANGES IN NET POSITION INFORMATION BY ENTITYFOR THE YEAR ENDED JUNE 30, 2014
Metropolitan Nashville Airport Authority | Comprehensive Annnual Financial Report 75
See independent auditor’s report.
Nashville MNAAInternational John C. Tune PropertiesAirport (1) Airport Corporation (1) Total
OPERATING REVENUES: Signatory airline 37,026,998$ -$ -$ 37,026,998$ Parking 36,258,325 - - 36,258,325 Concession 21,520,372 - - 21,520,372 Space rental 7,980,838 720,643 2,343,529 11,045,010 Other 6,131,125 64,366 82,926 6,278,417 108,917,658 785,009 2,426,455 112,129,122
OPERATING EXPENSES: Salaries and wages 31,011,975 316,073 - 31,328,048 Contractual services 26,598,021 204,924 1,083,769 27,886,714 Materials and supplies 4,070,540 49,090 13,254 4,132,884 Utilities 5,464,306 41,693 381,709 5,887,708 Other 4,326,937 25,659 292,451 4,645,047
71,471,779 637,439 1,771,183 73,880,401
OPERATING INCOME BEFORE PROVISION FOR DEPRECIATION 37,445,879 147,570 655,272 38,248,721
PROVISION FOR DEPRECIATION 33,879,806 1,147,994 745,668 35,773,468
OPERATING INCOME (LOSS) 3,566,073 (1,000,424) (90,396) 2,475,253
NONOPERATING REVENUES (EXPENSES): Investment income 326,106 704 1,539 328,349 Passenger facility charges 13,502,385 - - 13,502,385 Customer facility charges 10,825,490 - - 10,825,490 Interest expense (8,802,393) (1,300) (196,453) (9,000,146) Gain on disposal of property and equipment 25,522 - - 25,522 Gain on derivative financial instruments 322,718 - - 322,718 Other nonoperating, net (34,681) - - (34,681)
16,165,147 (596) (194,914) 15,969,637
INCOME (LOSS) BEFORE CAPITAL CONTRIBUTIONS 19,731,220 (1,001,020) (285,310) 18,444,890
CAPITAL CONTRIBUTIONS 9,936,544 2,802,519 - 12,739,063
INCREASE (DECREASE) IN NET POSITION 29,667,764 1,801,499 (285,310) 31,183,953
TOTAL NET POSITION - BEGINNING OF YEAR 378,824,940 14,852,728 7,099,687 400,777,355
TOTAL NET POSITION - END OF YEAR 408,492,704$ 16,654,227$ 6,814,377$ 431,961,308$
(1) The financial information of MPC CONRAC LLC is included in Nashville International Airport as the sole purpose of MPC CONRAC LLC relates to the CONRAC Facility at Nashville International Airport, and therefore, it is integrated with the Airport forreporting purposes.
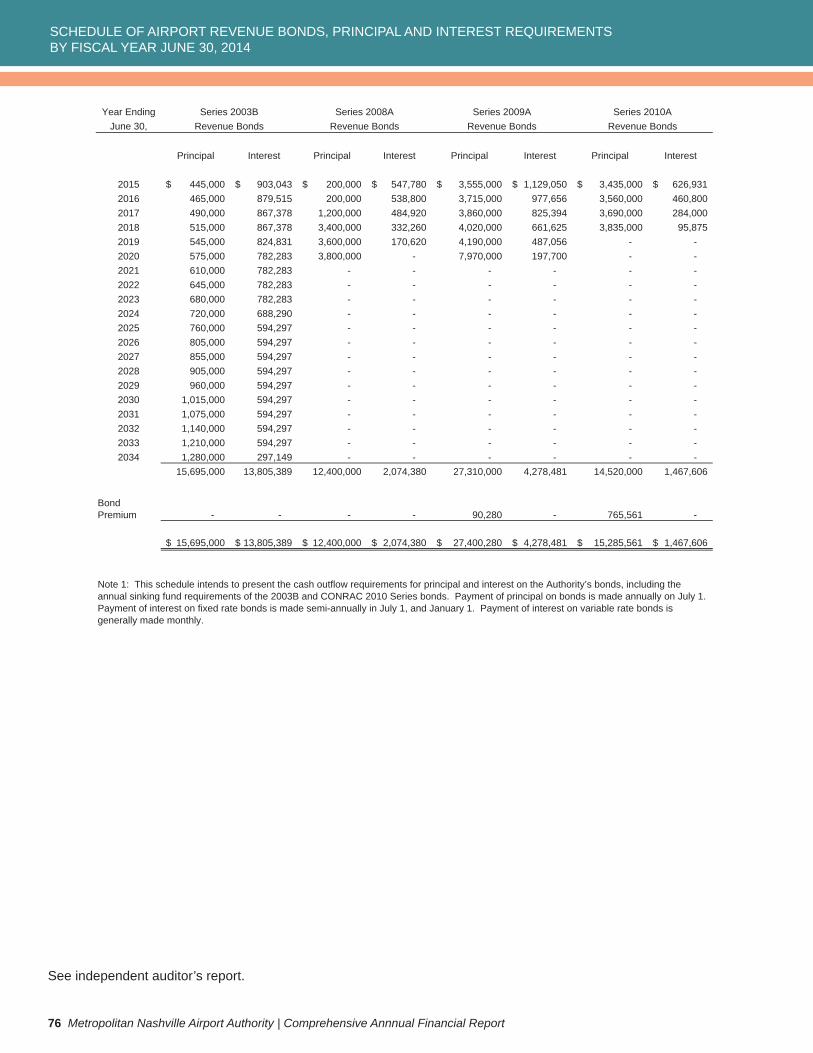
SCHEDULE OF AIRPORT REVENUE BONDS, PRINCIPAL AND INTEREST REQUIREMENTSBY FISCAL YEAR JUNE 30, 2014
76 Metropolitan Nashville Airport Authority | Comprehensive Annnual Financial Report
See independent auditor’s report.
Year EndingJune 30,
Principal Interest Principal Interest Principal Interest Principal Interest
2015 445,000$ 903,043$ 200,000$ 547,780$ 3,555,000$ 1,129,050$ 3,435,000$ 626,931$ 2016 465,000 879,515 200,000 538,800 3,715,000 977,656 3,560,000 460,800 2017 490,000 867,378 1,200,000 484,920 3,860,000 825,394 3,690,000 284,000 2018 515,000 867,378 3,400,000 332,260 4,020,000 661,625 3,835,000 95,875 2019 545,000 824,831 3,600,000 170,620 4,190,000 487,056 - - 2020 575,000 782,283 3,800,000 - 7,970,000 197,700 - - 2021 610,000 782,283 - - - - - - 2022 645,000 782,283 - - - - - - 2023 680,000 782,283 - - - - - - 2024 720,000 688,290 - - - - - - 2025 760,000 594,297 - - - - - - 2026 805,000 594,297 - - - - - - 2027 855,000 594,297 - - - - - - 2028 905,000 594,297 - - - - - - 2029 960,000 594,297 - - - - - - 2030 1,015,000 594,297 - - - - - - 2031 1,075,000 594,297 - - - - - - 2032 1,140,000 594,297 - - - - - - 2033 1,210,000 594,297 - - - - - - 2034 1,280,000 297,149 - - - - - -
15,695,000 13,805,389 12,400,000 2,074,380 27,310,000 4,278,481 14,520,000 1,467,606
BondPremium - - - - 90,280 - 765,561 -
15,695,000$ 13,805,389$ 12,400,000$ 2,074,380$ 27,400,280$ 4,278,481$ 15,285,561$ 1,467,606$
Series 2010ARevenue Bonds
Note 1: This schedule intends to present the cash outflow requirements for principal and interest on the Authority’s bonds, including the annual sinking fund requirements of the 2003B and CONRAC 2010 Series bonds. Payment of principal on bonds is made annually on July 1.Payment of interest on fixed rate bonds is made semi-annually in July 1, and January 1. Payment of interest on variable rate bonds is generally made monthly.
Revenue BondsSeries 2009A
Revenue BondsRevenue BondsSeries 2003B Series 2008A
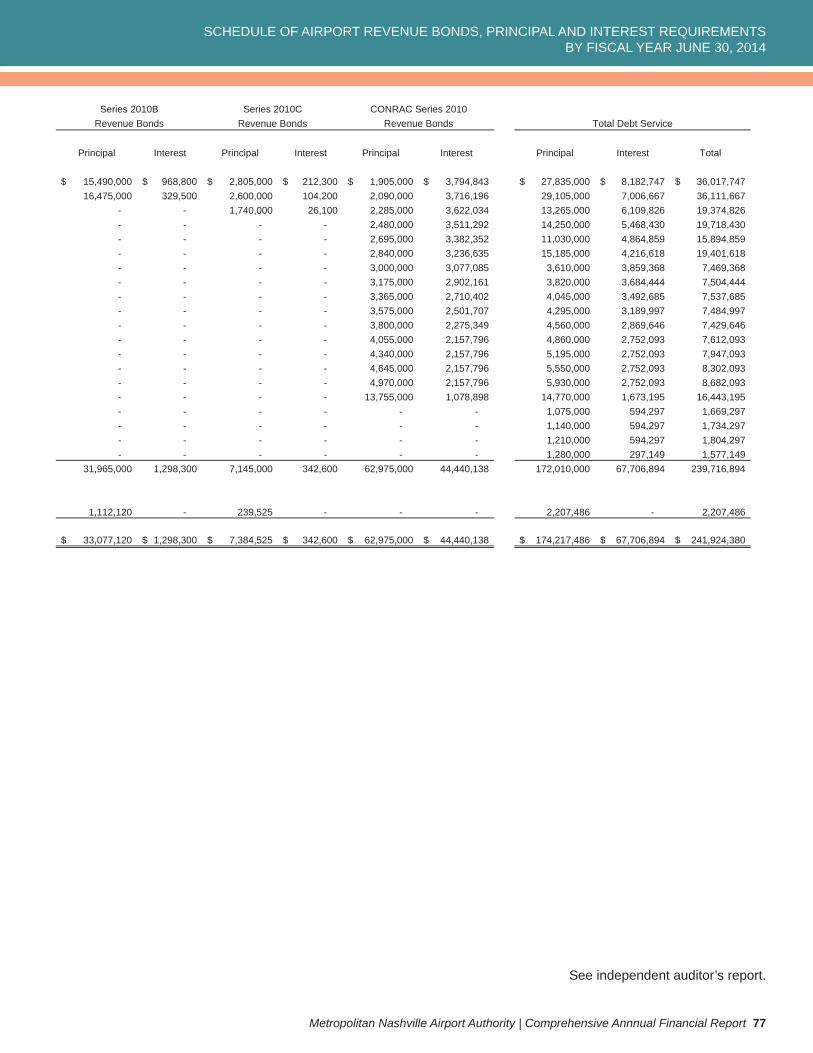
SCHEDULE OF AIRPORT REVENUE BONDS, PRINCIPAL AND INTEREST REQUIREMENTSBY FISCAL YEAR JUNE 30, 2014
Metropolitan Nashville Airport Authority | Comprehensive Annnual Financial Report 77
See independent auditor’s report.
Principal Interest Principal Interest Principal Interest Principal Interest Total
15,490,000$ 968,800$ 2,805,000$ 212,300$ 1,905,000$ 3,794,843$ 27,835,000$ 8,182,747$ 36,017,747$ 16,475,000 329,500 2,600,000 104,200 2,090,000 3,716,196 29,105,000 7,006,667 36,111,667
- - 1,740,000 26,100 2,285,000 3,622,034 13,265,000 6,109,826 19,374,826 - - - - 2,480,000 3,511,292 14,250,000 5,468,430 19,718,430 - - - - 2,695,000 3,382,352 11,030,000 4,864,859 15,894,859 - - - - 2,840,000 3,236,635 15,185,000 4,216,618 19,401,618 - - - - 3,000,000 3,077,085 3,610,000 3,859,368 7,469,368 - - - - 3,175,000 2,902,161 3,820,000 3,684,444 7,504,444 - - - - 3,365,000 2,710,402 4,045,000 3,492,685 7,537,685 - - - - 3,575,000 2,501,707 4,295,000 3,189,997 7,484,997 - - - - 3,800,000 2,275,349 4,560,000 2,869,646 7,429,646 - - - - 4,055,000 2,157,796 4,860,000 2,752,093 7,612,093 - - - - 4,340,000 2,157,796 5,195,000 2,752,093 7,947,093 - - - - 4,645,000 2,157,796 5,550,000 2,752,093 8,302,093 - - - - 4,970,000 2,157,796 5,930,000 2,752,093 8,682,093 - - - - 13,755,000 1,078,898 14,770,000 1,673,195 16,443,195 - - - - - - 1,075,000 594,297 1,669,297 - - - - - - 1,140,000 594,297 1,734,297 - - - - - - 1,210,000 594,297 1,804,297 - - - - - - 1,280,000 297,149 1,577,149
31,965,000 1,298,300 7,145,000 342,600 62,975,000 44,440,138 172,010,000 67,706,894 239,716,894
1,112,120 - 239,525 - - - 2,207,486 - 2,207,486
33,077,120$ 1,298,300$ 7,384,525$ 342,600$ 62,975,000$ 44,440,138$ 174,217,486$ 67,706,894$ 241,924,380$
Total Debt ServiceCONRAC Series 2010
Revenue BondsRevenue BondsSeries 2010C
Revenue BondsSeries 2010B

Statistical SectionMetropolitan Nashville Airport Authority | Comprehensive Annual Financial Report
Statistical information differs from fi nancial statements because it usually covers more than one fi scal year and may present non-accounting
data. Available fi nancial trend data is presented to assist the reader in understanding the Authority’s primary business activities and to
identify emerging fi nancial trends. Operational data further supports this. The residual lease agreement with the signatory airlines dictates
their responsibility to cover any revenue shortfall in the form of rates and charges. Therefore, special attention is placed on operating revenues,
operating expenses and related indicators. Readers are interested in the Authority’s debt burden as it provides some insight as to the ability of the
Authority to fi nance major capital projects such as runways, taxiways and terminal improvements in the future. Finally, demographic, economic and
operating information is presented to further explain the interrelationship of key indicators in Middle Tennessee with the activities of the Authority.
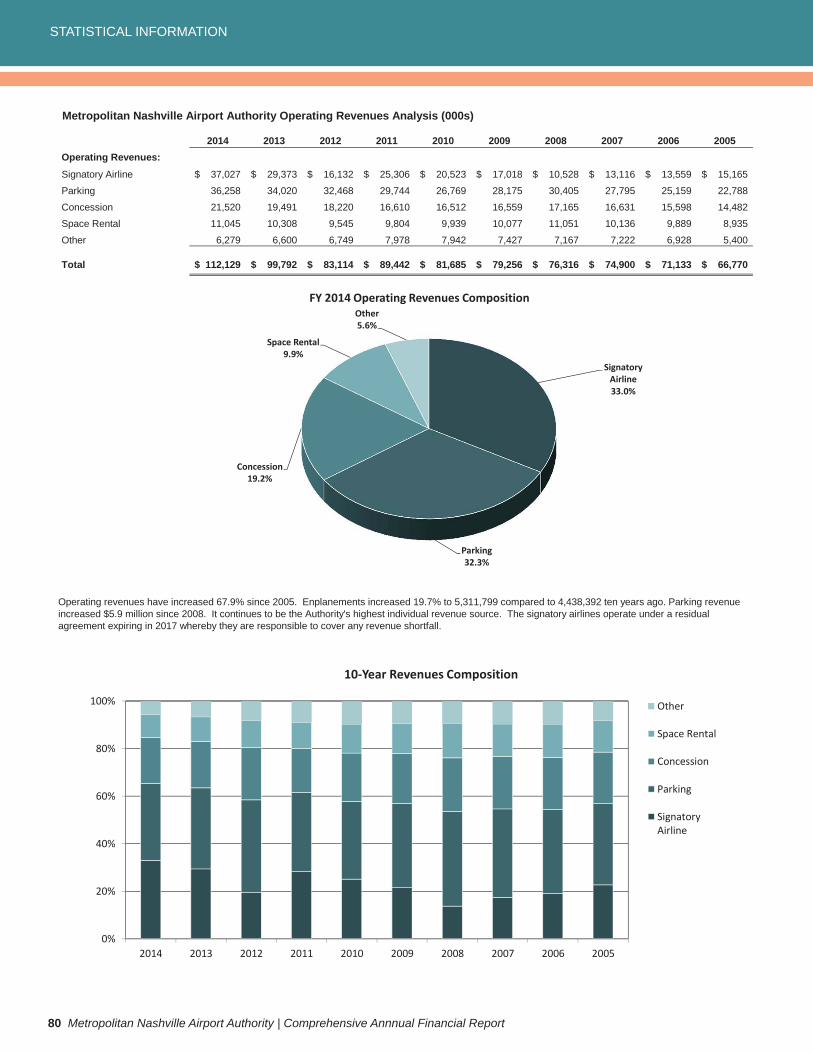
STATISTICAL INFORMATION
80 Metropolitan Nashville Airport Authority | Comprehensive Annnual Financial Report
Metropolitan Nashville Airport Authority Operating Revenues Analysis (000s)
2014 2013 2012 2011 2010 2009 2008 2007 2006 2005Operating Revenues:Signatory Airline 37,027$ 29,373$ 16,132$ 25,306$ 20,523$ 17,018$ 10,528$ 13,116$ 13,559$ 15,165$Parking 36,258 34,020 32,468 29,744 26,769 28,175 30,405 27,795 25,159 22,788Concession 21,520 19,491 18,220 16,610 16,512 16,559 17,165 16,631 15,598 14,482Space Rental 11,045 10,308 9,545 9,804 9,939 10,077 11,051 10,136 9,889 8,935Other 6,279 6,600 6,749 7,978 7,942 7,427 7,167 7,222 6,928 5,400
Total 112,129$ 99,792$ 83,114$ 89,442$ 81,685$ 79,256$ 76,316$ 74,900$ 71,133$ 66,770$
Operating revenues have increased 67.9% since 2005. Enplanements increased 19.7% to 5,311,799 compared to 4,438,392 ten years ago. Parking revenue increased $5.9 million since 2008. It continues to be the Authority's highest individual revenue source. The signatory airlines operate under a residual agreement expiring in 2017 whereby they are responsible to cover any revenue shortfall.
SignatoryAirline33.0%
Parking32.3%
Concession19.2%
Space Rental9.9%
Other5.6%
FY 2014 Operating Revenues Composition
0%
20%
40%
60%
80%
100%
2014 2013 2012 2011 2010 2009 2008 2007 2006 2005
10 Year Revenues Composition
Other
Space Rental
Concession
Parking
SignatoryAirline
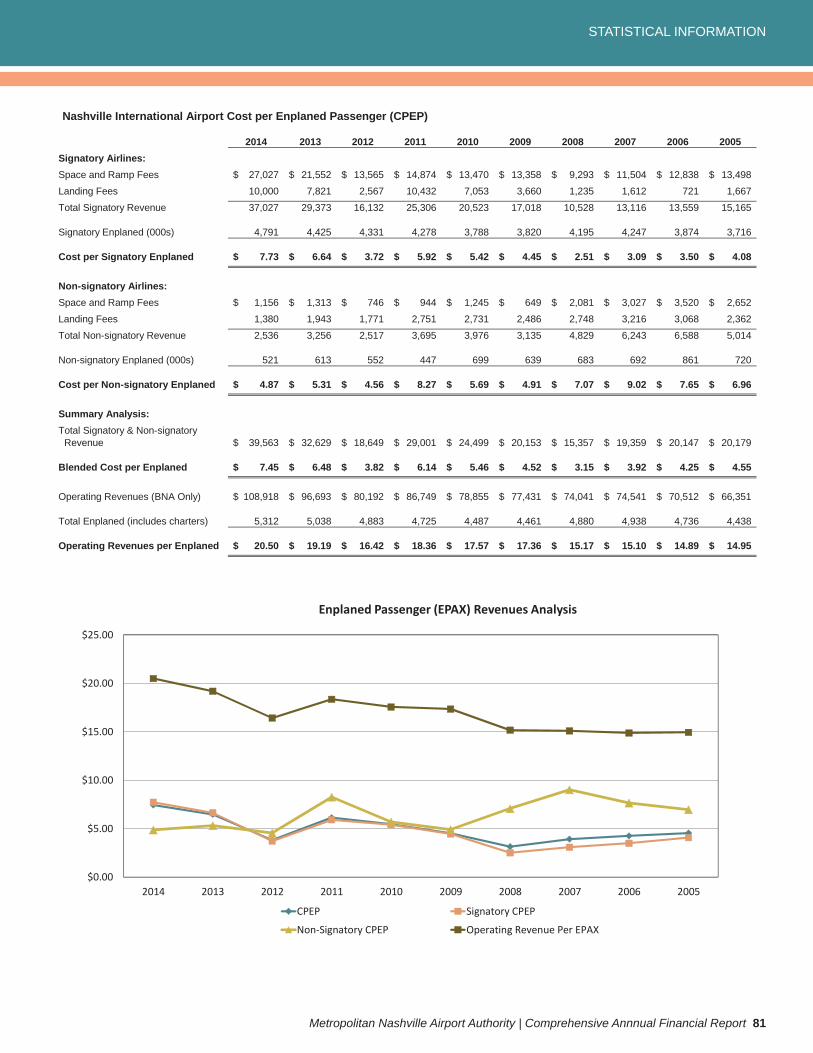
STATISTICAL INFORMATION
Metropolitan Nashville Airport Authority | Comprehensive Annnual Financial Report 81
Nashville International Airport Cost per Enplaned Passenger (CPEP)
2014 2013 2012 2011 2010 2009 2008 2007 2006 2005Signatory Airlines:Space and Ramp Fees 27,027$ 21,552$ 13,565$ 14,874$ 13,470$ 13,358$ 9,293$ 11,504$ 12,838$ 13,498$Landing Fees 10,000 7,821 2,567 10,432 7,053 3,660 1,235 1,612 721 1,667Total Signatory Revenue 37,027 29,373 16,132 25,306 20,523 17,018 10,528 13,116 13,559 15,165
Signatory Enplaned (000s) 4,791 4,425 4,331 4,278 3,788 3,820 4,195 4,247 3,874 3,716
Cost per Signatory Enplaned 7.73$ 6.64$ 3.72$ 5.92$ 5.42$ 4.45$ 2.51$ 3.09$ 3.50$ 4.08$
Non-signatory Airlines:Space and Ramp Fees 1,156$ 1,313$ 746$ 944$ 1,245$ 649$ 2,081$ 3,027$ 3,520$ 2,652$Landing Fees 1,380 1,943 1,771 2,751 2,731 2,486 2,748 3,216 3,068 2,362Total Non-signatory Revenue 2,536 3,256 2,517 3,695 3,976 3,135 4,829 6,243 6,588 5,014
Non-signatory Enplaned (000s) 521 613 552 447 699 639 683 692 861 720
Cost per Non-signatory Enplaned 4.87$ 5.31$ 4.56$ 8.27$ 5.69$ 4.91$ 7.07$ 9.02$ 7.65$ 6.96$
Summary Analysis:Total Signatory & Non-signatory
Revenue 39,563$ 32,629$ 18,649$ 29,001$ 24,499$ 20,153$ 15,357$ 19,359$ 20,147$ 20,179$
Blended Cost per Enplaned 7.45$ 6.48$ 3.82$ 6.14$ 5.46$ 4.52$ 3.15$ 3.92$ 4.25$ 4.55$
Operating Revenues (BNA Only) 108,918$ 96,693$ 80,192$ 86,749$ 78,855$ 77,431$ 74,041$ 74,541$ 70,512$ 66,351$
Total Enplaned (includes charters) 5,312 5,038 4,883 4,725 4,487 4,461 4,880 4,938 4,736 4,438
Operating Revenues per Enplaned 20.50$ 19.19$ 16.42$ 18.36$ 17.57$ 17.36$ 15.17$ 15.10$ 14.89$ 14.95$
$0.00
$5.00
$10.00
$15.00
$20.00
$25.00
2014 2013 2012 2011 2010 2009 2008 2007 2006 2005
Enplaned Passenger (EPAX) Revenues Analysis
CPEP Signatory CPEP
Non Signatory CPEP Operating Revenue Per EPAX
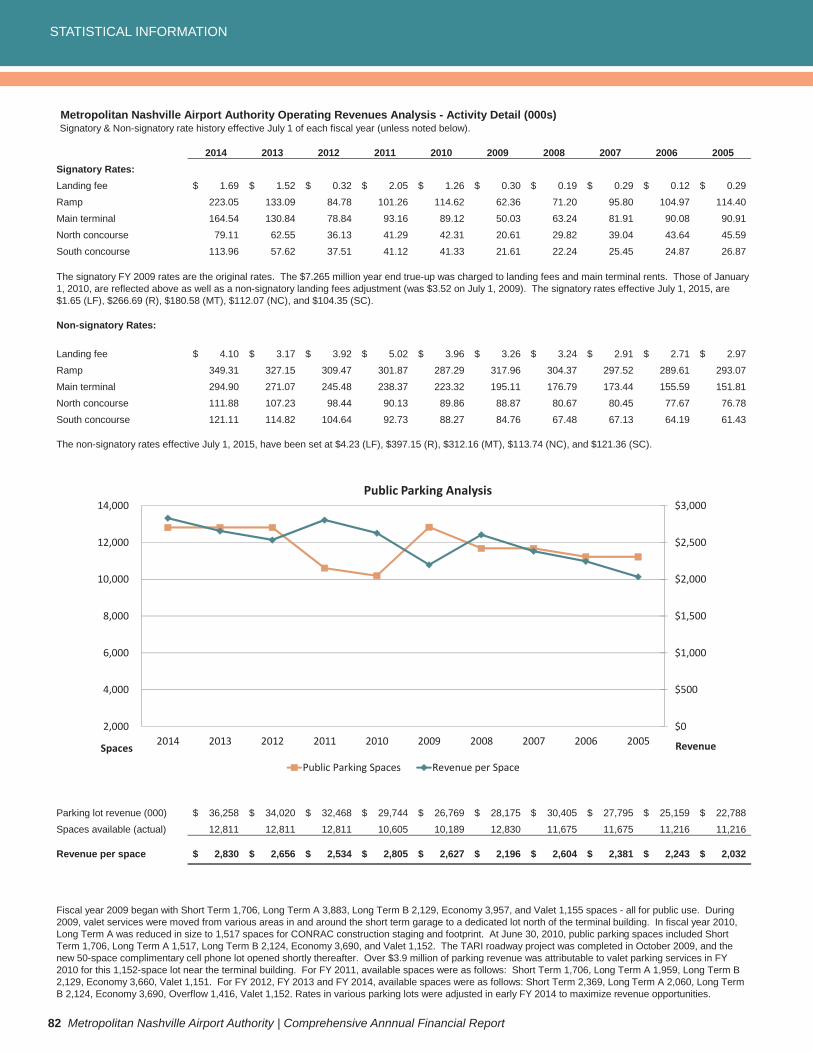
STATISTICAL INFORMATION
82 Metropolitan Nashville Airport Authority | Comprehensive Annnual Financial Report
Metropolitan Nashville Airport Authority Operating Revenues Analysis - Activity Detail (000s)Signatory & Non-signatory rate history effective July 1 of each fiscal year (unless noted below).
2014 2013 2012 2011 2010 2009 2008 2007 2006 2005Signatory Rates:Landing fee 1.69$ 1.52$ 0.32$ 2.05$ 1.26$ 0.30$ 0.19$ 0.29$ 0.12$ 0.29$Ramp 223.05 133.09 84.78 101.26 114.62 62.36 71.20 95.80 104.97 114.40Main terminal 164.54 130.84 78.84 93.16 89.12 50.03 63.24 81.91 90.08 90.91North concourse 79.11 62.55 36.13 41.29 42.31 20.61 29.82 39.04 43.64 45.59South concourse 113.96 57.62 37.51 41.12 41.33 21.61 22.24 25.45 24.87 26.87
Non-signatory Rates:
Landing fee 4.10$ 3.17$ 3.92$ 5.02$ 3.96$ 3.26$ 3.24$ 2.91$ 2.71$ 2.97$Ramp 349.31 327.15 309.47 301.87 287.29 317.96 304.37 297.52 289.61 293.07Main terminal 294.90 271.07 245.48 238.37 223.32 195.11 176.79 173.44 155.59 151.81North concourse 111.88 107.23 98.44 90.13 89.86 88.87 80.67 80.45 77.67 76.78South concourse 121.11 114.82 104.64 92.73 88.27 84.76 67.48 67.13 64.19 61.43
The non-signatory rates effective July 1, 2015, have been set at $4.23 (LF), $397.15 (R), $312.16 (MT), $113.74 (NC), and $121.36 (SC).
Parking lot revenue (000) 36,258$ 34,020$ 32,468$ 29,744$ 26,769$ 28,175$ 30,405$ 27,795$ 25,159$ 22,788$Spaces available (actual) 12,811 12,811 12,811 10,605 10,189 12,830 11,675 11,675 11,216 11,216
Revenue per space 2,830$ 2,656$ 2,534$ 2,805$ 2,627$ 2,196$ 2,604$ 2,381$ 2,243$ 2,032$
Fiscal year 2009 began with Short Term 1,706, Long Term A 3,883, Long Term B 2,129, Economy 3,957, and Valet 1,155 spaces - all for public use. During 2009, valet services were moved from various areas in and around the short term garage to a dedicated lot north of the terminal building. In fiscal year 2010, Long Term A was reduced in size to 1,517 spaces for CONRAC construction staging and footprint. At June 30, 2010, public parking spaces included Short Term 1,706, Long Term A 1,517, Long Term B 2,124, Economy 3,690, and Valet 1,152. The TARI roadway project was completed in October 2009, and the new 50-space complimentary cell phone lot opened shortly thereafter. Over $3.9 million of parking revenue was attributable to valet parking services in FY 2010 for this 1,152-space lot near the terminal building. For FY 2011, available spaces were as follows: Short Term 1,706, Long Term A 1,959, Long Term B 2,129, Economy 3,660, Valet 1,151. For FY 2012, FY 2013 and FY 2014, available spaces were as follows: Short Term 2,369, Long Term A 2,060, Long Term B 2,124, Economy 3,690, Overflow 1,416, Valet 1,152. Rates in various parking lots were adjusted in early FY 2014 to maximize revenue opportunities.
The signatory FY 2009 rates are the original rates. The $7.265 million year end true-up was charged to landing fees and main terminal rents. Those of January1, 2010, are reflected above as well as a non-signatory landing fees adjustment (was $3.52 on July 1, 2009). The signatory rates effective July 1, 2015, are $1.65 (LF), $266.69 (R), $180.58 (MT), $112.07 (NC), and $104.35 (SC).
$0
$500
$1,000
$1,500
$2,000
$2,500
$3,000
2,000
4,000
6,000
8,000
10,000
12,000
14,000
2014 2013 2012 2011 2010 2009 2008 2007 2006 2005 RevenueSpaces
Public Parking Analysis
Public Parking Spaces Revenue per Space
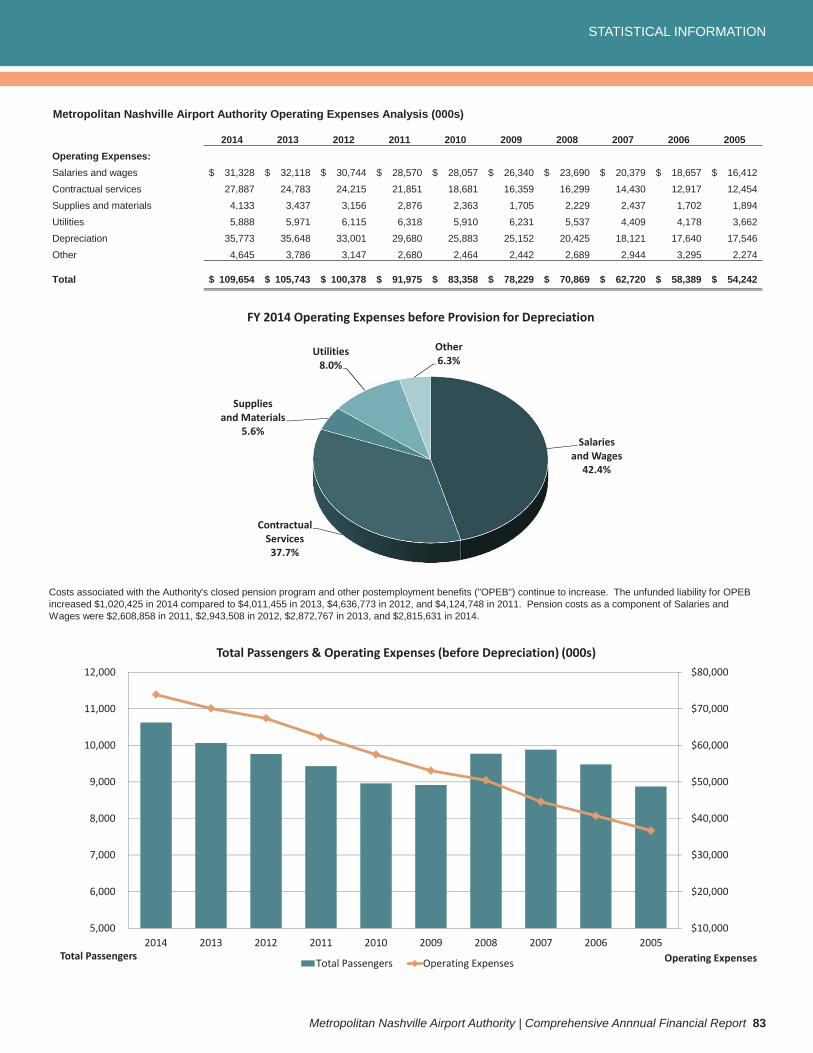
STATISTICAL INFORMATION
Metropolitan Nashville Airport Authority | Comprehensive Annnual Financial Report 83
Metropolitan Nashville Airport Authority Operating Expenses Analysis (000s)
2014 2013 2012 2011 2010 2009 2008 2007 2006 2005Operating Expenses:Salaries and wages 31,328$ 32,118$ 30,744$ 28,570$ 28,057$ 26,340$ 23,690$ 20,379$ 18,657$ 16,412$Contractual services 27,887 24,783 24,215 21,851 18,681 16,359 16,299 14,430 12,917 12,454Supplies and materials 4,133 3,437 3,156 2,876 2,363 1,705 2,229 2,437 1,702 1,894Utilities 5,888 5,971 6,115 6,318 5,910 6,231 5,537 4,409 4,178 3,662Depreciation 35,773 35,648 33,001 29,680 25,883 25,152 20,425 18,121 17,640 17,546Other 4,645 3,786 3,147 2,680 2,464 2,442 2,689 2,944 3,295 2,274
Total 109,654$ 105,743$ 100,378$ 91,975$ 83,358$ 78,229$ 70,869$ 62,720$ 58,389$ 54,242$
Costs associated with the Authority's closed pension program and other postemployment benefits ("OPEB") continue to increase. The unfunded liability for OPEB increased $1,020,425 in 2014 compared to $4,011,455 in 2013, $4,636,773 in 2012, and $4,124,748 in 2011. Pension costs as a component of Salaries and Wages were $2,608,858 in 2011, $2,943,508 in 2012, $2,872,767 in 2013, and $2,815,631 in 2014.
Salariesand Wages42.4%
ContractualServices37.7%
Suppliesand Materials
5.6%
Utilities8.0%
Other6.3%
FY 2014 Operating Expenses before Provision for Depreciation
$10,000
$20,000
$30,000
$40,000
$50,000
$60,000
$70,000
$80,000
5,000
6,000
7,000
8,000
9,000
10,000
11,000
12,000
2014 2013 2012 2011 2010 2009 2008 2007 2006 2005Operating ExpensesTotal Passengers
Total Passengers & Operating Expenses (before Depreciation) (000s)
Total Passengers Operating Expenses
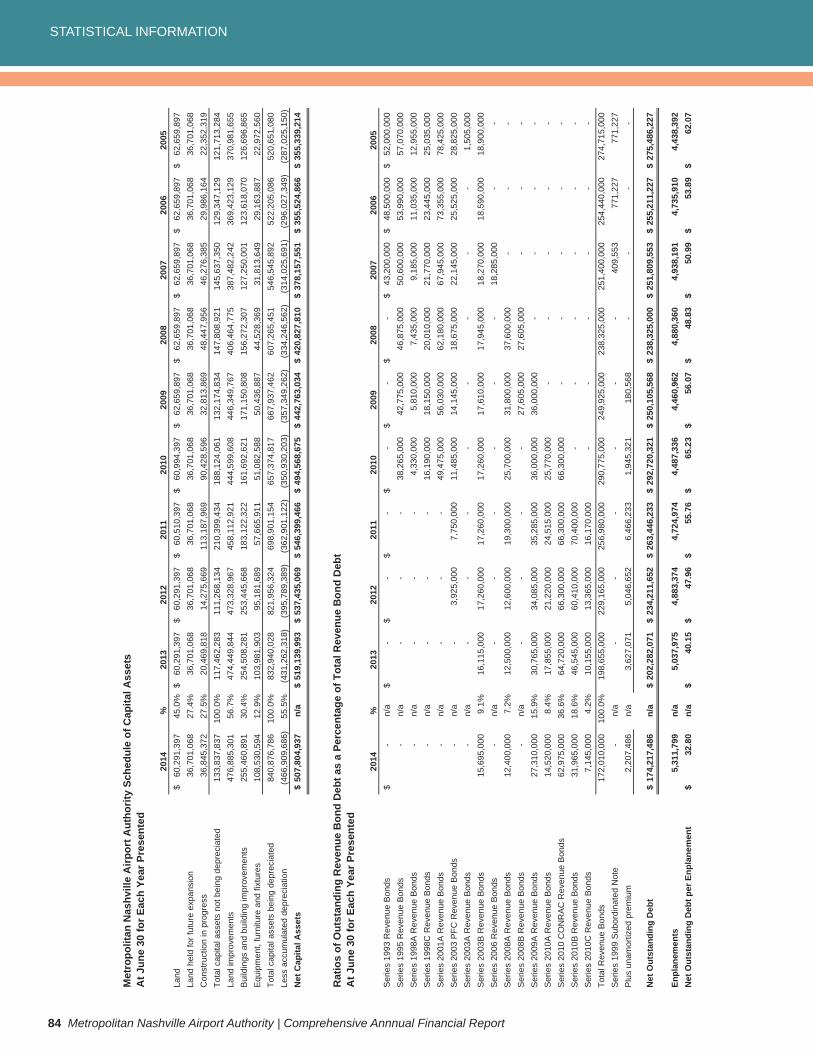
STATISTICAL INFORMATION
84 Metropolitan Nashville Airport Authority | Comprehensive Annnual Financial Report
Met
ropo
litan
Nas
hvill
e A
irpor
t Aut
horit
y Sc
hedu
le o
f Cap
ital A
sset
sA
t Jun
e 30
for E
ach
Year
Pre
sent
ed
2014
%20
1320
1220
1120
1020
0920
0820
0720
0620
05La
nd60
,291
,397
$
45.0
%60
,291
,397
$
60,2
91,3
97$
60
,510
,397
$
60,9
94,3
97$
62
,659
,897
$
62,6
59,8
97$
62
,659
,897
$
62,6
59,8
97$
62
,659
,897
$La
nd h
eld
for f
utur
e ex
pans
ion
36,7
01,0
68
27
.4%
36,7
01,0
68
36
,701
,068
36,7
01,0
68
36
,701
,068
36,7
01,0
68
36
,701
,068
36,7
01,0
68
36
,701
,068
36,7
01,0
68C
onst
ruct
ion
in p
rogr
ess
36,8
45,3
72
27
.5%
20,4
69,8
18
14
,275
,669
113,
187,
969
90,4
28,5
96
32
,813
,869
48,4
47,9
56
46
,276
,385
29,9
86,1
64
22
,352
,319
Tota
l cap
ital a
sset
s no
t bei
ng d
epre
ciat
ed13
3,83
7,83
7
10
0.0%
117,
462,
283
111,
268,
134
210,
399,
434
188,
124,
061
132,
174,
834
147,
808,
921
145,
637,
350
129,
347,
129
121,
713,
284
Land
impr
ovem
ents
476,
885,
301
56.7
%47
4,44
9,84
4
47
3,32
8,96
7
45
8,11
2,92
1
44
4,59
9,60
8
44
6,34
9,76
7
40
6,46
4,77
5
38
7,48
2,24
2
36
9,42
3,12
9
37
0,98
1,65
5B
uild
ings
and
bui
ldin
g im
prov
emen
ts25
5,46
0,89
1
30
.4%
254,
508,
281
253,
445,
668
183,
122,
322
161,
692,
621
171,
150,
808
156,
272,
307
127,
250,
001
123,
618,
070
126,
696,
865
Equ
ipm
ent,
furn
iture
and
fixt
ures
108,
530,
594
12.9
%10
3,98
1,90
3
95
,181
,689
57,6
65,9
11
51
,082
,588
50,4
36,8
87
44
,528
,369
31,8
13,6
49
29
,163
,887
22,9
72,5
60To
tal c
apita
l ass
ets
bein
g de
prec
iate
d84
0,87
6,78
6
10
0.0%
832,
940,
028
821,
956,
324
698,
901,
154
657,
374,
817
667,
937,
462
607,
265,
451
546,
545,
892
522,
205,
086
520,
651,
080
Less
acc
umul
ated
dep
reci
atio
n(4
66,9
09,6
86)
55
.5%
(431
,262
,318
)
(395
,789
,389
)
(362
,901
,122
)
(350
,930
,203
)
(357
,349
,262
)
(334
,246
,562
)
(314
,025
,691
)
(296
,027
,349
)
(287
,025
,150
)N
et C
apita
l Ass
ets
507,
804,
937
$
n/a
519,
139,
993
$
537,
435,
069
$
546,
399,
466
$
494,
568,
675
$
442,
763,
034
$
420,
827,
810
$
378,
157,
551
$
355,
524,
866
$
355,
339,
214
$
Rat
ios
of O
utst
andi
ng R
even
ue B
ond
Deb
t as
a Pe
rcen
tage
of T
otal
Rev
enue
Bon
d D
ebt
At J
une
30 fo
r Eac
h Ye
ar P
rese
nted
2014
%20
1320
1220
1120
1020
0920
0820
0720
0620
05S
erie
s 19
93 R
even
ue B
onds
-$
n/a
-$
-$
-$
-$
-$
-$
43,2
00,0
00$
48
,500
,000
$
52,0
00,0
00$
Ser
ies
1995
Rev
enue
Bon
ds-
n/
a-
-
-
38
,265
,000
42,7
75,0
00
46
,875
,000
50,6
00,0
00
53
,990
,000
57,0
70,0
00S
erie
s 19
98A
Rev
enue
Bon
ds-
n/
a-
-
-
4,
330,
000
5,
810,
000
7,
435,
000
9,
185,
000
11
,035
,000
12,9
55,0
00S
erie
s 19
98C
Rev
enue
Bon
ds-
n/
a-
-
-
16
,190
,000
18,1
50,0
00
20
,010
,000
21,7
70,0
00
23
,445
,000
25,0
35,0
00S
erie
s 20
01A
Rev
enue
Bon
ds-
n/
a-
-
-
49
,475
,000
56,0
30,0
00
62
,180
,000
67,9
45,0
00
73
,355
,000
78,4
25,0
00S
erie
s 20
03 P
FC R
even
ue B
onds
-
n/a
-
3,92
5,00
0
7,75
0,00
0
11,4
85,0
00
14
,145
,000
18,6
75,0
00
22
,145
,000
25,5
25,0
00
28
,825
,000
Ser
ies
2003
A R
even
ue B
onds
-
n/a
-
-
-
-
-
-
-
-
1,50
5,00
0S
erie
s 20
03B
Rev
enue
Bon
ds15
,695
,000
9.1%
16,1
15,0
00
17
,260
,000
17,2
60,0
00
17
,260
,000
17,6
10,0
00
17
,945
,000
18,2
70,0
00
18
,590
,000
18,9
00,0
00S
erie
s 20
06 R
even
ue B
onds
-
n/a
-
-
-
-
-
-
18,2
85,0
00
-
-
Ser
ies
2008
A R
even
ue B
onds
12,4
00,0
00
7.
2%12
,500
,000
12,6
00,0
00
19
,300
,000
25,7
00,0
00
31
,800
,000
37,6
00,0
00
-
-
-
Ser
ies
2008
B R
even
ue B
onds
-
n/a
-
-
-
-
27,6
05,0
00
27
,605
,000
-
-
-S
erie
s 20
09A
Rev
enue
Bon
ds27
,310
,000
15.9
%30
,765
,000
34,0
85,0
00
35
,285
,000
36,0
00,0
00
36
,000
,000
-
-
-
-S
erie
s 20
10A
Rev
enue
Bon
ds14
,520
,000
8.4%
17,8
55,0
00
21
,220
,000
24,5
15,0
00
25
,770
,000
-
-
-
-
-S
erie
s 20
10 C
ON
RA
C R
even
ue B
onds
62,9
75,0
00
36
.6%
64,7
20,0
00
66
,300
,000
66,3
00,0
00
66
,300
,000
-
-
-
-
-S
erie
s 20
10B
Rev
enue
Bon
ds31
,965
,000
18.6
%46
,545
,000
60,4
10,0
00
70
,400
,000
-
-
-
-
-
-S
erie
s 20
10C
Rev
enue
Bon
ds7,
145,
000
4.
2%10
,155
,000
13,3
65,0
00
16
,170
,000
-
-
-
-
-
-To
tal R
even
ue B
onds
172,
010,
000
100.
0%19
8,65
5,00
0
22
9,16
5,00
0
25
6,98
0,00
0
29
0,77
5,00
0
24
9,92
5,00
0
23
8,32
5,00
0
25
1,40
0,00
0
25
4,44
0,00
0
27
4,71
5,00
0S
erie
s 19
99 S
ubor
dina
ted
Not
e-
n/
a-
-
-
-
-
-
40
9,55
3
77
1,22
7
77
1,22
7P
lus
unam
ortiz
ed p
rem
ium
2,20
7,48
6
n/a
3,62
7,07
1
5,04
6,65
2
6,46
6,23
3
1,94
5,32
1
180,
568
-
-
-
-
Net
Out
stan
ding
Deb
t17
4,21
7,48
6$
n/
a20
2,28
2,07
1$
23
4,21
1,65
2$
26
3,44
6,23
3$
29
2,72
0,32
1$
25
0,10
5,56
8$
23
8,32
5,00
0$
25
1,80
9,55
3$
25
5,21
1,22
7$
27
5,48
6,22
7$
Enpl
anem
ents
5,31
1,79
9
n/a
5,03
7,97
5
4,88
3,37
4
4,72
4,97
4
4,48
7,33
6
4,46
0,96
2
4,88
0,36
0
4,93
8,19
1
4,73
5,91
0
4,43
8,39
2N
et O
utst
andi
ng D
ebt p
er E
npla
nem
ent
32.8
0$
n/a
40.1
5$
47.9
6$
55.7
6$
65.2
3$
56.0
7$
48.8
3$
50.9
9$
53.8
9$
62.0
7$
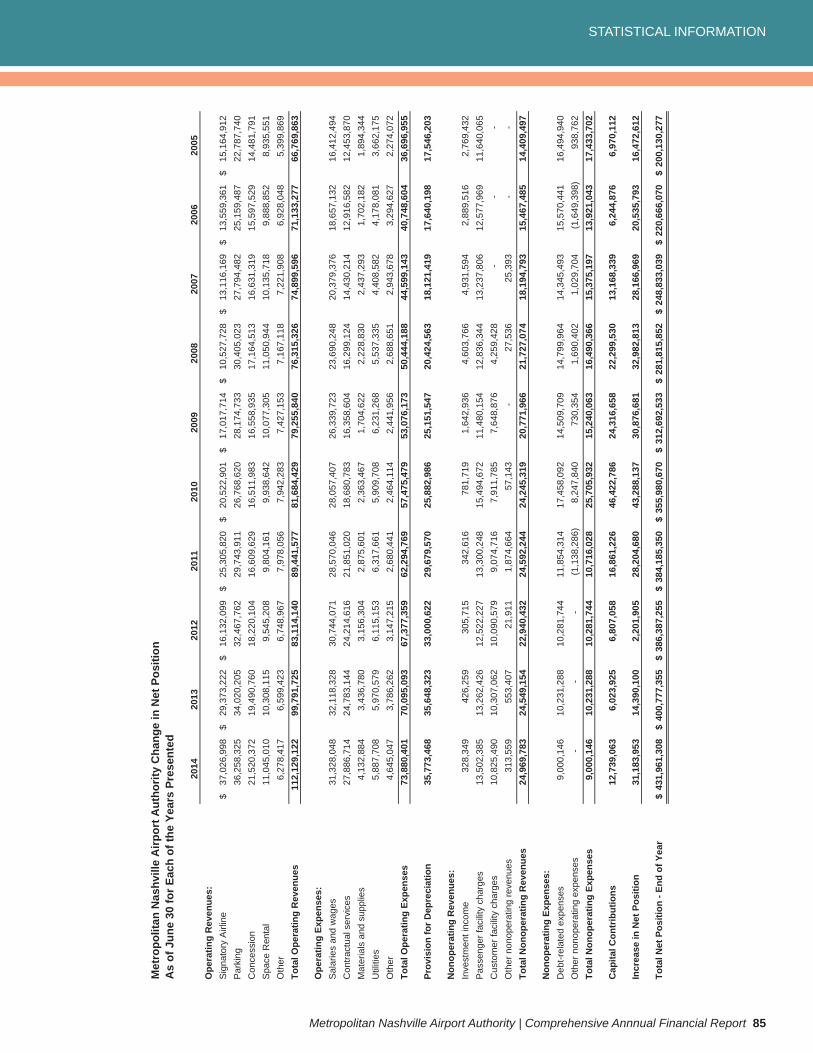
STATISTICAL INFORMATION
Metropolitan Nashville Airport Authority | Comprehensive Annnual Financial Report 85
Met
ropo
litan
Nas
hvill
e A
irpor
t Aut
horit
y C
hang
e in
Net
Pos
ition
As
of J
une
30 fo
r Eac
h of
the
Year
s Pr
esen
ted
2014
2013
2012
2011
2010
2009
2008
2007
2006
2005
Ope
ratin
g R
even
ues:
Sig
nato
ry A
irlin
e37
,026
,998
$
29,3
73,2
22$
16
,132
,099
$
25,3
05,8
20$
20
,522
,901
$
17,0
17,7
14$
10
,527
,728
$
13,1
16,1
69$
13
,559
,361
$
15,1
64,9
12$
P
arki
ng36
,258
,325
34,0
20,2
05
32
,467
,762
29,7
43,9
11
26
,768
,620
28,1
74,7
33
30
,405
,023
27,7
94,4
82
25
,159
,487
22,7
87,7
40
C
once
ssio
n21
,520
,372
19,4
90,7
60
18
,220
,104
16,6
09,6
29
16
,511
,983
16,5
58,9
35
17
,164
,513
16,6
31,3
19
15
,597
,529
14,4
81,7
91
S
pace
Ren
tal
11,0
45,0
10
10
,308
,115
9,54
5,20
8
9,80
4,16
1
9,93
8,64
2
10,0
77,3
05
11
,050
,944
10,1
35,7
18
9,
888,
852
8,
935,
551
O
ther
6,27
8,41
7
6,59
9,42
3
6,74
8,96
7
7,97
8,05
6
7,94
2,28
3
7,42
7,15
3
7,16
7,11
8
7,22
1,90
8
6,92
8,04
8
5,39
9,86
9
Tota
l Ope
ratin
g R
even
ues
112,
129,
122
99,7
91,7
25
83
,114
,140
89,4
41,5
77
81
,684
,429
79,2
55,8
40
76
,315
,326
74,8
99,5
96
71
,133
,277
66,7
69,8
63
Ope
ratin
g Ex
pens
es:
Sal
arie
s an
d w
ages
31,3
28,0
48
32
,118
,328
30,7
44,0
71
28
,570
,046
28,0
57,4
07
26
,339
,723
23,6
90,2
48
20
,379
,376
18,6
57,1
32
16
,412
,494
Con
tract
ual s
ervi
ces
27,8
86,7
14
24
,783
,144
24,2
14,6
16
21
,851
,020
18,6
80,7
83
16
,358
,604
16,2
99,1
24
14
,430
,214
12,9
16,5
82
12
,453
,870
Mat
eria
ls a
nd s
uppl
ies
4,13
2,88
4
3,43
6,78
0
3,15
6,30
4
2,87
5,60
1
2,36
3,46
7
1,70
4,62
2
2,22
8,83
0
2,43
7,29
3
1,70
2,18
2
1,89
4,34
4
Util
ities
5,88
7,70
8
5,97
0,57
9
6,11
5,15
3
6,31
7,66
1
5,90
9,70
8
6,23
1,26
8
5,53
7,33
5
4,40
8,58
2
4,17
8,08
1
3,66
2,17
5
Oth
er4,
645,
047
3,
786,
262
3,
147,
215
2,
680,
441
2,
464,
114
2,
441,
956
2,
688,
651
2,
943,
678
3,
294,
627
2,
274,
072
To
tal O
pera
ting
Expe
nses
73,8
80,4
01
70
,095
,093
67,3
77,3
59
62
,294
,769
57,4
75,4
79
53
,076
,173
50,4
44,1
88
44
,599
,143
40,7
48,6
04
36
,696
,955
Prov
isio
n fo
r Dep
reci
atio
n35
,773
,468
35,6
48,3
23
33
,000
,622
29,6
79,5
70
25
,882
,986
25,1
51,5
47
20
,424
,563
18,1
21,4
19
17
,640
,198
17,5
46,2
03
Non
oper
atin
g R
even
ues:
Inve
stm
ent i
ncom
e32
8,34
9
42
6,25
9
30
5,71
5
34
2,61
6
78
1,71
9
1,
642,
936
4,
603,
766
4,
931,
594
2,
889,
516
2,
769,
432
P
asse
nger
faci
lity
char
ges
13,5
02,3
85
13
,262
,426
12,5
22,2
27
13
,300
,248
15,4
94,6
72
11
,480
,154
12,8
36,3
44
13
,237
,806
12,5
77,9
69
11
,640
,065
Cus
tom
er fa
cilit
y ch
arge
s10
,825
,490
10,3
07,0
62
10
,090
,579
9,07
4,71
6
7,91
1,78
5
7,64
8,87
6
4,25
9,42
8
-
-
-
Oth
er n
onop
erat
ing
reve
nues
313,
559
553,
407
21,9
11
1,87
4,66
4
57,1
43
-
27,5
36
25,3
93
-
-
Tota
l Non
oper
atin
g R
even
ues
24,9
69,7
83
24
,549
,154
22,9
40,4
32
24
,592
,244
24,2
45,3
19
20
,771
,966
21,7
27,0
74
18
,194
,793
15,4
67,4
85
14
,409
,497
Non
oper
atin
g Ex
pens
es:
Deb
t-rel
ated
exp
ense
s9,
000,
146
10
,231
,288
10,2
81,7
44
11
,854
,314
17,4
58,0
92
14
,509
,709
14,7
99,9
64
14
,345
,493
15,5
70,4
41
16
,494
,940
Oth
er n
onop
erat
ing
expe
nses
-
-
-
(1,1
38,2
86)
8,
247,
840
73
0,35
4
1,
690,
402
1,
029,
704
(1
,649
,398
)
938,
762
Tota
l Non
oper
atin
g Ex
pens
es9,
000,
146
10
,231
,288
10,2
81,7
44
10
,716
,028
25,7
05,9
32
15
,240
,063
16,4
90,3
66
15
,375
,197
13,9
21,0
43
17
,433
,702
Cap
ital C
ontr
ibut
ions
12,7
39,0
63
6,
023,
925
6,
807,
058
16
,861
,226
46,4
22,7
86
24
,316
,658
22,2
99,5
30
13
,168
,339
6,24
4,87
6
6,97
0,11
2
Incr
ease
in N
et P
ositi
on31
,183
,953
14,3
90,1
00
2,
201,
905
28
,204
,680
43,2
88,1
37
30
,876
,681
32,9
82,8
13
28
,166
,969
20,5
35,7
93
16
,472
,612
Tota
l Net
Pos
ition
- En
d of
Yea
r43
1,96
1,30
8$
40
0,77
7,35
5$
38
6,38
7,25
5$
38
4,18
5,35
0$
35
5,98
0,67
0$
31
2,69
2,53
3$
28
1,81
5,85
2$
24
8,83
3,03
9$
22
0,66
6,07
0$
20
0,13
0,27
7$
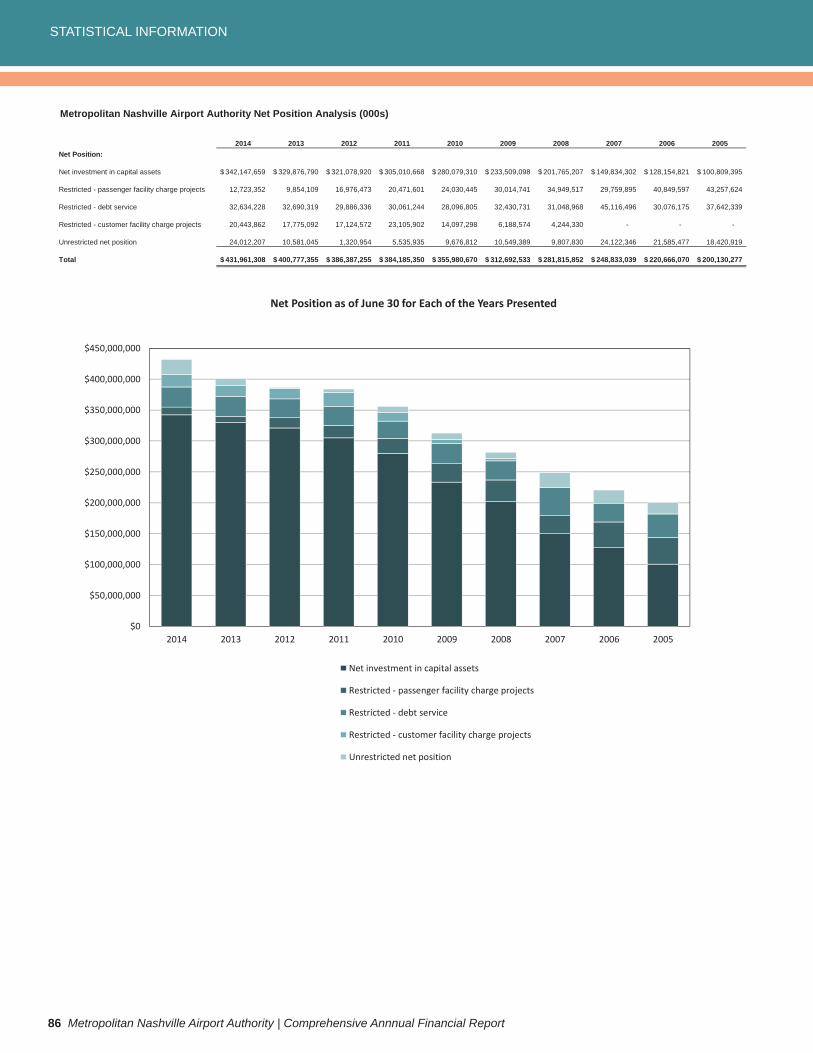
STATISTICAL INFORMATION
86 Metropolitan Nashville Airport Authority | Comprehensive Annnual Financial Report
Metropolitan Nashville Airport Authority Net Position Analysis (000s)
2014 2013 2012 2011 2010 2009 2008 2007 2006 2005Net Position:
Net investment in capital assets 342,147,659$ 329,876,790$ 321,078,920$ 305,010,668$ 280,079,310$ 233,509,098$ 201,765,207$ 149,834,302$ 128,154,821$ 100,809,395$
Restricted - passenger facility charge projects 12,723,352 9,854,109 16,976,473 20,471,601 24,030,445 30,014,741 34,949,517 29,759,895 40,849,597 43,257,624
Restricted - debt service 32,634,228 32,690,319 29,886,336 30,061,244 28,096,805 32,430,731 31,048,968 45,116,496 30,076,175 37,642,339
Restricted - customer facility charge projects 20,443,862 17,775,092 17,124,572 23,105,902 14,097,298 6,188,574 4,244,330 - - -
Unrestricted net position 24,012,207 10,581,045 1,320,954 5,535,935 9,676,812 10,549,389 9,807,830 24,122,346 21,585,477 18,420,919
Total 431,961,308$ 400,777,355$ 386,387,255$ 384,185,350$ 355,980,670$ 312,692,533$ 281,815,852$ 248,833,039$ 220,666,070$ 200,130,277$
$0
$50,000,000
$100,000,000
$150,000,000
$200,000,000
$250,000,000
$300,000,000
$350,000,000
$400,000,000
$450,000,000
2014 2013 2012 2011 2010 2009 2008 2007 2006 2005
Net Position as of June 30 for Each of the Years Presented
Net investment in capital assets
Restricted passenger facility charge projects
Restricted debt service
Restricted customer facility charge projects
Unrestricted net position
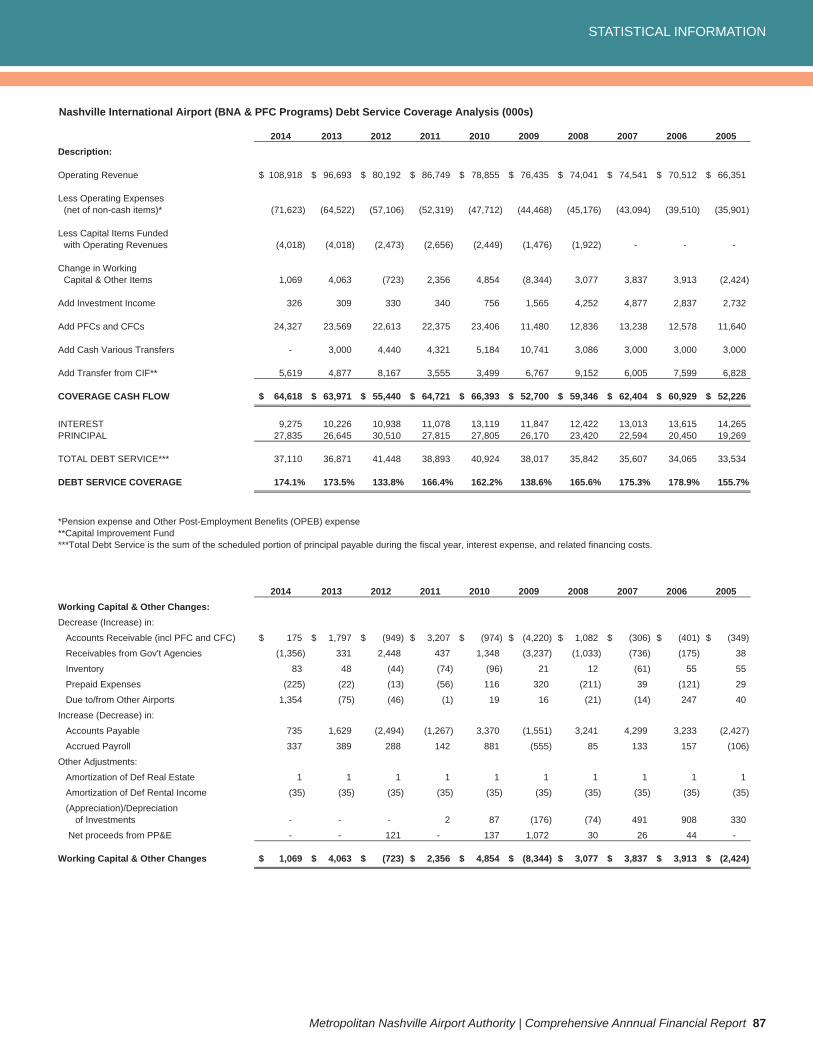
STATISTICAL INFORMATION
Metropolitan Nashville Airport Authority | Comprehensive Annnual Financial Report 87
Nashville International Airport (BNA & PFC Programs) Debt Service Coverage Analysis (000s)
2014 2013 2012 2011 2010 2009 2008 2007 2006 2005Description:
Operating Revenue 108,918$ 96,693$ 80,192$ 86,749$ 78,855$ 76,435$ 74,041$ 74,541$ 70,512$ 66,351$
Less Operating Expenses (net of non-cash items)* (71,623) (64,522) (57,106) (52,319) (47,712) (44,468) (45,176) (43,094) (39,510) (35,901)
Less Capital Items Funded with Operating Revenues (4,018) (4,018) (2,473) (2,656) (2,449) (1,476) (1,922) - - -
Change in WorkingCapital & Other Items 1,069 4,063 (723) 2,356 4,854 (8,344) 3,077 3,837 3,913 (2,424)
Add Investment Income 326 309 330 340 756 1,565 4,252 4,877 2,837 2,732
Add PFCs and CFCs 24,327 23,569 22,613 22,375 23,406 11,480 12,836 13,238 12,578 11,640
Add Cash Various Transfers - 3,000 4,440 4,321 5,184 10,741 3,086 3,000 3,000 3,000
Add Transfer from CIF** 5,619 4,877 8,167 3,555 3,499 6,767 9,152 6,005 7,599 6,828
COVERAGE CASH FLOW 64,618$ 63,971$ 55,440$ 64,721$ 66,393$ 52,700$ 59,346$ 62,404$ 60,929$ 52,226$
INTEREST 9,275 10,226 10,938 11,078 13,119 11,847 12,422 13,013 13,615 14,265 PRINCIPAL 27,835 26,645 30,510 27,815 27,805 26,170 23,420 22,594 20,450 19,269
TOTAL DEBT SERVICE*** 37,110 36,871 41,448 38,893 40,924 38,017 35,842 35,607 34,065 33,534
DEBT SERVICE COVERAGE 174.1% 173.5% 133.8% 166.4% 162.2% 138.6% 165.6% 175.3% 178.9% 155.7%
*Pension expense and Other Post-Employment Benefits (OPEB) expense**Capital Improvement Fund***Total Debt Service is the sum of the scheduled portion of principal payable during the fiscal year, interest expense, and related financing costs.
2014 2013 2012 2011 2010 2009 2008 2007 2006 2005Working Capital & Other Changes:Decrease (Increase) in:
Accounts Receivable (incl PFC and CFC) 175$ 1,797$ (949)$ 3,207$ (974)$ (4,220)$ 1,082$ (306)$ (401)$ (349)$
Receivables from Gov't Agencies (1,356) 331 2,448 437 1,348 (3,237) (1,033) (736) (175) 38
Inventory 83 48 (44) (74) (96) 21 12 (61) 55 55
Prepaid Expenses (225) (22) (13) (56) 116 320 (211) 39 (121) 29
Due to/from Other Airports 1,354 (75) (46) (1) 19 16 (21) (14) 247 40
Increase (Decrease) in:
Accounts Payable 735 1,629 (2,494) (1,267) 3,370 (1,551) 3,241 4,299 3,233 (2,427)
Accrued Payroll 337 389 288 142 881 (555) 85 133 157 (106)
Other Adjustments:
Amortization of Def Real Estate 1 1 1 1 1 1 1 1 1 1
Amortization of Def Rental Income (35) (35) (35) (35) (35) (35) (35) (35) (35) (35)
(Appreciation)/Depreciation of Investments - - - 2 87 (176) (74) 491 908 330
Net proceeds from PP&E - - 121 - 137 1,072 30 26 44 -
Working Capital & Other Changes 1,069$ 4,063$ (723)$ 2,356$ 4,854$ (8,344)$ 3,077$ 3,837$ 3,913$ (2,424)$
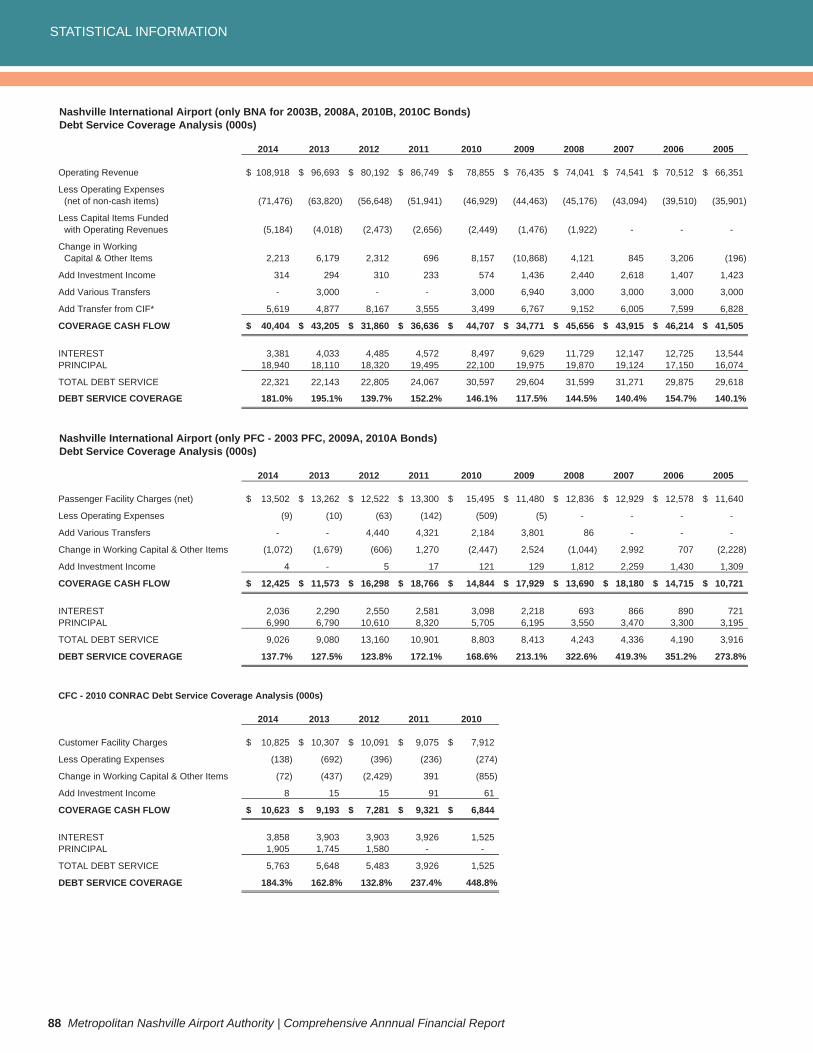
STATISTICAL INFORMATION
88 Metropolitan Nashville Airport Authority | Comprehensive Annnual Financial Report
2014 2013 2012 2011 2010 2009 2008 2007 2006 2005
Operating Revenue 108,918$ 96,693$ 80,192$ 86,749$ 78,855$ 76,435$ 74,041$ 74,541$ 70,512$ 66,351$
Less Operating Expenses(net of non-cash items) (71,476) (63,820) (56,648) (51,941) (46,929) (44,463) (45,176) (43,094) (39,510) (35,901)
Less Capital Items Fundedwith Operating Revenues (5,184) (4,018) (2,473) (2,656) (2,449) (1,476) (1,922) - - -
Change in Working Capital & Other Items 2,213 6,179 2,312 696 8,157 (10,868) 4,121 845 3,206 (196)
Add Investment Income 314 294 310 233 574 1,436 2,440 2,618 1,407 1,423
Add Various Transfers - 3,000 - - 3,000 6,940 3,000 3,000 3,000 3,000
Add Transfer from CIF* 5,619 4,877 8,167 3,555 3,499 6,767 9,152 6,005 7,599 6,828
COVERAGE CASH FLOW 40,404$ 43,205$ 31,860$ 36,636$ 44,707$ 34,771$ 45,656$ 43,915$ 46,214$ 41,505$
INTEREST 3,381 4,033 4,485 4,572 8,497 9,629 11,729 12,147 12,725 13,544 PRINCIPAL 18,940 18,110 18,320 19,495 22,100 19,975 19,870 19,124 17,150 16,074
TOTAL DEBT SERVICE 22,321 22,143 22,805 24,067 30,597 29,604 31,599 31,271 29,875 29,618
DEBT SERVICE COVERAGE 181.0% 195.1% 139.7% 152.2% 146.1% 117.5% 144.5% 140.4% 154.7% 140.1%
2014 2013 2012 2011 2010 2009 2008 2007 2006 2005
Passenger Facility Charges (net) 13,502$ 13,262$ 12,522$ 13,300$ 15,495$ 11,480$ 12,836$ 12,929$ 12,578$ 11,640$
Less Operating Expenses (9) (10) (63) (142) (509) (5) - - - -
Add Various Transfers - - 4,440 4,321 2,184 3,801 86 - - -
Change in Working Capital & Other Items (1,072) (1,679) (606) 1,270 (2,447) 2,524 (1,044) 2,992 707 (2,228)
Add Investment Income 4 - 5 17 121 129 1,812 2,259 1,430 1,309
COVERAGE CASH FLOW 12,425$ 11,573$ 16,298$ 18,766$ 14,844$ 17,929$ 13,690$ 18,180$ 14,715$ 10,721$
INTEREST 2,036 2,290 2,550 2,581 3,098 2,218 693 866 890 721 PRINCIPAL 6,990 6,790 10,610 8,320 5,705 6,195 3,550 3,470 3,300 3,195
TOTAL DEBT SERVICE 9,026 9,080 13,160 10,901 8,803 8,413 4,243 4,336 4,190 3,916
DEBT SERVICE COVERAGE 137.7% 127.5% 123.8% 172.1% 168.6% 213.1% 322.6% 419.3% 351.2% 273.8%
2014 2013 2012 2011 2010
Customer Facility Charges 10,825$ 10,307$ 10,091$ 9,075$ 7,912$
Less Operating Expenses (138) (692) (396) (236) (274)
Change in Working Capital & Other Items (72) (437) (2,429) 391 (855)
Add Investment Income 8 15 15 91 61
COVERAGE CASH FLOW 10,623$ 9,193$ 7,281$ 9,321$ 6,844$
INTEREST 3,858 3,903 3,903 3,926 1,525 PRINCIPAL 1,905 1,745 1,580 - -
TOTAL DEBT SERVICE 5,763 5,648 5,483 3,926 1,525
DEBT SERVICE COVERAGE 184.3% 162.8% 132.8% 237.4% 448.8%
Debt Service Coverage Analysis (000s)
Nashville International Airport (only PFC - 2003 PFC, 2009A, 2010A Bonds)Debt Service Coverage Analysis (000s)
CFC - 2010 CONRAC Debt Service Coverage Analysis (000s)
Nashville International Airport (only BNA for 2003B, 2008A, 2010B, 2010C Bonds)
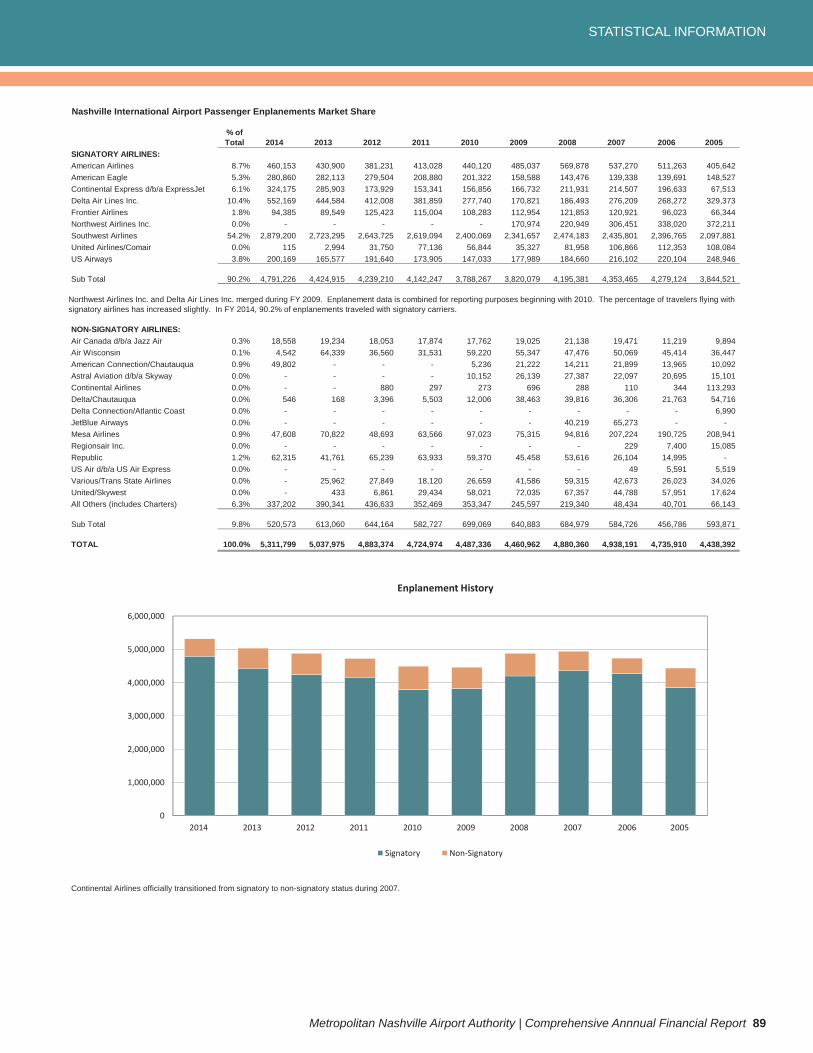
STATISTICAL INFORMATION
Metropolitan Nashville Airport Authority | Comprehensive Annnual Financial Report 89
Nashville International Airport Passenger Enplanements Market Share
% ofTotal 2014 2013 2012 2011 2010 2009 2008 2007 2006 2005
SIGNATORY AIRLINES:American Airlines 8.7% 460,153 430,900 381,231 413,028 440,120 485,037 569,878 537,270 511,263 405,642American Eagle 5.3% 280,860 282,113 279,504 208,880 201,322 158,588 143,476 139,338 139,691 148,527Continental Express d/b/a ExpressJet 6.1% 324,175 285,903 173,929 153,341 156,856 166,732 211,931 214,507 196,633 67,513Delta Air Lines Inc. 10.4% 552,169 444,584 412,008 381,859 277,740 170,821 186,493 276,209 268,272 329,373Frontier Airlines 1.8% 94,385 89,549 125,423 115,004 108,283 112,954 121,853 120,921 96,023 66,344Northwest Airlines Inc. 0.0% - - - - - 170,974 220,949 306,451 338,020 372,211Southwest Airlines 54.2% 2,879,200 2,723,295 2,643,725 2,619,094 2,400,069 2,341,657 2,474,183 2,435,801 2,396,765 2,097,881United Airlines/Comair 0.0% 115 2,994 31,750 77,136 56,844 35,327 81,958 106,866 112,353 108,084US Airways 3.8% 200,169 165,577 191,640 173,905 147,033 177,989 184,660 216,102 220,104 248,946
Sub Total 90.2% 4,791,226 4,424,915 4,239,210 4,142,247 3,788,267 3,820,079 4,195,381 4,353,465 4,279,124 3,844,521
NON-SIGNATORY AIRLINES:Air Canada d/b/a Jazz Air 0.3% 18,558 19,234 18,053 17,874 17,762 19,025 21,138 19,471 11,219 9,894Air Wisconsin 0.1% 4,542 64,339 36,560 31,531 59,220 55,347 47,476 50,069 45,414 36,447American Connection/Chautauqua 0.9% 49,802 - - - 5,236 21,222 14,211 21,899 13,965 10,092Astral Aviation d/b/a Skyway 0.0% - - - - 10,152 26,139 27,387 22,097 20,695 15,101Continental Airlines 0.0% - - 880 297 273 696 288 110 344 113,293Delta/Chautauqua 0.0% 546 168 3,396 5,503 12,006 38,463 39,816 36,306 21,763 54,716Delta Connection/Atlantic Coast 0.0% - - - - - - - - - 6,990JetBlue Airways 0.0% - - - - - - 40,219 65,273 - -Mesa Airlines 0.9% 47,608 70,822 48,693 63,566 97,023 75,315 94,816 207,224 190,725 208,941Regionsair Inc. 0.0% - - - - - - - 229 7,400 15,085Republic 1.2% 62,315 41,761 65,239 63,933 59,370 45,458 53,616 26,104 14,995 -US Air d/b/a US Air Express 0.0% - - - - - - - 49 5,591 5,519Various/Trans State Airlines 0.0% - 25,962 27,849 18,120 26,659 41,586 59,315 42,673 26,023 34,026United/Skywest 0.0% - 433 6,861 29,434 58,021 72,035 67,357 44,788 57,951 17,624All Others (includes Charters) 6.3% 337,202 390,341 436,633 352,469 353,347 245,597 219,340 48,434 40,701 66,143
Sub Total 9.8% 520,573 613,060 644,164 582,727 699,069 640,883 684,979 584,726 456,786 593,871
TOTAL 100.0% 5,311,799 5,037,975 4,883,374 4,724,974 4,487,336 4,460,962 4,880,360 4,938,191 4,735,910 4,438,392
Continental Airlines officially transitioned from signatory to non-signatory status during 2007.
Northwest Airlines Inc. and Delta Air Lines Inc. merged during FY 2009. Enplanement data is combined for reporting purposes beginning with 2010. The percentage of travelers flying with signatory airlines has increased slightly. In FY 2014, 90.2% of enplanements traveled with signatory carriers.
0
1,000,000
2,000,000
3,000,000
4,000,000
5,000,000
6,000,000
2014 2013 2012 2011 2010 2009 2008 2007 2006 2005
Enplanement History
Signatory Non Signatory
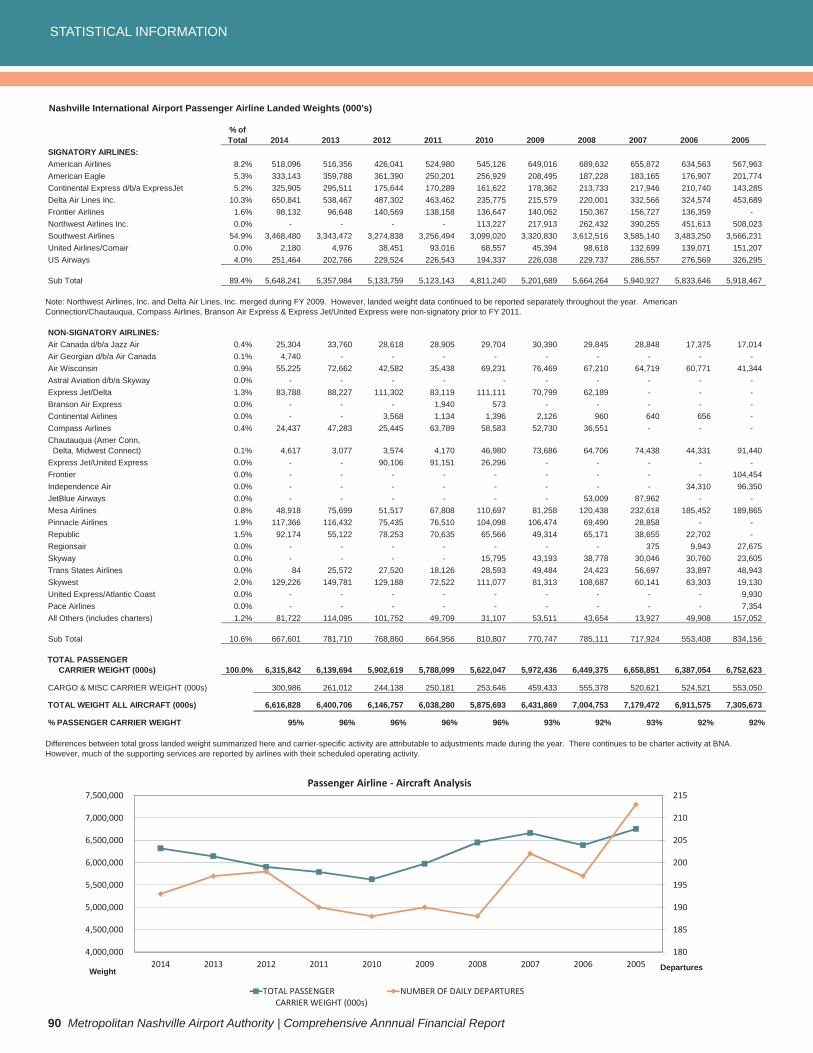
STATISTICAL INFORMATION
90 Metropolitan Nashville Airport Authority | Comprehensive Annnual Financial Report
Nashville International Airport Passenger Airline Landed Weights (000's)
% ofTotal 2014 2013 2012 2011 2010 2009 2008 2007 2006 2005
SIGNATORY AIRLINES:American Airlines 8.2% 518,096 516,356 426,041 524,980 545,126 649,016 689,632 655,872 634,563 567,963American Eagle 5.3% 333,143 359,788 361,390 250,201 256,929 208,495 187,228 183,165 176,907 201,774Continental Express d/b/a ExpressJet 5.2% 325,905 295,511 175,644 170,289 161,622 178,362 213,733 217,946 210,740 143,285Delta Air Lines Inc. 10.3% 650,841 538,467 487,302 463,462 235,775 215,579 220,001 332,566 324,574 453,689Frontier Airlines 1.6% 98,132 96,648 140,569 138,158 136,647 140,062 150,367 156,727 136,359 -Northwest Airlines Inc. 0.0% - - - - 113,227 217,913 262,432 390,255 451,613 508,023Southwest Airlines 54.9% 3,468,480 3,343,472 3,274,838 3,256,494 3,099,020 3,320,830 3,612,516 3,585,140 3,483,250 3,566,231United Airlines/Comair 0.0% 2,180 4,976 38,451 93,016 68,557 45,394 98,618 132,699 139,071 151,207US Airways 4.0% 251,464 202,766 229,524 226,543 194,337 226,038 229,737 286,557 276,569 326,295
Sub Total 89.4% 5,648,241 5,357,984 5,133,759 5,123,143 4,811,240 5,201,689 5,664,264 5,940,927 5,833,646 5,918,467
NON-SIGNATORY AIRLINES:Air Canada d/b/a Jazz Air 0.4% 25,304 33,760 28,618 28,905 29,704 30,390 29,845 28,848 17,375 17,014Air Georgian d/b/a Air Canada 0.1% 4,740 - - - - - - - - -Air Wisconsin 0.9% 55,225 72,662 42,582 35,438 69,231 76,469 67,210 64,719 60,771 41,344Astral Aviation d/b/a Skyway 0.0% - - - - - - - - - -Express Jet/Delta 1.3% 83,788 88,227 111,302 83,119 111,111 70,799 62,189 - - -Branson Air Express 0.0% - - - 1,940 573 - - - - -Continental Airlines 0.0% - - 3,568 1,134 1,396 2,126 960 640 656 -Compass Airlines 0.4% 24,437 47,283 25,445 63,789 58,583 52,730 36,551 - - -Chautauqua (Amer Conn,
Delta, Midwest Connect) 0.1% 4,617 3,077 3,574 4,170 46,980 73,686 64,706 74,438 44,331 91,440Express Jet/United Express 0.0% - - 90,106 91,151 26,296 - - - - -Frontier 0.0% - - - - - - - - - 104,454Independence Air 0.0% - - - - - - - - 34,310 96,350JetBlue Airways 0.0% - - - - - - 53,009 87,962 - -Mesa Airlines 0.8% 48,918 75,699 51,517 67,808 110,697 81,258 120,438 232,618 185,452 189,865Pinnacle Airlines 1.9% 117,366 116,432 75,435 76,510 104,098 106,474 69,490 28,858 - -Republic 1.5% 92,174 55,122 78,253 70,635 65,566 49,314 65,171 38,655 22,702 -Regionsair 0.0% - - - - - - - 375 9,943 27,675Skyway 0.0% - - - - 15,795 43,193 38,778 30,046 30,760 23,605Trans States Airlines 0.0% 84 25,572 27,520 18,126 28,593 49,484 24,423 56,697 33,897 48,943Skywest 2.0% 129,226 149,781 129,188 72,522 111,077 81,313 108,687 60,141 63,303 19,130United Express/Atlantic Coast 0.0% - - - - - - - - - 9,930Pace Airlines 0.0% - - - - - - - - - 7,354All Others (includes charters) 1.2% 81,722 114,095 101,752 49,709 31,107 53,511 43,654 13,927 49,908 157,052
Sub Total 10.6% 667,601 781,710 768,860 664,956 810,807 770,747 785,111 717,924 553,408 834,156
TOTAL PASSENGER CARRIER WEIGHT (000s) 100.0% 6,315,842 6,139,694 5,902,619 5,788,099 5,622,047 5,972,436 6,449,375 6,658,851 6,387,054 6,752,623
CARGO & MISC CARRIER WEIGHT (000s) 300,986 261,012 244,138 250,181 253,646 459,433 555,378 520,621 524,521 553,050
TOTAL WEIGHT ALL AIRCRAFT (000s) 6,616,828 6,400,706 6,146,757 6,038,280 5,875,693 6,431,869 7,004,753 7,179,472 6,911,575 7,305,673
% PASSENGER CARRIER WEIGHT 95% 96% 96% 96% 96% 93% 92% 93% 92% 92%
Differences between total gross landed weight summarized here and carrier-specific activity are attributable to adjustments made during the year. There continues to be charter activity at BNA. However, much of the supporting services are reported by airlines with their scheduled operating activity.
Note: Northwest Airlines, Inc. and Delta Air Lines, Inc. merged during FY 2009. However, landed weight data continued to be reported separately throughout the year. American Connection/Chautauqua, Compass Airlines, Branson Air Express & Express Jet/United Express were non-signatory prior to FY 2011.
180
185
190
195
200
205
210
215
4,000,000
4,500,000
5,000,000
5,500,000
6,000,000
6,500,000
7,000,000
7,500,000
2014 2013 2012 2011 2010 2009 2008 2007 2006 2005
Passenger Airline Aircraft Analysis
TOTAL PASSENGERCARRIER WEIGHT (000s)
NUMBER OF DAILY DEPARTURES
Weight Departures
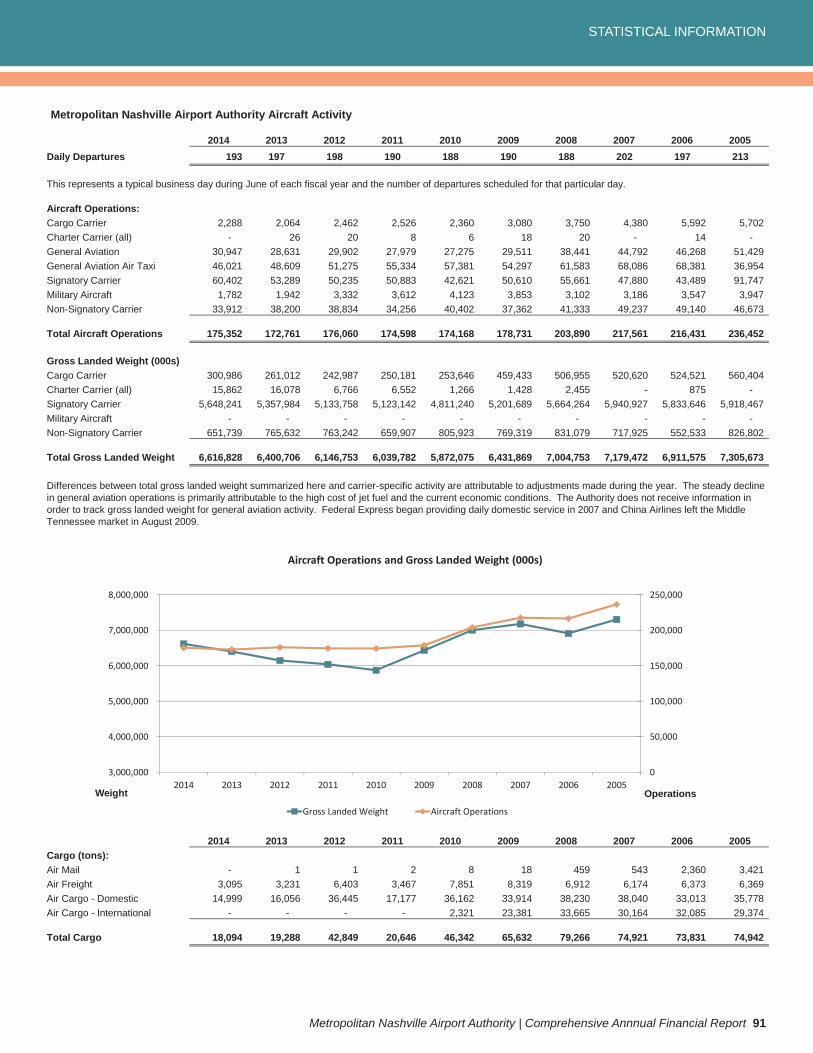
STATISTICAL INFORMATION
Metropolitan Nashville Airport Authority | Comprehensive Annnual Financial Report 91
Metropolitan Nashville Airport Authority Aircraft Activity
2014 2013 2012 2011 2010 2009 2008 2007 2006 2005Daily Departures 193 197 198 190 188 190 188 202 197 213
This represents a typical business day during June of each fiscal year and the number of departures scheduled for that particular day.
Aircraft Operations:Cargo Carrier 2,288 2,064 2,462 2,526 2,360 3,080 3,750 4,380 5,592 5,702Charter Carrier (all) - 26 20 8 6 18 20 - 14 -General Aviation 30,947 28,631 29,902 27,979 27,275 29,511 38,441 44,792 46,268 51,429General Aviation Air Taxi 46,021 48,609 51,275 55,334 57,381 54,297 61,583 68,086 68,381 36,954Signatory Carrier 60,402 53,289 50,235 50,883 42,621 50,610 55,661 47,880 43,489 91,747Military Aircraft 1,782 1,942 3,332 3,612 4,123 3,853 3,102 3,186 3,547 3,947Non-Signatory Carrier 33,912 38,200 38,834 34,256 40,402 37,362 41,333 49,237 49,140 46,673
Total Aircraft Operations 175,352 172,761 176,060 174,598 174,168 178,731 203,890 217,561 216,431 236,452
Gross Landed Weight (000s)Cargo Carrier 300,986 261,012 242,987 250,181 253,646 459,433 506,955 520,620 524,521 560,404Charter Carrier (all) 15,862 16,078 6,766 6,552 1,266 1,428 2,455 - 875 -Signatory Carrier 5,648,241 5,357,984 5,133,758 5,123,142 4,811,240 5,201,689 5,664,264 5,940,927 5,833,646 5,918,467Military Aircraft - - - - - - - - - -Non-Signatory Carrier 651,739 765,632 763,242 659,907 805,923 769,319 831,079 717,925 552,533 826,802
Total Gross Landed Weight 6,616,828 6,400,706 6,146,753 6,039,782 5,872,075 6,431,869 7,004,753 7,179,472 6,911,575 7,305,673
2014 2013 2012 2011 2010 2009 2008 2007 2006 2005Cargo (tons):Air Mail - 1 1 2 8 18 459 543 2,360 3,421Air Freight 3,095 3,231 6,403 3,467 7,851 8,319 6,912 6,174 6,373 6,369Air Cargo - Domestic 14,999 16,056 36,445 17,177 36,162 33,914 38,230 38,040 33,013 35,778Air Cargo - International - - - - 2,321 23,381 33,665 30,164 32,085 29,374
Total Cargo 18,094 19,288 42,849 20,646 46,342 65,632 79,266 74,921 73,831 74,942
Differences between total gross landed weight summarized here and carrier-specific activity are attributable to adjustments made during the year. The steady decline in general aviation operations is primarily attributable to the high cost of jet fuel and the current economic conditions. The Authority does not receive information in order to track gross landed weight for general aviation activity. Federal Express began providing daily domestic service in 2007 and China Airlines left the Middle Tennessee market in August 2009.
0
50,000
100,000
150,000
200,000
250,000
3,000,000
4,000,000
5,000,000
6,000,000
7,000,000
8,000,000
2014 2013 2012 2011 2010 2009 2008 2007 2006 2005
Aircraft Operations and Gross Landed Weight (000s)
Gross Landed Weight Aircraft Operations
Weight Operations
STATISTICAL INFORMATION
92 Metropolitan Nashville Airport Authority | Comprehensive Annnual Financial Report
Major Tenants at Nashville International Airport and John C. Tune Airport
Signatory Carriers: Other Airport Tenants: Vehicle Parking:American Airlines 118th Airlift Wing Standard Parking PlusEnvoy Airlines Aeronautical Radio First Transit, Inc. (airport shuttle)Delta Air Lines Inc. Aircraft Services InternationalExpress Jet (Continental Express) Airline Maintenance ServicesFrontier Embraer Aircraft Maintenance Private Hangar Rentals:Republic Airways Holdings* Federal Aviation Administration Nashville HangarSouthwest Airlines Genesco, Inc. Owl Hill HoldingsUnited Airlines Marisol SATA, Inc.US Airways Metro Air Services
Metro GovernmentMonell's at the Manor Rental Car:
Non-signatory Carriers: State of Tennessee AvisAir Georgian d/b/a Air Canada TN Aeronautics Commission Advantage Car RentalAir Wisconsin TN Dept of Transportation BudgetEndeavor Airlines US Customs Border Patrol DollarMesa Airlines US Govt Weather Service EnterprisePSA (owned by US Airways) US Postal Service HertzSeaport US DEA Vanguard (Alamo/National)Shuttle AmericaSkywest
Other Terminal Tenants: Tenants at John C. Tune Airport:24 Hour Flower Corporate Flight Management
Cargo Carriers: A T & T Cumberland AvionicsAir General, Inc. CareHere Medical Clinic HelistarMid South Express Clear Channel Airports Robert Orr/SyscoMiller Transport CTN Superior ShineBeaver Expedite Delaware North (Food & Beverage Concession)Service By Air Fifth Third Bank
Capital Cargo Int'l. First Class SeatsDHL/Astar Express GraycliffFederal Express Green Bean Coffee CompanyMoutain Air Cargo HMSHost (Food & Beverage Concession)
Hudson Group (News & Gift Concession)In Motion
Fixed-base Operators: Jarmon LimousineAtlantic Aviation Massage Bar IncSignature Flight Support Nashville Nails
New Zoom SystemsGaylord Opryland Resort
Ground Transportation: Security Point MediaHotel Shuttles Smarte CarteTaxicab Companies SunTrust BankLimousine Companies TSA
Wright Travel Business Center
Ground Handlers:Dynair/Swissport
* Includes Frontier, Republic, Shuttle America and Chautauqua Airlines. Became Signatory July 2011.
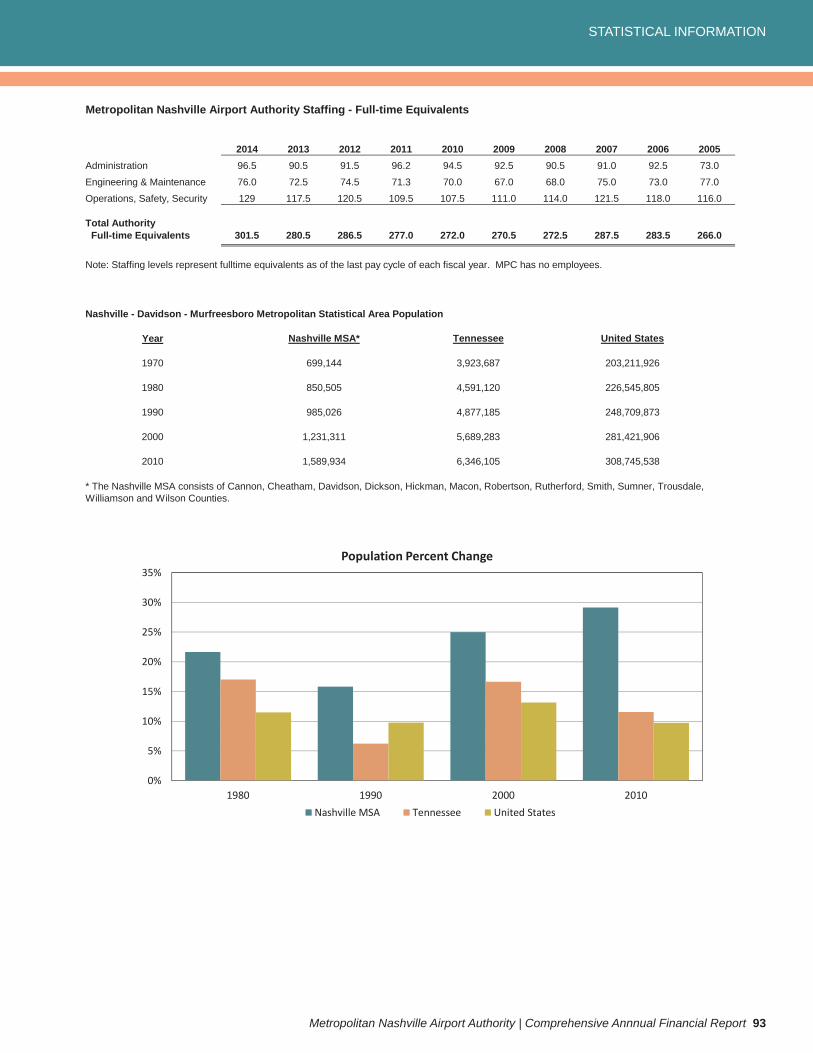
STATISTICAL INFORMATION
Metropolitan Nashville Airport Authority | Comprehensive Annnual Financial Report 93
Metropolitan Nashville Airport Authority Staffing - Full-time Equivalents
2014 2013 2012 2011 2010 2009 2008 2007 2006 2005Administration 96.5 90.5 91.5 96.2 94.5 92.5 90.5 91.0 92.5 73.0Engineering & Maintenance 76.0 72.5 74.5 71.3 70.0 67.0 68.0 75.0 73.0 77.0Operations, Safety, Security 129 117.5 120.5 109.5 107.5 111.0 114.0 121.5 118.0 116.0
Total Authority Full-time Equivalents 301.5 280.5 286.5 277.0 272.0 270.5 272.5 287.5 283.5 266.0
Note: Staffing levels represent fulltime equivalents as of the last pay cycle of each fiscal year. MPC has no employees.
Nashville - Davidson - Murfreesboro Metropolitan Statistical Area Population
Year
1970
1980
1990
2000
2010
* The Nashville MSA consists of Cannon, Cheatham, Davidson, Dickson, Hickman, Macon, Robertson, Rutherford, Smith, Sumner, Trousdale, Williamson and Wilson Counties.
1,589,934
1,231,311
985,026
Tennessee
203,211,926
United States
699,144
Nashville MSA*
3,923,687
850,505
308,745,538
281,421,906
248,709,873
226,545,8054,591,120
4,877,185
6,346,105
5,689,283
0%
5%
10%
15%
20%
25%
30%
35%
1980 1990 2000 2010
Population Percent Change
Nashville MSA Tennessee United States
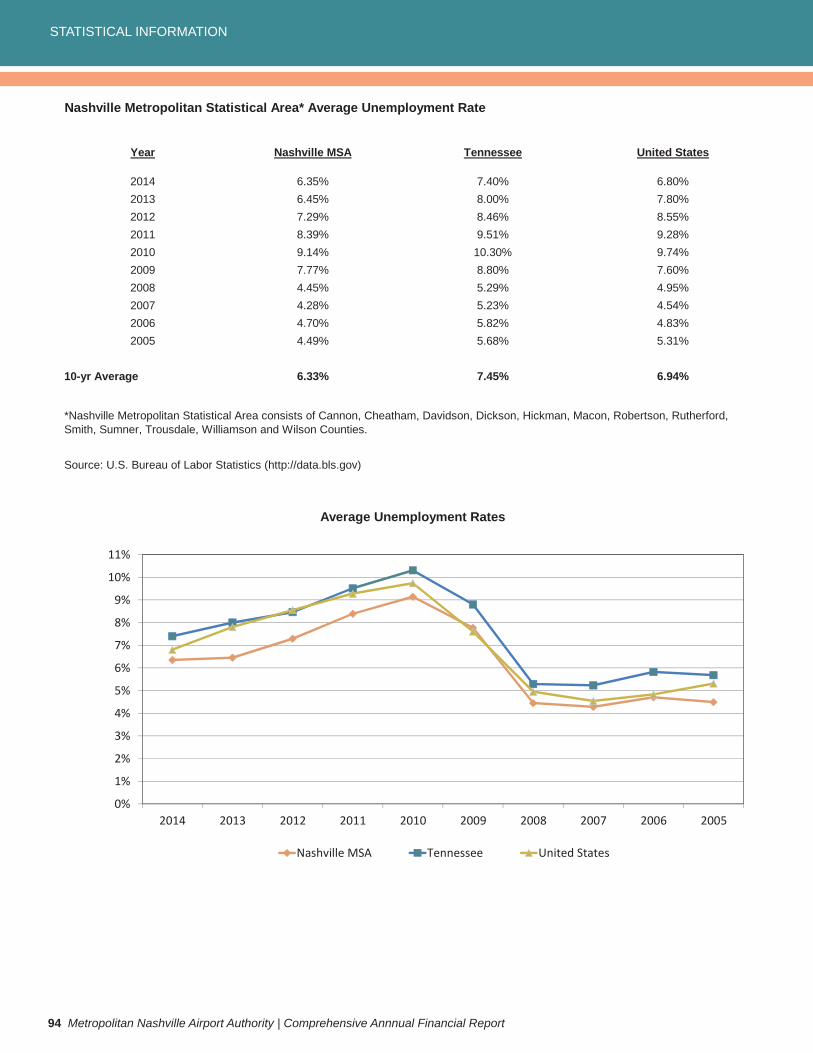
STATISTICAL INFORMATION
94 Metropolitan Nashville Airport Authority | Comprehensive Annnual Financial Report
Nashville Metropolitan Statistical Area* Average Unemployment Rate
Year Nashville MSA Tennessee United States
2014 6.35% 7.40% 6.80%2013 6.45% 8.00% 7.80%2012 7.29% 8.46% 8.55%2011 8.39% 9.51% 9.28%2010 9.14% 10.30% 9.74%2009 7.77% 8.80% 7.60%2008 4.45% 5.29% 4.95%2007 4.28% 5.23% 4.54%2006 4.70% 5.82% 4.83%2005 4.49% 5.68% 5.31%
10-yr Average 6.33% 7.45% 6.94%
Source: U.S. Bureau of Labor Statistics (http://data.bls.gov)
*Nashville Metropolitan Statistical Area consists of Cannon, Cheatham, Davidson, Dickson, Hickman, Macon, Robertson, Rutherford, Smith, Sumner, Trousdale, Williamson and Wilson Counties.
Average Unemployment Rates
0%
1%
2%
3%
4%
5%
6%
7%
8%
9%
10%
11%
2014 2013 2012 2011 2010 2009 2008 2007 2006 2005
Nashville MSA Tennessee United States
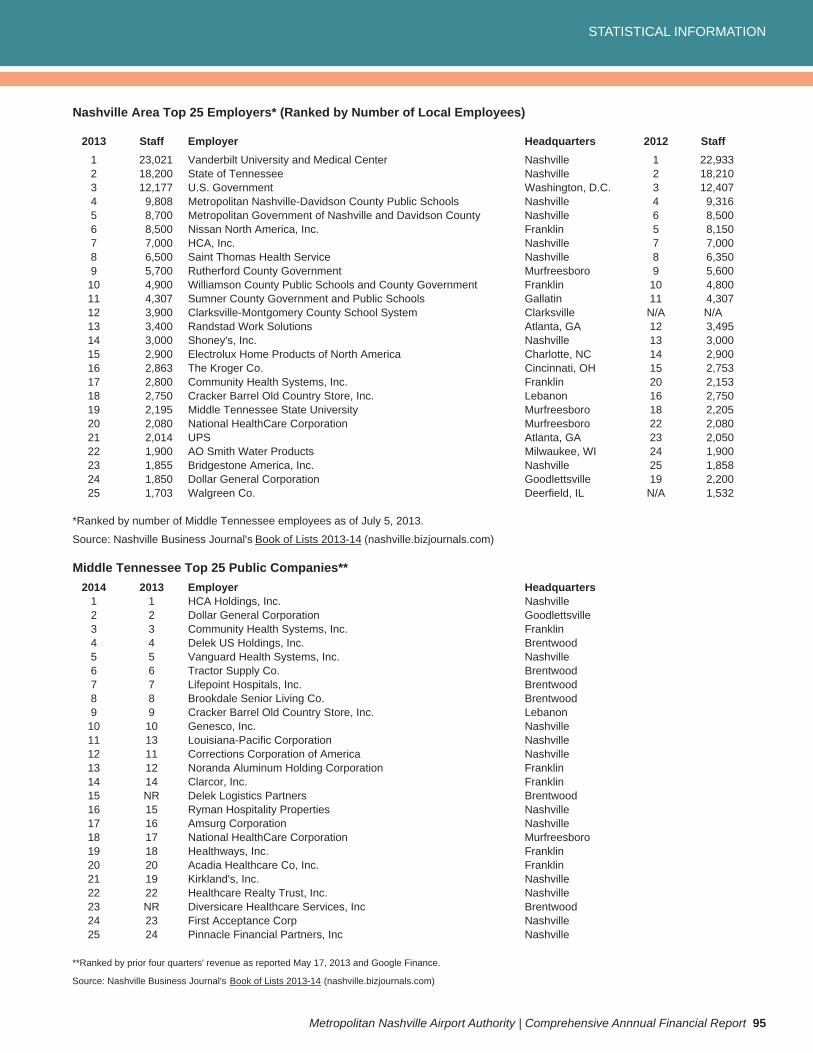
STATISTICAL INFORMATION
Metropolitan Nashville Airport Authority | Comprehensive Annnual Financial Report 95
Nashville Area Top 25 Employers* (Ranked by Number of Local Employees)
2013 Staff Employer Headquarters 2012 Staff1 23,021 Vanderbilt University and Medical Center Nashville 1 22,9332 18,200 State of Tennessee Nashville 2 18,2103 12,177 U.S. Government Washington, D.C. 3 12,4074 9,808 Metropolitan Nashville-Davidson County Public Schools Nashville 4 9,3165 8,700 Metropolitan Government of Nashville and Davidson County Nashville 6 8,5006 8,500 Nissan North America, Inc. Franklin 5 8,1507 7,000 HCA, Inc. Nashville 7 7,0008 6,500 Saint Thomas Health Service Nashville 8 6,3509 5,700 Rutherford County Government Murfreesboro 9 5,60010 4,900 Williamson County Public Schools and County Government Franklin 10 4,80011 4,307 Sumner County Government and Public Schools Gallatin 11 4,30712 3,900 Clarksville-Montgomery County School System Clarksville N/A N/A13 3,400 Randstad Work Solutions Atlanta, GA 12 3,49514 3,000 Shoney's, Inc. Nashville 13 3,00015 2,900 Electrolux Home Products of North America Charlotte, NC 14 2,90016 2,863 The Kroger Co. Cincinnati, OH 15 2,75317 2,800 Community Health Systems, Inc. Franklin 20 2,15318 2,750 Cracker Barrel Old Country Store, Inc. Lebanon 16 2,75019 2,195 Middle Tennessee State University Murfreesboro 18 2,20520 2,080 National HealthCare Corporation Murfreesboro 22 2,08021 2,014 UPS Atlanta, GA 23 2,05022 1,900 AO Smith Water Products Milwaukee, WI 24 1,90023 1,855 Bridgestone America, Inc. Nashville 25 1,85824 1,850 Dollar General Corporation Goodlettsville 19 2,20025 1,703 Walgreen Co. Deerfield, IL N/A 1,532
*Ranked by number of Middle Tennessee employees as of July 5, 2013.
Source: Nashville Business Journal's Book of Lists 2013-14 (nashville.bizjournals.com)
Middle Tennessee Top 25 Public Companies**2014 2013 Employer Headquarters
1 1 HCA Holdings, Inc. Nashville2 2 Dollar General Corporation Goodlettsville3 3 Community Health Systems, Inc. Franklin4 4 Delek US Holdings, Inc. Brentwood5 5 Vanguard Health Systems, Inc. Nashville6 6 Tractor Supply Co. Brentwood7 7 Lifepoint Hospitals, Inc. Brentwood8 8 Brookdale Senior Living Co. Brentwood9 9 Cracker Barrel Old Country Store, Inc. Lebanon10 10 Genesco, Inc. Nashville11 13 Louisiana-Pacific Corporation Nashville12 11 Corrections Corporation of America Nashville13 12 Noranda Aluminum Holding Corporation Franklin14 14 Clarcor, Inc. Franklin15 NR Delek Logistics Partners Brentwood16 15 Ryman Hospitality Properties Nashville17 16 Amsurg Corporation Nashville18 17 National HealthCare Corporation Murfreesboro19 18 Healthways, Inc. Franklin20 20 Acadia Healthcare Co, Inc. Franklin21 19 Kirkland's, Inc. Nashville22 22 Healthcare Realty Trust, Inc. Nashville23 NR Diversicare Healthcare Services, Inc Brentwood24 23 First Acceptance Corp Nashville25 24 Pinnacle Financial Partners, Inc Nashville
**Ranked by prior four quarters' revenue as reported May 17, 2013 and Google Finance.
Source: Nashville Business Journal's Book of Lists 2013-14 (nashville.bizjournals.com)

ONE TERMINAL DRIVE | SUITE 501 | NASHVILLE, TN 37214-4114 | (615) 275-1600
flynashville.com