Embed Size (px)
Citation preview

COMPREHENSIVE ANNUALFINANCIAL REPORTFISCAL YEAR ENDINGJUNE 30, 2019
www.cityofandersonsc.com

CITY OF ANDERSON, SOUTH CAROLINA
COMPREHENSIVE ANNUAL FINANCIAL REPORT
YEAR ENDED JUNE 30, 2019
Prepared By: Finance Department Margot B. Martin Finance Director


CITY OF ANDERSON, SOUTH CAROLINA
TABLE OF CONTENTS
YEAR ENDED JUNE 30, 2019
Page Number
Table of Contents i
Transmittal Letter 1
List of Principal Officials and Management Team 7
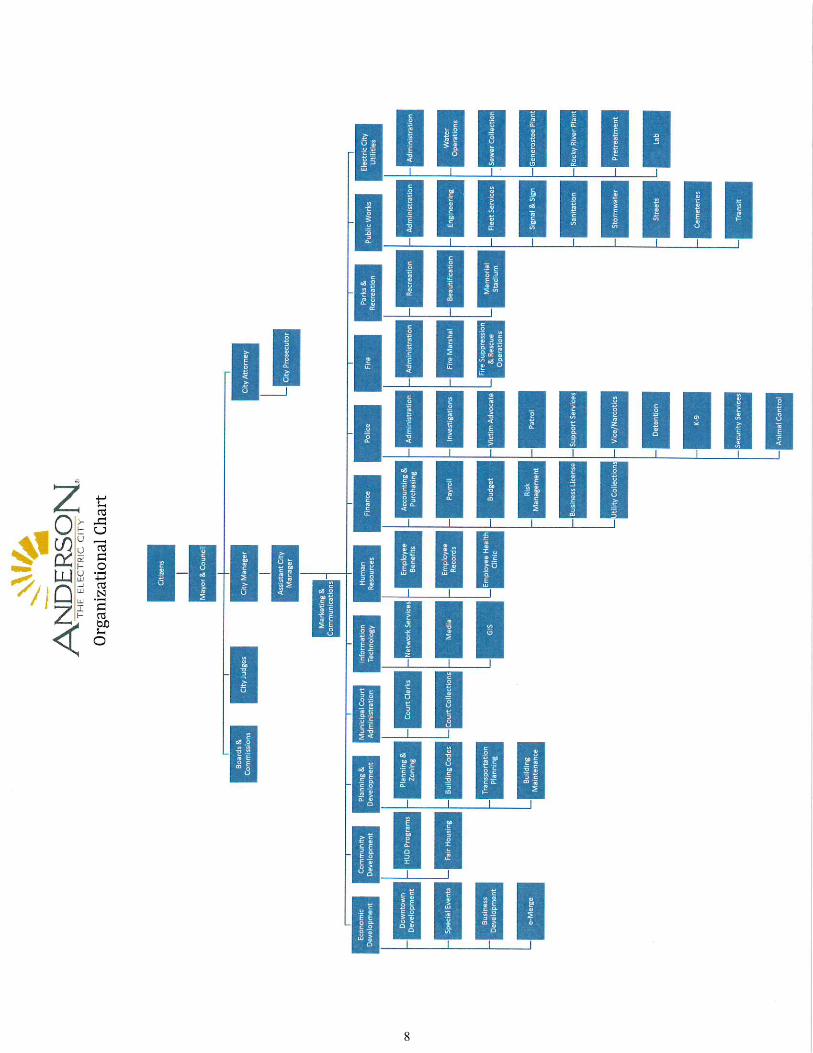
City of Anderson Organizational Chart 8
Certificate of Achievement for Excellence in Financial Reporting 9
INDEPENDENT AUDITOR'S REPORT 11
Management's Discussion and Analysis 13
Basic Financial Statements
Government-Wide Financial Statements
Statement of Net Position 26
Statement of Activities 27
Fund Financial Statements:
Balance Sheet - Governmental Funds 28
Reconciliation of the Governmental Funds Balance Sheet to the Statement of Net Position 29
Statement of Revenues, Expenditures, and Changes in Fund Balances - Governmental Funds 30
Reconciliation of the Governmental Funds Statement of Revenues, Expenditures,and Changes in Fund Balances to the Statement of Activities 31
Statement of Net Position - Proprietary Funds 32
Statement of Revenues, Expenses, and Changes in Fund Net Position - Proprietary Funds 33
Statement of Cash Flows - Proprietary Funds 34
Statement of Assets and Liabilities - Fiduciary Fund - Agency Fund 35
Statement of Net Position - Fiduciary Fund - Pension Trust Fund 36
Statement of Changes in Net Position - Fiduciary Fund - Pension Trust Fund 37
Notes to the Financial Statements 38
Budgetary Comparison Schedule
Schedule of Revenues, Expenditures, and Changes in Fund Balances - Budgets and Actual - General Fund 87
Notes to Budgetary Comparison Schedule 90
Other Postemployment Benefit Plan Schedule
City of Anderson Defined Benefit Retiree Healthcare Plan - Schedule of Changes in theTotal OPEB Liability and Related Ratios 91
FINANCIAL SECTION
INTRODUCTORY SECTION (UNAUDITED)
Required Supplementary Information
(Continued)
i

CITY OF ANDERSON, SOUTH CAROLINA
TABLE OF CONTENTS
YEAR ENDED JUNE 30, 2019
Page Number
Pension Plan Schedules
City of Anderson General Employees' Retirement Plan Schedules
Schedule of Changes in the Net Pension Liability and Related Ratios 92
Schedule of Contributions 93
Schedule of Investment Returns 94
South Carolina Police Officers Retirement System Schedules
Schedule of the City of Anderson's Proportionate Share of the Net Pension Liability 95
Schedule of Contributions 96
Combining and Individual Fund Financial Schedules
Combining Balance Sheet - Nonmajor Governmental Funds 98
Combining Schedule of Revenues, Expenditures, and Changes in Fund Balances -Nonmajor Governmental Funds 100
Special Revenue Funds
Schedule of Revenues, Expenditures, and Changes in Fund Balances -Budgets and Actual - Community Development Fund 105
Schedule of Revenues, Expenditures, and Changes in Fund Balances -Budgets and Actual - Perpetual Care Fund 106
Schedule of Revenues, Expenditures, and Changes in Fund Balances -Budgets and Actual - Accommodations Tax Fund 107
Schedule of Revenues, Expenditures, and Changes in Fund Balances -Budgets and Actual - Hospitality Fee Fund 108
Capital Projects Funds
Schedule of Revenues, Expenditures, and Changes in Fund Balances -Budgets and Actual - Capital Replacement Fund 111
Permanent Funds
Schedule of Revenues, Expenditures, and Changes in Fund Balances -Budgets and Actual - Transportation Investment Fund 115
Proprietary Funds
Schedule of Revenues, Expenses, and Changes in Fund Net PositionBudgets and Actual - Sewer Fund 119
Schedule of Revenues, Expenses, and Changes in Fund Net PositionBudgets and Actual - Water Fund 120
Schedule of Revenues, Expenses, and Changes in Fund Net PositionBudgets and Actual - Storm Water Fund 121
Schedule of Revenues, Expenses, and Changes in Fund Net PositionBudgets and Actual - Transit Fund 122
Required Supplementary Information (Continued)
Supplementary Information
FINANCIAL SECTION (CONTINUED)
(Continued)
ii

CITY OF ANDERSON, SOUTH CAROLINA
TABLE OF CONTENTS
YEAR ENDED JUNE 30, 2019
Page Number
Combining and Individual Fund Financial Schedules (Continued)
Fiduciary Funds
Statement of Changes in Assets and Liabilities - Fiduciary Fund - Agency Fund - Forfeitures and Seizures Fund 125
Other Schedules
Uniform Schedule of Fines, Assessments, and Surcharges (Per Act 96) 127
Schedule of Budgeted to Actual Cost for the South Carolina Department of Transportation 128
Financial Trends Information
Net Position by Component - Last Ten Fiscal Years - (accrual basis of accounting) 133
Changes in Net Position - Last Ten Fiscal Years - (accrual basis of accounting) 134
Governmental Activities Tax Revenue by Source - Last Ten Fiscal Years - (accrual basis of accounting) 136
Fund Balances of Governmental Funds - Last Ten Fiscal Years - (modified accrual basis of accounting) 137
Changes in Fund Balances of Governmental Funds - Last Ten Fiscal Years - (modified accrual basis of accounting) 138
Revenue Capacity Information
Assessed Value and Estimated Actual Value of Taxable Property - Last Ten Fiscal Years 140
Property Tax Rates - Direct and Overlapping Governments - Last Ten Fiscal Years 141
Principal Property Taxpayers - Current Year and Nine Years Ago 142
Property Tax Levies and Collections - Last Ten Fiscal Years 143
Debt Capacity Information
Ratios of Outstanding Debt by Type - Last Ten Fiscal Years 144
Ratios of General Bonded Debt Outstanding - Last Ten Fiscal Years 145
Direct and Overlapping Governmental Activities Debt - As of June 30, 2019 146
Legal Debt Margin Information - Last Ten Fiscal Years 147
Pledged Revenue Coverage - Last Ten Fiscal Years 148
Demographic and Economic Information
Demographic and Economic Statistics - Last Ten Fiscal Years 149
Principal Employers - Current Year and Nine Years Ago 150
Operating Information
Full-Time Equivalent City Government Employees by Function - Last Ten Fiscal Years 151
Operating Indicators - Last Ten Fiscal Years 152
Capital Asset Statistics - Last Ten Fiscal Years 153
STATISTICAL SECTION (UNAUDITED)
FINANCIAL SECTION (CONTINUED)
Supplementary Information (Continued)
(Continued)
iii

CITY OF ANDERSON, SOUTH CAROLINA
TABLE OF CONTENTS
YEAR ENDED JUNE 30, 2019
Page Number
Schedule of Expenditures of Federal Awards 155
Notes to the Schedule of Expenditures of Federal Awards 156
Independent Auditor's Report - Report on Internal Control Over Financial Reporting and on Compliance and Other MattersBased on an Audit of Financial Statements Performed in Accordance With Government Auditing Standards 157
Independent Auditor's Report - Report on Compliance for Each Major Federal Program and Report on InternalControl Over Compliance Required by the Uniform Guidance 159
Schedule of Findings and Questioned Costs 161
Summary Schedule of Prior Audit Findings 162
Schedule of Sewer System Service Statistics - Sewer Fund 163
Schedule of Water Meter Service - Water Fund 164
Schedule of Largest Utility Users - Water and Sewer Funds 165
Schedule of Utility Rates - Water and Sewer Funds 166
COMPLIANCE SECTION
CONTINUING DISCLOSURE SECTION (UNAUDITED)
iv

November 22, 2019 The Honorable Mayor Members of City Council City of Anderson, South Carolina Dear Mayor Roberts and City Council Members: State law requires that all general-purpose local governments, at the close of each fiscal year, publish a complete set of financial statements presented in conformity with accounting principles generally accepted in the United States of America (“GAAP”) and audited in accordance with generally accepted auditing standards by a firm of licensed certified public accountants. Pursuant to that requirement, we hereby issue the Comprehensive Annual Financial Report (“CAFR”) of the City of Anderson, South Carolina for the fiscal year ended June 30, 2019. This report consists of management’s representations concerning the finances of the City of Anderson. Consequently, management assumes full responsibility for the completeness and reliability of all of the information presented in this report. To provide a reasonable basis for making these representations, management of the City of Anderson has established a comprehensive internal control framework that is designed both to protect the government’s assets from loss, theft, or misuse and to compile sufficient reliable information for the preparation of the City of Anderson’s financial statements in conformity with GAAP. Because the cost of internal controls should not outweigh their benefits, the City of Anderson’s comprehensive framework of internal controls has been designed to provide reasonable rather than absolute assurance that the financial statements will be free from material misstatement. As management, we assert that, to the best of our knowledge and belief, this financial report is complete and reliable in all material respects. The City of Anderson’s financial statements have been audited by Greene Finney, LLP, a firm of licensed public accountants. The goal of the independent audit was to provide reasonable assurance that the financial statements of the City for the fiscal year ending June 30, 2019 are free of material misstatement. The independent audit involved examining, on a test basis, evidence supporting the amounts and disclosures in the financial statements; assessing the accounting principles used and significant estimates made by management; and evaluating the overall financial statement presentation. The independent auditor concluded, based upon the audit, that there was a reasonable basis for rendering an unmodified opinion that the City of Anderson’s financial statements for the fiscal year ended June 30, 2019 are fairly presented in conformity with GAAP. The independent auditors’ report is presented in the Financial Section of this report. The independent audit of the financial statements of the City of Anderson was part of a broader, federally mandated “Single Audit” designed to meet the special needs of federal grantor agencies. The standards governing Single Audit engagements require the independent auditor to report not only on the fair presentation of the financial statements, but also on the audited government’s internal controls and compliance with legal requirements, with special emphasis on internal controls and legal requirements involving the administration of federal awards. These reports are presented in the Compliance Section of the CAFR. GAAP requires that management provide a narrative introduction, overview, and analysis to accompany the basic financial statements in the form of Management’s Discussion and Analysis (“MD&A”). This letter of transmittal is designed to complement MD&A and should be read in conjunction with it. The City of Anderson’s MD&A can be found in the Financial Section of the CAFR.
1
PROFILE Community Profile Anderson was named for General Robert Anderson, a Revolutionary War hero who was born in 1741 in August County, Va. As a young man, he came to South Carolina to help his good friend, Andrew Pickens, in surveying some land that had been given to the English Colony by the Indians. The City was founded in December 1826 and incorporated by an act of Legislature, December 9, 1833. Due to the innovation of engineer William Whitner, Anderson was the first city in the United States to have a continuous supply of electric power. The electricity was supplied by a water mill located in the high shoals area of the Rocky River in Anderson County. Several areas in Anderson are named in honor of William Whitner, including a downtown street. In 1897, the first cotton gin in the world to be operated by electricity was in Anderson County, earning the community the nickname “The Electric City”. City Government Section 47-26 of the 1962 Code of Laws, as amended (Home Rule Act), requires that municipalities adopt a specific form of government. The City operates under Council-Manager form of government. The Council is composed of a Mayor and eight Council members. The Mayor and two Council members are elected at-large and six Council members are elected on a single member ward basis. The Mayor and Council, elected for four-year staggered terms, are vested with the legislative and policymaking powers of the City. The Council appoints a City Manager who serves as the chief executive officer of the City and is responsible to the Council for proper administration of all affairs of the City. Thirteen division heads currently report to the City Manager and are responsible for the following functions: Police, Fire, Public Works, Electric City Utilities, Community Development, City Attorney, Courts, Finance, Human Resources, Information Technology, Economic Development, Planning & Development, and Recreation & Parks. The City operates and maintains various programs which are funded from City revenues, as reflected in its annual budget for fiscal year 2018 - 2019 and provides a full range of services contemplated by statute. These services include the public safety (police and fire) public works; utilities, recreational activities; planning; zoning and community services. Budget Process In accordance with the General Statutes of the State of South Carolina, the City Council is required to adopt an annual balanced budget prior to July 1st. The City uses the adopted budget as a management control device during the year. A balanced budget is achieved when the City is able to equate the revenues with expenditure over the business cycles. The budget process begins in February with a special, comprehensive work session in which the Finance Department and City Manager’s Office meets with all Departments to discuss current and future trends, needs, and goals of the City. During this meeting the budget calendar is reviewed and budget manuals are distributed to each department. These manuals contain a detailed description of the mechanics associated with the budget. Each department then prepares a comprehensive list of objectives and funding requests they would like to have considered for the upcoming budget year. During this time the Finance Department prepares revenue estimates for both the current and upcoming years. Appropriate departments also prepare their own revenue projections for those revenue items affecting their departments. Each department then meets individually with the City Manager’s Office and the Finance Office to review program budgets and expenditure requests. During these meetings, the goals of each department are reviewed and expenditure requests are evaluated to determine the fiscal resources necessary to accomplish these goals. Following these meetings, the City Manager’s Office and the Finance Department meet to prepare a draft budget for submission to City Council. This draft budget is submitted to Council at formal budget workshops held in May and June. The public has an opportunity to comment on the budget at a designated public hearing. A public hearing and two readings are required for formal adoption of the budget. Amendments to the budget are allowable under South Carolina law and are made throughout the year as necessary.
2
FACTORS AFFECTING ECONOMIC CONDITION Local Economy The City of Anderson is located in the northwest corner of the state of South Carolina on the Piedmont Plateau. The City of Anderson is the county seat and the largest municipality in the county with a population of approximately 27,500. The City is ideally located on the busy Interstate 85 corridor, to which much of its economic growth can be attributed. Anderson County, South Carolina lies midway between Atlanta, Georgia and Charlotte, North Carolina on the I-85 corridor, which is one of the nation’s hottest growth areas and one of the heaviest traveled highways in the southeast. Business leaders and development officials in Anderson have taken advantage of this asset, and visible progress is the result. Anderson is a major contributor to the success of the upstate. Anderson offers all of the basics upon which to build a thriving economy, including affordable land, a good transportation system, infrastructure, and a large number of recreational amenities. The Anderson community offers the feel of small-town living with the attractions and business opportunities of larger cities only a short drive away. The City encompasses approximately 15.3 square miles. Long-Term Financial Planning The City of Anderson each year presents detailed strategies for implementing annual goals. Many of these goals progress a great deal during the year, while others require more time. Both the goals and strategies are indicative of the City’s Mission Statement and our visions for the future.
Continue to improve and enhance our neighborhoods o Continue to reduce substandard housing through demolition and clearance; increase new housing
opportunities by rebuilding and partnering with residents, businesses, and other entities; boost beautification efforts through enhanced neighborhood gateways for visual appeal and safety.
o Develop sustainable programs that can be replicated throughout our neighborhoods, and encourage the engagement of neighborhood residents to work together and regroup to achieve an improved sense of livability.
o Improving the local economy by awarding business loans to small businesses and microenterprises located in a redevelopment area or Central Business District.
Continue our downtown revitalization efforts
o Increase our emphasis on assistance and incentives that encourage private investment, and increase the growth of the Tax Increment Financing district for continued public infrastructure investment.
o Expand the focus and reach of the downtown master plan by fine-tuning the elements that compliment development i.e. wayfinding, maintenance, partnerships, marketing, promotion, etc.
o Continue efforts to promote expansion of residential, retail, and other economic development as well as the amenities to compliment them.
Strengthen our recreation and parks programs and tourism opportunities
o Focus on comprehensive recreation, parks and tourism development through collaboration. o Maximize the positive impact of the Recreation Center on the community, and generate opportunities to
promote active and healthy lifestyles.
Communicate the importance and value of basic City services, with specific attention to equity - the need for all receiving services to pay their equitable portion with a plan fair to all.
Continue the City’s communications program allowing the City to tell its story through our communications tool kit
including ECTV-14, website (www.cityofandersonsc.com), focused marketing, etc. geared toward retreat issues, major projects and timely subjects.
Drive the culture change that promotes efficiency, innovation, effectiveness, and equitable value.
3

Focus and engage the management team to develop methods and actions that advance the priorities in a strategic and comprehensive manner through leadership development, cross-departmental collaboration, benchmarking, etc. Many of these goals represent multi-year tasks and strategies. Many are process-oriented rather than project-oriented. Most all of them involve the planned expenditure of budgeted funds. Others require seeking alternative resources. Because of this, the City will continue to seek new opportunities relative to funding municipal government. Financial Policies The Statement of Financial Policies presents policies that the City follows in managing its financial and budgetary affairs. Operating Budget Policies
Essential City services will receive first priority. For the purpose of this policy, these services are those that protect lives and property.
The City will avoid budgetary procedures that balance current expenditures by obligating future year funds. The City will maintain its physical assets at a level adequate to protect the City’s capital investment and to minimize
future maintenance and replacement costs. Revenue Policies
The City will try to maintain a diversified and stable revenue system. The City will follow an aggressive policy of collecting revenues. The City will consider market rates and rates charged by other municipalities of similar size for charges for services. Enterprise funds will be self-supporting.
Investment Policies
The City’s investment portfolio will be diversified to avoid incurring unreasonable risks. The City will obtain the best possible return on all investments within the limits of State law, local ordinances and
prudent investment practices. The Finance Director will receive a monthly investment report outlining the nature, value, yield, purchase price and
any other pertinent information. Accounting, Auditing and Financial Reporting Policies
An independent audit will be performed annually. The City will issue annual financial reports in accordance with generally accepted accounting principles (GAAP) as
outlined by the Governmental Accounting, Auditing, and Financial Reporting (GAAFR) book. Reserved and Unreserved Fund Balance Policies
The City seeks to maintain a prudent level of financial resources to protect against reducing levels of service because of temporary shortfalls or unpredicted one-time expenditures.
Major Initiatives For the fifteenth straight year, the Mayor, City Council and Division Heads participated in a planning retreat. This retreat helped identify the major issues facing the City. City Council and management want to ensure that the residents in the City of Anderson are provided the most efficient and effective services at the most affordable costs. AWARDS AND ACKNOWLEDGEMENTS Awards The Government Finance Officers Association of the United States and Canada (“GFOA”) awarded a Certificate of Achievement for Excellence in Financial Reporting to The City of Anderson, South Carolina for its comprehensive annual financial report for the fiscal year ended June 30, 2018. The Certificate of Achievement is a prestigious national award recognizing conformance with the highest standards for preparation of state and local government financial reports. The City of Anderson has received this award for twenty-four consecutive years.
4
In order to be awarded a Certificate of Achievement, a government unit must publish an easily readable and efficiently organized comprehensive annual financial report, whose contents conform to program standards. Such CAFR must satisfy both generally accepted accounting principles and applicable legal requirements. A Certificate of Achievement is valid for a period of one year only. We believe our current report continues to conform to the Certificate of Achievement program requirements and we are submitting it to GFOA. The City of Anderson also received the Certificate for Excellence in Distinguished Budget Presentation from the Government Finance Officers Association of the United States and Canada for our Annual Adopted Budget for the fiscal year ended June 30, 2019. The City has received this award for thirteen years. The FY 2020 budget has been submitted for consideration of this award. Acknowledgments We appreciate the support of the Mayor and Council by encouraging excellence in financial reporting through participation in the Certificate of Achievement for Excellence in Financial Reporting Program of the Government Finance Officers Association. The preparation of the Comprehensive Annual Financial Report was made possible by the hard work of the Finance Division. Each division member has our sincere appreciation for the contributions made in the preparation of this report. Respectfully Submitted, David E. McCuen IV Margot B. Martin City Manager Finance Director
5

This page is intentionally left blank
6

CITY OF ANDERSON, SOUTH CAROLINALIST OF PRINCIPAL OFFICIALS AND MANAGEMENT TEAM
FOR FISCAL YEAR 2019-2020
MAYOR Terence V. Roberts
MAYOR PRO-TEM James A. Stewart/Seat 4
COUNCILMEMBER SEAT 1 Kyle L. Newton
COUNCILMEMBER SEAT 2 Donald G. Chapman
COUNCILMEMBER SEAT 3 Jeffrey D. Roberts
COUNCILMEMBER SEAT 5 Beatrice R. Thompson
COUNCILMEMBER SEAT 6 Richard A. Laughridge
COUNCILMEMBER AT-LARGE SEAT 8
John M. Roberts
COUNCILMEMBER AT-LARGE SEAT 7
Matthew C. Harbin
CITY MANAGER David E. McCuen, IV
ASSISTANT CITY MANAGER Andrew C. Strickland
FINANCE DIRECTOR Margot B. Martin
CITY ATTORNEY J. Franklin McClain
POLICE CHIEF James S. Stewart
FIRE CHIEF Randall K. Bratcher
PLANNING & DEVELOPMENT DIRECTOR Maurice L. McKenzie
PUBLIC WORKS DIRECTOR Kenneth M. Mullinax
UTILITIES DIRECTOR Jeffrey H. Caldwell
PARKS & RECREATION DIRECTOR Robert G. Beville
INFORMATION TECHNOLOGY DIRECTOR Mark L. Cunningham
COMMUNITY DEVELOPMENT DIRECTORErica M. Craft
HUMAN RESOURCE DIRECTORDonna M. Kazia
ECONOMIC DEVELOPMENT DIRECTORKimberly H. Spears
MUNICIPAL COURT ADMINISTRATORKimberly A. Poulin
7
8
9

This page is intentionally left blank
10

INDEPENDENT AUDITOR’S REPORT The Honorable Mayor and Members of City Council City of Anderson Anderson, South Carolina Report on the Financial Statements We have audited the accompanying financial statements of the governmental activities, the business-type activities, each major fund, and the aggregate remaining fund information of the City of Anderson, South Carolina (the “City”), as of and for the year ended June 30, 2019, and the related notes to the financial statements, which collectively comprise the City’s basic financial statements as listed in the table of contents. Management’s Responsibility for the Financial Statements Management is responsible for the preparation and fair presentation of these financial statements in accordance with accounting principles generally accepted in the United States of America; this includes the design, implementation, and maintenance of internal control relevant to the preparation and fair presentation of financial statements that are free from material misstatement, whether due to fraud or error. Auditor’s Responsibility Our responsibility is to express opinions on these financial statements based on our audit. We conducted our audit in accordance with auditing standards generally accepted in the United States of America and the standards applicable to financial audits contained in Government Auditing Standards, issued by the Comptroller General of the United States. Those standards require that we plan and perform the audit to obtain reasonable assurance about whether the financial statements are free from material misstatement. An audit involves performing procedures to obtain audit evidence about the amounts and disclosures in the financial statements. The procedures selected depend on the auditor’s judgment, including the assessment of the risks of material misstatement of the financial statements, whether due to fraud or error. In making those risk assessments, the auditor considers internal control relevant to the entity’s preparation and fair presentation of the financial statements in order to design audit procedures that are appropriate in the circumstances, but not for the purpose of expressing an opinion on the effectiveness of the entity’s internal control. Accordingly, we express no such opinion. An audit also includes evaluating the appropriateness of accounting policies used and the reasonableness of significant accounting estimates made by management, as well as evaluating the overall presentation of the financial statements. We believe that the audit evidence we have obtained is sufficient and appropriate to provide a basis for our audit opinions. Opinions In our opinion, the financial statements referred to above present fairly, in all material respects, the respective financial position of the governmental activities, the business-type activities, each major fund, and the aggregate remaining fund information of the City of Anderson, South Carolina, as of June 30, 2019, and the respective changes in financial position and, where applicable, cash flows thereof for the year then ended in accordance with accounting principles generally accepted in the United States of America.
11
Other Matters
Required Supplementary Information
Accounting principles generally accepted in the United States of America require that management’s discussion and analysis, the budgetary comparison schedule, the other postemployment benefit plan schedule, and the pension plan schedules, as listed in the table of contents, be presented to supplement the basic financial statements. Such information, although not a part of the basic financial statements, is required by the Governmental Accounting Standards Board who considers it to be an essential part of financial reporting for placing the basic financial statements in an appropriate operational, economic, or historical context. We have applied certain limited procedures to the required supplementary information in accordance with auditing standards generally accepted in the United States of America, which consisted of inquiries of management about the methods of preparing the information and comparing the information for consistency with management’s responses to our inquiries, the basic financial statements, and other knowledge we obtained during our audit of the basic financial statements. We do not express an opinion or provide any assurance on the information because the limited procedures do not provide us with sufficient evidence to express an opinion or provide any assurance.
Supplementary and Other Information
Our audit was conducted for the purpose of forming opinions on the financial statements that collectively comprise the City’s basic financial statements. The introductory section, supplementary information, statistical section, the schedule of expenditures of federal awards, as required by Title 2 U.S. Code of Federal Regulations Part 200, Uniform Administrative Requirements, Cost Principles, and Audit Requirements for Federal Awards, and the continuing disclosure section, as listed in the table of contents, are presented for purposes of additional analysis and are not a required part of the basic financial statements.
The supplementary information and the schedule of expenditures of federal awards are the responsibility of management and were derived from and relate directly to the underlying accounting and other records used to prepare the basic financial statements. Such information has been subjected to the auditing procedures applied in the audit of the basic financial statements and certain additional procedures, including comparing and reconciling such information directly to the underlying accounting and other records used to prepare the basic financial statements or to the basic financial statements themselves, and other additional procedures in accordance with auditing standards generally accepted in the United States of America. In our opinion, the supplementary information and the schedule of expenditures of federal awards are fairly stated, in all material respects, in relation to the basic financial statements as a whole.
The introductory section, statistical section, and the continuing disclosure section have not been subjected to the auditing procedures applied in the audit of the basic financial statements, and accordingly, we do not express an opinion or provide any assurance on them.
Other Reporting Required by Government Auditing Standards
In accordance with Government Auditing Standards, we have also issued our report dated November 22, 2019 on our consideration of the City’s internal control over financial reporting and on our tests of its compliance with certain provisions of laws, regulations, contracts, and grant agreements and other matters. The purpose of that report is to describe the scope of our testing of internal control over financial reporting and compliance and the results of that testing, and not to provide an opinion on internal control over financial reporting or on compliance. That report is an integral part of an audit performed in accordance with Government Auditing Standards in considering the City’s internal control over financial reporting and compliance.
Greene Finney, LLP Mauldin, South Carolina November 22, 2019
12

CITY OF ANDERSON, SOUTH CAROLINA MANAGEMENT’S DISCUSSION AND ANALYSIS YEAR ENDED JUNE 30, 2019
As management of the City of Anderson (“City”), we offer readers of the City’s financial statements this narrative overview and analysis of the financial activities of the City for the year ended June 30, 2019 (“FY 2019” or “2019”) compared to the year ended June 30, 2018 (“FY 2018” or “2018”). The intent of this management’s discussion and analysis (“MD&A”) is to look at the City’s financial performance as a whole. We would encourage readers to not only consider the information presented here, but also the information provided in the transmittal letter, the financial statements, and notes to the financial statements to enhance their understanding of the City’s overall financial performance. FINANCIAL HIGHLIGHTS
The assets and deferred outflows of resources of the City exceeded its liabilities and its deferred inflows of resources at the close of the current year by approximately $87,841,000 (net position). Of this amount, approximately $45,178,000 and $42,663,000 were related to the City’s governmental and business-type activities, respectively. In addition, the City’s unrestricted net position (which may be used to meet the government’s ongoing obligations to citizens and creditors) was approximately $801,000 for its governmental activities and approximately $10,381,000 for its business-type activities.
The government’s total net position increased by approximately $1,131,000 for governmental activities and approximately $1,039,000 for business-type activities compared to the prior year net position.
As of the close of the current fiscal year, the City’s governmental funds reported combined ending fund balances of approximately $22,431,000, an increase of approximately $2,607,000 over the prior year’s fund balance.
The City’s General Fund reported total fund balance of approximately $14,926,000. Approximately 59% of this total amount, or approximately $8,813,000, is available for spending at the government’s discretion (unassigned fund balance). The unassigned fund balance for the General Fund was approximately 28% of total General Fund expenditures for 2019.
The City’s governmental activities capital assets decreased by approximately $1,609,000 (4%) during the current fiscal year due to depreciation expense and disposals of capital assets of approximately $2,726,000 and $160,000, respectively, partially offset by capital asset additions of approximately $1,277,000. The City’s business-type activities capital assets decreased by approximately $3,300,000 (3%) during the current year primarily due to depreciation expense of approximately $5,472,000, partially offset by capital asset additions of approximately $2,172,000.
The City’s governmental activities total debt (including lease purchase obligations) decreased by approximately $1,462,000 (26%) during the current year primarily due to regularly scheduled principal payments. The City’s business-type activities total debt decreased approximately $3,849,000 (4%) during the current year primarily due to regularly scheduled principal payments of approximately $4,488,000 and amortization of premiums of approximately $454,000, partially offset by an addition to a state revolving fund loan for approximately $1,093,000.
The City currently for its 2008 general obligation bond issue has an “Aa3” rating from Moody’s Investors Service and an “AA- “from Standard and Poor’s. The City received an “Aa3” and “A+” rating from Moody’s Investors Service and Standard and Poor’s, respectively, for its 2012 and 2016 water and sewer system revenue bonds. These ratings are a reflection of the City’s strong financial stability.
OVERVIEW OF FINANCIAL STATEMENTS This annual report consists of five parts – Introductory Section, the Financial Section (which includes management’s discussion and analysis, the financial statements, required supplementary information, and supplementary information), the Statistical Section, the Compliance Section, and the Continuing Disclosure Section. Financial Statements This MD&A is intended to serve as an introduction to the City’s financial statements. The City’s financial statements are comprised of three components; 1) government-wide financial statements, 2) fund financial statements, and 3) notes to the financial statements. The financial statements present two different views of the City through the use of government-wide statements and fund financial statements. In addition to the financial statements, this report contains other supplementary information that will enhance the reader’s understanding of the financial condition of the City.
13

CITY OF ANDERSON, SOUTH CAROLINA MANAGEMENT’S DISCUSSION AND ANALYSIS YEAR ENDED JUNE 30, 2019
OVERVIEW OF FINANCIAL STATEMENTS (CONTINUED) Government-Wide Financial Statements. The financial statements include two kinds of statements that present different views of the City. The government-wide financial statements are designed to provide readers with a broad overview of the City’s finances in a manner similar to a private-sector business. The statement of net position presents information on all of the City’s assets and deferred outflows of resources and liabilities and deferred inflows of resources, with the differences between these items reported as net position. Over time, increases or decreases in net position may serve as a useful indicator of whether the financial position of the City is improving or deteriorating. The statement of activities presents information showing how the government’s net position changed during the most recent fiscal year. All changes in net position are reported as soon as the underlying event giving rise to the change occurs, regardless of the timing of related cash flows. Thus, revenues and expenses are reported in this statement for some items that will only result in cash flows in future fiscal periods. The government-wide financial statements are divided into two categories: 1) governmental activities; and 2) business-type activities. The governmental activities include general government, public safety, public works, community and economic development, recreation, and advertising and tourism. Taxes, business licenses, building permits, fines, recreational fees, and state and federal grant revenues finance most of these activities. The business-type activities are the City’s sewer, water, storm water, and transit operations for which it charges its customers a fee to provide. The government-wide financial statements can be found as listed in the table of contents. Fund Financial Statements. The fund financial statements provide a more detailed look at the City’s most significant activities. A fund is a grouping of related accounts that is used to maintain control over resources that have been segregated for specific activities or objectives. The City, like all other governmental entities in South Carolina, uses fund accounting to ensure and reflect compliance with finance-related legal requirements, such as the General Statutes or the City’s budget ordinance. All of the funds of the City can be divided into three categories: governmental funds, proprietary funds, and fiduciary funds. Governmental Funds – Governmental funds are used to account for those functions reported as governmental activities in the government-wide financial statements. Most of the City’s basic services are accounted for in governmental funds. These funds focus on how assets can readily be converted into cash flow (in and out), and what monies are left at year-end that will be available for spending in the next year. Governmental funds are reported using an accounting method called modified accrual accounting which provides a short-term spending focus. As a result, the governmental fund financial statements give the reader a detailed short-term view that helps him or her determine if there are more or less financial resources available to finance the City’s programs. The relationship between governmental activities (reported in the statement of net position and the statement of activities) and governmental funds is described in a reconciliation that is a part of the fund financial statements. The City maintained seven (7) individual governmental funds. Information is presented separately in the governmental fund balance sheet and in the governmental fund statement of revenue, expenditures, and changes in fund balances for the General Fund, Community Development Fund, Perpetual Care Fund, Accommodations Tax Fund, Hospitality Fee Fund, Capital Replacement Fund, and the Transportation Investment Fund. The governmental fund financial statements can be found as listed in the table of contents. Proprietary Funds – The City maintains one type of proprietary fund. Enterprise Funds are used to account for operations that (a) are financed and operated in a manner similar to private business enterprises — where the intent of the governing body is that the costs (expenses, including depreciation) of providing goods or services to the general public on a continuing basis be financed or recovered primarily through user charges; or (b) where the governing body has decided that periodic determination of revenues earned, expenses incurred, and/or net income is appropriate for capital maintenance, public policy, management control, accountability, or other purposes. The City uses four enterprise funds to account for its sewer, water, storm water, and transit operations. The proprietary fund financial statements can be found as listed in the table of contents.
14
CITY OF ANDERSON, SOUTH CAROLINA MANAGEMENT’S DISCUSSION AND ANALYSIS YEAR ENDED JUNE 30, 2019
OVERVIEW OF FINANCIAL STATEMENTS (CONTINUED) Fiduciary Funds – Fiduciary funds are used to account for resources held for the benefit of parties outside the government. Fiduciary funds are not reflected in the government-wide financial statements because the resources of those funds are not available to support the City’s own programs. Pension Trust funds account for resources that are required to be held in trust for the members and beneficiaries of defined benefit plans. The General Employees’ Retirement Plan Fund is used to account for the City’s single-employer defined benefit retirement plan. Agency funds are used to account for assets the City holds on behalf of others. The Forfeitures and Seizures Fund is used to account for money that was forfeited and/or seized during a law enforcement action. This money is held until completion of court proceedings. The Agency Fund is custodial in nature and does not present results of operations. The financial statement of the fiduciary funds can be found as listed in the table of contents. Notes to the Financial Statements – The notes provide additional information that is essential to a full understanding of the data provided in the government-wide and fund financial statements. The notes to the financial statements can be found as listed in the table of contents. Other Information – In addition to the financial statements and accompanying notes, this report includes certain required supplementary information. Regarding the City’s major governmental fund, the City adopts an annual budget for its General Fund, as required by the General Statutes. A required budgetary comparison schedule has been provided for the General Fund to demonstrate compliance with its budget. The City sponsors the General Employees’ Retirement Plan (“City Pension Plan”), a single-employer defined benefit pension plan, and a healthcare plan (“OPEB Plan”). The City has provided the required schedules for the City Pension Plan and OPEB Plan as required by GAAP. Required pension schedules have also been included which provide relevant information regarding the City’s participation in the South Carolina Police Officers Retirement System, a cost-sharing multiple-employer defined benefit plan. Required supplementary information can be found as listed in the table of contents. Supplementary information, which includes combining and individual fund financial schedules, budgetary schedules of the City’s governmental and proprietary funds, a schedule of fines, assessments, and surcharges, and schedules of budgeted to actual costs for the SC Department of Transportation are presented immediately following the required supplementary information. These schedules can be found as listed in the table of contents.
15

CITY OF ANDERSON, SOUTH CAROLINA MANAGEMENT’S DISCUSSION AND ANALYSIS YEAR ENDED JUNE 30, 2019
OVERVIEW OF FINANCIAL STATEMENTS (CONTINUED)
Figure A-1 Major Features of the City of Anderson’s Government-Wide and Fund Financial Statements
Fund Financial Statements Government-Wide
Financial Statements
Governmental Funds
Proprietary
Funds
Fiduciary
Funds Scope Entire City
government (except fiduciary funds).
The activities of the City that are not proprietary or fiduciary.
Activities the City operates similar to private businesses.
Instances in which the City is the trustee or agent for someone else’s resources.
Required Financial Statements
Statement of Net Position.
Statement of Activities.
Balance Sheet. Statement of Revenues,
Expenditures, and Changes in Fund Balances.
Statement of Net Position
Statement of Revenues, Expenses, and Changes in Net Position.
Statement of Cash Flows.
Statement of Assets and Liabilities and Statement of Fiduciary Net Position.
Statement of Changes in Fiduciary Net Position (not required for agency funds).
Accounting Basis and Measurement Focus
Accrual accounting and economic resources focus.
Modified accrual accounting and current financial resources focus.
Accrual accounting and economic resources focus.
Accrual accounting and economic resources focus.
Type of Balance Sheet Information
All balance sheet elements - both financial and capital, and short-term and long-term.
All balance sheet elements that come due during the year or soon, thereafter. No capital assets or long-term obligations are included.
All balance sheet elements - both financial and capital, and short-term and long-term.
All balance sheet elements - short-term and long-term.
Type of Inflow/Outflow Information
All revenues and expenses during year, regardless of when cash is received or paid.
Revenues for which cash is received during or soon after the end of the year; expenditures when goods or services have been received and payment is due during the year or soon thereafter.
All revenues and expenses during year, regardless of when cash is received or paid.
All revenues and expenses during year, regardless of when cash is received or paid.
16

CITY OF ANDERSON, SOUTH CAROLINA MANAGEMENT’S DISCUSSION AND ANALYSIS YEAR ENDED JUNE 30, 2019
GOVERNMENT-WIDE FINANCIAL ANALYSIS As noted earlier, net position may serve over time as a useful indicator of a government’s financial position. The following table provides a summary of the City’s net position as of June 30, 2019 compared to June 30, 2018:
2019 2018 2019 2018 2019 2018
Assets:Current and Other Assets $ 29,815,298 28,825,833 18,433,439 19,393,544 48,248,737 $ 48,219,377 Capital Assets, Net 37,922,424 39,531,186 116,870,499 120,169,922 154,792,923 159,701,108
Total Assets 67,737,722 68,357,019 135,303,938 139,563,466 203,041,660 207,920,485
Deferred Outflows of ResourcesDeferred Loss on Debt Refunding - - 5,559,034 5,867,675 5,559,034 5,867,675 Deferred OPEB Charges - City Plan 29,300 29,300 - - 29,300 29,300 Deferred Pension Charges - City Pension Plan 1,568,517 720,545 1,197,828 550,889 2,766,345 1,271,434 Deferred Pension Charges - State Retirement Plan 3,917,441 3,615,972 - - 3,917,441 3,615,972
Total Deferred Outflows of Resources 5,515,258 4,365,817 6,756,862 6,418,564 12,272,120 10,784,381
LiabilitiesLong-Term Liabilities 6,921,257 8,502,646 97,923,446 101,758,563 104,844,703 110,261,209 OPEB Liability - City Plan 1,124,434 1,070,235 221,097 210,440 1,345,531 1,280,675 Net Pension Liability - State Retirement Plan 15,453,236 14,274,263 - - 15,453,236 14,274,263 Other Liabilities 4,290,996 3,969,443 1,183,091 1,890,408 5,474,087 5,859,851
Total Liabilities 27,789,923 27,816,587 99,327,634 103,859,411 127,117,557 131,675,998
Deferred Inflows of ResourcesDeferred OPEB Credits - City Plan 113,570 79,414 - - 113,570 79,414 Deferred Pension Credits - City Plan 92,107 653,033 70,339 499,273 162,446 1,152,306 Deferred Pension Credits - State Retirement Plan 79,221 126,801 - - 79,221 126,801
Total Deferred Inflows of Resources 284,898 859,248 70,339 499,273 355,237 1,358,521
Net PositionNet Investment in Capital Assets 33,761,159 33,913,890 26,280,175 26,112,126 60,041,334 60,026,016 Restricted 10,615,667 9,010,338 6,776,052 5,575,695 17,391,719 14,586,033 Unrestricted 801,333 1,122,773 9,606,600 9,935,525 10,407,933 11,058,298
Total Net Position $ 45,178,159 44,047,001 42,662,827 41,623,346 87,840,986 $ 85,670,347
TotalGovernmental Activities Business-Type Activities
The City’s total assets and deferred outflows of resources decreased approximately $3,391,000 from the prior year to approximately $215,314,000 at June 30, 2019. Deferred outflows increased approximately $1,488,000 due to the changes in deferred pension and OPEB charges. Capital assets decreased approximately $4,908,000 from the prior year primarily due to depreciation expense exceeding capital asset additions. Total liabilities and deferred inflows of resources decreased approximately $5,562,000 from the prior year. The decrease is primarily due to scheduled principal payments on the City’s long-term obligations and decreases in the deferred pension and OPEB credits related to the City’s Pension and OPEB plans, partially offset by increases in the net pension and OPEB liabilities.
The City’s net position increased by approximately $2,171,000 during the current fiscal year due to current year revenues exceeding current year expenses. Please see discussion following the next table regarding this increase.
17

CITY OF ANDERSON, SOUTH CAROLINA MANAGEMENT’S DISCUSSION AND ANALYSIS YEAR ENDED JUNE 30, 2019
GOVERNMENT-WIDE FINANCIAL ANALYSIS (CONTINUED) The City’s assets and deferred outflows of resources exceeded liabilities and deferred inflows of resources (net position) by approximately $87,841,000 at June 30, 2019. The largest portion of the City’s net position of approximately $60,041,000 (approximately 68%) reflects its investment in capital assets (i.e., land, buildings, equipment, infrastructure, etc.) less any related outstanding debt/lease purchase obligations used to acquire those assets. The City uses these capital assets to provide services to citizens; consequently, these assets are not available for future spending. Although the City’s net investment in capital assets is reported net of related debt, it should be noted that the resources needed to repay this debt generally must be provided from other sources, since generally the capital assets themselves cannot be used to liquidate these liabilities. An additional portion of the City’s net position of approximately $17,392,000 (approximately 20%) represents resources that are subject to external restrictions on how they may be used. This portion of net position is restricted primarily for debt service or special revenue programs which are restricted by the revenue source (i.e. hospitality fee, accommodations tax, etc.). The remaining portion of the City’s net position is unrestricted net position of approximately $10,408,000 (approximately 12%) may be used to meet the government’s ongoing obligations to citizens and creditors. The following table shows the changes in the City’s net position for 2019 compared to 2018.
2019 2018 2019 2018 2019 2018
Revenues:Program Revenues:
Charges for Services $ 5,322,220 5,438,747 22,550,311 21,581,234 27,872,531 $ 27,019,981 Operating Grants and Contributions 1,325,090 1,007,073 625,011 502,902 1,950,101 1,509,975
Capital Grants and Contributions 56,090 141,189 197,372 357,800 253,462 498,989 General Revenues:
Taxes 27,438,183 26,176,789 - - 27,438,183 26,176,789 Other 952,310 932,235 156,455 60,441 1,108,765 992,676
Total Revenues 35,093,893 33,696,033 23,529,149 22,502,377 58,623,042 56,198,410
Expenses:General Government 6,787,780 6,753,776 - - 6,787,780 6,753,776 Public Safety 16,640,973 15,192,930 - - 16,640,973 15,192,930 Public Works 6,167,425 6,125,170 - - 6,167,425 6,125,170 Community & Economic Development 2,236,466 1,528,390 - - 2,236,466 1,528,390
Recreation 3,109,423 2,738,309 - - 3,109,423 2,738,309 Sanitation 1,787 2,177 - - 1,787 2,177 Advertising and Tourism 160,248 164,801 - - 160,248 164,801 Interest 191,686 240,868 - - 191,686 240,868 Sewer - - 11,001,237 10,988,830 11,001,237 10,988,830 Water - - 7,965,944 7,327,446 7,965,944 7,327,446 Storm Water - - 888,015 602,887 888,015 602,887 Transit - - 1,301,419 973,381 1,301,419 973,381
Total Expenses 35,295,788 32,746,421 21,156,615 19,892,544 56,452,403 52,638,965
Change in Net Position Before Transfers (201,895) 949,612 2,372,534 2,609,833 2,170,639 3,559,445 Transfers In (Out) 1,333,053 1,263,977 (1,333,053) (1,263,977) - -
Change in Net Position 1,131,158 2,213,589 1,039,481 1,345,856 2,170,639 3,559,445
Net Position, Beginning of Year 44,047,001 41,833,412 41,623,346 40,277,490 85,670,347 82,110,902
Net Position - End of Year $ 45,178,159 44,047,001 42,662,827 41,623,346 87,840,986 $ 85,670,347
TotalsGovernmental Activities Business-Type Activities
18

CITY OF ANDERSON, SOUTH CAROLINA MANAGEMENT’S DISCUSSION AND ANALYSIS YEAR ENDED JUNE 30, 2019
GOVERNMENT-WIDE FINANCIAL ANALYSIS (CONTINUED) Governmental Activities: Governmental activities increased the City’s net position by approximately $1,131,000 in the current year. Key changes in governmental activities revenues and expenses compared to the prior year were as follows:
Total governmental activities revenues for 2019 increased approximately $1,398,000 (4%) from the prior year and were approximately $35,094,000. This increase was primarily due to increase in property taxes ($110,000), hospitality taxes ($155,000), franchise fees ($171,000), and business licenses ($838,000).
Total governmental activities expenses increased approximately $2,549,000 (8%) from the prior year primarily due
to higher salaries and benefits (2% COLA) and changes in the net pension balances related to the City Pension Plan and the State retirement plan.
Business-Type Activities: Net position for business-type activities (sewer, water, storm water, and transit) increased by approximately $1,039,000. Please see “Proprietary Funds” discussion in the following section for details. FINANCIAL ANALYSIS OF THE CITY’S FUNDS As noted earlier, the City uses fund accounting to ensure and demonstrate compliance with finance-related legal requirements. Governmental funds. The focus of the City’s governmental funds is to provide information on near-term inflows, outflows, and balances of spendable resources. Such information is useful in assessing the City’s financing requirements. In particular, unassigned fund balance may serve as a useful measure of a government’s net resources available for spending at the end of the fiscal year. As of the end of the current fiscal year, the City's governmental funds reported combined ending fund balance of approximately $22,431,000 an increase of approximately $2,607,000 over the prior year fund balance. Please see below and discussion in the General Fund Budgetary Highlights section for more information on this increase. Approximately 39% or $8,718,000 of the total governmental fund balance of approximately $22,431,000 constitutes unassigned fund balance. The remainder of the fund balance is nonspendable, restricted, committed, or assigned to indicate that it is not available for new spending because it has already been set aside/constrained for (1) prepaids and inventory ($231,000; nonspendable), (2) victims advocate services ($37,000; restricted), (3) TIF debt service or capital projects ($1,137,000; restricted), (4) tourism related expenditures ($4,472,000; restricted), (5) perpetual care ($690,000; restricted), (6) Permanent Fund principal ($2,250,000; nonspendable), (7) appropriated for use in the FY 20 budget ($4,708,000; assigned), (8) transit expenditures ($143,000; restricted), (9) capital projects ($45,000; assigned). The General Fund is the chief operating fund of the City. At the end of the current fiscal year, the total fund balance was approximately $14,926,000. As a measure of the General Fund’s liquidity, it may be useful to compare total unassigned fund balance to total General Fund expenditures. Total unassigned fund balance of the General Fund ($8,813,000) represents approximately 28% of total General Fund expenditures for the current year. The fund balance for the General Fund increased by approximately $1,131,000, or 8%. This increase was primarily due to an increase in licenses and permits revenues and a decrease in capital outlay expenditures. In addition, the fund balances of the other governmental funds increased by approximately $1,476,000, or 24%, over the prior year ending fund balances. This increase was primarily due to lower expenditures of approximately $592,000 mainly related to a decrease in debt service payments (as the City paid off the 2011 Special Obligation Bond and Community Development Note in the prior year).
19
CITY OF ANDERSON, SOUTH CAROLINA MANAGEMENT’S DISCUSSION AND ANALYSIS YEAR ENDED JUNE 30, 2019
FINANCIAL ANALYSIS OF THE CITY’S FUNDS (CONTINUED) Proprietary Funds. The City’s proprietary funds provide the same type of information found in the government-wide financial statements but in more detail. Net position of the Sewer, Water, Storm Water, and Transit enterprise funds at the end of the current year amounted to approximately $42,663,000. Details on changes in the City’s proprietary funds were as follows:
Sewer Fund – total sewer operating revenues increased approximately $337,000 or 3% from the prior year. There was an incremental rate increase for the current year. Charges for services increased 5% from the prior year or approximately $471,000. Sewer operating expenses decreased approximately $10,000 or <1% from the prior year. Net position increased approximately $899,000 as a result of revenues exceeding expenses.
Water Fund – total water operating revenues increased approximately $524,000 or 6% from the prior year. There was an incremental rate increase for the current year, and water operating expenses increased $679,000 or 10% from the prior year. Net position increased approximately $233,000 from the prior year due to revenues exceeding expenses.
Storm Water Fund – total storm water operating revenues remained relatively flat with a decrease of less than $1,000 from the prior year. Total storm water operating expenses increased approximately $287,000 from the prior year, due to an increase in salaries paid due to a vacant position in the prior year and an adjustment related to the City’s Pension Plan. Net position increased approximately $119,000 from the prior year, as revenues exceeded expenses.
Transit Fund – total operating revenues increased approximately $108,000 or 37% from the prior year related to an increase in miscellaneous revenues. Operating expenses increased approximately $328,000 or 34% mainly due to increases in operating and garage expenses.
Fiduciary Funds. The City’s Pension Trust Fund is used to account for the City’s Pension Plan. During calendar year 2018, the City Pension Plan’s net position decreased approximately $2,260,000 primarily due to a decrease in investment earnings of approximately $1,201,000 and benefit and administrative payments of approximately $1,942,000, partially offset by employer contributions of approximately $883,000. The Forfeitures and Seizures Fund (“Agency Fund”) is used to account for money that was forfeited and/or seized during a law enforcement action. This money is held until completion of court proceedings. The Agency Fund is custodial in nature and does not present results of operations. The balance held by others in the Agency Fund was approximately $109,000 at June 30, 2019.
General Fund Budgetary Highlights. If budget amendments are made they generally fall into one of three categories: 1) amendments made to adjust the estimates that are used to prepare the original budget ordinance once exact information is available; 2) amendments made to recognize new funding amounts from external sources, such as federal and state grants; and 3) increases in appropriations that become necessary to maintain services. The City’s amendment to its original 2019 General Fund budget were as follows:
Use of Police Grant received (E share) during the prior year for purchase of police vehicles Increasing Police Grant revenue and expenditures (Justice Assistance Grant, Traffic Enforcement, and Law
Enforcement Victim’s Advocate) Adding Economic Development Grant and expense for the (Under the Bridge Project) Adding professional fees for the NuStrat contract Adding expenditures for special projects (Asbestos Abatement) and other equipment (Storage Area Network) Adding capital improvement (Ella Street Extension Rehabilitation Project)
The City’s actual results for the General Fund were different than the final budgeted amounts due to the following:
Business licenses and franchise fees came in higher than budget primarily due to stronger collections by an outsourced company and a recovering economy.
Expenditures came in under budget primarily in general government and public works.
20

CITY OF ANDERSON, SOUTH CAROLINA MANAGEMENT’S DISCUSSION AND ANALYSIS YEAR ENDED JUNE 30, 2019
CAPITAL ASSET AND DEBT ADMINISTRATION Capital Assets The City’s capital assets as of June 30, 2019 and June 30, 2018, amounted to approximately $154,793,000 and $159,701,000 (net of accumulated depreciation), respectively. This investment in capital assets includes land, construction in progress, buildings, improvements, vehicles, machinery and equipment, water and sewer lines, and other infrastructure. The City’s capital assets (net of depreciation) as of June 30, 2019 and 2018 were as follows:
2019 2018 2019 2018 2019 2018
Land $ 4,194,924 4,340,026 1,768,200 1,718,950 5,963,124 $ 6,058,976 Construction in Progress 529,192 293,252 838,758 5,089,374 1,367,950 5,382,626 Buildings and Improvements 36,604,902 36,277,345 139,308,692 133,660,319 175,913,594 169,937,664 Water Tanks and Lines - - 39,954,555 39,891,601 39,954,555 39,891,601 Infrastructure 16,268,856 16,268,856 - - 16,268,856 16,268,856 Machinery and Equipment 3,604,695 3,444,057 3,086,063 2,618,141 6,690,758 6,062,198 Furniture and Fixtures 52,566 52,566 413,737 413,737 466,303 466,303 Vehicles 11,740,580 11,638,779 5,673,022 5,607,673 17,413,602 17,246,452
Capital Assets, Gross 72,995,715 72,314,881 191,043,027 188,999,795 264,038,742 261,314,676
Accumulated Depreciation 35,073,291 32,783,695 74,172,528 68,829,873 109,245,819 101,613,568
Capital Assets, Net $ 37,922,424 39,531,186 116,870,499 120,169,922 154,792,923 $ 159,701,108
TotalGovernmental Activities Business-Type Activities
The total decrease in the City’s capital assets for the current fiscal year was approximately $4,908,000 (3%). Major capital asset events during the current year included the following:
Capital asset additions of approximately $1,277,000 for governmental activities which consisted primarily of the
following: o Additions related to construction in progress of approximately $517,000 which were primarily related to
the City Hall Roof Replacement ($167,000), the Under the Bridge project ($108,000), and other capital projects ($242,000).
o Purchase of vehicles for approximately $419,000. o Purchases of equipment for $239,000, land for $10,000, and other capital assets for $92,000
Capital asset additions of approximately $2,172,000 for business-type activities which consisted primarily of the following:
o Additions related to construction in progress of approximately $1,711,000 primarily related to the Mall Road/Wedgewood Pump Station Replacement ($864,000), the Club Drive project ($532,000), and other projects ($315,000).
o Purchase of various vehicles, equipment and other assets of approximately $461,000. Depreciation expense of approximately $2,726,000 for governmental activities and approximately $5,472,000 for
business-type activities. Additional information regarding the City’s capital assets can be found in “Note III.D” in the notes to the financial statements.
21

CITY OF ANDERSON, SOUTH CAROLINA MANAGEMENT’S DISCUSSION AND ANALYSIS YEAR ENDED JUNE 30, 2019
CAPITAL ASSET AND DEBT ADMINISTRATION (CONTINUED) Debt Administration As of June 30, 2019, and June 30, 2018, the City had total outstanding debt (including lease purchase obligations) of approximately $100,312,000 and $105,622,000, respectively. Of the City’s total long-term obligations at June 30, 2019, approximately $1,680,000 was general obligation debt which is backed by the full faith and credit of the City. The City’s total debt and lease purchase obligations as of June 30, 2019 and 2018 were as follows:
2019 2018 2019 2018 2019 2018
Debt:General Obligation Bonds $ 1,680,000 1,820,000 - - 1,680,000 $ 1,820,000 Revenue Bonds * - - 80,937,274 85,046,370 80,937,274 85,046,370 Tax Increment Bonds 1,555,000 2,305,000 - - 1,555,000 2,305,000 SC State Revolving Fund Loans - - 14,887,641 14,467,661 14,887,641 14,467,661 Lease Purchase Obligations 926,265 1,498,554 324,443 483,978 1,250,708 1,982,532
Total Debt $ 4,161,265 5,623,554 96,149,358 99,998,009 100,310,623 $ 105,621,563
TotalGovernmental Activities Business-Type Activities
* Including deferred items (i.e. discounts, premiums, etc.).
The total decrease in the City’s debt and lease purchase obligations for the current year was approximately $5,311,000 or 5%. Major 2019 events for the City’s governmental and business-type activities were as follows:
The City’s governmental activities total debt (including lease purchase obligations) decreased by approximately $1,462,000 (26%) during the current year primarily due to regularly scheduled principal payments.
The City’s business-type activities total debt (including lease purchase obligations) decreased approximately $3,849,000 (4%) during the current year primarily due to regularly scheduled principal payments and amortization of premiums of approximately $4,942,000, partially offset by an addition to a state revolving fund loan for approximately $1,093,000.
The State of South Carolina limits the amount of general obligation debt that a unit of government can issue to 8% of the total assessed value of taxable property located within that government’s boundaries. As of June 30, 2019, the City had approximately $1,680,000 of bonded debt subject to the 8% limit of approximately $8,534,000 resulting in an unused legal debt margin of approximately $6,854,000. Additional information regarding the City’s long-term obligations can be found in “Note III.E” in the notes to the financial statements. ECONOMIC FACTORS AND 2020 BUDGET FOR THE CITY The City’s elected officials and staff considered many factors when setting the fiscal year 2020 (“FY 20” or “2020”) budget. The state of the economy, tourism activity, anticipated building activity, future capital needs, and the best interests of the City’s residents were all taken into account. Key budget highlights were as follows:
The FY 20 budget will include an increase in revenue for the MASC Collection Program of $250,000, increase in
Business License revenue of $250,000, and an increase in Prisoner Per Diem of $395,000. The FY 20 budget will include 2.25% cost of living for employees, which will increase payroll by $388,000. The FY 20 budget for the employer contribution to the Police Officers Retirement System (PORS) will increase 1%. The FY 20 budget will include three additional Firefighters, one Building Maintenance Technician and one
Horticulturalist.
22
CITY OF ANDERSON, SOUTH CAROLINA MANAGEMENT’S DISCUSSION AND ANALYSIS YEAR ENDED JUNE 30, 2019
ECONOMIC FACTORS AND 2020 BUDGET FOR THE CITY (CONTINUED)
In FY 20 budget, the Economic Development Fund in move to the General Fund. Also, the Sanitation Department will move from the General Fund to the Sanitation Fund, as a special revenue fund.
The FY 20 capital fund budget will include monies for the City Hall and Municipal Business Center Roof Projects of $2,840,000 and Fire Station 1 Sleeping Quarters Upgrade of $300,000.
The FY 20 sewer, water, and stormwater budgets increased by approximately $1.60 million, $1.38 million, and $1.23 million, respectively. Budget increases were primarily funded using prior year funds and will be used for capital projects within the City.
Transfers from the Sewer, Water, Storm Water and Hospitality Fee Funds to the General Fund are budgeted to be approximately $1,778,596 for FY 20. This is the amount budgeted in FY 19. Hospitality monies are used to help fund the beautification department, new parks, recreation center and operations, and downtown projects. Also, the City’s administration, finance, public works and other areas provide services to all funds but are paid by the General Fund. The transfers help offset the cost born completely by the General Fund.
REQUESTS FOR CITY INFORMATION This financial report is designed to provide a general overview of the City of Anderson’s finances for all those with an interest in the government’s financing. Questions concerning any of the information provided in this report or requests for additional financial information should be addressed to the Finance Director, City of Anderson, 401 S. Main Street, Anderson, South Carolina 29624 or visit our website at www.cityofandersonsc.com.
23

This page is intentionally left blank
24

Basic Financial Statements
25

CITY OF ANDERSON, SOUTH CAROLINA
STATEMENT OF NET POSITION
JUNE 30, 2019
Governmental Business-TypeActivities Activities Totals
ASSETS
Cash and Cash Equivalents 13,098,907$ 8,271,571 21,370,478$ Cash and Cash Equivalents, Restricted 6,704,547 8,339,560 15,044,107 Investments, Restricted 2,150,346 319,548 2,469,894 Receivables, Net:
Interest 4,793 - 4,793 Property Taxes 583,998 - 583,998 Accounts 443,656 688,410 1,132,066 Utilities 2,375,239 - 2,375,239 Other 168,052 - 168,052
Intergovernmental Receivables 1,254,397 243,828 1,498,225 Community and Business Development Note Receivables 1,994,285 - 1,994,285 Prepaids and Inventories 232,616 27,966 260,582 Land Held for Sale/Redevelopment 94,000 - 94,000 Net Pension Asset - City Pension Plan 710,462 542,556 1,253,018 Capital Assets:
Non-Depreciable 4,724,116 2,606,958 7,331,074 Depreciable, Net 33,198,308 114,263,541 147,461,849
TOTAL ASSETS 67,737,722 135,303,938 203,041,660
DEFERRED OUTFLOWS OF RESOURCES
Deferred Refunding Charges - 5,559,034 5,559,034 Deferred Other Postemployment Benefit Charges - City Plan 29,300 - 29,300 Deferred Pension Charges - City Pension Plan 1,568,517 1,197,828 2,766,345 Deferred Pension Charges - State Retirement Plan 3,917,441 - 3,917,441
TOTAL DEFERRED OUTFLOWS OF RESOURCES 5,515,258 6,756,862 12,272,120
LIABILITIES
Accounts Payable 1,145,712 640,254 1,785,966 Accrued Interest Payable 31,240 1,563,509 1,594,749 Accrued Salaries and Benefits 869,889 - 869,889 Customer Deposits - 757,885 757,885 Other Accrued Liabilities 42,698 391,251 433,949 Intergovernmental Payables 31,649 - 31,649 Internal Balances 2,169,808 (2,169,808) - Non-Current Liabilities:
Net Other Postemployment Benefit Liability - City Plan 1,124,434 221,097 1,345,531 Net Pension Liability - State Retirement Plan 15,453,236 - 15,453,236 Long-Term Obligations - Due Within One Year 2,838,542 5,036,450 7,874,992 Long-Term Obligations - Due in More Than One Year 4,082,715 92,886,996 96,969,711
TOTAL LIABILITIES 27,789,923 99,327,634 127,117,557
DEFERRED INFLOWS OF RESOURCES
Deferred Other Postemployment Benefit Credits - City Plan 113,570 - 113,570 Deferred Pension Credits - City Plan 92,107 70,339 162,446 Deferred Pension Credits - State Retirement Plan 79,221 - 79,221
TOTAL DEFERRED INFLOWS OF RESOURCES 284,898 70,339 355,237
NET POSITION
Net Investment in Capital Assets 33,761,159 26,280,175 60,041,334 Restricted For:
Victim's Advocate 36,896 - 36,896 TIF Debt Service or Capital Projects 1,125,183 - 1,125,183 Debt Service - 5,125,862 5,125,862 Perpetual Care 689,637 - 689,637 Transportation Investment - Nonexpendable 2,250,000 - 2,250,000 Transportation Investment - Expendable 143,212 - 143,212 Community Development 1,898,944 - 1,898,944 Tourism Related Costs 4,471,795 - 4,471,795 Capital Improvements - 1,650,190 1,650,190
Unrestricted 801,333 9,606,600 10,407,933
TOTAL NET POSITION 45,178,159$ 42,662,827 87,840,986$
PRIMARY GOVERNMENT
The notes to the financial statements are an integral part of this statement. See accompanying independent auditor's report.
26

CITY OF ANDERSON, SOUTH CAROLINA
STATEMENT OF ACTIVITIES
YEAR ENDED JUNE 30, 2019
FUNCTIONS/PROGRAMSCharges for Operating Capital Governmental Business-Type
PRIMARY GOVERNMENT: Expenses Services Activities Activities Total
Governmental Activities:General Government 6,787,780$ 1,382,755 198,806 - (5,206,219) - (5,206,219)$ Public Safety 16,640,973 2,566,396 171,234 56,090 (13,847,253) - (13,847,253) Public Works 6,167,425 489,363 101,943 - (5,576,119) - (5,576,119) Community and Economic Development 2,236,466 181,745 853,107 - (1,201,614) - (1,201,614) Recreation 3,109,423 303,917 - - (2,805,506) - (2,805,506) Sanitation 1,787 398,044 - - 396,257 - 396,257 Advertising and Tourism 160,248 - - - (160,248) - (160,248) Interest on Long-Term Obligations 191,686 - - - (191,686) - (191,686)
Total Governmental Activities 35,295,788 5,322,220 1,325,090 56,090 (28,592,388) - (28,592,388)
Business-Type Activities:Sewer 11,001,237 12,344,376 - 133,572 - 1,476,711 1,476,711 Water 7,965,944 8,682,176 - 63,800 - 780,032 780,032 Storm Water 888,015 1,125,811 - - - 237,796 237,796 Transit 1,301,419 397,948 625,011 - - (278,460) (278,460)
Total Business-Type Activities 21,156,615 22,550,311 625,011 197,372 - 2,216,079 2,216,079 .
TOTAL - PRIMARY GOVERNMENT 56,452,403$ 27,872,531 1,950,101 253,462 (28,592,388) 2,216,079 (26,376,309)
General Revenues and Transfers:
General Revenues:Taxes:
Property Taxes 12,194,437 - 12,194,437 Tax Increment 1,176,450 - 1,176,450 Hospitality Fees 3,057,287 - 3,057,287 Accommodations Taxes 364,415 - 364,415 Franchise Taxes 5,817,482 - 5,817,482 Business Licenses 4,761,512 - 4,761,512 Other Taxes 66,600 - 66,600
Intergovernmental Revenue - Unrestricted 610,171 - 610,171 Investment Income 245,513 156,455 401,968 Miscellaneous 38,526 - 38,526 Gain on Sale of Assets 58,100 - 58,100
Transfers In (Out) 1,333,053 (1,333,053) -
Total General Revenues and Transfers 29,723,546 (1,176,598) 28,546,948
CHANGE IN NET POSITION 1,131,158 1,039,481 2,170,639
NET POSITION, BEGINNING OF YEAR 44,047,001 41,623,346 85,670,347
NET POSITION, END OF YEAR 45,178,159 42,662,827 87,840,986$
NET (EXPENSE) REVENUE ANDPROGRAM REVENUES CHANGE IN NET POSITION
Grants and Contributions
Primary Government
The notes to the financial statements are an integral part of this statement. See accompanying independent auditor's report.
27

OTHER TOTALGOVERNMENTAL GOVERNMENTAL
GENERAL FUNDS FUNDSASSETS
Cash and Cash Equivalents 13,093,727$ 5,180 13,098,907$ Cash and Cash Equivalents, Restricted 1,367,883 5,336,664 6,704,547 Investments, Restricted - 2,150,346 2,150,346 Receivables, Net:
Interest - 4,793 4,793 Property Taxes 583,998 - 583,998 Accounts - 443,656 443,656 Utilities 2,375,239 - 2,375,239 Other 3,535 164,517 168,052
Intergovernmental Receivables 1,254,397 - 1,254,397 Due From Other Funds 858,294 85,131 943,425 Prepaids and Inventories 230,729 1,887 232,616 Land Held for Sale/Redevelopment - 94,000 94,000
TOTAL ASSETS 19,767,802$ 8,286,174 28,053,976$
LIABILITIES, DEFERRED INFLOWS OF RESOURCES, AND FUND BALANCES
LIABILITIES
Accounts Payable 1,021,120$ 124,592 1,145,712$ Accrued Salaries and Benefits 869,889 - 869,889 Other Accrued Liabilities 42,657 41 42,698 Intergovernmental Payables 31,649 - 31,649 Due To Other Funds 2,456,074 657,159 3,113,233
TOTAL LIABILITIES 4,421,389 781,792 5,203,181
DEFERRED INFLOWS OF RESOURCES
Unavailable Revenue - Property Taxes 420,274 - 420,274
TOTAL DEFERRED INFLOWS OF RESOURCES 420,274 - 420,274
FUND BALANCES
Nonspendable:Prepaid and Inventories 230,729 - 230,729 Permanent Fund Principal - 2,250,000 2,250,000
Restricted For:Victim's Advocate 36,896 - 36,896 TIF Debt Service or Capital Projects 1,137,132 - 1,137,132 Perpetual Care - 689,637 689,637 Tourism Related Expenditures - 4,471,795 4,471,795 Community Development - - - Transit Expenditures - 143,212 143,212
Assigned For:Capital Projects - 45,079 45,079 Appropriated for Use in FY 2020 Budget 4,708,075 - 4,708,075
Unassigned 8,813,307 (95,341) 8,717,966
TOTAL FUND BALANCES 14,926,139 7,504,382 22,430,521
TOTAL LIABILITIES, DEFERRED INFLOWS OF RESOURCES, AND FUND BALANCES 19,767,802$ 8,286,174 28,053,976$
CITY OF ANDERSON, SOUTH CAROLINA
BALANCE SHEET - GOVERNMENTAL FUNDS
JUNE 30, 2019
The notes to the financial statements are an integral part of this statement. See accompanying independent auditor's report.
28

CITY OF ANDERSON, SOUTH CAROLINA
RECONCILIATION OF THE GOVERNMENTAL FUNDS BALANCE SHEET TO THE STATEMENT OF NET POSITION
JUNE 30, 2019
TOTAL FUND BALANCES - GOVERNMENTAL FUNDS 22,430,521$
Amounts reported for the governmental activities in the Statement of Net Position are different because of thefollowing:
Property taxes receivable that will be collected in the future, but are not available soon enough to pay for thecurrent period's expenditures, and therefore have been deferred in the governmental funds. 420,274
Community and business development note receivables are not available to pay for current period expendituresand thus are not recognized in the governmental funds but are recognized in the Statement of Net Position. 1,994,285
Capital assets used in governmental activities are not current financial resources and therefore are not reportedas assets in governmental funds. The cost of the capital assets was $72,995,715 and the accumulateddepreciation was $35,073,291. 37,922,424
Accrued interest on the long-term obligations in governmental accounting is not due or payable in the currentperiod, therefore, they have not been reported as a liability in the funds. (31,240)
The City's net pension asset, deferred outflows of resources, and deferred inflows of resources related to theCity Pension Plan are not reported in the governmental funds but are in the Statement of Net Position. 2,186,872
The City's proportionate shares of the net pension liability, deferred outflows of resources, and deferred inflows of resources related to their participation in the State Retirement Plan are not recorded in the governmental funds but are recorded in the Statement of Net Position. (11,615,016)
The City's net OPEB liability, deferred outflows of resources, and deferred inflows of resources related to theCity's OPEB Plan are not reported in the governmental funds but is in the Statement of Net Position. (1,208,704)
Long-term liabilities, including bonds payable, are not due or payable in the current period and therefore are notreported as liabilities in the funds but are recorded in the Statement of Net Position. Long-term liabilities at year-end consisted of the following:
Debt Obligations (3,235,000) Lease Purchase Obligations (926,265) Compensated Absence Obligations (2,759,992)
TOTAL NET POSITION - GOVERNMENTAL ACTIVITIES 45,178,159$
The notes to the financial statements are an integral part of this statement. See accompanying independent auditor's report.
29
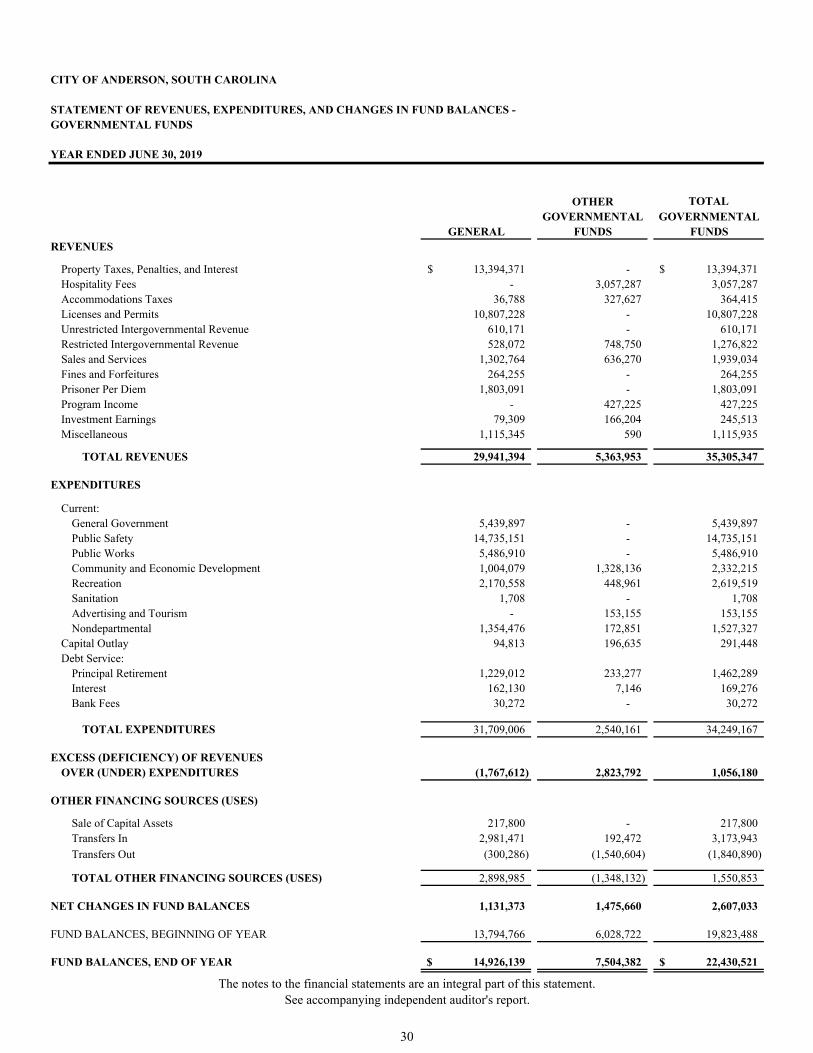
CITY OF ANDERSON, SOUTH CAROLINA
STATEMENT OF REVENUES, EXPENDITURES, AND CHANGES IN FUND BALANCES -GOVERNMENTAL FUNDS
YEAR ENDED JUNE 30, 2019
OTHER TOTALGOVERNMENTAL GOVERNMENTAL
GENERAL FUNDS FUNDSREVENUES
Property Taxes, Penalties, and Interest 13,394,371$ - 13,394,371$ Hospitality Fees - 3,057,287 3,057,287 Accommodations Taxes 36,788 327,627 364,415 Licenses and Permits 10,807,228 - 10,807,228 Unrestricted Intergovernmental Revenue 610,171 - 610,171 Restricted Intergovernmental Revenue 528,072 748,750 1,276,822 Sales and Services 1,302,764 636,270 1,939,034 Fines and Forfeitures 264,255 - 264,255 Prisoner Per Diem 1,803,091 - 1,803,091 Program Income - 427,225 427,225 Investment Earnings 79,309 166,204 245,513 Miscellaneous 1,115,345 590 1,115,935
TOTAL REVENUES 29,941,394 5,363,953 35,305,347
EXPENDITURES
Current:General Government 5,439,897 - 5,439,897 Public Safety 14,735,151 - 14,735,151 Public Works 5,486,910 - 5,486,910 Community and Economic Development 1,004,079 1,328,136 2,332,215 Recreation 2,170,558 448,961 2,619,519 Sanitation 1,708 - 1,708 Advertising and Tourism - 153,155 153,155 Nondepartmental 1,354,476 172,851 1,527,327
Capital Outlay 94,813 196,635 291,448 Debt Service:
Principal Retirement 1,229,012 233,277 1,462,289 Interest 162,130 7,146 169,276 Bank Fees 30,272 - 30,272
TOTAL EXPENDITURES 31,709,006 2,540,161 34,249,167
EXCESS (DEFICIENCY) OF REVENUESOVER (UNDER) EXPENDITURES (1,767,612) 2,823,792 1,056,180
OTHER FINANCING SOURCES (USES)
Sale of Capital Assets 217,800 - 217,800 Transfers In 2,981,471 192,472 3,173,943
Transfers Out (300,286) (1,540,604) (1,840,890)
TOTAL OTHER FINANCING SOURCES (USES) 2,898,985 (1,348,132) 1,550,853
NET CHANGES IN FUND BALANCES 1,131,373 1,475,660 2,607,033
FUND BALANCES, BEGINNING OF YEAR 13,794,766 6,028,722 19,823,488
FUND BALANCES, END OF YEAR 14,926,139$ 7,504,382 22,430,521$
The notes to the financial statements are an integral part of this statement. See accompanying independent auditor's report.
30

CITY OF ANDERSON, SOUTH CAROLINA
RECONCILIATION OF THE GOVERNMENTAL FUNDS STATEMENT OF REVENUES, EXPENDITURES, ANDCHANGES IN FUND BALANCES TO THE STATEMENT OF ACTIVITIES
YEAR ENDED JUNE 30, 2019
TOTAL NET CHANGE IN FUND BALANCES - GOVERNMENTAL FUNDS 2,607,033$
Amounts reported for the governmental activities in the Statement of Activities are different because of the following:
Property tax revenues in the Statement of Activities that do not provide current financial resources arenot reported as revenues in the funds. They are considered revenues in the Statement of Activities. (23,484)
Long-term community and business development loans (note receivables) made by the City during thecurrent year are reported as expenditures in the governmental funds but are shown as a note receivablein the Statement of Net Position. 126,925
The repayment of principal by debtors to the City is considered income in the governmental funds, but therepayment is shown as a reduction of the notes receivable amounts in the Statement of Net Position. (246,070)
Repayment of bond principal, lease purchase, and developer reimbursement is an expenditure in the governmentalfunds, but the repayment reduces long-term liabilities in the Statement of Net Position. 1,462,289
Interest on long-term debt in the Statement of Activities differs from the amount reported in the governmental funds because interest is recognized as an expenditure in the funds when it is due, andthus requires the use of current financial resources. In the Statement of Activities, however, interestexpense is recognized as the interest accrues, regardless of when it is due. 7,862
Changes in the City's net pension asset, deferred outflows of resources, and deferred inflows of resourcesrelated to the City Pension Plan for the current year are not reported in the governmental funds but are reported in the Statement of Activities (395,456)
Changes in the City's proportionate share of the net pension liability, deferred outflows of resources,and deferred inflows of resources related to the State Retirement Plan for the current year are not reported in the governmental funds but are reported in the Statement of Activities (829,924)
Changes in the City's net OPEB liability, deferred outflows of resources, and deferred inflows of resourcesrelated to the City's OPEB Plan for the current year are not reported in the governmental funds but are reported in the Statement of Activities (88,355)
Some expenses reported in the Statement of Activities do not require the use of current financial resourcesand therefore are not reported as expenditures in the governmental funds. 119,100
In the Statement of Activities the gain or loss on the sale of capital assets is reported, whereas in thegovernmental funds, the proceeds from the sale of assets increase financial resources. Thus, the changein net position differs from the change in fund balance by the net book value of the capital assets sold. (159,700)
Governmental funds report capital outlay as expenditures. However, in the Statement of Activities, capitaloutlay expenditures that qualify as capital asset additions are allocated over their estimated useful lives asdepreciation expense. This is the amount by which capital asset additions of $1,277,327 was exceededby depreciation expense of $2,726,389 in the current period. (1,449,062)
TOTAL CHANGE IN NET POSITION OF GOVERNMENTAL ACTIVITIES 1,131,158$
The notes to the financial statements are an integral part of this statement. See accompanying independent auditor's report.
31
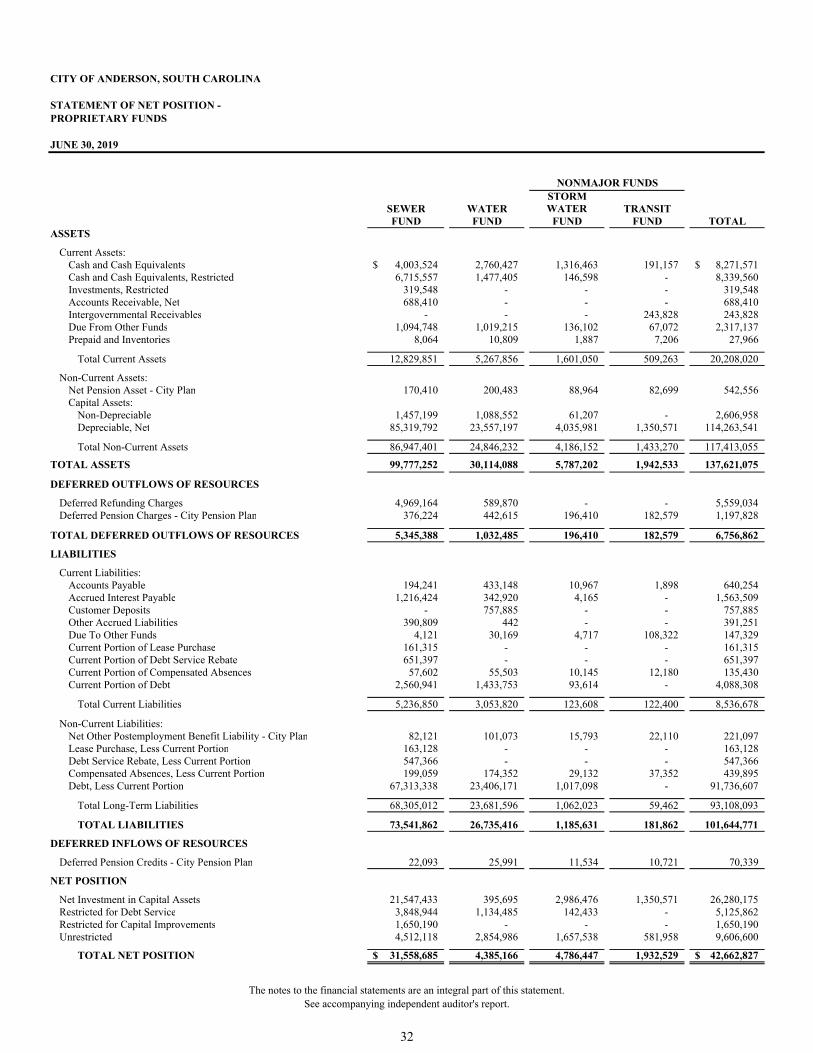
CITY OF ANDERSON, SOUTH CAROLINA
STATEMENT OF NET POSITION -PROPRIETARY FUNDS
JUNE 30, 2019
STORMSEWER WATER WATER TRANSITFUND FUND FUND FUND TOTAL
ASSETS
Current Assets:Cash and Cash Equivalents 4,003,524$ 2,760,427 1,316,463 191,157 8,271,571$ Cash and Cash Equivalents, Restricted 6,715,557 1,477,405 146,598 - 8,339,560 Investments, Restricted 319,548 - - - 319,548 Accounts Receivable, Net 688,410 - - - 688,410 Intergovernmental Receivables - - - 243,828 243,828 Due From Other Funds 1,094,748 1,019,215 136,102 67,072 2,317,137 Prepaid and Inventories 8,064 10,809 1,887 7,206 27,966
Total Current Assets 12,829,851 5,267,856 1,601,050 509,263 20,208,020
Non-Current Assets:Net Pension Asset - City Plan 170,410 200,483 88,964 82,699 542,556 Capital Assets:
Non-Depreciable 1,457,199 1,088,552 61,207 - 2,606,958 Depreciable, Net 85,319,792 23,557,197 4,035,981 1,350,571 114,263,541
Total Non-Current Assets 86,947,401 24,846,232 4,186,152 1,433,270 117,413,055
TOTAL ASSETS 99,777,252 30,114,088 5,787,202 1,942,533 137,621,075
DEFERRED OUTFLOWS OF RESOURCES
Deferred Refunding Charges 4,969,164 589,870 - - 5,559,034 Deferred Pension Charges - City Pension Plan 376,224 442,615 196,410 182,579 1,197,828
TOTAL DEFERRED OUTFLOWS OF RESOURCES 5,345,388 1,032,485 196,410 182,579 6,756,862
LIABILITIES
Current Liabilities:Accounts Payable 194,241 433,148 10,967 1,898 640,254 Accrued Interest Payable 1,216,424 342,920 4,165 - 1,563,509 Customer Deposits - 757,885 - - 757,885 Other Accrued Liabilities 390,809 442 - - 391,251 Due To Other Funds 4,121 30,169 4,717 108,322 147,329 Current Portion of Lease Purchase 161,315 - - - 161,315 Current Portion of Debt Service Rebate 651,397 - - - 651,397 Current Portion of Compensated Absences 57,602 55,503 10,145 12,180 135,430 Current Portion of Debt 2,560,941 1,433,753 93,614 - 4,088,308
Total Current Liabilities 5,236,850 3,053,820 123,608 122,400 8,536,678
Non-Current Liabilities:Net Other Postemployment Benefit Liability - City Plan 82,121 101,073 15,793 22,110 221,097 Lease Purchase, Less Current Portion 163,128 - - - 163,128 Debt Service Rebate, Less Current Portion 547,366 - - - 547,366 Compensated Absences, Less Current Portion 199,059 174,352 29,132 37,352 439,895 Debt, Less Current Portion 67,313,338 23,406,171 1,017,098 - 91,736,607
Total Long-Term Liabilities 68,305,012 23,681,596 1,062,023 59,462 93,108,093
TOTAL LIABILITIES 73,541,862 26,735,416 1,185,631 181,862 101,644,771
DEFERRED INFLOWS OF RESOURCES
Deferred Pension Credits - City Pension Plan 22,093 25,991 11,534 10,721 70,339
NET POSITION
Net Investment in Capital Assets 21,547,433 395,695 2,986,476 1,350,571 26,280,175 Restricted for Debt Service 3,848,944 1,134,485 142,433 - 5,125,862 Restricted for Capital Improvements 1,650,190 - - - 1,650,190 Unrestricted 4,512,118 2,854,986 1,657,538 581,958 9,606,600
TOTAL NET POSITION 31,558,685$ 4,385,166 4,786,447 1,932,529 42,662,827$
NONMAJOR FUNDS
The notes to the financial statements are an integral part of this statement. See accompanying independent auditor's report.
32

CITY OF ANDERSON, SOUTH CAROLINA
STATEMENT OF REVENUES, EXPENSES, AND CHANGES IN FUND NET POSITION - PROPRIETARY FUNDS
YEAR ENDED JUNE 30, 2019
STORMSEWER WATER WATER TRANSITFUND FUND FUND FUND TOTAL
OPERATING REVENUES
Charges for Services 9,383,985$ 7,967,301 1,125,811 221,099 18,698,196$ Cost Recovery Charges 2,704,570 - - - 2,704,570 Pretreatment Fees 104,700 - - - 104,700 Permits and Fees 85,600 240,196 - - 325,796 Other Operating Fees 65,521 474,679 - 176,849 717,049
TOTAL OPERATING REVENUES 12,344,376 8,682,176 1,125,811 397,948 22,550,311
OPERATING EXPENSES
Administrative 743,800 1,013,549 500,114 213,328 2,470,791 Operating - - - 650,711 650,711 Sewer Line 1,019,361 - - - 1,019,361 Plant 2,407,978 - - - 2,407,978 Sewer Lab 78,784 - - - 78,784 Pretreatment 140,661 - - - 140,661 Municipal Business Center - 117,148 - - 117,148 Water Distribution and Storage - 1,713,758 - - 1,713,758 Garage - - - 180,728 180,728 Nondepartmental 339,326 215,810 27,316 17,801 600,253 Purchased Water - 3,071,297 - - 3,071,297 Depreciation and Amortization 4,127,103 1,079,890 334,646 238,851 5,780,490
TOTAL OPERATING EXPENSES 8,857,013 7,211,452 862,076 1,301,419 18,231,960
OPERATING INCOME (LOSS) 3,487,363 1,470,724 263,735 (903,471) 4,318,351
NON-OPERATING REVENUES (EXPENSES)
Federal Grants - - - 473,528 473,528 State Grants - - - 151,483 151,483 Interest Earned on Investments 123,721 26,283 6,451 - 156,455 Interest on Long-Term Obligations (2,144,224) (754,492) (25,939) - (2,924,655)
TOTAL NON-OPERATING REVENUES (EXPENSES) (2,020,503) (728,209) (19,488) 625,011 (2,143,189)
INCOME (LOSS) BEFORE CONTRIBUTIONS AND TRANSFERS 1,466,860 742,515 244,247 (278,460) 2,175,162
Capital Contributions - Capacity Fees 21,000 42,200 - - 63,200 Donated Capital Assets 112,572 21,600 - - 134,172 Transfers In - - - 174,885 174,885 Transfers Out (701,250) (573,750) (125,125) (107,813) (1,507,938)
CHANGE IN NET POSITION 899,182 232,565 119,122 (211,388) 1,039,481
NET POSITION, BEGINNING OF YEAR 30,659,503 4,152,601 4,667,325 2,143,917 41,623,346
NET POSITION, END OF YEAR 31,558,685$ 4,385,166 4,786,447 1,932,529 42,662,827$
NONMAJOR FUNDS
The notes to the financial statements are an integral part of this statement. See accompanying independent auditor's report.
33

CITY OF ANDERSON, SOUTH CAROLINA
STATEMENT OF CASH FLOWS -PROPRIETARY FUNDS
YEAR ENDED JUNE 30, 2019
STORMSEWER WATER WATER TRANSITFUND FUND FUND FUND TOTAL
CASH FLOWS FROM OPERATING ACTIVITIES
Receipts from Customers and Users 13,479,791$ 8,694,235 1,125,811 397,948 23,697,785$ Payments to Suppliers for Goods and Services (3,848,362) (4,013,906) (137,155) (891,420) (8,890,843) Payments for Personal Services (1,422,621) (1,768,334) (330,477) (157,020) (3,678,452)
NET CASH PROVIDED BY (USED IN) OPERATING ACTIVITIES 8,208,808 2,911,995 658,179 (650,492) 11,128,490
CASH FLOWS FROM NON-CAPITAL FINANCING ACTIVITIES
State and Federal Grants - - - 785,599 785,599 Transfers to Other Funds (692,133) (659,704) (114,724) (107,813) (1,574,374) Transfers from Other Funds - - - 89,991 89,991
NET CASH PROVIDED BY (USED IN)NON-CAPITAL FINANCING ACTIVITIES (692,133) (659,704) (114,724) 767,777 (698,784)
CASH FLOWS FROM CAPITAL AND RELATED FINANCING ACTIVITIES
Capital Contributions - Capacity Fees and Grants 21,000 42,200 - - 63,200 Acquisition of Capital Assets (1,211,541) (807,173) (19,540) - (2,038,254) Bond and Note Proceeds Received 1,007,706 - - - 1,007,706 Bond and Revolving Fund Loan Principal Payments (3,205,987) (1,189,783) (91,538) - (4,487,308) Bond and Revolving Fund Loan Interest Payments (2,583,079) (834,783) (26,282) - (3,444,144) Debt Service Rebate Payments (656,464) - - - (656,464)
NET CASH USED IN CAPITAL AND RELATED FINANCING ACTIVITIES (6,628,365) (2,789,539) (137,360) - (9,555,264)
CASH FLOWS FROM INVESTING ACTIVITIES
Investment Earnings 123,721 26,283 6,451 - 156,455 Short Term Investments, Net (149,218) - - - (149,218)
NET CASH PROVIDED BY INVESTING ACTIVITIES (25,497) 26,283 6,451 - 7,237
NET INCREASE (DECREASE) IN RESTRICTED AND UNRESTRICTED CASH AND CASH EQUIVALENTS 862,813 (510,965) 412,546 117,285 881,679
RESTRICTED AND UNRESTRICTEDCASH AND CASH EQUIVALENTS, Beginning of Year 9,856,268 4,748,797 1,050,515 73,872 15,729,452
RESTRICTED AND UNRESTRICTEDCASH AND CASH EQUIVALENTS, End of Year 10,719,081$ 4,237,832 1,463,061 191,157 16,611,131$
Reconciliation of Operating Income (Loss) to Net Cash from Operating Activities:
Operating Income (Loss) 3,487,363$ 1,470,724 263,735 (903,471) 4,318,351$ Adjustments to Reconcile Operating Income (Loss)
to Net Cash from Operating Activities:Depreciation and Amortization Expense 4,127,103 1,079,890 334,646 238,851 5,780,490 Change in Accounts Representing Operating Activities:
Accounts Receivable 537,370 - - - 537,370 Prepaids and Inventory (589) (789) (138) (526) (2,042) Accounts Payable (489,905) 174,500 6,722 (10,072) (318,755) Customer Deposits - 12,059 - - 12,059 Other Accrued Liabilities (155,940) 9 - (625) (156,556) Intergovernmental Payables - - - (27,342) (27,342) Compensated Absences 4,632 58,529 4,950 3,842 71,953 Other Post Employment Benefits 3,958 4,872 761 1,066 10,657 Debt Service Rebate 598,045 - - - 598,045 Net Pension Asset 434,658 509,758 223,978 211,739 1,380,133 Deferred Pension Charges (202,859) (239,117) (106,746) (98,217) (646,939) Deferred Pension Credits (135,028) (158,440) (69,729) (65,737) (428,934)
Net Cash Provided by (Used in) Operating Activities 8,208,808$ 2,911,995 658,179 (650,492) 11,128,490$
Noncash Investing and Capital and Related Financing ItemsSRF Loan Proceeds Accrued but Not Yet Received 85,047$ - - - -$ Donated Capital Assets 112,572$ 21,600 - - 134,172$
NONMAJOR FUNDS
The notes to the financial statements are an integral part of this statement. See accompanying independent auditor's report.
34
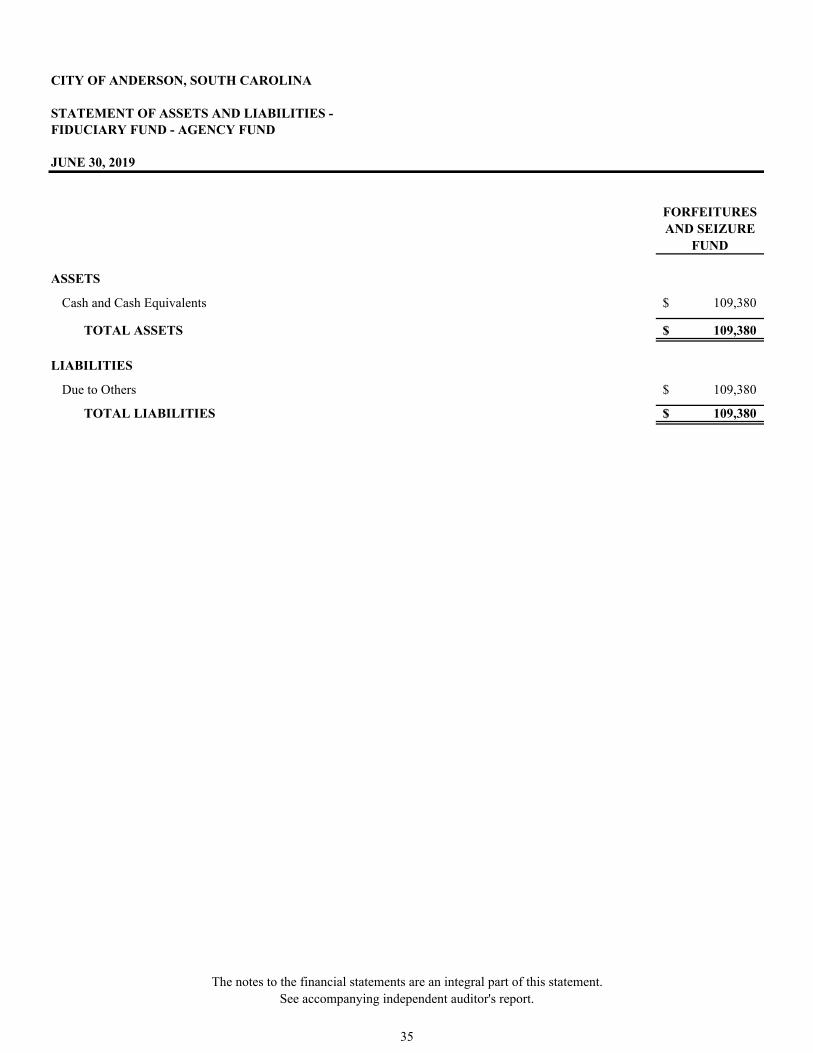
FORFEITURES AND SEIZURE
FUND
ASSETS
Cash and Cash Equivalents 109,380$
TOTAL ASSETS 109,380$
LIABILITIES
Due to Others 109,380$
TOTAL LIABILITIES 109,380$
CITY OF ANDERSON, SOUTH CAROLINA
STATEMENT OF ASSETS AND LIABILITIES -
JUNE 30, 2019
FIDUCIARY FUND - AGENCY FUND
The notes to the financial statements are an integral part of this statement. See accompanying independent auditor's report.
35

GENERAL EMPLOYEES' RETIREMENT
PLANASSETS
Cash and Cash Equivalents 746,339$ Investments:
Commingled Domestic Equity Funds 15,031,587 Commingled Foreign Equity Funds 3,908,997 Commingled Domestic Bond Funds 9,247,907 Commingled Foreign Bond Funds 1,024,469
Accounts Receivable:Contributions 226,355 Interest 21,913
Other Assets 21,380
TOTAL ASSETS 30,228,947$
LIABILITIES
Accounts Payable 359$
TOTAL LIABILITIES 359
NET POSITION
Net Position Restricted for Pensions 30,228,588
TOTAL NET POSITION AND LIABILITIES 30,228,947$
CITY OF ANDERSON, SOUTH CAROLINA
STATEMENT OF NET POSITION -FIDUCIARY FUND - PENSION TRUST FUND
DECEMBER 31, 2018
The notes to the financial statements are an integral part of this statement. See accompanying independent auditor's report.
36
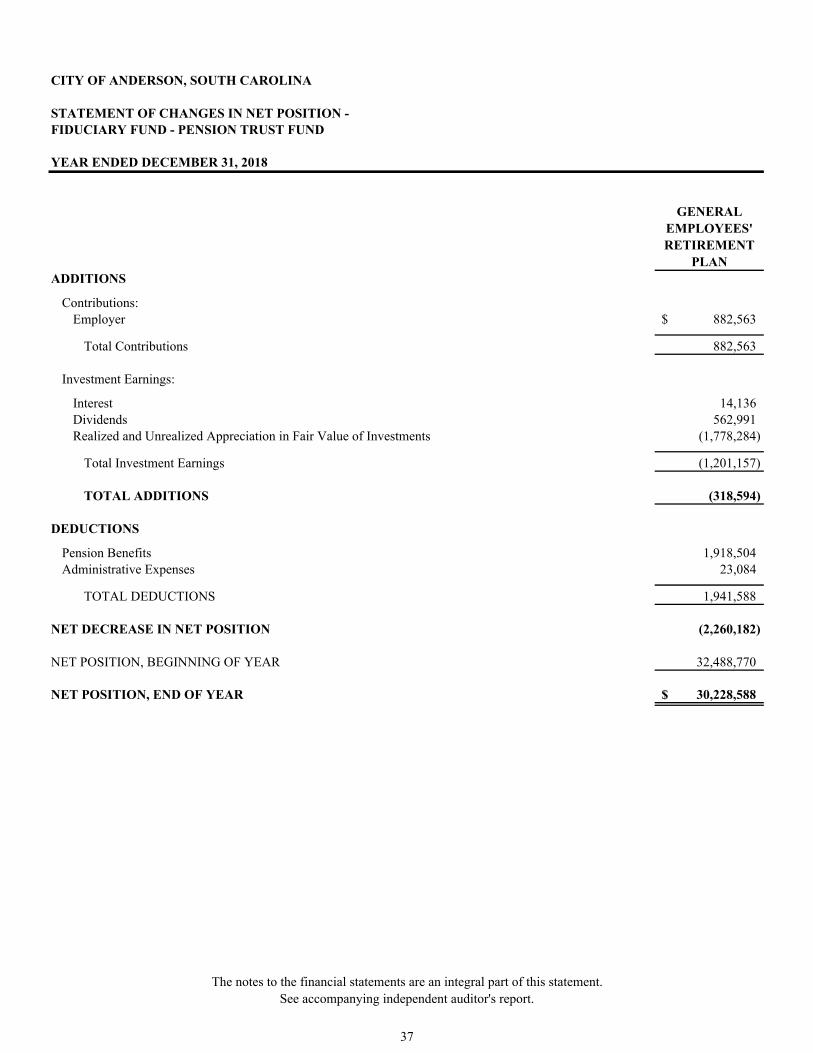
CITY OF ANDERSON, SOUTH CAROLINA
STATEMENT OF CHANGES IN NET POSITION -FIDUCIARY FUND - PENSION TRUST FUND
YEAR ENDED DECEMBER 31, 2018
GENERAL EMPLOYEES' RETIREMENT
PLANADDITIONS
Contributions:Employer 882,563$
Total Contributions 882,563
Investment Earnings:
Interest 14,136 Dividends 562,991 Realized and Unrealized Appreciation in Fair Value of Investments (1,778,284)
Total Investment Earnings (1,201,157)
TOTAL ADDITIONS (318,594)
DEDUCTIONS
Pension Benefits 1,918,504 Administrative Expenses 23,084
TOTAL DEDUCTIONS 1,941,588
NET DECREASE IN NET POSITION (2,260,182)
NET POSITION, BEGINNING OF YEAR 32,488,770
NET POSITION, END OF YEAR 30,228,588$
The notes to the financial statements are an integral part of this statement. See accompanying independent auditor's report.
37
CITY OF ANDERSON, SOUTH CAROLINA NOTES TO THE FINANCIAL STATEMENTS YEAR ENDED JUNE 30, 2019
The City of Anderson (“City”) was founded in December 1826 and incorporated by an act of Legislature on December 9, 1833. Section 47-26 of the 1962 Code of Laws, as amended (Home Rule Act), requires that municipalities adopt a specific form of government. The City operates under Council-Manager form of government. The Council is composed of a Mayor and eight Council members. The Mayor and two Council members are elected at-large and six Council members are elected on a single member ward basis. The Mayor and Council, elected for four-year staggered terms, are vested with the legislative and policymaking powers of the City. The Council appoints a City Manager who serves as the chief executive officer of the City and is responsible to the Council for proper administration of all affairs of the City. I. SUMMARY OF SIGNIFICANT ACCOUNTING POLICIES
A. The Reporting Entity
The financial statements of the City have been prepared in conformity with accounting principles generally accepted in the United States of America, (“GAAP”), as applied to governmental units. The Governmental Accounting Standards Board (“GASB”) is the accepted standard-setting body for establishing governmental accounting and financial reporting principles. The more significant of the City’s accounting policies are described below. As required by GAAP, the financial statements present the City’s financial information with any of its component units. The primary criterion for determining inclusion or exclusion of a legally separate entity (component unit) is financial accountability, which is presumed to exist if the City both appoints a voting majority of the entity’s governing body, and either 1) the City is able to impose its will on the entity or, 2) there is a potential for the entity to provide specific financial benefits to, or impose specific financial burdens on the City. If either or both of the foregoing conditions are not met, the entity could still be considered a component unit if it is fiscally dependent on the City and there is a potential that the entity could either provide specific financial benefits to, or to impose specific financial burdens on the City. In order to be considered fiscally independent, an entity must have the authority to do all of the following: (a) determine its budget without the City having the authority to approve or modify that budget; (b) levy taxes or set rates or charges without approval by the City; and (c) issue bonded debt without approval by the City. An entity has a financial benefit or burden relationship with the City if, for example, any one of the following conditions exists: (a) the City is legally entitled to or can otherwise access the entity’s resources, (b) the City is legally obligated or has otherwise assumed the obligation to finance the deficits or, or provide financial support to, the entity, or (c) the City is obligated in some manner for the debt of the entity. Finally, an entity could be a component unit even if it met all the conditions described above for being fiscally independent if excluding it would cause the City’s financial statements to be misleading. Blended component units, although legally separate entities, are in substance, part of the government's operations and data from these units are combined with data of the primary government in the fund financial statements. Discretely presented component units, on the other hand, are reported in a separate column in the government-wide financial statements to emphasize they are legally separate from the City. Based on the criteria above, the City does not have any component units. Related Organizations Anderson Regional Joint Water System (“System”) was formed as a partnership of rural and municipal water districts devoted to providing a high-quality, clean, safe, reliable, economical flow of treated water to its wholesale customers in Anderson and Pickens counties. The System is governed by a fourteen-member Board of Commissioners for which the City of Anderson serves as a member and its largest customer. Each member of the Board represents a water district or municipality that purchases its water from the Joint Water System. Currently, there are fifteen (15) member agencies in Anderson and Pickens Counties. The City has the responsibility of appointing one board member but this appointment does not represent a majority or controlling interest in the System. The System does not have significant exclusive operational or financial relationships with the City. Therefore, it is not considered to be a component unit as defined by GAAP.
38

CITY OF ANDERSON, SOUTH CAROLINA NOTES TO THE FINANCIAL STATEMENTS YEAR ENDED JUNE 30, 2019
I. SUMMARY OF SIGNIFICANT ACCOUNTING POLICIES (CONTINUED)
A. The Reporting Entity (Continued)
Related Organizations (Continued) The City, the County of Anderson, and the City of Belton in 2006 joined together to form the Home Consortium (“Consortium”). The Consortium was formed to make available federal funds through the US Department of Housing and Urban Development Home program. The Consortium does not have an official board or council. The City is eligible to receive 35% of the funds allocated to the Consortium (after certain defined fees and administrative expenses of the Consortium). The City does not have financial accountability for the Consortium but merely reports its portion of the revenues and expenditures earned/incurred related to the HOME program. The Consortium is not considered to be a component unit as defined by GAAP. Major Operations
The City’s major operations as authorized by its charter: public safety (police and fire), highways and streets, sanitation, health and social services, culture-recreation, public improvements, planning and zoning, sewer and water, transit services and general administration.
B. Measurement Focus, Basis of Accounting, and Basis of Presentation
The government-wide financial statements (i.e., the Statement of Net Position and the Statement of Activities) report information on all of the non-fiduciary activities of the City (the “Primary Government”). For the most part, the effect of interfund activity (except for interfund services provided and used between functions) has been removed from these financial statements. Governmental activities, which normally are supported by taxes and intergovernmental revenues, are reported separately from business-type activities, which rely, to a significant extent, on fees and charges for support. The Statement of Activities demonstrates the degree to which the direct expenses of a given function or segment are offset by program revenues. Direct expenses are those that are clearly identifiable with a specific function or segment. Program revenues include 1) charges to customers or applicants who purchase, use, or directly benefit from goods, services or privileges provided by a given function or segment and 2) grants and contributions that are restricted to meeting the operational or capital requirements of a particular function or segment. Taxes and other items not properly included among program revenues are reported instead as general revenues. The comparison of direct expenses with program revenues identifies the extent to which each business segment or governmental function is self-financing or draws from the general revenues of the City.
The government-wide financial statements are reported using the economic resources measurement focus and the accrual basis of accounting, as are the Proprietary and Fiduciary Funds financial statements. Revenues are recorded when earned and expenses are recorded when a liability is incurred, regardless of the timing of related cash flows. Non-exchange transactions, in which the City gives or receives value without directly receiving or giving equal value in exchange, includes property taxes, grants and donations. Property taxes are recognized as revenues in the year for which they are levied. Grants and similar items are recognized as revenues as soon as all eligibility requirements imposed by the provider have been met. The government-wide statements are prepared using a different measurement focus from the manner in which governmental fund financial statements are prepared (see further detail below). Governmental fund financial statements therefore, include reconciliations with brief explanations to better identify the relationship between the government-wide statements and the statements for governmental funds.
39
CITY OF ANDERSON, SOUTH CAROLINA NOTES TO THE FINANCIAL STATEMENTS YEAR ENDED JUNE 30, 2019
I. SUMMARY OF SIGNIFICANT ACCOUNTING POLICIES (CONTINUED)
B. Measurement Focus, Basis of Accounting, and Basis of Presentation (Continued)
Governmental fund financial statements are reported using the current financial resources measurement focus and the modified accrual basis of accounting. Revenues are recognized as soon as they are both measurable and available. Revenues are considered to be available when they are collectible within the current period or soon enough thereafter to pay liabilities of the current period. Property taxes, intergovernmental revenues, franchise taxes, licenses, and interest associated with the current fiscal period are all considered to be measurable and susceptible to accrual and so have been recognized as revenues of the current fiscal period. For this purpose, the government generally considers property taxes to be available if they are collected within 60 days of the end of the current fiscal period. A four-month availability period is generally used for revenue recognition for all other governmental fund revenues.
Expenditures generally are recorded when a liability is incurred, as under accrual accounting. However, debt service expenditures, capital lease expenditures, as well as expenditures related to compensated absences and claims and judgments, are recorded only when payments are due and payable. Capital asset acquisitions are reported as capital outlay expenditures in governmental funds. Proceeds of long-term debt and acquisitions under capital leases are reported as other financing sources. Fund financial statements report detailed information about the City. The focus of governmental and enterprise fund financial statements is on major funds rather than reporting funds by type. Each major fund is presented in a separate column. Non-major funds are aggregated and presented in a single column. Fiduciary funds are reported by fund type. When both restricted and unrestricted resources are available for use, it is the City’s practice to use restricted resources first, then unrestricted resources as they are needed. The accounts of the government are organized and operated on the basis of funds. A fund is an independent fiscal and accounting entity with a self-balancing set of accounts. Fund accounting segregates funds according to their intended purpose and is used to aid management in demonstrating compliance with finance-related legal and contractual provisions. The minimum number of funds is maintained consistent with legal and managerial requirements. The following major funds and fund types are used by the City.
Governmental Fund Types are those through which most governmental functions of the City are financed. The City's expendable financial resources and related assets and liabilities (except for those accounted for in the Proprietary Funds and Fiduciary Funds) are accounted for through governmental funds. Governmental funds are accounted for using the current financial resources measurement focus and the modified accrual basis of accounting. The City’s governmental fund types and major and non-major funds are as follows:
The General Fund, a major fund and a budgeted fund, is the general operating fund of the City and accounts for all revenues and expenditures of the City except those required to be accounted for in other funds. All general tax revenues and other receipts that (a) are not allocated by law or contractual agreement to other funds or (b) that have not been restricted, committed, or assigned to other funds are accounted for in the General Fund. General operating expenditures and the capital improvement costs that are not paid through other funds are paid from the General Fund. The Special Revenue Funds, non-major funds, are used to account for the proceeds of specific revenue sources (that are expected to continue to comprise a substantial portion of the inflows of the fund) that are restricted or committed to expenditures for specified purposes other than debt service or capital projects. The City has the following non-major budgeted Special Revenue Funds:
Community Development Fund Perpetual Care Fund Accommodations Tax Fund Hospitality Fee Fund
40

CITY OF ANDERSON, SOUTH CAROLINA NOTES TO THE FINANCIAL STATEMENTS YEAR ENDED JUNE 30, 2019
I. SUMMARY OF SIGNIFICANT ACCOUNTING POLICIES (CONTINUED)
B. Measurement Focus, Basis of Accounting, and Basis of Presentation (Continued)
The Capital Replacement Fund, a non-major capital projects fund and a budgeted fund, is used to account for and report resources that are received from the City’s sanitation fee or that are transferred from other funds to provide resources for future capital asset purchases. The sanitation fee funds are by ordinance committed for capital replacement purposes. Any unspent sanitation fee funds will be shown as committed fund balance in this fund. The Permanent Fund, a non-major fund and a budgeted fund, is used to account for and report resources that are endowed to the City in trust, for which only the interest earnings may be used by the City for various restricted purposes as specified by the private donors. The City’s Transportation Investment Fund is used to account for a $2,250,000 contribution to the City from a local utility company to divest itself of the transit operations. The original contribution and subsequent investment earnings are restricted by City Council as to amount and nature of allowable expenditures with a portion being available for transit operations. This is a budgeted fund and any remaining fund balance is restricted.
Proprietary Fund Types are accounted for based on the economic resources measurement focus and use of the accrual basis of accounting. Under this method, revenues are recorded when earned and expenses are recorded at the time liabilities are incurred. Proprietary funds are made up of two classes: enterprise funds and internal service funds. The City does not have any internal service funds and has four enterprise funds.
Proprietary funds distinguish operating revenues and expenses from non-operating items. Operating revenues and expenses generally result from providing services and producing and delivering goods in connection with a proprietary fund’s principal ongoing operations. The principal operating revenues of enterprise funds are primarily charges for services and fees. Operating expenses for enterprise funds include the expense for providing goods and services, administrative expenses, maintenance, and depreciation of capital assets. All revenues and expenses not meeting this definition are reported as non-operating revenues and expenses. The City’s proprietary fund types and major and non-major funds are as follows:
Enterprise Funds are used to account for operations (a) that are financed and operated in a manner similar to private business enterprises — where the intent of the governing body is that the costs (expenses, including depreciation) of providing goods or services to the general public on a continuing basis be financed or recovered primarily through user charges; or (b) where the governing body has decided that periodic determination of revenues earned, expenses incurred, and/or net income is appropriate for capital maintenance, public policy, management control, accountability, or other purposes. The City has the following Enterprise Funds:
The Sewer Fund, a major fund, is used to account for the City’s sewer operations. The City operates two wastewater treatment facilities and provides sewer taps for the City and the surrounding areas. This is a budgeted fund. The Water Fund, a major fund, is used to account for the City’s water operations. The City owns the water mains and lines and provides water services for the City and the surrounding areas. This is a budgeted fund. The Storm Water Utility Fund, a non-major fund, is used to account for the City’s storm water drainage operations. This is a budgeted fund. The Transit Fund, a non-major fund, is used to account for the City’s transit operations. The City provides transit services for citizens of the City by maintaining five bus routes. This is a budgeted fund.
41

CITY OF ANDERSON, SOUTH CAROLINA NOTES TO THE FINANCIAL STATEMENTS YEAR ENDED JUNE 30, 2019
I. SUMMARY OF SIGNIFICANT ACCOUNTING POLICIES (CONTINUED)
B. Measurement Focus, Basis of Accounting, and Basis of Presentation (Continued)
Fiduciary Fund Types include the Pension Trust Fund and the Agency Fund. These funds are used to account for assets held by the City in a trustee capacity for individuals, other governments, and/or other funds and are accounted for in essentially the same manner as Proprietary Funds. Pension Trust funds account for resources that are required to be held in trust for the members and beneficiaries of defined benefit plans. The General Employees’ Retirement Plan Fund is used to account for the City’s single-employer defined benefit retirement plan. The General Employees’ Retirement Plan Fund is shown on a calendar year basis since the plan’s year end is December 31st. Agency funds are generally used to account for miscellaneous assets that the government holds on behalf of others. The Forfeitures and Seizures Fund is used to account for money that was forfeited and/or seized during a law enforcement action. This money is held until completion of court proceedings. The Forfeitures and Seizures Fund is custodial in nature and does not present results of operations.
C. Assets, Liabilities, Deferred Outflows/Inflows of Resources, and Equity
1. Cash, Cash Equivalents, and Investments
The City considers all highly liquid investments (including restricted assets) with original maturities of three months or less when purchased and money market mutual funds to be cash equivalents. Securities with an initial maturity of more than three months (from when initially purchased) and other non-money market mutual funds are reported as investments.
The City’s operating cash and investment policy is designed to operate within existing statutes (which are identical for all non-fiduciary funds, fund types and component units within the State of South Carolina). The statutes of the State of South Carolina authorize the City to invest in the following:
(a) Obligations of the United States and its agencies, the principal and interest of which is fully guaranteed by
the United States. (b) Obligations issued by the Federal Financing Bank, Federal Farm Credit Bank, the Bank of Cooperatives, the
Federal Intermediate Credit Bank, the Federal Land Banks, the Federal Home Loan Banks, the Federal Home Loan Mortgage Corporation, the Federal National Mortgage Association, the Government National Mortgage Association, the Federal Housing Administration, and the Farmers Home Administration, if, at the time of investment, the obligor has a long-term, unenhanced, unsecured debt rating in one of the top two ratings categories, without regard to a refinement or gradation of rating category by numerical modifier or otherwise, issued by at least two nationally recognized credit rating organizations.
(c) (i) General obligations of the State of South Carolina or any of its political units; or (ii) revenue obligations
of the State of South Carolina or its political units, if at the time of investment, the obligor has a long-term, unenhanced, unsecured debt rating in one of the top two ratings categories, without regard to a refinement or gradation of rating category by numerical modifier or otherwise, issued by at least two nationally recognized credit rating organizations.
(d) Savings and Loan Associations to the extent that the same are insured by an agency of the federal government. (e) Certificates of deposit where the certificates are collaterally secured by securities of the type described in (a)
and (b) above held by a third party as escrow agent or custodian, of a market value not less than the amount of the certificates of deposit so secured, including interest; provided, however, such collateral shall not be required to the extent the same are insured by an agency of the federal government.
(f) Repurchase agreements when collateralized by securities as set forth in this section.
42

CITY OF ANDERSON, SOUTH CAROLINA NOTES TO THE FINANCIAL STATEMENTS YEAR ENDED JUNE 30, 2019
I. SUMMARY OF SIGNIFICANT ACCOUNTING POLICIES (CONTINUED)
C. Assets, Liabilities, Deferred Outflows/Inflows of Resources, and Equity (Continued) 1. Cash, Cash Equivalents, and Investments (Continued)
(g) No load open-end or closed-end management type investment companies or investment trusts registered
under the Investment Company Act of 1940, as amended, where the investment is made by a bank or trust company or savings and loan association or other financial institution when acting as trustee or agent for a bond or other debt issue of that local government unit, political subdivision, or county treasurer if the particular portfolio of the investment company or investment trust in which the investment is made (i) is limited to obligations described in items (a), (b), (c), and (f) of this subsection, and (ii) has among its objectives the attempt to maintain a constant net asset value of one dollar a share and to that end, value its assets by the amortized cost method.
The City’s cash and investment objectives are preservation of capital, liquidity and yield. The City reports its cash and investments at fair value which is normally determined by quoted market prices. The City currently or in the past year has primarily used the following investments in its operating activities:
Money market mutual funds are generally open-ended funds that invest in short term debt securities
(including obligations of the United States and related agencies) that generally have a weighted average maturity of 60 days or less and do not invest more than 5% in any one issuer, except for government securities and repurchase agreements.
Certificates of Deposit (“CD”) are bond-type investments issued by a bank when a person or company
deposits a certain amount of money for a determined amount of time. The maturity can be up to five years, and interest is paid to the holder of the CD at an agreed upon rate. Money removed before maturity is subject to a penalty.
Municipal securities are issued by state and local governments or their agencies which may be general
obligations of the issuer or secured by specified revenues. Interest income received by holders of municipal bonds is often exempt from the federal and state income tax.
US securities are generally treasury notes, treasury bonds, treasury bills, and related securities which are debt
obligations of the U.S. government (lending money to the federal government for a specified period of time). These debt obligations are backed by the “full faith and credit” of the government, and thus by its ability to raise tax revenues and print currency, U.S. Treasury securities are considered the safest of all investments.
Agency securities are securities that are generally backed by mortgage loans, and due to their creation from particular corporations that are sponsored by the U.S. government, they enjoy credit protection based on either an implicit or explicit guarantee from the U.S. Government.
South Carolina Local Government Investment Pool (“LGIP” or “Pool”) investments are invested with the
South Carolina State Treasurer’s Office, which established the South Carolina Pool pursuant to Section 6-6-10 of the South Carolina Code. The Pool is an investment trust fund, in which public monies in excess of current needs, which are under the custody of any city treasurer or any governing body of a political subdivision of the State, may be deposited. In accordance with GASB Statement No. 31 “Accounting and Financial Reporting for Certain Investments and for External Investment Pools” and GASB Statement No. 72 “Fair Value Measurement and Application”, investments are carried at fair value determined annually based upon (a) quoted market prices for identical or similar investments or (b) observable inputs other than quoted market prices. The total fair value of the Pool is apportioned to the entities with funds invested on an equal basis for each share owned, which are acquired at a cost of $1.00. Funds may be deposited by Pool participants at any time and may be withdrawn upon 24 hours’ notice. Financial statements for the Pool may be obtained by writing the Office of State Treasurer, Local Government Investment Pool, P.O. Box 11778, Columbia, SC 29211-1960.
43
CITY OF ANDERSON, SOUTH CAROLINA NOTES TO THE FINANCIAL STATEMENTS YEAR ENDED JUNE 30, 2019
I. SUMMARY OF SIGNIFICANT ACCOUNTING POLICIES (CONTINUED)
C. Assets, Liabilities, Deferred Outflows/Inflows of Resources, and Equity (Continued)
2. Receivables and Payables
During the course of its operations, the City has numerous transactions occurring between funds. These transactions include expenditures and transfers of resources to provide services, construct assets, and service debt. The accompanying financial statements generally reflect such transactions as transfers in (out). To the extent that certain transactions between funds had not been paid or received as of year-end, balances of interfund amounts or payables have been recorded. All trade and property taxes receivable are shown net of an allowance for uncollectible amounts. Trade receivables are comprised of amounts due from entities and individuals for a variety of types of fees, charges and services, including franchise fees, hospitality fees, sanitation, water, sewer, storm water, and other fees and charges.
3. Inventories and Prepaid Items
Inventories of materials, supplies and gasoline are stated at average cost, which approximates market. The costs of inventories and prepaid items are accounted for using the consumption method (expensed when consumed).
4. Capital Assets
General capital assets are those assets not specifically related to activities reported in the Proprietary Funds. These assets generally result from expenditures in the governmental funds. These assets are reported in the governmental activities column of the Government-Wide Statement of Net Position, but are not reported in the fund financial statements. Capital assets utilized by the Proprietary Funds are reported both in the business-type activities column of the Government-Wide Statement of Net Position and in the respective fund financial statements.
The City defines capital assets as assets with an initial, individual cost of more than $5,000 (amount not rounded) or groupings of similar items with individual costs is less than $5,000, but when purchased together the total is greater than $100,000 and an estimated useful life in excess of one year. Such assets are recorded at historical cost or estimated historical cost if not purchased or constructed. Donated capital assets are recorded at estimated acquisition value (as estimated by the City) at the date of donation.
Public domain (“infrastructure”) general capital assets acquired prior to July 1, 2002, consist of the road network (roads, bridges, curbs and gutters, streets, and sidewalks, drainage systems, lighting systems) and water and sewer system assets that were acquired or that received substantial improvements subsequent to July 1, 1980. These assets are reported at estimated historical cost using deflated replacement cost. The cost of normal maintenance and repairs that do not add to the value of the asset or materially extend assets’ lives are not capitalized. Interest costs related to Proprietary Fund construction is capitalized as part of the capitalized value of the asset constructed (if material). Interest costs of tax-exempt borrowings are capitalized net of related investment earnings on the proceeds.
Capital assets are depreciated on the straight-line method using the following estimated useful lives:
Buildings and Improvements 15 - 40 years Infrastructure 20 - 40 years Distribution Systems 15 - 40 years Furniture and Fixtures 5 - 10 years Equipment 3 - 10 years Vehicles 5 - 10 years
44
CITY OF ANDERSON, SOUTH CAROLINA NOTES TO THE FINANCIAL STATEMENTS YEAR ENDED JUNE 30, 2019
I. SUMMARY OF SIGNIFICANT ACCOUNTING POLICIES (CONTINUED) C. Assets, Liabilities, Deferred Outflows/Inflows of Resources, and Equity (Continued)
5. Compensated Absences It is the City’s policy to permit employees to accumulate earned but unused vacation and sick pay benefits. Unused vacation is accumulated in varying amounts based on years of service to a maximum amount of 30 days, and sick leave is accumulated to a maximum amount of 120 days. Sick leave with pay may be taken by an eligible employee but only for personal illness or the illness of a member of the employee’s immediate family. Sick leave for a regular, full-time employee with the City with 15 consecutive years of service that (a) retires from the City or (b) who is separated from the City on some basis other than involuntary termination for violation of the City’s disciplinary rules is eligible for the cash value of his/her personal accrued sick leave at the time of termination or retirement. These benefits will be paid as follows:
Cash Out Benefit – an employee may elect to receive the cash equivalency for unused sick leave. For employees who terminated prior to August 1, 2009, this payment shall be made in equal payments semi-annually over a ten-year period. For employees who terminated after August 1, 2009, this payment shall be made in $1,000 monthly installments until the cash value has been exhausted. This liability is included in the compensated absence liability.
The City reports compensated absences in accordance with the provisions of GASB Statement No. 16 “Accounting for Compensated Absences.” The entire compensated absence liability and expense is reported on the government-wide financial statements. Governmental funds will only recognize compensated absences liability if they have matured, for example, as a result of employee resignations or retirements, and is due and payable.
6. Accrued Liabilities and Long-Term Obligations
All payables, accrued liabilities and long-term obligations are reported in the government-wide financial statements. Bond premiums and discounts are deferred and amortized over the life of the bonds using the straight-line method (as it approximates the effective interest method) if material. Debt is reported net of applicable bond premiums and discounts. Issuance costs are expensed when incurred.
In the governmental fund financial statements, bond premiums, discounts, and issuance costs are recognized immediately. The face amount of debt or capital leases issued is reported as other financing sources. Premiums received on debt issuances are reported as other financing sources while discounts are reported as other financing uses. Issuance costs are reported as debt service expenditures.
In general, payables and accrued liabilities that will be paid from governmental funds are reported on the governmental fund financial statements regardless of whether they will be liquidated with current financial resources. However, claims and judgments, debt and capital leases, compensated absences, contractually required pension contributions, special termination benefits and other related long-term liabilities that will eventually be paid from governmental funds are not reported as a liability in the fund financial statements until due and payable.
7. Deferred Outflows/Inflows of Resources
In addition to assets, the Statement of Net Position and the Balance Sheet will sometimes report a separate section for deferred outflows of resources. This separate financial statement element, deferred outflows of resources, represents a consumption of net position that applies to a future period(s) and so will not be recognized as an outflow of resources (expense/expenditure) until then. The City currently has three types of deferred outflows of resources: (1) The City reports deferred refunding charges in its Statements of Net Position. If material, deferred refunding charges, which is the difference between the reacquisition price and the net carrying amount of the defeased debt, are deferred and amortized over the life of the refunding bonds, which has the same maturity as the bonds that were refunded. Amortization of deferred refunding charges is included in interest expense.
45
CITY OF ANDERSON, SOUTH CAROLINA NOTES TO THE FINANCIAL STATEMENTS YEAR ENDED JUNE 30, 2019
I. SUMMARY OF SIGNIFICANT ACCOUNTING POLICIES (CONTINUED) C. Assets, Liabilities, Deferred Outflows/Inflows of Resources, and Equity (Continued)
7. Deferred Outflows/Inflows of Resources (Continued) (2) The City also reports deferred pension charges in its Statements of Net Position in connection with the City Pension Plan and/or their participation in the State Retirement Plan. (3) The City reports deferred other postemployment benefit (“OPEB”) charges in its Statement of Net Position in connection with the City’s Defined Benefit Retiree Healthcare Plan. The deferred pension and OPEB charges are either (a) recognized in the subsequent period as a reduction of the net pension/OPEB liability (which includes contributions made after the measurement date) or (b) amortized in a systematic and rational method as pension/OPEB expense in future periods in accordance with GAAP. In addition to liabilities, the Statement of Net Position and the Balance Sheet will sometimes report a separate section for deferred inflows of resources. This separate financial statement element, deferred inflows of resources, represents an acquisition of net position that applies to a future period(s) and so will not be recognized as an inflow of resources (revenue) until that time. The City currently has three types of deferred inflows of resources. (1) The City reports unavailable revenue only in the governmental funds balance sheet; it is deferred and recognized as an inflow of resources (revenues) in the period the amounts become available. (2) The City also reports deferred pension credits in its Statements of Net Position in connection with the City Pension Plan and/or their participation in the State Retirement Plan. (3) The City reports deferred OPEB credit in its Statements of Net Position in connection with the City’s Defined Benefit Retiree Healthcare Plan. The deferred pension and OPEB credits are amortized in a systematic and rational method and recognized as a reduction of pension/OPEB expense in future periods in accordance with GAAP.
8. Fund Balance
In accordance with GAAP, the City classifies its governmental fund balances as follows:
Nonspendable – includes amounts that inherently cannot be spent either because it is not in spendable form (i.e. prepaids, inventories, etc.) or because of legal or contractual requirements (i.e. principal on an endowment, etc.). Restricted – includes amounts that are constrained by specific purposes which are externally imposed by (a) other governments through laws and regulations, (b) grantors or contributions through agreements, (c) creditors through debt covenants or other contracts, or (d) imposed by law through constitutional provisions or enabling legislation. Committed – includes amounts that are constrained for specific purposes that are internally imposed by the government through formal action made by the highest level of decision making authority (City Council) before the end of the reporting period. Those committed amounts cannot be used for any other purpose unless the government removes or changes the specified use by taking the same type of action it employed to previously commit those amounts.
Assigned – includes amounts that are intended to be used for specific purposes that are neither considered restricted or committed and that such assignments are made before the report issuance date. City Council reserves the right to assign fund balance. Unassigned – includes amounts that do not qualify to be accounted for and reported in any of the other fund balance categories. This classification represents the amount of fund balance that has not been assigned to other funds and that has not been restricted, committed, or assigned to specific purposes within the General Fund. The General Fund should be the only fund that reports a positive unassigned fund balance amount.
46
CITY OF ANDERSON, SOUTH CAROLINA NOTES TO THE FINANCIAL STATEMENTS YEAR ENDED JUNE 30, 2019
I. SUMMARY OF SIGNIFICANT ACCOUNTING POLICIES (CONTINUED) C. Assets, Liabilities, Deferred Outflows/Inflows of Resources, and Equity (Continued)
8. Fund Balance (Continued) The City generally uses restricted amounts to be spent first when both restricted and unrestricted (committed, assigned, and unassigned) fund balance is available unless there are legal documents, contracts, or agreements that prohibit doing such. Additionally, the City generally would first use committed, then assigned, and lastly unassigned amounts of unrestricted fund balance when expenditures are made.
9. Net Position
Net position represents the difference between assets and deferred outflows of resources and liabilities and deferred inflows of resources in the Statement of Net Position. Net position is classified as net investment in capital assets; restricted; and unrestricted. Net investment in capital assets consists of capital assets, net of accumulated depreciation, reduced by the outstanding balances of any borrowings used for the acquisition, construction or improvement of those assets. Outstanding debt which has not been spent is included in the same net position component as the unspent proceeds. Net position is reported as restricted when there are limitations imposed on their use either through enabling legislation or through external restrictions imposed by creditors, grantors, contributors, or laws or regulations of other governments.
10. Pensions and Other Postemployment Benefits
In government-wide financial statements, pensions and OPEB are required to be recognized and disclosed using the accrual basis of accounting (see Note IV.B and Note IV.C and the required supplementary information immediately following the notes to the financial statements for more information), regardless of the amounts recognized as pension and OPEB expenditures on the modified accrual basis of accounting. The City recognizes net pension and total OPEB liabilities (assets) for each plan for which it participates, which represents the excess of the total pension and OPEB liabilities over the fiduciary net position of the qualified plan, or the City’s proportionate share thereof in the case of a cost-sharing multiple-employer plan, measured as of the City’s fiscal year-end. Changes in the net pension and total OPEB liabilities during the period are recorded as pension and OPEB expenses, or as deferred outflows or inflows of resources depending on the nature of the change, in the period incurred. Those changes in net pension and total OPEB liabilities that are recorded as deferred outflows or inflows of resources that arise from changes in actuarial assumptions or other inputs and differences between expected or actual experience are amortized over the weighted average remaining service life of all participants in the respective qualified plan and recorded as a component of pension and OPEB expense beginning with the period in which they are incurred. Any projected earnings on qualified pension and OPEB plan investments are recognized as a component of pension and OPEB expense. Differences between projected and actual investment earnings are reported as deferred outflows or inflows of resources and amortized as a component of pension and OPEB expense on a closed basis over a five-year period beginning with the period in which the difference occurred.
11. Fair Value
The fair value measurement and disclosure framework provides for a three-tier fair value hierarchy that gives highest priority to quoted prices in active markets for identical assets or liabilities (Level 1 measurements) and the lowest priority to unobservable inputs (Level 3 measurements). The three levels of the fair value hierarchy are described below:
Level 1 – Inputs to the valuation methodology are unadjusted quoted prices for identical assets or liabilities in active markets that the City can access at the measurement date.
47
CITY OF ANDERSON, SOUTH CAROLINA NOTES TO THE FINANCIAL STATEMENTS YEAR ENDED JUNE 30, 2019
I. SUMMARY OF SIGNIFICANT ACCOUNTING POLICIES (CONTINUED) C. Assets, Liabilities, Deferred Outflows/Inflows of Resources, and Equity (Continued)
11. Fair Value (Continued) Level 2 – Inputs to the valuation methodology, other than quoted prices included in Level 1, that are
observable for an asset or liability either directly or indirectly and include: Quoted prices for similar assets and liabilities in active markets. Quoted prices for identical or similar assets or liabilities in inactive markets. Inputs other than quoted market prices that are observable for the asset or liability. Inputs that are derived principally from or corroborated by observable market data by
correlation or other means.
Level 3 – Inputs to the valuation methodology that are unobservable for an asset or liability and include: Fair value is often based on developed models in which there are few, if any, observable
inputs.
The asset’s or liability’s fair value measurement level within the fair value hierarchy is based on the lowest level of any input that is significant to the fair value measurement. Valuation techniques used maximize the use of observable inputs and minimize the use of unobservable inputs.
The valuation methodologies described above may produce a fair value calculation that may not be indicative of future net realizable values or reflective of future fair values. The City believes that the valuation methods used are appropriate and consistent with GAAP. The use of different methodologies or assumptions to determine the fair value of certain financial instruments could result in a different fair value measurement at the reporting date. There have been no significant changes from the prior year in the methodologies used to measure fair value.
12. Encumbrances
Encumbrance accounting, under which purchase orders, contracts, and other commitments for expenditures are recorded to reflect the use of the applicable spending appropriations, is used by the General Fund during the year to control expenditures. Encumbrances do not constitute expenditures or liabilities. Encumbrances and unused expenditure appropriations lapse at year end.
13. Accounting Estimates
The preparation of financial statements in conformity with accounting principles generally accepted in the United States of America requires management to make estimates and assumptions. Those estimates and assumptions affect the reported amounts of assets, deferred outflows of resources, liabilities, and deferred inflows of resources and disclosure of contingent amounts at the date of the financial statements. In addition, they affect the reported amounts of revenues and expenditures/expenses during the reporting period. Actual results could differ from those estimates and assumptions.
14. Comparative Data
Comparative data (i.e. presentation of prior year totals by fund type) has not been presented in each of the statements since their inclusion would make the statements unduly complex and difficult to read.
48

CITY OF ANDERSON, SOUTH CAROLINA NOTES TO THE FINANCIAL STATEMENTS YEAR ENDED JUNE 30, 2019
II. STEWARDSHIP, COMPLIANCE, AND ACCOUNTABILITY
A. Budgetary Information
The City follows the following procedures in establishing its annual budgets:
1. On or before the first Friday in March of each year, all departments/agencies of the government submit requests for appropriation to the City Manager so that a budget may be prepared. The budget is prepared by fund, function and department, and includes information on the past year, the current year budget and requested appropriations for the next fiscal year.
2. In May of each year, the proposed budget is presented to the City Council for review. The City adopts the
budget ordinance before June 30 of each year. Amounts transferred between departments within any fund and any revisions that do not alter the total expenditures of any fund do not have to be approved by City Council. Changes that alter total expenditures of any fund must be changed by an affirmative vote of a majority of City Council. Budgeted expenditure appropriations lapse at year-end.
3. Legally adopted budgets are employed as a management control device during the year for the General Fund
(which includes the Cemetery, Parks and Recreation, Sanitation, Economic Development Division, and Tax Increment Financing subfunds), Community Development Fund, Perpetual Care Fund, Accommodations Tax Fund, Hospitality Fee Fund, Capital Replacement Fund, and Transportation Investment Fund. The City also adopts budgets for all proprietary funds. All annual appropriations lapse at fiscal year-end. Expenditures may not legally exceed appropriations on the fund level.
4. The budgets for the budgeted funds are legally adopted on a basis consistent with GAAP. The budgets at the
end of the year for these funds represent the budgets adopted and amended by the City Council.
5. Encumbrances represent commitments related to unperformed contracts for goods or services. Encumbrance accounting (under which purchase orders, contracts, and other commitments for the expenditure of resources are recorded to reserve that portion of the applicable appropriation) is utilized in the governmental funds. Encumbrances outstanding at year end lapse and generally are re-appropriated in the following year’s budget.
III. DETAILED NOTES ON ALL FUNDS AND ACTIVITIES
A. Deposits and Investments
Deposits Custodial Credit Risk for Deposits: Custodial credit risk for deposits is the risk that, in the event of a bank failure, the City’s deposits might not be recovered. The City does not have a formal deposit policy for custodial credit risk but follows the investment policy statutes of the State of South Carolina. As of June 30, 2019, none of the City’s bank balances of approximately $30,098,000 (with a carrying value of approximately $29,880,000) were exposed to custodial credit risk.
49

CITY OF ANDERSON, SOUTH CAROLINA NOTES TO THE FINANCIAL STATEMENTS YEAR ENDED JUNE 30, 2019
III. DETAILED NOTES ON ALL FUNDS AND ACTIVITIES (CONTINUED)
A. Deposits and Investments (Continued)
Investments - Non-Pension Trust Fund As of June 30, 2019, the City had the following non-pension trust fund investments and maturities:
Fair Value Credit Fair
Investment Type Level (1) Rating ^ Value < 1 yr 1 - 3 yrs 3 - 5 yrs > 5 yrs
LGIP N/A NR, NR 146,598$ 146,598 - - -$
Money Market Mutual Funds Level 1 AAAm, Aaa-mf 6,817,155 6,817,155 - - -
Certificates of Deposit Level 1 ~ 372,026 50,291 125,453 102,074 94,208
US Securities Level 1 * 244,729 - - 111,370 133,359
Agency Securities Level 1 AA+, Aaa 1,533,182 25,598 361,641 77,053 1,068,890
Total 9,113,690$ 7,039,642 487,094 290,497 1,296,457$
(1) See Note I.C.11 for details of the City's fair value hierarchy
~ Certificates of Deposit are covered by FDIC insurance and thus no credit rat ings are required.* U.S. government securities are not considered to have credit risk. Credit rat ings for these investments have not been disclosed.NR – Not rated.
Investment Maturities in Years
^ If available, credit ratings are for Standard & Poor’s and Moody’s Investors Service.
Interest Rate Risk: The City does not have a formal policy limiting investment maturities that would help manage its exposure to fair value losses from increasing interest rates. Custodial Credit Risk for Investments: Custodial credit risk for investments is the risk that, in the event of a bank failure, the government will not be able to recover the value of its investments or collateral securities that are in the possession of an outside party. The City does not have an investment policy for custodial credit risk but follows the investment policy statutes of the State of South Carolina. Credit Risk for Investments: Credit risk for investments is the risk that an issuer or other counterparty to an investment will not fulfill its obligations. The City does not have an investment policy for credit risk but follows the investment policy statutes of the State of South Carolina. Concentration of Credit Risk for Investments: The City places no limit on the amount the City may invest in any one issuer. Investments issued by or explicitly guaranteed by the U.S. Government and investments in mutual funds, external investment pools and other pooled investments are exempt from concentration of credit risk disclosures. As of June 30, 2019, the City held approximately $623,000 (7%) and $523,000 (6%) in various debt securities with the Federal National Mortgage Association (Fannie Mae) and Federal Home Loan Bank, respectively.
Certain cash, cash equivalents and investments of the City are legally restricted for specified purposes. The major types of restrictions at June 30, 2019 were (a) those imposed by the revenue source (i.e. hospitality fees, accommodation taxes, grants, etc.), (b) debt service reserve funds, (c) permanent fund contribution, and (d) unspent debt and lease purchase proceeds.
50

CITY OF ANDERSON, SOUTH CAROLINA NOTES TO THE FINANCIAL STATEMENTS YEAR ENDED JUNE 30, 2019
III. DETAILED NOTES ON ALL FUNDS AND ACTIVITIES (CONTINUED)
A. Deposits and Investments (Continued)
Reconciliation to the Financial Statements – Non-Pension Trust Fund A reconciliation of cash and investments for all activities, except for the City’s pension trust fund, is as follows:
Description Amount
Carrying Amount of Deposits 29,880,169$ Fair Value of Investments 9,113,690
Total Deposits and Investments 38,993,859$
Statement of Net Position:Cash and Cash Equivalents 21,370,478$ Cash and Cash Equivalents, Restricted 15,044,107 Investments, Restricted 2,469,894
Statement of Assets and Liabilities - Fiduciary Fund - Agency FundCash and Cash Equivalents 109,380
Total Cash, Cash Equivalents, and Investments 38,993,859$
Investments – Fiduciary Fund – Pension Trust Fund The City’s investment policy for its General Employees’ Retirement Plan Fund (“City Pension Plan”) requires the overall asset investment allocation mix for the City Pension Plan includes various asset classes and investment management styles that, in total, are expected to offer the opportunity to diversify the portfolio in a manner consistent with the specified risk and return requirements of the portfolio. See Note IV.B for more details on the City Pension Plan’s investment policy. The Pension Trust Fund’s investments at December 31, 2018 are shown in the following table. The Pension Plan reports its investments at fair value.
Fair Value Credit Fair
Investment Type Level (1) Rating ^ Value < 1 yr > 5 yrs
Money Market Funds Level 1 AAAm, Aaa-mf, AAAmmf 746,339$ 746,339 -$
Domestic Equity Funds Level 1 ~ 15,031,587 ~ ~
Foreign Equity Funds Level 1 ~ 3,908,997 ~ ~
Foreign Bond Funds Level 1 NR, NR 1,024,469 - 1,024,469
Domestic Bond Funds Level 1 NR, NR 9,247,907 - 9,247,907
Total 29,959,299$ 746,339 10,272,376$
(1) See Note I.C.11 for details of the City's fair value heirarchy
Investment Maturities in Years
^ If available, credit ratings are for Standard & Poor’s, Moody's Investors Service, and Fitch Ratings.~ Credit ratings and weighted average maturities are not applicable for equities or equity funds.NR - Not rated.
51
CITY OF ANDERSON, SOUTH CAROLINA NOTES TO THE FINANCIAL STATEMENTS YEAR ENDED JUNE 30, 2019
III. DETAILED NOTES ON ALL FUNDS AND ACTIVITIES (CONTINUED)
A. Deposits and Investments (Continued) Investments – Fiduciary Fund – Pension Trust Fund (Continued) Interest Rate Risk for Pension Trust Fund: The Pension Plan does not have a formal interest rate risk policy. The investment guidelines of the Pension Plan are based upon an investment horizon of greater than five years. The Pension Plan’s strategic asset allocation is also based on this long-term perspective. Short-term liquidity requirements are anticipated to be covered by the annual contribution from the City.
Custodial Credit Risk for Investments for Pension Trust Fund: Custodial credit risk for investments is the risk that, in the event of a bank failure, the government will not be able to recover the value of its investments or collateral securities that are in the possession of an outside party. The Pension Plan does not have an investment policy for custodial credit risk. Credit Risk for Investments for Pension Trust Fund: Credit risk for investments is the risk that an issuer or other counterparty to an investment will not fulfill its obligations. The Pension Plan does not have an investment policy for credit risk but relies on the prudent expert to make credit risk determinations. Concentration of Credit Risk for Investments for Pension Trust Funds: The Pension Plan places no limit on the amount the City may invest in any one issuer. Investments issued by or explicitly guaranteed by the U.S. Government and investments in mutual funds, external investment pools and other pooled investments are exempt from concentration of credit risk disclosures.
B. Receivables and Unavailable/Unearned Revenues
Property Taxes
Gross property taxes receivable of approximately $687,000 represent current real and personal property as well as delinquent real and personal property taxes for the past ten years, less an allowance for amounts estimated to be uncollectible of approximately $103,000. All net property taxes receivable at year end, except those collected within 60 days, are recorded as unavailable revenue on the governmental fund financial statements and thus not recognized as revenue until collected in the governmental funds. Property taxes are assessed and collected by Anderson County. The County levies its real property taxes each September based upon current assessed valuation. Assessed values are established by the County Assessor, the County Auditor, and the South Carolina Department of Revenue and Taxation at various rates of 4 to 6 percent of the estimated market value. Real property and all personal property taxes other than vehicle property taxes attach as an enforceable lien on property as of January 16th. Taxes are levied and billed in September on all property other than vehicles and are payable without penalty until January 15th of the following year. Penalties are assessed on unpaid taxes on the following dates:
January 16th 3% February 2nd an additional 7% March 17th an additional 5%
After proper notification, the law requires "exclusive possession" of property necessary to satisfy the delinquent taxes. Properties with unpaid taxes are sold at a public auction during the month of October. Vehicle property taxes attach a lien and are levied throughout the year depending on when the vehicles' license tags expire. The lien and collection date for motor vehicle taxes is the last day of the month in which the motor vehicle license expires.
The City’s fiscal year 2019 real and business personal property taxes (which was for tax year 2018) were levied in September 2018 based on a millage rate of 116 mills (no change from the prior year). The City’s assessed value of real and personal property was approximately $106.7 million for tax year 2018. Any amounts received by Anderson County but not yet remitted to the City at year end are included in the caption “Intergovernmental Receivables” in the balance sheet and statement of net position.
52

CITY OF ANDERSON, SOUTH CAROLINA NOTES TO THE FINANCIAL STATEMENTS YEAR ENDED JUNE 30, 2019
III. DETAILED NOTES ON ALL FUNDS AND ACTIVITIES (CONTINUED)
B. Receivables and Unavailable/Unearned Revenues (Continued) Community and Business Development Note Receivables The City has approximately 140 outstanding notes receivables funded with the proceeds from the Community Development notes payable. Normally these notes are issued in varying amounts not to exceed $25,000 with interest rates ranging from 0% to 3% for loan periods of 20 years or less. With the recent Neighborhood Stabilization Program which the City was a participant, some of the loan amounts exceed $25,000. At June 30, 2019, the outstanding notes receivable balance was approximately $1,717,000. The City has eleven active outstanding business development notes receivable funded through the business development portion of the Community Development Block Grant program. These amounts are issued in varying amounts at varying interest rates for loan periods of 10 years to 17 years. At June 30, 2019, the outstanding notes receivable balance was approximately $277,000. Intergovernmental and Other Receivables The City has receivables related to water, sewer, storm water, and sanitation utility fee billings (which are billed in the General Fund and recorded as an interfund payable to the enterprise funds), Hospitality Fee Fund, and other miscellaneous receivables. Water, sewer, storm water, and sanitation utility fees are billed every week for the previous four weeks of service.
Reconciliation of Governmental Fund Receivable Balances to the Financial Statements The net receivables of the City’s governmental activities at June 30, 2019 consisted of the following:
Accomm- Transpor-Community Perpetual odations Hospitality tation
General Development Care Tax Fee InvestmentDescription Fund Fund Fund Fund Fund Fund Totals
Property Taxes, Net 583,998$ - - - - - 583,998$ Utilities 2,375,239 - - - - - 2,375,239 Accommodations Taxes - - - 175,885 - - 175,885 Hospitality Fees - - - - 267,771 - 267,771 Interest - - 1,681 - - 3,112 4,793 Franchise Fees 589,899 - - - - - 589,899 Aid to Subdivisions 158,178 - - - - - 158,178 Grants 73,747 164,517 - - - - 238,264 Other 436,108 - - - - - 436,108
Net Receivables 4,217,169$ 164,517 1,681 175,885 267,771 3,112 4,830,135$
Unavailable and Unearned Revenues Governmental funds defer revenue in connection with receivables for revenues that are not considered to be available (a component of deferred inflows of resources) to liquidate liabilities of the current period. Governmental funds also defer revenue recognition in connection with resources that have been received, but not yet earned (unearned revenue). As of June 30, 2019, the City had the following unavailable/unearned revenues:
Description Fund Unavailable Unearned Total
Property Taxes Receivable General 420,274$ - 420,274$
Total Unavailable/Unearned Revenue 420,274$ - 420,274$
53

CITY OF ANDERSON, SOUTH CAROLINA NOTES TO THE FINANCIAL STATEMENTS YEAR ENDED JUNE 30, 2019
III. DETAILED NOTES ON ALL FUNDS AND ACTIVITIES (CONTINUED)
C. Interfund Receivables, Payables, and Transfers
Interfund Receivables and Payables
Interfund balances at June 30, 2019, consisted of the following individual fund receivables and payables (most of which are expected to be repaid within one year):
Fund Receivables Payables
Major Governmental Funds:General Fund 858,294$ 2,456,074$
Major Enterprise Funds:Sewer Fund 1,094,748 4,121
Water Fund 1,019,215 30,169
Other Non-Major Funds:Other Governmental Funds 85,131 657,159 Other Enterprise Funds 203,174 113,039
Totals 3,260,562$ 3,260,562$
The interfund receivables and payables are a result of the General Fund financing salaries and other operating expenditures for Grant Funds and Special Revenue Funds. During 2013, the General Fund loaned the Community Development Fund monies to pay off its line of credit with a local bank. The loan outstanding at June 30, 2019 was approximately $28,000 and will be repaid from community development program revenue in the coming years. During the year ended June 30, 2002, the City began providing water service in addition to sewer service. The General Fund acts as an agent for the utility funds billings and collections. Thus, utility receivables are recorded in the General Fund and the revenue is recorded in the corresponding utility fund – water, sewer, or storm water. The General Fund also processes vendor payments and payroll transactions for the utility funds. Utility payables are recorded on the General Fund and the expense is record in the appropriate utility fund. Amounts to be paid between the funds are accounted for in the “due from other funds” or “due to other funds” on the balance sheet.
Interfund Transfers
Interfund transfers for the year ended June 30, 2019, consisted of the following:
Fund Transfers In Transfers Out
Major Governmental Funds:General Fund 2,981,471$ 300,286$
Major Enterprise Funds:Sewer Fund - 701,250
Water Fund - 573,750
Other Non-Major Funds:Other Governmental Funds 192,472 1,540,604 Other Enterprise Funds 174,885 232,938
Totals 3,348,828$ 3,348,828$
54

CITY OF ANDERSON, SOUTH CAROLINA NOTES TO THE FINANCIAL STATEMENTS YEAR ENDED JUNE 30, 2019
III. DETAILED NOTES ON ALL FUNDS AND ACTIVITIES (CONTINUED)
C. Interfund Receivables, Payables, and Transfers (Continued)
Interfund Transfers (Continued) During the course of normal operations and in order to support the numerous functions of the City, transactions between funds may occur. The City uses transfers to move unrestricted receipts so that they may be used for various programs in other funds. Transfers are most commonly made for debt service and grant matches. Funds are transferred to the General fund from water and sewer funds in lieu of property taxes and franchise fees. Council approves the amount transferred annually during the budget process.
D. Capital Assets
Capital asset activity for the City’s governmental activities for the year ended June 30, 2019 was as follows:
Beginning Ending Balance Increases Decreases Transfers Balance
Governmental Activities:
Capital Assets, Non-Depreciable:Land 4,340,026$ 9,500 154,602 - 4,194,924$ Construction In Progress 293,252 516,920 - (280,980) 529,192
Total Capital Assets, Non-Depreciable 4,633,278 526,420 154,602 (280,980) 4,724,116
Capital Assets, Depreciable:Buildings and Improvements 36,277,345 92,263 45,686 280,980 36,604,902 Furniture and Fixtures 52,566 - - - 52,566 Vehicles 11,638,779 419,217 304,397 (13,019) 11,740,580 Machinery and Equipment 3,444,057 239,427 91,808 13,019 3,604,695 Infrastructure 16,268,856 - - - 16,268,856
Total Capital Assets, Depreciable 67,681,603 750,907 441,891 280,980 68,271,599
Less: Accumulated Depreciation for:Buildings and Improvements 13,388,328 1,087,372 45,511 - 14,430,189 Furniture and Fixtures 52,566 - - - 52,566 Vehicles 8,172,949 693,340 301,628 (10,429) 8,554,232 Machinery and Equipment 2,470,184 330,822 89,654 10,429 2,721,781 Infrastructure 8,699,668 614,855 - - 9,314,523
Total Accumulated Depreciation 32,783,695 2,726,389 436,793 - 35,073,291
Total Capital Assets, Depreciable, Net 34,897,908 (1,975,482) 5,098 280,980 33,198,308
Governmental Activities Capital Assets, Net 39,531,186$ (1,449,062) 159,700 - 37,922,424$
Ongoing construction in progress in the City’s governmental activities primarily relates to the City Hall Roof Project and various park projects.
55

CITY OF ANDERSON, SOUTH CAROLINA NOTES TO THE FINANCIAL STATEMENTS YEAR ENDED JUNE 30, 2019
III. DETAILED NOTES ON ALL FUNDS AND ACTIVITIES (CONTINUED)
D. Capital Assets (Continued)
Capital asset additions and depreciation expense for governmental activities were charged to functions/programs as follows:
Capital Asset DepreciationFunctions/Programs Additions Expense
General Government 254,920$ 1,180,386$ Public Safety 317,020 672,969 Public Works 94,562 354,759 Community and Economic Development 107,966 12,878 Recreation 203,998 505,397 Nondepartmental 298,861 -
Total - Governmental Activities 1,277,327$ 2,726,389$
Capital asset activity for the City’s business-type activities for the year ended June 30, 2019, was as follows:
Beginning Transfers/ Ending Balance Increases Decreases Other Changes Balance
Business-Type Activities
Capital Assets, Non-Depreciable:Land 1,718,950$ - - 49,250 1,768,200$ Construction In Progress 5,089,374 1,710,754 - (5,961,370) 838,758
Total Capital Assets, Non-Depreciable 6,808,324 1,710,754 - (5,912,120) 2,606,958
Capital Assets, Depreciable:Buildings and Improvements 133,660,319 112,572 - 5,535,801 139,308,692 Water Tanks and Lines 39,891,601 62,954 - - 39,954,555 Machinery and Equipment 2,618,141 132,103 40,500 376,319 3,086,063 Furniture and Fixtures 413,737 - - - 413,737 Vehicles 5,607,673 154,043 88,694 - 5,673,022
Total Capital Assets, Depreciable 182,191,471 461,672 129,194 5,912,120 188,436,069
Less: Accumulated Depreciation for:Buildings and Improvements 51,499,591 3,297,426 - - 54,797,017 Water Tanks and Lines 11,972,942 1,132,003 - - 13,104,945 Machinery and Equipment 1,521,653 551,783 40,500 - 2,032,936 Furniture and Fixtures 408,069 5,668 - - 413,737 Vehicles 3,427,618 484,969 88,694 - 3,823,893
Total Accumulated Depreciation 68,829,873 5,471,849 129,194 - 74,172,528
Total Capital Assets, Depreciable, Net 113,361,598 (5,010,177) - 5,912,120 114,263,541
Business-Type Activities Capital Assets, Net 120,169,922$ (3,299,423) - - 116,870,499$
Ongoing construction in progress in the City’s business-type activities represents costs related primarily to sewer and water projects.
56
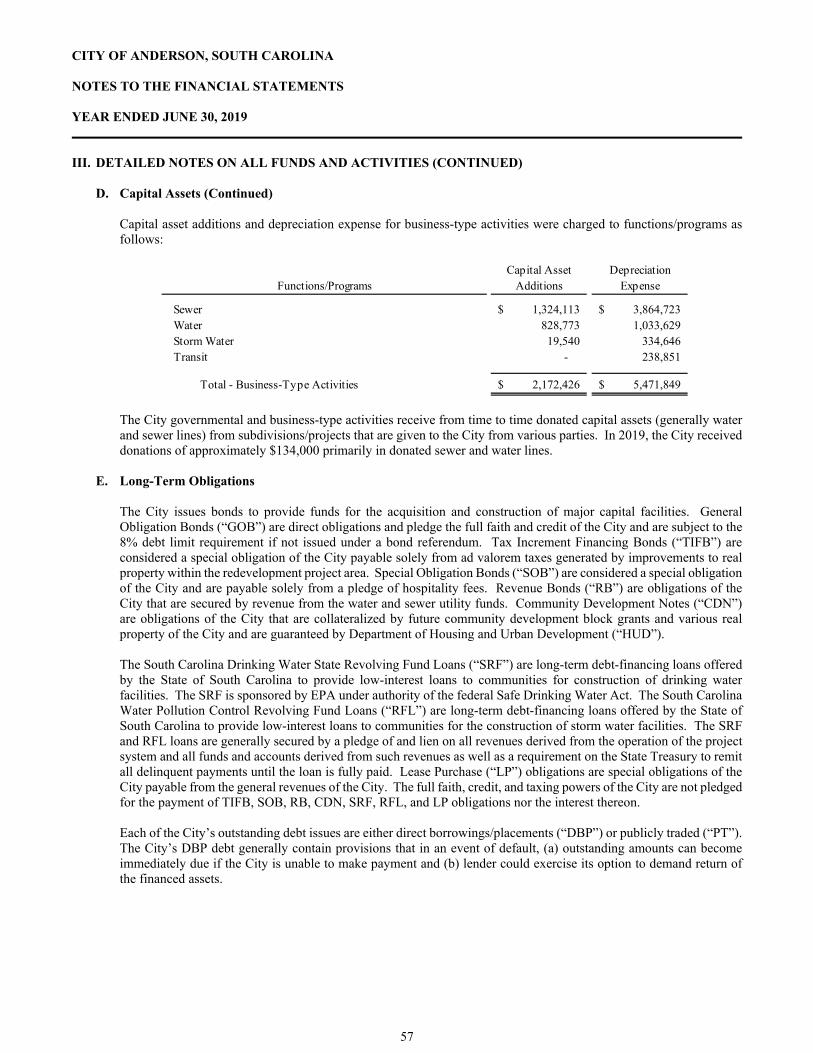
CITY OF ANDERSON, SOUTH CAROLINA NOTES TO THE FINANCIAL STATEMENTS YEAR ENDED JUNE 30, 2019
III. DETAILED NOTES ON ALL FUNDS AND ACTIVITIES (CONTINUED)
D. Capital Assets (Continued) Capital asset additions and depreciation expense for business-type activities were charged to functions/programs as follows:
Capital Asset DepreciationFunctions/Programs Additions Expense
Sewer 1,324,113$ 3,864,723$ Water 828,773 1,033,629 Storm Water 19,540 334,646 Transit - 238,851
Total - Business-Type Activities 2,172,426$ 5,471,849$
The City governmental and business-type activities receive from time to time donated capital assets (generally water and sewer lines) from subdivisions/projects that are given to the City from various parties. In 2019, the City received donations of approximately $134,000 primarily in donated sewer and water lines.
E. Long-Term Obligations
The City issues bonds to provide funds for the acquisition and construction of major capital facilities. General Obligation Bonds (“GOB”) are direct obligations and pledge the full faith and credit of the City and are subject to the 8% debt limit requirement if not issued under a bond referendum. Tax Increment Financing Bonds (“TIFB”) are considered a special obligation of the City payable solely from ad valorem taxes generated by improvements to real property within the redevelopment project area. Special Obligation Bonds (“SOB”) are considered a special obligation of the City and are payable solely from a pledge of hospitality fees. Revenue Bonds (“RB”) are obligations of the City that are secured by revenue from the water and sewer utility funds. Community Development Notes (“CDN”) are obligations of the City that are collateralized by future community development block grants and various real property of the City and are guaranteed by Department of Housing and Urban Development (“HUD”). The South Carolina Drinking Water State Revolving Fund Loans (“SRF”) are long-term debt-financing loans offered by the State of South Carolina to provide low-interest loans to communities for construction of drinking water facilities. The SRF is sponsored by EPA under authority of the federal Safe Drinking Water Act. The South Carolina Water Pollution Control Revolving Fund Loans (“RFL”) are long-term debt-financing loans offered by the State of South Carolina to provide low-interest loans to communities for the construction of storm water facilities. The SRF and RFL loans are generally secured by a pledge of and lien on all revenues derived from the operation of the project system and all funds and accounts derived from such revenues as well as a requirement on the State Treasury to remit all delinquent payments until the loan is fully paid. Lease Purchase (“LP”) obligations are special obligations of the City payable from the general revenues of the City. The full faith, credit, and taxing powers of the City are not pledged for the payment of TIFB, SOB, RB, CDN, SRF, RFL, and LP obligations nor the interest thereon. Each of the City’s outstanding debt issues are either direct borrowings/placements (“DBP”) or publicly traded (“PT”). The City’s DBP debt generally contain provisions that in an event of default, (a) outstanding amounts can become immediately due if the City is unable to make payment and (b) lender could exercise its option to demand return of the financed assets.
57

CITY OF ANDERSON, SOUTH CAROLINA NOTES TO THE FINANCIAL STATEMENTS YEAR ENDED JUNE 30, 2019
III. DETAILED NOTES ON ALL FUNDS AND ACTIVITIES (CONTINUED)
E. Long-Term Obligations (Continued) Details on the City’s outstanding debt issues and lease purchase obligations as of June 30, 2019 are as follows:
General Obligation Bonds – PT Balance at
June 30, 2019
$2,850,000 general obligation serial bonds issued in June 2008 (“GOB – 06/08”), due in annual installments of $75,000 to $225,000 beginning April 1, 2009 through April 1, 2028, plus interest at 3.25% to 5.0% due semi-annually. The proceeds of this issue were used for construction costs of a new fire station, purchase of a fire truck, and other cost of issuance. Issuance costs were not significant and thus have not been recorded related to this issue.
$ 1,680,000
Tax Increment Financing Bonds – DBP
$5,600,000 tax increment financing bonds issued in September 2011 (“TIFB – 09/11 Series B”), due in annual installments of $180,000 to $780,000 beginning April 1, 2012 through April 1, 2021, plus interest at 3.04%, due annually. The proceeds from this issue were used to currently refund the TIFB – 06/08 Series A. Issuance costs were not significant and thus have not been recorded related to this issue.
1,555,000
Revenue Bonds – PT
$48,655,000 water and sewer system revenue bonds issued in March 2009 (“RB – 03/09”), due in annual installments of $850,000 to $3,030,000 beginning July 1, 2010 through July 1, 2039, plus interest at 4.00% to 5.00%, due semi-annually. The proceeds from this issue were used to repay the 2008 BAN and for the Rocky River WWTP upgrade. There was a discount on the issuance of these bonds of approximately $806,000 and debt issuance costs were incurred of approximately $1,246,000. $39,655,000 of these bonds were advanced refunded from the proceeds of the RB – 05/16.
1,165,000
$43,295,000 water and sewer system refunding revenue bonds issued in April 2012 (“RB – 04/12”), due in annual installments of $315,000 to $3,365,000 beginning July 1, 2013 through July 1, 2032, plus interest at 2.00% to 5.00%, due semi-annually. The proceeds from this issue were used to currently refund the RB – 11/98 and advance refunded most of the RB – 04/02 and RB – 07/03. A premium on the issuance of these bonds was received of $4,364,063 and debt issuance costs were incurred of $800,864. The refunding resulted in a deferred loss of $1,368,555.
33,015,000
$40,200,000 water and sewer system refunding revenue bonds issued in May 2016 (“RB – 05/16”), due in annual installments of $1,275,000 to $2,810,000 beginning July 1, 2020 through July 1, 2039, plus interest at 3.00% to 5.00%, due semi-annually. The proceeds from this issue were used to advance refund part of the RB – 03/09. A net premium on the issuance of these bonds was received of approximately $4,802,000 and debt issuance costs were incurred of approximately $450,000. The refunding resulted in a deferred loss on refunding of approximately $5,502,000.
$40,200,000
58
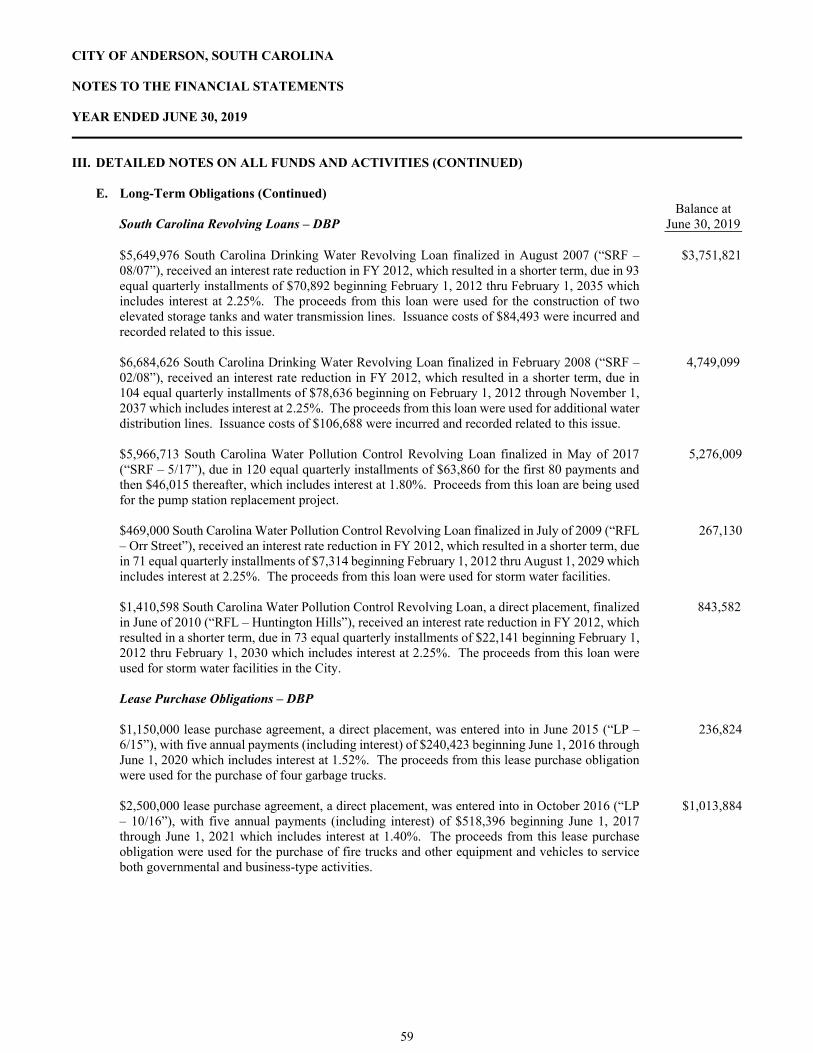
CITY OF ANDERSON, SOUTH CAROLINA NOTES TO THE FINANCIAL STATEMENTS YEAR ENDED JUNE 30, 2019
III. DETAILED NOTES ON ALL FUNDS AND ACTIVITIES (CONTINUED)
E. Long-Term Obligations (Continued)
South Carolina Revolving Loans – DBP Balance at
June 30, 2019
$5,649,976 South Carolina Drinking Water Revolving Loan finalized in August 2007 (“SRF – 08/07”), received an interest rate reduction in FY 2012, which resulted in a shorter term, due in 93 equal quarterly installments of $70,892 beginning February 1, 2012 thru February 1, 2035 which includes interest at 2.25%. The proceeds from this loan were used for the construction of two elevated storage tanks and water transmission lines. Issuance costs of $84,493 were incurred and recorded related to this issue.
$3,751,821
$6,684,626 South Carolina Drinking Water Revolving Loan finalized in February 2008 (“SRF – 02/08”), received an interest rate reduction in FY 2012, which resulted in a shorter term, due in 104 equal quarterly installments of $78,636 beginning on February 1, 2012 through November 1, 2037 which includes interest at 2.25%. The proceeds from this loan were used for additional water distribution lines. Issuance costs of $106,688 were incurred and recorded related to this issue.
4,749,099
$5,966,713 South Carolina Water Pollution Control Revolving Loan finalized in May of 2017 (“SRF – 5/17”), due in 120 equal quarterly installments of $63,860 for the first 80 payments and then $46,015 thereafter, which includes interest at 1.80%. Proceeds from this loan are being used for the pump station replacement project.
5,276,009
$469,000 South Carolina Water Pollution Control Revolving Loan finalized in July of 2009 (“RFL – Orr Street”), received an interest rate reduction in FY 2012, which resulted in a shorter term, due in 71 equal quarterly installments of $7,314 beginning February 1, 2012 thru August 1, 2029 which includes interest at 2.25%. The proceeds from this loan were used for storm water facilities.
267,130
$1,410,598 South Carolina Water Pollution Control Revolving Loan, a direct placement, finalized in June of 2010 (“RFL – Huntington Hills”), received an interest rate reduction in FY 2012, which resulted in a shorter term, due in 73 equal quarterly installments of $22,141 beginning February 1, 2012 thru February 1, 2030 which includes interest at 2.25%. The proceeds from this loan were used for storm water facilities in the City.
843,582
Lease Purchase Obligations – DBP
$1,150,000 lease purchase agreement, a direct placement, was entered into in June 2015 (“LP – 6/15”), with five annual payments (including interest) of $240,423 beginning June 1, 2016 through June 1, 2020 which includes interest at 1.52%. The proceeds from this lease purchase obligation were used for the purchase of four garbage trucks.
236,824
$2,500,000 lease purchase agreement, a direct placement, was entered into in October 2016 (“LP – 10/16”), with five annual payments (including interest) of $518,396 beginning June 1, 2017 through June 1, 2021 which includes interest at 1.40%. The proceeds from this lease purchase obligation were used for the purchase of fire trucks and other equipment and vehicles to service both governmental and business-type activities.
$1,013,884
59

CITY OF ANDERSON, SOUTH CAROLINA NOTES TO THE FINANCIAL STATEMENTS YEAR ENDED JUNE 30, 2019
III. DETAILED NOTES ON ALL FUNDS AND ACTIVITIES (CONTINUED)
E. Long-Term Obligations (Continued)
Presented below is a summary of changes in long-term obligations for the City’s governmental activities for the year ended June 30, 2019:
Long-Term Obligations Type of IssueBeginning Balance Additions Reductions
Ending Balance
Due Within One Year
Governmental Activities:Debt:General Obligation Bonds:
GOB – 06/08 PT 1,820,000$ - 140,000 1,680,000 150,000$
Total General Obligation Bonds 1,820,000 - 140,000 1,680,000 150,000
Tax Increment Financing Bonds:TIFB – 09/11 Series B DBP 2,305,000 - 750,000 1,555,000 775,000
Total Tax Increment Financing Bonds 2,305,000 - 750,000 1,555,000 775,000
Total Debt 4,125,000 - 890,000 3,235,000 925,000
Lease Purchases:LP – 6/15 DBP 470,101 - 233,277 236,824 236,824 LP – 10/16 DBP 1,028,453 - 339,012 689,441 342,795
Total Lease Purchases 1,498,554 - 572,289 926,265 579,619
Compensated Absences N/A 2,879,092 1,333,762 1,452,862 2,759,992 1,333,923
Total Governmental Activities 8,502,646$ 1,333,762 2,915,151 6,921,257 2,838,542$
Resources from the Community Development Fund have been used to liquidate the community development notes. Resources from the General Fund and Hospitality Fee Fund have been used to liquidate all of the other governmental activities long-term obligations.
Interest paid on the debt issued by the City is generally exempt from federal income tax. The City sometimes temporarily reinvests the proceeds of such tax-exempt debt in higher-yielding taxable securities, especially during construction projects. The federal tax code refers to this practice as arbitrage. Excess earnings (the difference between the interest on the debt and the investment earnings received) resulting from arbitrage must be rebated to the federal government. The City does not believe it has an arbitrage liability at June 30, 2019.
Article Eight, Section Seven of the South Carolina Constitution of 1895, as amended, provides that no City or Town shall incur any bonded debt which shall exceed eight percent (8%) of the assessed value of the property therein and no such debt shall be created without the electors of such City or Town voting in favor of such further bonded debt. Prior to Home Rule Act of July 1, 1976, the bonded debt exemption was thirty five percent (35%). In 1976, the General Assembly reduced the general obligation debt limit without voter approval to eight percent (8%) of assessed valuation; whereas, with a referendum any amount can be floated. As of June 30, 2019, the City had approximately $1,680,000 of bonded debt subject to the 8% limit of approximately $8,534,000 resulting in an unused legal debt margin of approximately $6,854,000.
60

CITY OF ANDERSON, SOUTH CAROLINA NOTES TO THE FINANCIAL STATEMENTS YEAR ENDED JUNE 30, 2019
III. DETAILED NOTES ON ALL FUNDS AND ACTIVITIES (CONTINUED)
E. Long-Term Obligations (Continued)
Presented below is a summary of changes in long-term obligations for the City’s business-type activities for the year ended June 30, 2019:
Long-Term ObligationsType of
IssueBeginning Balance Additions Reductions
Ending Balance
Due Within One Year
Business-Type Activities:Debt:Revenue Bonds:
RB – 03/09 PT 2,285,000$ - 1,120,000 1,165,000 1,165,000$ RB – 04/12 PT 35,550,000 - 2,535,000 33,015,000 2,280,000 RB – 05/16 PT 40,200,000 - - 40,200,000 -
Total Revenue Bonds 78,035,000 - 3,655,000 74,380,000 3,445,000
SC State Revolving Fund Loans:SRF – 08/07 DBP 3,948,205 - 196,384 3,751,821 200,840 SRF – 02/08 DBP 4,953,898 - 204,799 4,749,099 209,447 SRF – 05/17 DBP 4,363,308 1,092,753 180,052 5,276,009 139,407 RFL – Orr Street DBP 290,052 - 22,922 267,130 23,441 RFL – Huntington Hills DBP 912,198 - 68,616 843,582 70,173
Total SC State Revolving Fund Loans 14,467,661 1,092,753 672,773 14,887,641 643,308
Subtotal 92,502,661 1,092,753 4,327,773 89,267,641 4,088,308
Deferred Amounts on Revenue Bonds:Issuance Premiums N/A 7,011,370 - 454,096 6,557,274 -
Total Debt 99,514,031 1,092,753 4,781,869 95,824,915 4,088,308
Lease Purchases:LP - 10/16 DBP 483,978 - 159,535 324,443 161,315
Total Lease Purchases 483,978 - 159,535 324,443 161,315
Compensated Absences N/A 503,372 218,841 146,888 575,325 135,430 Debt Service Rebate N/A 1,257,182 598,045 656,464 1,198,763 651,397
Total Business-Type Activities 101,758,563$ 1,909,639 5,744,756 97,923,446 5,036,450$
Resources from the Water and Sewer Funds have been used to liquidate the revenue bonds. Resources from the Sewer Fund have been used to liquidate the debt service rebate liability. Resources from the Water Fund have been used to liquidate the SRF loans. Resources from the Storm Water Fund have been used to liquidate the RFL loans. The Sewer Fund, Water Fund, Storm Water Fund, and Transit Fund have typically been used in prior years to liquidate their respective liabilities for compensated absences.
61
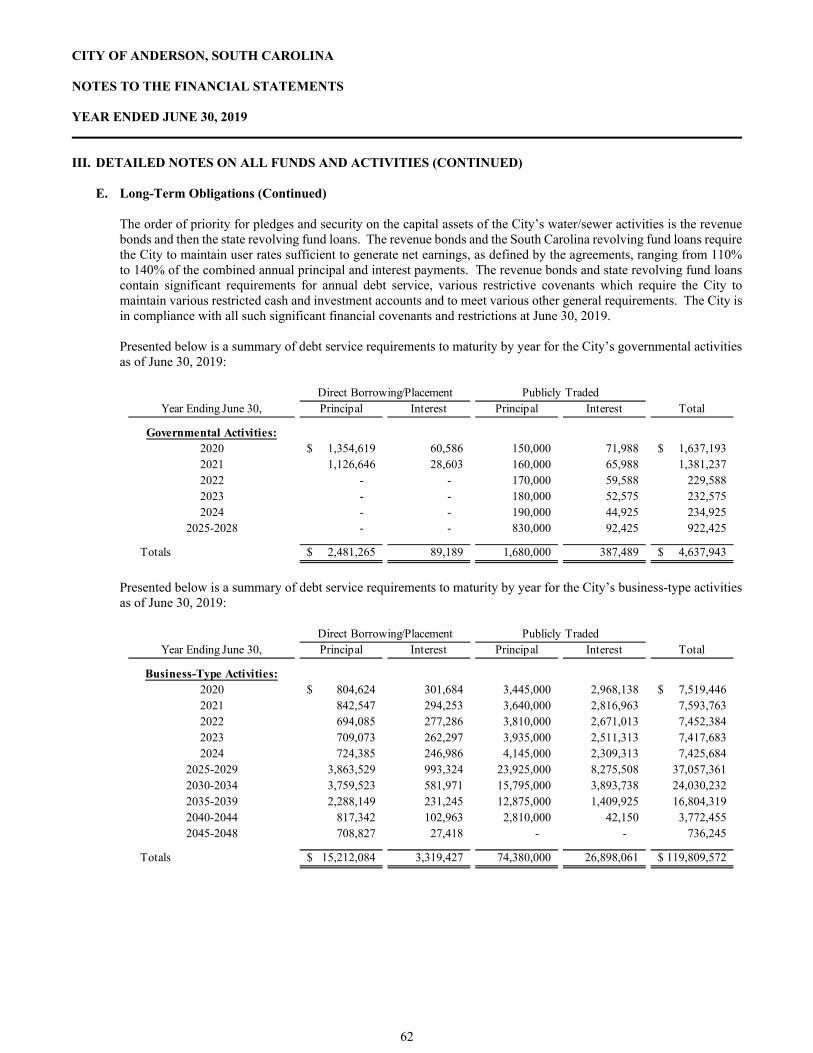
CITY OF ANDERSON, SOUTH CAROLINA NOTES TO THE FINANCIAL STATEMENTS YEAR ENDED JUNE 30, 2019
III. DETAILED NOTES ON ALL FUNDS AND ACTIVITIES (CONTINUED)
E. Long-Term Obligations (Continued)
The order of priority for pledges and security on the capital assets of the City’s water/sewer activities is the revenue bonds and then the state revolving fund loans. The revenue bonds and the South Carolina revolving fund loans require the City to maintain user rates sufficient to generate net earnings, as defined by the agreements, ranging from 110% to 140% of the combined annual principal and interest payments. The revenue bonds and state revolving fund loans contain significant requirements for annual debt service, various restrictive covenants which require the City to maintain various restricted cash and investment accounts and to meet various other general requirements. The City is in compliance with all such significant financial covenants and restrictions at June 30, 2019.
Presented below is a summary of debt service requirements to maturity by year for the City’s governmental activities as of June 30, 2019:
Year Ending June 30, Principal Interest Principal Interest Total
Governmental Activities:2020 1,354,619$ 60,586 150,000 71,988 1,637,193$ 2021 1,126,646 28,603 160,000 65,988 1,381,237 2022 - - 170,000 59,588 229,588 2023 - - 180,000 52,575 232,575 2024 - - 190,000 44,925 234,925
2025-2028 - - 830,000 92,425 922,425
Totals 2,481,265$ 89,189 1,680,000 387,489 4,637,943$
Direct Borrowing/Placement Publicly Traded
Presented below is a summary of debt service requirements to maturity by year for the City’s business-type activities as of June 30, 2019:
Year Ending June 30, Principal Interest Principal Interest Total
Business-Type Activities:2020 804,624$ 301,684 3,445,000 2,968,138 7,519,446$ 2021 842,547 294,253 3,640,000 2,816,963 7,593,763 2022 694,085 277,286 3,810,000 2,671,013 7,452,384 2023 709,073 262,297 3,935,000 2,511,313 7,417,683 2024 724,385 246,986 4,145,000 2,309,313 7,425,684
2025-2029 3,863,529 993,324 23,925,000 8,275,508 37,057,361 2030-2034 3,759,523 581,971 15,795,000 3,893,738 24,030,232 2035-2039 2,288,149 231,245 12,875,000 1,409,925 16,804,319 2040-2044 817,342 102,963 2,810,000 42,150 3,772,455 2045-2048 708,827 27,418 - - 736,245
Totals 15,212,084$ 3,319,427 74,380,000 26,898,061 119,809,572$
Direct Borrowing/Placement Publicly Traded
62
CITY OF ANDERSON, SOUTH CAROLINA NOTES TO THE FINANCIAL STATEMENTS YEAR ENDED JUNE 30, 2019
IV. OTHER INFORMATION
A. Risk Management Participation in Public Entity Risk Pools for Property and Casualty Insurance The City is exposed to various risks of loss related to torts, theft of, damage to, and destruction of assets, errors and omissions, and natural disasters. The City has joined together with other municipalities in the state to form the South Carolina Municipal Insurance and Risk Financing Fund (“SCMIRF”) and the South Carolina Municipal Insurance Trust (“SCMIT”), which are public entity risk pools currently operating as a common risk management and insurance program for general risk insurance and workers compensation, respectively.
The City pays an annual premium to SCMIRF for its general risk insurance. For the year ended June 30, 2019, the City’s total general risk insurance expense was approximately $1,046,000. SCMIRF is self-sustaining through member premiums and reinsures through commercial companies. SCMIRF’s net position from its most recently issued audited financial statements at December 31, 2018, totaled approximately $12,619,000. There were no significant reductions in coverage in the past fiscal year and there were no settlements exceeding insurance coverage in the past three fiscal years. The City pays an annual premium to SCMIT for its workers compensation insurance. For the year ended June 30, 2019, the City’s total workers compensation insurance expense was approximately $600,000. The Trust uses reinsurance agreements to reduce its exposure to large workers’ compensation losses. SCMIT’s net position from its most recently issued audited financial statements at December 31, 2018, totaled approximately $57,682,000. There were no significant reductions in coverage in the past fiscal year and there were no settlements exceeding insurance coverage in the past three fiscal years. Health Insurance The City has a fully insured health insurance program for the City’s employees in which the City pays a monthly premium for this coverage and has no additional liability related to health insurance. The City has not significantly reduced insurance coverages from the previous year.
B. Retirement Plans City Pension Plan Plan Description The General Employees’ Retirement Plan (“City Pension Plan”) is a single-employer defined benefit pension plan administered by the City of Anderson. It provides retirement, disability, and death benefits to plan members and beneficiaries at the discretion of City Council. Currently, all employees of the City, except for fire and police department personnel, are eligible to participate in the City Pension Plan. The City Administrator, City Clerk and Treasurer, and one other Employee (appointed by City Council) comprise the Pension Plan Committee (“Committee”) which administers the City Pension Plan. City Council has the authority to establish and amend benefit provisions for the City Pension Plan. The City Pension Plan’s year end is December 31st. The City Pension Plan does not issue a stand-alone financial report. Plan information from the latest actuarial report may be obtained by contacting the City of Anderson Finance Department, 401 S. Main Street, Anderson, South Carolina 29624. The City Pension Plan provides for a normal retirement age of 65 with 5 years of service with an additional early retirement with the earlier of age 55 with 5 years of service or 30 years of service, with no reduction in benefits. Elected officials’ normal retirement dates will now be defined as age 65 with 8 years of service, with an additional early retirement date of age 55 with 8 years of service, with no reduction in benefits. There was a 2.00%, cost-of-living, monthly benefit increase for retirees and beneficiaries granted as of August 1, 2018. The normal retirement benefit is 1.82% of final average earnings times years of benefit service. The City Pension Plan also provides for disability, delayed, and pre-retirement death, and termination benefits.
63
CITY OF ANDERSON, SOUTH CAROLINA NOTES TO THE FINANCIAL STATEMENTS YEAR ENDED JUNE 30, 2019
IV. OTHER INFORMATION (CONTINUED)
B. Retirement Plans (Continued) City Pension Plan (Continued) Plan Description (Continued)
Employer membership data consists of the following: retirees and beneficiaries receiving benefits – 147; vested inactive employees not yet receiving benefits – 46; and active employees/officials – 216. Covered payroll for year ended December 31, 2018, was approximately $7,674,000; average pay was approximately $38,218; average age was approximately 49; and average past service was approximately 11 years.
Basis of Accounting The City Pension Plan implemented GASB #67 “Financial Reporting for Pension Plans” (“GASB #67”) in 2014. GASB #67 replaces the requirements of GASB Statements No. 25 and No. 50 as they relate to pension plans that are administered through trusts or equivalent arrangements. GASB #67 establishes standards of financial reporting for plans that issue separate financial reports and also those plans whose financial information is included solely in the financial report of another government as a pension trust fund. GASB #67 specifies the required approach for measuring the pension liability of employers and non-employer contributing entities for benefits provided through pension plans. The City Pension Plan’s financial statements are prepared using the accrual basis of accounting. Employer contributions, benefit payments, and refunds are all recognized when due. All investments are reported at fair value. Securities traded on a national or international exchange are reported at the last reported sales price at current exchange rates. Securities without an established market are reported at estimated fair value. Administrative costs are paid out of the fund’s net position. Plan Investments The investment objective of the City Pension Plan is to (a) have the ability to pay all benefits and expense obligations when due, (b) control costs of administering the Pension Plan and managing the investments, (c) maximize return within reasonable and prudent levels of risks in order to minimize contributions, and (d) to adhere to the following general safe harbor rules:
Use prudent experts to make the investment decisions. Demonstrate that the prudent expert was selected by following a due diligence process. Give the prudent expert discretion over the assets. Have the prudent expert acknowledge their co-fiduciary status. Monitor the activities of the prudent expert to ensure that the expert is performing the agreed upon tasks.
It is the policy of the Committee to pursue an investment strategy that reduces risk through the prudent diversification of the portfolio across a broad selection of distinct asset classes. This policy discourages the use of cash equivalents, except for liquidity purposes, and aims to refrain from dramatically shifting asset class allocations over short time spans. To achieve the above investment objectives, City Council has appointed Synovus Trust Company to serve as Trustee, with their duties and responsibilities described in the executed trust agreement. The City Pension Plan’s current target asset allocation as of December 31, 2018 is summarized in the following table:
Asset Class Target Allocation
Cash and Money Market Funds 2.0%Fixed Income 33.0%Global Equity 65.0%
64
CITY OF ANDERSON, SOUTH CAROLINA NOTES TO THE FINANCIAL STATEMENTS YEAR ENDED JUNE 30, 2019
IV. OTHER INFORMATION (CONTINUED)
B. Retirement Plans (Continued) City Pension Plan (Continued) Plan Investments (Continued) For the year ended December 31, 2018, the annual money-weighted rate of return on City Pension Plan investments, net of City Pension Plan investment expenses, was negative and was 3.78%. The money-weighted rate of return expresses investment performance, net of investment expenses, adjusted for the changing amounts actually invested. For more information on the actual investments being held by the City Pension Plan and any significant concentration risk as of December 31, 2018, see Note III.A for details.
Plan Contributions In accordance with the City Pension Plan document, the City makes contributions in amounts determined by the Committee, based on recommendations of the City Pension Plan’s actuary. The actuarial determined rate is the estimated amount necessary to finance the costs of benefits earned by plan members during the year, with an additional amount to finance any unfunded accrued liability. As such, the City has established a funding policy of 9.10% of compensation being contributed to the City Pension Plan. Participant contributions are not permitted or required. Plan Actuarial Assumptions The total pension liability was determined by an actuarial valuation on January 1, 2019, using the following key actuarial assumptions, applied to all periods included in the measurement:
Actuarial Valuation Date: January 1, 2019
Actuarial Cost Method: Entry Age
Amortization Period: Level Percent of Payroll Amount; 30 years - Closed
Actuarial Asset Valuation Method: Market Value
Actuarial Assumptions:
Assumed Rate of Return on Investments: 7.5%, net of investment expenses, including inflation
Mortality Rate: 1984 Unisex Pension Mortality Table
Rates of Disability: Hallman & Lorber Disability Table
Salary Increases: 3.5%, average, including inflation
Survivor Benefits: 50% of monthly benefits
Inflation Rate: 2.0%
Changes in Actuarial Assumptions: A 2.0% ad-hoc cost of living adjustment was granted 8/1/2018.
There was no assumption made about any ad hoc cost-of-living adjustments for the pensioners; historically, the decision about granting these has been made by considering the value of the current net pension liability (asset). The discount rate used to measure the total pension liability was 7.50 percent. The projection of cash flows used to determine the discount rate assumed that the City’s contributions will continue to be made at their current funding percent (9.10%) of compensation. Based on this assumption, the City Pension Plan’s net position was projected to be available to make all projected future benefit payments of current plan members. Therefore, the long-term expected rate of return on investments was applied to all periods of projected benefit payments to determine the total pension liability.
65
CITY OF ANDERSON, SOUTH CAROLINA NOTES TO THE FINANCIAL STATEMENTS YEAR ENDED JUNE 30, 2019
IV. OTHER INFORMATION (CONTINUED)
B. Retirement Plans (Continued) City Pension Plan (Continued)
Plan Actuarial Assumptions (Continued) The longer-term expected rate of return on City Pension Plan investments was determined using a building-block method in which best-estimate ranges of expected future real rates of return (expected returns, net of City Pension Plan investment expense and inflation) are developed for each major asset class. These ranges are combined to produce the long-term expected rate of return by weighting the expected future real rates of return by the target asset allocation percentage and by adding expected inflation. Best estimates of arithmetic real rates of return for each major asset class included in the Plan’s target asset allocation as of December 31, 2018 are summarized in the following table:
Long-Term ExpectedAsset Class Real Rate of Return
Cash and Money Market Funds 2.00%Fixed Income 3.00%Global Equity 5.00%
Changes in the Net Pension Liability (Asset) The components of the change in the City Pension Plan’s liability (asset) for the year ended December 31, 2018 were as follows:
(a) Total Pension
Liability
(b) Plan Fiduciary Net Position
(a) - (b) Net Pension
Liability (Asset)
Balance at December 31, 2017 28,051,265$ 32,488,770 (4,437,505)$ Changes for the Year:
Service Cost 588,398 - 588,398 Interest 2,033,981 - 2,033,981 Change of Benefit Terms 366,088 366,088 Differences between Expected and Actual Experience (201,124) - (201,124) Contributions - Employer - 882,563 (882,563) Net Investment Income - (1,208,821) 1,208,821 Benefit Payments, Net (1,863,038) (1,863,038) - Administrative Expenses - (78,550) 78,550 Other - 7,664 (7,664)
Net Changes 924,305 (2,260,182) 3,184,487
Balance at December 31, 2018 28,975,570$ 30,228,588 (1,253,018)$
City Pension Plan's Fiduciary Net Position as aPercentage of the Total Pension Liability (Asset)
Beginning of the Year 115.82%
End of the Year 104.32%
66
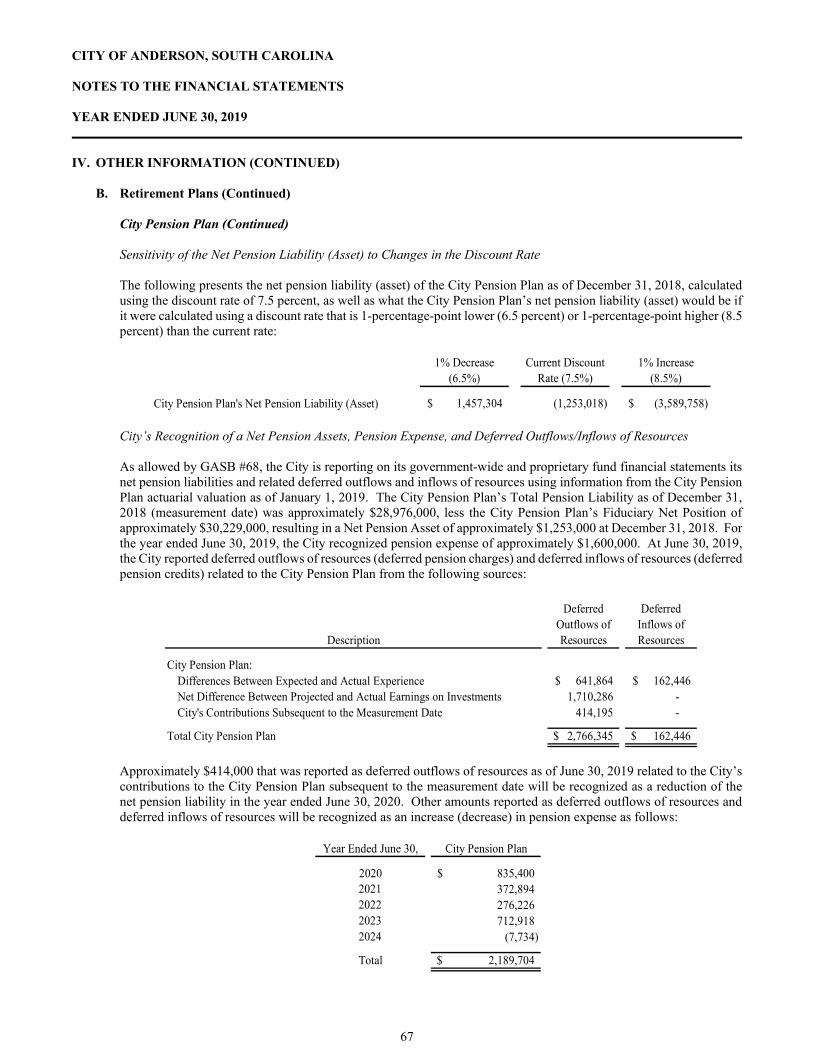
CITY OF ANDERSON, SOUTH CAROLINA NOTES TO THE FINANCIAL STATEMENTS YEAR ENDED JUNE 30, 2019
IV. OTHER INFORMATION (CONTINUED)
B. Retirement Plans (Continued) City Pension Plan (Continued)
Sensitivity of the Net Pension Liability (Asset) to Changes in the Discount Rate The following presents the net pension liability (asset) of the City Pension Plan as of December 31, 2018, calculated using the discount rate of 7.5 percent, as well as what the City Pension Plan’s net pension liability (asset) would be if it were calculated using a discount rate that is 1-percentage-point lower (6.5 percent) or 1-percentage-point higher (8.5 percent) than the current rate:
1% Decrease (6.5%)
Current Discount Rate (7.5%)
1% Increase (8.5%)
City Pension Plan's Net Pension Liability (Asset) 1,457,304$ (1,253,018) (3,589,758)$
City’s Recognition of a Net Pension Assets, Pension Expense, and Deferred Outflows/Inflows of Resources As allowed by GASB #68, the City is reporting on its government-wide and proprietary fund financial statements its net pension liabilities and related deferred outflows and inflows of resources using information from the City Pension Plan actuarial valuation as of January 1, 2019. The City Pension Plan’s Total Pension Liability as of December 31, 2018 (measurement date) was approximately $28,976,000, less the City Pension Plan’s Fiduciary Net Position of approximately $30,229,000, resulting in a Net Pension Asset of approximately $1,253,000 at December 31, 2018. For the year ended June 30, 2019, the City recognized pension expense of approximately $1,600,000. At June 30, 2019, the City reported deferred outflows of resources (deferred pension charges) and deferred inflows of resources (deferred pension credits) related to the City Pension Plan from the following sources:
Description
City Pension Plan:Differences Between Expected and Actual Experience 641,864$ 162,446$ Net Difference Between Projected and Actual Earnings on Investments 1,710,286 - City's Contributions Subsequent to the Measurement Date 414,195 -
Total City Pension Plan 2,766,345$ 162,446$
Deferred Outflows of Resources
Deferred Inflows of Resources
Approximately $414,000 that was reported as deferred outflows of resources as of June 30, 2019 related to the City’s contributions to the City Pension Plan subsequent to the measurement date will be recognized as a reduction of the net pension liability in the year ended June 30, 2020. Other amounts reported as deferred outflows of resources and deferred inflows of resources will be recognized as an increase (decrease) in pension expense as follows:
Year Ended June 30, City Pension Plan
2020 835,400$ 2021 372,894 2022 276,226 2023 712,918 2024 (7,734)
Total 2,189,704$
67
CITY OF ANDERSON, SOUTH CAROLINA NOTES TO THE FINANCIAL STATEMENTS YEAR ENDED JUNE 30, 2019
IV. OTHER INFORMATION (CONTINUED)
B. Retirement Plans (Continued) City Pension Plan (Continued) Payable to Plan The City reported a payable of approximately $226,000 to the City Pension Plan as of June 30, 2019, representing required employer contributions for the fourth quarter of fiscal year 2019. This amount is included in Accrued Salaries and Benefits on the financial statements and was paid in July 2019. State Retirement Plan
The City participates in one of the State of South Carolina’s retirement plans, which are administered by the South Carolina Public Employee Benefit Authority (“PEBA”). The PEBA, created on July 1, 2012 and governed by an 11-member Board of Directors (“PEBA Board”), is the state agency responsible for the administration and management of the various retirement systems and retirement programs of the state of South Carolina, including the State Optional Retirement Program and the S.C. Deferred Compensation Program, as well as the state’s employee insurance programs. As such, the PEBA is responsible for administering the South Carolina Retirement Systems’ (“Systems”) five defined benefit pension plans. The Retirement Funding and Administration Act of 2017, which became effective July 1, 2017, increased the employer and employee contribution rates, established a ceiling on the and PORS employee contribution rates, lowered the assumed rate of return, required a scheduled reduction of the funding periods, and addressed various governance issues including the assignment of the PEBA Board as custodian of the retirement trust funds and assignment of the Retirement Systems Investment Commission (“RSIC”) and PEBA as co-trustees of the assets of the retirement trust funds. By law, the State Fiscal Accountability Authority (“SFAA”), which consists of five elected officials, also reviews certain PEBA Board decisions regarding the actuary of the Systems. The PEBA issues a Comprehensive Annual Financial Report (“CAFR”) containing financial statements and required supplementary information for the System’ Pension Trust Funds. The CAFR is publicly available through the Retirement Benefits’ link on the PEBA’s website at www.peba.sc.gov, or a copy may be obtained by submitting a request to PEBA, 202 Arbor Lake Drive, Columbia, SC 29223. The PEBA is considered a division of the primary government of the state of South Carolina and therefore, retirement trust fund financial information is also included in the comprehensive annual financial report of the state. Plan Description
The South Carolina Police Officers Retirement System (“PORS” or “Plan”), a cost–sharing multiple-employer defined benefit pension plan, was established effective July 1, 1962, pursuant to the provisions of Section 9-11-20 of the South Carolina Code of Laws for the purpose of providing retirement allowances and other benefits for police officers and firefighters. PORS also covers peace officers, coroners, probate judges, and magistrates. Plan Membership Membership requirements are prescribed in Title 9 of the South Carolina Code of Laws. A brief summary of the requirements under the system is presented below.
PORS – To be eligible for PORS membership, an employee must be required by the terms of his employment, by election or appointment, to preserve public order, protect life and property, and detect crimes in the state; to prevent and control property destruction by fire; or to serve as a peace officer employed by the Department of Corrections, the Department of Juvenile Justice, or the Department of Mental Health. Probate judges and coroners may elect membership in the PORS. Magistrates are required to participate in the PORS for service as a magistrate. PORS members, other than magistrates and probate judges, must also earn at least $2,000 per year and devote at least 1,600 hours per year to this work, unless exempted by statute. An employee member of the system with an effective date of membership prior to July 1, 2012, is a Class Two member.
68
CITY OF ANDERSON, SOUTH CAROLINA NOTES TO THE FINANCIAL STATEMENTS YEAR ENDED JUNE 30, 2019
IV. OTHER INFORMATION (CONTINUED)
B. Retirement Plans (Continued) State Retirement Plan (Continued)
Plan Membership (Continued)
An employee member of the system with an effective date of membership on or after July 1, 2012, is a Class Three member.
Plan Benefits Benefit terms are prescribed in Title 9 of the South Carolina Code of Laws. PEBA does not have the authority to establish or amend benefit terms without a legislative change in the code of laws. Key elements of the benefit calculation include the benefit multiplier, years of service, and average final compensation/current annual salary. A brief summary of benefit terms under the system is presented below.
PORS – A Class Two member who has separated from service with at least five or more years of earned service is eligible for a monthly pension at age 55 or with 25 years of service regardless of age. A Class Three member who has separated from service with at least eight or more years of earned service is eligible for a monthly pension at age 55 or with 27 years of service regardless of age. Both Class Two and Class Three members are eligible to receive a deferred annuity at age 55 with five or eight years of earned service, respectively. An incidental death benefit is also available to beneficiaries of active and retired members of employers who participate in the death benefit program. Accidental death benefits are also provided upon the death of an active member working for a covered employer whose death was a natural and proximate result of an injury incurred while in the performance of duty. The retirement allowance of eligible retirees or their surviving annuitants is increased by the lesser of one percent or five hundred dollars every July 1. Only those annuitants in receipt of a benefit on July 1 of the preceding year are eligible to receive the increase.
Plan Contributions
Contributions are prescribed in Title 9 of the South Carolina Code of Laws. If the scheduled employee and employer contributions provided in statute, or the rates last adopted by the PEBA Board, are insufficient to maintain the period set in statute, the PEBA Board shall increase employer contribution rates as necessary. After June 30, 2027, if the most recent annual actuarial valuation of the Systems for funding purposes shows a ratio of the actuarial value of system assets to the actuarial accrued liability of the system (the funded ratio) that is equal to or greater than eighty-five percent, then the PEBA Board, effective on the following July first, may decrease the then current contribution rates upon making a finding that the decrease will not result in a funded ratio of less than eighty-five percent. If contribution rates are decreased pursuant to this provision, and the most recent annual actuarial valuation of the system shows a funded ratio of less than eighty-five percent, then effective on the following July first, and annually thereafter as necessary, the PEBA Board shall increase the then current contribution rates until a subsequent annual actuarial valuation of the system shows a funded ratio that is equal to or greater than eighty-five percent. The Retirement System Funding and Administration Act establishes a ceiling on employee contribution rates at 9.75 percent for the PORS. The employer contribution rates will continue to increase annually by 1 percent through July 1, 2022. The legislation's ultimate scheduled employer rate is 21.24 percent for the PORS. The amortization period is scheduled to be reduced one year for each of the next 10 years to a twenty-year amortization period.
69

CITY OF ANDERSON, SOUTH CAROLINA NOTES TO THE FINANCIAL STATEMENTS YEAR ENDED JUNE 30, 2019
IV. OTHER INFORMATION (CONTINUED) B. Retirement Plans (Continued)
State Retirement Plan (Continued) Plan Contributions (Continued) As noted earlier, both employees and the City are required to contribute to the Plan at rates established and as amended by the PEBA. The City’s contributions are actuarially determined but are communicated to and paid by the City as a percentage of the employees’ annual eligible compensation. Required employer and employee contribution rates for the past three years are as follows:
2017 2018 2019
Employer Contribution Rate:^ 13.84% 15.84% 16.84%
Incidental Death Benefit N/A N/A 0.20%
Accidental Death Contributions N/A N/A 0.20%
13.84% 15.84% 17.24%
Employee Contribution Rate 9.24% 9.75% 9.75%
^ Calculated on earnable compensation as defined in Title 9 of the South Carolina Code of Laws.
PORS Rates
The required contributions and percentages of amounts contributed to the Plan for the past three years were as follows:
Required % Contributed
2019 1,458,783$ 100%2018 1,224,221 100%2017 998,880$ 100%
PORS ContributionsYear Ended June 30,
In an effort to help offset a portion of the burden of the increased contribution requirement for employers, the State General Assembly (“State”) funded 1 percent of the PORS contribution increase for the year ended June 30, 2018. The State’s budget appropriated these funds directly to the PEBA for the Police Officers Retirement System Trust Fund. The amount of funds appropriated by the State (nonemployer contributing entity) for the year ended June 30, 2018 (measurement date) to the City were approximately $68,000 for the PORS. The City recognized contributions (on-behalf benefits) from the State of approximately $67,000 for the year ended June 30, 2019. These contributions by the State are recognized as miscellaneous revenues and pension expenditures in the City’s governmental fund financial statements. Eligible payrolls covered under the Plan for the past three years were as follows:
PORS Payroll
2019 8,461,617$ 2018 7,728,671 2017 7,217,338$
Year Ended June 30,
70

CITY OF ANDERSON, SOUTH CAROLINA NOTES TO THE FINANCIAL STATEMENTS YEAR ENDED JUNE 30, 2019
IV. OTHER INFORMATION (CONTINUED) B. Retirement Plans (Continued)
State Retirement Plan (Continued) Actuarial Assumptions and Methods Actuarial valuations of the plan involve estimates of the reported amounts and assumptions about the probability of occurrence of events far into the future. Examples include assumptions about future employment, mortality, and future salary increases. Amounts determined regarding the net pension liability are subject to continual revision as actual results are compared with past expectations and new estimates are made about the future. South Carolina state statute requires that an actuarial experience study be completed at least once in each five-year period. An experience report on the Systems was most recently issued for the period ending June 30, 2015. The June 30, 2018 total pension liability (“TPL”), net pension liability (“NPL”), and sensitivity information shown in this report were determined by the consulting actuary, Gabriel, Roeder, Smith and Company (“GRS”), and are based on an actuarial valuation performed as of July 1, 2017. The TPL was rolled-forward from the valuation date to the Plan's fiscal year end, June 30, 2018, using generally accepted actuarial principles.
The following table provides a summary of the actuarial assumptions and methods used to calculate the TPL as of June 30, 2018 for the PORS.
PORS
Actuarial Cost Method Entry Age NormalActuarial Assumptions:
Investment Rate of Return* 7.25%Projected Salary Increases* 3.5% to 9.5% (varies by service)Benefit Adjustments Lesser of 1% or $500 annually
* Includes inflation at 2.25%.
The post-retiree mortality assumption is dependent upon the member's job category and gender. The base mortality assumptions, the 2016 Public Retirees of South Carolina Mortality table (“2016 PRSC”), were developed using the Systems' mortality experience. These base rates are adjusted for future improvement in mortality using published Scale AA projected from the year 2016.
Former Job Class Males Females
Educators
2016 PRSC Males multiplied by 92%
2016 PRSC Females multiplied by 98%
General Employees and Members of the
General Assembly
2016 PRSC Males multiplied by 100%
2016 PRSC Females multiplied by 111%
Public Safety and Firefighters
2016 PRSC Males multiplied by 125%
2016 PRSC Females multiplied by 111%
Long-Term Expected Rate of Return The long-term expected rate of return on pension plan investments is based upon 30 year capital market assumptions. The long-term expected rate of returns represent assumptions developed using an arithmetic building block approach primarily based on consensus expectations and market based inputs. Expected returns are net of investment fees.
71
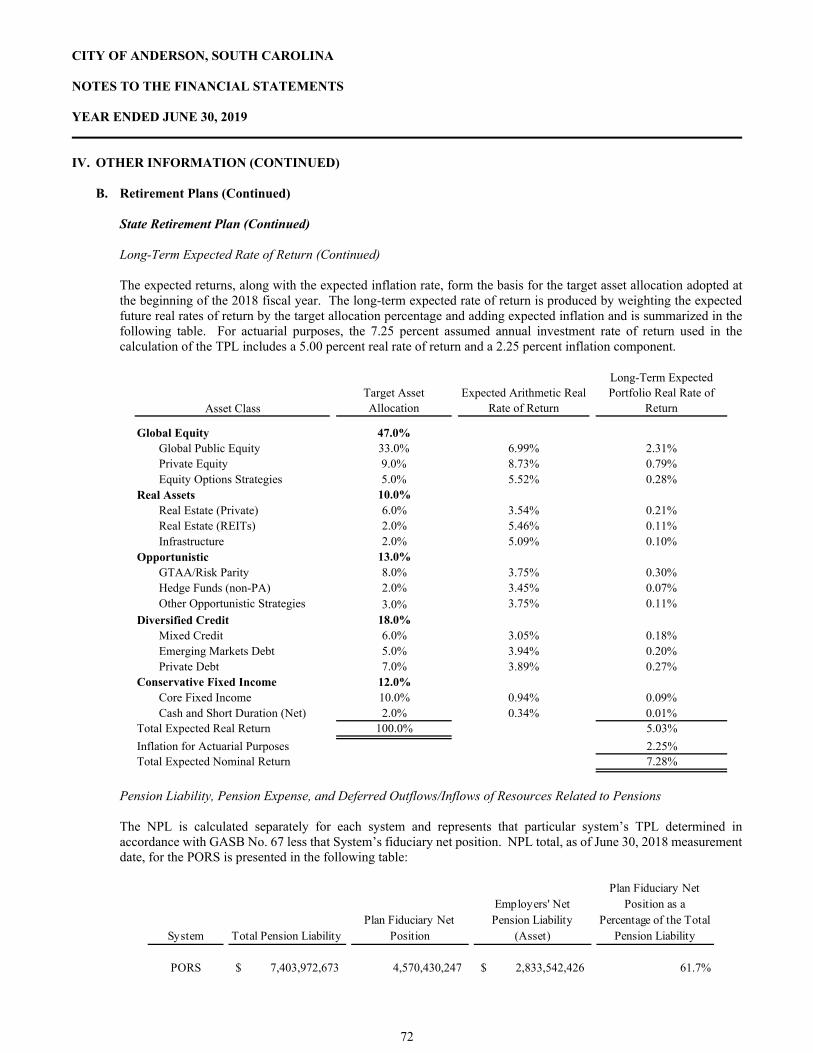
CITY OF ANDERSON, SOUTH CAROLINA NOTES TO THE FINANCIAL STATEMENTS YEAR ENDED JUNE 30, 2019
IV. OTHER INFORMATION (CONTINUED) B. Retirement Plans (Continued)
State Retirement Plan (Continued)
Long-Term Expected Rate of Return (Continued) The expected returns, along with the expected inflation rate, form the basis for the target asset allocation adopted at the beginning of the 2018 fiscal year. The long-term expected rate of return is produced by weighting the expected future real rates of return by the target allocation percentage and adding expected inflation and is summarized in the following table. For actuarial purposes, the 7.25 percent assumed annual investment rate of return used in the calculation of the TPL includes a 5.00 percent real rate of return and a 2.25 percent inflation component.
Asset ClassTarget Asset Allocation
Expected Arithmetic Real Rate of Return
Long-Term Expected Portfolio Real Rate of
Return
Global Equity 47.0%Global Public Equity 33.0% 6.99% 2.31%Private Equity 9.0% 8.73% 0.79%Equity Options Strategies 5.0% 5.52% 0.28%
Real Assets 10.0%Real Estate (Private) 6.0% 3.54% 0.21%Real Estate (REITs) 2.0% 5.46% 0.11%Infrastructure 2.0% 5.09% 0.10%
Opportunistic 13.0%GTAA/Risk Parity 8.0% 3.75% 0.30%Hedge Funds (non-PA) 2.0% 3.45% 0.07%Other Opportunistic Strategies 3.0% 3.75% 0.11%
Diversified Credit 18.0%Mixed Credit 6.0% 3.05% 0.18%Emerging Markets Debt 5.0% 3.94% 0.20%Private Debt 7.0% 3.89% 0.27%
Conservative Fixed Income 12.0%Core Fixed Income 10.0% 0.94% 0.09%Cash and Short Duration (Net) 2.0% 0.34% 0.01%
Total Expected Real Return 100.0% 5.03%
Inflation for Actuarial Purposes 2.25%Total Expected Nominal Return 7.28%
Pension Liability, Pension Expense, and Deferred Outflows/Inflows of Resources Related to Pensions The NPL is calculated separately for each system and represents that particular system’s TPL determined in accordance with GASB No. 67 less that System’s fiduciary net position. NPL total, as of June 30, 2018 measurement date, for the PORS is presented in the following table:
System Total Pension LiabilityPlan Fiduciary Net
Position
Employers' Net Pension Liability
(Asset)
Plan Fiduciary Net Position as a
Percentage of the Total Pension Liability
PORS 7,403,972,673$ 4,570,430,247 2,833,542,426$ 61.7%
72
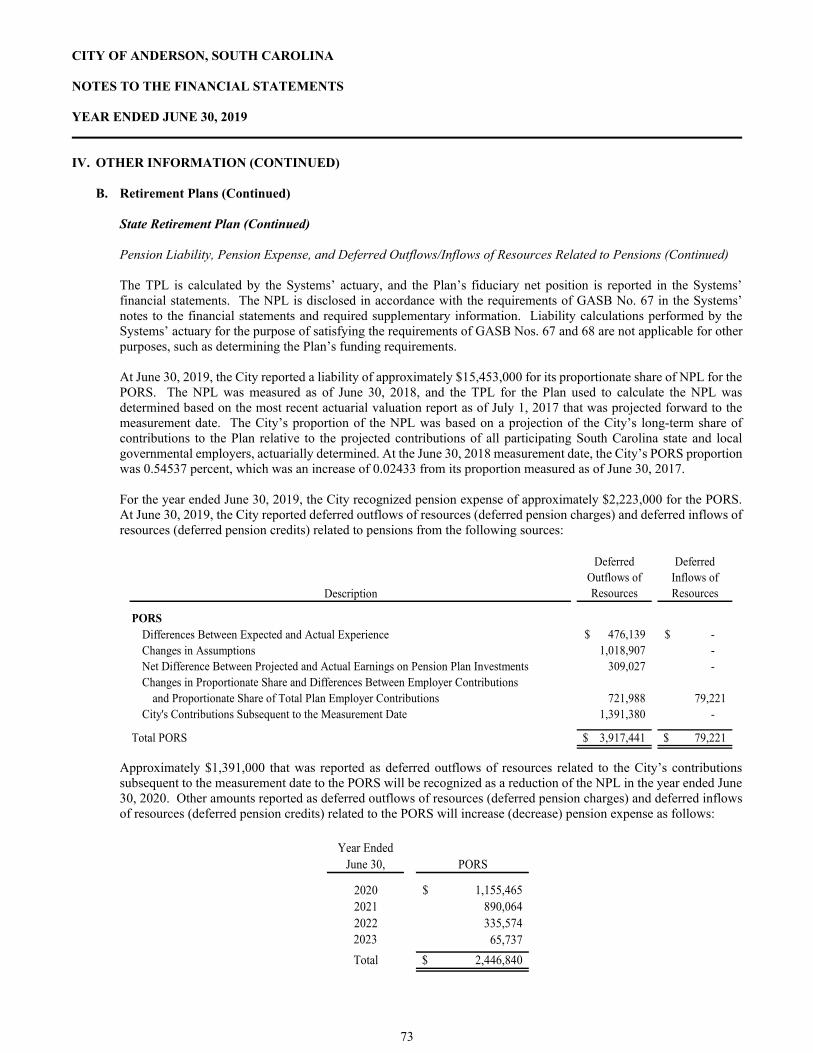
CITY OF ANDERSON, SOUTH CAROLINA NOTES TO THE FINANCIAL STATEMENTS YEAR ENDED JUNE 30, 2019
IV. OTHER INFORMATION (CONTINUED) B. Retirement Plans (Continued)
State Retirement Plan (Continued)
Pension Liability, Pension Expense, and Deferred Outflows/Inflows of Resources Related to Pensions (Continued) The TPL is calculated by the Systems’ actuary, and the Plan’s fiduciary net position is reported in the Systems’ financial statements. The NPL is disclosed in accordance with the requirements of GASB No. 67 in the Systems’ notes to the financial statements and required supplementary information. Liability calculations performed by the Systems’ actuary for the purpose of satisfying the requirements of GASB Nos. 67 and 68 are not applicable for other purposes, such as determining the Plan’s funding requirements. At June 30, 2019, the City reported a liability of approximately $15,453,000 for its proportionate share of NPL for the PORS. The NPL was measured as of June 30, 2018, and the TPL for the Plan used to calculate the NPL was determined based on the most recent actuarial valuation report as of July 1, 2017 that was projected forward to the measurement date. The City’s proportion of the NPL was based on a projection of the City’s long-term share of contributions to the Plan relative to the projected contributions of all participating South Carolina state and local governmental employers, actuarially determined. At the June 30, 2018 measurement date, the City’s PORS proportion was 0.54537 percent, which was an increase of 0.02433 from its proportion measured as of June 30, 2017. For the year ended June 30, 2019, the City recognized pension expense of approximately $2,223,000 for the PORS. At June 30, 2019, the City reported deferred outflows of resources (deferred pension charges) and deferred inflows of resources (deferred pension credits) related to pensions from the following sources:
Description
Deferred Outflows of Resources
Deferred Inflows of Resources
PORSDifferences Between Expected and Actual Experience 476,139$ -$ Changes in Assumptions 1,018,907 - Net Difference Between Projected and Actual Earnings on Pension Plan Investments 309,027 - Changes in Proportionate Share and Differences Between Employer Contributions
and Proportionate Share of Total Plan Employer Contributions 721,988 79,221 City's Contributions Subsequent to the Measurement Date 1,391,380 -
Total PORS 3,917,441$ 79,221$
Approximately $1,391,000 that was reported as deferred outflows of resources related to the City’s contributions subsequent to the measurement date to the PORS will be recognized as a reduction of the NPL in the year ended June 30, 2020. Other amounts reported as deferred outflows of resources (deferred pension charges) and deferred inflows of resources (deferred pension credits) related to the PORS will increase (decrease) pension expense as follows:
PORS
2020 1,155,465$ 2021 890,064 2022 335,574 2023 65,737
Total 2,446,840$
Year Ended June 30,
73

CITY OF ANDERSON, SOUTH CAROLINA NOTES TO THE FINANCIAL STATEMENTS YEAR ENDED JUNE 30, 2019
IV. OTHER INFORMATION (CONTINUED) B. Retirement Plans (Continued)
State Retirement Plan (Continued)
Discount Rate The discount rate used to measure the TPL was 7.25 percent. The projection of cash flows used to determine the discount rate assumed that contributions from participating employers in the PORS will be made based on the actuarially determined rates based on provisions in the South Carolina Code of Laws. Based on those assumptions, each System’s fiduciary net position was projected to be available to make all projected future benefit payments of current plan members. Therefore, the long-term expected rate of return on pension plan investments was applied to all periods of projected benefit payments to determine the TPL. Sensitivity Analysis The following table presents the sensitivity of the City’s proportionate share of the NPL of the Plan to changes in the discount rate, calculated using the discount rate of 7.25 percent, as well as what it would be if it were calculated using a discount rate that is 1% point lower (6.25 percent) or 1% point higher (8.25 percent) than the current rate:
1.00% Decrease Current Discount Rate 1.00% IncreaseSystem (6.25%) (7.25%) (8.25%)
The City's proportionate share of the netpension liability of the PORS 20,832,894$ 15,453,236 11,046,845$
Plan Fiduciary Net Position Detailed information regarding the fiduciary net position of the Plan administered by the PEBA is available in the separately issued CAFR containing financial statements and required supplementary information for the PORS. The CAFR is publicly available through the Retirement Benefits’ link on the PEBA’s website at www.peba.sc.gov, or a copy may be obtained by submitting a request to PEBA, 202 Arbor Lake Drive, Columbia, SC 29223. Payable to Plan The City reported a payable of approximately $190,000 to the PEBA as of June 30, 2019, representing required employer and employee contributions for the month of June 2019 for the PORS. This amount is included in Accrued Salaries and Benefits on the financial statements and was paid in July 2019.
74

CITY OF ANDERSON, SOUTH CAROLINA NOTES TO THE FINANCIAL STATEMENTS YEAR ENDED JUNE 30, 2019
IV. OTHER INFORMATION (CONTINUED)
C. Other Postemployment Benefit Plan
Plan Description The City of Anderson Defined Benefit Retiree Healthcare Plan is a single-employer defined benefit OPEB plan (“OPEB Plan”) administered by the City. Employees who are retired under the City Pension Plan or under the South Carolina Police Officers Retirement System and receive benefits upon retirement are eligible to remain on the City’s health and dental plan. More information regarding the PEBA and the South Carolina Police Officers Retirement System eligibility may be found in Note IV.B.
Plan Membership As of June 30, 2017, the last actuarial valuation, the following employees were covered by the OPEB Plan’s benefit terms:
Inactive Members or Beneficiaries Currently Receiving Benefit Payments 9 Active Members 426
Total Membership 435
Plan Benefits and Contributions
The City’s OPEB Plan currently participates in the State Health Plan, which is administered by the PEBA. The PEBA is responsible for establishing and amending the provisions, benefits, and contribution requirements of those entities that participate in the State Health Plan. The primary benefits of the OPEB Plan include medical, prescription, and dental coverages for retirees and their eligible dependents. Retiree contributions requirements for the City are established and amended by the City Council. Currently, retirees and dependents must pay the full group blended premium rate (implicit subsidy) as determined by the PEBA. The current average medical premium prior to Medicare eligibility is approximately $460.66 (PEBA Standard Plan) for retirees, $972.34 (PEBA Standard Plan) for retiree and spouse, $700.96 (PEBA Standard Plan) for retiree and child(ren), and $1,206.74 (PEBA Standard Plan) for retiree and family. Coverage can continue up to age 65 for the retiree and spouse. Dental coverage is also available. The retiree must pay 100% of the published premium rate for dental coverage. Employees who meet the definition of disabled as defined by Medicare are allowed to continue spouse coverage. The retiree must pay the 100% of the published premium rate. Actuarial Assumptions and Method Actuarial valuations of the OPEB Plan involve estimates of the reported amounts and assumptions about the probability of occurrence of events far into the future. Examples include assumptions about future employment, mortality, inflation, healthcare cost trend rates, and future salary changes. Amounts determined regarding the total OPEB liability are subject to continual revision as actual results are compared with past expectations and new estimates are made about the future. Projections of benefits for financial reporting purposes are based on the substantive OPEB Plan (the plan as understood by the employer and its members) and include the types of benefits provided at the time of each valuation and the historical pattern of sharing of benefit costs between the employer and plan members to that point. The actuarial methods and assumptions used include techniques that are designed to reduce the effects of short-term volatility in actuarial accrued liabilities and the actuarial value of assets, consistent with the long-term perspective of the calculations.
75

CITY OF ANDERSON, SOUTH CAROLINA NOTES TO THE FINANCIAL STATEMENTS YEAR ENDED JUNE 30, 2019
IV. OTHER INFORMATION (CONTINUED)
C. Other Postemployment Benefit Plan (Continued) Actuarial Assumptions and Method (Continued) The following table provides a summary of the significant actuarial assumptions and methods used in the latest actuarial valuation for the OPEB Plan.
Actuarial Valuation Date June 30, 2017Actuarial Cost Method Entry Age NormalAsset Valuation Method N/A (No Assets)Actuarial Assumptions:
Inflation City Pension Plan - 3.00%; PORS - 2.25%Investment Return N/A (No Assets)Discount Rate 3.87% (previous measurement date was 3.56%)Healthcare Cost Trend Rate 7.50% for 2017 decreasing to an ultimate rate of 5.00% by 2023Payroll Growth City Retirement Plan - 3.50%; PORS - 3.50% - 9.50%Coverage Elections
Active Participation/Marriage 100% of all active employees are assumed to be married with female spousesassumed to be 3 years younger
Mortality Table City Pension Plan - 1984 Unisex Penion Mortality TablePORS - RP-2014 Mortality Table with a 95% Multiplier
Implicit Subsidy
40% of eligible retirees will elect coverage and 30% of those will elect to cover thespouse
Total cost of coverage for pre-65 retirees is 35% higher than the average premiumrate to account for implicitly subsidized costs
The actuarial assumptions used above were based on the results of an actuarial experience study most recently issued as of January 1, 2017.
OPEB Liabilities, OPEB Expense, and Deferred Outflows/Inflows of Resources Related to OPEB The City’s total OPEB liability was determined by the actuary and is based on an actuarial valuation as of June 30, 2017. The total pension liability was rolled-forward from the valuation date to the June 30, 2018 measurement date using generally accepted actuarial principles.
Total OPEB Liability
Balance as of the June 30, 2017 Measurement Date 1,280,675$
Changes for the year:Service Cost 98,233 Interest 45,070 Changes of Assumptions or Other Inputs (49,147) Benefit Payments and Implicit Subsidy Credit (29,300)
Net Changes 64,856
Balance as of the June 30, 2018 Measurement Date 1,345,531$
76
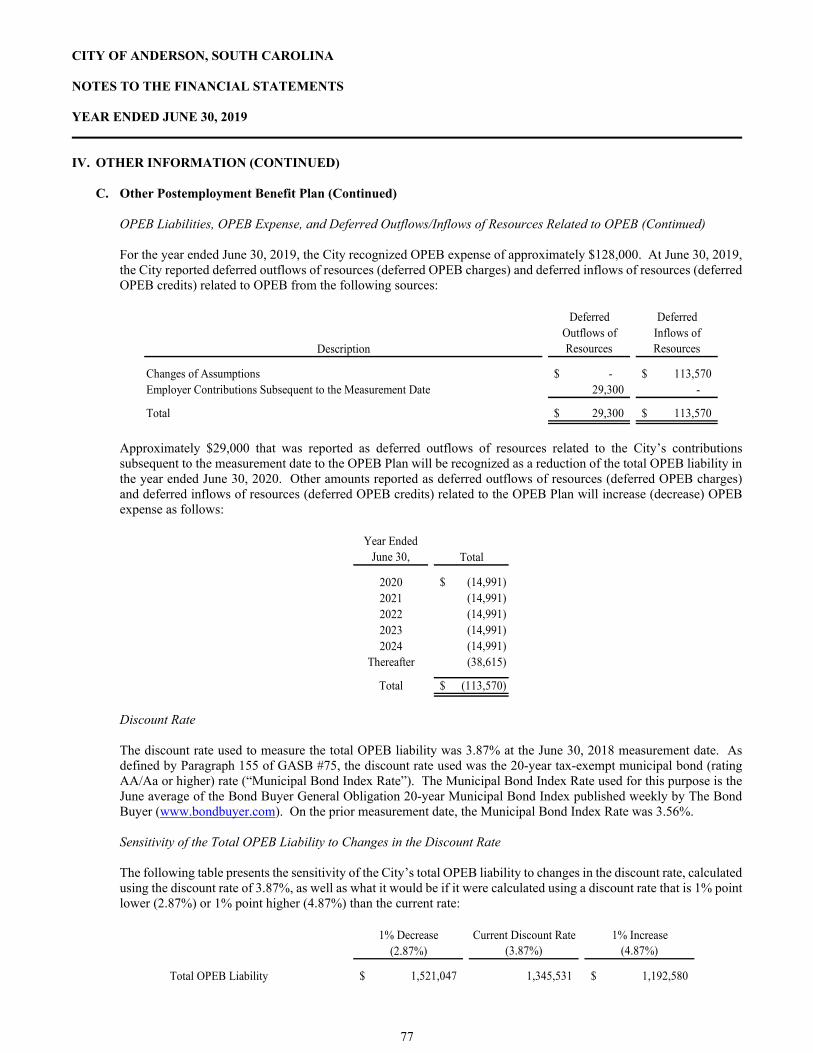
CITY OF ANDERSON, SOUTH CAROLINA NOTES TO THE FINANCIAL STATEMENTS YEAR ENDED JUNE 30, 2019
IV. OTHER INFORMATION (CONTINUED)
C. Other Postemployment Benefit Plan (Continued) OPEB Liabilities, OPEB Expense, and Deferred Outflows/Inflows of Resources Related to OPEB (Continued) For the year ended June 30, 2019, the City recognized OPEB expense of approximately $128,000. At June 30, 2019, the City reported deferred outflows of resources (deferred OPEB charges) and deferred inflows of resources (deferred OPEB credits) related to OPEB from the following sources:
Deferred DeferredOutflows of Inflows of
Description Resources Resources
Changes of Assumptions -$ 113,570$ Employer Contributions Subsequent to the Measurement Date 29,300 -
Total 29,300$ 113,570$
Approximately $29,000 that was reported as deferred outflows of resources related to the City’s contributions subsequent to the measurement date to the OPEB Plan will be recognized as a reduction of the total OPEB liability in the year ended June 30, 2020. Other amounts reported as deferred outflows of resources (deferred OPEB charges) and deferred inflows of resources (deferred OPEB credits) related to the OPEB Plan will increase (decrease) OPEB expense as follows:
Year Ended June 30, Total
2020 (14,991)$ 2021 (14,991) 2022 (14,991) 2023 (14,991) 2024 (14,991)
Thereafter (38,615)
Total (113,570)$
Discount Rate The discount rate used to measure the total OPEB liability was 3.87% at the June 30, 2018 measurement date. As defined by Paragraph 155 of GASB #75, the discount rate used was the 20-year tax-exempt municipal bond (rating AA/Aa or higher) rate (“Municipal Bond Index Rate”). The Municipal Bond Index Rate used for this purpose is the June average of the Bond Buyer General Obligation 20-year Municipal Bond Index published weekly by The Bond Buyer (www.bondbuyer.com). On the prior measurement date, the Municipal Bond Index Rate was 3.56%.
Sensitivity of the Total OPEB Liability to Changes in the Discount Rate
The following table presents the sensitivity of the City’s total OPEB liability to changes in the discount rate, calculated using the discount rate of 3.87%, as well as what it would be if it were calculated using a discount rate that is 1% point lower (2.87%) or 1% point higher (4.87%) than the current rate:
1% Decrease Current Discount Rate 1% Increase(2.87%) (3.87%) (4.87%)
Total OPEB Liability 1,521,047$ 1,345,531 1,192,580$
77

CITY OF ANDERSON, SOUTH CAROLINA NOTES TO THE FINANCIAL STATEMENTS YEAR ENDED JUNE 30, 2019
IV. OTHER INFORMATION (CONTINUED)
C. Other Postemployment Benefit Plan (Continued) Sensitivity of the Total OPEB Liability to Changes in the Healthcare Cost Trend Rate The following table presents the sensitivity of the City’s total OPEB liability to changes in the healthcare cost trend rate, calculated using the healthcare cost trend rate of 7.50% decreasing to 5.00%, as well as what it would be if it were calculated using a healthcare cost trend rate that is 1% point lower (6.50% decreasing to 4.00%) or 1% point higher (8.50% decreasing to 6.00%) than the current rate:
1% Decrease 1% Increase(6.50% decreasing to
4.00%)(7.50% decreasing to
5.00%)(8.50% decreasing to
6.00%)
Total OPEB Liability 1,150,465$ 1,345,531 1,586,100$
Current Healthcare Cost Trend Rate
D. Contingent Liabilities and Commitments
Litigation
The City is periodically the subject of litigation by a variety of plaintiffs. The City’s management believes that such amounts claimed by these plaintiffs, net of the applicable insurance coverage, are immaterial. Grants
The City receives financial assistance from various federal, state, and local governmental agencies in the form of grants. Disbursements of funds received under these programs generally require compliance with the terms and conditions specified in the grant agreements. The disbursements are also subject to audit by the grantor agencies. Any disallowed claims resulting from such audits could become a liability of the General Fund, Community Development Fund, or other applicable funds. However, in the opinion of management, any such disallowed claims will not have a material effect on any of the financial statements included herein or on the overall financial position of the City at June 30, 2019. Consent Order – Sewer
The United States Environmental Protection Agency (“EPA”) and the City entered into an Administrative Order on Consent (“Consent Order”) in May 2014 and paid a fine of approximately $45,000 for the discharge of untreated wastewater containing pollutants to the navigable waters at locations not authorized by the National Pollutant Discharge Elimination System permit. In the Consent Order, the City agreed to develop a Management, Operation, and Maintenance (“MOM”) program over the next couple of years in accordance with established guidelines that will eliminate the sanitary sewer overflows cited in the EPA’s visit. The City is currently implementing its MOM program and does not expect that the Consent Order will have a significant financial impact to the City’s Sewer Fund.
Water Agreement
The City joined the Anderson County Joint Municipal Water System ("System") in 2002 and entered into a water sale and purchase agreement with the System. The agreement provides for the following:
Allocates a percentage of the water treatment plant's total capacity to each member with the member agreeing to pay the System's debt service monthly based on its respective percentage of plant capacity together with certain operating expenses proportionate to its percentage of plant capacity. The City's proportion of plant capacity is 32.7% or 10.46 Million gallons per day (“MGD”) of the total plant capacity of 32 MGD.
78

CITY OF ANDERSON, SOUTH CAROLINA NOTES TO THE FINANCIAL STATEMENTS YEAR ENDED JUNE 30, 2019
IV. OTHER INFORMATION (CONTINUED)
D. Contingent Liabilities and Commitments (Continued) Water Agreement (Continued)
The cost of future capital improvements not increasing the system's capacity will be shared by the members according to their respective percentage of plant capacity.
All amounts paid by the members not required to fund debt service will be deposited into a Facilities Renewal and Replacement Fund. Any surplus existing in this fund at year-end will be paid to members based on their respective percentage of plant capacity.
The members of the System also entered into an operating agreement dated April 17, 2002. This agreement provides for the System to sell water to the City on a wholesale basis using existing water transmission mains with each owner agreeing to pay all costs in maintaining their own water transmission mains. The agreement is for 99 years or until additional transmission mains are constructed that enable all of the System's wholesale customers to receive water without utilizing the City's transmission mains, water tanks, and booster station. The City has paid the System approximately $3,071,000 for purchased water including monthly operation and maintenance and capital charges during fiscal year 2019.
In 2005, the members of the system approved the first amendment to the water sale and purchase agreement. This amendment provided for a 13 MGD treatment plant expansion to meet the present and future water needs of the member agencies. The City’s portion of this expansion is 28.15% or 3.66 MGD. Currently, the City owns 31.4% or 14.12 MGD of the total 45 MGD treatment capacity.
Following the plant expansion in July 2009, the plant received a filter re-rating that increased the overall allowed treatment capacity to 48 MGD. The System retained the additional 3 MGD as reserve capacity. In the third quarter of fiscal year 2011, the System board approved the construction contracts for approximately $8,000,000 that were to be paid for the by the benefitting parties. The construction costs combined with planning and engineering fees total $8,491,427. Final project funding was composed of a $7.850 million SRF loan with the balance paid using System pay as you go (“PAYGO”) funding. The City’s portion of the SRF loan principal is approximately $2,465,000 or 31.4%.
After several years of experiencing taste and odor problems in the water, the System determined that the best way to address the problem was with advanced oxidation processes (“Ozone Project”). The construction cost for the Ozone Project combined with planning and engineering fees was expected to be approximately $13,500,000 and was funded by an SRF loan. During the year ended June 30, 2018, the System completed and placed into service the Ozone Project. The total outstanding SRF loan balance is approximately $12,273,000 at June 30, 2019. The City’s portion of the SRF loan balance at June 30, 2019 is estimated to be approximately $3,854,000. Economic Incentive and Infrastructure Reimbursement Commitments In November 2017, the City entered into an agreement with Tetra Investment, LLC (“Tetra”) related to the development of a commercial property that is qualified under the City’s Infrastructure Reimbursement Program. Related to the significant investment by Tetra, the City has agreed to provide total reimbursements of $814,000 that will be paid in annual installments for ten years or until the reimbursement is complete, whichever comes first, as long as certain terms and conditions are met as noted in the agreement. As of June 30, 2019, all of these terms and conditions were not met so the first payment was not made by the City. However, the City expects for all the terms and conditions to be met in future years and that all reimbursement payments will be made. In May 2018, the City entered into an agreement with JB Ferguson Properties, LLC (“Ferguson”), related to the complete renovation of a building in the downtown for a mixed-use development, that qualified under the City’s Economic Development Incentive Program. Related to this significant investment by Ferguson, the City has agreed to provide a total grant of $250,000 that will be paid in five annual installments beginning on January 15, 2019 at $50,000 per year as long as certain terms and conditions are met as noted in the agreement. As of June 30, 2019, approximately $6,000 has been paid to Ferguson and the remaining amount to be paid is approximately $244,000.
79

CITY OF ANDERSON, SOUTH CAROLINA NOTES TO THE FINANCIAL STATEMENTS YEAR ENDED JUNE 30, 2019
IV. OTHER INFORMATION (CONTINUED)
D. Contingent Liabilities and Commitments (Continued)
Economic Incentive and Infrastructure Reimbursement Commitments (Continued) In July 2018, the City approved a three-year contract with NuStrat Analytics for revenue collection consulting related to business licenses. The fee for these services is 38% of any and all fees, penalties, and or taxes collected by the agency related to their efforts. As of June 30, 2019, approximately $211,000 was paid to NuStrat Analytics for their services. In September 2018, the City entered into an agreement with Main at Market, LLC (“Main”) related to the construction of a hotel building downtown. Related to this significant agreement with Main, the City has agreed to reimburse $1,500,000 for costs relating to this infrastructure. The City will reimburse Main in four installments of $375,000 (based on various benchmarks that must be achieved). As of June 30, 2019, none of these terms or conditions were met, so the first payment was not made by the City. However, the City does expect these terms and conditions to be met in future years and that all payments will be made. In November 2018, the City entered into an agreement with LabTech Diagnostics (“Developer”) related to the development of a commercial property that is qualified under the City’s Economic Development Incentive Program. Related to this significant investment by the Developer, the City has agreed to provide a total grant of $345,000 that will be paid in five installments of $69,000 beginning on June 15, 2019, and four annual payments thereafter beginning January 15, 2020 as long as certain terms and conditions are met as noted in the agreement. As of June 30, 2019, none of these terms or conditions were met, so the first payment was not made by the City. However, the City does expect these terms and conditions to be met in future years and that all payments will be made. In November 2018, the City entered into multiple agreements with American Tank Maintenance (“ATM”) for water tank maintenance and asset management. The City agreed to a total cost of $2,138,000 over the next 10 years. As of June 30, 2019, approximately $192,000 has been paid to ATM for water tank maintenance.
E. Cost Recovery
The City adopted an indirect cost recovery policy of charging the Community Development Fund and Transit Fund for specialized services provided by the General Fund. The cost recovery charge to the Community Development Fund and Transit Fund was based on the indirect cost method which uses a ratio to allocate available costs. These charges are reported as expenditures or expenses in the funds making the payment, and reported as revenue in the General Fund.
F. Deficit Balance in Non-Major Fund
The Special Revenue – Community Development Fund had a deficit fund balance of approximately $95,000 at June 30, 2019. The City will receive proceeds from grants and program income to make up this deficit.
G. Subsequent Events
In July 2019, the City entered into a three-year contract with Cartegraph Systems, LLC for the implementation of campus technology and supporting services for a total amount of approximately $191,000 to be paid over the course of the next three years.
In July 2019, the City entered into an agreement to purchase several police department vehicles and emergency equipment for the new vehicles for a total amount of approximately $258,000. In August 2019, the City entered into an agreement to purchase of a compressed natural gas (“CNG”) bus for a total amount of approximately $490,000. The CNG bus is expected to be received in FY 2020.
80

CITY OF ANDERSON, SOUTH CAROLINA NOTES TO THE FINANCIAL STATEMENTS YEAR ENDED JUNE 30, 2019
IV. OTHER INFORMATION (CONTINUED)
G. Subsequent Events (Continued) In September 2019, the City approved a resolution authorizing the City to reimburse certain General Fund expenditures made prior to the issuance of bonds not exceeding $5,500,000 for the new parking facility. The City expects to issue the bonds during the winter of FY 2020. In September 2019, the City approved a resolution authorizing the City to reimburse certain expenditures made by the Hospitality Fee Fund made prior to the issuance of Special Obligation Bonds not exceeding $8,500,000 for the Recreation Center project and Whitner Creek Greenway project. The City expects to issue the bonds during the spring of FY 2020. In September 2019, the City approved a contract with C. E. Bourne & Co., Inc. for the City Hall and Municipal Business Center repairs and renovations at a guaranteed maximum price of approximately $4,201,000. In October 2019, the City entered into an agreement with McDuffie Parking, LLC for the development of a new parking facility. The City agrees to reimburse the developer through an Installment Purchase Revenue Bond in the amount of up to $5,500,000 for costs associated with this new parking facility. In November 2019, the City entered into a lease purchase agreement in the amount of $855,000 to cover the cost of vehicle and equipment purchases for the Public Works department. This lease is payable in five annual principal payments ranging from $165,000 to $177,000 starting in November 2020, plus interest at 1.78%.
81

This page is intentionally left blank
82
Required Supplementary Information
83

This page is intentionally left blank
84

THE GENERAL FUND
The General Fund is used to account for revenues traditionally associated with government which are not legally required to be accounted for in another fund.
85

This page is intentionally left blank
86
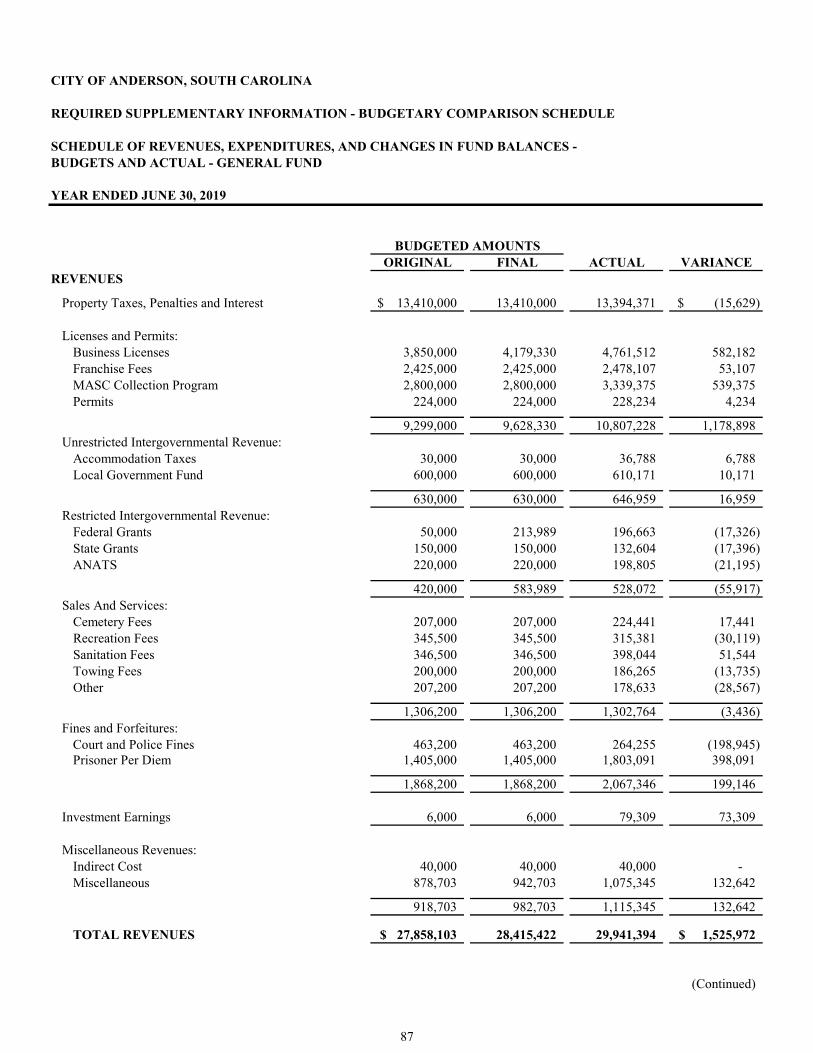
CITY OF ANDERSON, SOUTH CAROLINA
REQUIRED SUPPLEMENTARY INFORMATION - BUDGETARY COMPARISON SCHEDULE
SCHEDULE OF REVENUES, EXPENDITURES, AND CHANGES IN FUND BALANCES -BUDGETS AND ACTUAL - GENERAL FUND
YEAR ENDED JUNE 30, 2019
ORIGINAL FINAL ACTUAL VARIANCEREVENUES
Property Taxes, Penalties and Interest 13,410,000$ 13,410,000 13,394,371 (15,629)$
Licenses and Permits:Business Licenses 3,850,000 4,179,330 4,761,512 582,182 Franchise Fees 2,425,000 2,425,000 2,478,107 53,107 MASC Collection Program 2,800,000 2,800,000 3,339,375 539,375 Permits 224,000 224,000 228,234 4,234
9,299,000 9,628,330 10,807,228 1,178,898 Unrestricted Intergovernmental Revenue:
Accommodation Taxes 30,000 30,000 36,788 6,788 Local Government Fund 600,000 600,000 610,171 10,171
630,000 630,000 646,959 16,959 Restricted Intergovernmental Revenue:
Federal Grants 50,000 213,989 196,663 (17,326) State Grants 150,000 150,000 132,604 (17,396) ANATS 220,000 220,000 198,805 (21,195)
420,000 583,989 528,072 (55,917) Sales And Services:
Cemetery Fees 207,000 207,000 224,441 17,441 Recreation Fees 345,500 345,500 315,381 (30,119) Sanitation Fees 346,500 346,500 398,044 51,544 Towing Fees 200,000 200,000 186,265 (13,735) Other 207,200 207,200 178,633 (28,567)
1,306,200 1,306,200 1,302,764 (3,436) Fines and Forfeitures:
Court and Police Fines 463,200 463,200 264,255 (198,945) Prisoner Per Diem 1,405,000 1,405,000 1,803,091 398,091
1,868,200 1,868,200 2,067,346 199,146
Investment Earnings 6,000 6,000 79,309 73,309
Miscellaneous Revenues:Indirect Cost 40,000 40,000 40,000 - Miscellaneous 878,703 942,703 1,075,345 132,642
918,703 982,703 1,115,345 132,642
TOTAL REVENUES 27,858,103$ 28,415,422 29,941,394 1,525,972$
(Continued)
BUDGETED AMOUNTS
87
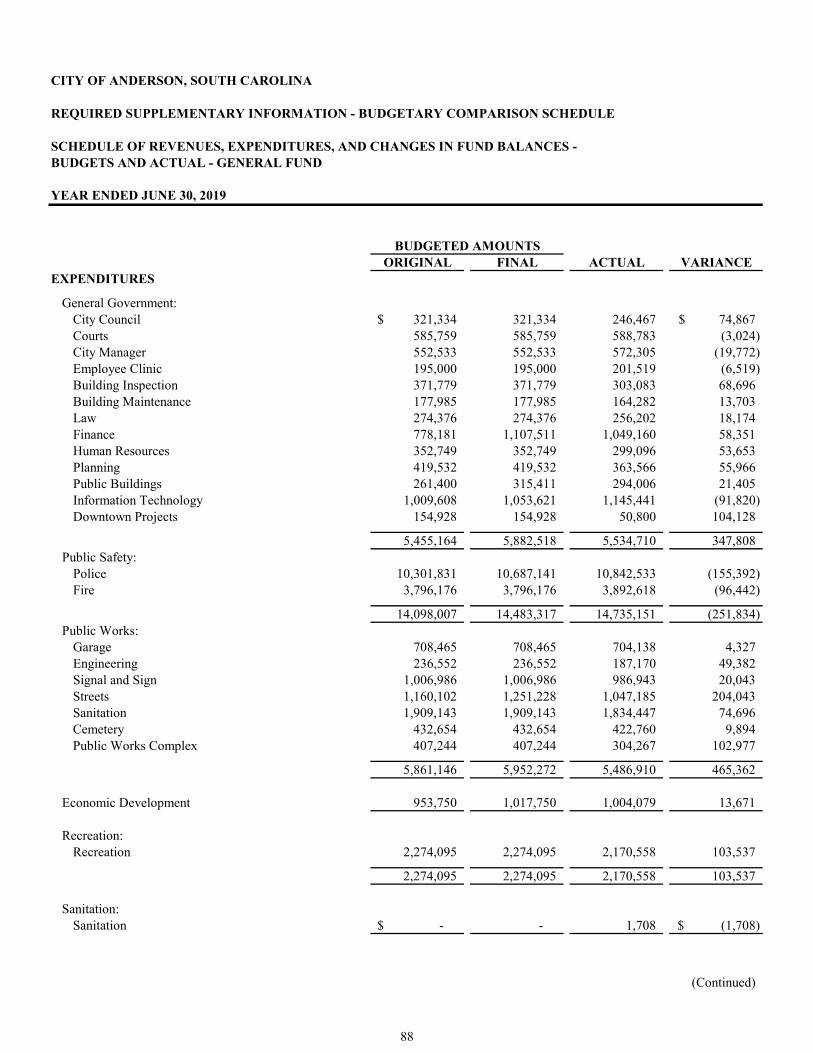
CITY OF ANDERSON, SOUTH CAROLINA
REQUIRED SUPPLEMENTARY INFORMATION - BUDGETARY COMPARISON SCHEDULE
SCHEDULE OF REVENUES, EXPENDITURES, AND CHANGES IN FUND BALANCES -BUDGETS AND ACTUAL - GENERAL FUND
YEAR ENDED JUNE 30, 2019
ORIGINAL FINAL ACTUAL VARIANCEBUDGETED AMOUNTS
EXPENDITURES
General Government:City Council 321,334$ 321,334 246,467 74,867$ Courts 585,759 585,759 588,783 (3,024) City Manager 552,533 552,533 572,305 (19,772) Employee Clinic 195,000 195,000 201,519 (6,519) Building Inspection 371,779 371,779 303,083 68,696 Building Maintenance 177,985 177,985 164,282 13,703 Law 274,376 274,376 256,202 18,174 Finance 778,181 1,107,511 1,049,160 58,351 Human Resources 352,749 352,749 299,096 53,653 Planning 419,532 419,532 363,566 55,966 Public Buildings 261,400 315,411 294,006 21,405 Information Technology 1,009,608 1,053,621 1,145,441 (91,820) Downtown Projects 154,928 154,928 50,800 104,128
5,455,164 5,882,518 5,534,710 347,808 Public Safety:
Police 10,301,831 10,687,141 10,842,533 (155,392) Fire 3,796,176 3,796,176 3,892,618 (96,442)
14,098,007 14,483,317 14,735,151 (251,834) Public Works:
Garage 708,465 708,465 704,138 4,327 Engineering 236,552 236,552 187,170 49,382 Signal and Sign 1,006,986 1,006,986 986,943 20,043 Streets 1,160,102 1,251,228 1,047,185 204,043 Sanitation 1,909,143 1,909,143 1,834,447 74,696 Cemetery 432,654 432,654 422,760 9,894 Public Works Complex 407,244 407,244 304,267 102,977
5,861,146 5,952,272 5,486,910 465,362
Economic Development 953,750 1,017,750 1,004,079 13,671
Recreation:Recreation 2,274,095 2,274,095 2,170,558 103,537
2,274,095 2,274,095 2,170,558 103,537
Sanitation:Sanitation -$ - 1,708 (1,708)$
(Continued)
88

CITY OF ANDERSON, SOUTH CAROLINA
REQUIRED SUPPLEMENTARY INFORMATION - BUDGETARY COMPARISON SCHEDULE
SCHEDULE OF REVENUES, EXPENDITURES, AND CHANGES IN FUND BALANCES -BUDGETS AND ACTUAL - GENERAL FUND
YEAR ENDED JUNE 30, 2019
ORIGINAL FINAL ACTUAL VARIANCEBUDGETED AMOUNTS
EXPENDITURES (CONTINUED)
Nondepartmental:Workers Compensation Insurance 330,000$ 330,000 369,598 (39,598)$ Other Insurance 758,000 758,000 792,629 (34,629) Christmas Bonus 65,000 65,000 62,700 2,300 Health Insurance Incentive - - 321 (321) Employee Benefits 13,000 13,000 58,843 (45,843) Miscellaneous 50,000 50,000 70,385 (20,385) Contingency Fund 47 47 - 47
1,216,047 1,216,047 1,354,476 (138,429)
Debt Service:Principal 1,242,509 1,242,509 1,229,012 13,497 Interest and Bank Fees 167,660 167,660 192,402 (24,742)
1,410,169 1,410,169 1,421,414 (11,245)
TOTAL EXPENDITURES 31,268,378 32,236,168 31,709,006 527,162
EXCESS (DEFICIENCY) OF REVENUES OVER (UNDER) EXPENDITURES (3,410,275) (3,820,746) (1,767,612) 2,053,134
OTHER FINANCING SOURCES (USES)
Sale of Capital Assets - - 217,800 217,800 Transfers In 3,219,258 3,219,258 2,981,471 (237,787) Transfers Out (2,782,836) (2,782,836) (300,286) 2,482,550
TOTAL OTHER FINANCING SOURCES (USES) 436,422 436,422 2,898,985 2,462,563
NET CHANGE IN FUND BALANCES (2,973,853) (3,384,324) 1,131,373 4,515,697
FUND BALANCES, BEGINNING OF YEAR 13,794,766 13,794,766 13,794,766 -
FUND BALANCES, END OF YEAR 10,820,913$ 10,410,442 14,926,139 4,515,697$
Note: The notes to the budgetary comparison schedule is an integral part of this schedule.Note: The City's original and final budget reflected an expected use of fund balance of approximately $2,974,000 and $3,384,000,respectively.
89

CITY OF ANDERSON, SOUTH CAROLINA NOTES TO BUDGETARY COMPARISON SCHEDULE YEAR ENDED JUNE 30, 2019 NOTE 1 – BASIS OF ACCOUNTING The General Fund budgetary comparison schedule has been presented on the modified accrual basis of accounting, which is consistent with accounting principles generally accepted in the United States of America. See Note II.A in the notes to the financial statements for more information on the City’s budgetary information.
90
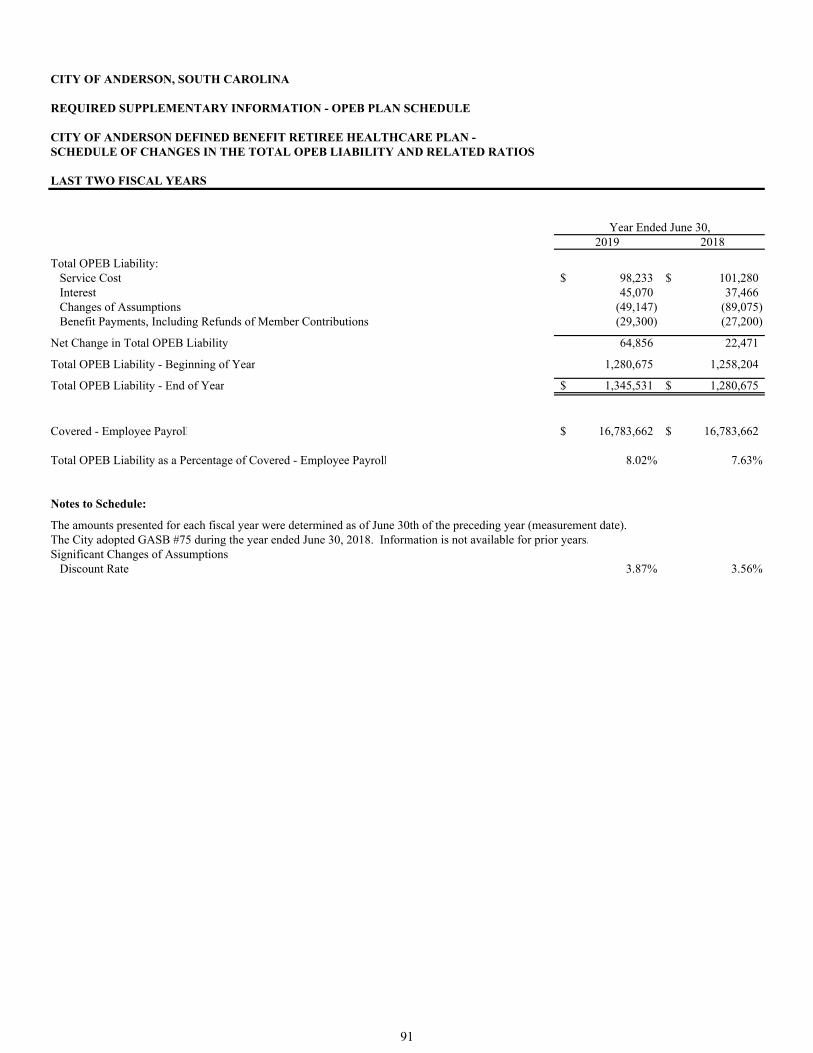
CITY OF ANDERSON, SOUTH CAROLINA
REQUIRED SUPPLEMENTARY INFORMATION - OPEB PLAN SCHEDULE
CITY OF ANDERSON DEFINED BENEFIT RETIREE HEALTHCARE PLAN -SCHEDULE OF CHANGES IN THE TOTAL OPEB LIABILITY AND RELATED RATIOS
LAST TWO FISCAL YEARS
2019 2018
Total OPEB Liability:Service Cost 98,233$ 101,280$ Interest 45,070 37,466 Changes of Assumptions (49,147) (89,075) Benefit Payments, Including Refunds of Member Contributions (29,300) (27,200)
Net Change in Total OPEB Liability 64,856 22,471
Total OPEB Liability - Beginning of Year 1,280,675 1,258,204
Total OPEB Liability - End of Year 1,345,531$ 1,280,675$
Covered - Employee Payroll 16,783,662$ 16,783,662$
Total OPEB Liability as a Percentage of Covered - Employee Payroll 8.02% 7.63%
Notes to Schedule:
The amounts presented for each fiscal year were determined as of June 30th of the preceding year (measurement date).The City adopted GASB #75 during the year ended June 30, 2018. Information is not available for prior years.Significant Changes of Assumptions
Discount Rate 3.87% 3.56%
Year Ended June 30,
91

CIT
Y O
F A
ND
ER
SO
N, S
OU
TH
CA
RO
LIN
A
RE
QU
IRE
D S
UP
PL
EM
EN
TA
RY
IN
FO
RM
AT
ION
- P
EN
SIO
N P
LA
N S
CH
ED
UL
ES
CIT
Y O
F A
ND
ER
SO
N G
EN
ER
AL
EM
PL
OY
EE
S' R
ET
IRE
ME
NT
PL
AN
-S
CH
ED
UL
E O
F C
HA
NG
ES
IN
TH
E N
ET
PE
NS
ION
LIA
BIL
ITY
AN
D R
EL
AT
ED
RA
TIO
S
LA
ST
TE
N F
ISC
AL
YE
AR
S
For
th
e Y
ear
En
ded
Dec
emb
er 3
1,20
1820
1720
1620
1520
1420
1320
1220
1120
1020
09
Tot
al P
ensi
on L
iabi
lity
:S
ervi
ce C
ost
588,
398
$
487,
888
455,
424
460,
758
447,
217
465,
572
452,
841
484,
560
554,
927
525,
087
$
Inte
rest
2,03
3,98
1
1,95
8,73
5
1,89
5,16
6
1,80
7,22
7
1,73
3,88
5
1,70
5,48
7
1,69
5,88
6
1,58
9,16
0
1,56
1,15
1
1,48
6,88
5
Ben
efit
Cha
nges
366,
088
-
-
-
-
-
-
-
-
-
D
iffe
renc
es B
etw
een
Exp
ecte
d an
d A
ctua
l Exp
erie
nce
(201
,124
)
831,
310
82,1
11
30
7,87
6
20
,524
(102
,349
)
(560
,415
)
(125
,893
)
(857
,978
)
(114
,572
)
Cha
nges
of
Ass
umpt
ions
-
-
-
-
-
-
-
-
-
-
Ben
efit
Pay
men
ts, I
nclu
ding
Ref
unds
of
Mem
ber
Con
trib
utio
ns(1
,863
,038
)
(1
,710
,481
)
(1
,524
,674
)
(1
,271
,356
)
(1
,203
,192
)
(1
,070
,124
)
(9
93,0
26)
(9
73,0
90)
(8
14,2
80)
(9
37,0
27)
Net
Cha
nge
in T
otal
Pen
sion
Lia
bili
ty92
4,30
5
1,
567,
452
90
8,02
7
1,
304,
505
99
8,43
4
99
8,58
6
59
5,28
6
97
4,73
7
44
3,82
0
96
0,37
3
Tot
al P
ensi
on L
iabi
lity
- B
egin
ning
of
Yea
r28
,051
,265
26,4
83,8
13
25
,575
,786
24,2
71,2
81
23
,272
,847
22,2
74,2
61
21
,678
,975
20,7
04,2
38
20
,260
,418
19,3
00,0
45
Tot
al P
ensi
on L
iabi
lity
- E
nd o
f Y
ear
28,9
75,5
70$
28
,051
,265
26,4
83,8
13
25
,575
,786
24,2
71,2
81
23
,272
,847
22,2
74,2
61
21
,678
,975
20,7
04,2
38
20
,260
,418
$
Pla
n F
iduc
iary
Net
Pos
itio
n:E
mpl
oyer
Con
trib
utio
n88
2,56
3$
79
3,31
5
64
3,60
2
66
1,15
7
65
2,39
2
69
5,12
4
67
0,67
2
66
3,26
1
70
2,63
2
72
0,56
3$
N
et I
nves
tmen
t Inc
ome
(1,2
08,8
21)
4,94
9,22
1
1,80
1,54
5
(105
,671
)
1,57
5,27
5
4,32
0,72
3
2,59
3,87
7
293,
539
2,25
2,25
4
3,71
9,32
7
Ben
efit
Pay
men
ts, I
nclu
ding
Ref
unds
of
Mem
ber
Con
trib
utio
ns(1
,863
,038
)
(1
,710
,481
)
(1
,524
,674
)
(1
,271
,356
)
(1
,203
,192
)
(1
,070
,124
)
(9
93,0
26)
(9
73,0
90)
(8
14,2
80)
(9
37,0
27)
A
dmin
istr
ativ
e E
xpen
ses
(78,
550)
(85,
202)
(81,
576)
(84,
166)
(85,
160)
(75,
215)
(76,
149)
(76,
203)
(70,
034)
(68,
030)
Oth
er
7,66
4
-
-
-
-
-
-
-
-
-
Net
Cha
nge
in P
lan
Fid
ucia
ry N
et P
osit
ion
(2,2
60,1
82)
3,94
6,85
3
838,
897
(800
,036
)
939,
315
3,87
0,50
8
2,19
5,37
4
(92,
493)
2,07
0,57
2
3,43
4,83
3
Pla
n F
iduc
iary
Net
Pos
itio
n -
Beg
inni
ng o
f Y
ear
32,4
88,7
70
28
,541
,917
27,7
03,0
20
28
,503
,056
27,5
63,7
41
23
,693
,233
21,4
97,8
59
21
,590
,352
19,5
19,7
80
16
,084
,947
Pla
n F
iduc
iary
Net
Pos
itio
n -
End
of
Yea
r30
,228
,588
$
32,4
88,7
70
28
,541
,917
27,7
03,0
20
28
,503
,056
27,5
63,7
41
23
,693
,233
21,4
97,8
59
21
,590
,352
19,5
19,7
80$
Net
Pen
sion
Lia
bili
ty (
Ass
et)
- E
nd o
f Y
ear
(1,2
53,0
18)
$
(4,4
37,5
05)
(2,0
58,1
04)
(2,1
27,2
34)
(4,2
31,7
75)
(4,2
90,8
94)
(1,4
18,9
72)
181,
116
(886
,114
)
740,
638
$
Pla
n F
iduc
iary
Net
Pos
itio
nas
a P
erce
ntag
e of
the
Tot
al P
ensi
on L
iabi
lity
104.
32%
115.
82%
107.
77%
108.
32%
117.
44%
118.
44%
106.
37%
99.1
6%10
4.28
%96
.34%
Cov
ered
Pay
roll
8,25
5,00
5$
7,45
3,84
0
6,91
4,34
2
6,58
2,74
1
6,73
3,04
9
6,48
0,08
4
6,64
0,84
3
6,43
7,91
0
6,83
7,93
4
7,69
5,94
1$
Net
Pen
sion
Lia
bili
ty a
s a
Per
cent
age
of C
over
ed P
ayro
ll-1
5.18
%-5
9.53
%-2
9.77
%-3
2.32
%-6
2.85
%-6
6.22
%-2
1.37
%2.
81%
-12.
96%
9.62
%
Not
es t
o S
ched
ule
:
Sig
nifi
cant
Ben
efit
Cha
nges
: A
d-ho
c C
OL
A G
rant
ed2.
00%
2.00
%2.
00%
2.25
%1.
50%
2.00
%2.
00%
Sig
nifi
cant
Cha
nges
of
Ass
umpt
ions
Non
eN
one
Non
eN
one
Non
eN
one
Non
eN
one
Non
eN
one
92

CIT
Y O
F A
ND
ER
SO
N, S
OU
TH
CA
RO
LIN
A
RE
QU
IRE
D S
UP
PL
EM
EN
TA
RY
IN
FO
RM
AT
ION
- P
EN
SIO
N P
LA
N S
CH
ED
UL
ES
CIT
Y O
F A
ND
ER
SO
N G
EN
ER
AL
EM
PL
OY
EE
S' R
ET
IRE
ME
NT
PL
AN
-S
CH
ED
UL
E O
F C
ON
TR
IBU
TIO
NS
LA
ST
TE
N F
ISC
AL
YE
AR
S
For
th
e Y
ear
En
ded
Ju
ne
30,
2018
2017
2016
2015
2014
2013
2012
2011
2010
2009
Act
uari
ally
Det
erm
ined
Con
trib
utio
n87
8,03
9$
35
5,10
7
31
8,18
3
18
7,74
0
17
0,38
5
37
4,02
5
46
4,52
6
42
7,39
1
60
2,71
0
73
2,51
3$
Con
trib
utio
ns in
Rel
atio
n to
the
Act
uari
ally
Det
erm
ined
Con
trib
utio
n:E
mpl
oyer
Con
trib
utio
n87
8,03
9
79
3,31
5
64
3,60
2
66
1,15
7
65
2,39
2
69
5,12
4
67
0,67
2
66
3,26
1
70
2,63
2
72
0,56
3
Tot
al C
ontr
ibut
ions
878,
039
793,
315
643,
602
661,
157
652,
392
695,
124
670,
672
663,
261
702,
632
720,
563
Con
trib
utio
n D
efic
ienc
y (E
xces
s)-
$
(438
,208
)
(325
,419
)
(473
,417
)
(482
,007
)
(321
,099
)
(206
,146
)
(235
,870
)
(99,
922)
11,9
50$
Cov
ered
Pay
rol l
8,39
9,46
8$
7,45
3,84
0
6,91
4,34
2
6,58
2,74
1
6,73
3,04
9
6,48
0,08
4
6,64
0,84
3
6,43
7,91
0
6,83
7,93
4
7,69
5,94
1$
Con
trib
utio
ns a
s a
Per
cent
age
of C
over
edP
ayro
ll10
.45%
10.6
4%9.
31%
10.0
4%9.
69%
10.7
3%10
.10%
10.3
0%10
.28%
9.36
%
Not
es t
o S
ched
ule
:
Val
uati
on D
ate:
Act
uari
ally
det
erm
ined
con
trib
utio
n ra
tes
are
calc
ulat
ed a
s of
Jan
uary
1st
eac
h ye
ar, a
t the
beg
inni
ng o
f th
e fi
scal
yea
r in
whi
ch c
ontr
ibut
ions
are
rep
orte
d.M
etho
ds a
nd A
ssum
ptio
ns U
sed
toD
eter
min
e C
ontr
ibut
ion
Rat
es:
Act
uari
al C
ost M
etho
dE
ntry
Age
Am
orti
zati
on M
etho
dL
evel
Per
cent
age
of P
ayro
ll, C
lose
d
R
emai
ning
Am
orti
zati
on P
erio
d30
Yea
rsA
sset
Val
uati
on M
etho
dM
arke
t Val
ueIn
flat
ion
2.0%
Sal
ary
Incr
ease
s3.
5%, A
vera
ge, I
nclu
ding
Inf
lati
onIn
vest
men
t Rat
e of
Ret
urn
7.5%
, Net
of
Pen
sion
Pla
n In
vest
men
t Exp
ense
s, I
nclu
ding
Inf
lati
onR
etir
emen
t Age
Pla
n N
orm
al R
etir
emen
t Dat
eM
orta
lity
1984
Uni
sex
Pen
sion
Mor
tali
ty T
able
(U
P-8
4)
Oth
er I
nfo
rmat
ion
:
Non
e
93
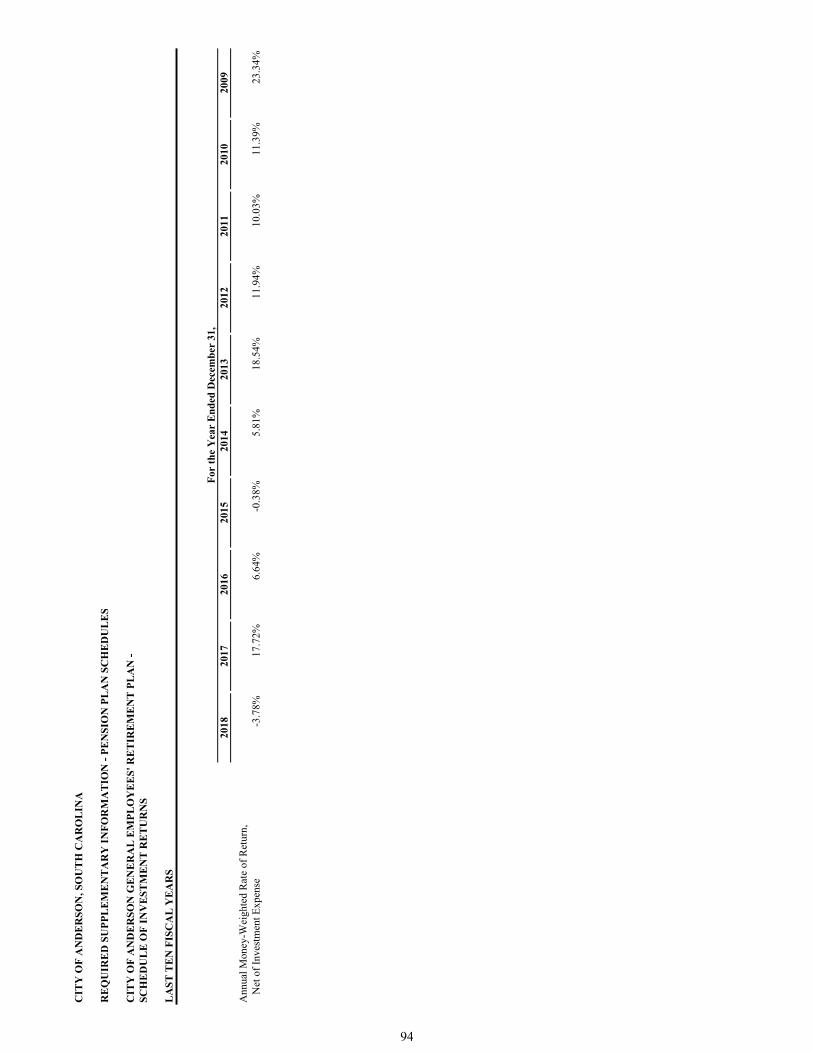
CIT
Y O
F A
ND
ER
SO
N, S
OU
TH
CA
RO
LIN
A
RE
QU
IRE
D S
UP
PL
EM
EN
TA
RY
IN
FO
RM
AT
ION
- P
EN
SIO
N P
LA
N S
CH
ED
UL
ES
CIT
Y O
F A
ND
ER
SO
N G
EN
ER
AL
EM
PL
OY
EE
S' R
ET
IRE
ME
NT
PL
AN
-S
CH
ED
UL
E O
F I
NV
ES
TM
EN
T R
ET
UR
NS
LA
ST
TE
N F
ISC
AL
YE
AR
S
For
th
e Y
ear
En
ded
Dec
emb
er 3
1,20
1820
1720
1620
1520
1420
1320
1220
1120
1020
09
Ann
ual M
oney
-Wei
ghte
d R
ate
of R
etur
n,N
et o
f In
vest
men
t Exp
ens e
-3.7
8%17
.72%
6.64
%-0
.38%
5.81
%18
.54%
11.9
4%10
.03%
11.3
9%23
.34%
94

CIT
Y O
F A
ND
ER
SO
N, S
OU
TH
CA
RO
LIN
A
RE
QU
IRE
D S
UP
PL
EM
EN
TA
RY
IN
FO
RM
AT
ION
- P
EN
SIO
N P
LA
N S
CH
ED
UL
ES
SC
HE
DU
LE
OF
TH
E C
ITY
OF
AN
DE
RS
ON
'S P
RO
PO
RT
ION
AT
E S
HA
RE
OF
TH
E N
ET
PE
NS
ION
LIA
BIL
ITY
SO
UT
H C
AR
OL
INA
PO
LIC
E O
FF
ICE
RS
RE
TIR
EM
EN
T S
YS
TE
M
LA
ST
SIX
FIS
CA
L Y
EA
RS
2019
2018
2017
2016
2015
2014
Cit
y of
And
erso
n's
Pro
port
ion
of th
e N
et P
ensi
on L
iabi
lity
(A
sset
)0.
5453
7%0.
5210
4%0.
4992
7%0.
5097
6%0.
5063
2%0.
5063
2%
Cit
y of
And
erso
n's
Pro
port
iona
te S
hare
of
the
Net
Pen
sion
Lia
bili
ty (
Ass
et)
15,4
53,2
36$
14,2
74,2
63
12,6
63,7
81
11,1
10,2
23
9,69
3,05
2
10,4
95,7
91$
Cit
y of
And
erso
n's
Cov
ered
Pay
roll
7,72
8,67
1$
7,21
7,33
8
6,55
5,84
0
6,51
2,69
3
6,28
5,50
6
6,22
9,60
6$
Cit
y of
And
erso
n's
Pro
port
iona
te S
hare
of
the
Net
Pen
sion
Lia
bili
ty (
Ass
et)
as a
Per
cent
age
of it
s C
over
ed P
ayro
ll19
9.95
%19
7.78
%19
3.17
%17
0.59
%15
4.21
%16
8.48
%
Pla
n F
iduc
iary
Net
Pos
itio
n as
a P
erce
ntag
e of
the
Tot
al P
ensi
on L
iabi
lity
61.7
3%60
.94%
60.4
4%64
.57%
67.5
5%62
.98%
Not
es t
o S
ched
ule
:
The
am
ount
s pr
esen
ted
for
each
fis
cal y
ear
wer
e de
term
ined
as
of J
une
30th
of
the
prec
edin
g ye
ar.
The
Cit
y im
plem
ente
d G
AS
B #
68 d
urin
g th
e ye
ar e
nded
Jun
e 30
, 201
5. I
nfor
mat
ion
befo
re th
e ye
ar e
nded
Jun
e 30
, 201
4 is
not
rea
dily
ava
ilab
le.
The
dis
coun
t rat
e w
as lo
wer
ed f
rom
7.5
0% to
7.2
5% b
egin
ning
wit
h th
e ye
ar e
nded
Jun
e 30
, 201
7 m
easu
rem
ent d
ate.
Yea
r E
nd
ed J
un
e 30
,
95
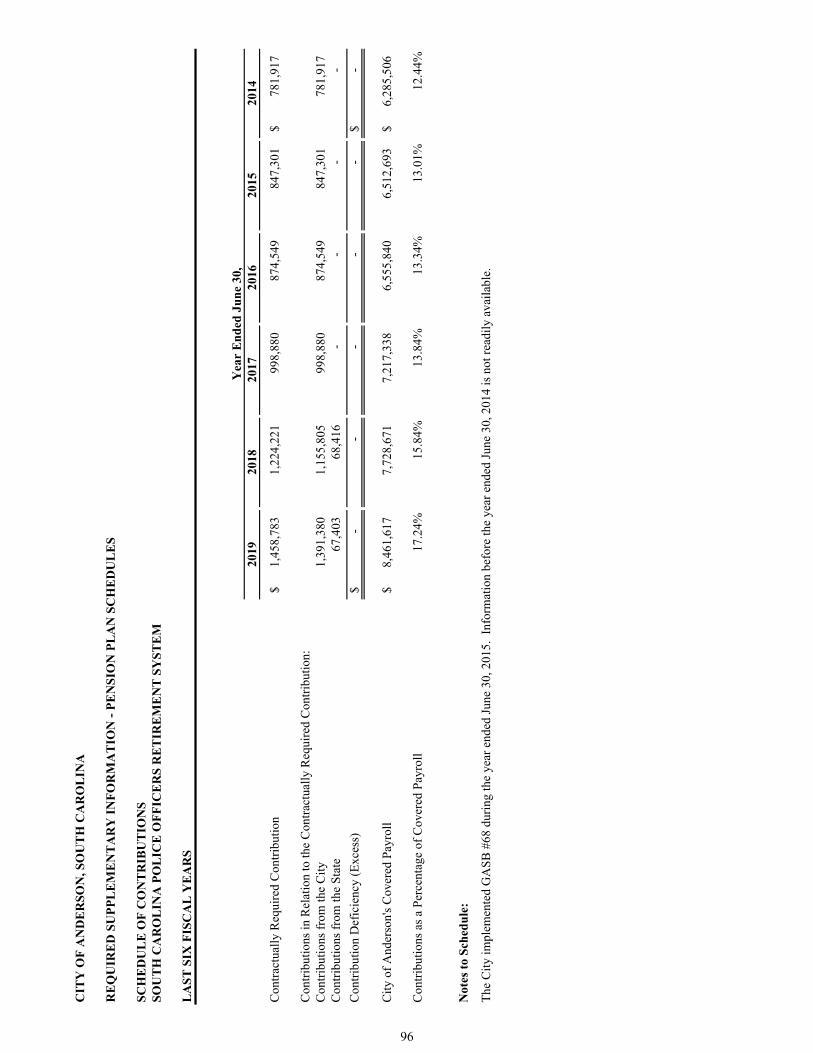
CIT
Y O
F A
ND
ER
SO
N, S
OU
TH
CA
RO
LIN
A
RE
QU
IRE
D S
UP
PL
EM
EN
TA
RY
IN
FO
RM
AT
ION
- P
EN
SIO
N P
LA
N S
CH
ED
UL
ES
SC
HE
DU
LE
OF
CO
NT
RIB
UT
ION
SS
OU
TH
CA
RO
LIN
A P
OL
ICE
OF
FIC
ER
S R
ET
IRE
ME
NT
SY
ST
EM
LA
ST
SIX
FIS
CA
L Y
EA
RS
Yea
r E
nd
ed J
un
e 30
,20
1920
1820
1720
1620
1520
14
Con
trac
tual
ly R
equi
red
Con
trib
utio
n1,
458,
783
$
1,
224,
221
99
8,88
0
87
4,54
9
84
7,30
1
78
1,91
7$
Con
trib
utio
ns in
Rel
atio
n to
the
Con
trac
tual
ly R
equi
red
Con
trib
utio
n:C
ontr
ibut
ions
fro
m th
e C
ity
1,39
1,38
0
1,15
5,80
5
998,
880
874,
549
847,
301
781,
917
Con
trib
utio
ns f
rom
the
Sta
te67
,403
68
,416
-
-
-
-
Con
trib
utio
n D
efic
ienc
y (E
xces
s)-
$
-
-
-
-
-
$
Cit
y of
And
erso
n's
Cov
ered
Pay
roll
8,46
1,61
7$
7,72
8,67
1
7,21
7,33
8
6,55
5,84
0
6,51
2,69
3
6,28
5,50
6$
Con
trib
utio
ns a
s a
Per
cent
age
of C
over
ed P
ayro
ll17
.24%
15.8
4%13
.84%
13.3
4%13
.01%
12.4
4%
Not
es t
o S
ched
ule
:
The
Cit
y im
plem
ente
d G
AS
B #
68 d
urin
g th
e ye
ar e
nded
Jun
e 30
, 201
5. I
nfor
mat
ion
befo
re th
e ye
ar e
nded
Jun
e 30
, 201
4 is
not
rea
dily
ava
ilab
le.
96

Supplementary Information
97

CITY OF ANDERSON, SOUTH CAROLINA
COMBINING BALANCE SHEET - NONMAJOR GOVERNMENTAL FUNDS
JUNE 30, 2019
COMMUNITY DEVELOPMENT
FUNDPERPETUAL CARE FUND
ASSETS
Cash and Cash Equivalents -$ - Cash and Cash Equivalents, Restricted 232,489 400,613 Investments, Restricted - 282,547 Receivables, Net
Interest - 1,681 Accounts - - Other 164,517 -
Due from Other Funds - 8,173 Prepaids and Inventories 1,887 - Land Held for Sale/Redevelopment 94,000 -
TOTAL ASSETS 492,893$ 693,014
LIABILITIES AND FUND BALANCES
LIABILITIES
Accounts Payable 1,934$ 6 Other Accrued Liabilities 27 - Due to Other Funds 586,273 3,371
TOTAL LIABILITIES 588,234 3,377
FUND BALANCES
Nonspendable:Permanent Fund Principal - -
Restricted For:Perpetual Care - 689,637 Tourism Related Expenditures - - Community Development - - Transit Expenditures - -
Assigned For:Capital Projects - -
Unassigned (95,341) -
TOTAL FUND BALANCES (95,341) 689,637
TOTAL LIABILITIES AND FUND BALANCES 492,893$ 693,014
SPECIAL REVENUE FUNDS
98

PERMANENT FUND
ACCOMMODATIONS TAX FUND
HOSPITALITY FEE FUND
CAPITAL REPLACEMENT
FUNDTRANSPORTATION INVESTMENT FUND
TOTAL OTHER GOVERNMENTAL
FUNDS
- - 5,180 - 5,180$ 696,038 3,417,700 - 589,824 5,336,664
- - - 1,867,799 2,150,346
- - - 3,112 4,793 175,885 267,771 - - 443,656
- - - - 164,517 - - 76,958 - 85,131 - - - - 1,887 - - - - 94,000
871,923 3,685,471 82,138 2,460,735 8,286,174$
77,952 7,633 37,059 8 124,592$ - 14 - - 41 - - - 67,515 657,159
77,952 7,647 37,059 67,523 781,792
- - - 2,250,000 2,250,000
- - - - 689,637 793,971 3,677,824 - - 4,471,795
- - - - - - - - 143,212 143,212
- - 45,079 - 45,079 - - - - (95,341)
793,971 3,677,824 45,079 2,393,212 7,504,382
871,923 3,685,471 82,138 2,460,735 8,286,174$
CAPITAL PROJECTS FUNDSPECIAL REVENUE FUNDS
99
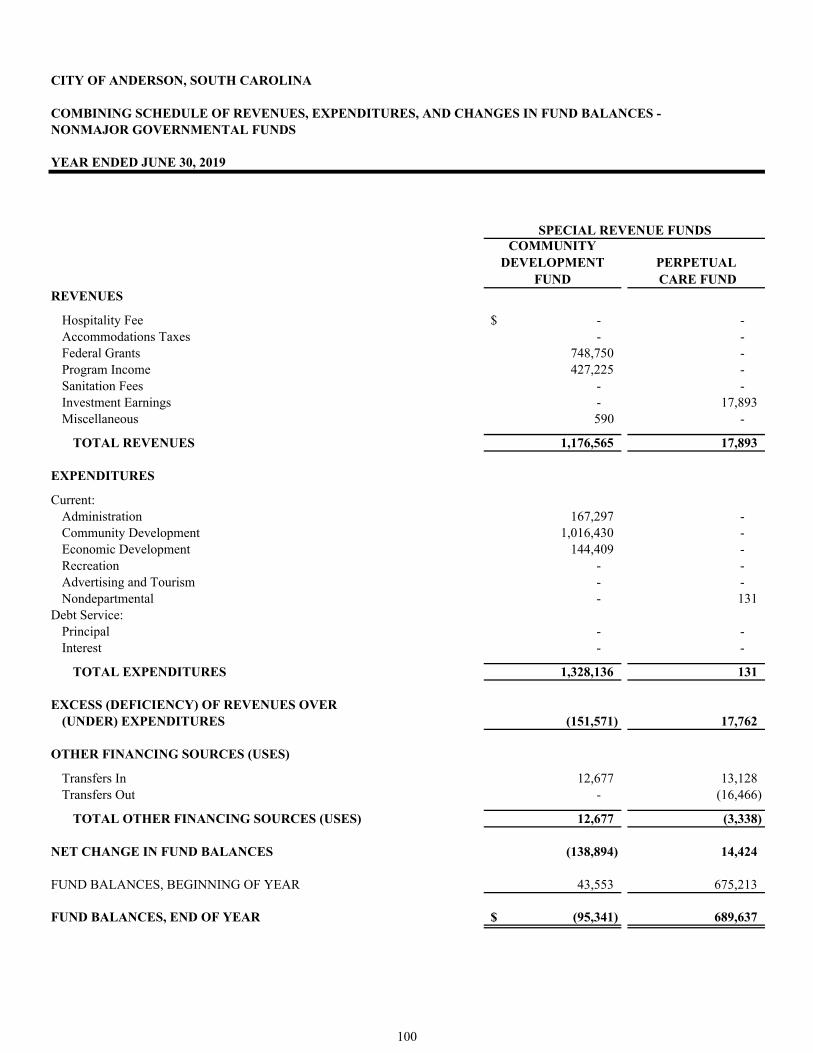
COMBINING SCHEDULE OF REVENUES, EXPENDITURES, AND CHANGES IN FUND BALANCES -
YEAR ENDED JUNE 30, 2019
COMMUNITY DEVELOPMENT
FUNDPERPETUAL CARE FUND
REVENUES
Hospitality Fee -$ - Accommodations Taxes - - Federal Grants 748,750 - Program Income 427,225 - Sanitation Fees - - Investment Earnings - 17,893 Miscellaneous 590 -
TOTAL REVENUES 1,176,565 17,893
EXPENDITURES
Current:Administration 167,297 - Community Development 1,016,430 - Economic Development 144,409 - Recreation - - Advertising and Tourism - - Nondepartmental - 131
Debt Service:Principal - - Interest - -
TOTAL EXPENDITURES 1,328,136 131
EXCESS (DEFICIENCY) OF REVENUES OVER (UNDER) EXPENDITURES (151,571) 17,762
OTHER FINANCING SOURCES (USES)
Transfers In 12,677 13,128 Transfers Out - (16,466)
TOTAL OTHER FINANCING SOURCES (USES) 12,677 (3,338)
NET CHANGE IN FUND BALANCES (138,894) 14,424
FUND BALANCES, BEGINNING OF YEAR 43,553 675,213
FUND BALANCES, END OF YEAR (95,341)$ 689,637
CITY OF ANDERSON, SOUTH CAROLINA
NONMAJOR GOVERNMENTAL FUNDS
SPECIAL REVENUE FUNDS
100

PERMANENT FUND
ACCOMMODATIONS TAX FUND
HOSPITALITY FEE FUND
CAPITAL REPLACEMENT
FUNDTRANSPORTATION INVESTMENT FUND
TOTAL OTHER GOVERNMENTAL
FUNDS
- 3,057,287 - - 3,057,287$ 327,627 - - - 327,627
- - - - 748,750 - - - - 427,225 - - 636,270 - 636,270 366 7,113 - 140,832 166,204 - - - - 590
327,993 3,064,400 636,270 140,832 5,363,953
- - - - 167,297 - - - - 1,016,430 - - - - 144,409 - 448,961 - - 448,961
153,155 - - - 153,155 - - 369,215 140 369,486
- - 233,277 - 233,277 - - 7,146 - 7,146
153,155 448,961 609,638 140 2,540,161
174,838 2,615,439 26,632 140,692 2,823,792
- - 166,667 - 192,472 - (1,307,066) (150,000) (67,072) (1,540,604)
- (1,307,066) 16,667 (67,072) (1,348,132)
174,838 1,308,373 43,299 73,620 1,475,660
619,133 2,369,451 1,780 2,319,592 6,028,722
793,971 3,677,824 45,079 2,393,212 7,504,382$
SPECIAL REVENUE FUNDSCAPITAL PROJECTS
FUND
101

This page is intentionally left blank
102
SPECIAL REVENUE FUNDS
Special Revenue Funds are used to account for specific revenues that are legally restricted to expenditure for particular purposes. Community Development Fund – is used to account for federal grant monies received, Community Development Block Grants and HOME investment Partnership Program funds, that are legally restricted for the development of viable communities, decent housing and suitable living environments and expanded economic opportunities for persons of low or moderate incomes. Perpetual Care Fund – is used to account for sale of cemetery lots, continuous care and grave openings. The revenue is specifically restricted for these purposes. Accommodations Tax Fund – is used to account for Accommodations Tax Revenue in accordance with the Accommodations Tax Act that are legally restricted to advertising, promotion, and tourism-related expenditures. Hospitality Fee Fund – is used to account for Hospitality Fee revenue that is legally restricted to fund park facilities and capital expenditures to promote quality of life, tourism, recreation, cultural and historic structures.
103

This page is intentionally left blank
104

CITY OF ANDERSON, SOUTH CAROLINA
SUPPLEMENTARY INFORMATION - BUDGETARY COMPARISON SCHEDULE - COMMUNITY DEVELOPMENT FUND
SCHEDULE OF REVENUES, EXPENDITURES, AND CHANGES IN FUND BALANCES - BUDGETS AND ACTUAL
YEAR ENDED JUNE 30, 2019
ORIGINAL FINALBUDGET BUDGET ACTUAL VARIANCE
REVENUES
Federal Grants 686,277$ 686,277 748,750 62,473$ Program Income 402,056 402,056 427,225 25,169 Miscellaneous - - 590 590
TOTAL REVENUES 1,088,333 1,088,333 1,176,565 88,232
EXPENDITURES
Current:Administration 30,476 114,612 167,297 (52,685) Community Development 859,576 775,440 1,016,430 (240,990) Economic Development 28,176 28,176 144,409 (116,233)
Capital OutlayDebt Service:
Principal 170,105 170,105 - 170,105
TOTAL EXPENDITURES 1,088,333 1,088,333 1,328,136 (239,803)
EXCESS (DEFICIENCY) OF REVENUES OVER (UNDER) EXPENDITURES - - (151,571) (151,571)
OTHER FINANCING SOURCES (USES)
Transfers In - - 12,677 12,677
TOTAL OTHER FINANCING SOURCES (USES) - - 12,677 12,677
NET CHANGE IN FUND BALANCES - - (138,894) (138,894)
FUND BALANCES, BEGINNING OF YEAR 43,553 43,553 43,553 -
FUND BALANCES, END OF YEAR 43,553$ 43,553 (95,341) (138,894)$
105

CITY OF ANDERSON, SOUTH CAROLINA
SUPPLEMENTARY INFORMATION - BUDGETARY COMPARISON SCHEDULE - PERPETUAL CARE FUND
SCHEDULE OF REVENUES, EXPENDITURES, AND CHANGES IN FUND BALANCES - BUDGETS AND ACTUAL
YEAR ENDED JUNE 30, 2019
ORIGINAL FINALBUDGET BUDGET ACTUAL VARIANCE
REVENUES
Investment Earnings 25,000$ 25,000 17,893 (7,107)$
TOTAL REVENUES 25,000 25,000 17,893 (7,107)
EXPENDITURES
Current:Nondepartmental 100 100 131 (31)
TOTAL EXPENDITURES 100 100 131 (31)
EXCESS (DEFICIENCY) OF REVENUES OVER (UNDER) EXPENDITURES 24,900 24,900 17,762 (7,138)
OTHER FINANCING SOURCES (USES)
Transfers In 15,000 15,000 13,128 (1,872) Transfers Out (39,900) (39,900) (16,466) 23,434
TOTAL OTHER FINANCING SOURCES (USES) (24,900) (24,900) (3,338) 21,562
NET CHANGE IN FUND BALANCES - - 14,424 14,424
FUND BALANCES, BEGINNING OF YEAR 675,213 675,213 675,213 -
FUND BALANCES, END OF YEAR 675,213$ 675,213 689,637 14,424$
106

CITY OF ANDERSON, SOUTH CAROLINA
SUPPLEMENTARY INFORMATION - BUDGETARY COMPARISON SCHEDULE - ACCOMMODATIONS TAX FUND
SCHEDULE OF REVENUES, EXPENDITURES, AND CHANGES IN FUND BALANCES - BUDGETS AND ACTUAL
YEAR ENDED JUNE 30, 2019
ORIGINAL FINALBUDGET BUDGET ACTUAL VARIANCE
REVENUES
Accommodations Taxes 143,000$ 143,000 327,627 184,627$ Investment Earnings 2,000 2,000 366 (1,634)
TOTAL REVENUES 145,000 145,000 327,993 182,993
EXPENDITURES
Current:Advertising and Tourism 145,000 145,000 153,155 (8,155)
TOTAL EXPENDITURES 145,000 145,000 153,155 (8,155)
NET CHANGE IN FUND BALANCES - - 174,838 174,838
FUND BALANCES, BEGINNING OF YEAR 619,133 619,133 619,133 -
FUND BALANCES, END OF YEAR 619,133$ 619,133 793,971 174,838$
107
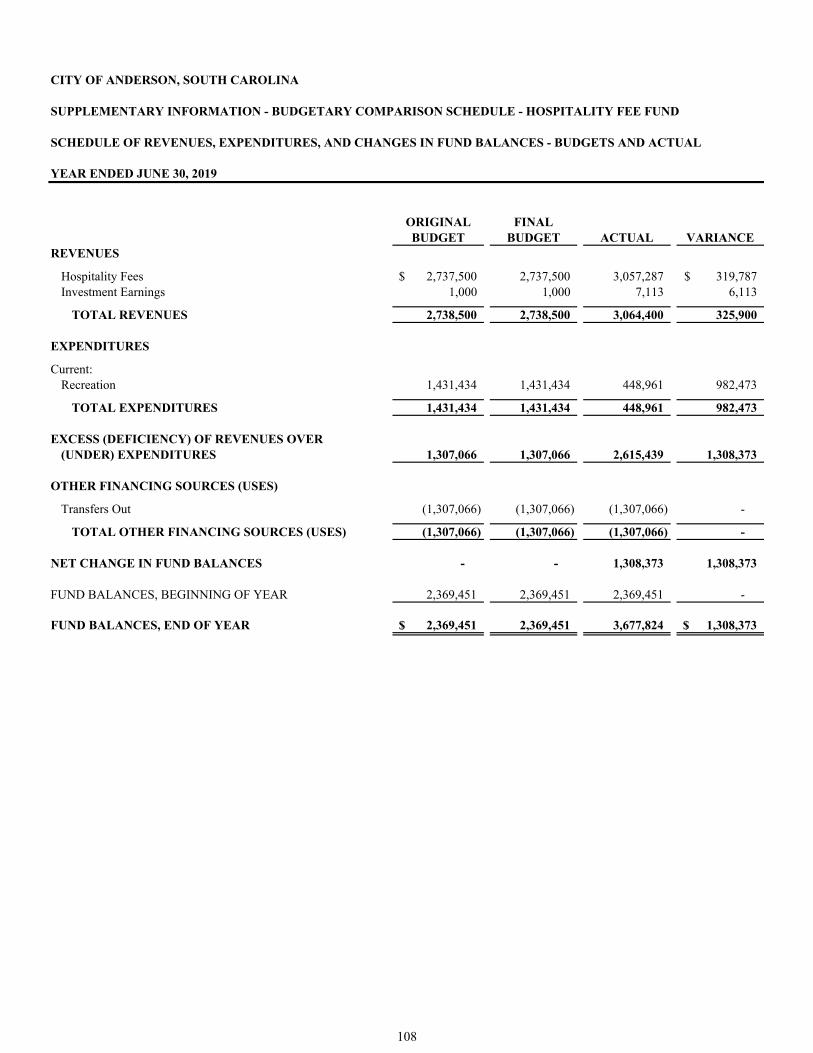
CITY OF ANDERSON, SOUTH CAROLINA
SUPPLEMENTARY INFORMATION - BUDGETARY COMPARISON SCHEDULE - HOSPITALITY FEE FUND
SCHEDULE OF REVENUES, EXPENDITURES, AND CHANGES IN FUND BALANCES - BUDGETS AND ACTUAL
YEAR ENDED JUNE 30, 2019
ORIGINAL FINALBUDGET BUDGET ACTUAL VARIANCE
REVENUES
Hospitality Fees 2,737,500$ 2,737,500 3,057,287 319,787$ Investment Earnings 1,000 1,000 7,113 6,113
TOTAL REVENUES 2,738,500 2,738,500 3,064,400 325,900
EXPENDITURES
Current:Recreation 1,431,434 1,431,434 448,961 982,473
TOTAL EXPENDITURES 1,431,434 1,431,434 448,961 982,473
EXCESS (DEFICIENCY) OF REVENUES OVER (UNDER) EXPENDITURES 1,307,066 1,307,066 2,615,439 1,308,373
OTHER FINANCING SOURCES (USES)
Transfers Out (1,307,066) (1,307,066) (1,307,066) -
TOTAL OTHER FINANCING SOURCES (USES) (1,307,066) (1,307,066) (1,307,066) -
NET CHANGE IN FUND BALANCES - - 1,308,373 1,308,373
FUND BALANCES, BEGINNING OF YEAR 2,369,451 2,369,451 2,369,451 -
FUND BALANCES, END OF YEAR 2,369,451$ 2,369,451 3,677,824 1,308,373$
108

CAPITAL PROJECT FUNDS
Capital Project funds are used to report resources that are restricted, committed, or assigned for the acquisition of capital assets or construction of major capital facilities for the City.
Capital Replacement Fund – is used to account for and report resources that are received from the City's sanitation fee or that are transferred from other funds to provide resources for future capital asset purchases. The sanitation fee funds are by ordinance committed for capital replacement purposes.
109

This page is intentionally left blank
110

CITY OF ANDERSON, SOUTH CAROLINA
SUPPLEMENTARY INFORMATION - BUDGETARY COMPARISON SCHEDULE - CAPITAL REPLACEMENT FUND
SCHEDULE OF REVENUES, EXPENDITURES, AND CHANGES IN FUND BALANCES - BUDGETS AND ACTUAL
YEAR ENDED JUNE 30, 2019
ORIGINAL FINALBUDGET BUDGET ACTUAL VARIANCE
REVENUES
Sanitation Fees 680,000$ 680,000 636,270 (43,730)$
TOTAL REVENUES 680,000 680,000 636,270 (43,730)
EXPENDITURES
Current:Nondepartmental 2,690,000 2,690,000 369,215 2,320,785
Debt Service:Principal 226,000 226,000 233,277 (7,277) Interest 14,000 14,000 7,146 6,854
TOTAL EXPENDITURES 2,930,000 2,930,000 609,638 2,320,362
EXCESS (DEFICIENCY) OF REVENUES OVER (UNDER) EXPENDITURES (2,250,000) (2,250,000) 26,632 2,276,632
OTHER FINANCING SOURCES (USES)
Transfers In 2,400,000 2,400,000 166,667 (2,233,333) Transfers Out (150,000) (150,000) (150,000) -
TOTAL OTHER FINANCING SOURCES (USES) 2,250,000 2,250,000 16,667 (2,233,333)
NET CHANGE IN FUND BALANCES - - 43,299 43,299
FUND BALANCES, BEGINNING OF YEAR 1,780 1,780 1,780 -
FUND BALANCES, END OF YEAR 1,780$ 1,780 45,079 43,299$
111

This page is intentionally left blank
112
PERMANENT FUNDS
Permanent funds are used to report resources that are legally restricted to the extent that only earnings, not principal, may be used for purposes that support the reporting government’s programs. Transportation Investment Fund – is used to account for a $2,250,000 contribution to the City from a local utility company to divest itself of transit operations. The original contribution and subsequent investment earnings are restricted by City Council as to amount and nature of allowable expenditures with a portion being available for transit operations and a portion being available for capital or debt expenditures of the General Fund.
113

This page is intentionally left blank
114

CITY OF ANDERSON, SOUTH CAROLINA
SUPPLEMENTARY INFORMATION - BUDGETARY COMPARISON SCHEDULE - TRANSPORTATION INVESTMENT FUND
SCHEDULE OF REVENUES, EXPENDITURES, AND CHANGES IN FUND BALANCES - BUDGETS AND ACTUAL
YEAR ENDED JUNE 30, 2019
ORIGINAL FINALBUDGET BUDGET ACTUAL VARIANCE
REVENUES
Investment Earnings 50,000$ 50,000 140,832 90,832$
TOTAL REVENUES 50,000 50,000 140,832 90,832
EXPENDITURES
Current:Nondepartmental - - 140 (140)
TOTAL EXPENDITURES - - 140 (140)
EXCESS (DEFICIENCY) OF REVENUES OVER (UNDER) EXPENDITURES 50,000 50,000 140,692 90,692
OTHER FINANCING SOURCES (USES)
Transfers Out (50,000) (50,000) (67,072) (17,072)
TOTAL OTHER FINANCING SOURCES (USES) (50,000) (50,000) (67,072) (17,072)
NET CHANGE IN FUND BALANCES - - 73,620 73,620
FUND BALANCES, BEGINNING OF YEAR 2,319,592 2,319,592 2,319,592 -
FUND BALANCES, END OF YEAR 2,319,592$ 2,319,592 2,393,212 73,620$
115

This page is intentionally left blank
116

PROPRIETARY FUNDS Proprietary funds are used to account for operations that are financed and operated in a manner similar to private business enterprises – where the intent on the government’s council is that the costs of providing goods or services to the general public on a continuing basis be financed or recovered primarily through user charges; or where the government’s council has decided that periodic determination of net income is appropriate for accountability purposes. The City has the following Proprietary Funds: Sewer Fund – is used to account for sewer operations of the City. The City operates two wastewater treatment facilities and provides sewer taps. Water Fund – is used to account for water operations of the City. The City owns the water mains and lines and provides water services for citizens of the City. Storm Water Fund – is used to account for the storm water drainage operations of the City. Transit Fund – is used to account for transit operations of the City. The City provides transit services for citizens of the City by maintaining four bus routes.
117

This page is intentionally left blank
118

CITY OF ANDERSON, SOUTH CAROLINA
SUPPLEMENTARY INFORMATION - BUDGETARY COMPARISON SCHEDULE - SEWER FUND
SCHEDULE OF REVENUES, EXPENSES, AND CHANGES IN FUND NET POSITION - BUDGETS AND ACTUAL
YEAR ENDED JUNE 30, 2019
ORIGINAL FINALBUDGET BUDGET ACTUAL VARIANCE
OPERATING REVENUES
Sewer Charges 9,217,545$ 9,217,545 9,383,985 166,440$ Cost Recovery Charges 3,302,617 3,302,617 2,704,570 (598,047) Pretreatment Fees 106,000 106,000 104,700 (1,300) Permits and Fees 75,000 75,000 85,600 10,600 Other Operating Fees 70,000 70,000 65,521 (4,479)
TOTAL OPERATING REVENUES 12,771,162 12,771,162 12,344,376 (426,786)
OPERATING EXPENSES
Administrative 919,464 919,464 743,800 175,664 Sewer Line 2,046,028 2,110,510 1,019,361 1,091,149 Plant 3,004,430 3,004,430 2,407,978 596,452 Sewer Lab 90,150 90,150 78,784 11,366 Pretreatment 124,887 124,887 140,661 (15,774)
Nondepartmental 837,686 837,686 339,326 498,360 Depreciation and Amortization - - 4,127,103 (4,127,103)
TOTAL OPERATING EXPENSES 7,022,645 7,087,127 8,857,013 (1,769,886)
TOTAL OPERATING INCOME (LOSS) 5,748,517 5,684,035 3,487,363 (2,196,672)
NONOPERATING REVENUES (EXPENSES)
Interest Earned on Investments 5,000 5,000 123,721 118,721 Interest on Long-Term Obligations (5,527,267) (5,527,267) (2,144,224) 3,383,043
TOTAL NONOPERATING REVENUES (EXPENSES) (5,522,267) (5,522,267) (2,020,503) 3,501,764
INCOME (LOSS) BEFORE CONTRIBUTIONS AND TRANSFERS 226,250 161,768 1,466,860 1,305,092
Capital Contributions - Capacity Fees 75,000 75,000 21,000 (54,000) Donated Capital Assets - - 112,572 112,572 Transfers Out (701,250) (701,250) (701,250) -
CHANGE IN NET POSITION (400,000) (464,482) 899,182 1,363,664
NET POSITION, BEGINNING OF YEAR 30,659,503 30,659,503 30,659,503 -
NET POSITION, END OF YEAR 30,259,503$ 30,195,021 31,558,685 1,363,664$
Note: The City's Interest on Long-Term Obligations for the original and final budget includes approximately $2,964,000 of debt principal payments.
Note: The City’s original and final budget reflected an expected use of net position of approximately $400,000 and $464,000, respectively.
119
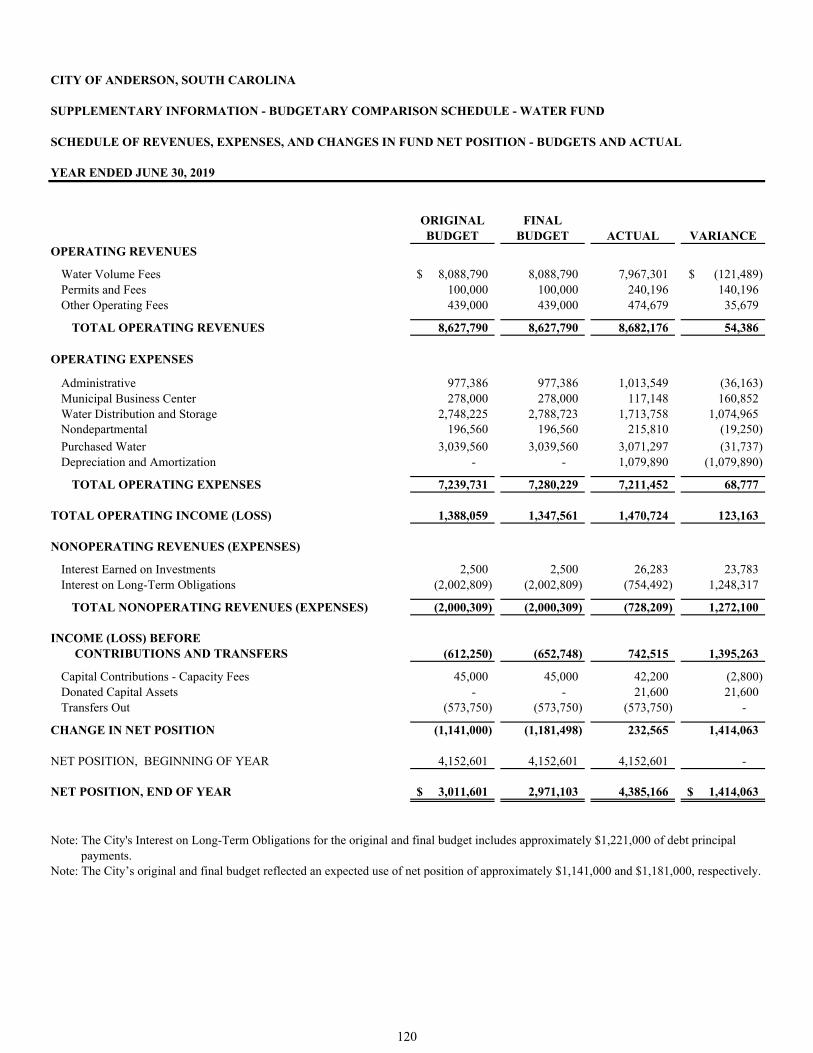
CITY OF ANDERSON, SOUTH CAROLINA
SUPPLEMENTARY INFORMATION - BUDGETARY COMPARISON SCHEDULE - WATER FUND
SCHEDULE OF REVENUES, EXPENSES, AND CHANGES IN FUND NET POSITION - BUDGETS AND ACTUAL
YEAR ENDED JUNE 30, 2019
ORIGINAL FINALBUDGET BUDGET ACTUAL VARIANCE
OPERATING REVENUES
Water Volume Fees 8,088,790$ 8,088,790 7,967,301 (121,489)$ Permits and Fees 100,000 100,000 240,196 140,196 Other Operating Fees 439,000 439,000 474,679 35,679
TOTAL OPERATING REVENUES 8,627,790 8,627,790 8,682,176 54,386
OPERATING EXPENSES
Administrative 977,386 977,386 1,013,549 (36,163) Municipal Business Center 278,000 278,000 117,148 160,852 Water Distribution and Storage 2,748,225 2,788,723 1,713,758 1,074,965 Nondepartmental 196,560 196,560 215,810 (19,250)
Purchased Water 3,039,560 3,039,560 3,071,297 (31,737) Depreciation and Amortization - - 1,079,890 (1,079,890)
TOTAL OPERATING EXPENSES 7,239,731 7,280,229 7,211,452 68,777
TOTAL OPERATING INCOME (LOSS) 1,388,059 1,347,561 1,470,724 123,163
NONOPERATING REVENUES (EXPENSES)
Interest Earned on Investments 2,500 2,500 26,283 23,783 Interest on Long-Term Obligations (2,002,809) (2,002,809) (754,492) 1,248,317
TOTAL NONOPERATING REVENUES (EXPENSES) (2,000,309) (2,000,309) (728,209) 1,272,100
INCOME (LOSS) BEFORE CONTRIBUTIONS AND TRANSFERS (612,250) (652,748) 742,515 1,395,263
Capital Contributions - Capacity Fees 45,000 45,000 42,200 (2,800) Donated Capital Assets - - 21,600 21,600 Transfers Out (573,750) (573,750) (573,750) -
CHANGE IN NET POSITION (1,141,000) (1,181,498) 232,565 1,414,063
NET POSITION, BEGINNING OF YEAR 4,152,601 4,152,601 4,152,601 -
NET POSITION, END OF YEAR 3,011,601$ 2,971,103 4,385,166 1,414,063$
Note: The City's Interest on Long-Term Obligations for the original and final budget includes approximately $1,221,000 of debt principal payments.
Note: The City’s original and final budget reflected an expected use of net position of approximately $1,141,000 and $1,181,000, respectively.
120
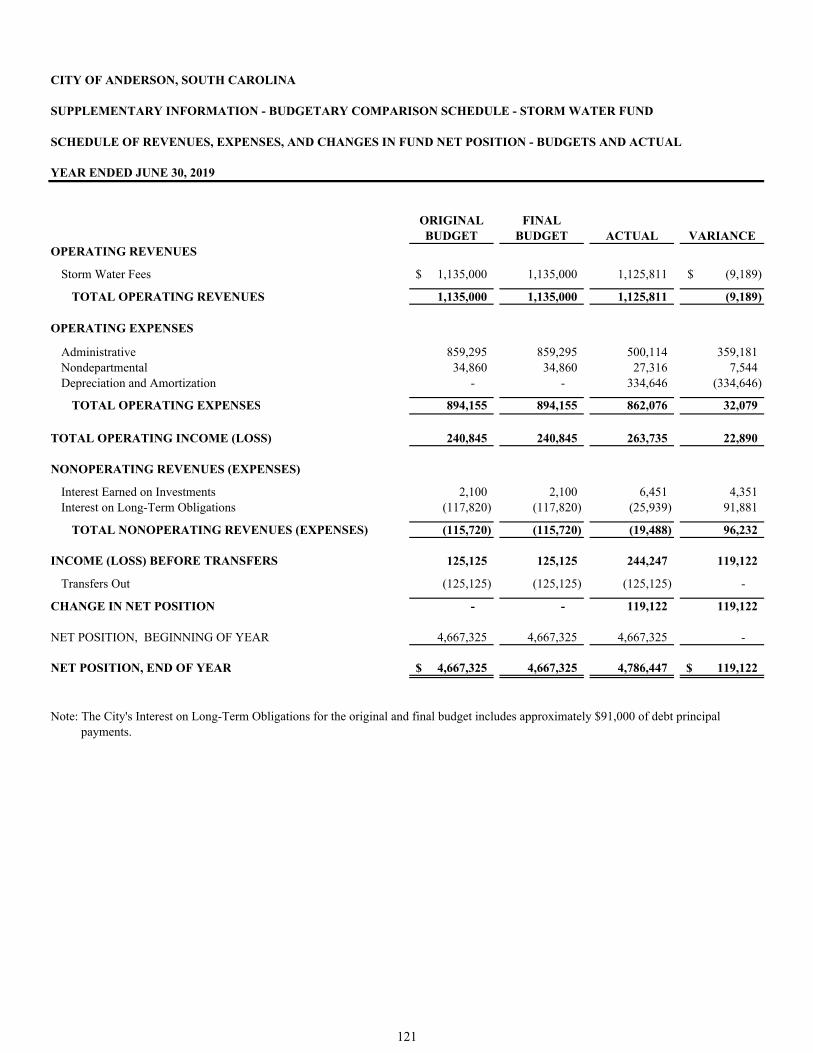
CITY OF ANDERSON, SOUTH CAROLINA
SUPPLEMENTARY INFORMATION - BUDGETARY COMPARISON SCHEDULE - STORM WATER FUND
SCHEDULE OF REVENUES, EXPENSES, AND CHANGES IN FUND NET POSITION - BUDGETS AND ACTUAL
YEAR ENDED JUNE 30, 2019
ORIGINAL FINALBUDGET BUDGET ACTUAL VARIANCE
OPERATING REVENUES
Storm Water Fees 1,135,000$ 1,135,000 1,125,811 (9,189)$
TOTAL OPERATING REVENUES 1,135,000 1,135,000 1,125,811 (9,189)
OPERATING EXPENSES
Administrative 859,295 859,295 500,114 359,181 Nondepartmental 34,860 34,860 27,316 7,544 Depreciation and Amortization - - 334,646 (334,646)
TOTAL OPERATING EXPENSES 894,155 894,155 862,076 32,079
TOTAL OPERATING INCOME (LOSS) 240,845 240,845 263,735 22,890
NONOPERATING REVENUES (EXPENSES)
Interest Earned on Investments 2,100 2,100 6,451 4,351 Interest on Long-Term Obligations (117,820) (117,820) (25,939) 91,881
TOTAL NONOPERATING REVENUES (EXPENSES) (115,720) (115,720) (19,488) 96,232
INCOME (LOSS) BEFORE TRANSFERS 125,125 125,125 244,247 119,122
Transfers Out (125,125) (125,125) (125,125) -
CHANGE IN NET POSITION - - 119,122 119,122
NET POSITION, BEGINNING OF YEAR 4,667,325 4,667,325 4,667,325 -
NET POSITION, END OF YEAR 4,667,325$ 4,667,325 4,786,447 119,122$
Note: The City's Interest on Long-Term Obligations for the original and final budget includes approximately $91,000 of debt principal payments.
121
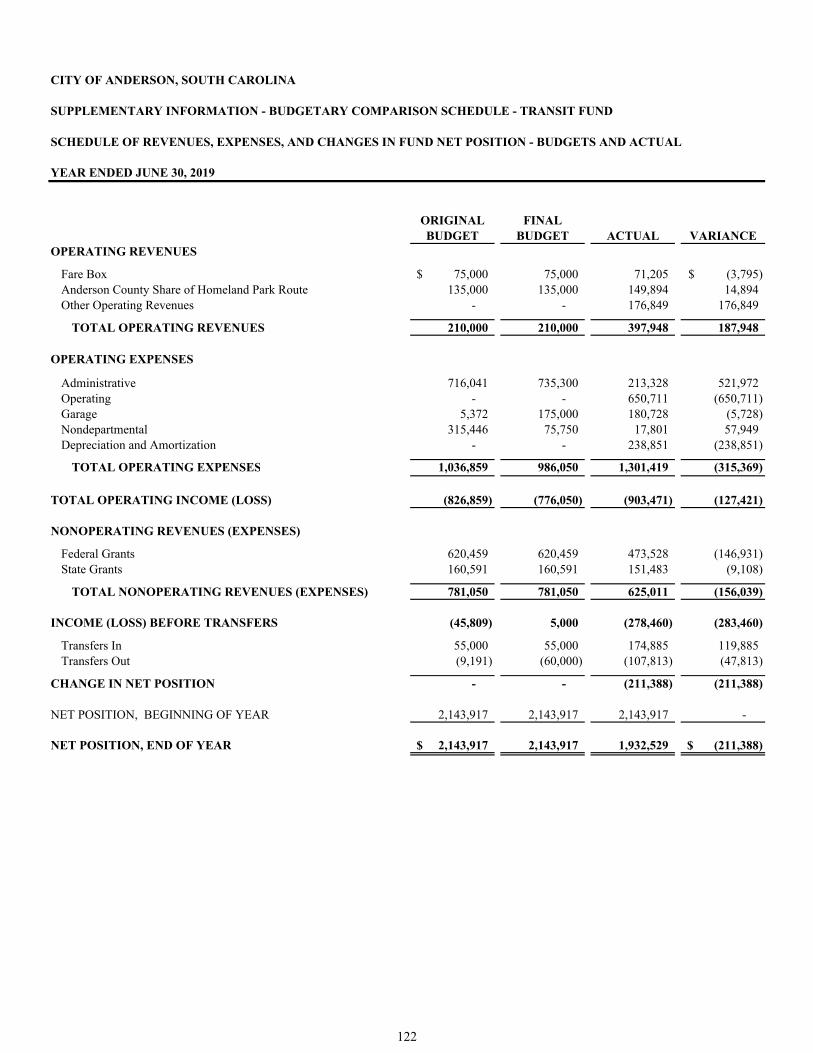
CITY OF ANDERSON, SOUTH CAROLINA
SUPPLEMENTARY INFORMATION - BUDGETARY COMPARISON SCHEDULE - TRANSIT FUND
SCHEDULE OF REVENUES, EXPENSES, AND CHANGES IN FUND NET POSITION - BUDGETS AND ACTUAL
YEAR ENDED JUNE 30, 2019
ORIGINAL FINALBUDGET BUDGET ACTUAL VARIANCE
OPERATING REVENUES
Fare Box 75,000$ 75,000 71,205 (3,795)$ Anderson County Share of Homeland Park Route 135,000 135,000 149,894 14,894 Other Operating Revenues - - 176,849 176,849
TOTAL OPERATING REVENUES 210,000 210,000 397,948 187,948
OPERATING EXPENSES
Administrative 716,041 735,300 213,328 521,972 Operating - - 650,711 (650,711) Garage 5,372 175,000 180,728 (5,728) Nondepartmental 315,446 75,750 17,801 57,949 Depreciation and Amortization - - 238,851 (238,851)
TOTAL OPERATING EXPENSES 1,036,859 986,050 1,301,419 (315,369)
TOTAL OPERATING INCOME (LOSS) (826,859) (776,050) (903,471) (127,421)
NONOPERATING REVENUES (EXPENSES)
Federal Grants 620,459 620,459 473,528 (146,931) State Grants 160,591 160,591 151,483 (9,108)
TOTAL NONOPERATING REVENUES (EXPENSES) 781,050 781,050 625,011 (156,039)
INCOME (LOSS) BEFORE TRANSFERS (45,809) 5,000 (278,460) (283,460)
Transfers In 55,000 55,000 174,885 119,885 Transfers Out (9,191) (60,000) (107,813) (47,813)
CHANGE IN NET POSITION - - (211,388) (211,388)
NET POSITION, BEGINNING OF YEAR 2,143,917 2,143,917 2,143,917 -
NET POSITION, END OF YEAR 2,143,917$ 2,143,917 1,932,529 (211,388)$
122

FIDUCIARY FUNDS Fiduciary funds are used to report assets held in a trustee or agency capacity for others and cannot be used to support the City’s programs. Agency Fund – accounts for funds held in custody for others.
Forfeitures and Seizures Fund – is used to account for money that was forfeited and/or seized during a law enforcement action. This money is held until completion of court proceedings.
123

This page is intentionally left blank
124
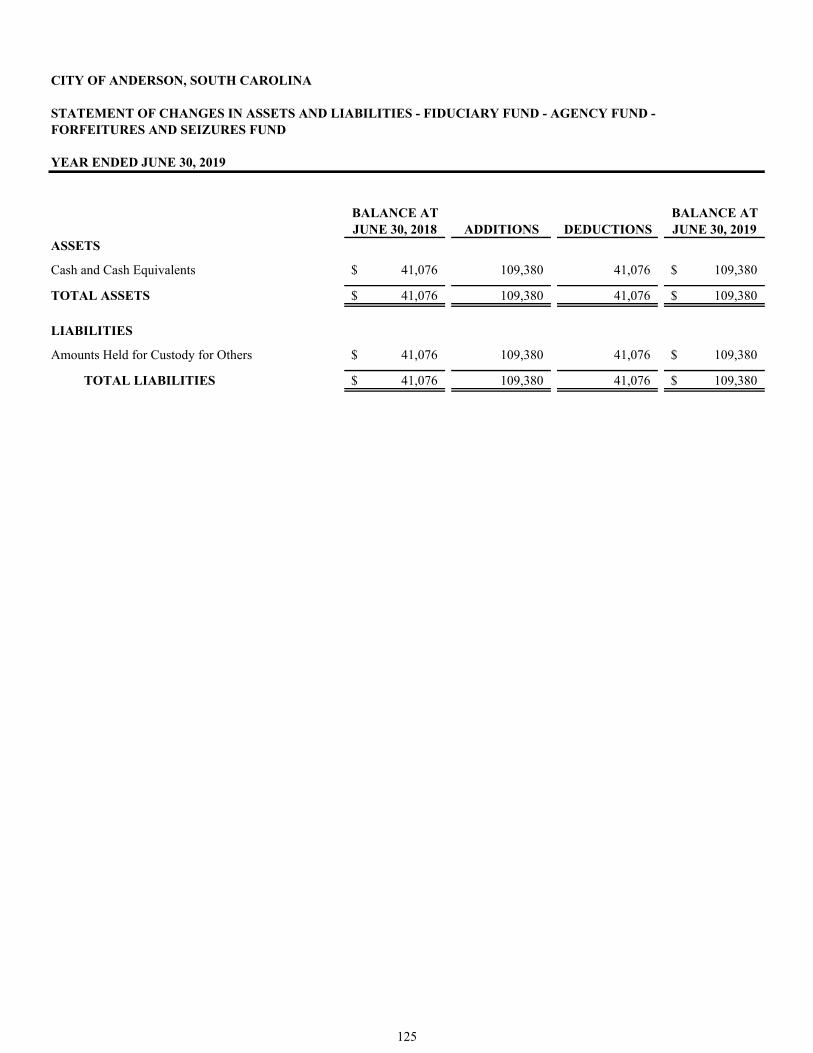
STATEMENT OF CHANGES IN ASSETS AND LIABILITIES - FIDUCIARY FUND - AGENCY FUND -FORFEITURES AND SEIZURES FUND
YEAR ENDED JUNE 30, 2019
BALANCE AT BALANCE ATJUNE 30, 2018 ADDITIONS DEDUCTIONS JUNE 30, 2019
ASSETS
Cash and Cash Equivalents 41,076$ 109,380 41,076 109,380$
TOTAL ASSETS 41,076$ 109,380 41,076 109,380$
LIABILITIES
Amounts Held for Custody for Others 41,076$ 109,380 41,076 109,380$
TOTAL LIABILITIES 41,076$ 109,380 41,076 109,380$
CITY OF ANDERSON, SOUTH CAROLINA
125

This page is intentionally left blank
126

CITY OF ANDERSON, SOUTH CAROLINA
UNIFORM SCHEDULE OF FINES, ASSESSMENTS, AND SURCHARGES (PER ACT 96)
YEAR ENDED JUNE 30, 2019
FOR THE STATE TREASURER'S OFFICE:COUNTY / MUNICIPAL FUNDS COLLECTED
BY CLERK OF COURT General Sessions Magistrate Court Municipal Court Total
Court Fines and Assessments:Court fines and assessments collected $ 443,295 $ 443,295 Court fines and assessments remitted to State Treasurer (232,183) (232,183)
Total Court Fines and Assessments retained 211,112 211,112 Surcharges and Assessments retained for victim services:
Surcharges collected and retained 12,073 12,073 Assessments retained 24,568 24,568
Total Surcharges and Assessments retained for victim services $ 36,641 $ 36,641
FOR THE DEPARTMENT OF CRIME VICTIM COMPENSATION (DCVC) Municipal County Total
$ 55,583 $ 55,583
24,568 24,568 12,073 12,073
- -
$ 92,224 $ 92,224 Municipal County Total
$ 49,861 $ 49,861 5,467 5,467
55,328 55,328
- -
$ 36,896 $ 36,896
VICTIM SERVICE FUNDS COLLECTEDCarryforward from Previous Year – Beginning BalanceVictim Service Revenue:
Victim Service Fines Retained by City/County TreasurerVictim Service Assessments Retained by City/County TreasurerVictim Service Surcharges Retained by City/County TreasurerInterest EarnedGrant Funds Received
Grant from:General Funds Transferred to Victim Service FundContribution Received from Victim Service Contracts:
(1) Town of(2) Town of (3) City of
Total Funds Allocated to Victim Service Fund + Beginning Balance (A) Expenditures for Victim Service Program:
Salaries and BenefitsOperating Expenditures
Victim Service Contract(s):(1) Entity's Name(2) Entity's Name
Victim Service Donation(s): (1) Domestic Violence Shelter: (2) Rape Crisis Center: (3) Other local direct crime victims service agency:
Transferred to General Fund
Total Expenditures from Victim Service Fund/Program (B)
Total Victim Service Funds Retained by Municipal/County Treasurer (A-B)Less: Prior Year Fund Deficit Repayment
Carryforward Funds – End of Year
127
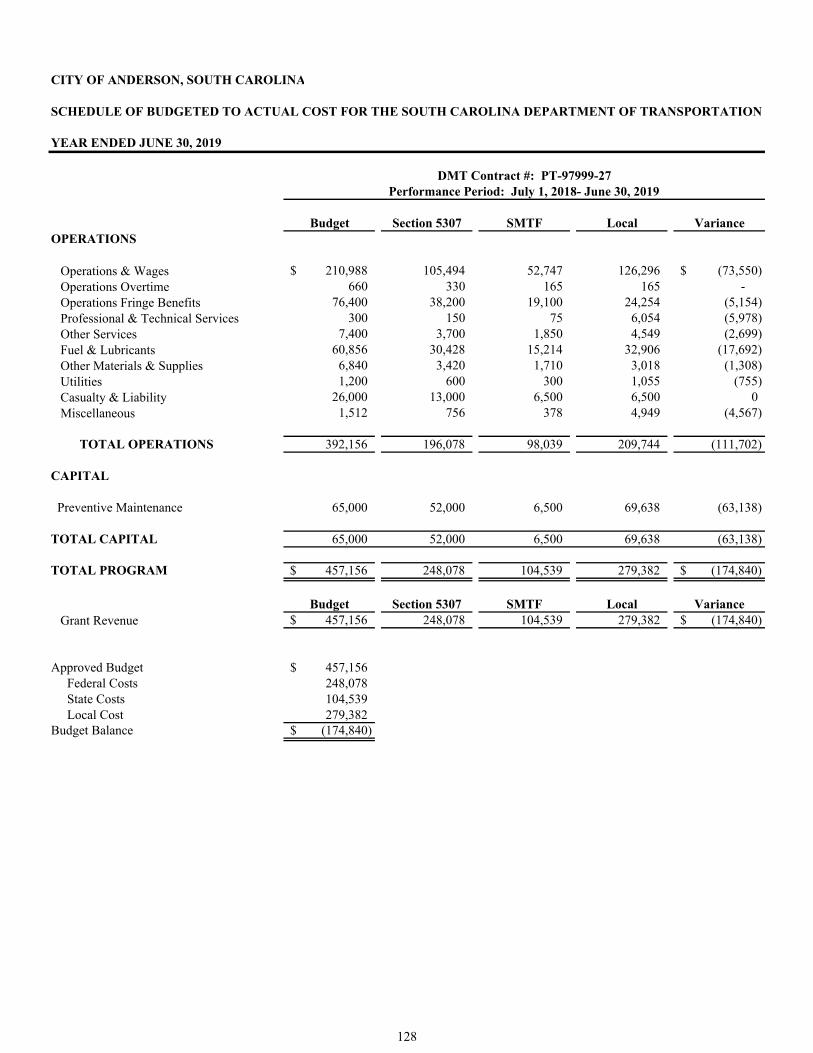
CITY OF ANDERSON, SOUTH CAROLINA
SCHEDULE OF BUDGETED TO ACTUAL COST FOR THE SOUTH CAROLINA DEPARTMENT OF TRANSPORTATION
YEAR ENDED JUNE 30, 2019
Budget Section 5307 SMTF Local VarianceOPERATIONS
Operations & Wages 210,988$ 105,494 52,747 126,296 (73,550)$ Operations Overtime 660 330 165 165 - Operations Fringe Benefits 76,400 38,200 19,100 24,254 (5,154) Professional & Technical Services 300 150 75 6,054 (5,978) Other Services 7,400 3,700 1,850 4,549 (2,699) Fuel & Lubricants 60,856 30,428 15,214 32,906 (17,692) Other Materials & Supplies 6,840 3,420 1,710 3,018 (1,308) Utilities 1,200 600 300 1,055 (755) Casualty & Liability 26,000 13,000 6,500 6,500 0 Miscellaneous 1,512 756 378 4,949 (4,567)
TOTAL OPERATIONS 392,156 196,078 98,039 209,744 (111,702)
CAPITAL
Preventive Maintenance 65,000 52,000 6,500 69,638 (63,138)
TOTAL CAPITAL 65,000 52,000 6,500 69,638 (63,138)
TOTAL PROGRAM 457,156$ 248,078 104,539 279,382 (174,840)$
Budget Section 5307 SMTF Local VarianceGrant Revenue 457,156$ 248,078 104,539 279,382 (174,840)$
Approved Budget 457,156$ Federal Costs 248,078 State Costs 104,539 Local Cost 279,382 Budget Balance (174,840)$
DMT Contract #: PT-97999-27Performance Period: July 1, 2018- June 30, 2019
128
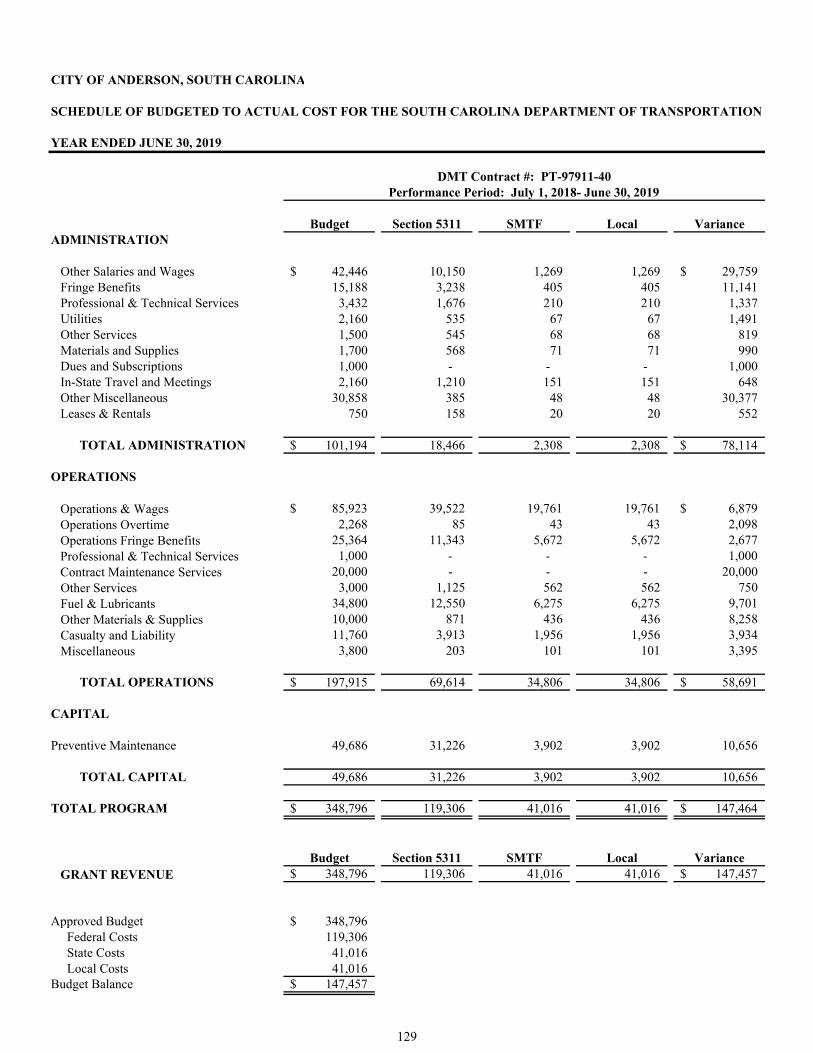
CITY OF ANDERSON, SOUTH CAROLINA
SCHEDULE OF BUDGETED TO ACTUAL COST FOR THE SOUTH CAROLINA DEPARTMENT OF TRANSPORTATION
YEAR ENDED JUNE 30, 2019
Budget Section 5311 SMTF Local VarianceADMINISTRATION
Other Salaries and Wages 42,446$ 10,150 1,269 1,269 29,759$ Fringe Benefits 15,188 3,238 405 405 11,141 Professional & Technical Services 3,432 1,676 210 210 1,337 Utilities 2,160 535 67 67 1,491 Other Services 1,500 545 68 68 819 Materials and Supplies 1,700 568 71 71 990 Dues and Subscriptions 1,000 - - - 1,000 In-State Travel and Meetings 2,160 1,210 151 151 648 Other Miscellaneous 30,858 385 48 48 30,377 Leases & Rentals 750 158 20 20 552
TOTAL ADMINISTRATION 101,194$ 18,466 2,308 2,308 78,114$
OPERATIONS
Operations & Wages 85,923$ 39,522 19,761 19,761 6,879$ Operations Overtime 2,268 85 43 43 2,098 Operations Fringe Benefits 25,364 11,343 5,672 5,672 2,677 Professional & Technical Services 1,000 - - - 1,000 Contract Maintenance Services 20,000 - - - 20,000 Other Services 3,000 1,125 562 562 750 Fuel & Lubricants 34,800 12,550 6,275 6,275 9,701 Other Materials & Supplies 10,000 871 436 436 8,258 Casualty and Liability 11,760 3,913 1,956 1,956 3,934 Miscellaneous 3,800 203 101 101 3,395
TOTAL OPERATIONS 197,915$ 69,614 34,806 34,806 58,691$
CAPITAL
Preventive Maintenance 49,686 31,226 3,902 3,902 10,656
TOTAL CAPITAL 49,686 31,226 3,902 3,902 10,656
TOTAL PROGRAM 348,796$ 119,306 41,016 41,016 147,464$
Budget Section 5311 SMTF Local VarianceGRANT REVENUE 348,796$ 119,306 41,016 41,016 147,457$
Approved Budget 348,796$ Federal Costs 119,306 State Costs 41,016 Local Costs 41,016 Budget Balance 147,457$
DMT Contract #: PT-97911-40Performance Period: July 1, 2018- June 30, 2019
129

This page is intentionally left blank
130

STATISTICAL SECTION This part of the City of Anderson’s (“City”) comprehensive annual financial report presents detailed information as a context for understanding what the information in the financial statements, note disclosures, and required supplementary information says about the City’s overall financial health. Contents Page Financial Trends Information 133
These schedules contain trend information to help the reader understand how the City’s financial performance and well-being have changed over time.
Revenue Capacity Information 140
These schedules contain information to help the reader assess the City’s most significant local revenue source, the property tax.
Debt Capacity Information 144
These schedules present information to help the reader assess the affordability of the City’s current levels of outstanding debt and the City’s ability to issue additional debt in the future.
Demographic and Economic Information 149
These schedules offer demographic and economic indicators to help the reader understand the environment within which the City’s financial activities take place.
Operating Information 151
These schedules contain service and infrastructure data to help the reader understand how the information in the City’s financial report relates to the services the City provides and the activities it performs.
Sources: Unless otherwise noted, the information in these schedules is derived from the comprehensive
annual financial reports for the relevant year.
131

This page is intentionally left blank
132

CIT
Y O
F A
ND
ER
SO
N, S
OU
TH
CA
RO
LIN
AT
able
1
NE
T P
OS
ITIO
N B
Y C
OM
PO
NE
NT
LA
ST
TE
N F
ISC
AL
YE
AR
S(a
ccru
al b
asis
of
acco
unti
ng)
(am
ount
s ex
pres
sed
in th
ousa
nds)
UN
AU
DIT
ED
2010
2011
2012
2013
2014
2015
2016
2017
2018
2019
Gov
ernm
enta
l Act
ivit
ies
Net
Inv
estm
ent i
n C
apit
al A
sset
s23
,773
$ 23
,703
24
,878
26
,413
27
,461
30
,093
31
,528
33
,880
33
,914
33
,761
$ R
estr
icte
d5,
691
6,85
0
7,
057
6,85
2
7,
639
7,23
6
7,
814
8,17
4
9,
010
10,6
16
Unr
estr
icte
d6,
863
7,10
5
7,
418
6,79
2
8,
103
(928
)
289
44
1,12
3
80
1
Tot
al G
over
nmen
tal A
ctiv
itie
s N
et P
osit
ion
36,3
27$
37
,658
39,3
53
40
,057
43,2
03
36
,401
39,6
31
42
,098
44,0
47
45
,178
$
Bus
ines
s-T
ype
Act
ivit
ies
Net
Inv
estm
ent i
n C
apit
al A
sset
s25
,534
$ 25
,313
24
,976
25
,329
23
,044
22
,339
25
,208
27
,025
26
,112
26
,280
$ R
estr
icte
d3,
617
4,78
6
4,
274
4,45
5
4,
681
5,01
8
5,
024
5,23
4
5,
576
6,77
6
U
nres
tric
ted
3,16
6
4,
302
6,59
2
6,
492
6,26
3
8,
528
8,37
7
8,
076
9,93
5
9,
607
Tot
al B
usin
ess-
Typ
e A
ctiv
itie
s N
et P
osit
ion
32,3
17$
34
,401
35,8
42
36
,276
33,9
88
35
,885
38,6
09
40
,335
41,6
23
42
,663
$
Pri
mar
y G
over
nmen
tN
et I
nves
tmen
t in
Cap
ital
Ass
ets
49,3
07$
49,0
16
49,8
54
51,7
42
50,5
05
52,4
32
56,7
36
60,9
05
60,0
26
60,0
41$
Res
tric
ted
9,30
8
11
,636
11
,331
11
,307
12
,320
12
,254
12
,838
13
,408
14
,586
17
,392
U
nres
tric
ted
10,0
29
11,4
07
14,0
10
13,2
84
14,3
66
7,60
0
8,
666
8,12
0
11
,058
10
,408
Tot
al P
rim
ary
Gov
ernm
ent N
et P
osit
ion
68,6
44$
72
,059
75,1
95
76
,333
77,1
91
72
,286
78,2
40
82
,433
85,6
70
87
,841
$
Fis
cal Y
ear
133
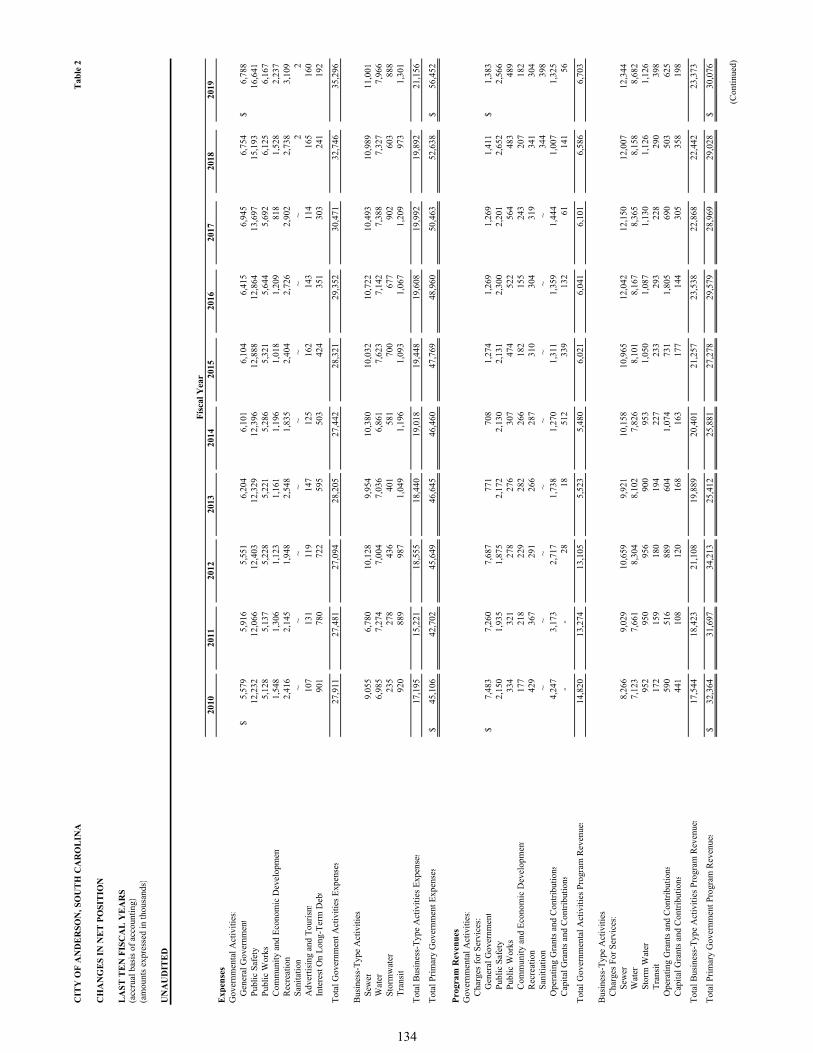
CIT
Y O
F A
ND
ER
SO
N, S
OU
TH
CA
RO
LIN
AT
able
2
CH
AN
GE
S I
N N
ET
PO
SIT
ION
LA
ST
TE
N F
ISC
AL
YE
AR
S(a
ccru
al b
asis
of
acco
unti
ng)
(am
ount
s ex
pres
sed
in th
ousa
nds)
UN
AU
DIT
ED
Fis
cal Y
ear
2010
2011
2012
2013
2014
2015
2016
2017
2018
2019
Exp
ense
sG
over
nmen
tal A
ctiv
itie
s:G
ener
al G
over
nmen
t5,
579
$
5,91
6
5,55
1
6,20
4
6,10
1
6,10
4
6,41
5
6,94
5
6,75
4
6,78
8$
Pub
lic
Saf
ety
12,2
32
12
,066
12,4
03
12
,329
12,3
96
12
,888
12,8
64
13
,697
15,1
93
16
,641
Pub
lic
Wor
ks5,
128
5,13
7
5,
228
5,22
1
5,
286
5,32
1
5,
644
5,69
2
6,
125
6,16
7
C
omm
unit
y an
d E
cono
mic
Dev
elop
men
t1,
548
1,30
6
1,
123
1,16
1
1,
196
1,01
8
1,
209
818
1,
528
2,23
7
R
ecre
atio
n2,
416
2,14
5
1,
948
2,54
8
1,
835
2,40
4
2,
726
2,90
2
2,
738
3,10
9
S
anit
atio
n~
~~
~~
~~
~2
2
A
dver
tisi
ng a
nd T
ouri
sm10
7
131
11
9
147
12
5
162
14
3
114
16
5
160
In
tere
st O
n L
ong-
Ter
m D
ebt
901
78
0
722
59
5
503
42
4
351
30
3
241
19
2
Tot
al G
over
nmen
t Act
ivit
ies
Exp
ense
s27
,911
27,4
81
27
,094
28,2
05
27
,442
28,3
21
29
,352
30,4
71
32
,746
35,2
96
Bus
ines
s-T
ype
Act
ivit
ies
Sew
er9,
055
6,78
0
10
,128
9,95
4
10
,380
10,0
32
10
,722
10,4
93
10
,989
11,0
01
W
ater
6,98
5
7,
274
7,00
4
7,
036
6,86
1
7,
623
7,14
2
7,
388
7,32
7
7,
966
Sto
rmw
ater
235
27
8
436
40
1
581
70
0
677
90
2
603
88
8
Tra
nsit
920
88
9
987
1,
049
1,19
6
1,
093
1,06
7
1,
209
973
1,
301
Tot
al B
usin
ess-
Typ
e A
ctiv
itie
s E
xpen
ses
17,1
95
15
,221
18,5
55
18
,440
19,0
18
19
,448
19,6
08
19
,992
19,8
92
21
,156
Tot
al P
rim
ary
Gov
ernm
ent E
xpen
ses
45,1
06$
42,7
02
45,6
49
46,6
45
46,4
60
47,7
69
48,9
60
50,4
63
52,6
38
56,4
52$
Pro
gram
Rev
enu
esG
over
nmen
tal A
ctiv
itie
s:C
harg
es f
or S
ervi
ces:
Gen
eral
Gov
ernm
ent
7,48
3$
7,26
0
7,68
7
771
708
1,27
4
1,26
9
1,26
9
1,41
1
1,38
3$
Pub
lic
Saf
ety
2,15
0
1,
935
1,87
5
2,
172
2,13
0
2,
131
2,30
0
2,
201
2,65
2
2,
566
Pub
lic
Wor
ks33
4
321
27
8
276
30
7
474
52
2
564
48
3
489
C
omm
unit
y an
d E
cono
mic
Dev
elop
men
t17
7
218
22
9
282
26
6
182
15
5
243
20
7
182
R
ecre
atio
n42
9
367
29
1
266
28
7
310
30
4
319
34
1
304
S
anit
iati
on~
~~
~~
~~
~34
4
398
O
pera
ting
Gra
nts
and
Con
trib
utio
ns4,
247
3,17
3
2,
717
1,73
8
1,
270
1,31
1
1,
359
1,44
4
1,
007
1,32
5
C
apit
al G
rant
s an
d C
ontr
ibut
ions
-
-
28
18
512
33
9
132
61
141
56
Tot
al G
over
nmen
tal A
ctiv
itie
s P
rogr
am R
even
ues
14,8
20
13,2
74
13,1
05
5,52
3
5,48
0
6,02
1
6,04
1
6,10
1
6,58
6
6,70
3
Bus
ines
s-T
ype
Act
ivit
ies
Cha
rges
For
Ser
vice
s:S
ewer
8,26
6
9,
029
10,6
59
9,
921
10,1
58
10
,965
12,0
42
12
,150
12,0
07
12
,344
Wat
er7,
123
7,66
1
8,
304
8,10
2
7,
826
8,10
1
8,
167
8,36
5
8,
158
8,68
2
S
torm
Wat
er95
2
950
95
6
900
95
3
1,05
0
1,
087
1,13
0
1,
126
1,12
6
T
rans
it17
2
159
18
0
194
22
7
233
29
3
228
29
0
398
O
pera
ting
Gra
nts
and
Con
trib
utio
ns59
0
51
6
889
60
4
1,07
4
73
1
1,80
5
69
0
503
62
5
Cap
ital
Gra
nts
and
Con
trib
utio
ns44
1
10
8
120
16
8
163
17
7
144
30
5
358
19
8
Tot
al B
usin
ess-
Typ
e A
ctiv
itie
s P
rogr
am R
even
ues
17,5
44
18,4
23
21,1
08
19,8
89
20,4
01
21,2
57
23,5
38
22,8
68
22,4
42
23,3
73
Tot
al P
rim
ary
Gov
ernm
ent P
rogr
am R
even
ues
32,3
64$
31,6
97
34,2
13
25,4
12
25,8
81
27,2
78
29,5
79
28,9
69
29,0
28
30,0
76$
(Con
tinu
ed)
134
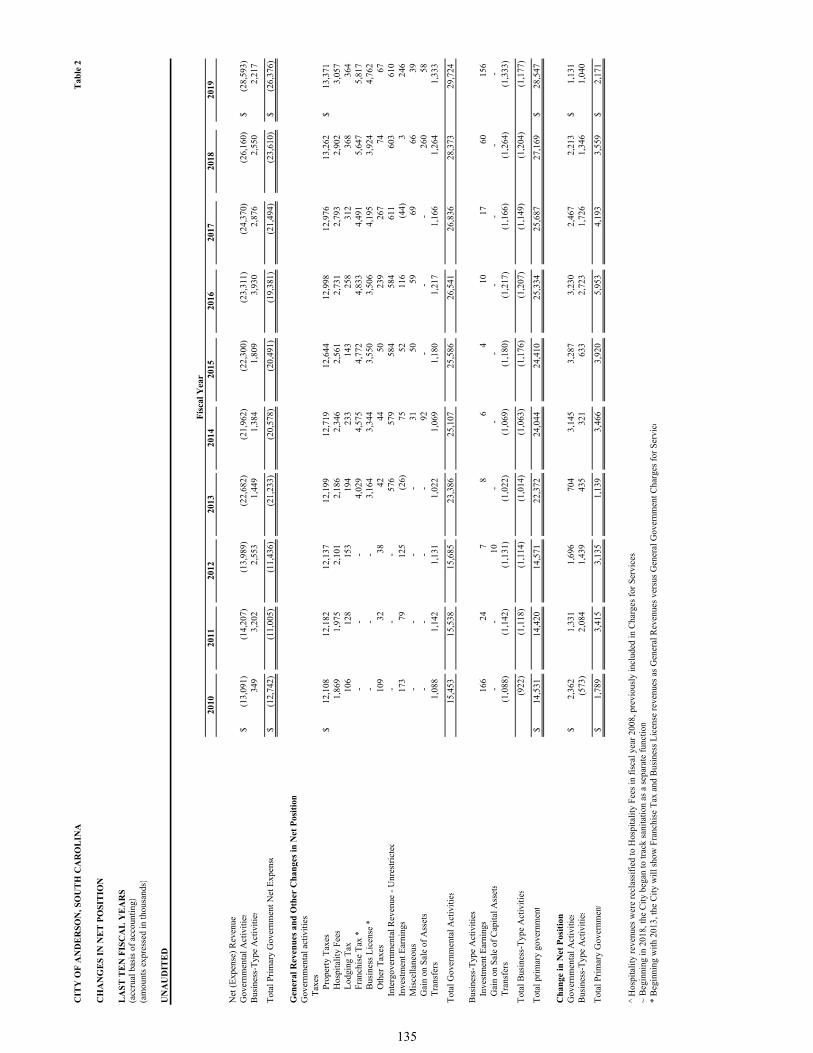
CIT
Y O
F A
ND
ER
SO
N, S
OU
TH
CA
RO
LIN
AT
able
2
CH
AN
GE
S I
N N
ET
PO
SIT
ION
LA
ST
TE
N F
ISC
AL
YE
AR
S(a
ccru
al b
asis
of
acco
unti
ng)
(am
ount
s ex
pres
sed
in th
ousa
nds)
UN
AU
DIT
ED
Fis
cal Y
ear
2010
2011
2012
2013
2014
2015
2016
2017
2018
2019
Net
(E
xpen
se)
Rev
enue
Gov
ernm
enta
l Act
ivit
ies
(13,
091)
$
(14,
207)
(13,
989)
(22,
682)
(21,
962)
(22,
300)
(23,
311)
(24,
370)
(26,
160)
(28,
593)
$
Bus
ines
s-T
ype
Act
ivit
ies
349
3,20
2
2,55
3
1,44
9
1,38
4
1,80
9
3,93
0
2,87
6
2,55
0
2,21
7
Tot
al P
rim
ary
Gov
ernm
ent N
et E
xpen
s e(1
2,74
2)$
(1
1,00
5)
(1
1,43
6)
(2
1,23
3)
(2
0,57
8)
(2
0,49
1)
(1
9,38
1)
(2
1,49
4)
(2
3,61
0)
(2
6,37
6)$
Gen
eral
Rev
enu
es a
nd
Oth
er C
han
ges
in N
et P
osit
ion
Gov
ernm
enta
l act
ivit
ies:
Tax
esP
rope
rty
Tax
es12
,108
$
12
,182
12
,137
12
,199
12
,719
12
,644
12
,998
12
,976
13
,262
13
,371
$
H
ospi
tali
ty F
ees
1,86
9
1,97
5
2,10
1
2,18
6
2,34
6
2,56
1
2,73
1
2,79
3
2,90
2
3,05
7
Lod
ging
Tax
106
128
153
194
233
143
258
312
368
364
Fra
nchi
se T
ax *
-
-
-
4,02
9
4,57
5
4,77
2
4,83
3
4,49
1
5,64
7
5,81
7
Bus
ines
s L
icen
se *
-
-
-
3,16
4
3,34
4
3,55
0
3,50
6
4,19
5
3,92
4
4,76
2
Oth
er T
axes
109
32
38
42
44
50
239
267
74
67
Inte
rgov
ernm
enta
l Rev
enue
- U
nres
tric
ted
-
-
-
576
579
584
584
611
603
610
Inve
stm
ent E
arni
ngs
173
79
125
(26)
75
52
11
6
(4
4)
3
24
6
M
isce
llan
eous
-
-
-
-
31
50
59
69
66
39
Gai
n on
Sal
e of
Ass
ets
-
-
-
-
92
-
-
-
260
58
Tra
nsfe
rs1,
088
1,
142
1,
131
1,
022
1,
069
1,
180
1,
217
1,
166
1,
264
1,
333
Tot
al G
over
nmen
tal A
ctiv
itie
s15
,453
15
,538
15
,685
23
,386
25
,107
25
,586
26
,541
26
,836
28
,373
29
,724
Bus
ines
s-T
ype
Act
ivit
ies
Inve
stm
ent E
arni
ngs
166
24
7
8
6
4
10
17
60
156
Gai
n on
Sal
e of
Cap
ital
Ass
ets
-
-
10
-
-
-
-
-
-
-
Tra
nsfe
rs(1
,088
)
(1,1
42)
(1
,131
)
(1,0
22)
(1
,069
)
(1,1
80)
(1
,217
)
(1,1
66)
(1
,264
)
(1,3
33)
Tot
al B
usin
ess-
Typ
e A
ctiv
itie
s(9
22)
(1,1
18)
(1
,114
)
(1,0
14)
(1
,063
)
(1,1
76)
(1
,207
)
(1,1
49)
(1
,204
)
(1,1
77)
Tot
al p
rim
ary
gove
rnm
ent
14,5
31$
14,4
20
14,5
71
22,3
72
24,0
44
24,4
10
25,3
34
25,6
87
27,1
69
28,5
47$
Ch
ange
in N
et P
osit
ion
Gov
ernm
enta
l Act
ivit
ies
2,36
2$
1,33
1
1,69
6
704
3,14
5
3,28
7
3,23
0
2,46
7
2,21
3
1,13
1$
Bus
ines
s-T
ype
Act
ivit
ies
(573
)
2,
084
1,
439
43
5
32
1
63
3
2,
723
1,
726
1,
346
1,
040
Tot
al P
rim
ary
Gov
ernm
ent
1,78
9$
3,41
5
3,13
5
1,13
9
3,46
6
3,92
0
5,95
3
4,19
3
3,55
9
2,17
1$
^ H
ospi
tali
ty r
even
ues
wer
e re
clas
sifi
ed to
Hos
pita
lity
Fee
s in
fis
cal y
ear
2008
, pre
viou
sly
incl
uded
in C
harg
es f
or S
ervi
ces
~ B
egin
ning
in 2
018,
the
Cit
y be
gan
to tr
ack
sani
tati
on a
s a
sepa
rate
fun
ctio
n*
Beg
inni
ng w
ith
2013
, the
Cit
y w
ill s
how
Fra
nchi
se T
ax a
nd B
usin
ess
Lic
ense
rev
enue
s as
Gen
eral
Rev
enue
s ve
rsus
Gen
eral
Gov
ernm
ent C
harg
es f
or S
ervi
ce
135
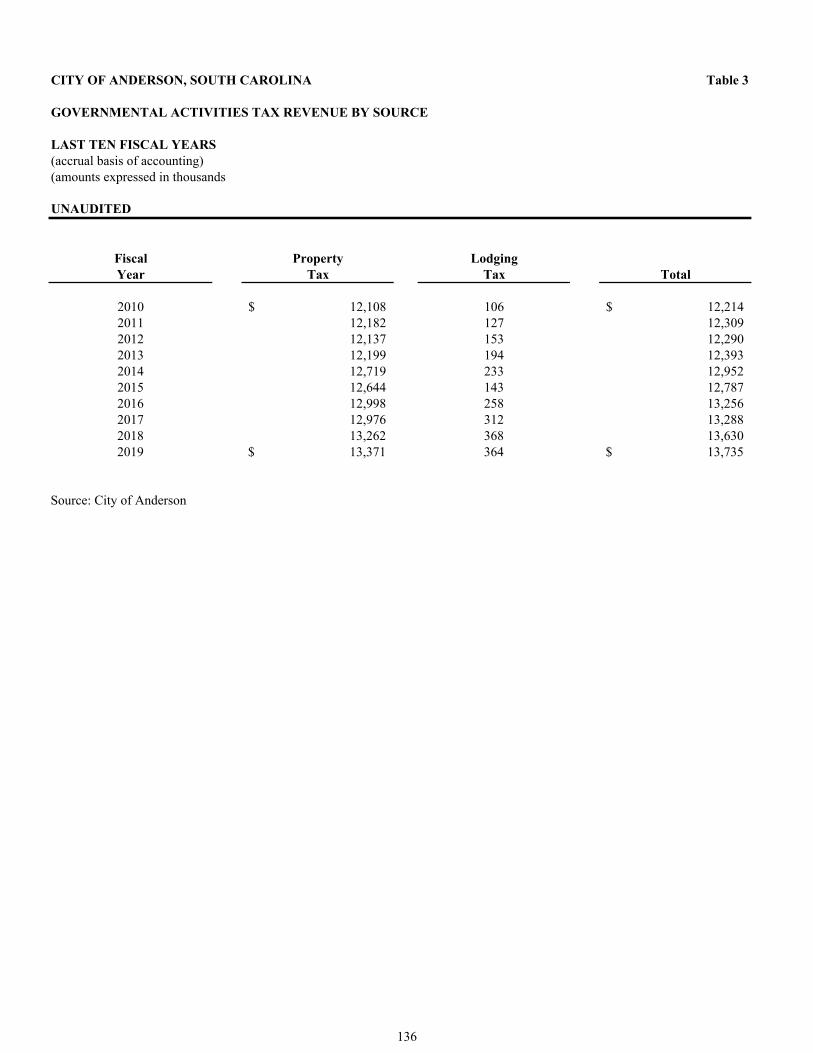
CITY OF ANDERSON, SOUTH CAROLINA Table 3
GOVERNMENTAL ACTIVITIES TAX REVENUE BY SOURCE
LAST TEN FISCAL YEARS(accrual basis of accounting)(amounts expressed in thousands
UNAUDITED
Fiscal Property LodgingYear Tax Tax Total
2010 12,108$ 106 12,214$ 2011 12,182 127 12,309 2012 12,137 153 12,290 2013 12,199 194 12,393 2014 12,719 233 12,952 2015 12,644 143 12,787 2016 12,998 258 13,256 2017 12,976 312 13,288 2018 13,262 368 13,630 2019 13,371$ 364 13,735$
Source: City of Anderson
136
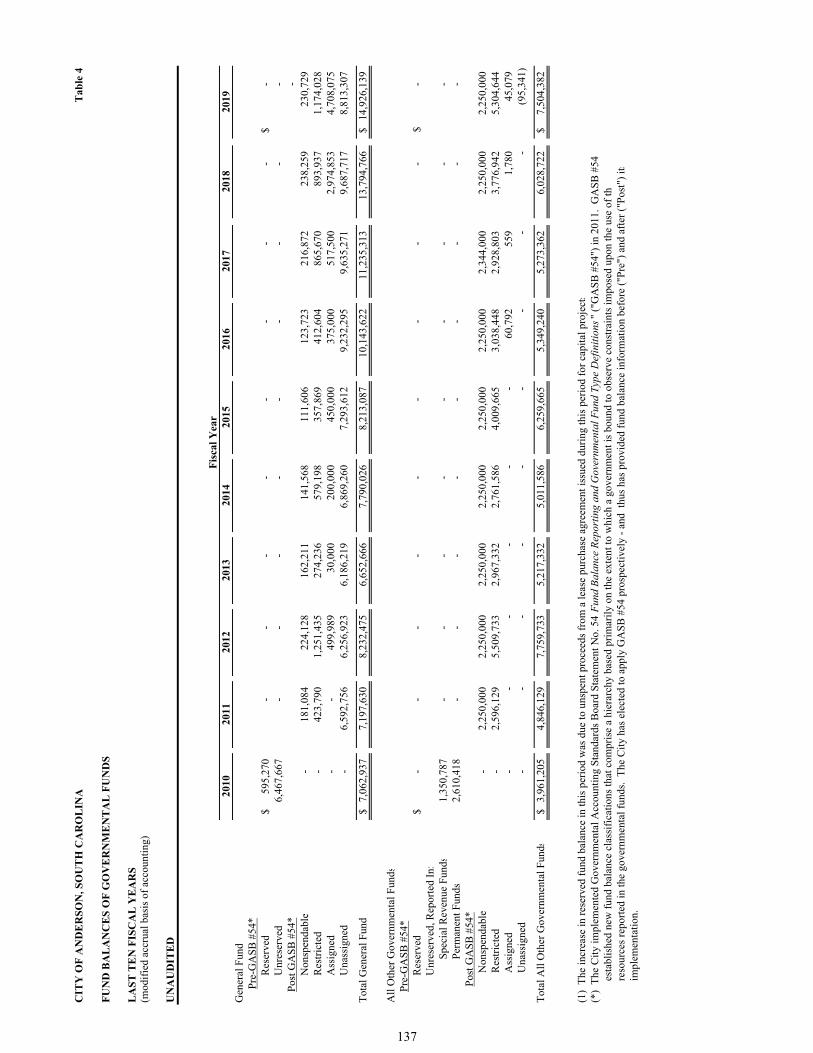
CIT
Y O
F A
ND
ER
SO
N, S
OU
TH
CA
RO
LIN
AT
able
4
FU
ND
BA
LA
NC
ES
OF
GO
VE
RN
ME
NT
AL
FU
ND
S
LA
ST
TE
N F
ISC
AL
YE
AR
S(m
odif
ied
accr
ual b
asis
of
acco
unti
ng)
UN
AU
DIT
ED
2010
2011
2012
2013
2014
2015
2016
2017
2018
2019
Gen
eral
Fun
d
Pre
-GA
SB
#54
*
R
eser
ved
595,
270
$
-
-
-
-
-
-
-
-
-
$
Unr
eser
ved
6,46
7,66
7
-
-
-
-
-
-
-
-
-
Pos
t GA
SB
#54
*-
Non
spen
dabl
e-
181,
084
22
4,12
8
162,
211
14
1,56
8
11
1,60
6
12
3,72
3
21
6,87
2
23
8,25
9
23
0,72
9
R
estr
icte
d-
423,
790
1,
251,
435
274,
236
57
9,19
8
35
7,86
9
41
2,60
4
86
5,67
0
89
3,93
7
1,
174,
028
A
ssig
ned
-
-
499,
989
30
,000
200,
000
450,
000
375,
000
517,
500
2,97
4,85
3
4,70
8,07
5
Una
ssig
ned
-
6,
592,
756
6,25
6,92
3
6,
186,
219
6,86
9,26
0
7,29
3,61
2
9,23
2,29
5
9,63
5,27
1
9,68
7,71
7
8,81
3,30
7
Tot
al G
ener
al F
und
7,06
2,93
7$
7,
197,
630
8,23
2,47
5
6,
652,
666
7,79
0,02
6
8,21
3,08
7
10,1
43,6
22
11
,235
,313
13,7
94,7
66
14
,926
,139
$
All
Oth
er G
over
nmen
tal F
unds
P
re-G
AS
B #
54*
Res
erve
d-
$
-
-
-
-
-
-
-
-
-$
U
nres
erve
d, R
epor
ted
In:
S
peci
al R
even
ue F
unds
1,35
0,78
7
-
-
-
-
-
-
-
-
-
P
erm
anen
t Fun
ds2,
610,
418
-
-
-
-
-
-
-
-
-
P
ost G
AS
B #
54*
N
onsp
enda
ble
-
2,
250,
000
2,25
0,00
0
2,
250,
000
2,25
0,00
0
2,25
0,00
0
2,25
0,00
0
2,34
4,00
0
2,25
0,00
0
2,25
0,00
0
R
estr
icte
d-
2,59
6,12
9
5,
509,
733
2,96
7,33
2
2,
761,
586
4,
009,
665
3,
038,
448
2,
928,
803
3,
776,
942
5,
304,
644
A
ssig
ned
-
-
-
-
-
-
60
,792
559
1,78
0
45,0
79
Una
ssig
ned
-
-
-
-
-
-
-
-
-
(95,
341)
Tot
al A
ll O
ther
Gov
ernm
enta
l Fun
ds3,
961,
205
$
4,84
6,12
9
7,
759,
733
5,21
7,33
2
5,
011,
586
6,
259,
665
5,
349,
240
5,
273,
362
6,
028,
722
7,
504,
382
$
(1)
The
incr
ease
in r
eser
ved
fund
bal
ance
in th
is p
erio
d w
as d
ue to
uns
pent
pro
ceed
s fr
om a
leas
e pu
rcha
se a
gree
men
t iss
ued
duri
ng th
is p
erio
d fo
r ca
pita
l pro
ject
s(*
) T
he C
ity
impl
emen
ted
Gov
ernm
enta
l Acc
ount
ing
Sta
ndar
ds B
oard
Sta
tem
ent N
o. 5
4 F
und
Bal
ance
Rep
orti
ng a
nd G
over
nmen
tal F
und
Typ
e D
efin
itio
ns"
("G
AS
B #
54")
in 2
011.
GA
SB
#54
e
stab
lish
ed n
ew f
und
bala
nce
clas
sifi
cati
ons
that
com
pris
e a
hier
arch
y ba
sed
prim
aril
y on
the
exte
nt to
whi
ch a
gov
ernm
ent i
s bo
und
to o
bser
ve c
onst
rain
ts im
pose
d up
on th
e us
e of
th
r
esou
rces
rep
orte
d in
the
gove
rnm
enta
l fun
ds.
The
Cit
y ha
s el
ecte
d to
app
ly G
AS
B #
54 p
rosp
ecti
vely
- a
nd t
hus
has
prov
ided
fun
d ba
lanc
e in
form
atio
n be
fore
("P
re")
and
aft
er (
"Pos
t")
its
i
mpl
emen
tati
on.
Fis
cal Y
ear
137
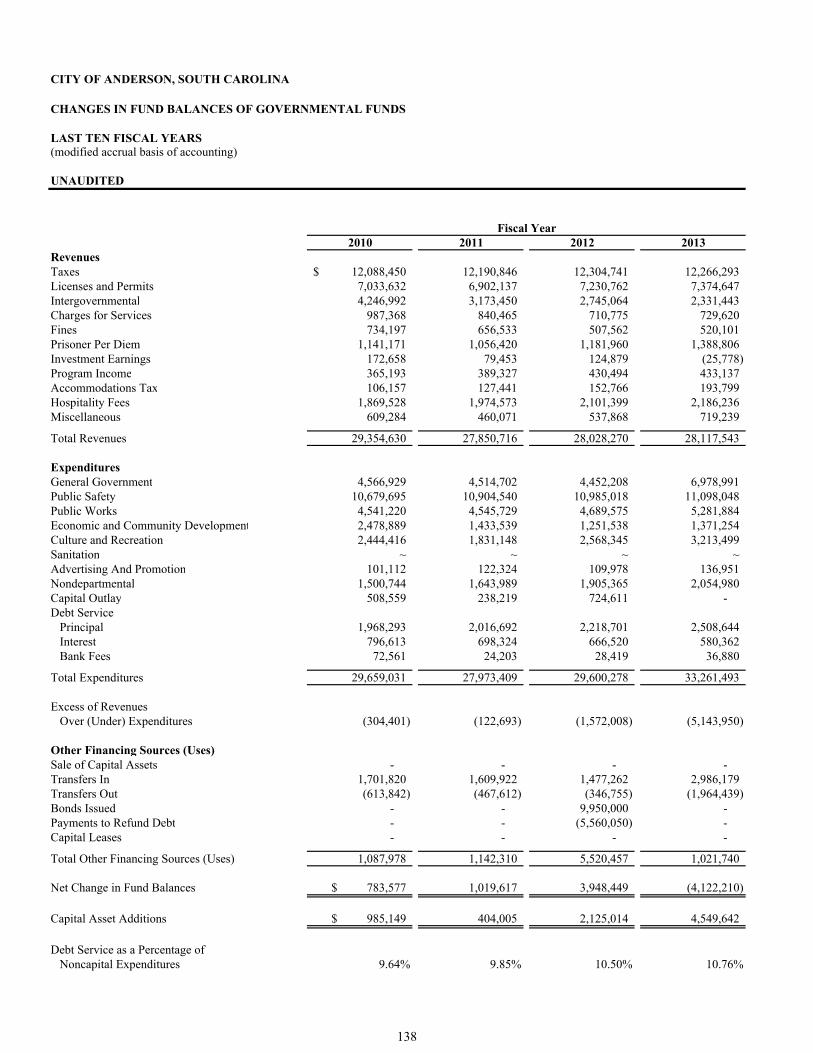
CITY OF ANDERSON, SOUTH CAROLINA
CHANGES IN FUND BALANCES OF GOVERNMENTAL FUNDS
LAST TEN FISCAL YEARS(modified accrual basis of accounting)
UNAUDITED
Fiscal Year2010 2011 2012 2013
RevenuesTaxes 12,088,450$ 12,190,846 12,304,741 12,266,293 Licenses and Permits 7,033,632 6,902,137 7,230,762 7,374,647 Intergovernmental 4,246,992 3,173,450 2,745,064 2,331,443 Charges for Services 987,368 840,465 710,775 729,620 Fines 734,197 656,533 507,562 520,101 Prisoner Per Diem 1,141,171 1,056,420 1,181,960 1,388,806 Investment Earnings 172,658 79,453 124,879 (25,778) Program Income 365,193 389,327 430,494 433,137 Accommodations Tax 106,157 127,441 152,766 193,799 Hospitality Fees 1,869,528 1,974,573 2,101,399 2,186,236 Miscellaneous 609,284 460,071 537,868 719,239
Total Revenues 29,354,630 27,850,716 28,028,270 28,117,543
ExpendituresGeneral Government 4,566,929 4,514,702 4,452,208 6,978,991 Public Safety 10,679,695 10,904,540 10,985,018 11,098,048 Public Works 4,541,220 4,545,729 4,689,575 5,281,884 Economic and Community Development 2,478,889 1,433,539 1,251,538 1,371,254 Culture and Recreation 2,444,416 1,831,148 2,568,345 3,213,499 Sanitation ~ ~ ~ ~Advertising And Promotion 101,112 122,324 109,978 136,951 Nondepartmental 1,500,744 1,643,989 1,905,365 2,054,980 Capital Outlay 508,559 238,219 724,611 - Debt Service
Principal 1,968,293 2,016,692 2,218,701 2,508,644 Interest 796,613 698,324 666,520 580,362 Bank Fees 72,561 24,203 28,419 36,880
Total Expenditures 29,659,031 27,973,409 29,600,278 33,261,493
Excess of RevenuesOver (Under) Expenditures (304,401) (122,693) (1,572,008) (5,143,950)
Other Financing Sources (Uses)Sale of Capital Assets - - - - Transfers In 1,701,820 1,609,922 1,477,262 2,986,179 Transfers Out (613,842) (467,612) (346,755) (1,964,439) Bonds Issued - - 9,950,000 - Payments to Refund Debt - - (5,560,050) - Capital Leases - - - -
Total Other Financing Sources (Uses) 1,087,978 1,142,310 5,520,457 1,021,740
Net Change in Fund Balances 783,577$ 1,019,617 3,948,449 (4,122,210)
Capital Asset Additions 985,149$ 404,005 2,125,014 4,549,642
Debt Service as a Percentage ofNoncapital Expenditures 9.64% 9.85% 10.50% 10.76%
138
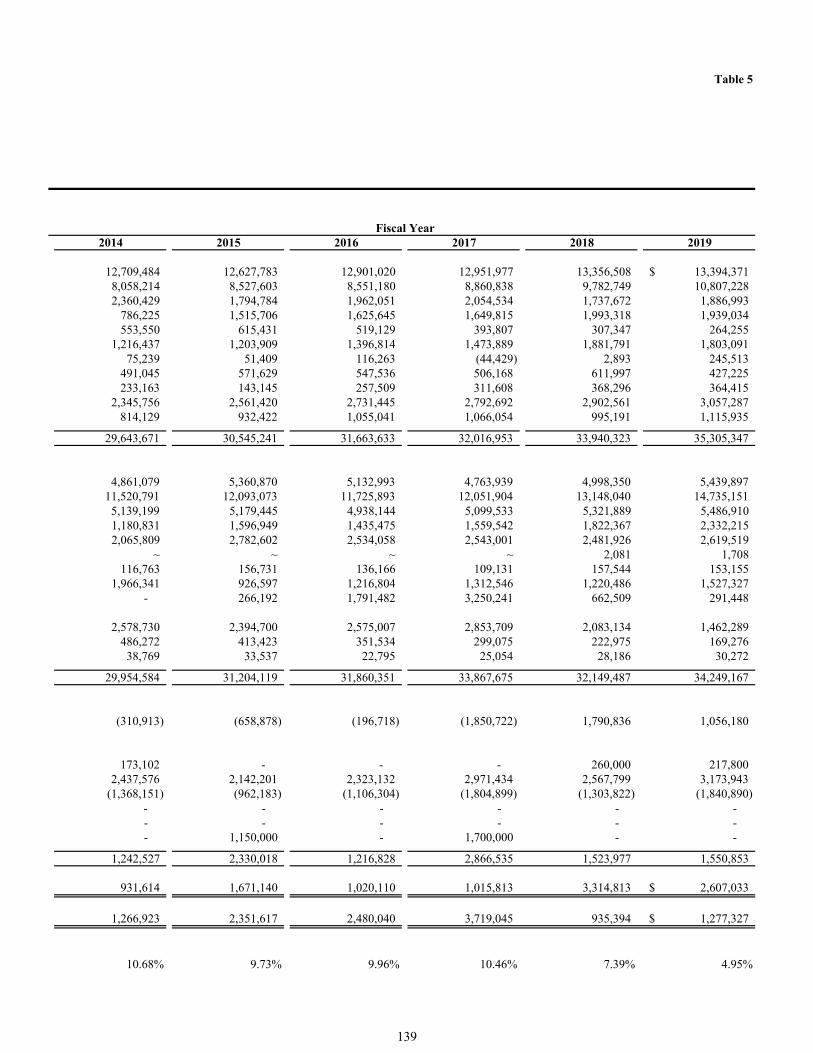
Table 5
Fiscal Year2014 2015 2016 2017 2018 2019
12,709,484 12,627,783 12,901,020 12,951,977 13,356,508 13,394,371$ 8,058,214 8,527,603 8,551,180 8,860,838 9,782,749 10,807,228 2,360,429 1,794,784 1,962,051 2,054,534 1,737,672 1,886,993
786,225 1,515,706 1,625,645 1,649,815 1,993,318 1,939,034 553,550 615,431 519,129 393,807 307,347 264,255
1,216,437 1,203,909 1,396,814 1,473,889 1,881,791 1,803,091 75,239 51,409 116,263 (44,429) 2,893 245,513
491,045 571,629 547,536 506,168 611,997 427,225 233,163 143,145 257,509 311,608 368,296 364,415
2,345,756 2,561,420 2,731,445 2,792,692 2,902,561 3,057,287 814,129 932,422 1,055,041 1,066,054 995,191 1,115,935
29,643,671 30,545,241 31,663,633 32,016,953 33,940,323 35,305,347
4,861,079 5,360,870 5,132,993 4,763,939 4,998,350 5,439,897 11,520,791 12,093,073 11,725,893 12,051,904 13,148,040 14,735,151 5,139,199 5,179,445 4,938,144 5,099,533 5,321,889 5,486,910 1,180,831 1,596,949 1,435,475 1,559,542 1,822,367 2,332,215 2,065,809 2,782,602 2,534,058 2,543,001 2,481,926 2,619,519
~ ~ ~ ~ 2,081 1,708 116,763 156,731 136,166 109,131 157,544 153,155
1,966,341 926,597 1,216,804 1,312,546 1,220,486 1,527,327 - 266,192 1,791,482 3,250,241 662,509 291,448
2,578,730 2,394,700 2,575,007 2,853,709 2,083,134 1,462,289 486,272 413,423 351,534 299,075 222,975 169,276 38,769 33,537 22,795 25,054 28,186 30,272
29,954,584 31,204,119 31,860,351 33,867,675 32,149,487 34,249,167
(310,913) (658,878) (196,718) (1,850,722) 1,790,836 1,056,180
173,102 - - - 260,000 217,800 2,437,576 2,142,201 2,323,132 2,971,434 2,567,799 3,173,943
(1,368,151) (962,183) (1,106,304) (1,804,899) (1,303,822) (1,840,890) - - - - - - - - - - - - - 1,150,000 - 1,700,000 - -
1,242,527 2,330,018 1,216,828 2,866,535 1,523,977 1,550,853
931,614 1,671,140 1,020,110 1,015,813 3,314,813 2,607,033$
1,266,923 2,351,617 2,480,040 3,719,045 935,394 1,277,327$
10.68% 9.73% 9.96% 10.46% 7.39% 4.95%
139

CIT
Y O
F A
ND
ER
SO
N, S
OU
TH
CA
RO
LIN
AT
able
6
AS
SE
SS
ED
VA
LU
E A
ND
ES
TIM
AT
ED
AC
TU
AL
VA
LU
E O
F T
AX
AB
LE
PR
OP
ER
TY
LA
ST
TE
N F
ISC
AL
YE
AR
S(i
n th
ousa
nds
of d
olla
rs)
UN
AU
DIT
ED
Fis
cal
Tot
alE
stim
ated
Ass
esse
dY
ear
Les
s:T
otal
Tax
able
Dir
ect
Act
ual
Val
ue
as a
En
ded
Res
iden
tial
Com
mer
cial
Mot
orT
ax E
xem
pt
Ass
esse
dT
ax
Tax
able
Per
cen
tage
of
Ju
ne
30P
rop
erty
Pro
per
tyV
ehic
les
Oth
erR
eal P
rop
erty
Val
ue
Rat
eV
alu
eA
ctu
al V
alu
e
2010
24,9
96$
46
,440
6,47
7
10
,291
3,45
6
84
,748
$
12
5
1,
588,
087
$
5.
34%
2011
25,5
68
46
,861
6,41
5
10
,494
2,79
3
86
,545
12
5
1,
618,
723
5.
35%
2012
25,9
28
46
,454
7,00
6
10
,730
1,74
7
88
,371
12
5
1,
631,
336
5.
42%
2013
25,8
97
47
,135
7,63
6
10
,012
1,37
7
89
,303
12
5
1,
648,
429
5.
42%
2014
27,4
64
48
,981
8,18
1
8,
865
1,
626
91,8
65
125
1,72
2,66
6
5.33
%20
1527
,704
50,9
31
8,
736
10,5
00
1,
634
96,2
37
118
1,77
8,42
8
5.41
%20
1628
,081
51,6
89
9,
118
11,7
47
6,
871
93,7
64
118
1,81
9,23
5
5.15
%20
1728
,407
52,6
99
9,
244
11,0
33
1,
963
99,4
20
118
1,84
1,29
3
5.40
%20
1830
,152
55,2
13
9,
352
11,0
90
1,
962
103,
845
116
1,92
6,39
7
5.39
%20
1930
,575
$
55,7
34
9,
279
11,0
87
1,
795
104,
880
$
116
1,94
3,61
8$
5.40
%
Sou
rce:
And
erso
n C
ount
y A
sses
sors
Off
ice
Rea
l Pro
per
tyP
erso
nal
Pro
per
ty
140

CIT
Y O
F A
ND
ER
SO
N, S
OU
TH
CA
RO
LIN
AT
able
7
PR
OP
ER
TY
TA
X R
AT
ES
- D
IRE
CT
AN
D O
VE
RL
AP
PIN
G G
OV
ER
NM
EN
TS
LA
ST
TE
N F
ISC
AL
YE
AR
S
UN
AU
DIT
ED
Cit
y of
An
der
son
(1)
(2)
(3)
Tot
alT
otal
Deb
tT
otal
Deb
tT
otal
Dir
ect
&F
isca
lC
ity
Op
erat
ing
Ser
vice
Cou
nty
Op
erat
ing
Ser
vice
Sch
ool
Ove
rlap
pin
gY
ear
Mil
lage
Mil
lage
Mil
lage
Mil
lage
Mil
lage
Mil
lage
Mil
lage
Rat
es
2010
125.
0075
.40
8.50
83.9
015
4.90
32.0
018
6.90
395.
8020
1112
5.00
77.3
07.
6084
.90
156.
0030
.00
186.
0039
5.90
2012
125.
0078
.70
6.20
84.9
015
8.90
30.0
018
8.90
398.
8020
1312
5.00
78.7
05.
7084
.40
164.
9030
.00
194.
9040
4.30
2014
125.
0082
.10
3.50
85.6
016
8.90
25.0
019
3.90
404.
5020
1511
8.00
83.1
02.
2085
.30
172.
5021
.00
193.
5039
6.80
2016
118.
0083
.70
2.30
86.0
017
7.10
21.0
019
8.10
402.
1020
1711
8.00
83.1
02.
2085
.30
177.
7017
.00
194.
7039
8.00
2018
116.
0081
.70
2.20
83.9
017
7.70
17.0
019
4.70
394.
6020
1911
6.00
82.7
02.
1084
.80
183.
5017
.00
200.
5040
1.30
(1)
Tot
al C
ity
mil
lage
not
bro
ken
dow
n by
Cit
y of
fici
als;
levi
ed a
s on
e m
illa
ge a
mou
nt.
(2)
Inf
orm
atio
n fr
om A
nder
son
Cou
nty.
(3)
Inf
orm
atio
n fr
om A
nder
son
Sch
ool D
istr
ict #
5.
Not
e: O
verl
appi
ng r
ates
are
thos
e of
loca
l and
cou
nty
gove
rnm
ents
that
app
ly to
pro
pert
y ow
ners
wit
hin
the
Cit
y of
And
erso
n.
Ove
rlap
pin
g R
ates
Cou
nty
Sch
ool D
istr
ict
141
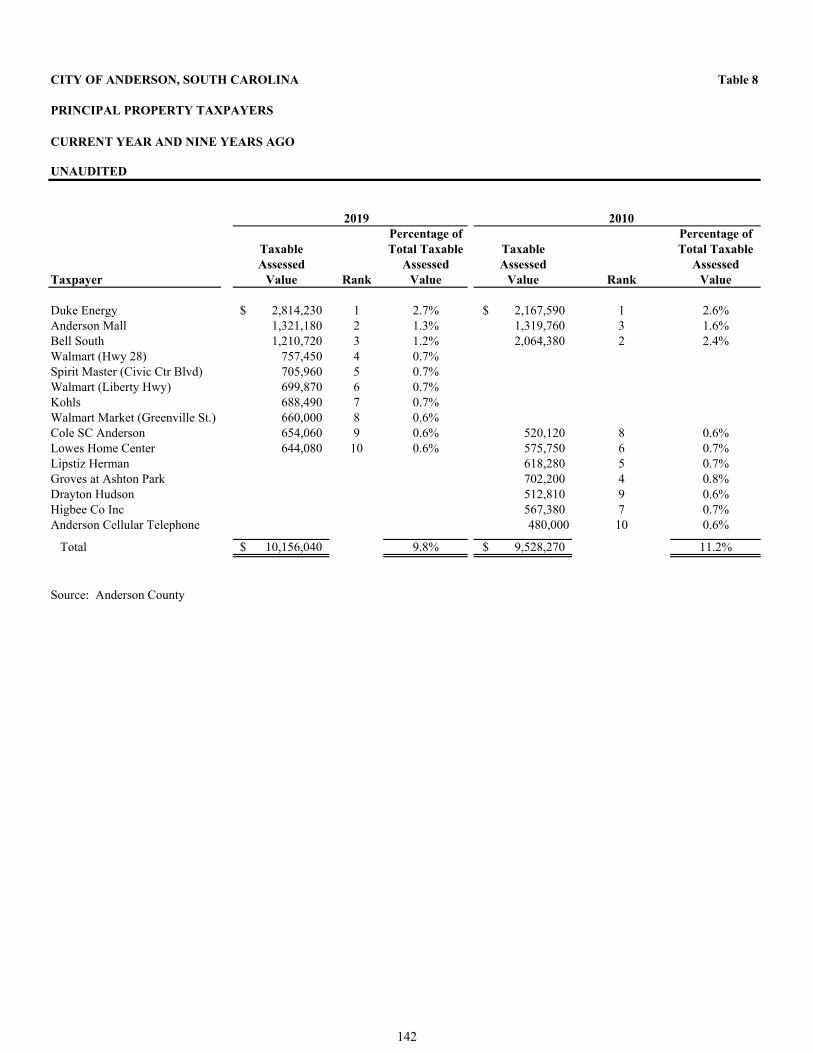
CITY OF ANDERSON, SOUTH CAROLINA Table 8
PRINCIPAL PROPERTY TAXPAYERS
CURRENT YEAR AND NINE YEARS AGO
UNAUDITED
2019 2010
Percentage of Percentage ofTaxable Total Taxable Taxable Total TaxableAssessed Assessed Assessed Assessed
Taxpayer Value Rank Value Value Rank Value
Duke Energy 2,814,230$ 1 2.7% 2,167,590$ 1 2.6%Anderson Mall 1,321,180 2 1.3% 1,319,760 3 1.6%Bell South 1,210,720 3 1.2% 2,064,380 2 2.4%Walmart (Hwy 28) 757,450 4 0.7%Spirit Master (Civic Ctr Blvd) 705,960 5 0.7%Walmart (Liberty Hwy) 699,870 6 0.7%Kohls 688,490 7 0.7%Walmart Market (Greenville St.) 660,000 8 0.6%Cole SC Anderson 654,060 9 0.6% 520,120 8 0.6%Lowes Home Center 644,080 10 0.6% 575,750 6 0.7%Lipstiz Herman 618,280 5 0.7%Groves at Ashton Park 702,200 4 0.8%Drayton Hudson 512,810 9 0.6%Higbee Co Inc 567,380 7 0.7%Anderson Cellular Telephone 480,000 10 0.6%
Total 10,156,040$ 9.8% 9,528,270$ 11.2%
Source: Anderson County
142
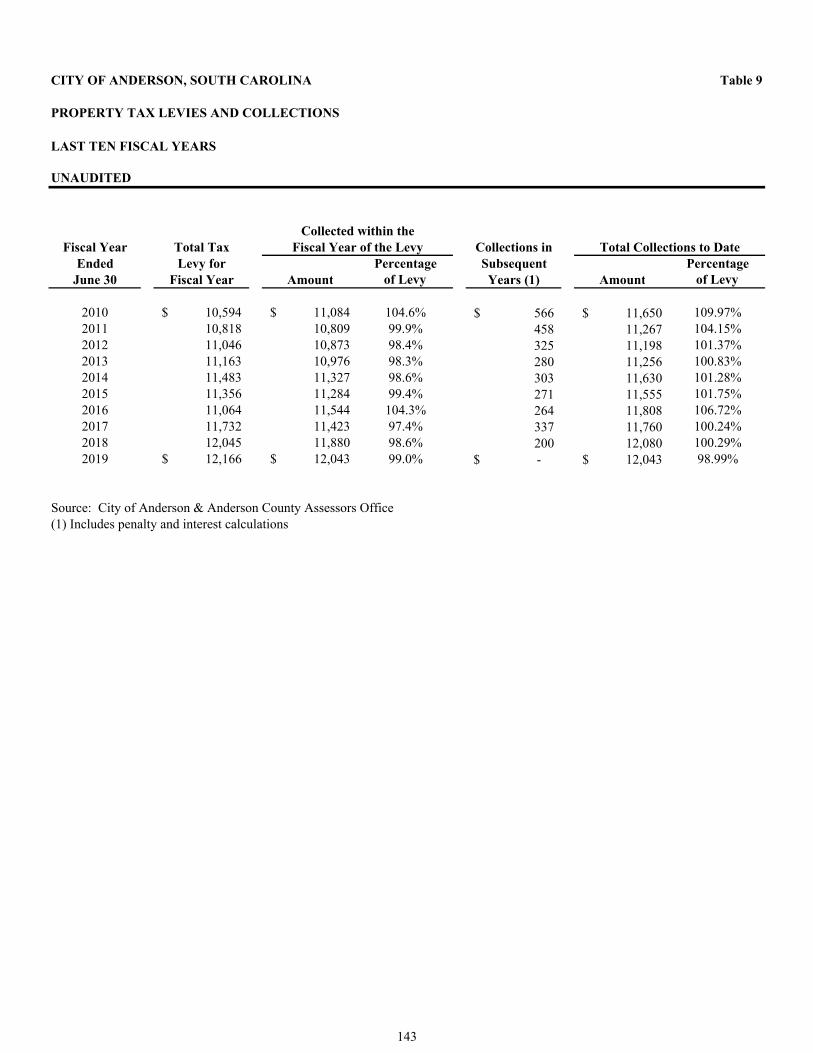
CITY OF ANDERSON, SOUTH CAROLINA Table 9
PROPERTY TAX LEVIES AND COLLECTIONS
LAST TEN FISCAL YEARS
UNAUDITED
Fiscal Year Total Tax Collections inEnded Levy for Percentage Subsequent Percentage
June 30 Fiscal Year Amount of Levy Years (1) Amount of Levy
2010 10,594$ 11,084$ 104.6% 566$ 11,650$ 109.97%2011 10,818 10,809 99.9% 458 11,267 104.15%2012 11,046 10,873 98.4% 325 11,198 101.37%2013 11,163 10,976 98.3% 280 11,256 100.83%2014 11,483 11,327 98.6% 303 11,630 101.28%2015 11,356 11,284 99.4% 271 11,555 101.75%2016 11,064 11,544 104.3% 264 11,808 106.72%2017 11,732 11,423 97.4% 337 11,760 100.24%2018 12,045 11,880 98.6% 200 12,080 100.29%2019 12,166$ 12,043$ 99.0% -$ 12,043$ 98.99%
Source: City of Anderson & Anderson County Assessors Office(1) Includes penalty and interest calculations
Collected within theFiscal Year of the Levy Total Collections to Date
143
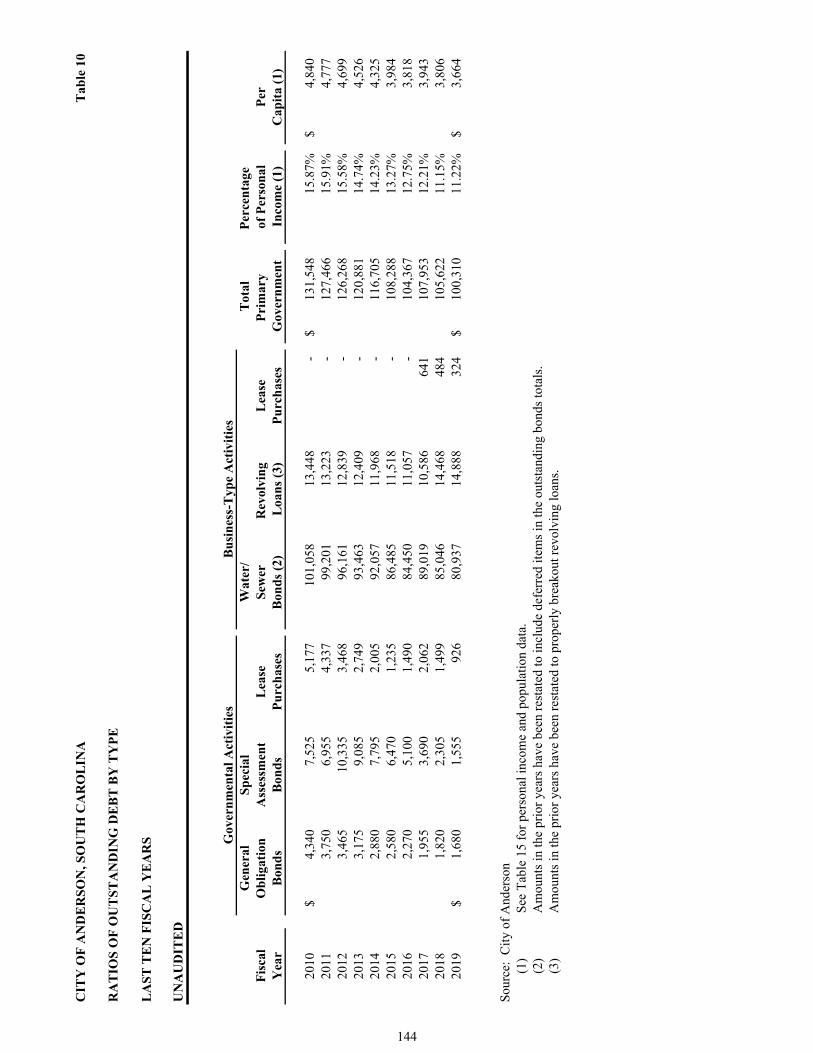
CIT
Y O
F A
ND
ER
SO
N, S
OU
TH
CA
RO
LIN
AT
able
10
RA
TIO
S O
F O
UT
ST
AN
DIN
G D
EB
T B
Y T
YP
E
LA
ST
TE
N F
ISC
AL
YE
AR
S
UN
AU
DIT
ED
Gen
eral
Sp
ecia
lW
ater
/T
otal
Per
cen
tage
F
isca
lO
bli
gati
onA
sses
smen
tL
ease
Sew
erR
evol
vin
g L
ease
Pri
mar
y of
Per
son
alP
erY
ear
Bon
ds
Bon
ds
Pu
rch
ases
Bon
ds
(2)
Loa
ns
(3)
Pu
rch
ases
Gov
ern
men
tIn
com
e (1
)C
apit
a (1
)
2010
4,34
0$
7,52
5
5,17
7
101,
058
13,4
48
-
13
1,54
8$
15
.87%
4,84
0$
2011
3,75
0
6,95
5
4,33
7
99,2
01
13,2
23
-
12
7,46
6
15
.91%
4,77
7
2012
3,46
5
10,3
35
3,46
8
96,1
61
12,8
39
-
12
6,26
8
15
.58%
4,69
9
2013
3,17
5
9,08
5
2,74
9
93,4
63
12,4
09
-
12
0,88
1
14
.74%
4,52
6
2014
2,88
0
7,79
5
2,00
5
92,0
57
11,9
68
-
11
6,70
5
14
.23%
4,32
5
2015
2,58
0
6,47
0
1,23
5
86,4
85
11,5
18
-
10
8,28
8
13
.27%
3,98
4
2016
2,27
0
5,10
0
1,49
0
84,4
50
11,0
57
-
10
4,36
7
12
.75%
3,81
8
2017
1,95
5
3,69
0
2,06
2
89,0
19
10,5
86
641
107,
953
12.2
1%3,
943
20
181,
820
2,
305
1,
499
85
,046
14
,468
48
4
10
5,62
2
11
.15%
3,80
6
2019
1,68
0$
1,55
5
926
80,9
37
14,8
88
324
100,
310
$
11.2
2%3,
664
$
Sou
rce:
Cit
y of
And
erso
n (1
)S
ee T
able
15
for
pers
onal
inco
me
and
popu
lati
on d
ata.
(2)
Am
ount
s in
the
prio
r ye
ars
have
bee
n re
stat
ed to
incl
ude
defe
rred
item
s in
the
outs
tand
ing
bond
s to
tals
.(3
)A
mou
nts
in th
e pr
ior
year
s ha
ve b
een
rest
ated
to p
rope
rly
brea
kout
rev
olvi
ng lo
ans.
Gov
ern
men
tal A
ctiv
itie
sB
usi
nes
s-T
ype
Act
ivit
ies
144
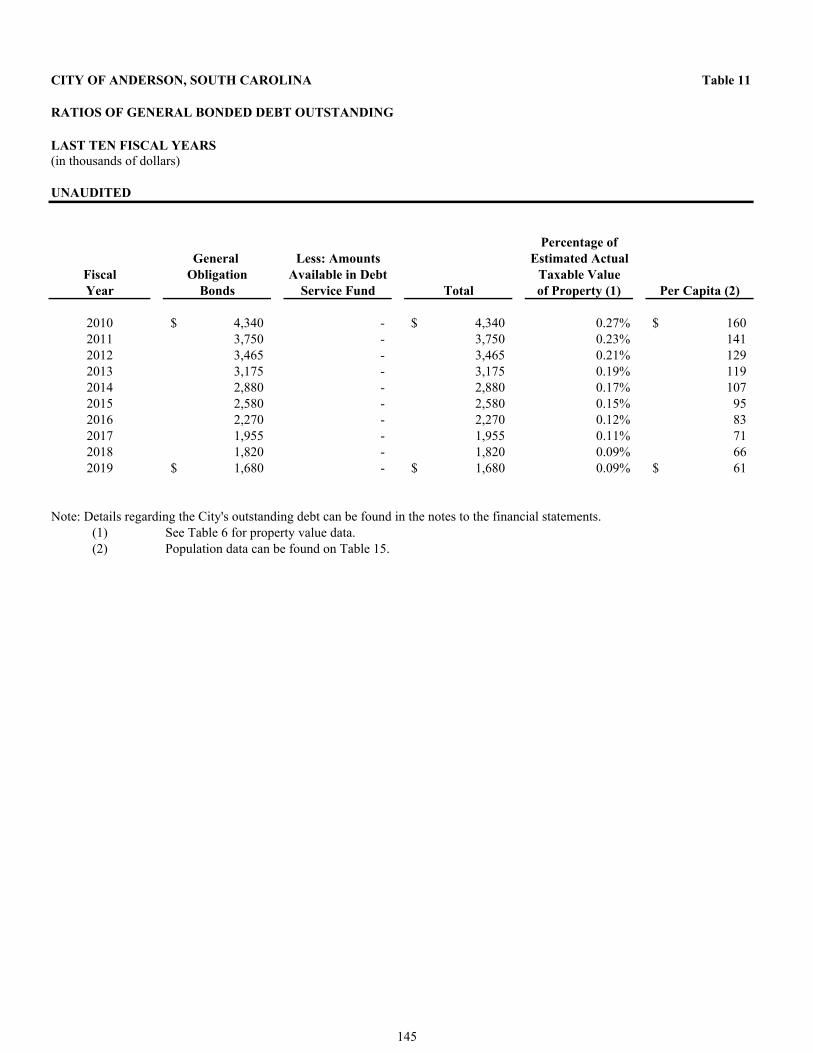
CITY OF ANDERSON, SOUTH CAROLINA Table 11
RATIOS OF GENERAL BONDED DEBT OUTSTANDING
LAST TEN FISCAL YEARS(in thousands of dollars)
UNAUDITED
Percentage of
General Less: Amounts Estimated ActualFiscal Obligation Available in Debt Taxable ValueYear Bonds Service Fund Total of Property (1) Per Capita (2)
2010 4,340$ - 4,340$ 0.27% 160$ 2011 3,750 - 3,750 0.23% 141 2012 3,465 - 3,465 0.21% 129 2013 3,175 - 3,175 0.19% 119 2014 2,880 - 2,880 0.17% 107 2015 2,580 - 2,580 0.15% 95 2016 2,270 - 2,270 0.12% 83 2017 1,955 - 1,955 0.11% 71 2018 1,820 - 1,820 0.09% 66 2019 1,680$ - 1,680$ 0.09% 61$
Note: Details regarding the City's outstanding debt can be found in the notes to the financial statements.(1) See Table 6 for property value data.(2) Population data can be found on Table 15.
145
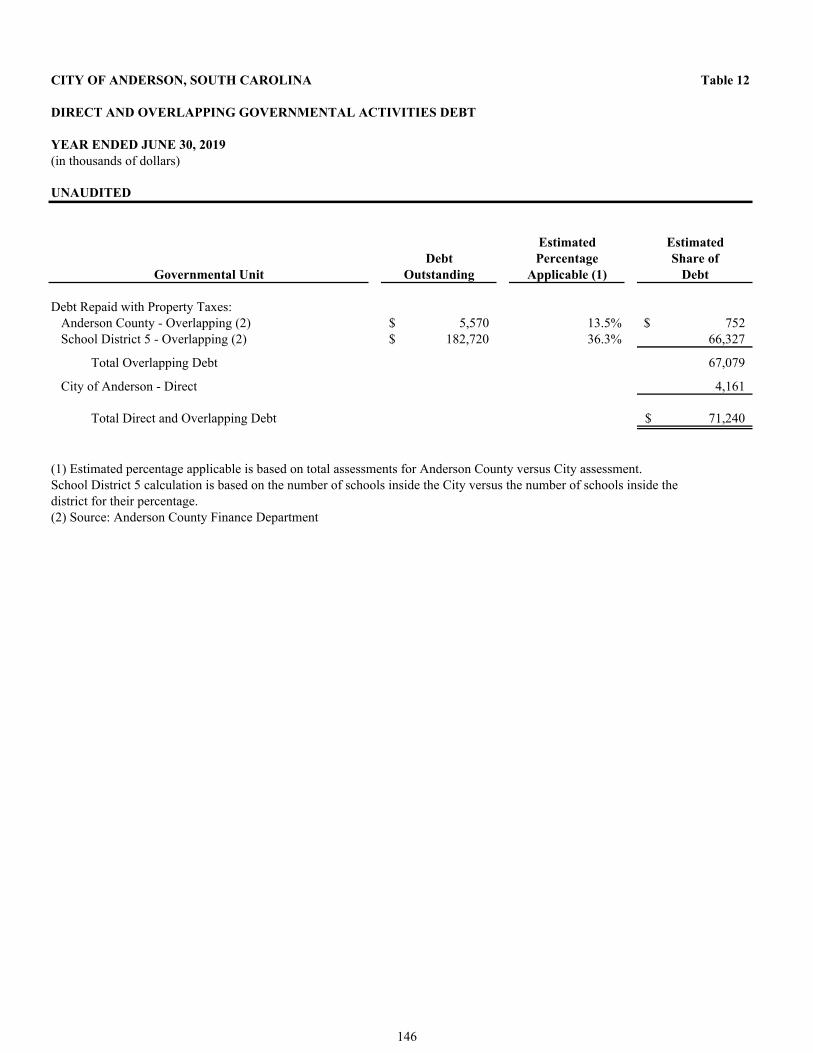
CITY OF ANDERSON, SOUTH CAROLINA Table 12
DIRECT AND OVERLAPPING GOVERNMENTAL ACTIVITIES DEBT
YEAR ENDED JUNE 30, 2019(in thousands of dollars)
UNAUDITED
Estimated EstimatedDebt Percentage Share of
Governmental Unit Outstanding Applicable (1) Debt
Debt Repaid with Property Taxes:Anderson County - Overlapping (2) 5,570$ 13.5% 752$ School District 5 - Overlapping (2) 182,720$ 36.3% 66,327
Total Overlapping Debt 67,079
City of Anderson - Direct 4,161
Total Direct and Overlapping Debt 71,240$
(1) Estimated percentage applicable is based on total assessments for Anderson County versus City assessment. School District 5 calculation is based on the number of schools inside the City versus the number of schools inside the district for their percentage.(2) Source: Anderson County Finance Department
146

CIT
Y O
F A
ND
ER
SO
N, S
OU
TH
CA
RO
LIN
AT
able
13
LE
GA
L D
EB
T M
AR
GIN
IN
FO
RM
AT
ION
LA
ST
TE
N F
ISC
AL
YE
AR
S(i
n th
ousa
nds
of d
olla
rs)
UN
AU
DIT
ED
2010
2011
2012
2013
2014
2015
2016
2017
2018
2019
Deb
t lim
it7,
056
$
7,
147
7,
209
7,
254
7,
479
7,
830
8,
051
8,11
1
8,46
5
8,53
4$
Tot
al n
et d
ebt a
ppli
cabl
e to
lim
it4,
340
3,
750
3,
465
3,
175
2,
880
2,
580
2,
270
1,95
5
1,82
0
1,68
0
Leg
al d
ebt m
argi
n2,
716
$
3,
397
3,
744
4,
079
4,
599
5,
250
5,
781
6,15
6
6,64
5
6,85
4$
Tot
al n
et d
ebt a
ppli
cabl
e to
the
lim
itas
a p
erce
ntag
e of
deb
t lim
it61
.51%
52.4
7%48
.06%
43.7
7%38
.51%
32.9
5%28
.20%
24.1
0%21
.50%
19.6
9%
Leg
al D
ebt
Mar
gin
Cal
cula
tion
for
Cu
rren
t F
isca
l Yea
r
Ass
esse
d V
alue
104,
880
$ A
dd b
ack:
exe
mpt
rea
l pro
pert
y1,
795
T
otal
ass
esse
d va
lue
106,
675
Deb
t lim
it (
8% o
f to
tal a
sses
sed
valu
e)8,
534
D
ebt a
ppli
cabl
e to
lim
it:
G
ener
al o
blig
atio
n bo
nds
(1,6
80)
Leg
al d
ebt m
argi
n6,
854
$
Fis
cal Y
ear
147
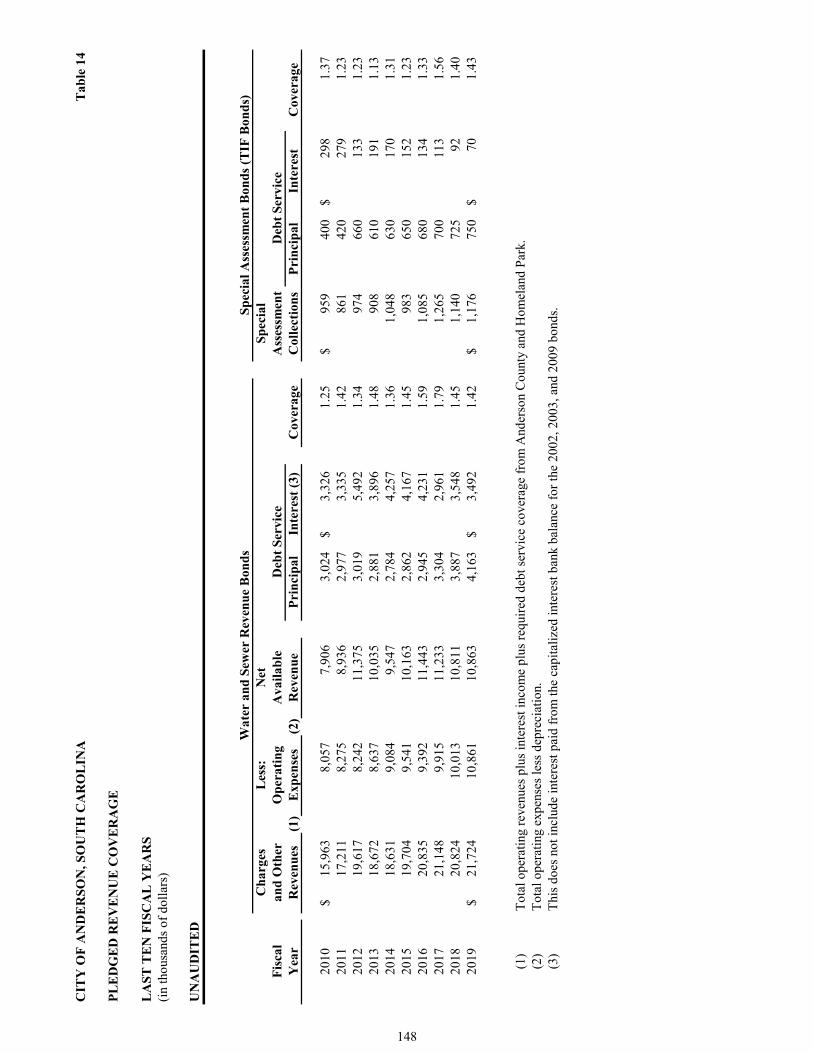
CIT
Y O
F A
ND
ER
SO
N, S
OU
TH
CA
RO
LIN
AT
able
14
PL
ED
GE
D R
EV
EN
UE
CO
VE
RA
GE
LA
ST
TE
N F
ISC
AL
YE
AR
S(i
n th
ousa
nds
of d
olla
rs)
UN
AU
DIT
ED
Ch
arge
sL
ess:
Net
Sp
ecia
lF
isca
lan
d O
ther
Op
erat
ing
Ava
ilab
leA
sses
smen
tY
ear
Rev
enu
es(1
)E
xpen
ses
(2)
Rev
enu
eP
rin
cip
alIn
tere
st (
3)C
over
age
Col
lect
ion
sP
rin
cip
alIn
tere
stC
over
age
2010
15,9
63$
8,
057
7,90
6
3,
024
3,32
6$
1.
2595
9$
400
29
8$
1.37
20
1117
,211
8,27
5
8,
936
2,97
7
3,
335
1.42
861
42
0
279
1.
23
2012
19,6
17
8,
242
11,3
75
3,
019
5,49
2
1.
3497
4
660
13
3
1.23
20
1318
,672
8,63
7
10
,035
2,88
1
3,
896
1.48
908
61
0
191
1.
13
2014
18,6
31
9,
084
9,54
7
2,
784
4,25
7
1.
361,
048
630
17
0
1.31
20
1519
,704
9,54
1
10
,163
2,86
2
4,
167
1.45
983
65
0
152
1.
23
2016
20,8
35
9,
392
11,4
43
2,
945
4,23
1
1.
591,
085
680
13
4
1.33
20
1721
,148
9,91
5
11
,233
3,30
4
2,
961
1.79
1,26
5
70
0
113
1.
56
2018
20,8
24
10
,013
10,8
11
3,
887
3,54
8
1.
451,
140
725
92
1.40
20
1921
,724
$
10,8
61
10
,863
4,16
3
3,
492
$
1.42
1,17
6$
75
0
70$
1.
43
(1)
Tot
al o
pera
ting
rev
enue
s pl
us in
tere
st in
com
e pl
us r
equi
red
debt
ser
vice
cov
erag
e fr
om A
nder
son
Cou
nty
and
Hom
elan
d P
ark.
(2)
Tot
al o
pera
ting
exp
ense
s le
ss d
epre
ciat
ion.
(3)
Thi
s do
es n
ot in
clud
e in
tere
st p
aid
from
the
capi
tali
zed
inte
rest
ban
k ba
lanc
e fo
r th
e 20
02, 2
003,
and
200
9 bo
nds.
Wat
er a
nd
Sew
er R
even
ue
Bon
ds
Sp
ecia
l Ass
essm
ent
Bon
ds
(TIF
Bon
ds)
Deb
t S
ervi
ceD
ebt
Ser
vice
148
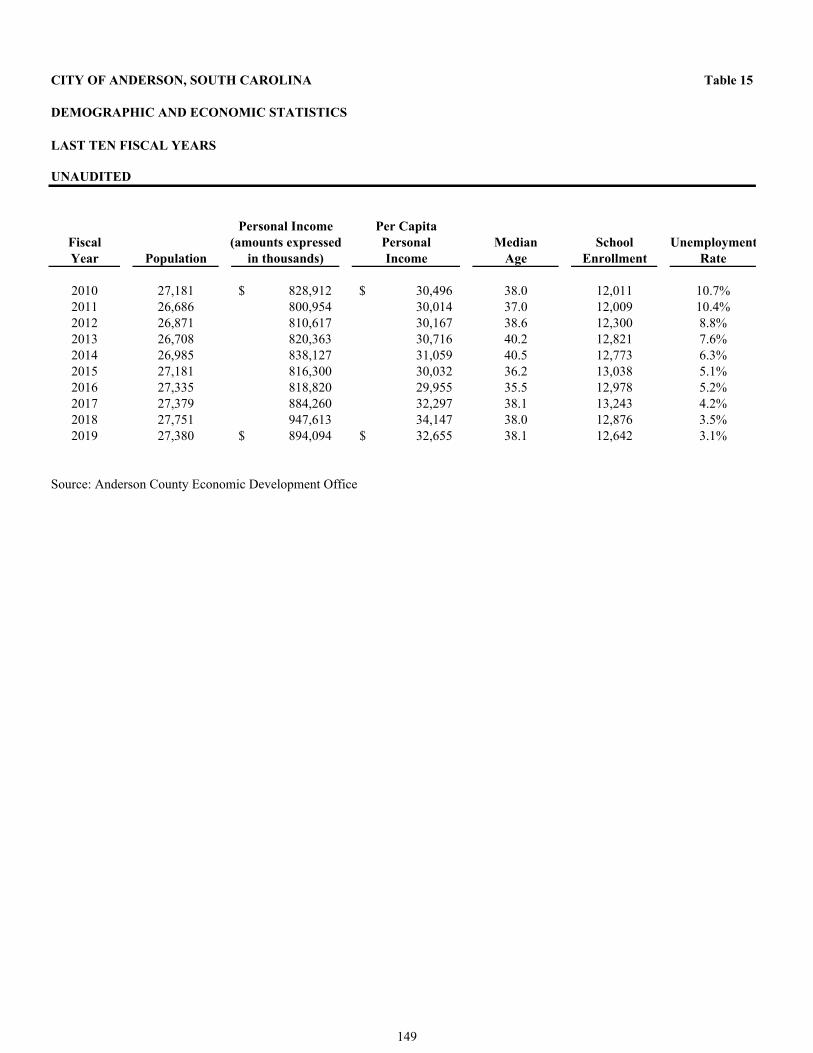
CITY OF ANDERSON, SOUTH CAROLINA Table 15
DEMOGRAPHIC AND ECONOMIC STATISTICS
LAST TEN FISCAL YEARS
UNAUDITED
Personal Income Per CapitaFiscal (amounts expressed Personal Median School UnemploymentYear Population in thousands) Income Age Enrollment Rate
2010 27,181 828,912$ 30,496$ 38.0 12,011 10.7%2011 26,686 800,954 30,014 37.0 12,009 10.4%2012 26,871 810,617 30,167 38.6 12,300 8.8%2013 26,708 820,363 30,716 40.2 12,821 7.6%2014 26,985 838,127 31,059 40.5 12,773 6.3%2015 27,181 816,300 30,032 36.2 13,038 5.1%2016 27,335 818,820 29,955 35.5 12,978 5.2%2017 27,379 884,260 32,297 38.1 13,243 4.2%2018 27,751 947,613 34,147 38.0 12,876 3.5%2019 27,380 894,094$ 32,655$ 38.1 12,642 3.1%
Source: Anderson County Economic Development Office
149
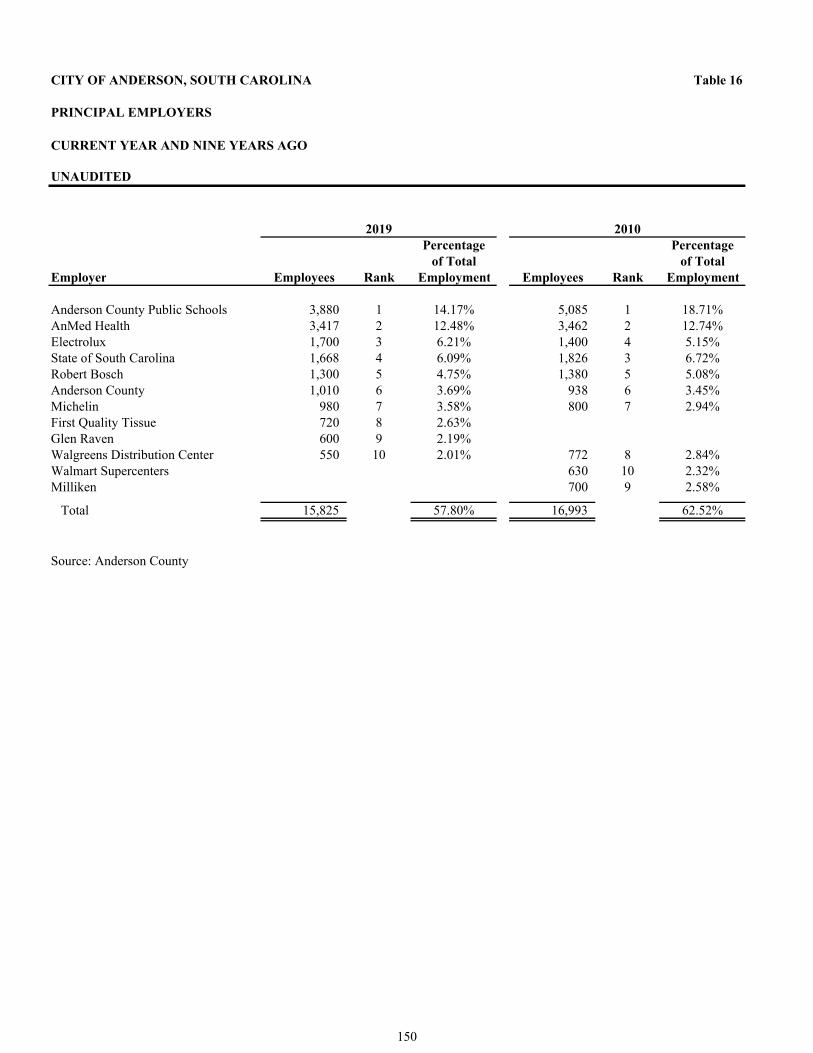
CITY OF ANDERSON, SOUTH CAROLINA Table 16
PRINCIPAL EMPLOYERS
CURRENT YEAR AND NINE YEARS AGO
UNAUDITED
Percentage Percentageof Total of Total
Employer Employees Rank Employment Employees Rank Employment
Anderson County Public Schools 3,880 1 14.17% 5,085 1 18.71%AnMed Health 3,417 2 12.48% 3,462 2 12.74%Electrolux 1,700 3 6.21% 1,400 4 5.15%State of South Carolina 1,668 4 6.09% 1,826 3 6.72%Robert Bosch 1,300 5 4.75% 1,380 5 5.08%Anderson County 1,010 6 3.69% 938 6 3.45%Michelin 980 7 3.58% 800 7 2.94%First Quality Tissue 720 8 2.63%Glen Raven 600 9 2.19%Walgreens Distribution Center 550 10 2.01% 772 8 2.84%Walmart Supercenters 630 10 2.32%Milliken 700 9 2.58%
Total 15,825 57.80% 16,993 62.52%
Source: Anderson County
2019 2010
150
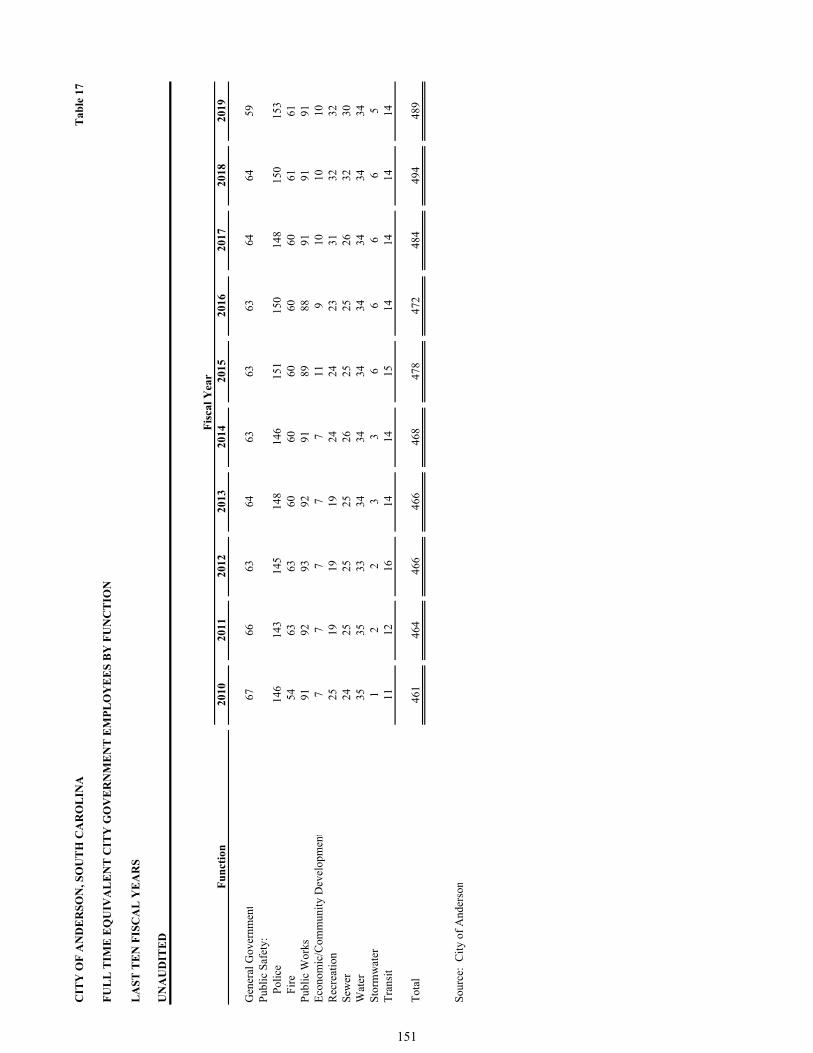
CIT
Y O
F A
ND
ER
SO
N, S
OU
TH
CA
RO
LIN
AT
able
17
FU
LL
TIM
E E
QU
IVA
LE
NT
CIT
Y G
OV
ER
NM
EN
T E
MP
LO
YE
ES
BY
FU
NC
TIO
N
LA
ST
TE
N F
ISC
AL
YE
AR
S
UN
AU
DIT
ED
Fis
cal Y
ear
Fu
nct
ion
2010
2011
2012
2013
2014
2015
2016
2017
2018
2019
Gen
eral
Gov
ernm
ent
6766
6364
6363
6364
6459
Pub
lic
Saf
ety:
Pol
ice
146
143
145
148
146
151
150
148
150
153
Fir
e54
6363
6060
6060
6061
61P
ubli
c W
orks
9192
9392
9189
8891
9191
Eco
nom
ic/C
omm
unit
y D
evel
opm
ent
77
77
711
910
1010
Rec
reat
ion
2519
1919
2424
2331
3232
Sew
e r24
2525
2526
2525
2632
30W
ater
35
3533
3434
3434
3434
34S
torm
wat
e r1
22
33
66
66
5T
rans
it11
1216
1414
1514
1414
14
Tot
al46
146
446
646
646
847
847
248
449
448
9
Sou
rce:
Cit
y of
And
erso
n
151
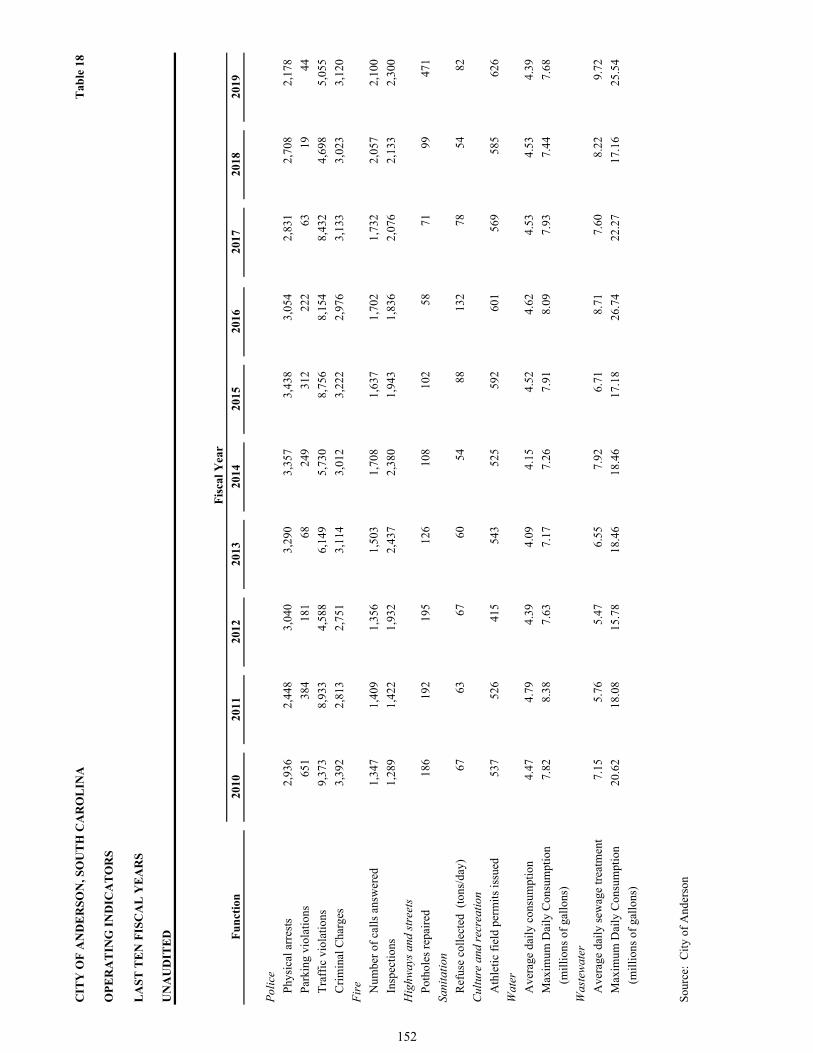
CIT
Y O
F A
ND
ER
SO
N, S
OU
TH
CA
RO
LIN
AT
able
18
OP
ER
AT
ING
IN
DIC
AT
OR
S
LA
ST
TE
N F
ISC
AL
YE
AR
S
UN
AU
DIT
ED F
un
ctio
n20
1020
1120
1220
1320
1420
1520
1620
1720
1820
19
Pol
ice
Phy
sica
l arr
ests
2,93
6
2,
448
3,04
0
3,
290
3,35
7
3,
438
3,05
4
2,
831
2,70
8
2,
178
Par
king
vio
lati
ons
651
38
4
181
68
24
9
312
22
2
63
19
44
Tra
ffic
vio
lati
ons
9,37
3
8,
933
4,58
8
6,
149
5,73
0
8,
756
8,15
4
8,
432
4,69
8
5,
055
Cri
min
al C
harg
es3,
392
2,81
3
2,
751
3,11
4
3,
012
3,22
2
2,
976
3,13
3
3,
023
3,12
0
Fir
e Num
ber
of c
alls
ans
wer
ed1,
347
1,40
9
1,
356
1,50
3
1,
708
1,63
7
1,
702
1,73
2
2,
057
2,10
0
Insp
ecti
ons
1,28
9
1,
422
1,93
2
2,
437
2,38
0
1,
943
1,83
6
2,
076
2,13
3
2,
300
Hig
hway
s an
d st
reet
s
Pot
hole
s re
pair
ed18
6
192
19
5
126
10
8
102
58
71
99
47
1
Sani
tati
on
Ref
use
coll
ecte
d (
tons
/day
)67
63
67
60
54
88
13
2
78
54
82
Cul
ture
and
rec
reat
ion
Ath
leti
c fi
eld
perm
its
issu
ed53
7
526
41
5
543
52
5
592
60
1
569
58
5
626
Wat
er
Ave
rage
dai
ly c
onsu
mpt
ion
4.47
4.79
4.39
4.09
4.15
4.52
4.62
4.53
4.53
4.39
Max
imum
Dai
ly C
onsu
mpt
ion
7.82
8.38
7.63
7.17
7.26
7.91
8.09
7.93
7.44
7.68
(mil
lion
s of
gal
lons
)
Was
tew
ater
Ave
rage
dai
ly s
ewag
e tr
eatm
ent
7.15
5.76
5.47
6.55
7.92
6.71
8.71
7.60
8.22
9.72
Max
imum
Dai
ly C
onsu
mpt
ion
20.6
2
18
.08
15.7
8
18
.46
18.4
6
17
.18
26.7
4
22
.27
17.1
6
25
.54
(mil
lion
s of
gal
lons
)
Sou
rce:
Cit
y of
And
erso
n
Fis
cal Y
ear
152

CIT
Y O
F A
ND
ER
SO
N, S
OU
TH
CA
RO
LIN
AT
able
19
CA
PIT
AL
AS
SE
T S
TA
TIS
TIC
S
LA
ST
TE
N F
ISC
AL
YE
AR
S
UN
AU
DIT
ED
Fis
cal Y
ear
Fu
nct
ion
2010
2011
2012
2013
2014
2015
2016
2017
2018
2019
Pub
lic
safe
tyP
olic
e:S
tati
ons
11
11
11
11
11
Sub
stat
ions
24
44
21
11
11
Pat
rol u
nits
9596
9597
9510
110
110
110
110
6F
ire
Sta
tion
s3
33
33
33
33
3Sa
nita
tion
Col
lect
ion
truc
ks10
1010
108
1010
1012
14H
ighw
ays
and
stre
ets
Str
eets
(m
iles
)20
620
620
620
620
720
720
720
720
720
7S
tree
tlig
hts
3,41
33,
413
3,41
33,
413
3413
3413
3413
3413
3806
3807
Tra
ffic
sig
nals
8787
8787
8888
8888
8686
Cul
ture
and
rec
reat
ion
Par
ks a
crea
ge18
118
118
118
518
618
618
618
818
813
4P
arks
1818
1818
1919
1920
2022
Sw
imm
ing
pool
s1
00
00
00
00
0T
enni
s co
urts
1212
50
00
00
00
Com
mun
ity
cent
ers
32
22
22
21
11
Wat
er
Wat
er m
ains
(m
iles
)36
836
836
836
936
936
936
936
927
037
0E
leva
ted
Tan
ks
88
88
88
88
87
Tot
al S
tora
ge C
apac
ity
3,60
0,00
0
3,
600,
000
3,60
0,00
0
3,
600,
000
3,60
0,00
03,
600,
000
3,60
0,00
03,
600,
000
3,60
0,00
03,
600,
000
Num
ber
of m
eter
s16
,511
16,5
0916
,604
16,6
4416
,608
16,6
9116
,792
16,9
7517
,228
17,0
45F
ire
Hyd
rant
s1,
028
1,02
81,
028
1,02
91,
029
1,02
91,
035
1,04
01,
045
1,04
6N
ew C
onne
ctio
n s55
5448
8966
7613
718
416
917
1W
ater
Mai
n B
reak
s73
105
8152
7154
8010
111
062
Max
imum
dai
ly c
apac
ity
*14
.12
14.1
214
.12
14.1
214
.12
14.1
214
.12
14.1
214
.12
14.1
2Se
wer
Num
ber
of tr
eatm
ent p
lant
s2
22
22
22
22
2N
umbe
r of
pum
ping
sta
tion
s6
66
66
66
66
5S
anit
ary
Sew
er M
iles
172
172
172
172
172
277
277
278
279
279
Num
ber
of s
ervi
ce c
onne
ctio
n s18
,322
18,2
3319
,311
19,7
9719
,699
19,9
0220
,101
20,4
3820
,600
20,9
20M
axim
um d
aily
trea
tmen
t cap
acit
y *
16.1
19.5
19.5
19.5
19.5
19.5
19.5
19.5
19.5
19.5
Sou
rce:
Cit
y of
And
erso
n *
In m
illi
ons
of g
allo
n s
153

This page is intentionally left blank
154

CITY OF ANDERSON, SOUTH CAROLINA
SCHEDULE OF EXPENDITURES OF FEDERAL AWARDS
YEAR ENDED JUNE 30, 2019
FederalCFDA Grant/Contract Federal
Federal Grantor/ Pass-through Grantor/Program or Cluster Title: Number Number Expenditures
US DEPARTMENT OF HOUSING / URBAN DEVELOPMENT
Direct Programs:Community Development Block Grants 14.218 N/A 1,035,627$ Neighborhood Stabilization Program 14.228 N/A 50,204
Pass-through From SC State Housing Finance and Development Authority:HOME Program 14.239 M16-DC-45-0212 60,758
TOTAL US DEPARTMENT OF HOUSING / URBAN DEVELOPMENT 1,146,589
US DEPARTMENT OF TRANSPORTATION
Direct Programs:Federal Transportation Administration Grants Cluster - Section 9 20.507 N/A 354,222 Traffic Enforcement Unit Grant 20.600 N/A 94,366
Pass-through From SC Department of Transportation:Highway Planning and Construction - ANATS 20.205 N/A 198,805 Formula Grants for Rural Areas 20.509 PT-77911-39 119,306
TOTAL US DEPARTMENT OF TRANSPORTATION 766,699
US DEPARTMENT OF HOMELAND SECURITY
Direct Programs:Federal Emergency Management Agency ("FEMA") 97.044 N/A 16,506 Incident Management Team 97.067 N/A 45,794
TOTAL US DEPARTMENT OF HOMELAND SECURITY 62,300
US DEPARTMENT OF JUSTICE
Direct Programs:JAG - Direct Award 2019 16.738 38,272
Pass-through From South Carolina Department of Public Safety:VAWA 16.588 1K16010 68,294
TOTAL US DEPARTMENT OF JUSTICE 106,566
US DEPARTMENT OF EDUCATION
Direct Programs:Law Enforcement Victims Advocate 84.923 N/A 73,435
TOTAL US DEPARTMENT OF EDUCATION 73,435
GRAND TOTALS 2,155,589$
See accompanying notes to the schedule of expenditures of federal awards.
155

CITY OF ANDERSON, SOUTH CAROLINA
NOTES TO THE SCHEDULE OF EXPENDITURES OF FEDERAL AWARDS
YEAR ENDED JUNE 30, 2019
A. GENERAL
The accompanying Schedule of Expenditures of Federal Awards (the “Schedule”) presents the activity of all federal award programs of the City of Anderson, South Carolina (the “City”) for the year ended June 30, 2019. Expenditures for federal financial assistance awarded directly from the federal agencies, as well as those passed through other government agencies, are included on the Schedule.
B. BASIS OF ACCOUNTING
The accompanying Schedule is presented using the modified accrual basis of accounting, which is described in the notes to the City’s financial statements.
C. RELATIONSHIP TO THE FINANCIAL STATEMENTS
Federal award expenditures are reported in the City’s financial statements primarily as expenditures in the General Fund and Special Revenue Funds and as expenses in the Proprietary funds for all federal programs.
D. MATCHING COSTS
Matching costs, i.e., the non-federal share of certain program costs, are not included in the accompanying Schedule.
E. SUB-RECIPIENTS
There were no federal expenditures provided to sub-recipients presented in the accompanying Schedule.
F. INDIRECT COST RATE
The City has elected not to use the 10% de minimis indirect cost rate allowed under the Uniform Guidance.
156

REPORT ON INTERNAL CONTROL OVER FINANCIAL REPORTING AND ON COMPLIANCE AND OTHER MATTERS BASED ON AN AUDIT OF FINANCIAL STATEMENTS
PERFORMED IN ACCORDANCE WITH GOVERNMENT AUDITING STANDARDS
INDEPENDENT AUDITOR’S REPORT
The Honorable Mayor and Members of City Council City of Anderson Anderson, South Carolina
We have audited, in accordance with the auditing standards generally accepted in the United States of America and the standards applicable to financial audits contained in Government Auditing Standards issued by the Comptroller General of the United States, the financial statements of the governmental activities, the business-type activities, each major fund, and the aggregate remaining fund information of the City of Anderson, South Carolina (the “City”), as of and for the year ended June 30, 2019, and the related notes to the financial statements, which collectively comprise the City’s basic financial statements, and have issued our report thereon dated November 22, 2019.
Internal Control Over Financial Reporting
In planning and performing our audit of the financial statements, we considered the City’s internal control over financial reporting (internal control) to determine the audit procedures that are appropriate in the circumstances for the purpose of expressing our opinions on the financial statements, but not for the purpose of expressing an opinion on the effectiveness of the City’s internal control. Accordingly, we do not express an opinion on the effectiveness of the City’s internal control.
A deficiency in internal control exists when the design or operation of a control does not allow management or employees, in the normal course of performing their assigned functions, to prevent, or detect and correct, misstatements on a timely basis. A material weakness is a deficiency, or a combination of deficiencies, in internal control, such that there is a reasonable possibility that a material misstatement of the entity’s financial statements will not be prevented, or detected and corrected on a timely basis. A significant deficiency is a deficiency, or a combination of deficiencies, in internal control that is less severe than a material weakness, yet important enough to merit attention by those charged with governance.
Our consideration of internal control was for the limited purpose described in the first paragraph of this section and was not designed to identify all deficiencies in internal control that might be material weaknesses or significant deficiencies. Given these limitations, during our audit we did not identify any deficiencies in internal control that we consider to be material weaknesses. However, material weaknesses may exist that have not been identified.
Compliance and Other Matters
As part of obtaining reasonable assurance about whether the City’s financial statements are free from material misstatement, we performed tests of its compliance with certain provisions of laws, regulations, contracts, and grant agreements, noncompliance with which could have a direct and material effect on the determination of financial statement amounts. However, providing an opinion on compliance with those provisions was not an objective of our audit, and accordingly, we do not express such an opinion. The results of our tests disclosed no instances of noncompliance or other matters that are required to be reported under Government Auditing Standards.
157
Purpose of this Report
The purpose of this report is solely to describe the scope of our testing of internal control and compliance and the results of that testing, and not to provide an opinion on the effectiveness of the entity’s internal control or on compliance. This report is an integral part of an audit performed in accordance with Government Auditing Standards in considering the entity’s internal control and compliance. Accordingly, this communication is not suitable for any other purpose.
Greene Finney, LLP Mauldin, South Carolina November 22, 2019
158

REPORT ON COMPLIANCE FOR EACH MAJOR FEDERAL PROGRAM AND REPORT ON INTERNAL CONTROL OVER COMPLIANCE REQUIRED BY THE UNIFORM GUIDANCE
INDEPENDENT AUDITOR’S REPORT The Honorable Mayor and Members of City Council City of Anderson Anderson, South Carolina Report on Compliance for Each Major Federal Program We have audited the City of Anderson, South Carolina’s (the “City”) compliance with the types of compliance requirements described in the OMB Compliance Supplement that could have a direct and material effect on each of the City’s major federal programs for the year ended June 30, 2019. The City’s major federal programs are identified in the summary of auditor’s results section of the accompanying schedule of findings and questioned costs. Management’s Responsibility Management is responsible for compliance with federal statutes, regulations, and the terms and conditions of its federal awards applicable to its federal programs. Auditor’s Responsibility Our responsibility is to express an opinion on compliance for each of the City’s major federal programs based on our audit of the types of compliance requirements referred to above. We conducted our audit of compliance in accordance with auditing standards generally accepted in the United States of America; the standards applicable to financial audits contained in Government Auditing Standards, issued by the Comptroller General of the United States; and the audit requirements of Title 2 U.S. Code of Federal Regulations Part 200, Uniform Administrative Requirements, Cost Principles, and Audit Requirements for Federal Awards (Uniform Guidance). Those standards and the Uniform Guidance require that we plan and perform the audit to obtain reasonable assurance about whether noncompliance with the types of compliance requirements referred to above that could have a direct and material effect on a major federal program occurred. An audit includes examining, on a test basis, evidence about the City’s compliance with those requirements and performing such other procedures as we considered necessary in the circumstances. We believe that our audit provides a reasonable basis for our opinion on compliance for each major federal program. However, our audit does not provide a legal determination of the City’s compliance. Opinion on Each Major Federal Program In our opinion, the City complied, in all material respects, with the types of compliance requirements referred to above that could have a direct and material effect on each of its major federal programs for the year ended June 30, 2019.
159
Report on Internal Control Over Compliance Management of the City is responsible for establishing and maintaining effective internal control over compliance with the types of compliance requirements referred to above. In planning and performing our audit of compliance, we considered the City’s internal control over compliance with the types of requirements that could have a direct and material effect on each major federal program to determine the auditing procedures that are appropriate in the circumstances for the purpose of expressing an opinion on compliance for each major federal program and to test and report on internal control over compliance in accordance with the Uniform Guidance, but not for the purpose of expressing an opinion on the effectiveness of internal control over compliance. Accordingly, we do not express an opinion on the effectiveness of the City’s internal control over compliance. A deficiency in internal control over compliance exists when the design or operation of a control over compliance does not allow management or employees, in the normal course of performing their assigned functions, to prevent, or detect and correct, noncompliance with a type of compliance requirement of a federal program on a timely basis. A material weakness in internal control over compliance is a deficiency, or combination of deficiencies, in internal control over compliance, such that there is a reasonable possibility that material noncompliance with a type of compliance requirement of a federal program will not be prevented, or detected and corrected, on a timely basis. A significant deficiency in internal control over compliance is a deficiency, or a combination of deficiencies, in internal control over compliance with a type of compliance requirement of a federal program that is less severe than a material weakness in internal control over compliance, yet important enough to merit attention by those charged with governance. Our consideration of internal control over compliance was for the limited purpose described in the first paragraph of this section and was not designed to identify all deficiencies in internal control over compliance that might be material weaknesses or significant deficiencies. We did not identify any deficiencies in internal control over compliance that we consider to be material weaknesses. However, material weaknesses may exist that have not been identified. The purpose of this report on internal control over compliance is solely to describe the scope of our testing of internal control over compliance and the results of that testing based on the requirements of the Uniform Guidance. Accordingly, this report is not suitable for any other purpose.
Greene Finney, LLP Mauldin, South Carolina November 22, 2019
160
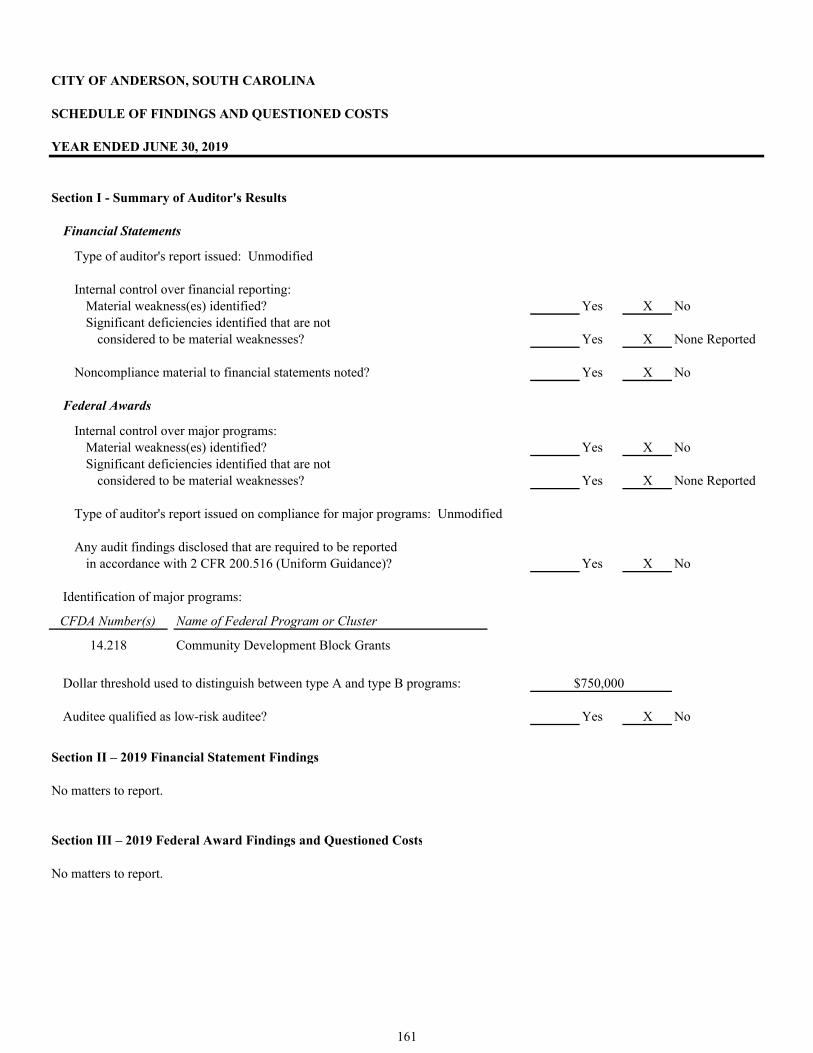
Financial Statements
Type of auditor's report issued: Unmodified
Internal control over financial reporting:Material weakness(es) identified? Yes X NoSignificant deficiencies identified that are not
considered to be material weaknesses? Yes X None Reported
Noncompliance material to financial statements noted? Yes X No
Federal Awards
Internal control over major programs:Material weakness(es) identified? Yes X NoSignificant deficiencies identified that are not
considered to be material weaknesses? Yes X None Reported
Type of auditor's report issued on compliance for major programs: Unmodified
Any audit findings disclosed that are required to be reportedin accordance with 2 CFR 200.516 (Uniform Guidance)? Yes X No
Identification of major programs:
CFDA Number(s) Name of Federal Program or Cluster
14.218 Community Development Block Grants
Dollar threshold used to distinguish between type A and type B programs:
Auditee qualified as low-risk auditee? Yes X No
Section II – 2019 Financial Statement Findings
No matters to report.
Section III – 2019 Federal Award Findings and Questioned Costs
No matters to report.
$750,000
CITY OF ANDERSON, SOUTH CAROLINA
SCHEDULE OF FINDINGS AND QUESTIONED COSTS
YEAR ENDED JUNE 30, 2019
Section I - Summary of Auditor's Results
161

CITY OF ANDERSON, SOUTH CAROLINA
SUMMARY SCHEDULE OF PRIOR AUDIT FINDINGS
YEAR ENDED JUNE 30, 2019
Federal Agency: US Department of Housing and Urban Development “HUD” Pass-Through Agency: Not applicable Community Development Block Grants: CFDA # 14.218 Pass-Through Grantor’s Award Numbers and Years: Not applicable 2018-001: PERIOD OF PERFORMANCE Questioned Costs
$ - 0 - Condition: The City failed to meet the 1.5 timely expenditure standard.
Criteria: As required by 24 CFR section 570.902, on the 60th day prior to the
program year end, the City is required to have no more than 1.5 times its annual grant remaining in the line of credit, including any program income on hand.
Context, Cause, and Effect: In performing our compliance testing related to “Period of
Performance” for the CDBG program in our Single Audit for 2018, we noted that the City failed to meet the 1.5 timely expenditure standard in 2018 (the City failed to meet for 2017 as well). The City met with HUD officials in June 2018 to discuss the noncompliance and whether or not the City’s grant amount will be reduced. HUD’s final decision on the noncompliance was to reduce the City’s grant by $49,224.
Status: The City agreed with the prior year finding and passed the 1.5 timely
expenditure standard in 2019.
162
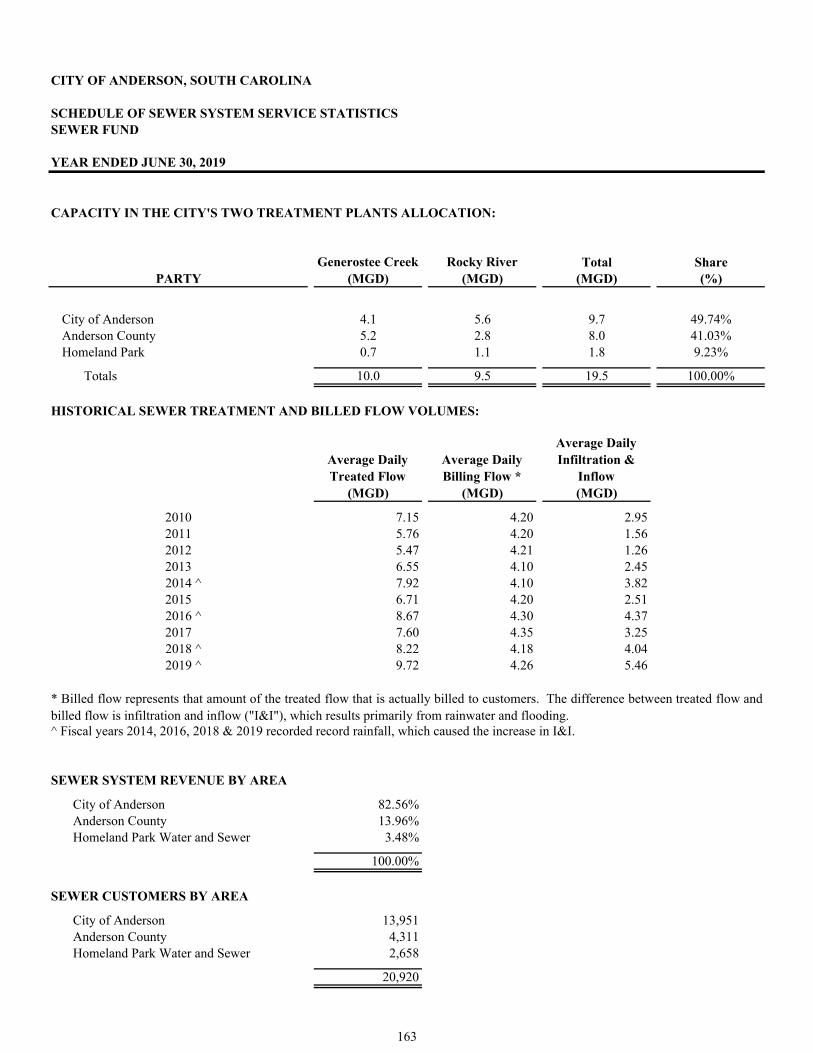
CITY OF ANDERSON, SOUTH CAROLINA
SCHEDULE OF SEWER SYSTEM SERVICE STATISTICSSEWER FUND
YEAR ENDED JUNE 30, 2019
CAPACITY IN THE CITY'S TWO TREATMENT PLANTS ALLOCATION:
Generostee Creek Rocky River Total SharePARTY (MGD) (MGD) (MGD) (%)
City of Anderson 4.1 5.6 9.7 49.74%Anderson County 5.2 2.8 8.0 41.03%Homeland Park 0.7 1.1 1.8 9.23%
Totals 10.0 9.5 19.5 100.00%
HISTORICAL SEWER TREATMENT AND BILLED FLOW VOLUMES:
Average Daily Treated Flow
Average Daily Billing Flow *
Average Daily Infiltration &
Inflow(MGD) (MGD) (MGD)
2010 7.15 4.20 2.952011 5.76 4.20 1.562012 5.47 4.21 1.262013 6.55 4.10 2.45
2014 ^ 7.92 4.10 3.822015 6.71 4.20 2.51
2016 ^ 8.67 4.30 4.372017 7.60 4.35 3.25
2018 ^ 8.22 4.18 4.04 2019 ^ 9.72 4.26 5.46
^ Fiscal years 2014, 2016, 2018 & 2019 recorded record rainfall, which caused the increase in I&I.
SEWER SYSTEM REVENUE BY AREA
City of Anderson 82.56%Anderson County 13.96%Homeland Park Water and Sewer 3.48%
100.00%
SEWER CUSTOMERS BY AREA
City of Anderson 13,951Anderson County 4,311Homeland Park Water and Sewer 2,658
20,920
* Billed flow represents that amount of the treated flow that is actually billed to customers. The difference between treated flow andbilled flow is infiltration and inflow ("I&I"), which results primarily from rainwater and flooding.
163

CITY OF ANDERSON, SOUTH CAROLINA
SCHEDULE OF WATER METER SERVICEWATER FUND
YEAR ENDED JUNE 30, 2019
Size of MeterTotal Active
Meters
3/4" 15,2581" 1,213
1 1/2" 1952" 1843" 344" 76" 318" 310" 1
Grand Total Active Meters 16,926
Size of MeterTotal Length
(Feet)
3/4" 1781" 9,714
1.25" 4,9521.5" 4,3372" 262,2183" 108,6784" 99,9106" 920,498
8" or larger 545,094
Total Length (Feet) 1,955,579
Total Length Miles 370
Fiscal YearBilled Usage
(1,000 Gallons) Customers
2010 1,442,920 16,5112011 1,488,276 16,5092012 1,716,655 16,6042013 1,912,916 16,6442014 1,325,834 16,6082015 1,389,043 16,6912016 1,437,609 16,7922017 1,465,458 16,9752018 1,364,342 17,3692019 1,407,489 16,926
Water Meter Service
Water System Piping
Water System - Usage
164

CITY OF ANDERSON, SOUTH CAROLINA
SCHEDULE OF LARGEST UTILITY USERSWATER AND SEWER FUNDS
YEAR ENDED JUNE 30, 2019
Water Sewer
Gallons % of Total Gallons % of TotalUtility User Used Revenues Revenues Used Revenues Revenues
Owens Corning Fiberglass 69,273,028 197,029$ 2.67%Michelin 59,875,156 164,015 2.22%AnMed Health 43,245,620 98,558 1.34% 27,583,248 182,291$ 2.81%JPS Composite Materials Corp 38,250,476 73,335 0.99% 38,250,476 259,516 3.99%Anderson University 33,502,172 112,712 1.53% 20,432,368 137,386 2.11%Anderson County 23,821,556 112,388 1.52%Plastic Omnium Industries 20,166,828 66,211 0.90%Northlake Condo HOA 12,199,132 50,423 0.68%Ashford Pointe LLC 9,795,808 21,827 0.30% 9,615,540 65,298 1.01%McLaughline Body Company 6,898,804 31,586 0.43%Anderson Health Care 8,619,952 58,480 0.90%Raintree Aptts 8,057,456 54,727 0.84%Tanglewood Apts 7,655,780 51,986 0.80%Anderson Crossing 5,756,608 39,082 0.60%NCHP Property Mgmt 5,325,760 36,161 0.56%Kroger Bakery 4,882,196 33,147 0.51%
Total 317,028,580 928,084$ 12.58% 136,179,384 918,074$ 14.13%
165
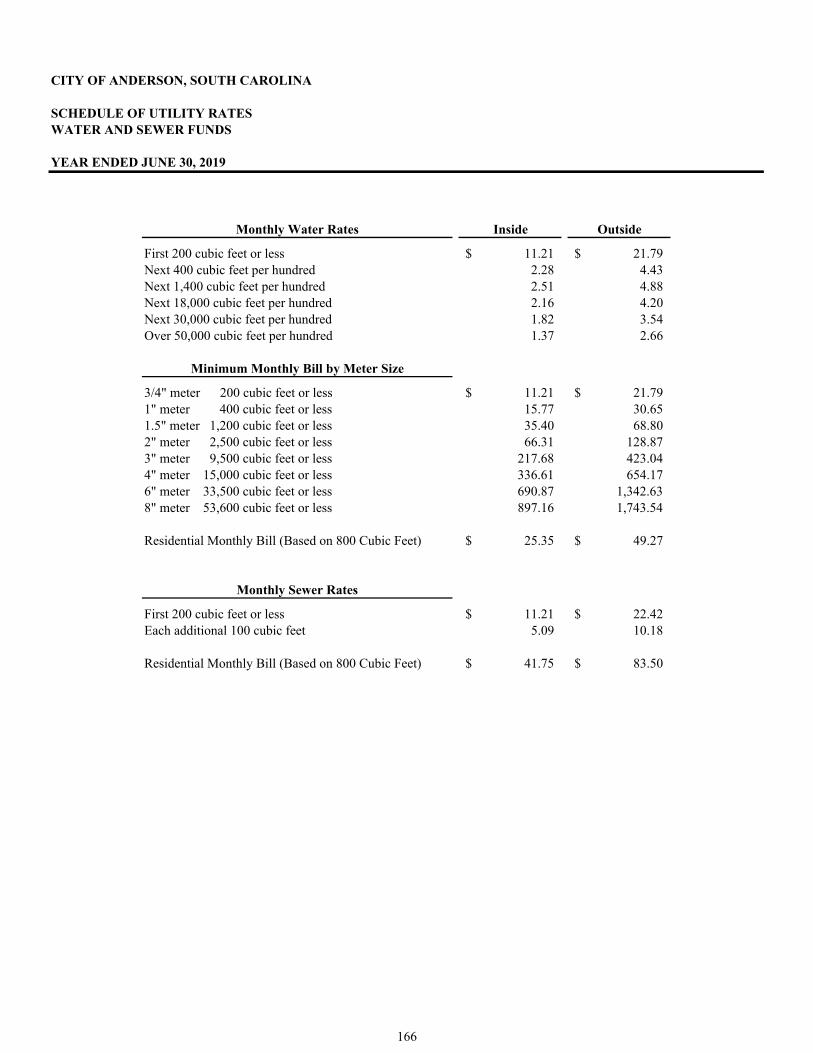
CITY OF ANDERSON, SOUTH CAROLINA
SCHEDULE OF UTILITY RATESWATER AND SEWER FUNDS
YEAR ENDED JUNE 30, 2019
Monthly Water Rates Inside Outside
First 200 cubic feet or less 11.21$ 21.79$ Next 400 cubic feet per hundred 2.28 4.43 Next 1,400 cubic feet per hundred 2.51 4.88 Next 18,000 cubic feet per hundred 2.16 4.20 Next 30,000 cubic feet per hundred 1.82 3.54 Over 50,000 cubic feet per hundred 1.37 2.66
Minimum Monthly Bill by Meter Size
3/4" meter 200 cubic feet or less 11.21$ 21.79$ 1" meter 400 cubic feet or less 15.77 30.65 1.5" meter 1,200 cubic feet or less 35.40 68.80 2" meter 2,500 cubic feet or less 66.31 128.87 3" meter 9,500 cubic feet or less 217.68 423.04 4" meter 15,000 cubic feet or less 336.61 654.17 6" meter 33,500 cubic feet or less 690.87 1,342.63 8" meter 53,600 cubic feet or less 897.16 1,743.54
Residential Monthly Bill (Based on 800 Cubic Feet) 25.35$ 49.27$
Monthly Sewer Rates
First 200 cubic feet or less 11.21$ 22.42$ Each additional 100 cubic feet 5.09 10.18
Residential Monthly Bill (Based on 800 Cubic Feet) 41.75$ 83.50$
166