Embed Size (px)
Citation preview

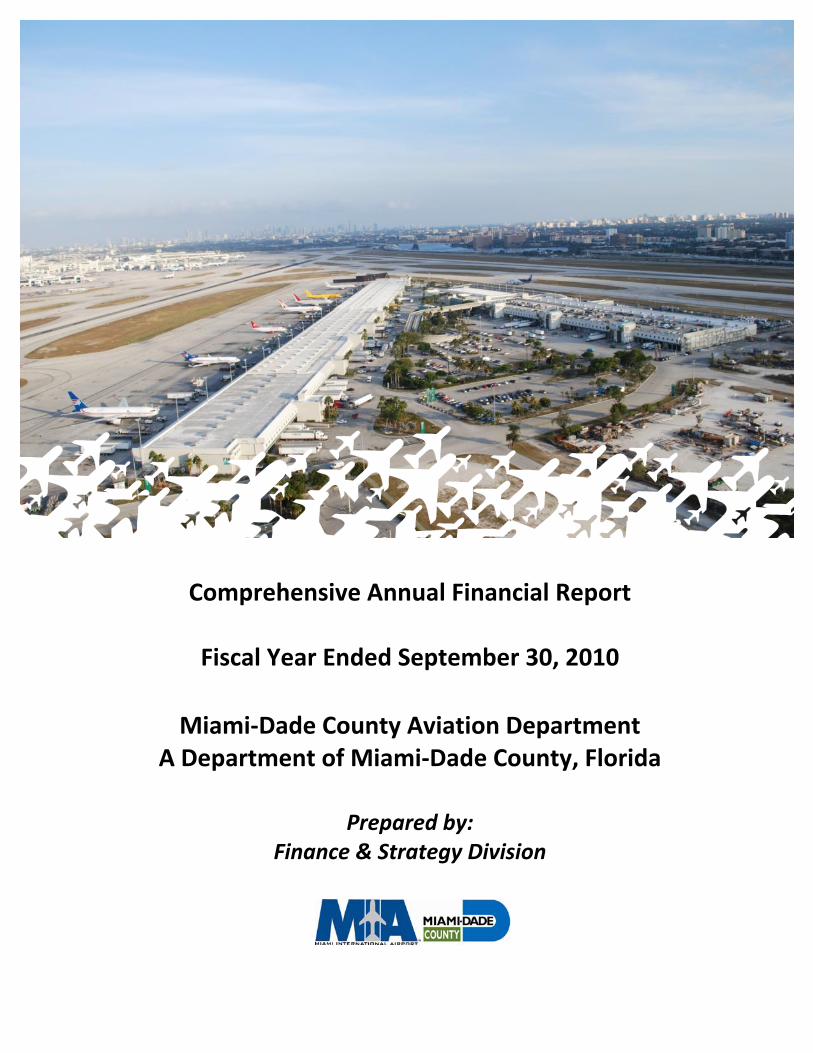
ComprehensiveAnnual Financial
Report
For fiscal year ended September 30, 2010
Miami‐Dade Aviation Department
Miami, Florida
Miami‐Dade Aviation Department

Comprehensive Annual Financial Report
Fiscal Year Ended September 30, 2010
Miami‐Dade County Aviation Department A Department of Miami‐Dade County, Florida
Prepared by: Finance & Strategy Division
2010 Comprehensive Annual Financial Report
(This page intentionally left blank)
Miami‐Dade Aviation Department Comprehensive Annual Financial Report
For the Fiscal Year Ended September 30, 2010
INDEX Introductory Section (Unaudited)
Letter of Transmittal ........................................................................................................................................ i
Miami‐Dade County Elected Officials .......................................................................................................... vii
Miami‐Dade Aviation Department Senior Staff ........................................................................................... viii
Miami‐Dade Aviation Department Organization Chart ................................................................................. ix
GFOA Certificate of Achievement .................................................................................................................. x
Financial Section
Independent Auditors Report ........................................................................................................................ 1
Management's Discussion and Analysis (Unaudited) ..................................................................................... 3
Financial Statements.............................................................................................................................11
Statements of Net Assets......................................................................................................................11
Statements of Revenues, Expenses, and Changes in Net Assets……………………………………………………… 13
Statements of Cash Flows................................................................................................................…. 14
Notes to Financial Statements..................................................................................................................... 16
Required Supplementary Information......................................................................................................... 52
Statistical Section (Unaudited)
Overview ....................................................................................................................................................... 53
Department Schedules of Revenues and Expenses ..................................................................................... 54
Department Statements of Net Assets ......................................................................................................... 55
Department Changes in Cash and Cash Equivalents .................................................................................... 56
Department Largest Sources of Revenue ..................................................................................................... 57
Key Usage Fees and Charges ........................................................................................................................ 58
Concession Revenue Per Enplaned Passenger ............................................................................................. 59
Parking Revenue Per Enplaned Passenger ................................................................................................... 60
Rental Car Revenue Per Enplaned Passenger ............................................................................................... 61
Terminal Rent Per Enplaned Passenger ....................................................................................................... 62
Food and Beverage Revenue Per Enplaned Passenger ................................................................................ 63
Department Employee Strength .................................................................................................................. 64
Aircraft Operations ....................................................................................................................................... 65
Aircraft Landed Weight ................................................................................................................................ 66
Passenger Enplanements ............................................................................................................................. 67
Passenger Deplanements …..……………………………………………………………………… .......... …………………….……..…..68
Enplanement Market Share by Airline by Fiscal Year ................................................................................... 69
Air Cargo Activity….………………..………… .......... ………………………………………………………………………………………... 70
Miami‐Dade County Population .................................................................................................................. 71

Principal Employers in Miami‐Dade County……………………………………………………………………………………….. .... 72
Miami‐Dade County Unemployment Statistics ............................................................................................ 73
Miami‐Dade County Per Capita Personal Income.................................................................................... .... 74
Revenue Bond Debt Service Coverage ......................................................................................................... 75
Outstanding Debt ......................................................................................................................................... 76
Long Term Debt Per Enplaned Passenger .................................................................................................... 77
Capital Assets ................................................................................................................................................ 78
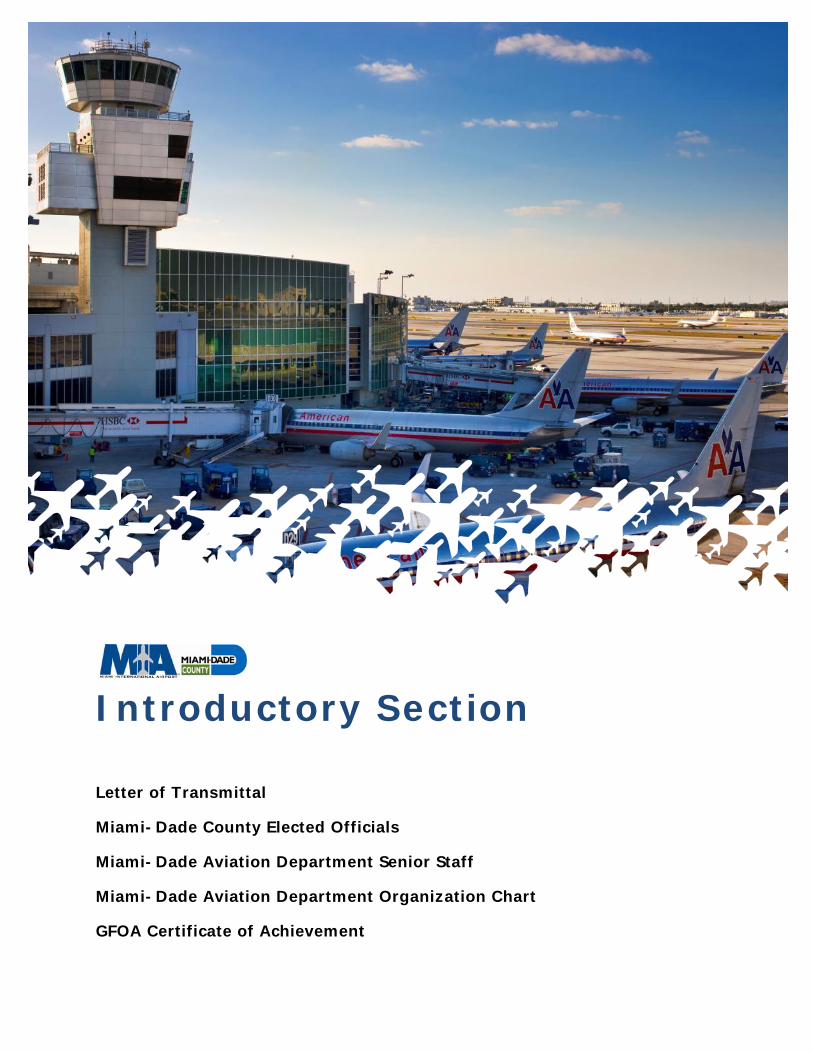
Introductory Section
Letter of Transmittal
Miami-Dade County Elected Officials
Miami-Dade Aviation Department Senior Staff
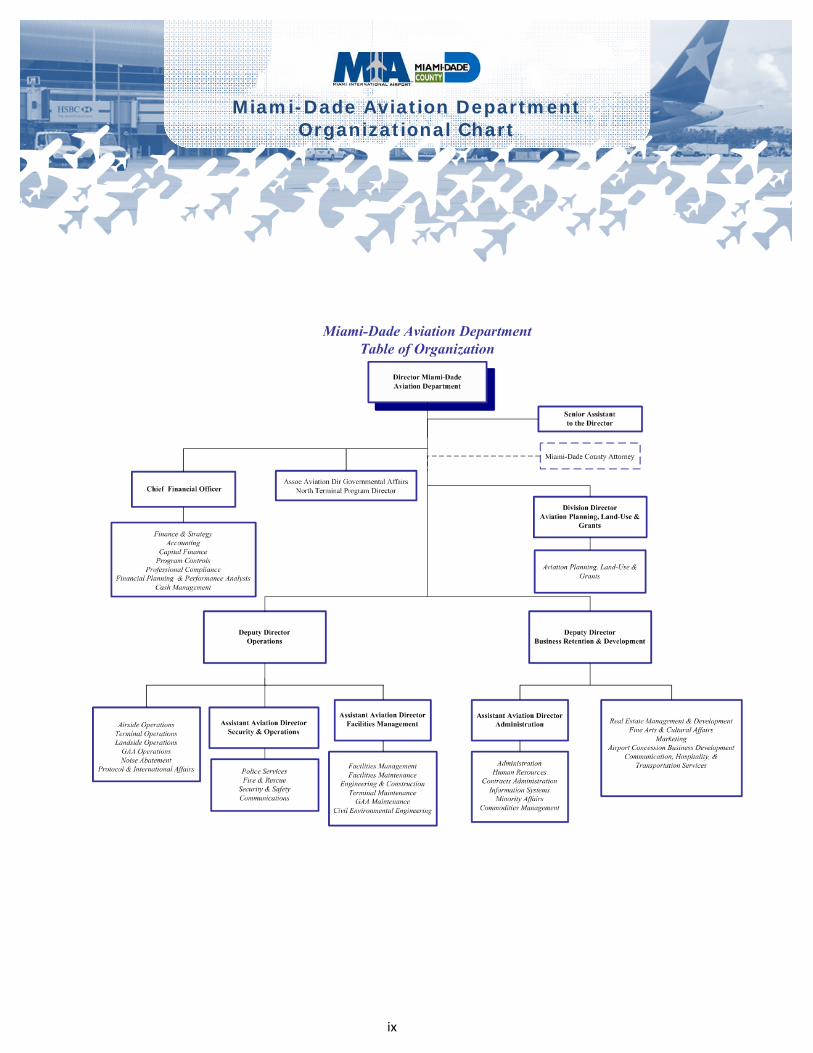
Miami-Dade Aviation Department Organization Chart
GFOA Certificate of Achievement
2010 Comprehensive Annual Financial Report
(This page intentionally left blank)
i
March 29, 2011
Honorable Chairman Joe A. Martinez
Honorable Members of the Board of County Commissioners
Alina T. Hudak, County Manager
Harvey Ruvin, Clerk of Courts
Ladies and Gentlemen: The Comprehensive Annual Financial Report of the Miami-Dade Aviation Department (“the Aviation Department” or “MDAD”) for the fiscal year ended September 30, 2010, is hereby submitted. Responsibility for both the accuracy and completeness and fairness of presentation, including all disclosures, rests with the Aviation Department. This report presents fairly, and discloses fully, in all material respects, the financial position and results of operations of the Aviation Department. The Aviation Department is also required to be audited in accordance with the provisions of the Single Audit Act of 1984 and the U.S. Office of Management and Budget Circular A-133, Audits of State, Local Governments and Non-Profit Organizations, and the Florida Single Audit. Information related to the single audit, including the schedule of expenditures of Federal Awards and State Financial Assistance, schedule of findings and questioned costs, and the Certified Public Accountants’ reports on the internal control structure and compliance with applicable laws and regulations, are reported under a separate cover. Generally Accepted Accounting Principles (GAAP) requires that management provide a narrative overview and analysis to accompany the financial statements in the form of Management’s Discussion and Analysis (MD&A). This letter of transmittal should be read in conjunction with the MD&A, which can be found immediately following the report of the independent auditors in the Financial Section of this report.
ii
Profile Overview The Aviation Department operates as an enterprise fund of Miami-Dade County (“the County”). An enterprise fund is used to account for the financing of services to the general public on a continuing basis with costs recovered primarily through user charges. The County owns Miami International Airport (“MIA” or the “Airport”), three general aviation airports, and one training airport (collectively “the Airport System”), all of which are operated by the Aviation Department. The County operates the Airport System through the Aviation Department with policy guidance from the Mayor, the Board of County Commissioners of Miami-Dade County, Florida (the “Board”), and the County Manager. Economic Conditions and Outlook MIA continues to be an economic engine for Miami-Dade County and the State of Florida. In the most recent economic impact study (which MDAD has done every three years), it was found that MIA has an annual financial impact on local tourism, cruise, international banking, trade and commerce of $26.7 billion. MIA and related aviation industries contribute 282,043 jobs directly and indirectly to the South Florida economy, and are responsible for 1 out of every 4 jobs. The Airport offers an extensive air service network, enhanced by multiple daily scheduled and non-scheduled flights covering nearly 150 cities on four continents. MIA’s stronghold market, the Latin America/Caribbean region, was served by more passenger flights from the airport than from any other U.S. airport. MIA is a major transshipment point by air for the Americas. During calendar year 2009, the most recent year for which such information is available, the Airport handled 83% of all air imports and 80% of all air exports between the USA and the Latin American/Caribbean region. The Airport was also the nation’s number one airport in international freight� (excluding mail) and second in international passenger traffic during calendar year 2010. The Airport stimulates a host of industries such as tourism, the cruise industry and international banking and commerce. The Airport’s activities have significant statewide effects as well. For the 12 months ended February 2010, the most recent period for which such information is available, the Airport was the port of entry for 69.3% of all international passenger traffic arriving by air to the State. In terms of trade, Department of Commerce data for 2009 showed that the Airport handled 97% of the dollar value of the State’s total air imports and exports, and 41% of the State’s total air and sea trade domestically and international. Passenger Activity During fiscal year 2010, 35,029,106 passengers transited through MIA, which represents a 3.4% increase compared to fiscal year 2009. Domestic traffic increased by 2.7% to 18,403,921, or 52.5% of the total. International traffic accounted for 47.5% of the traffic or 16,625,185 passengers, which represents an increase of 4.2% over the prior fiscal year. MIA is ranked second in the U.S. behind New York Kennedy for international passengers. The Airport is American Airline’s largest international hub operation, both for international passengers and international cargo. American Airlines accounted for approximately 64% of the enplaned passengers at the Airport during fiscal year 2010, and together with its affiliate, American Eagle, approximately 69% of all enplaned passengers during such period. American combined with American Eagle increased 2.5% fiscal year over fiscal year. Delta Air Lines, which became the second largest carrier at MIA in fiscal year 2010 by surpassing American eagle with over 5% of the enplaned passenger traffic, also significantly increased its service at MIA in fiscal year 2010. Airports Council International (“ACI”) includes Anchorage International Airport (“ANC”) in its rankings. MIA excludes ANC from its rankings because of ANC’s particular methodology of accounting for freight. MIA’s total freight only reflects enplaned and deplaned freight, while ANC chooses to include a large amount of transit (same aircraft) freight. Source: Miami-Dade County Aviation Department.
iii
Cargo Activity Cargo (mail and freight) tonnage totaled 1,991,467 tons in fiscal year 2010, resulting in an increase of 16.5%. MIA remains the number one airport in the U.S. for international freight. Cargo activity generates different types of revenues for the Aviation Department including landing fees, cargo warehouse rentals, aircraft apron rentals, and ground rentals. Cargo carriers represented 21.9% of the landed weight in fiscal year 2010, which is an increase from the 20.4% in the prior fiscal year. Airline Agreements The County has entered into separate but identical Airline Use Agreements with the airlines using MIA. The Airline Use Agreement, which is a 15-year agreement expiring in 2017, provides that the County, acting through its Board of County Commissioners, has the right to calculate landing fees using an airport system residual cost methodology so that the revenues from landing fees, together with revenues from other sources, will be sufficient to meet the requirements of the rate covenant and other requirements. The County has entered into separate, but substantially similar Terminal Building Lease Agreements with the airlines. Under these agreements airlines have no obligations to make real property investments in tenant improvements to their premises and in personal property to support their operations. Passenger Facility Charges (PFC) The Federal Aviation Administration (“FAA”) authorized the Aviation Department to impose a Passenger Facility Charge (“PFC”) of $3 per passenger commencing November 1, 1994. Subsequently, on October 21, 2001, the FAA approved a revised PFC collection level of $4.50 with an effective date of January 1, 2002. In December 2002, the FAA approved a PFC application that enables the Aviation Department to use PFC revenues to pay debt service related to the bonds that were issued to finance the construction of the North and South terminals at MIA. Per FAA regulations, net receipts from PFCs are restricted to use only on these FAA approved capital projects and related financing costs. The Aviation Department has been authorized to collect PFCs in the estimated aggregate amount of $2.6 billion. The authorization is expected to expire October 1, 2035. The amount of PFC collections from inception through September 30, 2010 was $740.3 million and with interest was $811.0 million. Of this amount, the Aviation Department has expended $652.0 million. As of September 30, 2010, the Aviation Department had a cash balance of $159.0 million in the PFC account. Capital Improvement Program (CIP) In 2002, the Board of County Commissioners approved a CIP, with estimated expenditures of $4.8 billion through 2015, when enplanement levels were projected to reach 39 million annual passengers. Since that time the Board has approved a number of increases in the cost of the CIP such that the total CIP budget was approximately $6.5 billion as of September 30, 2010. The increases were primarily due to schedule delays and increased construction estimates. To finance the costs of certain projects including financing costs, the Board has authorized the Department to issue up to $6.2 billion in Aviation Revenue Bonds under the Trust Agreement, of which $5.84 billion has been issued. The remaining Bond authorized amount of $355.5 million, however, may not be issued without approval of specific bond series resolutions by the Board. Future authorizations will be required to issue bonds for projects that are not yet covered by existing ordinances.
iv
Tenant Financed Facilities Because of the significant size of the CIP, the Department has decided, as a matter of policy, to permit tenants of airside facilities to construct some buildings with private financing. Accordingly, certain hangars and cargo facilities (including those for Federal Express, UPS, LAN Airlines, and United) have been constructed with private financing. Such improvements do not constitute County-owned properties until the financing of such improvements has been paid. Such change in ownership may be done either through buy-out or at the termination of the ground lease in which terms are long enough to allow the tenant to fully amortize its investment in the facility. Major Initiatives & Long-Term Financial Planning Of the $6.491 billion total CIP, approximately $5.654 billion has been spent as of September 30, 2010. About $3.650 billion worth of projects have been completed and are in use with the remaining $2.841 billion under construction or in design as of September 30, 2010. The Terminal Building is divided into three areas: North, Central and South. Approximately, 63.2% of the CIP is allocated to constructing and expanding the North and South Terminals. The CIP will increase the building’s area from 4.8 million to approximately 7.8 million square feet. A significant portion of the North Terminal Development (NTD) Program was completed in fiscal year 2010 including the reopening of old Concourse A (with 16 gates and now is part of Concourse D), the regional commuter facility for American Eagle operations, and the NT automated people mover that spans the entire length of Concourse D (50 gates). The major remaining NTD projects to be completed before the end of fiscal year 2011 are the outbound baggage handling system and the Federal Inspection Services area. The South Terminal Program, which is substantially complete and the related facilities have been operational since August 2007, includes the terminal expansion from Concourse H to Concourse J, construction of a new Concourse J, internationalization of four gates at Concourse H, apron construction between Concourses H and J and related utilities infrastructure. It provides approximately 1.5 million square feet of new and 0.2 million square feet of renovated terminal and concourse space. The South Terminal has 28 gates of which 19 are international/domestic and one designated for Airport A-380 operations. In addition the South Terminal includes a new Federal Inspection Services Facility; a cruise and tour bus station; 50,000 square feet of new concession space; and a gate control tower for aircraft traffic at Concourses H and J. The other on-going major capital project is the MIA Mover, which is the construction of an elevated automated people mover (APM) system connecting the Terminal Building to remote ground transportation facilities at an intermodal hub known as the MIC that is being built by Florida Department of Transportation. This APM project is scheduled to be operational by September 2011. The CIP is the critical path to success for MIA, as its completion will allow existing and prospective carriers to maintain and expand their domestic and international passenger operations out of MIA. Risk Management It is the policy of the Aviation Department to measure, manage and monitor risk associated with its operations. As a business practice, certain risks are transferred by way of insurance instruments and others are self-assumed, with risk management and mitigation being key elements. Risks involving lease operations are typically managed by way of enforcement of minimum insurance requirements to be maintained by lessors, as well as inclusion of “hold harmless” and indemnification wording in favor of the Aviation Department. Additionally, vendors, service providers, concessionaires, retailers and other outside parties are managed similarly. Use of contractors for construction or professional services is closely monitored to
v
ensure that financial responsibility (insurance) is adequate and that the appropriate coverage is afforded to the Aviation Department. The Aviation Department manages credit risk by restricting authorization as to the type and compositions of investment in which it invests (and its related custodians). Its portfolio has reflected such policy. The Aviation Department manages its interest rate risk by requiring the matching of known cash needs and anticipated net cash outflows with its liquid cash and investment maturities. Independent Audit The financial statements for Fiscal Year 2010 were audited by KPMG LLP, and the opinion resulting from their examination is included in this Comprehensive Annual Financial Report. Their audit was made in accordance with auditing standards generally accepted in the United States. Awards The Government Finance Officers Association of the United States and Canada (GFOA) awarded a Certificate of Achievement for Excellence in Financial Reporting to the Department for its Comprehensive Annual Financial Report for the Fiscal Year ended September 30, 2009. The Certificate of Achievement is a prestigious national award recognizing conformance with the highest standards for preparation of state and local government financial reports. In order to be awarded a Certificate of Achievement, the Department had to publish an easily readable and efficiently organized Comprehensive Annual Financial Report, whose contents conform to program standards. This Comprehensive Annual Financial Report must satisfy both accounting principles generally accepted in the United States and applicable legal requirements. A Certificate of Achievement is valid for one year only. The Department has received a Certificate of Achievement for the last 18 consecutive fiscal years (1992-2009). We believe our current report continues to conform to the Certificate of Achievement program requirements, and we are submitting it to the GFOA. Acknowledgements This report could not have been presented without the efforts of the Finance and Strategy staff. We sincerely appreciate their time and thank them for their valuable contributions. The Deparment also thanks the County Mayor, the Board of County Commissioners and the County Manager for providing their continued support to the Department, enabling us to successully operate the Airport System.
er of Transmittal
vi
2010 Comprehensive Annual Financial Report
(This page intentionally left blank)
vii
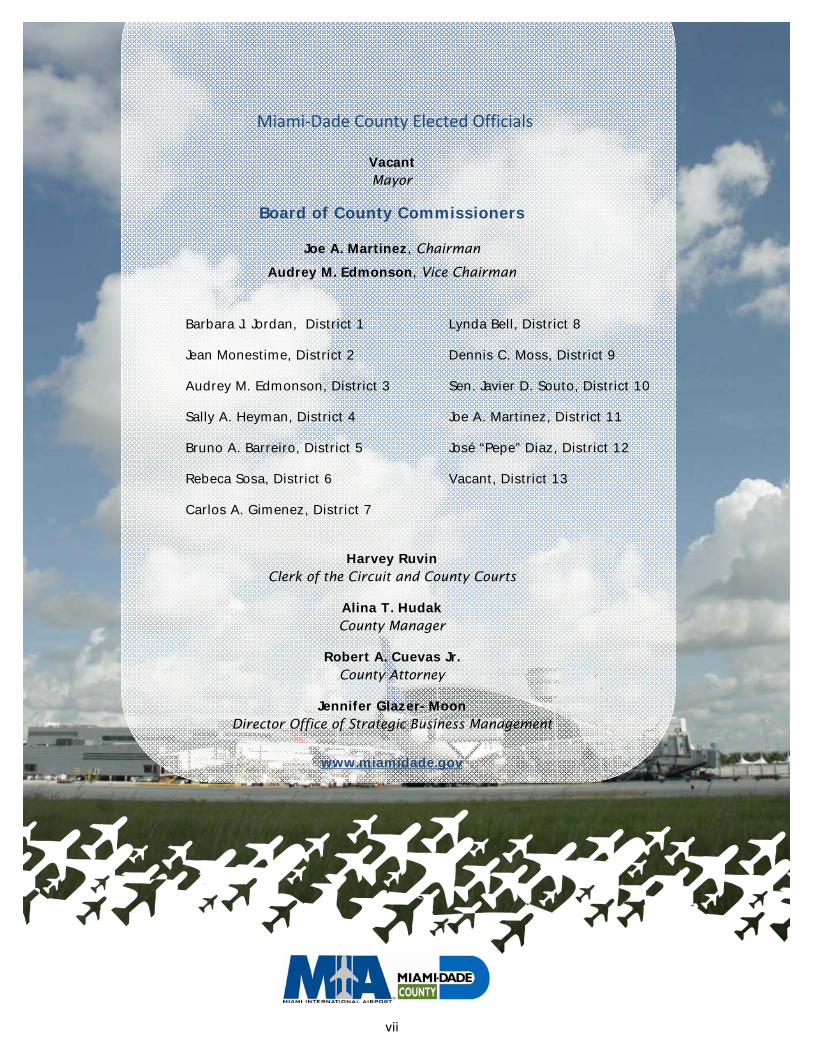
Miami‐Dade County Elected Officials
Vacant Mayor
Board of County Commissioners
Joe A. Martinez, Chairman
Audrey M. Edmonson, Vice Chairman
Barbara J. Jordan, District 1 Lynda Bell, District 8
Jean Monestime, District 2 Dennis C. Moss, District 9
Audrey M. Edmonson, District 3 Sen. Javier D. Souto, District 10
Sally A. Heyman, District 4 Joe A. Martinez, District 11
Bruno A. Barreiro, District 5 José “Pepe” Diaz, District 12
Rebeca Sosa, District 6 Vacant, District 13
Carlos A. Gimenez, District 7
Harvey Ruvin Clerk of the Circuit and County Courts
Alina T. Hudak County Manager
Robert A. Cuevas Jr. County Attorney
Jennifer Glazer-Moon Director Office of Strategic Business Management
www.miamidade.gov

viii
José Abreu
Aviation Director
Anne Syrcle Lee
Chief Financial Officer
Ken Pyatt
Deputy Aviation Director
Operations
Bobbie Jones‐Wilfork
Assistant Director
Administration
Carlos Jose
Assistant Director
Facilities Management
Lauren Stover
Assistant Director
Public Safety and Security
Tony Quintero
Associate Director
Governmental Affairs
Milton Collins
Associate Director
Minority Affairs
Juan Carlos Arteaga
North Terminal Program
Director
Miguel Southwell
Deputy Aviation Director
Business Retention & Development
Miami-Dade Aviation Department Senior Staff
ix
Miami-Dade Aviation Department Organizational Chart

x
GFOA Certificate of Achievement

Financial Section
Independent Auditor’s Report
Management Discussion & Analysis
Financial Statements
2010 Comprehensive Annual Financial Report
(This page intentionally left blank)
MIAMI-DADE COUNTY AVIATION DEPARTMENT
Financial Statements
September 30, 2010 and 2009
(With Independent Auditors’ Report Thereon)
MIAMI-DADE COUNTY AVIATION DEPARTMENT
Table of Contents
Page(s)
Independent Auditors’ Report 1 – 2
Management’s Discussion and Analysis (Unaudited) 3 – 10
Financial Statements:
Statements of Net Assets 11 – 12
Statements of Revenues, Expenses, and Changes in Net Assets 13
Statements of Cash Flows 14 – 15
Notes to Financial Statements 16 – 51
Required Supplementary Information (Unaudited) 52
KPMG LLP Suite 2000 200 South Biscayne Boulevard Miami, FL 33131
KPMG LLP is a Delaware limited liability partnership, the U.S. member firm of KPMG International Cooperative (“KPMG International”), a Swiss entity.
Independent Auditors’ Report
The Honorable Mayor and Members The Board of County Commissioners Miami-Dade County Miami, Florida:
We have audited the accompanying financial statements of the Miami-Dade County Aviation Department (the Aviation Department), an enterprise fund of Miami-Dade County, as of and for the years ended September 30, 2010 and 2009, as listed in the table of contents. These financial statements are the responsibility of the Aviation Department’s management. Our responsibility is to express an opinion on these financial statements based on our audits.
We conducted our audits in accordance with auditing standards generally accepted in the United States of America and the standards applicable to financial audits contained in Government Auditing Standards, issued by the Comptroller General of the United States. Those standards require that we plan and perform the audit to obtain reasonable assurance about whether the financial statements are free of material misstatement. An audit includes consideration of internal control over financial reporting as a basis for designing audit procedures that are appropriate in the circumstances, but not for the purpose of expressing an opinion on the effectiveness of the Aviation Department’s internal control over financial reporting. Accordingly, we express no such opinion. An audit also includes examining, on a test basis, evidence supporting the amounts and disclosures in the financial statements, assessing the accounting principles used and the significant estimates made by management, as well as evaluating the overall financial statement presentation. We believe that our audits provide a reasonable basis for our opinion.
As discussed in note 1(a), the financial statements present only the Aviation Department and do not purport to, and do not, present fairly the financial position of Miami-Dade County, Florida (the County), as of September 30, 2010 and 2009, and the changes in its financial position or, where applicable, its cash flows for the years then ended in conformity with U.S. generally accepted accounting principles.
In our opinion, the financial statements referred to above present fairly, in all material respects, the financial position of the Aviation Department, an enterprise fund of Miami-Dade County, as of September 30, 2010 and 2009, and the changes in financial position and cash flows for the years then ended in conformity with U.S. generally accepted accounting principles.
In accordance with Government Auditing Standards, we have also issued our report dated March 11, 2011, on our consideration of the Aviation Department’s internal control over financial reporting and on our tests of its compliance with certain provisions of laws, regulations, contracts, and grant agreements and other matters. The purpose of the report is to describe the scope of our testing of internal control over financial reporting and compliance and the results of that testing, and not to provide an opinion on the internal control over financial reporting or on compliance. That report is an integral part of an audit performed in accordance with Government Auditing Standards and should be considered in assessing the results of our audit.
2
The management’s discussion and analysis on pages 3 through 10 and the schedule of funding progress on page 52 are not a required part of the basic financial statements but are supplementary information required by U.S. generally accepted accounting principles. We have applied certain limited procedures, which consisted principally of inquiries of management regarding the methods of measurement and presentation of the required supplementary information. However, we did not audit the information and express no opinion on it.
Our audit was conducted for the purpose of forming an opinion on the basic financial statements of Miami-Dade County Aviation Department, an enterprise fund of Miami-Dade County. The accompanying introductory section and statistical section are presented for purposes of additional analysis and are not a required part of the basic financial statements. The introductory and statistical sections have not been subjected to the auditing procedures applied in the audit of the basic financial statements and, accordingly, we express no opinion on them.
March 11, 2011 Certified Public Accountants

MIAMI-DADE COUNTY AVIATION DEPARTMENT
Management’s Discussion and Analysis
September 30, 2010 and 2009
(Unaudited)
3 (Continued)
Introduction
The following discussion and analysis of the financial performance and activity of the Miami-Dade County Aviation Department (the Aviation Department) is to provide an introduction and understanding of the financial statements of the Aviation Department for the years ended September 30, 2010 and 2009. This discussion has been prepared by management and should be read in conjunction with the financial statements and the notes thereto, which follow this section.
The Aviation Department operates an Airport System consisting of Miami International Airport (MIA), three general aviation airports, Opa Locka Airport, Homestead General Airport, Kendall Tamiami Executive Airport, and two training airports, one of which has been closed.
The Aviation Department operates as an enterprise fund of Miami-Dade County, Florida (the County). The Aviation Department is self-supporting, using aircraft landing fees, fees from terminal and other rentals, and revenues from concessions to fund operating expenses. The Capital Improvement Program (CIP) is primarily funded by bonds, federal and state grants, and Passenger Facility Charges (PFCs).
Required Financial Statements
The Aviation Department’s financial report includes three financial statements: the statements of net assets, statements of revenues, expenses, and changes in net assets, and statements of cash flows. The financial statements are prepared in accordance with U.S. generally accepted accounting principles as promulgated by the Governmental Accounting Standards Board (GASB). The Aviation Department is structured as a single enterprise fund with revenues recognized when earned and expenses recognized when incurred. Capital asset costs, with the exception of land and construction in progress, are capitalized and depreciated over their estimated useful lives. Certain net asset balances are restricted for debt service, construction activities, and major maintenance type activities.
The statements of net assets include all of the Aviation Department’s assets and liabilities and provide information about the nature and amounts of investments in resources (assets) as well as obligations to creditors and investors (liabilities). They also provide the basis for evaluating the capital structure of the Aviation Department and assessing liquidity and financial flexibility.
The statements of revenues, expenses, and changes in net assets report the operating revenues and expenses and nonoperating revenues and expenses of the Aviation Department for the fiscal year with the difference, net income or loss being combined with any capital contributions to arrive at the change in net assets for the fiscal year. These statements measure the success of the Aviation Department’s operations over the past year and can be used to determine whether the Aviation Department has successfully recovered all its costs through its users’ fees and other charges.
The statements of cash flows provide information about the Aviation Department’s cash receipts and payments during the reporting period. The statements report cash receipts, cash payments, and net changes in cash resulting from operating, investing, and capital and noncapital financing activities and provide an insight regarding sources providing cash and activities using cash.
MIAMI-DADE COUNTY AVIATION DEPARTMENT
Management’s Discussion and Analysis
September 30, 2010 and 2009
(Unaudited)
4 (Continued)
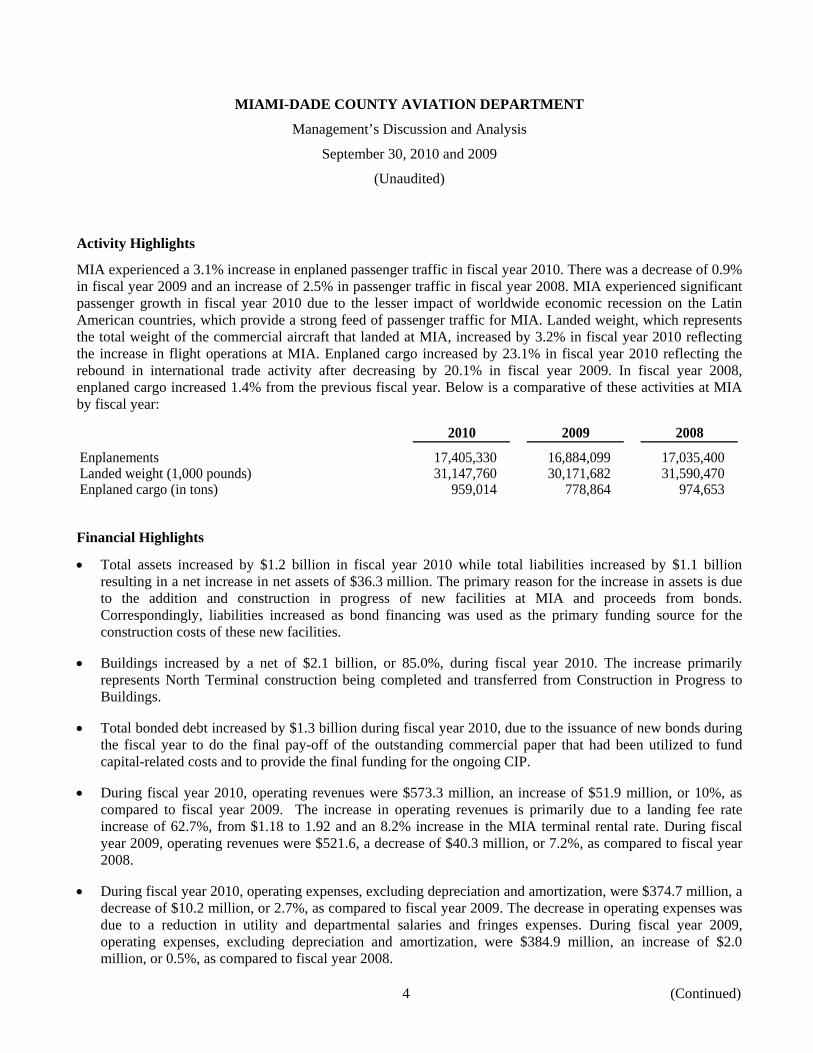
Activity Highlights
MIA experienced a 3.1% increase in enplaned passenger traffic in fiscal year 2010. There was a decrease of 0.9% in fiscal year 2009 and an increase of 2.5% in passenger traffic in fiscal year 2008. MIA experienced significant passenger growth in fiscal year 2010 due to the lesser impact of worldwide economic recession on the Latin American countries, which provide a strong feed of passenger traffic for MIA. Landed weight, which represents the total weight of the commercial aircraft that landed at MIA, increased by 3.2% in fiscal year 2010 reflecting the increase in flight operations at MIA. Enplaned cargo increased by 23.1% in fiscal year 2010 reflecting the rebound in international trade activity after decreasing by 20.1% in fiscal year 2009. In fiscal year 2008, enplaned cargo increased 1.4% from the previous fiscal year. Below is a comparative of these activities at MIA by fiscal year:
2010 2009 2008
Enplanements 17,405,330 16,884,099 17,035,400 Landed weight (1,000 pounds) 31,147,760 30,171,682 31,590,470 Enplaned cargo (in tons) 959,014 778,864 974,653
Financial Highlights
• Total assets increased by $1.2 billion in fiscal year 2010 while total liabilities increased by $1.1 billion resulting in a net increase in net assets of $36.3 million. The primary reason for the increase in assets is due to the addition and construction in progress of new facilities at MIA and proceeds from bonds. Correspondingly, liabilities increased as bond financing was used as the primary funding source for the construction costs of these new facilities.
• Buildings increased by a net of $2.1 billion, or 85.0%, during fiscal year 2010. The increase primarily represents North Terminal construction being completed and transferred from Construction in Progress to Buildings.
• Total bonded debt increased by $1.3 billion during fiscal year 2010, due to the issuance of new bonds during the fiscal year to do the final pay-off of the outstanding commercial paper that had been utilized to fund capital-related costs and to provide the final funding for the ongoing CIP.
• During fiscal year 2010, operating revenues were $573.3 million, an increase of $51.9 million, or 10%, as compared to fiscal year 2009. The increase in operating revenues is primarily due to a landing fee rate increase of 62.7%, from $1.18 to 1.92 and an 8.2% increase in the MIA terminal rental rate. During fiscal year 2009, operating revenues were $521.6, a decrease of $40.3 million, or 7.2%, as compared to fiscal year 2008.
• During fiscal year 2010, operating expenses, excluding depreciation and amortization, were $374.7 million, a decrease of $10.2 million, or 2.7%, as compared to fiscal year 2009. The decrease in operating expenses was due to a reduction in utility and departmental salaries and fringes expenses. During fiscal year 2009, operating expenses, excluding depreciation and amortization, were $384.9 million, an increase of $2.0 million, or 0.5%, as compared to fiscal year 2008.

MIAMI-DADE COUNTY AVIATION DEPARTMENT
Management’s Discussion and Analysis
September 30, 2010 and 2009
(Unaudited)
5 (Continued)
The table below shows the composition of assets, liabilities, and net assets as of September 30, 2010, 2009, and 2008.
2010 2009 2008(In thousands)
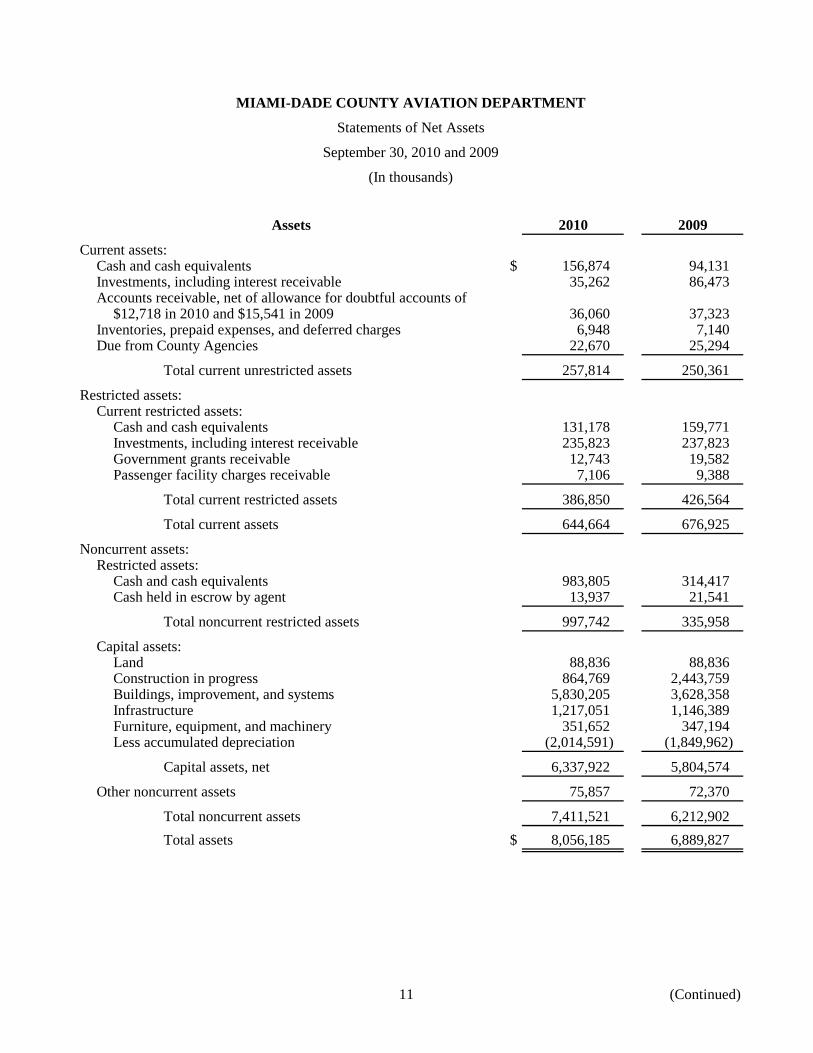
Current assets:Unrestricted assets $ 257,814 250,361 293,237 Restricted assets 386,850 426,564 377,380
Total current assets 644,664 676,925 670,617
Noncurrent assets:Restricted assets 997,742 335,958 326,066 Capital assets, net 6,337,922 5,804,574 5,148,169 Other assets 75,857 72,370 71,678
Total assets 8,056,185 6,889,827 6,216,530
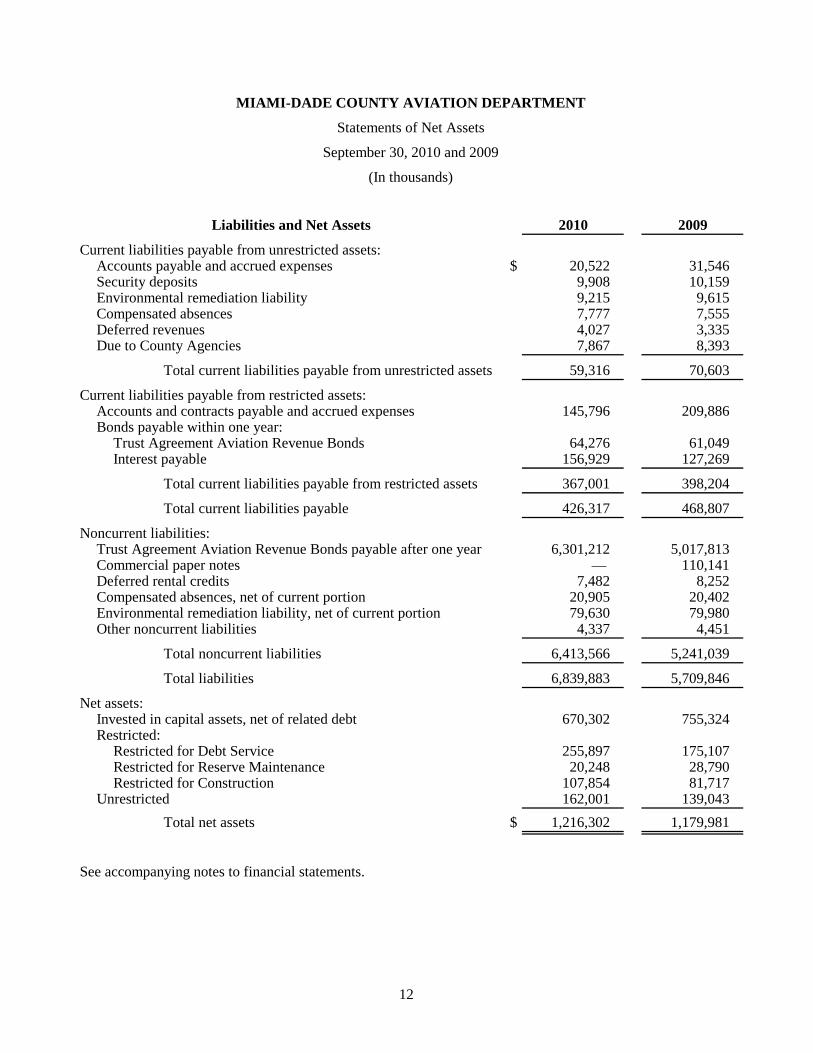
Current liabilities 59,316 70,603 62,548 Current liabilities payable from restricted
assets 367,001 398,204 358,002
Total current liabilities 426,317 468,807 420,550
Noncurrent liabilities 6,413,566 5,241,039 4,604,000
Total liabilities 6,839,883 5,709,846 5,024,550
Net assets:Invested in capital assets, net of debt 670,302 755,324 627,687 Restricted 383,999 285,614 380,357 Unrestricted 162,001 139,043 183,936
Total net assets $ 1,216,302 1,179,981 1,191,980
Capital assets, net, as of September 30, 2010 were $6.3 billion, $533.3 million higher than at September 30, 2009. Capital assets, net, as of September 30, 2009 were $5.8 billion, $656.4 million higher than at September 30, 2008. Capital assets, net, as of September 30, 2008 were $5.1 billion, $513.2 million higher than at September 30, 2007. These increases were primarily in buildings and improvements due to the ongoing CIP.
Total net assets as of September 30, 2010 were $1.2 billion, an increase of approximately $36.3 million as compared to 2009. Total net assets as of September 30, 2009 were $1.18 billion, a decrease of approximately $12.0 million as compared to 2008. Total net assets as of September 30, 2008 were $1.19 billion, an increase of approximately $33.6 million as compared to 2007.
MIAMI-DADE COUNTY AVIATION DEPARTMENT
Management’s Discussion and Analysis
September 30, 2010 and 2009
(Unaudited)
6 (Continued)
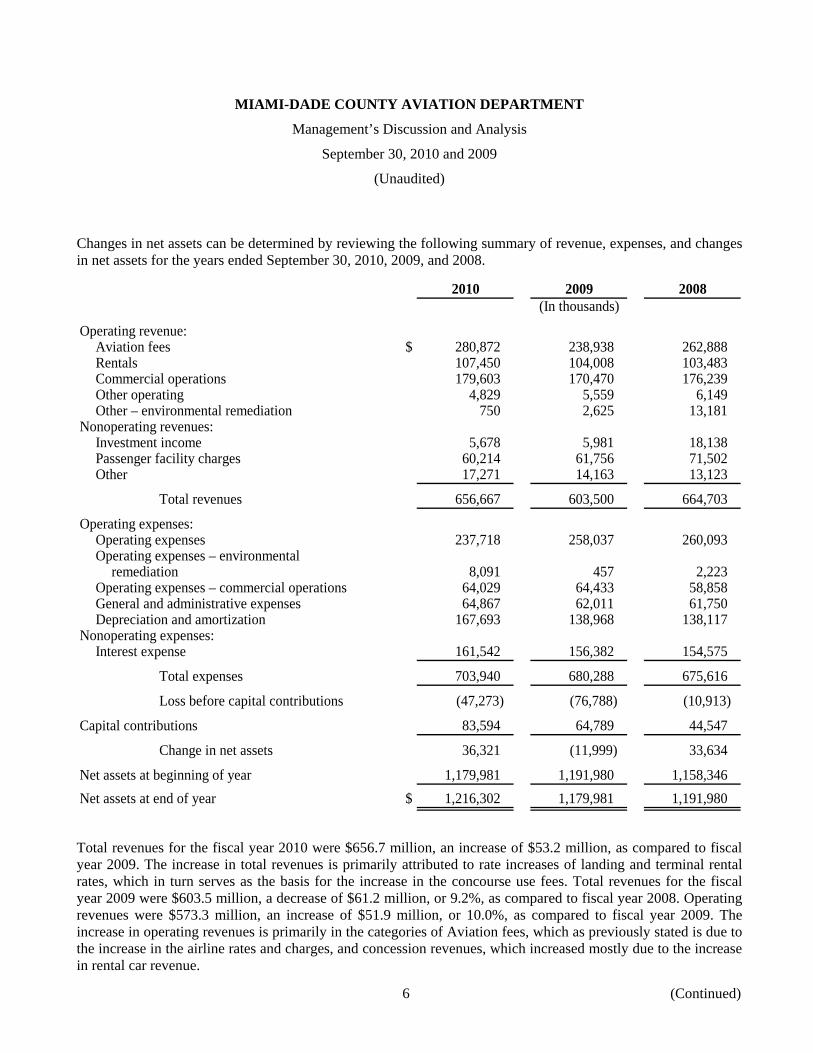
Changes in net assets can be determined by reviewing the following summary of revenue, expenses, and changes in net assets for the years ended September 30, 2010, 2009, and 2008.
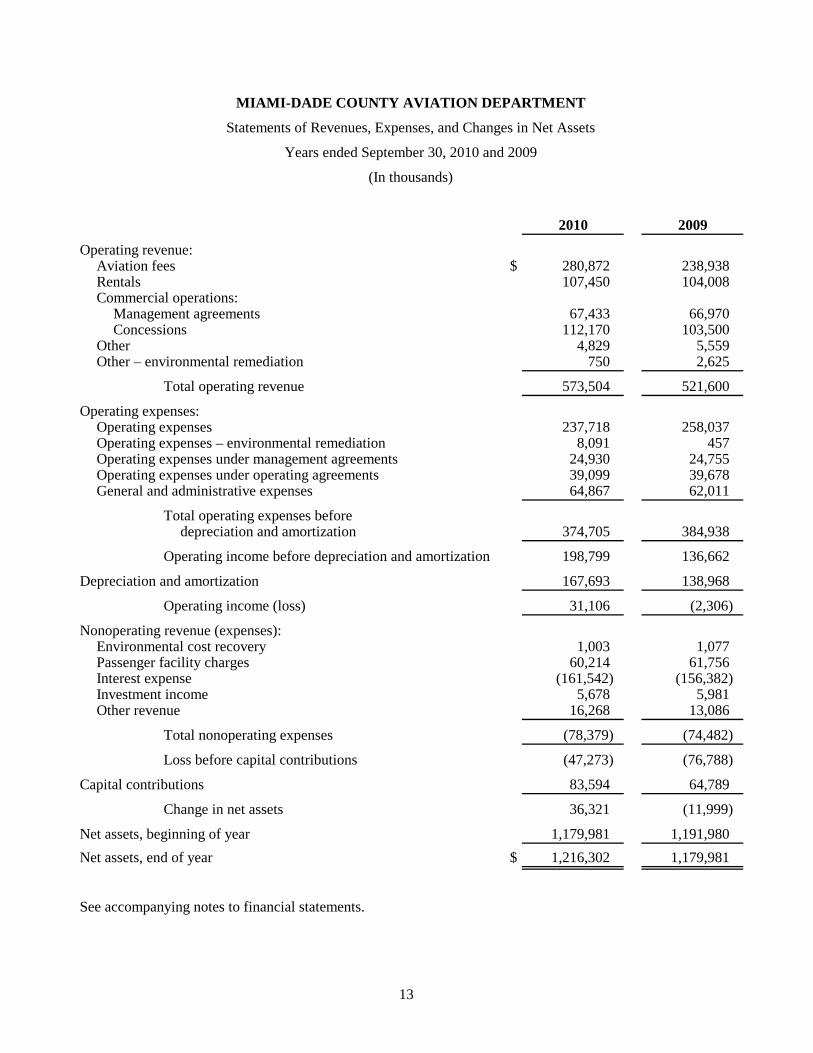
2010 2009 2008(In thousands)
Operating revenue:Aviation fees $ 280,872 238,938 262,888 Rentals 107,450 104,008 103,483 Commercial operations 179,603 170,470 176,239 Other operating 4,829 5,559 6,149 Other – environmental remediation 750 2,625 13,181
Nonoperating revenues:Investment income 5,678 5,981 18,138 Passenger facility charges 60,214 61,756 71,502 Other 17,271 14,163 13,123
Total revenues 656,667 603,500 664,703
Operating expenses:Operating expenses 237,718 258,037 260,093 Operating expenses – environmental
remediation 8,091 457 2,223 Operating expenses – commercial operations 64,029 64,433 58,858 General and administrative expenses 64,867 62,011 61,750 Depreciation and amortization 167,693 138,968 138,117
Nonoperating expenses:Interest expense 161,542 156,382 154,575
Total expenses 703,940 680,288 675,616
Loss before capital contributions (47,273) (76,788) (10,913)
Capital contributions 83,594 64,789 44,547
Change in net assets 36,321 (11,999) 33,634
Net assets at beginning of year 1,179,981 1,191,980 1,158,346 Net assets at end of year $ 1,216,302 1,179,981 1,191,980
Total revenues for the fiscal year 2010 were $656.7 million, an increase of $53.2 million, as compared to fiscal year 2009. The increase in total revenues is primarily attributed to rate increases of landing and terminal rental rates, which in turn serves as the basis for the increase in the concourse use fees. Total revenues for the fiscal year 2009 were $603.5 million, a decrease of $61.2 million, or 9.2%, as compared to fiscal year 2008. Operating revenues were $573.3 million, an increase of $51.9 million, or 10.0%, as compared to fiscal year 2009. The increase in operating revenues is primarily in the categories of Aviation fees, which as previously stated is due to the increase in the airline rates and charges, and concession revenues, which increased mostly due to the increase in rental car revenue.
MIAMI-DADE COUNTY AVIATION DEPARTMENT
Management’s Discussion and Analysis
September 30, 2010 and 2009
(Unaudited)
7 (Continued)
Total expenses, including depreciation and amortization, for fiscal year 2010 were $703.9 million, an increase of $23.7 million, or 3.5%, as compared to fiscal year 2009. The increase in total expenses is primarily attributed to the increase in depreciation expense. Total expenses, including depreciation and amortization, for the fiscal year 2009 were $680.3 million, an increase of $4.7 million, or 0.7%, as compared to fiscal year 2008. Operating expenses, excluding depreciation and amortization, were $374.7 million, a decrease of $10.2 million, or 2.7%, as compared to fiscal year 2009. The decrease in operating expenses was related to a reduction in utility and departmental salaries and fringes expenses. During fiscal year 2009, operating expenses, excluding depreciation and amortization, were $384.9 million, an increase of $2.0 million, or 0.5%, as compared to fiscal year 2008.
In accordance with the amended and restated Trust Agreement (the Trust Agreement), the Aviation Department is required to meet its rate covenant, which means the Aviation Department is required to maintain, charge, and collect rates and charges for the use of and for the services and facilities provided to all users of these facilities. In addition, these rates and charges are to provide revenues sufficient to pay current expenses: to make the required Reserve Maintenance Fund annual deposits as recommended by the Consulting Engineers; and to make deposits to the Sinking Fund, which comprises the Bond Service Account, the Reserve Account, and the Redemption Account, of not less than 120% of the Principal and Interest Requirements of the Outstanding bonds, as defined in the Trust Agreement (all capitalized terms referenced in the last few sentences are defined terms in the Trust Agreement). The Aviation Department uses an airport system residual cost recovery methodology to set its landing fee rate. The manner in which the residual landing fee is calculated enables the Aviation Department to establish rates to meets its rate covenant.
Capital Assets and Debt Administration
Capital Assets
As of September 30, 2010, 2009, and 2008, the Aviation Department had $6.3 billion, $5.8 billion, and $5.1 billion, respectively, invested in capital assets, net of accumulated depreciation.
The following table summarizes the composition of capital assets, net of accumulated depreciation as of September 30, 2010, 2009, and 2008.
2010 2009 2008(In thousands)
Land $ 88,836 88,836 88,836 Buildings, improvements, and systems 4,477,364 2,419,663 2,458,826 Infrastructure 774,144 711,205 669,888 Furniture, machinery, and equipment 132,809 141,111 147,178
5,473,153 3,360,815 3,364,728
Construction in progress 864,769 2,443,759 1,783,441 Total capital assets, net $ 6,337,922 5,804,574 5,148,169
Buildings increased by a net $2.1 billion, or 85.0%, during 2010, due to completion of most of the North Terminal construction.
MIAMI-DADE COUNTY AVIATION DEPARTMENT
Management’s Discussion and Analysis
September 30, 2010 and 2009
(Unaudited)
8 (Continued)
The Aviation Department’s ongoing CIP consists of 344 projects with a budgeted cost of approximately $6.32 billion for capital projects through fiscal year 2015. As of September 30, 2010, the status of these projects can be described as follows:
• 287 projects completed $3.659 billion
• The completed projects include most of the South Terminal, the Northside Runway (9/27), portions of Concourse “A” Terminal Expansion, the Central Collection Plaza, the Park 7 Garage, the Central Chiller Plant, Mid-field and Runway 9/27 rehabilitation, security projects, and the entire Westside Cargo Development Program.
• 38 projects under construction $2.626 billion
• These projects primarily consist of the North Terminal, which will add terminal, concourse, administrative, and concessions space to MIA. It also includes the MIA Mover, which will connect MIA with the Miami Intermodal Center. A few remaining projects related to the South Terminal, which opened for passenger operations in August 2007, are still under construction.
• 19 projects in design and planning $0.035 billion
• These projects include the rehabilitation of runway 8R/26L at MIA, life safety, roof repairs, and signage projects in the terminal building and drainage improvement projects on the north side of MIA.
Additional information on the Aviation’s Department’s capital assets can be found in note 5 to the financial statements of this report.
Debt Administration
As of September 30, 2010, 2009, and 2008, the Aviation Department had a total of $6.1 billion, $5.1 billion, and $4.6 billion, respectively, in long-term revenue bonds outstanding. The long-term debt consists of Aviation Revenue Bonds issued under the Trust Agreement. Maturity dates range from 2011 to 2041, and the interest rates range from 2% to 6%. Both principal and interest are payable solely from net revenues generated from the airport facilities constructed under the provisions of the Trust Agreement. These revenue bonds do not constitute debt of the County or a pledge of the full faith and credit of the County. In addition to net revenues, the Aviation Department used $100.0 million of PFC revenue to pay principal and interest due in fiscal year 2010.
In January 2010, the County issued $600,000,000 of Series 2010A all of which remains outstanding at September 30, 2010. The Series 2010A were issued to refund outstanding Commercial Paper Notes and to provide funds for the payment of costs of certain airport improvements. The Series 2010A bonds bear stated interest ranging from 3.00% to 5.50%, with $172,925,000 serial bonds due October 1, 2012 to 2030 and $427,075,000 term bonds due October 1, 2029 to 2041.
In August 2010, the County issued $503,020,000 of Series 2010B all of which remains outstanding at September 30, 2010. Series 2010B were issued as part of a contingency program to finance certain airport capital projects under the Aviation Department’s CIP. The Series 2010B bonds bear stated interest ranging from 2.25% to 5.00%, with $228,795,000 serial bonds due October 1, 2013 to 2030 and $274,225,000 term bonds due October 1, 2035 to 2041.
MIAMI-DADE COUNTY AVIATION DEPARTMENT
Management’s Discussion and Analysis
September 30, 2010 and 2009
(Unaudited)
9 (Continued)
Additionally, on March 4, 2010 the County issued its Double-Barreled Aviation Bond (General Obligation), Series 2010, in the aggregate principal amount of $239,775,000 all of which remains outstanding at September 30, 2010. The Series 2010 Bonds are a general obligation of the County, secured by the full faith, credit and taxing power of the County. The Series 2010 Bonds are payable from ad valorem taxes levied on all taxable property in the County, without limitation as to rate or amount, to the extent that Net Available Airport Revenues are insufficient to pay debt services on the Series 2010 Bonds. ‘Net Available Airport Revenues’ is defined to mean any unencumbered funds held for the credit of the Improvement Fund created under the Trust Agreement after the payment of all obligations of the County pertaining to the County airports which are payable pursuant to, and subject to the restrictions of (i) the Trust Agreement, (ii) any Airline Use Agreement then in effect, or (iii) any other indenture, trust agreement or contract. Series 2010 was issued to provide long-term financing for certain capital improvement comprising a part of the CIP for the County’s Aviation Department. Proceeds of the Series 2010 Bonds will be used for financing or reimbursing the County for costs of the acquisition, construction, improvement, and/or installation by the Aviation Department of its MIA Mover Program and a portion of its North Terminal Program. The Series 2010 Bonds bear stated interest ranging from 2.00% to 5.00%, with $129,995,000 serial bonds due July 1, 2012 to 2032 and $109,760,000 term bonds due July 1, 2034 to 2041.
The Aviation Department initiated a Commercial Paper (CP) Program in July 2000, with the authorization of the Board of County Commissioners (the Board), of $400,000,000 Aviation Commercial Paper Notes with maturities not to exceed 270 days. As of September 30, 2010, 2009, and 2008, the Aviation Department had outstanding $0, $110.1 million, and $0, respectively. The CP Program expired on August 1, 2010.
Some issues of General Aviation Revenue Bonds are insured by various original monoline insurance companies whose credit ratings reflect the financial capacity of these companies. The purchase of insurance elevated bond ratings by Standard and Poor’s, Moody’s Investor Service, and Fitch Ratings, respectively, to AAA, Aaa, and AAA and lowered the interest rate on the related debt. The Trust Agreement requires that insurers have certain minimum ratings in order to insure County bonds. The policies provide that insurers will make debt service payments in the unlikely event that the County is unable to do so. Since the insured bonds were issued, the ratings of the various monoline insurers have been lowered or withdrawn by the rating agencies. The rating downgrades do not necessarily affect the insurance companies’ ability to pay claims, and the various insurance policies remain in effect. However, the Reserve Account was affected by the rating downgrades of the Surety policies that were purchased in lieu of cash funding the Debt Service Reserve Requirement.
MDAD funded the reserve requirement shortfall by funding the difference over a specified time period. As a result, the Department has a fully-funded cash reserve along with potentially viable but unusable Surety policies unless the ratings of the Reserve Surety Providers are upgraded to “AA/Aa” or higher. The County’s cash flow and its ability to pay its debt service obligation have not been affected.
As of September 30, 2010, the public underlying ratings for the Aviation Department’s outstanding General Aviation Revenue Bonds were A- with a stable outlook, A2 with a stable outlook, and A with a stable outlook per Standard and Poor’s, Moody’s Investors Service, Inc, and Fitch Ratings, respectively.
Additional information of the Aviation Department’s debt administration can be found in note 6 of this report.
MIAMI-DADE COUNTY AVIATION DEPARTMENT
Management’s Discussion and Analysis
September 30, 2010 and 2009
(Unaudited)
10
Economic Factors and Outlook
Most of the airline rates and charges at MIA continue to increase despite the decrease in operating expenses due to the issuance of additional debt required for the Aviation Department’s ongoing CIP. As previously stated, the Aviation Department calculates the landing fee rate on an airport system residual cost recovery basis and, therefore, is able to pass along these increases in costs to the MIA air carriers through the terminal rental rate, terminal concourse use fee, and the landing fee. This increase in debt service is expected to significantly increase in fiscal years 2011 and 2012 and then level off for the next few years.
MIA principally serves the metropolitan area of Miami-Dade County. The local residents in Miami-Dade County serve as a portion of the MIA passenger traffic, which means that the local economy somewhat affects the airport’s revenues. Like the rest of the nation, during fiscal year 2010, Miami-Dade County continued to economically struggle; although a number of the economic indicators improved over fiscal year 2009. On the negative side, Miami-Dade County experienced a significant increase in the unemployment rate and declines in median house prices. On the plus side, the County experienced an increase in taxable sales and visitors to the area, which improved the hotel occupancy rate over the prior year. Most of these positive factors had experienced declines in fiscal year 2009.
The rebound in visitors to the County is partially due to the increase in MIA passenger traffic. Compared to the nation’s 1.1% growth during fiscal year 2010, MIA’s growth of 3.1% is noteworthy. For a number of reasons, MIA passenger traffic has not experienced the same decline as the nation, most of which has to do with the strong Latin American traffic that passes through or visits MIA. In addition, with the completion of most of the gates in Concourse D and the reopening of the area previously referred to as Concourse A (but now part of Concourse D), American Airlines along with its regional airline American Eagle has significantly increased service to MIA. Delta Air Lines also significantly increased its service to MIA in fiscal year 2010.
Thus far in this economic cycle, Latin American economies have been more resilient than the U.S. economy, thereby diluting some of the negative impacts that other airports have faced and continue to face during this time of financial strain. This has benefited Miami International Airport because it dominates the Latin American/Caribbean region both in passenger numbers and cargo volume. The financial strength and stability of the airlines serving Miami International Airport will affect future airline traffic. While passenger demand at the airport remained strong in fiscal year 2010, there can be no assurance given as to the levels of aviation activity that will be achieved at the airport in the future. Any financial or operational difficulties incurred by American Airlines or any other major air carriers at the airport could have a material adverse effect on the airport, although the Aviation Department would take measures to mitigate the effect.
Air cargo tonnage at MIA greatly rebounded in fiscal year 2010 as noted by the 23.1% increase in cargo tonnage. This increase is reflective of the significant rebound in exports and imports from/to Latin American countries, which had both significantly declined in the previous year, thus benefitting MIA because MIA is a transshipment location with a major portion of the goods being shipped beyond MIA.
Request for Information
This financial report is designed to provide customers, creditors, and other interested parties with a general overview of the Aviation Department’s finances. Questions concerning any of the information provided in the report or requests for additional financial information should be addressed in writing to the Finance Manager, Miami-Dade County Aviation Department, 4200 N.W. 36th Street, Suite 300, Miami, FL 33122.
(Continued)11
MIAMI-DADE COUNTY AVIATION DEPARTMENT
Statements of Net Assets
September 30, 2010 and 2009
(In thousands)
Assets 2010 2009
Current assets:Cash and cash equivalents $ 156,874 94,131 Investments, including interest receivable 35,262 86,473 Accounts receivable, net of allowance for doubtful accounts of
$12,718 in 2010 and $15,541 in 2009 36,060 37,323 Inventories, prepaid expenses, and deferred charges 6,948 7,140 Due from County Agencies 22,670 25,294
Total current unrestricted assets 257,814 250,361
Restricted assets:Current restricted assets:
Cash and cash equivalents 131,178 159,771 Investments, including interest receivable 235,823 237,823 Government grants receivable 12,743 19,582 Passenger facility charges receivable 7,106 9,388
Total current restricted assets 386,850 426,564
Total current assets 644,664 676,925
Noncurrent assets:Restricted assets:
Cash and cash equivalents 983,805 314,417 Cash held in escrow by agent 13,937 21,541
Total noncurrent restricted assets 997,742 335,958
Capital assets:Land 88,836 88,836 Construction in progress 864,769 2,443,759 Buildings, improvement, and systems 5,830,205 3,628,358 Infrastructure 1,217,051 1,146,389 Furniture, equipment, and machinery 351,652 347,194 Less accumulated depreciation (2,014,591) (1,849,962)
Capital assets, net 6,337,922 5,804,574
Other noncurrent assets 75,857 72,370
Total noncurrent assets 7,411,521 6,212,902 Total assets $ 8,056,185 6,889,827
12
MIAMI-DADE COUNTY AVIATION DEPARTMENT
Statements of Net Assets
September 30, 2010 and 2009
(In thousands)
Liabilities and Net Assets 2010 2009
Current liabilities payable from unrestricted assets:Accounts payable and accrued expenses $ 20,522 31,546 Security deposits 9,908 10,159 Environmental remediation liability 9,215 9,615 Compensated absences 7,777 7,555 Deferred revenues 4,027 3,335 Due to County Agencies 7,867 8,393
Total current liabilities payable from unrestricted assets 59,316 70,603
Current liabilities payable from restricted assets:Accounts and contracts payable and accrued expenses 145,796 209,886 Bonds payable within one year:
Trust Agreement Aviation Revenue Bonds 64,276 61,049 Interest payable 156,929 127,269
Total current liabilities payable from restricted assets 367,001 398,204
Total current liabilities payable 426,317 468,807
Noncurrent liabilities:Trust Agreement Aviation Revenue Bonds payable after one year 6,301,212 5,017,813 Commercial paper notes — 110,141 Deferred rental credits 7,482 8,252 Compensated absences, net of current portion 20,905 20,402 Environmental remediation liability, net of current portion 79,630 79,980 Other noncurrent liabilities 4,337 4,451
Total noncurrent liabilities 6,413,566 5,241,039
Total liabilities 6,839,883 5,709,846
Net assets:Invested in capital assets, net of related debt 670,302 755,324 Restricted:
Restricted for Debt Service 255,897 175,107 Restricted for Reserve Maintenance 20,248 28,790 Restricted for Construction 107,854 81,717
Unrestricted 162,001 139,043 Total net assets $ 1,216,302 1,179,981
See accompanying notes to financial statements.
13
MIAMI-DADE COUNTY AVIATION DEPARTMENT
Statements of Revenues, Expenses, and Changes in Net Assets
Years ended September 30, 2010 and 2009
(In thousands)
2010 2009
Operating revenue:Aviation fees $ 280,872 238,938 Rentals 107,450 104,008 Commercial operations:
Management agreements 67,433 66,970 Concessions 112,170 103,500
Other 4,829 5,559 Other – environmental remediation 750 2,625
Total operating revenue 573,504 521,600
Operating expenses:Operating expenses 237,718 258,037 Operating expenses – environmental remediation 8,091 457 Operating expenses under management agreements 24,930 24,755 Operating expenses under operating agreements 39,099 39,678 General and administrative expenses 64,867 62,011
Total operating expenses beforedepreciation and amortization 374,705 384,938
Operating income before depreciation and amortization 198,799 136,662
Depreciation and amortization 167,693 138,968
Operating income (loss) 31,106 (2,306)
Nonoperating revenue (expenses):Environmental cost recovery 1,003 1,077 Passenger facility charges 60,214 61,756 Interest expense (161,542) (156,382) Investment income 5,678 5,981 Other revenue 16,268 13,086
Total nonoperating expenses (78,379) (74,482)
Loss before capital contributions (47,273) (76,788)
Capital contributions 83,594 64,789
Change in net assets 36,321 (11,999)
Net assets, beginning of year 1,179,981 1,191,980 Net assets, end of year $ 1,216,302 1,179,981
See accompanying notes to financial statements.
(Continued)14
MIAMI-DADE COUNTY AVIATION DEPARTMENT
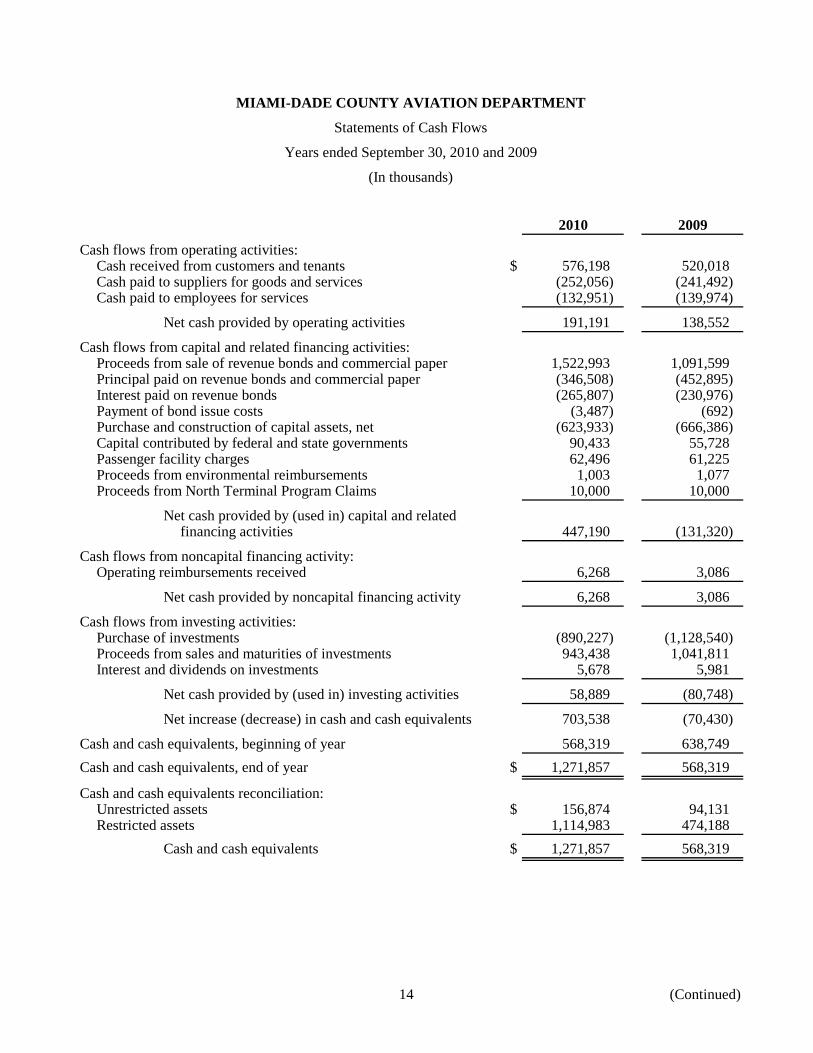
Statements of Cash Flows
Years ended September 30, 2010 and 2009
(In thousands)
2010 2009
Cash flows from operating activities:Cash received from customers and tenants $ 576,198 520,018 Cash paid to suppliers for goods and services (252,056) (241,492) Cash paid to employees for services (132,951) (139,974)
Net cash provided by operating activities 191,191 138,552
Cash flows from capital and related financing activities:Proceeds from sale of revenue bonds and commercial paper 1,522,993 1,091,599 Principal paid on revenue bonds and commercial paper (346,508) (452,895) Interest paid on revenue bonds (265,807) (230,976) Payment of bond issue costs (3,487) (692) Purchase and construction of capital assets, net (623,933) (666,386) Capital contributed by federal and state governments 90,433 55,728 Passenger facility charges 62,496 61,225 Proceeds from environmental reimbursements 1,003 1,077 Proceeds from North Terminal Program Claims 10,000 10,000
Net cash provided by (used in) capital and relatedfinancing activities 447,190 (131,320)
Cash flows from noncapital financing activity:Operating reimbursements received 6,268 3,086
Net cash provided by noncapital financing activity 6,268 3,086
Cash flows from investing activities:Purchase of investments (890,227) (1,128,540) Proceeds from sales and maturities of investments 943,438 1,041,811 Interest and dividends on investments 5,678 5,981
Net cash provided by (used in) investing activities 58,889 (80,748)
Net increase (decrease) in cash and cash equivalents 703,538 (70,430)
Cash and cash equivalents, beginning of year 568,319 638,749 Cash and cash equivalents, end of year $ 1,271,857 568,319
Cash and cash equivalents reconciliation:Unrestricted assets $ 156,874 94,131 Restricted assets 1,114,983 474,188
Cash and cash equivalents $ 1,271,857 568,319
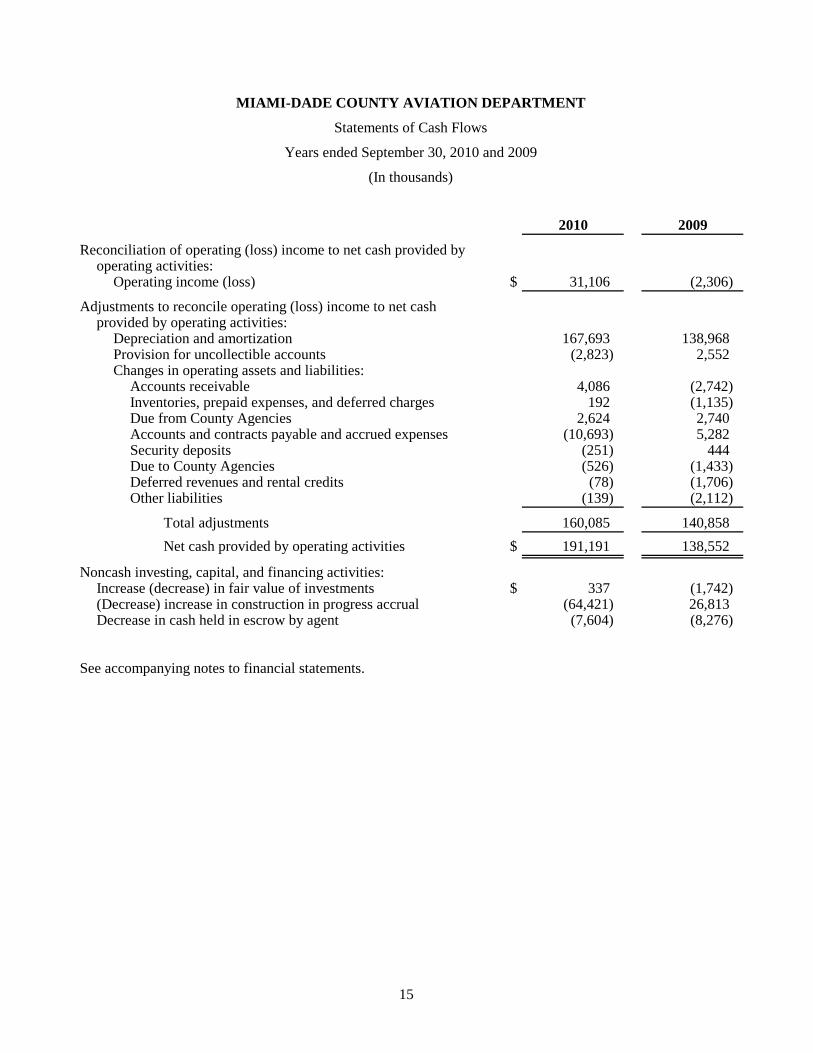
15
MIAMI-DADE COUNTY AVIATION DEPARTMENT
Statements of Cash Flows
Years ended September 30, 2010 and 2009
(In thousands)
2010 2009
Reconciliation of operating (loss) income to net cash provided byoperating activities:
Operating income (loss) $ 31,106 (2,306)
Adjustments to reconcile operating (loss) income to net cashprovided by operating activities:
Depreciation and amortization 167,693 138,968 Provision for uncollectible accounts (2,823) 2,552 Changes in operating assets and liabilities:
Accounts receivable 4,086 (2,742) Inventories, prepaid expenses, and deferred charges 192 (1,135) Due from County Agencies 2,624 2,740 Accounts and contracts payable and accrued expenses (10,693) 5,282 Security deposits (251) 444 Due to County Agencies (526) (1,433) Deferred revenues and rental credits (78) (1,706) Other liabilities (139) (2,112)
Total adjustments 160,085 140,858 Net cash provided by operating activities $ 191,191 138,552
Noncash investing, capital, and financing activities:Increase (decrease) in fair value of investments $ 337 (1,742) (Decrease) increase in construction in progress accrual (64,421) 26,813 Decrease in cash held in escrow by agent (7,604) (8,276)
See accompanying notes to financial statements.
MIAMI-DADE COUNTY AVIATION DEPARTMENT
Notes to Financial Statements
September 30, 2010 and 2009
16 (Continued)
(1) General
(a) Description
Miami-Dade County, Florida (the County) is a chartered political subdivision of the state of Florida and is granted home rule county powers by the Constitution of the State of Florida and Florida Statutes. The Board of County Commissioners (the Board) is the legislative and governing body of the County. The Miami-Dade County Aviation Department (the Aviation Department), established on February 6, 1973, is included as an enterprise fund in the County’s comprehensive annual financial report as part of the County’s reporting entity.
These statements present only the Aviation Department, and do not purport to, and do not present fairly the financial position of the County as of September 30, 2010 and 2009, and the changes in its financial position and its cash flows for the years then ended, in conformity with U.S. generally accepted accounting principles.
Pursuant to the general laws of Florida, the County owns Miami International Airport (MIA), three general aviation airports, and two training airports, one of which has been closed, (collectively, the Airports), all of which are operated by the Aviation Department.
(b) Basis of Presentation
The Aviation Department operates as an enterprise fund of the County. An enterprise fund is used to account for the financing of services to the general public, since substantially all of the costs involved are paid in the form of charges by users of such services. Accordingly, the Aviation Department’s financial statements have been prepared using the economic resources measurement focus and accrual basis of accounting. Revenues are recorded when earned and expenses are recorded at the time liabilities are incurred, regardless of when the related cash flows take place.
(c) Authority to Fix Rates
Under the provisions of the Trust Agreement, amended and restated dated December 15, 2002 by the County, The Bank of New York, successor in interest to JP Morgan Chase Bank, New York, New York, as trustee (the Trustee) and U.S. Bank National Association (successor in interest to Wachovia Bank, National Association, Miami, Florida) as co-trustee (the Co-Trustee) (the Trust Agreement), which amended and restated the Trust Agreement dated as of October 1, 1954 with the Chase Manhattan Bank (predecessor-in-interest to the Trustee) and First Union National Bank of Miami (predecessor-in-interest to the Co-Trustee), as amended and supplemented (the Original Trust Agreement), the Aviation Department is required to maintain, charge, and collect rates and charges for the use and services provided, which will provide revenues sufficient to:
• Pay current expenses, as defined in the Trust Agreement;
• Make the Reserve Maintenance Fund (the Reserve Maintenance Account) deposits recommended by the Consulting Engineers; and
• Make deposits to the Interest and Sinking Fund (the Sinking Fund Account) comprising the Bond Service Account, the Reserve Account, and the Redemption Account of not less than 120%
MIAMI-DADE COUNTY AVIATION DEPARTMENT
Notes to Financial Statements
September 30, 2010 and 2009
17 (Continued)
of the principal and interest requirements of the Trust Agreement Aviation Revenue Bonds, as defined in the Trust Agreement.
Any remaining balance in the Revenue Fund, after meeting the requirements noted above, is deposited to the Improvement Fund (the Improvement Account), as defined in the Trust Agreement.
(d) Agreements with Airlines
An Airline Use Agreement, which became effective in May 2002, establishes an airport system residual landing fee such that all costs not recovered through other revenues will be recovered from the landing fee revenue. Pursuant to the requirements of the Airlines Use Agreement, remaining money residing in the Improvement Fund at the end of the fiscal year in excess of $5 million, adjusted annually by the Consumer Price Index (CPI), is to be transferred to the Revenue Fund in the subsequent fiscal year thus reducing the amounts otherwise to be paid by the MIA air carriers in that fiscal year. The $5 million annual contribution is deposited into a separate account that has a cumulative cap of $15 million also subject to a CPI adjustment and can be used for any discretionary airport-related purpose. As of September 30, 2010 and 2009, these excess deposits, which are supposed to be transferred to the Revenue Fund annually by the following March, were approximately $57,222,000 and $71,954,000, respectively.
(e) Relationship with County Departments
The Aviation Department reimburses the General Fund of the County for its portion of the direct administrative service cost, such as Audit and Management Services, the Board, Clerk of the Courts, Computer Services and Information Systems, County Manager, Fire, Police, Personnel, and others. In 1996, an internal study was conducted by the County to determine the appropriate method as a basis to establish the indirect administrative services cost reimbursement for the year ended September 30, 1996 and subsequent years. This study was updated in 2003, which has recommended a cost allocation basis in accordance with the Office of Management and Budget (OMB) Circular A-87. For the years ended September 30, 2010 and 2009, the Aviation Department recorded an expense in the amount of $8,791,000 and $9,412,000, respectively, for the indirect administrative services cost reimbursement in accordance with the formula developed as a result of the study.
As of September 30, 2010 and 2009, the Aviation Department owes the County approximately $7,867,000 and $8,393,000, respectively, for various services. For these same periods, the Aviation Department has receivables due from the County in the amount of $22,670,000 and $25,294,000, respectively.
In addition, the Aviation Department pays other County departments directly for most services provided such as Fire, Police, Legal, and General Services Administration. The total cost to the Aviation Department for these services was approximately $70,024,000 and $70,610,000 for the years ended September 30, 2010 and 2009, respectively.
On March 20, 2003, the U.S. Department of Transportation, Office of the Inspector General (OIG) issued Report No. AV-2003-030 entitled Oversight of Airport Revenue in connection with their audit of amounts paid to the County by the Aviation Department. The OIG reported that the County diverted Aviation Department revenues of approximately $38 million from 1995 to 2000. On August 9, 2005, upon receiving additional information from the Aviation Department, the OIG
MIAMI-DADE COUNTY AVIATION DEPARTMENT
Notes to Financial Statements
September 30, 2010 and 2009
18 (Continued)
agreed to adjust the finding to $8.1 million, plus interest. The Oversight of Airport Revenue report was updated to include the years 2001 through 2005, and the total diversion of revenues was increased to $12 million, plus interest of $2.3 million for a total of $14.3 million. The County repaid the Aviation Department $2,257,005 and $2,257,006 in fiscal years 2010 and 2009, respectively, leaving an unpaid balance of $2,257,006 as of September 30, 2010, which is included in due from County Agencies in the accompanying statements of net assets. The $2,257,006 unpaid balance will be repaid by the County in quarterly installments of $564,251 over the next fiscal year.
(2) Summary of Significant Accounting Policies
(a) Basis of Accounting
The financial statements are presented on the accrual basis of accounting. Under this method, revenues are recorded when earned, and expenses are recorded when incurred.
(b) Cash and Cash Equivalents
Cash includes cash on hand, amounts in demand deposits, and positions in investment pools that can be deposited or withdrawn without notice or penalty. Cash equivalents are short-term highly liquid securities with known market values and maturities, when acquired, of less than three months.
(c) Investments
Investments consist primarily of U.S. government securities and are carried at fair value based on quoted market prices.
(d) Inventories
Inventories consisting of building materials/supplies and spare parts are valued at cost using the first-in, first-out (FIFO) method.
(e) Capital Assets and Depreciation
Capital assets are recorded at cost, except for contributions by third parties, which are recorded at fair value at the date of contribution. Expenditures for maintenance, repairs, minor renewals, and betterments are expensed as incurred. When property is disposed of, the cost and related accumulated depreciation is eliminated from the accounts and any gain or loss is reflected in the statements of revenues, expenses, and changes in net assets.
MIAMI-DADE COUNTY AVIATION DEPARTMENT
Notes to Financial Statements
September 30, 2010 and 2009
19 (Continued)
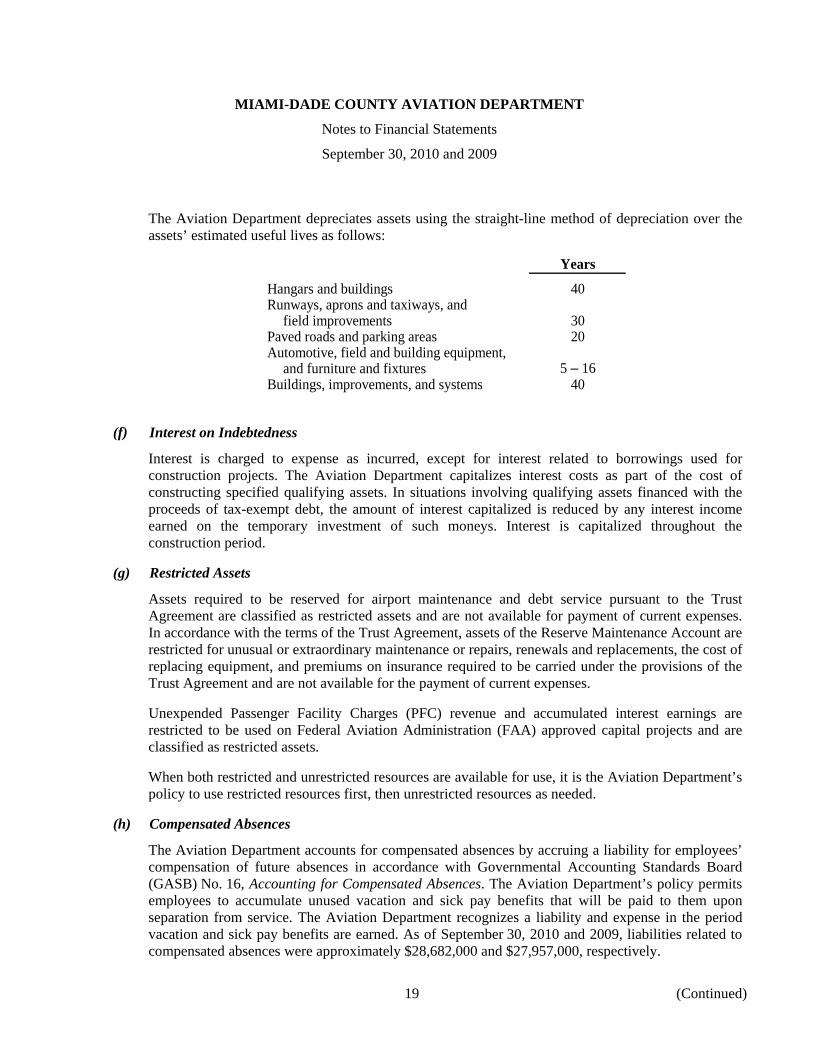
The Aviation Department depreciates assets using the straight-line method of depreciation over the assets’ estimated useful lives as follows:
Years
Hangars and buildings 40Runways, aprons and taxiways, and
field improvements 30Paved roads and parking areas 20Automotive, field and building equipment,
and furniture and fixtures 5 – 16Buildings, improvements, and systems 40
(f) Interest on Indebtedness
Interest is charged to expense as incurred, except for interest related to borrowings used for construction projects. The Aviation Department capitalizes interest costs as part of the cost of constructing specified qualifying assets. In situations involving qualifying assets financed with the proceeds of tax-exempt debt, the amount of interest capitalized is reduced by any interest income earned on the temporary investment of such moneys. Interest is capitalized throughout the construction period.
(g) Restricted Assets
Assets required to be reserved for airport maintenance and debt service pursuant to the Trust Agreement are classified as restricted assets and are not available for payment of current expenses. In accordance with the terms of the Trust Agreement, assets of the Reserve Maintenance Account are restricted for unusual or extraordinary maintenance or repairs, renewals and replacements, the cost of replacing equipment, and premiums on insurance required to be carried under the provisions of the Trust Agreement and are not available for the payment of current expenses.
Unexpended Passenger Facility Charges (PFC) revenue and accumulated interest earnings are restricted to be used on Federal Aviation Administration (FAA) approved capital projects and are classified as restricted assets.
When both restricted and unrestricted resources are available for use, it is the Aviation Department’s policy to use restricted resources first, then unrestricted resources as needed.
(h) Compensated Absences
The Aviation Department accounts for compensated absences by accruing a liability for employees’ compensation of future absences in accordance with Governmental Accounting Standards Board (GASB) No. 16, Accounting for Compensated Absences. The Aviation Department’s policy permits employees to accumulate unused vacation and sick pay benefits that will be paid to them upon separation from service. The Aviation Department recognizes a liability and expense in the period vacation and sick pay benefits are earned. As of September 30, 2010 and 2009, liabilities related to compensated absences were approximately $28,682,000 and $27,957,000, respectively.
MIAMI-DADE COUNTY AVIATION DEPARTMENT
Notes to Financial Statements
September 30, 2010 and 2009
20 (Continued)
(i) Environmental Remediation
Environmental remediation expenses that relate to current operations are expensed. Assets acquired for environmental remediation are capitalized as appropriate. Environmental remediation expenses that relate to an existing condition caused by past operations, and which do not contribute to current or future revenue generation, are expensed.
(j) Refundings Resulting in the Defeasance of Debt
For current and advance refundings resulting in the defeasance of debt, the difference between the reacquisition price and the net carrying amount of the old debt is deferred and amortized as a component of interest expense using the weighted average method since the results are not significantly different from the effective interest method over the remaining life of the old debt or the life of the new debt, whichever is shorter. The difference in these amounts, to the extent unamortized, is accounted for as an element of the carrying cost of the related debt.
(k) Bond Discount/Premium and Issuance Costs
Discount/premium on bonds and bond issuance costs are amortized using the straight-line method over the life of the related bond issue since the results are not significantly different from the interest method of amortization.
(l) Pension Plan
The Aviation Department contributes to the Florida Retirement System (FRS or the System), a cost-sharing multi-employer plan. Under GASB Statement No. 27, Accounting for Pensions by State and Local Government Employers, employers that participate in multi-employer defined benefit plans are required to measure and disclose an amount for annual pension costs on the accrual basis of accounting.
(m) Net Asset Classifications
Net assets are classified and displayed in three components:
Invested in capital assets, net of related debt – Consists of capital assets including capital assets, net of accumulated depreciation and reduced by the outstanding balances of any bonds, notes, or other borrowings that are attributable to the acquisition, construction, or improvement of those assets.
Restricted net assets – Consists of net assets with constraints placed on the use either by (1) external groups, such as creditors, grantors, contributors, or laws or regulations of other governments; or (2) law through constitutional provisions or enabling legislation.
Unrestricted net assets – All other net assets that do not meet the definition of “restricted” or “invested in capital assets, net of related debt.”
MIAMI-DADE COUNTY AVIATION DEPARTMENT
Notes to Financial Statements
September 30, 2010 and 2009
21 (Continued)
(n) Revenue Classifications
The Aviation Department defines operating revenue as those revenues earned from aviation operations and charged to customers and tenants. Nonoperating revenues include interest earnings, certain grants, and PFC collections.
The components of the major revenue captions are:
Aviation fees – landing fees, concourse use charges, loading bridge use charges, baggage claim use charges, screening fees, airplane parking fees, and other similar facilities and service use fees and charges.
Rentals – rentals of land, buildings, and machinery and equipment.
Management agreements – revenues from the sale of publications, automotive parking fees, pharmacy facilities, baggage services, special services lounges, the Airport Hotel, Fuel Farm, and the Top of the Port Restaurant.
Concessions – revenues from the sale of duty-free merchandise, rent-a-car companies, and various services provided by terminal complex concessionaires.
(o) Grants from Government Agencies
Grants received for the acquisition or construction of capital assets are recorded as capital contributions, when earned. Grants are earned when costs relating to such capital assets, which are reimbursable under the terms of the grants, have been incurred. During fiscal years 2010 and 2009, the Aviation Department recorded approximately $83,594,000 and $64,789,000, respectively, in contributions consisting of federal and state grants in aid of construction.
(p) Passenger Facility Charges
The FAA authorized the Aviation Department to impose PFC of $3.00 per passenger commencing November 1, 1994. In October 2001, with an effective date of January 1, 2002, the FAA approved an increase in the PFC at MIA to $4.50. The net receipts from PFCs are restricted to be used for funding FAA-approved capital projects and debt service attributable to such approved capital projects.
PFC revenue is reported as nonoperating revenue. The Aviation Department has been authorized to collect PFCs on eligible enplaning revenue-generating passengers in the aggregate amount not to exceed $2,757,441,000 including interest, of which $814,159,000 has been earned through September 30, 2010.
(q) Application of FASB Pronouncements to Proprietary Funds
GASB No. 20, Accounting and Financial Reporting for Proprietary Funds and Other Governmental Entities That Use Proprietary Fund Accounting, gave the option of adopting Financial Accounting Standards Board (FASB) standards issued after November 30, 1989, unless the latter contradict GASB pronouncements, or not following FASB standards issued after such date. The Aviation Department elected not to apply FASB statements and interpretations issued subsequent to November 30, 1989.
MIAMI-DADE COUNTY AVIATION DEPARTMENT
Notes to Financial Statements
September 30, 2010 and 2009
22 (Continued)
(r) Use of Estimates
The preparation of the financial statements requires management of the Aviation Department to make a number of estimates and assumptions relating to the reported amounts of assets and liabilities and the disclosure of contingent assets and liabilities at the date of the financial statements and the reported amounts of revenues and expenses during the reporting period. Significant items subject to such estimates and assumptions include the valuation allowances for receivables, self-insurance, and environmental liabilities. Actual results could differ from those estimates.
(s) Implementation of New Accounting Standards
In December 2006, the GASB issued GASB Statement No. 49, Accounting and Financial Reporting for Pollution Remediation Obligations. This statement provides guidance on how to calculate and report the cost and obligations associated with pollution cleanup efforts. The requirements of this statement become effective for fiscal periods beginning after December 15, 2007. Effective October 1, 2008, the Aviation Department adopted GASB Statement No. 49. The impact of adopting GASB No. 49 as of October 1, 2008 was not material to the Aviation Department’s financial statements.
In June 2007, the GASB issued GASB Statement No. 51, Accounting and Financial Reporting for Intangible Assets. This statement establishes accounting and financial reporting requirements for intangible assets including easements, water rights, timber rights, patents, trademarks, and computer software. An absence of sufficiently specific authoritative guidance has resulted in inconsistencies in the accounting and financial reporting of intangible assets among state and local governments, particularly in the areas of recognition, initial measurement, and amortization. The objective of this statement is to establish accounting and financial reporting requirements for intangible assets to reduce these inconsistencies, thereby enhancing the comparability of the accounting and financial reporting of such assets among state and local governments. The requirements of this statement are effective for financial statements for periods beginning after June 15, 2009. As of September 30, 2010, the Aviation Department has not acquired or developed intangible assets, as such, the adoption of GASB Statement No. 51 was not material to the Aviation Department’s financial statements.
In June 2008, the GASB issued GASB Statement No. 53, Accounting and Financial Reporting for Derivative Instruments. This statement addresses the recognition, measurement, and disclosure of information regarding derivative instruments entered into by state and local governments. Derivative instruments are often complex financial arrangements used by governments to manage specific risks or to make investments. By entering into these arrangements, governments receive and make payments based on market prices without actually entering into the related financial or commodity transactions. Derivative instruments associated with changing financial and commodity prices result in changing cash flows and fair values that can be used as effective risk-management or investment tools. Derivative instruments, however, also can expose governments to significant risks and liabilities. Common types of derivative instruments used by governments include interest rate and commodity swaps, interest rate locks, options (caps, floors, and collars), swap options, forward contracts, and futures contracts. The requirements of the new statement become effective for fiscal periods beginning after June 15, 2009. As of September 30, 2010, the Aviation Department has no derivative instruments, as such, the adoption of GASB Statement No. 53 was not material to the Aviation Department’s financial statements.
MIAMI-DADE COUNTY AVIATION DEPARTMENT
Notes to Financial Statements
September 30, 2010 and 2009
23 (Continued)
(t) Reclassification
Certain prior year amounts have been reclassified to conform to the current year’s presentation.
(3) Cash and Cash Equivalents and Investments
The County is authorized through Florida Statutes §218.415, Ordinance No. 84-47, Resolution R-31-09 and its Investment Policy to make certain investments. The Investment Policy was updated and adopted on January 22, 2009 in response to current and possible uncertainties in the domestic and international financial markets. The County’s overall investment objectives are, in order of priority, the safety of principal, liquidity of funds, and maximizing investment income.
As of September 30, 2010 and 2009, total unrestricted and restricted cash and cash equivalents and investments comprise the following:
2010 2009(In thousands)
Cash and cash equivalents $ 1,271,857 568,319 Investments, including interest receivable 271,085 324,296
$ 1,542,942 892,615
The carrying amounts of the Aviation Department’s local deposits were $20.0 million and $6.7 million as of September 30, 2010 and 2009, respectively. All deposits are fully insured by Federal Depository Insurance and are held in qualified public depositories pursuant to Florida Statutes Chapter 280, Florida Security for Public Deposits Act. Under the Act, all qualified public depositories are required to pledge eligible collateral having a market value equal to or greater than the average daily or monthly balance of all public deposits times the depository’s collateral pledging level. The pledging level may range from 50% to 125% depending upon the depository’s financial condition and establishment period. All collateral must be deposited with an approved financial institution. Any losses to public depositors are covered by applicable deposit insurance, sale of securities pledged as collateral and, if necessary, assessments against other qualified public depositories of the same type as the depository in default.
As a rule, the Aviation Department intends to hold all purchased securities until their final maturity date. There may be occasional exceptions, including, but not limited to the need to sell securities to meet unexpected liquidity needs.
Cash held in escrow by agent of $13.9 million and $21.5 million as of September 30, 2010 and 2009, respectively, represents the proceeds held by the Florida Department of Transportation (FDOT) State Infrastructure Bank to fund construction projects. See note 6.
MIAMI-DADE COUNTY AVIATION DEPARTMENT
Notes to Financial Statements
September 30, 2010 and 2009
24 (Continued)
Cash, cash equivalents, and investments as of September 30, 2010 and 2009 are summarized as follows:
2010 2009(In thousands)
Cash deposits $ 19,975 6,739
U.S. government securities 1,491,951 748,550 Money market 24,989 132,323 Interest bearing 6,027 5,003
Total cash equivalents and investments 1,522,967 885,876 $ 1,542,942 892,615
At September 30, 2010 and 2009, the carrying value of cash equivalents and investments included the following (in thousands):
2010 2009Investment type Fair value Fair value
Federal Home Loan Mortgage Company $ 420,449 163,848 Federal Home Loan Bank 406,363 254,259 Federal Farm Credit Bank 101,556 119,591 Fannie Mae 385,803 159,085 Treasury notes 177,780 51,767 Money market 24,989 132,323 Interest bearing 6,027 5,003
$ 1,522,967 885,876
(a) Credit Risk
The Aviation Department’s Investment Policy (the Policy) minimizes credit risk by restricting authorized investments to: Local Government Surplus Funds Trust Fund (SBA) or any intergovernmental investment pool authorized pursuant to the Florida Interlocal Cooperation Act; Securities and Exchange Commission (SEC) registered money market funds with the highest credit quality rating from a nationally recognized rating agency; interest-bearing time deposits or savings accounts in qualified public depositories, pursuant to Florida Statutes §280.02, which are defined as banks, savings bank, or savings association organized under the laws of the United States with an office in this state that is authorized to receive deposits, and has deposit insurance under the provisions of the Federal Deposit Insurance Act; direct obligations of the U.S. Treasury; federal agencies and instrumentalities; securities of, or other interest in, any open-end or closed-end management-type investment company or investment trust registered under the Investment Company Act of 1940, provided that the portfolio is limited to the obligations of the U.S. government or any agency or instrumentality thereof and to repurchase agreements fully collateralized by such U.S. government obligations, and provided that such investment company or investment trust takes delivery of such collateral either directly or through an authorized custodian; Commercial paper of
MIAMI-DADE COUNTY AVIATION DEPARTMENT
Notes to Financial Statements
September 30, 2010 and 2009
25 (Continued)
prime quality with a stated maturity of 270 days or less from the date of its issuance, which has the highest letter and numerical rating as provided for by at least one nationally recognized rating service; Banker Acceptances that have a stated maturity of 180 days or less from the date of its issuance, and have the highest letter and numerical rating as provided for by at least one nationally recognized rating service, and are drawn on and accepted by commercial banks and that are eligible for purchase by the Federal Reserve Bank; and investments in Repurchase Agreements (Repos) collateralized by securities authorized by this policy.
All Repos shall be governed by a standard SIFMA Master Repurchase Agreement; municipal securities issued by U.S. state or local governments, having at time of purchase, a stand-alone credit rating of AA or better assigned by two or more recognized credit rating agencies or a short-term credit rating of A1/P1 or equivalent from one or more recognized credit rating agencies.
The table below summarizes the investments by type and credit ratings as of September 30, 2010 and 2009:
Investment type Credit rating
Federal Home Loan Mortgage Corporation AAAFederal Home Loan Bank AAAFederal Farm Credit Bank AAAFannie Mae AAATreasury notes N/AMoney market AAAmInterest bearing N/A
(b) Custodial Credit Risk
The Policy requires that bank deposits be secured per Chapter 280, Florida Statutes. This requires local governments to deposit funds only in financial institutions designated as qualified public depositories by the Chief Financial Officer of the State of Florida and creates the Public Deposits Trust Fund, a multiple financial institution pool with the ability to assess its member financial institutions for collateral shortfalls if a default or insolvency has occurred. As of September 30, 2010, all of the County’s bank deposits were in qualified public depositories.
The Policy requires the execution of a Custodial Safekeeping Agreement (CSA) for all purchased securities and shall be held for the credit of the County in an account separate and apart from the assets of the financial institution.
(c) Concentration of Credit Risk
The Policy establishes limitations on portfolio composition by investment type and by issuer to limit its exposure to concentration of credit risk. The Policy provides that a maximum of 50% of the portfolio may be invested in the State of Florida Local Government Surplus Trust Fund (the Pool); however, bond proceeds may be temporarily deposited in the Pool until alternative investments have been purchased. Prior to any investment in the Pool, approval must be received from the Board. A maximum of 30% of the portfolio may be invested in SEC-registered money market funds with no
MIAMI-DADE COUNTY AVIATION DEPARTMENT
Notes to Financial Statements
September 30, 2010 and 2009
26 (Continued)
more than 10% to any single money market fund. A maximum of 20% of the portfolio may be invested in interest-bearing time deposits or demand accounts with no more than 5% deposited with any one issuer.
There is no limit on the percentage of the total portfolio that may be invested in direct obligations of the U.S. Treasury or federal agencies and instrumentalities, with no limits on individual issuers (investment in agencies containing call options shall be limited to a maximum of 25% of the total portfolio). A maximum of 5% of the portfolio may be invested in open-end or closed-end funds. A maximum of 50% of the portfolio may be in prime commercial paper with a maximum of 5% with any one issuer. A maximum of 25% of the portfolio may be invested in bankers’ acceptances with a maximum of 10% with any one issuer, but a maximum of 60% of the portfolio may be invested in both commercial paper and bankers’ acceptances. A maximum of 20% of the portfolio may be invested in repurchase agreements with the exception of one (1) business day agreement, with a maximum of 10% of the portfolio in any one institution or dealer with the exception of one (1) business day agreement. Investments in derivative products shall be prohibited by the County. A maximum of 25% of the portfolio may be directly invested in municipal obligations, up to 5% with any one municipal issuer.
As of September 30, 2010 and 2009, the following issuers held 5% or more of the investment portfolio:
Issuer 2010 2009
Federal Farm Credit Bank 6.70% 13.50%Federal Home Loan Bank 26.68 28.70Federal Home Loan Mortgage Corporation 27.61 18.50Fannie Mae 25.33 17.96Treasury notes 11.67 5.84Money market — 14.94
(d) Interest Rate Risk
The Policy limits interest rate risk by requiring the matching of known cash needs and anticipated net cash outflow requirements; following historical spread relationships between different security types and issuers; and evaluating both interest rate forecasts and maturity dates to consider short-term market expectations. The Policy requires that investments made with current operating funds shall maintain a weighted average of no longer than one year. Investments for bond reserves, construction funds, and other nonoperating funds shall have a term appropriate to the need for funds and in accordance with debt covenants. The Policy limits the maturity of an investment to a maximum of five years.
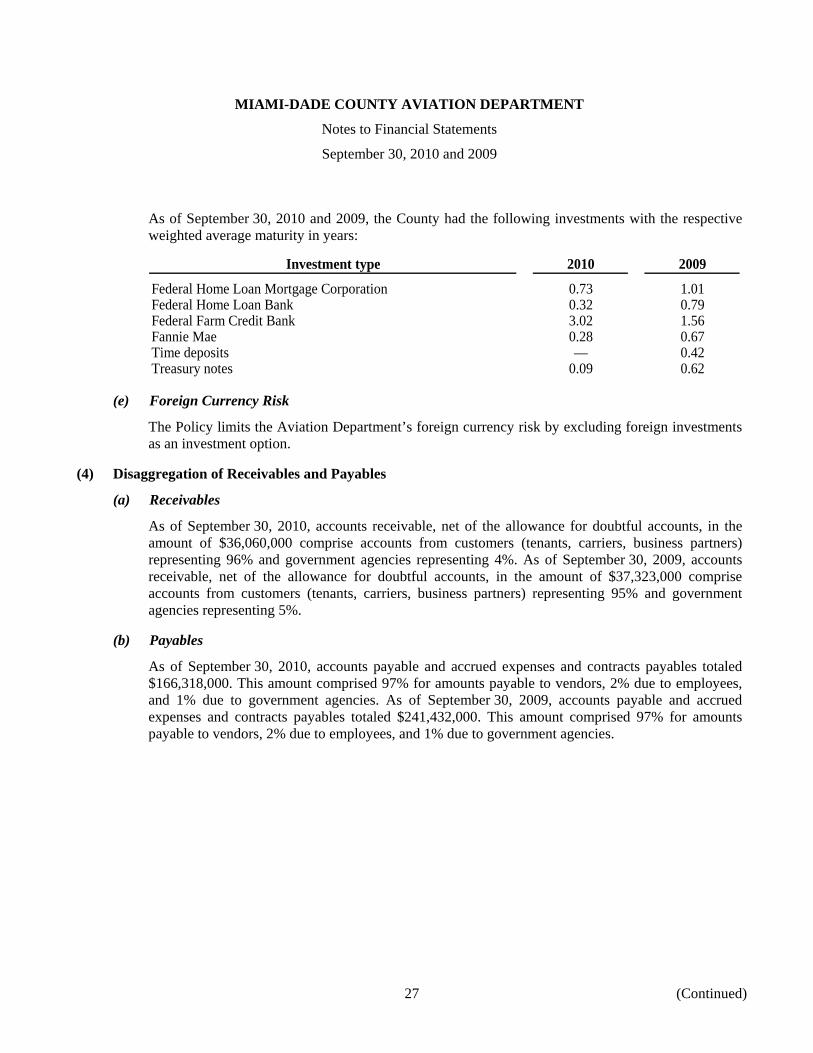
MIAMI-DADE COUNTY AVIATION DEPARTMENT
Notes to Financial Statements
September 30, 2010 and 2009
27 (Continued)
As of September 30, 2010 and 2009, the County had the following investments with the respective weighted average maturity in years:
Investment type 2010 2009
Federal Home Loan Mortgage Corporation 0.73 1.01Federal Home Loan Bank 0.32 0.79Federal Farm Credit Bank 3.02 1.56Fannie Mae 0.28 0.67Time deposits — 0.42Treasury notes 0.09 0.62
(e) Foreign Currency Risk
The Policy limits the Aviation Department’s foreign currency risk by excluding foreign investments as an investment option.
(4) Disaggregation of Receivables and Payables
(a) Receivables
As of September 30, 2010, accounts receivable, net of the allowance for doubtful accounts, in the amount of $36,060,000 comprise accounts from customers (tenants, carriers, business partners) representing 96% and government agencies representing 4%. As of September 30, 2009, accounts receivable, net of the allowance for doubtful accounts, in the amount of $37,323,000 comprise accounts from customers (tenants, carriers, business partners) representing 95% and government agencies representing 5%.
(b) Payables
As of September 30, 2010, accounts payable and accrued expenses and contracts payables totaled $166,318,000. This amount comprised 97% for amounts payable to vendors, 2% due to employees, and 1% due to government agencies. As of September 30, 2009, accounts payable and accrued expenses and contracts payables totaled $241,432,000. This amount comprised 97% for amounts payable to vendors, 2% due to employees, and 1% due to government agencies.
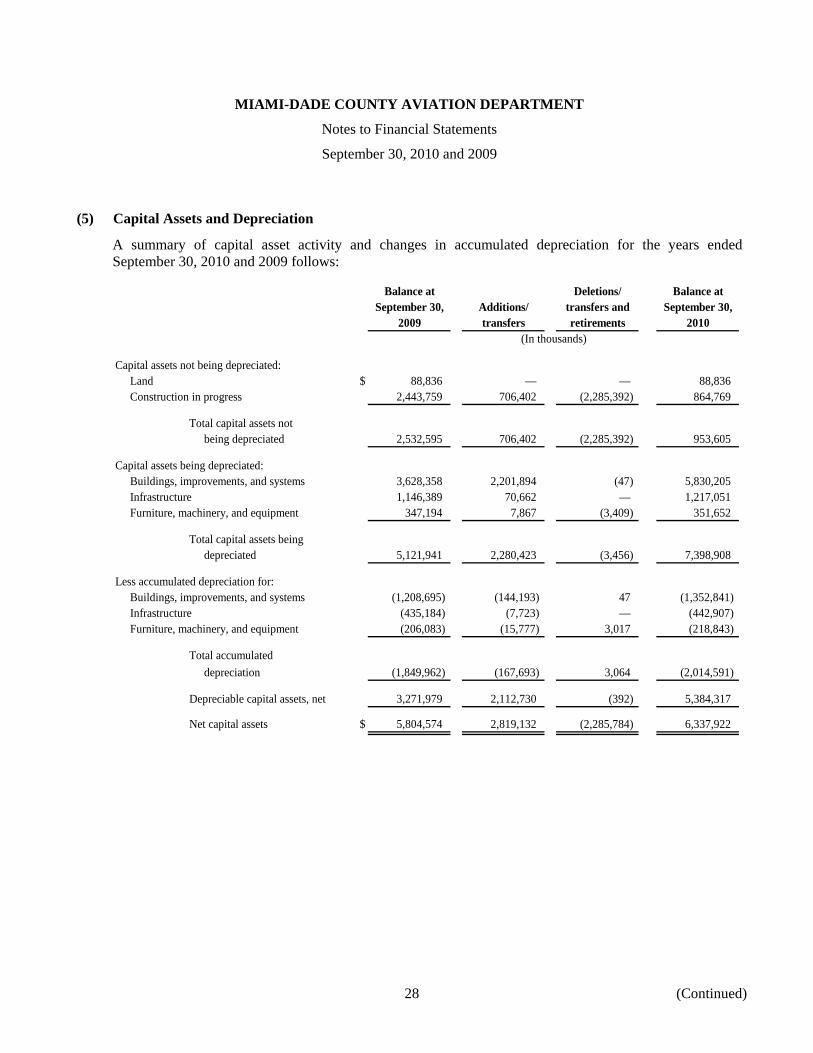
MIAMI-DADE COUNTY AVIATION DEPARTMENT
Notes to Financial Statements
September 30, 2010 and 2009
28 (Continued)
(5) Capital Assets and Depreciation
A summary of capital asset activity and changes in accumulated depreciation for the years ended September 30, 2010 and 2009 follows:
Balance at Deletions/ Balance atSeptember 30, Additions/ transfers and September 30,
2009 transfers retirements 2010(In thousands)
Capital assets not being depreciated:Land $ 88,836 — — 88,836 Construction in progress 2,443,759 706,402 (2,285,392) 864,769
Total capital assets notbeing depreciated 2,532,595 706,402 (2,285,392) 953,605
Capital assets being depreciated:Buildings, improvements, and systems 3,628,358 2,201,894 (47) 5,830,205 Infrastructure 1,146,389 70,662 — 1,217,051 Furniture, machinery, and equipment 347,194 7,867 (3,409) 351,652
Total capital assets beingdepreciated 5,121,941 2,280,423 (3,456) 7,398,908
Less accumulated depreciation for:Buildings, improvements, and systems (1,208,695) (144,193) 47 (1,352,841) Infrastructure (435,184) (7,723) — (442,907) Furniture, machinery, and equipment (206,083) (15,777) 3,017 (218,843)
Total accumulateddepreciation (1,849,962) (167,693) 3,064 (2,014,591)
Depreciable capital assets, net 3,271,979 2,112,730 (392) 5,384,317
Net capital assets $ 5,804,574 2,819,132 (2,285,784) 6,337,922
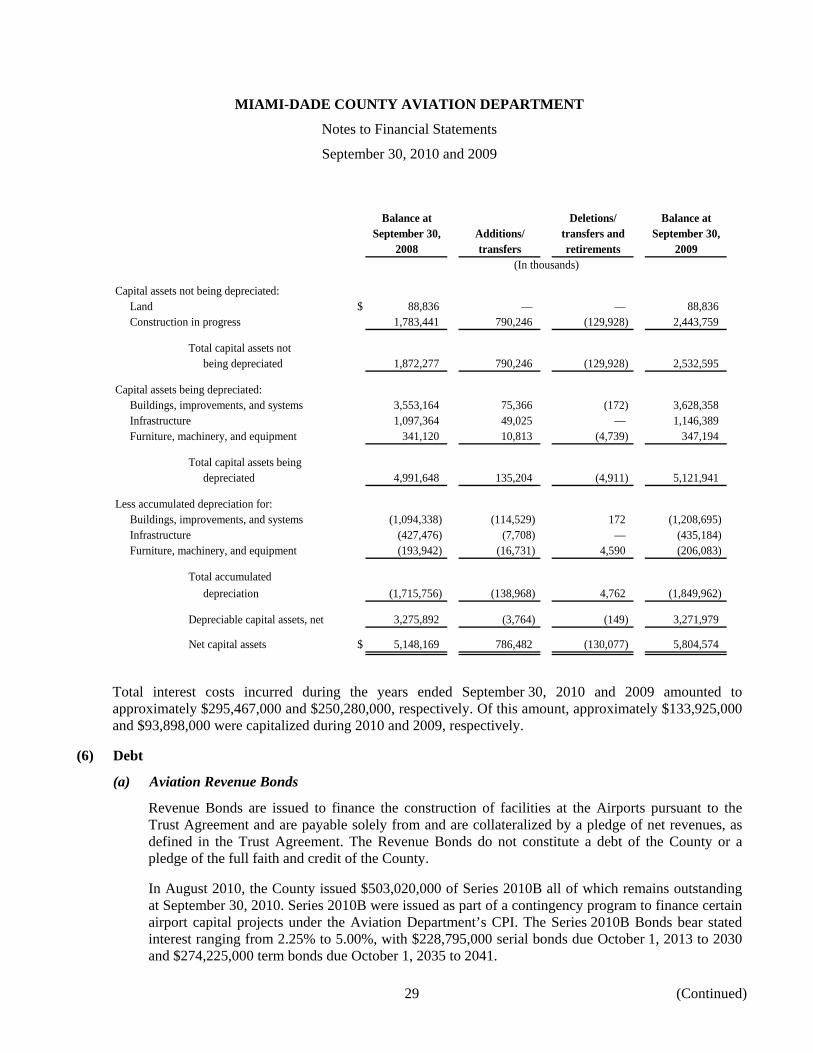
MIAMI-DADE COUNTY AVIATION DEPARTMENT
Notes to Financial Statements
September 30, 2010 and 2009
29 (Continued)
Balance at Deletions/ Balance atSeptember 30, Additions/ transfers and September 30,
2008 transfers retirements 2009(In thousands)
Capital assets not being depreciated:Land $ 88,836 — — 88,836 Construction in progress 1,783,441 790,246 (129,928) 2,443,759
Total capital assets notbeing depreciated 1,872,277 790,246 (129,928) 2,532,595
Capital assets being depreciated:Buildings, improvements, and systems 3,553,164 75,366 (172) 3,628,358 Infrastructure 1,097,364 49,025 — 1,146,389 Furniture, machinery, and equipment 341,120 10,813 (4,739) 347,194
Total capital assets beingdepreciated 4,991,648 135,204 (4,911) 5,121,941
Less accumulated depreciation for:Buildings, improvements, and systems (1,094,338) (114,529) 172 (1,208,695) Infrastructure (427,476) (7,708) — (435,184) Furniture, machinery, and equipment (193,942) (16,731) 4,590 (206,083)
Total accumulateddepreciation (1,715,756) (138,968) 4,762 (1,849,962)
Depreciable capital assets, net 3,275,892 (3,764) (149) 3,271,979
Net capital assets $ 5,148,169 786,482 (130,077) 5,804,574
Total interest costs incurred during the years ended September 30, 2010 and 2009 amounted to approximately $295,467,000 and $250,280,000, respectively. Of this amount, approximately $133,925,000 and $93,898,000 were capitalized during 2010 and 2009, respectively.
(6) Debt
(a) Aviation Revenue Bonds
Revenue Bonds are issued to finance the construction of facilities at the Airports pursuant to the Trust Agreement and are payable solely from and are collateralized by a pledge of net revenues, as defined in the Trust Agreement. The Revenue Bonds do not constitute a debt of the County or a pledge of the full faith and credit of the County.
In August 2010, the County issued $503,020,000 of Series 2010B all of which remains outstanding at September 30, 2010. Series 2010B were issued as part of a contingency program to finance certain airport capital projects under the Aviation Department’s CPI. The Series 2010B Bonds bear stated interest ranging from 2.25% to 5.00%, with $228,795,000 serial bonds due October 1, 2013 to 2030 and $274,225,000 term bonds due October 1, 2035 to 2041.
MIAMI-DADE COUNTY AVIATION DEPARTMENT
Notes to Financial Statements
September 30, 2010 and 2009
30 (Continued)
In January 2010, the County issued $600,000,000 of Series 2010A all of which remains outstanding at September 30, 2010. The Series 2010A were issued to refund outstanding Commercial Paper Notes and to provide funds for the payment of costs of certain airport improvements. The Series 2010A Bonds bear stated interest ranging from 3.00% to 5.50%, with $172,925,000 serial bonds due October 1, 2012 to 2030 and $427,075,000 term bonds due October 1, 2029 to 2041.
In May 2009, the County issued $388,440,000 of Series 2009A all of which remains outstanding at September 30, 2010 and $211,560,000 of Series 2009B all of which remains outstanding at September 30, 2010. The Series 2009A and 2009B were issued to refund outstanding Commercial Paper Notes and to provide funds for the payment of costs of certain airport improvements. The Series 2009B Bonds bear stated interest ranging from 3.00% to 5.75%, with $62,170,000 serial bonds due October 1, 2011 to 2029 and $149,390,000 term bonds due October 1, 2025 to 2041. The Series 2009A Bonds bear stated interest ranging from 3.00% to 6.00%, with $138,170,000 serial bonds due October 1, 2011 to 2029 and $250,270,000 term bonds due October 1, 2036 to 2041.
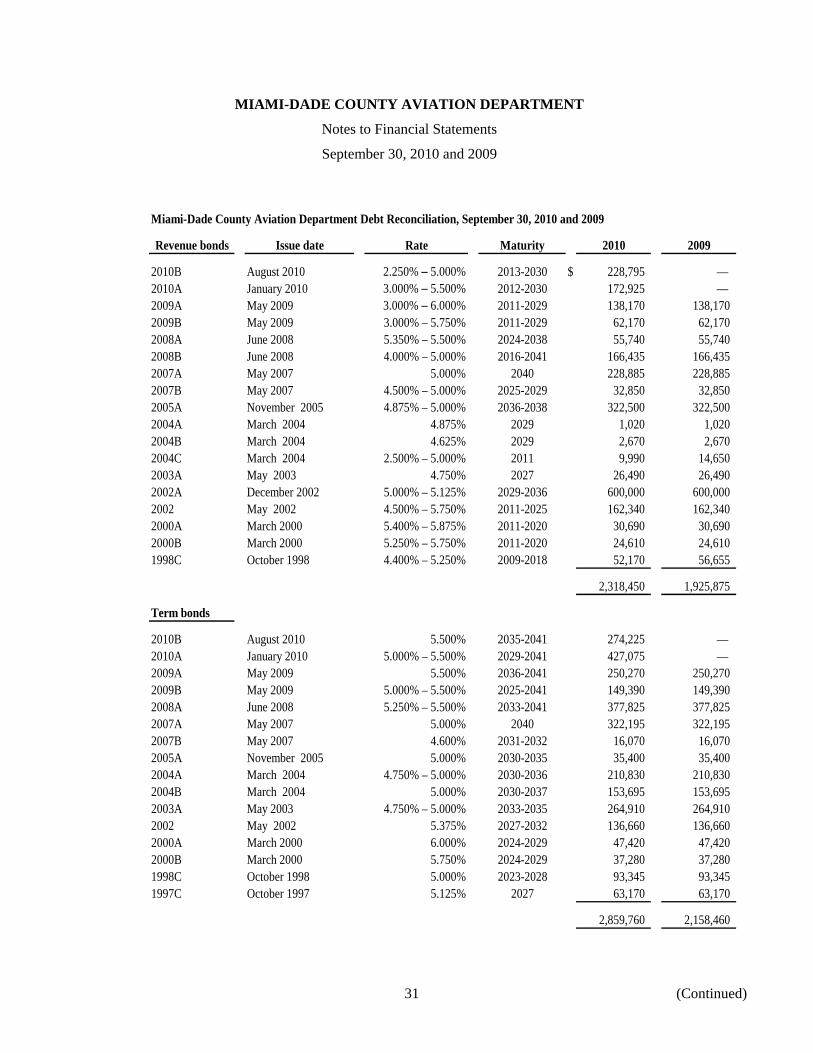
MIAMI-DADE COUNTY AVIATION DEPARTMENT
Notes to Financial Statements
September 30, 2010 and 2009
31 (Continued)
Miami-Dade County Aviation Department Debt Reconciliation, September 30, 2010 and 2009
Revenue bonds Issue date Rate Maturity 2010 2009
2010B August 2010 2.250% – 5.000% 2013-2030 $ 228,795 — 2010A January 2010 3.000% – 5.500% 2012-2030 172,925 — 2009A May 2009 3.000% – 6.000% 2011-2029 138,170 138,1702009B May 2009 3.000% – 5.750% 2011-2029 62,170 62,1702008A June 2008 5.350% – 5.500% 2024-2038 55,740 55,7402008B June 2008 4.000% – 5.000% 2016-2041 166,435 166,4352007A May 2007 5.000% 2040 228,885 228,8852007B May 2007 4.500% – 5.000% 2025-2029 32,850 32,8502005A November 2005 4.875% – 5.000% 2036-2038 322,500 322,5002004A March 2004 4.875% 2029 1,020 1,0202004B March 2004 4.625% 2029 2,670 2,6702004C March 2004 2.500% – 5.000% 2011 9,990 14,6502003A May 2003 4.750% 2027 26,490 26,4902002A December 2002 5.000% – 5.125% 2029-2036 600,000 600,0002002 May 2002 4.500% – 5.750% 2011-2025 162,340 162,3402000A March 2000 5.400% – 5.875% 2011-2020 30,690 30,6902000B March 2000 5.250% – 5.750% 2011-2020 24,610 24,6101998C October 1998 4.400% – 5.250% 2009-2018 52,170 56,655
2,318,450 1,925,875
Term bonds
2010B August 2010 5.500% 2035-2041 274,225 — 2010A January 2010 5.000% – 5.500% 2029-2041 427,075 — 2009A May 2009 5.500% 2036-2041 250,270 250,2702009B May 2009 5.000% – 5.500% 2025-2041 149,390 149,3902008A June 2008 5.250% – 5.500% 2033-2041 377,825 377,8252007A May 2007 5.000% 2040 322,195 322,1952007B May 2007 4.600% 2031-2032 16,070 16,0702005A November 2005 5.000% 2030-2035 35,400 35,4002004A March 2004 4.750% – 5.000% 2030-2036 210,830 210,8302004B March 2004 5.000% 2030-2037 153,695 153,6952003A May 2003 4.750% – 5.000% 2033-2035 264,910 264,9102002 May 2002 5.375% 2027-2032 136,660 136,6602000A March 2000 6.000% 2024-2029 47,420 47,4202000B March 2000 5.750% 2024-2029 37,280 37,2801998C October 1998 5.000% 2023-2028 93,345 93,3451997C October 1997 5.125% 2027 63,170 63,170
2,859,760 2,158,460
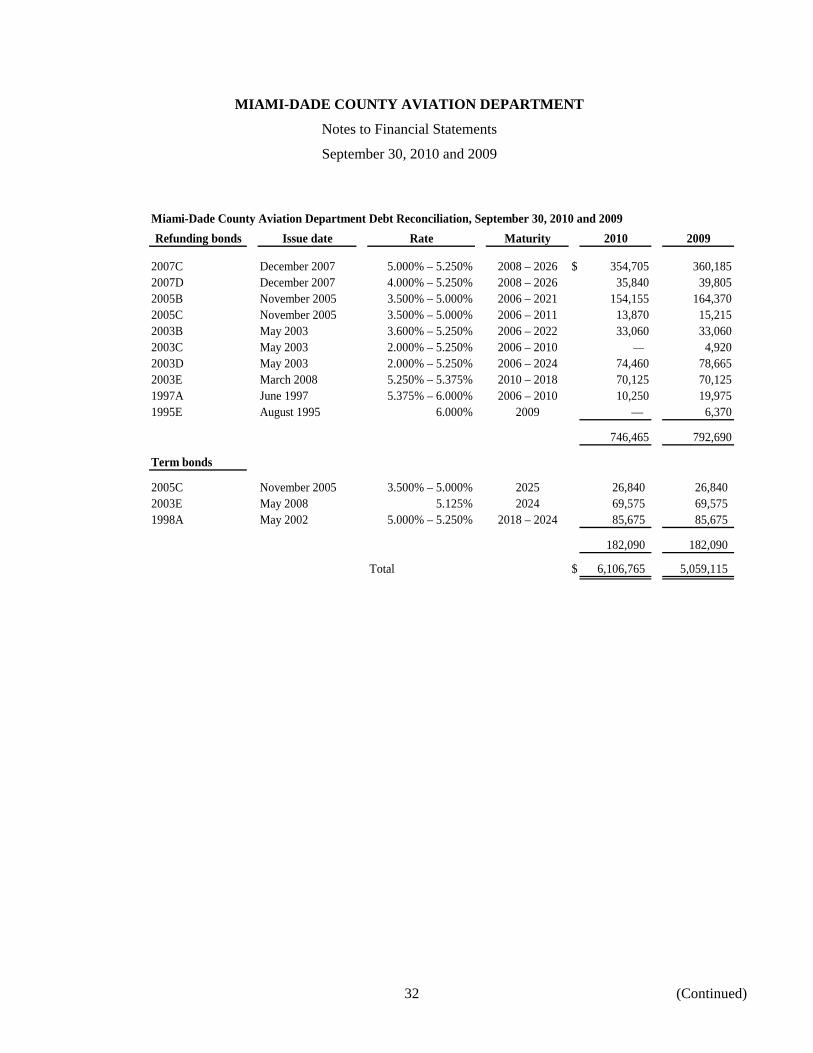
MIAMI-DADE COUNTY AVIATION DEPARTMENT
Notes to Financial Statements
September 30, 2010 and 2009
32 (Continued)
Miami-Dade County Aviation Department Debt Reconciliation, September 30, 2010 and 2009Refunding bonds Issue date Rate Maturity 2010 2009, , , ,
2007C December 2007 5.000% – 5.250% 2008 – 2026 $ 354,705 360,1852007D December 2007 4.000% – 5.250% 2008 – 2026 35,840 39,8052005B November 2005 3.500% – 5.000% 2006 – 2021 154,155 164,3702005C November 2005 3.500% – 5.000% 2006 – 2011 13,870 15,2152003B May 2003 3.600% – 5.250% 2006 – 2022 33,060 33,0602003C May 2003 2.000% – 5.250% 2006 – 2010 — 4,9202003D May 2003 2.000% – 5.250% 2006 – 2024 74,460 78,6652003E March 2008 5.250% – 5.375% 2010 – 2018 70,125 70,1251997A June 1997 5.375% – 6.000% 2006 – 2010 10,250 19,9751995E August 1995 6.000% 2009 — 6,370
746,465 792,690
Term bonds
2005C November 2005 3.500% – 5.000% 2025 26,840 26,8402003E May 2008 5.125% 2024 69,575 69,5751998A May 2002 5.000% – 5.250% 2018 – 2024 85,675 85,675
182,090 182,090
Total $ 6,106,765 5,059,115
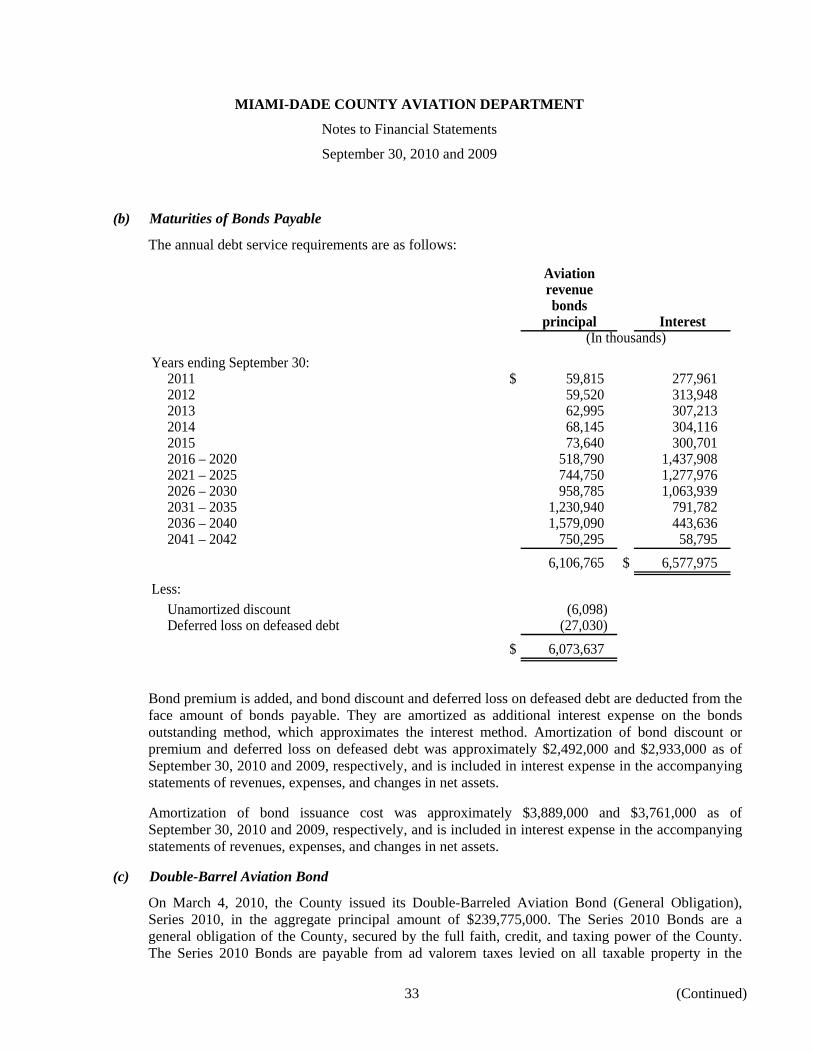
MIAMI-DADE COUNTY AVIATION DEPARTMENT
Notes to Financial Statements
September 30, 2010 and 2009
33 (Continued)
(b) Maturities of Bonds Payable
The annual debt service requirements are as follows:
Aviationrevenuebonds
principal Interest(In thousands)
Years ending September 30:2011 $ 59,815 277,961 2012 59,520 313,948 2013 62,995 307,213 2014 68,145 304,116 2015 73,640 300,701 2016 – 2020 518,790 1,437,908 2021 – 2025 744,750 1,277,976 2026 – 2030 958,785 1,063,939 2031 – 2035 1,230,940 791,782 2036 – 2040 1,579,090 443,636 2041 – 2042 750,295 58,795
6,106,765 $ 6,577,975
Less:Unamortized discount (6,098) Deferred loss on defeased debt (27,030)
$ 6,073,637
Bond premium is added, and bond discount and deferred loss on defeased debt are deducted from the face amount of bonds payable. They are amortized as additional interest expense on the bonds outstanding method, which approximates the interest method. Amortization of bond discount or premium and deferred loss on defeased debt was approximately $2,492,000 and $2,933,000 as of September 30, 2010 and 2009, respectively, and is included in interest expense in the accompanying statements of revenues, expenses, and changes in net assets.
Amortization of bond issuance cost was approximately $3,889,000 and $3,761,000 as of September 30, 2010 and 2009, respectively, and is included in interest expense in the accompanying statements of revenues, expenses, and changes in net assets.
(c) Double-Barrel Aviation Bond
On March 4, 2010, the County issued its Double-Barreled Aviation Bond (General Obligation), Series 2010, in the aggregate principal amount of $239,775,000. The Series 2010 Bonds are a general obligation of the County, secured by the full faith, credit, and taxing power of the County. The Series 2010 Bonds are payable from ad valorem taxes levied on all taxable property in the
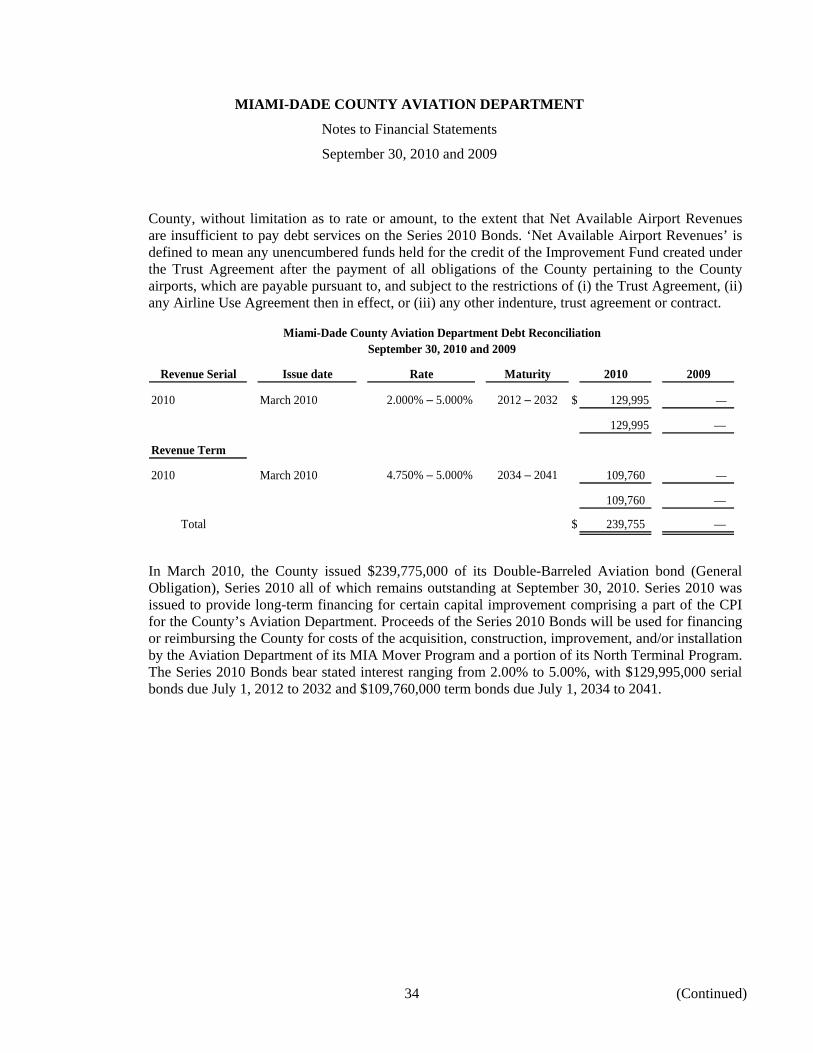
MIAMI-DADE COUNTY AVIATION DEPARTMENT
Notes to Financial Statements
September 30, 2010 and 2009
34 (Continued)
County, without limitation as to rate or amount, to the extent that Net Available Airport Revenues are insufficient to pay debt services on the Series 2010 Bonds. ‘Net Available Airport Revenues’ is defined to mean any unencumbered funds held for the credit of the Improvement Fund created under the Trust Agreement after the payment of all obligations of the County pertaining to the County airports, which are payable pursuant to, and subject to the restrictions of (i) the Trust Agreement, (ii) any Airline Use Agreement then in effect, or (iii) any other indenture, trust agreement or contract.
Miami-Dade County Aviation Department Debt ReconciliationSeptember 30, 2010 and 2009
Revenue Serial Issue date Rate Maturity 2010 2009
2010 March 2010 2.000% – 5.000% 2012 – 2032 $ 129,995 —
129,995 —
Revenue Term
2010 March 2010 4.750% – 5.000% 2034 – 2041 109,760 —
109,760 —
Total $ 239,755 —
In March 2010, the County issued $239,775,000 of its Double-Barreled Aviation bond (General Obligation), Series 2010 all of which remains outstanding at September 30, 2010. Series 2010 was issued to provide long-term financing for certain capital improvement comprising a part of the CPI for the County’s Aviation Department. Proceeds of the Series 2010 Bonds will be used for financing or reimbursing the County for costs of the acquisition, construction, improvement, and/or installation by the Aviation Department of its MIA Mover Program and a portion of its North Terminal Program. The Series 2010 Bonds bear stated interest ranging from 2.00% to 5.00%, with $129,995,000 serial bonds due July 1, 2012 to 2032 and $109,760,000 term bonds due July 1, 2034 to 2041.
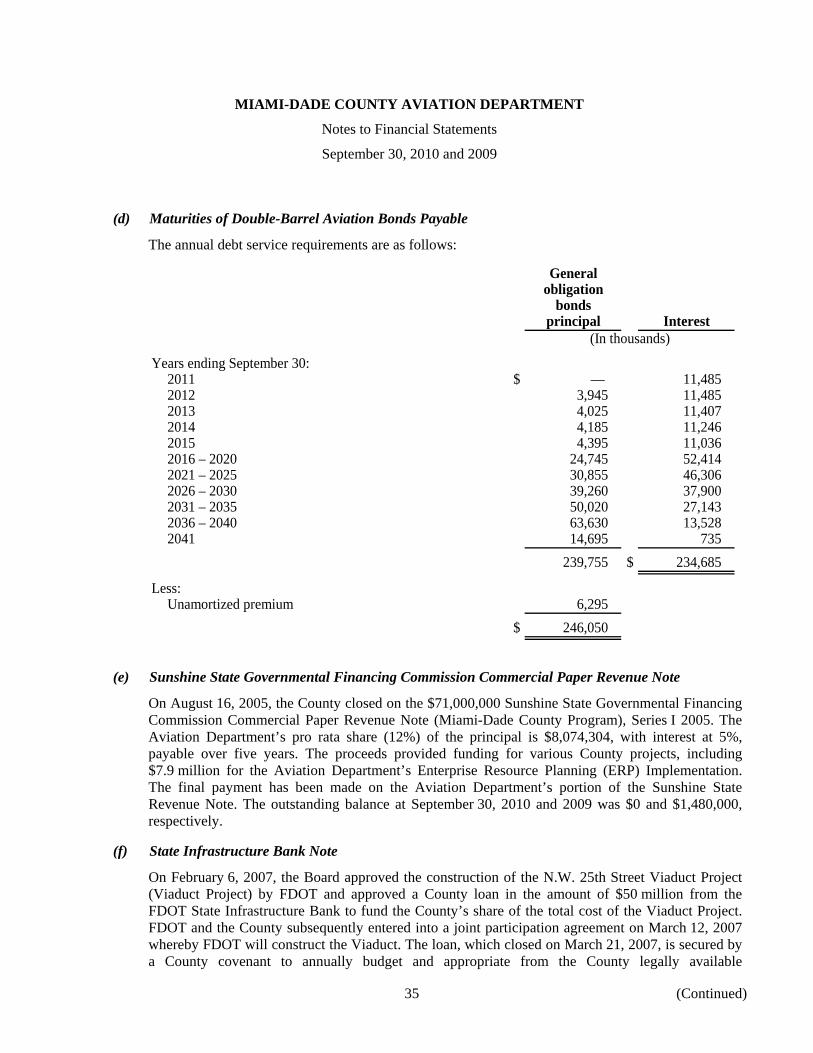
MIAMI-DADE COUNTY AVIATION DEPARTMENT
Notes to Financial Statements
September 30, 2010 and 2009
35 (Continued)
(d) Maturities of Double-Barrel Aviation Bonds Payable
The annual debt service requirements are as follows:
Generalobligation
bondsprincipal Interest
(In thousands)
Years ending September 30:2011 $ — 11,485 2012 3,945 11,485 2013 4,025 11,407 2014 4,185 11,246 2015 4,395 11,036 2016 – 2020 24,745 52,414 2021 – 2025 30,855 46,306 2026 – 2030 39,260 37,900 2031 – 2035 50,020 27,143 2036 – 2040 63,630 13,528 2041 14,695 735
239,755 $ 234,685
Less:Unamortized premium 6,295
$ 246,050
(e) Sunshine State Governmental Financing Commission Commercial Paper Revenue Note
On August 16, 2005, the County closed on the $71,000,000 Sunshine State Governmental Financing Commission Commercial Paper Revenue Note (Miami-Dade County Program), Series I 2005. The Aviation Department’s pro rata share (12%) of the principal is $8,074,304, with interest at 5%, payable over five years. The proceeds provided funding for various County projects, including $7.9 million for the Aviation Department’s Enterprise Resource Planning (ERP) Implementation. The final payment has been made on the Aviation Department’s portion of the Sunshine State Revenue Note. The outstanding balance at September 30, 2010 and 2009 was $0 and $1,480,000, respectively.
(f) State Infrastructure Bank Note
On February 6, 2007, the Board approved the construction of the N.W. 25th Street Viaduct Project (Viaduct Project) by FDOT and approved a County loan in the amount of $50 million from the FDOT State Infrastructure Bank to fund the County’s share of the total cost of the Viaduct Project. FDOT and the County subsequently entered into a joint participation agreement on March 12, 2007 whereby FDOT will construct the Viaduct. The loan, which closed on March 21, 2007, is secured by a County covenant to annually budget and appropriate from the County legally available
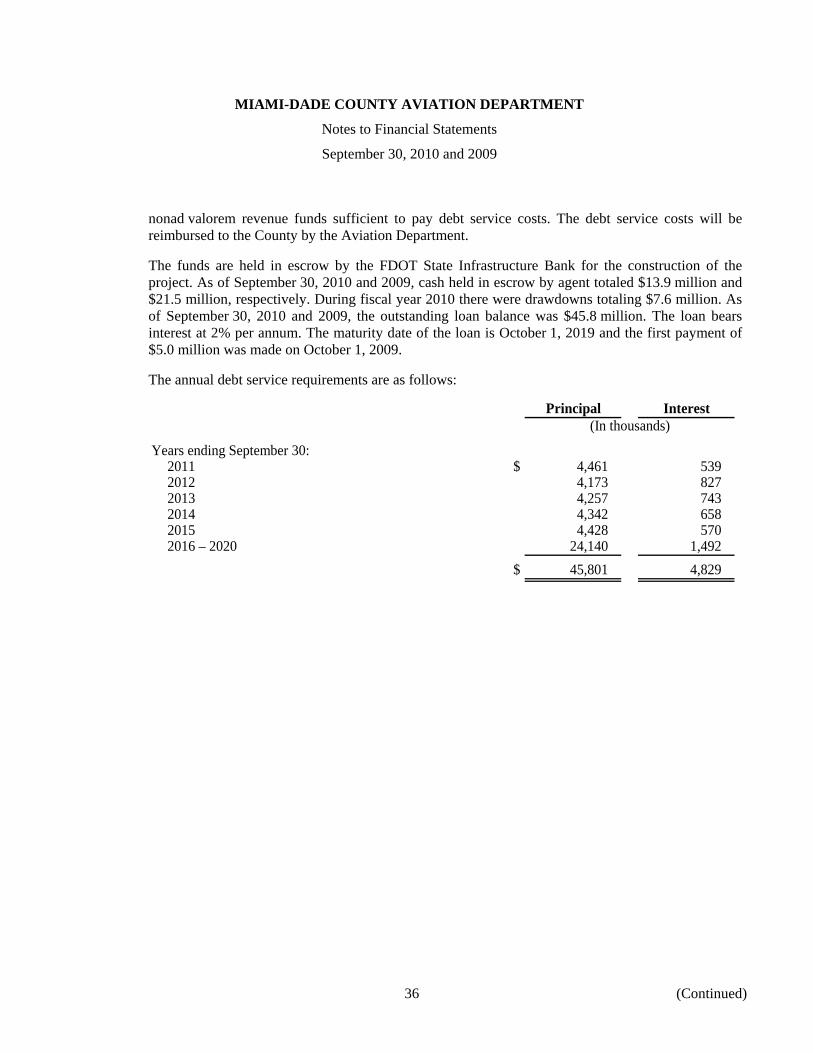
MIAMI-DADE COUNTY AVIATION DEPARTMENT
Notes to Financial Statements
September 30, 2010 and 2009
36 (Continued)
nonad valorem revenue funds sufficient to pay debt service costs. The debt service costs will be reimbursed to the County by the Aviation Department.
The funds are held in escrow by the FDOT State Infrastructure Bank for the construction of the project. As of September 30, 2010 and 2009, cash held in escrow by agent totaled $13.9 million and $21.5 million, respectively. During fiscal year 2010 there were drawdowns totaling $7.6 million. As of September 30, 2010 and 2009, the outstanding loan balance was $45.8 million. The loan bears interest at 2% per annum. The maturity date of the loan is October 1, 2019 and the first payment of $5.0 million was made on October 1, 2009.
The annual debt service requirements are as follows:
Principal Interest(In thousands)
Years ending September 30:2011 $ 4,461 539 2012 4,173 827 2013 4,257 743 2014 4,342 658 2015 4,428 570 2016 – 2020 24,140 1,492
$ 45,801 4,829
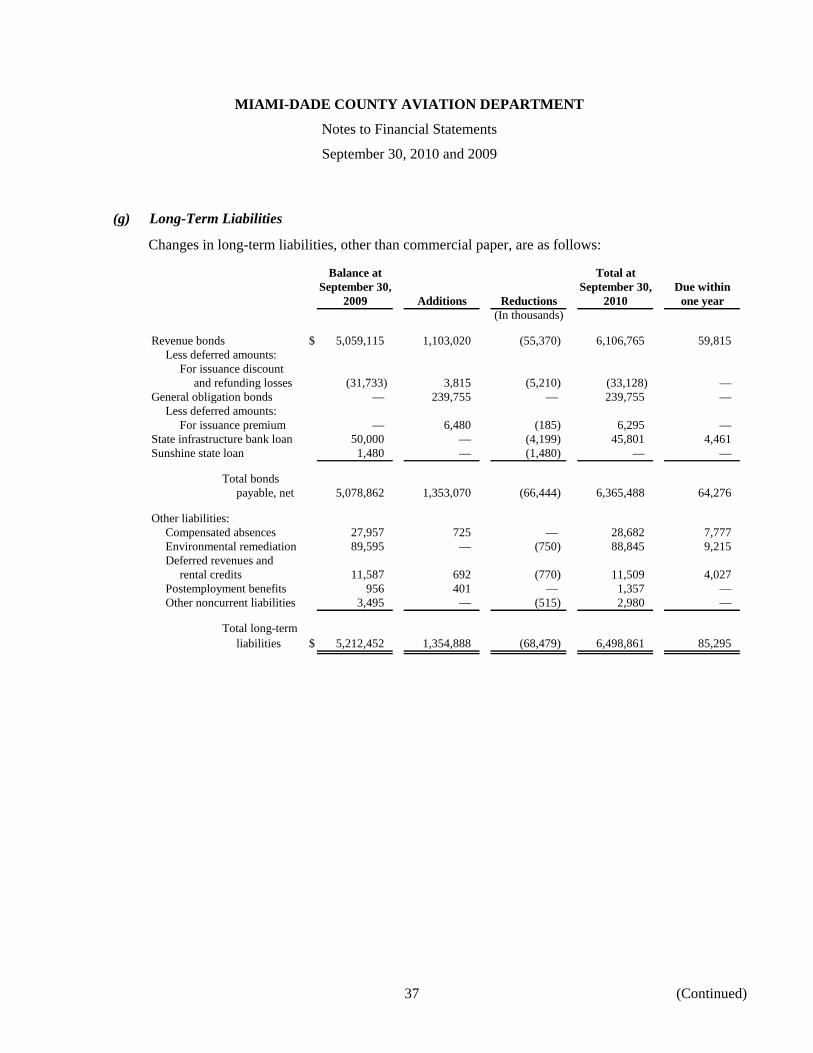
MIAMI-DADE COUNTY AVIATION DEPARTMENT
Notes to Financial Statements
September 30, 2010 and 2009
37 (Continued)
(g) Long-Term Liabilities
Changes in long-term liabilities, other than commercial paper, are as follows:
Balance at Total atSeptember 30, September 30, Due within
2009 Additions Reductions 2010 one year(In thousands)
Revenue bonds $ 5,059,115 1,103,020 (55,370) 6,106,765 59,815 Less deferred amounts:
For issuance discountand refunding losses (31,733) 3,815 (5,210) (33,128) —
General obligation bonds — 239,755 — 239,755 — Less deferred amounts:
For issuance premium — 6,480 (185) 6,295 — State infrastructure bank loan 50,000 — (4,199) 45,801 4,461 Sunshine state loan 1,480 — (1,480) — —
Total bondspayable, net 5,078,862 1,353,070 (66,444) 6,365,488 64,276
Other liabilities:Compensated absences 27,957 725 — 28,682 7,777 Environmental remediation 89,595 — (750) 88,845 9,215 Deferred revenues and
rental credits 11,587 692 (770) 11,509 4,027 Postemployment benefits 956 401 — 1,357 — Other noncurrent liabilities 3,495 — (515) 2,980 —
Total long-termliabilities $ 5,212,452 1,354,888 (68,479) 6,498,861 85,295
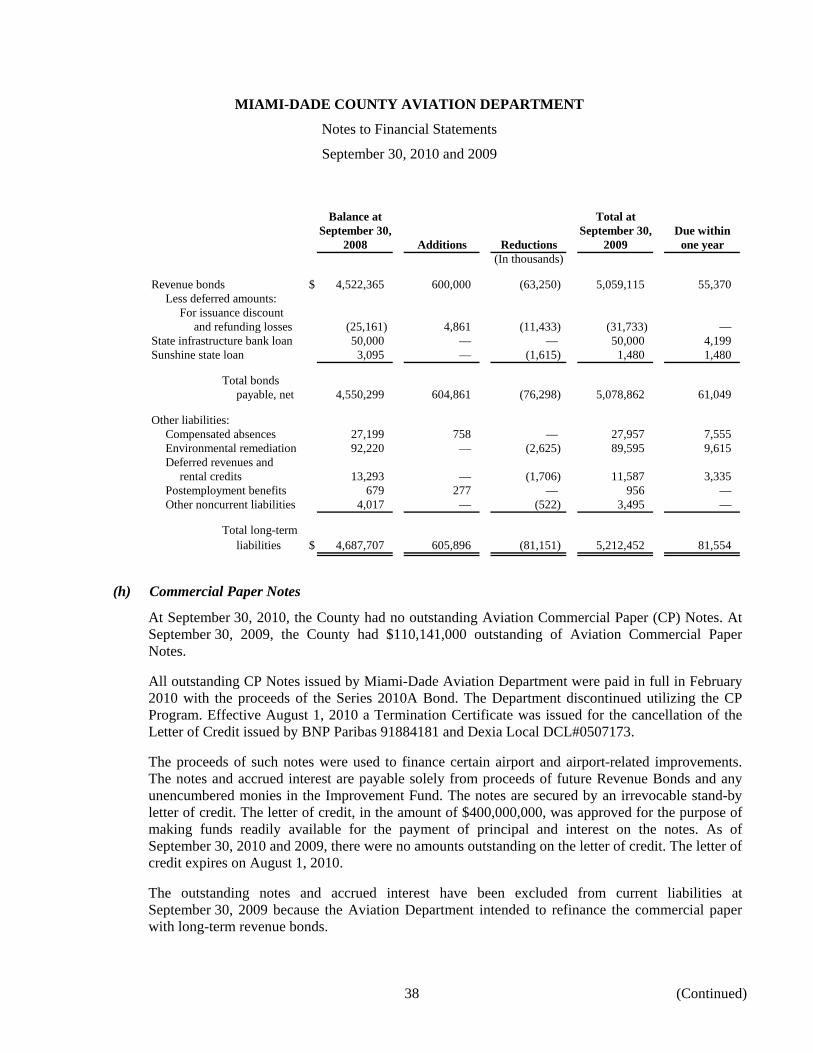
MIAMI-DADE COUNTY AVIATION DEPARTMENT
Notes to Financial Statements
September 30, 2010 and 2009
38 (Continued)
Balance at Total atSeptember 30, September 30, Due within
2008 Additions Reductions 2009 one year(In thousands)
Revenue bonds $ 4,522,365 600,000 (63,250) 5,059,115 55,370 Less deferred amounts:
For issuance discountand refunding losses (25,161) 4,861 (11,433) (31,733) —
State infrastructure bank loan 50,000 — — 50,000 4,199 Sunshine state loan 3,095 — (1,615) 1,480 1,480
Total bondspayable, net 4,550,299 604,861 (76,298) 5,078,862 61,049
Other liabilities:Compensated absences 27,199 758 — 27,957 7,555 Environmental remediation 92,220 — (2,625) 89,595 9,615 Deferred revenues and
rental credits 13,293 — (1,706) 11,587 3,335 Postemployment benefits 679 277 — 956 — Other noncurrent liabilities 4,017 — (522) 3,495 —
Total long-termliabilities $ 4,687,707 605,896 (81,151) 5,212,452 81,554
(h) Commercial Paper Notes
At September 30, 2010, the County had no outstanding Aviation Commercial Paper (CP) Notes. At September 30, 2009, the County had $110,141,000 outstanding of Aviation Commercial Paper Notes.
All outstanding CP Notes issued by Miami-Dade Aviation Department were paid in full in February 2010 with the proceeds of the Series 2010A Bond. The Department discontinued utilizing the CP Program. Effective August 1, 2010 a Termination Certificate was issued for the cancellation of the Letter of Credit issued by BNP Paribas 91884181 and Dexia Local DCL#0507173.
The proceeds of such notes were used to finance certain airport and airport-related improvements. The notes and accrued interest are payable solely from proceeds of future Revenue Bonds and any unencumbered monies in the Improvement Fund. The notes are secured by an irrevocable stand-by letter of credit. The letter of credit, in the amount of $400,000,000, was approved for the purpose of making funds readily available for the payment of principal and interest on the notes. As of September 30, 2010 and 2009, there were no amounts outstanding on the letter of credit. The letter of credit expires on August 1, 2010.
The outstanding notes and accrued interest have been excluded from current liabilities at September 30, 2009 because the Aviation Department intended to refinance the commercial paper with long-term revenue bonds.
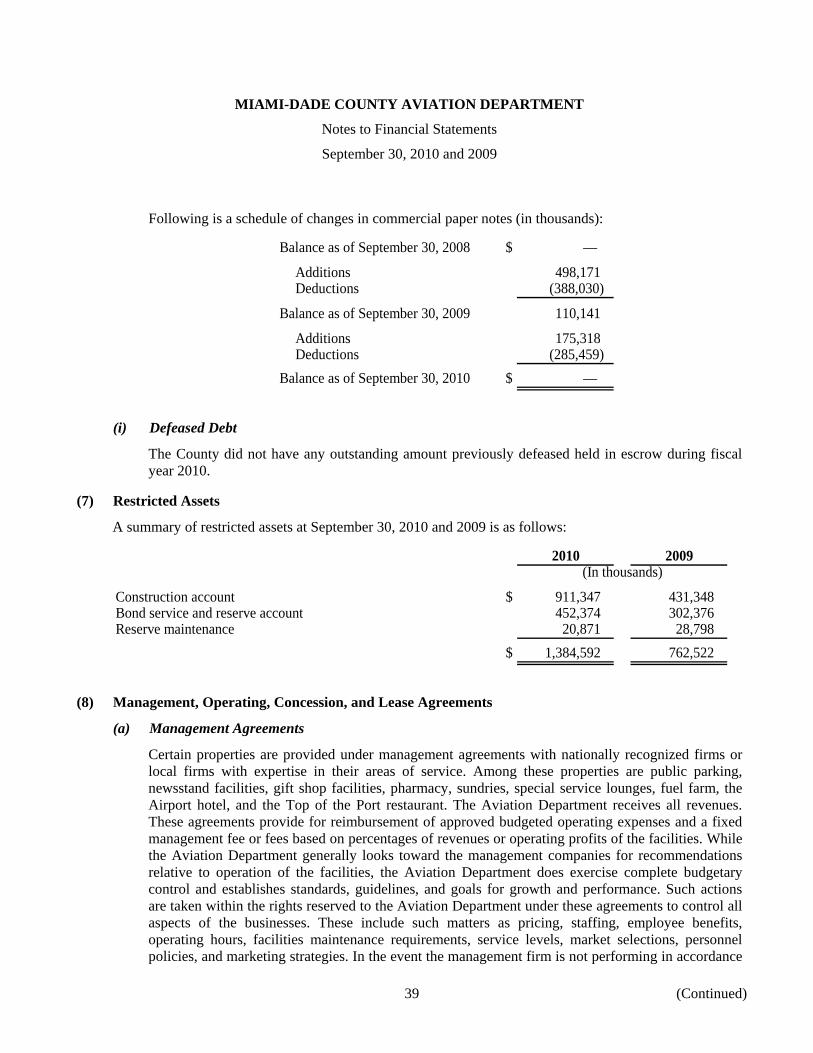
MIAMI-DADE COUNTY AVIATION DEPARTMENT
Notes to Financial Statements
September 30, 2010 and 2009
39 (Continued)
Following is a schedule of changes in commercial paper notes (in thousands):
Balance as of September 30, 2008 $ —
Additions 498,171 Deductions (388,030)
Balance as of September 30, 2009 110,141
Additions 175,318 Deductions (285,459)
Balance as of September 30, 2010 $ —
(i) Defeased Debt
The County did not have any outstanding amount previously defeased held in escrow during fiscal year 2010.
(7) Restricted Assets
A summary of restricted assets at September 30, 2010 and 2009 is as follows:
2010 2009(In thousands)
Construction account $ 911,347 431,348 Bond service and reserve account 452,374 302,376 Reserve maintenance 20,871 28,798
$ 1,384,592 762,522
(8) Management, Operating, Concession, and Lease Agreements
(a) Management Agreements
Certain properties are provided under management agreements with nationally recognized firms or local firms with expertise in their areas of service. Among these properties are public parking, newsstand facilities, gift shop facilities, pharmacy, sundries, special service lounges, fuel farm, the Airport hotel, and the Top of the Port restaurant. The Aviation Department receives all revenues. These agreements provide for reimbursement of approved budgeted operating expenses and a fixed management fee or fees based on percentages of revenues or operating profits of the facilities. While the Aviation Department generally looks toward the management companies for recommendations relative to operation of the facilities, the Aviation Department does exercise complete budgetary control and establishes standards, guidelines, and goals for growth and performance. Such actions are taken within the rights reserved to the Aviation Department under these agreements to control all aspects of the businesses. These include such matters as pricing, staffing, employee benefits, operating hours, facilities maintenance requirements, service levels, market selections, personnel policies, and marketing strategies. In the event the management firm is not performing in accordance
MIAMI-DADE COUNTY AVIATION DEPARTMENT
Notes to Financial Statements
September 30, 2010 and 2009
40 (Continued)
with the standards established by the Aviation Department, the Aviation Department has the authority to cancel such agreements. The management firms do not act as general agents on behalf of the County and, therefore, cannot obligate or commit the Aviation Department, without prior approval, beyond the scope of what is required to run the day-to-day operations of the managed properties as established by the budget approved by the Aviation Department. The revenues and expenses generated from the operations of these facilities are recorded as revenues under management agreements and operating expenses under management agreements, respectively, in the accompanying statements of revenues, expenses, and changes in net assets.
(b) Operating Agreements
Certain other services are provided under operating agreements with nationally recognized firms or local firms with expertise in their areas of service. These agreements provide necessary services of employee shuttle transportation, janitorial services, and porter services to the Aviation Department. These agreements provide for reimbursement of approved budgeted operating expenses and a fixed management fee. While the Aviation Department generally looks toward the operating companies for recommendations relative to these operations, the Aviation Department does exercise complete budgetary control and establishes standards, guidelines, and goals for service and performance. Such actions are taken within the rights reserved to the Aviation Department under these agreements to control all aspects of the businesses. These include such matters as personnel policies, staffing, employee benefits, facilities maintenance requirements, and service levels. In the event the operating firm is not performing in accordance with the standards established by the Aviation Department, the Aviation Department has the authority to cancel such operating agreements. The operating firms do not act as general agents on behalf of the County and, therefore, cannot obligate or commit the Aviation Department beyond the scope of what is required to run the day-to-day operations of managed properties as established by the budget approved by the Aviation Department. The expenses associated with the operation of these facilities and services are recorded as operating expenses under operating agreements, in the accompanying statements of revenues, expenses, and changes in net assets.
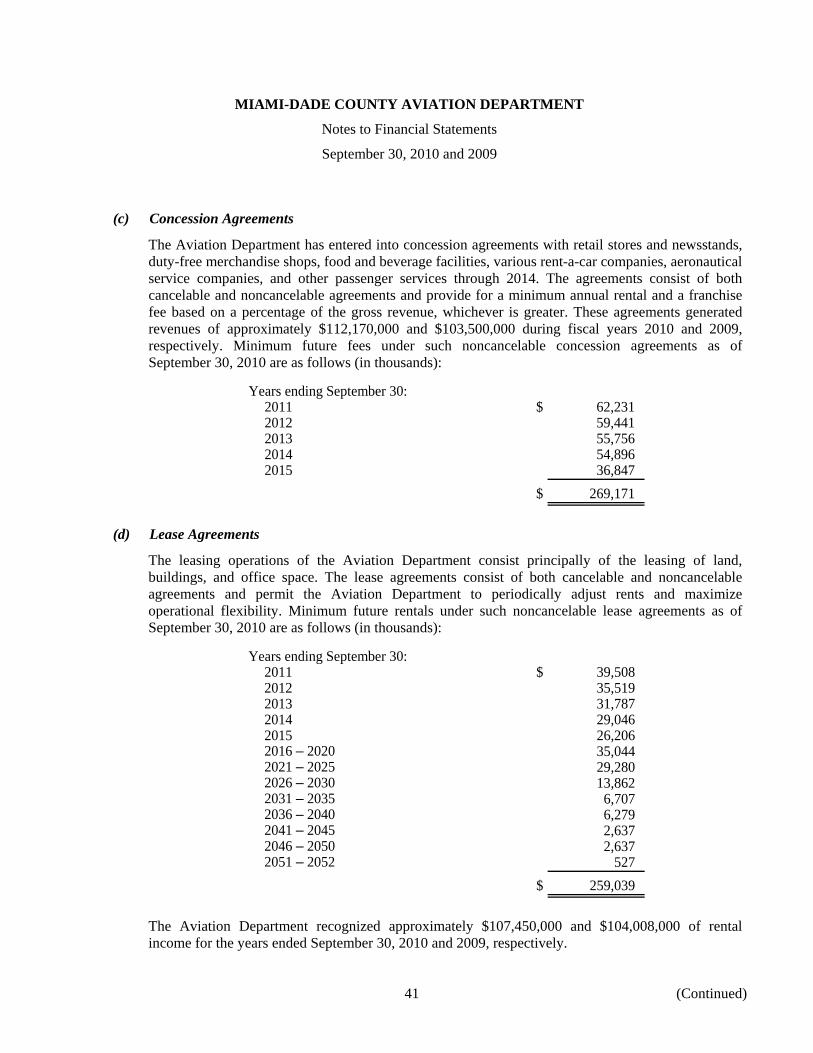
MIAMI-DADE COUNTY AVIATION DEPARTMENT
Notes to Financial Statements
September 30, 2010 and 2009
41 (Continued)
(c) Concession Agreements
The Aviation Department has entered into concession agreements with retail stores and newsstands, duty-free merchandise shops, food and beverage facilities, various rent-a-car companies, aeronautical service companies, and other passenger services through 2014. The agreements consist of both cancelable and noncancelable agreements and provide for a minimum annual rental and a franchise fee based on a percentage of the gross revenue, whichever is greater. These agreements generated revenues of approximately $112,170,000 and $103,500,000 during fiscal years 2010 and 2009, respectively. Minimum future fees under such noncancelable concession agreements as of September 30, 2010 are as follows (in thousands):
Years ending September 30:2011 $ 62,231 2012 59,441 2013 55,756 2014 54,896 2015 36,847
$ 269,171
(d) Lease Agreements
The leasing operations of the Aviation Department consist principally of the leasing of land, buildings, and office space. The lease agreements consist of both cancelable and noncancelable agreements and permit the Aviation Department to periodically adjust rents and maximize operational flexibility. Minimum future rentals under such noncancelable lease agreements as of September 30, 2010 are as follows (in thousands):
Years ending September 30:2011 $ 39,508 2012 35,519 2013 31,787 2014 29,046 2015 26,206 2016 – 2020 35,044 2021 – 2025 29,280 2026 – 2030 13,862 2031 – 2035 6,707 2036 – 2040 6,279 2041 – 2045 2,637 2046 – 2050 2,637 2051 – 2052 527
$ 259,039
The Aviation Department recognized approximately $107,450,000 and $104,008,000 of rental income for the years ended September 30, 2010 and 2009, respectively.
MIAMI-DADE COUNTY AVIATION DEPARTMENT
Notes to Financial Statements
September 30, 2010 and 2009
42 (Continued)
(9) Insurance
The Aviation Department, along with most other County departments, participates in the self-insurance program of the County for workers’ compensation insurance. The program is administered by the Risk Management Division of the General Services Administration Department of the County (Risk Management). Premiums on the self-insurance programs are based on historical loss experiences. The long-term estimated liability for claims payable, including incurred but not reported (IBNR), is recorded and retained at the County level. Therefore, such long-term liability is not included in the accompanying financial statements. The Aviation Department’s liability for workers’ compensation and general liability insurance is estimated to be approximately $4,779,000 and $4,125,000 as of September 30, 2010 and 2009, respectively, based on an independent actuarial valuation. The short-term liability for claims payable in the amount of approximately $1,224,000 and $1,057,000 is included in due to County Agencies in the accompanying statements of net assets as of September 30, 2010 and 2009, respectively.
The Aviation Department also pays premiums to commercial insurance carriers for airport liability insurance, construction wrap-up insurance, and property insurance. The Airport liability coverage provides comprehensive general liability, contractual liability, and personal injury liability at all Airports. Coverage under the policy is limited to $500 million with a self-insured retention of $50,000 per occurrence for a total annual aggregate retention of $500,000. Coverage under the policy for personal injury is limited to $50 million per occurrence.
The construction wrap-up insurance program provides comprehensive general liability including contractual liability and personal injury liability. The limit of liability is $150 million with a $15,000 property damage deductible per occurrence. Coverage is also provided for on-site automobile liability in excess of $1 million. This program covers the County’s contractors and other parties for occurrences arising out of designated construction projects at the airport.
With the exception of the South Terminal, the property of the Aviation Department is insured under a Countywide master program that covers most County properties subject to policy terms and conditions. The Aviation Department has been allocated a portion of the premium by the Risk Management Division based on the value of the property of the Aviation Department as a percentage of the total value of the property insured. The limit is $365 million countywide with a $5 million deductible per occurrence for most perils and a $200 million deductible for Named Storms. The sublimit for flood is $50 million. Terrorism is included in the program with a limit of $100 million. The Business Interruption limit for the Aviation Department is $192 million.
The South Terminal properties, including Concourse J, are covered by a separate property insurance policy with a total insured value of $660 million. The sublimits are $50 million per occurrence for Named Storm-related perils, and $10 million per occurrence and aggregate for Flood. The deductible for most perils is $5 million per occurrence (including Non-Named Storms).
The amounts of insurance settlements during the past three fiscal years have not exceeded the Aviation Department’s insurance coverage.
MIAMI-DADE COUNTY AVIATION DEPARTMENT
Notes to Financial Statements
September 30, 2010 and 2009
43 (Continued)
(10) Pension Plan
The Aviation Department, as a department of the County, participates in the FRS, a cost-sharing, multi-employer retirement plan, which covers substantially all of the Aviation Department’s full-time and part-time employees. The System was created in 1970 by consolidating several employee retirement systems. All eligible employees, as defined by the state, who were hired after 1970 and those employed prior to 1970 who elect to be enrolled are covered by the System. The System is administered by the Florida State Board of Administration, under the guidelines and rules of the Florida Legislature.
The Florida Legislature created a new defined contribution program that was added to the menu of choices available to FRS members beginning in June 2002. Formally created as the Public Employee Optional Retirement Program (PEORP), the FRS Investment Plan is available as an option for all current and future FRS members, including renewed members (FRS retirees who have returned to FRS employment). The FRS Investment Plan is a defined contribution plan, in which the monthly contribution rate is fixed, the final benefit will be the total account value (contributions plus investment earnings less expenses and losses) distributed during retirement.
Benefits under the plan vest after six years of service. Employees who retire at or after age 62, with six years of credited service, are entitled to an annual retirement benefit, payable monthly for life. The FRS also provides for early retirement at reduced benefits and death and disability benefits. These benefit provisions and all other requirements are established by Florida Statutes.
The FRS funding policy provides for monthly employer contributions at actuarially determined rates that, expressed as percentages of annual covered payroll, are adequate to accumulate sufficient assets to pay benefits when due based upon plan assumptions. Employer contributions rates are established by state law as a level percentage of payroll (Chapter 121.70, Florida Statutes). Employer contribution rates are determined using the entry-age actuarial cost method. The consulting actuary recommends rates based on the annual valuation, but actual contributions are established by the Florida Legislature.
Pension costs for the Aviation Department as required and defined by the FRS ranged between 10.77% and 23.25% of gross salaries for fiscal years 2010, 2009, and 2008. For the fiscal years ended September 30, 2010, 2009, and 2008, the County contributed 100% of the annual required contributions. These contributions aggregated $282 million, $284 million, and $281 million, respectively, which represents 13.39%, 12.95%, and 13.10% of covered payroll, respectively, and 11.52%, 11.22%, and 10.80% of the total contributions required of all participating agencies for fiscal years 2010, 2009, and 2008.
Pension costs of the Aviation Department for the years ended September 30, 2010, 2009, and 2008, as required and defined by the System were $11,670,000, $11,681,000, and $11,261,000, respectively. These amounts are included in operating expenses in the accompanying statements of revenues, expenses, and changes in net assets.
The complete financial report of the FRS may be obtained by writing Division of Retirement, P.O. Box 9000, Tallahassee, Florida, 32315-9000; or by contacting Research & Education by e-mail at [email protected] or by phone toll-free at 877-FRS-1FRS (877-377-1377), at 850-488-5706 in the Tallahassee local calling area, or at SUNCOM 278-5706.
MIAMI-DADE COUNTY AVIATION DEPARTMENT
Notes to Financial Statements
September 30, 2010 and 2009
44 (Continued)
(11) North Terminal Development Program (NTD)
In 1989, the Aviation Department agreed to allow a major carrier (collectively, the parties) to create an international passenger hub at MIA. The North Terminal Development Project (NTD or the Project) evolved out of this plan and commitment to improve the level and quality of services to passengers. The carrier worked with the Aviation Department to develop the concept plan for NTD and in October 1995, the parties entered into a Lease, Construction, and Financing Agreement (the LCF Agreement), which authorized the carrier to design and construct the Project.
The LCF Agreement was approved by the Board in 1995 and provided for costs up to $974,900,000. In July 1999, the parties agreed to the First Amendment, which increased the scope of work and the costs to $1,304,900,000. In January 2002, the parties agreed to the Second Amendment, which eliminated the 250 flights per day requirement in the LCF Agreement. In April 2002, the parties entered into the Third Amendment, which increased the costs to $1,515,900,000.
Due to the complexity of the project, coordination and construction problems, along with insufficient Project management and controls, the project encountered substantial delays, and significant cost overruns resulting in a series of unprocessed and unpaid claims from subcontractors and suppliers related to change orders and cost overruns. As a result of the aforementioned delays and issues, the Aviation Department assumed responsibility for the management and completion of the Project with the assistance of consultants.
A Fourth Amendment was entered into between the parties, which was approved by the Board on June 21, 2005. The Fourth Amendment primarily terminated the carrier’s management of the Project and attempted to resolve the unprocessed and unpaid claims. Under the Fourth Amendment, the carrier agreed to contribute to the Project, $105 million, payable in installments over a period of 10 years beginning in fiscal year 2005. The contribution shall be maintained in a claims reserve fund to pay such claims. Once all claims have been settled, any excess funds available are retained by the Aviation Department to be applied to construction of the Project. Payments in the amount of $10 million were received in fiscal years 2010 and 2009. They were recognized as other revenue in the accompanying statements of revenues, expenses, and changes in net assets. The Aviation Department’s best estimate is an allowance for uncollectible amounts equal to 100% of the unpaid balance of $35 million.
It is not probable that the Aviation Department will have any further claims predating the Fourth Amendment associated with the NTD. All known claims have been paid to date, and there were no claims paid during fiscal 2010. As of September 30, 2010 and 2009, $62,495,000 of claims had been paid and none had been accrued in the accompanying statements of net assets.
(12) Commitments and Contingencies
(a) Environmental Matters
In August 1993, the Aviation Department and the Dade County Department of Environmental Resources Management (DERM) entered into a Consent Order. Under the Consent Order, the Aviation Department was required to correct environmental violations resulting from various tenants’ failure to comply with their environmental obligations at the Airport including those facilities previously occupied by Eastern Airlines (Eastern) and Pan Am Airlines (Pan Am). In
MIAMI-DADE COUNTY AVIATION DEPARTMENT
Notes to Financial Statements
September 30, 2010 and 2009
45 (Continued)
addition, the Aviation Department had a preliminary study performed by an independent engineering firm to estimate the cost to correct the environmental violations noted in the Consent Order. This study was used as a basis to record the environmental remediation liability as of September 30, 1993.
In each subsequent year, the Aviation Department has received an updated study performed by MACTEC Engineering and Consulting (MACTEC), an independent engineering firm to further update the estimated costs to correct the environmental violations noted in the Consent Order based on additional information and further refinement of estimated costs to be incurred.
As a result of the updated study and costs incurred in fiscal year 2010, the total cumulative estimate to correct such violations was $223.9 million. This estimate allows for uncertainties as to the nature and extent of environmental reparations and the methods, which must be employed for the remediation. The cumulative amount of environmental expenditures spent through September 30, 2010 approximated $135.0 million. The Aviation Department has also spent $55.9 million in other environmental-related projects not part of any consent order.
During fiscal year 1998, a Consent Order (FDEP Consent Order) was signed with the State of Florida Department of Environmental Protection (FDEP). The FDEP Consent Order encompasses and replaces the DERM agreement and includes additional locations. The FDEP Consent Order includes all locations at MIA that are contaminated as well as additional sites where contamination is suspected. The Aviation Department included other sites where contamination is suspected in the FDEP Consent Order under a Protective Filing. If contamination is documented at these sites, the State would be required to incur the costs of remediation. Because the State will be required to pay for remediation of sites filed in the Protective Filing and because the contamination at the sites is unknown, an accrual amount is not reflected in the Opinion of Cost report or in the accompanying financial statements.
Currently, the County has several pending lawsuits in State Court against the Potentially Responsible Parties (PRPs) and insurers to address recovery of past and future damages associated with the County’s liability under the FDEP Consent Order. As of September 30, 2010, the Aviation Department has received approximately $52.6 million from the State, insurance companies, and PRPs.
The outstanding liability amount at September 30, 2010 and 2009 was $88,845,000 and $89,595,000, respectively, representing the unexpended environmental remediation costs based on the Opinion of Cost performed by MACTEC. Management has allocated a portion of bond proceeds to fund this obligation and believes that the remaining amount can be funded from recoveries and the operations of the Aviation Department. The liability recorded by the Aviation Department does not include an estimate of any environmental violations at the three general aviation airports or at the two training airports. Management is not aware of any such liabilities, and the occurrence of any would not be material to the financial statements.
In addition to the studies conducted to determine the environmental damage to the sites occupied by Eastern and Pan Am, the Aviation Department caused studies to be performed to determine the amount required to remove or otherwise contain the asbestos in certain buildings occupied by the airlines. The Aviation Department has also estimated the amount required to remove or otherwise
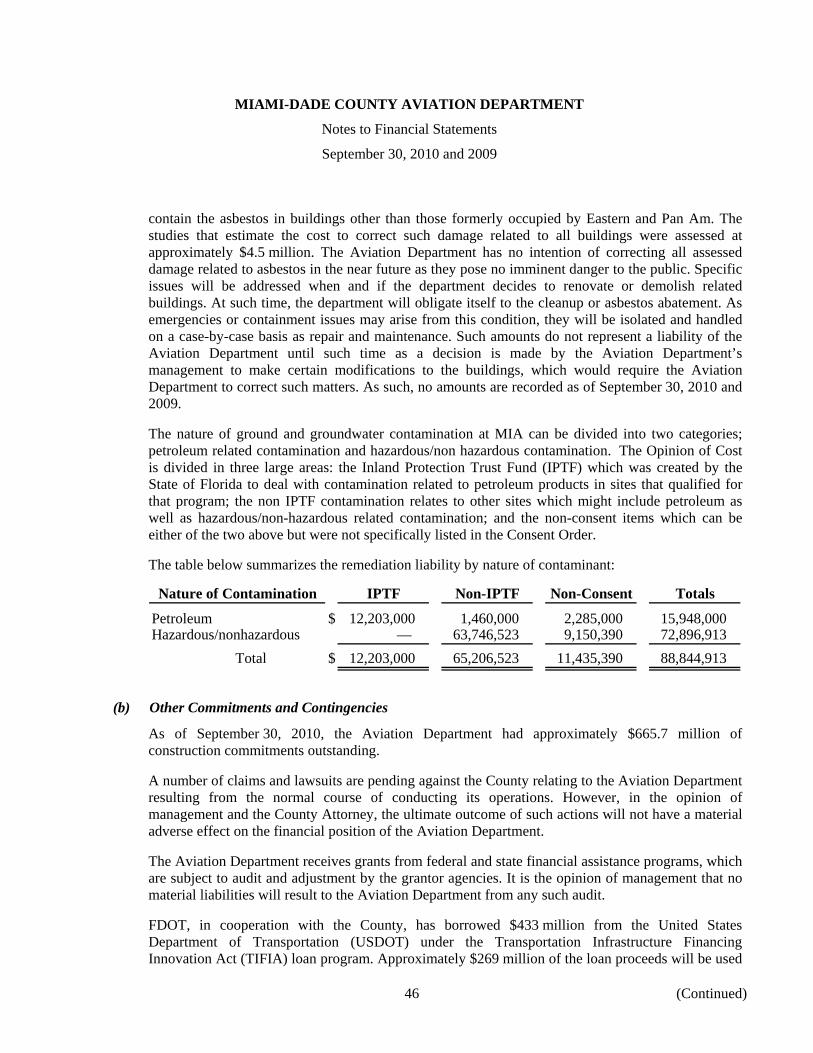
MIAMI-DADE COUNTY AVIATION DEPARTMENT
Notes to Financial Statements
September 30, 2010 and 2009
46 (Continued)
contain the asbestos in buildings other than those formerly occupied by Eastern and Pan Am. The studies that estimate the cost to correct such damage related to all buildings were assessed at approximately $4.5 million. The Aviation Department has no intention of correcting all assessed damage related to asbestos in the near future as they pose no imminent danger to the public. Specific issues will be addressed when and if the department decides to renovate or demolish related buildings. At such time, the department will obligate itself to the cleanup or asbestos abatement. As emergencies or containment issues may arise from this condition, they will be isolated and handled on a case-by-case basis as repair and maintenance. Such amounts do not represent a liability of the Aviation Department until such time as a decision is made by the Aviation Department’s management to make certain modifications to the buildings, which would require the Aviation Department to correct such matters. As such, no amounts are recorded as of September 30, 2010 and 2009.
The nature of ground and groundwater contamination at MIA can be divided into two categories; petroleum related contamination and hazardous/non hazardous contamination. The Opinion of Cost is divided in three large areas: the Inland Protection Trust Fund (IPTF) which was created by the State of Florida to deal with contamination related to petroleum products in sites that qualified for that program; the non IPTF contamination relates to other sites which might include petroleum as well as hazardous/non-hazardous related contamination; and the non-consent items which can be either of the two above but were not specifically listed in the Consent Order.
The table below summarizes the remediation liability by nature of contaminant:
Nature of Contamination IPTF Non-IPTF Non-Consent Totals
Petroleum $ 12,203,000 1,460,000 2,285,000 15,948,000 Hazardous/nonhazardous — 63,746,523 9,150,390 72,896,913
Total $ 12,203,000 65,206,523 11,435,390 88,844,913
(b) Other Commitments and Contingencies
As of September 30, 2010, the Aviation Department had approximately $665.7 million of construction commitments outstanding.
A number of claims and lawsuits are pending against the County relating to the Aviation Department resulting from the normal course of conducting its operations. However, in the opinion of management and the County Attorney, the ultimate outcome of such actions will not have a material adverse effect on the financial position of the Aviation Department.
The Aviation Department receives grants from federal and state financial assistance programs, which are subject to audit and adjustment by the grantor agencies. It is the opinion of management that no material liabilities will result to the Aviation Department from any such audit.
FDOT, in cooperation with the County, has borrowed $433 million from the United States Department of Transportation (USDOT) under the Transportation Infrastructure Financing Innovation Act (TIFIA) loan program. Approximately $269 million of the loan proceeds will be used
MIAMI-DADE COUNTY AVIATION DEPARTMENT
Notes to Financial Statements
September 30, 2010 and 2009
47 (Continued)
to construct the Miami Intermodal Center and approximately $164 million for a consolidated rental car facility (RCF) adjacent to the Airport. The $164 million was to be used by FDOT to purchase the land needed for the RCF and then design and construct the facility. The portion of the loan relating to the RCF will be repaid through the collection of the Customer Facility Charges (CFCs) from car rental company customers at the Airport. The remainder of the loan will be repaid by the State. The repayment of the TIFIA loan is not secured by revenues or any other revenues of the Aviation Department. On December 7, 1999, the County entered into a Memorandum of Understanding (MOU) with FDOT. The MOU provides that FDOT’s portion of the TIFIA loan is $269 million and that MDAD’s portion of the TIFIA loan is approximately $164 million. This funding of $164 million is expressly for the purpose of paying FDOT for the cost of the land underlying the RCF and the construction of the RCF. MDAD has agreed to purchase from FDOT all land acquired by FDOT for use in connection with the RCF site as part of the capital cost for the RCF. As of September 30, 2010, the purchase by MDAD from FDOT has not taken place. The negotiation and purchase of the land will not occur until all construction work in connection with the RCF is completed.
On April 1, 2005, a security agreement was entered into among USDOT, FDOT, and the County regarding FDOT’s loan agreement, for the TIFIA loan in an amount up to $170 million. Under the security agreement, the USDOT requires as a condition to loaning the TIFIA funds to FDOT that FDOT and the County pledge and assign to a fiscal agent a security interest in the Pledged Revenues, which includes the CFCs collected by MDAD and any contingent rent that is imposed by the County on participating car rental companies in the event CFCs are not sufficient to meet the debt service requirements. As to the nature of the payment by MDAD to FDOT, MDAD is under no obligation to expend its own funds for the purchase. All payments to FDOT for the purchase of the land and the RCF will come exclusively from a pool of funds made of Customer Facility Charge proceeds (as well as any contingent rents that are imposed on the rental car companies).
On July 19, 2007, the Board approved the First Amendment to the Rental Car Concession Agreement and Facility Lease Agreement (the RCCA). The RCCA was one of the contractual documents all rental car companies desiring to participate in the RCF were required to sign. Resolution No. R-910-07 approving the First Amendment also accepted FDOT’s new estimate of $370 million for the design and construction costs of the RCF, and approved an increase in MDADs portion of the TIFIA loan from $164 million to $270 million, with the balance of the costs to be paid by the CFCs already collected from rental car company customers. The RCCA as amended confirmed that the debt service of the RCF portion of the TIFIA loan and additional RCF financing shall be paid solely from CFCs and contingent rent, if any. In no event shall MDAD be required to use general airport revenues for the payment of debt service on the RCF portion of the TIFIA loan or any additional RCF financing.
(13) Postemployment Benefits Other Than Pensions
During fiscal year 2008, the Aviation Department adopted the requirements of GASB 45, Accounting and Financial Reporting by Employers for Postemployment Benefits Other than Pensions, for Other Postemployment Benefit (OPEB). This statement requires that the County accrue the cost of the County’s retiree health subsidiary and OPEB during the period of employees’ active employment as the benefits are being earned. It requires the unfunded actuarial accrued liability be disclosed in order to accurately account
MIAMI-DADE COUNTY AVIATION DEPARTMENT
Notes to Financial Statements
September 30, 2010 and 2009
48 (Continued)
for the total future cost of OPEB and the financial impact on the County. The financial impact to the Aviation Department is reflected in the accompanying financial statements.
Plan Description
The County administers a single-employer defined benefit healthcare plan (the Plan) that provides postretirement medical and dental coverage to retirees as well as their eligible spouses and dependents. Benefits are provided through the County’s group health insurance plan, which covers both active and retired members. Benefits are established and may be amended by the Miami-Dade County Board of County Commissioners (the BCC), whose powers derive from F.S. 125.01(3)(a). The Plan does not issue a publicly available financial report.
Eligibility: To be eligible to receive retiree medical and dental benefits, participants must be eligible for retirement benefits under FRS and pay required contributions.
• Regular Class (All employees not identified as members of the Special Risk Class)
• Eligibility for Unreduced Pension Benefits under FRS
• Age 62 with 6 years of service
• 30 years of service (no age requirement)
• Eligibility for Reduced Pension Benefits under FRS
• Special Risk Class (Police Officers, Firefighters, and Corrections Officers)
• Eligibility for Unreduced Pension Benefits under FRS
• Age 55 with 6 years of special risk service
• 25 years of special risk service (no age requirement)
• Age 52 and 25 years of creditable service, including special risk service and up to maximum of 4 years of active duty wartime military service credit
• Regular Class criteria
• Eligibility for Reduced Pension Benefits under FRS
• 6 years of service (no age requirement)
Benefits: The medical plans offered provide hospital, medical, and pharmacy coverage. Pre-65 retirees are able to select from five medical plans as follows:
• AvMed POS
• AvMed HMO High Option
• AvMed HMO Low Option
MIAMI-DADE COUNTY AVIATION DEPARTMENT
Notes to Financial Statements
September 30, 2010 and 2009
49 (Continued)
• JMH HMO High Option
• JMH HMO Low Option
Post-65 retirees are able to select from five medical plans as follows. The County only contributes to post-65 retirees electing an AvMed Medicare Supplement Plan.
• AvMed Medicare Supplement Low Option
• AvMed Medicare Supplement High Option with RX
• AvMed Medicare Supplement High Option without RX
• JMH HMO High Option
• JMH HMO Low Option Number of covered participants:
Actives 37,516 Retirees under age 65 2,329 Eligible spouses under age 65 681 Retirees age 65 and over 548 Eligible age 65 and over 112
Total 41,186
Funding Policy. The County contributes to both the pre-65 and post-65 retiree medical coverage. Retirees pay the full cost of dental coverage. Medical contributions vary based on plan and tier. For pre-65 retirees, the County explicitly contributed an average of 19% of the cost for the AvMed POS plan, 40% for the AvMed HMO High, and AvMed HMO Low plans in fiscal year 2008. The JMH HMO plans receive no explicit contribution. However, it is the County’s policy that after fiscal year 2008, its per capita contribution for retiree healthcare benefits will remain at the 2008 dollar level.
The pre-65 retirees also receive an implicit subsidy from the County since they are underwritten with the active employees. The implicit contribution is approximately 3% of the cost. The pre-65 cost is approximately 42% greater than the combined pre-65 and active cost. The post-65 retiree contributions also vary by plan and tier with the County contributing an average of 30% of the entire plan cost.
The postretirement medical and dental benefits are currently funded on a pay-as-you go basis (i.e., Miami-Dade County funds on a cash basis as benefits are paid). No assets have been segregated and restricted to provide postretirement benefits. For fiscal years 2010 and 2009, the Miami-Dade Aviation Department contributed $851,000 and $836,000, respectively, to the Plan.
Annual OPEB Cost and Net OPEB Obligation
The Aviation Department’s annual OPEB cost (expense) is calculated based on the annual required contribution of the employer (ARC), an amount actuarially determined in accordance with the parameters of GASB 45. The ARC represents a level of funding that, if paid on an ongoing basis, is projected to cover normal cost each year and to amortize any unfunded actuarial liabilities (or funding excess) over a period not to exceed 30 years.
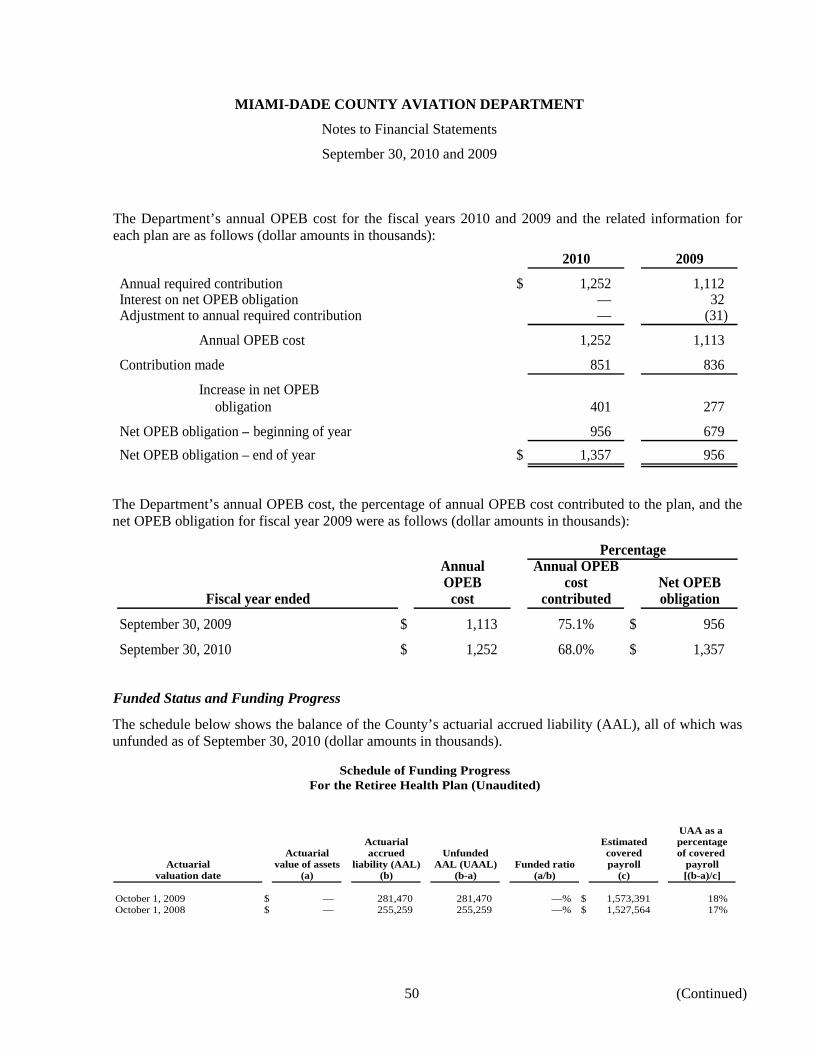
MIAMI-DADE COUNTY AVIATION DEPARTMENT
Notes to Financial Statements
September 30, 2010 and 2009
50 (Continued)
The Department’s annual OPEB cost for the fiscal years 2010 and 2009 and the related information for each plan are as follows (dollar amounts in thousands):
2010 2009
Annual required contribution $ 1,252 1,112 Interest on net OPEB obligation — 32 Adjustment to annual required contribution — (31)
Annual OPEB cost 1,252 1,113
Contribution made 851 836
Increase in net OPEBobligation 401 277
Net OPEB obligation – beginning of year 956 679 Net OPEB obligation – end of year $ 1,357 956
The Department’s annual OPEB cost, the percentage of annual OPEB cost contributed to the plan, and the net OPEB obligation for fiscal year 2009 were as follows (dollar amounts in thousands):
PercentageAnnual Annual OPEBOPEB cost Net OPEB
Fiscal year ended cost contributed obligation
September 30, 2009 $ 1,113 75.1% $ 956
September 30, 2010 $ 1,252 68.0% $ 1,357
Funded Status and Funding Progress
The schedule below shows the balance of the County’s actuarial accrued liability (AAL), all of which was unfunded as of September 30, 2010 (dollar amounts in thousands).
Schedule of Funding ProgressFor the Retiree Health Plan (Unaudited)
UAA as a Actuarial Estimated percentage
Actuarial accrued Unfunded covered of covered Actuarial value of assets liability (AAL) AAL (UAAL) Funded ratio payroll payroll
valuation date (a) (b) (b-a) (a/b) (c) [(b-a)/c]
October 1, 2009 $ — 281,470 281,470 —% $ 1,573,391 18% October 1, 2008 $ — 255,259 255,259 —% $ 1,527,564 17%
MIAMI-DADE COUNTY AVIATION DEPARTMENT
Notes to Financial Statements
September 30, 2010 and 2009
51
Actuarial valuations involve estimates of the value of reported amounts and assumptions about the probability of events in the future. Amounts determined regarding the funded status of the plan and the annual required contributions by the County are subject to continual revision as actual results are compared to past expectations and new estimates are made about the future.
Actuarial Methods and Assumptions
Projections of benefits are based on the substantive plan (the Plan as understood by the employer and plan members) and include the types of benefits in force at the valuation date and the pattern of sharing benefit costs between the County and the plan members to that point. Actuarial calculations reflect a long-term perspective and employ methods and assumptions that are designed to reduce short-term volatility in actuarial accrued liabilities and the actuarial value of assets.
The actuarial cost method used in the valuation to determine the AAL and the Actuarial Required Contribution (ARC) was the Projected Unit Credit Method with service prorated. Under this method, the total present value of benefits is determined by projecting the benefit to be paid after the expected retirement date (or other event) and discounting those amounts to the valuation date. The normal cost is computed by dividing the total present value of benefits by the participant’s total service (actual plus expected service) at retirement. The AAL under this method represents the total present value of benefits multiplied by the ratio of the participant’s actual service to date and divided by expected service at retirement. The AAL for participants currently receiving payments and deferred vested participants is calculated as the actuarial present value of future benefits expected to be paid. No normal cost for these participants is payable. The AAL and normal costs were calculated at the measurement date, which is the beginning of the applicable fiscal year using standard actuarial techniques.
The following summarizes other significant methods and assumptions used in valuing the AAL and benefits under the plan.
Actuarial valuation date October 1, 2008Amortization method Level percentage
of payroll, closedRemaining amortization period 30 yearsActuarial assumptions:
Discount rate 4.75% Payroll growth assumption 3.00% Healthcare cost trend rates 10.00% initial to
5.25% ultimateMortality table RP 2000
Further, the valuation assumes that the County will continue to fund the liability on a pay-as-you-go basis and that the County’s policy is that its per capita contribution for retiree benefits will remain at the 2008 level. As a result, the retiree contributions will be increased to the extent necessary so that they are sufficient to provide for the difference between the gross costs and the fixed County contributions.
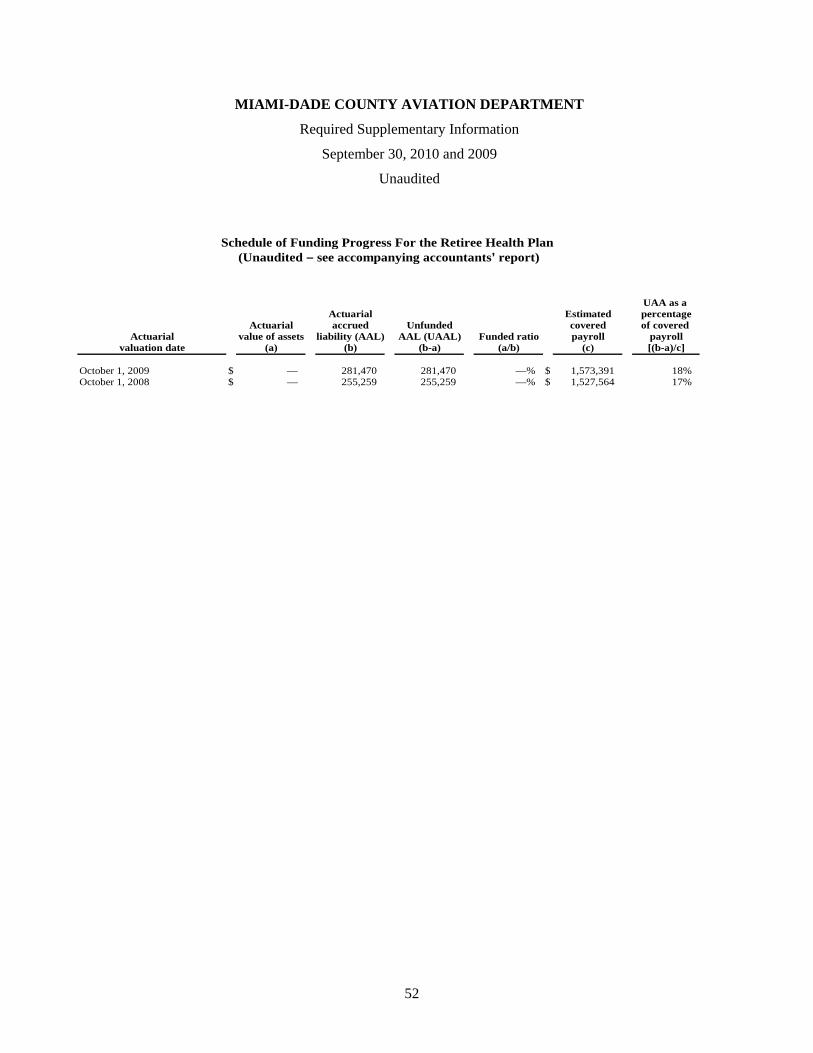
MIAMI-DADE COUNTY AVIATION DEPARTMENT
Required Supplementary Information
September 30, 2010 and 2009
Unaudited
52
Schedule of Funding Progress For the Retiree Health Plan (Unaudited – see accompanying accountants’ report)
UAA as a Actuarial Estimated percentage
Actuarial accrued Unfunded covered of covered Actuarial value of assets liability (AAL) AAL (UAAL) Funded ratio payroll payroll
valuation date (a) (b) (b-a) (a/b) (c) [(b-a)/c]
October 1, 2009 $ — 281,470 281,470 —% $ 1,573,391 18% October 1, 2008 $ — 255,259 255,259 —% $ 1,527,564 17%
Statistical Section (unaudited)
2010 Comprehensive Annual Financial Report
(This page intentionally left blank)
53
The Statistical Section is divided into five areas: financial trend data; revenue capacity data; debt capacity data;
demographic and economic information and operating information. The source of all non‐accounting data presented
in the statistical section is Miami‐Dade Aviation Department unless otherwise stated.
Financial Trend data shows changes in the Department’s financial position:
Department Operating Revenues and Expenses
Department Statements of Net Assets
Department Changes in Cash and Cash Equivalents
Department Largest Sources of Revenue
Revenue Capacity data shows MIA’s major revenue sources and changes in key rates and charges:
Key Usage Fees and Charges
Concession Revenue Per Enplaned Passenger
Parking Revenue Per Enplaned Passenger
Rental Car Revenue Per Enplaned Passenger
Terminal Rent Revenue Per Enplaned Passenger
Food and Beverage Revenue Per Enplaned Passenger
Operating Information shows how the Airport has performed on an annual basis and within the airport market
sector:
Department Employee Strength
Aircraft Operations
Aircraft Landed Weight
Passenger Enplanements
Passenger Deplanements
Enplanement Market Share by Airline by Fiscal Year
Air Cargo Activity
Economic Information shows the major drivers of usage and how the Airport service area is performing compared to
the region and the nation: Miami‐Dade County Population Estimates
Principal Employers in Miami‐Dade County
Miami‐Dade County Unemployment Statistics
Miami‐Dade County Per Capita Personal Income
Debt information shows how the Airport is meeting its debt obligations and the relative level of debt:
Revenue Bond Debt Service Coverage
Outstanding Debt
Long Term Debt Per Enplaned Passenger
Capital Assets
Overview
2010 Comprehensive Annual Financial Report
(This page intentionally left blank)
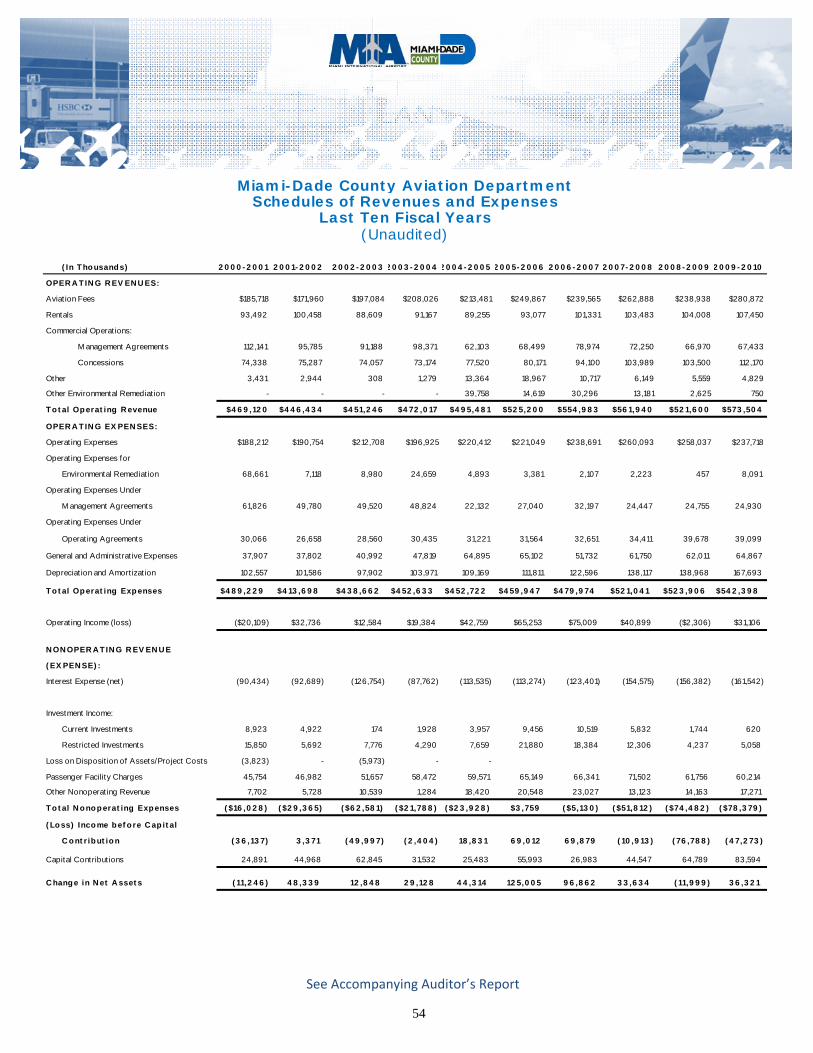
54
See Accompanying Auditor’s Report
( In T ho usand s) 2 0 0 0 - 2 0 0 1 2 0 0 1- 2 0 0 2 2 0 0 2 - 2 0 0 3 2 0 0 3 - 2 0 0 4 2 0 0 4 - 2 0 0 5 2 0 0 5- 2 0 0 6 2 0 0 6 - 2 0 0 7 2 0 0 7- 2 0 0 8 2 0 0 8 - 2 0 0 9 2 0 0 9 - 2 0 10
OPER A T IN G R EV EN U ES:
Aviat ion Fees $185,718 $171,960 $197,084 $208,026 $213,481 $249,867 $239,565 $262,888 $238,938 $280,872
Rentals 93,492 100,458 88,609 91,167 89,255 93,077 101,331 103,483 104,008 107,450
Commercial Operat ions:
M anagement Agreements 112,141 95,785 91,188 98,371 62,103 68,499 78,974 72,250 66,970 67,433
Concessions 74,338 75,287 74,057 73,174 77,520 80,171 94,100 103,989 103,500 112,170
Other 3,431 2,944 308 1,279 13,364 18,967 10,717 6,149 5,559 4,829
Other Environmental Remediat ion - - - - 39,758 14,619 30,296 13,181 2,625 750
T o t al Op erat ing R evenue $4 6 9 ,12 0 $4 4 6 ,4 3 4 $4 51,2 4 6 $4 72 ,0 17 $4 9 5,4 8 1 $52 5,2 0 0 $554 ,9 8 3 $56 1,9 4 0 $52 1,6 0 0 $573 ,50 4
OPER A T IN G EX PEN SES:
Operat ing Expenses $188,212 $190,754 $212,708 $196,925 $220,412 $221,049 $238,691 $260,093 $258,037 $237,718
Operat ing Expenses for
Environmental Remediat ion 68,661 7,118 8,980 24,659 4,893 3,381 2,107 2,223 457 8,091
Operat ing Expenses Under
M anagement Agreements 61,826 49,780 49,520 48,824 22,132 27,040 32,197 24,447 24,755 24,930
Operat ing Expenses Under
Operat ing Agreements 30,066 26,658 28,560 30,435 31,221 31,564 32,651 34,411 39,678 39,099
General and Administrat ive Expenses 37,907 37,802 40,992 47,819 64,895 65,102 51,732 61,750 62,011 64,867
Depreciat ion and Amort izat ion 102,557 101,586 97,902 103,971 109,169 111,811 122,596 138,117 138,968 167,693
T o t al Op erat ing Exp enses $4 8 9 ,2 2 9 $4 13 ,6 9 8 $4 3 8 ,6 6 2 $4 52 ,6 3 3 $4 52 ,72 2 $4 59 ,9 4 7 $4 79 ,9 74 $52 1,0 4 1 $52 3 ,9 0 6 $54 2 ,3 9 8
Operat ing Income (loss) ($20,109) $32,736 $12,584 $19,384 $42,759 $65,253 $75,009 $40,899 ($2,306) $31,106
N ON OPER A T IN G R EV EN U E
( EX PEN SE) :
Interest Expense (net) (90,434) (92,689) (126,754) (87,762) (113,535) (113,274) (123,401) (154,575) (156,382) (161,542)
Investment Income:
Current Investments 8,923 4,922 174 1,928 3,957 9,456 10,519 5,832 1,744 620
Restricted Investments 15,850 5,692 7,776 4,290 7,659 21,880 18,384 12,306 4,237 5,058
Loss on Disposit ion of Assets/Project Costs (3,823) - (5,973) - -
Passenger Facility Charges 45,754 46,982 51,657 58,472 59,571 65,149 66,341 71,502 61,756 60,214
Other Nonoperat ing Revenue 7,702 5,728 10,539 1,284 18,420 20,548 23,027 13,123 14,163 17,271
T o t al N o no p erat ing Exp enses ( $16 ,0 2 8 ) ( $2 9 ,3 6 5) ( $6 2 ,58 1) ( $2 1,78 8 ) ( $2 3 ,9 2 8 ) $3 ,759 ( $5,13 0 ) ( $51,8 12 ) ( $74 ,4 8 2 ) ( $78 ,3 79 )
( Lo ss) Inco me b ef o re C ap it al
C o nt r ib ut io n ( 3 6 ,13 7) 3 ,3 71 ( 4 9 ,9 9 7) ( 2 ,4 0 4 ) 18 ,8 3 1 6 9 ,0 12 6 9 ,8 79 ( 10 ,9 13 ) ( 76 ,78 8 ) ( 4 7,2 73 )
Capital Contribut ions 24,891 44,968 62,845 31,532 25,483 55,993 26,983 44,547 64,789 83,594
C hang e in N et A sset s ( 11,2 4 6 ) 4 8 ,3 3 9 12 ,8 4 8 2 9 ,12 8 4 4 ,3 14 12 5,0 0 5 9 6 ,8 6 2 3 3 ,6 3 4 ( 11,9 9 9 ) 3 6 ,3 2 1
Miami-Dade County Aviation DepartmentSchedules of Revenues and Expenses
Last Ten Fiscal Years(Unaudited)
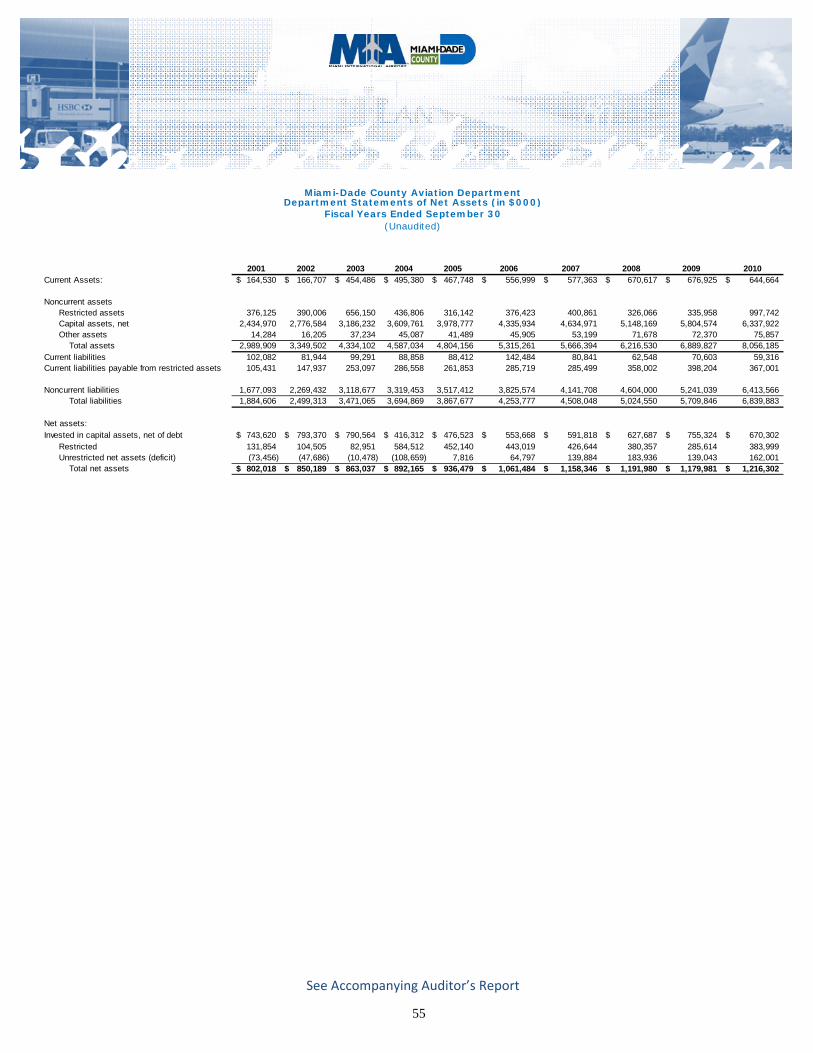
55
See Accompanying Auditor’s Report
2001 2002 2003 2004 2005 2006 2007 2008 2009 2010Current Assets: 164,530$ 166,707$ 454,486$ 495,380$ 467,748$ 556,999$ 577,363$ 670,617$ 676,925$ 644,664$
Noncurrent assets Restricted assets 376,125 390,006 656,150 436,806 316,142 376,423 400,861 326,066 335,958 997,742
Capital assets, net 2,434,970 2,776,584 3,186,232 3,609,761 3,978,777 4,335,934 4,634,971 5,148,169 5,804,574 6,337,922 Other assets 14,284 16,205 37,234 45,087 41,489 45,905 53,199 71,678 72,370 75,857
Total assets 2,989,909 3,349,502 4,334,102 4,587,034 4,804,156 5,315,261 5,666,394 6,216,530 6,889,827 8,056,185Current liabilities 102,082 81,944 99,291 88,858 88,412 142,484 80,841 62,548 70,603 59,316 Current liabilities payable from restricted assets 105,431 147,937 253,097 286,558 261,853 285,719 285,499 358,002 398,204 367,001
Noncurrent liabilities 1,677,093 2,269,432 3,118,677 3,319,453 3,517,412 3,825,574 4,141,708 4,604,000 5,241,039 6,413,566 Total liabilities 1,884,606 2,499,313 3,471,065 3,694,869 3,867,677 4,253,777 4,508,048 5,024,550 5,709,846 6,839,883
Net assets:Invested in capital assets, net of debt 743,620$ 793,370$ 790,564$ 416,312$ 476,523$ 553,668$ 591,818$ 627,687$ 755,324$ 670,302$
Restricted 131,854 104,505 82,951 584,512 452,140 443,019 426,644 380,357 285,614 383,999 Unrestricted net assets (deficit) (73,456) (47,686) (10,478) (108,659) 7,816 64,797 139,884 183,936 139,043 162,001
Total net assets 802,018$ 850,189$ 863,037$ 892,165$ 936,479$ 1,061,484$ 1,158,346$ 1,191,980$ 1,179,981$ 1,216,302$
Miami-Dade County Aviation DepartmentDepartment Statements of Net Assets (in $000)
(Unaudited)Fiscal Years Ended September 30
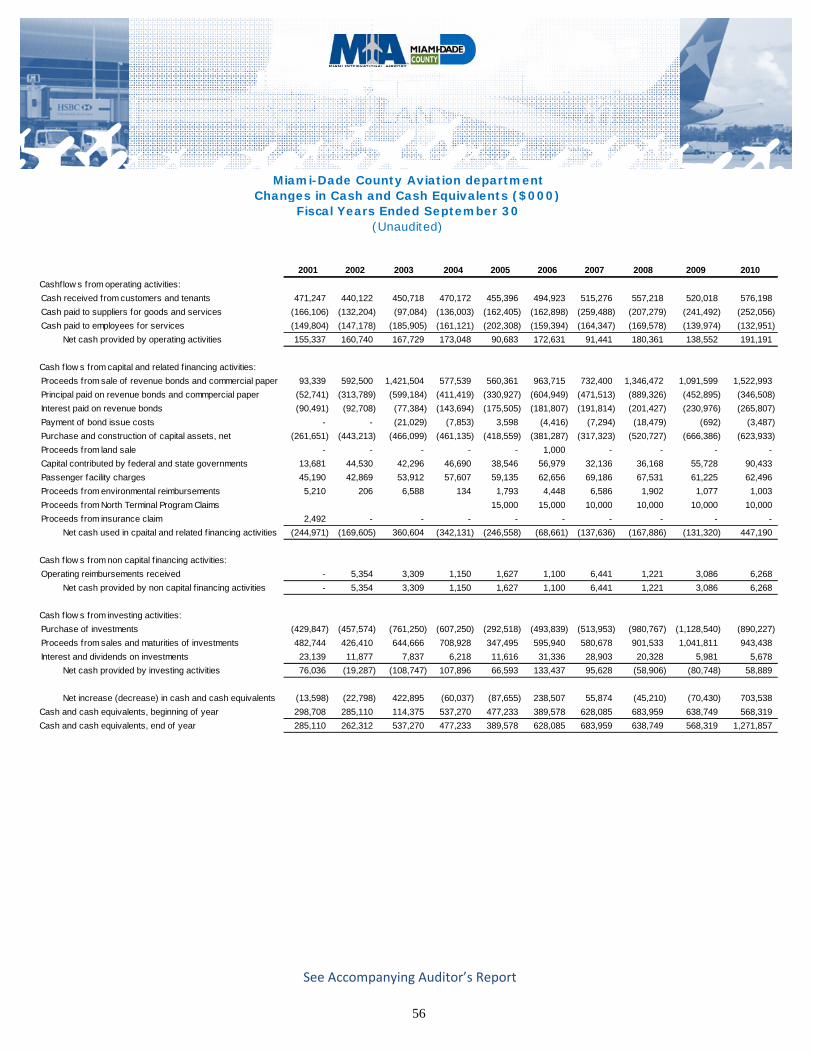
56
See Accompanying Auditor’s Report
2001 2002 2003 2004 2005 2006 2007 2008 2009 2010
Cashflow s from operating activities:
Cash received from customers and tenants 471,247 440,122 450,718 470,172 455,396 494,923 515,276 557,218 520,018 576,198
Cash paid to suppliers for goods and services (166,106) (132,204) (97,084) (136,003) (162,405) (162,898) (259,488) (207,279) (241,492) (252,056)
Cash paid to employees for services (149,804) (147,178) (185,905) (161,121) (202,308) (159,394) (164,347) (169,578) (139,974) (132,951)
Net cash provided by operating activities 155,337 160,740 167,729 173,048 90,683 172,631 91,441 180,361 138,552 191,191
Cash f low s from capital and related f inancing activities:
Proceeds from sale of revenue bonds and commercial paper 93,339 592,500 1,421,504 577,539 560,361 963,715 732,400 1,346,472 1,091,599 1,522,993
Principal paid on revenue bonds and commpercial paper (52,741) (313,789) (599,184) (411,419) (330,927) (604,949) (471,513) (889,326) (452,895) (346,508)
Interest paid on revenue bonds (90,491) (92,708) (77,384) (143,694) (175,505) (181,807) (191,814) (201,427) (230,976) (265,807)
Payment of bond issue costs - - (21,029) (7,853) 3,598 (4,416) (7,294) (18,479) (692) (3,487)
Purchase and construction of capital assets, net (261,651) (443,213) (466,099) (461,135) (418,559) (381,287) (317,323) (520,727) (666,386) (623,933)
Proceeds from land sale - - - - - 1,000 - - - -
Capital contributed by federal and state governments 13,681 44,530 42,296 46,690 38,546 56,979 32,136 36,168 55,728 90,433
Passenger facility charges 45,190 42,869 53,912 57,607 59,135 62,656 69,186 67,531 61,225 62,496
Proceeds from environmental reimbursements 5,210 206 6,588 134 1,793 4,448 6,586 1,902 1,077 1,003
Proceeds from North Terminal Program Claims 15,000 15,000 10,000 10,000 10,000 10,000
Proceeds from insurance claim 2,492 - - - - - - - - -
Net cash used in cpaital and related f inancing activities (244,971) (169,605) 360,604 (342,131) (246,558) (68,661) (137,636) (167,886) (131,320) 447,190
Cash f low s from non capital f inancing activities:
Operating reimbursements received - 5,354 3,309 1,150 1,627 1,100 6,441 1,221 3,086 6,268
Net cash provided by non capital f inancing activities - 5,354 3,309 1,150 1,627 1,100 6,441 1,221 3,086 6,268
Cash f low s from investing activities:
Purchase of investments (429,847) (457,574) (761,250) (607,250) (292,518) (493,839) (513,953) (980,767) (1,128,540) (890,227)
Proceeds from sales and maturities of investments 482,744 426,410 644,666 708,928 347,495 595,940 580,678 901,533 1,041,811 943,438
Interest and dividends on investments 23,139 11,877 7,837 6,218 11,616 31,336 28,903 20,328 5,981 5,678
Net cash provided by investing activities 76,036 (19,287) (108,747) 107,896 66,593 133,437 95,628 (58,906) (80,748) 58,889
Net increase (decrease) in cash and cash equivalents (13,598) (22,798) 422,895 (60,037) (87,655) 238,507 55,874 (45,210) (70,430) 703,538
Cash and cash equivalents, beginning of year 298,708 285,110 114,375 537,270 477,233 389,578 628,085 683,959 638,749 568,319
Cash and cash equivalents, end of year 285,110 262,312 537,270 477,233 389,578 628,085 683,959 638,749 568,319 1,271,857
(Unaudited)Fiscal Years Ended September 30
Changes in Cash and Cash Equivalents ($000)Miami-Dade County Aviation department
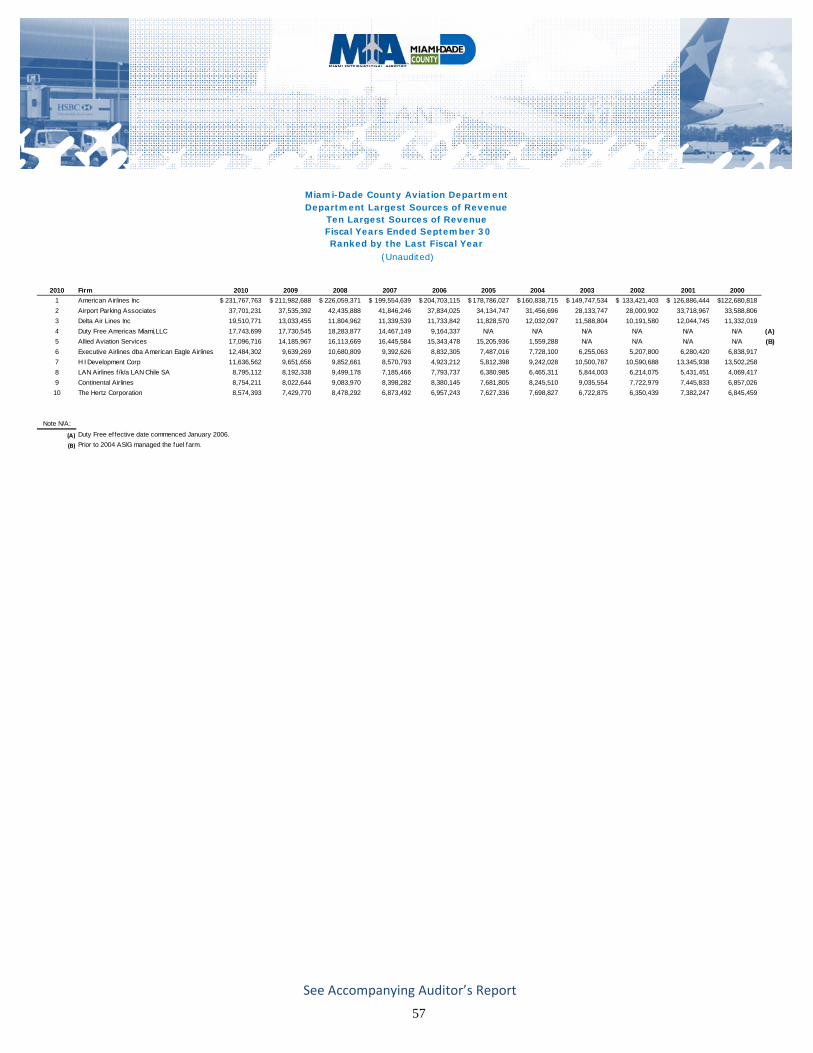
57
See Accompanying Auditor’s Report
2010 Firm 2010 2009 2008 2007 2006 2005 2004 2003 2002 2001 2000
1 American Airlines Inc 231,767,763$ 211,982,688$ 226,059,371$ 199,554,639$ 204,703,115$ 178,786,027$ 160,838,715$ 149,747,534$ 133,421,403$ 126,886,444$ 122,680,818$
2 Airport Parking Associates 37,701,231 37,535,392 42,435,888 41,846,246 37,834,025 34,134,747 31,456,696 28,133,747 28,000,902 33,718,967 33,588,806
3 Delta Air Lines Inc 19,510,771 13,033,455 11,804,962 11,339,539 11,733,842 11,828,570 12,032,097 11,588,804 10,191,580 12,044,745 11,332,019
4 Duty Free Americas Miami,LLC 17,743,699 17,730,545 18,283,877 14,467,149 9,164,337 N/A N/A N/A N/A N/A N/A (A)
5 Allied Aviation Services 17,096,716 14,185,967 16,113,669 16,445,584 15,343,478 15,205,936 1,559,288 N/A N/A N/A N/A (B)
6 Executive Airlines dba American Eagle Airlines 12,484,302 9,639,269 10,680,809 9,392,626 8,832,305 7,487,016 7,728,100 6,255,063 5,207,800 6,280,420 6,838,917
7 H I Development Corp 11,636,562 9,651,656 9,852,661 8,570,793 4,923,212 5,812,398 9,242,028 10,500,787 10,590,688 13,345,938 13,502,258
8 LAN Airlines f/k/a LAN Chile SA 8,795,112 8,192,338 9,499,178 7,185,466 7,793,737 6,380,985 6,465,311 5,844,003 6,214,075 5,431,451 4,069,417
9 Continental Airlines 8,754,211 8,022,644 9,083,970 8,398,282 8,380,145 7,681,805 8,245,510 9,035,554 7,722,979 7,445,833 6,857,026
10 The Hertz Corporation 8,574,393 7,429,770 8,478,292 6,873,492 6,957,243 7,627,336 7,698,827 6,722,875 6,350,439 7,382,247 6,845,459
Note N/A:
(A) Duty Free effective date commenced January 2006.
(B) Prior to 2004 ASIG managed the fuel farm.
(Unaudited)
Miami-Dade County Aviation Department Department Largest Sources of Revenue
Ten Largest Sources of Revenue Fiscal Years Ended September 30Ranked by the Last Fiscal Year
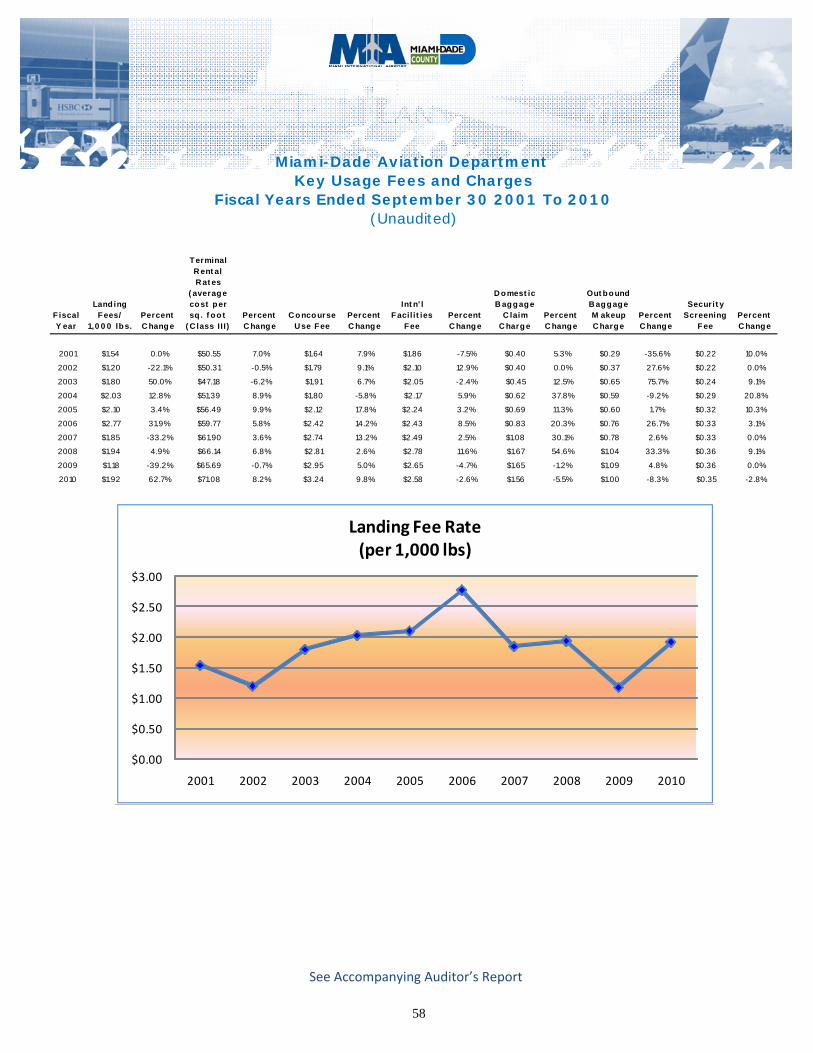
58
See Accompanying Auditor’s Report
Fiscal Years Ended September 30 2001 To 2010
F iscal Y ear
Land ing Fees/
1,0 0 0 lbs.Percent C hange
Terminal R ent al R at es
( average cost per sq . f oo t
( C lass II I)Percent C hange
C oncourse U se Fee
Percent C hange
Int n' l Facil it ies
FeePercent C hange
D omest ic B aggage
C laim C harge
Percent C hange
Out bound B aggage M akeup C harge
Percent C hange
Securit y Screening
FeePercent C hange
2001 $1.54 0.0% $50.55 7.0% $1.64 7.9% $1.86 -7.5% $0.40 5.3% $0.29 -35.6% $0.22 10.0%
2002 $1.20 -22.1% $50.31 -0.5% $1.79 9.1% $2.10 12.9% $0.40 0.0% $0.37 27.6% $0.22 0.0%
2003 $1.80 50.0% $47.18 -6.2% $1.91 6.7% $2.05 -2.4% $0.45 12.5% $0.65 75.7% $0.24 9.1%
2004 $2.03 12.8% $51.39 8.9% $1.80 -5.8% $2.17 5.9% $0.62 37.8% $0.59 -9.2% $0.29 20.8%
2005 $2.10 3.4% $56.49 9.9% $2.12 17.8% $2.24 3.2% $0.69 11.3% $0.60 1.7% $0.32 10.3%
2006 $2.77 31.9% $59.77 5.8% $2.42 14.2% $2.43 8.5% $0.83 20.3% $0.76 26.7% $0.33 3.1%
2007 $1.85 -33.2% $61.90 3.6% $2.74 13.2% $2.49 2.5% $1.08 30.1% $0.78 2.6% $0.33 0.0%
2008 $1.94 4.9% $66.14 6.8% $2.81 2.6% $2.78 11.6% $1.67 54.6% $1.04 33.3% $0.36 9.1%
2009 $1.18 -39.2% $65.69 -0.7% $2.95 5.0% $2.65 -4.7% $1.65 -1.2% $1.09 4.8% $0.36 0.0%
2010 $1.92 62.7% $71.08 8.2% $3.24 9.8% $2.58 -2.6% $1.56 -5.5% $1.00 -8.3% $0.35 -2.8%
Miami-Dade Aviation Department Key Usage Fees and Charges
(Unaudited)
$0.00
$0.50
$1.00
$1.50
$2.00
$2.50
$3.00
2001 2002 2003 2004 2005 2006 2007 2008 2009 2010
Landing Fee Rate(per 1,000 lbs)
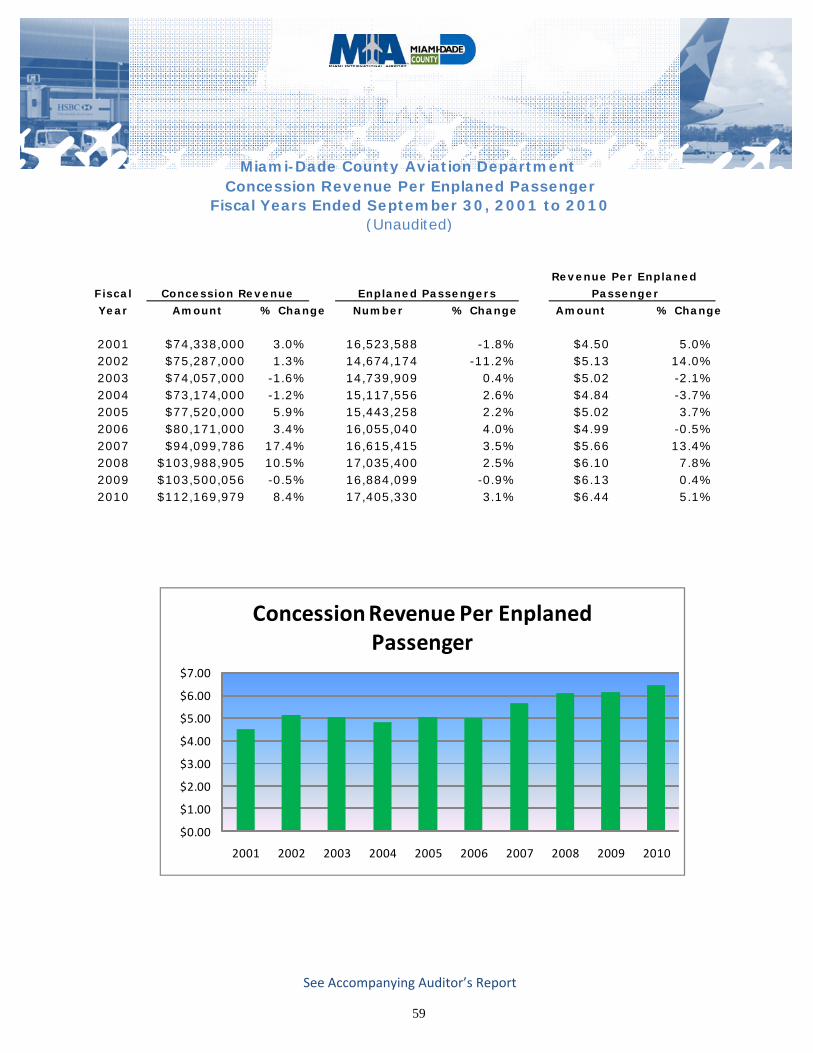
59
See Accompanying Auditor’s Report
Revenue Per Enplaned
Fiscal Passenger
Year Amount % Change Number % Change Amount % Change
2001 $74,338,000 3.0% 16,523,588 -1.8% $4.50 5.0%2002 $75,287,000 1.3% 14,674,174 -11.2% $5.13 14.0%2003 $74,057,000 -1.6% 14,739,909 0.4% $5.02 -2.1%2004 $73,174,000 -1.2% 15,117,556 2.6% $4.84 -3.7%2005 $77,520,000 5.9% 15,443,258 2.2% $5.02 3.7%2006 $80,171,000 3.4% 16,055,040 4.0% $4.99 -0.5%2007 $94,099,786 17.4% 16,615,415 3.5% $5.66 13.4%2008 $103,988,905 10.5% 17,035,400 2.5% $6.10 7.8%2009 $103,500,056 -0.5% 16,884,099 -0.9% $6.13 0.4%2010 $112,169,979 8.4% 17,405,330 3.1% $6.44 5.1%
Concession Revenue Enplaned Passengers
Miami-Dade County Aviation Department Concession Revenue Per Enplaned Passenger
Fiscal Years Ended September 30, 2001 to 2010(Unaudited)
$0.00
$1.00
$2.00
$3.00
$4.00
$5.00
$6.00
$7.00
2001 2002 2003 2004 2005 2006 2007 2008 2009 2010
Concession Revenue Per Enplaned Passenger
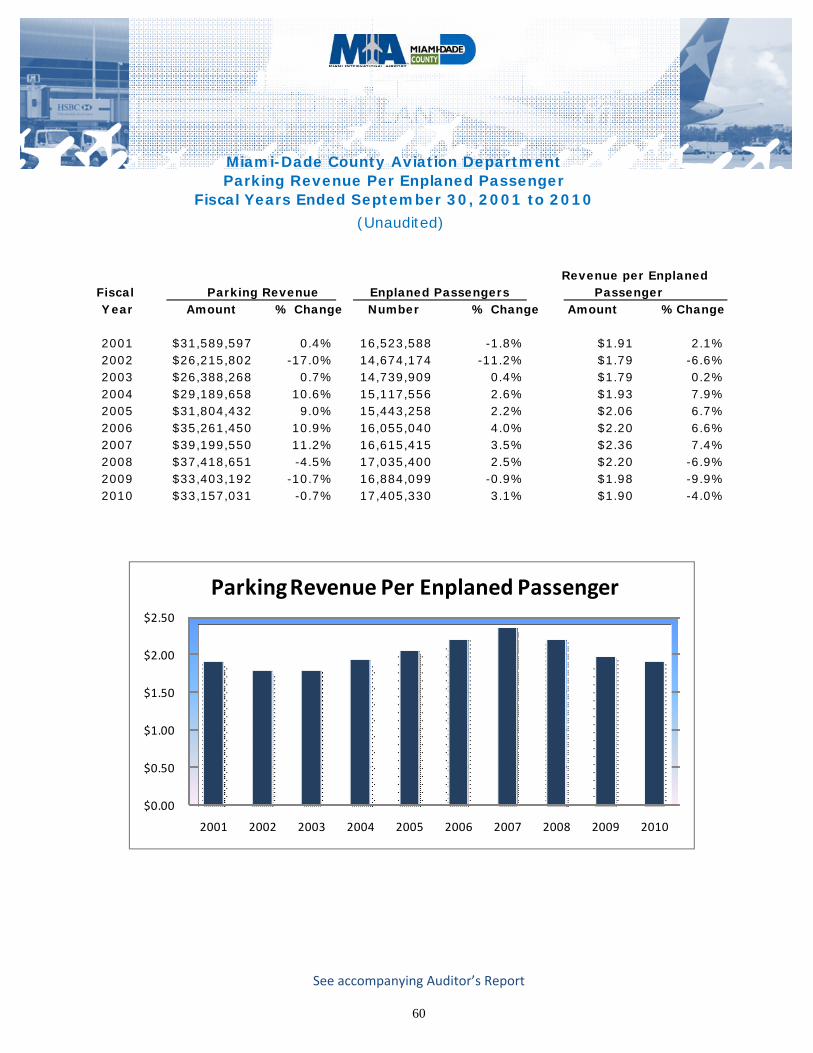
60
See accompanying Auditor’s Report
Miami-Dade County Aviation DepartmentParking Revenue Per Enplaned Passenger
Fiscal Years Ended September 30, 2001 to 2010
(Unaudited)
Revenue per EnplanedFiscal Parking Revenue PassengerYear Amount % Change Number % Change Amount %Change
2001 $31,589,597 0.4% 16,523,588 -1.8% $1.91 2.1%2002 $26,215,802 -17.0% 14,674,174 -11.2% $1.79 -6.6%2003 $26,388,268 0.7% 14,739,909 0.4% $1.79 0.2%2004 $29,189,658 10.6% 15,117,556 2.6% $1.93 7.9%2005 $31,804,432 9.0% 15,443,258 2.2% $2.06 6.7%2006 $35,261,450 10.9% 16,055,040 4.0% $2.20 6.6%2007 $39,199,550 11.2% 16,615,415 3.5% $2.36 7.4%2008 $37,418,651 -4.5% 17,035,400 2.5% $2.20 -6.9%2009 $33,403,192 -10.7% 16,884,099 -0.9% $1.98 -9.9%2010 $33,157,031 -0.7% 17,405,330 3.1% $1.90 -4.0%
Enplaned Passengers
$0.00
$0.50
$1.00
$1.50
$2.00
$2.50
2001 2002 2003 2004 2005 2006 2007 2008 2009 2010
Parking Revenue Per Enplaned Passenger
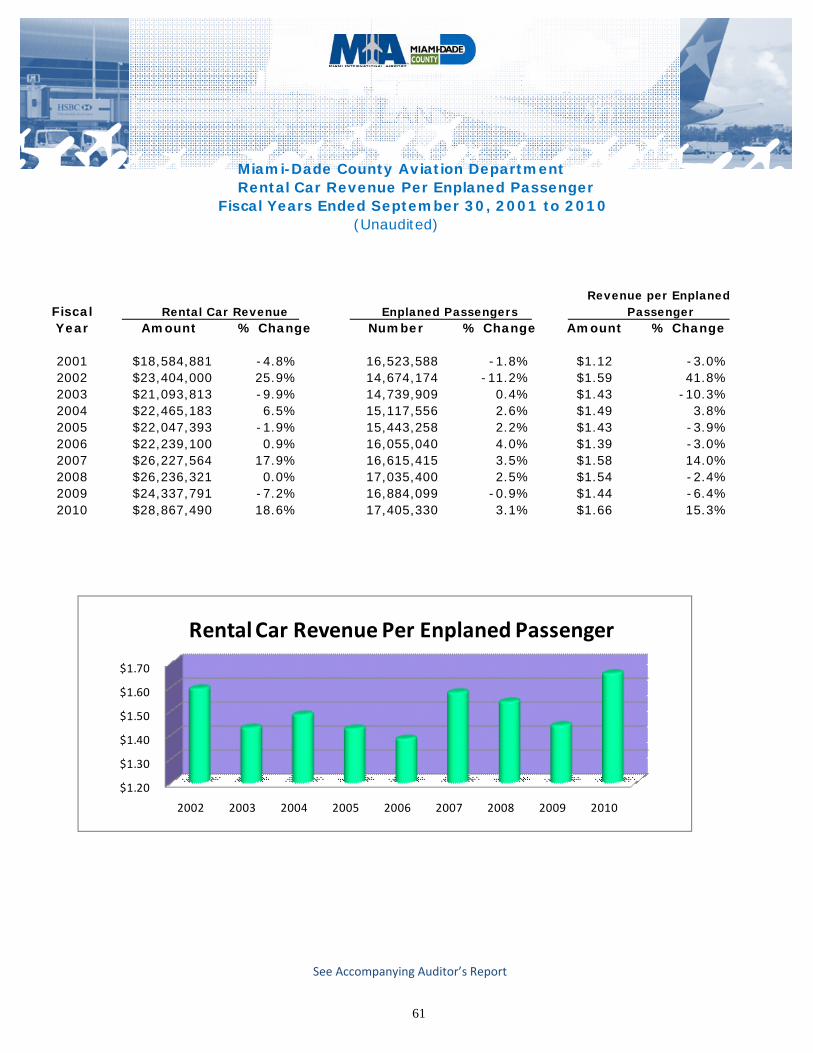
61
See Accompanying Auditor’s Report
Miami-Dade County Aviation Department Rental Car Revenue Per Enplaned Passenger
Fiscal Years Ended September 30, 2001 to 2010(Unaudited)
Revenue per EnplanedFiscal Rental Car Revenue Enplaned PassengersYear Amount % Change Number % Change Amount % Change
2001 $18,584,881 -4.8% 16,523,588 -1.8% $1.12 -3.0%2002 $23,404,000 25.9% 14,674,174 -11.2% $1.59 41.8%2003 $21,093,813 -9.9% 14,739,909 0.4% $1.43 -10.3%2004 $22,465,183 6.5% 15,117,556 2.6% $1.49 3.8%2005 $22,047,393 -1.9% 15,443,258 2.2% $1.43 -3.9%2006 $22,239,100 0.9% 16,055,040 4.0% $1.39 -3.0%2007 $26,227,564 17.9% 16,615,415 3.5% $1.58 14.0%2008 $26,236,321 0.0% 17,035,400 2.5% $1.54 -2.4%2009 $24,337,791 -7.2% 16,884,099 -0.9% $1.44 -6.4%2010 $28,867,490 18.6% 17,405,330 3.1% $1.66 15.3%
Passenger
$1.20
$1.30
$1.40
$1.50
$1.60
$1.70
2002 2003 2004 2005 2006 2007 2008 2009 2010
Rental Car Revenue Per Enplaned Passenger
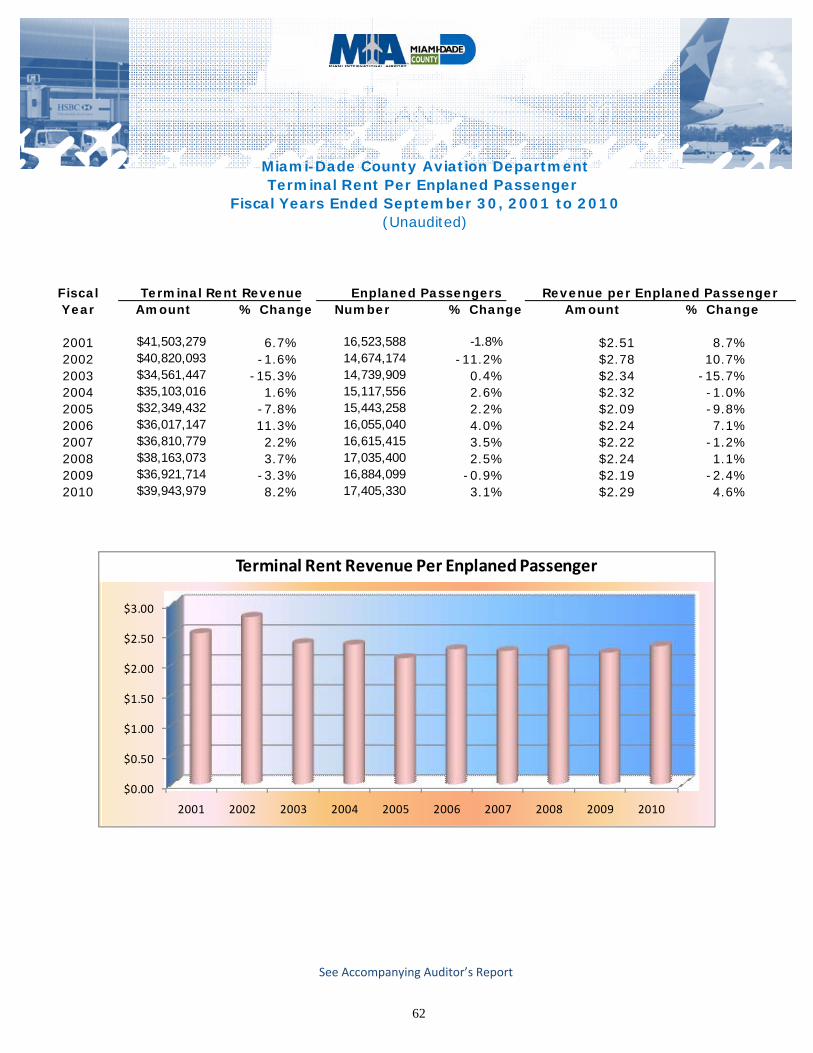
62
See Accompanying Auditor’s Report
Fiscal Terminal Rent Revenue Enplaned Passengers Revenue per Enplaned PassengerYear Amount % Change Number % Change Amount % Change
2001 $41,503,279 6.7% 16,523,588 -1.8% $2.51 8.7%2002 $40,820,093 -1.6% 14,674,174 -11.2% $2.78 10.7%2003 $34,561,447 -15.3% 14,739,909 0.4% $2.34 -15.7%2004 $35,103,016 1.6% 15,117,556 2.6% $2.32 -1.0%2005 $32,349,432 -7.8% 15,443,258 2.2% $2.09 -9.8%2006 $36,017,147 11.3% 16,055,040 4.0% $2.24 7.1%2007 $36,810,779 2.2% 16,615,415 3.5% $2.22 -1.2%2008 $38,163,073 3.7% 17,035,400 2.5% $2.24 1.1%2009 $36,921,714 -3.3% 16,884,099 -0.9% $2.19 -2.4%2010 $39,943,979 8.2% 17,405,330 3.1% $2.29 4.6%
Miami-Dade County Aviation DepartmentTerminal Rent Per Enplaned Passenger
Fiscal Years Ended September 30, 2001 to 2010(Unaudited)
$0.00
$0.50
$1.00
$1.50
$2.00
$2.50
$3.00
2001 2002 2003 2004 2005 2006 2007 2008 2009 2010
Terminal Rent Revenue Per Enplaned Passenger
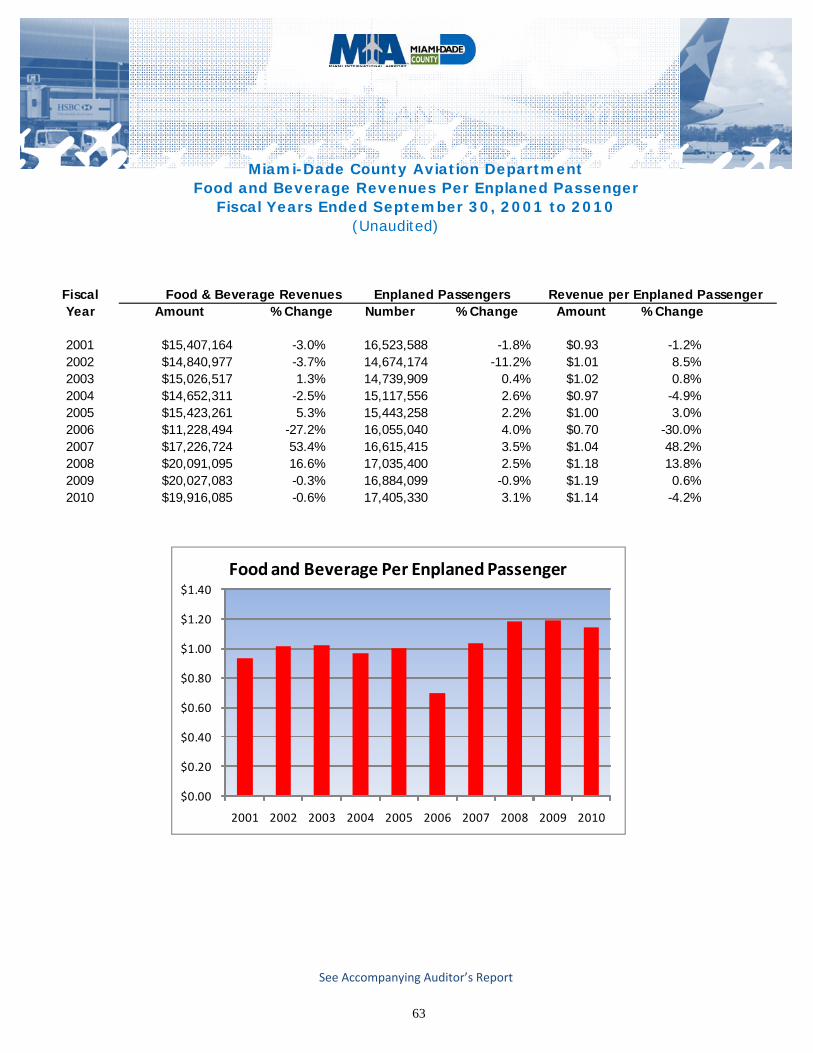
63
See Accompanying Auditor’s Report
(Unaudited)
Fiscal Food & Beverage Revenues Enplaned PassengersYear Amount % Change Number % Change Amount % Change
2001 $15,407,164 -3.0% 16,523,588 -1.8% $0.93 -1.2%2002 $14,840,977 -3.7% 14,674,174 -11.2% $1.01 8.5%2003 $15,026,517 1.3% 14,739,909 0.4% $1.02 0.8%2004 $14,652,311 -2.5% 15,117,556 2.6% $0.97 -4.9%2005 $15,423,261 5.3% 15,443,258 2.2% $1.00 3.0%2006 $11,228,494 -27.2% 16,055,040 4.0% $0.70 -30.0%2007 $17,226,724 53.4% 16,615,415 3.5% $1.04 48.2%2008 $20,091,095 16.6% 17,035,400 2.5% $1.18 13.8%2009 $20,027,083 -0.3% 16,884,099 -0.9% $1.19 0.6%2010 $19,916,085 -0.6% 17,405,330 3.1% $1.14 -4.2%
Revenue per Enplaned Passenger
Miami-Dade County Aviation DepartmentFood and Beverage Revenues Per Enplaned Passenger
Fiscal Years Ended September 30, 2001 to 2010
$0.00
$0.20
$0.40
$0.60
$0.80
$1.00
$1.20
$1.40
2001 2002 2003 2004 2005 2006 2007 2008 2009 2010
Food and Beverage Per Enplaned Passenger
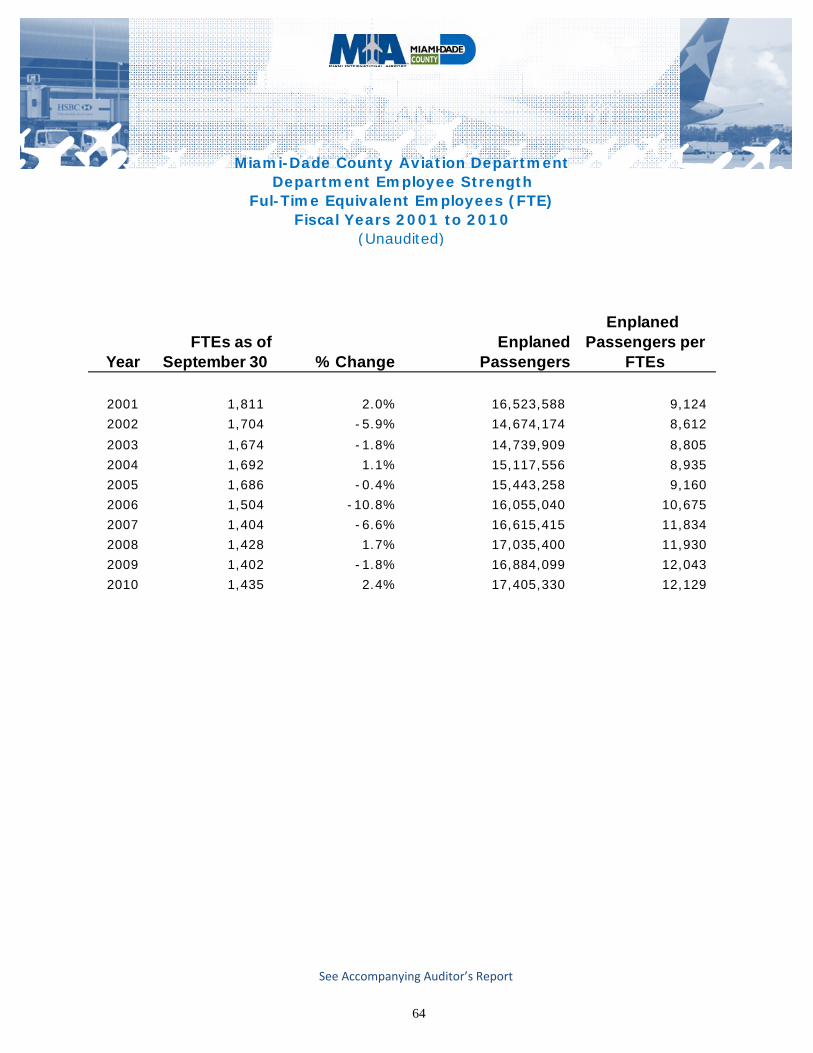
64
See Accompanying Auditor’s Report
Enplaned FTEs as of Enplaned Passengers per
Year September 30 % Change Passengers FTEs
2001 1,811 2.0% 16,523,588 9,124
2002 1,704 -5.9% 14,674,174 8,612
2003 1,674 -1.8% 14,739,909 8,805
2004 1,692 1.1% 15,117,556 8,935
2005 1,686 -0.4% 15,443,258 9,160
2006 1,504 -10.8% 16,055,040 10,675
2007 1,404 -6.6% 16,615,415 11,834
2008 1,428 1.7% 17,035,400 11,930
2009 1,402 -1.8% 16,884,099 12,043
2010 1,435 2.4% 17,405,330 12,129
Miami-Dade County Aviation DepartmentDepartment Employee Strength
Ful-Time Equivalent Employees (FTE)Fiscal Years 2001 to 2010
(Unaudited)
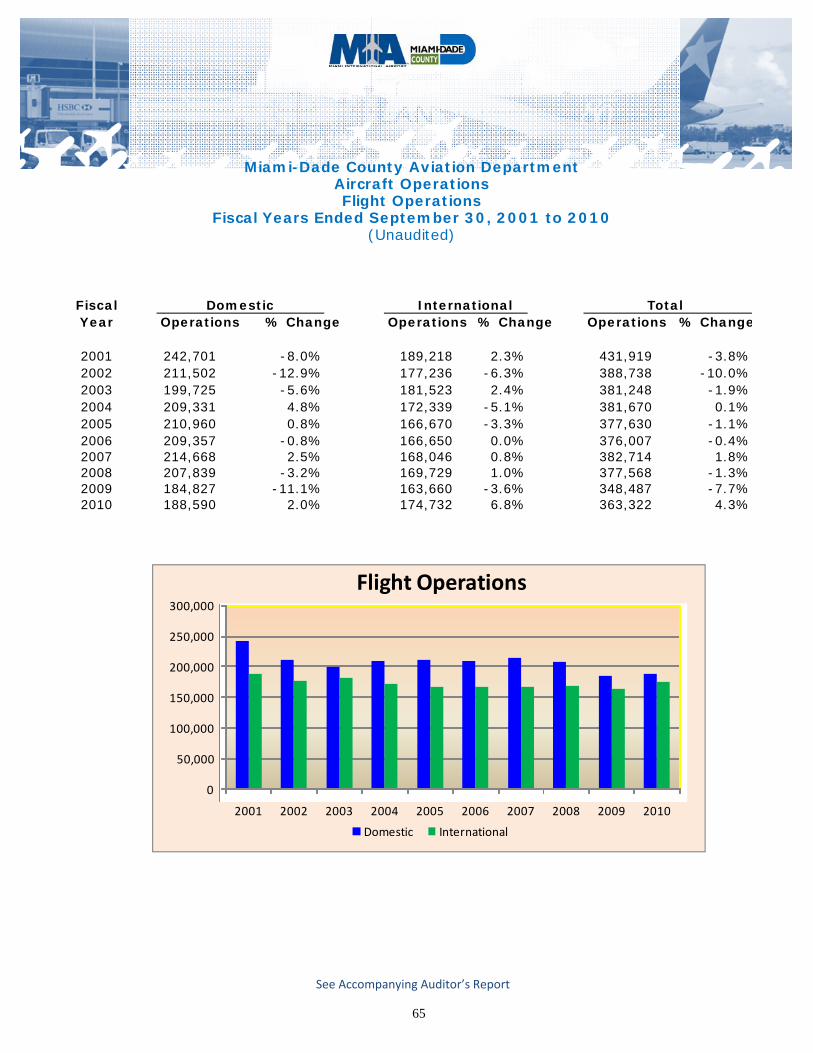
65
See Accompanying Auditor’s Report
Fiscal Domestic International TotalYear Operations % Change Operations % Change Operations % Change
2001 242,701 -8.0% 189,218 2.3% 431,919 -3.8%2002 211,502 -12.9% 177,236 -6.3% 388,738 -10.0%2003 199,725 -5.6% 181,523 2.4% 381,248 -1.9%2004 209,331 4.8% 172,339 -5.1% 381,670 0.1%2005 210,960 0.8% 166,670 -3.3% 377,630 -1.1%2006 209,357 -0.8% 166,650 0.0% 376,007 -0.4%2007 214,668 2.5% 168,046 0.8% 382,714 1.8%2008 207,839 -3.2% 169,729 1.0% 377,568 -1.3%2009 184,827 -11.1% 163,660 -3.6% 348,487 -7.7%2010 188,590 2.0% 174,732 6.8% 363,322 4.3%
Flight Operations
(Unaudited)
Aircraft OperationsMiami-Dade County Aviation Department
Fiscal Years Ended September 30, 2001 to 2010
0
50,000
100,000
150,000
200,000
250,000
300,000
2001 2002 2003 2004 2005 2006 2007 2008 2009 2010
Flight Operations
Domestic International
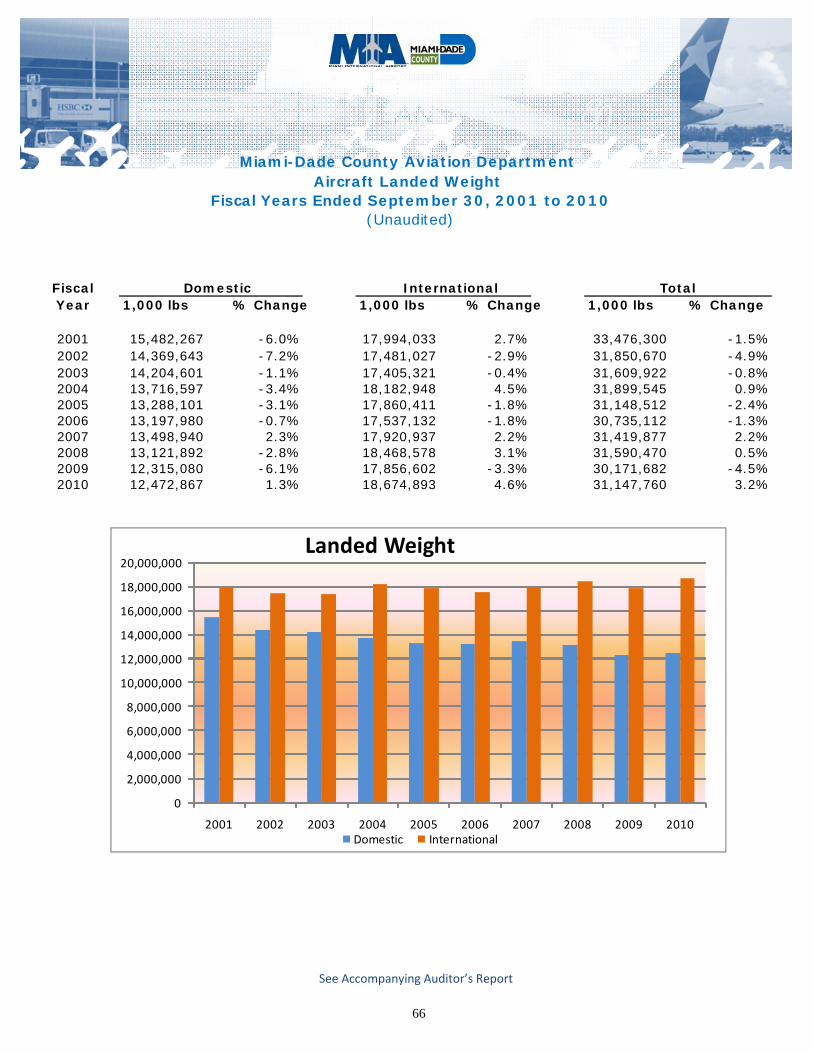
66
See Accompanying Auditor’s Report
Fiscal Domestic International TotalYear 1,000 lbs % Change 1,000 lbs % Change 1,000 lbs % Change
2001 15,482,267 -6.0% 17,994,033 2.7% 33,476,300 -1.5%2002 14,369,643 -7.2% 17,481,027 -2.9% 31,850,670 -4.9%2003 14,204,601 -1.1% 17,405,321 -0.4% 31,609,922 -0.8%2004 13,716,597 -3.4% 18,182,948 4.5% 31,899,545 0.9%2005 13,288,101 -3.1% 17,860,411 -1.8% 31,148,512 -2.4%2006 13,197,980 -0.7% 17,537,132 -1.8% 30,735,112 -1.3%2007 13,498,940 2.3% 17,920,937 2.2% 31,419,877 2.2%2008 13,121,892 -2.8% 18,468,578 3.1% 31,590,470 0.5%2009 12,315,080 -6.1% 17,856,602 -3.3% 30,171,682 -4.5%2010 12,472,867 1.3% 18,674,893 4.6% 31,147,760 3.2%
Fiscal Years Ended September 30, 2001 to 2010(Unaudited)
Miami-Dade County Aviation Department Aircraft Landed Weight
0
2,000,000
4,000,000
6,000,000
8,000,000
10,000,000
12,000,000
14,000,000
16,000,000
18,000,000
20,000,000
2001 2002 2003 2004 2005 2006 2007 2008 2009 2010
Landed Weight
Domestic International

67
See Accompanying Auditor’s Report
Year Passengers % Change Passengers % Change Passengers % Change
2001 8,568,487 -1.8% 7,955,101 -1.9% 16,523,588 -1.8%2002 7,615,860 -11.1% 7,058,314 -11.3% 14,674,174 -11.2%2003 7,792,381 2.3% 6,947,528 -1.6% 14,739,909 0.4%2004 8,162,901 4.8% 6,954,655 0.1% 15,117,556 2.6%2005 8,373,079 2.6% 7,070,179 1.7% 15,443,258 2.2%2006 8,854,085 5.7% 7,200,955 1.8% 16,055,040 4.0%2007 9,102,351 2.8% 7,513,064 4.3% 16,615,415 3.5%2008 9,067,718 -0.4% 7,967,682 6.1% 17,035,400 2.5%2009 8,987,096 -0.9% 7,897,003 -0.9% 16,884,099 -0.9%2010 9,179,436 2.1% 8,225,894 4.2% 17,405,330 3.1%
Miami-Dade County Aviation DepartmentPassenger Enplanements
Fiscal Years Ended September 30, 2001 to 2010(Unaudited)
Domestic International Total
0
1,000,000
2,000,000
3,000,000
4,000,000
5,000,000
6,000,000
7,000,000
8,000,000
9,000,000
10,000,000
2001 2002 2003 2004 2005 2006 2007 2008 2009 2010
Annual Enplaned Passengers
Domestic
International
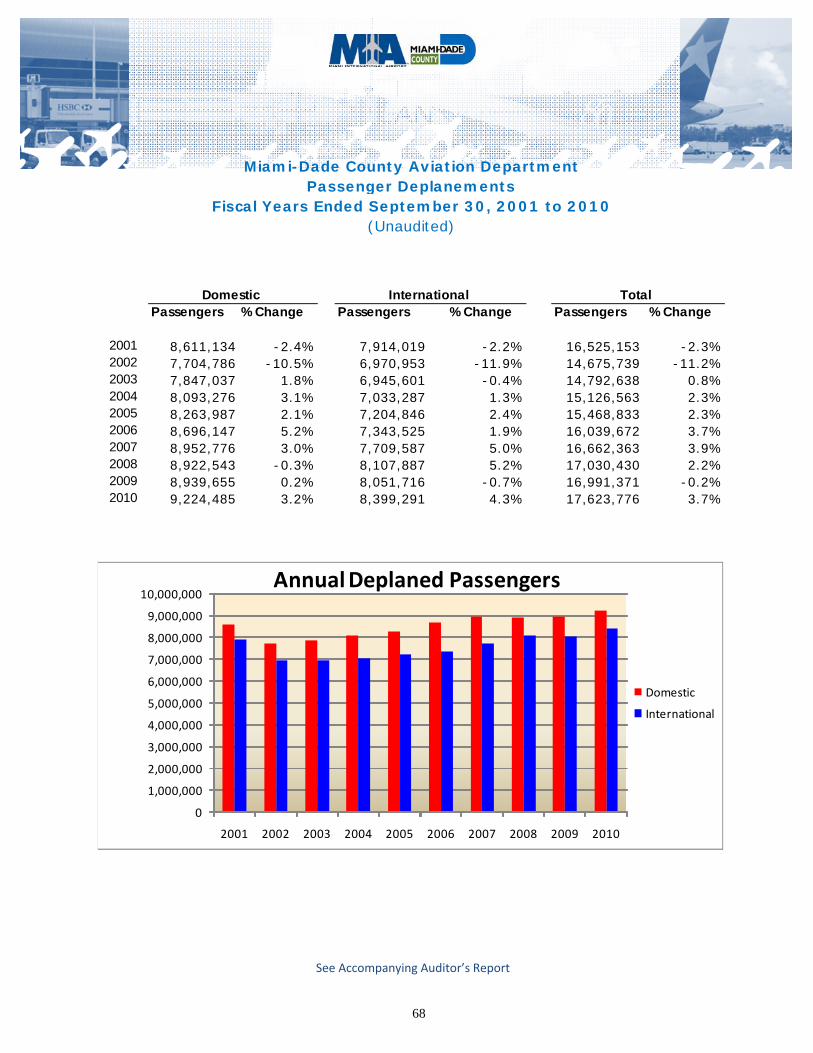
68
See Accompanying Auditor’s Report
Passengers % Change Passengers % Change Passengers % Change
2001 8,611,134 -2.4% 7,914,019 -2.2% 16,525,153 -2.3%2002 7,704,786 -10.5% 6,970,953 -11.9% 14,675,739 -11.2%2003 7,847,037 1.8% 6,945,601 -0.4% 14,792,638 0.8%2004 8,093,276 3.1% 7,033,287 1.3% 15,126,563 2.3%2005 8,263,987 2.1% 7,204,846 2.4% 15,468,833 2.3%2006 8,696,147 5.2% 7,343,525 1.9% 16,039,672 3.7%2007 8,952,776 3.0% 7,709,587 5.0% 16,662,363 3.9%2008 8,922,543 -0.3% 8,107,887 5.2% 17,030,430 2.2%2009 8,939,655 0.2% 8,051,716 -0.7% 16,991,371 -0.2%2010 9,224,485 3.2% 8,399,291 4.3% 17,623,776 3.7%
Miami-Dade County Aviation DepartmentPassenger Deplanements
Fiscal Years Ended September 30, 2001 to 2010
Domestic International Total
(Unaudited)
0
1,000,000
2,000,000
3,000,000
4,000,000
5,000,000
6,000,000
7,000,000
8,000,000
9,000,000
10,000,000
2001 2002 2003 2004 2005 2006 2007 2008 2009 2010
Annual Deplaned Passengers
Domestic
International
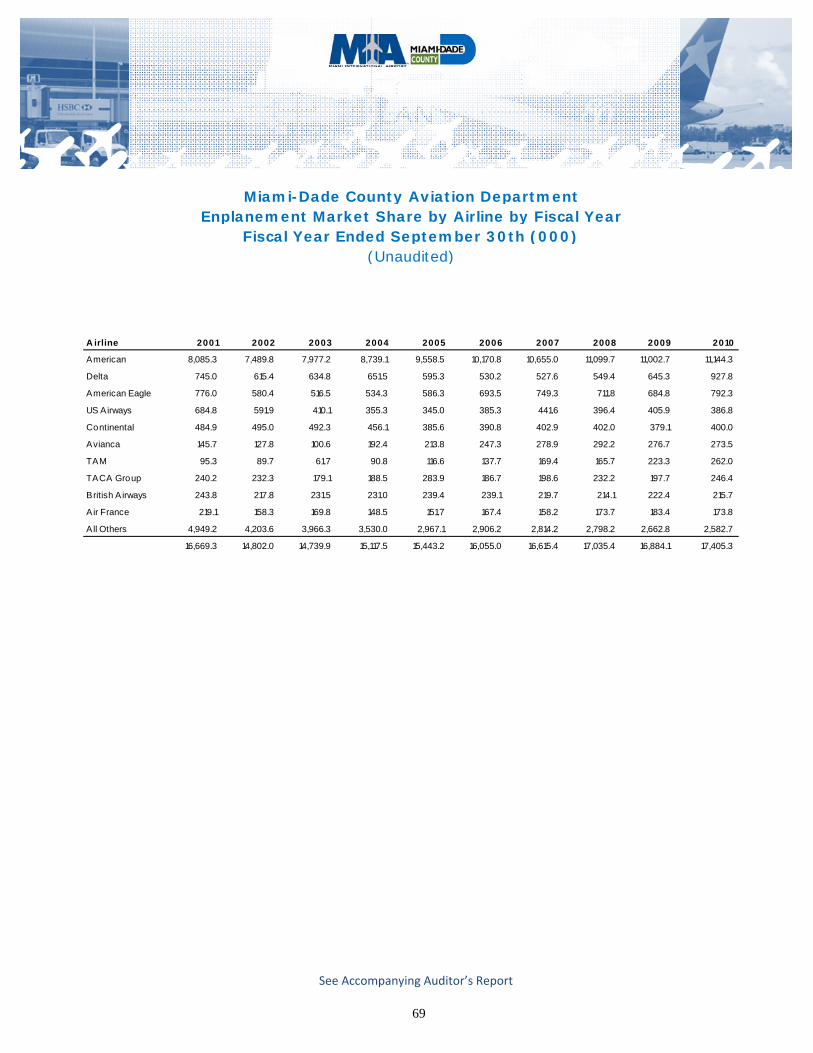
69
See Accompanying Auditor’s Report
A irline 2001 2002 2003 2004 2005 2006 2007 2008 2009 2010
American 8,085.3 7,489.8 7,977.2 8,739.1 9,558.5 10,170.8 10,655.0 11,099.7 11,002.7 11,144.3
Delta 745.0 615.4 634.8 651.5 595.3 530.2 527.6 549.4 645.3 927.8
American Eagle 776.0 580.4 516.5 534.3 586.3 693.5 749.3 711.8 684.8 792.3
US Airways 684.8 591.9 410.1 355.3 345.0 385.3 441.6 396.4 405.9 386.8
Continental 484.9 495.0 492.3 456.1 385.6 390.8 402.9 402.0 379.1 400.0
Avianca 145.7 127.8 100.6 192.4 213.8 247.3 278.9 292.2 276.7 273.5
TAM 95.3 89.7 61.7 90.8 116.6 137.7 169.4 165.7 223.3 262.0
TACA Group 240.2 232.3 179.1 188.5 283.9 186.7 198.6 232.2 197.7 246.4
British A irways 243.8 217.8 231.5 231.0 239.4 239.1 219.7 214.1 222.4 215.7
A ir France 219.1 158.3 169.8 148.5 151.7 167.4 158.2 173.7 183.4 173.8
A ll Others 4,949.2 4,203.6 3,966.3 3,530.0 2,967.1 2,906.2 2,814.2 2,798.2 2,662.8 2,582.7
16,669.3 14,802.0 14,739.9 15,117.5 15,443.2 16,055.0 16,615.4 17,035.4 16,884.1 17,405.3
Miami-Dade County Aviation DepartmentEnplanement Market Share by Airline by Fiscal Year
Fiscal Year Ended September 30th (000)(Unaudited)
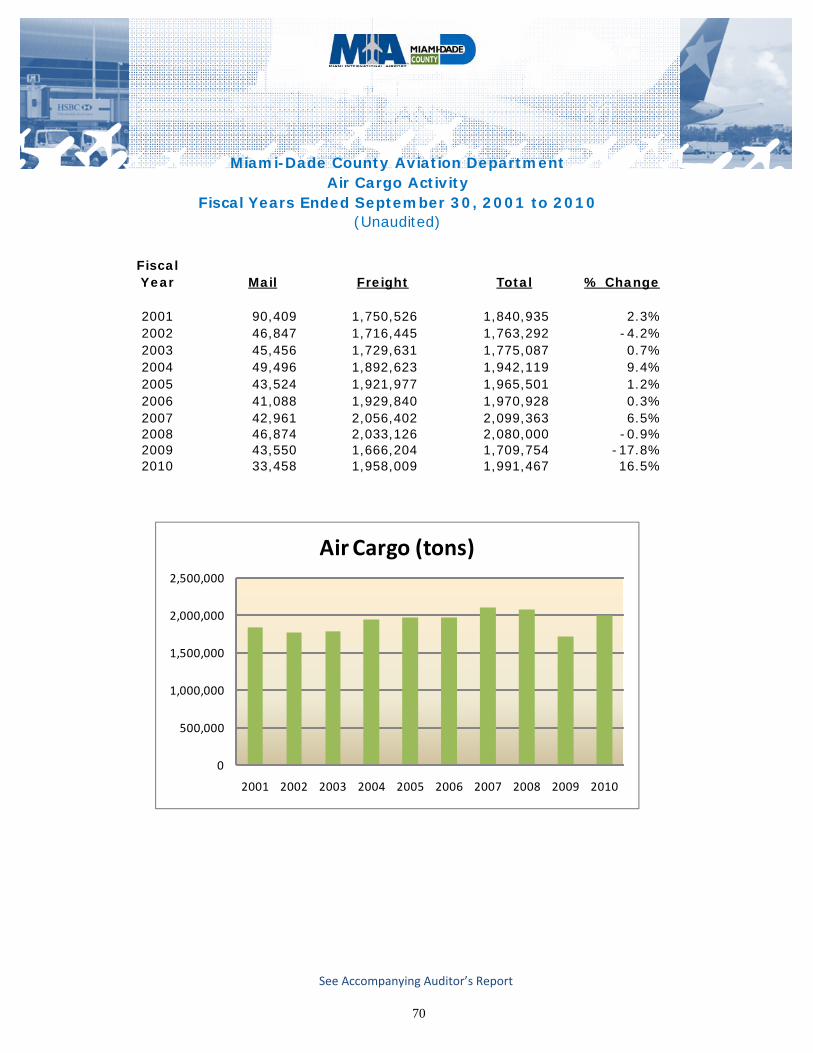
70
See Accompanying Auditor’s Report
FiscalYear Mail Freight Total % Change
2001 90,409 1,750,526 1,840,935 2.3%2002 46,847 1,716,445 1,763,292 -4.2%2003 45,456 1,729,631 1,775,087 0.7%2004 49,496 1,892,623 1,942,119 9.4%2005 43,524 1,921,977 1,965,501 1.2%2006 41,088 1,929,840 1,970,928 0.3%2007 42,961 2,056,402 2,099,363 6.5%2008 46,874 2,033,126 2,080,000 -0.9%2009 43,550 1,666,204 1,709,754 -17.8%2010 33,458 1,958,009 1,991,467 16.5%
(Unaudited)
Miami-Dade County Aviation DepartmentAir Cargo Activity
Fiscal Years Ended September 30, 2001 to 2010
0
500,000
1,000,000
1,500,000
2,000,000
2,500,000
2001 2002 2003 2004 2005 2006 2007 2008 2009 2010
Air Cargo (tons)
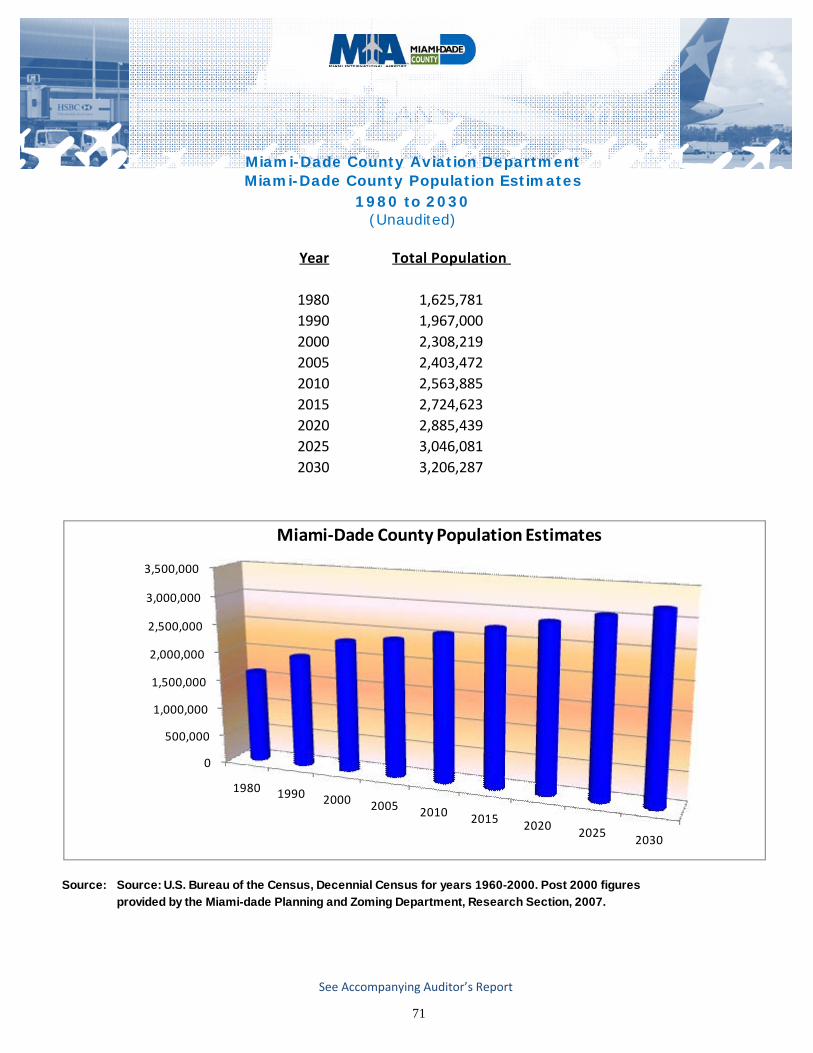
71
See Accompanying Auditor’s Report
Year Total Population
1980 1,625,781
1990 1,967,000
2000 2,308,219
2005 2,403,472
2010 2,563,885
2015 2,724,623
2020 2,885,439
2025 3,046,081
2030 3,206,287
Source: Source: U.S. Bureau of the Census, Decennial Census for years 1960-2000. Post 2000 figures
provided by the Miami-dade Planning and Zoming Department, Research Section, 2007.
Miami-Dade County Aviation DepartmentMiami-Dade County Population Estimates
1980 to 2030(Unaudited)
0
500,000
1,000,000
1,500,000
2,000,000
2,500,000
3,000,000
3,500,000
1980 1990 2000 2005 20102015
20202025
2030
Miami‐Dade County Population Estimates
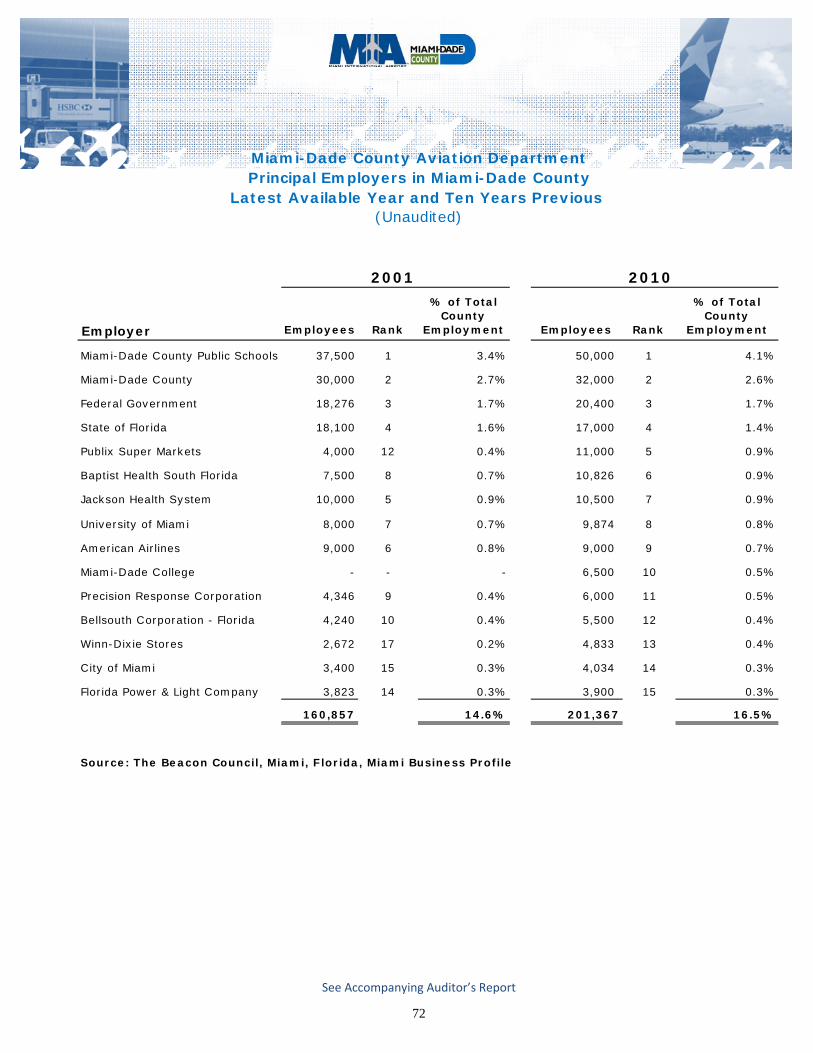
72
See Accompanying Auditor’s Report
2001 2010
Employer Employees Rank
% of Total County
Employment Employees Rank
% of Total County
Employment
Miami-Dade County Public Schools 37,500 1 3.4% 50,000 1 4.1%
Miami-Dade County 30,000 2 2.7% 32,000 2 2.6%
Federal Government 18,276 3 1.7% 20,400 3 1.7%
State of Florida 18,100 4 1.6% 17,000 4 1.4%
Publix Super Markets 4,000 12 0.4% 11,000 5 0.9%
Baptist Health South Florida 7,500 8 0.7% 10,826 6 0.9%
Jackson Health System 10,000 5 0.9% 10,500 7 0.9%
University of Miami 8,000 7 0.7% 9,874 8 0.8%
American Airlines 9,000 6 0.8% 9,000 9 0.7%
Miami-Dade College - - - 6,500 10 0.5%
Precision Response Corporation 4,346 9 0.4% 6,000 11 0.5%
Bellsouth Corporation - Florida 4,240 10 0.4% 5,500 12 0.4%
Winn-Dixie Stores 2,672 17 0.2% 4,833 13 0.4%
City of Miami 3,400 15 0.3% 4,034 14 0.3%
Florida Power & Light Company 3,823 14 0.3% 3,900 15 0.3%
160,857 14.6% 201,367 16.5%
Source: The Beacon Council, Miami, Florida, Miami Business Profile
Miami-Dade County Aviation DepartmentPrincipal Employers in Miami-Dade County
Latest Available Year and Ten Years Previous (Unaudited)
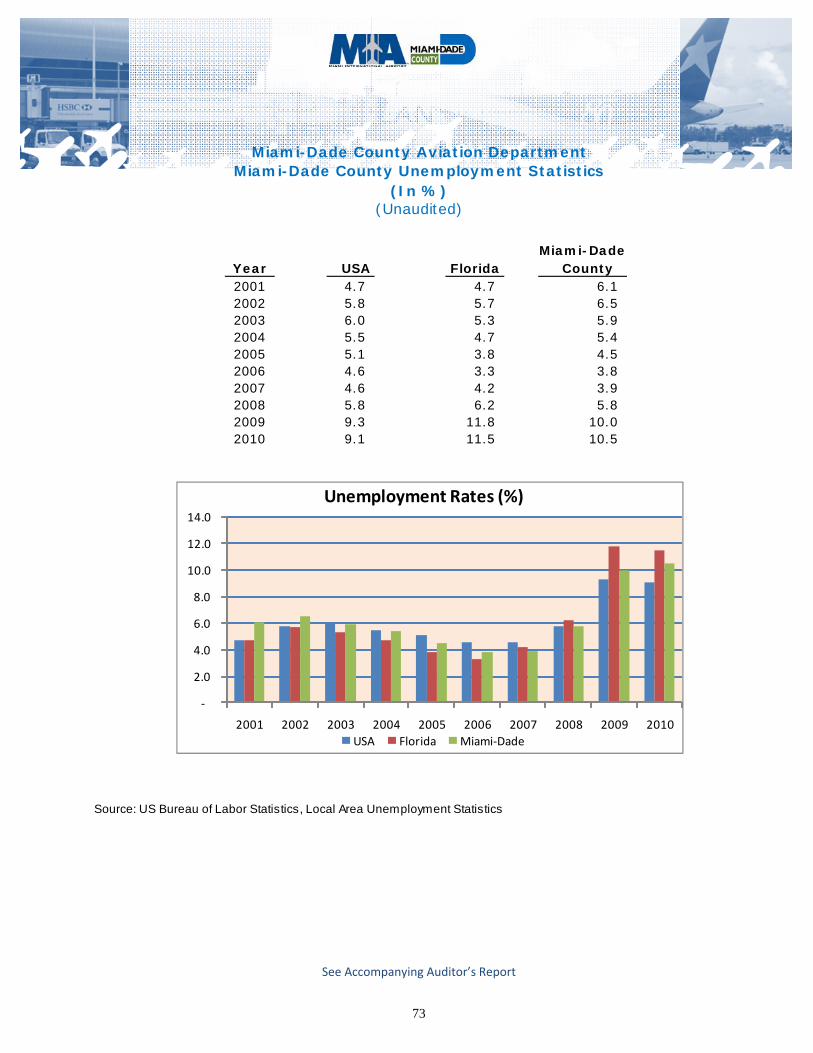
73
See Accompanying Auditor’s Report
Miami-DadeYear USA Florida County 2001 4.7 4.7 6.1 2002 5.8 5.7 6.5 2003 6.0 5.3 5.9 2004 5.5 4.7 5.4 2005 5.1 3.8 4.5 2006 4.6 3.3 3.8 2007 4.6 4.2 3.9 2008 5.8 6.2 5.8 2009 9.3 11.8 10.0 2010 9.1 11.5 10.5
Source: US Bureau of Labor Statistics, Local Area Unemployment Statistics
Miami-Dade County Aviation DepartmentMiami-Dade County Unemployment Statistics
(In %)(Unaudited)
‐
2.0
4.0
6.0
8.0
10.0
12.0
14.0
2001 2002 2003 2004 2005 2006 2007 2008 2009 2010
Unemployment Rates (%)
USA Florida Miami‐Dade
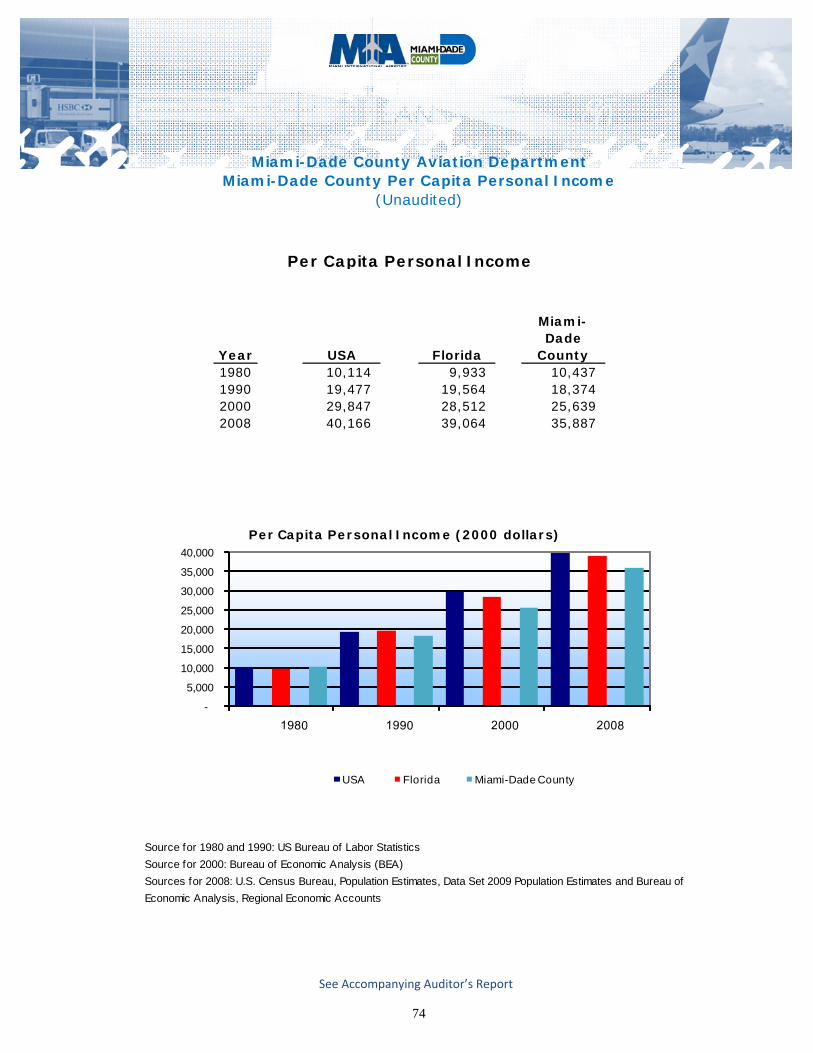
74
See Accompanying Auditor’s Report
Year USA Florida
Miami-Dade
County1980 10,114 9,933 10,437 1990 19,477 19,564 18,374 2000 29,847 28,512 25,639 2008 40,166 39,064 35,887
USA FloridaMiami-Dade County1996 5.4 5.3 8.0 1997 4.9 5.0 7.6
1980 #REF! #### #REF!1990 10,114 ### 10,437 2000 29,832 ### 25,627 2007 29,847 ### 25,639
Source for 1980 and 1990: US Bureau of Labor Statistics
Source for 2000: Bureau of Economic Analysis (BEA)
Sources for 2008: U.S. Census Bureau, Population Estimates, Data Set 2009 Population Estimates and Bureau of
Economic Analysis, Regional Economic Accounts
Miami-Dade County Aviation DepartmentMiami-Dade County Per Capita Personal Income
(Unaudited)
Per Capita Personal Income
0.00
5,000.00
10,000.00
15,000.00
20,000.00
25,000.00
30,000.00
Per Capita Personal Income (2000 dollars)
USA Florida Miami-Dade
-
5,000
10,000
15,000
20,000
25,000
30,000
35,000
40,000
Per Capita Personal Income (2000 dollars)
USA Florida Miami-Dade County
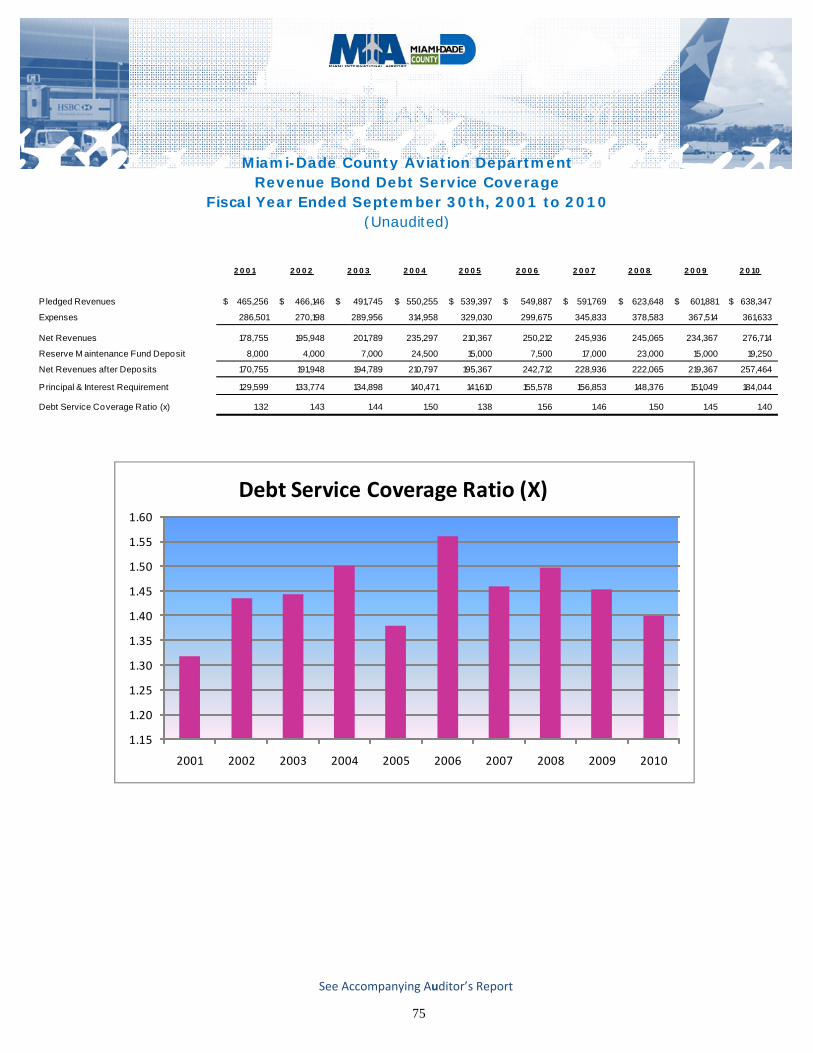
75
See Accompanying Auditor’s Report
2 0 0 1 2 0 0 2 2 0 0 3 2 0 0 4 2 0 0 5 2 0 0 6 2 0 0 7 2 0 0 8 2 0 0 9 2 0 10
Pledged Revenues 465,256$ 466,146$ 491,745$ 550,255$ 539,397$ 549,887$ 591,769$ 623,648$ 601,881$ 638,347$
Expenses 286,501 270,198 289,956 314,958 329,030 299,675 345,833 378,583 367,514 361,633
Net Revenues 178,755 195,948 201,789 235,297 210,367 250,212 245,936 245,065 234,367 276,714
Reserve M aintenance Fund Deposit 8,000 4,000 7,000 24,500 15,000 7,500 17,000 23,000 15,000 19,250
Net Revenues after Deposits 170,755 191,948 194,789 210,797 195,367 242,712 228,936 222,065 219,367 257,464
Principal & Interest Requirement 129,599 133,774 134,898 140,471 141,610 155,578 156,853 148,376 151,049 184,044
Debt Service Coverage Ratio (x) 1.32 1.43 1.44 1.50 1.38 1.56 1.46 1.50 1.45 1.40
(Unaudited)Fiscal Year Ended September 30th, 2001 to 2010
Revenue Bond Debt Service CoverageMiami-Dade County Aviation Department
1.15
1.20
1.25
1.30
1.35
1.40
1.45
1.50
1.55
1.60
2001 2002 2003 2004 2005 2006 2007 2008 2009 2010
Debt Service Coverage Ratio (X)
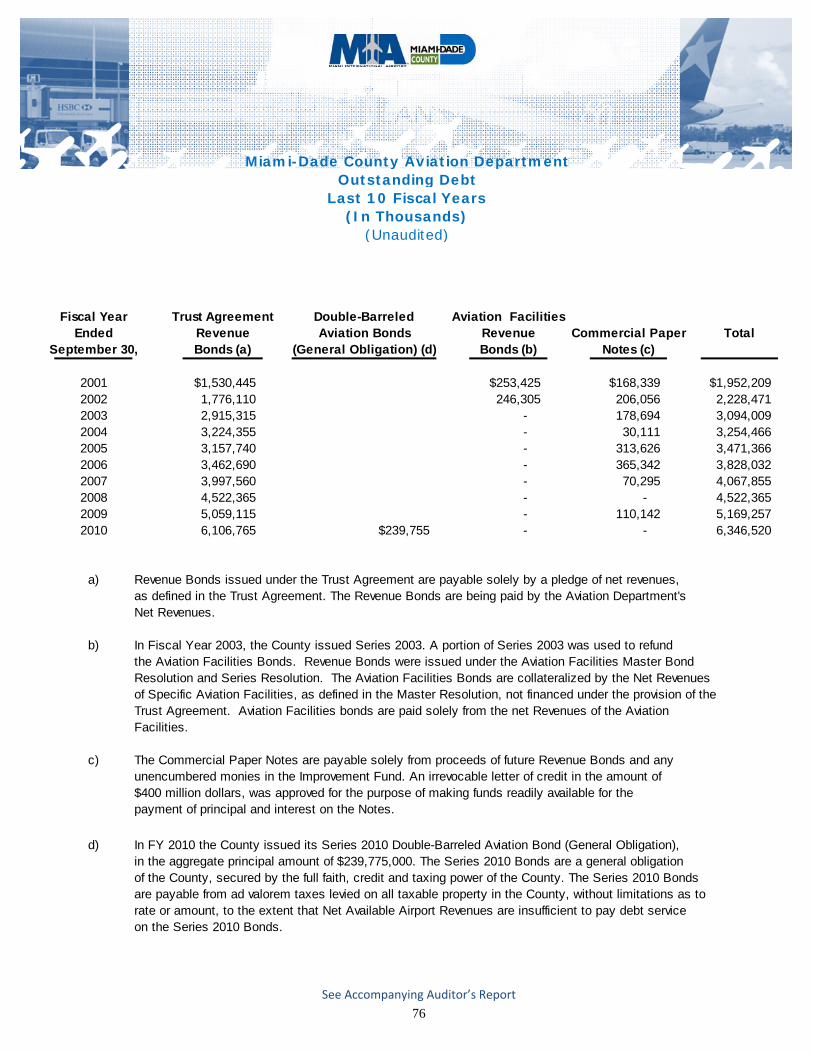
76
See Accompanying Auditor’s Report
Fiscal Year Trust Agreement Double-Barreled Aviation FacilitiesEnded Revenue Aviation Bonds Revenue Commercial Paper Total
September 30, Bonds (a) (General Obligation) (d) Bonds (b) Notes (c)
2001 $1,530,445 $253,425 $168,339 $1,952,2092002 1,776,110 246,305 206,056 2,228,471 2003 2,915,315 - 178,694 3,094,009 2004 3,224,355 - 30,111 3,254,466 2005 3,157,740 - 313,626 3,471,366 2006 3,462,690 - 365,342 3,828,032 2007 3,997,560 - 70,295 4,067,855 2008 4,522,365 - - 4,522,365 2009 5,059,115 - 110,142 5,169,257 2010 6,106,765 $239,755 - - 6,346,520
a) Revenue Bonds issued under the Trust Agreement are payable solely by a pledge of net revenues,as defined in the Trust Agreement. The Revenue Bonds are being paid by the Aviation Department'sNet Revenues.
b) In Fiscal Year 2003, the County issued Series 2003. A portion of Series 2003 was used to refund the Aviation Facilities Bonds. Revenue Bonds were issued under the Aviation Facilities Master BondResolution and Series Resolution. The Aviation Facilities Bonds are collateralized by the Net Revenuesof Specific Aviation Facilities, as defined in the Master Resolution, not financed under the provision of theTrust Agreement. Aviation Facilities bonds are paid solely from the net Revenues of the AviationFacilities.
c) The Commercial Paper Notes are payable solely from proceeds of future Revenue Bonds and any unencumbered monies in the Improvement Fund. An irrevocable letter of credit in the amount of $400 million dollars, was approved for the purpose of making funds readily available for the payment of principal and interest on the Notes.
d) In FY 2010 the County issued its Series 2010 Double-Barreled Aviation Bond (General Obligation), in the aggregate principal amount of $239,775,000. The Series 2010 Bonds are a general obligationof the County, secured by the full faith, credit and taxing power of the County. The Series 2010 Bondsare payable from ad valorem taxes levied on all taxable property in the County, without limitations as torate or amount, to the extent that Net Available Airport Revenues are insufficient to pay debt serviceon the Series 2010 Bonds.
Miami-Dade County Aviation Department
(Unaudited)(In Thousands)
Last 10 Fiscal YearsOutstanding Debt
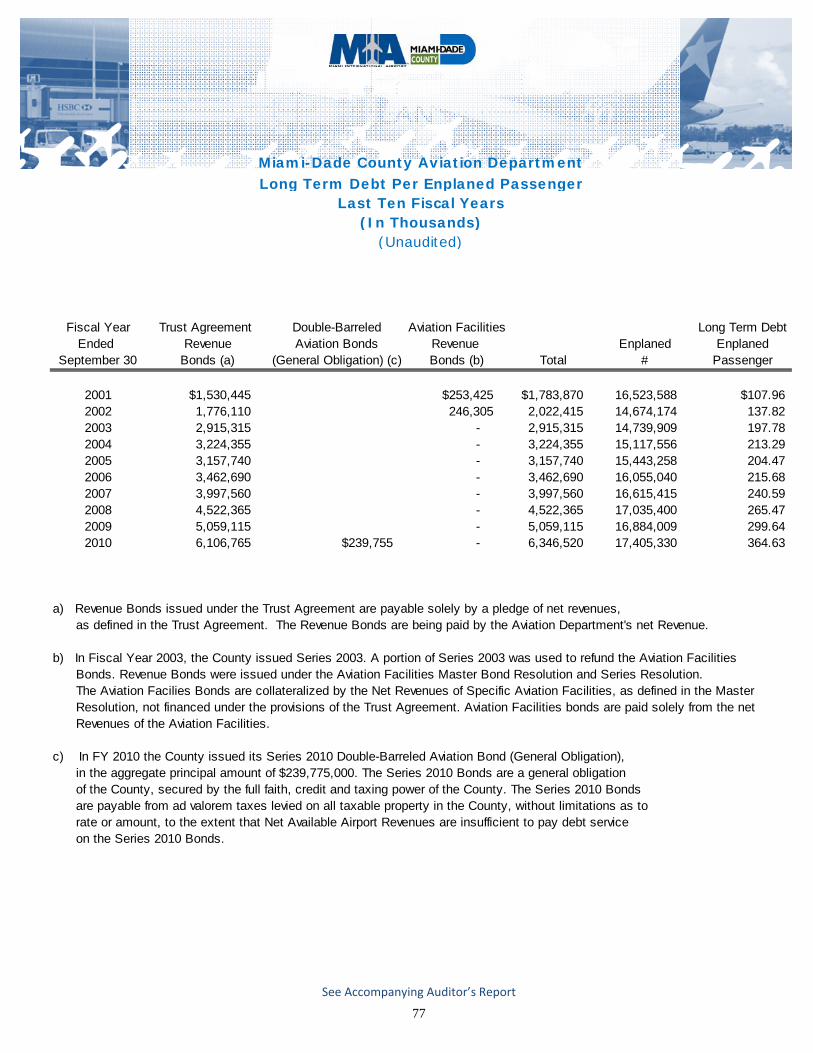
77
See Accompanying Auditor’s Report
Fiscal Year Trust Agreement Double-Barreled Aviation Facilities Long Term DebtEnded Revenue Aviation Bonds Revenue Enplaned Enplaned
September 30 Bonds (a) (General Obligation) (c) Bonds (b) Total # Passenger
2001 $1,530,445 $253,425 $1,783,870 16,523,588 $107.962002 1,776,110 246,305 2,022,415 14,674,174 137.82 2003 2,915,315 - 2,915,315 14,739,909 197.78 2004 3,224,355 - 3,224,355 15,117,556 213.29 2005 3,157,740 - 3,157,740 15,443,258 204.47 2006 3,462,690 - 3,462,690 16,055,040 215.68 2007 3,997,560 - 3,997,560 16,615,415 240.59 2008 4,522,365 - 4,522,365 17,035,400 265.47 2009 5,059,115 - 5,059,115 16,884,009 299.64 2010 6,106,765 $239,755 - 6,346,520 17,405,330 364.63
b) In Fiscal Year 2003, the County issued Series 2003. A portion of Series 2003 was used to refund the Aviation Facilities Bonds. Revenue Bonds were issued under the Aviation Facilities Master Bond Resolution and Series Resolution. The Aviation Facilies Bonds are collateralized by the Net Revenues of Specific Aviation Facilities, as defined in the Master Resolution, not financed under the provisions of the Trust Agreement. Aviation Facilities bonds are paid solely from the net Revenues of the Aviation Facilities.
c) In FY 2010 the County issued its Series 2010 Double-Barreled Aviation Bond (General Obligation), in the aggregate principal amount of $239,775,000. The Series 2010 Bonds are a general obligation of the County, secured by the full faith, credit and taxing power of the County. The Series 2010 Bonds are payable from ad valorem taxes levied on all taxable property in the County, without limitations as to rate or amount, to the extent that Net Available Airport Revenues are insufficient to pay debt service on the Series 2010 Bonds.
a) Revenue Bonds issued under the Trust Agreement are payable solely by a pledge of net revenues, as defined in the Trust Agreement. The Revenue Bonds are being paid by the Aviation Department's net Revenue.
Miami-Dade County Aviation DepartmentLong Term Debt Per Enplaned Passenger
Last Ten Fiscal Years
(Unaudited)(In Thousands)
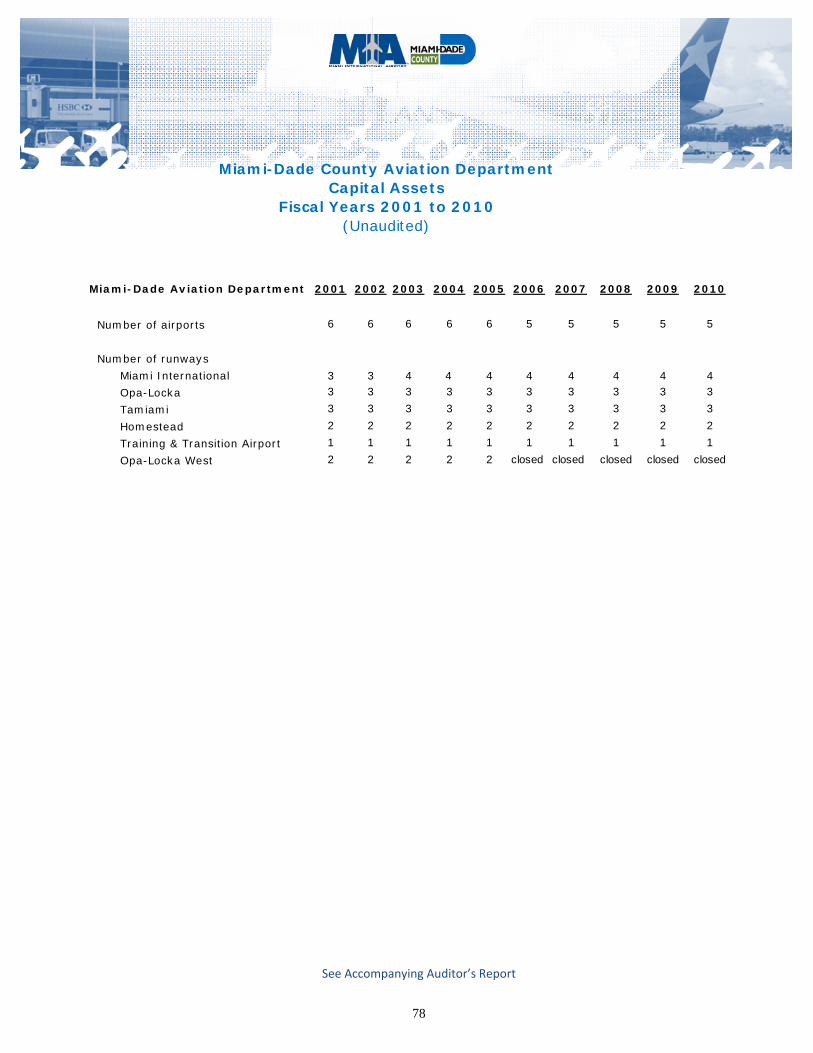
78
See Accompanying Auditor’s Report
Miami-Dade Aviation Department 2001 2002 2003 2004 2005 2006 2007 2008 2009 2010
Number of airports 6 6 6 6 6 5 5 5 5 5
Number of runways
Miami International 3 3 4 4 4 4 4 4 4 4
Opa-Locka 3 3 3 3 3 3 3 3 3 3
Tamiami 3 3 3 3 3 3 3 3 3 3
Homestead 2 2 2 2 2 2 2 2 2 2
Training & Transition Airport 1 1 1 1 1 1 1 1 1 1
Opa-Locka West 2 2 2 2 2 closed closed closed closed closed
Fiscal Years 2001 to 2010(Unaudited)
Miami-Dade County Aviation DepartmentCapital Assets
2010 Comprehensive Annual Financial Report
(This page intentionally left blank)


Miami-Dade Aviation Department
Finance & Strategy Division
P.O. Box 526624
Miami, FL 33152-6624
www.miami-airport.com