Embed Size (px)
Citation preview

Comprehensive Annual
Financial Report
of the
City of Wildwood Board of Education
Cape May County, New Jersey
For the Fiscal Year Ended June 30, 2017
Prepared by
City of Wildwood Board of Education
Finance Office

Page
INTRODUCTORY SECTION:
Letter of Transmittal 1-4Organizational Chart 5Roster of Officials 6Consultants and Advisors 7
FINANCIAL SECTION:
Independent Auditor's Report 8-10
Required Supplementary Information - Part IManagement Discussion and Analysis 11-19
Basic Financial Statements
A District-Wide Financial Statements
A-1 Statement of Net Position 20A-2 Statement of Activities 21
B Fund Financial Statements:
Governmental Funds:B-1 Balance Sheet 22B-2 Statement of Revenues, Expenditures, and
Changes in Fund Balances 23B-3 Reconciliation of the Statement of Revenues, Expenditures, and
Changes in Fund Balances of Governmental Funds to theStatement of Activities 24
Proprietary Funds:B-4 Statement of Net Position 25B-5 Statement of Revenues, Expenses, and
Changes in Fund Net Position 26B-6 Statement of Cash Flows 27
Fiduciary Funds:B-7 Statement of Fiduciary Net Position 28B-8 Statement of Changes in Fiduciary Net Position 29
Notes to the Financial Statements 30-54
TABLE OF CONTENTS
Page
Required Supplementary Information - Part II
C Budgetary Comparison SchedulesC-1 Budgetary Comparison Schedule - General Fund 55-65C-1b Education Jobs Fund Program - Budget to Actual N/AC-2 Budgetary Comparison Schedule - Special Revenue Fund 66-67
Notes to Required Supplementary InformationC-3 Budget to GAAP Reconciliation 68
Required Supplementary Information - Part IIIL-1 Schedule of the District's Proportionate Share of the Net Pension Liability (PERS) 69L-2 Schedule of District's Contributions (PERS) 70L-3 Schedule of the District's Proportionate Share of the Net Pension Liability (TPAF) 71
Other Supplementary Information
E Special Revenue Fund:E-1 Combining Schedule of Revenues and Expenditures -
Special Revenue Fund - Budgetary Basis 72-74E-2 Preschool Education Aid-Budgetary Basis 75
F Capital Projects Fund:F-1 Summary Schedule of Revenues, Expenditures and Changes in Fund Balance 76F-2a Schedule of Revenues, Expenditures and Changes in Fund Balance - ROD Grant 77
G Proprietary Funds:
Enterprise Funds:G-1 Combining Statement of Net Position N/AG-2 Combining Statement of Revenues, Expenses, and
Changes in Fund Net Position N/AG-3 Combining Statement of Cash Flows N/A
Internal Service Fund:G-4 Combining Statement of Net Position N/AG-5 Combining Statement of Revenues, Expenses, and
Changes in Fund Net Position N/AG-6 Combining Statement of Cash Flows N/A
TABLE OF CONTENTS
Page
H Fiduciary Funds:
H-1 Combining Statement of Fiduciary Net Position 78H-2 Combining Statement of Changes in Fiduciary Net Position 79H-3 Student Activity Agency Fund Schedule of Receipts and
Disbursements 80H-4 Payroll Agency Fund Schedule of Receipts and
Disbursements 81
I Long-Term Debt:I-1 Schedule of Serial Bonds N/AI-2 Schedule of Obligations under Capital Leases 82I-3 Debt Service Fund Budgetary Comparison Schedule N/A
STATISTICAL SECTION: (Unaudited)
Financial TrendsJ-1 Net Position by Component 83J-2 Changes in Net Position 84-85J-3 Fund Balances - Governmental Funds 86J-4 Changes in Fund Balances - Governmental Funds 87J-5 General Fund Other Local Revenue by Source 88
Revenue CapacityJ-6 Assessed Value and Estimated Actual Value of Taxable Property 89J-7 Direct and Overlapping Property Taxes 90J-8 Principal Property Taxpayers 91
J-9 Property Tax Levies and Collections 92Debt Capacity
J-10 Ratios of Outstanding Debt by Type 93J-11 Ratios of General Bonded Debt Outstanding 94J-12 Direct and Overlapping Governmental Activities Debt 95J-13 Legal Debt Margin Information 96
Demographic and Economic informationJ-14 Demographic and Economic Statistics 97J-15 Principal Employers 98
Operating informationJ-16 Full-time Equivalent District Employees by Function/Program 99J-17 Operating Statistics 100J-18 School Building Information 101J-19 Schedule of Required Maintenance Expenditures
by School Facility 102J-20 Insurance Schedule 103-104
TABLE OF CONTENTS

Page
SINGLE AUDIT SECTION:
K-1 Independent Auditor's Report - Government Auditing Standards 105-106K-2 Independent Auditor's Report - in accordance with Uniform Guidance and OMB 15-08 107-108K-3 Schedule of Expenditures of Federal Awards, Schedule A 109K-4 Schedule of Expenditures of State Financial Assistance, Schedule B 110K-5 Notes to the Schedules of Awards and Financial Assistance 111-112K-6 Schedule of Findings and Questioned Costs 113-114K-7 Summary Schedule of Prior Audit Findings 115
TABLE OF CONTENTS

Introductory Section


.........
. . . . . . . . . . . . . . . . . . . . . . . . . . . .
CHILDREN FIRST!!!
Wildwood Public Schools
November 27, 2017
Honorable President and Members of the Board of Education City of Wildwood School District County of Cape May, New Jersey
Dear Board Members:
The Comprehensive Annual Financial Report of the City of Wildwood School District for the fiscal year ended June 30, 2017 is hereby submitted. Responsibility for both the accuracy of the data and completeness and fairness of the presentation, including all disclosures, rests with the management of the Board of Education. To the best of our knowledge and belief, the data presented in this report is accurate in all material respects and is reported in a manner designed to present fairly the financial position and results of operations of the various funds of the District. All disclosures necessary to enable the reader to gain an understanding of the District's financial activities have been included.
The Comprehensive Annual Financial Report is presented in four sections: Introductory, Financial, Statistical and Single Audit. The Introductory section includes this transmittal letter, the District's organizational chart and a list of principal officials. The Financial section includes the basic financial statements and schedules, as well as the auditor's report thereon. The Statistical section includes selected financial and demographic information, generally presented on a multi-year basis. The District is required to undergo an annual single audit in conformity with the provisions of the Single Audit Act of 1984 and the U.S. Office of Management and Budget Uniform Guidance, and New Jersey OMB Circular 15-08, Single Audit Policy for Recipients of Federal Grants, State Grants and State Aid Payments. Information related to this Single Audit, including the auditor's report on the internal control structure and compliance with applicable laws and regulations and findings and recommendations, is included in the single audit section of this report.
1. REPORTING ENTITY AND ITS SERVICES:
The City of Wildwood School District is an independent reporting entity within the criteria adopted by the GASB as established by GASB Statement No. 14 as established by NCGA Statement 3. All funds of the District are included in this report. The City of Wildwood Board of Education and all its schools constitute the District's reporting entity.
The District provides a full range of educational services appropriate to grade levels PK through 12. These include regular and vocational, as well as special education for handicappedyoungsters. The District completed the 2016-17 school year with a resident enrollment of 844students, which is 6 students less than the previous year's enrollment. The table on the followingpage details the changes in the student enrollment of the District over the last ten years.
J. Kenyon Kummings, SuperintendentWildwood Public Schools4300 Pacific AvenueWildwood, New Jersey 08260Phone: 609-522-4157 Fax: 609-523-8161
1

November 27, 2017 Page 2
Student PercentFiscal Year Enrollment Change
2016-17 844 -0.7%2015-16 850 -2.2%2014-15 869 3.5%2013-14 840 -1.4%2012-13 852 0.7%2011-12 846 -0.9%2010-11 854 2.0%2009-10 837 -1.1%2008-09 846 8.7%2007-08 778 -1.3%
2. ECONOMIC CONDITION AND OUTLOOK:
The City of Wildwood continues to suffer under the economic down-turn in residential and commercial development and expansion. The growth in development has been stagnant with a real estate market flush with sellers, but not enough buyers. The valuation of property in the city has continued to decline, although at a slower rate, and is hoped to begin a slow rebound in the near future. This coupled with a state-imposed budget cap lower than inflation and significant increases in costs in areas such as health benefits, place increased pressure upon the District’s budget.
The leasing of homes to temporary or transient families has continued, and along with this there has been an increase of special needs students who require specialized support services.
The District continues to cope with overcrowding in both the Pre-K through grade 5 and special education departments resulting in significant costs for leasing classroom space and out-of-district placements.
3. MAJOR INITIATIVES:
The District continues to focus on curricular revision and alignment with the Common Core State Standards, as well as teacher training as a means of improving student performance. The District has developed strategic plans in all areas identified as in need of improvement, and continues to revise these as needed. Understanding that it may take several years to fully implement these methods and for the student scores to reflect these changes, the District continues to support these initiatives and follow through on them through targeted, job embedded professional development.
The District has also expanded its Career and Technical Education (CTE) program offering Culinary Arts and Industrial Arts programs, with plans to expand into additional areas within the next few years. Along with these CTE programs, the District has aligned with Atlantic Cape Community College to offer dual credit courses, allowing students to graduate with up to 27 college credits.
The District’s after-school program, funded through 21st Century Community Learning Center federal grant funding, has been providing a comprehensive program for students in grades 4 through 8 for the past 5 years, including dinner. This program includes activities such as theater, dance, sewing, and cooking. With the upcoming school year, 2017-18, this program is expanding to include grades 3 through 12 through an increase in funding and will offer an extensive variety of learning opportunities for all students.
2
November 27, 2017 Page 3
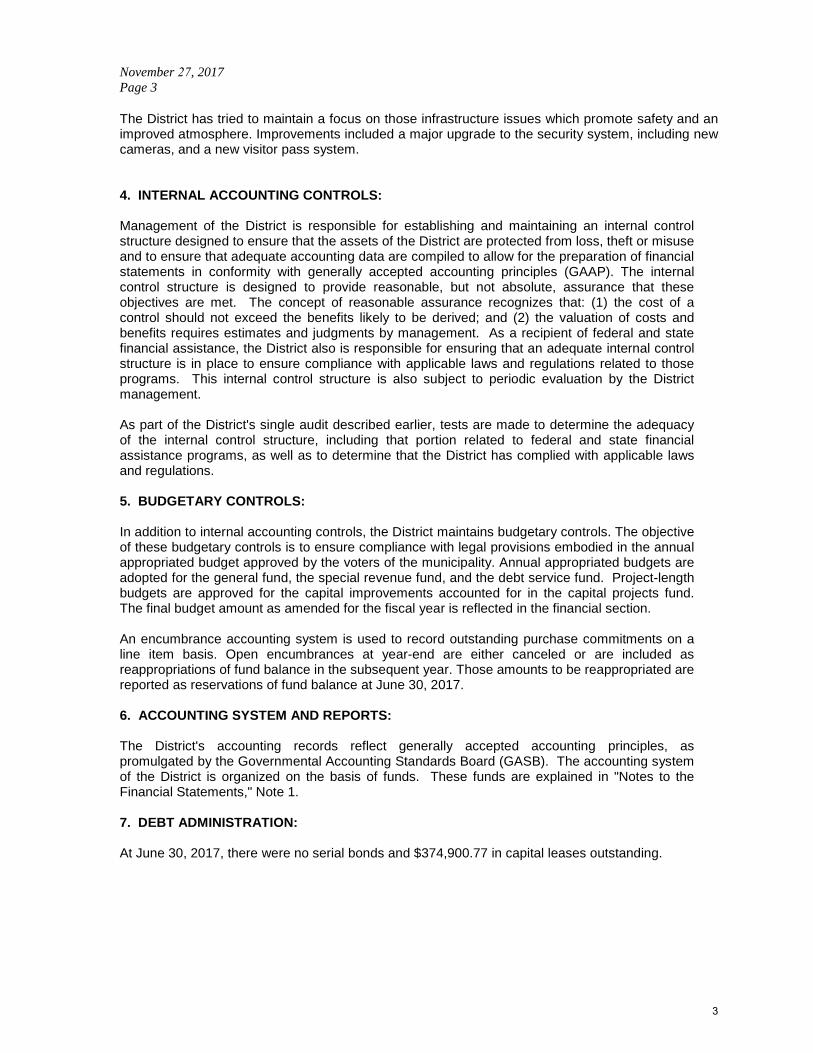
The District has tried to maintain a focus on those infrastructure issues which promote safety and an improved atmosphere. Improvements included a major upgrade to the security system, including new cameras, and a new visitor pass system.
4. INTERNAL ACCOUNTING CONTROLS:
Management of the District is responsible for establishing and maintaining an internal control structure designed to ensure that the assets of the District are protected from loss, theft or misuse and to ensure that adequate accounting data are compiled to allow for the preparation of financial statements in conformity with generally accepted accounting principles (GAAP). The internal control structure is designed to provide reasonable, but not absolute, assurance that these objectives are met. The concept of reasonable assurance recognizes that: (1) the cost of a control should not exceed the benefits likely to be derived; and (2) the valuation of costs and benefits requires estimates and judgments by management. As a recipient of federal and state financial assistance, the District also is responsible for ensuring that an adequate internal control structure is in place to ensure compliance with applicable laws and regulations related to those programs. This internal control structure is also subject to periodic evaluation by the District management.
As part of the District's single audit described earlier, tests are made to determine the adequacy of the internal control structure, including that portion related to federal and state financial assistance programs, as well as to determine that the District has complied with applicable laws and regulations.
5. BUDGETARY CONTROLS:
In addition to internal accounting controls, the District maintains budgetary controls. The objective of these budgetary controls is to ensure compliance with legal provisions embodied in the annual appropriated budget approved by the voters of the municipality. Annual appropriated budgets are adopted for the general fund, the special revenue fund, and the debt service fund. Project-length budgets are approved for the capital improvements accounted for in the capital projects fund. The final budget amount as amended for the fiscal year is reflected in the financial section.
An encumbrance accounting system is used to record outstanding purchase commitments on a line item basis. Open encumbrances at year-end are either canceled or are included as reappropriations of fund balance in the subsequent year. Those amounts to be reappropriated are reported as reservations of fund balance at June 30, 2017.
6. ACCOUNTING SYSTEM AND REPORTS:
The District's accounting records reflect generally accepted accounting principles, as promulgated by the Governmental Accounting Standards Board (GASB). The accounting system of the District is organized on the basis of funds. These funds are explained in "Notes to the Financial Statements," Note 1.
7. DEBT ADMINISTRATION:
At June 30, 2017, there were no serial bonds and $374,900.77 in capital leases outstanding.
3
November 27, 2017 Page 4
8. CASH MANAGEMENT:
The investment policy of the District is guided in large part by state statute as detailed in "Notes to the Financial Statements," Note 2. The District has adopted a cash management plan that requires it to deposit public funds in public depositories protected from loss under the provisions
of the Governmental Unit Deposit Protection Act ("GUDPA"). GUDPA was enacted in 1970 to protect governmental units from a loss of funds on deposit with a failed banking institution in New Jersey. The law requires governmental units to deposit public funds only in public depositories located in New Jersey, where the funds are secured in accordance with the Act.
9. RISK MANAGEMENT:
The Board carries various forms of insurance, including but not limited to general liability, automobile liability and comprehensive/collision, hazard and theft insurance on property and contents, and fidelity bonds.
10. OTHER INFORMATION:
A) Independent Audit - State statutes require an annual audit by independent certified public accountants or registered municipal accountants. The accounting firm of Ford, Scott & Associates, L.L.C., CPAs, was selected by the Board of Education. In addition to meeting the requirements set forth in state statutes, the audit also was designed to meet the requirements of the Single Audit Act of 1984 and the related Budget Uniform Guidance and New Jersey OMB Circular 15-08. The auditor's report on the basic financial statements and combining and individual fund statements and schedules is included in the financial section of this report. The auditor's reports related specifically to the single audit are included in the single audit section of this report.
11. ACKNOWLEDGMENTS:
We would like to express our appreciation to the members of the City of Wildwood School Board for their concern in providing fiscal accountability to the citizens and taxpayers of the school district and thereby contributing their full support to the development and maintenance of our financial operation. The preparation of this report could not have been accomplished without the efficient and dedicated services of our financial and accounting staff.
Respectfully submitted,
J. Kenyon Kummings Martha J. Jamison
J. Kenyon Kummings Martha J. Jamison, CPA Superintendent of Schools Board Secretary/Business Administrator
4
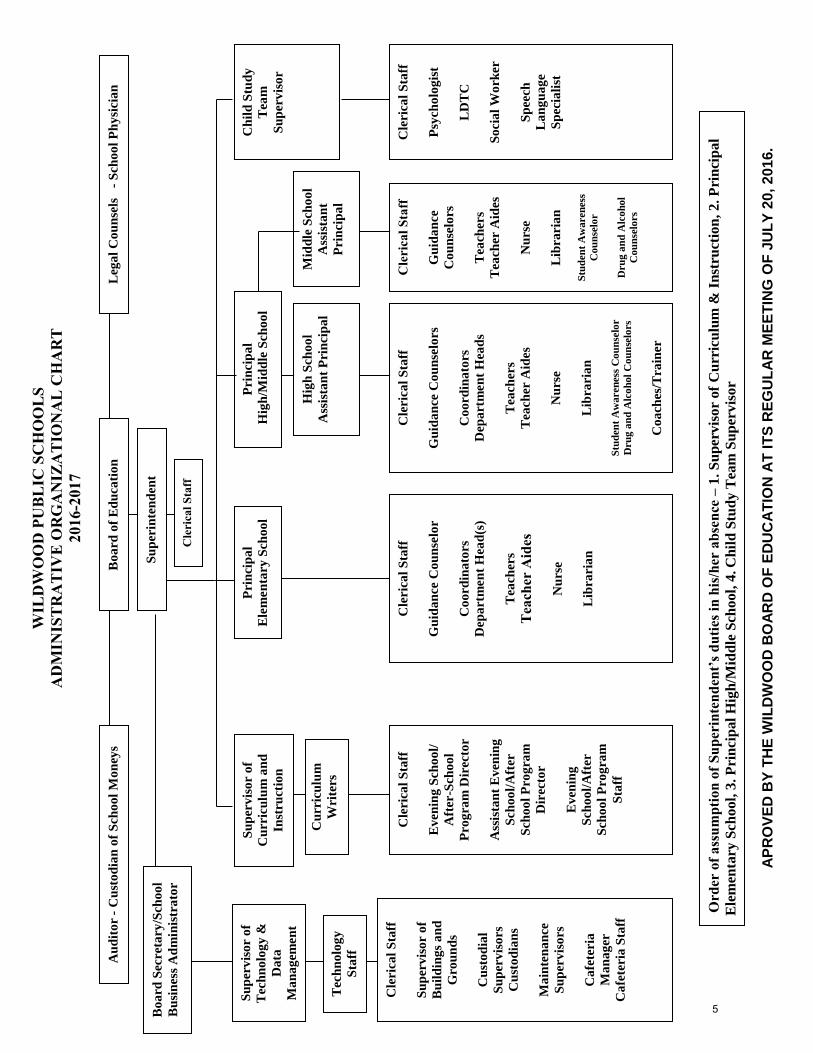
WIL
DW
OO
D P
UB
LIC
SC
HO
OL
S
AD
MIN
IST
RA
TIV
E O
RG
AN
IZA
TIO
NA
L C
HA
RT
2016-2
017
AP
RO
VE
D B
Y T
HE
WIL
DW
OO
D B
OA
RD
OF
ED
UC
AT
ION
AT
IT
S R
EG
UL
AR
ME
ET
ING
OF
JU
LY
20
, 2
016.
Au
dit
or -
Cu
sto
dia
n o
f S
cho
ol
Mo
ney
s B
oa
rd o
f E
du
cati
on
L
ega
l C
ou
nse
ls
- S
cho
ol
Ph
ysi
cia
n
Su
per
inte
nd
ent
Bo
ard
Sec
ret
ary
/Sch
oo
l
Bu
sin
ess
Ad
min
istr
ato
r
Cle
ric
al
Sta
ff
Su
per
vis
or
of
Bu
ild
ing
s a
nd
Gro
un
ds
Cu
sto
dia
l
Su
per
vis
ors
Cu
sto
dia
ns
Ma
inte
na
nce
Su
per
vis
ors
Ca
fete
ria
Ma
na
ger
Ca
fete
ria
Sta
ff
Pri
nci
pa
l
Hig
h/M
idd
le S
cho
ol
Cle
ric
al
Sta
ff
Gu
ida
nce
Co
un
selo
rs
Co
ord
ina
tors
Dep
art
men
t H
ead
s
Tea
cher
s
Tea
cher
Aid
es
Nu
rse
Lib
rari
an
Stu
den
t A
waren
ess
Co
un
selo
r
Dru
g a
nd
Alc
oh
ol
Co
un
selo
rs
Co
ach
es/T
rain
er
Cle
ric
al
Sta
ff
Gu
ida
nce
Co
un
selo
rs
Tea
cher
s
Tea
cher
Aid
es
Nu
rse
Lib
rari
an
Stu
den
t A
waren
ess
Co
un
selo
r
Dru
g a
nd
Alc
oh
ol
Co
un
selo
rs
Ch
ild
Stu
dy
Tea
m
Su
per
vis
or
Cle
ric
al
Sta
ff
Psy
cho
log
ist
LD
TC
So
cia
l W
ork
er
Sp
eech
La
ng
ua
ge
Sp
ecia
list
Ord
er o
f a
ssu
mp
tio
n o
f S
up
erin
ten
den
t’s
du
ties
in
his
/her
ab
sen
ce –
1.
Su
per
vis
or
of
Cu
rric
ulu
m &
In
stru
ctio
n,
2. P
rin
cip
al
Ele
men
tary
Sch
ool,
3. P
rin
cip
al
Hig
h/M
idd
le S
chool,
4. C
hil
d S
tud
y T
eam
Su
per
vis
or
Mid
dle
Sch
oo
l
Ass
ista
nt
Pri
nci
pa
l
Cle
ric
al
Sta
ff
Gu
ida
nce
Co
un
selo
r
Co
ord
ina
tors
Dep
art
men
t H
ead
(s)
Tea
cher
s
Tea
cher
Aid
es
Nu
rse
Lib
rari
an
Su
per
vis
or
of
Cu
rric
ulu
m a
nd
Inst
ruct
ion
Pri
nci
pa
l
Ele
men
tary
Sch
oo
l
Cu
rric
ulu
m
Wri
ters
Cle
ric
al
Sta
ff
Ev
enin
g S
cho
ol/
Aft
er-S
cho
ol
Pro
gra
m D
irec
tor
Ass
ista
nt
Ev
enin
g
Sch
oo
l/A
fter
Sch
oo
l P
rog
ram
Dir
ect
or
Ev
enin
g
Sch
oo
l/A
fter
Sch
oo
l P
rog
ram
Sta
ff
Hig
h S
cho
ol
Ass
ista
nt
Pri
nci
pa
l
Cle
rica
l S
taff
Su
per
vis
or
of
Tec
hn
olo
gy
&
Da
ta
Ma
na
gem
en
t
Tec
hn
olo
gy
Sta
ff
5
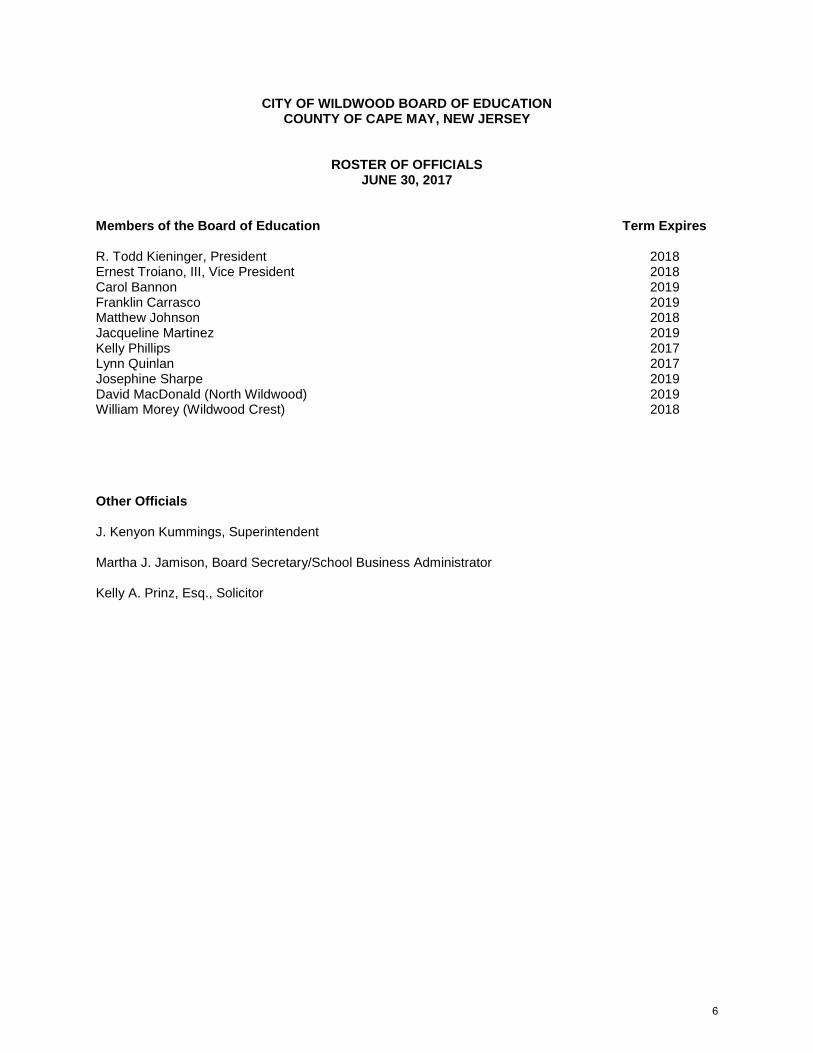
CITY OF WILDWOOD BOARD OF EDUCATION COUNTY OF CAPE MAY, NEW JERSEY
ROSTER OF OFFICIALS JUNE 30, 2017
Members of the Board of Education Term Expires R. Todd Kieninger, President 2018 Ernest Troiano, III, Vice President 2018 Carol Bannon 2019 Franklin Carrasco 2019 Matthew Johnson 2018 Jacqueline Martinez 2019 Kelly Phillips 2017 Lynn Quinlan 2017 Josephine Sharpe 2019 David MacDonald (North Wildwood) 2019 William Morey (Wildwood Crest) 2018 Other Officials J. Kenyon Kummings, Superintendent Martha J. Jamison, Board Secretary/School Business Administrator Kelly A. Prinz, Esq., Solicitor
6

CITY OF WILDWOOD BOARD OF EDUCATION CONSULTANTS AND ADVISORS
AUDIT FIRM
Ford, Scott & Associates, L.L.C. Certified Public Accountants
1535 Haven Avenue Ocean City, NJ 08226-0538
ATTORNEY
Kelli A. Prinz, Esq.
1125 Atlantic Avenue Atlantic City, NJ 08401
RISK MANAGEMENT CONSULTANT
Joseph Meola Byrne Agency
5200 New Jersey Avenue Wildwood, NJ 08260
SCHOOL PHYSICIAN
Richard A. Renza, D.O.
P.O. Box 278 Cape May Court House, NJ 08210
COMPUTER CONSULTANT
Computer Solutions, Inc. 6 Commerce Street, Suite 2
Branchburg, NJ 08876
Pearson 13036 Collection Center Drive
Chicago, Il 60693
OFFICIAL DEPOSITORY
Crest Savings Bank 113 E. Wildwood Avenue
Wildwood, NJ 08260
7

{THIS PAGE IS INTENTIONALLY LEFT BLANK}

Financial Section

Independent Auditor’s Report
The Honorable President and Members of the Board of Education City of Wildwood School District County of Cape May, New Jersey Report on the Financial Statements We have audited the accompanying financial statements of the governmental activities, the business-type activities, each major fund, and the aggregate remaining fund information of the City of Wildwood School District, State of New Jersey, as of and for the year ended June 30, 2017, and the related notes to the financial statements, which collectively comprise the District’s basic financial statements as listed in the table of contents. Management’s Responsibility for the Financial Statements Management is responsible for the preparation and fair presentation of these financial statements in accordance with accounting principles generally accepted in the United States of America; this includes the design, implementation, and maintenance of internal control relevant to the preparation and fair presentation of financial statements that are free from material misstatement, whether due to fraud or error. Auditor’s Responsibility Our responsibility is to express opinions on these financial statements based on our audit. We conducted our audit in accordance with auditing standards generally accepted in the United States of America and the standards applicable to financial audits contained in Government Auditing Standards issued by the Comptroller General of the United States. Those standards require that we plan and perform the audit to obtain reasonable assurance about whether the financial statements are free from material misstatement. An audit involves performing procedures to obtain audit evidence about the amounts and disclosures in the financial statements. The procedures selected depend on the auditor’s judgment, including the assessment of the risks of material misstatement of the financial statements, whether due to fraud or error. In making those risk assessments, the auditor considers internal control relevant to the entity’s preparation and fair presentation of the financial statements in order to design audit procedures that are appropriate in the circumstances, but not for the purpose of expressing and opinion on the effectiveness of the entity’s internal control. Accordingly, we express no such opinion. An audit also includes evaluating the appropriateness of accounting policies used and the reasonableness of significant accounting estimates made by management, as well as evaluating the overall presentation of the financial statements. We believe the audit evidence we have obtained is sufficient and appropriate to provide a basis for our audit opinion.
8
Opinion In our opinion, the financial statements referred to above present fairly, in all material respects, the respective financial position of the governmental activities, the business-type activities, each major fund, and the aggregate remaining fund information of the City of Wildwood School District, in the County of Cape May, State of New Jersey, as of June 30, 2017, and the respective changes in financial position and, where applicable, cash flows thereof for the year then ended in accordance with accounting principles generally accepted in the United States of America. Other Matters Required Supplementary Information Accounting principles generally accepted in the United States of America require that the Required Supplementary Information identified in the table of contents be presented to supplement the basic financial statements. Such information, although not a part of the basic financial statements, is required by the Governmental Accounting Standards Board who considers it to be an essential part of financial reporting for placing the basic financial statements in an appropriate operational, economic, or historical context. We have applied certain limited procedures to the required supplementary information in accordance with auditing standards generally accepted in the United States of America, which consisted of inquiries of management about the methods of preparing the information and comparing the information for consistency with management’s responses to our inquiries, the basic financial statements, and other knowledge we obtained during our audit of the basic financial statements. We do not express an opinion or provide any assurance on the information because the limited procedures do not provide us with sufficient evidence to express an opinion or provide any assurance. Other Information Our audit was conducted for the purpose of forming opinions on the financial statements that collectively comprise the City of Wildwood School District’s basic financial statements. The combining and individual non-major fund financial statements and schedule of expenditures of federal awards, as required by Title 2 U.S. Code of Federal Regulations Part 200, Uniform Administrative Requirements, Cost Principles, and Audit Requirements for Federal Awards (Uniform Guidance), and the schedule of state financial assistance as required by NJ OMB 15-08 and the introductory and statistical sections are presented for purposes of additional analysis and are not a required part of the basic financial statements. The combining and individual non-major fund financial statements, schedule of expenditures of federal awards, as required by Title 2 U.S. Code of Federal Regulations Part 200, Uniform Administrative Requirements, Cost Principles, and Audit Requirements for Federal Awards (Uniform Guidance), the schedule of federal awards and the schedule of state financial assistance as required by NJ OMB 15-08 is the responsibility of management and was derived from and relates directly to the underlying accounting and other records used to prepare the basic financial statements. Such information has been subjected to the auditing procedures applied in the audit of the basic financial statements and certain additional procedures, including comparing and reconciling such information directly to the underlying accounting and other records used to prepare the basic financial statements or to the basic financial statements themselves, and other additional procedures in accordance with auditing standards generally accepted in the United States of America. In our opinion, the combining and individual non-major fund financial statements, schedule of expenditures of federal awards, as required by Title 2 U.S. Code of Federal Regulations Part 200, Uniform Administrative Requirements, Cost Principles, and Audit Requirements for Federal Awards (Uniform Guidance), and the schedule of state financial assistance as required by NJ OMB 15-08 is fairly stated, in all material respects, in relation to the basic financial statements as a whole. The introductory and statistical sections have not been subject to the auditing procedures applied in the audit of the basic financial statements, and accordingly, we do not express an opinion or provide any assurance on it.
9

Other Reporting Required by Government Auditing Standards In accordance with Government Auditing Standards, we have also issued our report dated November 27, 2017 on our consideration of the City of Wildwood School District’s internal control over financial reporting and on our tests of its compliance with certain provisions of laws, regulations, contracts, and grant agreements and other matters. The purpose of that report is to describe the scope of our testing of internal control over financial reporting and compliance and the results of that testing, and not to provide an opinion on internal control over financial reporting or on compliance. That report is an integral part of an audit performed in accordance with Government Auditing Standards in considering Wildwood School District’s internal control over financial reporting and compliance.
Ford, Scott & Associates, L.L.C. FORD, SCOTT & ASSOCIATES, L.L.C. CERTIFIED PUBLIC ACCOUNTANTS
Michael S. Garcia Michael S. Garcia Certified Public Accountant Licensed Public School Accountant No. 2080 November 27, 2017
10

{THIS PAGE IS INTENTIONALLY LEFT BLANK}

REQUIRED SUPPLEMENTARY INFORMATION – PART I

CITY OF WILDWOOD SCHOOL DISTRICT MANAGEMENT’S DISCUSSION AND ANALYSIS FOR THE FISCAL YEAR ENDED JUNE 30, 2017
UNAUDITED The discussion and analysis of the City of Wildwood School District's financial performance provides an overall review of the School District's financial activities for the fiscal year ended June 30, 2017. The intent of this discussion and analysis is to look at the School District's financial performance as a whole; readers should also review the basic financial statements and notes to enhance their understanding of the School District's financial performance. Financial Highlights Key financial highlights for 2017 are as follows:
In total, net position decreased $171,040.55, which represents a 5 percent decrease from 2016. General revenues accounted for $16,308,929.87 in revenue or 60 percent of all revenues.
Program specific revenues in the form of charges for services and operating grants and contributions accounted for $10,758,923.33 or 40 percent of total revenues of $27,067,853.20.
Total assets of governmental activities increased by $59,736.38 as cash and cash equivalents
increased by $268,925.60 and receivables increased by $26,275.25. Capital Assets remained comparable from 2016, decreasing by 113,121.44
The School District had $27,239,327.64 in expenses; only $10,758,923.33 of these expenses was offset by program specific charges for services, grants or contributions. General revenues (primarily taxes) of $16,308,929.87 plus budgeted fund prior fund balance were adequate to provide for these programs.
Among governmental funds, the General Fund had $19,755,803.31 in revenues and
$19,579,880.88 in expenditures. The General Fund's fund balance increased $175,922.43 over 2016.
Using this Comprehensive Annual Financial Report (CAFR) This annual report consists of a series of financial statements and notes to those statements. These statements are organized so the reader can understand the City of Wildwood School District as a financial whole, an entire operating entity. The statements then proceed to provide an increasingly detailed look at specific financial activities. The Statement of Net Position and Statement of Activities provide information about the activities of the whole School district, presenting both an aggregate view of the School district's finances and a longer-term view of those finances. Fund financial statements provide the next level of detail. For governmental funds, these statements tell how services were financed in the short-term as well as what remains for future spending. The fund financial statements also look at the School district's most significant funds with all other non-major funds presented in total in one column. In the case of the City of Wildwood School District, the General Fund is by far the most significant fund.
11
CITY OF WILDWOOD SCHOOL DISTRICT MANAGEMENT’S DISCUSSION AND ANALYSIS FOR THE FISCAL YEAR ENDED JUNE 30, 2017
UNAUDITED Reporting the School District as a Whole Statement of Net Position and the Statement of Activities While this document contains the large number of funds used by the School District to provide programs and activities, the view of the School District as a whole looks at all financial transactions and asks the question, "How did we do financially during 2017?" The Statement of Net Position and the Statement of Activities answers this question. These statements include all assets and liabilities using the accrual basis of accounting similar to the accounting used by most private-sector businesses. This basis of accounting takes into account all of the current year's revenues and expenses regardless of when cash is received or paid. These two statements report the School District's net position and changes in net position. This change in net position is important because it tells the reader that, for the school district as a whole, the financial position of the School district has improved or diminished. The causes of this change may be the result of many factors, some financial and some not. Non-financial factors include the School District's property tax base, current laws in New Jersey restricting revenue growth, facility condition, required educational programs, and other factors. In the Statement of Net Position and the Statement of Activities, the School District is divided into two distinct kinds of activities:
Governmental Activities - All of the School District's programs and services are reported here including instruction, support services, operation and maintenance of plant facilities, pupil transportation, and extracurricular activities.
Business-Type Activity - This service is provided on a charge for goods or services basis to
recover all the expenses of the goods or services provided. The Food Service enterprise fund is reported as a business activity.
Reporting the School District's Most Significant Funds Fund Financial Statements Fund financial reports provide detailed information about the School District's funds. The School District uses many funds to account for a multitude of financial transactions. The School District's governmental funds are the General Fund, Special Revenue Fund and Capital Projects Fund. Governmental Funds The School District's activities are reported in governmental funds, which focus on how money flows into and out of those funds and the balances left at year-end available for spending in the future years. These funds are reported using an accounting method called modified accrual accounting, which measures cash and all other financial assets that can readily be converted to cash. The governmental fund statements provide a detailed short-term view of the School district's general government operations and the basic services it provides. Governmental fund information helps the reader determine whether there are more or fewer financial resources that can be spent in the near future to finance educational programs. The relationship (or differences) between governmental activities (reported in the Statement of Net Position and the Statement of Activities) and governmental funds is reconciled in the financial statements.
12

CITY OF WILDWOOD SCHOOL DISTRICT MANAGEMENT’S DISCUSSION AND ANALYSIS FOR THE FISCAL YEAR ENDED JUNE 30, 2017
UNAUDITED Enterprise Fund The enterprise fund uses the same basis of accounting as business-type activities; therefore, these statements are essentially the same. Notes to the Financial Statements The notes provide additional information that is essential to a full understanding of the data provided in the district-wide and fund financial statements. The Notes to the Financial Statements can be found in this report as shown in the table of contents. The School District as a Whole Recall that the Statement of Net Position provides the perspective of the School District as a whole. Net Position may serve over time as a useful indicator of a government's financial position. The District's financial position is the product of several financial transactions including the net results of activities, the acquisition and payment of debt, the acquisition and disposal of capital assets, and the depreciation of capital assets. In 2017, net position was restated as required by implementation of GASB 68. Table 1 provides a summary of the School District's net position for 2017 and 2016.
Table 1
Net Position
2017 2016Assets
Current and Other Assets $ 4,783,731.28 4,510,649.65 Capital Assets 5,299,454.17 5,414,668.74
Total Assets 10,083,185.45 9,925,318.39
LiabilitiesLong-Term Liabilities 8,085,361.62 6,233,793.49 Other Liabilities 576,657.36 561,973.15
Total Liabilities 8,662,018.98 6,795,766.64
Net PositionInvested in Capital Assets, Net of Debt 4,660,539.60 4,846,608.73 Restricted 3,964,595.38 3,589,949.23 Unrestricted (5,111,386.51) (4,751,768.94) Total Net Position $ 3,513,748.47 3,684,789.02
The District's combined net position was $3,513,748.47 on June 30, 2017. This is a decrease of 5 percent from the prior year.
13
CITY OF WILDWOOD SCHOOL DISTRICT MANAGEMENT’S DISCUSSION AND ANALYSIS FOR THE FISCAL YEAR ENDED JUNE 30, 2017
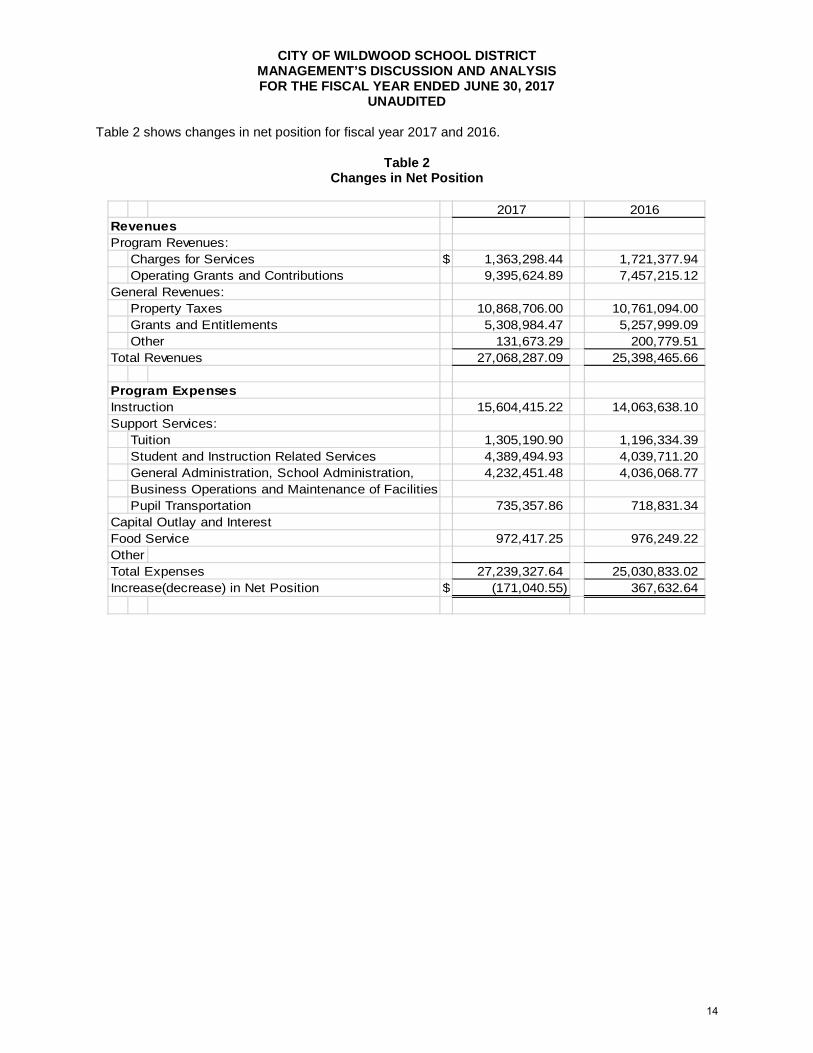
UNAUDITED Table 2 shows changes in net position for fiscal year 2017 and 2016.
Table 2
Changes in Net Position
2017 2016RevenuesProgram Revenues:
Charges for Services $ 1,363,298.44 1,721,377.94 Operating Grants and Contributions 9,395,624.89 7,457,215.12
General Revenues:Property Taxes 10,868,706.00 10,761,094.00 Grants and Entitlements 5,308,984.47 5,257,999.09 Other 131,673.29 200,779.51
Total Revenues 27,068,287.09 25,398,465.66
Program ExpensesInstruction 15,604,415.22 14,063,638.10 Support Services:
Tuition 1,305,190.90 1,196,334.39 Student and Instruction Related Services 4,389,494.93 4,039,711.20 General Administration, School Administration, 4,232,451.48 4,036,068.77 Business Operations and Maintenance of FacilitiesPupil Transportation 735,357.86 718,831.34
Capital Outlay and InterestFood Service 972,417.25 976,249.22 OtherTotal Expenses 27,239,327.64 25,030,833.02 Increase(decrease) in Net Position $ (171,040.55) 367,632.64
14
CITY OF WILDWOOD SCHOOL DISTRICT MANAGEMENT’S DISCUSSION AND ANALYSIS FOR THE FISCAL YEAR ENDED JUNE 30, 2017
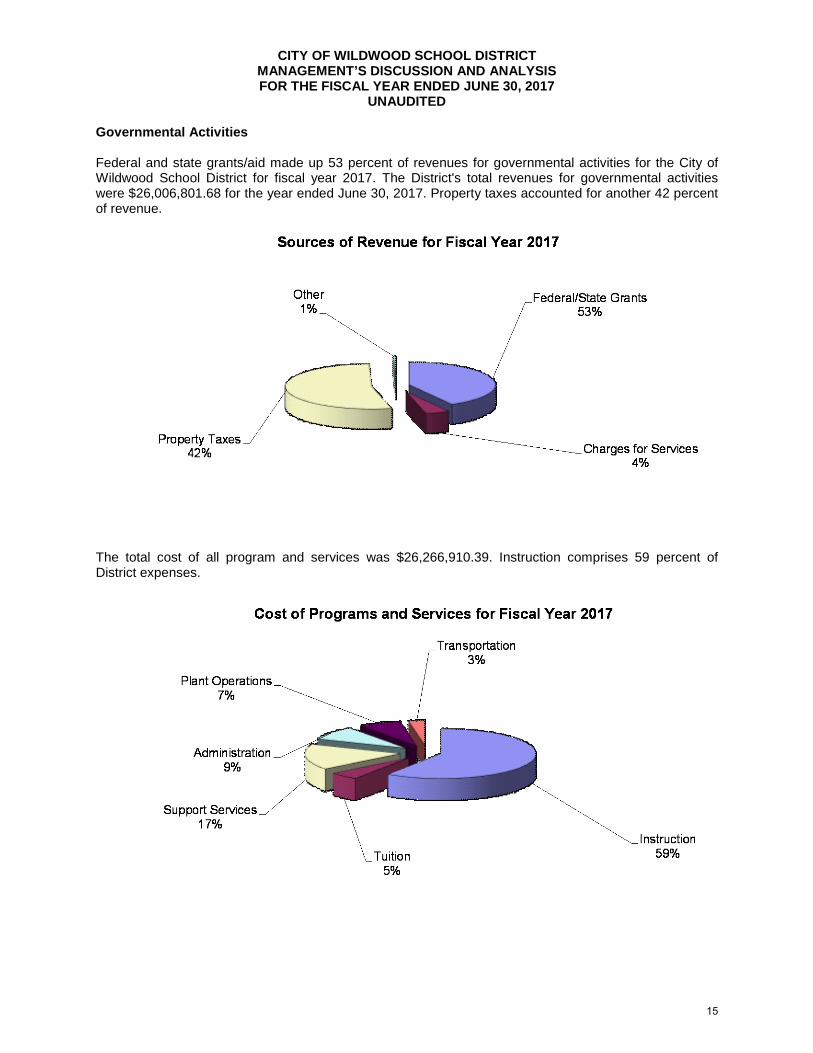
UNAUDITED Governmental Activities Federal and state grants/aid made up 53 percent of revenues for governmental activities for the City of Wildwood School District for fiscal year 2017. The District's total revenues for governmental activities were $26,006,801.68 for the year ended June 30, 2017. Property taxes accounted for another 42 percent of revenue.
The total cost of all program and services was $26,266,910.39. Instruction comprises 59 percent of District expenses.
15
CITY OF WILDWOOD SCHOOL DISTRICT MANAGEMENT’S DISCUSSION AND ANALYSIS FOR THE FISCAL YEAR ENDED JUNE 30, 2017
UNAUDITED Business-Type Activities Revenues for the District's business-type activities (food service program) were comprised of charges for services and federal and state reimbursements.
Food service revenues exceeded expenses by $89,068.16.
Charges for services represent $196,864.88 of revenue. This represents amounts paid by patrons for daily food service and special functions.
Federal and state reimbursement for meals, including payments for free and reduced lunches and
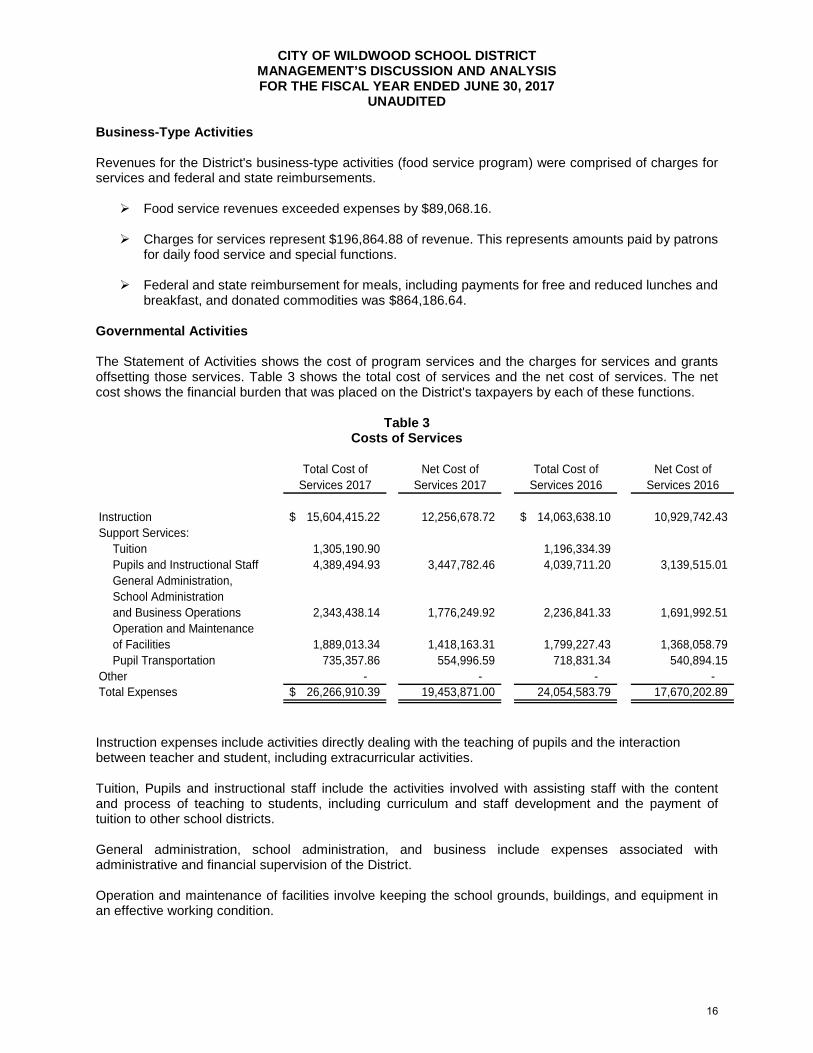
breakfast, and donated commodities was $864,186.64. Governmental Activities The Statement of Activities shows the cost of program services and the charges for services and grants offsetting those services. Table 3 shows the total cost of services and the net cost of services. The net cost shows the financial burden that was placed on the District's taxpayers by each of these functions.
Table 3 Costs of Services
Total Cost of Net Cost of Total Cost of Net Cost of
Services 2017 Services 2017 Services 2016 Services 2016
Instruction 15,604,415.22$ 12,256,678.72 14,063,638.10$ 10,929,742.43 Support Services:
Tuition 1,305,190.90 1,196,334.39 Pupils and Instructional Staff 4,389,494.93 3,447,782.46 4,039,711.20 3,139,515.01 General Administration,School Administration and Business Operations 2,343,438.14 1,776,249.92 2,236,841.33 1,691,992.51 Operation and Maintenance of Facilities 1,889,013.34 1,418,163.31 1,799,227.43 1,368,058.79 Pupil Transportation 735,357.86 554,996.59 718,831.34 540,894.15
Other - - - - Total Expenses 26,266,910.39$ 19,453,871.00 24,054,583.79 17,670,202.89
Instruction expenses include activities directly dealing with the teaching of pupils and the interaction between teacher and student, including extracurricular activities. Tuition, Pupils and instructional staff include the activities involved with assisting staff with the content and process of teaching to students, including curriculum and staff development and the payment of tuition to other school districts. General administration, school administration, and business include expenses associated with administrative and financial supervision of the District. Operation and maintenance of facilities involve keeping the school grounds, buildings, and equipment in an effective working condition.
16
CITY OF WILDWOOD SCHOOL DISTRICT MANAGEMENT’S DISCUSSION AND ANALYSIS FOR THE FISCAL YEAR ENDED JUNE 30, 2017
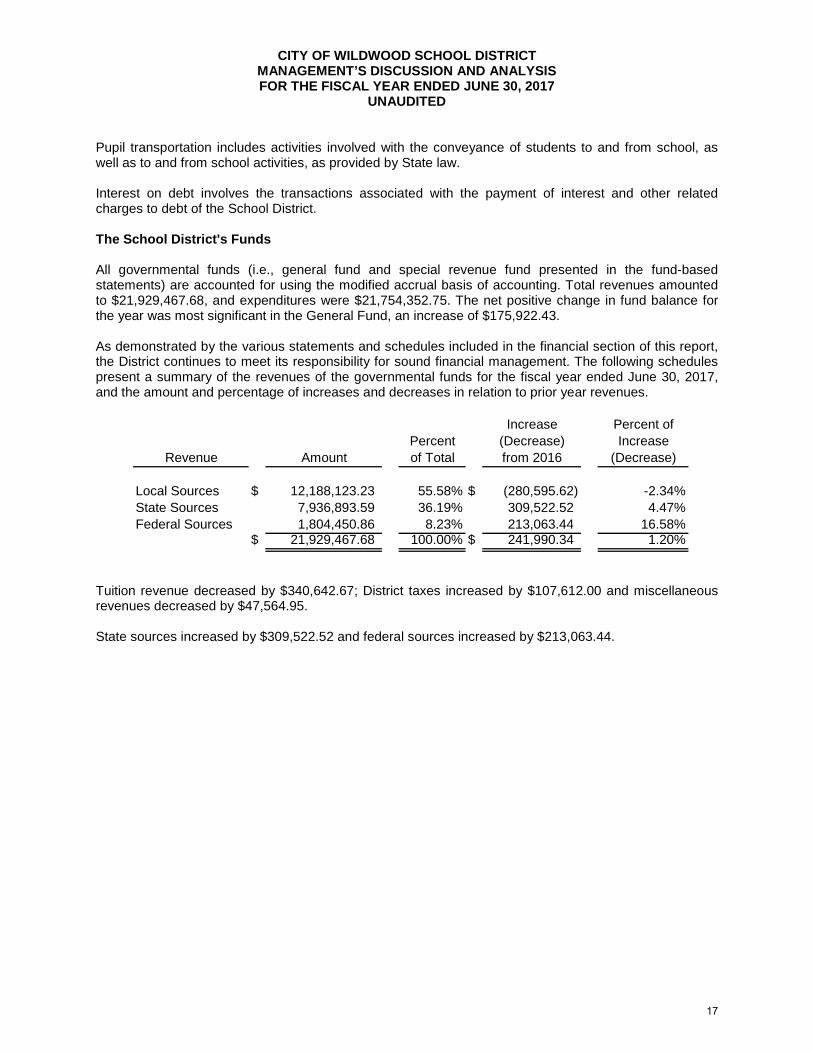
UNAUDITED Pupil transportation includes activities involved with the conveyance of students to and from school, as well as to and from school activities, as provided by State law. Interest on debt involves the transactions associated with the payment of interest and other related charges to debt of the School District. The School District's Funds All governmental funds (i.e., general fund and special revenue fund presented in the fund-based statements) are accounted for using the modified accrual basis of accounting. Total revenues amounted to $21,929,467.68, and expenditures were $21,754,352.75. The net positive change in fund balance for the year was most significant in the General Fund, an increase of $175,922.43. As demonstrated by the various statements and schedules included in the financial section of this report, the District continues to meet its responsibility for sound financial management. The following schedules present a summary of the revenues of the governmental funds for the fiscal year ended June 30, 2017, and the amount and percentage of increases and decreases in relation to prior year revenues.
Increase Percent ofPercent (Decrease) Increase
Revenue Amount of Total from 2016 (Decrease)
Local Sources $ 12,188,123.23 55.58% $ (280,595.62) -2.34%State Sources 7,936,893.59 36.19% 309,522.52 4.47%Federal Sources 1,804,450.86 8.23% 213,063.44 16.58%
$ 21,929,467.68 100.00% $ 241,990.34 1.20%
Tuition revenue decreased by $340,642.67; District taxes increased by $107,612.00 and miscellaneous revenues decreased by $47,564.95. State sources increased by $309,522.52 and federal sources increased by $213,063.44.
17

CITY OF WILDWOOD SCHOOL DISTRICT MANAGEMENT’S DISCUSSION AND ANALYSIS FOR THE FISCAL YEAR ENDED JUNE 30, 2017
UNAUDITED The following schedule presents a summary of general fund, special revenue fund, and debt service fund expenditures for the fiscal year ended June 30, 2017.
Increase Percent ofPercent (Decrease) Increase
Expenditures Amount of Total from 2016 (Decrease)
Current Expense: Instruction $ 7,412,918.76 37.86% (1,170,432.77) -15.79% Undistributed Expenditures 11,840,886.39 60.47% (169,718.03) -1.43%Capital Outlay 326,075.73 1.67% (218,665.36) -67.06%
$ 19,579,880.88 100.00% (1,558,816.16) -7.96%
Changes in expenditures were the results of varying factors. Instructional expenses decreased specifically in the areas of regular and special education instruction. Capital Outlay was less than prior years because most ongoing projects have been completed. The School District's budget is prepared according to New Jersey law, and is based on accounting for certain transactions on a basis of cash receipts, disbursements, and encumbrances. The most significant budgeted fund is the General Fund. Capital Assets At the end of the fiscal year 2017, the School District had $5,299,454.15 invested in land, building, furniture and equipment and vehicles. Table 4 shows fiscal year 2017 balances compared to 2016.
Table 4 Capital Assets (Net of Depreciation) at June 30,
2017 2016
Land $ 205,000.00 205,000.00 Construction in Progress - - Land Improvements 17,600.00 19,200.00 Buildings and Improvements 4,775,904.80 4,868,183.00 Machinery and Equipment 274,088.38 291,238.65 Licensed Vehicles 26,860.97 31,047.09 Total $ 5,299,454.15 5,414,668.74
Overall capital assets decreased $115,214.59 from fiscal year 2016 to fiscal year 2017.
18

CITY OF WILDWOOD SCHOOL DISTRICT MANAGEMENT’S DISCUSSION AND ANALYSIS FOR THE FISCAL YEAR ENDED JUNE 30, 2017
UNAUDITED Debt Administration At June 30, 2017, the School District had $636,386.62 of outstanding debt.
Table 5 Outstanding Debt at June 30
2017 2016
Leases of Capital Assets $ 374,900.77 564,076.13 Compensated Absences 261,485.85 264,877.36 Total $ 636,386.62 828,953.49
For the Future The Wildwood School District is presently in adequate financial condition. The School District is proud that community support of the schools have continued to grow. However, future finances are not without challenges as the community continues to grow and change in the midst of a general down-turn in the state’s economy and the nation’s real estate market, which has traditionally been a large part of the city’s economic health. As the slow-down in new building and new businesses continues in the City of Wildwood, student population and funding could be affected. In conclusion, the Wildwood School District has committed itself to serving the needs of all of its students and recognizes that financial excellence is necessary to fulfill that promise. In addition, the School District's system for financial planning, budgeting, and internal financial controls continues to be reviewed, assessed, and strengthened in order to meet the many challenges of the present and future. Contacting the School District's Management This financial report is designed to provide our citizens, taxpayers, investors, and creditors with a general overview of the School District's finances and to show the School District's accountability for the money it receives. If you have questions about this report or need additional information, contact the Business Administration/Board Secretary at the City of Wildwood Board of Education, 4300 Pacific Avenue, Wildwood, New Jersey 08260.
19

{THIS PAGE IS INTENTIONALLY LEFT BLANK}
BASIC FINANCIAL STATEMENTS


DISTRICT-WIDE FINANCIAL STATEMENTS
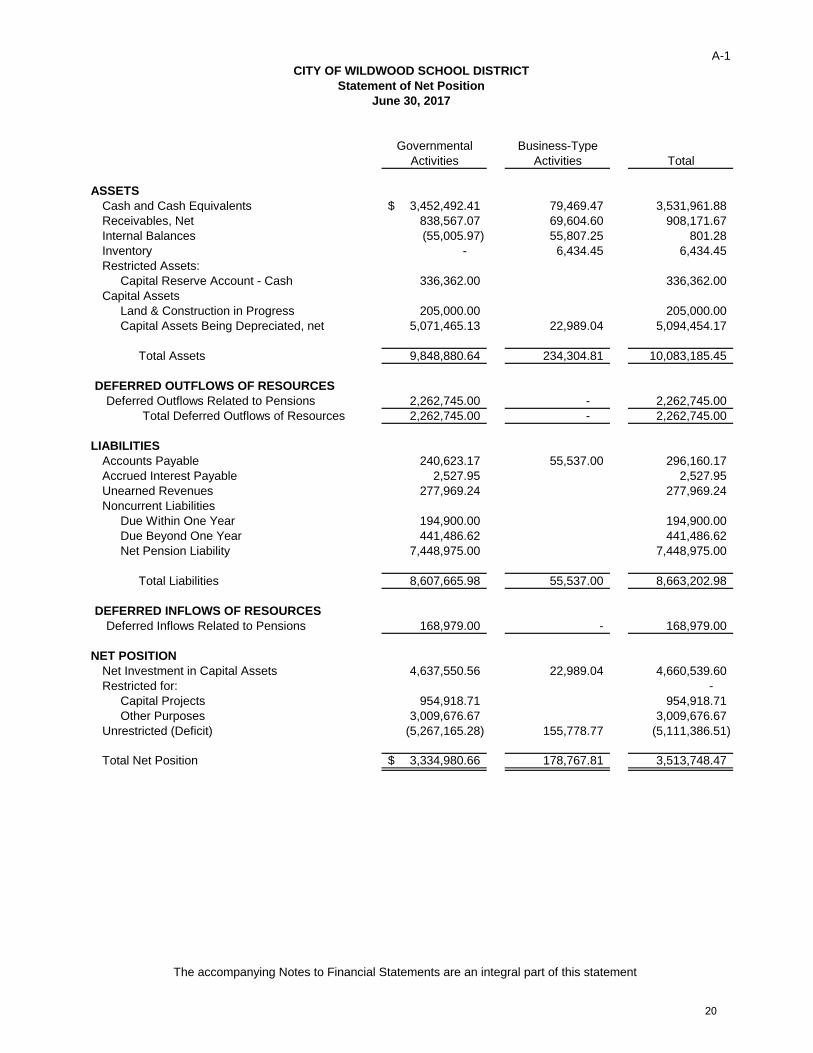
The statement of net position and the statement of activities display information about the District. These statements include the financial activities of the overall District, except for fiduciary activities. Eliminations have been made to minimize the double-counting of internal activities. These statements distinguish between the governmental and business-type activities of the District.

The accompanying Notes to Financial Statements are an integral part of this statement
A-1
Governmental Business-TypeActivities Activities Total
ASSETSCash and Cash Equivalents 3,452,492.41$ 79,469.47 3,531,961.88 Receivables, Net 838,567.07 69,604.60 908,171.67 Internal Balances (55,005.97) 55,807.25 801.28 Inventory - 6,434.45 6,434.45 Restricted Assets:
Capital Reserve Account - Cash 336,362.00 336,362.00 Capital Assets
Land & Construction in Progress 205,000.00 205,000.00 Capital Assets Being Depreciated, net 5,071,465.13 22,989.04 5,094,454.17
Total Assets 9,848,880.64 234,304.81 10,083,185.45
DEFERRED OUTFLOWS OF RESOURCESDeferred Outflows Related to Pensions 2,262,745.00 - 2,262,745.00
Total Deferred Outflows of Resources 2,262,745.00 - 2,262,745.00
LIABILITIESAccounts Payable 240,623.17 55,537.00 296,160.17 Accrued Interest Payable 2,527.95 2,527.95 Unearned Revenues 277,969.24 277,969.24 Noncurrent Liabilities
Due Within One Year 194,900.00 194,900.00 Due Beyond One Year 441,486.62 441,486.62 Net Pension Liability 7,448,975.00 7,448,975.00
Total Liabilities 8,607,665.98 55,537.00 8,663,202.98
DEFERRED INFLOWS OF RESOURCESDeferred Inflows Related to Pensions 168,979.00 - 168,979.00
NET POSITIONNet Investment in Capital Assets 4,637,550.56 22,989.04 4,660,539.60 Restricted for: -
Capital Projects 954,918.71 954,918.71 Other Purposes 3,009,676.67 3,009,676.67
Unrestricted (Deficit) (5,267,165.28) 155,778.77 (5,111,386.51)
Total Net Position 3,334,980.66$ 178,767.81 3,513,748.47
Statement of Net PositionCITY OF WILDWOOD SCHOOL DISTRICT
June 30, 2017
20

The
acco
mpa
nyin
g N
otes
to F
inan
cial
Sta
tem
ents
are
an
inte
gral
par
t of t
his
Stat
emen
t
A-2
Ope
ratin
gC
apita
lC
harg
es fo
rG
rant
s an
dG
rant
s an
dG
over
nmen
tal
Busi
ness
-Typ
eFu
nctio
n/Pr
ogra
ms
Expe
nses
Allo
catio
nSe
rvic
esC
ontri
butio
nsC
ontri
butio
nsAc
tiviti
esAc
tiviti
esTo
tal
Gov
ernm
enta
l Act
iviti
es:
Inst
ruct
ion:
Reg
ular
6,28
6,92
7.78
$
1,
717,
184.
40
1,16
6,43
3.56
2,34
3,24
2.72
-
(4,4
94,4
35.9
0)
-
(4,4
94,4
35.9
0)
Spec
ial E
duca
tion
4,20
8,63
3.25
1,
149,
527.
99
3,03
8,21
8.52
(2,3
19,9
42.7
2)
(2,3
19,9
42.7
2)
Oth
er In
stru
ctio
n1,
761,
117.
69
481,
024.
11
65
6,39
7.90
(1
,585
,743
.90)
(1
,585
,743
.90)
Su
ppor
t Ser
vice
s:-
Tu
ition
1,30
5,19
0.90
(1
,305
,190
.90)
(1
,305
,190
.90)
St
uden
t & In
stru
ctio
n R
elat
ed S
ervi
ces
3,44
7,78
2.46
94
1,71
2.47
1,98
9,11
9.54
(2,4
00,3
75.3
9)
(2,4
00,3
75.3
9)
Scho
ol A
dmin
istra
tive
Serv
ices
820,
998.
30
26
1,94
4.67
108,
454.
16
(974
,488
.81)
(974
,488
.81)
Plan
t Ope
ratio
n an
d M
aint
enan
ce1,
418,
163.
31
470,
850.
03
19
4,94
8.21
(1
,694
,065
.13)
(1
,694
,065
.13)
Pu
pil T
rans
porta
tion
554,
996.
59
18
0,36
1.27
74,6
75.8
1
(6
60,6
82.0
5)
(6
60,6
82.0
5)
G
ener
al a
nd B
usin
ess
Serv
ices
955,
251.
62
30
5,24
3.55
126,
381.
39
(1,1
34,1
13.7
8)
(1,1
34,1
13.7
8)
Una
lloca
ted
Bene
fits
5,50
7,84
8.49
(5
,507
,848
.49)
-
-
Cap
ital O
utla
y-
-
-
Tota
l Gov
ernm
enta
l Act
iviti
es26
,266
,910
.39
-
1,
166,
433.
56
8,
531,
438.
25
-
(1
6,56
9,03
8.58
)
-
(1
6,56
9,03
8.58
)
Busi
ness
-Typ
e Ac
tiviti
es:
Food
Ser
vice
972,
417.
25
19
6,86
4.88
86
4,18
6.64
88
,634
.27
88,6
34.2
7
Tota
l Bus
ines
s-Ty
pe A
ctiv
ities
972,
417.
25
-
196,
864.
88
864,
186.
64
-
-
88
,634
.27
88,6
34.2
7
Tota
l Prim
ary
Gov
ernm
ent
27,2
39,3
27.6
4$
-
1,36
3,29
8.44
9,39
5,62
4.89
-
(16,
569,
038.
58)
88,6
34.2
7
(1
6,48
0,40
4.31
)
Gen
eral
Rev
enue
s:Ta
xes:
Prop
erty
Tax
es, L
evie
d fo
r Gen
eral
Pur
pose
s, N
et10
,868
,706
.00
$
-
10,8
68,7
06.0
0
Fede
ral a
nd S
tate
Aid
not
Res
trict
ed5,
308,
984.
47
5,30
8,98
4.47
In
vest
men
t Ear
ning
s-
433.
89
433.
89
Mis
cella
neou
s In
com
e13
1,23
9.40
131,
239.
40
Sp
ecia
l Ite
ms:
Tran
sfer
s-
-
-
Tota
l Gen
eral
Rev
enue
s, S
peci
al It
ems,
Ext
raor
dina
ry It
ems
and
Tran
sfer
s16
,308
,929
.87
433.
89
16,3
09,3
63.7
6
Cha
nge
in N
et P
ositi
on(2
60,1
08.7
1)
89
,068
.16
(171
,040
.55)
Net
Pos
ition
- Be
ginn
ing
3,59
5,08
9.37
89
,699
.65
3,68
4,78
9.02
Net
Pos
ition
- En
ding
3,33
4,98
0.66
$
17
8,76
7.81
3,
513,
748.
47
Net
(Exp
ense
) Rev
enue
and
Cha
nges
in N
et P
ositi
onPr
ogra
m R
even
ue
CIT
Y O
F W
ILD
WO
OD
SC
HO
OL
DIS
TRIC
TSt
atem
ent o
f Act
iviti
esFo
r the
Yea
r End
ed J
une
30, 2
017
21

FUND FINANCIAL STATEMENTS
The individual fund financial statements present more detailed information for the individual funds in a format that segregates information by fund type.


The accompanying Notes to Financial Statements are an integral part of this Statement
B-1
Special Capital TotalGeneral Revenue Projects Governmental
Fund Fund Fund FundsASSETS
Cash and Cash Equivalents 3,432,540.66$ 19,951.75 3,452,492.41 Receivables from Other Governments 153,270.11 555,628.00 129,668.96 838,567.07 Interfunds Receivable 100,348.77 100,348.77 Restricted Cash & Cash Equivalents 336,362.00 336,362.00
Total Assets 4,022,521.54 555,628.00 149,620.71 4,727,770.25
LIABILITIES AND FUND BALANCESLiabilities:
Accounts Payable 77,513.15 163,110.02 240,623.17 Payable to Other Governments - 1,184.00 1,184.00 Interfunds Payable - 155,354.74 155,354.74 Unearned Revenues 277,969.24 277,969.24
Total Liabilities 77,513.15 597,618.00 - 675,131.15
Fund Balances:Restricted Fund Balance:
Excess Surplus 1,113,140.75 1,113,140.75 Excess Surplus - Designated for Subsequent
Year's Expenditures 1,145,535.92 1,145,535.92 Capital Projects 149,620.71 149,620.71
Committed Fund Balance:Maintenance Reserve 501,000.00 501,000.00 Capital Reserve 805,298.00 805,298.00 Emergency Reserve 250,000.00 250,000.00 Designated for Subsequent Years Expenditures 199,516.08 199,516.08
Assigned to:Encumbrances -
UnassignedGeneral Fund (69,482.36) (69,482.36) Special Revenue Fund (41,990.00) (41,990.00)
Total Fund Balances 3,945,008.39 (41,990.00) 149,620.71 4,052,639.10
Total Liabilities and Fund Balances 4,022,521.54$ 555,628.00 149,620.71
Amounts reported for governmental activities in the statement ofNet Position (A-1) are different because:
Capital Assets used in governmental activities are not financial resources and therefore are not reported in the funds. The cost of the assets is $11,002,433.05 and the accumulated depreciation is $5,725,967.92. 5,276,465.13
Pension Liabilities Net of Deferred Outflows & Inflows (5,355,209)
Accrued interest payments on long-term liabilities are not due andpayable in the current period and therefore are not reportedin the funds. (2,527.95)
Long-term liabilities are not due and payable in the current period and therefore are not reported as liabilities in the funds. (636,386.62)
3,334,980.66$
Governmental FundsBalance Sheet
CITY OF WILDWOOD SCHOOL DISTRICT
June 30, 2017
22

The accompanying Notes to Financial Statements are an integral part of this Statement
B-2
Special Capital TotalGeneral Revenue Projects Governmental
Fund Fund Fund FundsREVENUES
Local Sources:Local Tax Levy 10,868,706.00$ 10,868,706.00 Tuition Charges 1,166,433.56 1,166,433.56 Miscellaneous 131,239.40 21,744.27 152,983.67
Total Local Sources 12,166,378.96 21,744.27 - 12,188,123.23 State Sources 7,524,185.38 412,708.21 - 7,936,893.59 Federal Sources 65,238.97 1,739,211.89 1,804,450.86
Total Revenues 19,755,803.31 2,173,664.37 - 21,929,467.68
EXPENDITURESCurrent:
Regular Instruction 4,556,599.22 4,556,599.22 Special Education Instruction 1,579,907.95 1,470,398.29 3,050,306.24 Other Instructional Programs 1,276,411.59 1,276,411.59 Support Services:
Tuition 1,305,190.90 1,305,190.90 Student & Instruction Related Serv. 1,794,788.09 704,073.58 2,498,861.67 School Administrative Services 695,077.87 695,077.87 Other Administrative Services 809,972.73 809,972.73 Plant Operation and Maintenance 1,249,414.38 1,249,414.38 Pupil Transportation 478,593.93 478,593.93 Employee Benefits 5,507,848.49 5,507,848.49
Capital Outlay 326,075.73 - - 326,075.73
Total Expenditures 19,579,880.88 2,174,471.87 - 21,754,352.75
Excess (Deficiency) of RevenuesOver Expenditures 175,922.43 (807.50) - 175,114.93
OTHER FINANCING SOURCES (USES)Transfer in - - - Transfer out - -
Total Other Financing Sources and Uses - - - -
Net Changes in Fund Balance 175,922.43 (807.50) - 175,114.93
Fund Balance (Deficit) - July 1 3,769,085.96 (41,182.50) 149,620.71 3,877,524.17
Fund Balance (Deficit) - June 30 3,945,008.39$ (41,990.00) 149,620.71 4,052,639.10
Governmental FundsStatement of Revenues, Expenditures, and Changes in Fund Balance
CITY OF WILDWOOD SCHOOL DISTRICT
For the Year Ended June 30, 2017
23
The accompanying Notes to Financial Statements are an integral part of this Statement
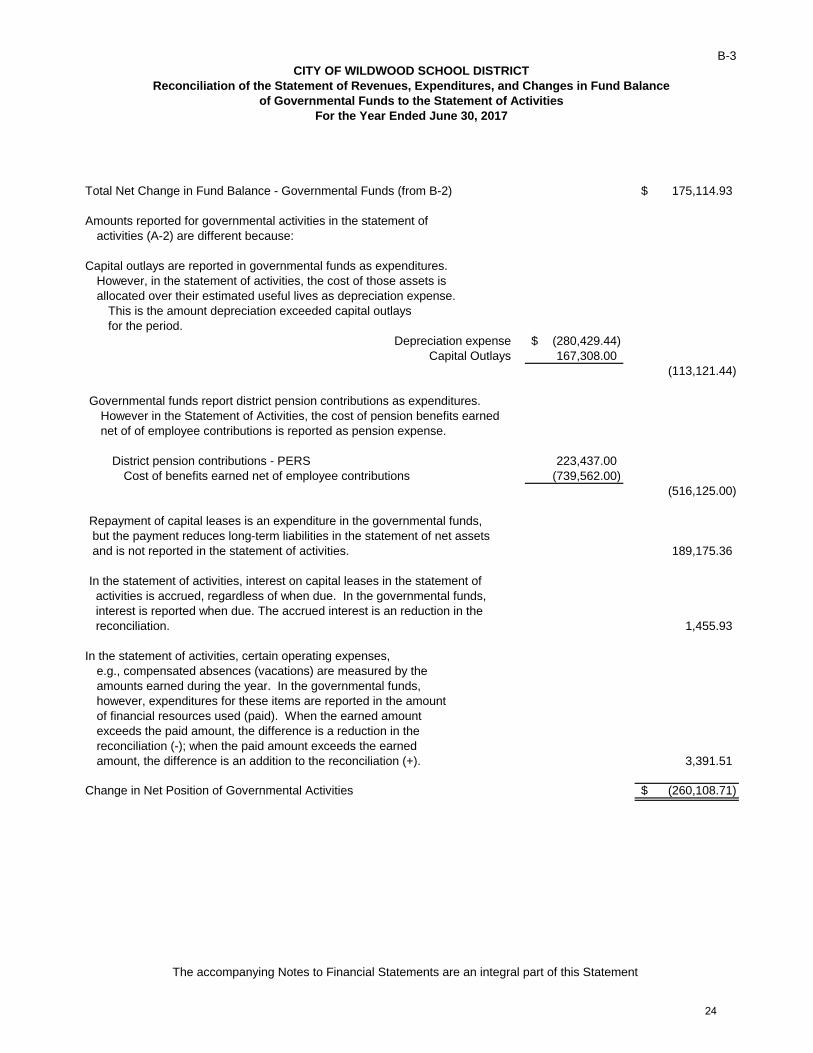
B-3
Total Net Change in Fund Balance - Governmental Funds (from B-2) 175,114.93$
Amounts reported for governmental activities in the statement ofactivities (A-2) are different because:
Capital outlays are reported in governmental funds as expenditures.However, in the statement of activities, the cost of those assets isallocated over their estimated useful lives as depreciation expense.
This is the amount depreciation exceeded capital outlays for the period.
Depreciation expense (280,429.44)$ Capital Outlays 167,308.00
(113,121.44)
Governmental funds report district pension contributions as expenditures.However in the Statement of Activities, the cost of pension benefits earnednet of of employee contributions is reported as pension expense.
District pension contributions - PERS 223,437.00 Cost of benefits earned net of employee contributions (739,562.00)
(516,125.00)
Repayment of capital leases is an expenditure in the governmental funds, but the payment reduces long-term liabilities in the statement of net assets and is not reported in the statement of activities. 189,175.36
In the statement of activities, interest on capital leases in the statement of activities is accrued, regardless of when due. In the governmental funds, interest is reported when due. The accrued interest is an reduction in the reconciliation. 1,455.93
In the statement of activities, certain operating expenses,e.g., compensated absences (vacations) are measured by the amounts earned during the year. In the governmental funds,however, expenditures for these items are reported in the amountof financial resources used (paid). When the earned amountexceeds the paid amount, the difference is a reduction in thereconciliation (-); when the paid amount exceeds the earnedamount, the difference is an addition to the reconciliation (+). 3,391.51
Change in Net Position of Governmental Activities (260,108.71)$
CITY OF WILDWOOD SCHOOL DISTRICTReconciliation of the Statement of Revenues, Expenditures, and Changes in Fund Balance
of Governmental Funds to the Statement of ActivitiesFor the Year Ended June 30, 2017
24
The accompanying Notes to Financial Statements are an integral part of this Statement
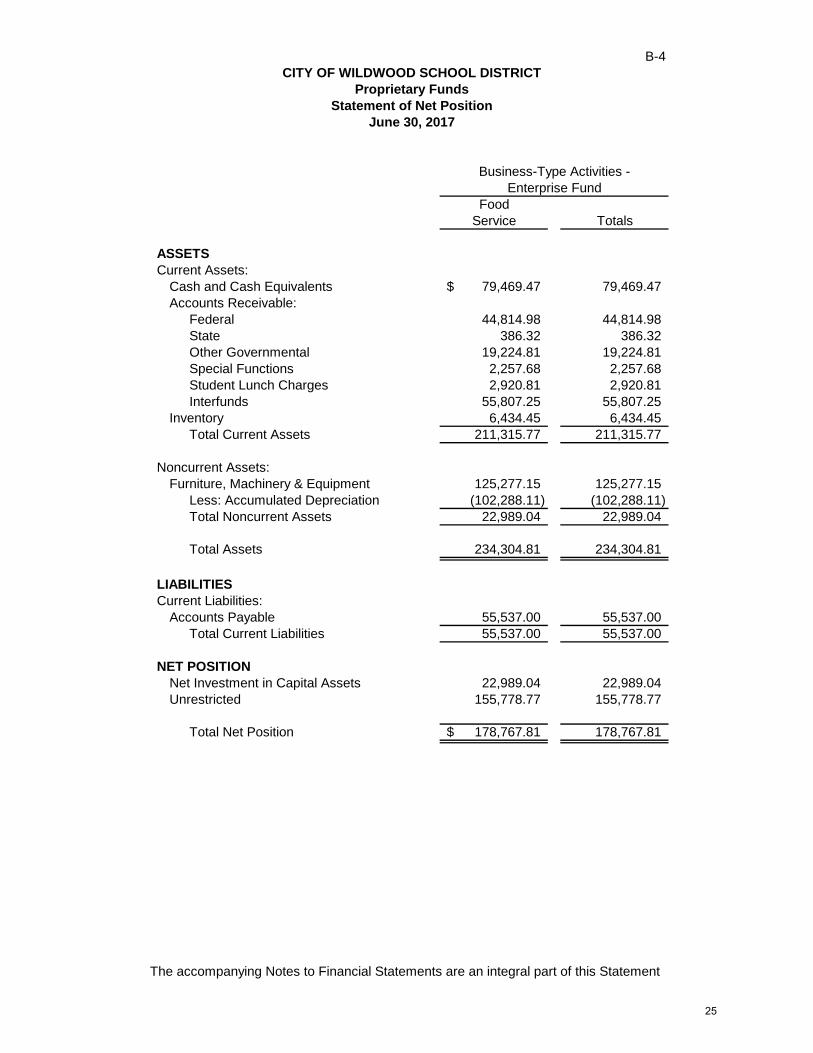
B-4
FoodService Totals
ASSETSCurrent Assets:
Cash and Cash Equivalents 79,469.47$ 79,469.47 Accounts Receivable:
Federal 44,814.98 44,814.98 State 386.32 386.32 Other Governmental 19,224.81 19,224.81 Special Functions 2,257.68 2,257.68 Student Lunch Charges 2,920.81 2,920.81 Interfunds 55,807.25 55,807.25
Inventory 6,434.45 6,434.45 Total Current Assets 211,315.77 211,315.77
Noncurrent Assets:Furniture, Machinery & Equipment 125,277.15 125,277.15
Less: Accumulated Depreciation (102,288.11) (102,288.11) Total Noncurrent Assets 22,989.04 22,989.04
Total Assets 234,304.81 234,304.81
LIABILITIESCurrent Liabilities:
Accounts Payable 55,537.00 55,537.00 Total Current Liabilities 55,537.00 55,537.00
NET POSITIONNet Investment in Capital Assets 22,989.04 22,989.04 Unrestricted 155,778.77 155,778.77
Total Net Position 178,767.81$ 178,767.81
CITY OF WILDWOOD SCHOOL DISTRICT
June 30, 2017
Enterprise FundBusiness-Type Activities -
Statement of Net PositionProprietary Funds
25
The accompanying Notes to Financial Statements are an integral part of this Statement
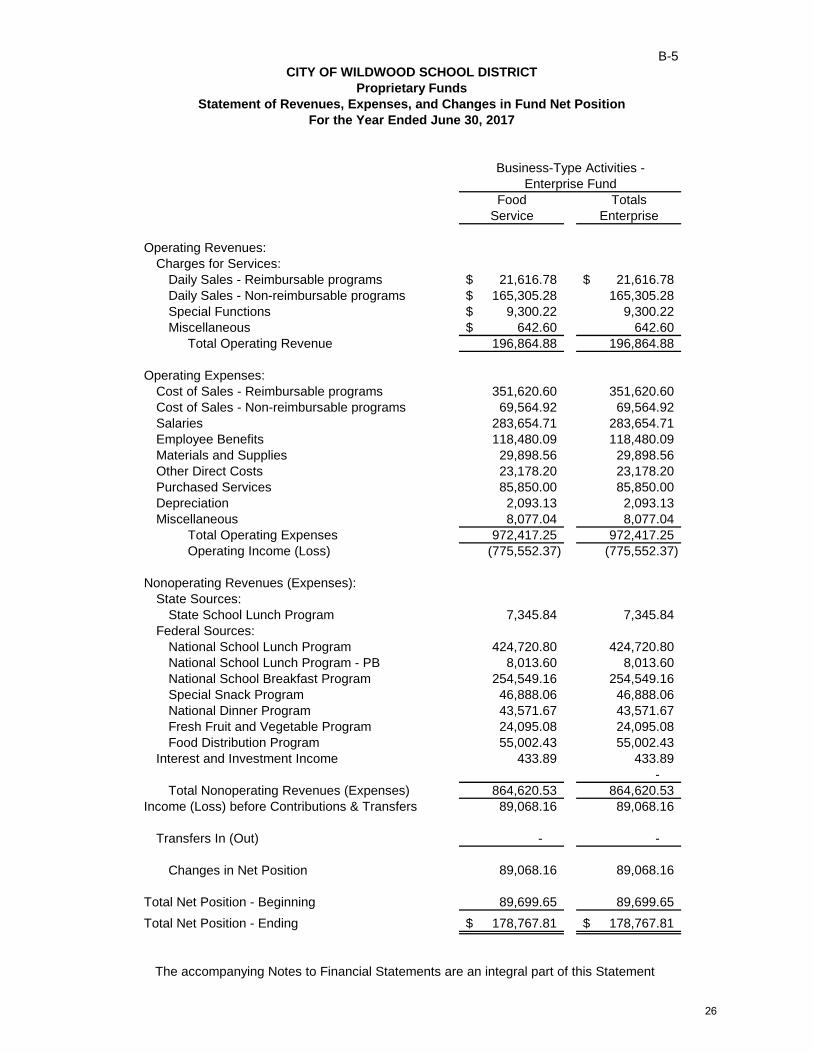
B-5
Food TotalsService Enterprise
Operating Revenues:Charges for Services:
Daily Sales - Reimbursable programs 21,616.78$ 21,616.78$ Daily Sales - Non-reimbursable programs 165,305.28$ 165,305.28 Special Functions 9,300.22$ 9,300.22 Miscellaneous 642.60$ 642.60
Total Operating Revenue 196,864.88 196,864.88
Operating Expenses:Cost of Sales - Reimbursable programs 351,620.60 351,620.60 Cost of Sales - Non-reimbursable programs 69,564.92 69,564.92 Salaries 283,654.71 283,654.71 Employee Benefits 118,480.09 118,480.09 Materials and Supplies 29,898.56 29,898.56 Other Direct Costs 23,178.20 23,178.20 Purchased Services 85,850.00 85,850.00 Depreciation 2,093.13 2,093.13 Miscellaneous 8,077.04 8,077.04
Total Operating Expenses 972,417.25 972,417.25 Operating Income (Loss) (775,552.37) (775,552.37)
Nonoperating Revenues (Expenses):State Sources:
State School Lunch Program 7,345.84 7,345.84 Federal Sources:
National School Lunch Program 424,720.80 424,720.80 National School Lunch Program - PB 8,013.60 8,013.60 National School Breakfast Program 254,549.16 254,549.16 Special Snack Program 46,888.06 46,888.06 National Dinner Program 43,571.67 43,571.67 Fresh Fruit and Vegetable Program 24,095.08 24,095.08 Food Distribution Program 55,002.43 55,002.43
Interest and Investment Income 433.89 433.89 -
Total Nonoperating Revenues (Expenses) 864,620.53 864,620.53 Income (Loss) before Contributions & Transfers 89,068.16 89,068.16
Transfers In (Out) - -
Changes in Net Position 89,068.16 89,068.16
Total Net Position - Beginning 89,699.65 89,699.65 Total Net Position - Ending 178,767.81$ 178,767.81$
CITY OF WILDWOOD SCHOOL DISTRICT
For the Year Ended June 30, 2017
Enterprise FundBusiness-Type Activities -
Statement of Revenues, Expenses, and Changes in Fund Net PositionProprietary Funds
26
The accompanying Notes to Financial Statements are an integral part of this Statement
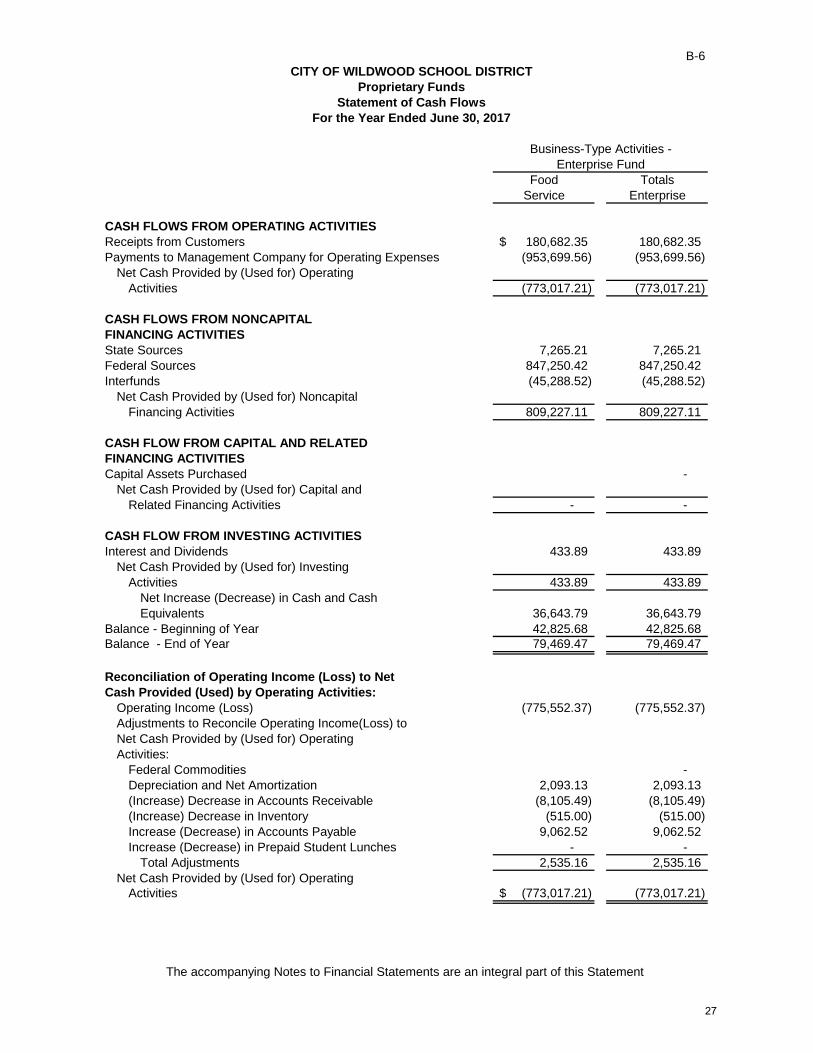
B-6
Food TotalsService Enterprise
CASH FLOWS FROM OPERATING ACTIVITIESReceipts from Customers 180,682.35$ 180,682.35 Payments to Management Company for Operating Expenses (953,699.56) (953,699.56)
Net Cash Provided by (Used for) OperatingActivities (773,017.21) (773,017.21)
CASH FLOWS FROM NONCAPITAL FINANCING ACTIVITIESState Sources 7,265.21 7,265.21 Federal Sources 847,250.42 847,250.42 Interfunds (45,288.52) (45,288.52)
Net Cash Provided by (Used for) NoncapitalFinancing Activities 809,227.11 809,227.11
CASH FLOW FROM CAPITAL AND RELATEDFINANCING ACTIVITIESCapital Assets Purchased -
Net Cash Provided by (Used for) Capital andRelated Financing Activities - -
CASH FLOW FROM INVESTING ACTIVITIESInterest and Dividends 433.89 433.89
Net Cash Provided by (Used for) InvestingActivities 433.89 433.89
Net Increase (Decrease) in Cash and CashEquivalents 36,643.79 36,643.79
Balance - Beginning of Year 42,825.68 42,825.68 Balance - End of Year 79,469.47 79,469.47
Reconciliation of Operating Income (Loss) to NetCash Provided (Used) by Operating Activities:
Operating Income (Loss) (775,552.37) (775,552.37) Adjustments to Reconcile Operating Income(Loss) toNet Cash Provided by (Used for) Operating Activities:
Federal Commodities - Depreciation and Net Amortization 2,093.13 2,093.13 (Increase) Decrease in Accounts Receivable (8,105.49) (8,105.49) (Increase) Decrease in Inventory (515.00) (515.00) Increase (Decrease) in Accounts Payable 9,062.52 9,062.52 Increase (Decrease) in Prepaid Student Lunches - -
Total Adjustments 2,535.16 2,535.16 Net Cash Provided by (Used for) Operating
Activities (773,017.21)$ (773,017.21)
CITY OF WILDWOOD SCHOOL DISTRICT
For the Year Ended June 30, 2017
Enterprise FundBusiness-Type Activities -
Statement of Cash FlowsProprietary Funds
27

The accompanying Notes to Financial Statements are an integral part of this Statement
B-7
Unemployment Private Purpose AgencyCompensation Scholarship Fund Fund
ASSETSCash and Cash Equivalents 78,727.56$ 292,188.69$ 80,597.27$ Interfunds Receivable - -
Total Assets 78,727.56$ 292,188.69$ 80,597.27$
LIABILITIESAccounts Payable 26.84$ -$ -$ Payroll Deductions and Withholdings 13,714.03 Interfunds Payable - 801.28 Due to Student Groups 66,081.96
Total Liabilities 26.84 - 80,597.27$
NET POSITIONHeld in Trust for Unemployment
Claims and Other Purposes 78,700.72$
Reserved for Scholarships 292,188.69$
Statement of Net PositionFiduciary Funds
CITY OF WILDWOOD SCHOOL DISTRICT
June 30, 2017
28
The accompanying Notes to Financial Statements are an integral part of this Statement
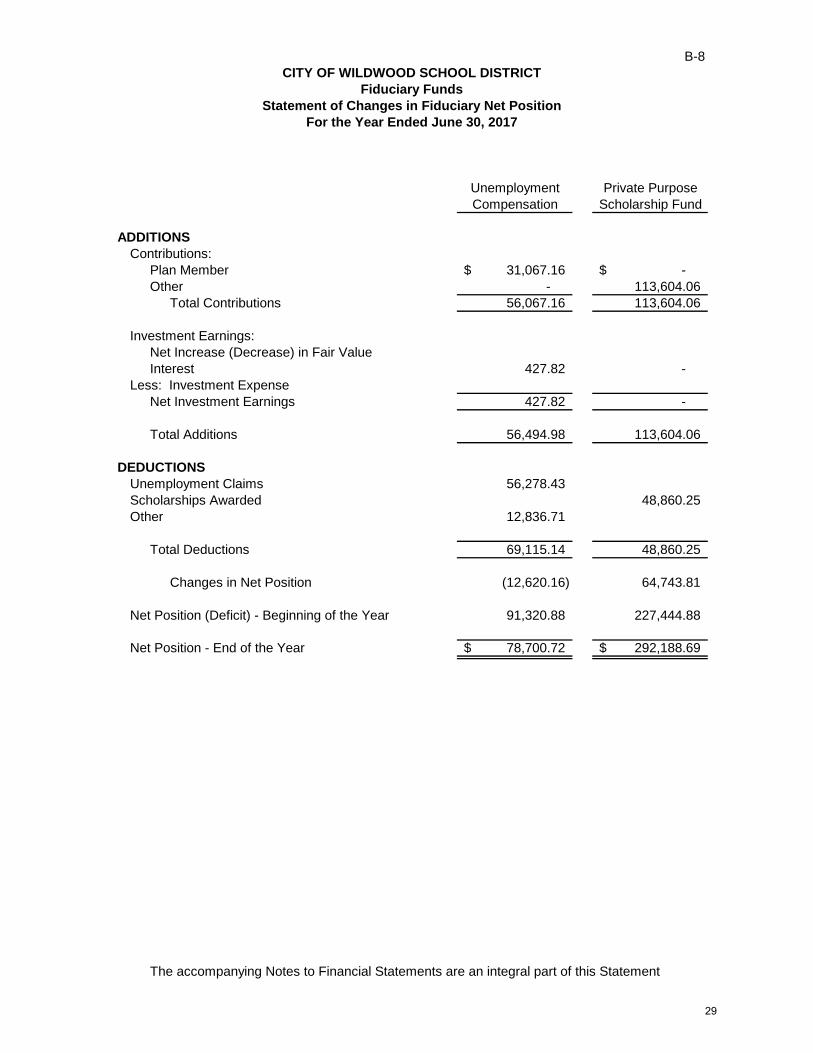
B-8
Unemployment Private PurposeCompensation Scholarship Fund
ADDITIONSContributions:
Plan Member 31,067.16$ -$ Other - 113,604.06
Total Contributions 56,067.16 113,604.06
Investment Earnings:Net Increase (Decrease) in Fair ValueInterest 427.82 -
Less: Investment ExpenseNet Investment Earnings 427.82 -
Total Additions 56,494.98 113,604.06
DEDUCTIONSUnemployment Claims 56,278.43 Scholarships Awarded 48,860.25 Other 12,836.71
Total Deductions 69,115.14 48,860.25
Changes in Net Position (12,620.16) 64,743.81
Net Position (Deficit) - Beginning of the Year 91,320.88 227,444.88
Net Position - End of the Year 78,700.72$ 292,188.69$
Statement of Changes in Fiduciary Net PositionFiduciary Funds
CITY OF WILDWOOD SCHOOL DISTRICT
For the Year Ended June 30, 2017
29
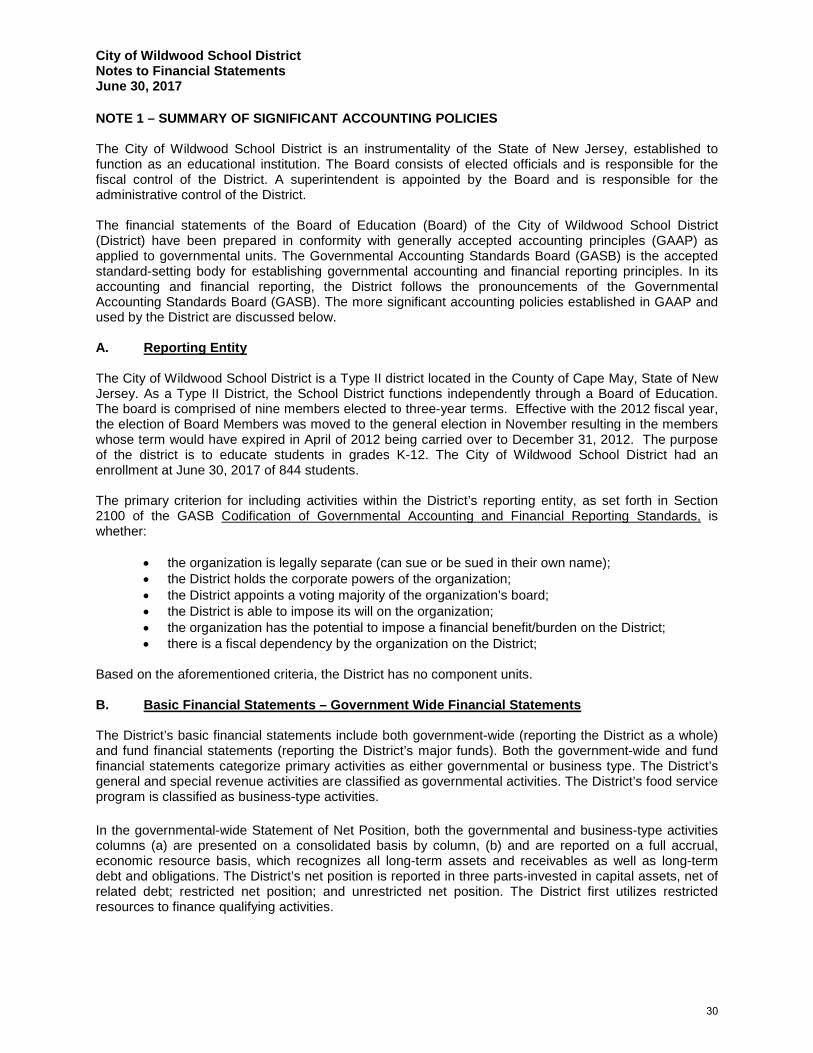
City of Wildwood School District Notes to Financial Statements June 30, 2017
NOTE 1 – SUMMARY OF SIGNIFICANT ACCOUNTING POLICIES The City of Wildwood School District is an instrumentality of the State of New Jersey, established to function as an educational institution. The Board consists of elected officials and is responsible for the fiscal control of the District. A superintendent is appointed by the Board and is responsible for the administrative control of the District. The financial statements of the Board of Education (Board) of the City of Wildwood School District (District) have been prepared in conformity with generally accepted accounting principles (GAAP) as applied to governmental units. The Governmental Accounting Standards Board (GASB) is the accepted standard-setting body for establishing governmental accounting and financial reporting principles. In its accounting and financial reporting, the District follows the pronouncements of the Governmental Accounting Standards Board (GASB). The more significant accounting policies established in GAAP and used by the District are discussed below. A. Reporting Entity The City of Wildwood School District is a Type II district located in the County of Cape May, State of New Jersey. As a Type II District, the School District functions independently through a Board of Education. The board is comprised of nine members elected to three-year terms. Effective with the 2012 fiscal year, the election of Board Members was moved to the general election in November resulting in the members whose term would have expired in April of 2012 being carried over to December 31, 2012. The purpose of the district is to educate students in grades K-12. The City of Wildwood School District had an enrollment at June 30, 2017 of 844 students. The primary criterion for including activities within the District’s reporting entity, as set forth in Section 2100 of the GASB Codification of Governmental Accounting and Financial Reporting Standards, is whether:
• the organization is legally separate (can sue or be sued in their own name); • the District holds the corporate powers of the organization; • the District appoints a voting majority of the organization’s board; • the District is able to impose its will on the organization; • the organization has the potential to impose a financial benefit/burden on the District; • there is a fiscal dependency by the organization on the District;
Based on the aforementioned criteria, the District has no component units. B. Basic Financial Statements – Government Wide Financial Statements The District’s basic financial statements include both government-wide (reporting the District as a whole) and fund financial statements (reporting the District’s major funds). Both the government-wide and fund financial statements categorize primary activities as either governmental or business type. The District’s general and special revenue activities are classified as governmental activities. The District’s food service program is classified as business-type activities. In the governmental-wide Statement of Net Position, both the governmental and business-type activities columns (a) are presented on a consolidated basis by column, (b) and are reported on a full accrual, economic resource basis, which recognizes all long-term assets and receivables as well as long-term debt and obligations. The District’s net position is reported in three parts-invested in capital assets, net of related debt; restricted net position; and unrestricted net position. The District first utilizes restricted resources to finance qualifying activities.
30

City of Wildwood School District Notes to Financial Statements June 30, 2017
The government-wide Statement of Activities reports both the gross and net cost of each of the District’s functions and business-type activities (food service). The functions are also supported by general government revenues (property taxes, tuition, certain intergovernmental revenues, etc.). The Statement of Activities reduces gross expenses (including depreciation) by related program revenues, operating and capital grants. Program revenues must be directly associated with the function (regular instruction, vocational programs, student & instruction related services, etc.) or a business-type activity. Operating grants include operating-specific and discretionary (either operating or capital) grants while the capital grants column reflects capital-specific grants. The net costs (by function or business-type activity) are normally covered by general revenue (property taxes, interest income, etc.).
a. The District does allocate indirect costs such as depreciation expense, compensated absences, On-behalf TPAF Pension Contributions, and Reimbursed TPAF Social Security Contributions.
The government-wide focus is more on the sustainability of the District as an entity and the change in the District’s net position resulting from the current year’s activities. Fiduciary funds are not included in the government-wide statements. C. Basic Financial Statements – Fund Financial Statements The financial transactions of the District are reported in individual funds in the fund financial statements. Each fund is accounted for by providing a separate set of self-balancing accounts that comprise its assets, liabilities, reserves, fund equity, revenues and expenditures/expenses. The various funds are reported by generic classification within the financial statements. The emphasis in fund financial statements is on the major funds in either the governmental or business-type activities categories. Non major funds by category are summarized into a single column. GASB Statement No. 34 sets forth minimum criteria (percentage of the assets, liabilities, revenues or expenditures/expenses of either fund category or the governmental and enterprise combined) for the determination of major funds. The non major funds are combined in a column in the fund financial statements. The State of New Jersey Department of Education has mandated that all New Jersey School Districts must report all governmental funds as major, regardless of the fund meeting the GASB definition of a major fund. However, the criteria are applied to proprietary funds. The following fund types are used by the District:
Governmental Funds: The focus of the governmental funds’ measurement (in the fund statements) is upon determination of financial position and changes in financial position (sources, uses, and balances of financial resources) rather than upon net income. The following is a description of the governmental funds of the District.
a. General fund is the general operating fund of the District. It is used to account for all financial resources except those required to be accounted for in another fund.
b. Special revenue funds are used to account for the proceeds of specific revenue sources that are legally restricted to expenditures for a specific purpose. The special revenue fund is specifically used to account for state and federal grant monies that have been allocated to the District.
c. Capital projects funds are used to account for all financial resources to be used for the acquisition or construction of major capital facilities. The financial resources are derived from temporary notes or serial bonds that are specifically authorized by the voters as a separate question on the ballot either during the annual election or at a special election.
31

City of Wildwood School District Notes to Financial Statements June 30, 2017
Fund Balances – Governmental Funds In the fund financial statements, governmental funds report the following classifications of fund balance:
Nonspendable – includes amounts that cannot be spent because they are either not spendable in form or are legally or contractually required to be maintained intact. Restricted – includes amounts restricted by external sources (creditors, laws of other governments, etc.) or by constitutional provision or enabling legislation.
Committed – includes amounts that can only be used for specific purposes. Committed fund balance is reported pursuant to resolutions passed by the Board of Education, the District’s highest level of decision making authority. Commitments may be modified or rescinded only through resolutions approved by the Board of Education. Assigned – includes amounts that the District intends to use for a specific purpose, but do not meet the definition of restricted or committed fund balance. Under the District’s policy, amounts may be assigned by the Business Administrator. Unassigned – includes amounts that have not been assigned to other funds or restricted, committed or assigned to a specific purpose within the General Fund. The District reports all amounts that meet the unrestricted General Fund Balance Policy described below as unassigned:
The details of the fund balances are included in the Governmental Funds Balance Sheet. When an expenditure is incurred for purposes for which both restricted and unrestricted fund balance is available, the District considers restricted funds to have been spent first. When an expenditure is incurred for which committed, assigned or unassigned fund balance are available, the District considers amounts to have been spent first out of committed funds, then assigned funds and finally unassigned funds, as needed. Proprietary Funds: The focus of proprietary fund measurement is upon determination of operating income, changes in net position, financial position, and cash flows. The generally accepted accounting principles applicable are those similar to businesses in the private sector. The following is a description of the proprietary funds of the District:
Enterprise Funds are required to be used to account for operations for which a fee is charged to external users for goods or services and the activity (a) is financed with debt that is solely secured by a pledge of the net revenues, (b) has third party requirements that the cost of providing services, including capital costs, be recovered with fees and charges or (c) establishes fees and charges based on a pricing policy designated to recover similar costs. The District’s enterprise fund consists of the following: Food Service Fund – provides for the operation of food services in all schools within the district.
Fiduciary Funds: Fiduciary funds are used to report assets held in a trustee or agency capacity for others and therefore are not available to support District programs. The reporting focus is on net position and changes in net position, and is reported using accounting principles similar to proprietary funds.
32

City of Wildwood School District Notes to Financial Statements June 30, 2017
The District’s fiduciary funds are presented in the fiduciary fund financial statements by type (pension, private purpose and agency). Since by definition these assets are being held for the benefit of a third party (other local governments, private parties, pension participants, etc.), and cannot be used to address activities or obligations of the government, these funds are not incorporated into the government-wide statements. All fund internal activity is eliminated when carried to the Government-wide statements. D. Basis of Accounting Basis of accounting refers to the point at which revenues or expenditures/expenses are recognized in the accounts and reported in the financial statements. It relates to the timing of the measurements made regardless of the measurement focus applied. 1. Accrual: Both governmental and business-type activities in the government-wide financial statements and the proprietary and fiduciary fund financial statements are presented on the accrual basis of accounting. Revenues are recognized when earned and expenses are recognized when incurred. 2. Modified Accrual: The governmental fund financial statements are presented on the modified accrual basis of accounting. Under the modified accrual basis of accounting, revenues are recorded when susceptible to accrual; i.e., both measurable and available. “Available” means collectible within the current period or within 60 days after year end. Expenditures are generally recognized under the modified accrual basis of accounting when the related liability is incurred. The exception to this general rule is that principal and interest on general obligation long-term debt, if any, is recognized when due. E. Financial Statement Amounts 1. Cash and Cash Equivalents: Cash and cash equivalents include petty cash, change funds, cash in banks and all highly liquid investments with a maturity of three months or less at the time of purchase and are stated at cost plus accrued interest. U.S. Treasury and agency obligations and certificates of deposit with maturities of one year or less when purchased are stated at cost. All other investments are stated at fair value. New Jersey school districts are limited as to the types of investments and types of financial institutions they may invest in. New Jersey statute 18A:20-37 provides a list of permissible investments that may be purchased by New Jersey school districts. Additionally, the District has adopted a cash management plan that requires it to deposit public funds in public depositories protected from loss under the provisions of the Governmental Unit Deposit Protection Act (“GUDPA”). GUDPA was enacted in 1970 to protect Governmental Units from a loss of funds on deposit with a failed banking institution in New Jersey. NJSA 17:9-41 et. seq. establishes the requirements for the security of deposits of governmental units. The statute requires that no governmental unit shall deposit public funds in a public depository unless such funds are secured in accordance with the Act. Public depositories include Savings and Loan institutions, banks (both state and national banks) and savings banks, the deposits of which are federally insured. All public depositories must pledge collateral, having a market value at least equal to five percent of the average daily balance of collected public funds, to secure the deposits of Governmental Units. If a public depository fails, the collateral it has pledged, plus the collateral of all other public depositories, is available to pay the full amount of their deposits to the Governmental units.
33
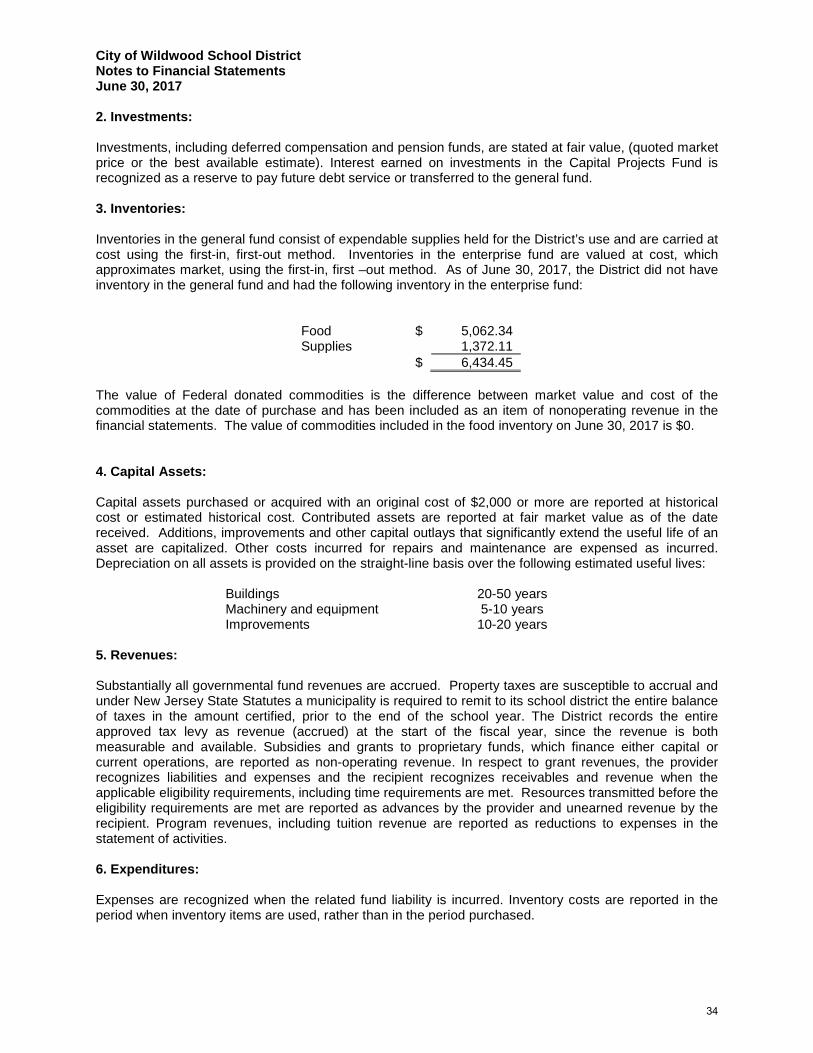
City of Wildwood School District Notes to Financial Statements June 30, 2017
2. Investments: Investments, including deferred compensation and pension funds, are stated at fair value, (quoted market price or the best available estimate). Interest earned on investments in the Capital Projects Fund is recognized as a reserve to pay future debt service or transferred to the general fund. 3. Inventories: Inventories in the general fund consist of expendable supplies held for the District’s use and are carried at cost using the first-in, first-out method. Inventories in the enterprise fund are valued at cost, which approximates market, using the first-in, first –out method. As of June 30, 2017, the District did not have inventory in the general fund and had the following inventory in the enterprise fund:
Food $ 5,062.34 Supplies 1,372.11 $ 6,434.45
The value of Federal donated commodities is the difference between market value and cost of the commodities at the date of purchase and has been included as an item of nonoperating revenue in the financial statements. The value of commodities included in the food inventory on June 30, 2017 is $0. 4. Capital Assets: Capital assets purchased or acquired with an original cost of $2,000 or more are reported at historical cost or estimated historical cost. Contributed assets are reported at fair market value as of the date received. Additions, improvements and other capital outlays that significantly extend the useful life of an asset are capitalized. Other costs incurred for repairs and maintenance are expensed as incurred. Depreciation on all assets is provided on the straight-line basis over the following estimated useful lives:
Buildings 20-50 years Machinery and equipment 5-10 years Improvements 10-20 years
5. Revenues: Substantially all governmental fund revenues are accrued. Property taxes are susceptible to accrual and under New Jersey State Statutes a municipality is required to remit to its school district the entire balance of taxes in the amount certified, prior to the end of the school year. The District records the entire approved tax levy as revenue (accrued) at the start of the fiscal year, since the revenue is both measurable and available. Subsidies and grants to proprietary funds, which finance either capital or current operations, are reported as non-operating revenue. In respect to grant revenues, the provider recognizes liabilities and expenses and the recipient recognizes receivables and revenue when the applicable eligibility requirements, including time requirements are met. Resources transmitted before the eligibility requirements are met are reported as advances by the provider and unearned revenue by the recipient. Program revenues, including tuition revenue are reported as reductions to expenses in the statement of activities. 6. Expenditures: Expenses are recognized when the related fund liability is incurred. Inventory costs are reported in the period when inventory items are used, rather than in the period purchased.
34

City of Wildwood School District Notes to Financial Statements June 30, 2017
7. Compensated Absences: Compensated absences are those absences for which employees will be paid, such as vacation, sick leave, and sabbatical leave. A liability for compensated absences that are attributable to services already rendered, and that are not contingent on a specific event that is outside the control of the District and its employees, is accrued as the employees earn the rights to the benefits. Compensated absences that relate to future services, or that are contingent on a specific event that is outside the control of the District and its employees, are accounted for in the period in which such services are rendered or in which such events take place. In governmental and similar trust funds, compensated absences that are expected to be liquidated with expendable available financial resources are reported as both an expenditure and a fund liability in the fund that will pay for the compensated absences. The remainder of the compensated absences liability is reported in the District-wide Financial Statements as a Governmental Activity. In proprietary and similar trust funds, compensated absences are recorded as an expense and liability of the fund that will pay for them. 8. Interfund Activity: Interfund activity is reported as either loans, services provided, reimbursements, or transfers. Loans are reported as interfund receivables and payables as appropriate and are subject to elimination upon consolidation. Services provided, deemed to be at market or near market rates, are treated as revenues and expenditures/expenses. Reimbursements are when one fund incurs a cost, charges the appropriate benefiting fund and reduces its related costs as reimbursement. All other interfund transactions are treated as transfers. Transfers between governmental or proprietary funds are netted as part of the reconciliation to the government-wide financial statements. 9. Budgets/Budgetary Control: Annual appropriated budgets are prepared in the spring of each year for the general, special revenue, and debt service funds. The budgets are submitted to the county office for approval and, as long as the District budget is within State mandated CAPs, there is no public vote on the budget. If the budget exceeds State mandated CAPs, the voters have an opportunity to approve or reject the budget at the regular election held in November. Budgets are prepared using the modified accrual basis of accounting, except for the special revenue fund as described later. The legal level of budgetary control is established at line item accounts within each fund. Line item accounts are defined as the lowest (most specific) level of detail as established pursuant to the minimum chart of accounts referenced in N.J.A.C. 6:23-2(g). Transfers of appropriations may be made by School Board resolution at any time during the fiscal year and are subject to two-thirds majority vote by the School Board and under certain circumstances require approval by the County Superintendent of Schools. Significant transfers approved by the Board of Education during the fiscal year were as follows:
Regular Programs-InstructionKindergarten Salaries of Teachers (90,000.00)$ Grades 9-12 Salaries of Teachers (72,840.00)
Resource Room/Resource CenterSalaries of Teachers 100,940.00
Basic Skills/RemedialSalaries of Teachers 100,839.00
Unallocated Benefits - Employee BenefitsHealth Benefits (108,270.00)
35
City of Wildwood School District Notes to Financial Statements June 30, 2017
Formal budgetary integration into the accounting system is employed as a management control device during the year. For governmental funds there are no substantial differences between the budgetary basis of accounting and generally accepted accounting principles with the exception of the legally mandated revenue recognition of the last state aid payments for budgetary purposes only and the special revenue fund as noted below. Encumbrance accounting is also employed as an extension of formal budgetary integration in the governmental fund types. Unencumbered appropriations lapse at fiscal year end. The accounting records of the special revenue fund are maintained on the grant accounting budgetary basis. The grant accounting budgetary basis differs from GAAP in that the grant accounting budgetary basis recognizes encumbrances as expenditures and also recognizes the related revenues, whereas the GAAP basis does not. Sufficient supplemental records are maintained to allow for the presentation of GAAP basis financial reports. 10. Encumbrances Under encumbrance accounting purchase orders, contracts and other commitments for the expenditure of resources are recorded to reserve a portion of the applicable appropriation. Open encumbrances in governmental funds, other than the special revenue fund, are reported as reservations of fund balances at fiscal year end as they do not constitute expenditures or liabilities but rather commitments related to unperformed contracts for goods and services. Open encumbrances in the special revenue fund, for which the District has received advances, are reflected in the balance sheet as unearned revenues at fiscal year end. The encumbered appropriation authority carries over into the next fiscal year. An entry will be made at the beginning of the next fiscal year to increase the appropriation reflected in the certified budget by the outstanding encumbrance amount as of the current fiscal year end. 11. Tuition Receivable Tuition charges were established by the Boards of Education based on estimated costs. The charges are subject to adjustment when the final costs have been determined. The final cost is based on agreements with the North Wildwood, Wildwood Crest and West Wildwood Boards of Education with a negotiated amount up to the final cost as determined by State of New Jersey. 12. Tuition Payable Tuition charges for the fiscal years 2016/17 and 2015/16 were based on rates established by the receiving district. These rates are subject to change when the actual costs have been determined. 13. Use of Estimates The preparation of financial statements in conformity with generally accepted accounting principles requires management to make estimates and assumptions that affect certain reported amounts and disclosures. Accordingly, actual results could differ from those results. 14. Allocation of Costs In the government-wide statement of activities, the District has allocated unallocated benefits to various programs based on the budgetary expenditures by program.
36

City of Wildwood School District Notes to Financial Statements June 30, 2017
15. Pensions: For purposes of measuring the net position liability, deferred outflows of resources and deferred inflows of resources related to pensions, and pension expense, information about the fiduciary net position of the Teachers’ Pension and Annuity Fund (TPAF) and Public Employee Retirement System (PERS) and additions to/deductions from the fiduciary net position have been determined on the same basis as they are reported by the TPAF and PERS. For this purpose, benefit payments (including refunds of employee contributions) are recognized when due and payable in accordance with the benefit terms. Investments are reported at fair value. F. Recent Accounting Changes In June 2015, the Governmental Accounting Standards Board (GASB) issued Statement No. 75, “Accounting and Financial Reporting for Postemployment Benefits Other Than Pensions”. This statement is effective for fiscal periods beginning after June 30, 2017. Although not determinable, the impact of this statement on the net position of the entity is anticipated to be significant. In January 2016, the Governmental Accounting Standards Board (GASB) issued Statement No. 80, “Blending Requirements for Certain Component Units – an amendment of GASB Statement No. 14”. This statement is effective for fiscal periods beginning after December 15, 2016, will not have any effect on the District’s financial reporting. In March 2016, the Governmental Accounting Standards Board (GASB) issued Statement No. 81, “Irrevocable Split-Interest Agreements”. This statement is effective for fiscal periods beginning after December 15, 2016, will not have any effect on the District’s financial reporting. In November 2016, the Governmental Accounting Standards Board (GASB) issued Statement No. 83, “Certain Asset Retirement Obligations”. This statement is effective for fiscal periods beginning after June 15, 2018, will not have any effect on the District’s financial reporting. In January 2017, the Governmental Accounting Standards Board (GASB) issued Statement No. 84, “Fiduciary Activities”. This statement is effective for fiscal periods beginning after December 15, 2018, will not have any effect on the District’s financial reporting. In March 2017, the Governmental Accounting Standards Board (GASB) issued Statement No. 85, “Omnibus 2017”. This statement is effective for fiscal periods beginning after June 15, 2017, will have an effect on the District’s financial reporting and will affect the disclosure of pension related items. In May 2017, the Governmental Accounting Standards Board (GASB) issued Statement No. 86, “Certain Debt Extinguishment Issues”. This statement is effective for fiscal periods beginning after June 15, 2017, will have an effect on the District’s financial reporting and will affect the disclosure of pension related items. Although not determinable, the impact of this statement on the net position of the entity is not anticipated to be significant. In June 2017, the Governmental Accounting Standards Board (GASB) issued Statement No. 86, “Leases”. This statement is effective for fiscal periods beginning after December 15, 2019, will have an effect on the District’s financial reporting and will affect the disclosure of pension related items. Although not determinable, the impact of this statement on the net position of the entity is not anticipated to be significant.
37

City of Wildwood School District Notes to Financial Statements June 30, 2017
NOTE 2 – CASH AND CASH EQUIVALENTS Custodial Credit Risk—Deposits. Custodial credit risk is the risk that in the event of a bank failure, the government’s deposits may not be returned to it. The district’s policy is based on New Jersey Statutes requiring cash be deposited only in New Jersey based banking institutions that participate in the New Jersey Governmental Depository Protection Act (GUDPA) or in qualified investments established in New Jersey Statutes 18A:20-37 that are treated as cash equivalents. As of June 30, 2017, $0 of the government’s bank balance of $3,905,074.10 was exposed to custodial credit risk. NOTE 3 – INVESTMENTS As of June 30, 2017, the District had the following investments: Maturities Fair Value
Certificate of Deposit 6 months $ 8,679.85
Total $ 8,679.85
Interest Rate Risk. The district does not have a formal investment policy that limits investment maturities as a means of managing its exposure to fair value losses arising from increasing interest rates. However, New Jersey Statutes 18A:20-37 limits the length of time for most investment to 397 days. Credit Risk. New Jersey Statutes 18A:20-37 limits district investments to those specified in the Statutes. The type of allowable investments are Bonds of the United States of America or of the district or the local units in which the district is located; obligations of federal agencies not exceeding 397 days; government money market mutual funds; the State of New Jersey Cash Management Plan; local government investment pools; or repurchase of fully collateralized securities. Concentration of Credit Risk. The district places no limit on the amount the district may invest in any one issuer. NOTE 4 – RECEIVABLES Receivables at June 30, 2017, consisted of accounts (tuition), interfund, and intergovernmental. All receivables are considered collectible in full. A summary of the principal items of intergovernmental receivables follows:
Governmental GovernmentFund Wide
Financial FinancialStatements Statements
State Aid $ 150,409.11 $ 150,795.43 Federal Aid 513,638.00 558,452.98 Other 174,519.96 198,923.26 Gross Receivables 838,567.07 908,171.67 Less: Allowance for Uncollectibles
Total Receivables, Net $ 838,567.07 $ 908,171.67
38
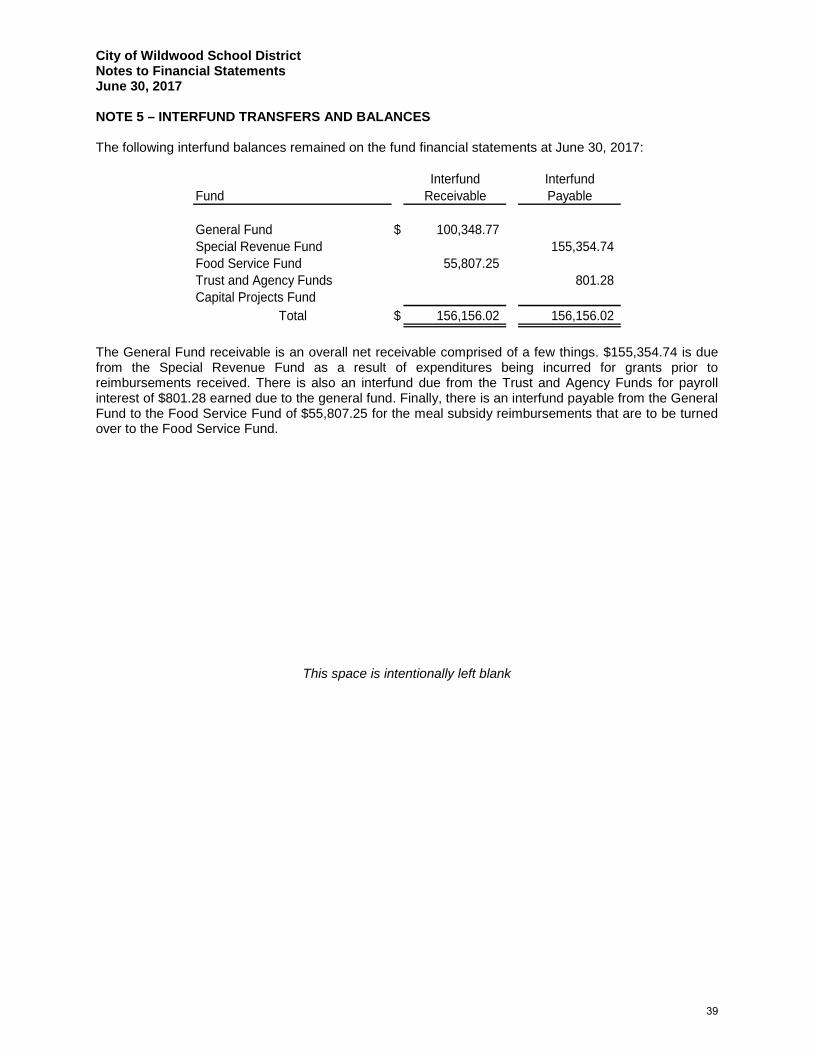
City of Wildwood School District Notes to Financial Statements June 30, 2017
NOTE 5 – INTERFUND TRANSFERS AND BALANCES The following interfund balances remained on the fund financial statements at June 30, 2017:
Interfund InterfundFund Receivable Payable
General Fund $ 100,348.77 Special Revenue Fund 155,354.74 Food Service Fund 55,807.25 Trust and Agency Funds 801.28 Capital Projects Fund
Total $ 156,156.02 156,156.02
The General Fund receivable is an overall net receivable comprised of a few things. $155,354.74 is due from the Special Revenue Fund as a result of expenditures being incurred for grants prior to reimbursements received. There is also an interfund due from the Trust and Agency Funds for payroll interest of $801.28 earned due to the general fund. Finally, there is an interfund payable from the General Fund to the Food Service Fund of $55,807.25 for the meal subsidy reimbursements that are to be turned over to the Food Service Fund.
This space is intentionally left blank
39
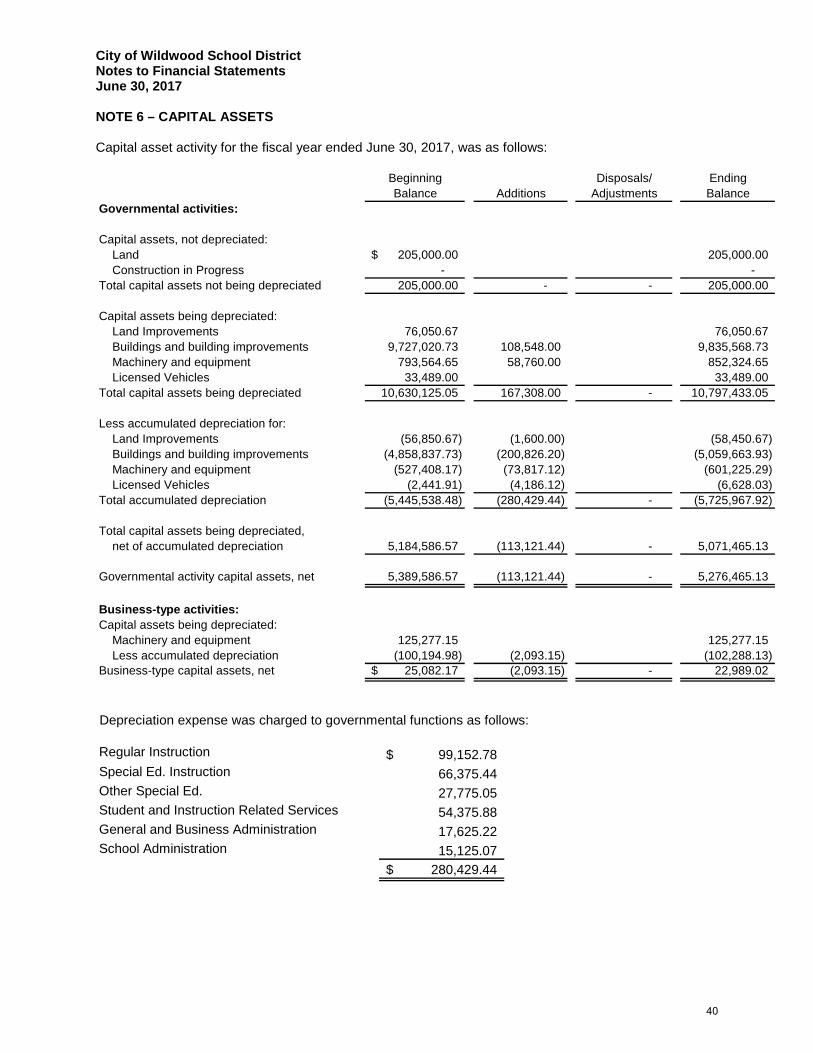
City of Wildwood School District Notes to Financial Statements June 30, 2017
NOTE 6 – CAPITAL ASSETS Capital asset activity for the fiscal year ended June 30, 2017, was as follows:
Beginning Disposals/ EndingBalance Additions Adjustments Balance
Governmental activities:
Capital assets, not depreciated: Land 205,000.00$ 205,000.00 Construction in Progress - - Total capital assets not being depreciated 205,000.00 - - 205,000.00
Capital assets being depreciated: Land Improvements 76,050.67 76,050.67 Buildings and building improvements 9,727,020.73 108,548.00 9,835,568.73 Machinery and equipment 793,564.65 58,760.00 852,324.65 Licensed Vehicles 33,489.00 33,489.00 Total capital assets being depreciated 10,630,125.05 167,308.00 - 10,797,433.05
Less accumulated depreciation for: Land Improvements (56,850.67) (1,600.00) (58,450.67) Buildings and building improvements (4,858,837.73) (200,826.20) (5,059,663.93) Machinery and equipment (527,408.17) (73,817.12) (601,225.29) Licensed Vehicles (2,441.91) (4,186.12) (6,628.03) Total accumulated depreciation (5,445,538.48) (280,429.44) - (5,725,967.92)
Total capital assets being depreciated, net of accumulated depreciation 5,184,586.57 (113,121.44) - 5,071,465.13
Governmental activity capital assets, net 5,389,586.57 (113,121.44) - 5,276,465.13
Business-type activities:Capital assets being depreciated: Machinery and equipment 125,277.15 125,277.15 Less accumulated depreciation (100,194.98) (2,093.15) (102,288.13) Business-type capital assets, net 25,082.17$ (2,093.15) - 22,989.02
Depreciation expense was charged to governmental functions as follows: Regular Instruction 99,152.78$ Special Ed. Instruction 66,375.44 Other Special Ed. 27,775.05 Student and Instruction Related Services 54,375.88 General and Business Administration 17,625.22 School Administration 15,125.07
280,429.44$
40

City of Wildwood School District Notes to Financial Statements June 30, 2017
No interest on debt was capitalized during the year and the amount of interest expense paid on long term debt was $2,257.95. NOTE 7 – LONG-TERM OBLIGATIONS Changes in long-term obligations for the year ended June 30, 2017 are as follows:
Amounts DueBalance Issues or Payments or Balance Within
June 30, 2016 Additions Expenditures June 30, 2017 One Year
Obligations underCapital Leases $ 564,076.13 - 189,175.36 374,900.77 194,900.77
Compensated Absences 264,877.36 3,391.51 261,485.85 -
$ 828,953.49 - 192,566.87 636,386.62 194,900.77
Compensated absences have been liquidated in the General Fund. NOTE 8 – OPERATING LEASES The district entered into a new lease agreement for the rental of several district-wide copy machines. The lease provides for monthly payments of $2,438.33 with the last lease terminating in August of 2021. Rental expense for the year ended June 30, 2017 was $33,323.30. The district also leased classroom space for the preschool program for 2016-2017 from St. Simeon’s By the Sea. Rental expense for the year ended June 30, 2017 was $135,563.17. Future minimum lease payments are as follows:
Fiscal Year EndJune 30, Payment
2018 34,172.04 2019 34,172.04 2020 33,075.34 2021 5,256.74
Total 106,676.16$ NOTE 9 – PENSION PLANS Description of Plans - All required employees of the District are covered by either the Public Employees' Retirement System or the Teachers' Pension and Annuity Fund which have been established by state statute and are administered by the New Jersey Division of Pension and Benefits (Division). According to the State of New Jersey Administrative Code, all obligations of both Systems will be assumed by the State of New Jersey should the Systems terminate. The Division issues a publicly available financial report that includes the financial statements and required supplementary information for the Public Employees Retirement System and the Teachers' Pension and Annuity Fund. These reports may be obtained by writing to the Division of Pension and Benefits, PO Box 295, Trenton, New Jersey, 08625 or the reports can be accessed on the internet at http://www.state.nj.us/treasury/pensions/annrpts achive.htm.
41
City of Wildwood School District Notes to Financial Statements June 30, 2017
Teachers' Pension and Annuity Fund (TPAF) The Teachers' Pension and Annuity Fund was established as of January 1, 1955, under the provisions of N.J.S.A. 18A:66 to provide retirement benefits, death, disability and medical benefits to certain qualified members. The Teachers' Pension and Annuity Fund is considered a cost-sharing multiple-employer plan with a special funding situation, as under current statute, all employer contributions are made by the State of New Jersey on behalf of the District and the system's other related non-contributing employers. Membership is mandatory for substantially all teachers or members of the professional staff certified by the State Board of Examiners, and employees of the Department of Education who have titles that are unclassified, professional and certified. Public Employees' Retirement System (PERS) The Public Employees' Retirement System (PERS) was established as of January 1, 1955 under the provisions of N.J.S.A. 43:15A to provide retirement, death, disability and medical benefits to certain qualified members. The Public Employees' Retirement System is a cost-sharing multiple-employer plan. Membership is mandatory for substantially all full-time employees of the State of New Jersey or any county, municipality, school district, or public agency, provided the employee is not required to be a member of another state-administered retirement system or other state or local jurisdiction. Defined Contribution Retirement Program (DCRP) The Defined Contribution Retirement Program (DCRP) was established as of July 1, 2007 under the provisions of Chapter 92, P.L. 2007 and Chapter 103, P.L. 2007 (N.J.S.A. 43:15C-1 et seq.). The DCRP is a cost-sharing multiple-employer defined contribution pension fund. The DCRP provides eligible members, and their beneficiaries with a tax-sheltered, defined contribution retirement benefit, along with life insurance and disability coverage. Vesting and benefit provisions are established by N. J.S.A. 43:15C-1 et. seq.
The contribution requirements of plan members are determined by state statute. In accordance with Chapter 92, P.L. 2007 and Chapter 103, P.L. 2007, plan members are required to contribute 5.5% of their annual covered salary. The State Treasurer has the right under current law to make temporary reductions in member rates based on the existence of surplus plan assets in the retirement system; however statute also requires the return to the normal rate when such surplus pension assets no longer exist. In addition to the employee contributions, the School District’s contribution amounts for each pay period are required to be transmitted to Prudential Financial not later than the fifth business day after the date on which the employee is paid for that pay period. The School District has no employees enrolled in the Defined Contribution Retirement Program (DCRP) during the fiscal year ended June 30, 2017. Funding Policy The contribution policy is set by N.J.S.A. 43:15A, Chapter 62, P.L. of 1994, Chapter 115, P.L. of 1997 and N.J.S.A. 18:66, and requires contributions by active members and contributing employers. Plan member and employer contributions may be amended by State of New Jersey legislation. TPAF and PERS provide for employee contributions of 5.5% of employees’ annual compensation, as defined. Employers are required to contribute at an actuarially determined rate in both TPAF and PERS. The current TPAF rate is 7.06% and the PERS rate is 7.06% of covered payroll. The School District’s contributions to TPAF for the years ending June 30, 2017, 2016 and 2015 were $0, $0 and $0, respectively. The School District’s contributions to PERS for the years ending June 30, 2017, 2016 and 2015 were $223,437.00, $206,992.00 and $209,616.00, respectively, equal to the required contributions for each year.
42
City of Wildwood School District Notes to Financial Statements June 30, 2017
During the fiscal years ended June 30, 2017, 2016 and 2015, the State of New Jersey contributed $754,865.00, $760,044.00 and $707,512.00, respectively, to the TPAF for post-retirement medical benefits on behalf of the Board. Also, in accordance with NJSA 18A:66-66 the State of New Jersey reimbursed the Board $617,705.88, $608,129.07 and $608,900.04, during the same fiscal years for the employer’s share of social security contributions for TPAF members as calculated on their base salaries. These amounts, which are not required to be budgeted, have been included in the financial statements, and the combining and individual fund and account group statements and schedules as revenues and expenditures in accordance in GASB 27. Vesting and Benefit Provisions - The vesting and benefit provisions for PERS are set by N.J.S.A. 43:15A and 43.3B, and N.J.S.A. 18A:6C for TPAF. All benefits vest after eight to ten years of service, except for medical benefits that vest after 25 years of service. Retirement benefits for age and service are available at age 60 and are generally determined to be 1/60 of the final average salary for each year of service credit, as defined. Final average salary equals the average salary for the final three years of service prior to retirement (or highest three years' compensation if other than the final three years). Members may seek early retirement after achieving 25 years of service credit or they may elect deferred retirement after achieving eight to ten years of service in which case benefits would begin the first day of the month after the member attains normal retirement age. The TPAF and PERS provides for specified medical benefits for members who retire after achieving 25 years of qualified service, as defined, or under the disability provisions of the System. Members are always fully vested for their own contributions and, after three years of service credit, become vested for 2% of related interest earned on the contributions. In the case of death before retirement, members' beneficiaries are entitled to full interest credited to the members' accounts. Significant Legislation Chapter 78, P.L. 2011, effective June 28, 2011 made various changes to the manner in which the Public Employees’ Retirement System (PERS) and the Teacher’s Pension and Annuity Fund (TPAF) operate and to the benefit provisions of those systems. Chapter 78’s provisions impacting employee pension and health benefits include:
• New members of the PERS and TPAF hired on or after June 28, 2011 (Tier 5 members) will need 30 years of creditable service and age 65 for receipt of the early retirement benefit without a reduction of ¼ of 1% for each month that the member is under age 65.
• The eligibility age to qualify for a service retirement in the systems is increased from age 63 to 65 for Tier 5 members.
• Increases in active member contribution rates. PERS active member rates increase from 5.5% of annual compensation to 6.5% plus an additional 1% phased-in over 7 years. For fiscal year 2013, the member contribution rates increased in October 2012. The phase-in of the additional incremental member contribution rates for PERS members will take place in July of each subsequent fiscal year.
• The payment of automatic cost-of-living adjustment (COLA) additional increases to current and future retirees and beneficiaries is suspended until reactivated as permitted by this law.
• New employee contribution requirements towards the cost of employer-provided health benefit coverage. Employees are required to contribute a certain percentage of the cost of coverage. The rate of contribution is determined based on the employee’s annual salary and the selected level of coverage. The increased employee contributions will be phased in over a 4-year period for those employed prior to Chapter 78’s effective date with a minimum contribution required to be at least 1.5% of salary.
• In addition, this new legislation changes the method for amortizing the pension systems’ unfunded accrued liability (from a level percent of pay method to a level dollar of pay).
43

City of Wildwood School District Notes to Financial Statements June 30, 2017
Chapter 1, P.L. 2010, effective May 21, 2010, made a number of changes to the State-administered retirement systems concerning eligibility, the retirement allowance formula, the definition of compensation, the positions eligible for service credit, the non-forfeitable right to a pension, the prosecutor’s part of the PERS, and employer contributions to the retirement systems. Also, Chapter 1, P.L. 2010 changed the membership eligibility criteria for new members of PERS and TPAF from the amount of annual compensation to the number of hours worked weekly. Also, it returned the benefit multiplier for new members of PERS and TPAF to 1/60th from 1/55th, and it provided that new members of PERS and TPAF have the retirement allowance calculated using the average annual compensation for the last five years of service instead of the last three years of service. New members of PERS and TPAF will no longer receive pension service credit from more than one employer. Pension service credit will be earned for the highest paid position only. The law also requires the State to make its full pension contribution, defined as 1/7th of the required amount, beginning in fiscal years 2012. Chapter 3, P.L. 2010, effective May 21, 2010, replaced the accidental and ordinary disability retirement for new members of the PERS and TPAF with disability insurance coverage similar to that provided by the State to individuals enrolled in the State’s Defined Contribution Retirement Program. Chapter 92, P.L. 2007 implemented certain recommendations contained in the December 1, 2006 report of the Joint Legislative Committee on Public Employee Benefits Reform; established a DCRP for elected and certain appointed officials, effective July 1, 2007; the new pension loan interest rate became 4.69% per year, and an $8.00 processing fee per loan was charged, effective January 1, 2008. The legislation also removed language from existing law that permits the State Treasurer to reduce employer pension contributions needed to fund the Funds and Systems when excess assets are available. NOTE 10: PUBLIC EMPLOYEES RETIREMENT SYSTEM At June 30, 2017, the District reported a liability of $7,448,975.00 for its proportionate share of the net pension liability. The net pension liability was measured as of June 30, 2016, and the total pension liability used to calculate the net pension liability was determined by an actuarial valuation as of that date. The District’s proportion of the net pension liability was based on a projection of the District’s long-term share of contributions to the pension plan relative to the projected contributions of all participating employers, actuarially determined. At June 30, 2016, the District’s proportion was 0.02515089960%, which was an increase of 4.46% from its proportion measured as of June 30, 2015. For the year ended June 30, 2017, the District recognized pension expense of $739,562.00. At June 30, 2017, the District reported deferred outflows of resources and deferred inflows of resources related to PERS from the following sources:
Deferred Outflows Deferred Inflowsof Resources of Resources
Differences between expected and actual experience 138,528.00$ Changes of assumptions 1,543,030.00 Net difference between projected and actual earnings on pension plan investments 284,036 Changes in proportion and differences between District contributions and proportionate share of contributions 297,151.00 (168,979.00) District contributions subsequent to the measurement date 223,437.00
Total 2,486,182.00$ (168,979.00)$
44

City of Wildwood School District Notes to Financial Statements June 30, 2017
$223,437.00 reported as deferred outflows of resources related to pensions resulting from school district contributions subsequent to the measurement date (June 30, 2016) will be recognized as a reduction of the net pension liability in the year ended June 30, 2017. Other amounts reported as deferred outflows of resources and deferred inflows of resources related to pensions will be recognized in pension expense as follows:
Year ended June 30,
2018 473,832.00$ 2019 473,832.00 2020 541,688.00 2021 453,302.00 2022 151,112.00 Total 2,093,766.00$
Actuarial Assumptions The total pension liability for the June 30, 2016 measurement date was determined by an actuarial valuation of July 1, 2015, which was rolled forward to June 30, 2016. This actuarial valuation used the following assumptions, applied to all period in the measurement:
Inflation rate 3.08%
Salary increases:
Through 2026 1.65% - 4.15% (based on age)
Thereafter 2.65% - 5.15% (based on age)
Investment rate of return: 7.65%
Pre-retirement mortality rates were based on the RP-2000 Employee Preretirement Mortality Table for male and female active participants. For State employees, mortality tables are set back 4 years for males and females. For local employees, mortality tables are set back 2 years for males and 7 years for females. In addition, the tables provide for future improvements in mortality from the base year of 2014 using a generational approach based on the plan actuary’s modified MP-2014 projection scale. Post-retirement mortality rates were based on the RP-2000 Combined Healthy Male and Female Mortality Tables (set back 1 year for males and females) for service retirements and beneficiaries of former members and a one-year static projection based on mortality improvement Scale AA. In addition, the tables for service retirements and beneficiaries of former members provide for future improvements in mortality from the base year of 2013 using a generational approach based on the plan actuary’s modified MP-2014 projection scale. Disability retirement rates used to value disabled retirees were based on the RP-2000 Disabled Mortality Table (set back 3 years for males and set forward 1 year for females).
The actuarial assumptions used in the July 1, 2015 valuation were based on the results of an actuarial experience study for the period July 1, 2011 to June 30, 2014. It is likely that future experience will not exactly conform to these assumptions. To the extent that actual experience deviates from these assumptions, the emerging liabilities may be higher or lower than anticipated. The more experience deviates, the larger the impact on future financial statements.
45
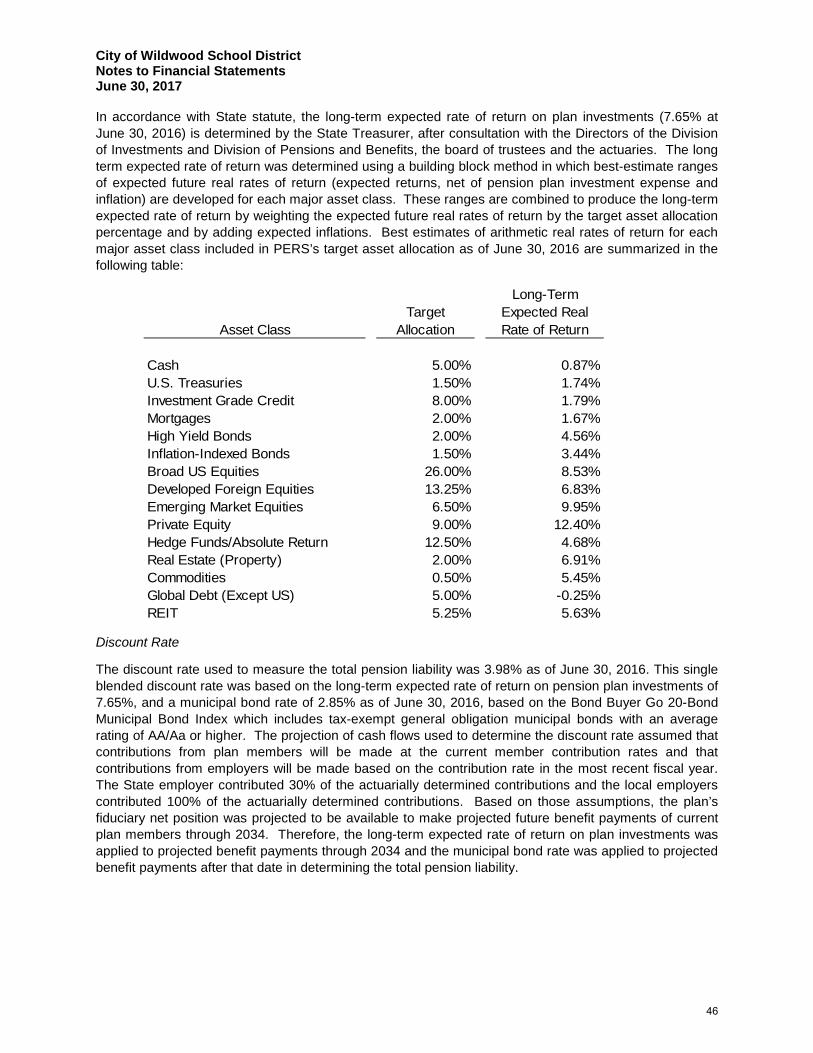
City of Wildwood School District Notes to Financial Statements June 30, 2017
In accordance with State statute, the long-term expected rate of return on plan investments (7.65% at June 30, 2016) is determined by the State Treasurer, after consultation with the Directors of the Division of Investments and Division of Pensions and Benefits, the board of trustees and the actuaries. The long term expected rate of return was determined using a building block method in which best-estimate ranges of expected future real rates of return (expected returns, net of pension plan investment expense and inflation) are developed for each major asset class. These ranges are combined to produce the long-term expected rate of return by weighting the expected future real rates of return by the target asset allocation percentage and by adding expected inflations. Best estimates of arithmetic real rates of return for each major asset class included in PERS’s target asset allocation as of June 30, 2016 are summarized in the following table:
Long-TermTarget Expected Real
Asset Class Allocation Rate of Return
Cash 5.00% 0.87%U.S. Treasuries 1.50% 1.74%Investment Grade Credit 8.00% 1.79%Mortgages 2.00% 1.67%High Yield Bonds 2.00% 4.56%Inflation-Indexed Bonds 1.50% 3.44%Broad US Equities 26.00% 8.53%Developed Foreign Equities 13.25% 6.83%Emerging Market Equities 6.50% 9.95%Private Equity 9.00% 12.40%Hedge Funds/Absolute Return 12.50% 4.68%Real Estate (Property) 2.00% 6.91%Commodities 0.50% 5.45%Global Debt (Except US) 5.00% -0.25%REIT 5.25% 5.63%
Discount Rate
The discount rate used to measure the total pension liability was 3.98% as of June 30, 2016. This single blended discount rate was based on the long-term expected rate of return on pension plan investments of 7.65%, and a municipal bond rate of 2.85% as of June 30, 2016, based on the Bond Buyer Go 20-Bond Municipal Bond Index which includes tax-exempt general obligation municipal bonds with an average rating of AA/Aa or higher. The projection of cash flows used to determine the discount rate assumed that contributions from plan members will be made at the current member contribution rates and that contributions from employers will be made based on the contribution rate in the most recent fiscal year. The State employer contributed 30% of the actuarially determined contributions and the local employers contributed 100% of the actuarially determined contributions. Based on those assumptions, the plan’s fiduciary net position was projected to be available to make projected future benefit payments of current plan members through 2034. Therefore, the long-term expected rate of return on plan investments was applied to projected benefit payments through 2034 and the municipal bond rate was applied to projected benefit payments after that date in determining the total pension liability.
46

City of Wildwood School District Notes to Financial Statements June 30, 2017
Sensitivity of the District’s proportionate share of the net pension liability to changes in the discount rate.
The following presents the collective net pension liability of the participated employers as of June 30, 2016, calculated using the discount rate as disclosed above as well as what the collective net pension liability would be if it was calculated using a discount rate that is 1-percentage point lower or 1-percentage point higher than the current rate:
1% Current Discount 1%Decrease Rate Increase(2.98%) (3.98%) (4.98%)
District's proportionate share ofthe net pension liability 8,926,879.51$ 7,448,975.00 6,230,146.73 Pension plan fiduciary net position. Detailed information about the pension plan’s fiduciary net position is available in the separately issued PERS financial report. NOTE 11. TEACHERS’ PENSION AND ANNUITY FUND (TPAF) At June 30, 2017, the District reported a liability for its proportionate share of the net pension liability that reflected a reduction for State pension support provided to the District. The amount recognized by the District as its proportionate share of the net pension liability, the related State support, and the total portion of the net pension liability that was associated with the District were as follows:
District's proprotionate share of the net pension liability -$
State's proprotionate share of the net position liability associated with the District 62,716,328.00
Total 62,716,328.00$ The net pension liability was measured as of June 30, 2016 and the total pension liability to calculate the net pension liability was determined by an actuarial valuation as of that date. The District’s proportion of the net pension liability was based on a projection of the District’s long-term share of contributions to the pension plan relative to the projected contributions of all participating school districts and the State, actuarially determined. At June 30, 2016, the District’s proportion was 0.00%, which was no change from its proportion measured as of June 30, 2015.
This space is intentionally left blank
47

City of Wildwood School District Notes to Financial Statements June 30, 2017
For the year ended June 30, 2017, the District recognized pension expense of $4,712,259.00 and revenue of $4,712,259.00 for support provided by the State. At June 30, 2016, the District reported deferred outflows of resources and deferred inflows of resources related to TPAF from the following sources:
Deferred Outflows Deferred Inflowsof Resources of Resources
Differences between expected and actual experience 221,013.00$ (107,255.00) Changes of assumptions 12,518,932.00 Net difference betweenn projected and actual earnings on pension plan investments 114,830.00 Changes in proportion and differences between District contributions and proportionate share of contributions (386,590.00) District contributions subsequent to the measurement date 634,925.00
Total 13,489,700.00$ (493,845.00)
$634,925.00 reported as deferred outflows of resources related to pensions resulting from district contributions subsequent to the measurement date (June 30, 2016) will be recognized as a reduction of the net pension liability in the year ended June 30, 2017. Other amounts reported as deferred outflows of resources and deferred inflows of resources related to pensions will be recognized in pension expense as follows:
Year ended June 30,
2018 1,967,042.00$ 2019 1,967,042.00 2020 2,304,351.00 2021 2,155,078.00 2022 1,820,445.00
Thereafter 3,175,972.00 Total 13,389,930.00$
This space is intentionally left blank
48
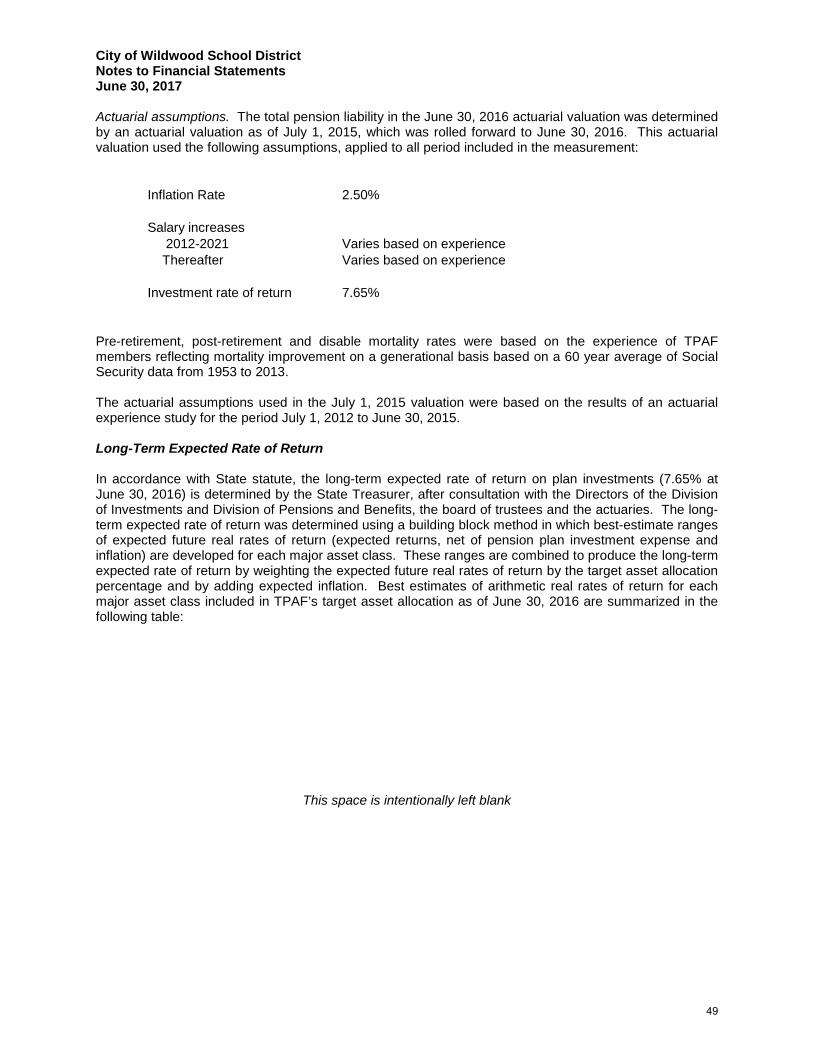
City of Wildwood School District Notes to Financial Statements June 30, 2017
Actuarial assumptions. The total pension liability in the June 30, 2016 actuarial valuation was determined by an actuarial valuation as of July 1, 2015, which was rolled forward to June 30, 2016. This actuarial valuation used the following assumptions, applied to all period included in the measurement:
Inflation Rate 2.50%
Salary increases 2012-2021 Varies based on experience Thereafter Varies based on experience
Investment rate of return 7.65%
Pre-retirement, post-retirement and disable mortality rates were based on the experience of TPAF members reflecting mortality improvement on a generational basis based on a 60 year average of Social Security data from 1953 to 2013. The actuarial assumptions used in the July 1, 2015 valuation were based on the results of an actuarial experience study for the period July 1, 2012 to June 30, 2015. Long-Term Expected Rate of Return In accordance with State statute, the long-term expected rate of return on plan investments (7.65% at June 30, 2016) is determined by the State Treasurer, after consultation with the Directors of the Division of Investments and Division of Pensions and Benefits, the board of trustees and the actuaries. The long-term expected rate of return was determined using a building block method in which best-estimate ranges of expected future real rates of return (expected returns, net of pension plan investment expense and inflation) are developed for each major asset class. These ranges are combined to produce the long-term expected rate of return by weighting the expected future real rates of return by the target asset allocation percentage and by adding expected inflation. Best estimates of arithmetic real rates of return for each major asset class included in TPAF’s target asset allocation as of June 30, 2016 are summarized in the following table:
This space is intentionally left blank
49
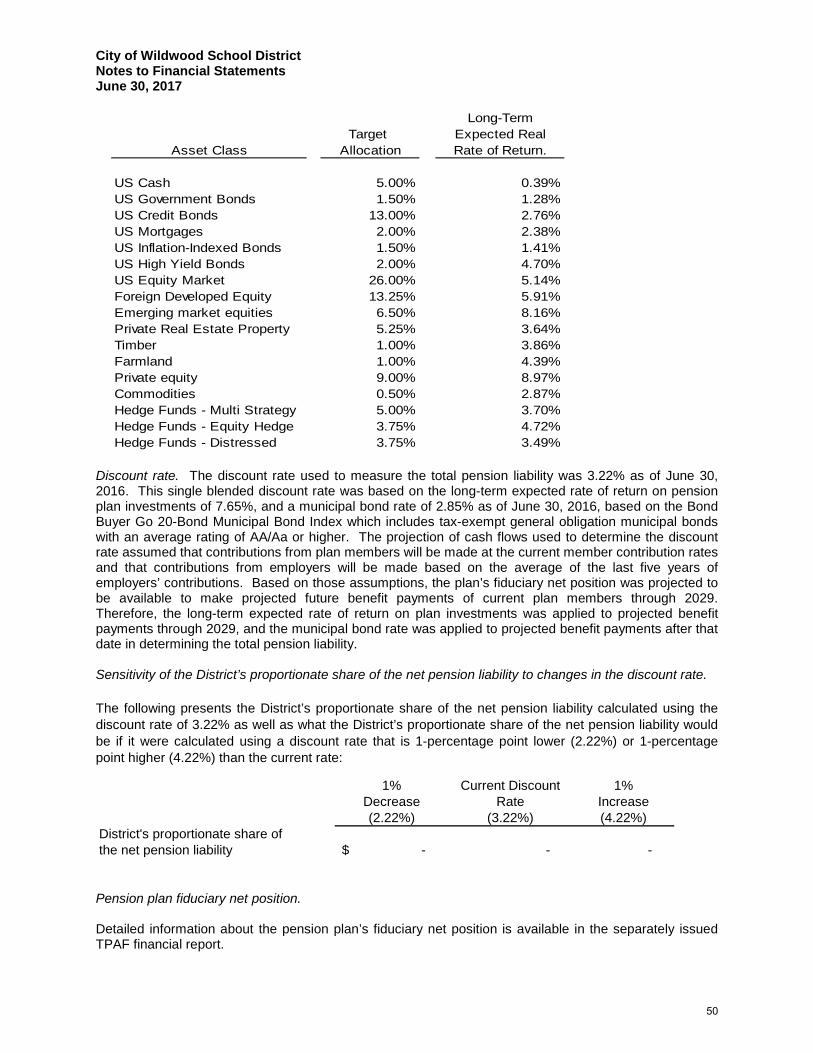
City of Wildwood School District Notes to Financial Statements June 30, 2017
Long-TermTarget Expected Real
Asset Class Allocation Rate of Return.
US Cash 5.00% 0.39%US Government Bonds 1.50% 1.28%US Credit Bonds 13.00% 2.76%US Mortgages 2.00% 2.38%US Inflation-Indexed Bonds 1.50% 1.41%US High Yield Bonds 2.00% 4.70%US Equity Market 26.00% 5.14%Foreign Developed Equity 13.25% 5.91%Emerging market equities 6.50% 8.16%Private Real Estate Property 5.25% 3.64%Timber 1.00% 3.86%Farmland 1.00% 4.39%Private equity 9.00% 8.97%Commodities 0.50% 2.87%Hedge Funds - Multi Strategy 5.00% 3.70%Hedge Funds - Equity Hedge 3.75% 4.72%Hedge Funds - Distressed 3.75% 3.49%
Discount rate. The discount rate used to measure the total pension liability was 3.22% as of June 30, 2016. This single blended discount rate was based on the long-term expected rate of return on pension plan investments of 7.65%, and a municipal bond rate of 2.85% as of June 30, 2016, based on the Bond Buyer Go 20-Bond Municipal Bond Index which includes tax-exempt general obligation municipal bonds with an average rating of AA/Aa or higher. The projection of cash flows used to determine the discount rate assumed that contributions from plan members will be made at the current member contribution rates and that contributions from employers will be made based on the average of the last five years of employers’ contributions. Based on those assumptions, the plan’s fiduciary net position was projected to be available to make projected future benefit payments of current plan members through 2029. Therefore, the long-term expected rate of return on plan investments was applied to projected benefit payments through 2029, and the municipal bond rate was applied to projected benefit payments after that date in determining the total pension liability. Sensitivity of the District’s proportionate share of the net pension liability to changes in the discount rate. The following presents the District’s proportionate share of the net pension liability calculated using the discount rate of 3.22% as well as what the District’s proportionate share of the net pension liability would be if it were calculated using a discount rate that is 1-percentage point lower (2.22%) or 1-percentage point higher (4.22%) than the current rate:
1% Current Discount 1%Decrease Rate Increase(2.22%) (3.22%) (4.22%)
District's proportionate share ofthe net pension liability -$ - -
Pension plan fiduciary net position. Detailed information about the pension plan’s fiduciary net position is available in the separately issued TPAF financial report.
50
City of Wildwood School District Notes to Financial Statements June 30, 2017
NOTE 12 – POST-RETIREMENT BENEFITS The School District contributes to the New Jersey State Health Benefits Program (“the SHBP”), a cost sharing multiple-employer defined benefit post-employment healthcare plan administered by the State of New Jersey Division of Pensions and Benefits. SHBP provides medical, prescription drug, mental health/substance abuse and Medicare Part B reimbursement to retirees and their covered dependents. The State Health Benefits Program is found in the New Jersey Statutes Annotated, Title 52, Article 17.25 et seq. Rules governing the operation and administration of the program are found in Title 17, Chapter 9 of the New Jersey Administrative Code. The Division of Pension and Benefits issues a publicly available financial report that includes the financial statements and required supplementary information for the Public Employees Retirement System and the Teachers' Pension and Annuity Fund. These reports may be obtained by writing to the Division of Pensions and Benefits, PO Box 295, Trenton, New Jersey, 08625. Chapter 384 of Public Laws 1987 and Chapter 6 of Public Laws 1990 required TPAF and PERS, respectively, to fund post-retirement medical benefits for those State employees who retire after accumulating 25 years of credited service or on a disability retirement. P.L. 2008, C. 103 amended the law to eliminate the funding and payment of post-retirement medical benefits for retired state employees through TPAF and PERS. It created separate funds outside of the pension plans for the funding and payment of post-retirement medical benefits for retired state employees and retired educational employees. As of June 30, 2012, there were 97,661 retirees eligible for post-retirement medical benefits. The cost of these benefits is funded through contributions by the State in accordance with P.L. 1994, c.62. Funding of post-retirement medical premiums changed from a pre-funding basis to a pay-as-you-go basis beginning in fiscal year 1994. The State is also responsible for the cost attributable to P.L. 1992 c. 126 which provides free health benefits for members PERS and the Alternative Benefit Program who retired from a board of education or county college with 25 years of service. The State paid $214.1 million toward Chapter 126 benefits for 19,056 eligible retired members in Fiscal Year 2015. The State also makes on-behalf payments for Teacher Pension and Annuity Program retirees for health benefits. The on-behalf amount paid by the State of New Jersey in fiscal year 2017 was $754,865.00. NOTE 13 – COMPENSATED ABSENCES The District accounts for compensated absences (e.g., unused vacation, sick leave) as directed by Governmental Accounting Standards Board Statement No. 16 (GASB 16), “Accounting for Compensated Absences”. A liability for compensated absences attributable to services already rendered and not contingent on a specific event that is outside the control of the employer and employee is accrued as employees earn the rights to the benefits. District employees are granted varying amounts of vacation and sick leave in accordance with the District’s personnel policies. Upon termination, employees are paid for accrued vacation. The District’s policy permits employees to accumulate unused sick leave and carry forward the full amount to subsequent years as long as it does not violate Title 18A. Upon retirement employees shall be paid by the District for unused sick leave in accordance with the District’s agreements with the various employee unions. The liability for vested compensated absences for the governmental fund types is recorded in current and long-term liabilities. The current portion of the compensated absences balance of the governmental funds is not considered material to the applicable funds total liabilities, and therefore is not shown separately from the long-term liability of compensated absences. The liability for vested compensated absences of the proprietary fund types is recorded within those funds as the benefits accrue to employees. As of June 30, 2017, no liability existed for compensated absences in the Food Service Enterprise Fund.
51
City of Wildwood School District Notes to Financial Statements June 30, 2017
NOTE 14 – DEFERRED COMPENSATION The District offers its employees a deferred compensation plan created in accordance with Internal Revenue Code Section 403(b). The plans, which are administered by the entities listed below, permit participants to defer a portion of their salary until future years. Amounts deferred under the plans are not available to employees until termination, retirement, death or unforeseeable emergency. The plan administrators are as follows: VALIC (Variable Annuity Life Insurance Co.)
Lincoln Investment Planning Inc. Thomas Seely Agency, Inc. Equitable (Equi-Vest) Smith Barney Siracusa Benefits Program
NOTE 15 – CAPITAL RESERVE ACCOUNT A capital reserve account was established by City of Wildwood Board of Education by the inclusion of $1.00 on October 10, 2000 for the accumulation of funds for use as capital outlay expenditures in subsequent fiscal years. The capital reserve account is maintained in the general fund and its activity is included in the general fund annual budget. Funds placed in the capital reserve account are restricted to capital projects in the district’s approved Long Range Facilities Plan (LRFP). Upon submission of the LRFP to the department, a district may increase the balance in the capital reserve by appropriating funds in the annual general fund budget certified for taxes pr by transfer by board resolution at year end of any unanticipated revenue or unexpended line-item appropriation amounts, or both. A district may also appropriate additional amounts when the express approval of the voters has been obtained by a separate proposal at budget time or by a special question at one of the four special elections authorized pursuant to N.J.S.A. 19:60-2. Pursuant to N.J.A.C. 6A:26-9.1(d)1, the balance in the account cannot at any time exceed the local support costs of uncompleted capital projects in its LRFP. The activity of the capital reserve for the July 1, 2016 to June 30, 2017 fiscal year is as follows:
Beginning Balance, July 1, 2016 604,298.00$
Excess Funds Transferred by BoardResolution - June 2017 201,000.00
805,298.00
Appropriated Withdrawal
Ending Balance, June 30, 2017 805,298.00$
NOTE 16 – RISK MANAGEMENT The District is exposed to various risks of loss related to torts; theft of, damage to, and destruction of assets; errors and omissions; injuries to employees; and natural disasters. Property and Liability Insurance – The District maintains commercial insurance coverage for property, liability and surety bonds. During the fiscal year ended June 30, 2017 the District did not incur claims in excess of their coverage and the amount of coverage did not significantly decrease.
52
City of Wildwood School District Notes to Financial Statements June 30, 2017
New Jersey Unemployment Compensation Insurance – The District has elected to fund its New Jersey Unemployment Compensation Insurance under the “Benefit Reimbursement Method”. Under this plan, the District is required to reimburse the New Jersey Unemployment Trust Fund for benefits paid to its former employees and charged to its account with the State. The District is billed quarterly for amounts due to the State. The following is a summary of District contributions, employee contributions, reimbursements to the State for benefits paid and the ending balance of the District’s expendable trust fund for the current and previous two years:
Interest on Employee/Board Amount EndingFiscal Year Investments Contributions Reimbursed Balance2016-2017 $ 427.82 56,067.16 (69,115.14) 78,700.72 2015-2016 326.01 58,051.84 (24,608.58) 91,320.88 2014-2015 206.58 25,758.00 (17,512.28) 57,551.61
NOTE 17 – CONTINGENT LIABILITIES Federal and State Grants The District participates in a number of federal and state grant programs. The grant programs are subject to program compliance audits by the grantors or their representatives. The District is potentially liable for expenditures which may be disallowed pursuant to the terms of these grant programs. Management is not aware of any material items of noncompliance would result in the disallowance of program expenditures. NOTE 18 – ECONOMIC DEPENDENCY The District receives support from federal government and from the state governments through local school districts. A significant reduction in the level of support, if this were to occur, would have an effect on the District’s programs and activities. NOTE 19 – LITIGATION From time to time, the District is a defendant in legal proceedings relating to its operations as a school district. NOTE 20 – COMMITMENTS The District does not have an encumbrance policy for the fiscal year end to determine significant encumbrances. All encumbrances are classified as Assigned Fund Balance in the General Fund and Special Revenue Fund. Significant encumbrances at June 30th are as follows;
Fund AmountGeneral Fund Encumbered Orders 19,469.82$
Special Revenue Fund - Encumbered Orders 3,703.84
23,173.66$
53
City of Wildwood School District Notes to Financial Statements June 30, 2017
NOTE 21 – FUND BALANCE APPROPRIATED General Fund – Of the $3,945,008.39 General Fund fund balance, at June 30, 2017, $19,469.82 is reserved for encumbrances, however $0.00 is shown as committed on the balance sheet since GASB requires that unassigned fund balance cannot be a deficit when assigned balances are available; $2,258,676.67 is reserved as excess surplus in accordance with NJSA 18A:7F-7 ($1,145,535.92 of the total reserve for excess surplus will be appropriated and included as anticipated revenue for the year ending June 30, 2017), $199,516.08 has been legally restricted and included as anticipated revenue for the year ending June 30, 2018. $805,298 has been reserved in the Capital Reserve Account; $501,000 has been reserved in a Maintenance Reserve Account; $250,000 has been reserved in an Emergency Reserve Account; and -69,482.36 is classified as unassigned, after adjusting. NOTE 22 – CALCULATION OF EXCESS SURPLUS In accordance with NJSA 18A:7F-7, as amended by P.L. 2004, c.73, the designation for Reserved Fund Balance – Excess Surplus is a required calculation. New Jersey school districts are required to reserve General Fund fund balance at the fiscal year end of June 30 if they did not appropriate a required minimum amount as budgeted fund balance in their subsequent years’ budget. The excess fund balance at June 30, 2017 is $2,258,676.67, of which $1,145,535.92 has been appropriated and included as anticipated revenue for the year ended June 30, 2018. NOTE 23 – DEFICIT FUND BALANCES The District has a deficit fund balance of $41,190.00 in the Special Revenue Fund as of June 30, 2017 as reported in the fund statements (modified accrual basis). N.J.S.A.18A:22-44.2 provides that in the event a state school aid payment is not made until the following school budget year, districts must record the last state aid payment as revenue, for budget purposes only, in the current school budget year. The bill provides legal authority for school districts to recognize this revenue in the current budget year. For intergovernmental transactions, GASB Statement No. 33 requires that recognition (revenue, expenditure, asset, liability) should be in symmetry, i.e., if one government recognizes an asset, the other government recognizes a liability. Since the State is recording the last state aid payment in the subsequent fiscal year, the school district cannot recognize the last state aid payment on the GAAP financial statements until the year the State records the payable. This amount was $41,190.00 in the Special Revenue Fund. Due to the timing difference of recording the last state aid payment, the Special Revenue Fund balance deficit does not alone indicate that the district is facing financial difficulties. NOTE 24 – SUBSEQUENT EVENTS Management has reviewed and evaluated all events and transactions that occurred from June 30, 2017 through November 27, 2017, the date that the financial statements were available to be issued for possible disclosure and recognition in the financial statements, and no items have come to the attention of the District that would require disclosure.
54

{THIS PAGE IS INTENTIONALLY LEFT BLANK}
REQUIRED SUPPLEMENTARY INFORMATION – PART II

BUDGETARY COMPARISON SCHEDULES


C-1
Varia
nce
Und
er/(O
ver)
Orig
inal
Budg
etFi
nal B
udge
tBu
dget
Tran
sfer
sFi
nal B
udge
tAc
tual
to A
ctua
lR
EVEN
UES
:Lo
cal S
ourc
es:
Loca
l Tax
Lev
y10
,868
,706
.00
$
10
,868
,706
.00
$
10,8
68,7
06.0
0$
-
$
Tuiti
on1,
034,
422.
00
1,03
4,42
2.00
1,
166,
433.
56
132,
011.
56
In
tere
st E
arne
d on
Inve
stm
ents
-
19,5
33.0
9
19,5
33.0
9
Mis
cella
neou
s60
,215
.00
60
,215
.00
11
1,70
6.31
51,4
91.3
1
Tota
l Loc
al S
ourc
es11
,963
,343
.00
-
11
,963
,343
.00
12,1
66,3
78.9
6
20
3,03
5.96
Stat
e So
urce
s:Ex
traor
dina
ry A
id50
,000
.00
50
,000
.00
39
,619
.00
(1
0,38
1.00
)
C
ateg
oric
al S
peci
al E
duca
tion
Aid
402,
345.
00
40
2,34
5.00
402,
345.
00
-
Eq
ualiz
atio
n Ai
d86
3,84
4.00
863,
844.
00
86
3,84
4.00
-
Cat
egor
ical
Sec
urity
Aid
277,
022.
00
27
7,02
2.00
277,
022.
00
-
Ad
just
men
t Aid
3,52
5,21
6.00
3,
525,
216.
00
3,52
5,21
6.00
-
C
ateg
oric
al T
rans
porta
tion
Aid
119,
536.
00
11
9,53
6.00
119,
536.
00
-
PA
RC
Rea
dine
ss A
id7,
750.
00
7,
750.
00
7,
750.
00
-
Per P
upil
Gro
wth
Aid
7,75
0.00
7,75
0.00
7,75
0.00
-
Pr
ofes
sion
al L
earn
ing
Com
mun
ity A
id7,
610.
00
7,
610.
00
7,
610.
00
-
TPAF
Con
tribu
tions
(On-
Beha
lf - N
on-B
udge
ted)
:Pe
nsio
n C
ontri
butio
ns-
90
5,95
4.00
905,
954.
00
Po
st R
etire
men
t Med
ical
Con
tribu
tions
754,
865.
00
75
4,86
5.00
Long
-Ter
m D
isab
ility
Insu
ranc
e1,
915.
00
1,91
5.00
TPAF
Soc
ial S
ecur
ity (R
eim
burs
ed-
Non
-Bud
gete
d)-
61
7,70
5.88
617,
705.
88
To
tal S
tate
Sou
rces
5,26
1,07
3.00
-
5,
261,
073.
00
7,53
1,13
1.88
2,
270,
058.
88
Fede
ral S
ourc
es:
Med
icai
d R
eim
burs
emen
t42
,825
.00
42
,825
.00
65
,238
.97
22
,413
.97
To
tal F
eder
al S
ourc
es42
,825
.00
-
42
,825
.00
65
,238
.97
22
,413
.97
To
tal R
even
ues
17,2
67,2
41.0
0
-
17,2
67,2
41.0
0
19
,762
,749
.81
2,49
5,50
8.81
Bud
geta
ry C
ompa
rison
Sch
edul
eG
ener
al F
und
CIT
Y O
F W
ILD
WO
OD
SC
HO
OL
DIS
TRIC
T
For t
he Y
ear E
nded
Jun
e 30
, 201
7
55

C-1
Varia
nce
Und
er/(O
ver)
Orig
inal
Budg
etFi
nal B
udge
tBu
dget
Tran
sfer
sFi
nal B
udge
tAc
tual
to A
ctua
l
Bud
geta
ry C
ompa
rison
Sch
edul
eG
ener
al F
und
CIT
Y O
F W
ILD
WO
OD
SC
HO
OL
DIS
TRIC
T
For t
he Y
ear E
nded
Jun
e 30
, 201
7
EXPE
ND
ITU
RES
:C
UR
REN
T EX
PEN
SER
EGU
LAR
PR
OG
RAM
S - I
NST
RU
CTI
ON
Pres
choo
l Sal
arie
s3,
000.
00$
3,
000.
00
53
7.60
2,46
2.40
Kind
erga
rten
Sala
ries
of T
each
ers
305,
957.
00
(9
0,00
0.00
)
215,
957.
00
20
6,42
2.59
9,53
4.41
Gra
des
1 - 5
Sal
arie
s of
Tea
cher
s1,
288,
186.
00
(23,
773.
84)
1,
264,
412.
16
1,26
4,41
2.16
-
G
rade
s 6
- 8 S
alar
ies
of T
each
ers
955,
438.
00
(6
3,23
0.56
)
892,
207.
44
86
0,54
9.98
31,6
57.4
6
Gra
des
9 - 1
2 Sa
larie
s of
Tea
cher
s1,
959,
281.
00
(72,
840.
00)
1,
886,
441.
00
1,82
0,98
2.53
65
,458
.47
R
egul
ar P
rogr
ams
- Hom
e In
stru
ctio
nSa
larie
s of
Tea
cher
s15
,000
.00
15
,000
.00
11
,064
.35
3,
935.
65
Pu
rcha
sed
Prof
essi
onal
- Ed
ucat
iona
l Ser
vice
s10
,000
.00
10
,000
.00
48
0.00
9,52
0.00
Reg
ular
Pro
gram
s - U
ndis
tribu
ted
Inst
ruct
ion
Pers
onal
Ser
vice
s - S
alar
ies
5,00
0.00
9,50
4.40
14,5
04.4
0
14,5
04.4
0
-
Oth
er S
alar
ies
for I
nstru
ctio
n75
0.00
75
0.00
67
5.00
75.0
0
Purc
hase
d Pr
ofes
sion
al -
Educ
atio
nal S
ervi
ces
28,0
00.0
0
21,0
25.0
0
49
,025
.00
49
,025
.00
-
Pu
rcha
sed
Tech
nica
l Ser
vice
s9,
000.
00
(3
,500
.00)
5,50
0.00
3,66
0.00
1,
840.
00
O
ther
Pur
chas
ed S
ervi
ces
(400
-500
ser
ies)
118,
500.
00
(6
,025
.00)
112,
475.
00
66
,429
.14
46
,045
.86
G
ener
al S
uppl
ies
288,
659.
00
10
,193
.29
298,
852.
29
24
2,77
1.49
56,0
80.8
0
Text
book
s15
,000
.00
-
15
,000
.00
11
,426
.13
3,
573.
87
O
ther
Obj
ects
10,5
00.0
0
10,5
00.0
0
3,65
8.85
6,
841.
15
TO
TAL
REG
ULA
R P
RO
GR
AMS
- IN
STR
UC
TIO
N5,
012,
271.
00
(218
,646
.71)
4,
793,
624.
29
4,55
6,59
9.22
23
7,02
5.07
Mul
tiple
Dis
abilt
ies
Sala
ries
of T
each
ers
255,
115.
00
18
,015
.00
273,
130.
00
27
1,05
6.98
2,07
3.02
Oth
er S
alar
ies
for I
nstru
ctio
n74
,059
.00
33
,613
.00
107,
672.
00
10
7,19
0.56
481.
44
Gen
eral
Sup
plie
s4,
000.
00
4,
000.
00
2,
575.
92
1,42
4.08
Text
book
s1,
000.
00
1,
000.
00
1,
000.
00
To
tal M
ultip
le D
isab
ilitie
s33
4,17
4.00
51,6
28.0
0
38
5,80
2.00
380,
823.
46
4,
978.
54
Res
ourc
e R
oom
/Res
ourc
e C
ente
rSa
larie
s of
Tea
cher
s1,
003,
016.
00
100,
940.
00
1,10
3,95
6.00
1,
103,
955.
40
0.60
Gen
eral
Sup
plie
s12
,000
.00
12
,000
.00
11
,822
.97
17
7.03
Te
xtbo
oks
2,00
0.00
2,00
0.00
2,00
0.00
Tota
l Res
ourc
e R
oom
/Res
ourc
e C
ente
r1,
017,
016.
00
100,
940.
00
1,11
7,95
6.00
1,
115,
778.
37
2,17
7.63
56

C-1
Varia
nce
Und
er/(O
ver)
Orig
inal
Budg
etFi
nal B
udge
tBu
dget
Tran
sfer
sFi
nal B
udge
tAc
tual
to A
ctua
l
Bud
geta
ry C
ompa
rison
Sch
edul
eG
ener
al F
und
CIT
Y O
F W
ILD
WO
OD
SC
HO
OL
DIS
TRIC
T
For t
he Y
ear E
nded
Jun
e 30
, 201
7
Pres
choo
l Dis
abilit
ies
- Ful
l Tim
eSa
larie
s of
Tea
cher
s59
,307
.00
59
,307
.00
59
,307
.00
-
O
ther
Sal
arie
s fo
r Ins
truct
ion
22,9
08.0
0
22,9
08.0
0
21,9
08.0
0
1,00
0.00
Gen
eral
Sup
plie
s1,
500.
00
1,
500.
00
21
3.32
1,28
6.68
Tota
l Pre
scho
ol D
isab
ilitie
s - F
ull T
ime
83,7
15.0
0
-
83,7
15.0
0
81,4
28.3
2
2,28
6.68
Hom
e In
stru
ctio
nSa
larie
s of
Tea
cher
s15
,000
.00
(1
2,50
0.00
)
2,50
0.00
948.
60
1,
551.
40
Pu
rcha
sed
Prof
essi
onal
- Ed
ucat
iona
l Ser
vice
s10
,000
.00
(5
,000
.00)
5,00
0.00
929.
20
4,
070.
80
To
tal H
ome
Inst
ruct
ion
25,0
00.0
0
(17,
500.
00)
7,
500.
00
1,
877.
80
5,62
2.20
TOTA
L SP
ECIA
L ED
UC
ATIO
N -
INST
RU
CTI
ON
1,45
9,90
5.00
13
5,06
8.00
1,
594,
973.
00
1,57
9,90
7.95
15
,065
.05
Basi
c Sk
ills/R
emed
ial
Sala
ries
of T
each
ers
200,
215.
00
10
0,83
9.00
30
1,05
4.00
299,
058.
89
1,
995.
11
To
tal B
asic
Ski
lls/R
emed
ial
200,
215.
00
10
0,83
9.00
30
1,05
4.00
299,
058.
89
1,
995.
11
Bilin
gual
Edu
catio
n - I
nstru
ctio
nSa
larie
s of
Tea
cher
s30
4,85
8.00
53,1
67.0
0
35
8,02
5.00
358,
024.
64
0.
36
O
ther
Sal
arie
s fo
r Ins
truct
ion
70,0
85.0
0
(2,5
00.0
0)
67
,585
.00
66
,799
.00
78
6.00
Su
pplie
s an
d M
ater
ials
2,00
0.00
2,00
0.00
2,00
0.00
Tota
l Bilin
gual
Edu
catio
n - I
nstru
ctio
n37
6,94
3.00
50,6
67.0
0
42
7,61
0.00
424,
823.
64
2,
786.
36
Scho
ol-S
pon.
Coc
urric
ular
Act
iviti
es -
Inst
ruct
ion
Sala
ries
81,0
00.0
0
81,0
00.0
0
77,7
29.5
0
3,27
0.50
Purc
hase
d Se
rvic
es (3
00-5
00 s
erie
s)4,
000.
00
4,
000.
00
1,
286.
00
2,71
4.00
Supp
lies
and
Mat
eria
ls7,
000.
00
-
7,
000.
00
6,
526.
14
473.
86
Oth
er O
bjec
ts1,
250.
00
1,
250.
00
86
5.00
385.
00
Tota
l Sch
ool-S
pon.
Coc
urric
ular
Act
iviti
es -
Inst
.93
,250
.00
-
93
,250
.00
86
,406
.64
6,
843.
36
57

C-1
Varia
nce
Und
er/(O
ver)
Orig
inal
Budg
etFi
nal B
udge
tBu
dget
Tran
sfer
sFi
nal B
udge
tAc
tual
to A
ctua
l
Bud
geta
ry C
ompa
rison
Sch
edul
eG
ener
al F
und
CIT
Y O
F W
ILD
WO
OD
SC
HO
OL
DIS
TRIC
T
For t
he Y
ear E
nded
Jun
e 30
, 201
7
Scho
ol-S
pon.
Coc
urric
ular
Ath
letic
s - I
nstru
ctio
nSa
larie
s34
7,11
6.00
347,
116.
00
32
4,98
4.30
22,1
31.7
0
Purc
hase
d Se
rvic
es (3
00-5
00 s
erie
s)57
,000
.00
(6
,300
.00)
50,7
00.0
0
32,7
69.2
6
17,9
30.7
4
Supp
lies
& M
ater
ials
80,0
00.0
0
5,60
0.00
85,6
00.0
0
79,3
87.8
9
6,21
2.11
Oth
er O
bjec
ts10
,000
.00
70
0.00
10
,700
.00
10
,686
.58
13
.42
To
tal S
choo
l-Spo
n. C
ocur
ricul
ar A
thle
tics
- Ins
t.49
4,11
6.00
-
494,
116.
00
44
7,82
8.03
46,2
87.9
7
Com
mun
ity S
ervi
ce O
pera
tions
Sala
ries
10,0
00.0
0
2,42
4.00
12,4
24.0
0
12,4
23.6
0
0.40
Purc
hase
d Se
rvic
es (3
00-5
00 s
erie
s)10
,000
.00
(2
,424
.00)
7,57
6.00
500.
00
7,
076.
00
Su
pplie
s &
Mat
eria
ls10
,000
.00
10
,000
.00
5,
370.
79
4,62
9.21
Tota
l Com
mun
ity S
ervi
ces
30,0
00.0
0
-
30,0
00.0
0
18,2
94.3
9
11,7
05.6
1
TOTA
L O
THER
INST
RU
CTI
ON
AL P
RO
GR
AMS-
INST
RU
CTI
ON
1,19
4,52
4.00
15
1,50
6.00
1,
346,
030.
00
1,27
6,41
1.59
69
,618
.41
TOTA
L IN
STR
UC
TIO
N7,
666,
700.
00
67,9
27.2
9
7,
734,
627.
29
7,41
2,91
8.76
32
1,70
8.53
UN
DIS
TRIB
UTE
D E
XPEN
DIT
UR
ESU
ndis
tribu
ted
Expe
nditu
res
- Ins
truct
ion
Tuiti
on to
Oth
er L
EAs
With
in th
e St
ate-
Reg
ular
131,
582.
00
(2
0,00
0.00
)
111,
582.
00
33
,476
.42
78
,105
.58
Tu
ition
to O
ther
LEA
s W
ithin
the
Stat
e-Sp
ecia
l25
,000
.00
25
,000
.00
25
,000
.00
Tu
ition
to C
ount
y Vo
c. S
choo
l Dis
t. - R
egul
ar27
2,20
0.00
272,
200.
00
27
2,20
0.00
-
Tuiti
on to
Cou
nty
Voc.
Sch
ool D
ist.
- Spe
cial
16,1
84.0
0
16,1
84.0
0
16,1
84.0
0
-
Tuiti
on to
CSS
D &
Reg
iona
l Day
Sch
ools
766,
137.
00
76
6,13
7.00
622,
937.
11
14
3,19
9.89
Tuiti
on to
Priv
ate
Scho
ols
for t
he D
isab
led
--
-
W
ithin
Sta
te17
4,90
9.00
174,
909.
00
13
2,97
5.37
41,9
33.6
3
Tuiti
on -
Stat
e Fa
cilit
ies
229,
234.
00
22
9,23
4.00
227,
418.
00
1,
816.
00
To
tal U
ndis
tribu
ted
Expe
nditu
res
- Ins
truct
ion
1,61
5,24
6.00
(2
0,00
0.00
)
1,59
5,24
6.00
1,
305,
190.
90
290,
055.
10
Und
istri
bute
d Ex
pend
. - A
ttend
. & S
ocia
l Wor
ker
Sala
ries
86,9
46.0
0
(10,
000.
00)
76
,946
.00
76
,497
.00
44
9.00
O
ther
Pur
chas
ed S
ervi
ces
(400
-500
ser
ies)
16,2
50.0
0
16,2
50.0
0
9,57
0.10
6,
679.
90
Su
pplie
s &
Mat
eria
ls25
0.00
25
0.00
25
0.00
To
tal U
ndis
t. Ex
pend
. - A
ttend
. & S
ocia
l Wor
ker
103,
446.
00
(1
0,00
0.00
)
93,4
46.0
0
86,0
67.1
0
7,37
8.90
58
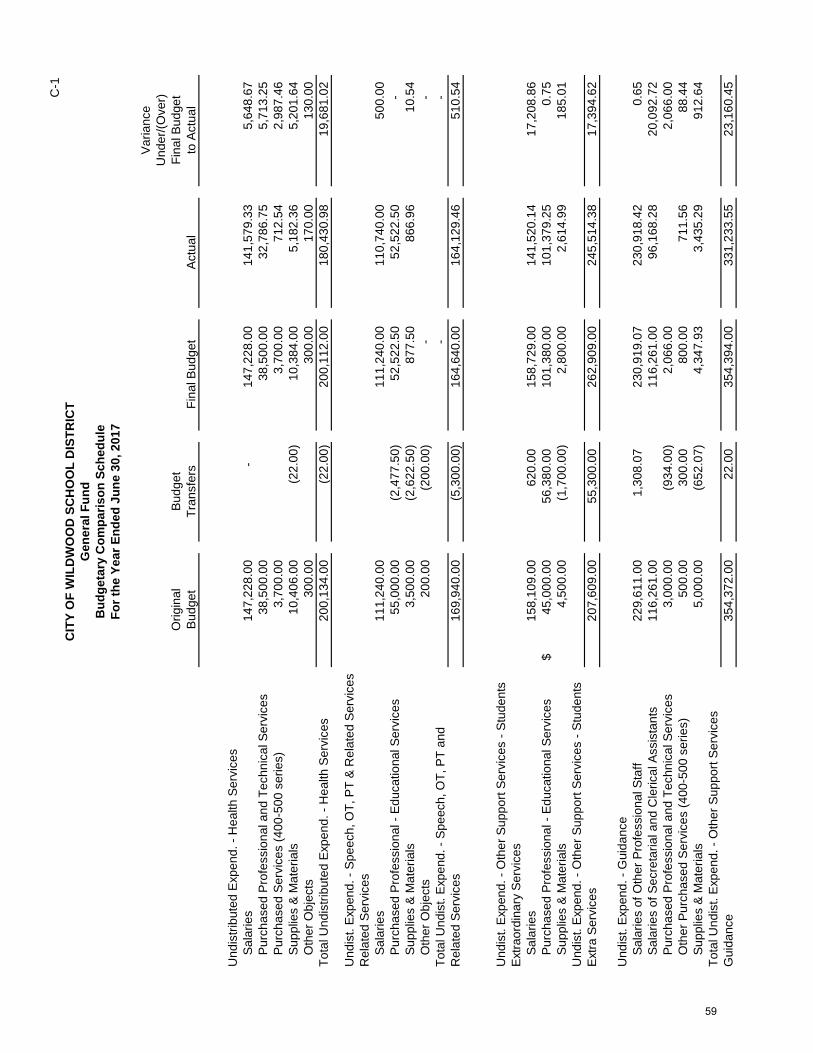
C-1
Varia
nce
Und
er/(O
ver)
Orig
inal
Budg
etFi
nal B
udge
tBu
dget
Tran
sfer
sFi
nal B
udge
tAc
tual
to A
ctua
l
Bud
geta
ry C
ompa
rison
Sch
edul
eG
ener
al F
und
CIT
Y O
F W
ILD
WO
OD
SC
HO
OL
DIS
TRIC
T
For t
he Y
ear E
nded
Jun
e 30
, 201
7
Und
istri
bute
d Ex
pend
. - H
ealth
Ser
vice
sSa
larie
s14
7,22
8.00
-
147,
228.
00
14
1,57
9.33
5,64
8.67
Purc
hase
d Pr
ofes
sion
al a
nd T
echn
ical
Ser
vice
s38
,500
.00
38
,500
.00
32
,786
.75
5,
713.
25
Pu
rcha
sed
Serv
ices
(400
-500
ser
ies)
3,70
0.00
3,70
0.00
712.
54
2,
987.
46
Su
pplie
s &
Mat
eria
ls10
,406
.00
(2
2.00
)
10
,384
.00
5,
182.
36
5,20
1.64
Oth
er O
bjec
ts30
0.00
30
0.00
17
0.00
130.
00
Tota
l Und
istri
bute
d Ex
pend
. - H
ealth
Ser
vice
s20
0,13
4.00
(22.
00)
200,
112.
00
18
0,43
0.98
19,6
81.0
2
Und
ist.
Expe
nd. -
Spe
ech,
OT,
PT
& R
elat
ed S
ervi
ces
Rel
ated
Ser
vice
sSa
larie
s11
1,24
0.00
111,
240.
00
11
0,74
0.00
500.
00
Purc
hase
d Pr
ofes
sion
al -
Educ
atio
nal S
ervi
ces
55,0
00.0
0
(2,4
77.5
0)
52
,522
.50
52
,522
.50
-
Su
pplie
s &
Mat
eria
ls3,
500.
00
(2
,622
.50)
877.
50
866.
96
10
.54
O
ther
Obj
ects
200.
00
(200
.00)
-
-
To
tal U
ndis
t. Ex
pend
. - S
peec
h, O
T, P
T an
d-
-
R
elat
ed S
ervi
ces
169,
940.
00
(5
,300
.00)
164,
640.
00
16
4,12
9.46
510.
54
Und
ist.
Expe
nd. -
Oth
er S
uppo
rt Se
rvic
es -
Stud
ents
Extra
ordi
nary
Ser
vice
sSa
larie
s15
8,10
9.00
620.
00
158,
729.
00
14
1,52
0.14
17,2
08.8
6
Purc
hase
d Pr
ofes
sion
al -
Educ
atio
nal S
ervi
ces
45,0
00.0
0$
56,3
80.0
0
10
1,38
0.00
101,
379.
25
0.
75
Su
pplie
s &
Mat
eria
ls4,
500.
00
(1
,700
.00)
2,80
0.00
2,61
4.99
18
5.01
U
ndis
t. Ex
pend
. - O
ther
Sup
port
Serv
ices
- St
uden
tsEx
tra S
ervi
ces
207,
609.
00
55
,300
.00
262,
909.
00
24
5,51
4.38
17,3
94.6
2
Und
ist.
Expe
nd. -
Gui
danc
eSa
larie
s of
Oth
er P
rofe
ssio
nal S
taff
229,
611.
00
1,
308.
07
23
0,91
9.07
230,
918.
42
0.
65
Sa
larie
s of
Sec
reta
rial a
nd C
leric
al A
ssis
tant
s11
6,26
1.00
116,
261.
00
96
,168
.28
20
,092
.72
Pu
rcha
sed
Prof
essi
onal
and
Tec
hnic
al S
ervi
ces
3,00
0.00
(934
.00)
2,
066.
00
2,
066.
00
O
ther
Pur
chas
ed S
ervi
ces
(400
-500
ser
ies)
500.
00
300.
00
800.
00
711.
56
88
.44
Su
pplie
s &
Mat
eria
ls5,
000.
00
(6
52.0
7)
4,34
7.93
3,43
5.29
91
2.64
To
tal U
ndis
t. Ex
pend
. - O
ther
Sup
port
Serv
ices
Gui
danc
e35
4,37
2.00
22.0
0
35
4,39
4.00
331,
233.
55
23
,160
.45
59
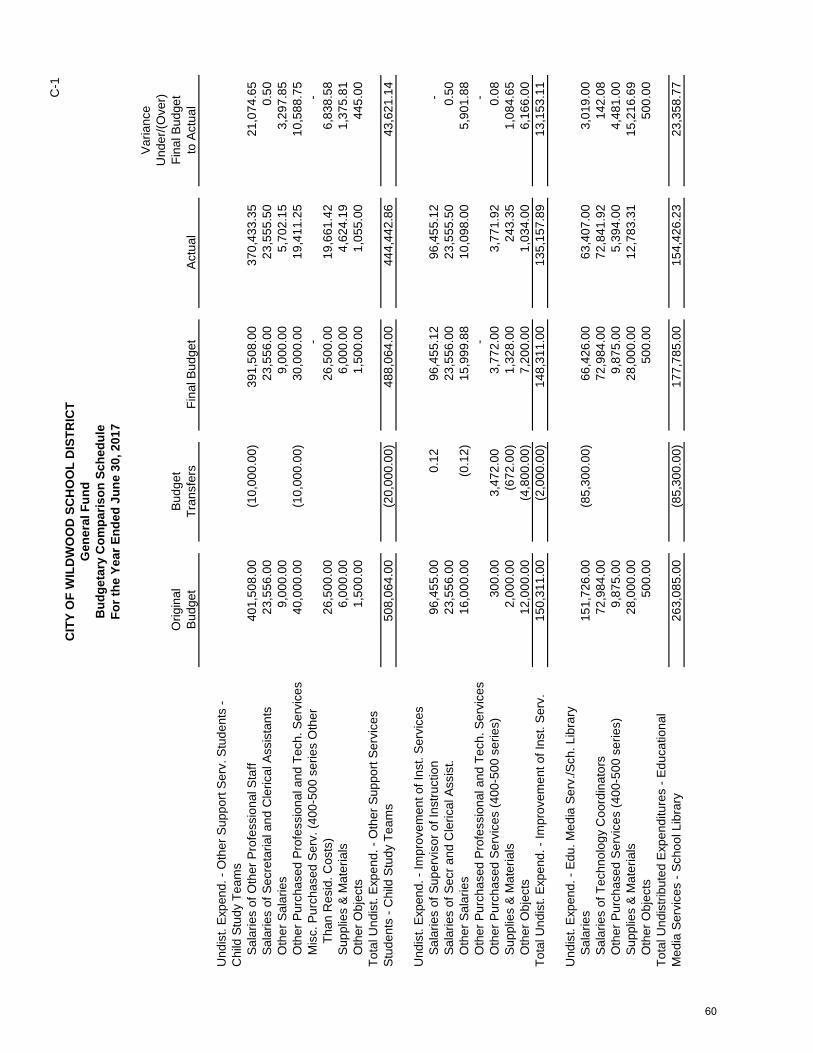
C-1
Varia
nce
Und
er/(O
ver)
Orig
inal
Budg
etFi
nal B
udge
tBu
dget
Tran
sfer
sFi
nal B
udge
tAc
tual
to A
ctua
l
Bud
geta
ry C
ompa
rison
Sch
edul
eG
ener
al F
und
CIT
Y O
F W
ILD
WO
OD
SC
HO
OL
DIS
TRIC
T
For t
he Y
ear E
nded
Jun
e 30
, 201
7
Und
ist.
Expe
nd. -
Oth
er S
uppo
rt Se
rv. S
tude
nts
-C
hild
Stu
dy T
eam
sSa
larie
s of
Oth
er P
rofe
ssio
nal S
taff
401,
508.
00
(1
0,00
0.00
)
391,
508.
00
37
0,43
3.35
21,0
74.6
5
Sala
ries
of S
ecre
taria
l and
Cle
rical
Ass
ista
nts
23,5
56.0
0
23,5
56.0
0
23,5
55.5
0
0.50
Oth
er S
alar
ies
9,00
0.00
9,00
0.00
5,70
2.15
3,
297.
85
O
ther
Pur
chas
ed P
rofe
ssio
nal a
nd T
ech.
Ser
vice
s40
,000
.00
(1
0,00
0.00
)
30,0
00.0
0
19,4
11.2
5
10,5
88.7
5
Mis
c. P
urch
ased
Ser
v. (4
00-5
00 s
erie
s O
ther
-
-
Th
an R
esid
. Cos
ts)
26,5
00.0
0
26,5
00.0
0
19,6
61.4
2
6,83
8.58
Supp
lies
& M
ater
ials
6,00
0.00
6,00
0.00
4,62
4.19
1,
375.
81
O
ther
Obj
ects
1,50
0.00
1,50
0.00
1,05
5.00
44
5.00
To
tal U
ndis
t. Ex
pend
. - O
ther
Sup
port
Serv
ices
Stud
ents
- C
hild
Stu
dy T
eam
s50
8,06
4.00
(20,
000.
00)
48
8,06
4.00
444,
442.
86
43
,621
.14
Und
ist.
Expe
nd. -
Impr
ovem
ent o
f Ins
t. Se
rvic
esSa
larie
s of
Sup
ervi
sor o
f Ins
truct
ion
96,4
55.0
0
0.12
96
,455
.12
96
,455
.12
-
Sa
larie
s of
Sec
r and
Cle
rical
Ass
ist.
23,5
56.0
0
23,5
56.0
0
23,5
55.5
0
0.50
Oth
er S
alar
ies
16,0
00.0
0
(0.1
2)
15
,999
.88
10
,098
.00
5,
901.
88
O
ther
Pur
chas
ed P
rofe
ssio
nal a
nd T
ech.
Ser
vice
s-
-
O
ther
Pur
chas
ed S
ervi
ces
(400
-500
ser
ies)
300.
00
3,47
2.00
3,77
2.00
3,77
1.92
0.
08
Su
pplie
s &
Mat
eria
ls2,
000.
00
(6
72.0
0)
1,32
8.00
243.
35
1,
084.
65
O
ther
Obj
ects
12,0
00.0
0
(4,8
00.0
0)
7,
200.
00
1,
034.
00
6,16
6.00
Tota
l Und
ist.
Expe
nd. -
Impr
ovem
ent o
f Ins
t. Se
rv.
150,
311.
00
(2
,000
.00)
148,
311.
00
13
5,15
7.89
13,1
53.1
1
Und
ist.
Expe
nd. -
Edu
. Med
ia S
erv.
/Sch
. Lib
rary
Sala
ries
151,
726.
00
(8
5,30
0.00
)
66,4
26.0
0
63,4
07.0
0
3,01
9.00
Sala
ries
of T
echn
olog
y C
oord
inat
ors
72,9
84.0
0
72,9
84.0
0
72,8
41.9
2
142.
08
Oth
er P
urch
ased
Ser
vice
s (4
00-5
00 s
erie
s)9,
875.
00
9,
875.
00
5,
394.
00
4,48
1.00
Supp
lies
& M
ater
ials
28,0
00.0
0
28,0
00.0
0
12,7
83.3
1
15,2
16.6
9
Oth
er O
bjec
ts50
0.00
50
0.00
50
0.00
To
tal U
ndis
tribu
ted
Expe
nditu
res
- Edu
catio
nal
Med
ia S
ervi
ces
- Sch
ool L
ibra
ry26
3,08
5.00
(85,
300.
00)
17
7,78
5.00
154,
426.
23
23
,358
.77
60

C-1
Varia
nce
Und
er/(O
ver)
Orig
inal
Budg
etFi
nal B
udge
tBu
dget
Tran
sfer
sFi
nal B
udge
tAc
tual
to A
ctua
l
Bud
geta
ry C
ompa
rison
Sch
edul
eG
ener
al F
und
CIT
Y O
F W
ILD
WO
OD
SC
HO
OL
DIS
TRIC
T
For t
he Y
ear E
nded
Jun
e 30
, 201
7
Und
ist.
Expe
nd. -
Inst
r. St
aff T
rain
ing
Serv
.Pu
rcha
sed
Prof
essi
onal
- Ed
ucat
iona
l Ser
vice
s45
,000
.00
7,
650.
00
52
,650
.00
52
,650
.00
-
O
ther
Pur
chas
ed S
ervi
ces
(400
-500
ser
ies)
7,50
0.00
(5,6
50.0
0)
1,
850.
00
73
5.64
1,11
4.36
Supp
lies
& M
ater
ials
1,00
0.00
1,00
0.00
1,00
0.00
Tota
l Und
istri
bute
d Ex
pend
iture
s - I
nstr.
Sta
ff Tr
aini
ng S
erv.
53,5
00.0
0
2,00
0.00
55,5
00.0
0
53,3
85.6
4
2,11
4.36
Und
ist.
Expe
nd. -
Sup
p. S
erv.
- G
ener
al A
dmin
.Sa
larie
s20
3,07
1.00
16,4
84.0
0
21
9,55
5.00
219,
554.
26
0.
74
Le
gal S
ervi
ces
50,0
00.0
0
25,0
00.0
0
75
,000
.00
64
,378
.39
10
,621
.61
Au
dit S
ervi
ces
32,0
00.0
0
32,0
00.0
0
30,0
50.0
0
1,95
0.00
Arch
itect
Ser
vice
s20
,000
.00
(1
5,75
9.00
)
4,24
1.00
4,24
1.00
Oth
er P
urch
ased
Pro
fess
iona
l Ser
vice
s12
,000
.00
12
,000
.00
4,
547.
50
7,45
2.50
Com
mun
icat
ions
/Tel
epho
ne73
,100
.00
15
,000
.00
88,1
00.0
0
45,7
29.0
0
42,3
71.0
0
Oth
er P
urch
ased
Ser
vice
s (4
00-5
00 s
erie
s)51
,000
.00
51
,000
.00
47
,477
.02
3,
522.
98
G
ener
al S
uppl
ies
10,5
00.0
0
10,5
00.0
0
4,28
2.04
6,
217.
96
M
isce
llane
ous
Expe
nditu
res
6,00
0.00
6,00
0.00
5,48
3.00
51
7.00
BO
E M
embe
rshi
p D
ues
and
Fees
9,50
0.00
9,50
0.00
9,00
6.00
49
4.00
To
tal U
ndis
t Exp
end
- Gen
eral
Adm
inis
tratio
n46
7,17
1.00
40,7
25.0
0
50
7,89
6.00
430,
507.
21
77
,388
.79
Und
ist.
Expe
nd. -
Sup
p. S
erv.
- Sc
hool
Adm
in.
Sala
ries
of P
rinci
pals
/Ass
ista
nce
Prin
cipa
ls36
7,70
6.00
351.
00
368,
057.
00
36
8,05
5.00
2.00
Sala
ries
of O
ther
Pro
fess
iona
l Sta
ff46
,225
.00
7,
705.
00
53
,930
.00
53
,928
.92
1.
08
Sa
larie
s of
Sec
reta
rial a
nd C
leric
al A
ssis
tant
s20
9,92
3.00
26,7
49.2
8
23
6,67
2.28
232,
455.
94
4,
216.
34
O
ther
Sal
arie
s2,
000.
00
2,
035.
72
4,
035.
72
4,
035.
72
-
Oth
er P
urch
ased
Pro
fess
iona
l and
Tec
h. S
ervi
ces
500.
00
500.
00
500.
00
Oth
er P
urch
ased
Ser
vice
s (4
00-5
00 s
erie
s)17
,800
.00
10
,000
.00
27,8
00.0
0
14,2
01.5
6
13,5
98.4
4
Supp
lies
& M
ater
ials
19,8
00.0
0
10,0
00.0
0
29
,800
.00
18
,531
.73
11
,268
.27
O
ther
Obj
ects
4,90
0.00
4,90
0.00
3,86
9.00
1,
031.
00
To
tal U
ndis
tribu
ted
Expe
nditu
res
- Sup
port
Serv
ices
- Sc
hool
Adm
inis
tratio
n66
8,85
4.00
56,8
41.0
0
72
5,69
5.00
695,
077.
87
30
,617
.13
61

C-1
Varia
nce
Und
er/(O
ver)
Orig
inal
Budg
etFi
nal B
udge
tBu
dget
Tran
sfer
sFi
nal B
udge
tAc
tual
to A
ctua
l
Bud
geta
ry C
ompa
rison
Sch
edul
eG
ener
al F
und
CIT
Y O
F W
ILD
WO
OD
SC
HO
OL
DIS
TRIC
T
For t
he Y
ear E
nded
Jun
e 30
, 201
7
Und
ist.
Expe
nd. -
Cen
tral S
ervi
ces
Sala
ries
256,
660.
00
25
6,66
0.00
255,
960.
00
70
0.00
Pu
rcha
sed
Prof
essi
onal
Ser
vice
s30
,000
.00
30
,000
.00
20
,736
.88
9,
263.
12
M
isce
llane
ous
Purc
h. S
ervi
ces
(400
-500
Ser
ies)
4,00
0.00
4,00
0.00
2,87
0.73
1,
129.
27
Su
pplie
s &
Mat
eria
ls12
,500
.00
10
,000
.00
22,5
00.0
0
8,81
5.38
13
,684
.62
In
tere
st o
n Le
ase
Purc
hase
Agr
eem
ents
9,11
6.00
9,11
6.00
9,11
5.50
0.
50
O
ther
Obj
ects
2,50
0.00
2,50
0.00
1,22
0.00
1,
280.
00
To
tal U
ndis
t. Ex
pend
. - C
entra
l Ser
vice
s31
4,77
6.00
10,0
00.0
0
32
4,77
6.00
298,
718.
49
26
,057
.51
Und
ist.
Expe
nd. -
Adm
in In
fo. T
echn
olog
ySa
larie
s41
,840
.00
41
,840
.00
41
,839
.92
0.
08
Pu
rcha
sed
Tech
nica
l Ser
vice
s10
,000
.00
10
,000
.00
20,0
00.0
0
14,6
96.7
6
5,30
3.24
Oth
er P
urch
ased
Ser
vice
s (4
00-5
00 s
erie
s)29
,000
.00
10
,000
.00
39,0
00.0
0
23,0
05.1
1
15,9
94.8
9
Supp
lies
& M
ater
ials
5,00
0.00
5,00
0.00
1,20
5.24
3,
794.
76
To
tal U
ndis
t. Ex
pend
. - A
dmin
Info
. Tec
hnol
ogy
85,8
40.0
0
20,0
00.0
0
10
5,84
0.00
80,7
47.0
3
25,0
92.9
7
Und
ist.
Expe
nd. -
Req
uire
d M
aint
. Sch
ool F
acilit
ies
Sala
ries
123,
135.
00
12
3,13
5.00
116,
819.
52
6,
315.
48
C
lean
ing,
Rep
air a
nd M
aint
enan
ce S
ervi
ce12
5,00
0.00
(10,
000.
00)
11
5,00
0.00
106,
133.
26
8,
866.
74
G
ener
al S
uppl
ies
81,8
65.0
0
(10,
000.
00)
71
,865
.00
51
,604
.51
20
,260
.49
To
tal U
ndis
tribu
ted
Expe
nditu
res
- Req
uire
d-
M
aint
enan
ce fo
r Sch
ool F
acilit
ies
330,
000.
00
(2
0,00
0.00
)
310,
000.
00
27
4,55
7.29
35,4
42.7
1
Und
ist.
Expe
nd. -
Cus
todi
al S
ervi
ces
Sala
ries
503,
901.
00
-
50
3,90
1.00
477,
764.
60
26
,136
.40
C
lean
ing,
Rep
air a
nd M
aint
enan
ce S
ervi
ce41
,000
.00
41
,000
.00
15
,042
.24
25
,957
.76
O
ther
Pur
chas
ed P
rope
rty S
ervi
ces
22,5
00.0
0
22,5
00.0
0
18,1
73.9
0
4,32
6.10
Insu
ranc
e90
,000
.00
(1
7,79
9.00
)
72,2
01.0
0
72,2
00.9
1
0.09
Mis
cella
neou
s Pu
rcha
sed
Serv
ices
6,00
0.00
6,00
0.00
2,33
7.60
3,
662.
40
G
ener
al S
uppl
ies
71,5
00.0
0
(20,
000.
00)
51
,500
.00
22
,424
.93
29
,075
.07
En
ergy
(Ele
ctric
ity)
220,
000.
00
22
0,00
0.00
176,
168.
93
43
,831
.07
En
ergy
(Nat
ural
Gas
)10
5,00
0.00
105,
000.
00
53
,692
.92
51
,307
.08
O
ther
Obj
ects
1,00
0.00
1,00
0.00
550.
00
45
0.00
To
tal U
ndis
tribu
ted
Expe
nditu
res
- C
usto
dial
Ser
vice
s1,
060,
901.
00
(37,
799.
00)
1,
023,
102.
00
838,
356.
03
18
4,74
5.97
62
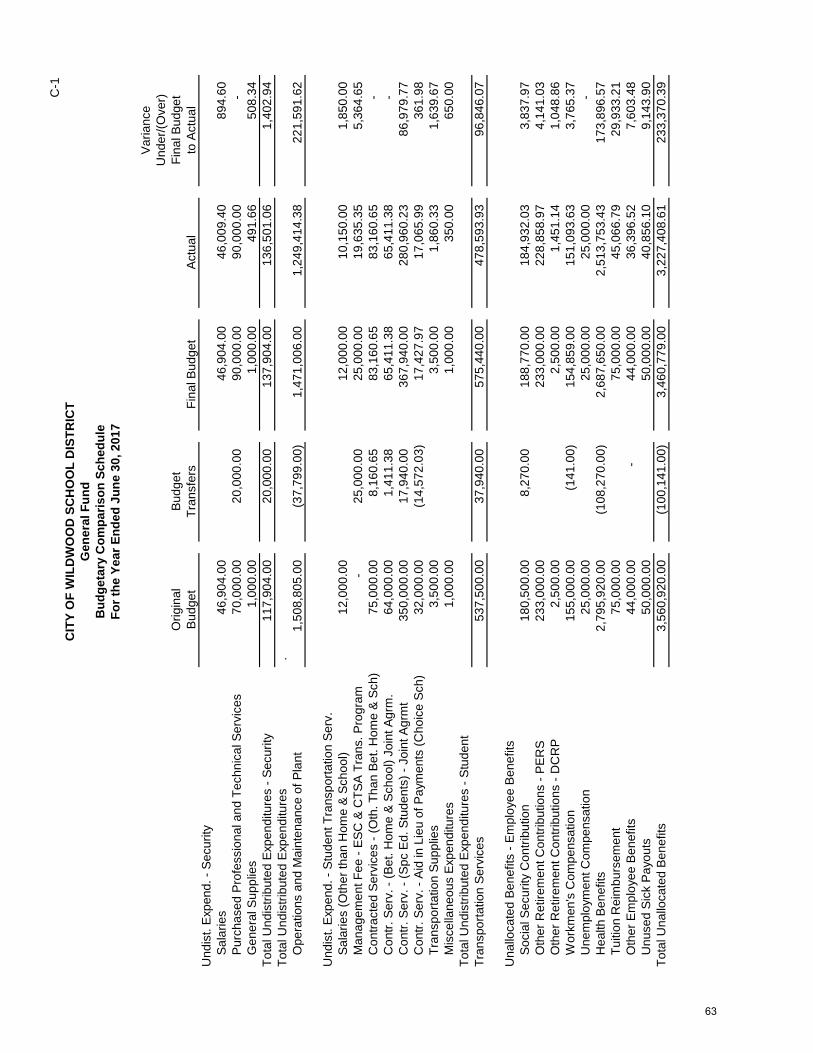
C-1
Varia
nce
Und
er/(O
ver)
Orig
inal
Budg
etFi
nal B
udge
tBu
dget
Tran
sfer
sFi
nal B
udge
tAc
tual
to A
ctua
l
Bud
geta
ry C
ompa
rison
Sch
edul
eG
ener
al F
und
CIT
Y O
F W
ILD
WO
OD
SC
HO
OL
DIS
TRIC
T
For t
he Y
ear E
nded
Jun
e 30
, 201
7
Und
ist.
Expe
nd. -
Sec
urity
Sala
ries
46,9
04.0
0
46,9
04.0
0
46,0
09.4
0
894.
60
Purc
hase
d Pr
ofes
sion
al a
nd T
echn
ical
Ser
vice
s70
,000
.00
20
,000
.00
90,0
00.0
0
90,0
00.0
0
-
Gen
eral
Sup
plie
s1,
000.
00
1,
000.
00
49
1.66
508.
34
Tota
l Und
istri
bute
d Ex
pend
iture
s - S
ecur
ity11
7,90
4.00
20,0
00.0
0
13
7,90
4.00
136,
501.
06
1,
402.
94
To
tal U
ndis
tribu
ted
Expe
nditu
res
.O
pera
tions
and
Mai
nten
ance
of P
lant
1,50
8,80
5.00
(3
7,79
9.00
)
1,47
1,00
6.00
1,
249,
414.
38
221,
591.
62
Und
ist.
Expe
nd. -
Stu
dent
Tra
nspo
rtatio
n Se
rv.
Sala
ries
(Oth
er th
an H
ome
& Sc
hool
)12
,000
.00
12
,000
.00
10
,150
.00
1,
850.
00
M
anag
emen
t Fee
- ES
C &
CTS
A Tr
ans.
Pro
gram
-
25,0
00.0
0
25
,000
.00
19
,635
.35
5,
364.
65
C
ontra
cted
Ser
vice
s - (
Oth
. Tha
n Be
t. H
ome
& Sc
h)75
,000
.00
8,
160.
65
83
,160
.65
83
,160
.65
-
C
ontr.
Ser
v. -
(Bet
. Hom
e &
Scho
ol) J
oint
Agr
m.
64,0
00.0
0
1,41
1.38
65,4
11.3
8
65,4
11.3
8
-
Con
tr. S
erv.
- (S
pc E
d. S
tude
nts)
- Jo
int A
grm
t35
0,00
0.00
17,9
40.0
0
36
7,94
0.00
280,
960.
23
86
,979
.77
C
ontr.
Ser
v. -
Aid
in L
ieu
of P
aym
ents
(Cho
ice
Sch)
32,0
00.0
0
(14,
572.
03)
17
,427
.97
17
,065
.99
36
1.98
Tr
ansp
orta
tion
Supp
lies
3,50
0.00
3,50
0.00
1,86
0.33
1,
639.
67
M
isce
llane
ous
Expe
nditu
res
1,00
0.00
1,00
0.00
350.
00
65
0.00
To
tal U
ndis
tribu
ted
Expe
nditu
res
- Stu
dent
Tran
spor
tatio
n Se
rvic
es53
7,50
0.00
37,9
40.0
0
57
5,44
0.00
478,
593.
93
96
,846
.07
Una
lloca
ted
Bene
fits
- Em
ploy
ee B
enef
itsSo
cial
Sec
urity
Con
tribu
tion
180,
500.
00
8,
270.
00
18
8,77
0.00
184,
932.
03
3,
837.
97
O
ther
Ret
irem
ent C
ontri
butio
ns -
PER
S23
3,00
0.00
233,
000.
00
22
8,85
8.97
4,14
1.03
Oth
er R
etire
men
t Con
tribu
tions
- D
CR
P2,
500.
00
2,
500.
00
1,
451.
14
1,04
8.86
Wor
kmen
's C
ompe
nsat
ion
155,
000.
00
(1
41.0
0)
154,
859.
00
15
1,09
3.63
3,76
5.37
Une
mpl
oym
ent C
ompe
nsat
ion
25,0
00.0
0
25,0
00.0
0
25,0
00.0
0
-
Hea
lth B
enef
its2,
795,
920.
00
(108
,270
.00)
2,
687,
650.
00
2,51
3,75
3.43
17
3,89
6.57
Tuiti
on R
eim
burs
emen
t75
,000
.00
75
,000
.00
45
,066
.79
29
,933
.21
O
ther
Em
ploy
ee B
enef
its44
,000
.00
-
44
,000
.00
36
,396
.52
7,
603.
48
U
nuse
d Si
ck P
ayou
ts50
,000
.00
50
,000
.00
40
,856
.10
9,
143.
90
To
tal U
nallo
cate
d Be
nefit
s 3,
560,
920.
00
(100
,141
.00)
3,
460,
779.
00
3,22
7,40
8.61
23
3,37
0.39
63
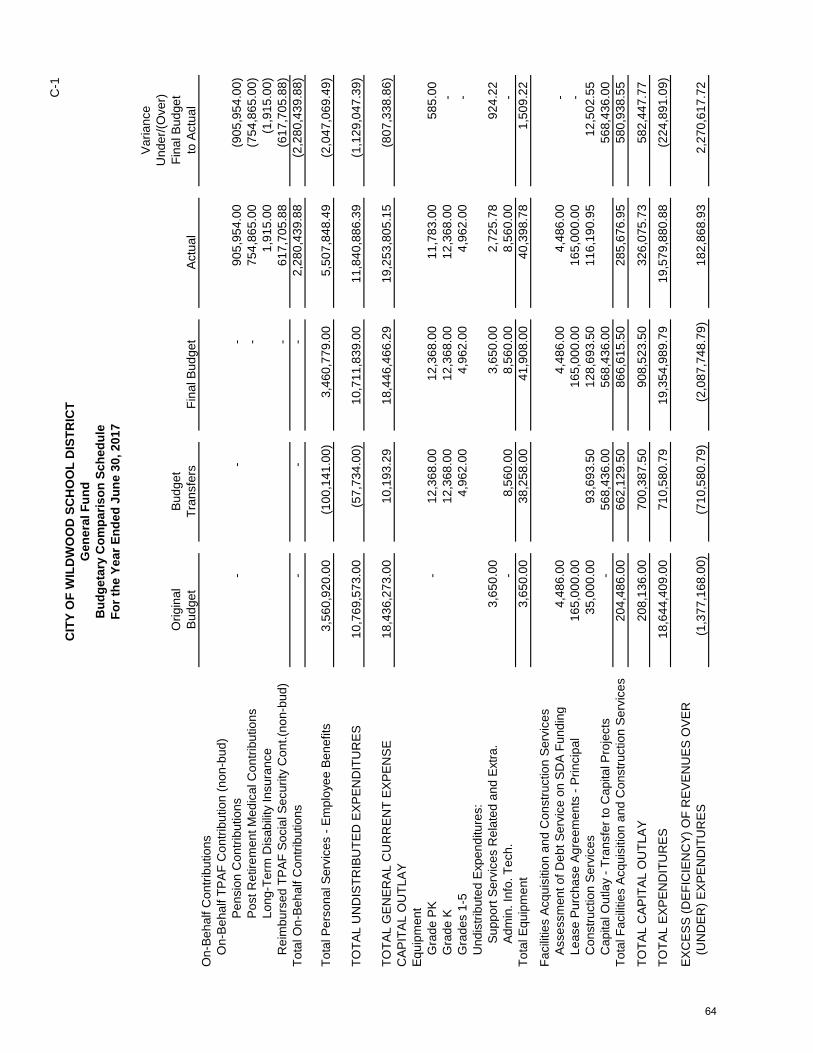
C-1
Varia
nce
Und
er/(O
ver)
Orig
inal
Budg
etFi
nal B
udge
tBu
dget
Tran
sfer
sFi
nal B
udge
tAc
tual
to A
ctua
l
Bud
geta
ry C
ompa
rison
Sch
edul
eG
ener
al F
und
CIT
Y O
F W
ILD
WO
OD
SC
HO
OL
DIS
TRIC
T
For t
he Y
ear E
nded
Jun
e 30
, 201
7
On-
Beha
lf C
ontri
butio
nsO
n-Be
half
TPAF
Con
tribu
tion
(non
-bud
)Pe
nsio
n C
ontri
butio
ns-
-
-
90
5,95
4.00
(905
,954
.00)
Post
Ret
irem
ent M
edic
al C
ontri
butio
ns-
75
4,86
5.00
(754
,865
.00)
Long
-Ter
m D
isab
ility
Insu
ranc
e1,
915.
00
(1,9
15.0
0)
Rei
mbu
rsed
TPA
F So
cial
Sec
urity
Con
t.(no
n-bu
d)-
61
7,70
5.88
(617
,705
.88)
Tota
l On-
Beha
lf C
ontri
butio
ns-
-
-
2,
280,
439.
88
(2,2
80,4
39.8
8)
Tota
l Per
sona
l Ser
vice
s - E
mpl
oyee
Ben
efits
3,56
0,92
0.00
(1
00,1
41.0
0)
3,46
0,77
9.00
5,
507,
848.
49
(2,0
47,0
69.4
9)
TOTA
L U
ND
ISTR
IBU
TED
EXP
END
ITU
RES
10,7
69,5
73.0
0
(57,
734.
00)
10
,711
,839
.00
11,8
40,8
86.3
9
(1
,129
,047
.39)
TOTA
L G
ENER
AL C
UR
REN
T EX
PEN
SE18
,436
,273
.00
10
,193
.29
18,4
46,4
66.2
9
19
,253
,805
.15
(807
,338
.86)
CAP
ITAL
OU
TLAY
Equi
pmen
tG
rade
PK
-
12,3
68.0
0
12
,368
.00
11
,783
.00
58
5.00
G
rade
K12
,368
.00
12,3
68.0
0
12,3
68.0
0
-
Gra
des
1-5
4,96
2.00
4,96
2.00
4,96
2.00
-
U
ndis
tribu
ted
Expe
nditu
res:
Supp
ort S
ervi
ces
Rel
ated
and
Ext
ra.
3,65
0.00
3,65
0.00
2,72
5.78
92
4.22
Ad
min
. Inf
o. T
ech.
-
8,56
0.00
8,56
0.00
8,56
0.00
-
To
tal E
quip
men
t3,
650.
00
38
,258
.00
41,9
08.0
0
40,3
98.7
8
1,50
9.22
Faci
litie
s Ac
quis
ition
and
Con
stru
ctio
n Se
rvic
esAs
sess
men
t of D
ebt S
ervi
ce o
n SD
A Fu
ndin
g4,
486.
00
4,
486.
00
4,
486.
00
-
Leas
e Pu
rcha
se A
gree
men
ts -
Prin
cipa
l16
5,00
0.00
165,
000.
00
16
5,00
0.00
-
Con
stru
ctio
n Se
rvic
es35
,000
.00
93
,693
.50
128,
693.
50
11
6,19
0.95
12,5
02.5
5
Cap
ital O
utla
y - T
rans
fer t
o C
apita
l Pro
ject
s-
56
8,43
6.00
56
8,43
6.00
568,
436.
00
To
tal F
acilit
ies
Acqu
isiti
on a
nd C
onst
ruct
ion
Serv
ices
204,
486.
00
66
2,12
9.50
86
6,61
5.50
285,
676.
95
58
0,93
8.55
TOTA
L C
APIT
AL O
UTL
AY20
8,13
6.00
700,
387.
50
908,
523.
50
32
6,07
5.73
582,
447.
77
TOTA
L EX
PEN
DIT
UR
ES18
,644
,409
.00
71
0,58
0.79
19
,354
,989
.79
19,5
79,8
80.8
8
(2
24,8
91.0
9)
EXC
ESS
(DEF
ICIE
NC
Y) O
F R
EVEN
UES
OVE
R(U
ND
ER) E
XPEN
DIT
UR
ES(1
,377
,168
.00)
(7
10,5
80.7
9)
(2,0
87,7
48.7
9)
182,
868.
93
2,
270,
617.
72
64
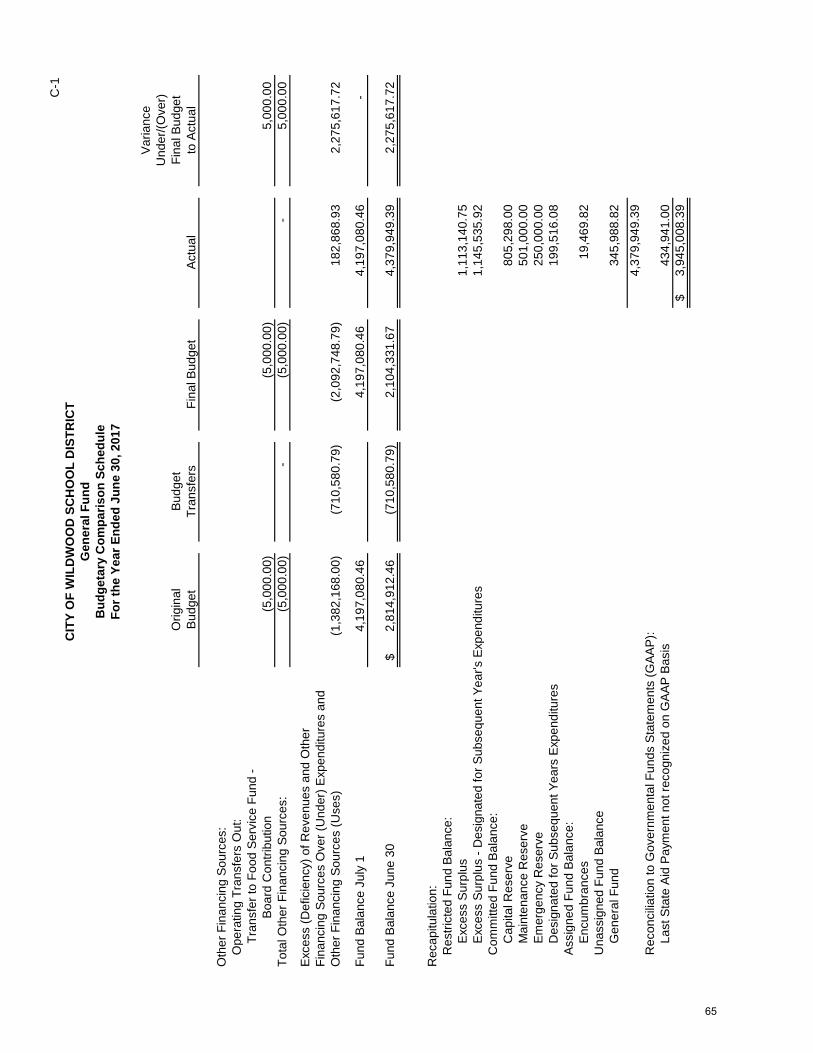
C-1
Varia
nce
Und
er/(O
ver)
Orig
inal
Budg
etFi
nal B
udge
tBu
dget
Tran
sfer
sFi
nal B
udge
tAc
tual
to A
ctua
l
Bud
geta
ry C
ompa
rison
Sch
edul
eG
ener
al F
und
CIT
Y O
F W
ILD
WO
OD
SC
HO
OL
DIS
TRIC
T
For t
he Y
ear E
nded
Jun
e 30
, 201
7
Oth
er F
inan
cing
Sou
rces
:O
pera
ting
Tran
sfer
s O
ut:
Tran
sfer
to F
ood
Serv
ice
Fund
- Bo
ard
Con
tribu
tion
(5,0
00.0
0)
(5,0
00.0
0)
5,00
0.00
Tota
l Oth
er F
inan
cing
Sou
rces
:(5
,000
.00)
-
(5
,000
.00)
-
5,00
0.00
Exce
ss (D
efic
ienc
y) o
f Rev
enue
s an
d O
ther
Fina
ncin
g So
urce
s O
ver (
Und
er) E
xpen
ditu
res
and
Oth
er F
inan
cing
Sou
rces
(Use
s)(1
,382
,168
.00)
(7
10,5
80.7
9)
(2,0
92,7
48.7
9)
182,
868.
93
2,
275,
617.
72
Fund
Bal
ance
Jul
y 1
4,19
7,08
0.46
4,
197,
080.
46
4,19
7,08
0.46
-
Fund
Bal
ance
Jun
e 30
2,81
4,91
2.46
$
(7
10,5
80.7
9)
2,10
4,33
1.67
4,
379,
949.
39
2,27
5,61
7.72
Rec
apitu
latio
n:R
estri
cted
Fun
d Ba
lanc
e:Ex
cess
Sur
plus
1,11
3,14
0.75
Ex
cess
Sur
plus
- D
esig
nate
d fo
r Sub
sequ
ent Y
ear's
Exp
endi
ture
s1,
145,
535.
92
Com
mitt
ed F
und
Bala
nce:
Cap
ital R
eser
ve80
5,29
8.00
Mai
nten
ance
Res
erve
501,
000.
00
Em
erge
ncy
Res
erve
250,
000.
00
D
esig
nate
d fo
r Sub
sequ
ent Y
ears
Exp
endi
ture
s19
9,51
6.08
Assi
gned
Fun
d Ba
lanc
e:En
cum
bran
ces
19,4
69.8
2
Una
ssig
ned
Fund
Bal
ance
Gen
eral
Fun
d34
5,98
8.82
4,37
9,94
9.39
R
econ
cilia
tion
to G
over
nmen
tal F
unds
Sta
tem
ents
(GAA
P):
Last
Sta
te A
id P
aym
ent n
ot re
cogn
ized
on
GAA
P Ba
sis
434,
941.
00
3,94
5,00
8.39
$
65
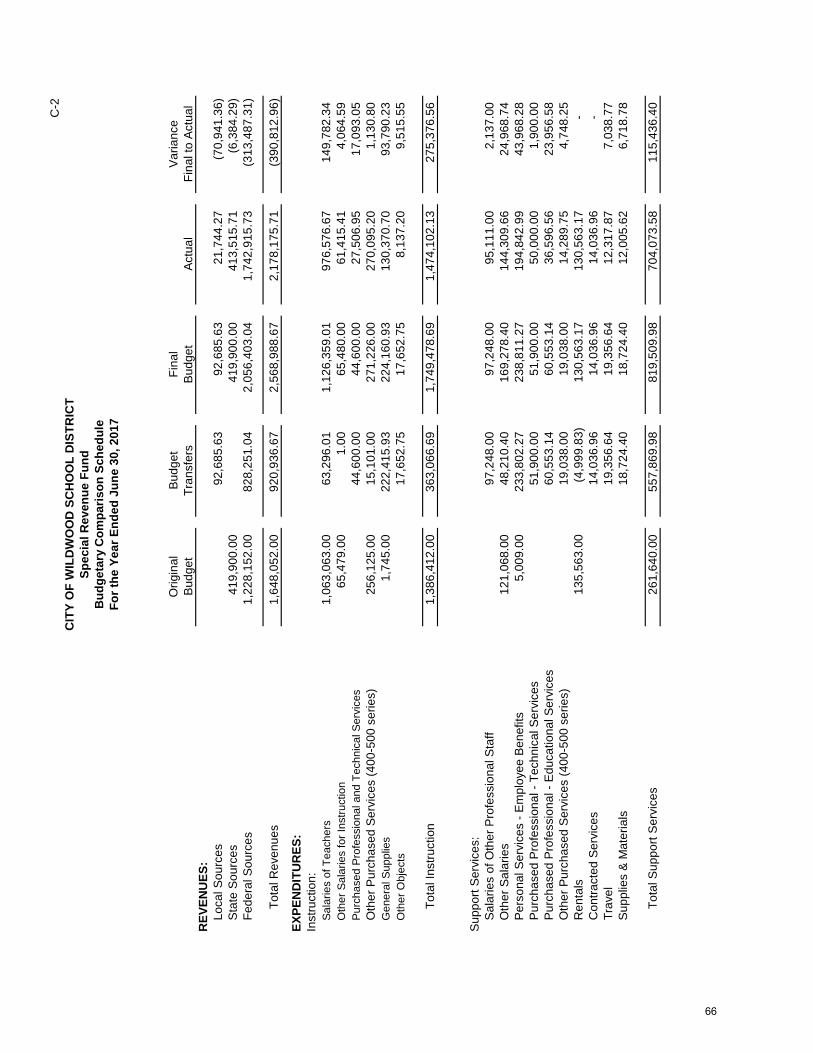
C-2
Orig
inal
Bud
get
Fina
lV
aria
nce
Bud
get
Tran
sfer
sB
udge
tA
ctua
lFi
nal t
o A
ctua
lR
EVEN
UES
:Lo
cal S
ourc
es92
,685
.63
92
,685
.63
21,7
44.2
7
(7
0,94
1.36
)
Sta
te S
ourc
es41
9,90
0.00
41
9,90
0.00
41
3,51
5.71
(6
,384
.29)
Fede
ral S
ourc
es1,
228,
152.
00
82
8,25
1.04
2,05
6,40
3.04
1,74
2,91
5.73
(313
,487
.31)
Tota
l Rev
enue
s1,
648,
052.
00
92
0,93
6.67
2,56
8,98
8.67
2,17
8,17
5.71
(390
,812
.96)
EXPE
ND
ITU
RES
:In
stru
ctio
n:Sa
larie
s of
Tea
cher
s1,
063,
063.
00
63
,296
.01
1,
126,
359.
01
97
6,57
6.67
14
9,78
2.34
O
ther
Sal
arie
s fo
r Ins
truct
ion
65,4
79.0
0
1.
00
65
,480
.00
61,4
15.4
1
4,
064.
59
Pu
rcha
sed
Prof
essi
onal
and
Tec
hnic
al S
ervi
ces
44,6
00.0
0
44,6
00.0
0
27
,506
.95
17,0
93.0
5
O
ther
Pur
chas
ed S
ervi
ces
(400
-500
ser
ies)
256,
125.
00
15,1
01.0
0
271,
226.
00
270,
095.
20
1,13
0.80
Gen
eral
Sup
plie
s1,
745.
00
22
2,41
5.93
224,
160.
93
130,
370.
70
93,7
90.2
3
O
ther
Obj
ects
17,6
52.7
5
17,6
52.7
5
8,
137.
20
9,51
5.55
Tota
l Ins
truct
ion
1,38
6,41
2.00
363,
066.
69
1,
749,
478.
69
1,
474,
102.
13
27
5,37
6.56
Sup
port
Ser
vice
s:S
alar
ies
of O
ther
Pro
fess
iona
l Sta
ff97
,248
.00
97
,248
.00
95,1
11.0
0
2,
137.
00
O
ther
Sal
arie
s12
1,06
8.00
48
,210
.40
16
9,27
8.40
14
4,30
9.66
24
,968
.74
Per
sona
l Ser
vice
s - E
mpl
oyee
Ben
efits
5,00
9.00
233,
802.
27
23
8,81
1.27
19
4,84
2.99
43
,968
.28
Pur
chas
ed P
rofe
ssio
nal -
Tec
hnic
al S
ervi
ces
51,9
00.0
0
51,9
00.0
0
50
,000
.00
1,90
0.00
Pur
chas
ed P
rofe
ssio
nal -
Edu
catio
nal S
ervi
ces
60,5
53.1
4
60,5
53.1
4
36
,596
.56
23,9
56.5
8
O
ther
Pur
chas
ed S
ervi
ces
(400
-500
ser
ies)
19,0
38.0
0
19,0
38.0
0
14
,289
.75
4,74
8.25
Ren
tals
135,
563.
00
(4,9
99.8
3)
130,
563.
17
130,
563.
17
-
Con
tract
ed S
ervi
ces
14,0
36.9
6
14,0
36.9
6
14
,036
.96
-
Trav
el19
,356
.64
19
,356
.64
12,3
17.8
7
7,
038.
77
S
uppl
ies
& M
ater
ials
18,7
24.4
0
18,7
24.4
0
12
,005
.62
6,71
8.78
Tota
l Sup
port
Ser
vice
s26
1,64
0.00
55
7,86
9.98
819,
509.
98
704,
073.
58
115,
436.
40
CIT
Y O
F W
ILD
WO
OD
SC
HO
OL
DIS
TRIC
TSp
ecia
l Rev
enue
Fun
dB
udge
tary
Com
paris
on S
ched
ule
For t
he Y
ear E
nded
Jun
e 30
, 201
7
66
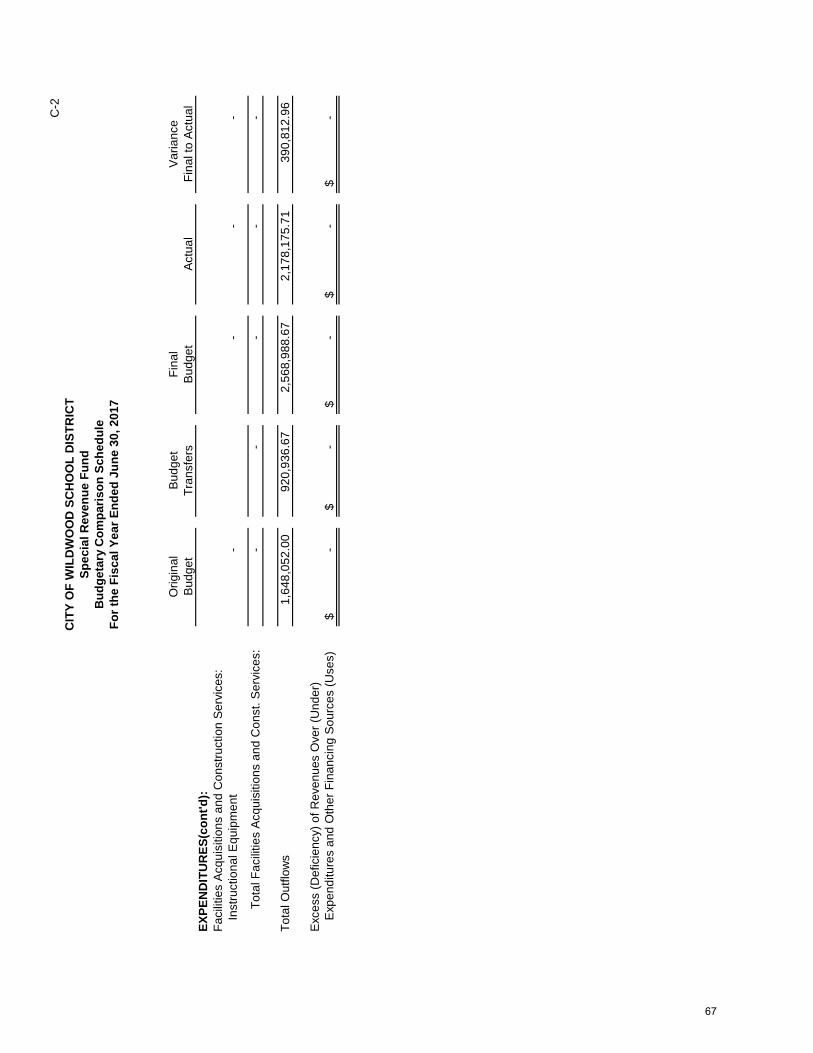
C-2
Orig
inal
Bud
get
Fina
lV
aria
nce
Bud
get
Tran
sfer
sB
udge
tA
ctua
lFi
nal t
o A
ctua
lEX
PEN
DIT
UR
ES(c
ont'd
):Fa
cilit
ies
Acq
uisi
tions
and
Con
stru
ctio
n S
ervi
ces:
Inst
ruct
iona
l Equ
ipm
ent
-
-
-
-
Tota
l Fac
ilitie
s A
cqui
sitio
ns a
nd C
onst
. Ser
vice
s:-
-
-
-
-
Tota
l Out
flow
s1,
648,
052.
00
92
0,93
6.67
2,56
8,98
8.67
2,17
8,17
5.71
390,
812.
96
Exc
ess
(Def
icie
ncy)
of R
even
ues
Ove
r (U
nder
)E
xpen
ditu
res
and
Oth
er F
inan
cing
Sou
rces
(Use
s)-
$
-
$
-
$
-
$
-
$
Bud
geta
ry C
ompa
rison
Sch
edul
eFo
r the
Fis
cal Y
ear E
nded
Jun
e 30
, 201
7
CIT
Y O
F W
ILD
WO
OD
SC
HO
OL
DIS
TRIC
TSp
ecia
l Rev
enue
Fun
d
67

{THIS PAGE IS INTENTIONALLY LEFT BLANK}

NOTES TO REQUIRED SUPPLEMENTARY INFORMATION

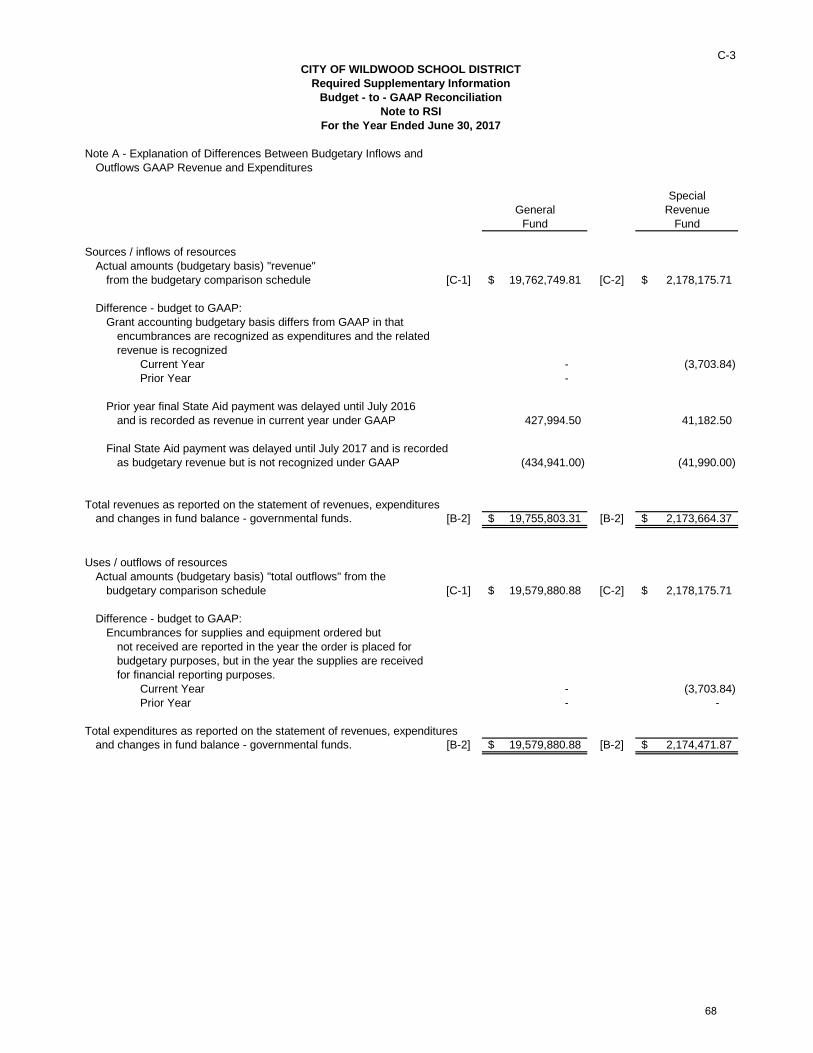
C-3
Note A - Explanation of Differences Between Budgetary Inflows andOutflows GAAP Revenue and Expenditures
SpecialGeneral Revenue
Fund Fund
Sources / inflows of resourcesActual amounts (budgetary basis) "revenue"
from the budgetary comparison schedule [C-1] 19,762,749.81$ [C-2] 2,178,175.71$
Difference - budget to GAAP:Grant accounting budgetary basis differs from GAAP in that
encumbrances are recognized as expenditures and the relatedrevenue is recognized
Current Year - (3,703.84) Prior Year -
Prior year final State Aid payment was delayed until July 2016 and is recorded as revenue in current year under GAAP 427,994.50 41,182.50
Final State Aid payment was delayed until July 2017 and is recordedas budgetary revenue but is not recognized under GAAP (434,941.00) (41,990.00)
Total revenues as reported on the statement of revenues, expendituresand changes in fund balance - governmental funds. [B-2] 19,755,803.31$ [B-2] 2,173,664.37$
Uses / outflows of resourcesActual amounts (budgetary basis) "total outflows" from the
budgetary comparison schedule [C-1] 19,579,880.88$ [C-2] 2,178,175.71$
Difference - budget to GAAP:Encumbrances for supplies and equipment ordered but
not received are reported in the year the order is placed forbudgetary purposes, but in the year the supplies are receivedfor financial reporting purposes.
Current Year - (3,703.84) Prior Year - -
Total expenditures as reported on the statement of revenues, expendituresand changes in fund balance - governmental funds. [B-2] 19,579,880.88$ [B-2] 2,174,471.87$
Note to RSI
Required Supplementary InformationCITY OF WILDWOOD SCHOOL DISTRICT
For the Year Ended June 30, 2017
Budget - to - GAAP Reconciliation
68

{THIS PAGE IS INTENTIONALLY LEFT BLANK}
REQUIRED SUPPLEMENTARY INFORMATION – PART III


L-1
2016 2015 2014 2013District's proportion of the net pension
liability (asset) 0.0251589960% 0.0240771598% 0.0254269368% 0.0242302520%
District's proportionate of the net pensionliability (asset) 7,448,975$ 5,404,840$ 4,760,618$ 4,630,883$
District's covered payroll 1,732,136$ 1,735,489$ 1,640,811$ 1,707,350$
District's proportionate share of the netpension liability (asset) as a percentageof its covered-employee payroll 430.05% 311.43% 290.14% 271.23%
Plan fiduciary net position as a percentage of the total pension liability 40.14% 47.93% 52.08% 48.72%
Source: GASB 68 report on Public Employees' Retirement System; District records
Note: This schedule is required by GASB 68 to be show information for a 10 year period. However, information is only currently available for four years. Additional years will be presented as they become available.
CITY OF WILDWOOD SCHOOL DISTRICTSchedule of the District's Proportionate Share of the Net Pension Liability
Public Employee Retirement SystemLast Four Fiscal Years
69
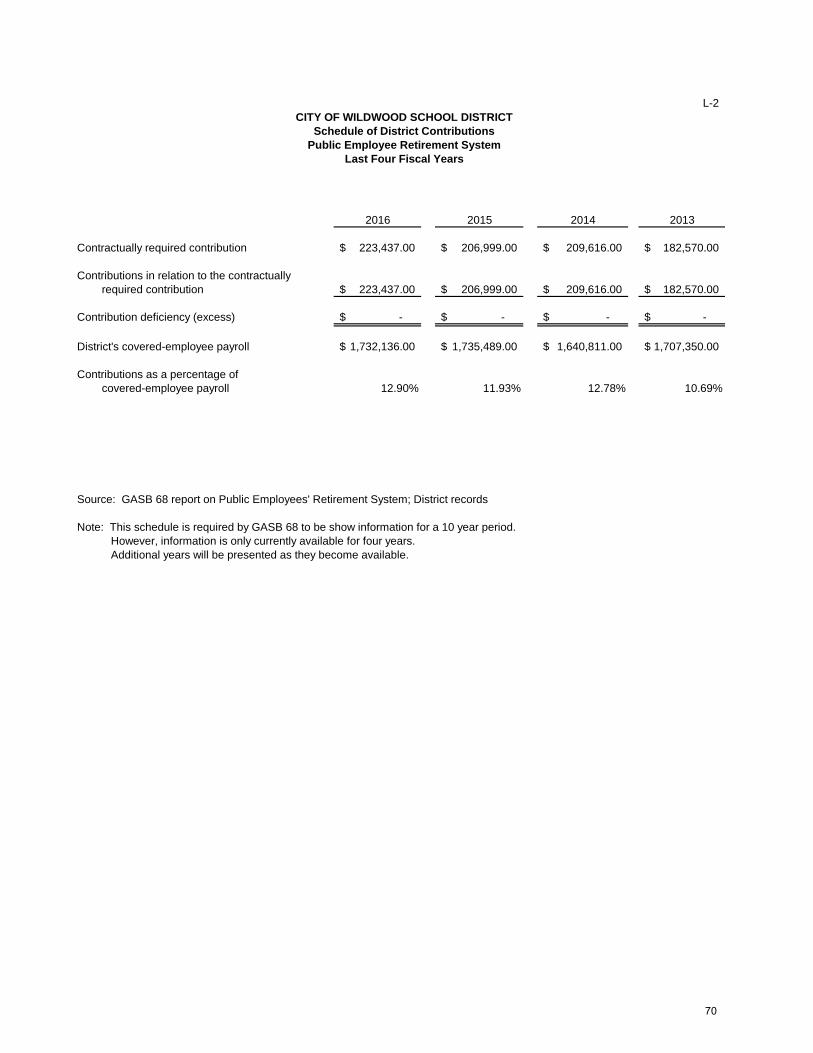
L-2
2016 2015 2014 2013
Contractually required contribution 223,437.00$ 206,999.00$ 209,616.00$ 182,570.00$
Contributions in relation to the contractuallyrequired contribution 223,437.00$ 206,999.00$ 209,616.00$ 182,570.00$
Contribution deficiency (excess) -$ -$ -$ -$
District's covered-employee payroll 1,732,136.00$ 1,735,489.00$ 1,640,811.00$ 1,707,350.00$
Contributions as a percentage ofcovered-employee payroll 12.90% 11.93% 12.78% 10.69%
Source: GASB 68 report on Public Employees' Retirement System; District records
Note: This schedule is required by GASB 68 to be show information for a 10 year period. However, information is only currently available for four years. Additional years will be presented as they become available.
CITY OF WILDWOOD SCHOOL DISTRICTSchedule of District Contributions
Public Employee Retirement SystemLast Four Fiscal Years
70

L-3
2016 2015 2014 2013District's proportion of the net pension
liability (asset) 0.00% 0.00% 0.00% 0.00%
District's proportionate of the net pensionliability (asset) -$ -$ -$ -$
State's proportionate share of the net pensionliability (asset) associated with the District 52,102,816.00$ 42,510,749.00$ 43,994,590.00$ 40,938,768.00$
Total 52,102,816.00$ 42,510,749.00$ 43,994,590.00$ 40,938,768.00$
District's covered payroll 8,224,043.00$ 8,117,379.00$ 7,934,822.00$ 8,071,551.00$
District's proportionate share of the netpension liability (asset) as a percentageof its covered-employee payroll 0.00% 0.00% 0.00% 0.00%
Plan fiduciary net position as a percentage of the total pension liability 22.33% 28.71% 33.64% 33.76%
Source: GASB 68 report on Public Employees' Retirement System; District records
Note: This schedule is required by GASB 68 to be show information for a 10 year period. However, information is only currently available for four years. Additional years will be presented as they become available.
CITY OFWILDWOOD SCHOOL DISTRICTSchedule of the District's Proportionate Share of the Net Pension Liability
Teachers' Pension and Annuity FundLast Four Fiscal Years
71

{THIS PAGE IS INTENTIONALLY LEFT BLANK}

OTHER SUPPLEMENTARY INFORMATION


SPECIAL REVENUE FUND DETAIL STATEMENTS
The Special Revenue Fund is used to account for the proceeds of specific revenue sources (other than expendable trusts or major capital projects) that are legally restricted to expenditures for specific purposes.


E-1
Tota
lB
roug
htFo
rwar
dTi
tle IA
Tota
ls(E
x. E
-1a)
Title
IAC
arry
over
Title
III
Title
IIA
Title
III C
/O20
17R
EVEN
UES
:S
tate
Sou
rces
413,
515.
71$
-
-
-
-
41
3,51
5.71
Fe
dera
l Sou
rces
984,
715.
3959
9,11
9.14
34,3
22.3
8
44,6
05.1
2
67,9
31.1
5
12,2
22.5
5
1,74
2,91
5.73
Loca
l Sou
rces
21,7
44.2
7
21
,744
.27
Tota
l Rev
enue
s1,
419,
975.
37
599,
119.
14
34
,322
.38
44
,605
.12
67
,931
.15
12
,222
.55
2,
178,
175.
71
EXPE
ND
ITU
RES
:In
stru
ctio
n:Sa
larie
s of
Tea
cher
s50
7,02
3.50
450,
938.
14
16
,808
.28
1,
806.
75
97
6,57
6.67
O
ther
Sal
arie
s fo
r Ins
truct
ion
61,4
15.4
1
61
,415
.41
Pu
rcha
sed
Prof
essi
onal
Tec
hnic
al S
ervi
ces
27,5
06.9
5
27
,506
.95
O
ther
Pur
chas
ed S
ervi
ces
(400
-500
ser
ies)
270,
095.
20
27
0,09
5.20
G
ener
al S
uppl
ies
101,
864.
17
19
,289
.86
4,
082.
22
5,
134.
45
13
0,37
0.70
Te
xtbo
oks
-
-
O
ther
Obj
ects
6,84
2.20
1,
295.
00
8,
137.
20
Tota
l Ins
truct
ion
974,
747.
43
47
0,22
8.00
20,8
90.5
0
8,23
6.20
-
-
1,47
4,10
2.13
Sup
port
Ser
vice
s:S
alar
ies
of S
uper
viso
rs o
f Ins
truct
ion
-
-
S
alar
ies
of O
ther
Pro
fess
iona
l Sta
ff95
,111
.00
95,1
11.0
0
Oth
er S
alar
ies
53,3
04.5
6
6,
632.
55
7,
344.
00
25
,949
.00
51
,079
.55
14
4,30
9.66
Pe
rson
al S
ervi
ces
- Em
ploy
ee B
enef
its55
,287
.59
116,
393.
01
4,
009.
88
7,
513.
76
11
,638
.75
19
4,84
2.99
Pu
rcha
sed
Prof
essi
onal
Tec
hnic
al S
ervi
ces
50,0
00.0
0
50
,000
.00
Pu
rcha
sed
Prof
essi
onal
- Ed
ucat
iona
l Ser
vice
s28
,596
.56
3,00
0.00
5,00
0.00
36,5
96.5
6
Oth
er P
urch
ased
Ser
vice
s (4
00-5
00 s
erie
s)11
,524
.75
2,76
5.00
14,2
89.7
5
Ren
tals
130,
563.
17
13
0,56
3.17
C
ontr.
Tra
ns S
erv
(Bet
. Hom
e &
Scho
ol)
-
-
C
ontr.
Tra
ns S
erv
(Fie
ld T
rips)
14,0
36.9
6
14
,036
.96
Tr
avel
4,50
6.97
1,
045.
23
6,
765.
67
12
,317
.87
Su
pplie
s &
Mat
eria
ls2,
296.
38
5,86
5.58
2,07
8.00
141.
16
1,16
7.62
456.
88
12,0
05.6
2
Oth
er O
bjec
ts-
-
Tota
l Sup
port
Ser
vice
s44
5,22
7.94
128,
891.
14
13
,431
.88
36
,368
.92
67
,931
.15
12
,222
.55
70
4,07
3.58
Faci
litie
s A
cqui
sitio
ns a
nd C
onst
ruct
ion
Ser
vice
s:In
stru
ctio
nal E
quip
men
t-
-
-
-
-
-
-
Tota
l Fac
ilitie
s A
cqui
sitio
ns a
nd C
onst
. Ser
vice
s:-
-
-
-
-
-
-
Tota
l Out
flow
s1,
419,
975.
37
599,
119.
14
34
,322
.38
44
,605
.12
67
,931
.15
12
,222
.55
2,
178,
175.
71
Exc
ess
(Def
icie
ncy)
of R
even
ues
Ove
r (U
nder
)E
xpen
ditu
res
and
Oth
er F
inan
cing
Sou
rces
(Use
s)-
$
-
-
-
-
-
-
CIT
Y O
F W
ILD
WO
OD
SC
HO
OL
DIS
TRIC
TSp
ecia
l Rev
enue
Fun
dC
ombi
ning
Sch
edul
e of
Pro
gram
Rev
enue
s an
d Ex
pend
iture
s - B
udge
tary
Bas
isFo
r the
Yea
r End
ed J
une
30, 2
017
72
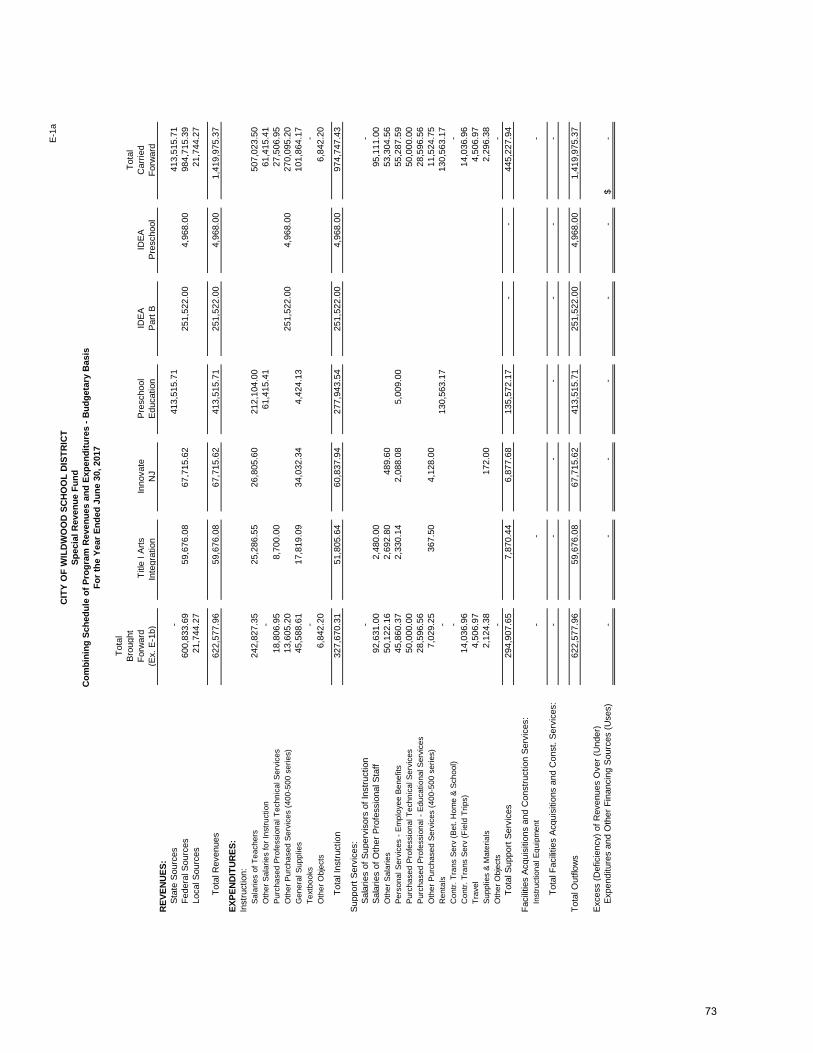
E-1a
Tota
lBr
ough
tTo
tal
Forw
ard
Titl
e I A
rtsIn
nova
tePr
esch
ool
IDEA
IDEA
Car
ried
(Ex.
E-1
b)In
tegr
atio
nN
JEd
ucat
ion
Part
BPr
esch
ool
Forw
ard
REV
ENU
ES:
Stat
e So
urce
s-
413,
515.
71
413,
515.
71
Fe
dera
l Sou
rces
600,
833.
69
59,6
76.0
8
67,7
15.6
2
251,
522.
00
4,96
8.00
98
4,71
5.39
Loca
l Sou
rces
21,7
44.2
7
21
,744
.27
Tota
l Rev
enue
s62
2,57
7.96
59
,676
.08
67
,715
.62
41
3,51
5.71
25
1,52
2.00
4,
968.
00
1,41
9,97
5.37
EXPE
ND
ITU
RES
:In
stru
ctio
n:Sa
larie
s of
Tea
cher
s24
2,82
7.35
25
,286
.55
26
,805
.60
21
2,10
4.00
50
7,02
3.50
Oth
er S
alar
ies
for I
nstru
ctio
n-
61,4
15.4
1
61,4
15.4
1
Pu
rcha
sed
Prof
essi
onal
Tec
hnic
al S
ervi
ces
18,8
06.9
5
8,
700.
00
27,5
06.9
5
O
ther
Pur
chas
ed S
ervi
ces
(400
-500
ser
ies)
13,6
05.2
0
25
1,52
2.00
4,
968.
00
270,
095.
20
G
ener
al S
uppl
ies
45,5
88.6
1
17
,819
.09
34
,032
.34
4,
424.
13
10
1,86
4.17
Text
book
s-
-
O
ther
Obj
ects
6,84
2.20
6,
842.
20
Tota
l Ins
truct
ion
327,
670.
31
51,8
05.6
4
60,8
37.9
4
277,
943.
54
251,
522.
00
4,96
8.00
97
4,74
7.43
Supp
ort S
ervi
ces:
Sala
ries
of S
uper
viso
rs o
f Ins
truct
ion
-
-
Sala
ries
of O
ther
Pro
fess
iona
l Sta
ff92
,631
.00
2,48
0.00
95
,111
.00
Oth
er S
alar
ies
50,1
22.1
6
2,
692.
80
489.
60
53,3
04.5
6
Pe
rson
al S
ervi
ces
- Em
ploy
ee B
enef
its45
,860
.37
2,33
0.14
2,
088.
08
5,
009.
00
55
,287
.59
Purc
hase
d Pr
ofes
sion
al T
echn
ical
Ser
vice
s50
,000
.00
50,0
00.0
0
Pu
rcha
sed
Prof
essi
onal
- Ed
ucat
iona
l Ser
vice
s28
,596
.56
28,5
96.5
6
O
ther
Pur
chas
ed S
ervi
ces
(400
-500
ser
ies)
7,02
9.25
36
7.50
4,12
8.00
11,5
24.7
5
R
enta
ls-
130,
563.
17
130,
563.
17
C
ontr.
Tra
ns S
erv
(Bet
. Hom
e &
Scho
ol)
-
-
Con
tr. T
rans
Ser
v (F
ield
Trip
s)14
,036
.96
14,0
36.9
6
Tr
avel
4,50
6.97
4,
506.
97
Supp
lies
& M
ater
ials
2,12
4.38
17
2.00
2,
296.
38
Oth
er O
bjec
ts-
-
To
tal S
uppo
rt Se
rvic
es29
4,90
7.65
7,
870.
44
6,87
7.68
135,
572.
17
-
-
44
5,22
7.94
Faci
litie
s Ac
quis
ition
s an
d C
onst
ruct
ion
Serv
ices
:In
stru
ctio
nal E
quip
men
t-
-
-
Tota
l Fac
ilitie
s Ac
quis
ition
s an
d C
onst
. Ser
vice
s:-
-
-
-
-
-
-
Tota
l Out
flow
s62
2,57
7.96
59
,676
.08
67
,715
.62
41
3,51
5.71
25
1,52
2.00
4,
968.
00
1,41
9,97
5.37
Exce
ss (D
efic
ienc
y) o
f Rev
enue
s O
ver (
Und
er)
Expe
nditu
res
and
Oth
er F
inan
cing
Sou
rces
(Use
s)-
-
-
-
-
-
-$
CIT
Y O
F W
ILD
WO
OD
SC
HO
OL
DIS
TRIC
TSp
ecia
l Rev
enue
Fun
dC
ombi
ning
Sch
edul
e of
Pro
gram
Rev
enue
s an
d Ex
pend
iture
s - B
udge
tary
Bas
isFo
r the
Yea
r End
ed J
une
30, 2
017
73

E-1
b
21st
21st
Tota
lC
C&
RC
C&
RC
entu
ry G
rant
Cen
tury
Gra
ntLo
cal
Car
ried
2016
2017
Yea
r 4Y
ear 5
Gra
nts
Forw
ard
REV
ENU
ES:
Sta
te S
ourc
es-
-
-
-
Fede
ral S
ourc
es69
,823
.19
18
2,44
1.21
72,3
45.8
8
276,
223.
41
60
0,83
3.69
Lo
cal S
ourc
es21
,744
.27
21
,744
.27
Tota
l Rev
enue
s69
,823
.19
18
2,44
1.21
72,3
45.8
8
276,
223.
41
21
,744
.27
62
2,57
7.96
EXPE
ND
ITU
RES
:In
stru
ctio
n:S
alar
ies
of T
each
ers
31,8
40.2
0
79,7
24.2
0
30,4
43.6
0
100,
819.
35
24
2,82
7.35
O
ther
Sal
arie
s fo
r Ins
truct
ion
-
Pur
chas
ed P
rofe
ssio
nal T
echn
ical
Ser
vice
s18
,806
.95
18
,806
.95
Oth
er P
urch
ased
Ser
vice
s (4
00-5
00 s
erie
s)3,
472.
20
10
,133
.00
13
,605
.20
Gen
eral
Sup
plie
s3,
709.
06
14,4
88.8
5
5,89
0.27
9,
889.
16
11,6
11.2
7
45,5
88.6
1
Te
xtbo
oks
-
Oth
er O
bjec
ts1,
111.
10
4,
163.
00
1,56
8.10
6,
842.
20
Tota
l Ins
truct
ion
35,5
49.2
6
98,7
96.3
5
40,4
96.8
7
131,
083.
56
21
,744
.27
32
7,67
0.31
Sup
port
Ser
vice
s:S
alar
ies
of S
uper
viso
rs o
f Ins
truct
ion
-
Sal
arie
s of
Oth
er P
rofe
ssio
nal S
taff
7,07
0.00
85
,561
.00
92
,631
.00
Oth
er S
alar
ies
6,94
2.16
43
,180
.00
50
,122
.16
Per
sona
l Ser
vice
s - E
mpl
oyee
Ben
efits
2,96
6.85
17
,203
.97
2,
869.
80
22,8
19.7
5
45,8
60.3
7
P
urch
ased
Pro
fess
iona
l Tec
hnic
al S
ervi
ces
12,0
00.0
0
19,0
00.0
0
19,0
00.0
0
50,0
00.0
0
P
urch
ased
Pro
fess
iona
l - E
duca
tiona
l Ser
vice
s11
,762
.42
16
,834
.14
28
,596
.56
Oth
er P
urch
ased
Ser
vice
s (4
00-5
00 s
erie
s)60
2.50
6,42
6.75
7,02
9.25
R
enta
ls-
C
ontr.
Tra
ns S
erv
(Bet
. Hom
e &
Sch
ool)
-
Con
tr. T
rans
Ser
v (F
ield
Trip
s)2,
156.
00
11,8
80.9
6
14,0
36.9
6
Tr
avel
259.
78
4,
247.
19
4,50
6.97
S
uppl
ies
& M
ater
ials
493.
43
1,
630.
95
2,12
4.38
O
ther
Obj
ects
-
Tota
l Sup
port
Ser
vice
s34
,273
.93
83
,644
.86
31
,849
.01
14
5,13
9.85
-
29
4,90
7.65
Faci
litie
s A
cqui
sitio
ns a
nd C
onst
ruct
ion
Ser
vice
s:In
stru
ctio
nal E
quip
men
t-
Tota
l Fac
ilitie
s A
cqui
sitio
ns a
nd C
onst
. Ser
vice
s:-
-
-
-
-
-
Tota
l Out
flow
s69
,823
.19
18
2,44
1.21
72,3
45.8
8
276,
223.
41
21
,744
.27
62
2,57
7.96
Exc
ess
(Def
icie
ncy)
of R
even
ues
Ove
r (U
nder
)E
xpen
ditu
res
and
Oth
er F
inan
cing
Sou
rces
(Use
s)-
-
-
-
-
-
CIT
Y O
F W
ILD
WO
OD
SC
HO
OL
DIS
TRIC
TSp
ecia
l Rev
enue
Fun
dC
ombi
ning
Sch
edul
e of
Pro
gram
Rev
enue
s an
d Ex
pend
iture
s - B
udge
tary
Bas
isFo
r the
Yea
r End
ed J
une
30, 2
017
74
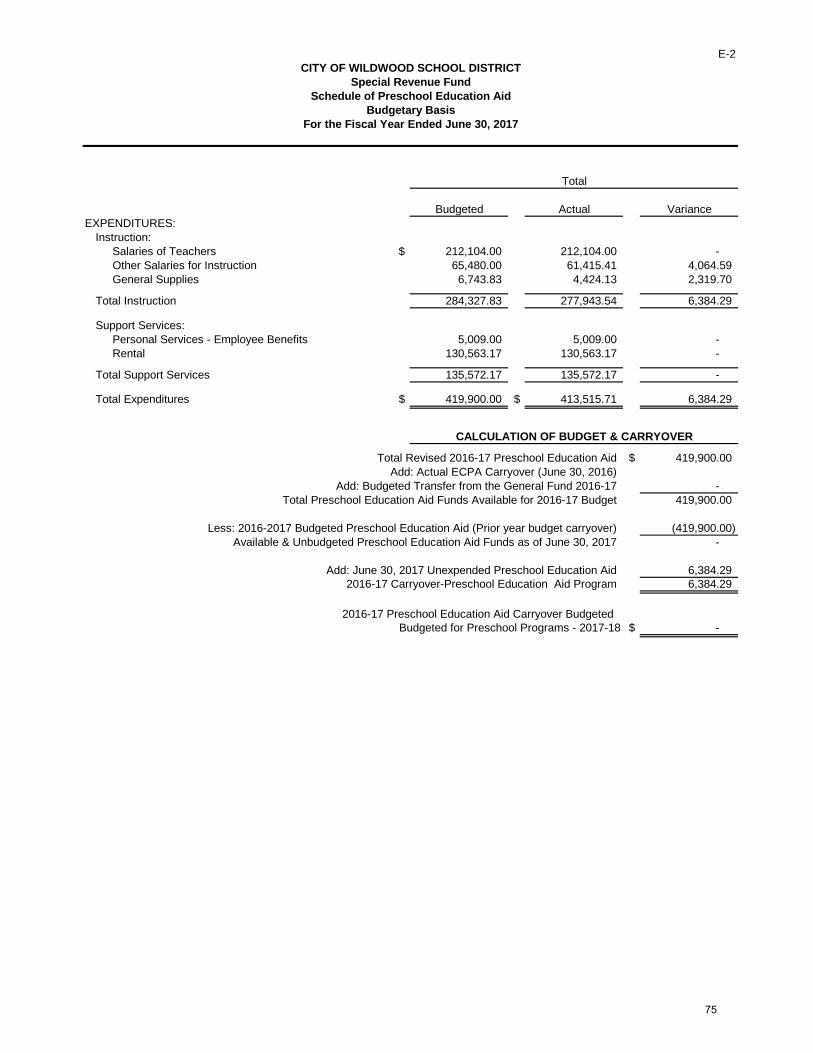
E-2
Budgeted Actual VarianceEXPENDITURES:
Instruction:Salaries of Teachers $ 212,104.00 212,104.00 - Other Salaries for Instruction 65,480.00 61,415.41 4,064.59 General Supplies 6,743.83 4,424.13 2,319.70
Total Instruction 284,327.83 277,943.54 6,384.29
Support Services:Personal Services - Employee Benefits 5,009.00 5,009.00 - Rental 130,563.17 130,563.17 -
Total Support Services 135,572.17 135,572.17 -
Total Expenditures $ 419,900.00 $ 413,515.71 6,384.29
Total Revised 2016-17 Preschool Education Aid $ 419,900.00 Add: Actual ECPA Carryover (June 30, 2016)
Add: Budgeted Transfer from the General Fund 2016-17 - Total Preschool Education Aid Funds Available for 2016-17 Budget 419,900.00
Less: 2016-2017 Budgeted Preschool Education Aid (Prior year budget carryover) (419,900.00) Available & Unbudgeted Preschool Education Aid Funds as of June 30, 2017 -
Add: June 30, 2017 Unexpended Preschool Education Aid 6,384.29 2016-17 Carryover-Preschool Education Aid Program 6,384.29
2016-17 Preschool Education Aid Carryover Budgeted Budgeted for Preschool Programs - 2017-18 $ -
CALCULATION OF BUDGET & CARRYOVER
Budgetary Basis
Special Revenue FundCITY OF WILDWOOD SCHOOL DISTRICT
For the Fiscal Year Ended June 30, 2017
Schedule of Preschool Education Aid
Total
75

CAPITAL PROJECTS FUND DETAIL STATEMENTS
The Capital Projects Fund is used to account for the acquisition and construction of major capital facilities and equipment purchases other than those financed by proprietary funds.


Exhibit F-1
Capital Projects FundSummary Schedule of Revenues, Expenditures, and Changes in Fund Balance
Budgetary BasisFor the Fiscal Year Ended June 30, 2017
Revenues and Other Financing Sources: State Sources - ROD Grant $ - Lease proceeds and transfers -
Total revenues -
Expenditures and Other Financing Uses:
Purchased professional & technical services - Construction services -
Total expenditures -
Excess of revenues over expenditures -
Fund balance - beginning 149,620.71
Fund balance - ending $ 149,620.71
CITY OF WILDWOOD SCHOOL DISTRICT
76

Exhibit F-2a
Capital Projects FundSummary Schedule of Revenues, Expenditures, and Changes in Fund Balance
Budgetary BasisROD Roof Replacement
For the Fiscal Year Ended June 30, 2017
RevisedAuthorized
Prior Periods Current Year Totals Cost
Revenues and Other Financing Sources: State Sources- ROD Grant 508,000.00$ - 508,000.00 508,000.00 Lease proceeds and transfers 825,000.00 - 825,000.00 825,000.00 Transfer from capital outlay - - -
Total revenues 1,333,000.00 - 1,333,000.00 1,333,000.00
Expenditures and Other Financing Uses:
Purchased professional & technical services 121,090.56 - 121,090.56 208,407.00 Construction services 1,062,288.73 - 1,062,288.73 1,124,593.00
Total expenditures 1,183,379.29 - 1,183,379.29 1,333,000.00
Excess of revenues over expenditures 149,620.71$ - 149,620.71 -
Additional project information: Project numbers 5790-050-14-1001G4 Grant Date 3/5/2014 Lease Authorization Date 3/26/2014 Lease Proceeds 825,000.00
Original Authorized Cost 1,333,000.00 Additional Authorized Cost - Revised Authorized Cost 1,333,000.00
Percentage Increase over Original Authorized Cost 0% Percentage Completion 89% Adjusted Target completion date 2016
CITY OF WILDWOOD SCHOOL DISTRICT
77

FIDUCIARY FUNDS DETAIL STATEMENTS
Trust funds are used to account for gifts and bequests to the school district for a specific purpose. Unemployment Fund - This trust fund is an expendable trust fund and limits expenses set aside for this purpose in current and prior budgets and contributions from employee withholding in prior years. Agency funds are used to account for assets held by the school district as an agent for individuals, private organizations, other governments and/or other funds. Student Activity Fund - This agency fund is used to account for student funds held at the schools. Payroll Fund - This agency fund is used to account for the payroll transactions of the school district.


H-1
Unemployment Private Trust & Compensation Purpose Agency
Trust Trust Funds Totals
ASSETSCash and Cash Equivalents $ 78,727.56 292,188.69 80,597.27 451,513.52 Interfunds Receivable -
Total Assets 78,727.56 292,188.69 80,597.27 451,513.52
LIABILITIESAccounts Payable 26.84 - 26.84 Payroll Deductions & Withholding 13,714.03 13,714.03 Interfunds Payable 801.28 801.28 Due to Student Groups 66,081.96 66,081.96
Total Liabilities 26.84 - 80,597.27 80,624.11
NET POSITIONTrust for Unemployment
Claims and Other Purposes $ 78,700.72 78,700.72 Reserve for Scholarships 292,188.69 292,188.69
Total Net Position 370,889.41
Total Liabilities and Net Position 451,513.52
Combining Statement of Fiduciary Net PositionFiduciary Funds
CITY OF WILDWOOD SCHOOL DISTRICT
As of June 30, 2017
78
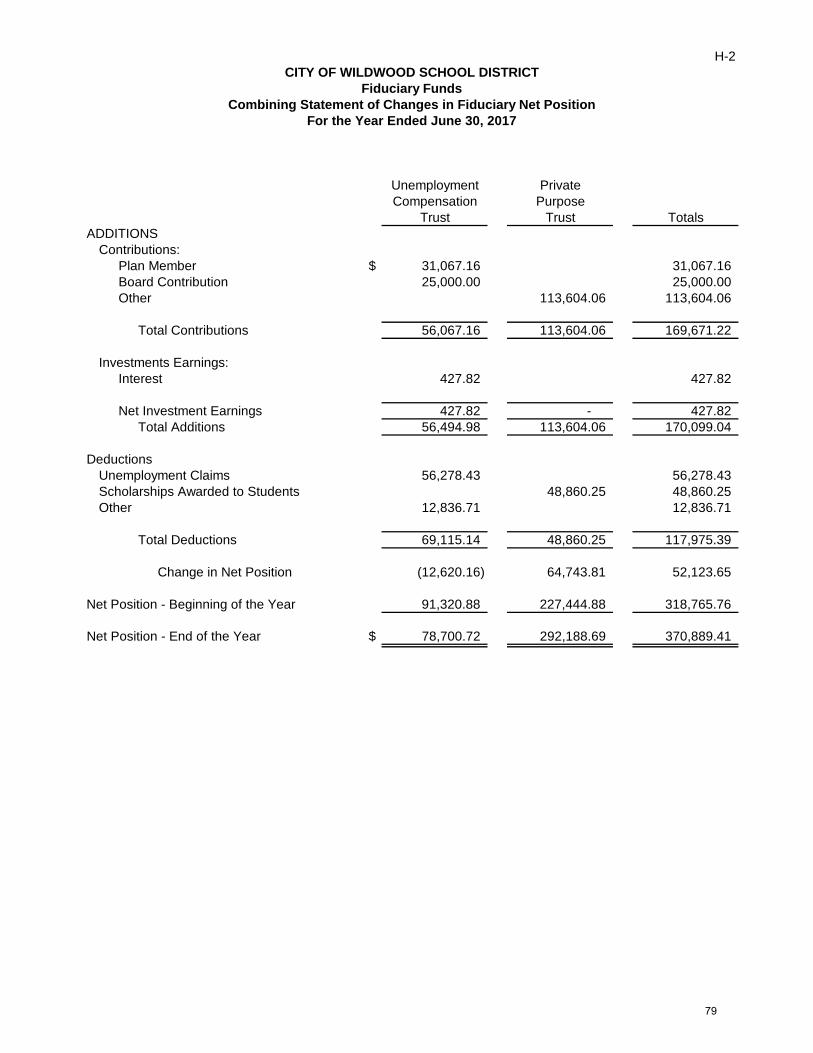
H-2
Unemployment PrivateCompensation Purpose
Trust Trust TotalsADDITIONS
Contributions:Plan Member $ 31,067.16 31,067.16 Board Contribution 25,000.00 25,000.00 Other 113,604.06 113,604.06
Total Contributions 56,067.16 113,604.06 169,671.22
Investments Earnings:Interest 427.82 427.82
Net Investment Earnings 427.82 - 427.82 Total Additions 56,494.98 113,604.06 170,099.04
DeductionsUnemployment Claims 56,278.43 56,278.43 Scholarships Awarded to Students 48,860.25 48,860.25 Other 12,836.71 12,836.71
Total Deductions 69,115.14 48,860.25 117,975.39
Change in Net Position (12,620.16) 64,743.81 52,123.65
Net Position - Beginning of the Year 91,320.88 227,444.88 318,765.76
Net Position - End of the Year $ 78,700.72 292,188.69 370,889.41
Combining Statement of Changes in Fiduciary Net PositionFiduciary Funds
CITY OF WILDWOOD SCHOOL DISTRICT
For the Year Ended June 30, 2017
79

H-3
Balance BalanceJune 30, 2016 Additions Deletions June 30, 2017
Student Activity Account $ 72,090.28 97,061.88 103,070.20 66,081.96
Total Assets $ 72,090.28 97,061.88 103,070.20 66,081.96
Schedule of Receipts and DisbursementsStudent Activity Agency Fund
CITY OF WILDWOOD SCHOOL DISTRICT
As of June 30, 2017
80
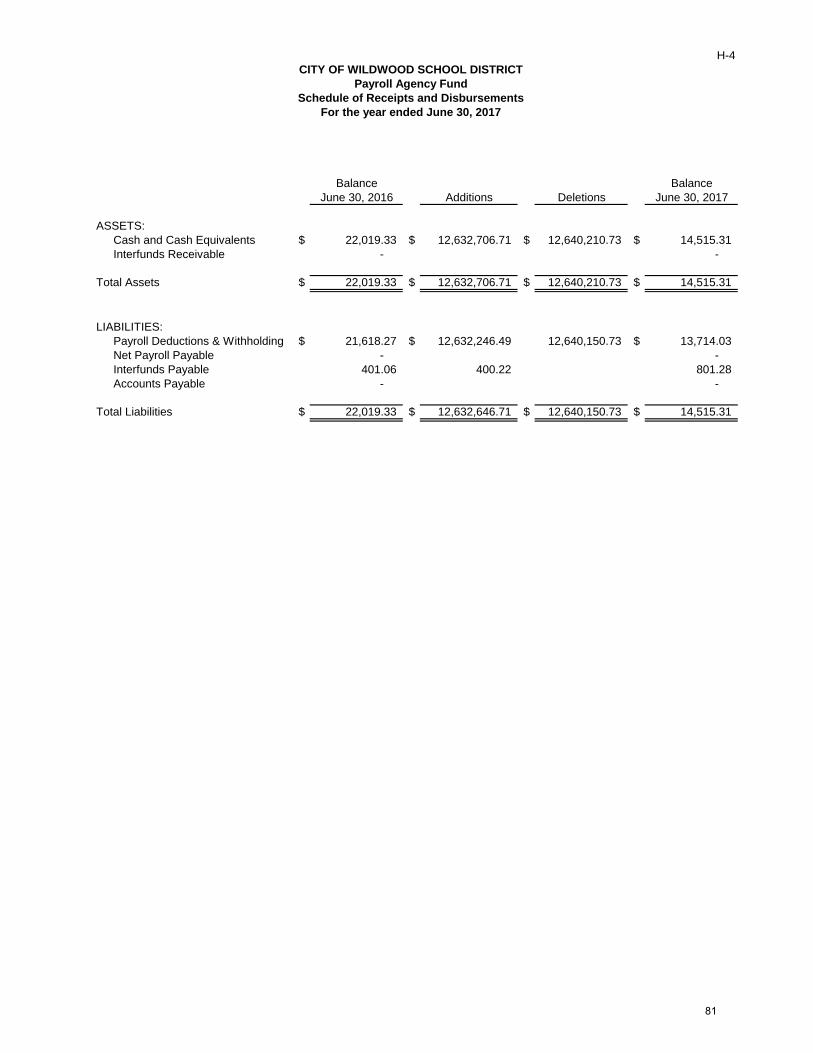
H-4
Balance BalanceJune 30, 2016 Additions Deletions June 30, 2017
ASSETS:Cash and Cash Equivalents $ 22,019.33 $ 12,632,706.71 $ 12,640,210.73 $ 14,515.31 Interfunds Receivable - -
Total Assets $ 22,019.33 $ 12,632,706.71 $ 12,640,210.73 $ 14,515.31
LIABILITIES:Payroll Deductions & Withholding $ 21,618.27 $ 12,632,246.49 12,640,150.73 $ 13,714.03 Net Payroll Payable - - Interfunds Payable 401.06 400.22 801.28 Accounts Payable - -
Total Liabilities $ 22,019.33 $ 12,632,646.71 $ 12,640,150.73 $ 14,515.31
Schedule of Receipts and DisbursementsPayroll Agency Fund
CITY OF WILDWOOD SCHOOL DISTRICT
For the year ended June 30, 2017
81

LONG-TERM DEBT SCHEDULES


I-2
Issu
edR
etire
dD
ate
ofTe
rm o
fIn
tere
stBa
lanc
eC
urre
ntC
urre
ntBa
lanc
eLe
ase
Leas
ePr
inci
pal
Inte
rest
Rat
eJu
ly 1
, 201
6Ye
arYe
arJu
ne 3
0, 2
017
Roo
f Rep
lace
men
t3/
26/2
014
5 Ye
ars
$82
5,00
0.00
47,4
71.5
21.
77%
$51
5,00
0.00
16
5,00
0.00
35
0,00
0.00
Tech
nolo
gy L
ease
8/5/
2013
5 Ye
ars
117,
458.
7010
,781
.10
3.50
%49
,076
.13
24,1
75.3
6
24
,900
.77
$56
4,07
6.13
-
18
9,17
5.36
37
4,90
0.77
CIT
Y O
F W
ILD
WO
OD
SC
HO
OL
DIS
TRIC
T
As o
f Jun
e 30
, 201
7Sc
hedu
le o
f Obl
igat
ions
Und
er C
apita
l Lea
se
Des
crip
tion
Amou
nt o
f Orig
inal
Lea
se
82

{THIS PAGE IS INTENTIONALLY LEFT BLANK}

Statistical Section


CIT
Y O
F W
ILD
WO
OD
SC
HOO
L D
ISTR
ICT
Exhi
bit J
-1Ne
t Pos
ition
by
Com
pone
nt,
Last
Ten
Fis
cal Y
ears
(acc
rual
bas
is o
f acc
ount
ing)
2008
2009
2010
2011
2012
2013
2014
2015
2016
2017
Gov
ernm
enta
l act
iviti
esN
et in
vest
men
t in
capi
tal a
sset
s5,
261,
447.
54
5,
253,
903.
08
5,
096,
579.
43
4,
928,
543.
38
4,75
2,00
9.07
4,52
3,75
6.01
3,55
0,40
3.99
4,
645,
076.
06
4,82
1,52
6.56
4,
637,
550.
56
Res
trict
ed1,
108,
693.
38
1,
813,
972.
98
2,
185,
902.
30
1,
579,
782.
56
573,
251.
81
852,
760.
28
1,68
7,62
2.44
3,
083,
483.
39
3,58
9,94
9.23
3,
964,
595.
38
Unr
estri
cted
(79,
309.
42)
(109
,553
.37)
96
,566
.68
174,
105.
46
33
2,46
7.21
(2
11,8
55.0
7)
(3
,348
,332
.58)
(4,5
01,9
28.9
5)
(4
,816
,386
.42)
(5,2
67,1
65.2
8)
Tota
l gov
ernm
enta
l act
iviti
es n
et p
ositi
on6,
290,
831.
50
6,
958,
322.
69
7,
379,
048.
41
6,
682,
431.
40
5,65
7,72
8.09
5,16
4,66
1.22
1,88
9,69
3.85
*
3,22
6,63
0.50
3,
595,
089.
37
3,33
4,98
0.66
Bus
ines
s-ty
pe a
ctiv
ities
Inve
sted
in c
apita
l ass
ets,
net
of r
elat
ed d
ebt
29,7
79.7
3
25
,682
.56
22,1
36.5
1
18
,674
.95
14,0
13.4
1
11
,443
.00
9,
796.
68
8,34
3.35
25
,082
.17
22,9
89.0
4
Res
trict
edU
nres
trict
ed10
2,53
4.76
10
1,26
8.33
10
7,97
3.30
69
,419
.29
28,5
63.8
7
2,
759.
14
(1
,279
.51)
82,1
82.5
3
64
,617
.48
155,
778.
77
To
tal b
usin
ess-
type
act
iviti
es n
et p
ositi
on13
2,31
4.49
12
6,95
0.89
13
0,10
9.81
88
,094
.24
42,5
77.2
8
14
,202
.14
8,
517.
17
90,5
25.8
8
89
,699
.65
178,
767.
81
Dis
trict
-Wid
eN
et In
vest
men
t in
capi
tal a
sset
s5,
279,
585.
64
5,
118,
715.
94
4,
947,
218.
33
4,
766,
022.
48
4,53
5,19
9.01
3,56
0,20
0.67
4,65
3,41
9.41
4,
846,
608.
73
4,84
6,60
8.73
4,
660,
539.
60
Res
trict
ed1,
813,
972.
98
2,
185,
902.
30
1,
579,
782.
56
57
3,25
1.81
852,
760.
28
1,68
7,62
2.44
3,08
3,48
3.39
3,
589,
949.
23
3,58
9,94
9.23
3,
964,
595.
38
Unr
estri
cted
(8,2
85.0
4)
20
4,53
9.98
24
3,52
4.75
36
1,03
1.08
(209
,095
.93)
(3
,349
,612
.09)
(4
,419
,746
.42)
(4,7
51,7
68.9
4)
(4
,751
,768
.94)
(5,1
11,3
86.5
1)
Tota
l dis
trict
net
pos
ition
7,08
5,27
3.58
7,50
9,15
8.22
6,77
0,52
5.64
5,70
0,30
5.37
5,
178,
863.
36
1,
898,
211.
02
3,
317,
156.
38
3,68
4,78
9.02
3,
684,
789.
02
3,51
3,74
8.47
Sour
ce: C
AFR
Sch
edul
e A-
1
Not
e: P
revi
ous
year
s ha
ve b
een
reca
ptio
ned
to c
onfo
rm to
cur
rent
term
inol
ogy
* N
et P
ositi
on w
as re
stat
ed a
s of
Jun
e 30
, 201
4 as
requ
ired
for i
mpl
emen
tatio
n of
GA
SB
68
Fisc
al Y
ear E
ndin
g Ju
ne 3
0,
83

CIT
Y O
F W
ILD
WO
OD
SC
HO
OL
DIS
TRIC
TEx
hibi
t J-2
Cha
nges
in N
et P
ositi
on,
Last
Ten
Fis
cal Y
ears
(acc
rual
bas
is o
f acc
ount
ing)
2008
2009
2010
2011
2012
2013
2014
2015
2016
2017
Expe
nses
Gov
ernm
enta
l act
iviti
es:
Inst
ruct
ion:
Reg
ular
8,76
9,82
0.59
8,79
7,55
0.80
8,77
9,75
4.28
7,18
4,68
0.12
8,17
3,91
3.01
6,75
4,30
1.81
6,01
9,32
2.47
6,86
6,50
7.05
7,84
4,67
7.29
8,
004,
112.
18
Spe
cial
edu
catio
n2,
324,
999.
04
2,
150,
394.
63
2,
037,
037.
43
3,
754,
288.
59
3,
273,
082.
42
3,
719,
394.
45
4,
032,
349.
21
4,
681,
121.
30
4,
423,
926.
37
5,35
8,16
1.24
O
ther
inst
ruct
ion
1,05
0,03
2.51
1,06
0,21
3.77
1,01
1,37
3.14
1,02
9,46
4.98
1,06
4,97
6.27
1,52
7,75
8.07
1,30
1,73
8.87
1,70
9,02
8.31
1,79
5,03
4.44
2,
242,
141.
80
Sup
port
Ser
vice
s:Tu
ition
1,25
5,42
9.08
1,30
6,64
5.39
1,34
5,01
3.34
1,34
9,05
8.88
1,59
2,59
0.07
1,72
5,04
0.09
1,50
6,84
2.62
1,10
8,10
7.05
1,19
6,33
4.39
1,
305,
190.
90
Stu
dent
& in
stru
ctio
n re
late
d se
rvic
es3,
119,
775.
88
2,
453,
771.
10
2,
872,
868.
30
2,
560,
706.
74
2,
611,
458.
62
3,
064,
786.
63
3,
156,
520.
31
3,
736,
389.
17
4,
039,
711.
20
4,38
9,49
4.93
S
choo
l adm
inis
trativ
e se
rvic
es68
9,53
4.00
74
8,52
9.87
84
6,82
5.85
81
6,87
9.24
74
8,14
5.19
96
6,27
2.47
88
0,87
4.80
89
0,59
2.88
1,
027,
728.
90
1,08
2,94
2.97
O
ther
adm
inis
trativ
e se
rvic
es65
8,88
8.18
67
0,27
4.73
63
2,29
8.82
89
3,69
7.34
1,
028,
449.
35
85
4,10
4.13
98
1,03
2.29
1,
004,
514.
00
1,
209,
112.
43
1,26
0,49
5.17
P
lant
ope
ratio
ns a
nd m
aint
enan
ce1,
606,
399.
91
1,
867,
331.
00
2,
088,
263.
25
2,
381,
713.
96
2,
219,
737.
76
1,
764,
204.
07
1,
669,
561.
72
1,
686,
678.
53
1,
799,
227.
43
1,88
9,01
3.34
P
upil
trans
porta
tion
570,
140.
56
588,
111.
25
529,
180.
46
470,
024.
96
491,
471.
30
382,
967.
77
442,
934.
37
515,
623.
77
718,
831.
34
73
5,35
7.86
Cap
ital O
utla
y47
,345
.26
-
-
-
C
harte
r Sch
ools
Inte
rest
on
long
-term
deb
t8,
941.
20
4,
111.
77
99
.18
Una
lloca
ted
depr
ecia
tion
230,
769.
55
243,
259.
96
1,60
0.00
1,60
0.00
Tota
l gov
ernm
enta
l act
iviti
es e
xpen
ses
20,2
84,7
30.5
0
19,8
90,1
94.2
7
20,1
44,3
14.0
5
20,4
42,1
14.8
1
21,2
03,8
23.9
9
20,7
58,8
29.4
9
20,0
38,5
21.9
2
22,1
98,5
62.0
6
24,0
54,5
83.7
9
26,2
66,9
10.3
9
Bus
ines
s-ty
pe a
ctiv
ities
:Fo
od s
ervi
ce93
9,34
6.98
93
4,95
2.28
89
6,12
0.88
91
5,97
2.62
91
5,55
1.97
90
5,97
3.34
90
0,13
8.33
91
7,52
1.09
97
6,24
9.22
972,
417.
25
C
hild
car
eO
ther
Tota
l bus
ines
s-ty
pe a
ctiv
ities
exp
ense
s93
9,34
6.98
93
4,95
2.28
89
6,12
0.88
91
5,97
2.62
91
5,55
1.97
90
5,97
3.34
90
0,13
8.33
91
7,52
1.09
97
6,24
9.22
972,
417.
25
To
tal d
istri
ct e
xpen
ses
21,2
24,0
77.4
8
20,8
25,1
46.5
5
21,0
40,4
34.9
3
21,3
58,0
87.4
3
22,1
19,3
75.9
6
21,6
64,8
02.8
3
20,9
38,6
60.2
5
23,1
16,0
83.1
5
25,0
30,8
33.0
1
27,2
39,3
27.6
4
Prog
ram
Rev
enue
sG
over
nmen
tal a
ctiv
ities
:C
harg
es fo
r ser
vice
sO
ther
2,04
2,31
6.50
1,92
6,20
7.35
2,56
9,34
2.00
2,23
7,99
3.00
2,19
7,83
5.00
1,80
7,72
8.53
1,57
6,67
1.31
1,90
0,19
0.75
1,50
7,07
6.23
1,
166,
433.
56
Ope
ratin
g gr
ants
and
con
tribu
tions
5,70
5,77
7.11
4,09
9,03
8.21
3,62
9,60
6.15
3,66
1,52
8.38
3,61
5,49
0.40
4,22
1,35
4.94
1,98
9,82
7.11
5,78
7,50
6.32
6,69
9,07
4.41
8,
531,
438.
25
Cap
ital g
rant
s an
d co
ntrib
utio
ns-
-
-
-
-
-
-
-
-
-
To
tal g
over
nmen
tal a
ctiv
ities
pro
gram
reve
nues
7,74
8,09
3.61
6,02
5,24
5.56
6,19
8,94
8.15
5,89
9,52
1.38
5,81
3,32
5.40
6,02
9,08
3.47
3,56
6,49
8.42
7,68
7,69
7.07
8,20
6,15
0.64
9,
697,
871.
81
Bus
ines
s-ty
pe a
ctiv
ities
:C
harg
es fo
r ser
vice
s:Fo
od s
ervi
ce31
6,63
1.10
29
2,33
1.77
24
4,03
1.59
20
6,98
1.09
20
4,69
9.09
19
5,53
9.62
20
1,68
1.73
20
3,30
5.37
21
4,30
1.71
196,
864.
88
O
ther
Ope
ratin
g gr
ants
and
con
tribu
tions
618,
352.
42
595,
139.
99
635,
113.
05
650,
903.
19
665,
967.
53
666,
738.
56
692,
603.
65
795,
981.
61
758,
140.
71
86
4,18
6.64
Cap
ital g
rant
s an
d co
ntrib
utio
nsTo
tal b
usin
ess-
type
act
iviti
es p
rogr
am re
venu
e93
4,98
3.52
88
7,47
1.76
87
9,14
4.64
85
7,88
4.28
87
0,66
6.62
86
2,27
8.18
89
4,28
5.38
99
9,28
6.98
97
2,44
2.42
1,06
1,05
1.52
To
tal d
istri
ct p
rogr
am re
venu
e8,
683,
077.
13
6,
912,
717.
32
7,
078,
092.
79
6,
757,
405.
66
6,
683,
992.
02
6,
891,
361.
65
4,
460,
783.
80
8,
686,
984.
05
9,
178,
593.
06
10,7
58,9
23.3
3
Net
(Exp
ense
)/Rev
enue
Gov
ernm
enta
l act
iviti
es(1
2,53
6,63
6.89
)
(13,
864,
948.
71)
(1
3,94
5,36
5.90
)
(14,
542,
593.
43)
(1
5,39
0,49
8.59
)
(14,
729,
746.
02)
(1
6,47
2,02
3.50
)
(14,
510,
864.
99)
(1
5,84
8,43
3.15
)
(1
6,56
9,03
8.58
)
B
usin
ess-
type
act
iviti
es(4
,363
.46)
(47,
480.
52)
(1
6,97
6.24
)
(58,
088.
34)
(4
4,88
5.35
)
(43,
695.
16)
(5
,852
.95)
81
,765
.89
(3
,806
.80)
88
,634
.27
Tota
l dis
trict
-wid
e ne
t exp
ense
(12,
541,
000.
35)
(1
3,91
2,42
9.23
)
(13,
962,
342.
14)
(1
4,60
0,68
1.77
)
(15,
435,
383.
94)
(1
4,77
3,44
1.18
)
(16,
477,
876.
45)
(1
4,42
9,09
9.10
)
(15,
852,
239.
95)
(16,
480,
404.
31)
Fisc
al Y
ear E
ndin
g Ju
ne 3
0,
84
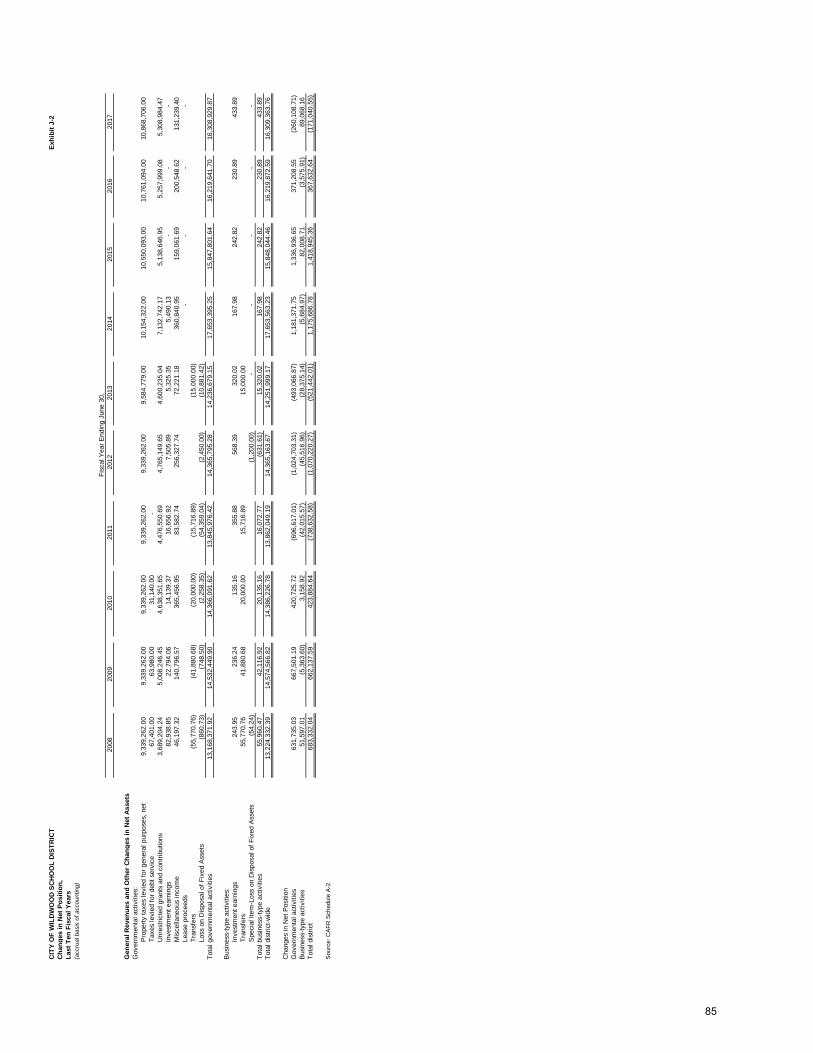
CIT
Y O
F W
ILD
WO
OD
SC
HO
OL
DIS
TRIC
TEx
hibi
t J-2
Cha
nges
in N
et P
ositi
on,
Last
Ten
Fis
cal Y
ears
(acc
rual
bas
is o
f acc
ount
ing)
2008
2009
2010
2011
2012
2013
2014
2015
2016
2017
Fisc
al Y
ear E
ndin
g Ju
ne 3
0,
Gen
eral
Rev
enue
s an
d O
ther
Cha
nges
in N
et A
sset
sG
over
nmen
tal a
ctiv
ities
:P
rope
rty ta
xes
levi
ed fo
r gen
eral
pur
pose
s, n
et9,
339,
262.
00
9,
339,
262.
00
9,
339,
262.
00
9,
339,
262.
00
9,
339,
262.
00
9,
584,
779.
00
10
,154
,322
.00
10
,550
,093
.00
10
,761
,094
.00
10
,868
,706
.00
Taxe
s le
vied
for d
ebt s
ervi
ce67
,401
.00
63
,980
.00
31
,140
.00
-
U
nres
trict
ed g
rant
s an
d co
ntrib
utio
ns3,
689,
204.
24
5,
008,
246.
45
4,
638,
351.
65
4,
476,
550.
69
4,
765,
149.
65
4,
600,
235.
04
7,
132,
742.
17
5,
138,
646.
95
5,
257,
999.
08
5,30
8,98
4.47
In
vest
men
t ear
ning
s82
,938
.85
22
,794
.06
14
,139
.37
16
,656
.92
7,
505.
89
5,
325.
35
5,
490.
13
-
-
-
M
isce
llane
ous
inco
me
46,1
97.3
2
140,
796.
57
365,
456.
95
83,5
82.7
4
256,
327.
74
72,2
21.1
8
360,
840.
95
159,
061.
69
200,
548.
62
13
1,23
9.40
Leas
e pr
ocee
ds-
-
-
-
Tr
ansf
ers
(55,
770.
76)
(4
1,88
0.68
)
(20,
000.
00)
(1
5,71
6.89
)
(15,
000.
00)
Lo
ss o
n D
ispo
sal o
f Fix
ed A
sset
s(8
60.7
3)
(748
.50)
(2,2
58.3
5)
(5
4,35
9.04
)
(2,4
50.0
0)
(1
0,88
1.42
)
Tota
l gov
ernm
enta
l act
iviti
es13
,168
,371
.92
14
,532
,449
.90
14
,366
,091
.62
13
,845
,976
.42
14
,365
,795
.28
14
,236
,679
.15
17
,653
,395
.25
15
,847
,801
.64
16
,219
,641
.70
16
,308
,929
.87
Bus
ines
s-ty
pe a
ctiv
ities
:In
vest
men
t ear
ning
s24
3.95
23
6.24
13
5.16
35
5.88
56
8.39
32
0.02
16
7.98
24
2.82
23
0.89
433.
89
Tr
ansf
ers
55,7
70.7
6
41,8
80.6
8
20,0
00.0
0
15,7
16.8
9
15,0
00.0
0
Spe
cial
Item
-Los
s on
Dis
posa
l of F
ixed
Ass
ets
(54.
24)
(1
,200
.00)
-
-
-
-
-
Tota
l bus
ines
s-ty
pe a
ctiv
ities
55,9
60.4
7
42,1
16.9
2
20,1
35.1
6
16,0
72.7
7
(631
.61)
15
,320
.02
16
7.98
24
2.82
23
0.89
433.
89
To
tal d
istri
ct-w
ide
13,2
24,3
32.3
9
14,5
74,5
66.8
2
14,3
86,2
26.7
8
13,8
62,0
49.1
9
14,3
65,1
63.6
7
14,2
51,9
99.1
7
17,6
53,5
63.2
3
15,8
48,0
44.4
6
16,2
19,8
72.5
9
16,3
09,3
63.7
6
Cha
nges
in N
et P
ositi
onG
over
nmen
tal a
ctiv
ities
631,
735.
03
667,
501.
19
420,
725.
72
(696
,617
.01)
(1,0
24,7
03.3
1)
(493
,066
.87)
1,18
1,37
1.75
1,33
6,93
6.65
371,
208.
55
(2
60,1
08.7
1)
Bus
ines
s-ty
pe a
ctiv
ities
51,5
97.0
1
(5,3
63.6
0)
3,15
8.92
(42,
015.
57)
(4
5,51
6.96
)
(28,
375.
14)
(5
,684
.97)
82
,008
.71
(3
,575
.91)
89
,068
.16
Tota
l dis
trict
683,
332.
04
662,
137.
59
423,
884.
64
(738
,632
.58)
(1,0
70,2
20.2
7)
(521
,442
.01)
1,17
5,68
6.78
1,41
8,94
5.36
367,
632.
64
(1
71,0
40.5
5)
Sour
ce: C
AFR
Sch
edul
e A-
2
85

CIT
Y O
F W
ILD
WO
OD
SC
HO
OL
DIS
TRIC
TEx
hibi
t J-3
Fund
Bal
ance
s, G
over
nmen
tal F
unds
,La
st T
en F
isca
l Yea
rs(m
odifi
ed a
ccru
al b
asis
of a
ccou
ntin
g)
2008
2009
2010
2011
2012
2013
2014
2015
2016
2017
Gen
eral
Fun
dR
estri
cted
-
-
-
778,
010.
00
-
390,
879.
78
1,04
3,85
0.08
2,18
3,84
4.68
2,28
5,53
0.52
2,25
8,67
6.67
Com
mitt
ed46
1,39
3.00
46
1,39
3.00
46
1,39
3.00
35
0,01
8.00
1,
056,
249.
92
1,
396,
971.
40
1,
755,
814.
08
As
sign
ed64
6,49
4.64
64
4,45
2.92
48
7.50
-
-
-
-
U
nass
igne
d(4
1,38
0.54
)
(6
7,40
5.89
)
(9,2
22.1
7)
0.
00
(58,
221.
76)
86
,584
.04
(69,
482.
36)
R
eser
ved
1,11
1,37
3.05
1,81
4,72
6.42
2,18
8,74
6.92
-
U
nres
erve
d21
3,42
3.76
22
,805
.03
19
0,75
4.48
To
tal g
ener
al fu
nd1,
324,
796.
81
1,
837,
531.
45
2,
379,
501.
40
1,
844,
517.
10
1,
038,
440.
03
84
3,53
8.11
1,
393,
868.
08
3,
181,
872.
84
3,
769,
085.
96
3,
945,
008.
39
All O
ther
Gov
ernm
enta
l Fun
dsR
estri
cted
Rep
orte
d in
Deb
t Ser
vice
Fun
d(2
,844
.62)
-
-
-
-
-
-
Rep
orte
d in
Cap
ital P
roje
cts
Fund
1,22
6,22
9.44
149,
620.
71
149,
620.
71
149,
620.
71
Una
ssig
ned
Rep
orte
d in
Spe
cial
Rev
enue
Fun
d(3
8,61
0.00
)
(4
0,15
4.40
)
(41,
700.
40)
(4
3,60
5.00
)
-
(41,
182.
50)
(4
1,99
0.00
)
Res
erve
d-
-
-
-
Unr
eser
ved,
repo
rted
in:
Spec
ial r
even
ue fu
nd(5
8,39
1.74
)
(36,
610.
90)
(3
7,83
7.80
)
-
C
apita
l pro
ject
s fu
nd-
D
ebt s
ervi
ce fu
nd0.
75
1.25
(2,8
44.6
2)
Pe
rman
ent f
und
-
Tota
l all
othe
r gov
ernm
enta
l fun
ds(5
8,39
0.99
)
(36,
609.
65)
(4
0,68
2.42
)
(41,
454.
62)
(40,
154.
40)
(4
1,70
0.40
)
1,18
2,62
4.44
149,
620.
71
108,
438.
21
107,
630.
71
Sou
rce:
CA
FR S
ched
ule
B-1
Fisc
al Y
ear E
ndin
g Ju
ne 3
0,
86

CIT
Y O
F W
ILD
WO
OD
SC
HO
OL
DIS
TRIC
TEx
hibi
t J-4
Cha
nges
in F
und
Bal
ance
s, G
over
nmen
tal F
unds
,La
st T
en F
isca
l Yea
rs
2008
2009
2010
2011
2012
2013
2014
2015
2016
2017
Rev
enue
sTa
x le
vy9,
406,
663.
00
9,40
3,24
2.00
9,
370,
402.
00
9,33
9,26
2.00
9,
339,
262.
00
9,58
4,77
9.00
10
,154
,322
.00
10,5
50,0
93.0
0
10,7
61,0
94.0
0
10,8
68,7
06.0
0
Tu
ition
cha
rges
2,04
2,31
6.50
1,
926,
207.
35
2,56
9,34
2.00
2,
237,
993.
00
2,18
6,33
0.00
1,
790,
379.
45
1,57
6,67
1.31
1,
900,
190.
75
1,50
7,07
6.23
1,
166,
433.
56
M
isce
llane
ous
129,
136.
17
16
3,59
0.61
379,
596.
33
10
1,15
9.34
447,
592.
25
19
8,92
5.95
366,
331.
08
15
9,06
1.69
200,
548.
62
15
2,98
3.67
St
ate
sour
ces
7,85
1,70
3.13
7,
323,
089.
86
6,66
2,85
2.95
6,
572,
383.
89
6,92
3,48
3.35
7,
293,
405.
18
7,69
9,91
5.03
7,
393,
370.
23
7,62
7,37
1.07
7,
936,
893.
59
Fe
dera
l sou
rces
1,54
3,27
8.22
1,
784,
194.
82
1,60
5,10
4.84
1,
564,
775.
50
1,28
4,90
3.08
1,
424,
154.
46
1,42
2,65
4.25
1,
611,
138.
04
1,59
1,38
7.42
1,
804,
450.
86
To
tal r
even
ue20
,973
,097
.02
20,6
00,3
24.6
4
20
,587
,298
.12
19,8
15,5
73.7
3
20
,181
,570
.68
20,2
91,6
44.0
4
21
,219
,893
.67
21,6
13,8
53.7
1
21,6
87,4
77.3
4
21,9
29,4
67.6
8
Expe
nditu
res
Inst
ruct
ion
Reg
ular
Inst
ruct
ion
7,05
9,51
5.31
7,
163,
811.
26
6,94
4,79
4.76
5,
237,
263.
27
5,73
0,67
1.14
4,
605,
349.
23
4,40
2,92
0.72
4,
472,
846.
44
4,78
7,78
1.25
4,
556,
599.
22
Sp
ecia
l edu
catio
n in
stru
ctio
n1,
635,
360.
36
1,57
4,13
7.34
1,
504,
938.
93
3,12
3,76
5.77
2,
575,
116.
20
2,91
9,04
2.57
2,
949,
520.
30
3,04
9,28
4.96
2,
700,
020.
79
3,05
0,30
6.24
Oth
er in
stru
ctio
n77
9,02
0.57
818,
667.
31
77
2,58
7.21
759,
317.
43
76
6,29
1.70
1,05
1,64
5.94
95
2,17
5.77
1,11
3,26
1.96
1,
095,
549.
49
1,27
6,41
1.59
Supp
ort S
ervi
ces:
Tuiti
on1,
255,
429.
08
1,30
6,64
5.39
1,
345,
013.
34
1,34
9,05
8.88
1,
592,
590.
07
1,72
5,04
0.09
1,
506,
842.
62
1,10
8,10
7.05
1,
196,
334.
39
1,30
5,19
0.90
Stud
ent &
inst
ruct
ion
rela
ted
serv
ices
2,49
9,37
3.86
1,
930,
452.
60
2,25
7,22
6.48
1,
965,
555.
96
1,97
1,21
1.58
2,
304,
253.
95
2,32
7,64
3.12
2,
433,
885.
94
2,46
5,52
5.70
2,
498,
861.
67
G
ener
al a
nd B
usin
ess
adm
in. s
ervi
ces
517,
826.
80
53
3,81
7.33
500,
566.
86
62
6,41
7.58
598,
426.
47
65
9,49
7.13
644,
328.
64
64
7,23
0.62
684,
917.
48
69
5,07
7.87
Sc
hool
Adm
inis
trativ
e se
rvic
es50
4,90
1.65
557,
133.
51
62
8,24
4.51
636,
440.
30
67
8,97
3.61
656,
269.
84
71
7,59
0.29
731,
133.
86
80
7,47
2.46
809,
972.
73
Plan
t ope
ratio
ns a
nd m
aint
enan
ce1,
812,
434.
32
1,77
4,38
6.39
1,
625,
238.
04
1,91
9,28
0.25
1,
728,
041.
42
1,26
9,93
4.27
1,
221,
225.
12
1,25
2,13
8.26
1,
180,
917.
43
1,24
9,41
4.38
Pupi
l tra
nspo
rtatio
n57
0,14
0.56
588,
111.
25
52
9,18
0.46
470,
024.
96
49
1,47
1.30
378,
226.
21
32
3,99
0.76
379,
250.
42
48
7,34
7.88
478,
593.
93
Una
lloca
ted
empl
oyee
ben
efits
4,09
7,85
6.52
3,
688,
228.
10
3,84
2,59
2.66
4,
146,
942.
88
4,76
8,37
5.60
4,
954,
895.
26
4,54
1,23
3.18
4,
859,
141.
77
5,18
8,08
9.08
5,
507,
848.
49
C
harte
r Sch
ools
Cap
ital o
utla
y20
,094
.36
2,50
0.00
33
,163
.82
60
,165
.52
59,1
53.0
9
16
,830
.86
28
4,57
8.82
1,32
7,73
2.12
54
4,74
1.09
326,
075.
73
Deb
t ser
vice
:Pr
inci
pal
80,0
00.0
0
80
,000
.00
45,0
00.0
0
-
-
-
-
-
-
-
Inte
rest
and
oth
er c
harg
es10
,656
.67
6,03
7.50
85
3.87
-
-
-
-
-
-
-
Tota
l exp
endi
ture
s20
,842
,610
.06
20,0
23,9
27.9
8
20
,029
,400
.94
20,2
94,2
32.8
0
20
,960
,322
.18
20,5
40,9
85.3
5
19
,872
,049
.34
21,3
74,0
13.4
0
21,1
38,6
97.0
4
21,7
54,3
52.7
5
Ex
cess
(Def
icie
ncy)
of r
even
ues
ove
r (un
der)
exp
endi
ture
s(8
8,49
5.32
)
13
0,48
6.96
576,
396.
66
55
7,89
1.18
(478
,659
.07)
(7
78,7
51.5
0)
(2
49,3
41.3
1)
1,
347,
844.
33
548,
780.
30
17
5,11
4.93
Oth
er F
inan
cing
sou
rces
(use
s)C
apita
l lea
ses
(non
-bud
gete
d)94
2,45
8.70
-
-
-
Tran
sfer
s in
-
-
-
-
2,84
4.62
-
-
-
-
-
Tr
ansf
ers
out
(55,
770.
76)
(41,
880.
68)
(20,
000.
00)
(15,
716.
89)
(2,8
44.6
2)
(1
5,00
0.00
)
To
tal o
ther
fina
ncin
g so
urce
s (u
ses)
(55,
770.
76)
(41,
880.
68)
(20,
000.
00)
(15,
716.
89)
-
(1
5,00
0.00
)
-
-
-
-
Net
cha
nge
in fu
nd b
alan
ces
(144
,266
.08)
88
,606
.28
556,
396.
66
54
2,17
4.29
(478
,659
.07)
(7
93,7
51.5
0)
(2
49,3
41.3
1)
1,
347,
844.
33
548,
780.
30
17
5,11
4.93
Deb
t ser
vice
as
a pe
rcen
tage
of
nonc
apita
l exp
endi
ture
s0.
44%
0.43
%0.
23%
0.00
%0.
00%
0.00
%0.
00%
0.00
%0.
00%
0.00
%
Sou
rce:
CA
FR S
ched
ule
B-2
87
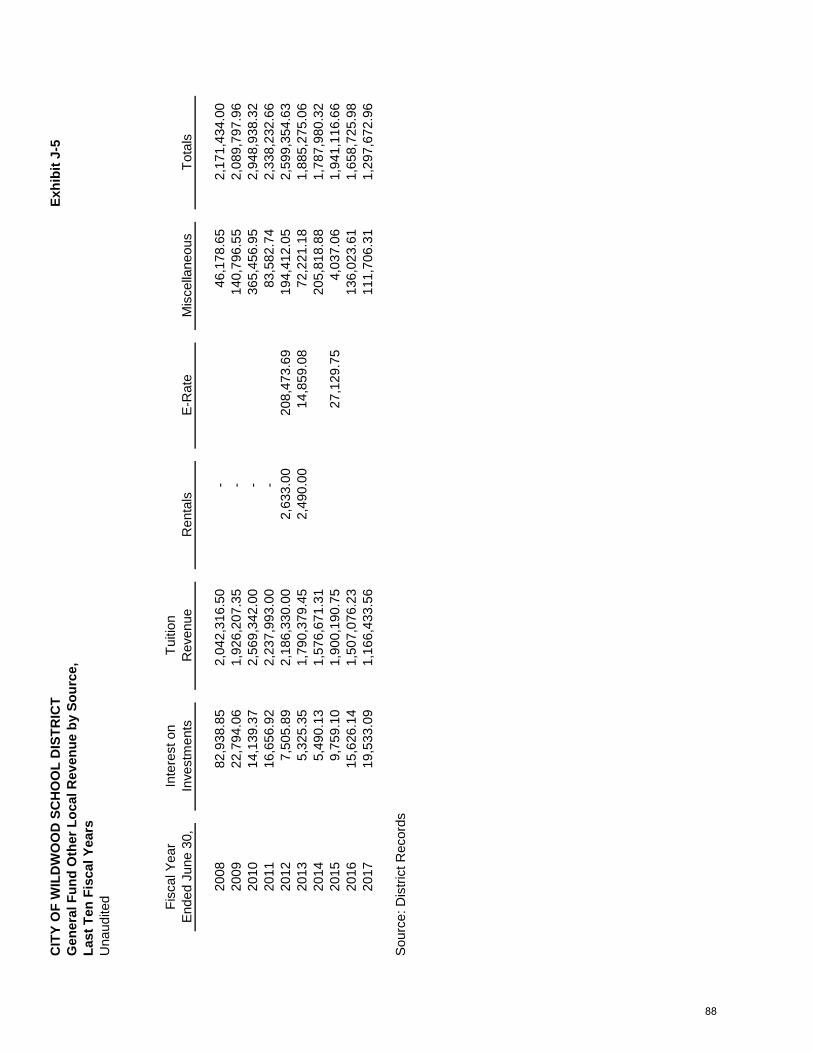
CIT
Y O
F W
ILD
WO
OD
SC
HO
OL
DIS
TRIC
TEx
hibi
t J-5
Gen
eral
Fun
d O
ther
Loc
al R
even
ue b
y So
urce
,La
st T
en F
isca
l Yea
rsU
naud
ited Fisc
al Y
ear
Inte
rest
on
Tuiti
onEn
ded
June
30,
Inve
stm
ents
Rev
enue
Ren
tals
E-R
ate
Mis
cella
neou
sTo
tals
2008
82,9
38.8
5
2,
042,
316.
50
-
46
,178
.65
2,17
1,43
4.00
20
0922
,794
.06
1,92
6,20
7.35
-
140,
796.
55
2,08
9,79
7.96
20
1014
,139
.37
2,56
9,34
2.00
-
365,
456.
95
2,94
8,93
8.32
20
1116
,656
.92
2,23
7,99
3.00
-
83,5
82.7
4
2,
338,
232.
66
2012
7,50
5.89
2,18
6,33
0.00
2,63
3.00
208,
473.
69
194,
412.
05
2,59
9,35
4.63
20
135,
325.
35
1,
790,
379.
45
2,
490.
00
14
,859
.08
72,2
21.1
8
1,
885,
275.
06
2014
5,49
0.13
1,57
6,67
1.31
205,
818.
88
1,78
7,98
0.32
20
159,
759.
10
1,
900,
190.
75
27
,129
.75
4,03
7.06
1,94
1,11
6.66
20
1615
,626
.14
1,50
7,07
6.23
136,
023.
61
1,65
8,72
5.98
20
1719
,533
.09
1,16
6,43
3.56
111,
706.
31
1,29
7,67
2.96
Sour
ce: D
istri
ct R
ecor
ds
88
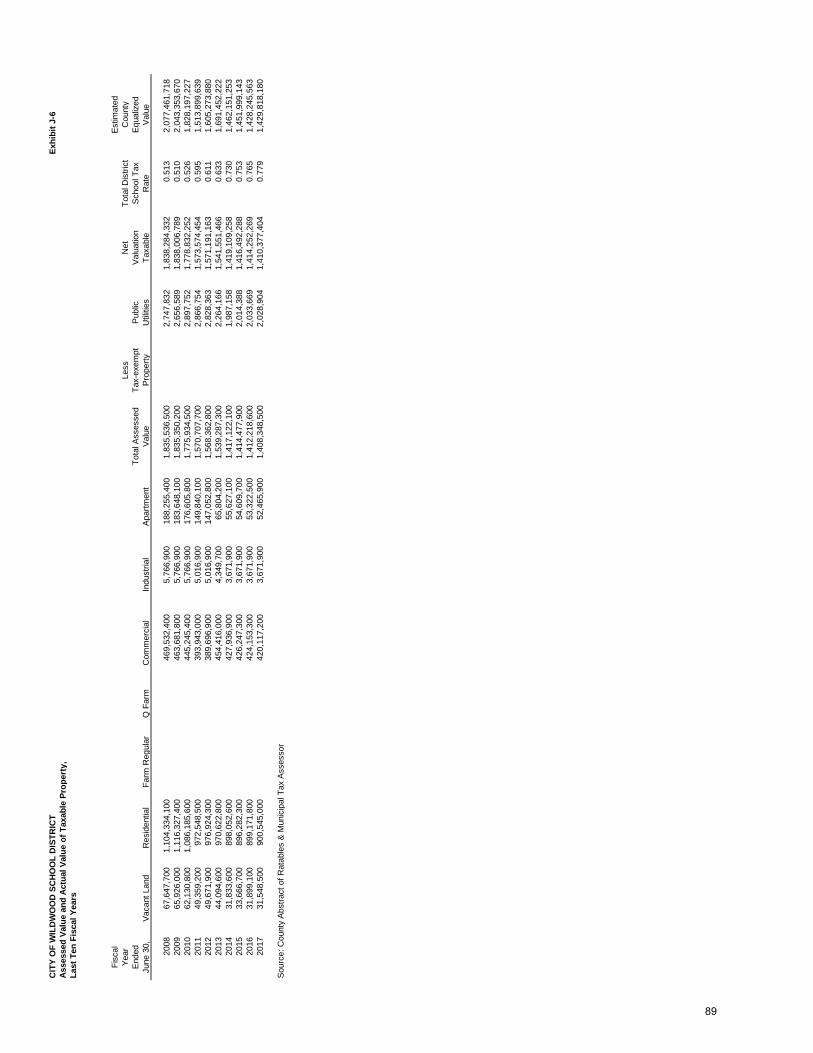
CIT
Y O
F W
ILD
WO
OD
SC
HO
OL
DIS
TRIC
TEx
hibi
t J-6
Ass
esse
d Va
lue
and
Act
ual V
alue
of T
axab
le P
rope
rty,
Last
Ten
Fis
cal Y
ears
Fisc
alEs
timat
edYe
arLe
ssN
etTo
tal D
istri
ctC
ount
yEn
ded
Tota
l Ass
esse
dTa
x-ex
empt
Publ
icVa
luat
ion
Scho
ol T
axEq
ualiz
edJu
ne 3
0,Va
cant
Lan
dR
esid
entia
lFa
rm R
egul
arQ
Far
mC
omm
erci
alIn
dust
rial
Apar
tmen
tVa
lue
Prop
erty
Util
ities
Taxa
ble
Rat
eVa
lue
2008
67,6
47,7
00
1,
104,
334,
100
46
9,53
2,40
0
5,
766,
900
188,
255,
400
1,83
5,53
6,50
0
2,
747,
832
1,83
8,28
4,33
2
0.
513
2,07
7,46
1,71
8
2009
65,9
26,0
00
1,
116,
327,
400
46
3,68
1,80
0
5,
766,
900
183,
648,
100
1,83
5,35
0,20
0
2,
656,
589
1,83
8,00
6,78
9
0.
510
2,04
3,35
3,67
0
2010
62,1
30,8
00
1,
086,
185,
600
44
5,24
5,40
0
5,
766,
900
176,
605,
800
1,77
5,93
4,50
0
2,
897,
752
1,77
8,83
2,25
2
0.
526
1,82
8,19
7,22
7
2011
49,3
59,2
00
97
2,54
8,50
0
39
3,94
3,00
0
5,
016,
900
149,
840,
100
1,57
0,70
7,70
0
2,
866,
754
1,57
3,57
4,45
4
0.
595
1,51
3,89
9,63
9
2012
49,6
71,9
00
97
6,92
4,30
0
38
9,69
6,90
0
5,
016,
900
147,
052,
800
1,56
8,36
2,80
0
2,
828,
363
1,57
1,19
1,16
3
0.
611
1,60
5,27
3,88
0
2013
44,0
94,6
00
97
0,62
2,80
0
45
4,41
6,00
0
4,
349,
700
65,8
04,2
00
1,53
9,28
7,30
0
2,
264,
166
1,54
1,55
1,46
6
0.
633
1,69
1,45
2,22
2
2014
31,8
33,6
00
89
8,05
2,60
0
42
7,93
6,90
0
3,
671,
900
55,6
27,1
00
1,41
7,12
2,10
0
1,
987,
158
1,41
9,10
9,25
8
0.
730
1,46
2,15
1,25
3
2015
33,6
66,7
00
89
6,28
2,30
0
42
6,24
7,30
0
3,
671,
900
54,6
09,7
00
1,41
4,47
7,90
0
2,
014,
388
1,41
6,49
2,28
8
0.
753
1,45
1,99
9,14
3
2016
31,8
99,1
00
89
9,17
1,80
0
42
4,15
3,30
0
3,
671,
900
53,3
22,5
00
1,41
2,21
8,60
0
2,
033,
669
1,41
4,25
2,26
9
0.
765
1,42
8,24
5,56
3
2017
31,5
48,5
00
90
0,54
5,00
0
42
0,11
7,20
0
3,
671,
900
52,4
65,9
00
1,40
8,34
8,50
0
2,
028,
904
1,41
0,37
7,40
4
0.
779
1,42
9,81
8,18
0
Sour
ce: C
ount
y Ab
stra
ct o
f Rat
able
s &
Mun
icip
al T
ax A
sses
sor
89
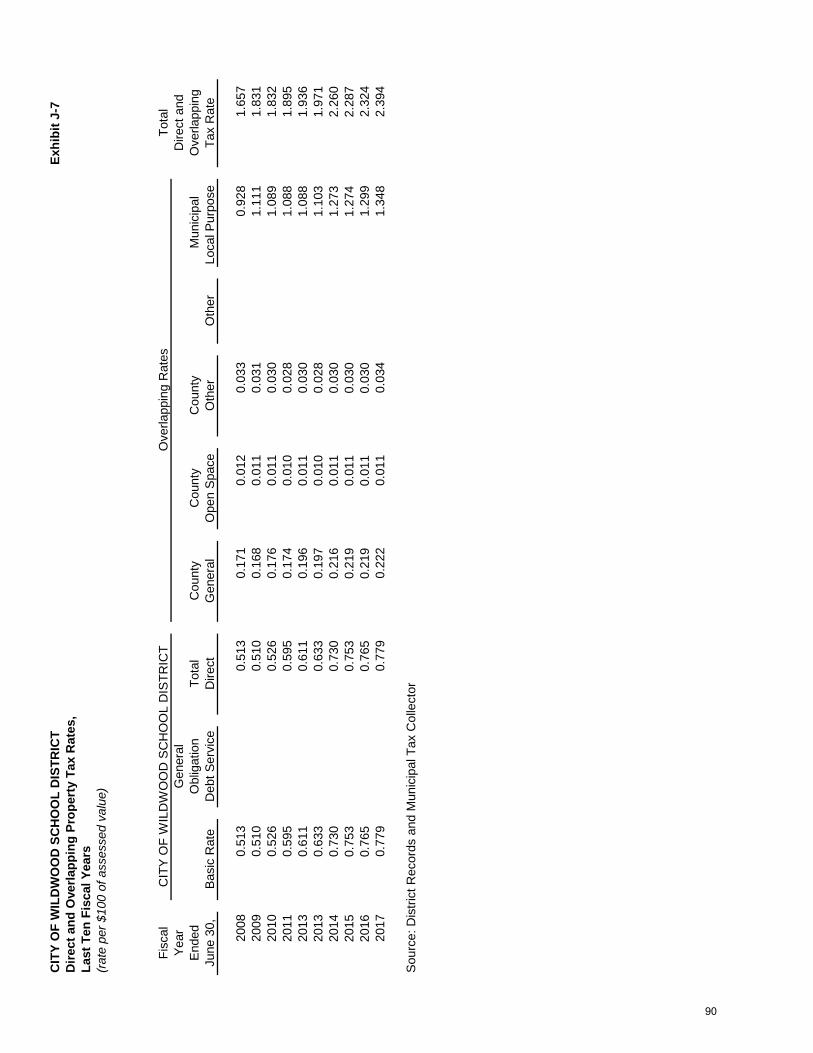
CIT
Y O
F W
ILD
WO
OD
SC
HO
OL
DIS
TRIC
TEx
hibi
t J-7
Dire
ct a
nd O
verla
ppin
g Pr
oper
ty T
ax R
ates
,La
st T
en F
isca
l Yea
rs(r
ate
per $
100
of a
sses
sed
valu
e)
Fisc
alTo
tal
Year
Gen
eral
Dire
ct a
ndE
nded
Obl
igat
ion
Tota
lC
ount
yC
ount
yC
ount
yM
unic
ipal
Ove
rlapp
ing
June
30,
Bas
ic R
ate
Deb
t Ser
vice
Dire
ctG
ener
alO
pen
Spa
ceO
ther
Oth
erLo
cal P
urpo
seTa
x R
ate
2008
0.51
3
0.
513
0.17
1
0.
012
0.03
3
0.
928
1.
657
20
090.
510
0.51
0
0.
168
0.01
1
0.
031
1.11
1
1.83
1
2010
0.52
6
0.
526
0.17
6
0.
011
0.03
0
1.
089
1.
832
20
110.
595
0.59
5
0.
174
0.01
0
0.
028
1.08
8
1.89
5
2013
0.61
1
0.
611
0.19
6
0.
011
0.03
0
1.
088
1.
936
20
130.
633
0.63
3
0.
197
0.01
0
0.
028
1.10
3
1.97
1
2014
0.73
0
0.
730
0.21
6
0.
011
0.03
0
1.
273
2.
260
20
150.
753
0.75
3
0.
219
0.01
1
0.
030
1.27
4
2.28
7
2016
0.76
5
0.
765
0.21
9
0.
011
0.03
0
1.
299
2.
324
20
170.
779
0.77
9
0.
222
0.01
1
0.
034
1.34
8
2.39
4
Sou
rce:
Dis
trict
Rec
ords
and
Mun
icip
al T
ax C
olle
ctor
CIT
Y O
F W
ILD
WO
OD
SC
HO
OL
DIS
TRIC
TO
verla
ppin
g R
ates
90
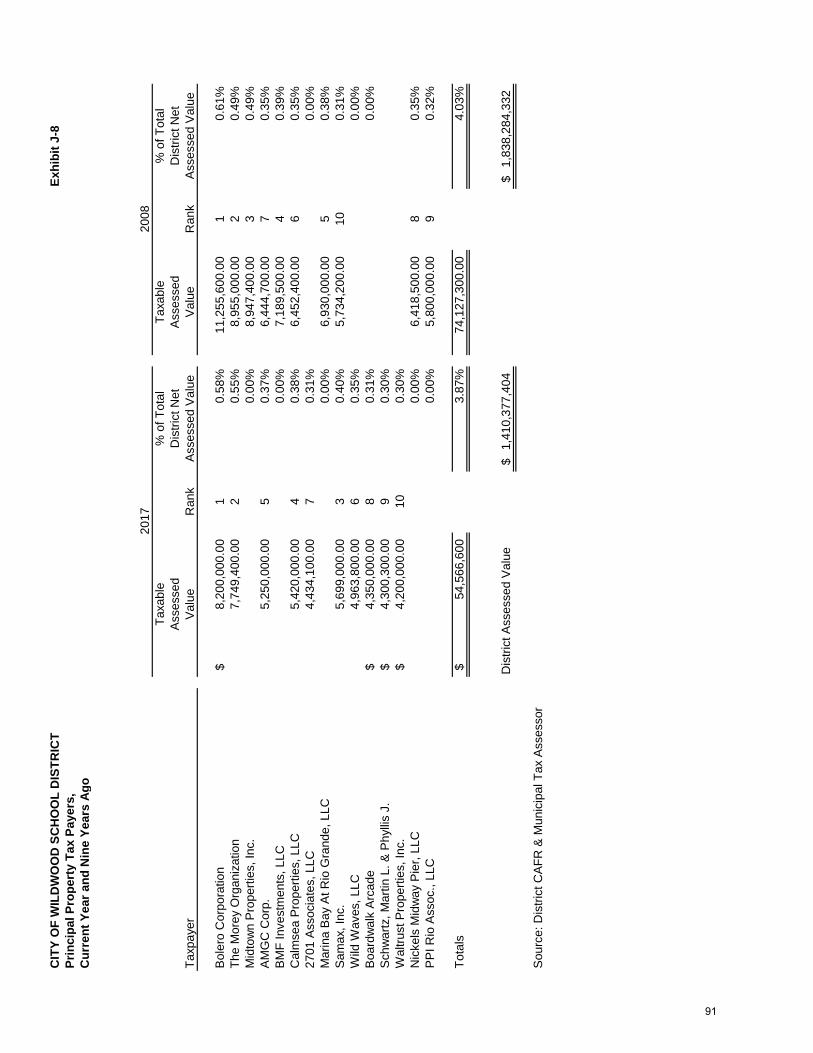
CIT
Y O
F W
ILD
WO
OD
SC
HO
OL
DIS
TRIC
TEx
hibi
t J-8
Prin
cipa
l Pro
pert
y Ta
x Pa
yers
,C
urre
nt Y
ear a
nd N
ine
Year
s A
go
Taxa
ble
% o
f Tot
alTa
xabl
e%
of T
otal
Ass
esse
dD
istri
ct N
etA
sses
sed
Dis
trict
Net
Taxp
ayer
Val
ueR
ank
Ass
esse
d V
alue
Val
ueR
ank
Ass
esse
d V
alue
Bol
ero
Cor
pora
tion
8,20
0,00
0.00
$
1
0.58
%11
,255
,600
.00
10.
61%
The
Mor
ey O
rgan
izat
ion
7,74
9,40
0.00
2
0.55
%8,
955,
000.
00
20.
49%
Mid
tow
n P
rope
rties
, Inc
.0.
00%
8,94
7,40
0.00
3
0.49
%A
MG
C C
orp.
5,25
0,00
0.00
5
0.37
%6,
444,
700.
00
70.
35%
BM
F In
vest
men
ts, L
LC0.
00%
7,18
9,50
0.00
4
0.39
%C
alm
sea
Pro
perti
es, L
LC5,
420,
000.
00
40.
38%
6,45
2,40
0.00
6
0.35
%27
01 A
ssoc
iate
s, L
LC4,
434,
100.
00
70.
31%
0.00
%M
arin
a B
ay A
t Rio
Gra
nde,
LLC
0.00
%6,
930,
000.
00
50.
38%
Sam
ax, I
nc.
5,69
9,00
0.00
3
0.40
%5,
734,
200.
00
100.
31%
Wild
Wav
es, L
LC4,
963,
800.
00
60.
35%
0.00
%B
oard
wal
k A
rcad
e 4,
350,
000.
00$
80.
31%
0.00
%S
chw
artz
, Mar
tin L
. & P
hylli
s J.
4,30
0,30
0.00
$
9
0.30
%W
altru
st P
rope
rties
, Inc
.4,
200,
000.
00$
100.
30%
Nic
kels
Mid
way
Pie
r, LL
C0.
00%
6,41
8,50
0.00
8
0.35
%P
PI R
io A
ssoc
., LL
C0.
00%
5,80
0,00
0.00
9
0.32
%
Tota
ls54
,566
,600
$
3.87
%74
,127
,300
.00
4.03
%
Dis
trict
Ass
esse
d V
alue
1,41
0,37
7,40
4$
1,
838,
284,
332
$
Sou
rce:
Dis
trict
CA
FR &
Mun
icip
al T
ax A
sses
sor
2017
2008
91

CIT
Y O
F W
ILD
WO
OD
SC
HO
OL
DIS
TRIC
TEx
hibi
t J-9
Prop
erty
Tax
Lev
ies
and
Col
lect
ions
,La
st T
en F
isca
l Yea
rs
Fisc
alYe
arC
olle
ctio
ns in
End
edTa
xes
Levi
ed fo
rP
erce
ntag
eS
ubse
quen
tJu
ne 3
0,th
e Fi
scal
Yea
rA
mou
ntof
Lev
yYe
ars
2008
9,40
6,66
3.00
9,
406,
663.
00
100%
-
2009
9,40
3,24
2.00
9,
403,
242.
00
100%
-
2010
9,37
0,40
2.00
9,
370,
402.
00
100%
-
2011
9,33
9,26
2.00
9,
339,
262.
00
100%
-
2012
9,33
9,26
2.00
9,
339,
262.
00
100%
-
2013
9,58
4,77
9.00
9,
584,
779.
00
100%
-
2014
10,1
54,3
22.0
0
10,1
54,3
22.0
0
100%
-
2015
10,5
50,0
93.0
0
10,5
50,0
93.0
0
100%
-
2016
10,7
61,0
94.0
0
10,7
61,0
94.0
0
100%
-
2017
10,8
68,7
06.0
0
10,8
68,7
06.0
0
100%
-
Sou
rce:
Dis
trict
reco
rds
incl
udin
g th
e C
ertif
icat
e an
d R
epor
t of S
choo
l Tax
es (A
4F fo
rm)
Col
lect
ed w
ithin
the
Fisc
al Y
ear
of th
e Le
vy
92
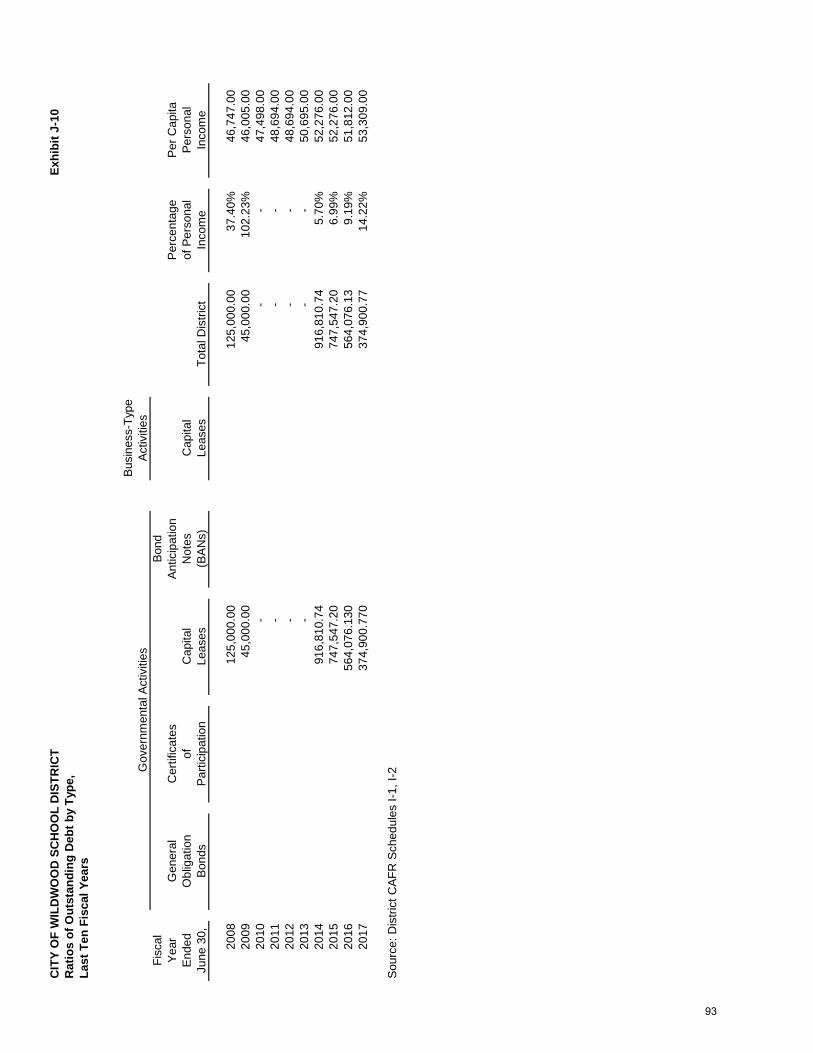
CIT
Y O
F W
ILD
WO
OD
SC
HO
OL
DIS
TRIC
TEx
hibi
t J-1
0R
atio
s of
Out
stan
ding
Deb
t by
Type
,La
st T
en F
isca
l Yea
rs
Busi
ness
-Typ
eAc
tiviti
esFi
scal
Bond
Year
Gen
eral
Cer
tific
ates
Antic
ipat
ion
Perc
enta
gePe
r Cap
itaEn
ded
Obl
igat
ion
ofC
apita
lN
otes
Cap
ital
of P
erso
nal
Pers
onal
June
30,
Bond
sPa
rtici
patio
nLe
ases
(BAN
s)Le
ases
Tota
l Dis
trict
Inco
me
Inco
me
2008
125,
000.
00
125,
000.
00
37
.40%
46,7
47.0
0
2009
45,0
00.0
0
45
,000
.00
102.
23%
46,0
05.0
0
2010
-
-
-
47,4
98.0
0
2011
-
-
-
48,6
94.0
0
2012
-
-
-
48,6
94.0
0
2013
-
-
-
50,6
95.0
0
2014
916,
810.
74
916,
810.
74
5.
70%
52,2
76.0
0
2015
747,
547.
20
747,
547.
20
6.
99%
52,2
76.0
0
2016
564,
076.
130
564,
076.
13
9.
19%
51,8
12.0
0
2017
374,
900.
770
374,
900.
77
14
.22%
53,3
09.0
0
Sour
ce: D
istri
ct C
AFR
Sch
edul
es I-
1, I-
2Gov
ernm
enta
l Act
iviti
es
93

CIT
Y O
F W
ILD
WO
OD
SC
HO
OL
DIS
TRIC
TEx
hibi
t J-1
1R
atio
s of
Net
Gen
eral
Bon
ded
Deb
t Out
stan
ding
,La
st T
en F
isca
l Yea
rs
Fisc
alP
erce
ntag
e of
Deb
tYe
arG
ener
alN
et G
ener
alA
ctua
l Tax
able
Per
Cap
itaE
nded
Obl
igat
ion
Bon
ded
Deb
tV
alue
of
Per
sona
lJu
ne 3
0,B
onds
Ded
uctio
nsO
utst
andi
ngP
rope
rtyIn
com
e
2008
-
-
-
0.00
%46
,747
.00
20
09-
-
-
0.
00%
46,0
05.0
0
2010
-
-
-
0.00
%47
,498
.00
20
11-
-
-
0.
00%
48,6
94.0
0
2012
-
-
-
0.00
%48
,694
.00
20
13-
-
-
0.
00%
50,6
95.0
0
2014
-
-
-
0.00
%52
,276
.00
20
15-
-
-
0.
00%
52,2
76.0
0
2016
-
-
-
0.00
%51
,812
.00
20
17-
-
-
0.
00%
53,3
09.0
0
Gov
ernm
enta
l Act
iviti
es
94

CIT
Y O
F W
ILD
WO
OD
SC
HO
OL
DIS
TRIC
TEx
hibi
t J-1
2D
irect
and
Ove
rlapp
ing
Gov
ernm
enta
l Act
iviti
es D
ebt,
As o
f Dec
embe
r 31,
201
6
Estim
ated
Bond
ed D
ebt
Estim
ated
Shar
e of
and
Loan
sPe
rcen
tage
Ove
rlapp
ing
Gov
ernm
enta
l Uni
tO
utst
andi
ngAp
plic
able
Deb
t
Deb
t Rep
aid
with
Pro
pert
y Ta
xes
City
of W
ildw
ood
19,7
05,5
07.4
5$
100.
00%
19,7
05,5
07.4
5$
Oth
er D
ebt
City
of W
ildw
ood
Wat
er a
nd S
ewer
Util
ities
39,1
09,0
98.6
4
100.
00%
39,1
09,0
98.6
4
Cou
nty
of C
ape
May
22
6,12
5,66
5.11
3.
12%
7,05
5,12
0.75
C
ape
May
Cou
nty
MU
A 57
,915
,545
.00
3.
12%
1,80
6,96
5.00
C
ape
May
Brid
ge C
omm
issi
on
13,6
02,4
19.4
7
3.12
%42
4,39
5.49
Subt
otal
, Ove
rlapp
ing
Deb
t48
,395
,579
.88
City
of W
ildw
ood
Scho
ol D
istr
ict D
irect
Deb
t-
Tota
l Dire
ct a
nd O
verla
ppin
g D
ebt
68,1
01,0
87.3
3$
Sour
ces:
C
ount
y an
d D
istri
ct R
ecor
ds
95

CIT
Y O
F W
ILD
WO
OD
SC
HO
OL
DIS
TRIC
TEx
hibi
t J-1
3Le
gal D
ebt M
argi
n In
form
atio
n,La
st T
en F
isca
l Yea
rs
Equa
lized
val
uatio
n ba
sis
2016
1,42
0,17
1,56
1$
2015
1,41
6,60
2,80
4$
2014
1,44
0,60
3,84
3
4,
277,
378,
208
$
Aver
age
equa
lized
val
uatio
n of
taxa
ble
prop
erty
1,42
5,79
2,73
6$
Deb
t lim
it ( 4
% o
f ave
rage
)57
,031
,709
N
et b
onde
d sc
hool
deb
t-
Le
gal d
ebt m
argi
n57
,031
,709
$
2008
2009
2010
2011
2012
2013
2014
2015
2016
2017
Deb
t lim
it76
,324
,180
80,9
67,7
14
79
,658
,526
74,4
57,2
63
68
,704
,506
63,7
43,4
26
60
,429
,874
58
,571
,251
57,3
38,3
83
57
,031
,709
Tota
l net
deb
t app
licab
le to
lim
it
Lega
l deb
t mar
gin
64,0
68,1
40
76
,324
,180
80,9
67,7
14
79
,658
,526
74,4
57,2
63
68
,704
,506
63,7
43,4
26
58,5
71,2
51
57
,338
,383
57,0
31,7
09
Tota
l net
deb
t app
licab
le to
the
limit
as a
per
cent
age
of d
ebt l
imit
0.00
%0.
00%
0.00
%0.
00%
0.00
%0.
00%
0.00
%0.
00%
0.00
%0.
00%
Sour
ce: A
bstra
ct o
f Rat
able
s an
d D
istri
ct R
ecor
ds C
AFR
Sch
edul
e J-
7
96
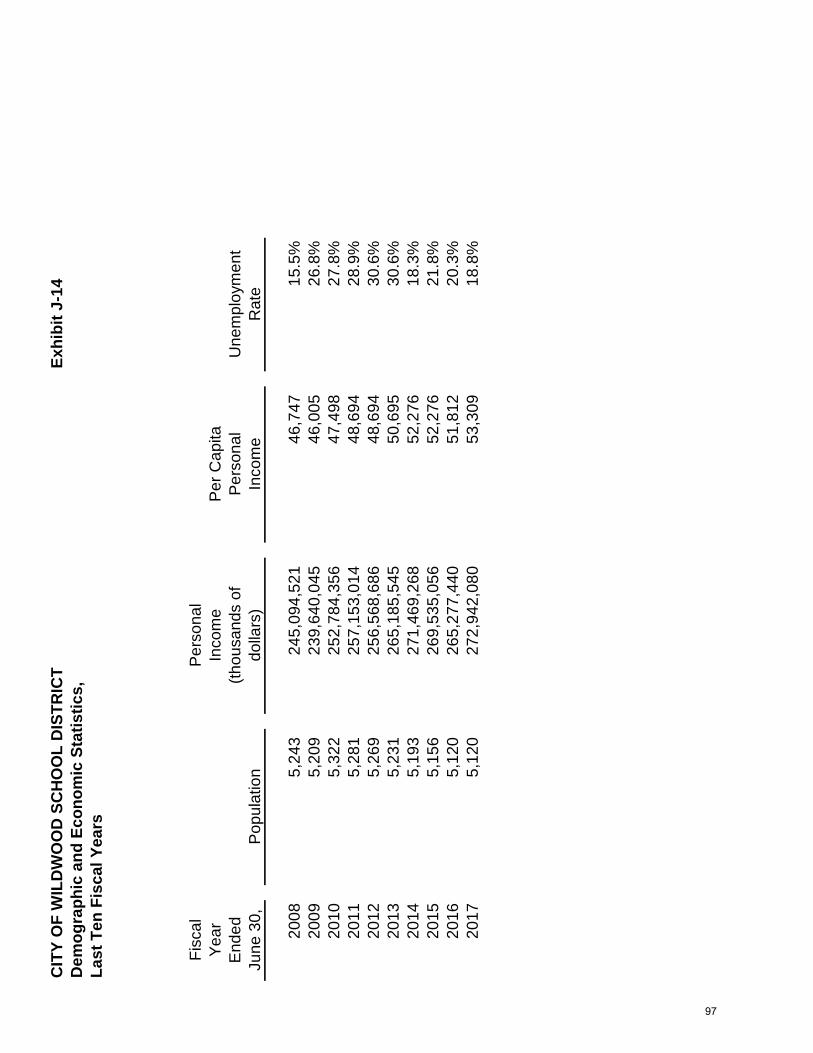
CIT
Y O
F W
ILD
WO
OD
SC
HO
OL
DIS
TRIC
TEx
hibi
t J-1
4D
emog
raph
ic a
nd E
cono
mic
Sta
tistic
s,La
st T
en F
isca
l Yea
rs
Fisc
alP
erso
nal
Year
Inco
me
Per
Cap
itaE
nded
(thou
sand
s of
Per
sona
lU
nem
ploy
men
tJu
ne 3
0,P
opul
atio
ndo
llars
)In
com
eR
ate
2008
5,24
3
24
5,09
4,52
1
46
,747
15
.5%
2009
5,20
9
23
9,64
0,04
5
46
,005
26
.8%
2010
5,32
2
25
2,78
4,35
6
47
,498
27
.8%
2011
5,28
1
25
7,15
3,01
4
48
,694
28
.9%
2012
5,26
9
25
6,56
8,68
6
48
,694
30
.6%
2013
5,23
1
26
5,18
5,54
5
50
,695
30
.6%
2014
5,19
3
27
1,46
9,26
8
52
,276
18
.3%
2015
5,15
6
26
9,53
5,05
6
52
,276
21
.8%
2016
5,12
0
26
5,27
7,44
0
51
,812
20
.3%
2017
5,12
0
27
2,94
2,08
0
53
,309
18
.8%
97

CIT
Y O
F W
ILD
WO
OD
SC
HO
OL
DIS
TRIC
TEx
hibi
t J-1
5Pr
inci
pal E
mpl
oyer
s,C
urre
nt Y
ear a
nd N
ine
Year
s Ag
o
Perc
enta
ge o
fPe
rcen
tage
of
Tota
lTo
tal
Empl
oyer
Empl
oyee
sR
ank
Empl
oym
ent
Empl
oyee
sR
ank
Empl
oym
ent
Not
Ava
ilabl
eN
ot A
vaila
ble
Tota
ls-
0.00
%-
0.00
%
2017
2008
98
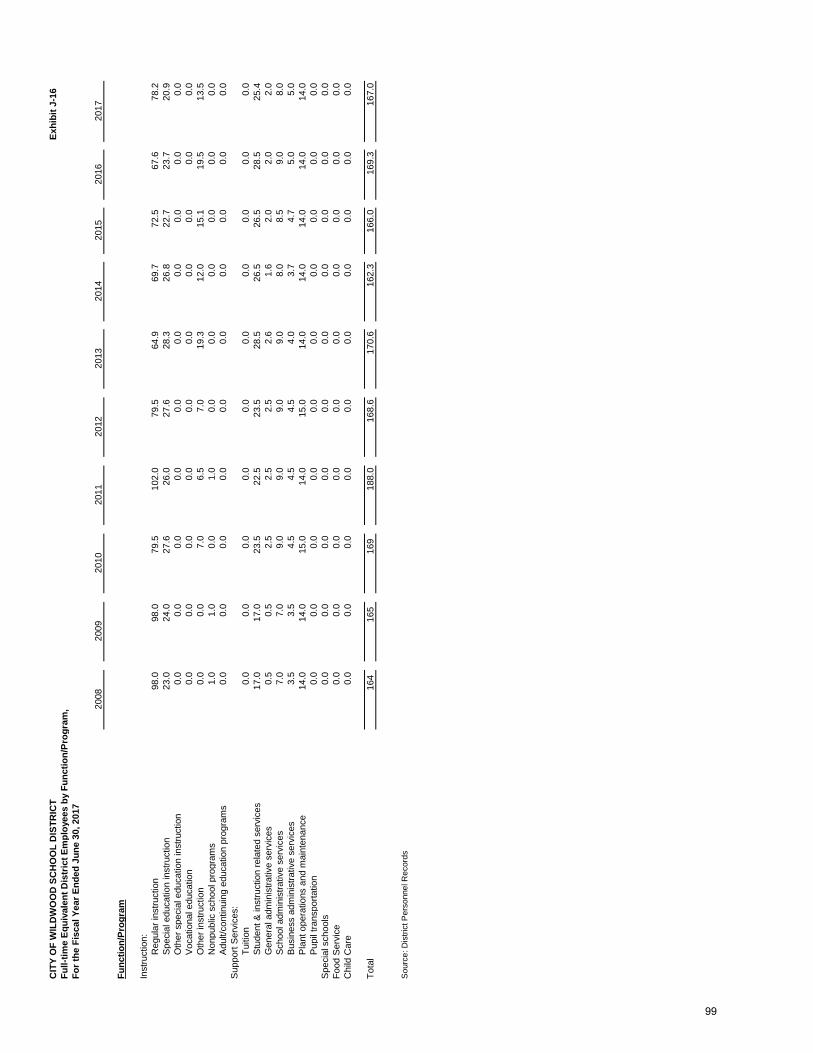
CIT
Y O
F W
ILD
WO
OD
SC
HO
OL
DIS
TRIC
TEx
hibi
t J-1
6Fu
ll-tim
e Eq
uiva
lent
Dis
tric
t Em
ploy
ees
by F
unct
ion/
Prog
ram
,Fo
r the
Fis
cal Y
ear E
nded
Jun
e 30
, 201
7
2008
2009
2010
2011
2012
2013
2014
2015
2016
2017
Func
tion/
Prog
ram
Inst
ruct
ion:
Reg
ular
inst
ruct
ion
98.0
98.0
79.5
102.
079
.564
.969
.772
.567
.678
.2S
peci
al e
duca
tion
inst
ruct
ion
23.0
24.0
27.6
26.0
27.6
28.3
26.8
22.7
23.7
20.9
Oth
er s
peci
al e
duca
tion
inst
ruct
ion
0.0
0.0
0.0
0.0
0.0
0.0
0.0
0.0
0.0
0.0
Voc
atio
nal e
duca
tion
0.0
0.0
0.0
0.0
0.0
0.0
0.0
0.0
0.0
0.0
Oth
er in
stru
ctio
n0.
00.
07.
06.
57.
019
.312
.015
.119
.513
.5N
onpu
blic
sch
ool p
rogr
ams
1.0
1.0
0.0
1.0
0.0
0.0
0.0
0.0
0.0
0.0
Adu
lt/co
ntin
uing
edu
catio
n pr
ogra
ms
0.0
0.0
0.0
0.0
0.0
0.0
0.0
0.0
0.0
0.0
Sup
port
Ser
vice
s:Tu
ition
0.0
0.0
0.0
0.0
0.0
0.0
0.0
0.0
0.0
0.0
Stu
dent
& in
stru
ctio
n re
late
d se
rvic
es17
.017
.023
.522
.523
.528
.526
.526
.528
.525
.4G
ener
al a
dmin
istra
tive
serv
ices
0.5
0.5
2.5
2.5
2.5
2.6
1.6
2.0
2.0
2.0
Sch
ool a
dmin
istra
tive
serv
ices
7.0
7.0
9.0
9.0
9.0
9.0
8.0
8.5
9.0
8.0
Bus
ines
s ad
min
istra
tive
serv
ices
3.5
3.5
4.5
4.5
4.5
4.0
3.7
4.7
5.0
5.0
Pla
nt o
pera
tions
and
mai
nten
ance
14.0
14.0
15.0
14.0
15.0
14.0
14.0
14.0
14.0
14.0
Pup
il tra
nspo
rtatio
n0.
00.
00.
00.
00.
00.
00.
00.
00.
00.
0S
peci
al s
choo
ls0.
00.
00.
00.
00.
00.
00.
00.
00.
00.
0Fo
od S
ervi
ce0.
00.
00.
00.
00.
00.
00.
00.
00.
00.
0C
hild
Car
e0.
00.
00.
00.
00.
00.
00.
00.
00.
00.
0
Tota
l16
4
165
16
9
188.
016
8.6
170.
616
2.3
166.
016
9.3
167.
0
Sou
rce:
Dis
trict
Per
sonn
el R
ecor
ds
99
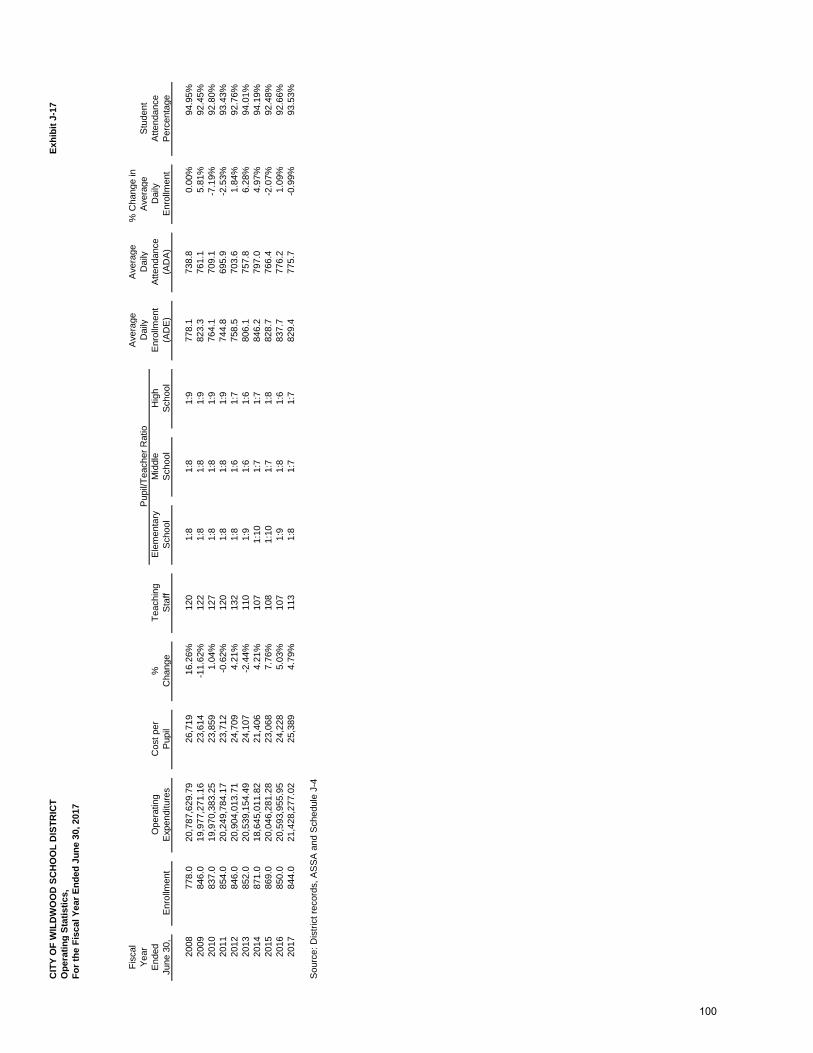
CIT
Y O
F W
ILD
WO
OD
SC
HO
OL
DIS
TRIC
TEx
hibi
t J-1
7O
pera
ting
Stat
istic
s,Fo
r the
Fis
cal Y
ear E
nded
Jun
e 30
, 201
7
Fisc
alA
vera
geA
vera
ge%
Cha
nge
inYe
arD
aily
Dai
lyA
vera
geS
tude
ntE
nded
Ope
ratin
gC
ost p
er%
Teac
hing
Ele
men
tary
Mid
dle
Hig
hE
nrol
lmen
tA
ttend
ance
Dai
lyA
ttend
ance
June
30,
Enr
ollm
ent
Exp
endi
ture
sP
upil
Cha
nge
Sta
ffS
choo
lS
choo
lS
choo
l(A
DE
)(A
DA
)E
nrol
lmen
tP
erce
ntag
e
2008
778.
0
20,7
87,6
29.7
9
26,7
19
16.2
6%12
01:
81:
81:
977
8.1
738.
80.
00%
94.9
5%20
0984
6.0
19
,977
,271
.16
23
,614
-1
1.62
%12
21:
81:
81:
982
3.3
761.
15.
81%
92.4
5%20
1083
7.0
19
,970
,383
.25
23
,859
1.
04%
127
1:8
1:8
1:9
764.
1 70
9.1
-7.1
9%92
.80%
2011
854.
0
20,2
49,7
84.1
7
23,7
12
-0.6
2%12
01:
81:
81:
974
4.8
695.
9-2
.53%
93.4
3%20
1284
6.0
20
,904
,013
.71
24
,709
4.
21%
132
1:8
1:6
1:7
758.
5 70
3.6
1.84
%92
.76%
2013
852.
0
20,5
39,1
54.4
9
24,1
07
-2.4
4%11
01:
91:
61:
680
6.1
757.
86.
28%
94.0
1%20
1487
1.0
18
,645
,011
.82
21
,406
4.
21%
107
1:10
1:7
1:7
846.
2 79
7.0
4.97
%94
.19%
2015
869.
0
20,0
46,2
81.2
8
23,0
68
7.76
%10
81:
101:
71:
882
8.7
766.
4-2
.07%
92.4
8%20
1685
0.0
20
,593
,955
.95
24
,228
5.
03%
107
1:9
1:8
1:6
837.
7 77
6.2
1.09
%92
.66%
2017
844.
0
21,4
28,2
77.0
2
25,3
89
4.79
%11
31:
81:
71:
782
9.4
775.
7-0
.99%
93.5
3%
Sou
rce:
Dis
trict
reco
rds,
AS
SA
and
Sch
edul
e J-
4
Pup
il/Te
ache
r Rat
io
100
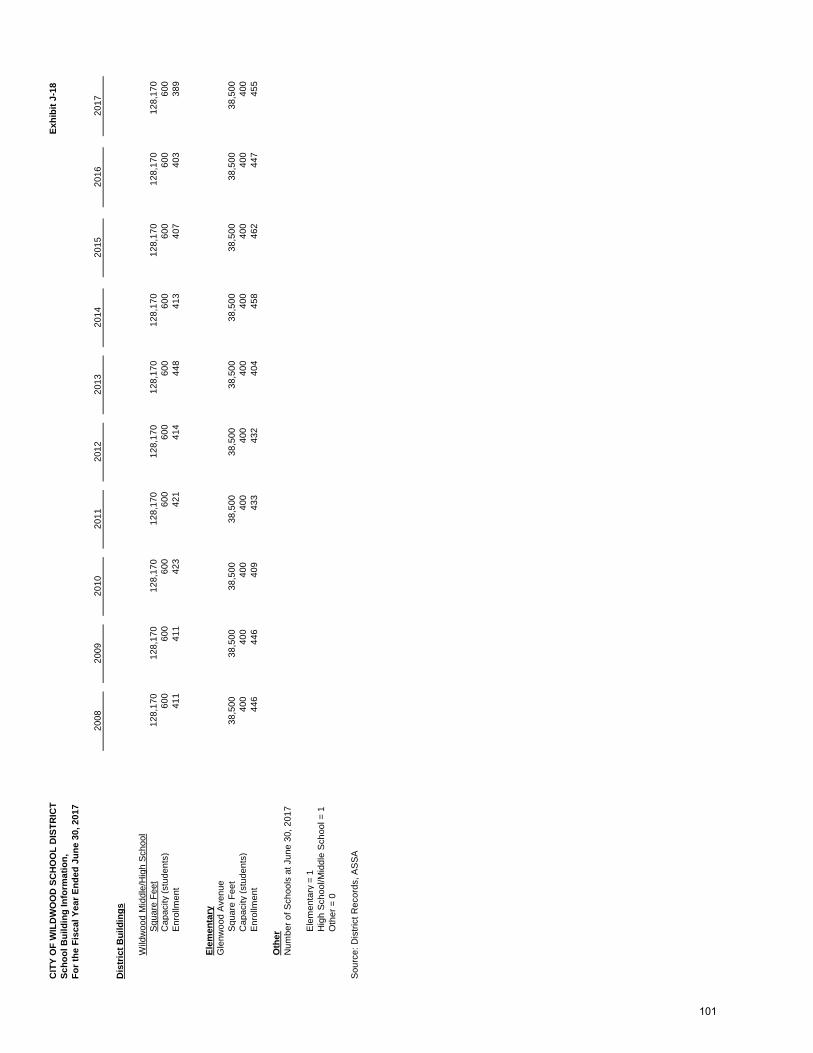
CIT
Y O
F W
ILD
WO
OD
SC
HO
OL
DIS
TRIC
TEx
hibi
t J-1
8Sc
hool
Bui
ldin
g In
form
atio
n,Fo
r the
Fis
cal Y
ear E
nded
Jun
e 30
, 201
7
2008
2009
2010
2011
2012
2013
2014
2015
2016
2017
Dis
tric
t Bui
ldin
gs
Wild
woo
d M
iddl
e/H
igh
Sch
ool
Squ
are
Feet
128,
170
128,
170
128,
170
128,
170
128,
170
128,
170
12
8,17
0
128,
170
12
8,17
0
128,
170
C
apac
ity (s
tude
nts)
600
600
600
600
600
600
60
0
600
60
0
600
E
nrol
lmen
t41
141
142
342
141
444
8
413
40
7
403
38
9
Elem
enta
ryG
lenw
ood
Ave
nue
Squ
are
Feet
38,5
00
38,5
00
38,5
00
38,5
00
38,5
00
38,5
00
38,5
00
38,5
00
38,5
00
38,5
00
Cap
acity
(stu
dent
s)40
0
400
40
0
400
40
0
400
40
0
400
40
0
400
E
nrol
lmen
t44
6
446
40
9
433
43
2
404
45
8
462
44
7
455
Oth
erN
umbe
r of S
choo
ls a
t Jun
e 30
, 201
7
Ele
men
tary
= 1
Hig
h S
choo
l/Mid
dle
Sch
ool =
1O
ther
= 0
Sou
rce:
Dis
trict
Rec
ords
, AS
SA
101
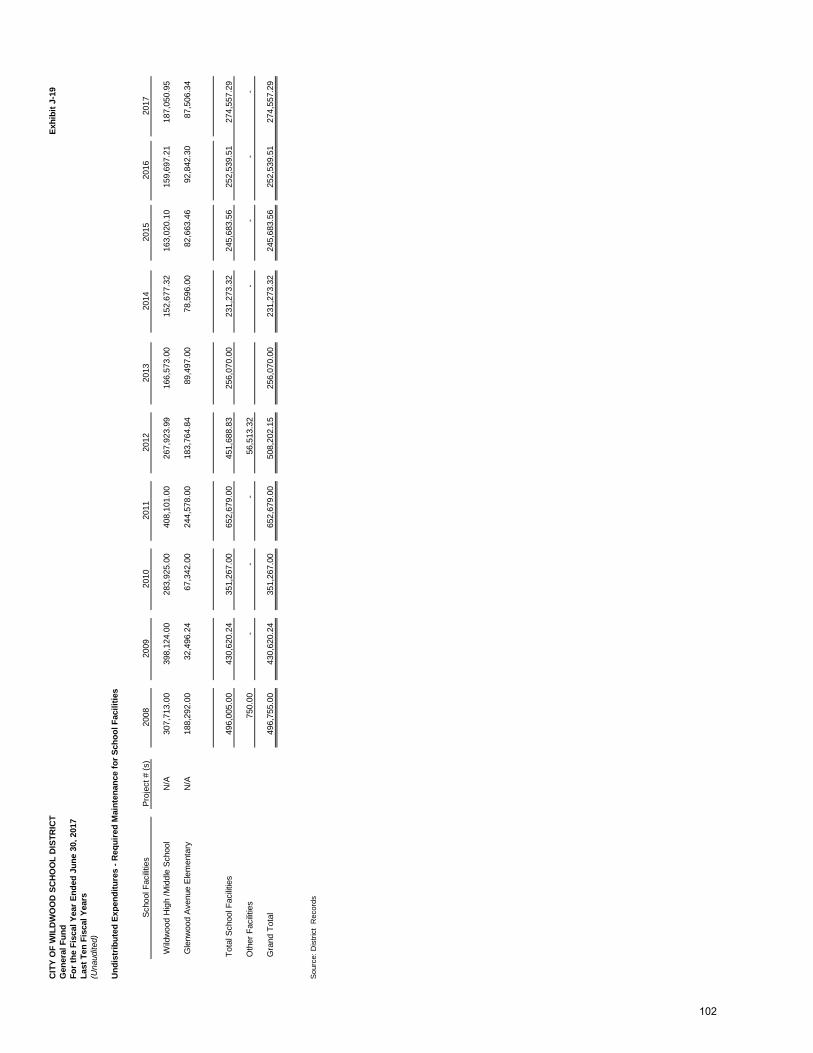
CIT
Y O
F W
ILD
WO
OD
SC
HO
OL
DIS
TRIC
TEx
hibi
t J-1
9G
ener
al F
und
For t
he F
isca
l Yea
r End
ed J
une
30, 2
017
Last
Ten
Fis
cal Y
ears
(Una
udite
d)
Und
istr
ibut
ed E
xpen
ditu
res
- Req
uire
d M
aint
enan
ce fo
r Sch
ool F
acili
ties
Scho
ol F
acilit
ies
Proj
ect #
(s)
2008
2009
2010
2011
2012
2013
2014
2015
2016
2017
Wild
woo
d H
igh
/Mid
dle
Scho
olN
/A30
7,71
3.00
398,
124.
00
28
3,92
5.00
408,
101.
00
26
7,92
3.99
166,
573.
00
15
2,67
7.32
163,
020.
10
159,
697.
21
18
7,05
0.95
Gle
nwoo
d Av
enue
Ele
men
tary
N
/A18
8,29
2.00
32,4
96.2
4
67,3
42.0
0
244,
578.
00
18
3,76
4.84
89,4
97.0
0
78,5
96.0
0
82,6
63.4
6
92
,842
.30
87,5
06.3
4
Tota
l Sch
ool F
acilit
ies
496,
005.
00
43
0,62
0.24
351,
267.
00
65
2,67
9.00
451,
688.
83
25
6,07
0.00
231,
273.
32
24
5,68
3.56
25
2,53
9.51
274,
557.
29
Oth
er F
acilit
ies
750.
00
-
-
-
56,5
13.3
2
-
-
-
-
Gra
nd T
otal
496,
755.
00
43
0,62
0.24
351,
267.
00
65
2,67
9.00
508,
202.
15
25
6,07
0.00
231,
273.
32
24
5,68
3.56
25
2,53
9.51
274,
557.
29
Sour
ce: D
istri
ct R
ecor
ds
102
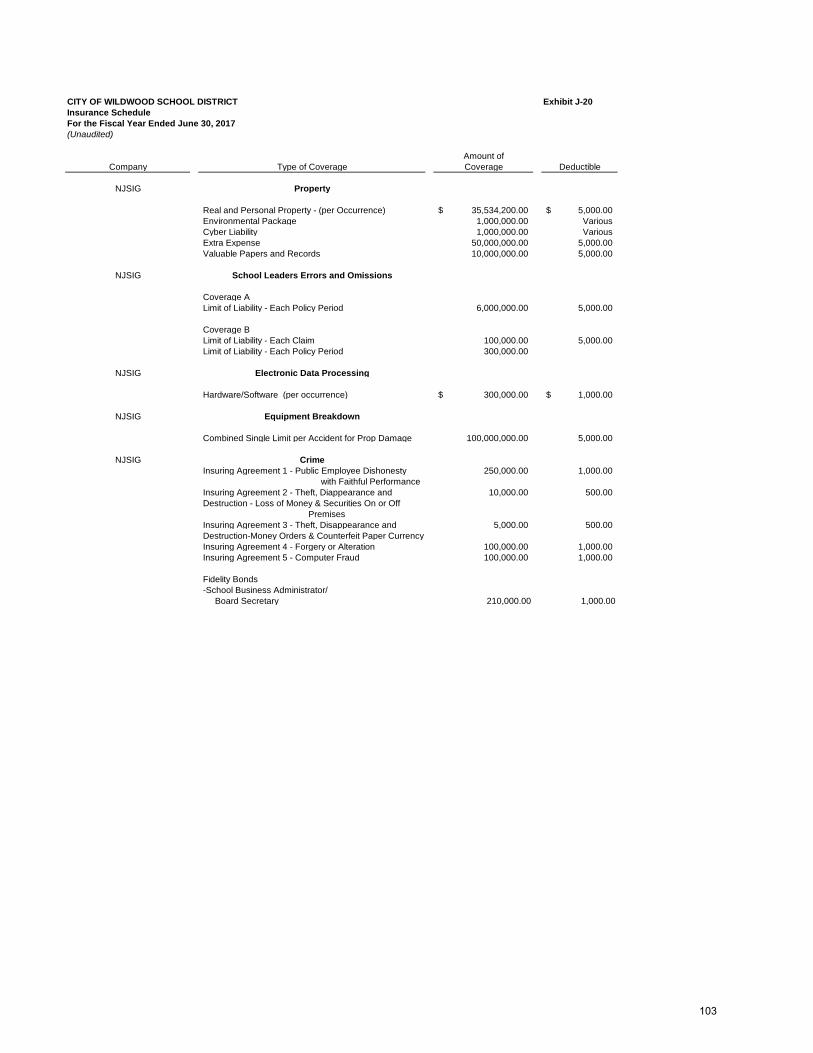
CITY OF WILDWOOD SCHOOL DISTRICT Exhibit J-20Insurance ScheduleFor the Fiscal Year Ended June 30, 2017(Unaudited)
Amount ofCompany Type of Coverage Coverage Deductible
NJSIG Property
Real and Personal Property - (per Occurrence) 35,534,200.00$ 5,000.00$ Environmental Package 1,000,000.00 VariousCyber Liability 1,000,000.00 VariousExtra Expense 50,000,000.00 5,000.00 Valuable Papers and Records 10,000,000.00 5,000.00
NJSIG School Leaders Errors and Omissions
Coverage ALimit of Liability - Each Policy Period 6,000,000.00 5,000.00
Coverage BLimit of Liability - Each Claim 100,000.00 5,000.00 Limit of Liability - Each Policy Period 300,000.00
NJSIG Electronic Data Processing
Hardware/Software (per occurrence) 300,000.00$ 1,000.00$
NJSIG Equipment Breakdown
Combined Single Limit per Accident for Prop Damage 100,000,000.00 5,000.00
NJSIG CrimeInsuring Agreement 1 - Public Employee Dishonesty 250,000.00 1,000.00
with Faithful PerformanceInsuring Agreement 2 - Theft, Diappearance and 10,000.00 500.00 Destruction - Loss of Money & Securities On or Off PremisesInsuring Agreement 3 - Theft, Disappearance and 5,000.00 500.00 Destruction-Money Orders & Counterfeit Paper CurrencyInsuring Agreement 4 - Forgery or Alteration 100,000.00 1,000.00 Insuring Agreement 5 - Computer Fraud 100,000.00 1,000.00
Fidelity Bonds-School Business Administrator/ Board Secretary 210,000.00 1,000.00
103
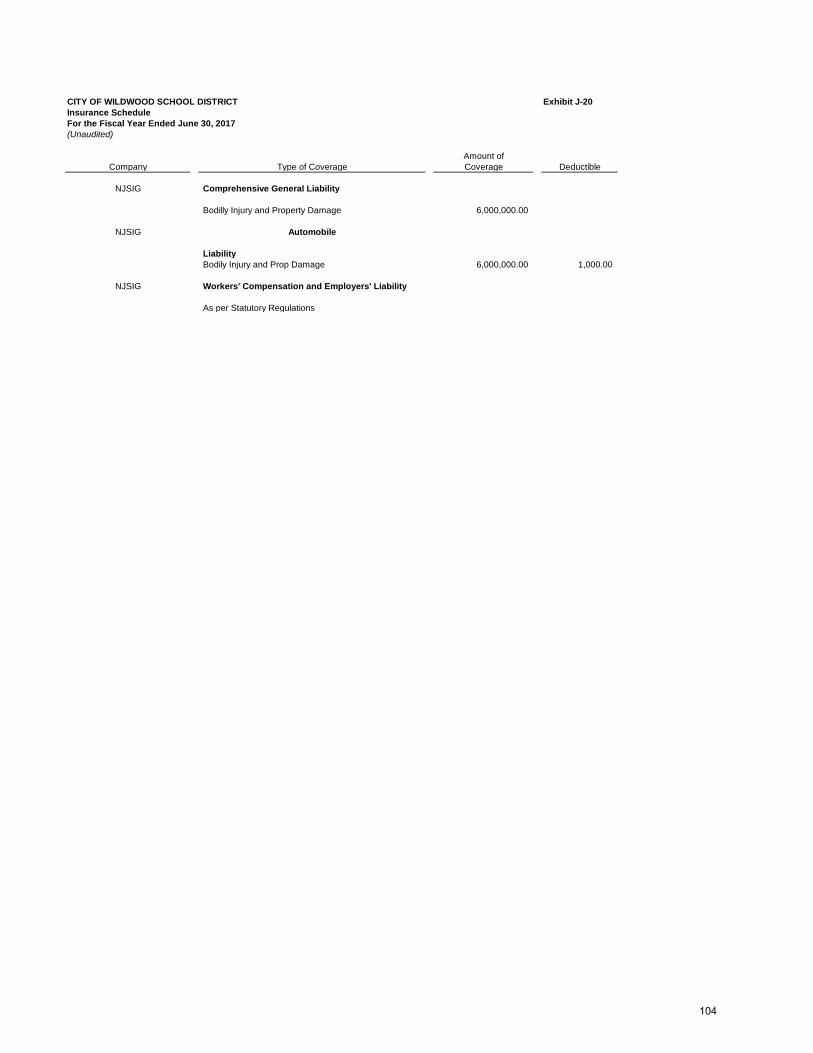
CITY OF WILDWOOD SCHOOL DISTRICT Exhibit J-20Insurance ScheduleFor the Fiscal Year Ended June 30, 2017(Unaudited)
Amount ofCompany Type of Coverage Coverage Deductible
NJSIG Comprehensive General Liability
Bodilly Injury and Property Damage 6,000,000.00
NJSIG Automobile
LiabilityBodily Injury and Prop Damage 6,000,000.00 1,000.00
NJSIG Workers' Compensation and Employers' Liability
As per Statutory Regulations
104
Single Audit Section

K-1 INDEPENDENT AUDITOR’S REPORT Honorable President and Members of the Board of Education City of Wildwood School District County of Cape May, New Jersey
We have audited the basic financial statements of the Board of Education of the City of Wildwood, State of New Jersey, as of and for the fiscal year ended June 30, 2017, and have issued our report thereon dated November 27, 2017. We conducted our audit in accordance with auditing standards generally accepted in the United States of America; the standards applicable to financial audits contained in Government Auditing Standards, issued by the Comptroller General of the United States; and audit requirements presented by the Division of Finance, Department of Education, State of New Jersey. Internal Control Over Financial Reporting In planning and performing our audit of the financial statements, we considered City of Wildwood School District’s control over financial reporting (internal control) to determine the audit procedures that are appropriate in the circumstances for the purpose of expressing our opinions on the financial statements but not for the purpose of expressing an opinion on the effectiveness of City of Wildwood School District’s internal control. Accordingly, we do not express an opinion on the effectiveness of District’s internal control. A deficiency in internal control exists when the design or operation of a control does not allow management or employees, in the normal course of performing their assigned functions, to prevent, or detect and correct, misstatements on a timely basis. A material weakness is a deficiency, or a combination of deficiencies, in internal control, such that there is a reasonable possibility that a material misstatement of the entity’s financial statements will not be prevented, or detected and corrected on a timely basis. A significant deficiency is a deficiency, or a combination of deficiencies, in internal control that is less severe than a material weakness, yet important enough to merit attention by those charged with governance. Our consideration of internal control was for the limited purpose described in the first paragraph of this section and was not designed to identify all deficiencies in internal control that might be material weaknesses or significant deficiencies. Given these limitations, during our audit we did not identify any deficiencies in internal control that we consider to be material weaknesses. However, material weaknesses may exist that have not been identified.
105

Compliance and Other Matters As part of obtaining reasonable assurance about whether the City of Wildwood School District’s basic financial statements are free of material misstatement, we performed tests of its compliance with certain provisions of laws, regulations, contracts and grant agreements, noncompliance with which could have a direct and material effect on the determination of basic financial statement amounts. However, providing an opinion on compliance with those provisions was not an objective of our audit, and accordingly, we do not express such an opinion. The results of our tests disclosed no instances of noncompliance or other matters that are required to be reported under Government Auditing Standards and audit requirements prescribed by the Division of Finance, Department of Education, and State of New Jersey. Purpose of this Report The purpose of this report is solely to describe the scope of our testing of internal control and compliance and the results of that testing, and not to provide an opinion on the effectiveness of the entity’s internal control or on compliance. This report is an integral part of an audit performed in accordance with Government Auditing Standards in considering the entity’s internal control and compliance. Accordingly, this communication is not suitable for any other purpose.
Ford, Scott & Associates, L.L.C. FORD, SCOTT & ASSOCIATES, L.L.C. CERTIFIED PUBLIC ACCOUNTANTS
Michael S. Garcia Michael S. Garcia Certified Public Accountant Licensed Public School Accountant No. 2080 November 27, 2017
106

K-2 INDEPENDENT AUDITOR’S REPORT
Honorable President and Members of the Board of Education City of Wildwood School District County of Cape May, New Jersey Report on Compliance for Each Major Federal and State Program
We have audited the Board of Education of the City of Wildwood, County of Cape May, State of New Jersey’s compliance with the types of compliance requirements described in the OMB Compliance Supplement and the New Jersey State Aid/Grant Compliance Supplement that could have a direct and material effect on each of the City of Wildwood School District’s major federal and state programs for the year ended June 30, 2017. The City of Wildwood School District’s major federal and state programs are identified in the summary of auditor’s results section of the accompanying schedule of findings and questioned costs.
Management’s Responsibility
Management is responsible for compliance with the requirements of laws, regulations, contracts, and grants applicable to its federal and state programs.
Auditor’s Responsibility
Our responsibility is to express an opinion on compliance for each of the City of Wildwood School District’s major federal and state programs based on our audit of the types of compliance requirements referred to above. We conducted our audit of compliance in accordance with auditing standards generally accepted in the United States of America; the standards applicable to financial audits contained in Government Auditing Standards, issued by the Comptroller General of the United States; and OMB Uniform Guidance and New Jersey OMB 15-08. Those standards, OMB Uniform Guidance and NJ OMB 15-08 require that we plan and perform the audit to obtain reasonable assurance about whether noncompliance with the types of compliance requirements referred to above that could have a direct and material effect on a major federal or state program occurred. An audit includes examining, on a test basis, evidence about the City of Wildwood School District’s compliance with those requirements and performing such other procedures as we considered necessary in the circumstances.
We believe that our audit provides a reasonable basis for our opinion on compliance for each major federal and state program. However, our audit does not provide a legal determination of the City of Wildwood School District’s compliance.
107

Opinion on Each Major Federal and State Program
In our opinion, the City of Wildwood School District complied, in all material respects, with the types of compliance requirements referred to above that could have a direct and material effect on each of its major federal and state programs for the year ended June 30, 2017.
Report on Internal Control Over Compliance
Management of the City of Wildwood School District is responsible for establishing and maintaining effective internal control over compliance with the types of compliance requirements referred to above. In planning and performing our audit of compliance, we considered the City of Wildwood School District’s internal control over compliance with the types of requirements that could have a direct and material effect on each major federal and state program to determine the auditing procedures that are appropriate in the circumstances for the purpose of expressing an opinion on compliance for each major federal program and to test and report on internal control over compliance in accordance with Uniform Guidance and NJ OMB 15-08, but not for the purpose of expressing an opinion on the effectiveness of internal control over compliance. Accordingly, we do not express an opinion on the effectiveness of the City of Wildwood School District’s internal control over compliance.
A deficiency in internal control over compliance exists when the design or operation of a control over compliance does not allow management or employees, in the normal course of performing their assigned functions, to prevent, or detect and correct, noncompliance with a type of compliance requirement of a federal or state program on a timely basis. A material weakness in internal control over compliance is a deficiency, or combination of deficiencies, in internal control over compliance, such that there is a reasonable possibility that material noncompliance with a type of compliance requirement of a federal program will not be prevented, or detected and corrected, on a timely basis. A significant deficiency in internal control over compliance is a deficiency, or a combination of deficiencies, in internal control over compliance with a type of compliance requirement of a federal or state program that is less severe than a material weakness in internal control over compliance, yet important enough to merit attention by those charged with governance.
Our consideration of internal control over compliance was for the limited purpose described in the first paragraph of this section and was not designed to identify all deficiencies in internal control over compliance that might be material weaknesses or significant deficiencies. We did not identify any deficiencies in internal control over compliance that we consider to be material weaknesses. However, material weaknesses may exist that have not been identified.
The purpose of this report on internal control over compliance is solely to describe the scope of our testing of internal control over compliance and the results of that testing based on the requirements of the Uniform Guidance and NJ OMB 15-08. Accordingly, this report is not suitable for any other purpose.
Ford, Scott & Associates, L.L.C. FORD, SCOTT & ASSOCIATES, L.L.C. CERTIFIED PUBLIC ACCOUNTANTS
Michael S. Garcia Michael S. Garcia Certified Public Accountant Licensed Public School Accountant No. 2080 November 27, 2017
108
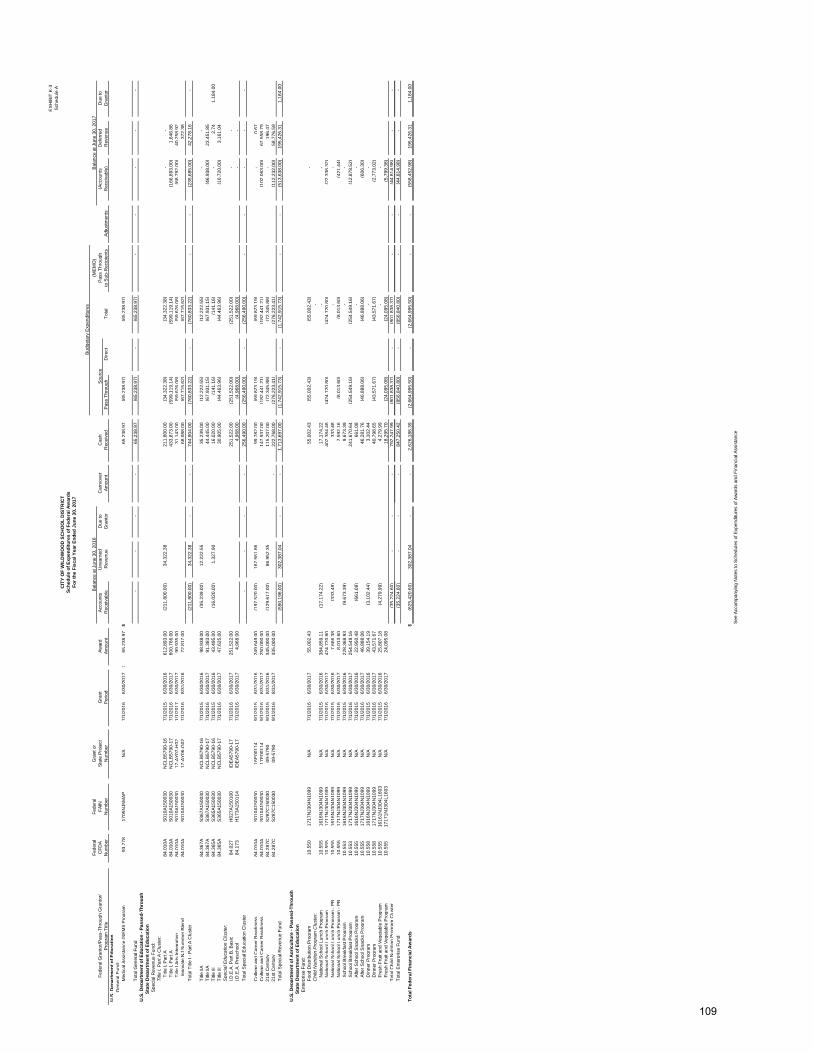
See
Acc
ompa
nyin
g N
otes
to S
ched
ules
of E
xpen
ditu
res
of A
war
ds a
nd F
inan
cial
Ass
ista
nce
EXH
IBIT
K-3
Sch
edul
e A
Fede
ral
Fede
ral
Gra
nt o
r(M
EM
O)
CFD
AFA
INS
tate
Pro
ject
Gra
ntAw
ard
Acco
unts
U
near
ned
Due
toC
arry
over
Cas
hP
ass
Thro
ugh
(Acc
ount
sD
efer
red
Due
toN
umbe
rN
umbe
rN
umbe
rP
erio
dAm
ount
Rec
eiva
ble
Rev
enue
Gra
ntor
Amou
ntR
ecei
ved
Pas
s Th
roug
hD
irect
Tota
lto
Sub
-Rec
ipie
nts
Adju
stm
ents
Rec
eiva
ble)
Rev
enue
Gra
ntor
U.S
. Dep
artm
ent o
f Edu
catio
nG
ener
al F
und:
Med
ical
Ass
ista
nce
(SE
MI)
Pro
gram
93.7
78
1705
NJ5
MAP
N/A
7/1/
2016
6/30
/201
7$
65,2
38.9
7
$65
,238
.97
(65,
238.
97)
(6
5,23
8.97
)
Tota
l Gen
eral
Fun
d-
-
-
-
65,2
38.9
7
(6
5,23
8.97
)
-
(6
5,23
8.97
)
-
-
-
-
-
U.S
. Dep
artm
ent o
f Edu
catio
n - P
asse
d-Th
roug
h
St
ate
Dep
artm
ent o
f Edu
catio
nS
peci
al R
even
ue F
und:
Title
I, P
art A
Clu
ster
:
Title
I, P
art A
84.0
10A
S01
0A15
0030
NC
LB57
90-1
67/
1/20
156/
30/2
016
612,
893.
00
(2
11,8
00.0
0)
34,3
22.3
8
211,
800.
00
(3
4,32
2.38
)
(34,
322.
38)
-
-
Title
I, P
art A
84.0
10A
S01
0A15
0030
NC
LB57
90-1
77/
1/20
166/
30/2
017
600,
766.
00
43
3,87
3.00
(599
,119
.14)
(5
99,1
19.1
4)
(1
66,8
93.0
0)
1,64
6.86
Title
I Ar
ts In
tegr
atio
n84
.010
AS
010A
1500
3017
-AY0
7-H
021/
1/20
176/
30/2
017
99,9
35.0
0
31,1
43.0
0
(5
9,67
6.08
)
(59,
676.
08)
(6
8,79
2.00
)
40
,258
.92
In
nova
te N
J S
umm
er B
lend
84.0
10A
S01
0A15
0030
17-A
Y06-
G02
7/1/
2016
8/31
/201
672
,817
.00
68
,088
.00
(67,
715.
62)
(6
7,71
5.62
)
372.
38
To
tal T
itle
I - P
art A
Clu
ster
(211
,800
.00)
34
,322
.38
-
-
74
4,90
4.00
(760
,833
.22)
-
(760
,833
.22)
-
-
(235
,685
.00)
42
,278
.16
-
Title
IIA
84.3
67A
S36
7A15
0030
NC
LB57
90-1
67/
1/20
156/
30/2
016
98,9
38.0
0
(35,
239.
00)
12,2
22.5
5
35,2
39.0
0
(1
2,22
2.55
)
(12,
222.
55)
-
-
Ti
tle II
A84
.367
AS
367A
1500
30N
CLB
5790
-17
7/1/
2016
6/30
/201
791
,383
.00
44
,445
.00
(67,
931.
15)
(6
7,93
1.15
)
(46,
938.
00)
23,4
51.8
5
Ti
tle II
I84
.365
AS
365A
1500
30N
CLB
5790
-16
7/1/
2015
6/30
/201
643
,495
.00
(1
6,02
0.00
)
1,
327.
90
16,0
20.0
0
(1
41.1
6)
(141
.16)
-
2.74
1,
184.
00
Title
III
84.3
65A
S36
5A15
0030
NC
LB57
90-1
77/
1/20
166/
30/2
017
47,6
25.0
0
30,9
05.0
0
(4
4,46
3.96
)
(44,
463.
96)
(1
6,72
0.00
)
3,
161.
04
Spe
cial
Edu
catio
n C
lust
er:
I.D.E
.A. P
art B
, Bas
ic84
.027
H02
7A15
0100
IDE
A579
0-17
7/1/
2016
6/30
/201
725
1,52
2.00
251,
522.
00
(2
51,5
22.0
0)
(251
,522
.00)
-
-
I.D.E
.A. P
resc
hool
84.1
73H
173A
1501
14ID
EA5
790-
177/
1/20
166/
30/2
017
4,96
8.00
4,96
8.00
(4
,968
.00)
(4,9
68.0
0)
-
-
To
tal S
peci
al E
duca
tion
Clu
ster
-
-
-
-
25
6,49
0.00
(256
,490
.00)
-
(256
,490
.00)
-
-
-
-
-
Col
lege
and
Car
eer R
eadi
ness
84.0
10A
S01
0A15
0030
16E
0011
49/
1/20
158/
31/2
016
249,
649.
00
(1
97,5
20.0
0)
167,
561.
86
99
,782
.00
(69,
823.
19)
(6
9,82
3.19
)
-
0.
67
Col
lege
and
Car
eer R
eadi
ness
84.0
10A
S01
0A15
0030
17E
0011
49/
1/20
168/
31/2
017
250,
000.
00
14
7,93
7.00
(182
,441
.21)
(1
82,4
41.2
1)
(1
02,0
63.0
0)
67,5
58.7
9
2
1st C
entu
ry
84.2
87C
S28
7C15
0030
09-5
790
9/1/
2015
8/31
/201
634
5,00
0.00
(129
,617
.00)
86
,952
.35
11
5,20
7.00
(72,
345.
88)
(7
2,34
5.88
)
-
19
6.47
21s
t Cen
tury
84
.287
CS
287C
1500
3009
-579
09/
1/20
168/
31/2
017
335,
000.
00
-
22
2,76
8.00
(276
,223
.41)
(2
76,2
23.4
1)
(1
12,2
32.0
0)
58,7
76.5
9
To
tal S
peci
al R
even
ue F
und
(590
,196
.00)
30
2,38
7.04
-
-
1,71
3,69
7.00
(1
,742
,915
.73)
-
(1
,742
,915
.73)
-
-
(5
13,6
38.0
0)
195,
426.
31
1,18
4.00
U.S
. Dep
artm
ent o
f Agr
icul
ture
- Pa
ssed
-Thr
ough
Stat
e D
epar
tmen
t of E
duca
tion
Ent
erpr
ise
Fund
:Fo
od D
istri
butio
n P
rogr
am10
.550
1717
NJ3
04N
1099
N/A
7/1/
2016
6/30
/201
755
,002
.43
55
,002
.43
(55,
002.
43)
(5
5,00
2.43
)
-
C
hild
Nut
ritio
n P
rogr
am C
lust
er:
-
N
atio
nal S
choo
l Lun
ch P
rogr
am10
.555
1616
NJ3
04N
1099
N/A
7/1/
2015
6/30
/201
638
4,85
9.11
(17,
174.
22)
17,1
74.2
2
-
-
N
atio
nal S
choo
l Lun
ch P
rogr
am10
.555
1717
NJ3
04N
1099
N/A
7/1/
2016
6/30
/201
742
4,72
0.80
402,
384.
48
(4
24,7
20.8
0)
(424
,720
.80)
(22,
336.
32)
N
atio
nal S
choo
l Lun
ch P
rogr
am -
PB
10.5
5516
16N
J304
N10
99N
/A7/
1/20
156/
30/2
016
7,66
6.38
(333
.48)
333.
48
-
-
N
atio
nal S
choo
l Lun
ch P
rogr
am -
PB
10.5
5517
17N
J304
N10
99N
/A7/
1/20
166/
30/2
017
8,01
3.60
7,59
2.16
(8
,013
.60)
(8,0
13.6
0)
(4
21.4
4)
Sch
ool B
reak
fast
Pro
gram
10.5
5316
16N
J304
N10
99N
/A7/
1/20
156/
30/2
016
228,
368.
93
(9
,673
.39)
9,
673.
39
-
-
Sch
ool B
reak
fast
Pro
gram
10.5
5317
17N
J304
N10
99N
/A7/
1/20
166/
30/2
017
254,
549.
16
24
1,67
0.64
(254
,549
.16)
(2
54,5
49.1
6)
(1
2,87
8.52
)
Afte
r Sch
ool S
nack
s P
rogr
am10
.555
1616
NJ3
04N
1099
N/A
7/1/
2015
6/30
/201
622
,950
.48
(6
61.0
8)
66
1.08
-
-
Afte
r Sch
ool S
nack
s P
rogr
am10
.555
1717
NJ3
04N
1099
N/A
7/1/
2016
6/30
/201
746
,888
.06
46
,281
.76
(46,
888.
06)
(4
6,88
8.06
)
(606
.30)
D
inne
r Pro
gram
10.5
5816
16N
J304
N10
99N
/A7/
1/20
156/
30/2
016
39,1
54.1
9
(3,1
02.4
4)
3,10
2.44
-
-
D
inne
r Pro
gram
10.5
5817
17N
J304
N10
99N
/A7/
1/20
166/
30/2
017
43,5
71.6
7
40,7
98.6
5
(4
3,57
1.67
)
(43,
571.
67)
(2
,773
.02)
Fres
h Fr
uit a
nd V
eget
able
Pro
gram
10.5
5516
161N
J304
L160
3N
/A7/
1/20
156/
30/2
016
25,8
07.1
8
(4,2
79.9
9)
4,27
9.99
-
-
Fr
esh
Frui
t and
Veg
etab
le P
rogr
am10
.555
1717
1NJ3
04L1
603
N/A
7/1/
2016
6/30
/201
724
,095
.08
18
,295
.70
(24,
095.
08)
(2
4,09
5.08
)
(5,7
99.3
8)
Tota
l Chi
ld N
utrit
ion
Pro
gram
Clu
ster
(35,
224.
60)
-
-
-
792,
247.
99
(8
01,8
38.3
7)
-
(8
01,8
38.3
7)
-
-
(4
4,81
4.98
)
-
-
Tota
l Ent
erpr
ise
Fund
(35,
224.
60)
-
-
-
847,
250.
42
(8
56,8
40.8
0)
-
(8
56,8
40.8
0)
-
-
(4
4,81
4.98
)
-
-
Tota
l Fed
eral
Fin
anci
al A
war
ds$
(625
,420
.60)
30
2,38
7.04
-
-
2,62
6,18
6.39
(2
,664
,995
.50)
-
(2
,664
,995
.50)
-
-
(5
58,4
52.9
8)
195,
426.
31
1,18
4.00
Fede
ral G
rant
or/P
ass-
Thro
ugh
Gra
ntor
/S
ourc
eP
rogr
am T
itle
CIT
Y O
F W
ILD
WO
OD
SC
HO
OL
DIS
TRIC
TSc
hedu
le o
f Exp
endi
ture
s of
Fed
eral
Aw
ards
For t
he F
isca
l Yea
r End
ed J
une
30, 2
017
Bud
geta
ry E
xpen
ditu
res
Bal
ance
at J
une
30, 2
016
Bal
ance
at J
une
30, 2
017
109

See
Acco
mpa
nyin
g N
otes
to S
ched
ules
of E
xpen
ditu
res
of A
war
ds a
nd F
inan
cial
Ass
ista
nce
EXH
IBIT
K-4
Sche
dule
B
Ad
just
men
ts/
Car
ryov
erR
epay
men
tC
umul
ativ
eG
rant
or S
tate
Gra
ntAw
ard
Acco
unts
Def
erre
dD
ue to
(Wal
kove
r)C
ash
Budg
etar
yof
Prio
r Yea
rs'
(Acc
ount
sD
efer
red
Due
toBu
dget
ary
Tota
lPr
ojec
t Num
ber
Perio
dAm
ount
Rec
eiva
ble
Rev
enue
Gra
ntor
Amou
ntR
ecei
ved
Expe
nditu
res
Bala
nces
Rec
eiva
ble)
Rev
enue
Gra
ntor
Rec
eiva
ble
Expe
nditu
res
Stat
e D
epar
tmen
t of E
duca
tion
Gen
eral
Fun
d:Sp
ecia
l Edu
catio
n C
ateg
oric
al A
id17
-495
-034
-512
0-08
97/
1/20
166/
30/2
017
$40
2,34
5.00
362,
110.
50
(402
,345
.00)
(4
0,23
4.50
)
402,
345.
00
Tran
spor
tatio
n Ai
d17
-495
-034
-512
0-01
47/
1/20
166/
30/2
017
119,
536.
00
10
7,58
2.40
(1
19,5
36.0
0)
(11,
953.
60)
11
9,53
6.00
Eq
ualiz
atio
n Ai
d17
-495
-034
-512
0-07
87/
1/20
166/
30/2
017
863,
844.
00
77
7,45
9.60
(8
63,8
44.0
0)
(86,
384.
40)
86
3,84
4.00
Ad
just
men
t Aid
17-4
95-0
34-5
120-
085
7/1/
2016
6/30
/201
73,
525,
216.
00
3,17
2,69
4.40
(3,5
25,2
16.0
0)
(3
52,5
21.6
0)
3,52
5,21
6.00
Secu
rity
Aid
17-4
95-0
34-5
120-
084
7/1/
2016
6/30
/201
727
7,02
2.00
249,
319.
80
(277
,022
.00)
(2
7,70
2.20
)
277,
022.
00
Extra
ordi
nary
Aid
16-1
00-0
34-5
120-
473
7/1/
2015
6/30
/201
628
,527
.00
(28,
527.
00)
28,5
27.0
0
-
28
,527
.00
Extra
ordi
nary
Aid
17-1
00-0
34-5
120-
473
7/1/
2016
6/30
/201
739
,619
.00
(39,
619.
00)
(3
9,61
9.00
)
(39,
619.
00)
39
,619
.00
PAR
C R
eadi
ness
Aid
17-4
95-0
34-5
120-
098
7/1/
2016
6/30
/201
77,
750.
00
7,11
0.31
(7,7
50.0
0)
(6
39.6
9)
7,75
0.00
Per P
upil
Gro
wth
Aid
17-4
95-0
34-5
120-
097
7/1/
2016
6/30
/201
77,
750.
00
7,11
0.31
(7,7
50.0
0)
(6
39.6
9)
7,75
0.00
Pro
fess
iona
l Lea
rnin
g C
omm
unity
17-4
95-0
34-5
120-
101
7/1/
2016
6/30
/201
77,
610.
00
6,57
8.38
(7,6
10.0
0)
(1
,031
.62)
7,61
0.00
Non
Pub
lic T
rans
porta
tion
Aid
-
-
-
Rei
mbu
rsed
TPA
F So
cial
Sec
urity
Con
tribu
tions
16-4
95-0
34-5
095-
002
7/1/
2015
6/30
/201
660
8,12
9.07
(29,
415.
98)
29,4
15.9
8
-
-
60
8,12
9.07
R
eim
burs
ed T
PAF
Soci
al
S
ecur
ity C
ontri
butio
ns17
-495
-034
-509
5-00
27/
1/20
166/
30/2
017
617,
705.
88
58
7,45
2.52
(6
17,7
05.8
8)
(30,
253.
36)
(3
0,25
3.36
)
617,
705.
88
Tota
l Gen
eral
Fun
d(5
7,94
2.98
)
-
-
-
5,33
5,36
1.20
(5,8
68,3
97.8
8)
-
(6
9,87
2.36
)
-
-
(590
,979
.66)
6,
505,
053.
95
Spec
ial R
even
ue F
und:
Pres
choo
l Edu
catio
n Ai
d49
5-03
4-51
20-0
867/
1/20
156/
30/2
016
411,
825.
00
(4
1,18
2.50
)
41
,182
.50
-
-
Pres
choo
l Edu
catio
n Ai
d49
5-03
4-51
20-0
867/
1/20
166/
30/2
017
419,
900.
00
-
37
7,91
0.00
(4
13,5
15.7
1)
(41,
990.
00)
6,
384.
29
(4
1,99
0.00
)
413,
515.
71
Tota
l Spe
cial
Rev
enue
Fun
d(4
1,18
2.50
)
-
-
-
419,
092.
50
(413
,515
.71)
-
(4
1,99
0.00
)
6,38
4.29
-
(41,
990.
00)
41
3,51
5.71
Cap
ital P
roje
cts
Fund
RO
D R
oof R
epla
cem
ent
5790
-050
-14-
1001
G4
508,
000.
00
(1
29,6
68.9
6)
(129
,668
.96)
(1
29,6
68.9
6)
(508
,000
.00)
Tota
l Cap
ital P
roje
cts
Fund
(129
,668
.96)
-
-
-
-
-
-
(129
,668
.96)
-
-
(1
29,6
68.9
6)
(508
,000
.00)
Stat
e D
epar
tmen
t of A
gric
ultu
reEn
terp
rise
Fund
:N
atio
nal S
choo
l Lun
ch P
rogr
am
(S
tate
Sha
re)
100-
010-
3360
-067
7/1/
2015
6/30
/201
66,
977.
61
(305
.69)
30
5.69
-
-
N
atio
nal S
choo
l Lun
ch P
rogr
am
(Sta
te S
hare
)10
0-01
0-33
60-0
677/
1/20
166/
30/2
017
7,34
5.80
6,
959.
52
(7
,345
.80)
0.04
(3
86.3
2)
(386
.32)
7,
345.
80
Tota
l Ent
erpr
ise
Fund
(305
.69)
-
-
-
7,26
5.21
(7,3
45.8
0)
0.
04
(386
.32)
-
-
(3
86.3
2)
7,34
5.80
Tota
l Sta
te F
inan
cial
Ass
ista
nce
$(2
29,1
00.1
3)
-
-
-
5,
761,
718.
91
(6
,289
,259
.39)
0.04
(2
41,9
17.6
4)
6,38
4.29
-
(763
,024
.94)
6,
417,
915.
46
Stat
e G
rant
or/P
rogr
am T
itle
open
CIT
Y O
F W
ILD
WO
OD
SC
HO
OL
DIS
TRIC
TSc
hedu
le o
f Exp
endi
ture
s of
Sta
te F
inan
cial
Ass
ista
nce
For t
he F
isca
l Yea
r End
ed J
une
30, 2
017
Bala
nce
at J
une
30, 2
017
Bala
nce
at J
une
30, 2
016
MEM
O
110
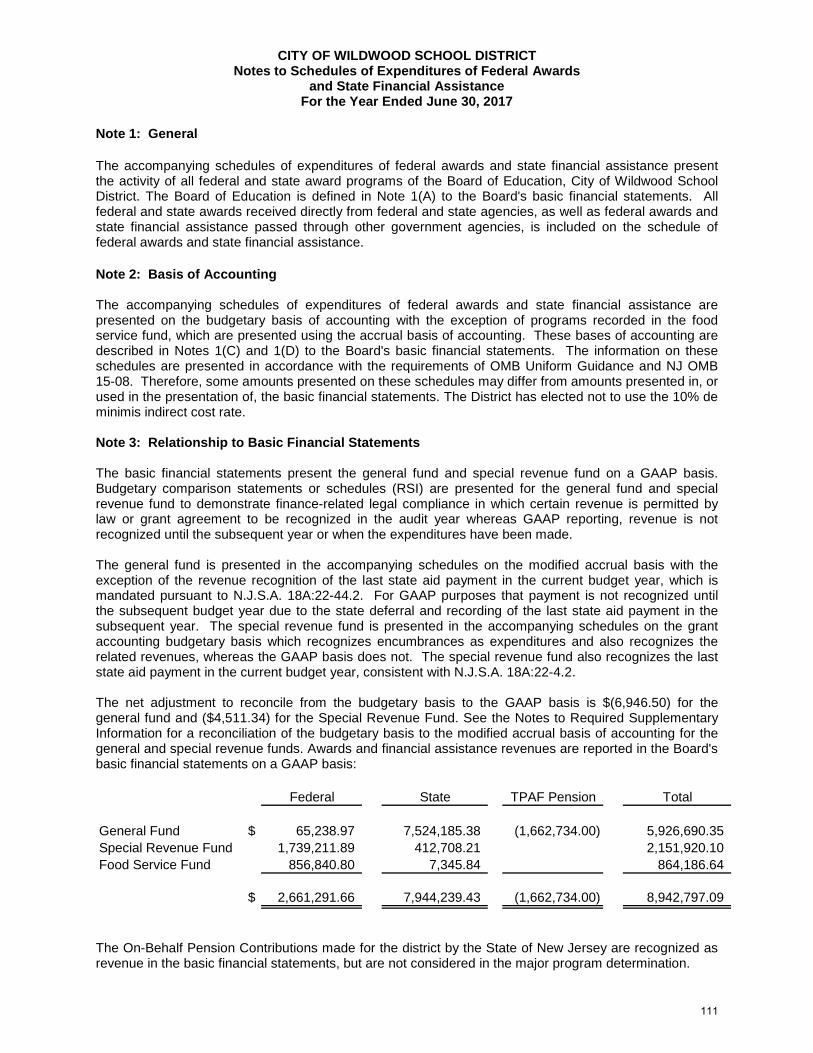
CITY OF WILDWOOD SCHOOL DISTRICT Notes to Schedules of Expenditures of Federal Awards
and State Financial Assistance For the Year Ended June 30, 2017
Note 1: General The accompanying schedules of expenditures of federal awards and state financial assistance present the activity of all federal and state award programs of the Board of Education, City of Wildwood School District. The Board of Education is defined in Note 1(A) to the Board's basic financial statements. All federal and state awards received directly from federal and state agencies, as well as federal awards and state financial assistance passed through other government agencies, is included on the schedule of federal awards and state financial assistance. Note 2: Basis of Accounting The accompanying schedules of expenditures of federal awards and state financial assistance are presented on the budgetary basis of accounting with the exception of programs recorded in the food service fund, which are presented using the accrual basis of accounting. These bases of accounting are described in Notes 1(C) and 1(D) to the Board's basic financial statements. The information on these schedules are presented in accordance with the requirements of OMB Uniform Guidance and NJ OMB 15-08. Therefore, some amounts presented on these schedules may differ from amounts presented in, or used in the presentation of, the basic financial statements. The District has elected not to use the 10% de minimis indirect cost rate. Note 3: Relationship to Basic Financial Statements The basic financial statements present the general fund and special revenue fund on a GAAP basis. Budgetary comparison statements or schedules (RSI) are presented for the general fund and special revenue fund to demonstrate finance-related legal compliance in which certain revenue is permitted by law or grant agreement to be recognized in the audit year whereas GAAP reporting, revenue is not recognized until the subsequent year or when the expenditures have been made. The general fund is presented in the accompanying schedules on the modified accrual basis with the exception of the revenue recognition of the last state aid payment in the current budget year, which is mandated pursuant to N.J.S.A. 18A:22-44.2. For GAAP purposes that payment is not recognized until the subsequent budget year due to the state deferral and recording of the last state aid payment in the subsequent year. The special revenue fund is presented in the accompanying schedules on the grant accounting budgetary basis which recognizes encumbrances as expenditures and also recognizes the related revenues, whereas the GAAP basis does not. The special revenue fund also recognizes the last state aid payment in the current budget year, consistent with N.J.S.A. 18A:22-4.2. The net adjustment to reconcile from the budgetary basis to the GAAP basis is $(6,946.50) for the general fund and ($4,511.34) for the Special Revenue Fund. See the Notes to Required Supplementary Information for a reconciliation of the budgetary basis to the modified accrual basis of accounting for the general and special revenue funds. Awards and financial assistance revenues are reported in the Board's basic financial statements on a GAAP basis:
Federal State TPAF Pension Total
General Fund $ 65,238.97 7,524,185.38 (1,662,734.00) 5,926,690.35 Special Revenue Fund 1,739,211.89 412,708.21 2,151,920.10 Food Service Fund 856,840.80 7,345.84 864,186.64
$ 2,661,291.66 7,944,239.43 (1,662,734.00) 8,942,797.09
The On-Behalf Pension Contributions made for the district by the State of New Jersey are recognized as revenue in the basic financial statements, but are not considered in the major program determination.
111

CITY OF WILDWOOD SCHOOL DISTRICT Notes to Schedules of Expenditures of Federal Awards
and State Financial Assistance For the Year Ended June 30, 2017
(Continued)
Note 4: Relationship to Federal and State Financial Reports Amounts reported in the accompanying schedules agree with the amounts reported in the related federal and state financial reports. Note 5: Other Revenues and expenditures reported under the Food Distribution Program represent current year value received and current year distributions respectively. The amount reported as TPAF Pension Contributions represents the amount paid by the state on behalf of the district for the year ended June 30, 2017. TPAF Social Security Contributions represents the amount reimbursed by the state for the employer’s share of social security contributions for TPAF members for the year ended June 30, 2017.
112

EXHIBIT K-6 CITY OF WILDWOOD BOARD OF EDUCATION
SCHEDULE OF FINDINGS AND QUESTIONED COSTS FOR THE YEAR ENDING JUNE 30, 2017
Section I - Summary of Auditor's Results
Financial Statements
Type of auditor's report issued: Unmodified Opinion
Internal control over financial reporting:
1) Material weakness(es) identified? Yes X No
2) Significant Deficiencies identified? Yes X None reported
Non-compliance material to basic financial statements noted? Yes X No
Federal Awards Internal Control over major programs:
1) Material weakness(es) identified: Yes X No
2) Significant Deficiencies identified ? Yes X None reported
Type of auditor's report issued on compliance for major programs: Unmodified Opinion
Any audit findings disclosed that are required to be reported in accordance with Uniform Guidance?
Yes X No
Identification of major programs:
CFDA Number(s) Name of Federal Program or Cluster
Title I, Part A Cluster: 84.010 Title I, Part A
10.553 10.555
Child Nutrition Cluster: School Breakfast Program National School Lunch Program
Dollar threshold used to distinguish between type A and type B programs: $750,000
Auditee qualified as low-risk auditee? X Yes No
113
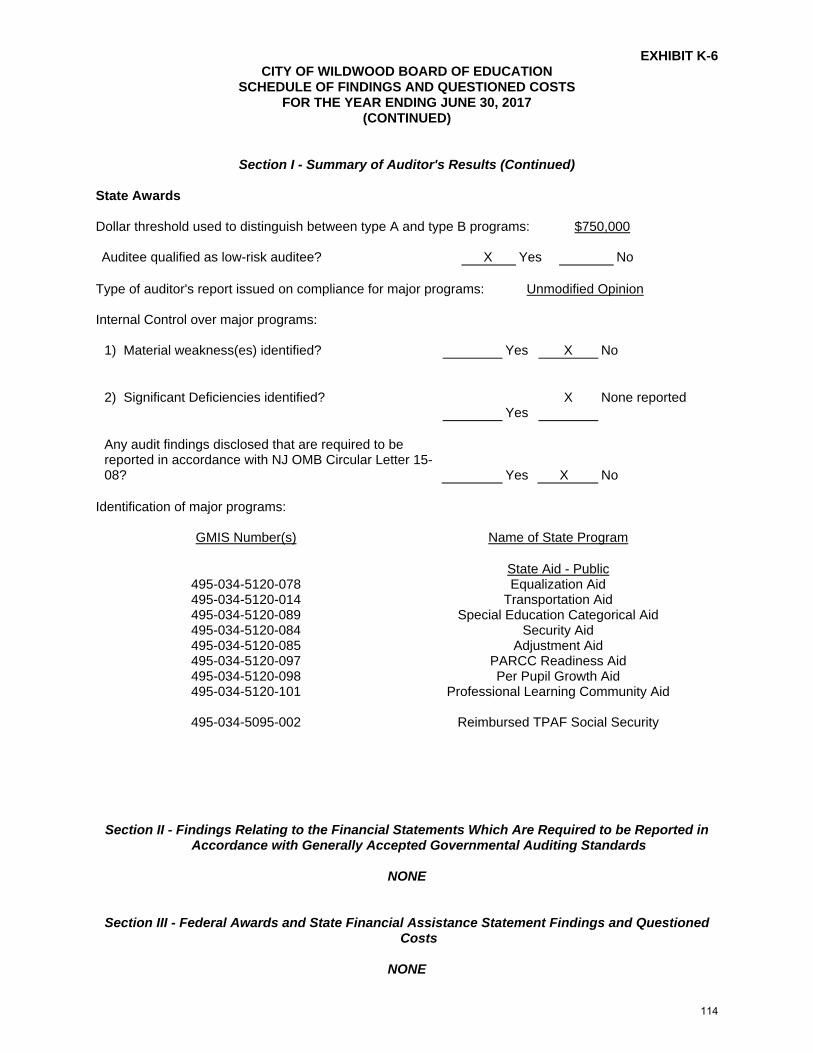
EXHIBIT K-6 CITY OF WILDWOOD BOARD OF EDUCATION
SCHEDULE OF FINDINGS AND QUESTIONED COSTS FOR THE YEAR ENDING JUNE 30, 2017
(CONTINUED)
Section I - Summary of Auditor's Results (Continued) State Awards Dollar threshold used to distinguish between type A and type B programs: $750,000 Auditee qualified as low-risk auditee? X Yes No
Type of auditor's report issued on compliance for major programs: Unmodified Opinion Internal Control over major programs:
1) Material weakness(es) identified? Yes X No 2) Significant Deficiencies identified?
Yes
X
None reported
Any audit findings disclosed that are required to be reported in accordance with NJ OMB Circular Letter 15-08?
Yes
X
No
Identification of major programs:
GMIS Number(s) Name of State Program
495-034-5120-078 495-034-5120-014
State Aid - Public Equalization Aid
Transportation Aid 495-034-5120-089 Special Education Categorical Aid 495-034-5120-084 Security Aid 495-034-5120-085 495-034-5120-097 495-034-5120-098 495-034-5120-101
495-034-5095-002
Adjustment Aid PARCC Readiness Aid Per Pupil Growth Aid
Professional Learning Community Aid
Reimbursed TPAF Social Security
Section II - Findings Relating to the Financial Statements Which Are Required to be Reported in
Accordance with Generally Accepted Governmental Auditing Standards
NONE
Section III - Federal Awards and State Financial Assistance Statement Findings and Questioned Costs
NONE
114

EXHIBIT K-7 CITY OF WILDWOOD BOARD OF EDUCATION
SUMMARY SCHEDULE OF PRIOR AUDIT FINDINGS AND QUESTIONED COSTS
STATUS OF PRIOR-YEAR FINDINGS:
None noted.
115