Embed Size (px)
Citation preview


Comprehensive Annual Financial Report
For the Fiscal Year Ended June 30, 2014
ARLINGTON INDEPENDENT SCHOOL DISTRICT
1203 W. Pioneer Pkwy, Arlington, TX 76013
Prepared By The Finance Department:
Cindy Powell, CPA Chief Financial Officer


ARLINGTON INDEPENDENT SCHOOL DISTRICT TABLE OF CONTENTS
Page
Exhibit/ Table
Introductory Section
Board of Trustees and Administration i Certificate of the Board viii Transmittal Letter ix GFOA Certificate of Achievement xvi ASBO Certificate of Excellence xvii Organizational Chart xviii
Financial Section
Report of Independent Auditors
1
Management’s Discussion and Analysis
7
Basic Financial Statements: Government-Wide Financial Statements
Statement of Net Position 27 A-1 Statement of Activities 28 B-1
Governmental Fund Financial Statements Balance Sheet 30 C-1 Reconciliation of Balance Sheet for Governmental Funds to the
Statement of Net Position
33
C-2 Statement of Revenues, Expenditures, and Changes in Fund Balance 34 C-3 Reconciliation of the Statement of Revenues, Expenditures, and
Changes in Fund Balance of Governmental Funds to the Statement of Activities
36
C-4 Statement of Revenues, Expenditures, and Changes in Fund Balances -
Original Budget, Amended Final (GAAP Basis) and Actual - General Fund
37
C-5 Proprietary Fund Financial Statements
Statement of Net Position 38 D-1 Statement of Revenues, Expenses and Changes in Fund Net Position 39 D-2 Statement of Cash Flows 40 D-3
Fiduciary Fund Financial Statements Statement of Fiduciary Assets and Liabilities 41 E-1
Notes to the Financial Statements
42 F-1
Other Supplementary Information: Combining Fund Statements:
Combining Balance Sheet - Nonmajor Governmental Funds 70 H-1 Combining Statement of Revenues, Expenditures, and Changes in
Fund Balance - Nonmajor Governmental Funds
78
H-2

ARLINGTON INDEPENDENT SCHOOL DISTRICT TABLE OF CONTENTS (continued)
Page
Exhibit/ Table
Financial Section (continued)
Other Supplementary Information (continued): Combining Fund Statements (cont.):
Combining Statement of Net Position - Internal Service Funds 86 H-3 Combining Statement of Revenues, Expenses, and Changes in Net
Position - Internal Service Funds
87
H-4 Combining Statement of Cash Flows - Internal Service Funds 88 H-5 Statement of Changes in Assets and Liabilities - Agency Funds 91 H-6
Required TEA Schedules
Schedule of Delinquent Taxes Receivable 94 J-1 Schedule of Revenues, Expenditures, and Changes in Net Position -
Original Budget, Amended Final and Actual - Child Nutrition
96
J-4 Schedule of Revenues, Expenditures, and Changes in Fund Balance -
Original Budget, Amended Final and Actual - Debt Service Fund
97
J-5 Schedule of Revenues, Expenditures, and Changes in Fund Balance -
Original Budget, Amended Final and Actual - Capital Projects Fund
98
J-6 Statistical Section (Unaudited)
Net Position by Component 100 1 Expenses, Program Revenues, and Net Expenses 102 2 General Revenues and Total Change in Net Position 104 3 Fund Balances, Governmental Funds 106 4 Governmental Funds Expenditures and Debt Service Ratio 108 5 Governmental Funds Revenues 110 6 Other Financing Sources and Uses and Net Change in Fund Balances 112 7 Appraised Value and Actual Value of Taxable Property 114 8 Direct and Overlapping Property Tax Rates 115 9 Direct and Overlapping Property Tax Levies 116 10 Principal Property Taxpayers 117 11 Property Tax Levies and Collections 118 12 Outstanding Debt by Type 119 13 Ratio of Net Bonded Debt to Assessed Value and Net Bonded Debt Per Capita
120 14
Statement of Direct and Overlapping Debt 121 15 Legal Debt Margin Information 122 16 Demographic and Economic Statistics 123 17 Principal Employers 124 18 Full-Time Equivalent District Campus Employees 126 19 Operating Statistics 129 20 Capital Asset Information 130 21

ARLINGTON INDEPENDENT SCHOOL DISTRICT TABLE OF CONTENTS (continued)
Page
Exhibit/ Table
Federal Awards Section
Independent Auditors’ Report on Internal Control over Financial Reporting and on Compliance and Other Matters Based on an Audit of Financial Statements Performed in Accordance with Government Auditing Standards
135
Independent Auditors’ Report on Compliance for Each Major Program and on Internal Control over Compliance Required by OMB Circular A-133
137
Schedule of Findings and Questioned Costs 139
Schedule of Expenditures of Federal Awards 141 K-1
Notes to Schedule of Expenditures of Federal Awards 144 K-2


INTRODUCTORY SECTION

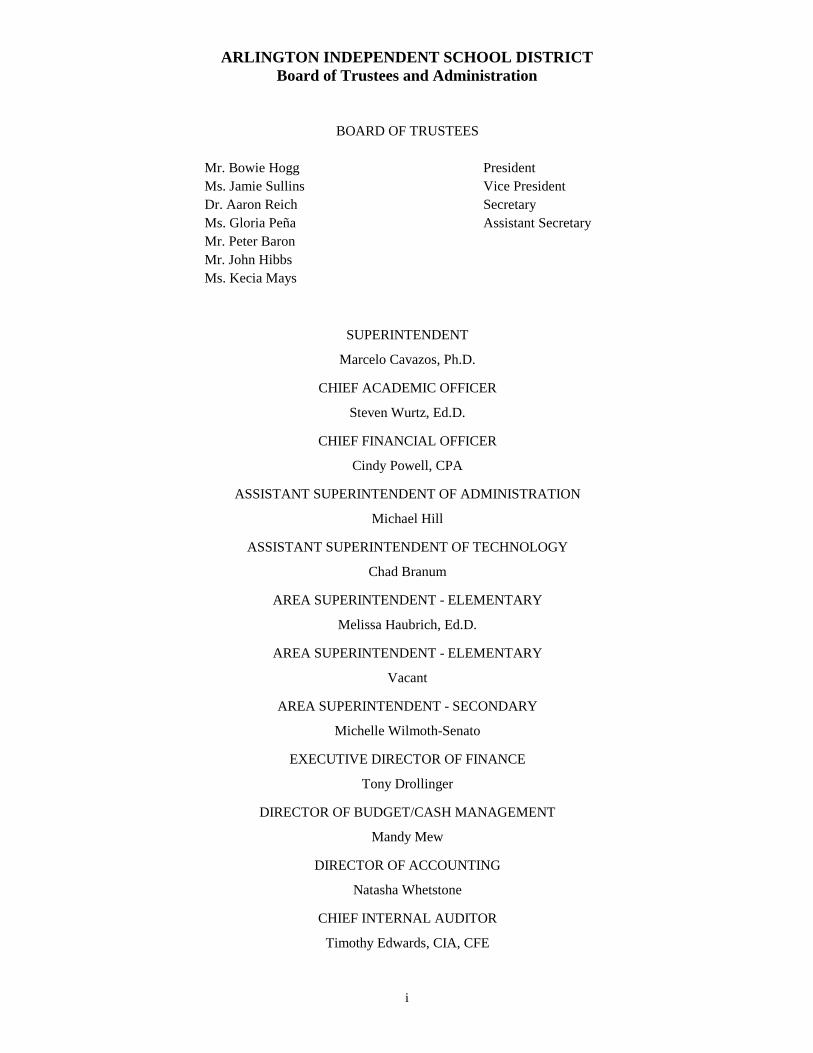
ARLINGTON INDEPENDENT SCHOOL DISTRICT Board of Trustees and Administration
i
Mr. Bowie Hogg PresidentMs. Jamie Sullins Vice PresidentDr. Aaron Reich SecretaryMs. Gloria Peña Assistant SecretaryMr. Peter BaronMr. John HibbsMs. Kecia Mays
Cindy Powell, CPA
ASSISTANT SUPERINTENDENT OF TECHNOLOGY
Chad Branum
Vacant
AREA SUPERINTENDENT - SECONDARY
AREA SUPERINTENDENT - ELEMENTARY
AREA SUPERINTENDENT - ELEMENTARY
ASSISTANT SUPERINTENDENT OF ADMINISTRATION
Michael Hill
BOARD OF TRUSTEES
SUPERINTENDENT
Marcelo Cavazos, Ph.D.
CHIEF FINANCIAL OFFICER
CHIEF ACADEMIC OFFICER
Steven Wurtz, Ed.D.
Michelle Wilmoth-Senato
EXECUTIVE DIRECTOR OF FINANCE
Melissa Haubrich, Ed.D.
Timothy Edwards, CIA, CFE
Tony Drollinger
DIRECTOR OF BUDGET/CASH MANAGEMENT
Mandy Mew
DIRECTOR OF ACCOUNTING
Natasha Whetstone
CHIEF INTERNAL AUDITOR

ARLINGTON INDEPENDENT SCHOOL DISTRICT Board of Trustees and Administration (continued)
ii
BOARD OF TRUSTEES Bowie Hogg – President
Bowie Hogg was elected to the board in May of 2008 and is a product of the Arlington schools from kindergarten through high school graduation. Mr. Hogg graduated from The Mays Business School at Texas A&M University with a Bachelors of Business Administration degree. Mr. Hogg also represented Arlington and the Dallas-Fort Worth metroplex by being chosen out of 216,000 applicants to appear on the original edition of the Emmy nominated television show, The Apprentice. Mr. Hogg is a healthcare executive with Aon Corp., while also serving his community as a Board member for the United Way of Tarrant County, Leadership Arlington and the Advisory Board for the Arlington Life Shelter and Junior League Arlington. Mr. Hogg’s passions are education, healthcare and community service, with his wife who is also a 5th grade teacher.
Jamie Sullins – Vice President
Mrs. Sullins was elected in May 2010. She has a Bachelors of Business Administration in Finance from Texas Tech University. She worked at Lockheed Martin Missiles and Advanced Programs Division in financial planning and analysis evaluating the feasibility and cost effectiveness of capital improvement projects. She also worked for Interturbine Group of Companies, as the corporate Manager of Financial Planning and Analysis for international operations. Mrs. Sullins is a life-long community volunteer. She has served as a full-time volunteer in Arlington schools for 16 years serving on four PTA Executive boards. She is founder and past president of the North Arlington Education Alliance, a non-profit organization working in close parallel with the District to connect people and to mobilize ideas that promote educational excellence. Mrs. Sullins and her husband, Gerald, have lived in Arlington for over 26 years. They have two children; one graduated from AISD in 2007 and the other in 2011.
Aaron Reich – Secretary
Dr. Reich was re-elected to the Board in May of 2012. He has lived in Arlington for 22 years and is married with two children currently enrolled in the AISD. He and his wife of 21 years have two businesses in Arlington; a CPA practice (his wife, Debra J. Freiheit, CPA, MS) and TRINU Healthcare (a professional development, education and consulting firm for healthcare). Dr. Reich has been an invited lecturer on a local, state and national level. He received his Doctor of Pharmacy degree from Creighton University, Omaha, Nebraska and came to Texas via his post graduate residency at UT MD Anderson Cancer Center in Houston. Dr. Reich has served on many non-profit Boards of Directors and committees, mostly related to his professional practice and healthcare education. Specific to education and the local community, he is a very active parent, President and co-founder of Positive Influence, which is a non-profit organization dedicated to parental and father figure involvement programs for primary and secondary education. He also serves on the Board of Directors for Theatre Arlington. Along with being a proud member of the First United Methodist Church, Ft. Worth, Aaron enjoys his family, community advocacy, the outdoors, and traveling.
ARLINGTON INDEPENDENT SCHOOL DISTRICT Board of Trustees and Administration (continued)
iii
BOARD OF TRUSTEES (continued)
Gloria Peña - Assistant Secretary
Mrs. Peña was elected to the Board in May 2005, and has served as Secretary, Assistant Secretary, Vice-President and President. She also serves on the State Board of Directors of the Texas Association of School Boards and the Mexican American School Board Association. She graduated Magna Cum Laude from Northwood University with a Bachelor’s degree in Business Administration in management. Prior to her election she was involved in and continues to be involved in various AISD committees. She serves on multiple boards in the community and is an active member of St. Vincent de Paul Church as well as other community involvement. She and her husband of 31 years, Richard, have one daughter who graduated from Martin High School and Tarrant County College. Mrs. Peña enjoys spending time with her family, working with children of all ages, sewing, ceramics, learning and traveling. She recently retired from the US Army Corps of Engineers after 37 years of service.
Peter Baron
Mr. Baron was re-elected in May 2012. He is a Lieutenant Colonel, retired, in the United States Marine Corps. He served 23 years on active duty, retiring in 1991 as a Naval Aviator, with 5000 flight hours in helicopters and jets, and over 200 carrier arrested landings. A decorated Vietnam veteran, he moved to NAS Beeville, Texas, in 1988 to become the first Marine to command a US Navy Strike Training squadron. Mr. Baron has a BS from Auburn University and a master’s degree in Aeronautics from Embry Riddle University. A Master Technology Teacher, he taught mathematics and computer classes at Arlington High School for thirteen years. After being elected to the board in 2008, he resigned his teaching position in Arlington and subsequently taught high school mathematics in a neighboring school district until retiring this year after 20 years in the classroom. Peter Baron is a Life Member of the USMC Combat Helicopter Association, the Military Officers Association of America, and the Glock Sport Shooting Federation. He rides with the Lone Star Cyclists bicycle club and is a member of the Knights of Columbus at St. Maria Goretti Church. He has represented AISD on numerous occasions as a presenter at TASA/TASB conventions, Texas Computer Educators Association conventions and at ESC Region XI workshops. Additionally, he has served on the AISD Financial Futures Committee, the Textbook Selection Committee, the Mathematics Benchmark Test Committee, and numerous Board committees. He and his wife, Carole, have resided in Arlington since 1991. They have three grown children and five grandchildren.
John Hibbs
Mr. Hibbs was elected to the Board in May 2010. He is the Western Regional Lab Manager for Bausch & Lomb, a leader in the eye care industry. He has been employed with Bausch & Lomb for 23 years. He also is a licensed Contact Lens Examiner. Mr. Hibbs is a 1985 graduate of Texas Christian University where he received a BA degree. John Hibbs and his wife, Mary, have been married for 29 years. They have one son and two daughters, all of whom have attended the Arlington Independent School District. Prior to being elected to the School Board, John received both the PTSA Life Membership and PTSA Extended Life Membership awards for his volunteerism within the AISD. He currently serves as a director for the Arlington Children’s Toy Charities, and serves in a leadership role in the Children’s Ministry at Lake Arlington Baptist Church. His passion is his family and the community he serves.

ARLINGTON INDEPENDENT SCHOOL DISTRICT Board of Trustees and Administration (continued)
iv
BOARD OF TRUSTEES (continued) Kecia Mays
Mrs. Mays is an auditor for the State Comptroller’s Office. She serves as a Field Service Rep for the Texas PTA Board of Directors and Serves on the Executive Board for the Black Former Students Network of Texas A&M University along with volunteering in multiple capacities in her children’s schools.
ADMINISTRATION
Dr. Marcelo Cavazos –Superintendent
Dr. Marcelo Cavazos started his teaching career as an English teacher in the Mission Consolidated ISD in 1990. In 1992, he moved to McAllen ISD where he taught English and government. He was named the secondary language arts supervisor for Mercedes ISD in 1993 and became associate adviser for San Benito Consolidated ISD in 1995. Cavazos went to work for the Texas Education Agency Department of School Finance and Support in 1998. He joined the AISD in 1999 as associate superintendent for instruction and served as interim deputy superintendent for seven months before being named deputy superintendent in February 2009. He has previously served as a lecturer for the University of Texas at Arlington’s Department of Educational Leadership and Policy Studies. Cavazos served as interim superintendent for six months before being named superintendent Dec. 6, 2012. He holds a bachelor’s and a master’s degree from the University of Texas – Pan American and a doctorate from the University of Texas at Austin. In addition to his professional accomplishments, Cavazos is active in the community. He serves on the Texas School Alliance Board, United Way of Tarrant County Board Executive Committee, , the Workforce Solutions for Tarrant County Board, the River Legacy Foundation Board, the Salvation Army Youth Education Town North Texas Advisory Council and the Arlington ISD Education Foundation Board. He’s an ex-officio member of the Arlington Chamber of Commerce Board. Cavazos is an associate member of the Rotary Club of Arlington, an associate member of the Greater Arlington Lions Club, a Lifetime Supporting member of the Texas Lions Camp, a member of the Knights of Columbus and active at St. Matthew Catholic Church. He received the 2009 Arlington MLK Celebration Sharing the Dream Award for Asian- American Chamber of Commerce and the 2013-2014 Elks Distinguished Citizenship Award from the Arlington Elks Lodge No. 2114. He has been married to Nora for 14 years; his children Theresa and Diego attend school at Key Elementary.
ARLINGTON INDEPENDENT SCHOOL DISTRICT Board of Trustees and Administration (continued)
v
ADMINISTRATION (continued)
Steven Wurtz – Chief Academic Officer
Wurtz has served as an area superintendent of elementary schools for Arlington ISD since June 2013. Prior to that, he was the division director of elementary schools in the Irving ISD since 2011, following his position as principal at Schulze Elementary. Prior to that, he was principal at Austin Elementary in the Grand Prairie ISD from 2007 to 2009 and assistant principal at Keyes Elementary in the Irving ISD from 2003 to 2007. He was a bilingual elementary teacher in the Irving ISD before that. He has a bachelor’s degree from Brigham Young University, a master’s degree from the University of Texas at Arlington, and a doctorate from Dallas Baptist University. Wurtz was formerly a member of the state board of directors for the Texas Elementary Principals and Supervisors Association and he is currently the second vice president elect for the TEPSA District 11 board. Wurtz serves on the TEPSA state advocacy committee, and he has been a member of TEPSA for 11 years. Wurtz is also a member of the Texas Association of School Administrators.
Cindy Powell – Chief Financial Officer
Cindy Powell has been AISD's Chief Financial Officer (previously titled Associate Superintendent of Finance) since October 2008. Mrs. Powell was originally hired in September 1993 as the District’s first Internal Auditor. She served in that capacity for three years. Mrs. Powell then was named Director of Accounting in 1996 and held that position for three years before being named Executive Director of Finance in 1999. She has 28 years total experience in public accounting, private sector auditing, and governmental accounting. She graduated from Texas Tech University with a BBA in Accounting and is a Certified Public Accountant.
Michael Hill – Assistant Superintendent of Administration
Michael Hill was named Assistant Superintendent of Administration in February of 2013. He started his teaching career in 1996 as an Economics/Government teacher in the Union Parish School System in Louisiana. In 1997 he moved to Fort Worth ISD where he taught and coached at Paschal High School. In 2002 he moved to Arlington ISD and taught and coached at Bowie High School. Later he moved into administration at Bowie High School as an assistant principal, serving in that capacity for 3 years. Mr. Hill then became the Academic Associate Principal at Timberview High School in the Mansfield ISD. He served in that capacity for a little less than two years before returning to Arlington ISD as the principal at Juan Seguin High School. He served in that capacity from January 2011 until February 2013. Mr. Hill holds a master’s degree in Educational Leadership and Policy Studies and a superintendent certification from the University of Texas at Arlington and a bachelor’s degree from Grambling State University in Louisiana.

ARLINGTON INDEPENDENT SCHOOL DISTRICT Board of Trustees and Administration (continued)
vi
ADMINISTRATION (continued)
Chad Branum – Assistant Superintendent of Technology
Chad Branum was named Assistant Superintendent of Technology for Arlington ISD in May 2013. He started his career in the business sector and transitioned to education in 1999 with Coppell ISD. He served in several roles for Coppell ISD with the most recent being the Executive Director of Technology for 12 years. He is involved with Educational Technology organizations from around the country and is an active officer for the Texas K-12 CTO Council organization. He holds a bachelor’s degree from Texas A&M University and a master’s degree from Western Michigan University. Additionally, Chad obtained the Certified Education Technology Leader (CETL) certification in the summer of 2014 from the Consortium for School Networking (CoSN). The CETL certification is based upon the Framework of Essential Skills of K-12 CTO and demonstrates the knowledge and skills necessary to be an effective and visionary technology leader.
Vacant – Area Superintendent - Elementary
Melissa Haubrich – Area Superintendent - Elementary
Haubrich has served as an Area Superintendent since January 2013. Prior to that, she was the director of elementary personnel for Arlington ISD, principal at Ferguson Junior High and Pearcy Elementary in Arlington and Southwest Elementary in the Belton ISD. Haubrich was also an elementary school teacher in the Belton ISD and the Killeen ISD. She has a bachelor’s degree from the University of Texas at San Antonio, a master’s degree from the University of Mary Hardin-Baylor, and a doctorate from Tarleton State University. Haubrich has published articles in several psychology journals and presented at the National Council of Professors of Educational Administration. She is a member of the Texas Elementary Principals and Supervisors Association, the National Association of Bilingual Education, and the Association for Supervision and Curriculum and Development.
Michelle Wilmoth-Senato – Area Superintendent - Secondary
Michelle Wilmoth-Senato was appointed Area Superintendent of Secondary Schools in January 2013. She began her teaching career in Arlington ISD in 1980. For 19 years, she taught a variety of courses, including English, Humanities, Debate, and Psychology at both Arlington High School and Bowie High School. In 2000, she became assistant principal at Bowie High School. In 2006 she was appointed principal of Boles Junior High. In 2008, she returned to Bowie High School as principal, a position she held until her appointment as area superintendent. From 1997-1999, while teaching for AISD, she also served as adjunct instructor at the University of Texas at Arlington in the College of Education, teaching classes at both the undergraduate and graduate levels. She holds a bachelor's in Education and a master's in Humanities from the University of Dallas. She holds a master's in Educational Administration and Policy Studies from the University of Texas at Arlington. Ms Wilmoth-Senato is a member of TASA and TASSP.

ARLINGTON INDEPENDENT SCHOOL DISTRICT Board of Trustees and Administration (continued)
vii
ADMINISTRATION (continued) Tony Drollinger – Executive Director of Finance
Tony Drollinger originally came to the District in October 1996 as the District’s Internal Auditor. After serving in that capacity for three years, he was named Director of Accounting in 1999, and then was named Executive Director of Finance in November of 2008. Prior to coming to the District, Mr. Drollinger worked four years as a financial consultant and software trainer for Texas Educational Consultative Services (TECS) in Austin. Before that time Mr. Drollinger spent five years working for the Texas Education Agency in the areas of School Audits and PEIMS. He is a graduate of Southwest Texas State University with a BBA in Accounting, and is a member of the Texas Association of School Business Officials and the Government Finance Officers Association.
Natasha Whetstone – Director of Accounting
Natasha Whetstone was named Director of Accounting in February 2013. Prior to joining the District she worked at Cleburne ISD for three years as the senior accountant and served six months as the Director of Federal Grants. Before that time Natasha spent three years working as an auditor for a local CPA firm. She is a graduate of the University of Texas at Arlington with a BS in Accounting and is a member of the Government Finance Officers Association.
Mandy Mew – Director of Budget and Cash Management
Mandy Mew has worked with Public School Finance since 1988. She was the Chief of School Finance for the North Carolina Department of Public Instruction until moving to Texas in 2000. After moving to Texas she worked for the Fort Worth ISD and the Hurst-Euless-Bedford ISD. In July, 2010 she moved to Arlington ISD as the Director of Budget and Cash Management. Ms. Mew graduated from Wake Forest University. She is also a graduate of the Education Policy Fellowship Program, sponsored by the Institute for Educational Leadership.
Tim Edwards – Chief Internal Auditor
Tim Edwards was appointed as the Chief Internal Auditor for AISD in December 2010. Previously, he served as the Chief Internal Auditor for a university system, was the Senior Manager of Corporate Audit for a Fortune 500 corporation, and led the start-up of an Internal Audit function for the largest real estate association management company in the country. Mr. Edwards has a BBA degree in Corporate Finance and is a Certified Internal Auditor and Certified Fraud Examiner.


ix
1203 W. Pioneer Pkwy Arlington, Texas 76013 682-867-7250
November 20, 2014 To the Board of Trustees and Citizens of the Arlington Independent School District: The Texas Education Code requires that all independent school districts file a complete set of financial statements within 150 days of the close of each fiscal year with the Texas Education Agency (“TEA”). The financial statements must be presented in conformity with generally accepted accounting principles (“GAAP”), and must be audited by a firm of licensed certified public accountants in accordance with generally accepted auditing standards. Pursuant to that requirement we hereby issue the comprehensive annual financial report of the Arlington Independent School District (“District” or “AISD”) for the fiscal year ended June 30, 2014. This report consists of management’s representations concerning the finances of the District. Consequently, management assumes full responsibility for the completeness and reliability of all of the information presented in this report. To the best of our knowledge and belief, we assert that this financial report is complete and reliable in all material respects. The District’s financial statements have been audited by Whitley Penn, LLP, a firm of licensed certified public accountants. The goal of the independent audit is to provide reasonable assurance that the financial statements of the District for the fiscal year ended June 30, 2014, are free of material misstatement. The independent audit involves examining, on a test basis, evidence supporting the amounts and disclosures in the financial statements; assessing the accounting principles used and significant estimates made by management; and evaluating the overall financial statement presentation. The independent auditors concluded, based upon the audit, that there was a reasonable basis for rendering an unqualified opinion that the District’s financial statements for the fiscal year ended June 30, 2014, are fairly presented in conformity with GAAP. The independent auditors’ report is presented as the first component of the financial section of this report. GAAP also requires that management provide a narrative introduction, overview and analysis to accompany the basic financial statements in the form of Management’s Discussion and Analysis (“MD&A”). This letter of transmittal is designed to complement MD&A and should be read in conjunction with it. The District’s MD&A can be found immediately following the report of the independent auditors. The independent audit of the financial statements is part of a broader, federally-mandated “Single Audit” designed to meet the special needs of federal grantor agencies. The standards governing Single Audit engagements require the independent auditor to report not only on the fair presentation of the financial statements, but also on the audited government’s internal controls and compliance with legal requirements, with special emphasis on internal controls and legal requirements involving the administration of federal awards. These reports may be found in the Federal Awards section of this report.
x
District Profile The Arlington Independent School District was established as a political subdivision of the State of Texas and incorporated in 1902. It lies halfway between Dallas and Fort Worth and serves students in four cities - the City of Arlington, the Tarrant County portion of the City of Grand Prairie, the Town of Pantego, and the City of Dalworthington Gardens. It is fully accredited by the TEA and is regulated by the Texas Education Code as established by the Texas State Legislature. The District is not a component unit of any other entity, nor does it have any component units within its overall structure. The Arlington Independent School District is the 11th largest school district in Texas. The District currently operates six traditional high schools, one early college high school, 12 junior high schools, 51 elementary schools, a pre-kindergarten campus and four alternative campuses (one is housed at one of the junior high school buildings). During the 2013-14 school year the District employed 8,055 full-time equivalent staff members of which 4,113 were classroom teachers. Enrollment for the 2013-14 year was 64,688 as reported to the State through the Public Education Information Management System (“PEIMS”). This enrollment figure represents a decrease of approximately 0.48% from the enrollment figure reported through PEIMS the previous year. Enrollment for 2014-15 is expected to be 64,757 at the fall PEIMS snapshot date which is 2% less than the 2013-14 official enrollment. All academic and extracurricular programs are supported by a highly qualified, culturally-diverse teaching staff. The average pupil-teacher ratio was 16 to 1 throughout the District. Texas law mandates that no more than 22 students be assigned to one classroom teacher in kindergarten through grade four. The mission of the Arlington Independent School District is to empower and engage all students to be contributing, responsible citizens reaching their maximum potential through relevant, innovative and rigorous learning experiences. To this end, the District provides regular, special education, career/technology, gifted/talented, and bilingual/ESL curricula in order to meet the needs of the diverse student population. Additionally, a broad range of electives, extra-curricular, and concentrated advanced academic programs are also offered to enhance learning opportunities beyond core curriculum. AISD currently offers the International Baccalaureate World School Program at four of its high schools. The District also offers an Advanced Placement program that gives students the opportunity to graduate with 30 or more college credits and also offers dual-credit choices so that students at each high school can take advantage of earning on-site AISD and Tarrant County College credits. Governance The District is under the control and management of a board of seven trustees, each of whom is elected by the District’s registered voters to serve a three year term. All of the trustees are elected at-large and serve without compensation. The elections are staggered so that not all positions are voted on during the same year. In general, the Board adopts policies, sets direction for curriculum, employs the Superintendent and oversees the operations of the District and its schools. Besides general Board business, Trustees are charged with numerous statutory regulations including appointing the tax assessor/collector, calling trustee and other school elections and canvassing the results, organizing the Board and electing its officers. The Board is also charged with setting the tax rate, acting on real property matters, setting salary schedules, acting as a board of appeals in personnel and student matters, confirming recommendations for textbook adoptions, and adopting and amending the annual budget.
Local Economy Arlington’s diverse economy and unique location within the D/FW Metroplex drive the city’s growth. Arlington hosts employers from a variety of industries, including defense contractors, an automobile manufacturer, high tech companies, higher education institutions, major finance companies, medical facilities and entertainment companies. The area’s major transportation systems afford area businesses easy access to cities throughout the world. Arlington is only fifteen minutes from D/FW International Airport, one of the

xi
busiest airports in the world. Interstate Highways 20 and 30 are the major east/west arteries through the city. Access to Interstate Highway 35, traversing the United States from Mexico to Canada, is also convenient. Rail transportation is available for both public transportation and freight. Arlington is known as the “Entertainment Capital of Texas.” Each year approximately 6.8 million people visit Arlington. The four main entertainment attractions are: Six Flags Over Texas amusement park; Globe Life Park, home of the Texas Rangers baseball team; Six Flags Hurricane Harbor water park; and AT&T Stadium, home of the Dallas Cowboys. AT&T Stadium has only been in operation for five years, but has already hosted numerous NFL and college games, major concerts, the 2010 NBA All Star game, the Cotton Bowl, Super Bowl XLV, and the 2014 NCAA Final Four. The 2015 NCAA football championship game will be played at AT&T Stadium in January 2015.
Relevant Financial Policies Factors affecting financial control Management of the District has established a comprehensive internal control framework that is designed both to protect the District’s assets from loss, misuse or theft, and to compile sufficient reliable information for the preparation of the District’s financial statements in conformity with GAAP. Because the cost of internal controls should not outweigh their benefits, the District’s comprehensive framework of internal controls has been designed to provide reasonable assurance rather than absolute assurance that the financial statements will be free from material misstatement. Budgetary Control The annual budget serves as the foundation for the District’s financial planning and control. Texas State law requires the Board president to call a Board meeting for the purpose of discussing and adopting the budget and the tax rate. A notice of this meeting must be published at least 10 days but not more than 30 days before the public meeting. The budget must be adopted prior to June 30. The District maintains budgetary controls throughout all of its financial systems. The objective of budgetary controls is to ensure compliance with legal provisions embodied in the official budget adopted by the Board. The Board adopts an official budget for the General Fund, Natural Gas Special Revenue Fund, Debt Service Fund, Capital Projects Fund and Food Service Fund (which is accounted for as an Enterprise Fund). In accordance with procedures prescribed by the State Board of Education, budget amendments that affect the total amount in a fund or functional spending category must be approved by the Board prior to expenditure of funds. The functional level is specified by Board policy as the legal level of budgetary control. Budgetary control is maintained at the organizational level by the encumbrance of estimated purchase amounts prior to the release of purchase orders to vendors. Outstanding encumbrances at the end of the fiscal year are an assignment of fund balance and are treated as expenditures in the subsequent year upon receipt of goods and services.
Major Initiatives Achieve Today. Excel Tomorrow. Strategic Plan Achieve Today. Excel Tomorrow. is a three-year strategic plan adopted by the Board in August 2012. The plan encompasses eleven goals grouped into a framework for success that includes Inspired Learners, Effective Leadership, and an Engaged Community. Strategies to achieve our goals include the following:
• Implement a Managed Performance Empowerment model of school administration to give specific autonomies to high-performing principals;
• Select an instructional model that promotes engagement, critical thinking and student achievement; • Implement workforce development and higher education partnerships to enhance student
opportunities to excel after graduation;

xii
• Create and implement a facilities vision to provide world-class facilities that support the educational process;
• Implement a competitive compensation plan and develop a measurement tool for teacher effectiveness that positively impacts student learning;
• Develop internal teacher, student and administrator leadership training and opportunities; and • Implement a plan to increase engagement with faith-based organizations, businesses, non-profits,
governmental entitites, higher education institutions, and volunteers. Achieve Today. Excel Tomorrow. is a detailed roadmap for students, staff and community that defines where we want to be and how we will get there. The plan does this while maintaining the district’s commitment to utilize our resources in the most efficient way possible. To Achieve Texas Education Agency 2014 Satisfactory or Advanced Performance Status AISD was rated “Met Standard” for 2014 by the Texas Education Agency, and 34 schools received distinction designations. To help our students and schools perform at high levels, resources have been committed to develop and implement a system of academic interventions, to reduce course and subject failure rates, to develop subject area vertical alignment, to more fully engage families and the community in the education process, to prevent campus violence, to reduce the annual dropout rate and improve the student completion rate, and to maintain compliance with State and Federal programs. 2014 Bond Program On May 10, 2014, AISD voters approved a $663.1 million bond proposition with an approval rate of almost 70 percent. This five-year program will transform the District and our community. Proceeds of the bond issue will be used to build new facilities, upgrade and renovate existing facilities, address safety and security district-wide, upgrade technology infrastructure and equipment, expand access to technology, provide fine arts equipment and address transportation needs. A 38-member Capital Needs Steering Committee recommended the bond package based on a comprehensive facilities assessment, enrollment forecasts and program priorities identified through community questionnaires and surveys. Construction projects will begin during the 2014-2015 school year and are scheduled to be completed in 2019. Twelve architecture firms have been selected to design the 21 construction and renovation projects in phases 1 and 2 of the bond program, and stakeholder committees are currently developing educational specifications for three of those projects. Educational specifications illustrate the goals and outcomes, activities to be conducted, persons to be served, spatial relationships of program areas, equipment needs, technology needs, and any special considerations for an instructional facility. Teachers, parents, students, administrators and industry specialists make up the stakeholder committees. New construction projects currently in design include two dual language/fine arts academies, a districtwide Career and Technical Center, multi-purpose activity centers for our six high schools, a classroom addition at one junior high school and two new elementary schools. Other purchases made this fall as part of the 2014 bond program include 36 buses, 39 white fleet vehicles and 43 copiers. Planning is underway for network infrastructure upgrades and fine arts purchases scheduled for phase 1 of the program. Instructional Model AISD is implementing an instructional model that promotes engagement, creativity, critical thinking and student achievement as part of our Achieve Today. Excel Tomorrow. strategic plan. An instructional model is designed to maximize student success by providing a common framework for research-based instructional planning, instructional delivery and assessment. A 41-member Instructional Model Committee consisting of teachers, campus administrators, parents, curriculum and instructional staff, and community members underwent the instructional model selection process and recommended the Seven Strategies of Assessment for Learning model based on the research of Dr. Rick Stiggins with the goal to engage students in thinking about themselves as learners. The model is based on three questions from the students’ point of view:
xiii
• Where am I going?
o Strategy 1: Provide students with a clear and understandable vision of the learning target. o Strategy 2: Use examples and models of strong and weak work.
• Where am I now? o Strategy 3: Offer regular descriptive feedback. o Strategy 4: Teach students to self-assess and set goals.
• How can I close the gap? o Strategy 5: Design lessons to focus on one learning target or aspect of quality at a time. o Strategy 6: Teach students focused revision. o Strategy 7: Engage students in self-reflection, and let them keep track and stare their learning.
Initial implementation of the instructional model began in January 2014 with school pilot groups. Phase I of system-wide implementation began in the fall of 2014. 2009 Bond Program Work is wrapping up on a $197.5 million bond package approved in November 2009. Bond proceeds were used to fund new construction, two new science labs at each high school, fine arts equipment and uniforms, technology and new propane-fueled buses. Construction projects will help relieve overcrowding at a number of locations by providing one new elementary school, classroom additions at two elementaries and Lamar High School, and expansion of the Arlington High School cafeteria and kitchen. The remaining $17.6 million of bonds authorized in the 2009 bond package were sold during the 2013-14 fiscal year. All work is scheduled to be completed during the 2014-2015 school year, and the overall bond program is expected to have a budget surplus. A citizens bond oversight committee meets quarterly to review bond program activities and reports its findings and recommendations to the Board semi-annually. Other Major Initiatives Other major initiatives include the development of programming to support transformational learning opportunities for students and implementation of recommendations for a curriculum audit completed in 2013. Also, in alignment with the district’s strategic plan, initial implementation of Positive Behavioral Interventions and Supports (PBIS) has begun with the goal to improve student academic and behavior outcomes. PBIS emphasizes systems development guided by six important principles:
• Develop a continuum of scientifically based behavior and academic interventions and supports • Use data to make decisions and solve problems • Arrange the environment to prevent the development and occurrence of problem behavior • Teach and encourage pro-social skills and behaviors • Implement evidence-based behavioral practices with fidelity and accountability • Screen universally and monitor student performance and progress continuously
PBIS focuses on the establishment of the behavioral supports and social culture for students to achieve academic success through learning environments that are engaging and responsive.
Long-term Financial Planning The Board recognizes the significance of adopting balanced budgets, sustaining a healthy fund balance, and long-range financial planning. To these ends, the Board has adopted a policy that sets forth parameters for annual budget development and targets the unassigned General Fund fund balance at two-months of operating expenditures. The parameters include prioritizing resources into programs that promote student achievement growth, maintaining competitive compensation to attract and retain a highly qualified workforce, board approval of staffing ratios, balancing the budget with limited use of surplus fund balance for one-time expenditures, and
xiv
prioritizing any necessary reductions in areas that have the least impact on instruction. Multi-year budget forecasts are presented to the Board each summer and are considered by the Board when evaluating the impact of potential new initiatives. Strategies included in the Achieve Today. Excel Tomorrow. Strategic Plan focus resources and long-range planning on District priorities in a manner that will help protect the District’s financial well-being. On August 28, 2014, State District Court Judge John Dietz ruled the Texas school finance system unconstitutional. The ruling was issued in a case brought by five plaintiff groups and one intervener. Arlington ISD is a member of the Texas Taxpayer and Student Fairness Coalition (“Coalition”), a coalition of more than 400 school districts that is one of the plaintiff groups suing the State. Judge Dietz ruled that the system is inadequate, arbitrary, inequitable and has created a de facto statewide ad valorem tax in violation of the state constitution. He further ruled that the system is unsuitable for the provision of the constitutionally-required general diffusion of knowledge. Judge Dietz issued an initial verbal ruling that the school finance system was unconstitutional in February 2013. He reopened the case in January 2014 to consider whether changes made to the funding system by the 83rd Texas Legislature in spring 2013 were sufficient to alter his initial ruling. The 83rd Texas Legislature restored $3.4 billion of the $5.4 billion it cut from public education during the 2011 legislative session. While most districts benefited from the additional appropriation, Judge Dietz ruled that the legislature made no changes to the formula structure to correct equity and adequacy claims set forth in the Coalition’s lawsuit. The State will appeal the case directly to the Texas Supreme Court, and a final ruling expected by early 2016. A special session could be called in spring/summer of 2016, if necessary, to address the Supreme Court’s ruling. While no overhaul of the state school finance formulas is expected prior to the Texas Supreme Court ruling in the school finance lawsuit, it is reasonably expected that the 84th Texas Legislature will increase the appropriation of funds for public education when it convenes in spring 2015. State revenue is trending higher than budgeted in the 2014-15 state budget biennium, and indications are that sufficient revenues will be available to increase appropriations to public education for the 2016-17 biennium.
Awards and Acknowledgements Innovative programs, teachers and volunteers are all key to the success of AISD students. TEA currently rates each district and campus as “Met Standard” or “Improvement Required.” AISD has a district rating of “Met Standard,” and 70 AISD campuses are rated Met Standard. Four campuses are rated “Improvement Required.” This year the District is continuing its efforts to improve and is working toward a goal of having the District and all schools achieving the Met Standard rating for 2015 Accountability. The Government Finance Officers Association (“GFOA”) awarded a Certificate of Achievement for Excellence in Financial Reporting to the Arlington Independent School District for its comprehensive annual financial report for the year ended June 30, 2013. This was the 35th consecutive year that the Arlington Independent School District has received this prestigious award. In order to be awarded a Certificate of Achievement, the District published a comprehensive annual financial report that was easy to read and was efficiently organized. This report satisfied both generally accepted accounting principles and applicable legal requirements. A Certificate of Achievement is valid for a period of one year only. We believe that our current comprehensive annual financial report continues to meet the Certificate of Achievement Program's requirements, and we are submitting it to the GFOA to determine its eligibility for another certificate. Additionally, the Association of School Business Officials International (“ASBO”) awarded a Certificate of Excellence in Financial Reporting by School Systems to the Arlington Independent School District for the 25th consecutive year. The Certificate of Excellence in Financial Reporting for School Systems Program is a voluntary program sponsored by ASBO to foster excellence in the preparation and issuance of school system financial reports. A Certificate of Excellence is awarded to those school systems that have voluntarily submitted
xv
their comprehensive annual financial report (“CAFR”) for review by an ASBO Panel of Review. Upon completion of a vigorous technical review, the panel of review members concluded that the Arlington Independent School District’s financial report met the criteria for excellence in financial reporting. We believe that our current CAFR continues to meet the requirements of the Certificate of Excellence in Financial Reporting by School Systems program, and we are submitting it to ASBO to determine its eligibility for another certificate. The preparation of this report on a timely basis could not be accomplished without the efficient and dedicated services of the entire staff of the finance department. We would like to express our appreciation to all members of the department who assisted and contributed to the preparation of this report. We would also like to thank the members of the Board of Trustees for their interest and support in planning and conducting the financial operations of the District in a responsible and progressive manner.
xvi

xvii

xviii

FINANCIAL SECTION

Houston Offi ce 3411 Richmond AvenueSuite 500Houston, Texas 77046713.621.1515 Main
whitleypenn.com
An IndependentMember of
Dallas Fort Worth Houston
1
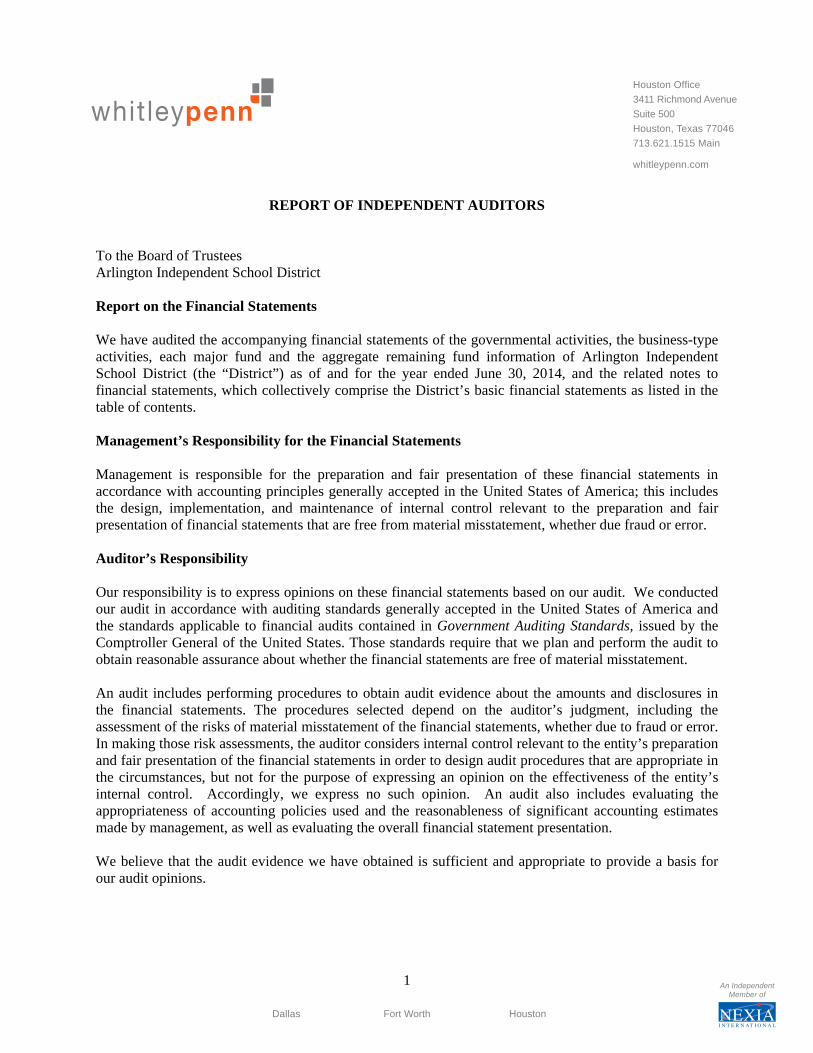
REPORT OF INDEPENDENT AUDITORS To the Board of Trustees Arlington Independent School District Report on the Financial Statements We have audited the accompanying financial statements of the governmental activities, the business-type activities, each major fund and the aggregate remaining fund information of Arlington Independent School District (the “District”) as of and for the year ended June 30, 2014, and the related notes to financial statements, which collectively comprise the District’s basic financial statements as listed in the table of contents. Management’s Responsibility for the Financial Statements Management is responsible for the preparation and fair presentation of these financial statements in accordance with accounting principles generally accepted in the United States of America; this includes the design, implementation, and maintenance of internal control relevant to the preparation and fair presentation of financial statements that are free from material misstatement, whether due fraud or error. Auditor’s Responsibility Our responsibility is to express opinions on these financial statements based on our audit. We conducted our audit in accordance with auditing standards generally accepted in the United States of America and the standards applicable to financial audits contained in Government Auditing Standards, issued by the Comptroller General of the United States. Those standards require that we plan and perform the audit to obtain reasonable assurance about whether the financial statements are free of material misstatement. An audit includes performing procedures to obtain audit evidence about the amounts and disclosures in the financial statements. The procedures selected depend on the auditor’s judgment, including the assessment of the risks of material misstatement of the financial statements, whether due to fraud or error. In making those risk assessments, the auditor considers internal control relevant to the entity’s preparation and fair presentation of the financial statements in order to design audit procedures that are appropriate in the circumstances, but not for the purpose of expressing an opinion on the effectiveness of the entity’s internal control. Accordingly, we express no such opinion. An audit also includes evaluating the appropriateness of accounting policies used and the reasonableness of significant accounting estimates made by management, as well as evaluating the overall financial statement presentation. We believe that the audit evidence we have obtained is sufficient and appropriate to provide a basis for our audit opinions.

To the Board of Trustees Arlington Independent School District
2
Opinions In our opinion, the financial statements referred to above present fairly, in all material respects, the respective financial position of the governmental activities, the business-type activities, each major fund, and the aggregate remaining fund information of the District as of June 30, 2014, and the respective changes in financial position, the respective budgetary comparison schedule for the general fund and, where applicable, cash flows thereof for the year then ended in conformity with accounting principles generally accepted in the United States of America. Other Matters Required Supplementary Information Accounting principles generally accepted in the United States of America require that the management’s discussion and analysis on pages 7 through 23 be presented to supplement the basic financial statements. Such information, although not a part of the basic financial statements, is required by the Governmental Accounting Standards Board, who considers it to be an essential part of the financial reporting for placing the basic financial statements in an appropriate operational, economic, or historical context. We have applied certain limited procedures to the required supplementary information in accordance with auditing standards generally accepted in the United States of America, which consisted of inquiries of management about the methods of preparing the information and comparing the information for consistency with management’s responses to our inquiries, the basic financial statements, and other knowledge we obtained during our audit of the basic financial statements. We do not express an opinion or provide any assurance on the information because the limited procedures do not provide us with sufficient evidence to express an opinion or provide any assurance. Other Information Our audit was conducted for the purpose of forming opinions on the financial statements that collectively comprise the District’s basic financial statements. The combining and individual nonmajor fund financial statements, TEA required schedules and other supplementary information, as listed in the table of contents, and schedule of expenditures of federal awards, as required by Office of Management and Budget Circular A-133, Audits of States, Local Governments, and Non-Profit Organizations and the other information, such as the introductory and statistical section are presented for the purposes of additional analysis and are not a required part of the basic financial statements. The combining and individual nonmajor fund financial statements, TEA required schedules and other supplementary information, as listed in the table of contents, and the schedule of federal awards is the responsibility of management and was derived from and relates directly to the underlying accounting and other records used to prepare the basic financial statements. Such information has been subjected to the auditing procedures applied in the audit of the basic financial statements and certain additional procedures, including comparing and reconciling such information directly to the underlying accounting and other records used to prepare the basic financial statements or to the basic financial statements themselves, and other additional procedures in accordance with auditing standards generally accepted in the United States of America. In our opinion, the combining and individual nonmajor fund financial statements, TEA required schedules and other supplementary information, as listed in the table of contents, and the schedule of federal awards is fairly stated, in all material respects, in relation to the basic financial statements as a whole.

To the Board of Trustees Arlington Independent School District
3
The introductory and statistical sections have not been subjected to the auditing procedures applied in the audit of the basic financial statements, and accordingly, we do not express an opinion or provide any assurance on it. Other Reporting Required by Government Auditing Standards In accordance with Government Auditing Standards, we have also issued our report dated November 20, 2014, on our consideration of the District’s internal control over financial reporting and on our tests of its compliance with certain provisions of laws, regulations, contracts, and grant agreements and other matters. The purpose of that report is to describe the scope of our testing of internal control over financial reporting and compliance and the results of that testing, and not to provide an opinion on internal control over financial reporting or on compliance. That report is an integral part of an audit performed in accordance with Government Auditing Standards in considering the District’s internal control over financial reporting and compliance.
Houston, Texas November 20, 2014

4

5
MANAGEMENT’S DISCUSSION AND ANALYSIS
6

ARLINGTON INDEPENDENT SCHOOL DISTRICT MANAGEMENT’S DISCUSSION AND ANALYSIS
7
In this section of the Comprehensive Annual Financial Report, we, the managers of Arlington Independent School District (“District”), discuss and analyze the District’s financial performance for the fiscal year ended June 30, 2014. We encourage readers to consider the information presented here in conjunction with additional information furnished in our letter of transmittal on pages ix - xv, the independent auditors’ report on pages 1 through 3, and the District’s basic financial statements which begin on page 27. FINANCIAL HIGHLIGHTS The assets and deferred outflows of the District exceeded its liabilities at the close of the fiscal
year by $320,239,195 (net position). Of this amount $219,267,502 (unrestricted net position), or 68%, may be used to meet the District’s ongoing obligations.
The District’s total net position increased by $39,922,434. The factors that substantially contributed to increases in revenue included the net effect of changes in property tax collections due to higher property values, increased state revenue due to state funding cuts being restored by the 83rd Texas Legislature, and the recognition of prior year state aid in the current year because funds were received beyond the allowable 60-day year-end accrual period, netted against lower student enrollment. The factors that substantially contributed to net increases in expenditures included increases in payroll costs for pay increases and new positions, contracted services for a state backed energy conservation retrofit project, library books and summer book backpacks funded through grants, and capital purchases.
As of the close of the fiscal year, the District’s governmental funds reported combined ending fund balances of $271,453,649, which is $12,564,364 more than the previous year. 56% of the combined fund balance, $153,113,358, is available for spending at the District’s discretion (unassigned balance).
USING THIS ANNUAL REPORT The annual report consists of a series of financial statements, notes to those statements, and other supplementary information. The basic financial statements include two types of statements that present different views of the District:
1) Government-wide financial statements provide information about the activities of the District as a whole and present both a long-term and short-term view of the District’s finances. The government-wide financial statements include the Statement of Net Position and the Statement of Activities (on pages 27 through 29).
2) Fund financial statements (starting on page 30) report the District’s operations in more detail
than the government-wide statements by providing information about the District’s most significant funds. For general governmental activities, these statements tell how services were financed in the short term as well as what resources remain for future spending. For proprietary activities, fund financial statements tell how goods or services of the District were sold to external customers and how funds were accumulated and costs were allocated internally among various functions. The remaining fund financial statement, the fiduciary statement, provides financial information about activities for which the District acts solely as a trustee or agent for the benefit of parties outside of the District. The fiduciary statement can be found on page 41.
ARLINGTON INDEPENDENT SCHOOL DISTRICT MANAGEMENT’S DISCUSSION AND ANALYSIS (continued)
8
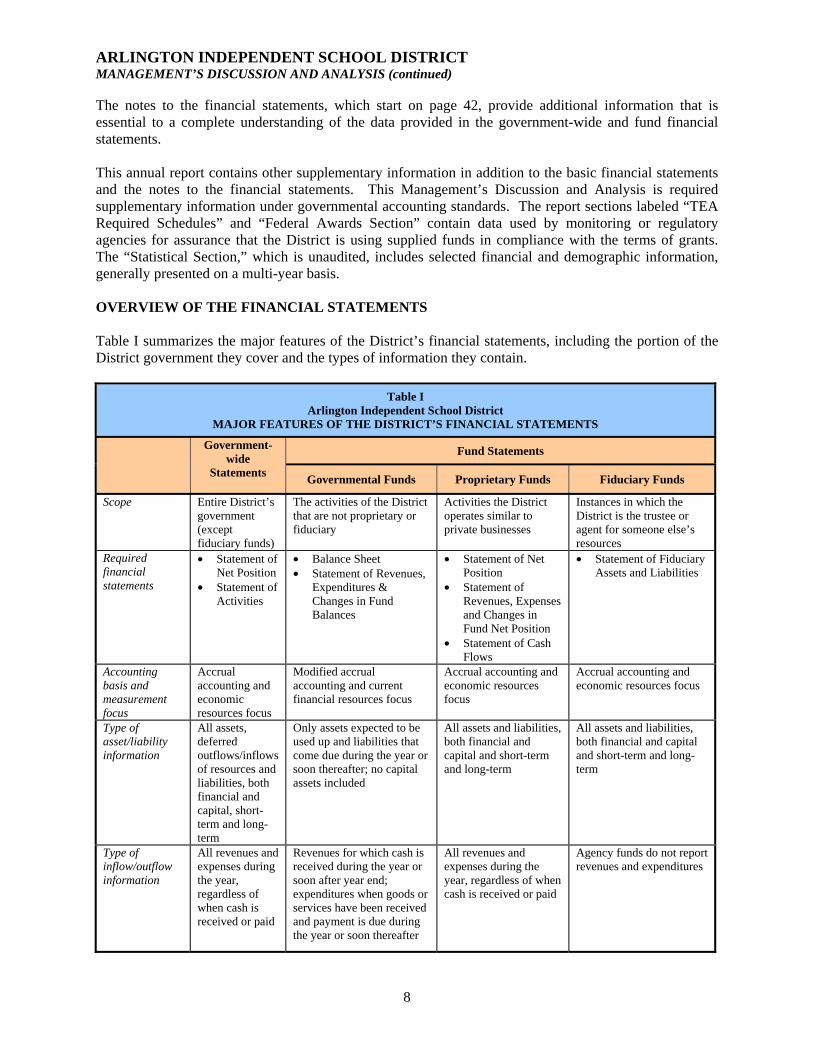
The notes to the financial statements, which start on page 42, provide additional information that is essential to a complete understanding of the data provided in the government-wide and fund financial statements. This annual report contains other supplementary information in addition to the basic financial statements and the notes to the financial statements. This Management’s Discussion and Analysis is required supplementary information under governmental accounting standards. The report sections labeled “TEA Required Schedules” and “Federal Awards Section” contain data used by monitoring or regulatory agencies for assurance that the District is using supplied funds in compliance with the terms of grants. The “Statistical Section,” which is unaudited, includes selected financial and demographic information, generally presented on a multi-year basis. OVERVIEW OF THE FINANCIAL STATEMENTS Table I summarizes the major features of the District’s financial statements, including the portion of the District government they cover and the types of information they contain.
Table I Arlington Independent School District
MAJOR FEATURES OF THE DISTRICT’S FINANCIAL STATEMENTS
Government-wide
Statements
Fund Statements
Governmental Funds Proprietary Funds Fiduciary Funds
Scope Entire District’s government (except fiduciary funds)
The activities of the District that are not proprietary or fiduciary
Activities the District operates similar to private businesses
Instances in which the District is the trustee or agent for someone else’s resources
Required financial statements
• Statement of Net Position
• Statement of Activities
• Balance Sheet • Statement of Revenues,
Expenditures & Changes in Fund Balances
• Statement of Net Position
• Statement of Revenues, Expenses and Changes in Fund Net Position
• Statement of Cash Flows
• Statement of Fiduciary Assets and Liabilities
Accounting basis and measurement focus
Accrual accounting and economic resources focus
Modified accrual accounting and current financial resources focus
Accrual accounting and economic resources focus
Accrual accounting and economic resources focus
Type of asset/liability information
All assets, deferred outflows/inflows of resources and liabilities, both financial and capital, short-term and long-term
Only assets expected to be used up and liabilities that come due during the year or soon thereafter; no capital assets included
All assets and liabilities, both financial and capital and short-term and long-term
All assets and liabilities, both financial and capital and short-term and long-term
Type of inflow/outflow information
All revenues and expenses during the year, regardless of when cash is received or paid
Revenues for which cash is received during the year or soon after year end; expenditures when goods or services have been received and payment is due during the year or soon thereafter
All revenues and expenses during the year, regardless of when cash is received or paid
Agency funds do not report revenues and expenditures
ARLINGTON INDEPENDENT SCHOOL DISTRICT MANAGEMENT’S DISCUSSION AND ANALYSIS (continued)
9
Government-wide Financial Statements The government-wide financial statements – consisting of the Statement of Net Position and the Statement of Activities – report information about the District as a whole. These statements are designed to provide readers with a broad overview of the District’s finances. The government-wide statements apply the accrual basis of accounting, which is similar to the accounting basis used by most private-sector companies. The Statement of Net Position includes all of the District’s assets, liabilities, and deferred inflows/outflows of resources, with the difference reported as net position. The Statement of Activities presents information showing how the District’s net position changed during the most recent fiscal year. All changes in net position are reported as soon as the underlying event giving rise to the change occurs, regardless of the timing of related cash flows. The two government-wide financial statements report the District’s net position and changes in them. Net position (the difference between assets, deferred inflows/outflows and liabilities) provide one measure of the District’s financial health, or financial position. Over time, increases or decreases in the District’s net position are one indicator of whether its financial health is improving or deteriorating. To fully assess the overall health of the District, however, you should consider additional factors as well, such as changes in the District’s property tax base, state funding, or its average daily attendance and the condition of the District’s facilities. In the Statement of Net Position and the Statement of Activities, we divide the District into two kinds of activities: Governmental activities – Most of the District’s basic services are reported here, including
instruction, student support services, transportation, maintenance, and general administration. Property taxes, state aid, and state and federal grants finance most of these activities.
Business-type activities – The District’s food service operation is reported here. The District
charges a fee to “customers” to help it cover the cost of services it provides in the food and nutrition program.
Fund Financial Statements The fund financial statements provide detailed information about the District’s most significant funds, as opposed to the District as a whole. Laws and bond covenants require the District to establish some funds, such as grants received under the No Child Left Behind Act from the U.S. Department of Education. The District’s administration establishes other funds to help it control and manage money for particular purposes. The three kinds of funds used by the District – governmental, proprietary and fiduciary – use different accounting approaches:
Governmental funds – Most of the District’s basic services are reported in governmental funds. These funds use modified accrual accounting (an accounting method that measures the receipt and disbursement of cash and all other financial assets that can be readily converted to cash) and report balances that are available for future spending. The governmental fund statements provide a detailed short-term view of the District’s general operations and the basic services it provides. Governmental fund information helps users determine the availability of financial resources to finance the District’s programs. We describe the differences between governmental activities (reported in the Statement of Net Position and the Statement of Activities) and governmental funds in reconciliation schedules following each of the fund financial statements.
ARLINGTON INDEPENDENT SCHOOL DISTRICT MANAGEMENT’S DISCUSSION AND ANALYSIS (continued)
10
Proprietary funds – Services for which the District charges a fee (whether the users are outside customers or other units of the District) are reported in proprietary funds. Proprietary funds use the same accounting methods employed in the government-wide financial statements.
The District maintains two different types of proprietary funds. Enterprise funds are used to report the same functions presented as business-type activities in the government-wide financial statements. The District accounts for its Food Service operation as an enterprise fund. Internal service funds are used to accumulate and allocate costs internally among various functions. The District accounts for its workers’ compensation and Print Shop programs as internal service funds. Because these services predominantly benefit governmental rather than business-type functions, they have been included within governmental activities in the government-wide financial statements.
Fiduciary funds – The District is the trustee, or fiduciary, for money raised by student activities. These resources can be used only for the student groups that raised the funds; therefore, they are recorded in separate fiduciary funds. We exclude these resources from the District’s other financial statements because the District cannot use these assets to finance its operations. The District is only responsible for ensuring that the assets reported in these funds are used for their intended purposes.
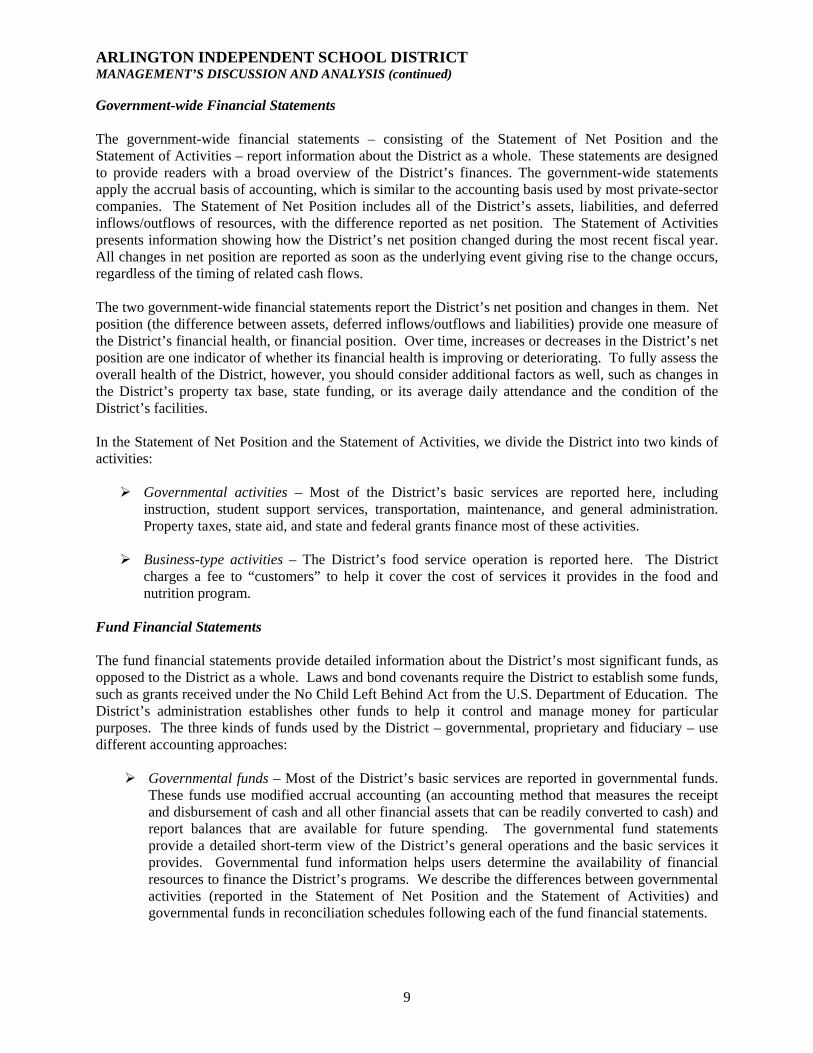
THE DISTRICT AS A WHOLE Net Position. The District’s combined net position were $320.2 million at June 30, 2014 A large portion of net position ($73.2 million or 23%) reflects the District’s investment in capital assets (e.g., land, buildings, furniture and equipment), less any related debt used to acquire those assets that is still outstanding. The District uses these capital assets to provide services to students; consequently, these assets are not available for future spending. Although the District’s investment in its capital assets is reported net of related debt, it should be noted that the resources needed to repay this debt must be provided from other sources, since the capital assets themselves cannot be used to liquidate these liabilities. An additional portion of the District’s net position ($27.80 million or 9%) represents resources that are subject to external restrictions on how they may be used. The remaining balance of unrestricted net position ($219.3 million or 68%) may be used to meet the government’s ongoing obligations.
Governmental Activities Business-Type Activities Totals2014 2013 2014 2013 2014 2013
Current and other assets 351,510$ 332,099$ 12,374$ 11,233$ 363,884$ 343,332$ Capital assets 465,935 466,071 9,573 8,032 475,508 474,103 Total Assets 817,445 798,170 21,947 19,265 839,392 817,435 Total Deferred Outflows of Resources 13,376 10,383 13,376 10,383 Current liabilities 78,769 72,640 1,268 836 80,037 73,476 Long term liabilities 452,492 474,024 452,492 474,024 Total Liabilities 531,261 546,664 1,268 836 532,529 547,500 Net PositionNet Investment in capital assets 63,648 69,385 9,573 8,032 73,221 77,417 Restricted 16,644 16,697 11,106 10,397 27,750 27,094 Unrestricted 219,268 175,807 219,268 175,807 Total Net Position 299,560$ 261,889$ 20,679$ 18,429$ 320,239$ 280,318$
NET POSITIONin thousands
Table II

ARLINGTON INDEPENDENT SCHOOL DISTRICT MANAGEMENT’S DISCUSSION AND ANALYSIS (continued)
11
Changes in Net Position. Total net position of the District increased by $39.9 million over last year (see Table III). Governmental activities increased net position by $37.7 million. Business-type activities increased net position by $2.3 million. Following are separate discussions of changes in revenues and expenses for governmental activities and business-type activities. Governmental activities. Revenues from governmental activities were $592.5 million. The cost of all governmental programs and services were $554.8 million. Governmental activities increased net position by $37.7 million
Governmental Activities Business-Type Activities Totals2014 2013 2014 2013 2014 2013
RevenuesProgram Revenues:
Charges for services 2,865$ 2,956$ 6,197$ 6,234$ 9,062$ 9,190$ Operating grants 65,603 62,110 25,902 24,725 91,505 86,835 Capital grants 273 684 273 684
General Revenues:Property taxes 257,214 251,096 257,214 251,096 State Aid - Formula Grants 248,873 209,685 248,873 209,685 Grants and contributions not restricted 8,594 9,835 8,594 9,835 Investment earnings 237 418 6 11 243 429 Other 9,146 6,210 9,146 6,210
Total Revenues 592,532 542,310 32,378 31,654 624,910 573,964
ExpensesInstruction, curriculum and media 365,037 342,749 365,037 342,749 Instructional and school leadership 34,378 32,412 34,378 32,412 Student support services 44,260 41,133 44,260 41,133 Food services 389 432 30,208 28,573 30,597 29,005 Cocurricular activities 9,413 8,833 9,413 8,833 General administration 7,034 6,540 7,034 6,540 Plant maintenance, security and data processing 64,788 63,450 64,788 63,450 Community services 3,180 3,115 3,180 3,115 Debt service 15,486 19,368 15,486 19,368 Facilities repairs and maintenance 1,413 971 1,413 971 Intergovernmental charges 9,402 5,527 9,402 5,527
Total Expenses 554,780 524,530 30,208 28,573 584,988 553,103 Excess (deficiency) before transfers 37,752 17,780 2,170 3,081 39,922 20,861 Transfers (80) (99) 80 99 Increase (Decrease) in Net Position 37,672 17,681 2,250 3,180 39,922 20,861 Net Position - Beginning 261,888 244,207 18,429 15,249 280,317 259,456 Net Position - Ending 299,560$ 261,888$ 20,679$ 18,429$ 320,239$ 280,317$
CHANGES IN NET POSITIONin thousands
Table III
ARLINGTON INDEPENDENT SCHOOL DISTRICT MANAGEMENT’S DISCUSSION AND ANALYSIS (continued)
12
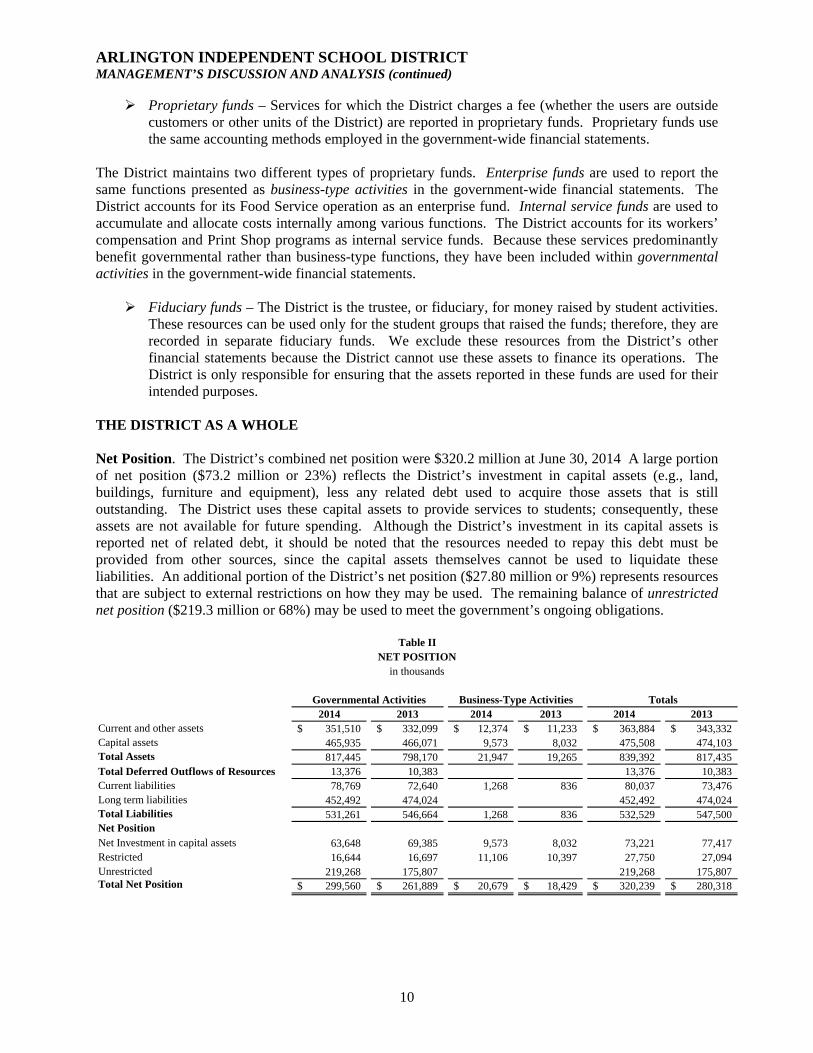
Figure 1 graphically depicts the sources of governmental activities revenue. Property taxes and state foundation aid (accounted for as “state aid – formula grants”) are the District’s chief sources of operating revenues. Both of these revenue streams continue to change dramatically from year to year due to changes in property values and components in the funding formulas used by the State of Texas to calculate state aid payments.
Governmental Revenues by Source
Property taxes (43%)
Operating grants and contributions(11%)
State aid - formula grants (42%)
Charges for services (1%)
Grants and contributions - notrestricted (1%)
Miscellaneous (2%)
Figure 1
The State required school districts to compress their maintenance and operations (M&O) tax rate to $1.00 over a two-year period ending in 2007-08. Districts were given the authority to add as much as another 4 cents to the compressed rate without voter approval. Any increase above the compressed rate plus 4 cents requires voter approval. The maximum M&O tax rate allowable under this law is $1.17. AISD found it necessary to levy the additional 4 cents of tax in 2007-08 to help balance the general operating budget, bringing the M&O tax rate to $1.04. The District’s M&O tax rate has remained unchanged since the 2007-08 fiscal year. Equity and adequacy concerns have plagued school finance for many years. More than 600 Texas public school districts, including Arlington, filed lawsuits during the 2013-14 year that claimed the state funding system was inadequate and unfair, and was in violation of the Texas constitution. A total of six lawsuits were originally filed and were subsequently combined into one lawsuit. In February, 2013, Judge John Dietz verbally ruled that the Texas school finance system was unconstitutional, finding it did not adequately fund public schools and that the system had evolved into a de facto statewide property tax. He reopened the case in January of 2014 to consider whether changes made to the funding system by the 83rd Texas Legislature altered the system to an extent that would change his ruling. On August 28, 2014, Judge Dietz issued his final ruling in the matter, finding that the Texas school finance system was unconstitutional. The ruling has been appealed to a higher court with the speculation that a Texas Supreme Court appeal will be heard within the next year. In addition to state foundation aid and property tax revenue the district received $65.6 million in operating grants and contributions. Included in this amount are federal entitlements and grants including the Title 1, Part A program, and the Individuals with Disabilities Education Act (IDEA, Part B).

ARLINGTON INDEPENDENT SCHOOL DISTRICT MANAGEMENT’S DISCUSSION AND ANALYSIS (continued)
13
Revenues for governmental activities increased by $50.2 million in 2013-14. The bulk of this increase is due to changes in state aid, property taxes and operating grants. These revenue items are examined in more detail, below: State aid increased by $39.2 million due to the net difference between legislative funding cuts for the
2012-2013 biennium being restored for the 2014-2015 biennium, lower student enrollment, changes in property values, and prior year state aid recognized in the current year because funds were received beyond the allowable 60 day year-end accrual period. The 82nd state legislature reduced the Regular Program Allotment component of the state funding formula to account for a $4 billion shortfall in the state education budget in the 2012-13 biennium. As previously mentioned, these reductions were restored by the 83rd state legislature for the 2014-15 biennium. This increase, netted against the prior year state aid, the effects on state funding formulas of a decrease in student enrollment of 325 students and changes in property values, resulted in the net increase to state aid.
In 2013-14 the District’s M&O taxes increased $6.2 million due to a 4.42% increase in certified property values, and due to increased collection trends.
The District received $3.5 million (or 5.6%) more for operating grants and contributions in 2014 compared to the prior year.
Expenses are summarized by functional categories that reflect the purpose of the transaction. Various operating expenses are recorded within each functional category. Total expenses increased $30.3 million (or 5.8%) over 2013. Increases in the 2014 fiscal year budget are primarily due to increased expenditures for salaries and related benefits, contracted services for energy retrofit projects, reading materials and library books, and capital asset purchases.
Governmental Expenses by Function
Instruction and student-related(80%)
Plant maintenance, security, anddata processing (12%)
Debt service (3%)
Cocurricular activities (1%)
Administration and other (3%)
Community services (1%)
Figure 2
Payroll, accounting for approximately 84% of total expenses, is the most significant operating expense incurred by the District and is recorded in the majority of functional categories. Payroll expenses were $19.4 million (or 4.8%) higher than last year primarily due to: 72.7 new positions added during the staffing process and to staff the new Adams Elementary school campus; additional stipends for academic enrichment, expanded academic offerings, leadership academies and expansion of athletic programs at the junior high schools; a 3.0% across the board pay increases for all employees; increasing beginning teacher salaries to $50,000; equity adjustments for steps 1-20 of the teacher salary schedule; and salary adjustments as a result of a contracted salary market study related to the District’s strategic plan.

ARLINGTON INDEPENDENT SCHOOL DISTRICT MANAGEMENT’S DISCUSSION AND ANALYSIS (continued)
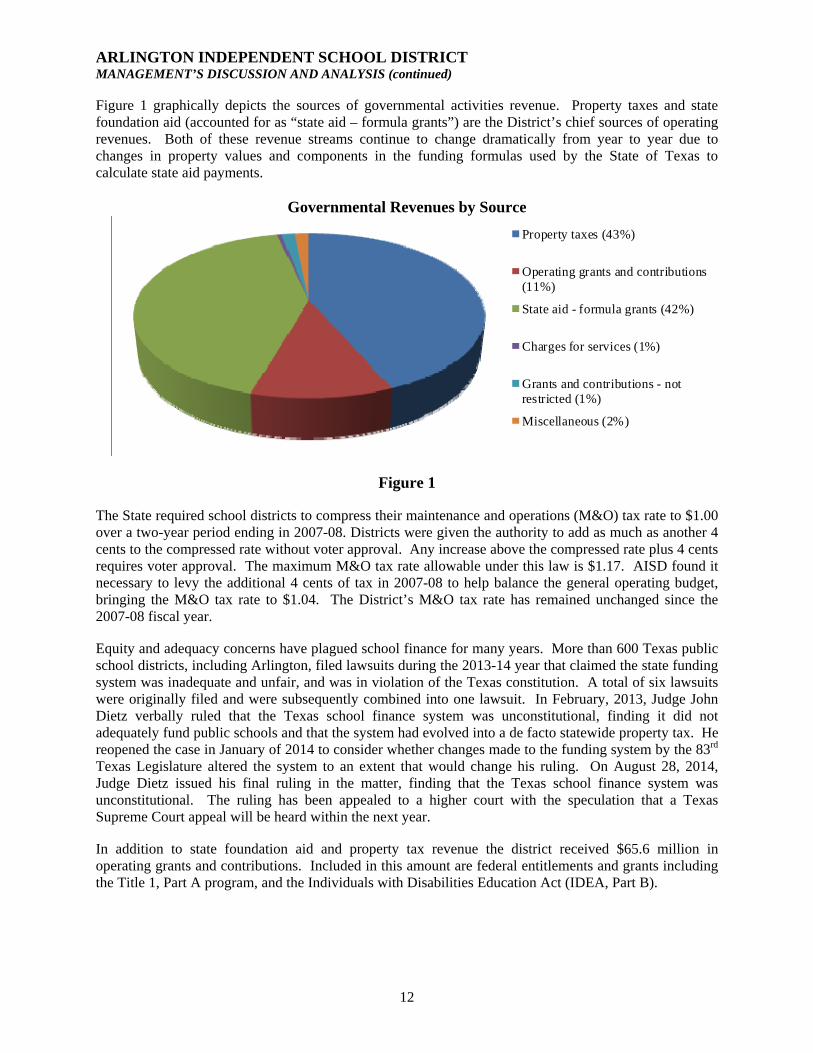
14
In early 2012 the Board of Trustees and Administration developed a bold and comprehensive strategic plan to guide the District in the upcoming years. Year two activities in the District’s 2012-2015 Achieve Today. Excel Tomorrow. strategic plan were funded in the 2014 budget in order to continue the quest to reach the goals of inspired learners, effective leadership and an engaged community. One major component of the strategic plan was to compensate all employees on a performance-based model. To address this component of the strategic plan, the District contracted with the Texas Association of School Boards during the year to conduct a salary market study to align the entire compensation structure to the market rate, align individual positions within the AISD salary structure and set the foundation for performance-based pay. The Board accepted the recommendations from the salary market study and adjusted salaries, where necessary, to reflect the market rate. In addition to salaries, increases in contract services, supplies and capital expenses also contributed to the overall increase in total expenses, as follows: Contracted services increased by approximately $2.4 million for projects related to the Texas State
Energy Conservation Office (SECO) revolving loan program which finances energy-related cost-reduction retrofits for state, public school district, public college, public university, and tax-district supported public hospital facilities. Under this program, low interest rate loans are provided to assist borrowers in financing energy related cost-reduction projects. Throughout the term of the loan, dollars from energy savings are used to make payments on the loan. Once the loan is paid in full, the on-going energy savings results in direct savings to AISD taxpayers.
Supplies increased approximately $4.2 million due to Title 1 and literacy grant purchases of book backpacks sent home with students over the summer. Additionally, these grants also funded the purchase of library books to enhance the library collection at certain campuses.
Capital expenses occurred during the year for architect services to build a new elementary school in
east Arlington. The Board of Trustees committed surplus fund balance to build the new school to relieve overcrowding in that area. The entire school will be built by this strategic one-time use of surplus fund balance. The remaining expenses are expected to occur in the 2014-15 school year as construction is completed. Additional capital expenses during the year were for school buses paid for from a Texas Emissions Reduction Plan (TERP) grant from the State Energy Conservation Office, and for white fleet vehicle replacements funded out of the general fund. Total additional capital expenses resulted in increased expenses of approximately $2.3 million.
Table IV presents the total costs of the District’s largest programs as well as the net costs (total costs less fees generated by the activities and operating grants) of those programs. The net cost is the financial burden that was borne by the District’s taxpayers for each of these functions. The cost of all governmental activities this year was $554.8 million compared to $524.5 million last year. As shown in the Statement of Activities on pages 28 - 29 the amount that our taxpayers ultimately financed for these activities through District taxes was $257.2 million (or 46.4%). The remaining costs were paid by state aid ($248.9 million), those who directly benefited from the programs ($2.9 million), other governments and organizations that subsidized certain programs with grants and contributions ($65.6 million), and miscellaneous other revenues ($17.9 million).
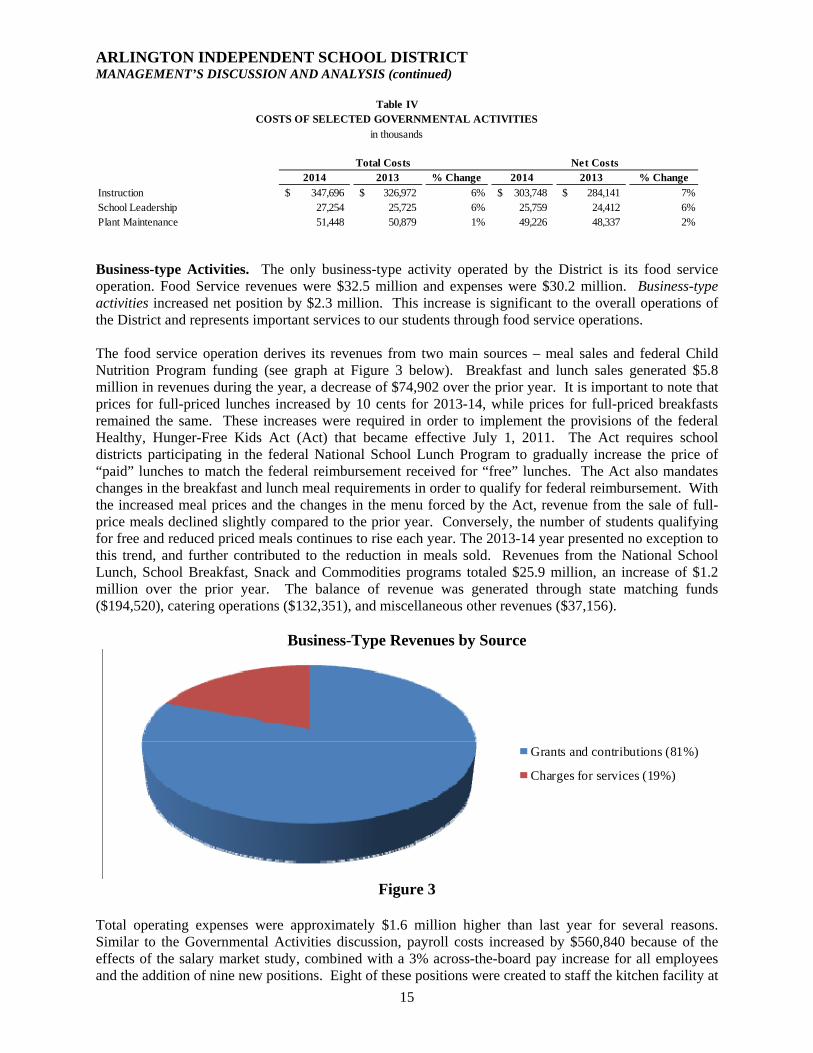
ARLINGTON INDEPENDENT SCHOOL DISTRICT MANAGEMENT’S DISCUSSION AND ANALYSIS (continued)
15
2014 2013 % Change 2014 2013 % ChangeInstruction 347,696$ 326,972$ 6% 303,748$ 284,141$ 7%School Leadership 27,254 25,725 6% 25,759 24,412 6%Plant Maintenance 51,448 50,879 1% 49,226 48,337 2%
Table IVCOSTS OF SELECTED GOVERNMENTAL ACTIVITIES
in thousands
Total Costs Net Costs
Business-type Activities. The only business-type activity operated by the District is its food service operation. Food Service revenues were $32.5 million and expenses were $30.2 million. Business-type activities increased net position by $2.3 million. This increase is significant to the overall operations of the District and represents important services to our students through food service operations. The food service operation derives its revenues from two main sources – meal sales and federal Child Nutrition Program funding (see graph at Figure 3 below). Breakfast and lunch sales generated $5.8 million in revenues during the year, a decrease of $74,902 over the prior year. It is important to note that prices for full-priced lunches increased by 10 cents for 2013-14, while prices for full-priced breakfasts remained the same. These increases were required in order to implement the provisions of the federal Healthy, Hunger-Free Kids Act (Act) that became effective July 1, 2011. The Act requires school districts participating in the federal National School Lunch Program to gradually increase the price of “paid” lunches to match the federal reimbursement received for “free” lunches. The Act also mandates changes in the breakfast and lunch meal requirements in order to qualify for federal reimbursement. With the increased meal prices and the changes in the menu forced by the Act, revenue from the sale of full-price meals declined slightly compared to the prior year. Conversely, the number of students qualifying for free and reduced priced meals continues to rise each year. The 2013-14 year presented no exception to this trend, and further contributed to the reduction in meals sold. Revenues from the National School Lunch, School Breakfast, Snack and Commodities programs totaled $25.9 million, an increase of $1.2 million over the prior year. The balance of revenue was generated through state matching funds ($194,520), catering operations ($132,351), and miscellaneous other revenues ($37,156).
Business-Type Revenues by Source
Grants and contributions (81%)
Charges for services (19%)
Figure 3
Total operating expenses were approximately $1.6 million higher than last year for several reasons. Similar to the Governmental Activities discussion, payroll costs increased by $560,840 because of the effects of the salary market study, combined with a 3% across-the-board pay increase for all employees and the addition of nine new positions. Eight of these positions were created to staff the kitchen facility at

ARLINGTON INDEPENDENT SCHOOL DISTRICT MANAGEMENT’S DISCUSSION AND ANALYSIS (continued)
16
the new Adams Elementary school, which opened for the beginning of the 2013-14 year. In addition, one new maintenance position was added to address equipment repairs and reduce the use of contracted services. These increases were offset by payroll decreases due to naturally occurring vacancies and unfilled positions during the year. General supplies and food costs increased by $393,236 and $374,245, respectively, primarily due to increased cost for supplies and food, as experienced by all consumers nationwide. THE DISTRICT’S FUNDS As noted earlier, the District uses fund accounting to ensure and demonstrate compliance with finance-related legal requirements, bond covenants, and segregation for particular purposes. Governmental funds. The focus of the District’s governmental funds is to provide information on near-term inflows, outflows, and balances of spendable resources. Such information is useful in assessing the District’s financing requirements. In particular, unassigned fund balance may serve as a useful measure of the District’s net resources available for spending at the end of a fiscal year. As the District completed the year, its governmental funds (as presented in the Balance Sheet on pages 30 - 31) reported combined fund balances of $271.5 million, which is $12.6 million more than last year’s combined fund balances, 56% of the total amount, or $153.1 million, is unassigned fund balance which is available for spending at the District’s discretion. The remainder of fund balance is not available for new spending because it is classified as nonspendable, restricted, committed or assigned for the following items: Inventory and prepaid items ($1.6 million); debt service ($17.3 million); federal, state and local grants ($397,248); capital acquisition and liquidation of contracts and purchase orders of the prior period ($61.4 million); and special projects ($34.8 million); and purposes related to the Texas High School Allotment ($2.9 million). The General Fund is the chief operating fund of the District. At the end of the current fiscal year, unassigned fund balance of the General Fund was $153.1 million, while the total fund balance was $188.8 million. The fund balance of the General Fund increased by $32.5 million this year. The major factors that contributed to the overall increase in fund balance are best understood in comparison to similar items from the prior year, as detailed below. Higher overall general fund revenues were primarily attributed to the net effect of several items. Legislative funding cuts for the 2012-2013 biennium were restored by the Texas legislature for the 2014-2015 biennium. Additionally, a lower overall student enrollment figure, resulting in less state aid for average daily attendance, was offset by prior year state aid that was recognized in the current year because funds were received more than 60 days beyond the end of the prior year, which is outside of the allowable 60 day year-end accrual period. Finally, changes in property values resulted in higher M&O property tax collections. The net effect of these items resulted in an increase of $47.5 million in General Fund revenues compared to the prior year. On the expenditure side, savings in payroll costs due to unfilled positions and naturally occurring position vacancies, netted against higher salaries, resulted in a year over year increase of $20.1 million in payroll expenditures. Salaries were higher in the general fund because of several factors, including: new positions were added during the staffing process and to staff the new Adams Elementary school; additional stipends were added for academic enrichment, expanded academic offerings, leadership academies and expansion of athletic programs at the junior high schools; a 3.0% across the board pay increase for all employees was granted; the beginning teacher salary was increased to $50,000; equity adjustments for steps 1-20 of the teacher salary schedule were provided; and salary adjustments were approved during the year as a result of a contracted salary market study that occurred in relation to the District’s strategic plan. Other expenditure categories that increased over the prior year included $2.5 million in contracted maintenance and repair for SECO Loan Star energy retrofit projects (explained in more detail in the governmental activities discussion), $2.1 million in general supplies as a result of a higher overall cost of goods, $4.3 million in the other operating expenses
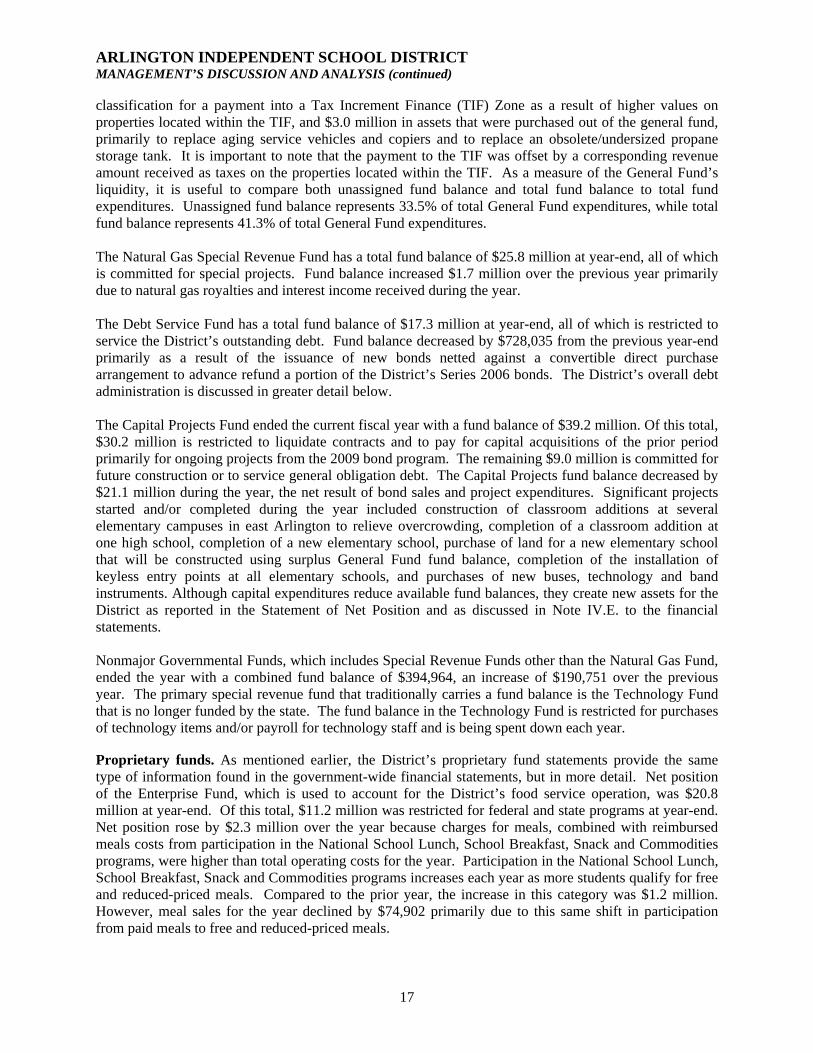
ARLINGTON INDEPENDENT SCHOOL DISTRICT MANAGEMENT’S DISCUSSION AND ANALYSIS (continued)
17
classification for a payment into a Tax Increment Finance (TIF) Zone as a result of higher values on properties located within the TIF, and $3.0 million in assets that were purchased out of the general fund, primarily to replace aging service vehicles and copiers and to replace an obsolete/undersized propane storage tank. It is important to note that the payment to the TIF was offset by a corresponding revenue amount received as taxes on the properties located within the TIF. As a measure of the General Fund’s liquidity, it is useful to compare both unassigned fund balance and total fund balance to total fund expenditures. Unassigned fund balance represents 33.5% of total General Fund expenditures, while total fund balance represents 41.3% of total General Fund expenditures. The Natural Gas Special Revenue Fund has a total fund balance of $25.8 million at year-end, all of which is committed for special projects. Fund balance increased $1.7 million over the previous year primarily due to natural gas royalties and interest income received during the year. The Debt Service Fund has a total fund balance of $17.3 million at year-end, all of which is restricted to service the District’s outstanding debt. Fund balance decreased by $728,035 from the previous year-end primarily as a result of the issuance of new bonds netted against a convertible direct purchase arrangement to advance refund a portion of the District’s Series 2006 bonds. The District’s overall debt administration is discussed in greater detail below. The Capital Projects Fund ended the current fiscal year with a fund balance of $39.2 million. Of this total, $30.2 million is restricted to liquidate contracts and to pay for capital acquisitions of the prior period primarily for ongoing projects from the 2009 bond program. The remaining $9.0 million is committed for future construction or to service general obligation debt. The Capital Projects fund balance decreased by $21.1 million during the year, the net result of bond sales and project expenditures. Significant projects started and/or completed during the year included construction of classroom additions at several elementary campuses in east Arlington to relieve overcrowding, completion of a classroom addition at one high school, completion of a new elementary school, purchase of land for a new elementary school that will be constructed using surplus General Fund fund balance, completion of the installation of keyless entry points at all elementary schools, and purchases of new buses, technology and band instruments. Although capital expenditures reduce available fund balances, they create new assets for the District as reported in the Statement of Net Position and as discussed in Note IV.E. to the financial statements. Nonmajor Governmental Funds, which includes Special Revenue Funds other than the Natural Gas Fund, ended the year with a combined fund balance of $394,964, an increase of $190,751 over the previous year. The primary special revenue fund that traditionally carries a fund balance is the Technology Fund that is no longer funded by the state. The fund balance in the Technology Fund is restricted for purchases of technology items and/or payroll for technology staff and is being spent down each year. Proprietary funds. As mentioned earlier, the District’s proprietary fund statements provide the same type of information found in the government-wide financial statements, but in more detail. Net position of the Enterprise Fund, which is used to account for the District’s food service operation, was $20.8 million at year-end. Of this total, $11.2 million was restricted for federal and state programs at year-end. Net position rose by $2.3 million over the year because charges for meals, combined with reimbursed meals costs from participation in the National School Lunch, School Breakfast, Snack and Commodities programs, were higher than total operating costs for the year. Participation in the National School Lunch, School Breakfast, Snack and Commodities programs increases each year as more students qualify for free and reduced-priced meals. Compared to the prior year, the increase in this category was $1.2 million. However, meal sales for the year declined by $74,902 primarily due to this same shift in participation from paid meals to free and reduced-priced meals.

ARLINGTON INDEPENDENT SCHOOL DISTRICT MANAGEMENT’S DISCUSSION AND ANALYSIS (continued)
18
The overall net increase in revenue was offset by modest increases in personnel and other operating expenses. As discussed earlier, payroll costs increased by $560,840 because of the effects of the salary market study, combined with a 3% across-the-board pay increase for all employees and the addition of nine new positions. These increases were offset by payroll decreases due to naturally occurring vacancies and unfilled positions during the year. General supplies and food costs increased by $393,236 and $374,245, respectively, primarily due to increased cost for supplies and food, as experienced by all consumers nationwide. Finally, increases in depreciation expense of $300,453, due to additional equipment purchased and contributed from capital projects funds, contributed to the overall increase in net position. GENERAL FUND BUDGETARY HIGHLIGHTS Over the course of the year, the Board of Trustees revised the District’s budget several times. Significant budget amendments affected the following areas:
1) An amendment in the amount of $1.2 million made shortly after the beginning of the new fiscal year to re-appropriate campus budget allocations not spent at the end of the preceding year (referred to as “carryover funds”).
2) An amendment in the amount of $1.5 million to begin construction of a new elementary school in
east Arlington. The Board committed $23,617,000 of surplus fund balance in January, 2013, to be used for construction of a new elementary school in east Arlington. This elementary school is needed to alleviate overcrowding in east Arlington. Although the majority of the construction will be completed in 2014-15, work began on this project in 2013-14. The $1.5 million budget was to cover work-in-progress billings from the architect and general contractor through June 30, 2014.
3) An amendment for $689,500 million to re-appropriate High School Allotment carryover funds for
college readiness needs. These funds were originally special revenue funds that were absorbed into the General Fund based on requirements from the Texas Education Agency. The General Fund maintains the $2.9 million carryover balance for the High School Allotment.
4) Changes made to revise estimates of revenues and expenditures based on the latest information on property valuations, student attendance, interest earnings, and operating costs. The following is a summary of the most significant amendments in this category:
a. $516,667 decrease in property tax revenues to reflect a change in the tax levy estimates
for the original budget, including changes in exemptions and changes in the TIF property values.
b. $3.5 million increase in TIF payments based on increased property values in the TIFs. The District participates in two TIFs. A new outlet mall was built within the Grand Prairie TIF #2 zone and added to the tax rolls during 2013-14.
c. $3.9 million decrease in state foundation aid to reflect decreases in average daily attendance.
d. $1.5 million decrease in SHARS revenue based on actual services provided to Medicaid eligible students.
e. $3 million decrease in other revenue sources for SECO Loan Star energy retrofit projects that will not be completed by June 30, 2013.
f. $10 million decrease in salary expense, including associated benefits, tutoring, and extra duty pay, due to decreased student enrollment, staff vacancies, and analysis of actual expenditure trends.

ARLINGTON INDEPENDENT SCHOOL DISTRICT MANAGEMENT’S DISCUSSION AND ANALYSIS (continued)
19
The District’s General Fund fund balance of $188.8 million reported on pages 30 - 31 differs from the final budgetary fund balance of $163.7 million reported in the budgetary comparison statement on page 37. The difference is largely due to the net effect of favorable and unfavorable variances in property taxes, state revenue, employee compensation, contracted services, and in the general supplies categories: Property Taxes - Ended the year with a net $1.8 million favorable variance mainly because
collections of taxes were higher than anticipated late in the fiscal year. State Foundation Aid - Higher than the final budget by $15.9 million, as follows: $13.8 million
primarily due to a prior year accrual adjustment and from total payments received in time to accrue the total revenue to 2013-14; $2.2 million due to increased rates for TRS on-behalf calculations that changed during the year (see corresponding note in Employee Compensation).
Employee Compensation and Related Employment Benefits- Ended the year with a $2.6
million unfavorable variance primarily because of increased rates for TRS on-behalf calculations that changed during the year (see corresponding note in State Foundation Aid).
Contracted services - Utilities were less than originally expected during the year because the
District acted on an opportunity to lower the rate for electricity during the year and because efforts to reduce consumption were successful. Additionally, deferred staff development related to the strategic plan resulted in savings, as well as expenditures being deferred to the 2015 year for items related to the SECO Loan Star project. The total favorable variance for contracted services was $5.1 million.
Supplies and Materials - $2.9 million less than the final budget due in part to activities in the
District’s strategic plan that were deferred until the following year, when training and curriculum materials will be utilized to implement the new instructional model. Also in this expenditure category are campus allotments (budgeted mainly in general supplies) that had a year-end balance of $1.3 million that will be re-appropriated in the 2014-15 fiscal year.
CAPITAL ASSET AND DEBT ADMINISTRATION Capital Assets At the end of 2014, the District had $465.9 million invested (net of accumulated depreciation) in a broad range of capital assets, including facilities and equipment for instruction, transportation, athletics, administration, maintenance, and food service (see Table V below).
Governmental Activities Business-Type Activities Totals2014 2013 2014 2013 2014 2013
Land 64,860$ 62,581$ 401 401$ 65,261$ 62,982$ Buildings and improvements 366,092 366,134 2,732 2,813 368,824 368,947 Furniture and equipment 21,649 19,916 6,439 4,817 28,088 24,733 Leased assets under capital lease 21 98 21 98 Construction in progress 13,313 17,342 13,313 17,342 Total 465,935 466,071 9,572 8,031 475,507 474,102
CAPITAL ASSETS(Net of depreciation, In thousands)
Table V
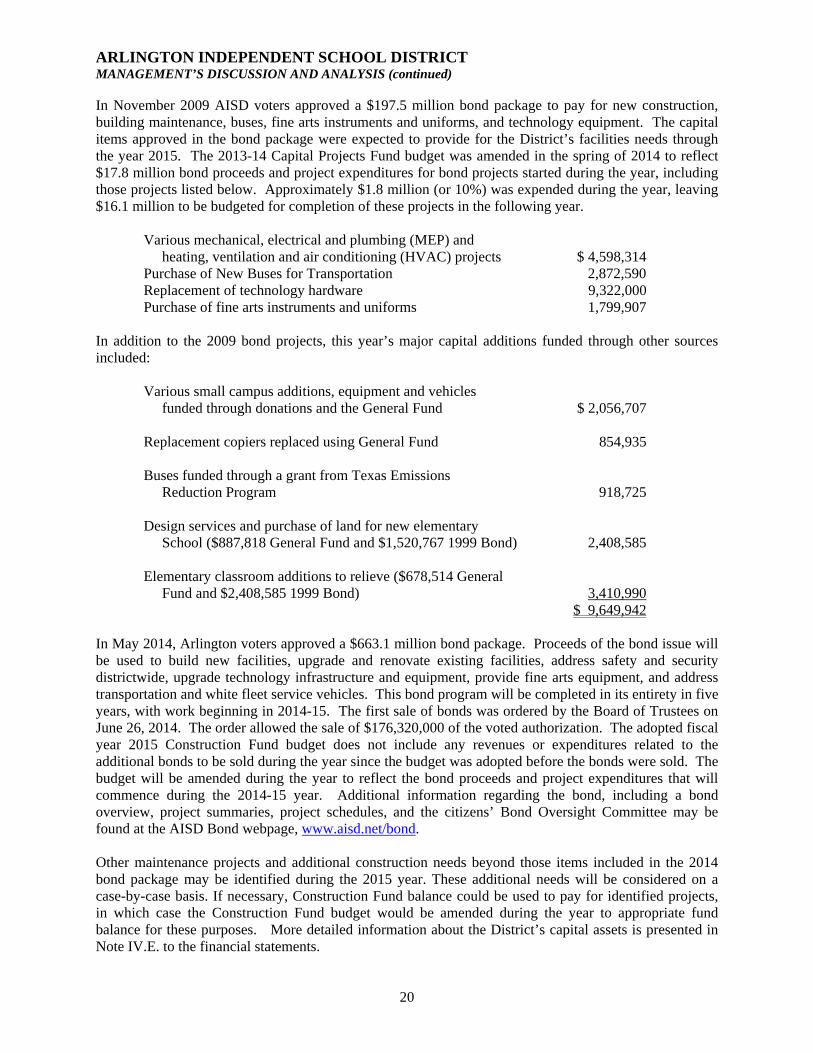
ARLINGTON INDEPENDENT SCHOOL DISTRICT MANAGEMENT’S DISCUSSION AND ANALYSIS (continued)
20
In November 2009 AISD voters approved a $197.5 million bond package to pay for new construction, building maintenance, buses, fine arts instruments and uniforms, and technology equipment. The capital items approved in the bond package were expected to provide for the District’s facilities needs through the year 2015. The 2013-14 Capital Projects Fund budget was amended in the spring of 2014 to reflect $17.8 million bond proceeds and project expenditures for bond projects started during the year, including those projects listed below. Approximately $1.8 million (or 10%) was expended during the year, leaving $16.1 million to be budgeted for completion of these projects in the following year.
Various mechanical, electrical and plumbing (MEP) and heating, ventilation and air conditioning (HVAC) projects $ 4,598,314 Purchase of New Buses for Transportation 2,872,590 Replacement of technology hardware 9,322,000 Purchase of fine arts instruments and uniforms 1,799,907
In addition to the 2009 bond projects, this year’s major capital additions funded through other sources included:
Various small campus additions, equipment and vehicles funded through donations and the General Fund $ 2,056,707 Replacement copiers replaced using General Fund 854,935 Buses funded through a grant from Texas Emissions Reduction Program 918,725 Design services and purchase of land for new elementary School ($887,818 General Fund and $1,520,767 1999 Bond) 2,408,585 Elementary classroom additions to relieve ($678,514 General Fund and $2,408,585 1999 Bond) 3,410,990 $ 9,649,942
In May 2014, Arlington voters approved a $663.1 million bond package. Proceeds of the bond issue will be used to build new facilities, upgrade and renovate existing facilities, address safety and security districtwide, upgrade technology infrastructure and equipment, provide fine arts equipment, and address transportation and white fleet service vehicles. This bond program will be completed in its entirety in five years, with work beginning in 2014-15. The first sale of bonds was ordered by the Board of Trustees on June 26, 2014. The order allowed the sale of $176,320,000 of the voted authorization. The adopted fiscal year 2015 Construction Fund budget does not include any revenues or expenditures related to the additional bonds to be sold during the year since the budget was adopted before the bonds were sold. The budget will be amended during the year to reflect the bond proceeds and project expenditures that will commence during the 2014-15 year. Additional information regarding the bond, including a bond overview, project summaries, project schedules, and the citizens’ Bond Oversight Committee may be found at the AISD Bond webpage, www.aisd.net/bond. Other maintenance projects and additional construction needs beyond those items included in the 2014 bond package may be identified during the 2015 year. These additional needs will be considered on a case-by-case basis. If necessary, Construction Fund balance could be used to pay for identified projects, in which case the Construction Fund budget would be amended during the year to appropriate fund balance for these purposes. More detailed information about the District’s capital assets is presented in Note IV.E. to the financial statements.

ARLINGTON INDEPENDENT SCHOOL DISTRICT MANAGEMENT’S DISCUSSION AND ANALYSIS (continued)
21
Debt At year-end, the District had total debt outstanding of $452.5 million versus $474.0 million last year – a decrease of 5.6% (see Table VI.) The decrease is the net result of scheduled debt retirements and the issuance of new bonds. AISD voters approved a $197.5 million bond package in November 2009. 100% of that authorization has been issued as of the end of the 2014 year, with all projects scheduled to be completed by December, 2014. $28.3 million is budgeted in 2014-15 for the completion of those projects. As discussed above, the voters also approved a $661.3 million bond package in May 2014. Additional debt will be issued during the 2015 year based on the $176.3 million bond ordered by the Board of Trustees on June 26, 2014. In addition to new debt, the District refunded a portion of its Series 2006 bond issue for debt service savings. A portion of the Series 2006 bonds was used to advance refund prior bonds; therefore, that portion of the bonds was not eligible to be refunded again on a tax-exempt basis prior to the call date. The District does have the option to issue taxable bonds to advance refund this same portion of the Series 2006 bonds. Wells Fargo offered the District a convertible direct purchase arrangement to purchase the Series 2006 bonds not eligible for refunding on a tax-exempt basis. Under this arrangement, the bank purchased the District’s fixed-rate taxable bond that had an option to convert to a lower tax-exempt rate on the call date, which is February 15, 2016. The taxable and tax-exempt rates are set at the time of sale. At the call date, the District can (a) ask to convert the bonds to a tax-exempt status (rate set on the sale date) if market conditions are favorable, or (b) do nothing and keep the initial taxable rate for the remainder of the bond issue. The tax-exempt rate conversion option is subject to delivery of an opinion from bond counsel that the bonds are eligible for tax-exempt status. If the District desires to convert to a tax-exempt rate and Wells Fargo cannot approve the transaction, the reset rate will step down to a lower taxable variable rate with a cap amount. The convertible direct purchase arrangement offers savings that are more competitive than those achievable through a taxable advance refunding in the public market. The total amount of the Series 2006 bonds refunded by convertible direct purchase was $72,365,000 of the 2017 through 2024 maturities. The projected net total savings through 2024 is $4,182,319 based on market rates in May, and the present value savings at May market rates is 5.78% of the refunded bonds.
Governmental Activities Business-Type Activities Totals2014 2013 2014 2013 2014 2013
Bonds Payable 420,160$ 445,145$ $ $ 420,160$ 445,145$ Bond Premiums 22,889 19,122 22,889 19,122 Accreted interest 6,064 5,758 6,064 5,758 Capital Leases 60 60 Accrued Service Benefits 614 894 614 894 Notes Payable 2,765 3,045 2,765 3,045
452,492$ 474,024$ $ $ 452,492$ 474,024$
OUTSTANDING DEBT(In thousands)
Table VI
Moody’s Investor Service, Inc. rates the District’s general obligation bonds Aa1. Standard and Poor’s assigned the District a credit rating of AA. Bonds with these ratings are judged to be of very high quality by all standards. State statutes limit the amount of general obligation debt a governmental entity may issue to 10 percent of its total assessed property valuation. The current debt limitation for the District is $2,070,707,258 which significantly exceeds the District’s outstanding general obligation debt.
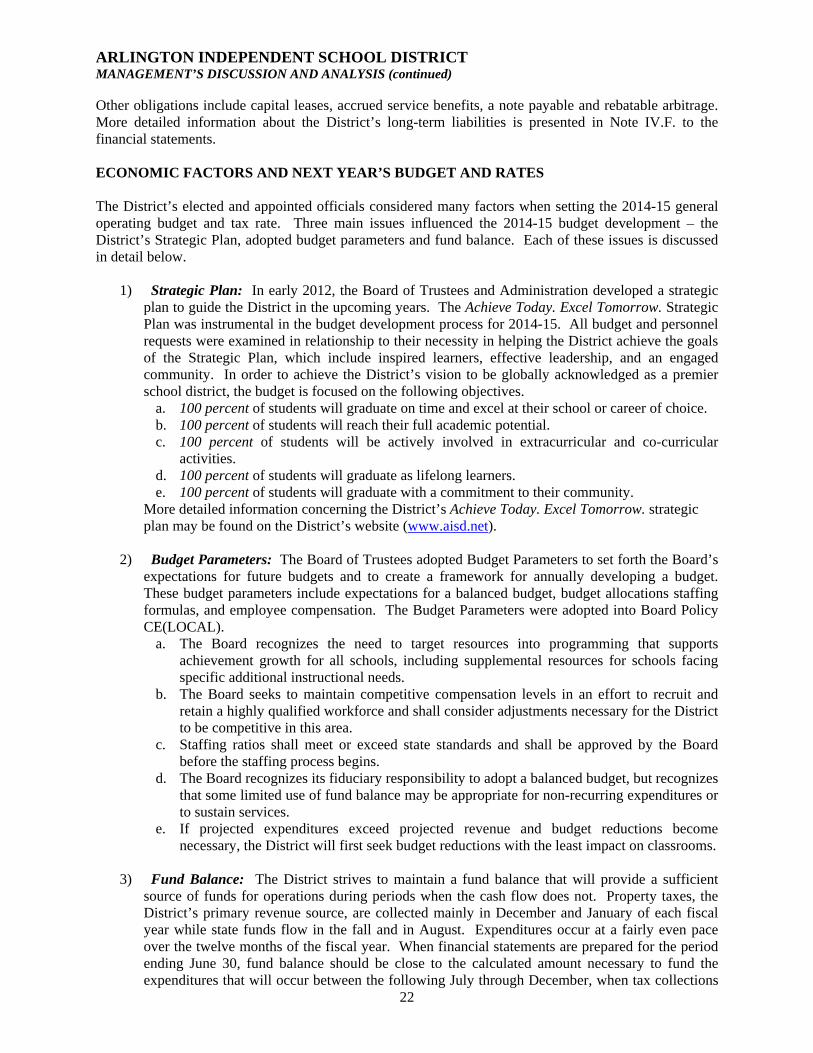
ARLINGTON INDEPENDENT SCHOOL DISTRICT MANAGEMENT’S DISCUSSION AND ANALYSIS (continued)
22
Other obligations include capital leases, accrued service benefits, a note payable and rebatable arbitrage. More detailed information about the District’s long-term liabilities is presented in Note IV.F. to the financial statements. ECONOMIC FACTORS AND NEXT YEAR’S BUDGET AND RATES The District’s elected and appointed officials considered many factors when setting the 2014-15 general operating budget and tax rate. Three main issues influenced the 2014-15 budget development – the District’s Strategic Plan, adopted budget parameters and fund balance. Each of these issues is discussed in detail below.
1) Strategic Plan: In early 2012, the Board of Trustees and Administration developed a strategic plan to guide the District in the upcoming years. The Achieve Today. Excel Tomorrow. Strategic Plan was instrumental in the budget development process for 2014-15. All budget and personnel requests were examined in relationship to their necessity in helping the District achieve the goals of the Strategic Plan, which include inspired learners, effective leadership, and an engaged community. In order to achieve the District’s vision to be globally acknowledged as a premier school district, the budget is focused on the following objectives.
a. 100 percent of students will graduate on time and excel at their school or career of choice. b. 100 percent of students will reach their full academic potential. c. 100 percent of students will be actively involved in extracurricular and co-curricular
activities. d. 100 percent of students will graduate as lifelong learners. e. 100 percent of students will graduate with a commitment to their community.
More detailed information concerning the District’s Achieve Today. Excel Tomorrow. strategic plan may be found on the District’s website (www.aisd.net).
2) Budget Parameters: The Board of Trustees adopted Budget Parameters to set forth the Board’s expectations for future budgets and to create a framework for annually developing a budget. These budget parameters include expectations for a balanced budget, budget allocations staffing formulas, and employee compensation. The Budget Parameters were adopted into Board Policy CE(LOCAL).
a. The Board recognizes the need to target resources into programming that supports achievement growth for all schools, including supplemental resources for schools facing specific additional instructional needs.
b. The Board seeks to maintain competitive compensation levels in an effort to recruit and retain a highly qualified workforce and shall consider adjustments necessary for the District to be competitive in this area.
c. Staffing ratios shall meet or exceed state standards and shall be approved by the Board before the staffing process begins.
d. The Board recognizes its fiduciary responsibility to adopt a balanced budget, but recognizes that some limited use of fund balance may be appropriate for non-recurring expenditures or to sustain services.
e. If projected expenditures exceed projected revenue and budget reductions become necessary, the District will first seek budget reductions with the least impact on classrooms.
3) Fund Balance: The District strives to maintain a fund balance that will provide a sufficient
source of funds for operations during periods when the cash flow does not. Property taxes, the District’s primary revenue source, are collected mainly in December and January of each fiscal year while state funds flow in the fall and in August. Expenditures occur at a fairly even pace over the twelve months of the fiscal year. When financial statements are prepared for the period ending June 30, fund balance should be close to the calculated amount necessary to fund the expenditures that will occur between the following July through December, when tax collections

ARLINGTON INDEPENDENT SCHOOL DISTRICT MANAGEMENT’S DISCUSSION AND ANALYSIS (continued)
23
begin to flow in. Maintaining a sufficient fund balance allows the District to avoid the interest expense on money borrowed to meet cash flow needs. Credit rating agencies consider a district’s fund balance to be adequate if it exceeds two months of operating expenditures, and they will take into account all resources available for general operations, including those in Special Revenue Funds. The 2014-15 General Fund budget has a deficit of $20,773,617. This deficit is due to the strategic one-time use of $21,758,600 of surplus fund balance to build a new elementary school in east Arlington to relieve overcrowding in that area. The Board committed surplus fund balance for this use. Without this one-time expenditure, the operating budget would have a surplus of $984,983. Other surplus fund balance may be designated for future use. Fund balance at June 30, 2015 is projected to be $151,369,937. This budget enables Arlington ISD to maintain a healthy total fund balance of 3.6 months of operating reserve for the fiscal year beginning July1, 2015. This healthy fund balance provides stability given the uncertainty of future revenues and expenditures.
A summary of the 2014-15 General Operating budget is presented in Table VII below.
Table VII Arlington Independent School District
Summary of General Operating Fund Budget
Fund
2014-2015 Original Budget
2013-2014 Original Budget
Change From 2013-14
Revenues & Other Resources $ 487,580,166 $ 480,508,102 $ 7,072,064 Expenditures & Other Uses 508,353,783 468,027,393 40,326,390 Budgeted Surplus/(Deficit) (20,773,617) 12,480,709 (33,254,326) Beginning Fund Balance 172,143,554* 156,291,281 15,852,273 Ending Fund Balance $ 151,369,937* $ 168,771,990* $ (17,402,053)
* Projected as of date the 2014-15 budget was adopted CONTACTING THE DISTRICT’S FINANCIAL MANAGEMENT This financial report is designed to provide our citizens, taxpayers, customers, investors and creditors with a general overview of the District’s finances and to show the District’s accountability for the money it receives. If you have questions about this report or need additional financial information, please contact the Finance Department at Arlington Independent School District, 1203 W. Pioneer Parkway, Arlington, Texas, 76013.

24
(This page intentionally left blank.)

25
BASIC FINANCIAL STATEMENTS

26
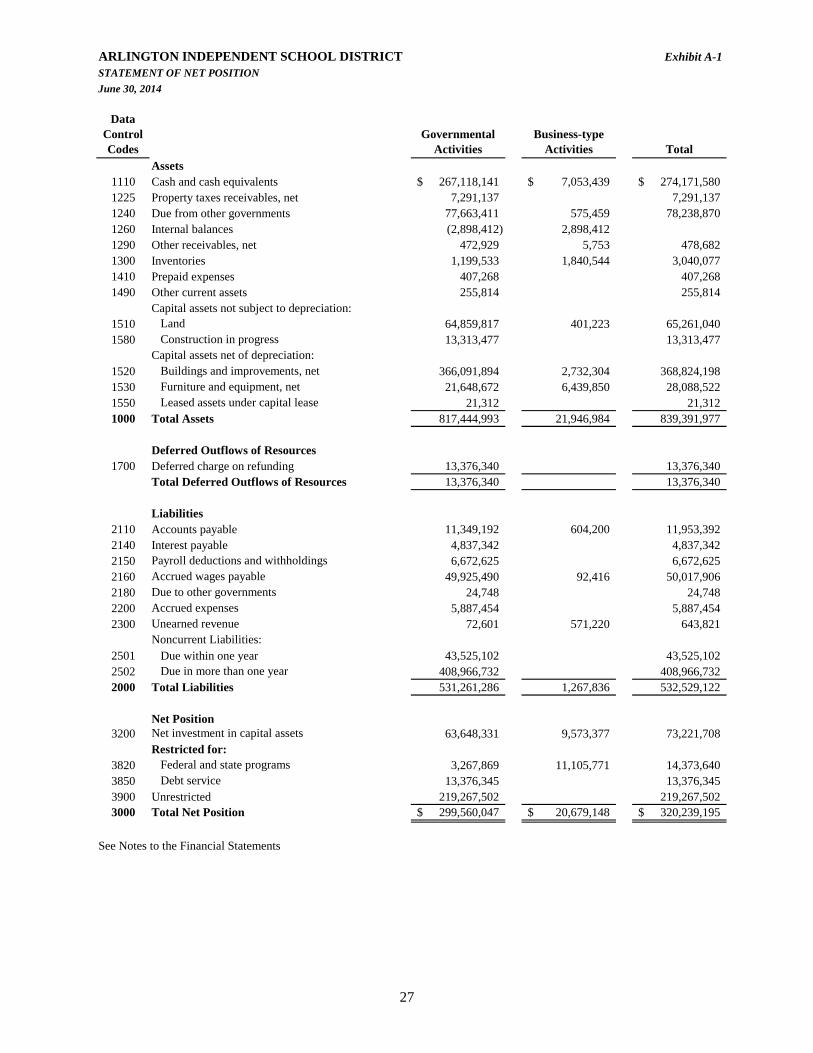
27
ARLINGTON INDEPENDENT SCHOOL DISTRICT Exhibit A-1STATEMENT OF NET POSITION
June 30, 2014
Data Control Codes
Governmental Activities
Business-type Activities Total
Assets1110 Cash and cash equivalents 267,118,141$ 7,053,439$ 274,171,580$ 1225 Property taxes receivables, net 7,291,137 7,291,137 1240 Due from other governments 77,663,411 575,459 78,238,870 1260 Internal balances (2,898,412) 2,898,412 1290 Other receivables, net 472,929 5,753 478,682 1300 Inventories 1,199,533 1,840,544 3,040,077 1410 Prepaid expenses 407,268 407,268 1490 Other current assets 255,814 255,814
Capital assets not subject to depreciation:1510 Land 64,859,817 401,223 65,261,040 1580 Construction in progress 13,313,477 13,313,477
Capital assets net of depreciation:1520 Buildings and improvements, net 366,091,894 2,732,304 368,824,198 1530 Furniture and equipment, net 21,648,672 6,439,850 28,088,522 1550 Leased assets under capital lease 21,312 21,312 1000 Total Assets 817,444,993 21,946,984 839,391,977
Deferred Outflows of Resources1700 Deferred charge on refunding 13,376,340 13,376,340
Total Deferred Outflows of Resources 13,376,340 13,376,340
Liabilities2110 Accounts payable 11,349,192 604,200 11,953,392 2140 Interest payable 4,837,342 4,837,342 2150 Payroll deductions and withholdings 6,672,625 6,672,625 2160 Accrued wages payable 49,925,490 92,416 50,017,906 2180 Due to other governments 24,748 24,748 2200 Accrued expenses 5,887,454 5,887,454 2300 Unearned revenue 72,601 571,220 643,821
Noncurrent Liabilities:2501 Due within one year 43,525,102 43,525,102 2502 Due in more than one year 408,966,732 408,966,732 2000 Total Liabilities 531,261,286 1,267,836 532,529,122
Net Position3200 Net investment in capital assets 63,648,331 9,573,377 73,221,708
Restricted for:3820 Federal and state programs 3,267,869 11,105,771 14,373,640 3850 Debt service 13,376,345 13,376,345 3900 Unrestricted 219,267,502 219,267,502 3000 Total Net Position 299,560,047$ 20,679,148$ 320,239,195$
See Notes to the Financial Statements

28
ARLINGTON INDEPENDENT SCHOOL DISTRICTSTATEMENT OF ACTIVITIES
For the Year Ended June 30, 2014
Data Control Codes Functions/Programs Expenses
Charges for Services
Operating Grants and
Contributions
Capital Grants and
ContributionsGovernmental activities:
11 Instruction 347,695,598$ 915,420$ 43,031,899$ $ 12 Instructional resources and media services 7,048,633 1,371,380 13 Curriculum and staff development 10,292,439 6,531,701 21 Instructional leadership 7,124,368 14,181 1,069,345 23 School leadership 27,253,780 1,494,544 31 Guidance, counseling, and evaluation services 25,530,501 3,763,085 32 Social work services 2,326,072 854,524 33 Health services 5,501,273 332,998 34 Student transportation 10,901,683 12,623 1,416,277 35 Food service 388,674 717,986 36 Extracurricular activities 9,412,633 638,644 292,688 41 General administration 7,033,855 312,439 51 Plant, maintenance and operations 51,447,854 1,133,962 1,087,457 52 Security and monitoring services 5,144,430 184,280 53 Data processing services 8,197,313 11,973 294,220 61 Community services 3,179,647 138,186 2,848,294 72 Interest on long-term debt 15,486,058 81 Facilities repairs and maintenance 1,413,049 95 Payments to Juvenile Justice Alternative
Education Programs 53,396
97 Payments to Tax Increment Fund 7,565,996 99 Intergovernmental charges 1,782,827 TG Total governmental activities 554,780,079 2,864,989 65,603,117
Business-type activities35 National School Breakfast and Lunch 30,208,241 6,197,429 25,902,286 273,272 TB Total business-type activities 30,208,241 6,197,429 25,902,286 273,272 TP Total primary government 584,988,320$ 9,062,418$ 91,505,403$ 273,272$
Data Control Codes
General revenuesTaxes:
MT Property taxes, levied for general purposes
DT Property taxes, levied for debt service
SF State-aid formula grants not restricted
GC Grants and contributions not restricted IE Investment earningsMI Miscellaneous
FR TransfersTR Total general revenues and transfers
CN Change in net position
NB Net position - beginning
NE Net position - ending
See Notes to the Financial Statements
Program Revenue

29
Exhibit B-1
Governmental Activities
Business-type Activities Total
(303,748,279)$ $ (303,748,279)$ (5,677,253) (5,677,253) (3,760,738) (3,760,738) (6,040,842) (6,040,842)
(25,759,236) (25,759,236) (21,767,416) (21,767,416)
(1,471,548) (1,471,548) (5,168,275) (5,168,275) (9,472,783) (9,472,783)
329,312 329,312 (8,481,301) (8,481,301) (6,721,416) (6,721,416)
(49,226,435) (49,226,435) (4,960,150) (4,960,150) (7,891,120) (7,891,120)
(193,167) (193,167) (15,486,058) (15,486,058)
(1,413,049) (1,413,049)
(53,396) (53,396) (7,565,996) (7,565,996) (1,782,827) (1,782,827)
(486,311,973) (486,311,973)
2,164,746 2,164,746 2,164,746 2,164,746
(486,311,973) 2,164,746 (484,147,227)
206,070,657 206,070,657
51,143,124 51,143,124 248,873,467 248,873,467
8,593,641 8,593,641 237,042 6,146 243,188
9,145,584 9,145,584 (79,552) 79,552
523,983,963 85,698 524,069,661
37,671,990 2,250,444 39,922,434
261,888,057 18,428,704 280,316,761
299,560,047$ 20,679,148$ 320,239,195$
Primary GovernmentNet (Expense) Revenue and Changes in Net Position

30
ARLINGTON INDEPENDENT SCHOOL DISTRICT
GOVERNMENTAL FUNDS
Data Control Codes General Fund
Debt Service Fund
Capital Projects Fund
Natural Gas Special Revenue
FundAssets
1110 Cash and cash equivalents 174,879,760$ 15,974,206$ 44,878,401$ 25,532,599$ 1120 Current investments
Receivables:1210 Property taxes receivable - current 3,086,802 1220 Property taxes receivable - delinquent 10,933,287 2,922,321 1230 Allowance for uncollectible taxes (credit) (8,080,232) (1,571,041) 1240 Receivables from other governments 67,454,649 393,775 1260 Due from other funds 4,654,736 495,425 149,072 1290 Other receivables 315,641 157,288 1300 Inventories, at cost 1,199,533 1410 Prepaid items 407,268 1490 Other current assets 5,814 1000 Total Assets 254,857,258$ 18,214,686$ 44,878,401$ 25,838,959$
Liabilities2110 Accounts payable 4,835,122$ 1,000$ 5,670,757$ 13,887$ 2150 Payroll deduction and withholdings 6,672,625 2160 Accrued wages payable 47,184,389 2170 Due to other funds 1,251,785 34,184 2180 Payable to other governments 2200 Accrued expenditures 1,801,940 2300 Unearned revenue - other 6,430 2000 Total Liabilities 61,752,291 1,000 5,704,941 13,887
Deferred Inflows of Resources2600 Unavailable revenue - property taxes 4,308,652 949,848
Total Deferred Inflows of Resources 4,308,652 949,848
Fund Balances:Non-Spendable:
3410 Inventories 1,199,533 3430 Prepaid items 407,268
Restricted:3450 Federal/State funds grant restrictions 3470 Capital acquisitions and contractual oblig. 30,150,719 3480 Retirement of long-term debt 17,263,838 3490 Texas High School Allotment 2,870,621
Committed: 3510 Construction 22,729,187 3545 Other committed 9,022,741 25,825,072
Assigned:3590 Other purposes 8,474,064 3600 Unassigned 153,115,642 3000 Total fund balances 188,796,315 17,263,838 39,173,460 25,825,072
4000
Total Liabilities, Deferred Inflows of Resources and Fund Balances 254,857,258$ 18,214,686$ 44,878,401$ 25,838,959$
See Notes to the Financial Statements.
June 30, 2014
BALANCE SHEET

31
Exhibit C-1
Total Nonmajor
Governmental Funds
Total Governmental
Funds
171,685$ 261,436,651$
3,086,802 13,855,608 (9,651,273)
9,814,987 77,663,411 549,993 5,849,226
472,929 1,199,533 407,268 5,814
10,536,665$ 354,325,969$
633,006$ 11,153,772$ 6,672,625
2,826,980 50,011,369 6,620,680 7,906,649
24,748 24,748 1,801,940
36,287 42,717 10,141,701 77,613,820
5,258,500 5,258,500
1,199,533 407,268
397,248 397,248
30,150,719 17,263,838 2,870,621
22,729,187 34,847,813
8,474,064
(2,284) 153,113,358 394,964 271,453,649
10,536,665$ 354,325,969$

32

33
ARLINGTON INDEPENDENT SCHOOL DISTRICT Exhibit C-2RECONCILIATION OF BALANCE SHEET FOR GOVERNMENTAL FUNDS TO
THE STATEMENT OF NET POSITION
Data Control Codes Total fund balance, governmental funds (from C-1) 271,453,649$
Amounts reported for governmental activities in the statement of net position (A-1) are different because:
1 Capital assets used in governmental activities are not financial resources and therefore are not reported as assets in governmental funds. Capital assets at historical cost, net of accumulated depreciation are reported in the governmental activities of the Statement of Net Position 465,935,172
2 Property taxes receivable have been levied and are due this year, but are not available soon enough to pay for the current period's expenditures, these property taxes (net of allowance for uncollectible accounts) are deferred in the fund financial statements. 5,228,616
3 Long-term liabilities, including bonds payable, are not due and payable in the current period, and therefore are not reported as liabilities in the funds. (443,952,836)
4 Addition of Internal Service Fund net position. 895,446
19 Net position of governmental activities 299,560,047$
See Notes to the Financial Statements.
June 30, 2014

34
ARLINGTON INDEPENDENT SCHOOL DISTRICTSTATEMENT OF REVENUES, EXPENDITURES, AND CHANGES
IN FUND BALANCE - GOVERNMENTAL FUNDS
For the Year Ended June 30, 2014
Data Control Codes General Fund
Debt Service Fund
Capital Projects Fund
Revenues5700 Local and intermediate sources 215,441,640$ 51,187,431$ 1,185,374$ 5800 State program revenues 270,883,707 5,395,126 5900 Federal program revenues 2,340,651 580,205 5020 Total revenues 488,665,998 57,162,762 1,185,374
ExpendituresCurrent:
0011 Instruction 293,466,343 12,792,167 0012 Instruction resources and media services 5,653,796 5,545 0013 Curriculum and staff development 3,663,403 0021 Instructional leadership 6,060,978 0023 School leadership 25,848,115 0031 Guidance, counseling and evaluation services 21,805,618 0032 Social work services 1,548,194 0033 Health services 5,180,936 0034 Student transportation 10,530,746 1,712,062 0035 Food services 0036 Extracurricular activities 8,801,478 258,604 0041 General administration 6,644,539 0051 Facilities maintenance and operations 42,184,227 7,946,307 0052 Security and monitoring services 4,966,857 235,547 0053 Data processing services 7,660,603 1,674,267 0061 Community services 343,827
Debt service:0071 Principal on long-term debt 801,319 40,820,000 0072 Interest on long-term debt 92,756 15,972,542 0073 Bond issuance costs and fees 289,950 195,239
Capital outlay:0081 Facilities acquistion and construction 1,938,117 15,364,748
Intergovernmental:0095 Payments to juvenile justice alt. ed. prgm. 53,396 0097 Payments to tax increment fund 7,565,996 0099 Other intergovernmental charges 1,782,827 6030 Total Expenditures 456,594,071 57,082,492 40,184,486 1100 Excess (deficiency) of revenues over expenditures 32,071,927 80,270 (38,999,112)
Other Financing Sources (Uses)7911 Issuance of bonds 72,020,000 16,180,000 7912 Sale of real or personal property 35,384 7914 Loan proceeds 433,107 7916 Premium or discount on issuance of bonds 6,426,528 1,654,930 8911 Transfers out 8949 Payment to Bond Refunding Escrow Agent (79,254,833) 7080 Total other financing sources and uses 433,107 (808,305) 17,870,314
1200 Net change in fund balances 32,505,034 (728,035) (21,128,798)
0100 Fund Balance - July 1 (Beginning) 156,291,281 17,991,873 60,302,258
3000 Fund Balance - June 30 (Ending) 188,796,315$ 17,263,838$ 39,173,460$
See Notes to the Financial Statements.

35
Exhibit C-3
Natural Gas Special
Revenue Fund
Total Nonmajor
Governmental Funds
Total Governmental
Funds
1,820,325$ 348,786$ 269,983,556$ 4,505,040 280,783,873 39,032,028 41,952,884
1,820,325 43,885,854 592,720,313
27,501,986 333,760,496 1,100,415 6,759,756 6,442,579 10,105,982 775,951 6,836,929 91,160 25,939,275 2,612,288 24,417,906 777,050 2,325,244 52,800 5,233,736 954,057 13,196,865 388,210 388,210 5,906 9,065,988
94,913 6,739,452 50,130,534 5,220 5,207,624 73,549 9,408,419 2,834,380 3,178,207
41,621,319 16,065,298 485,189
17,302,865
53,396 7,565,996 1,782,827
94,913 43,615,551 597,571,513 1,725,412 270,303 (4,851,200)
88,200,000 35,384 433,107 8,081,458 (79,552) (79,552) (79,254,833) (79,552) 17,415,564
1,725,412 190,751 12,564,364
24,099,660 204,213 258,889,285
25,825,072$ 394,964$ 271,453,649$
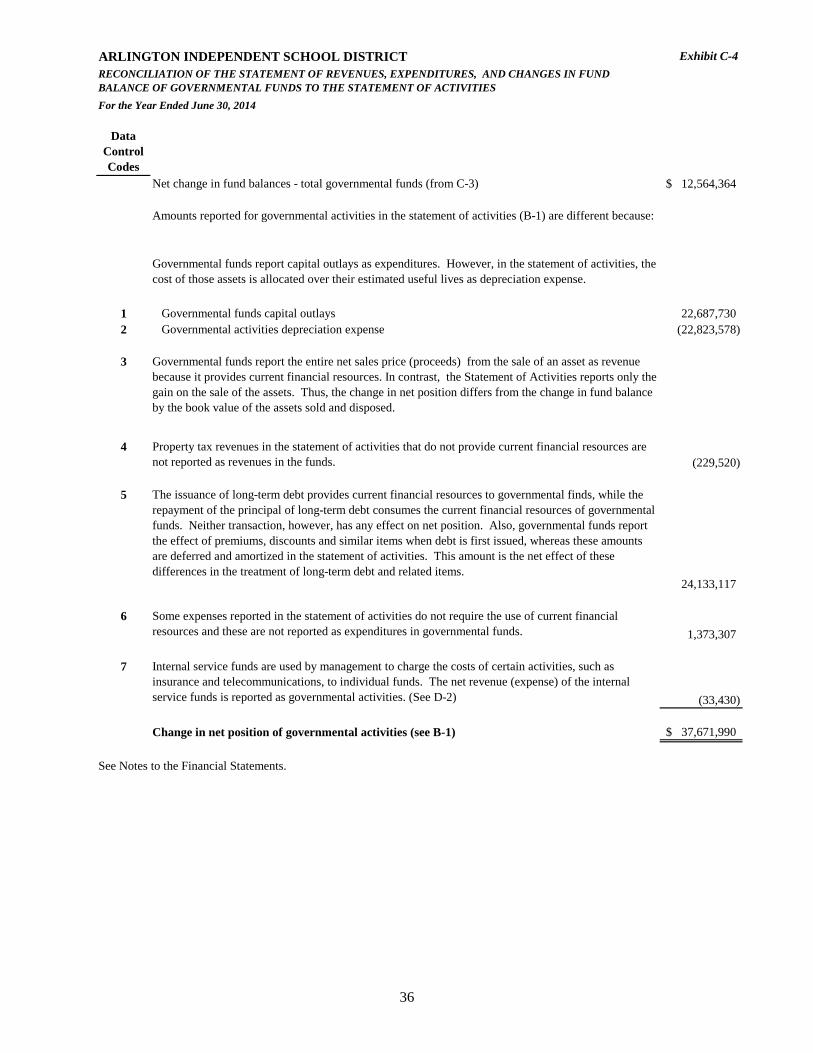
36
ARLINGTON INDEPENDENT SCHOOL DISTRICT Exhibit C-4
For the Year Ended June 30, 2014
Data Control Codes
Net change in fund balances - total governmental funds (from C-3) 12,564,364$
Amounts reported for governmental activities in the statement of activities (B-1) are different because:
Governmental funds report capital outlays as expenditures. However, in the statement of activities, the cost of those assets is allocated over their estimated useful lives as depreciation expense.
1 Governmental funds capital outlays 22,687,730 2 Governmental activities depreciation expense (22,823,578)
3 Governmental funds report the entire net sales price (proceeds) from the sale of an asset as revenue because it provides current financial resources. In contrast, the Statement of Activities reports only the gain on the sale of the assets. Thus, the change in net position differs from the change in fund balance by the book value of the assets sold and disposed.
4 Property tax revenues in the statement of activities that do not provide current financial resources are not reported as revenues in the funds. (229,520)
5 The issuance of long-term debt provides current financial resources to governmental finds, while the repayment of the principal of long-term debt consumes the current financial resources of governmental funds. Neither transaction, however, has any effect on net position. Also, governmental funds report the effect of premiums, discounts and similar items when debt is first issued, whereas these amounts are deferred and amortized in the statement of activities. This amount is the net effect of these differences in the treatment of long-term debt and related items.
24,133,117
6 Some expenses reported in the statement of activities do not require the use of current financial resources and these are not reported as expenditures in governmental funds. 1,373,307
7 Internal service funds are used by management to charge the costs of certain activities, such as insurance and telecommunications, to individual funds. The net revenue (expense) of the internal service funds is reported as governmental activities. (See D-2) (33,430)
Change in net position of governmental activities (see B-1) 37,671,990$
See Notes to the Financial Statements.
RECONCILIATION OF THE STATEMENT OF REVENUES, EXPENDITURES, AND CHANGES IN FUND BALANCE OF GOVERNMENTAL FUNDS TO THE STATEMENT OF ACTIVITIES

37
ARLINGTON INDEPENDENT SCHOOL DISTRICT Exhibit C-5STATEMENT OF REVENUES, EXPENDITURES, AND CHANGES IN FUND BALANCES -
ORIGINAL BUDGET, AMENDED FINAL (GAAP BASIS) AND ACTUAL - GENERAL FUND
For the Year Ended June 30, 2014
Budgeted Amounts
Data Control Codes Original Final
Actual Amounts, Budgetary Basis
Variance with Final Budget
Revenues5700 Local revenues 213,492,529$ 213,171,370$ 215,441,640$ 2,270,270$ 5800 State program revenues 258,864,240 254,930,907 270,883,707 15,952,800 5900 Federal program revenues 3,885,000 2,135,000 2,340,651 205,651 5000 Total revenues 476,241,769 470,237,277 488,665,998 18,428,721
ExpendituresCurrent:
0011 Instruction 300,022,210 292,777,174 293,466,343 (689,169) 0012 Instructional resources and media services 6,002,760 5,885,565 5,653,796 231,769 0013 Curriculum and staff development 4,692,498 4,059,446 3,663,403 396,043 0021 Instructional leadership 6,498,400 6,265,442 6,060,978 204,464 0023 School leadership 26,350,906 26,188,103 25,848,115 339,988 0031 Guidance, counseling and evaluation services 21,761,181 21,927,109 21,805,618 121,491 0032 Social work services 1,686,339 1,721,219 1,548,194 173,025 0033 Health services 5,262,903 5,269,338 5,180,936 88,402 0034 Student transportation 10,550,111 10,677,213 10,530,746 146,467 0036 Extracurricular activities 9,699,607 9,016,252 8,801,478 214,774 0041 General administration 7,701,397 7,486,083 6,644,539 841,544 0051 Facilities maintenance and operations 46,301,528 45,212,950 42,184,227 3,028,723 0052 Security and monitoring services 5,036,754 5,313,921 4,966,857 347,064 0053 Data processing services 8,378,918 8,526,356 7,660,603 865,753 0061 Community services 323,153 448,598 343,827 104,771
Debt Service:0071 Principal on long-term debt 889,866 937,946 801,319 136,627 0072 Interest on long-term debt 92,756 (92,756)
Capital Outlay:0081 Facilities acquisition and construction 793,514 2,807,167 1,938,117 869,050
Intergovernmental:0095 Payments to Juvenile Justice Alt. Ed. Prgm. 180,000 180,000 53,396 126,604 0097 Payments to tax increment fund 4,142,264 7,642,264 7,565,996 76,268 0099 Other governmental charges 1,753,084 1,788,084 1,782,827 5,257 6030 Total Expenditures 468,027,393 464,130,230 456,594,071 7,536,159 1100 Excess (deficiency) of revenues over
expenditures 8,214,376 6,107,047 32,071,927 25,964,880
Other Financing Sources (Uses):7914 Loan proceeds 4,266,333 1,266,333 433,107 (833,226) 7080 Total other financing sources (uses) 4,266,333 1,266,333 433,107 (833,226)
1200 Net change in fund balances 12,480,709 7,373,380 32,505,034 25,131,654 0100 Fund balances - beginning 156,291,281 156,291,281 156,291,281 3000 Fund balances - ending 168,771,990$ 163,664,661$ 188,796,315$ 25,131,654$
See Notes to the Financial Statements.

38
ARLINGTON INDEPENDENT SCHOOL DISTRICT Exhibit D-1STATEMENT OF NET POSITION
PROPRIETARY FUNDS
June 30, 2014
Enterprise FundInternal Service
Funds
AssetsCurrent assets:
Cash and cash equivalents 7,053,439$ 5,681,490$ Receivables:
Due from other governments 575,459 Due from other funds 2,981,273 57,295 Other receivables 5,753
Inventories, at cost 1,840,544 Other current assets 250,000
Total current assets 12,456,468 5,988,785
Capital assets:Land 401,223 Building and improvements 4,042,172 Furniture and equipment 11,066,306 Accumulated depreciation (5,936,324)
Total non-current assets 9,573,377 Total Assets 22,029,845 5,988,785
LiabilitiesCurrent Liabilities:
Accounts payable 604,200 109,540 Accrued wages payable 92,416 Due to other funds 981,145 Accrued expenses 4,085,514 Unearned revenue 571,220
Total current liabilities 1,267,836 5,176,199 Total Liabilities 1,267,836 5,176,199
Net PositionInvestment in capital assets 9,573,377 Restricted for food service 11,188,632 Unrestricted 812,586 Total Net Position 20,762,009$ 812,586$
Adjustment to reflect the consolidation of internal servicefund activities related to enterprise funds (83,021)
Net position of business-type activities 20,678,988$
See Notes to the Financial Statements
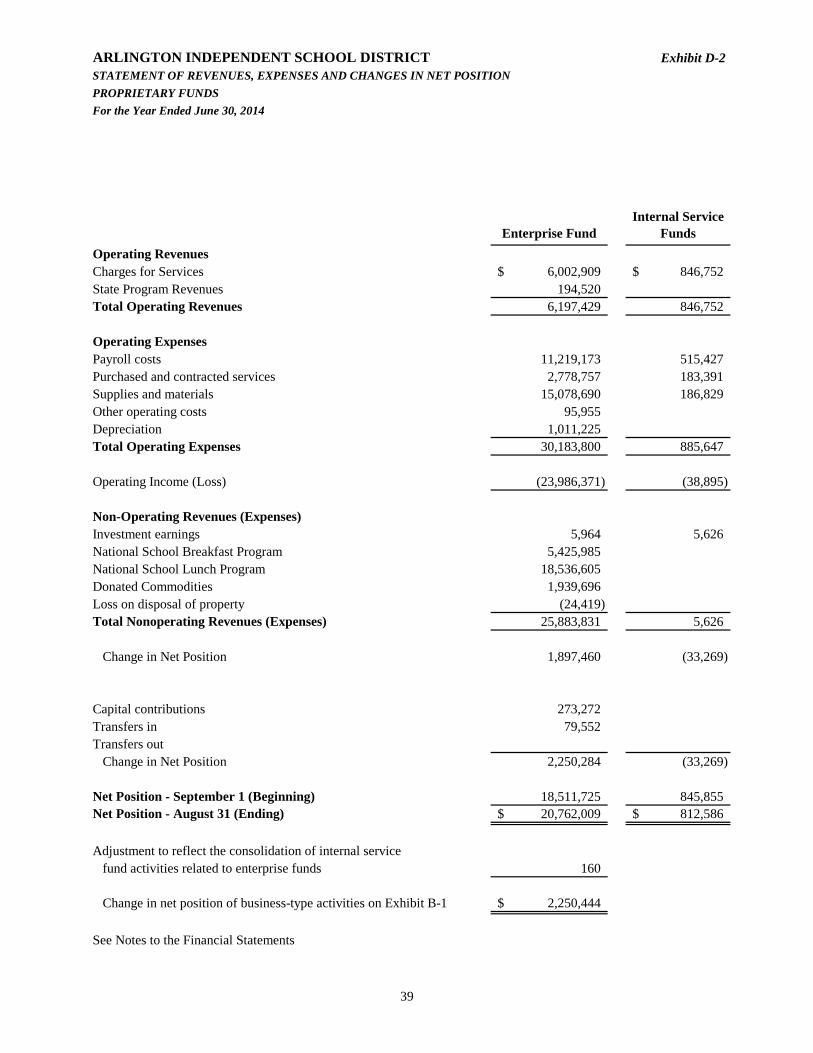
39
ARLINGTON INDEPENDENT SCHOOL DISTRICT Exhibit D-2STATEMENT OF REVENUES, EXPENSES AND CHANGES IN NET POSITION
PROPRIETARY FUNDS
For the Year Ended June 30, 2014
Enterprise FundInternal Service
Funds
Operating RevenuesCharges for Services 6,002,909$ 846,752$ State Program Revenues 194,520 Total Operating Revenues 6,197,429 846,752
Operating ExpensesPayroll costs 11,219,173 515,427 Purchased and contracted services 2,778,757 183,391 Supplies and materials 15,078,690 186,829 Other operating costs 95,955 Depreciation 1,011,225 Total Operating Expenses 30,183,800 885,647
Operating Income (Loss) (23,986,371) (38,895)
Non-Operating Revenues (Expenses)Investment earnings 5,964 5,626 National School Breakfast Program 5,425,985 National School Lunch Program 18,536,605 Donated Commodities 1,939,696 Loss on disposal of property (24,419) Total Nonoperating Revenues (Expenses) 25,883,831 5,626
Change in Net Position 1,897,460 (33,269)
Capital contributions 273,272 Transfers in 79,552 Transfers out
Change in Net Position 2,250,284 (33,269)
Net Position - September 1 (Beginning) 18,511,725 845,855 Net Position - August 31 (Ending) 20,762,009$ 812,586$
Adjustment to reflect the consolidation of internal servicefund activities related to enterprise funds 160
Change in net position of business-type activities on Exhibit B-1 2,250,444$
See Notes to the Financial Statements

40
ARLINGTON INDEPENDENT SCHOOL DISTRICT Exhibit D-3STATEMENT OF CASH FLOWS
PROPRIETARY FUNDS
For The Year Ended June 30, 2014
Enterprise Fund
Governmental Activities -
Internal Service Funds
Cash Flows from Operating Activities:Cash received from customers 6,015,940$ 1,501,558$ Cash received from outside sources 194,520 Cash payments for insurance claims (1,303,231) Cash payments to suppliers for goods and services (13,246,485) (234,010) Cash payments to suppliers for other operating expenses (2,642,489) Cash payments to employees (11,182,824) (186,829)
Net Cash Provided by (Used for) Operating Activities (20,861,338) (222,512)
Cash Flows from Non-Capital Financing Activities:Advances from other funds 79,552 Federal and state assistance - Food service and related 23,805,465
Net Cash Provided by Non-Capital Financing Activities 23,885,017
Cash Flows from Capital and Related Financing Activities:Capital contributions 273,272 Acquisition of capital assets (2,577,422)
Net Cash (Used for) Capital and Related Financing Activities (2,304,150)
Cash Flows from Investing Activities:Interest on investments 5,964 5,626
Net Cash Provided by (Used for) Investing Activities 5,964 5,626
Net Increase in Cash and Cash Equivalents 725,493 (216,886) Cash and Cash Equivalents at Beginning of Year 6,327,946 5,898,376 Cash and Cash Equivalents at End of Year 7,053,439$ 5,681,490$
Reconciliation to Balance SheetCash and Cash Equivalents Per Cash Flow 7,053,439$ 5,681,490
Cash and Cash Equivalents per Balance Sheet 7,053,439$ 5,681,490$
Reconciliation of Operating Income to Net CashProvided by Operating Activities:Operating (Loss) (23,986,371)$ (38,895)$ Adjustments to Reconcile Operating Income to Net Cash
Provided by Operating Activities:Depreciation 1,011,225 Donated commodities 1,939,696
Change in Assets and Liabilities:(Increase) in Receivables 13,031 Decrease in Interfund Receivables (75,718) (11,660) (Increase) in Inventories (195,093) Increase in Accounts Payable 307,941 (25,248) Increase in Accrued Wages Payable 36,349 Increase in Interfund Payables 666,466 (Decrease) in Accrued Expenses (813,175) (Decrease) in Unearned Revenue 87,602
Net Cash Provided by (Used for) Operating Activities (20,861,338)$ (222,512)$
Supplemental information:Non-cash transaction - Donated commodities received 1,939,696$ $
Total non-cash transactions 1,939,696$ $
See Notes to the Financial Statements

41
ARLINGTON INDEPENDENT SCHOOL DISTRICT Exhibit E-1STATEMENT OF FIDUCIARY ASSETS AND LIABILITIESAGENCY FUNDJune 30, 2014
AssetsCash and cash equivalents 4,431,623$ Total Assets 4,431,623$
LiabilitiesAccounts payable 124,638$ Due to student groups 4,306,985Total Liabilities 4,431,623$
See Notes to the Financial Statements

ARLINGTON INDEPENDENT SCHOOL DISTRICT Exhibit F-1 NOTES TO THE FINANCIAL STATEMENTS
42
I. SUMMARY OF SIGNIFICANT ACCOUNTING POLICIES Arlington Independent School District (“District”) is a public education agency operating under the applicable laws and regulations of the State of Texas. The District prepares its basic financial statements in conformity with generally accepted accounting principles promulgated by the Governmental Accounting Standards Board (“GASB”) and other authoritative sources identified in Statement on Auditing Standards No. 69 of the American Institute of Certified Public Accountants; and it complies with the requirements of the appropriate version of the Financial Accountability System Resource Guide, issued by the Texas Education Agency (“TEA”), and the requirements of contracts and grants of agencies from which it receives funds. A. Reporting Entity The Board of Trustees (“Board”), a seven member group, has governance responsibilities over all activities related to public elementary and secondary education in the City of Arlington and portions of the Cities of Grand Prairie and Dalworthington Gardens, and the Town of Pantego. Because members of the Board are elected by the public, they have the authority to make decisions, appoint administrators and managers, and significantly influence operations; and they have primary accountability for fiscal matters. The District is not included in any other governmental “reporting entity” as defined by GASB Statement No. 61, The Financial Reporting Entity: Omnibus; an amendment of GASB Statements No. 14 and No. 34.” The District is not financially accountable for any other organizations; therefore, no component units are included within the reporting entity. The District receives funding from local, state, and federal government sources and must comply with the requirements of these funding entities. B. Government-wide and Fund Financial Statements The government-wide financial statements (i.e., the statement of net position and the statement of activities) report information on all of the nonfiduciary activities of the District. For the most part, the effect of interfund activity has been removed from these statements. Governmental activities, which normally are supported by taxes and intergovernmental revenues, are reported separately from business-type activities, which rely to a significant extent on fees and charges for support. The statement of activities demonstrates the degree to which the direct expenses of a given function or given segment are offset by program revenues. Direct expenses are those that are clearly identifiable with a specific function or segment. Program revenues include 1) charges to customers who purchase, use or directly benefit from goods, services, or privileges provided by a given function or segment and 2) grants and contributions that are restricted to meeting the operational or capital requirements of a particular function or segment. Taxes and other items not properly included among program revenues are reported instead as general revenues. Interfund activities between governmental funds, and between governmental funds and proprietary funds, appear in the governmental and proprietary fund financial statements. However, all interfund transactions between governmental funds have been eliminated on the government-wide statements. Interfund transactions between governmental funds and internal service funds have not been eliminated to the extent that services have been provided and used. Interfund transactions remain in the government-wide statements for activities between governmental funds and proprietary funds. Separate financial statements are provided for governmental funds, proprietary funds, and fiduciary funds, even though the latter are excluded from the government-wide financial statements. Major individual governmental funds and major individual enterprise funds are reported as separate columns in the fund financial statements.
ARLINGTON INDEPENDENT SCHOOL DISTRICT Exhibit F-1 NOTES TO THE FINANCIAL STATEMENTS (continued)
43
B. Government-wide and Fund Financial Statements (continued) Major Governmental Funds General Fund - The General Fund is the District’s general operating fund. It is used to account for all financial transactions except those required to be accounted for in another fund. Major revenue sources include local property taxes and state funding under the Foundation School Program. Expenditures include all costs associated with the daily operations of the schools except for costs incurred by programs accounted for in the Special Revenue Funds, Capital Projects Fund, Debt Service Fund, and Proprietary Funds. The General Fund is a budgeted fund, and any fund balances are considered resources available for current operations. Debt Service Fund - The Debt Service Fund, which is a budgeted fund, accounts for the resources accumulated and payments made on long-term general obligation debt of government funds. Revenues include collections on general property taxes, state funding under the Instructional Facilities and Existing Debt Allotments, and earnings on investments of the fund. Expenditures of the fund are for retirement of bond principal and payment of interest on bonded debt. The fund balance represents amounts that will be used for retirement of bonds and payment of interest in the future. Capital Projects Fund - The Capital Projects Fund accounts for all proceeds of bond issues and earnings on investments of the fund. Revenue from the sale of bonds is used for acquiring school sites, constructing and equipping new school facilities, renovating existing facilities, and replacing transportation, technology, and various other equipment. This is a budgeted fund. Natural Gas Special Revenue Fund - During recent years, the District has engaged in leasing the mineral rights to its various properties for the extraction of natural gas. This activity has resulted in a significant inflow of contract signing bonuses and royalty payments for the District. During the year ended August 31, 2011, the Board of Trustees committed these inflows for future special projects Major Proprietary Funds Enterprise Fund - The Enterprise Fund, which is a budgeted fund, accounts for the food service operation that is financed and operated in a manner similar to a private business, where the determination of net income is necessary or useful for sound financial administration. The cost of providing meals to the student population and other outside groups is recovered primarily through meal charges and reimbursements from the federal government. Internal Service Fund - The Internal Service Fund accounts for the management of the District’s Print Shop and worker’s compensation insurance. The cost of these activities are allocated to the other funds of the District on a cost reimbursement basis. These are not budgeted funds. Fiduciary Fund Agency Fund - The Agency Fund, which is an unbudgeted fund, accounts for the activities of student groups. The student activity funds account for monies collected principally through fund-raising efforts of the students and District-sponsored student groups. Collections and disbursements of these funds are generally controlled by the student group itself under the supervision of a member of the professional staff. These funds have no equity, assets are equal to liabilities, and the funds do not include revenues and expenditures for general operations of the District. The District’s main involvement with these funds is to provide stewardship by accounting for the funds.

ARLINGTON INDEPENDENT SCHOOL DISTRICT Exhibit F-1 NOTES TO THE FINANCIAL STATEMENTS (continued)
44
C. Measurement Focus, Basis of Accounting, and Financial Statement Presentation The government-wide financial statements are reported using the economic resources measurement focus and the accrual basis of accounting, as are the proprietary fund financial statements. Revenues are recorded when earned and expenses are recorded when a liability is incurred, regardless of the timing of related cash flows. Property taxes are recognized as revenues in the year for which they are levied. Grants and similar items are recognized as revenue as soon as all eligibility requirements imposed by the provider have been met. The governmental fund financial statements are reported using the current financial resources measurement focus and the modified accrual basis of accounting. Revenues are recognized as soon as they are both measurable and available. Revenues are considered to be available when they are collected within the current period or soon enough thereafter to pay liabilities of the current period. For this purpose, the government considers revenues to be available if they are collected within 60 days of the end of the current fiscal period. Revenues susceptible to accrual are principally certain inter-governmental revenues, property taxes and investment income. Expenditures generally are recorded when a liability is incurred, as under accrual accounting. However, debt service expenditures, as well as expenditures related to compensated absences and claims and judgments, are recorded only when payment is due. Funds received from federal, state and other grants designated for payment of specific District expenditures are considered to be earned to the extent of expenditures made under the provisions of the grant. Accordingly, when such funds are received, they are recorded as unearned revenues until related and authorized expenditures have been made. If balances have not been expended by the end of the project period, grantors sometimes require the District to refund all or part of the unused amount. The proprietary fund types are accounted for on an economic resources measurement focus. Operating revenues and expenses are distinguished from nonoperating items. Operating revenues and expenses generally result from providing services and producing and delivering goods in connection with a proprietary fund’s principal ongoing operations. Operating expenses for enterprise funds and internal service funds include the cost of sales and services, administrative expenses, and depreciation on capital assets. All revenues and expenses not meeting this definition are reported as nonoperating revenues and expenses. The agency fund has no measurement focus but utilizes the accrual basis of accounting for reporting its assets and liabilities. Management’s Use of Estimates The preparation of financial statements in conformity with accounting principles generally accepted in the United States of America requires management to make estimations and assumptions that affect the reported amounts of assets and liabilities at the date of the financial statements and the reported amounts of revenues and expenditures during the reporting period. Actual results could differ from those estimates. D. Assets, Liabilities, Deferred Outflows/Inflows and Net Position or Fund Balances 1. Cash and cash equivalents The District’s cash and cash equivalents are considered to be cash on hand, demand deposits, and short-term investments with original maturities of three months or less from date of acquisition. Investments for the District are reported at fair value.
ARLINGTON INDEPENDENT SCHOOL DISTRICT Exhibit F-1 NOTES TO THE FINANCIAL STATEMENTS (continued)
45
D. Assets, Liabilities, Deferred Outflows/Inflows and Net Position or Fund Balances (continued) 2. Receivables and payables Interfund activity results from loans, services provided, reimbursements or transfers between funds. Loans are reported as interfund receivables and payables as appropriate and are subject to elimination upon consolidation. Services provided, deemed to be at market or near market rates, are treated as revenues and expenditures or expenses. Reimbursements occur when one fund incurs a cost, charges the appropriate benefiting fund and reduces its related cost as a reimbursement. All other interfund transactions are treated as transfers. Transfers in and transfers out are netted and presented as a single “transfers” line on the government-wide statement of activities. Similarly, interfund receivables and payables are netted and presented as a single “internal balances” line of the government-wide statement of net position. Property taxes are levied each year by October 1 based upon property valuations as of January 1. Taxes are due on receipt of the tax bill and are delinquent if not paid before February 1 of the year following the year in which imposed. On January 1 of each year, a tax lien attaches to property to secure the payment of all taxes, penalties, and interest ultimately imposed. Tax collections are prorated between the General Fund and Debt Service Fund based on the tax rate adopted by the Board. The District is permitted under the Texas Education Code to levy taxes up to $1.17 per $100 of assessed valuation for general governmental services other than debt service on general obligation bonds. The tax rate which may be levied to service general obligation bonds is not limited. For the current fiscal year, the Board of Trustees set tax rates applicable to general governmental services and to debt service of $1.04 per $100 valuation and $0.252 per $100 valuation, respectively, based on a net assessed valuation of $20,220,917,724. Delinquent property tax receivables are prorated between the General Fund and Debt Service Fund based on rates adopted for the year of the levy. Allowance for uncollectible tax receivables is based on historical experience in collecting property taxes. Management periodically reviews outstanding property taxes and establishes an allowance adequate to reflect the anticipated net collectible balance. The District is prohibited from writing off property taxes without specific statutory authority from the Texas Legislature. The property tax receivable allowance is equal to 57.0% of total outstanding property taxes at June 30, 2014. 3. Inventories and prepaid items In the General Fund, inventory is valued at cost, using the weighted-average method. A computerized inventory system automatically updates inventory values. This valuation is not materially different from the first-in, first-out valuation method. Inventories consist of expendable supplies held for consumption. The cost is recorded as an expenditure at the time individual inventory items are consumed rather than when purchased. In the General Fund, certain payments to vendors reflect costs applicable to future accounting periods and are recorded as prepaid expenses in the government-wide and fund financial statements. The cost of prepaid items is recorded as expenditures/ expenses when consumed rather than when purchased. In the Enterprise Fund, inventory is valued at cost, using the weighted-average method, except for food commodities, which are recorded at market values supplied by the Texas Department of Human Services. Commodities are received at no cost to the District; however, their fair market value is recorded as inventory and unearned revenue when received. As the commodities are consumed, inventory and unearned revenue are relieved, expenditures are charged, and revenue is recognized for an equal amount.

ARLINGTON INDEPENDENT SCHOOL DISTRICT Exhibit F-1 NOTES TO THE FINANCIAL STATEMENTS (continued)
46
D. Assets, Liabilities, Deferred Outflows/Inflows and Net Position or Fund Balances (continued) 4. Capital assets Capital assets, which include property, plant, and equipment, are reported in the applicable governmental or business-type activities columns in the government-wide financial statements. The District does not have any public domain (“infrastructure”) capital assets. Capital assets are defined by the District as assets with an initial, individual cost of more than $5,000 and an estimated useful life of two years or more. The cost of normal maintenance and repairs that do not add to the value of the asset or materially extend asset lives, as well as the cost of land, are not depreciated. Capital assets are depreciated over the estimated useful lives of the assets on a straight-line basis over the following estimated useful lives:
Buildings and improvements 20-40 years Furniture and equipment 5-12 years
All capital assets are valued at historical cost or estimated historical cost if actual historical cost is not available. Donated capital assets are valued at their estimated fair market value on the date donated. 5. Long-term obligations In the government-wide financial statements and proprietary fund types in the fund financial statements, long-term debt and other long-term obligations are reported as liabilities in the applicable governmental activities, business-type activities, or proprietary fund type statement of net position. Bond premiums and discounts are deferred and amortized over the life of the bonds using the appropriate effective interest and straight-line methods. In the fund financial statements, governmental fund types recognize bond premiums and discounts, as well as issuance costs, during the current period. The face amount of debt issued is reported as other financing sources. Premiums received on debt issuances are reported as other financing sources while discounts on debt issuances are reported as other financing uses. Issuance costs, whether or not withheld from the actual debt proceeds received, are reported as debt service expenditures. 6. Accrued service benefits Accrued service benefits are accrued as a liability in the government-wide financial statements. Eligibility for accrued service benefits for the employees of the Arlington Independent School District is determined by length of continuous service with the District and approval for retirement benefits under provisions of the Teacher Retirement System of Texas. Benefits are available to employees hired before January 1, 1985, and are based on years of experience with the District, accumulated eligible local sick leave days and accumulated ineligible local sick leave days.
7. Compensated absences All administrative and full-time hourly employees of the District receive up to three weeks of vacation each calendar year. If the employee does not use the vacation time by December 31 of the following year, it is lost and may not be carried forward. Employees may accumulate as many as fifty days of local personal leave, which can be carried forward from year to year. The time is forfeited if not used before the employee leaves the District. Therefore, no accrual for compensated absences is included in the accompanying financial statements.

ARLINGTON INDEPENDENT SCHOOL DISTRICT Exhibit F-1 NOTES TO THE FINANCIAL STATEMENTS (continued)
47
D. Assets, Liabilities, Deferred Outflows/Inflows and Net Position or Fund Balances (continued) 8. Deferred outflows/inflows of resources In addition to assets, the statement of financial position will sometimes report a separate section for deferred outflows of resources. This separate financial statement element, deferred outflows of resources, represents a consumption of net position that applies to a future period(s) and so will not be recognized as an outflow of resources (expense/ expenditure) until then. The District only has one item that qualifies for reporting in this category. It is the deferred charge on refunding reported in the government-wide statement of net position. A deferred charge on refunding results from the difference in the carrying value of refunded debt and its reacquisition price. This amount is deferred and amortized over the shorter of the life of the refunded or refunding debt. In addition to liabilities, the statement of financial position will sometimes report a separate section for deferred inflows of resources. This separate financial statement element, deferred inflows of resources, represents an acquisition of net position that applies to a future period(s) and so will not be recognized as an inflow of resources (revenue) until that time. The District has only one type of item, which arises only under a modified accrual basis of accounting, that qualifies for reporting in this category. Accordingly, the item, unavailable revenue, is reported only in the governmental funds balance sheet. The governmental funds report unavailable revenues from property taxes. These amounts are deferred and recognized as an inflow of resources in the period that the amounts become available. 9. Net position and fund balances Net position on the Statement of Net Position include the following:
Net investment in capital assets – the component of net position that reports capital assets less both the accumulated depreciation and the outstanding balance of debt and is directly attributable to the acquisition, construction, or improvement of these capital assets. Restricted for federal and state programs – the component of net position that reports the difference between assets and liabilities related to federal and state programs that consist of assets with constraints placed on their use by granting agencies. Restricted for debt service – the component of net position that reports the difference between assets, deferred inflows of resources and liabilities adjusted on a government-wide basis that consists of assets with constraints placed on their use by the bond covenants. Unrestricted net position – the difference between the assets, deferred inflows of resources and liabilities that are not reported in net position net investment in capital assets, or restricted net position. Net position flow assumption - Sometimes the District will fund outlays for a particular purpose from both restricted (e.g., restricted bond or grant proceeds) and unrestricted resources. In order to calculate the amounts to report as restricted - net position and unrestricted -net position in the government-wide and proprietary fund financial statements, a flow assumption must be made about the order in which the resources are considered to be applied. It is the District's policy to consider restricted- net position to have been depleted before unrestricted- net position is applied.

ARLINGTON INDEPENDENT SCHOOL DISTRICT Exhibit F-1 NOTES TO THE FINANCIAL STATEMENTS (continued)
48
D. Assets, Liabilities, Deferred Outflows/Inflows and Net Position or Fund Balances (continued) In the fund financial statements, governmental funds report fund balances as either a non-spendable fund balance or a spendable fund balance. Non-spendable Fund Balance Non-spendable fund balance is that portion of fund balance that is not expendable. Examples of non-spendable fund balance include inventories and prepaid items. Spendable Fund Balance Spendable fund balance includes restricted, committed, assigned, and unassigned components. These components can be described as follows:
Restricted fund balance – the component of the spendable fund balance constrained to a specific purpose by a provider, such as a creditor, grantor, contributor, or law or regulation of other governments. Restricted fund balance includes funds for debt service, construction programs, and resources from other granting agencies.
Committed Fund Balance – the component of the spendable fund balance constrained to a specific purpose by Board. A Board resolution is required to establish, modify, or rescind a fund balance commitment. Only the action that constitutes the most binding constraint of the Board can be considered a commitment for fund balance classification purposes. The Board has committed the funds in the natural gas fund ($25,825,072) and construction fund revenues and other resources generated through transactions other than bond issues ($9,022,741). The District has also committed 100% of the ending fund balance in the campus activity fund for use by the respective campuses. Assigned Fund Balance – the component of the spendable fund balance that is spendable or available for appropriation but has been tentatively earmarked for some specific purpose by the Superintendent. Board Policy CE (Local) was amended in August 2011 by the Board of Trustees to provide the Superintendent with this authorization. The District has assigned fund balance in the amount of $8,474,064 for general fund encumbrances. Unassigned Fund Balance – the component of the spendable fund balance which may be spent for any legal purpose. This portion of the total fund balance in the general fund is available to finance operating expenditures.
The District strives to maintain an unassigned fund balance in the general fund equal to a minimum of 16.67% of the District's general fund operating expenditures. In the event that unassigned fund balance falls below the target level, the Board shall, within 24 months, adopt a plan to restore this balance to the target level. Fund balance flow assumptions - Sometimes the government will fund outlays for a particular purpose from both restricted and unrestricted resources (the total of committed, assigned, and unassigned fund balance). In order to calculate the amounts to report as restricted, committed, assigned, and unassigned fund balance in the governmental fund financial statements a flow assumption must be made about the order in which the resources are considered to be applied. It is the government's policy to consider restricted fund balance to have been depleted before using any of the components of unrestricted fund balance. Further, when the components of unrestricted fund balance can be used for the same purpose, committed fund balance is depleted first, followed by assigned fund balance. Unassigned fund balance is applied last.
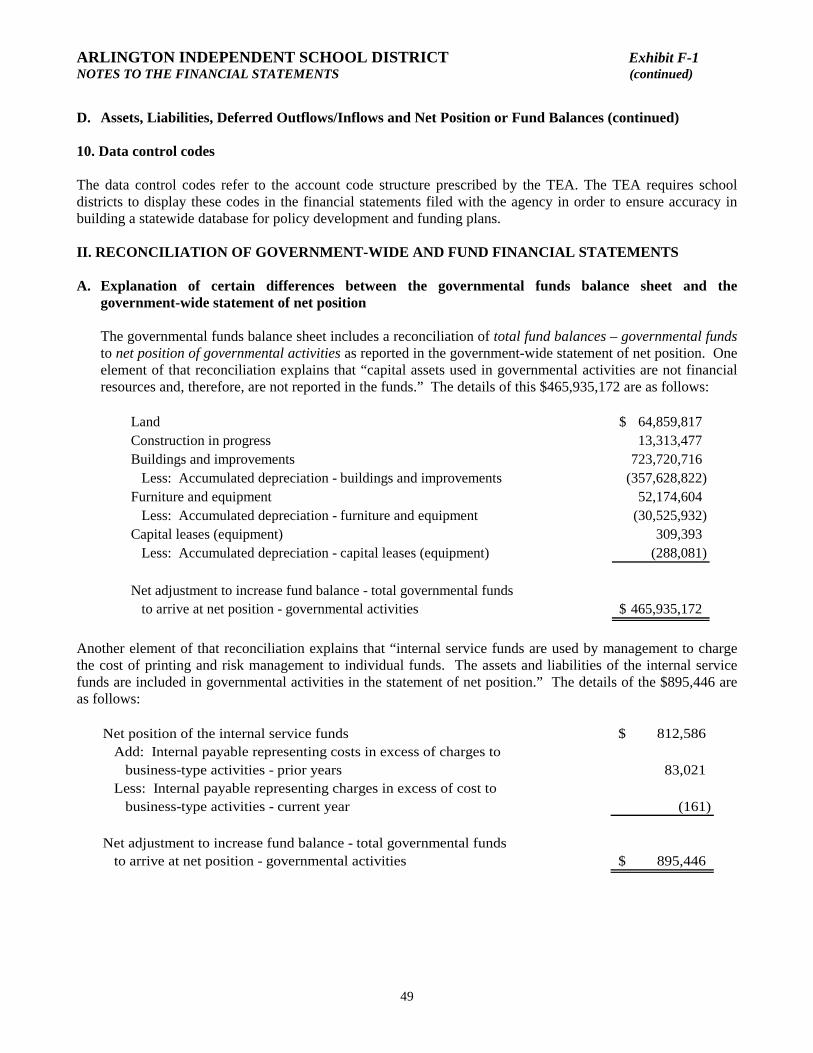
ARLINGTON INDEPENDENT SCHOOL DISTRICT Exhibit F-1 NOTES TO THE FINANCIAL STATEMENTS (continued)
49
D. Assets, Liabilities, Deferred Outflows/Inflows and Net Position or Fund Balances (continued) 10. Data control codes The data control codes refer to the account code structure prescribed by the TEA. The TEA requires school districts to display these codes in the financial statements filed with the agency in order to ensure accuracy in building a statewide database for policy development and funding plans. II. RECONCILIATION OF GOVERNMENT-WIDE AND FUND FINANCIAL STATEMENTS A. Explanation of certain differences between the governmental funds balance sheet and the
government-wide statement of net position
The governmental funds balance sheet includes a reconciliation of total fund balances – governmental funds to net position of governmental activities as reported in the government-wide statement of net position. One element of that reconciliation explains that “capital assets used in governmental activities are not financial resources and, therefore, are not reported in the funds.” The details of this $465,935,172 are as follows:
Land 64,859,817$ Construction in progress 13,313,477Buildings and improvements 723,720,716
Less: Accumulated depreciation - buildings and improvements (357,628,822)Furniture and equipment 52,174,604
Less: Accumulated depreciation - furniture and equipment (30,525,932)Capital leases (equipment) 309,393
Less: Accumulated depreciation - capital leases (equipment) (288,081)
Net adjustment to increase fund balance - total governmental fundsto arrive at net position - governmental activities 465,935,172$
Another element of that reconciliation explains that “internal service funds are used by management to charge the cost of printing and risk management to individual funds. The assets and liabilities of the internal service funds are included in governmental activities in the statement of net position.” The details of the $895,446 are as follows:
Net position of the internal service funds 812,586$ Add: Internal payable representing costs in excess of charges to
business-type activities - prior years 83,021Less: Internal payable representing charges in excess of cost to
business-type activities - current year (161)
Net adjustment to increase fund balance - total governmental fundsto arrive at net position - governmental activities 895,446$
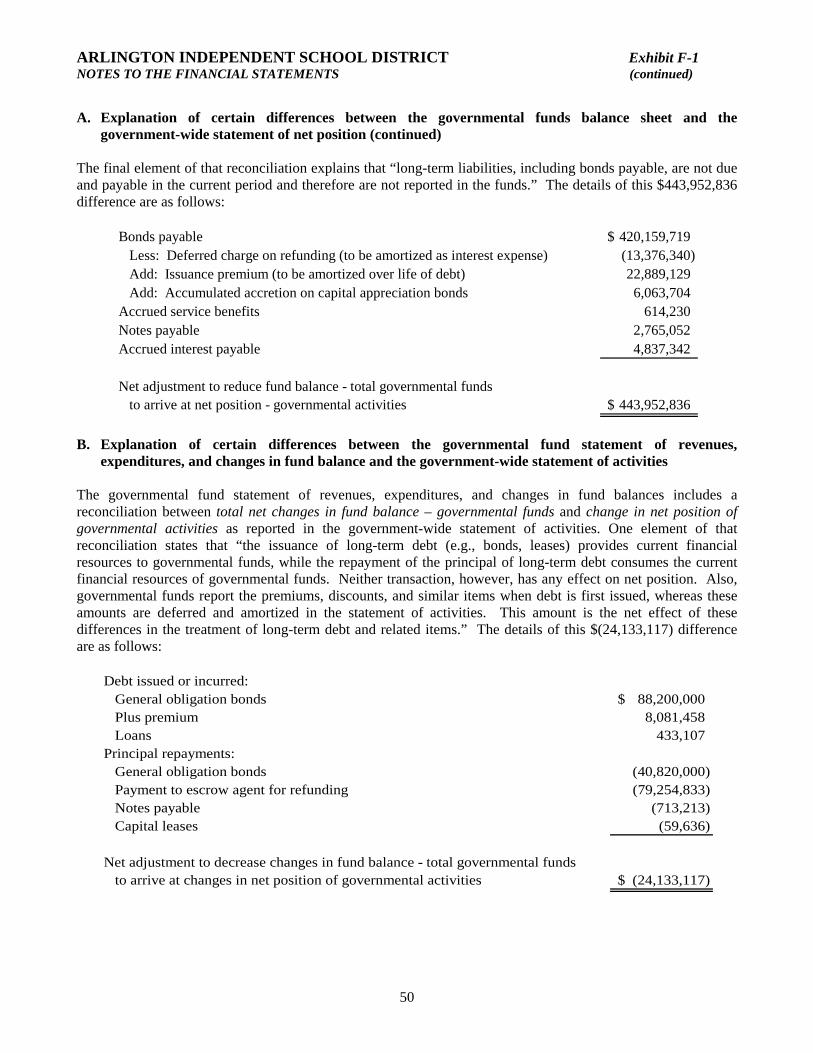
ARLINGTON INDEPENDENT SCHOOL DISTRICT Exhibit F-1 NOTES TO THE FINANCIAL STATEMENTS (continued)
50
A. Explanation of certain differences between the governmental funds balance sheet and the government-wide statement of net position (continued)
The final element of that reconciliation explains that “long-term liabilities, including bonds payable, are not due and payable in the current period and therefore are not reported in the funds.” The details of this $443,952,836 difference are as follows:
Bonds payable 420,159,719$ Less: Deferred charge on refunding (to be amortized as interest expense) (13,376,340)Add: Issuance premium (to be amortized over life of debt) 22,889,129Add: Accumulated accretion on capital appreciation bonds 6,063,704
Accrued service benefits 614,230Notes payable 2,765,052Accrued interest payable 4,837,342
Net adjustment to reduce fund balance - total governmental fundsto arrive at net position - governmental activities 443,952,836$
B. Explanation of certain differences between the governmental fund statement of revenues,
expenditures, and changes in fund balance and the government-wide statement of activities The governmental fund statement of revenues, expenditures, and changes in fund balances includes a reconciliation between total net changes in fund balance – governmental funds and change in net position of governmental activities as reported in the government-wide statement of activities. One element of that reconciliation states that “the issuance of long-term debt (e.g., bonds, leases) provides current financial resources to governmental funds, while the repayment of the principal of long-term debt consumes the current financial resources of governmental funds. Neither transaction, however, has any effect on net position. Also, governmental funds report the premiums, discounts, and similar items when debt is first issued, whereas these amounts are deferred and amortized in the statement of activities. This amount is the net effect of these differences in the treatment of long-term debt and related items.” The details of this $(24,133,117) difference are as follows:
Debt issued or incurred:General obligation bonds 88,200,000$ Plus premium 8,081,458Loans 433,107
Principal repayments:General obligation bonds (40,820,000)Payment to escrow agent for refunding (79,254,833)Notes payable (713,213)Capital leases (59,636)
Net adjustment to decrease changes in fund balance - total governmental fundsto arrive at changes in net position of governmental activities (24,133,117)$
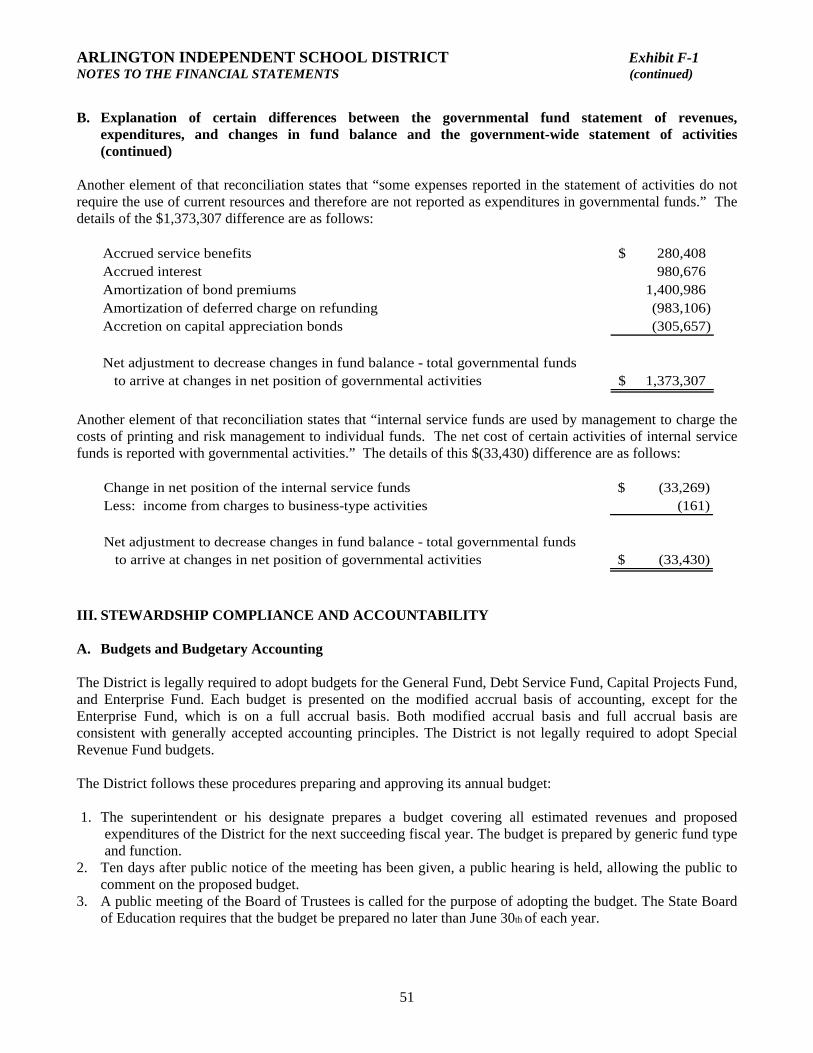
ARLINGTON INDEPENDENT SCHOOL DISTRICT Exhibit F-1 NOTES TO THE FINANCIAL STATEMENTS (continued)
51
B. Explanation of certain differences between the governmental fund statement of revenues, expenditures, and changes in fund balance and the government-wide statement of activities (continued)
Another element of that reconciliation states that “some expenses reported in the statement of activities do not require the use of current resources and therefore are not reported as expenditures in governmental funds.” The details of the $1,373,307 difference are as follows:
Accrued service benefits 280,408$ Accrued interest 980,676Amortization of bond premiums 1,400,986Amortization of deferred charge on refunding (983,106)Accretion on capital appreciation bonds (305,657)
Net adjustment to decrease changes in fund balance - total governmental fundsto arrive at changes in net position of governmental activities 1,373,307$
Another element of that reconciliation states that “internal service funds are used by management to charge the costs of printing and risk management to individual funds. The net cost of certain activities of internal service funds is reported with governmental activities.” The details of this $(33,430) difference are as follows:
Change in net position of the internal service funds (33,269)$ Less: income from charges to business-type activities (161)
Net adjustment to decrease changes in fund balance - total governmental fundsto arrive at changes in net position of governmental activities (33,430)$
III. STEWARDSHIP COMPLIANCE AND ACCOUNTABILITY A. Budgets and Budgetary Accounting The District is legally required to adopt budgets for the General Fund, Debt Service Fund, Capital Projects Fund, and Enterprise Fund. Each budget is presented on the modified accrual basis of accounting, except for the Enterprise Fund, which is on a full accrual basis. Both modified accrual basis and full accrual basis are consistent with generally accepted accounting principles. The District is not legally required to adopt Special Revenue Fund budgets. The District follows these procedures preparing and approving its annual budget: 1. The superintendent or his designate prepares a budget covering all estimated revenues and proposed
expenditures of the District for the next succeeding fiscal year. The budget is prepared by generic fund type and function.
2. Ten days after public notice of the meeting has been given, a public hearing is held, allowing the public to comment on the proposed budget.
3. A public meeting of the Board of Trustees is called for the purpose of adopting the budget. The State Board of Education requires that the budget be prepared no later than June 30th of each year.

ARLINGTON INDEPENDENT SCHOOL DISTRICT Exhibit F-1 NOTES TO THE FINANCIAL STATEMENTS (continued)
52
A. Budgets and Budgetary Accounting (continued) 4. Budget data must be received by the Texas Education Agency on or before December 15 each year. The
legal level of budgetary control is at the function level within each generic fund type. Budget amounts are as originally adopted, or as amended by the Board on June 21, 2014. Once a budget is approved, it can be amended at the function and fund level only by approval of a majority of the members of the Board of Trustees. Changes can be made to the budget at any detail within the function level without an amendment approved by the Board. During the year, several budget amendments were made with Board approval. The most significant amendments were for carryover funding; issuance of bonds and supplemental appropriations for bond projects; mid-year adjustment of local and state revenues and appropriations and operating costs; and year-end adjustments to revise estimates of revenues and expenditures based on the latest information on student attendance, interest earnings, and operating costs. All budget appropriations lapse at year-end.
IV. DETAILED NOTES ON ALL FUNDS A. Deposits and Investments The District’s funds are required to be deposited and invested under the terms of a depository contract pursuant to the School Depository Act. The depository bank places approved pledged securities for safekeeping and trust with the District’s agent bank in an amount sufficient to protect District funds on a day-to-day basis during the period of the contract. The pledge of approved securities is waived only to the extent of the depository bank’s dollar amount of Federal Deposit Insurance Corporation (“FDIC”) insurance. The Public Funds Investment Act (Government Code Chapter 2256) contains specific provisions in the areas of investment practices, management reports and establishment of appropriate policies. Among other things, it requires the District to adopt, implement, and publicize an investment policy. That policy must address the following areas: (1) safety of principal and liquidity, (2) portfolio diversification, (3) allowable investments, (4) acceptable risk levels, (5) expected rates of return, (6) maximum allowable stated maturity of portfolio investments, (7) maximum average dollar-weighted maturity allowed based on the stated maturity date for the portfolio, (8) investment staff quality and capabilities, (9) and bid solicitation preferences for certificates of deposit. The District maintains an investment policy which authorizes the District to invest in obligations of the U.S. Treasury and U.S. agencies, municipal securities and repurchase agreements and the State Treasurer’s investment pool or similar public fund investment pools. The Act also requires the District to have independent auditors perform test procedures related to investment practices as provided by the Act. The District is in substantial compliance with the requirements of the Act and with local policies. In compliance with the Public Funds Investment Act, the District has adopted a deposit and investment policy.
Custodial Credit Risk – Deposits – In the case of deposits, this is the risk that in the event of a bank failure, the government’s deposits may not be returned to it. The collateral shall always be held by an independent third party with whom the District has a current custodial agreement. The District is not exposed to custodial credit risk for its deposits as all are covered by depository insurance or securities pledged to the District and held by a third-party custodian.
At June 30, 2014, the carrying value of the District’s deposits (other than the temporary investments listed below) was $22,365,362 and the bank balance was $25,809,817. The District’s cash deposits at June 30, 2014, and during the year then ended, were entirely covered by FDIC insurance or by pledged collateral held by the District’s agent bank in the District’s name.

ARLINGTON INDEPENDENT SCHOOL DISTRICT Exhibit F-1 NOTES TO THE FINANCIAL STATEMENTS (continued)
53
A. Deposits and Investments (continued) The District’s temporary investments at June 30, 2014 , are shown below:
WeightedFair Percentage of Average
Value Investments Maturity (Days)Investments:
Money Market 50,069,585$ 19.5%
Local Government Investment Pools:Lone Star 10,023,264 3.9% 56TexPool 7,205,097 2.8% 52Logic 170,321,244 66.5% 56
Total Local Government Investment Pools 187,549,605 73.2%
Investment Securities:Federal Home Loan Mortgage Corp. 3,692,934 1.4% 58Federal Home Loan Bank 4,229,323 1.7% 115Freddie Mac Discount Note 10,696,394 4.2% 149Total Investment Securities 18,618,651 7.3%
Total temporary investments 256,237,841$ 100.0%
Custodial Credit Risk – Investments – For an investment, this is the risk that, in the event of the failure of the counterparty, the government will not be able to recover the value of its investments or collateral securities that are in the possession of an outside party. The District’s investments in the external investment pools (Lonestar, TexPool and LOGIC), are not exposed to custodial risk. External investment pools are not subject to custodial risk because investments are not evidenced by securities that exist in physical or book entry form. State law limits investments in public funds investment pools to those rated no lower than AAA or AAAm or an equivalent rating by at least one nationally recognized rating service. As of June 30, 2014, the District’s investments in Lonestar, TexPool and LOGIC were rated AAAm. Credit Risk – This is the risk that a security issuer may default on an interest or principal payment. State law limits investments in local government pools to those that are rated AAA or equivalent by at least one Nationally Recognized Statistical Rating Organization (NRSRO). The District controls and monitors this risk by purchasing quality rated instruments that have been evaluated by agencies such as Standard and Poor’s (S&P) or Moody’s Investors Service, or by investing in public fund investment pools rated no lower than AAA or AAAm. The District’s investments in Lonestar, TexPool and LOGIC were rated AAAm. Interest-rate Risk – This type of risk occurs when potential purchasers of debt securities do not agree to pay face value for those securities if interest rates rise. The District’s investment policy does not allow the purchase of investments that would expose the District to interest-rate risk. Concentration Risk – This type of risk is defined as positions of 5 percent or more in the securities of a single issuer. The District is not exposed to concentration risk because the investment portfolio mainly consists of external investment pools.
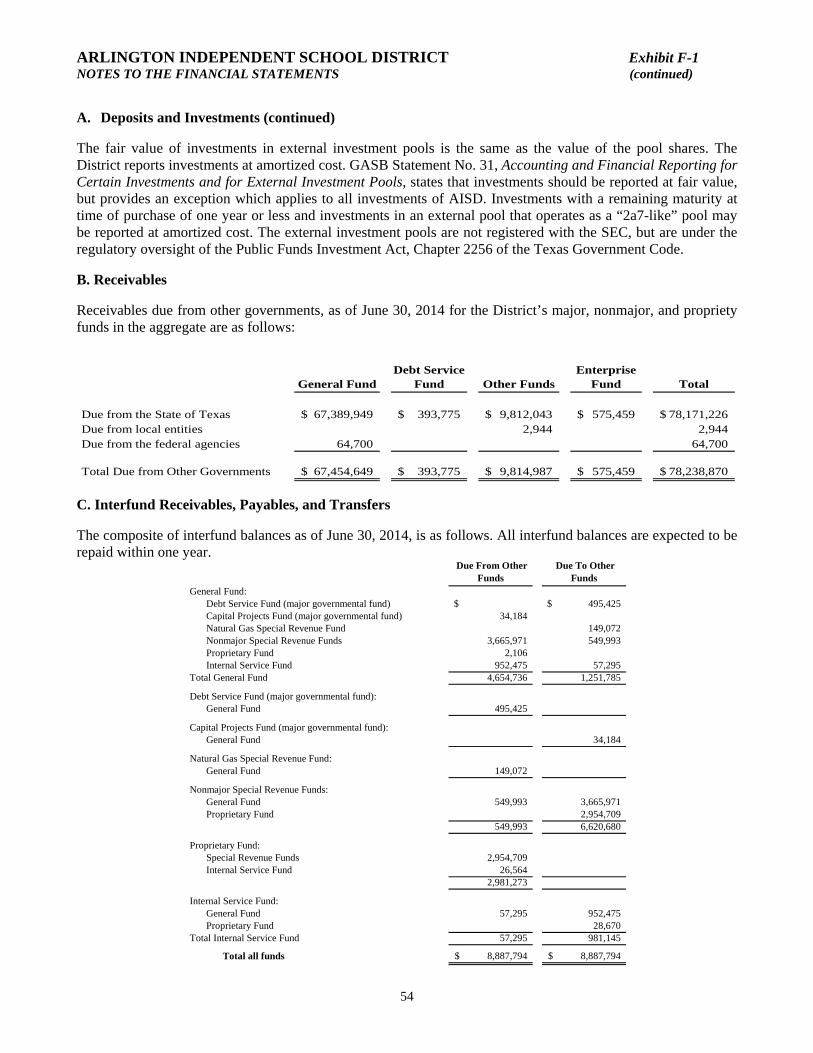
ARLINGTON INDEPENDENT SCHOOL DISTRICT Exhibit F-1 NOTES TO THE FINANCIAL STATEMENTS (continued)
54
A. Deposits and Investments (continued) The fair value of investments in external investment pools is the same as the value of the pool shares. The District reports investments at amortized cost. GASB Statement No. 31, Accounting and Financial Reporting for Certain Investments and for External Investment Pools, states that investments should be reported at fair value, but provides an exception which applies to all investments of AISD. Investments with a remaining maturity at time of purchase of one year or less and investments in an external pool that operates as a “2a7-like” pool may be reported at amortized cost. The external investment pools are not registered with the SEC, but are under the regulatory oversight of the Public Funds Investment Act, Chapter 2256 of the Texas Government Code. B. Receivables Receivables due from other governments, as of June 30, 2014 for the District’s major, nonmajor, and propriety funds in the aggregate are as follows:
General FundDebt Service
Fund Other FundsEnterprise
Fund Total
Due from the State of Texas 67,389,949$ 393,775$ 9,812,043$ 575,459$ 78,171,226$ Due from local entities 2,944 2,944 Due from the federal agencies 64,700 64,700
Total Due from Other Governments 67,454,649$ 393,775$ 9,814,987$ 575,459$ 78,238,870$
C. Interfund Receivables, Payables, and Transfers The composite of interfund balances as of June 30, 2014, is as follows. All interfund balances are expected to be repaid within one year.
Due From Other Funds
Due To Other Funds
General Fund:Debt Service Fund (major governmental fund) $ 495,425$ Capital Projects Fund (major governmental fund) 34,184 Natural Gas Special Revenue Fund 149,072 Nonmajor Special Revenue Funds 3,665,971 549,993 Proprietary Fund 2,106 Internal Service Fund 952,475 57,295
Total General Fund 4,654,736 1,251,785
Debt Service Fund (major governmental fund):General Fund 495,425
Capital Projects Fund (major governmental fund):General Fund 34,184
Natural Gas Special Revenue Fund:General Fund 149,072
Nonmajor Special Revenue Funds:General Fund 549,993 3,665,971 Proprietary Fund 2,954,709
549,993 6,620,680
Proprietary Fund:Special Revenue Funds 2,954,709 Internal Service Fund 26,564
2,981,273
Internal Service Fund:General Fund 57,295 952,475 Proprietary Fund 28,670
Total Internal Service Fund 57,295 981,145
Total all funds 8,887,794$ 8,887,794$

ARLINGTON INDEPENDENT SCHOOL DISTRICT Exhibit F-1 NOTES TO THE FINANCIAL STATEMENTS (continued)
55
C. Interfund Receivables, Payables, and Transfers (continued) These interfund balances resulted from the time lag between the dates that interfund goods and services are provided or reimbursable expenditures occur, transactions are recorded in the accounting system, and/or payments between funds are made. The composition of interfund transfers for the year ended June 30, 2014 is as follows:
Transfer Out AmountNonmajor Special Revenue Fund Enterprise Fund 79,552$
79,552$
Transfer In
D. Operating Leases The District leases building and office facilities and other equipment under noncancelable operating leases. Total costs for such leases were $310,809 for the year ended June 30, 2014. The future minimum lease payments for all active operating leases can be summarized as follows:
Year Ending June 30, Amounts2015 353,514$ 2016 407,069 2017 418,507 2018 429,945 2019 441,383 Total 2,050,418$
E. Capital Assets A summary of changes in governmental activities capital assets for the year ended June 30, 2014 as follows:
Balance (Retirements) BalanceJune 30, 2013 Additions and Transfers June 30, 2014
Governmental Activities:Capital assets, not being depreciated:
Land 62,581,144$ 2,278,673$ $ 64,859,817$ Construction in progress 17,341,967 13,190,492 (17,218,982) 13,313,477
Total Capital assets, not being depreciated 79,923,111 15,469,165 (17,218,982) 78,173,294 Capital assets, being depreciated:
Land improvements Buildings and improvements 706,190,046 311,688 17,218,982 723,720,716 Furniture and equipment 48,173,642 6,906,877 (2,905,915) 52,174,604 Leased assets under capital lease 309,393 309,393
Total Capital assets, being depreciated 754,673,081 7,218,565 14,313,067 776,204,713 Less accumulated depreciation for:
Land improvements Buildings and improvements (340,055,889) (17,572,933) (357,628,822) Furniture and Equipment (28,258,339) (5,173,508) 2,905,915 (30,525,932) Leased assets under capital lease (210,944) (77,137) (288,081)
Total Accumulated depreciation (368,525,172) (22,823,578) 2,905,915 (388,442,835) Governmental Capital Assets 466,071,020$ (135,848)$ $ 465,935,172$

ARLINGTON INDEPENDENT SCHOOL DISTRICT Exhibit F-1 NOTES TO THE FINANCIAL STATEMENTS (continued)
56
E. Capital Assets (continued) A summary of changes in the business-type activities capital assets for the year ended June 30, 2014 is as follows:
Balance (Retirements) BalanceJune 30, 2013 Additions and Transfers June 30, 2014
Business-type Activities:Capital assets, not being depreciated:
Land 401,223$ $ $ 401,223$ Total Capital assets, not being depreciated 401,223 401,223 Capital assets, being depreciated:
Buildings and improvements 4,026,280 15,892 4,042,172 Furniture and equipment 8,620,726 2,614,539 (168,959) 11,066,306
Total Capital assets, being depreciated 12,647,006 2,630,431 (168,959) 15,108,478 Less accumulated depreciation for:
Buildings and improvements (1,213,364) (96,504) (1,309,868) Furniture and Equipment (3,803,266) (914,721) 91,531 (4,626,456)
Total Accumulated depreciation (5,016,630) (1,011,225) 91,531 (5,936,324) Business-type Capital Assets 8,031,599$ 1,619,206$ (77,428)$ 9,573,377$
Depreciation was charged to functions as follows:
Depreciation Expense
Governmental Activities:Instruction 15,149,915$ Instructional resources and media services 291,875 Curriculum and staff development 189,122 Instructional leadership 312,896 School leadership 1,334,401 Guidance, counseling and evaluation services 1,125,066 Health services 267,464 Student transportation 543,646 Extracurricular activities 454,374 General administration 343,022 Plant maintenance and operations 2,159,909 Security and monitoring services 256,412 Data processing services 395,476 Total Governmental Activities 22,823,578
Business-type Activities:Food Services 1,011,225 Total Business-type Activities: 1,011,225
Total 23,834,803$
Function

ARLINGTON INDEPENDENT SCHOOL DISTRICT Exhibit F-1 NOTES TO THE FINANCIAL STATEMENTS (continued)
57
E. Capital Assets (continued) Construction Commitments The District has active construction projects as of June 30, 2014. Construction in progress and remaining commitments as of June 30, 2014 are as follows:
Approved Construction
BudgetConstruction in
Progress
Estimated Remaining
CommitmentBlanton Elementary School additions 5,133,081$ 4,536,033$ 597,048$ Rankin Elementary School additions 5,134,317 5,123,325 10,992 Knox Elementary School additions 2,893,255 2,753,533 139,722 New Elementary School additions 2,000,000 900,586 1,099,414
15,160,653$ 13,313,477$ 1,847,176$
Project
F. Long-Term Debt Long-term debt of the District is comprised of bonds payable, capital leases payable, accrued service benefits, and two notes payable. Debt service requirements for general obligation bonds are payable from fund balance and future revenues of the Debt Service Fund which consists principally of property taxes collected by the District, state funding under the Instructional Facilities and Existing Debt Allotments and interest earnings. The General Fund has typically been used to liquidate capital leases and notes payable, in prior years. The following is a summary of changes in long-term debt for governmental activities for the year ended June 30, 2014
Balance July 1, 2013 Additions Retirements
Balance June 30, 2014
Due Within One Year
Bonds payable 445,144,719$ 88,200,000$ (113,185,000)$ 420,159,719$ 36,967,234$ Bond premiums 19,121,967 8,081,458 (4,314,296) 22,889,129Accreted interest 5,758,047 305,657 6,063,704 5,209,005 Capital leases payable 59,636 (59,636) Notes payable 3,045,158 433,107 (713,213) 2,765,052 1,167,958 Accrued service benefits 894,638 12,473 (292,881) 614,230 180,905
Total 474,024,165$ 97,032,695$ (118,565,026)$ 452,491,834$ 43,525,102$

ARLINGTON INDEPENDENT SCHOOL DISTRICT Exhibit F-1 NOTES TO THE FINANCIAL STATEMENTS (continued)
58
F. Long-Term Debt (continued) Bond Issuances During fiscal year 2014, the District issued $16,180,000 in Unlimited Tax School Building Bonds with interest rates ranging from 2.00% to 5.00%. Proceeds from the issuance will be used to acquire, construct, renovate and equip school buildings and for the purchased of school sites and school buses. In May 2014, Arlington ISD voters approved a $663,130,000 bond package for the acquisition, construction, renovation and equipment of school buildings and for the purchase of school sites and school buses. As of June 30, 2014, none of the 2014 authorized bonds have been issued. Qualified School Construction Bonds ("QSCB's") are tax-credit bonds authorized through the American Recovery and Reinvestment Act. The QSCB program provides school districts the opportunity to issue interest free or very-low interest bonds to finance the construction, rehabilitation, or repair of a public school facility or for the acquisition of land on which such a facility is to be constructed. Purchasers of QSCB's issued in 2009 receive a federal tax credit instead of interest payments. Purchasers of QSCB's issued in 2011 receive interest payments from the issuer, and the issuer can elect to receive subsidy payments from the federal government equal to the lesser of (i) the amount of interest payable under such bond on such date, or (ii) the amount of interest which would have been payable under such bond on such date if such interest were determined at the applicable credit rate determined under section 54A(b)(3) of the Internal Revenue Code with respect to such bonds. The District received $580,205 in subsidy payments from the federal government during the fiscal year ended June 30, 2014. Bonds Payable Bonded indebtedness of the District is reflected in the Statement of Net Position. Current requirements for principal and interest expenditures are accounted for in the Debt Service Fund in the fund financial statements. A summary of changes in general obligation bonds for the year ended June 30, 2014, are as follows:
Interest RatesOriginal Amount
Range of Future Maturities
6/30/2013 Balances Issued
Retired / Defeased
6/30/2014 Balances
2004 Refunding 2.75 to 5.00% 52,127,530$ 2014 5,550,000$ $ 5,550,000$ $ 2005 Refunding 3.00 to 5.00% 138,745,000 2014-15 27,465,000 13,370,000 14,095,000 2006 Refunding 4.00 to 5.00% 82,880,000 2014-26 82,360,000 72,905,000 9,455,000 2007 Refunding 4.00 to 5.00% 114,350,000 2014-21 69,675,000 13,940,000 55,735,000 2009 Refunding 3.00 to 4.25% 12,465,000 2014-24 10,335,000 35,000 10,300,000 2009 QSCB 0.40% 36,320,000 2018-26 36,320,000 36,320,000 2010 Building 2.00 to 4.00% 29,435,000 2014-35 17,855,000 1,250,000 16,605,000 2011A Building 2.89 to 5.00% 50,717,485 2014-36 45,117,485 2,515,000 42,602,485 2011 QSCB 5.25 to 6.00% 13,655,000 2018-26 13,655,000 13,655,000 2011 Refunding 2.00 to 4.00% 19,479,966 2014-28 19,055,000 960,000 18,095,000 2012 Building 2.00 to 5.00% 24,885,000 2014-37 24,885,000 245,000 24,640,000 2013 Building 2.75 to 5.00% 16,390,000 2017-38 16,390,000 16,390,000 2013 Refunding 0.34 to 3.007% 76,482,234 2014-25 76,482,234 2,415,000 74,067,234 2013 Building 2.00 to 5.00% 16,180,000 2016-39 16,180,000 16,180,000 2014 Refunding 5.00% 72,020,000 2017-24 72,020,000 72,020,000
Total Bonds Payable 445,144,719$ 88,200,000$ 113,185,000$ 420,159,719$

ARLINGTON INDEPENDENT SCHOOL DISTRICT Exhibit F-1 NOTES TO THE FINANCIAL STATEMENTS (continued)
59
F. Long-Term Debt (continued) The annual debt service for retirement of bond principal and interest are as follows:
Year EndingJune 30, Principal Interest Totals
2015 36,967,234$ 19,101,378$ 56,068,612$ 2016 45,055,000 13,125,405 58,180,405 2017 43,241,714 12,284,801 55,526,515 2018 41,005,002 11,084,041 52,089,043 2019 38,443,751 10,177,546 48,621,297
2020 - 2024 142,307,018 31,059,153 173,366,171 2025 - 2029 38,215,000 11,783,291 49,998,291 2030 - 2034 22,660,000 6,124,486 28,784,486 2035 - 2039 12,265,000 1,069,780 13,334,780
420,159,719$ 115,809,881$ 535,969,600$
Rebatable Arbitrage Payable The Tax Reform Act of 1986 requires that the excess interest earned on tax-exempt bond proceeds over interest cost must be remitted to the federal government. These arbitrage interest earnings are paid from the Capital Projects Funds and must be remitted every five years from date of issue. During the fiscal year ended June 30, 2014 no arbitrage payments were made to the IRS. Furthermore, there was no rebatable arbitrage liability at June 30, 2014. Accreted Interest In accordance with general obligation bond indentures, the District is required to compute, at the time of levying the tax, a rate of tax sufficient to provide a fund each year to pay the principal and interest as bonds mature and interest payments are due. A portion of the Series 2011A and 2013 bond issues were Capital Appreciation Bonds. These bonds were issued at a discount, and there are no scheduled interest payments due until maturity of the bonds. A portion of the difference between the principal received at issuance and the total amount due at maturity is accreted each year until the total liability equals the cash due at maturity. Accreted interest on bonds represents the accrued interest to date on the above issues and is summarized as follows:
Amount Amount TotalDue at Received To Be Balance Current Year Additions / Balance
Issue Maturity at Issue Accreted 6/30/13 Accretion Maturities 6/30/142011A 10,480,000$ 8,217,485$ 2,262,515$ 577,379$ 277,320$ $ 854,699$ 2013 8,110,000 8,037,902 72,098 5,180,668 28,337 5,209,005
16,255,387$ 2,334,613$ 5,758,047$ 305,657$ $ 6,063,704$

ARLINGTON INDEPENDENT SCHOOL DISTRICT Exhibit F-1 NOTES TO THE FINANCIAL STATEMENTS (continued)
60
F. Long-Term Debt (continued) Advance Refunding The District issued $72,020,000 in unlimited tax refunding bonds at an initial taxable rate 3.096 percent until February 15, 2016. The proceeds were used to advance refund $72,365,000 of outstanding 2006 Series unlimited tax refunding bonds which had interest rates ranging from 4% to 5%. The District may request conversion to the predetermined tax-exempt fixed rate of 2.313% from the initial taxable rate of 3.096% at the February 15, 2016 conversion date. If the conversion is not approved by of the Purchaser of the bonds, the rate will adjust to a tax-exempt floating rate capped at 2.573%. The net proceeds of $79,254,833 (including a $6,424,849 premium, a $1,065,220 contribution from the District’s debt service fund and after payment of underwriting fees and other cost) were deposited into an irrevocable trust with an escrow agent to provide funds for the future debt service payments of the refunded bonds. As a result, the 2006 Series unlimited tax refunding bonds are considered defeased and the liability for those bonds has been removed from the Statement of Net Position. The reacquisition price exceeded the carrying amount of the old debt by $5,027,735. This amount is being reported as a deferred outflow of resources and amortized over the remaining life of the refunding debt. The District refunded the 2006 Series unlimited tax refunding bonds to reduce its total debt service payments by $3,196,150 to obtain an economic gain (difference between the present values of the debt service payments on the old and new debt) of $2,718,053. Prior Year Defeasance of Debt In prior years, the District defeased general obligation bonds by placing the proceeds of the new bonds in an irrevocable trust account to provide the for all future debt service payments on the old bonds. Accordingly, trust account assets and liabilities for the defeased bonds are not included in the District’s financial statements. At June 30, 2014, $128,305,000 of defeased bonds remain outstanding. Notes Payable The notes payable represent loans with the State of Texas Energy Conservation Office. The first phase of the project began during May 2006. Total proceeds of $1,886,308 from the loan were to be used for energy conservation measures at school locations throughout the District. This phase was completed during the fiscal year ending August 31, 2009. The related note matured in November 2012. The second phase resulted in additional construction draws of $4,584,295 that were taken during the years ended August 31, 2009 and 2010. The related note accrues interest at a fixed rate of 3.0% and matures in August 2017. During the 2014 fiscal year, the District entered into a loan agreement with the State of Texas Energy Conservation Office. The proceeds of the loan will be disbursed to the District as costs are incurred by the District for energy conservation projects. The proceeds of the loan will not exceed $4,984,031. Interest will accrue at a rate of 2.5%. from the date of each disbursement to the District. Construction draws totaled $433,107 during the current fiscal year. The District is required by the agreement to submit quarterly principal and interest payments on both notes payable, based on 7 year amortizations. The total notes payable balance at year end is $3,045,158 and annual maturities are as follows:
Year Ending June 30, Principal Interest Total2015 1,167,958$ 73,239$ 1,241,197$ 2016 757,146 43,614 800,760 2017 780,116 20,644 800,760 2018 59,832 907 60,739
2,765,052$ 138,404$ 2,903,456$

ARLINGTON INDEPENDENT SCHOOL DISTRICT Exhibit F-1 NOTES TO THE FINANCIAL STATEMENTS (continued)
61
F. Long-Term Debt (continued) Capital Leases The District has entered into lease agreements for various types of equipment with terms of 60 months. These lease agreements qualify as capital leases for accounting purposes, and therefore, have been recorded at the present value of their future minimum lease payments as of the inception date. The effective interest rate for these agreements is 5%. The assets acquired through capital leases are as follows:
GovernmentalActivities
Asset:Furniture and equipment 309,393$ Less: accumulated depreciation (288,081)
21,312$
The District paid the remaining balances on the capital leases during the 2014 fiscal year. Capital lease payments in governmental activities for the year ended June 30, 2014, were $93,315. G. Employee Benefits The following is a summary of the various insurance, reimbursement and retirement programs provided by the District for the benefit of District employees and their dependents: 1. Insurance plans Workers’ Compensation Insurance (Self-Insured) – The District contracts with the TASB Risk Management Fund (“the Fund”) to facilitate all claims. The Fund was created and is operated under the provisions of the Interlocal Cooperation Act, Chapter 791 of the Texas Government Code and Chapter 504, Texas Labor Code. All districts participating in the Fund execute Interlocal Agreements that define the responsibilities of the parties. As a self-funded member of the Fund, the District is solely responsible for all claim costs, both reported and unreported. The Fund provides administrative services to its self-funded members including claims administration and customer service. The District is protected against higher than expected claims costs through the purchase of stop loss coverage. Deposits in the amount of $250,000 for a required Loss Deposit Fund are included in other current assets on the Statement of Net Position. The Fund engages the service of an independent auditor to conduct a financial audit after the close of each plan year on August 31. The audit is approved by the Fund’s Board of Trustees in February of the following year. The Fund’s audited financial statements as of August 31, 2014, are available at the TASB offices and have been filed with the Texas Department of Insurance in Austin. The costs associated with the self-insured plan are reported as interfund transactions. Accordingly, they are treated as operating revenues of the Workers’ Compensation Fund and operating expenditures/expenses of the General Fund and Enterprise Fund.

ARLINGTON INDEPENDENT SCHOOL DISTRICT Exhibit F-1 NOTES TO THE FINANCIAL STATEMENTS (continued)
62
G. Employee Benefits (continued) An actuarial study is performed on the plan to estimate the claims liability at the fiscal year-end. Liabilities include an amount for claims that have been incurred but not reported (IBNRs). The resultant liability calculation is not an exact amount as it depends on many complex factors, such as inflation, changes in legal doctrines, and damage awards. Accordingly, claim liabilities are evaluated periodically. The following summarizes the self-insured plan claims and liabilities for workers’ compensation:
Fiscal Beginning of Current Year Claims End of YearYear Year Accrual Estimates Payments Accrual2013 5,153,027$ 812,187$ (1,066,525)$ 4,898,689$ 2014 4,898,689 490,056 (1,303,231) 4,085,514
Health Insurance (TRS ActiveCare) – Effective September 1, 2007, employees of the District were covered by TRS ActiveCare. TRS ActiveCare is a statewide health coverage program for public education employees established by the 77th Texas Legislature. The District contributed approximately $260 per month per participant to the plan, and employees, at their option, authorized payroll withholdings to pay employee contributions and additional premiums for dependents. The TRS issues a publicly available financial report that includes financial statements and required supplementary information for TRS ActiveCare. That report may be obtained by visiting the TRS Web site at www.trs.state.tx.us, by writing to the Communications Department of the Teacher Retirement System of Texas at 1000 Red River Street, Austin, Texas 78701, or by calling (800) 223-8778. 2. Employees Retirement Plan Plan Description – The District contributes to the Teacher Retirement System of Texas (“the System”), a public employee retirement system. It is a cost-sharing, multiple-employer defined benefit pension plan with one exception; all risks and costs are not shared by the District, but are the liability of the State of Texas. The System provides service retirement and disability retirement benefits, and death benefits to plan members and beneficiaries. The System operates under the authority of provisions contained primarily in Texas Government Code, Title 8, Public Retirement Systems, Subtitle C, Teacher Retirement System of Texas, which is subject to amendment by the Texas Legislature. The System’s annual financial report and other required disclosure information are available by writing the Teacher Retirement System of Texas, 1000 Red River, Austin, Texas 78701-2698, by calling (800) 223-8778, or by downloading the report from the TRS internet website, www.trs.state.tx.us, under the TRS Publications heading. Funding Policy – Under provisions in State law, plan members are required to contribute 6.4% of their annual covered salary and the State of Texas contributes an amount equal to 6.8% of covered payroll for fiscal year 2014 and 6.4% of the covered payroll for fiscal year 2013 and 2012. The District’s employees’ contributions to the System for the fiscal years ended June 30, 2014, June 30, 2013, and June 30, 2012 were $23,278,934, $22,298,820, and $17,981,140, respectively, equal to the required contributions for each year. Other contributions made from federal and private grants and from the District for salaries above the statutory minimum for the fiscal years ended June 30, 2014, June 30, 2013, and June 30, 2012 were $6,854,475, and $6,024,590, and $4,404,090, respectively, equal to the required contributions for each year. State contributions to TRS made on behalf of the District’s employees for the fiscal years ended June 30, 2014, June 30, 2013, and June 30, 2012 were $17,645,119, $16,049,280, and $12,452,945, respectively. The amounts have been recognized as both revenue and expenditures in the General Fund.
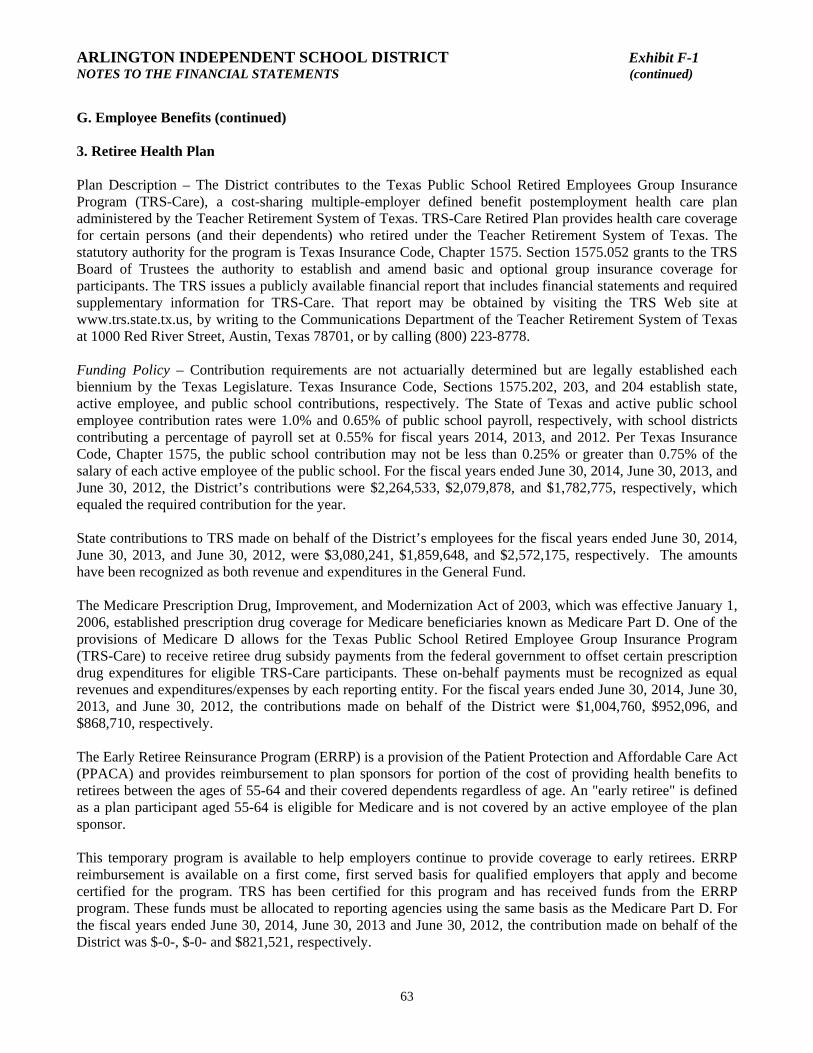
ARLINGTON INDEPENDENT SCHOOL DISTRICT Exhibit F-1 NOTES TO THE FINANCIAL STATEMENTS (continued)
63
G. Employee Benefits (continued) 3. Retiree Health Plan Plan Description – The District contributes to the Texas Public School Retired Employees Group Insurance Program (TRS-Care), a cost-sharing multiple-employer defined benefit postemployment health care plan administered by the Teacher Retirement System of Texas. TRS-Care Retired Plan provides health care coverage for certain persons (and their dependents) who retired under the Teacher Retirement System of Texas. The statutory authority for the program is Texas Insurance Code, Chapter 1575. Section 1575.052 grants to the TRS Board of Trustees the authority to establish and amend basic and optional group insurance coverage for participants. The TRS issues a publicly available financial report that includes financial statements and required supplementary information for TRS-Care. That report may be obtained by visiting the TRS Web site at www.trs.state.tx.us, by writing to the Communications Department of the Teacher Retirement System of Texas at 1000 Red River Street, Austin, Texas 78701, or by calling (800) 223-8778. Funding Policy – Contribution requirements are not actuarially determined but are legally established each biennium by the Texas Legislature. Texas Insurance Code, Sections 1575.202, 203, and 204 establish state, active employee, and public school contributions, respectively. The State of Texas and active public school employee contribution rates were 1.0% and 0.65% of public school payroll, respectively, with school districts contributing a percentage of payroll set at 0.55% for fiscal years 2014, 2013, and 2012. Per Texas Insurance Code, Chapter 1575, the public school contribution may not be less than 0.25% or greater than 0.75% of the salary of each active employee of the public school. For the fiscal years ended June 30, 2014, June 30, 2013, and June 30, 2012, the District’s contributions were $2,264,533, $2,079,878, and $1,782,775, respectively, which equaled the required contribution for the year. State contributions to TRS made on behalf of the District’s employees for the fiscal years ended June 30, 2014, June 30, 2013, and June 30, 2012, were $3,080,241, $1,859,648, and $2,572,175, respectively. The amounts have been recognized as both revenue and expenditures in the General Fund. The Medicare Prescription Drug, Improvement, and Modernization Act of 2003, which was effective January 1, 2006, established prescription drug coverage for Medicare beneficiaries known as Medicare Part D. One of the provisions of Medicare D allows for the Texas Public School Retired Employee Group Insurance Program (TRS-Care) to receive retiree drug subsidy payments from the federal government to offset certain prescription drug expenditures for eligible TRS-Care participants. These on-behalf payments must be recognized as equal revenues and expenditures/expenses by each reporting entity. For the fiscal years ended June 30, 2014, June 30, 2013, and June 30, 2012, the contributions made on behalf of the District were $1,004,760, $952,096, and $868,710, respectively. The Early Retiree Reinsurance Program (ERRP) is a provision of the Patient Protection and Affordable Care Act (PPACA) and provides reimbursement to plan sponsors for portion of the cost of providing health benefits to retirees between the ages of 55-64 and their covered dependents regardless of age. An "early retiree" is defined as a plan participant aged 55-64 is eligible for Medicare and is not covered by an active employee of the plan sponsor. This temporary program is available to help employers continue to provide coverage to early retirees. ERRP reimbursement is available on a first come, first served basis for qualified employers that apply and become certified for the program. TRS has been certified for this program and has received funds from the ERRP program. These funds must be allocated to reporting agencies using the same basis as the Medicare Part D. For the fiscal years ended June 30, 2014, June 30, 2013 and June 30, 2012, the contribution made on behalf of the District was $-0-, $-0- and $821,521, respectively.
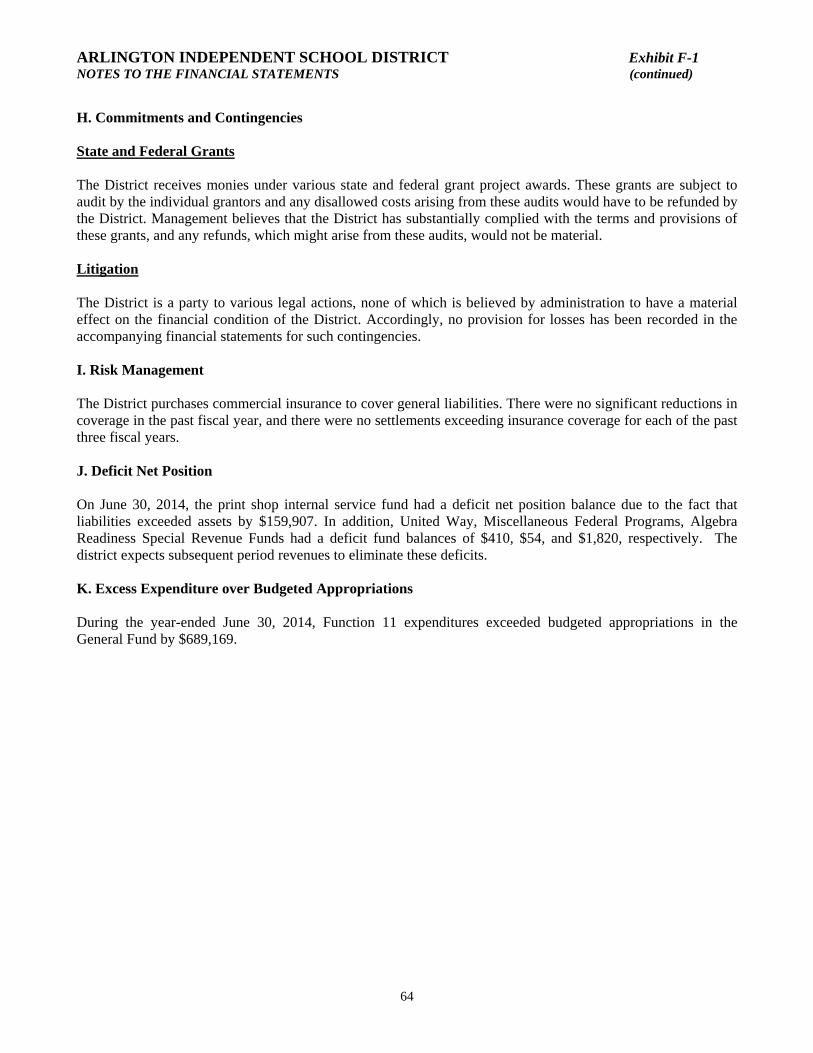
ARLINGTON INDEPENDENT SCHOOL DISTRICT Exhibit F-1 NOTES TO THE FINANCIAL STATEMENTS (continued)
64
H. Commitments and Contingencies State and Federal Grants The District receives monies under various state and federal grant project awards. These grants are subject to audit by the individual grantors and any disallowed costs arising from these audits would have to be refunded by the District. Management believes that the District has substantially complied with the terms and provisions of these grants, and any refunds, which might arise from these audits, would not be material. Litigation The District is a party to various legal actions, none of which is believed by administration to have a material effect on the financial condition of the District. Accordingly, no provision for losses has been recorded in the accompanying financial statements for such contingencies. I. Risk Management The District purchases commercial insurance to cover general liabilities. There were no significant reductions in coverage in the past fiscal year, and there were no settlements exceeding insurance coverage for each of the past three fiscal years. J. Deficit Net Position On June 30, 2014, the print shop internal service fund had a deficit net position balance due to the fact that liabilities exceeded assets by $159,907. In addition, United Way, Miscellaneous Federal Programs, Algebra Readiness Special Revenue Funds had a deficit fund balances of $410, $54, and $1,820, respectively. The district expects subsequent period revenues to eliminate these deficits. K. Excess Expenditure over Budgeted Appropriations During the year-ended June 30, 2014, Function 11 expenditures exceeded budgeted appropriations in the General Fund by $689,169.

65
OTHER SUPPLEMENTARY INFORMATION

66
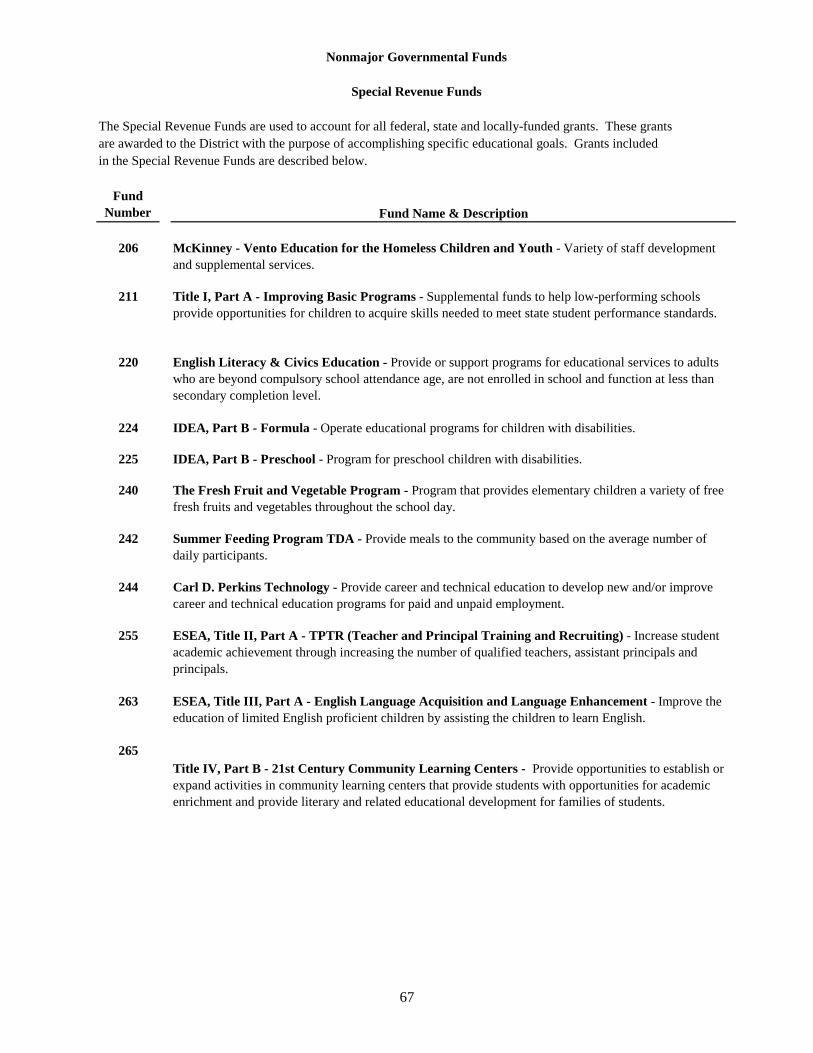
67
Fund Number Fund Name & Description
206 McKinney - Vento Education for the Homeless Children and Youth - Variety of staff development and supplemental services.
211 Title I, Part A - Improving Basic Programs - Supplemental funds to help low-performing schools provide opportunities for children to acquire skills needed to meet state student performance standards.
220 English Literacy & Civics Education - Provide or support programs for educational services to adults who are beyond compulsory school attendance age, are not enrolled in school and function at less than secondary completion level.
224 IDEA, Part B - Formula - Operate educational programs for children with disabilities.
225 IDEA, Part B - Preschool - Program for preschool children with disabilities.
240 The Fresh Fruit and Vegetable Program - Program that provides elementary children a variety of free fresh fruits and vegetables throughout the school day.
242 Summer Feeding Program TDA - Provide meals to the community based on the average number of daily participants.
244 Carl D. Perkins Technology - Provide career and technical education to develop new and/or improve career and technical education programs for paid and unpaid employment.
255 ESEA, Title II, Part A - TPTR (Teacher and Principal Training and Recruiting) - Increase student academic achievement through increasing the number of qualified teachers, assistant principals and principals.
263 ESEA, Title III, Part A - English Language Acquisition and Language Enhancement - Improve the education of limited English proficient children by assisting the children to learn English.
265Title IV, Part B - 21st Century Community Learning Centers - Provide opportunities to establish or expand activities in community learning centers that provide students with opportunities for academic enrichment and provide literary and related educational development for families of students.
in the Special Revenue Funds are described below.
Nonmajor Governmental Funds
Special Revenue Funds
The Special Revenue Funds are used to account for all federal, state and locally-funded grants. These grantsare awarded to the District with the purpose of accomplishing specific educational goals. Grants included
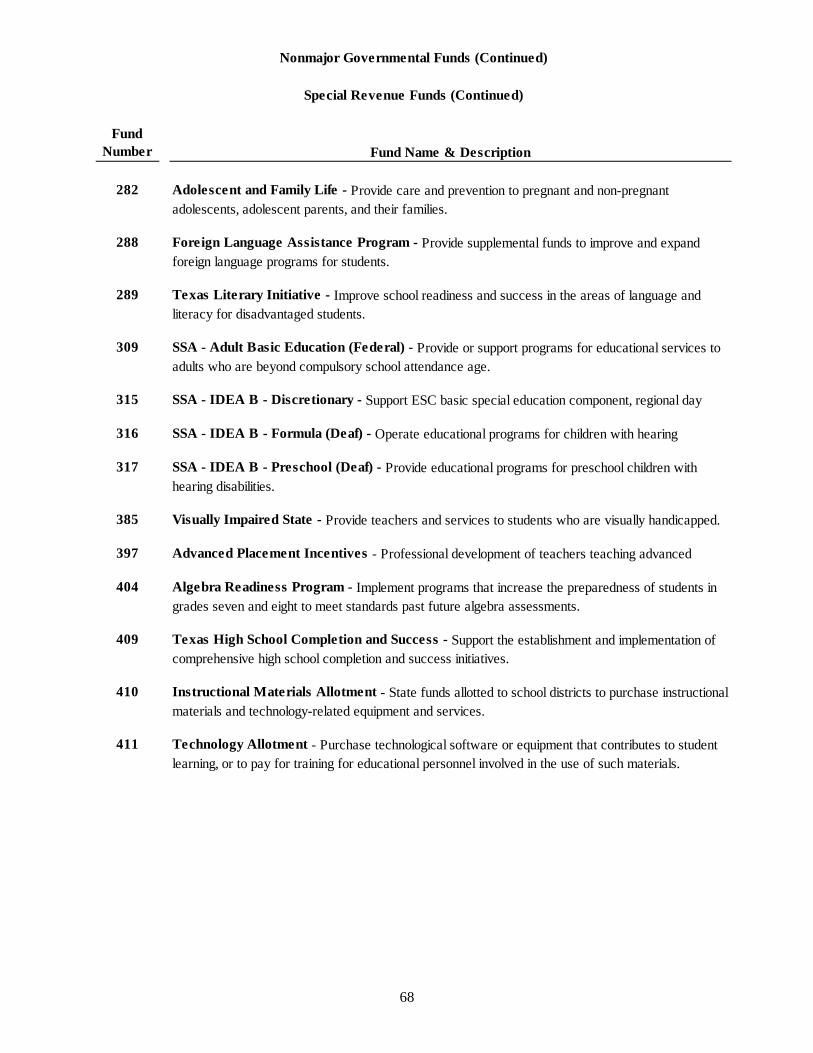
68
Fund Number Fund Name & Description
282 Adolescent and Family Life - Provide care and prevention to pregnant and non-pregnant adolescents, adolescent parents, and their families.
288 Foreign Language Assistance Program - Provide supplemental funds to improve and expand foreign language programs for students.
289 Texas Literary Initiative - Improve school readiness and success in the areas of language and literacy for disadvantaged students.
309 SSA - Adult Basic Education (Federal) - Provide or support programs for educational services to adults who are beyond compulsory school attendance age.
315 SSA - IDEA B - Discretionary - Support ESC basic special education component, regional day
316 SSA - IDEA B - Formula (Deaf) - Operate educational programs for children with hearing
317 SSA - IDEA B - Preschool (Deaf) - Provide educational programs for preschool children with hearing disabilities.
385 Visually Impaired State - Provide teachers and services to students who are visually handicapped.
397 Advanced Placement Incentives - Professional development of teachers teaching advanced
404 Algebra Readiness Program - Implement programs that increase the preparedness of students in grades seven and eight to meet standards past future algebra assessments.
409 Texas High School Completion and Success - Support the establishment and implementation of comprehensive high school completion and success initiatives.
410 Instructional Materials Allotment - State funds allotted to school districts to purchase instructional materials and technology-related equipment and services.
411 Technology Allotment - Purchase technological software or equipment that contributes to student learning, or to pay for training for educational personnel involved in the use of such materials.
Nonmajor Governmental Funds (Continued)
Special Revenue Funds (Continued)

69
Fund Number Fund Name & Description
429 Read to Succeed - Provide educational materials for the school library through license plate purchases.
431 SSA - Adult Basic Education - Provide or support programs for educational services to adults who are beyond compulsory school attendance age, are not enrolled in school and function at less than secondary completion level.
435 Regional Day School for the Deaf - Provide funding for staff and services to students with auditory handicaps.
481 AISD Access - The communications department partners with News for My School to sell advertising in the AUSD Achieving Excellence e-newsletter. Proceeds are used to promote the District.
493 African American Male Initiative - School-based mentoring program designed to encourage African-American male students to pursue a college education.
494 Venture Child Care - Provide child care for children from the age of 2 weeks to 5 years old.
496 United Way - The intent of this grant is to prepare low-income children in select areas of Tarrant County to enter kindergarten with the appropriate literacy, social, emotional, and cognitive skills necessary to be successful in the shcool environment.
497 Arlington Education Foundation - Nonprofit tax-exempt organizaiton which raises private funds for the District.
Nonmajor Governmental Funds (Continued)
Special Revenue Funds (Continued)

70
ARLINGTON INDEPENDENT SCHOOL DISTRICTCOMBINING BALANCE SHEET
NONMAJOR GOVERNMENTAL FUNDS
June 30, 2014
206 211 220
Data Control Codes
McKinney Homeless Education
Title I-A Improving
Basic Programs
English Literacy & Civics Ed.
Assets1110 Cash and cash equivalents $ 171,685$ $
Receivables:1240 Receivables from other governments 11,429 3,352,026 43,958 1260 Due from other funds 335,146 1000 Total Assets 11,429$ 3,858,857$ 43,958$
Liabilities:Current Liabilities:
2110 Accounts payable (8)$ 106,589$ 3,531$ 2160 Accrued wages payable 9,680 882,268 20,431 2170 Due to other funds 1,757 2,870,000 19,996 2180 Due to other governments 2300 Unearned revenue - other 2000 Total Liabilities 11,429 3,858,857 43,958
Fund Balance:Restricted:
3450 Federal/State funds grant restrictions 3600 Unassigned
Total Fund Balance
4000 11,429$ 3,858,857$ 43,958$ Total liabilities and fund balance
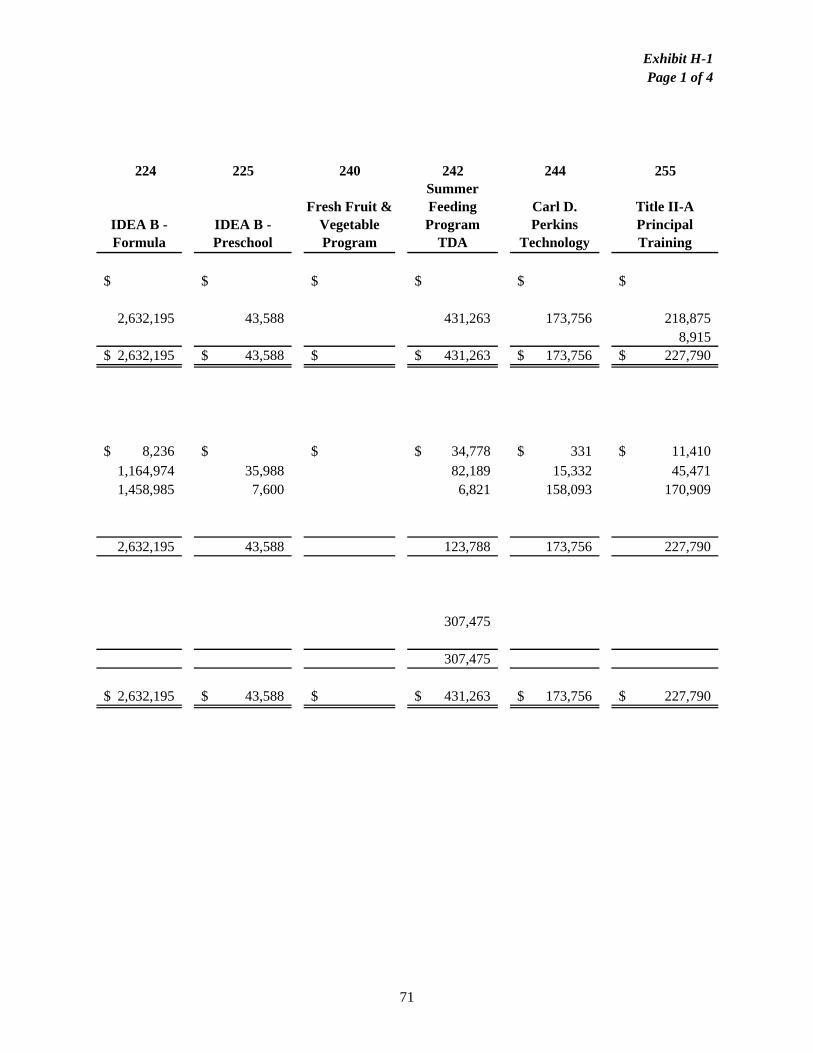
71
Exhibit H-1Page 1 of 4
224 225 240 242 244 255
IDEA B - Formula
IDEA B - Preschool
Fresh Fruit & Vegetable Program
Summer Feeding Program
TDA
Carl D. Perkins
Technology
Title II-A Principal Training
$ $ $ $ $ $
2,632,195 43,588 431,263 173,756 218,875 8,915
2,632,195$ 43,588$ $ 431,263$ 173,756$ 227,790$
8,236$ $ $ 34,778$ 331$ 11,410$ 1,164,974 35,988 82,189 15,332 45,471 1,458,985 7,600 6,821 158,093 170,909
2,632,195 43,588 123,788 173,756 227,790
307,475 307,475
2,632,195$ 43,588$ $ 431,263$ 173,756$ 227,790$

72
ARLINGTON INDEPENDENT SCHOOL DISTRICTCOMBINING BALANCE SHEET
NONMAJOR GOVERNMENTAL FUNDS
June 30, 2014
263 265 282
Data Control Codes
Title III-A LEP
21st Century Community
LearningAdolescent and
Family LifeAssets
1110 Cash and cash equivalents $ $ $ Receivables:
1240 Receivables from other governments 322,248 210,224 1260 Due from other funds 1000 Total Assets 322,248$ $ 210,224$
Liabilities:Current Liabilities:
2110 Accounts payable 28,139$ $ 2,053$ 2160 Accrued wages payable 186,472 44,301 2170 Due to other funds 107,637 163,870 2180 Due to other governments 2300 Unearned revenue - other 2000 Total Liabilities 322,248 210,224
Fund Balance:Restricted:
3450 Federal/State funds grant restrictions 3600 Unassigned
Total Fund Balance
4000 322,248$ $ 210,224$ Total liabilities and fund balance

73
Exhibit H-1Page 2 of 4
288 289 309 315 316 317
Foreign Language
GrantTexas Literary
InitiativeAdult Basic Education
IDEA B - Discretionary
IDEA B - Formula
(Deaf)
IDEA B - Preschool
(Deaf)
$ $ $ $ $ $
159,094 1,837,023 36,469 32,172 42,042 1,131
159,094$ 1,837,023$ 36,469$ 32,172$ 42,042$ 1,131$
379$ 322,688$ $ $ 16,393$ $ 3,690 234,982 17,242
155,025 1,279,407 19,227 32,172 25,649 1,131
159,094 1,837,077 36,469 32,172 42,042 1,131
(54) (54)
159,094$ 1,837,023$ 36,469$ 32,172$ 42,042$ 1,131$

74
ARLINGTON INDEPENDENT SCHOOL DISTRICTCOMBINING BALANCE SHEET
NONMAJOR GOVERNMENTAL FUNDS
June 30, 2014
385 397 404
Data Control Codes
State Visual Impairment
Advanced Placement Incentive
Algebra Readiness
Assets1110 Cash and cash equivalents $ $ $
Receivables:1240 Receivables from other governments 5,362 1260 Due from other funds 23,775 1000 Total Assets 5,362$ 23,775$ $
Liabilities:Current Liabilities:
2110 Accounts payable $ $ $ 2160 Accrued wages payable 2170 Due to other funds 5,362 1,820 2180 Due to other governments 2300 Unearned revenue - other 2000 Total Liabilities 5,362 1,820
Fund Balance:Restricted:
3450 Federal/State funds grant restrictions 23,775 3600 Unassigned (1,820)
Total Fund Balance 23,775 (1,820)
4000 5,362$ 23,775$ $ Total liabilities and fund balance

75
Exhibit H-1Page 3 of 4
409 410 411 429 431 435
TX HS Completion & Success
Instructional Materials Allotment
Technology Allotment
Other State Programs
Adult Basic Education
Regional Day School for the
Deaf
$ $ $ $ $ $
44,020 16,349 198,819 1,343 65,668 43,608 1,343$ 65,668$ 43,608$ 44,020$ 16,349$ 198,819$
$ 30,466$ 11,164$ 1,643$ $ 51,852$ 1,343 11,270 9,827 49,377
31,107 6,522 97,590 35,202
1,343 65,668 11,164 44,020 16,349 198,819
32,444 32,444
1,343$ 65,668$ 43,608$ 44,020$ 16,349$ 198,819$

76
ARLINGTON INDEPENDENT SCHOOL DISTRICTCOMBINING BALANCE SHEET
NONMAJOR GOVERNMENTAL FUNDS
June 30, 2014
481 493 494
Data Control Codes
AISD Access
African American
Male Initiative
Venture Child Care
Assets1110 Cash and cash equivalents $ $ $
Receivables:1240 Receivables from other governments 1260 Due from other funds 33,554 694 6,619 1000 Total Assets 33,554$ 694$ 6,619$
Liabilities:Current Liabilities:
2110 Accounts payable $ $ $ 2160 Accrued wages payable 694 6,619 2170 Due to other funds 2180 Due to other governments 2300 Unearned revenue - other 2000 Total Liabilities 694 6,619
Fund Balance:Restricted:
3450 Federal/State funds grant restrictions 33,554 3600 Unassigned
Total Fund Balance 33,554
4000 33,554$ 694$ 6,619$ Total liabilities and fund balance
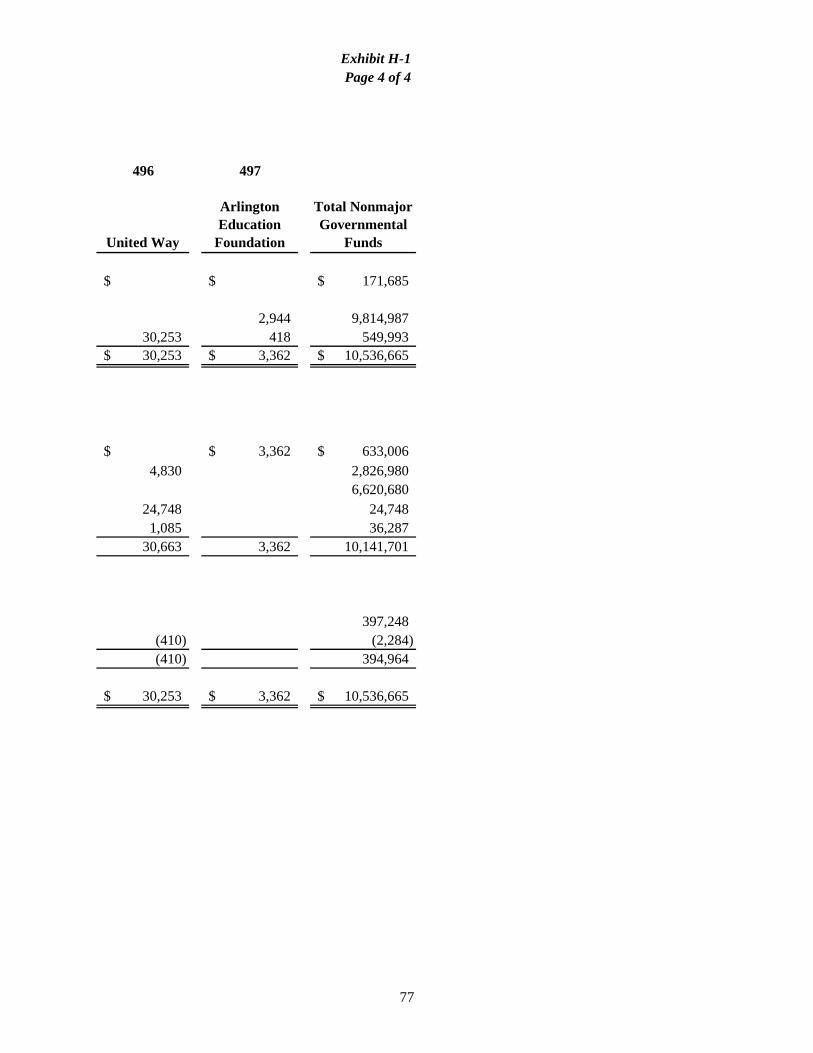
77
Exhibit H-1Page 4 of 4
496 497
United Way
Arlington Education
Foundation
Total Nonmajor Governmental
Funds
$ $ 171,685$
2,944 9,814,987 30,253 418 549,993 30,253$ 3,362$ 10,536,665$
$ 3,362$ 633,006$ 4,830 2,826,980
6,620,680 24,748 24,748 1,085 36,287
30,663 3,362 10,141,701
397,248
(410) (2,284) (410) 394,964
30,253$ 3,362$ 10,536,665$

78
ARLINGTON INDEPENDENT SCHOOL DISTRICTCOMBINING STATEMENT OF REVENUES, EXPENDITURES AND CHANGES
IN FUND BALANCE - NONMAJOR GOVERNMENTAL FUNDS
For the Year Ended June 30, 2014
206 211 220
Data Control Codes
McKinney Homeless Education
Title I-A Improving
Basic Programs
English Literacy & Civics Ed.
Revenues5700 Local and Intermediate Sources $ $ $ 5800 State Program Revenues 5900 Federal Program Revenues 184,116 15,152,430 101,415 5020 Total Revenues 184,116 15,152,430 101,415
ExpendituresCurrent:
0011 Instruction 26,346 10,480,224 99,812 0012 Instructional Resources and Media Services 44,494 0013 Curriculum and Instructional Staff Development 1,652,442 180 0021 Instructional Leadership 23,171 457,551 0023 School Leadership 40,749 0031 Guidance, Counseling and Evaluation Services 219,089 0032 Social work services 89,437 369,721 0033 Health Services 6,239 0034 Student Transportation 31,330 0035 Food Services 0036 Cocurricular/Extracurricular Activities 0052 Security and Monitoring Services 0053 Data Processing Services 611 0061 Community Services 7,593 1,887,549 1,423 6030 Total Expenditures 184,116 15,152,430 101,415 1100 Excess (deficiency) of revenues over expenditures
Other Financing Sources (Uses)8911 Transfers out
Total Other Financing Sources (Uses)
1200 Net change in fund balances
0100 Fund Balance - July 1 (Beginning)
3000 Fund Balance - June 30 (Ending) $ $ $

79
Exhibit H-2Page 1 of 4
224 225 240 242 244 255
IDEA B - Formula
IDEA B - Preschool
Fresh Fruit & Vegetable Program
Summer Feeding
Program TDA
Carl D. Perkins
Technology
Title II-A Principal Training
$ $ $ $ $ $
10,197,297 231,616 190,072 527,914 747,229 1,137,167 10,197,297 231,616 190,072 527,914 747,229 1,137,167
7,401,570 230,384 488,745 21,162
1,189,213 938 27,382 1,039,237 116,720 28,205 24,720
48,011 1,441,743 294 202,897
4,037 46,561
190,072 198,138
1,490 10,197,297 231,616 190,072 198,138 747,229 1,137,167
329,776
(79,552) (79,552)
250,224
57,251
$ $ $ 307,475$ $ $
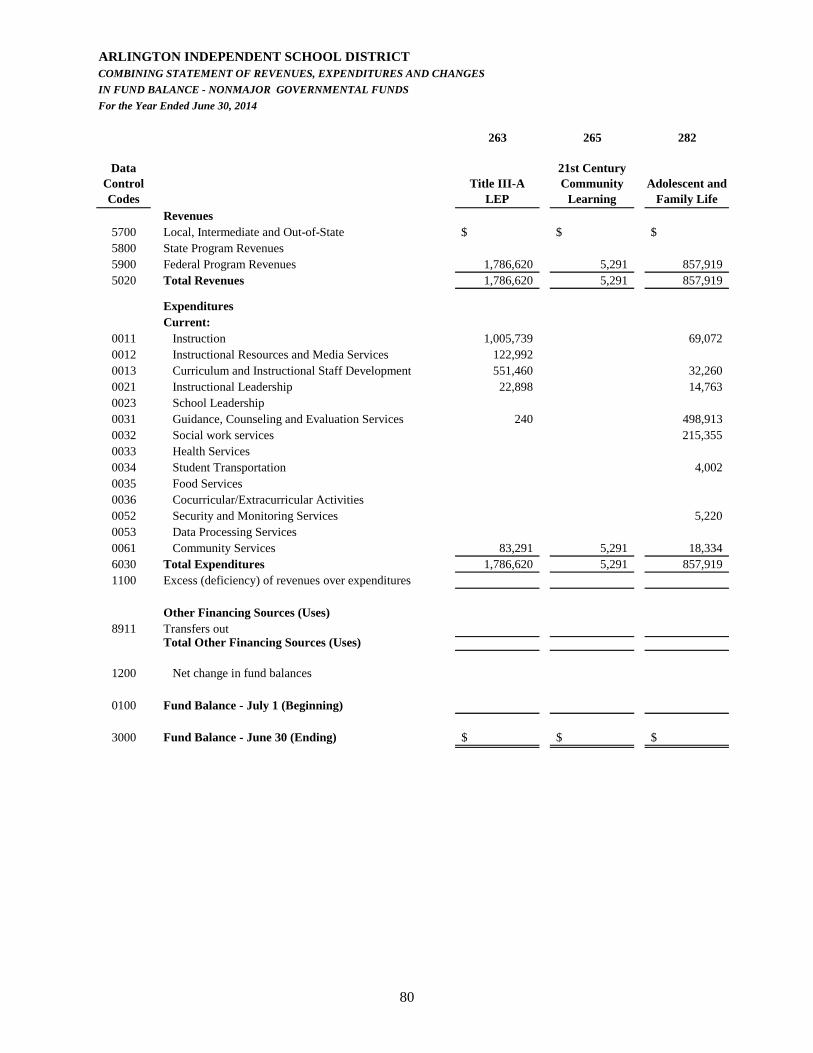
80
ARLINGTON INDEPENDENT SCHOOL DISTRICTCOMBINING STATEMENT OF REVENUES, EXPENDITURES AND CHANGES
IN FUND BALANCE - NONMAJOR GOVERNMENTAL FUNDS
For the Year Ended June 30, 2014
263 265 282
Data Control Codes
Title III-A LEP
21st Century Community
Learning Adolescent and
Family LifeRevenues
5700 Local, Intermediate and Out-of-State $ $ $ 5800 State Program Revenues 5900 Federal Program Revenues 1,786,620 5,291 857,919 5020 Total Revenues 1,786,620 5,291 857,919
ExpendituresCurrent:
0011 Instruction 1,005,739 69,072 0012 Instructional Resources and Media Services 122,992 0013 Curriculum and Instructional Staff Development 551,460 32,260 0021 Instructional Leadership 22,898 14,763 0023 School Leadership 0031 Guidance, Counseling and Evaluation Services 240 498,913 0032 Social work services 215,355 0033 Health Services 0034 Student Transportation 4,002 0035 Food Services 0036 Cocurricular/Extracurricular Activities 0052 Security and Monitoring Services 5,220 0053 Data Processing Services 0061 Community Services 83,291 5,291 18,334 6030 Total Expenditures 1,786,620 5,291 857,919 1100 Excess (deficiency) of revenues over expenditures
Other Financing Sources (Uses)8911 Transfers out
Total Other Financing Sources (Uses)
1200 Net change in fund balances
0100 Fund Balance - July 1 (Beginning)
3000 Fund Balance - June 30 (Ending) $ $ $

81
Exhibit H-2Page 2 of 4
288 289 309 315 316 317
Foreign Language
Grant Texas Literary
Initiative Adult Basic Education
IDEA B - Discretionary
IDEA B - Formula
(Deaf)IDEA B -
Preschool (Deaf)
$ $ $ $ $ $
134,530 7,593,613 62,681 39,767 42,042 1,116 134,530 7,593,613 62,681 39,767 42,042 1,116
27,310 4,077,713 62,681 39,767 42,042 1,116 899,788
106,073 1,829,639 1,147 80,852
171,212 534,463
134,530 7,593,667 62,681 39,767 42,042 1,116 (54)
(54)
$ (54)$ $ $ $ $

82
ARLINGTON INDEPENDENT SCHOOL DISTRICTCOMBINING STATEMENT OF REVENUES, EXPENDITURES AND CHANGES
IN FUND BALANCE - NONMAJOR GOVERNMENTAL FUNDS
For the Year Ended June 30, 2014
385 397 404
Data Control Codes
State Visual Impairment
Advanced Placement Incentive
Algebra Readiness
Revenues5700 Local, Intermediate and Out-of-State $ $ $ 5800 State Program Revenues 24,486 101,675 12,251 5900 Federal Program Revenues 5020 Total Revenues 24,486 101,675 12,251
ExpendituresCurrent:
0011 Instruction 24,486 12,251 0012 Instructional Resources and Media Services 0013 Curriculum and Instructional Staff Development 0021 Instructional Leadership 1,820 0023 School Leadership 0031 Guidance, Counseling and Evaluation Services 77,900 0032 Social work services 0033 Health Services 0034 Student Transportation 0035 Food Services 0036 Cocurricular/Extracurricular Activities 0052 Security and Monitoring Services 0053 Data Processing Services 0061 Community Services 6030 Total Expenditures 24,486 77,900 14,071 1100 Excess (deficiency) of revenues over expenditures 23,775 (1,820)
Other Financing Sources (Uses)8911 Transfers out
Total Other Financing Sources (Uses)
1200 Net change in fund balances 23,775 (1,820)
0100 Fund Balance - July 1 (Beginning)
3000 Fund Balance - June 30 (Ending) $ 23,775$ (1,820)$

83
Exhibit H-2Page 3 of 4
409 410 411 429 431 435
TX HS Completion &
Success
Instructional Materials Allotment
Technology Allotment
Other State Programs
Adult Basic Education
Regional Day School for the
Deaf
$ $ $ $ $ $ 21,462 2,660,081 996,033 36,785 652,267
21,462 2,660,081 996,033 36,785 652,267
2,660,081 8,495 36,785 652,267 270 8,755 4,104 2,400
21,462 77,038 918,725 72,938
21,462 2,660,081 96,692 996,033 36,785 652,267 (96,692)
(96,692)
129,136
$ $ 32,444$ $ $ $

84
ARLINGTON INDEPENDENT SCHOOL DISTRICTCOMBINING STATEMENT OF REVENUES, EXPENDITURES AND CHANGES
IN FUND BALANCE - NONMAJOR GOVERNMENTAL FUNDS
For the Year Ended June 30, 2014
481 493 494
Data Control Codes
AISD Access
African American
Male Initiative Venture
Child CareRevenues
5700 Local, Intermediate and Out-of-State 15,318$ 4,461$ 1,969$ 5800 State Program Revenues 5900 Federal Program Revenues 39,193 5020 Total Revenues 15,318 4,461 41,162
ExpendituresCurrent:
0011 Instruction 0012 Instructional Resources and Media Services 0013 Curriculum and Instructional Staff Development 0021 Instructional Leadership 0023 School Leadership 0031 Guidance, Counseling and Evaluation Services 0032 Social work services 0033 Health Services 0034 Student Transportation 0035 Food Services 0036 Cocurricular/Extracurricular Activities 4,461 0052 Security and Monitoring Services 0053 Data Processing Services 0061 Community Services 41,162 6030 Total Expenditures 4,461 41,162 1100 Excess (deficiency) of revenues over expenditures 15,318
Other Financing Sources (Uses)8911 Transfers out
Total Other Financing Sources (Uses)
1200 Net change in fund balances 15,318
0100 Fund Balance - July 1 (Beginning) 18,236
3000 Fund Balance - June 30 (Ending) 33,554$ $ $

85
Exhibit H-2Page 4 of 4
496 497
United Way
Arlington Education
Foundation
Total Nonmajor Governmental
Funds
284,055$ 42,983$ 348,786$ 4,505,040 39,032,028
284,055 42,983 43,885,854
2,400 31,538 27,501,986 27,871 5,000 1,100,415
5,000 6,442,579 775,951 91,160 2,612,288 777,050 52,800 954,057 388,210 1,445 5,906 5,220 73,549
253,784 2,834,380 284,055 42,983 43,615,551
270,303
(79,552) (79,552)
190,751
(410) 204,213
(410)$ $ 394,964$

86
ARLINGTON INDEPENDENT SCHOOL DISTRICT Exhibit H-3COMBINING STATEMENT OF NET POSITION
INTERNAL SERVICE FUNDS
June 30, 2014
752 770
Print Shop
Workers' Compensation
Fund TotalAssetsCurrent assets:
Cash and cash equivalents 60,308$ 5,621,182$ 5,681,490$ Receivables:
Due from other funds 57,295 57,295 Prepaid items 250,000 250,000
Total Current Assets 117,603 5,871,182 5,988,785
Total Assets 117,603 5,871,182 5,988,785
LiabilitiesCurrent Liabilities:
Accounts payable 4,510 105,030 109,540 Due to other funds 273,000 708,145 981,145 Accrued expenses 4,085,514 4,085,514
Total current liabilities 277,510 4,898,689 5,176,199 Total Liabilities 277,510 4,898,689 5,176,199
Net PositionUnrestricted (159,907) 972,493 812,586 Total Net Position (159,907)$ 972,493$ 812,586$

87
ARLINGTON INDEPENDENT SCHOOL DISTRICT Exhibit H-4COMBINING STATEMENT OF REVENUES, EXPENSES, AND CHANGES IN NET POSITION
INTERNAL SERVICE FUNDS
For the Year Ended June 30, 2014
752 770
Print Shop
Workers' Compensation
Fund TotalOperating RevenuesCharges for services 331,635$ 515,117$ 846,752$ Total operating revenues 331,635 515,117 846,752
Operating ExpensesPayroll costs 515,427 515,427 Purchased and contracted services 183,391 183,391 Supplies and materials 186,829 186,829 Total operating expenses 370,220 515,427 885,647
Operating Income (Loss) (38,585) (310) (38,895)
Non-Operating Revenues (Expenses)Earnings - temporary deposits and investments 5,626 5,626 Total non-operating revenues (expenses) 5,626 5,626
Change in Net Position (38,585) 5,316 (33,269)
Net Position - July 1 (Beginning) (121,322) 967,177 845,855
Net Position - June 30 (Ending) (159,907)$ 972,493$ 812,586$

88
ARLINGTON INDEPENDENT SCHOOL DISTRICT Exhibit H-5COMBINING STATEMENT OF CASH FLOWS
INTERNAL SERVICE FUNDS
For The Year Ended June 30, 2014
752 770
Print Shop
Workers' Compensation
Fund TotalIncrease (Decrease) in Cash and Cash Equivalents
Cash Flows from Operating Activities:Cash received from user charges 452,975$ 1,048,583$ 1,501,558$ Cash payments for insurance claims (1,303,231) (1,303,231) Cash payments to suppliers (234,010) (234,010) Cash payments for other operating expenses (186,829) (186,829)
Net Cash Provided by (Used for) Operating Activities 32,136 (254,648) (222,512)
Cash Flows from Investing Activities:Interest on investments 5,626 5,626
Net Cash Provided by Investing Activities 5,626 5,626
Net Increase (decrease) in Cash and Cash Equivalents 32,136 (249,022) (216,886) Cash and Cash Equivalents at Beginning of Year 28,172 5,870,204 5,898,376 Cash and Cash Equivalents at End of Year 60,308$ 5,621,182$ 5,681,490$
Reconciliation to Balance Sheet: Cash and Cash Equivalents Per Cash Flow 60,308$ 5,621,182$ 5,681,490$ Cash and Cash Equivalents per Balance Sheet 60,308$ 5,621,182$ 5,681,490$
Reconciliation of Operating Income to Net Cash
Provided by operating Activities:Operating Income (Loss) (38,585)$ (310)$ (38,895)$ Adjustments to Reconcile Operating Income to
Net Cash Provided by Operating Activities:Change in Assets and Liabilities:
Decrease (increase) in Interfund Receivables (11,660) (11,660) Increase (decrease) in Accounts Payable (50,619) 25,371 (25,248) Increase (decrease) in Interfund Payables 133,000 533,466 666,466 Increase (decrease) in Accrued Expenses (813,175) (813,175)
Net Cash Provided by (Used for) Operating Activities 32,136$ (254,648)$ (222,512)$

89
FIDUCIARY FUND
Agency Fund Student Activity Fund – An unbudgeted fund that accounts for the receipt and disbursement of monies from student activity organizations. This fund has no equity; assets are equal to liabilities, and it does not include revenues and expenditures for general operations of the school district.

90

91
ARLINGTON INDEPENDENT SCHOOL DISTRICT Exhibit H-6STATEMENT OF CHANGES IN ASSETS AND LIABILITIES
AGENCY FUNDS
For the Year Ended June 30, 2014
BalanceJuly 1, 2013 Additions Deductions
BalanceJune 30, 2014
Student Activities
AssetsCash and cash equivalents 4,148,893$ 9,252,759$ 8,970,029$ 4,431,623$
LiabilitiesAccounts payable 154,319$ 124,638$ 154,319$ 124,638$ Due to student groups 3,994,574 9,128,121 8,815,710 4,306,985Total liabilities 4,148,893$ 9,252,759$ 8,970,029$ 4,431,623$

92
93
REQUIRED TEA SCHEDULES Section 21.256, Texas Education Code, requires an annual audit and authorizes the State Board of Education, with the approval of the State Auditor, to prescribe minimum regulations and report forms for the annual audit. The Financial Accountability System Resource Guide of the Texas Education Agency prescribes the forms and formats to be filed with the Texas Education Agency. This section fulfills the requirements for certain forms and formats required to be filed with the Texas Education Agency.

94
ARLINGTON INDEPENDENT SCHOOL DISTRICTSCHEDULE OF DELINQUENT TAXES RECEIVABLE
For the Year Ended June 30, 2014
1 2 3 10
Net Assessed/Appraised BeginningLast Ten Tax Rates Value For School Balance
Fiscal Years Maintenance Debt Service Tax Purposes 7/1/2013
2005 and prior Various Various Various 7,253,790$
2006 1.500000 0.245000 18,250,180,575 735,106
2007 1.370000 0.240000 19,155,825,422 722,710
2008 1.040000 0.238000 20,074,396,432 588,710
2009 1.040000 0.232000 20,905,800,393 690,821
2010 1.040000 0.232000 20,756,079,556 905,722
2011 1.040000 0.295000 19,349,036,480 817,736
2012 1.040000 0.266000 19,472,765,823 1,534,179
2013 1.040000 0.261000 19,779,331,339 5,053,725
2014 1.040000 0.252170 20,220,917,724
1000 TOTALS 18,302,499$
9000 Portion of Row 1000 for Taxes Paid into TaxIncrement Zone Under Chapter 311, Tax Code $

95
Exhibit J-1
20 31 32 40 50
Current Maintenance Debt Service Entire EndingYear's Total Total Year's Balance
Total Levy Collections Collections Adjustments 6/30/2014
$ 35,010$ 5,635$ (7,244)$ 7,205,901$
12,680 2,071 (703) 719,652
13,889 2,433 (948) 705,440
17,006 3,892 (1,436) 566,376
49,648 11,075 10,844 640,942
80,927 18,053 29,672 836,414
131,008 37,161 14,149 663,716
441,777 112,993 (241,606) 737,803
2,507,439 629,271 (886,109) 1,030,906
261,254,257 207,391,115 50,252,463 224,581 3,835,260
261,254,257$ 210,680,499$ 51,075,047$ (858,800)$ 16,942,410
Total taxes receivable per Exhibit C-1 16,942,410$
4,749,340$ 4,749,340$ $ $ $

96
ARLINGTON INDEPENDENT SCHOOL DISTRICT Exhibit J-4SCHEDULE OF REVENUES, EXPENDITURES AND CHANGES IN NET POSITION -
ORIGINAL BUDGET, AMENDED FINAL AND ACTUAL - CHILD NUTRITION
For the Year Ended June 30, 2014
Budgeted Amounts
Data Control Codes Original Final
Actual Amounts, Budgetary Basis
Variance with Final Budget
Operating Revenues5700 Local revenues 6,192,113$ 5,692,113$ 6,002,909$ 310,796$ 5800 State program revenues 181,000 181,000 194,520 13,520
Total operating revenues 6,373,113 5,873,113 6,197,429 324,316
Operating Expenses6100 Payroll costs 11,545,097 11,545,097 11,219,173 325,924 6200 Professional and contracted services 3,292,479 3,292,479 2,778,757 513,722 6300 Curriculum and instructional staff development 15,277,542 15,277,542 15,078,690 198,852 6400 Other operating costs 96,000 96,000 95,955 45 6449 Depreciation 829,147 829,147 1,011,225 (182,078)
Total operating expenses 31,040,265 31,040,265 30,183,800 856,465
1100 Operating income (loss) (24,667,152) (25,167,152) (23,986,371) 1,180,781
Non-Operating Revenues (Expenses)7020 Investment earnings 5,964 5,964 7952 National School Breakfast 5,425,985 5,425,985 7953 National School Lunch 25,113,449 25,613,449 18,536,605 (7,076,844) 7954 U.S.D.A. donated commodities 1,939,696 1,939,696 8951 Loss on disposal of property (24,419) (24,419)
Total non-operating revenues (expenses) 25,113,449 25,613,449 25,883,831 270,382
Income (loss) before transfers 446,297 446,297 1,897,460 1,451,163
Capital Contributions and Transfers7915 Operating transfers in 79,552 79,552 7957 Capital contribution 273,272 273,272
1200 Net change in net position 446,297 446,297 2,250,284 1,803,987
0100 Net position - July 1 (beginning) 18,511,725 18,511,725 18,511,725
3000 Net position - June 30 (ending) 18,958,022$ 18,958,022$ 20,762,009$ 1,803,987$
Child Nutrition

97
ARLINGTON INDEPENDENT SCHOOL DISTRICT Exhibit J-5SCHEDULE OF REVENUES, EXPENDITURES AND CHANGES IN FUND BALANCE -
ORIGINAL BUDGET, AMENDED FINAL AND ACTUAL - DEBT SERVICE FUND
For the Year Ended June 30, 2014
Budgeted Amounts
Data Control Codes Original Final
Actual Amounts, Budgetary Basis
Variance with Final Budget
Revenues5700 Local revenues 51,079,012$ 50,579,012$ 51,187,431$ 608,419$ 5800 State program revenues 4,499,874 3,699,874 5,395,126 1,695,252 5900 Federal program revenues 630,315 579,932 580,205 273
Total revenues 56,209,201 54,858,818 57,162,762 2,303,944
ExpendituresDebt Service:
0071 Debt service expenditures 56,209,201 57,124,201 40,820,000 16,304,201 0072 Interest on long-term debt 15,972,542 (15,972,542) 0073 Bond issuance costs and fees 289,950 (289,950)
Total expenditures 56,209,201 57,124,201 57,082,492 41,709
1100Excess (deficiency) of revenues over expenditures (2,265,383) 80,270 2,345,653
Other Financing Sources (Uses)7911 Capital-related Debt Issued (Regular
Bonds) 78,444,849 72,020,000 (6,424,849)
7916 Premium or discount on issuance of bonds 6,426,528 6,426,528 8949 Payment to Bond Refunding Escrow Agent (79,254,833) (79,254,833)
Total other financing sources (uses) (809,984) (808,305) 1,679
1200 Net change in fund balance (3,075,367) (728,035) 2,347,332
0100 Fund balances - beginning 17,991,873 17,991,873 17,991,873
3000 Fund balances - ending 17,991,873$ 14,916,506$ 17,263,838$ 2,347,332$
Debt Service

98
ARLINGTON INDEPENDENT SCHOOL DISTRICT Exhibit J-6SCHEDULE OF REVENUES, EXPENDITURES AND CHANGES IN FUND BALANCE -
ORIGINAL BUDGET, AMENDED FINAL AND ACTUAL - CAPITAL PROJECTS FUND
For the Year Ended June 30, 2014
Budgeted Amounts
Data Control Codes Original Final
Actual Amounts, Budgetary
BasisVariance with Final Budget
Revenues5700 Local revenues 860,341$ 860,341$ 1,185,374$ 325,033$
Total revenues 860,341 860,341 1,185,374 325,033
ExpendituresCurrent:
0011 Instruction 15,876,117 19,462,525 12,792,167 6,670,358 0012 Instruction resources and media services 186,602 5,545 181,057 0034 Student transportation 2,763,540 5,636,130 1,712,062 3,924,068 0036 Extracurricular activities 500,000 258,604 241,396 0051 Plant maintenance and operations 9,042,669 14,019,319 7,946,307 6,073,012 0052 Security and monitoring services 297,579 235,547 62,032 0053 Data processing services 6,819,584 1,674,267 5,145,317
Debt Service:0071 Debt service expenditures 225,000 225,000
Capital Outlay:0081 Facilities acquisition and construction 16,271,244 19,375,844 15,364,748 4,011,096
Total expenditures 43,953,570 66,522,583 40,184,486 26,338,097
1100Excess (deficiency) of revenues over expenditures (43,093,229) (65,662,242) (38,999,112) 26,663,130
Other Financing Sources (Uses)7911 Capital-related Debt Issued (Regular Bonds) 17,830,000 16,180,000 (1,650,000) 7912 Sale of real or personal property 35,384 35,384 7916 Premium or discount on issuance of bonds 1,654,930 1,654,930
Total other financing sources (uses) 17,830,000 17,870,314 40,314
1200 Net change in fund balance (43,093,229) (47,832,242) (21,128,798) 26,703,444
0100 Fund balances - beginning 60,302,258 60,302,258 60,302,258
3000 Fund balances - ending 17,209,029$ 12,470,016$ 39,173,460$ 26,703,444$
Capital Projects Fund
99
STATISTICAL SECTION (Unaudited)
Statistical Tables are used to provide detailed data on the physical, economic, social and political characteristics of a government. They are intended to provide financial report users with a broader and more complete understanding of the government and its financial affairs than it is possible from the basic financial statements. The District’s Statistical Tables usually cover ten fiscal years and often present data from outside the accounting records. The tables are unaudited due to the nature of the information contained therein. Page Financial Trends 100 These schedules contain trend information to help the reader understand how the government’s financial performance and well-being have changed over time. Revenue Capacity 110 The schedules contain information to help the reader assess the government’s most significant local revenue source, the property tax. Debt Capacity 119 The schedules present information to help the reader assess the affordability of the government’s current levels of outstanding debt and the government’s ability to issue additional debt in the future. Demographic and Economic Information 123 The schedules offer demographic and economic indicators to help the reader understand the environment within which the government’s financial activities take place. Operating Information 129 These schedules contain service and infrastructure data to help the reader understand how the information in the government’s financial report relates to the services the government provides and the activities it performs.
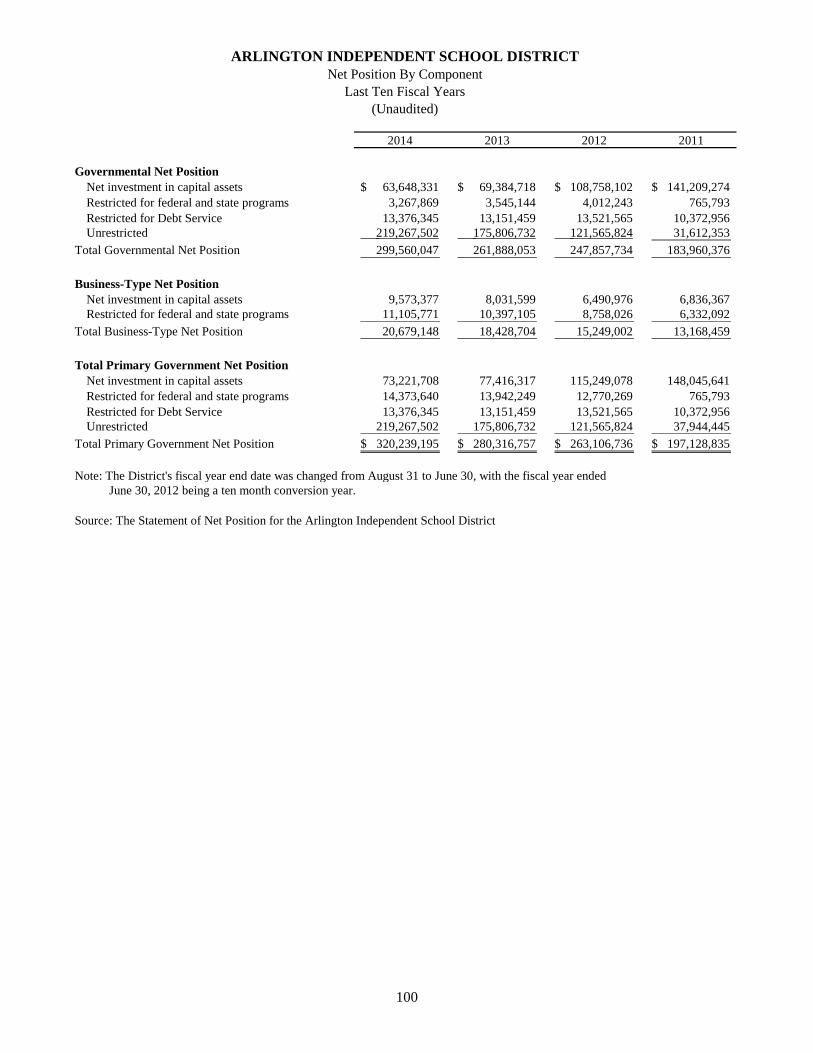
100
2014 2013 2012 2011
Governmental Net PositionNet investment in capital assets 63,648,331$ 69,384,718$ 108,758,102$ 141,209,274$ Restricted for federal and state programs 3,267,869 3,545,144 4,012,243 765,793 Restricted for Debt Service 13,376,345 13,151,459 13,521,565 10,372,956 Unrestricted 219,267,502 175,806,732 121,565,824 31,612,353
Total Governmental Net Position 299,560,047 261,888,053 247,857,734 183,960,376
Business-Type Net PositionNet investment in capital assets 9,573,377 8,031,599 6,490,976 6,836,367 Restricted for federal and state programs 11,105,771 10,397,105 8,758,026 6,332,092
Total Business-Type Net Position 20,679,148 18,428,704 15,249,002 13,168,459
Total Primary Government Net PositionNet investment in capital assets 73,221,708 77,416,317 115,249,078 148,045,641 Restricted for federal and state programs 14,373,640 13,942,249 12,770,269 765,793 Restricted for Debt Service 13,376,345 13,151,459 13,521,565 10,372,956 Unrestricted 219,267,502 175,806,732 121,565,824 37,944,445
Total Primary Government Net Position 320,239,195$ 280,316,757$ 263,106,736$ 197,128,835$
Note: The District's fiscal year end date was changed from August 31 to June 30, with the fiscal year ended June 30, 2012 being a ten month conversion year.
Source: The Statement of Net Position for the Arlington Independent School District
ARLINGTON INDEPENDENT SCHOOL DISTRICTNet Position By Component
Last Ten Fiscal Years(Unaudited)

101
Table 1
2010 2009 2008 2007 2006 2005
147,771,497$ 130,115,177$ 127,761,100$ 125,249,337$ 124,204,579$ 100,933,517$ 591,708
11,514,055 11,493,475 11,179,949 9,906,502 10,484,767 8,697,909 17,856,878 41,275,183 32,833,653 30,752,492 14,461,322 21,059,620
177,734,138 182,883,835 171,774,702 165,908,331 149,150,668 130,691,046
5,073,483 4,842,862 4,743,464 2,766,693 2,721,646 2,824,634 6,441,746 4,613,342 2,747,825 4,489,698 3,527,224 1,590,218
11,515,229 9,456,204 7,491,289 7,256,391 6,248,870 4,414,852
152,844,980 134,958,039 132,504,564 128,016,030 126,926,225 103,758,151 591,708
11,514,055 11,493,475 11,179,949 9,906,502 10,484,767 8,697,909 24,298,624 45,888,525 35,581,478 35,242,190 17,988,546 22,649,838
189,249,367$ 192,340,039$ 179,265,991$ 173,164,722$ 155,399,538$ 135,105,898$

102
2014 2013 2012 2011
ExpensesGovernmental activities:
Instruction 347,695,598$ 326,972,420$ 292,381,916$ 348,387,954$
Instructional resources and media services 7,048,633 6,274,891 5,963,914 6,897,415
Curriculum and instructional staff development 10,292,439 9,499,551 6,701,859 10,215,377
Instructional leadership 7,124,368 6,687,141 5,435,172 7,334,939
School leadership 27,253,780 25,724,635 21,294,889 26,790,801
Guidance, counseling, and evaluation services 25,530,501 23,682,670 17,621,819 22,504,083
Social work services 2,326,072 2,138,454 1,780,216 2,336,399
Health services 5,501,273 5,108,523 4,840,254 5,197,041
Pupil transportation 10,901,683 10,203,605 8,976,259 11,096,233
Food services 388,674 432,435 344,969 322,046
Cocurricular/extracurricular activities 9,412,633 8,833,151 8,147,211 9,483,994
General administration 7,033,855 6,540,185 5,499,431 6,986,698
Plant maintenance and operations 51,447,854 50,879,295 45,045,408 54,973,176
Security and monitoring services 5,144,430 4,942,866 3,835,434 4,839,013
Data processing services 8,197,313 7,628,023 6,664,602 8,134,179
Community services 3,179,647 3,115,412 2,835,888 3,991,485
Debt service - interest on long-term debt 15,486,058 19,368,480 16,860,954 19,944,575
Bond issuance cost and fees - - - -
Facilities repairs and maintenance 1,413,049 970,785 - -
Payments to Juvenile Justice Alt. Ed. Program 53,396 41,125 266,250 350,625
Payments to Tax Increment Fund 7,565,996 3,817,396 3,507,648 3,526,152
Other intergovernmental charges 1,782,827 1,668,202 1,234,497 1,557,935
Total governmental activities 554,780,079 524,529,245 459,238,590 554,870,120
Business-type activities:Food services 30,208,241 28,573,344 25,529,203 25,846,331
Total Expenses 584,988,320 553,102,589 484,767,793 580,716,451
Program RevenuesGovernmental activities:
Charges for services 2,864,989 2,956,248 2,682,308 2,992,981
Operating grants and contributions 65,603,117 62,110,376 55,880,066 123,583,489
Total governmental activities 68,468,106 65,066,624 58,562,374 126,576,470
Business-type activities:Charges for services 6,197,429 6,233,987 5,744,326 6,296,733
Operating grants and contributions 26,175,558 25,409,362 21,856,266 21,051,104
Total business-type activities 32,372,987 31,643,349 27,600,592 27,347,837
Total Program Revenues 100,841,093 96,709,973 86,162,966 153,924,307
Net Expenses (484,147,227)$ (456,392,616)$ (398,604,827)$ (426,792,144)$
Note: The District's fiscal year end date was changed from August 31 to June 30, with the fiscal year ended
June 30, 2012 being a ten month conversion year.
Source: The Statement of Activities for the Arlington Independent School District
ARLINGTON INDEPENDENT SCHOOL DISTRICTExpenses, Program Revenues, and Net Expenses
Last Ten Fiscal Years(Unaudited)
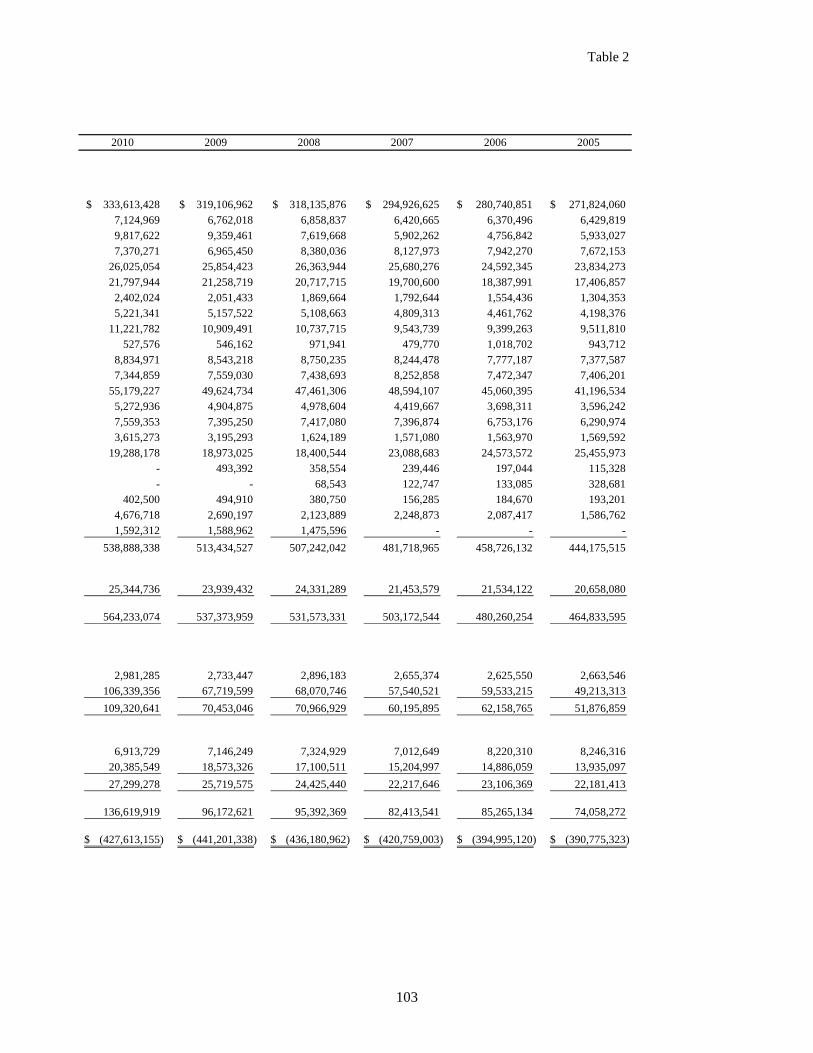
103
Table 2
2010 2009 2008 2007 2006 2005
333,613,428$ 319,106,962$ 318,135,876$ 294,926,625$ 280,740,851$ 271,824,060$
7,124,969 6,762,018 6,858,837 6,420,665 6,370,496 6,429,819 9,817,622 9,359,461 7,619,668 5,902,262 4,756,842 5,933,027
7,370,271 6,965,450 8,380,036 8,127,973 7,942,270 7,672,153 26,025,054 25,854,423 26,363,944 25,680,276 24,592,345 23,834,273
21,797,944 21,258,719 20,717,715 19,700,600 18,387,991 17,406,857 2,402,024 2,051,433 1,869,664 1,792,644 1,554,436 1,304,353
5,221,341 5,157,522 5,108,663 4,809,313 4,461,762 4,198,376
11,221,782 10,909,491 10,737,715 9,543,739 9,399,263 9,511,810 527,576 546,162 971,941 479,770 1,018,702 943,712
8,834,971 8,543,218 8,750,235 8,244,478 7,777,187 7,377,587 7,344,859 7,559,030 7,438,693 8,252,858 7,472,347 7,406,201
55,179,227 49,624,734 47,461,306 48,594,107 45,060,395 41,196,534 5,272,936 4,904,875 4,978,604 4,419,667 3,698,311 3,596,242
7,559,353 7,395,250 7,417,080 7,396,874 6,753,176 6,290,974 3,615,273 3,195,293 1,624,189 1,571,080 1,563,970 1,569,592
19,288,178 18,973,025 18,400,544 23,088,683 24,573,572 25,455,973 - 493,392 358,554 239,446 197,044 115,328
- - 68,543 122,747 133,085 328,681 402,500 494,910 380,750 156,285 184,670 193,201
4,676,718 2,690,197 2,123,889 2,248,873 2,087,417 1,586,762 1,592,312 1,588,962 1,475,596 - - -
538,888,338 513,434,527 507,242,042 481,718,965 458,726,132 444,175,515
25,344,736 23,939,432 24,331,289 21,453,579 21,534,122 20,658,080
564,233,074 537,373,959 531,573,331 503,172,544 480,260,254 464,833,595
2,981,285 2,733,447 2,896,183 2,655,374 2,625,550 2,663,546 106,339,356 67,719,599 68,070,746 57,540,521 59,533,215 49,213,313
109,320,641 70,453,046 70,966,929 60,195,895 62,158,765 51,876,859
6,913,729 7,146,249 7,324,929 7,012,649 8,220,310 8,246,316 20,385,549 18,573,326 17,100,511 15,204,997 14,886,059 13,935,097
27,299,278 25,719,575 24,425,440 22,217,646 23,106,369 22,181,413
136,619,919 96,172,621 95,392,369 82,413,541 85,265,134 74,058,272
(427,613,155)$ (441,201,338)$ (436,180,962)$ (420,759,003)$ (394,995,120)$ (390,775,323)$
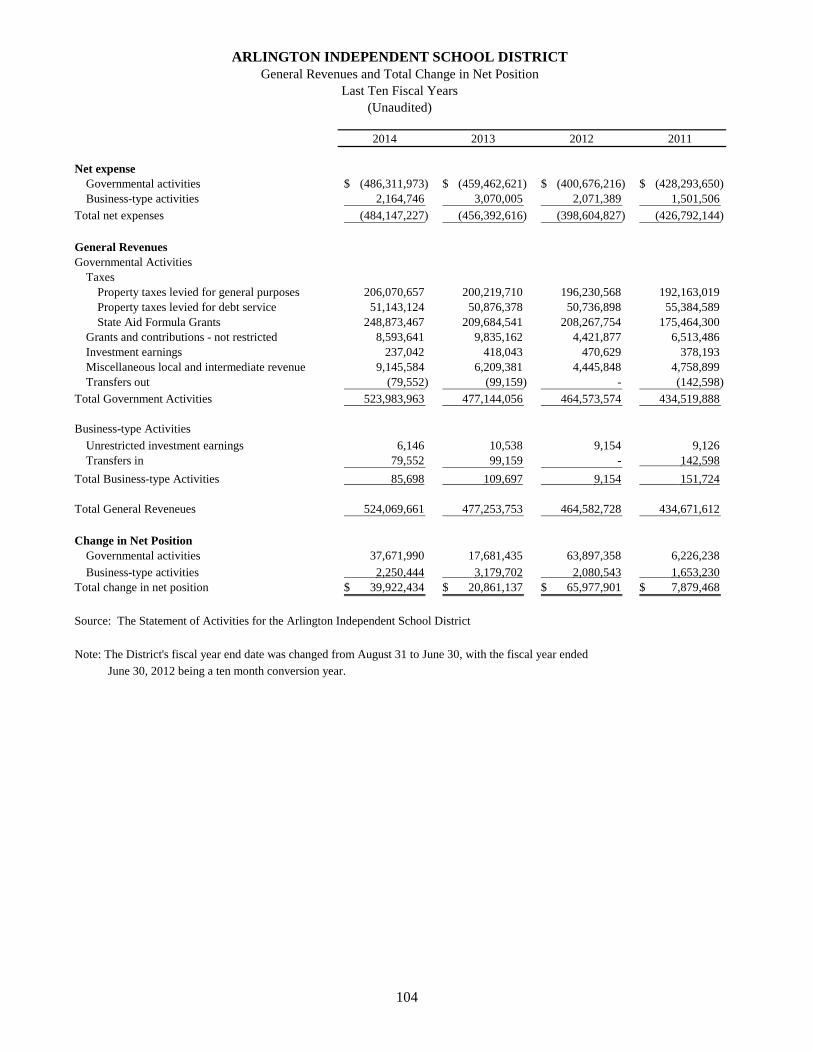
104
2014 2013 2012 2011
Net expenseGovernmental activities (486,311,973)$ (459,462,621)$ (400,676,216)$ (428,293,650)$ Business-type activities 2,164,746 3,070,005 2,071,389 1,501,506
Total net expenses (484,147,227) (456,392,616) (398,604,827) (426,792,144)
General RevenuesGovernmental Activities
TaxesProperty taxes levied for general purposes 206,070,657 200,219,710 196,230,568 192,163,019 Property taxes levied for debt service 51,143,124 50,876,378 50,736,898 55,384,589 State Aid Formula Grants 248,873,467 209,684,541 208,267,754 175,464,300
Grants and contributions - not restricted 8,593,641 9,835,162 4,421,877 6,513,486 Investment earnings 237,042 418,043 470,629 378,193 Miscellaneous local and intermediate revenue 9,145,584 6,209,381 4,445,848 4,758,899 Transfers out (79,552) (99,159) - (142,598)
Total Government Activities 523,983,963 477,144,056 464,573,574 434,519,888
Business-type Activities
Unrestricted investment earnings 6,146 10,538 9,154 9,126 Transfers in 79,552 99,159 - 142,598
Total Business-type Activities 85,698 109,697 9,154 151,724
Total General Reveneues 524,069,661 477,253,753 464,582,728 434,671,612
Change in Net PositionGovernmental activities 37,671,990 17,681,435 63,897,358 6,226,238
Business-type activities 2,250,444 3,179,702 2,080,543 1,653,230 Total change in net position 39,922,434$ 20,861,137$ 65,977,901$ 7,879,468$
Source: The Statement of Activities for the Arlington Independent School District
Note: The District's fiscal year end date was changed from August 31 to June 30, with the fiscal year ended
June 30, 2012 being a ten month conversion year.
(Unaudited)
ARLINGTON INDEPENDENT SCHOOL DISTRICTGeneral Revenues and Total Change in Net Position
Last Ten Fiscal Years

105
Table 3
2010 2009 2008 2007 2006 2005
(429,567,697)$ (442,981,481)$ (436,275,113)$ (421,523,070)$ (396,567,367)$ (392,276,818)$ 1,954,542 1,780,143 94,151 764,067 1,572,247 1,523,333
(427,613,155) (441,201,338) (436,180,962) (420,759,003) (394,995,120) (390,753,485)
209,744,123 213,225,430 203,831,754 254,867,064 269,294,985 263,452,389 47,297,808 48,103,125 46,996,542 45,037,591 44,407,232 45,128,067
157,265,155 168,943,843 176,346,363 119,521,344 84,788,321 83,833,978 4,892,850 2,768,238 1,582,590 1,202,126 1,460,292 38,187
451,996 1,994,577 8,240,277 10,708,678 9,682,596 5,481,626 4,858,323 19,215,304 5,170,591 7,047,149 5,553,945 3,392,451
(92,255) (159,903) (26,633) (103,219) (160,382) (123,264)
424,418,000 454,090,614 442,141,484 438,280,733 415,026,989 401,203,434
12,228 24,869 114,114 140,235 101,389 20,394 92,255 159,903 26,633 103,219 160,382 123,264
104,483 184,772 140,747 243,454 261,771 143,658
424,522,483 454,275,386 442,282,231 438,524,187 415,288,760 401,347,092
(5,149,697) 11,109,133 5,866,371 16,757,663 18,459,622 8,926,616
2,059,025 1,964,915 234,898 1,007,521 1,834,018 1,666,991 (3,090,672)$ 13,074,048$ 6,101,269$ 17,765,184$ 20,293,640$ 10,593,607$
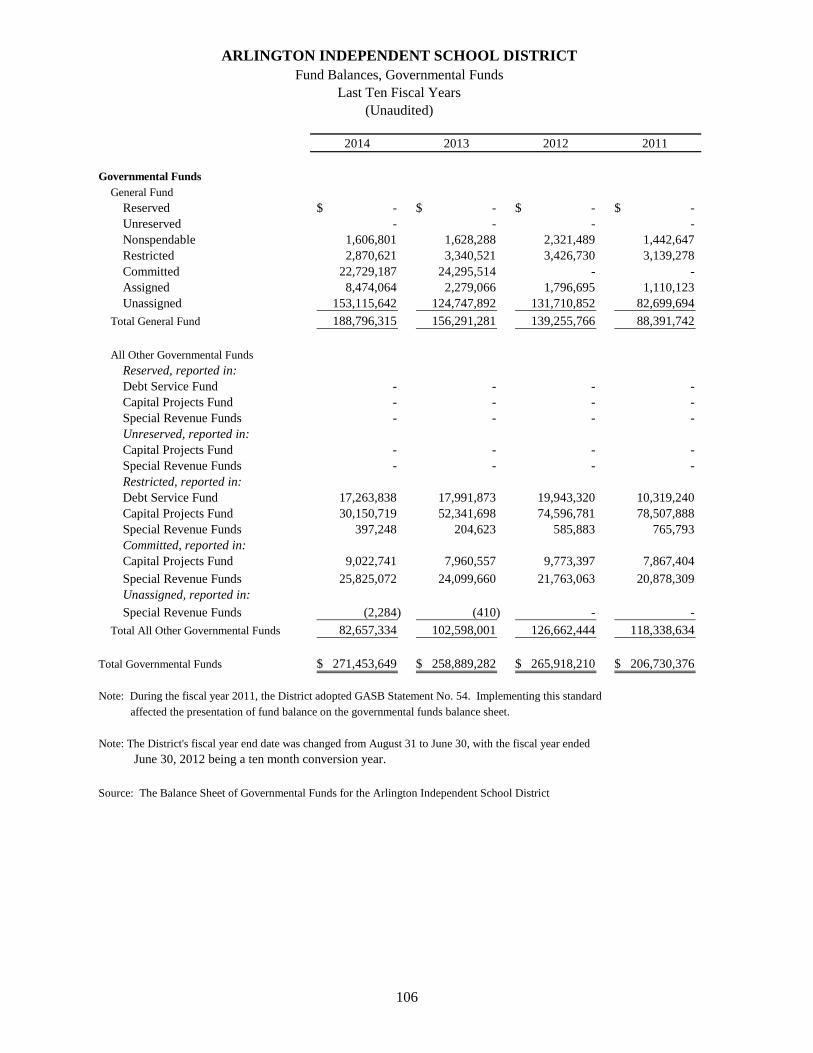
106
2014 2013 2012 2011
Governmental Funds
General Fund
Reserved -$ -$ -$ -$ Unreserved - - - - Nonspendable 1,606,801 1,628,288 2,321,489 1,442,647 Restricted 2,870,621 3,340,521 3,426,730 3,139,278 Committed 22,729,187 24,295,514 - - Assigned 8,474,064 2,279,066 1,796,695 1,110,123 Unassigned 153,115,642 124,747,892 131,710,852 82,699,694
Total General Fund 188,796,315 156,291,281 139,255,766 88,391,742
All Other Governmental Funds
Reserved, reported in:Debt Service Fund - - - - Capital Projects Fund - - - - Special Revenue Funds - - - - Unreserved, reported in:Capital Projects Fund - - - - Special Revenue Funds - - - - Restricted, reported in:Debt Service Fund 17,263,838 17,991,873 19,943,320 10,319,240 Capital Projects Fund 30,150,719 52,341,698 74,596,781 78,507,888 Special Revenue Funds 397,248 204,623 585,883 765,793 Committed, reported in:Capital Projects Fund 9,022,741 7,960,557 9,773,397 7,867,404
Special Revenue Funds 25,825,072 24,099,660 21,763,063 20,878,309 Unassigned, reported in:
Special Revenue Funds (2,284) (410) - -
Total All Other Governmental Funds 82,657,334 102,598,001 126,662,444 118,338,634
Total Governmental Funds 271,453,649$ 258,889,282$ 265,918,210$ 206,730,376$
Note: During the fiscal year 2011, the District adopted GASB Statement No. 54. Implementing this standard
affected the presentation of fund balance on the governmental funds balance sheet.
Note: The District's fiscal year end date was changed from August 31 to June 30, with the fiscal year ended
June 30, 2012 being a ten month conversion year.
Source: The Balance Sheet of Governmental Funds for the Arlington Independent School District
ARLINGTON INDEPENDENT SCHOOL DISTRICTFund Balances, Governmental Funds
Last Ten Fiscal Years(Unaudited)

107
Table 4
2010 2009 2008 2007 2006 2005
2,885,729$ 1,747,764$ 2,337,995$ 3,779,183$ 4,535,119$ 2,379,418$ 72,834,097 72,201,941 82,792,531 93,219,104 89,944,084 83,778,822
- - - - - - - - - - - - - - - - - - - - - - - - - - - - - -
75,719,826 73,949,705 85,130,526 96,998,287 94,479,203 86,158,240
10,893,002 11,493,475 11,179,949 9,906,502 10,484,767 8,697,909 7,212,480 402,724 337,560 1,025,973 58,648 201,263
131,285 19,871 354,240 119,540 103,221 93,404
60,228,753 21,591,851 22,034,951 22,958,872 25,500,326 27,457,144 18,909,781 22,566,161 7,966,570 3,043,145 82,301 200,005
- - - - - - - - - - - - - - - - - -
- - - - - -
- - - - - -
- - - - - -
97,375,301 56,074,082 41,873,270 37,054,032 36,229,263 36,649,725
173,095,127$ 130,023,787$ 127,003,796$ 134,052,319$ 130,708,466$ 122,807,965$

108
2014 2013 2012 2011
ExpendituresGovernmental Activities11 Instruction 333,760,496$ 315,443,325$ 282,673,930$ 337,517,461$ 12 Instructional resources and media services 6,759,756 6,013,136 5,701,051 6,627,414 13 Curriculum and staff development services 10,105,982 9,347,159 6,613,513 10,075,614
Total function 10 350,626,234 330,803,620 294,988,494 354,220,489
21 Instructional leadership 6,836,929 6,408,693 5,253,816 7,086,068 23 School leadership 25,939,275 24,550,708 20,425,269 25,630,104
Total function 20 32,776,204 30,959,401 25,679,085 32,716,172
31 Guidance, counseling, and evaluation services 24,417,906 22,666,317 16,979,919 21,652,300 32 Social work services 2,325,244 2,137,027 1,736,929 2,245,542 33 Health services 5,233,736 4,872,288 4,623,820 4,956,320 34 Student transportation 13,196,865 12,524,372 8,723,934 15,807,145 35 Food service 388,210 433,000 349,393 323,496 36 Extracurricular activities 9,065,988 8,467,395 7,804,876 9,094,628
Total function 30 54,627,949 51,100,399 40,218,871 54,079,431
41 General administration 6,739,452 6,285,394 5,466,109 6,654,255 Total function 40 6,739,452 6,285,394 5,466,109 6,654,255
51 Plant maintenance and operations 50,130,534 49,651,274 43,947,936 53,716,243 52 Security and monitoring services 5,207,624 5,540,877 3,780,303 4,905,258 53 Data processing services 9,408,419 8,440,673 7,158,556 9,272,962
Total function 50 64,746,577 63,632,824 54,886,795 67,894,463
61 Community services 3,178,207 3,111,373 2,835,888 4,013,529 Total function 60 3,178,207 3,111,373 2,835,888 4,013,529
71 Debt service71 Principal on long-term debt 41,621,319 37,769,533 37,834,692 38,553,033 72 Interest on long-term debt 16,065,298 20,349,329 10,554,395 20,227,161 73 Bond issuance costs and fees 485,189 682,386 587,366 686,532
Total function 70 58,171,806 58,801,248 48,976,453 59,466,726
81 Facilities acquisition/construction 17,302,865 18,511,812 14,201,868 14,016,545 Total function 80 17,302,865 18,511,812 14,201,868 14,016,545
95 Payments to Juvenile Justice Alt. Ed. Program 53,396 41,125 266,250 350,625 97 Payments to Tax Increment Fund 7,565,996 3,817,396 3,507,648 3,526,152 99 Other intergovernmental charges 1,782,827 1,668,202 1,234,497 1,557,935
Total function 90 9,402,219 5,526,723 5,008,395 5,434,712
Total Expenditures 597,571,513$ 568,732,794$ 492,261,958$ 598,496,322$
Debt Service as a % of noncapital expenditures: 10.03% 10.70% 10.18% 10.20%
1 Includes General, Debt Service, Capital Projects, and Special Revenue Funds; Excludes capital expenditures and bond issuance costs and fees.
Note: The District's fiscal year end date was changed from August 31 to June 30, with the fiscal year ended June 30, 2012 being a ten month conversion year.
Source: Statement of Revenues, Expenditures, and Changes in Fund Balances Governmental Funds - Governmental Funds
ARLINGTON INDEPENDENT SCHOOL DISTRICTGovernmental Funds Expenditures and Debt Service Ratio1
Last Ten Fiscal Years (Unaudited)

109
Table 5
2010 2009 2008 2007 2006 2005
321,288,764$ 306,723,075$ 303,669,652$ 281,059,009$ 266,791,043$ 256,424,463$ 6,842,736 6,512,774 6,650,970 6,192,909 6,151,694 6,146,011 9,651,957 9,262,192 7,594,366 5,902,513 4,765,322 5,823,334
337,783,457 322,498,041 317,914,988 293,154,431 277,708,059 268,393,808
7,156,101 6,790,192 8,378,649 8,095,663 8,038,052 7,577,191 24,875,316 24,788,344 24,864,910 23,930,713 22,997,856 22,334,947 32,031,417 31,578,536 33,243,559 32,026,376 31,035,908 29,912,138
20,957,060 20,489,517 19,751,286 18,629,694 17,268,933 16,425,218 2,402,098 2,055,563 1,869,337 1,791,682 1,555,261 1,311,213 4,993,365 4,946,724 4,907,937 4,633,344 4,259,540 4,002,672
10,714,690 10,529,201 12,265,659 10,769,991 10,485,823 9,999,704 639,414 593,065 456,308 505,921 558,603 521,963
8,470,813 8,184,309 8,612,057 7,589,312 7,177,315 6,778,141 48,177,440 46,798,379 47,862,584 43,919,944 41,305,475 39,038,911
7,052,625 7,281,396 7,479,662 8,260,795 7,511,952 7,412,954 7,052,625 7,281,396 7,479,662 8,260,795 7,511,952 7,412,954
53,638,705 47,613,777 47,193,293 48,587,281 44,663,482 41,387,827 5,246,305 4,699,965 4,712,767 4,292,615 3,462,366 3,325,269 7,588,830 7,182,359 7,922,556 7,656,137 7,159,563 6,195,326
66,473,840 59,496,101 59,828,616 60,536,033 55,285,411 50,908,422
3,615,273 3,194,170 1,604,699 1,571,080 1,544,259 1,554,195 3,615,273 3,194,170 1,604,699 1,571,080 1,544,259 1,554,195
28,870,288 29,539,530 32,378,416 30,872,051 21,862,060 23,222,943 19,431,220 20,028,332 19,353,333 21,719,966 29,952,797 28,302,210
468,727 258,622 1,062,200 16,567 792,269 48,770,235 49,826,484 52,793,949 52,608,584 52,607,126 51,525,153
7,712,002 555,969 1,312,178 2,880,923 2,039,093 6,475,785 7,712,002 555,969 1,312,178 2,880,923 2,039,093 6,475,785
402,500 494,910 380,750 156,285 184,670 193,201 4,676,718 2,690,197 2,123,889 2,248,873 2,087,417 1,586,762 1,592,312 1,588,962 1,475,596 6,671,530 4,774,069 2,504,639 2,405,158 2,272,087 1,779,963
558,287,819$ 526,003,145$ 524,544,874$ 497,363,324$ 471,309,370$ 457,001,329$
8.79% 9.44% 9.95% 10.71% 11.11% 11.53%

110
2014 2013 2012 2011
Federal SourcesFederal grants 41,952,884$ 43,385,720$ 36,002,530$ 97,835,232$
State SourcesState education finance program 270,883,707 228,966,201 219,479,345 197,935,860 State grants and other sources 9,900,166 8,966,911 11,896,826 7,008,854
Total State Sources 280,783,873 237,933,112 231,376,171 204,944,714
Local SourcesProperty taxes 261,295,774 251,505,877 246,967,468 251,384,848 Capital Projects Funds 1,185,374 785,629 758,161 807,012 Athletic/extracurricular activities 638,644 665,371 716,770 705,751 Other local sources 6,863,764 9,670,141 7,365,653 9,094,658
Total Local Sources 269,983,556 262,627,018 255,808,052 261,992,269
Total Revenues 592,720,313$ 543,945,850$ 523,186,753$ 564,772,215$
1 Includes General, Debt Service, Capital Projects, and Special Revenue Funds
Note: The District's fiscal year end date was changed from August 31 to June 30, with the fiscal year ended June 30, 2012 being a ten month conversion year.
Source: Statement of Revenues, Expenditures, and Changes in Fund Balances - Governmental Funds
ARLINGTON INDEPENDENT SCHOOL DISTRICTGovernmental Funds Revenues
Last Ten Fiscal Years1
(Unaudited)

111
Table 6
2010 2009 2008 2007 2006 2005
80,665,294$ 37,598,710$ 33,431,030$ 30,530,310$ 35,955,353$ 25,354,863$
180,200,696 199,547,501 210,863,521 146,409,376 108,245,489 107,610,783 7,268,336 1,947,977 1,582,590 1,202,126 1,460,292 38,187
187,469,032 201,495,478 212,446,111 147,611,502 109,705,781 107,648,970
262,647,327 269,654,275 250,828,296 303,417,980 313,702,217 308,580,456 692,089 849,536 1,313,291 1,847,001 2,536,749 2,168,445 890,184 712,894 722,281 663,823 710,082 687,734
(527,152) 14,677,265 14,516,562 12,810,829 13,145,699 7,903,920
263,702,448 285,893,970 267,380,430 318,739,633 330,094,747 319,340,555
531,836,774$ 524,988,158$ 513,257,571$ 496,881,445$ 475,755,881$ 452,344,388$

112
2014 2013 2012 2011
Excess of revenues over (under) expenditures (4,851,200)$ (24,786,944)$ 30,924,795$ (33,724,107)$
Other financial sources (uses):General long-term debt issued 16,180,000 16,390,000 44,364,966 64,372,485 General long-term debt refunding 72,020,000 76,482,234 - - Premium or discount on issuance of bonds 8,081,458 7,667,322 4,733,364 2,644,506 Sale of real and personal property 35,384 69,561 34,881 395,149 Proceeds from capital leases - - - 89,815 Loan Issuance 433,107 - - - Transfers in - 2,799 1,925,679 - Transfers out (79,552) (98,958) (1,925,679) (142,598) Payment to escrow agent (79,254,833) (82,754,942) (20,870,172) - Natural gas lease - - - -
Total other financing sources (uses) 17,415,564 17,758,016 28,263,039 67,359,357
Net change in fund balances 12,564,364$ (7,028,928)$ 59,187,834$ 33,635,250$
Note: The District's fiscal year end date was changed from August 31 to June 30, with the fiscal year ended June 30, 2012 being a ten month conversion year.
Source: Statement of Revenues, Expenditures, and Changes in Fund Balances - Governmental Funds
ARLINGTON INDEPENDENT SCHOOL DISTRICTOther Financing Sources and Uses and Net Change in Fund Balances
Last Ten Fiscal Years(Unaudited)

113
Table 7
2010 2009 2008 2007 2006 2005
(26,451,045)$ (1,014,987)$ (12,762,899)$ (481,879)$ 4,446,521$ (6,333,658)$
- - - - - - 65,755,000 12,465,000 114,350,000 - 82,880,000 190,872,530
1,748,110 430,700 5,508,050 - 5,696,384 27,621,179 917,386 - 574,010 74,634 384,226 6,400 219,578 - 70,215 - 264,066 251,710 974,566 3,924,908 - 232,843 1,653,465 -
3,585,325 18,896 32,243 44,769 73,979 211,989 (3,677,580) (156,799) (20,876) (97,988) (152,544) (106,792)
(12,647,727) (118,844,460) (88,067,671) (217,752,441) 4,045,194 3,571,474 722,075 -
69,522,385 4,034,978 5,714,376 3,825,732 3,453,980 1,104,575
43,071,340$ 3,019,991$ (7,048,523)$ 3,343,853$ 7,900,501$ (5,229,083)$

114
Table 8
FiscalYear
2005 17,531,539,556$ 3,514,371,045$ 3,362,905,214$ 17,683,005,387$ 1.755000 2006 18,181,134,394 3,693,993,256 3,624,947,075 18,250,180,575 1.745460 2007 18,953,034,734 3,909,156,717 3,706,366,029 19,155,825,422 1.610000 2008 19,836,493,860 4,011,609,057 3,773,706,485 20,074,396,432 1.278000 2009 20,718,304,882 4,232,461,721 4,044,966,210 20,905,800,393 1.272000 2010 20,903,886,353 4,346,942,585 4,494,749,382 20,756,079,556 1.272000 2011 20,041,660,089 3,858,013,644 4,550,637,253 19,349,036,480 1.335000 2012 20,018,366,118 4,131,626,701 4,677,226,996 19,472,765,823 1.305500 2013 20,281,235,605 4,289,821,428 4,791,725,694 19,779,331,339 1.301000 2014 20,953,089,907 4,259,956,704 4,992,128,887 20,220,917,724 1.292170
Source: Tarrant County
DirectRateReal Property
orProperty
Less: TaxableValueExemptions
Personal
ARLINGTON INDEPENDENT SCHOOL DISTRICTAppraised Value and Actual Value of Taxable Property
Last Ten Fiscal Years(Unaudited)
Residential Estimated Appraised Value Total
Total

115
Table 9
City of City of City of
Fiscal Local Debt Tarrant City of Fort Grand Town of Dalworthington
Year Maintenance Service Total County2 Arlington Worth Prairie Pantego Gardens
2004-05 1.500000 0.255000 1.755000 0.737277 0.648000 0.865000 0.669998 0.400200 0.262739
2005-06 1.500000 0.245460 1.745460 0.736627 0.648000 0.865000 0.669998 0.398834 0.262739
2006-07 1.370000 0.240000 1.610000 0.735277 0.648000 0.860000 0.669998 0.382880 0.262739
2007-08 1.040000 0.238000 1.278000 0.720277 0.648000 0.855000 0.669998 0.373270 0.262739
2008-09 1.040000 0.232000 1.272000 0.713857 0.648000 0.855000 0.669998 0.373270 0.262739
2009-10 1.040000 0.232000 1.272000 0.713567 0.648000 0.855000 0.669998 0.373270 0.262739
2010-11 1.040000 0.295000 1.335000 0.713537 0.648000 0.855000 0.669998 0.373270 0.262739
2011-12 1.040000 0.265500 1.305500 0.724867 0.648000 0.855000 0.669998 0.410000 0.262739
2012-13 1.040000 0.261000 1.301000 0.724867 0.648000 0.855000 0.669998 0.410000 0.262739
2013-14 1.040000 0.252170 1.292170 0.741397 0.648000 0.855000 0.669998 0.420000 0.262739
1Includes rates for operating and debt service costs
2Includes Tarrant County, Tarrant County College, Tarrant Regional Water District, JPS Health Network,
and Tarrant County Emergency Services District
Source: Tarrant County and City of Grand Prairie
ARLINGTON INDEPENDENT SCHOOL DISTRICTDirect and Overlapping Property Tax Rates
Last Ten Fiscal Years
(Unaudited)

116
Table 10
City ofFiscal AISD Property Tarrant City of City of City of Town of DalworthingtonYear Tax Levy County1 Arlington Fort Worth Grand Prairie Pantego Gardens
2005 302,196,873$ 581,310,368$ 99,636,338$ 232,455,241$ 47,567,932$ 830,594$ 633,282$ 2006 310,342,233 622,448,062 102,984,068 253,150,231 47,567,932 872,333 661,401 2007 301,491,681 684,748,246 107,697,040 289,444,942 53,828,763 875,013 713,036 2008 252,530,606 733,412,806 112,644,235 320,374,571 61,700,580 899,974 747,602 2009 252,351,441 774,430,479 116,732,720 336,676,822 65,699,162 932,155 754,256 2010 250,819,373 789,844,701 115,724,665 345,778,617 64,170,530 939,334 790,5912011 251,394,282 774,047,114 110,604,993 341,028,726 62,231,126 903,789 789,2842012 248,339,784 798,447,284 111,088,494 348,384,651 63,267,520 988,951 799,4552013 252,734,168 808,754,010 113,513,529 355,057,237 62,804,427 1,003,031 855,5802014 261,478,838 823,644,959 115,683,433 362,833,021 65,947,913 1,004,406 839,569
1 Includes Tarrant County, Tarrant County College, Tarrant Regional Water District, JPS Health Network, and Tarrant County Emergency Services District
Source: Tarrant County and City of Grand Prairie
Overlapping Levies
ARLINGTON INDEPENDENT SCHOOL DISTRICTDirect and Overlapping Property Tax Levies
Last Ten Fiscal Years(Unaudited)

117
Table 11
October 2013 October 2004Taxable TaxableValue Rank Value Rank
General Motors Corp. 296,849,826$ 1 1.43 % 382,778,244$ 1 2.16 %Parks at Arlington, LP. 165,545,717 2 0.80 126,550,000 3 0.72 Arlington Highlands LTD 165,448,090 3 0.80Oncor Electric Delivery Co., LLC 139,549,329 4 0.67 134,799,319 2 0.76 Grand Prairie Premium Outlets LP 135,229,080 5 0.65Bell Helicopter Textron, Inc 125,885,608 6 0.61Chesapeake Operating (WI) 95,418,040 7 0.46Republic Beverage 94,716,058 8 0.46 45,800,000 10 0.26 Six Flags Fund II LTD 84,252,537 9 0.41 70,400,254 7 0.40 Lincoln Square Dunhill LP 63,490,196 10 0.31Southwestern Bell 114,208,649 4 0.65 McKesson Corporation 107,250,236 5 0.61 Textron, Inc. 70,400,254 6 0.40 National Semiconductor 53,482,496 8 0.30 HC -Arlington 45,800,000 9 0.26
1,366,384,481$ 6.60 % 1,151,469,452$ 6.52 %
Source: Tarrant Appraisal District
ValueTaxable of Total
Percentage
ValueTaxable of Total
Percentage
ARLINGTON INDEPENDENT SCHOOL DISTRICTPrincipal Property Taxpayers
Current Year and Nine Years Ago (Unaudited)
2014 2005

118
Table 12
Collections inSubsequent
Years
Fiscal Year
2005 306,622,614$ 302,312,734$ 98.59 3,319,874$ 305,632,608$ 99.682006 313,505,624 308,744,944 98.48 4,041,028 312,785,972 99.772007 301,929,602 297,575,738 98.56 3,648,424 301,224,162 99.772008 251,372,677 248,501,872 98.86 2,304,429 250,806,301 99.772009 261,709,081 259,113,481 99.01 1,954,658 261,068,139 99.762010 257,375,792 255,811,075 99.39 728,303 256,539,378 99.682011 251,720,281 249,404,594 99.08 1,651,971 251,056,565 99.742012 248,476,320 243,830,921 98.13 3,907,596 247,738,517 99.702013 251,848,059 247,680,443 98.35 3,136,710 250,817,153 99.592014 261,478,838 257,643,578 98.53
Source: Tarrant County
ARLINGTON INDEPENDENT SCHOOL DISTRICTProperty Tax Levies and Collections
Last Ten Fiscal Years
Fiscal Year of the Levy Collected within the
Adjusted
(Unaudited)
Total Collections to Date
LevyAmount
Percentageof
Levy
Percentageof
Taxes Leviedfor the
AmountTaxesDelinquent
Fiscal Year
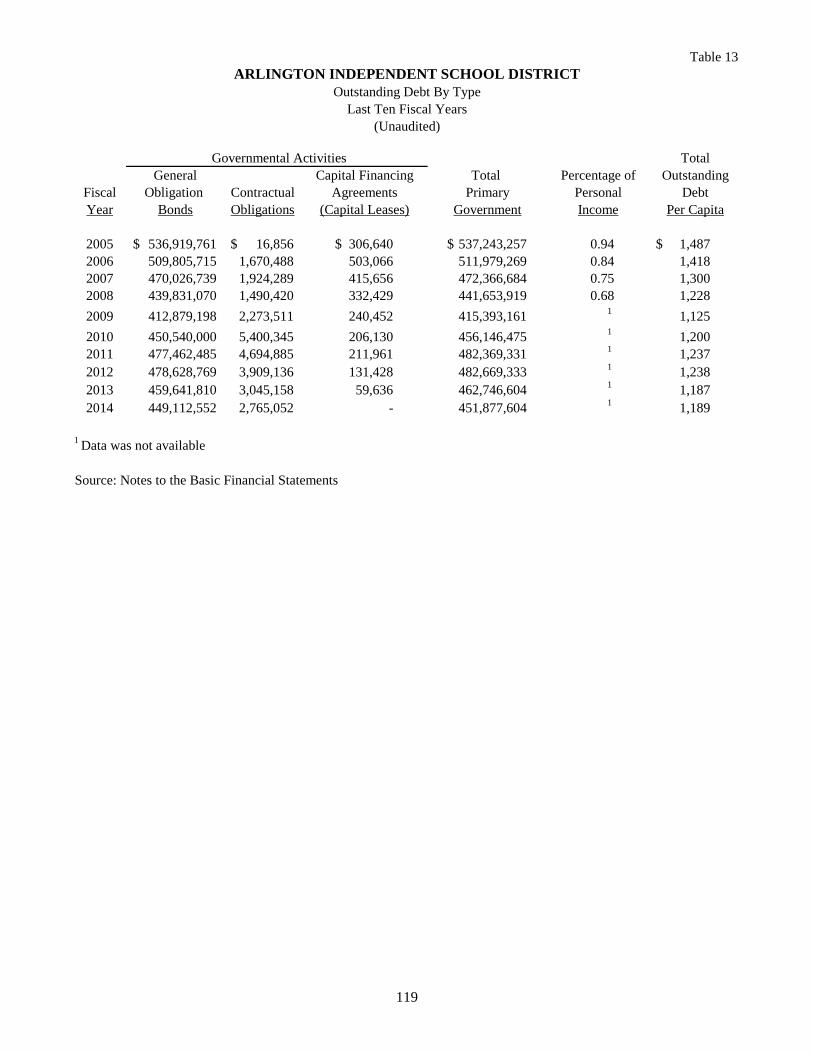
119
Table 13
General Total Fiscal Obligation Contractual PrimaryYear Bonds Obligations Government
2005 536,919,761$ 16,856$ 306,640$ 537,243,257$ 0.94 1,487$ 2006 509,805,715 1,670,488 503,066 511,979,269 0.84 1,418 2007 470,026,739 1,924,289 415,656 472,366,684 0.75 1,300 2008 439,831,070 1,490,420 332,429 441,653,919 0.68 1,228
2009 412,879,198 2,273,511 240,452 415,393,161 1 1,125
2010 450,540,000 5,400,345 206,130 456,146,475 1 1,200 2011 477,462,485 4,694,885 211,961 482,369,331 1 1,237 2012 478,628,769 3,909,136 131,428 482,669,333 1 1,238 2013 459,641,810 3,045,158 59,636 462,746,604 1 1,187 2014 449,112,552 2,765,052 - 451,877,604 1 1,189
1 Data was not available
Source: Notes to the Basic Financial Statements
ARLINGTON INDEPENDENT SCHOOL DISTRICTOutstanding Debt By Type
Last Ten Fiscal Years(Unaudited)
Governmental Activities
(Capital Leases)Agreements
Capital FinancingTotal
Percentage of
IncomePersonal
Per CapitaDebt
Outstanding

120
Table 14
Fiscal
Year
2005 362,426 17,683,005,387$ 536,919,761$ 8,697,909$ 528,221,852$ 2.99 1,457$
2006 362,393 18,250,180,575 509,805,715 10,484,767 499,320,948 2.74 1,378
2007 365,000 19,155,825,422 470,026,739 9,906,502 460,120,237 2.40 1,261
2008 369,150 20,074,396,432 439,831,070 11,179,949 428,651,121 2.14 1,161
2009 370,450 20,905,800,393 412,879,198 11,493,476 401,385,722 1.92 1,084
2010 380,085 20,756,079,556 450,540,000 10,893,002 439,646,998 2.12 1,157
2011 389,967 19,349,036,480 477,462,485 10,319,240 467,143,245 2.41 1,198
2012 389,967 19,472,765,823 465,377,451 19,943,320 445,434,131 2.29 1,142
2013 389,967 19,779,331,339 459,641,810 17,991,873 441,649,937 2.23 1,133
2014 380,084 20,220,917,724 449,112,552 17,263,838 431,848,714 2.14 1,136
Note: The District's fiscal year end date was changed from August 31 to June 30, with the fiscal year ended
June 30, 2012 being a ten month conversion year.
Source: Arlington Independent School District CAFR notes to the financial statements(1) This is the amount of Fund Balance restricted for Debt Service
Bonded Debt Capita
Debt PerNet Bonded Debt to
Assessed ValuePopulation Funds (1)
Debt Service
Value Bonded Debt
GrossAssessed
Ratio of Net
ARLINGTON INDEPENDENT SCHOOL DISTRICTRatio of Net Bonded Debt to Assessed Value and Net Bonded Debt Per Capita
Last Ten Fiscal Years(Unaudited)
Net BondedLess

121
Table 15
Government Entity
Tarrant County3 381,455,533$ 25.29 % 96,470,104$ City of Fort Worth 582,551,689 0.00City of Arlington 335,496,351 96.79 324,726,918 City of Grand Prairie 144,634,000 46.49 67,240,347 Town of Pantego 330,000 100.00 330,000 City of Dalworthington Gardens 1,145,000 100.00 1,145,000
Subtotal, Overlapping Bonded Debt 489,912,369
Arlington Independent School District direct debt 449,112,552 100.00 449,112,552
Total direct and overlapping debt 939,024,921$
Ratio of total direct and overlapping debt to: Assessed valuations for 2013 ($20,220,917,724) 4.64 % Full valuations for 2013 ($25,213,045,611) 3.72 %
Amount of total direct and overlapping debt per: Enrollment (64,688) 14,516$ Average daily attendance (59,245) 15,850 Per capita (estimated district population - 380,084) 2,471
Source: Tarrant County, City of Fort Worth, City of Arlington, City of Grand Prairie, Town of Pantego, City of Dalworthington Gardens
1 Estimated geographical percentage of the area of each entity that is within the boundaries of the Arlington Independent School District.
2 This schedule estimates the portion of the outstanding debt of those overlapping governments that is borne by the residents and businesses of the District.
3 Includes Tarrant County, Tarrant County College, and JPS Health Network
ARLINGTON INDEPENDENT SCHOOL DISTRICTStatement of Direct and Overlapping Debt
June 30, 2014(Unaudited)
Debt
OutstandingNet Amount
Estimated
Applicable1
Percentage Estimated
Debt2
Overlapping Direct andShare of

122
Table 16
FiscalYear
2005 1,768,300,539$ 528,221,852$ 1,240,078,687$ 29.872006 1,825,018,058 499,320,948 1,325,697,110 27.362007 1,915,582,542 460,120,237 1,455,462,305 24.022008 2,007,439,643 428,651,121 1,578,788,522 21.352009 2,090,580,039 401,385,723 1,689,194,316 19.202010 2,075,607,956 439,646,998 1,635,960,958 21.182011 1,934,903,648 467,143,245 1,467,760,403 24.142012 1,947,276,582 445,434,131 1,501,842,451 22.872013 1,977,865,049 459,641,810 1,518,223,239 23.242014 2,070,707,258 449,112,552 1,621,594,706 21.69
Legal debt margin calculation for fiscal year 2014:
Debt Limit (10% of Assessed Value) 2,070,707,258 Debt Applicable to Limit 449,112,552 Legal Debt Margin 1,621,594,706$
Debt Limit
ARLINGTON INDEPENDENT SCHOOL DISTRICTLegal Debt Margin Information
Last Ten Fiscal Years(Unaudited)
Total Net DebtApplicable to Limit as aPercentage of Debt LimitApplicable to Limit
Total Net Debt Legal DebtMargin

123
Table 17
Period
Ending
2005 362,426 1,925,586 63,800,913,000$ 33,133$ 4.72006 362,393 1,668,539 61,138,590,000 36,642 4.32007 365,000 1,717,435 63,687,642,105 37,083 4.02008 369,150 1,738,231 66,704,614,625 38,375 5.5
2009 370,450 4 4 4 4
2010 380,085 4 4 4 4
2011 389,967 2,231,390 4 4 8.32012 389,967 2,290,239 4 4 6.72013 389,967 2,409,121 4 4 5.62014 380,084 4 4 4 5.0
1 Source: City of Arlington operating budget projection
2 Source: Texas Workforce Commission or DSHS
3 Source: Arlington Chamber of Commerce
4 Data not available
Arlington Fort Worth
ARLINGTON INDEPENDENT SCHOOL DISTRICTDemographic and Economic Statistics
Last Ten Fiscal Years(Unaudited)
ArlingtonCity of
CapitaPer
Metro DivisionArlington Fort Worth
Population1
City of Arlington
Population2
Metro Division
Rate3
Unemployment
Income Income2
PersonalPersonal

124
2014
Taxpayer Type of Business Rank
Arlington Independent School District Public Education 8,055 1 3.23 %University of Texas at Arlington Higher Education 6,239 2 2.50
Six Flags Over Texas Amusement Park 3,500 1 3 1.40
City of Arlington Municipality 3,253 4 1.30General Motors Automobile Assembly 2,500 5 1.00Texas Health Resources - AMH Health Care 2,105 6 0.84
Texas Rangers Baseball Club Sports/Entertainment 2,100 1 7 0.84
Medical Center of Arlington Health Care 1,250 8 0.50
Cowboys Stadium Sports/Entertainment 1,000 1 9 0.40Chase Retail Banking Center Finance 800 10 0.32Americredit FinanceProvidian Financial Finance
30,802 12.34 %
1 Includes part-time and peak seasonal employees
Note: 2007 is the oldest data available for comparison
Source: City of Arlington (Total Arlington labor force in 2012 and 2007 was 249,579 and 192,060, respectively)
Percentage
Employees Employmentof Total City
ARLINGTON INDEPENDENT SCHOOL DISTRICTPrincipal Employers
Ranked for Current Year and 2007(Unaudited)

125
Table 18
2007
Percentageof Total City
Employees Rank Employment
8,088 1 4.21 %5,700 2 2.97
3,200 3 1.67
2,310 5 1.20 3,000 4 1.56 1,300 8 0.68
1,800 7 0.94
1,900 6 0.99 1,300 9 0.68 1,200 10 0.62
29,798 15.52 %
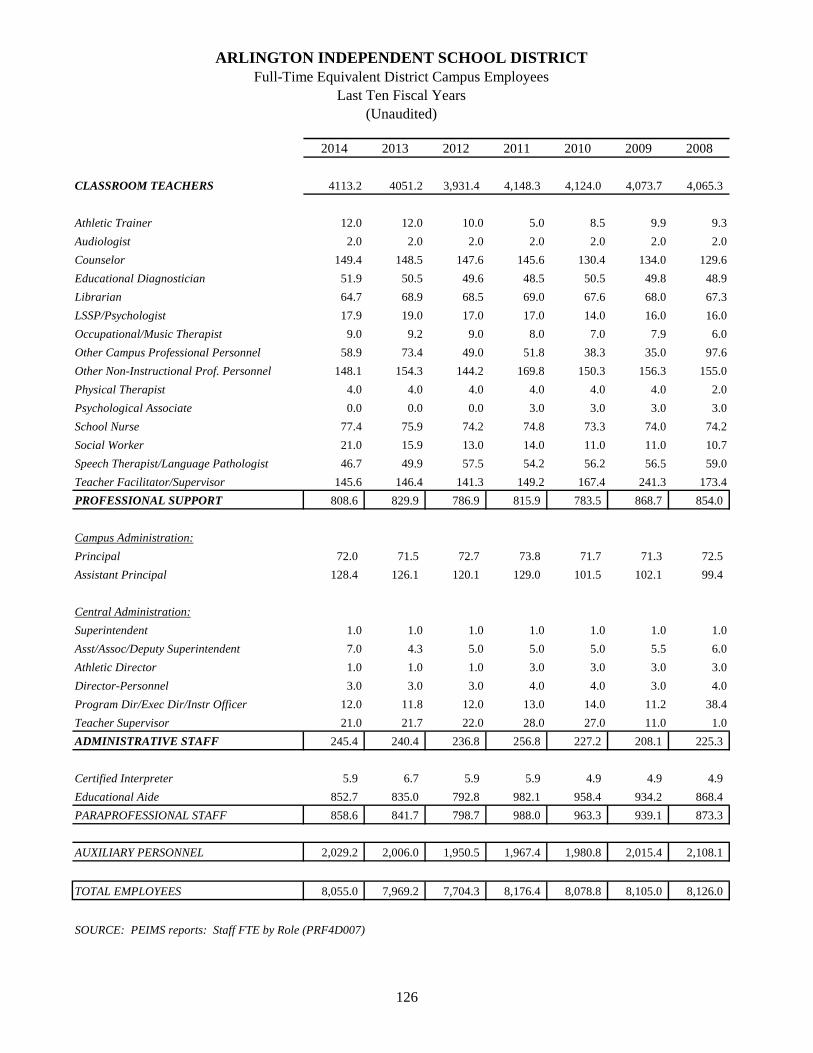
126
2014 2013 2012 2011 2010 2009 2008
CLASSROOM TEACHERS 4113.2 4051.2 3,931.4 4,148.3 4,124.0 4,073.7 4,065.3
Athletic Trainer 12.0 12.0 10.0 5.0 8.5 9.9 9.3
Audiologist 2.0 2.0 2.0 2.0 2.0 2.0 2.0
Counselor 149.4 148.5 147.6 145.6 130.4 134.0 129.6
Educational Diagnostician 51.9 50.5 49.6 48.5 50.5 49.8 48.9
Librarian 64.7 68.9 68.5 69.0 67.6 68.0 67.3
LSSP/Psychologist 17.9 19.0 17.0 17.0 14.0 16.0 16.0
Occupational/Music Therapist 9.0 9.2 9.0 8.0 7.0 7.9 6.0
Other Campus Professional Personnel 58.9 73.4 49.0 51.8 38.3 35.0 97.6
Other Non-Instructional Prof. Personnel 148.1 154.3 144.2 169.8 150.3 156.3 155.0
Physical Therapist 4.0 4.0 4.0 4.0 4.0 4.0 2.0
Psychological Associate 0.0 0.0 0.0 3.0 3.0 3.0 3.0
School Nurse 77.4 75.9 74.2 74.8 73.3 74.0 74.2
Social Worker 21.0 15.9 13.0 14.0 11.0 11.0 10.7
Speech Therapist/Language Pathologist 46.7 49.9 57.5 54.2 56.2 56.5 59.0
Teacher Facilitator/Supervisor 145.6 146.4 141.3 149.2 167.4 241.3 173.4
PROFESSIONAL SUPPORT 808.6 829.9 786.9 815.9 783.5 868.7 854.0
Campus Administration:
Principal 72.0 71.5 72.7 73.8 71.7 71.3 72.5
Assistant Principal 128.4 126.1 120.1 129.0 101.5 102.1 99.4
Central Administration:
Superintendent 1.0 1.0 1.0 1.0 1.0 1.0 1.0
Asst/Assoc/Deputy Superintendent 7.0 4.3 5.0 5.0 5.0 5.5 6.0
Athletic Director 1.0 1.0 1.0 3.0 3.0 3.0 3.0
Director-Personnel 3.0 3.0 3.0 4.0 4.0 3.0 4.0
Program Dir/Exec Dir/Instr Officer 12.0 11.8 12.0 13.0 14.0 11.2 38.4
Teacher Supervisor 21.0 21.7 22.0 28.0 27.0 11.0 1.0
ADMINISTRATIVE STAFF 245.4 240.4 236.8 256.8 227.2 208.1 225.3
Certified Interpreter 5.9 6.7 5.9 5.9 4.9 4.9 4.9
Educational Aide 852.7 835.0 792.8 982.1 958.4 934.2 868.4
PARAPROFESSIONAL STAFF 858.6 841.7 798.7 988.0 963.3 939.1 873.3
AUXILIARY PERSONNEL 2,029.2 2,006.0 1,950.5 1,967.4 1,980.8 2,015.4 2,108.1
TOTAL EMPLOYEES 8,055.0 7,969.2 7,704.3 8,176.4 8,078.8 8,105.0 8,126.0
SOURCE: PEIMS reports: Staff FTE by Role (PRF4D007)
ARLINGTON INDEPENDENT SCHOOL DISTRICTFull-Time Equivalent District Campus Employees
Last Ten Fiscal Years(Unaudited)

127
Table 19
2007 2006 2005
4,051.0 3,979.6 3,964.2
0.0 0.0 0.0
2.0 2.0 2.0
134.1 133.0 128.5
49.6 48.8 43.0
64.1 65.5 65.8
14.5 13.0 14.9
5.0 4.0 3.0
16.7 58.2 29.5
161.5 142.2 137.7
1.0 2.0 2.0
1.0 1.0 0.0
74.5 73.9 72.7
7.0 10.4 8.0
57.0 45.0 49.8
103.1 120.5 125.2
691.1 719.5 682.1
74.0 73.8 73.5
98.1 99.3 100.2
1.0 1.0 1.0
6.0 3.0 3.0
2.0 2.0 1.0
4.0 6.0 5.0
41.0 38.1 32.4
25.6 20.5 20.9
251.7 243.7 237.0
9.7 9.7 10.8
840.0 756.7 746.4
849.7 766.4 757.2
2,196.9 2,313.9 2,234.0
8,040.4 8,023.1 7,874.5

128

129
Table 20
Percentageof StudentsReceiving
General Fund Pupil- Free or Operating Cost Per Teaching Teacher Reduced-Price
Fiscal Year Enrollment1 Expenditures Pupil Staff Ratio Meals
2005 62,267 356,878,610$ 5,731 3.34 4,067 15.31 46.202006 63,397 369,836,203 5,834 1.78 4,083 15.53 49.302007 63,082 404,735,619 6,416 9.98 4,041 15.61 55.102008 62,863 428,581,183 6,818 6.26 4,063 15.47 54.402009 63,045 427,156,330 6,775 -0.62 4,236 14.88 54.702010 63,487 401,668,574 6,327 -6.61 4,228 15.02 59.722011 64,484 392,297,791 6,084 -3.84 4,301 14.99 62.982012 64,703 374,817,746 5,793 -4.78 3,931 16.46 65.342013 65,001 424,144,895 6,525 12.64 4,051 16.05 68.292014 64,688 456,594,071 7,058 8.17 4,113 15.73 68.42
Note: The District's fiscal year end date was changed from August 31 to June 30, with the fiscal year ended June 30, 2012 being a ten month conversion year.
1Amounts reported to the Texas Education Agency Public Education Information Management System (PEIMS)
Percentage
Change
ARLINGTON INDEPENDENT SCHOOL DISTRICTOperating Statistics
Last Ten Fiscal Years(Unaudited)
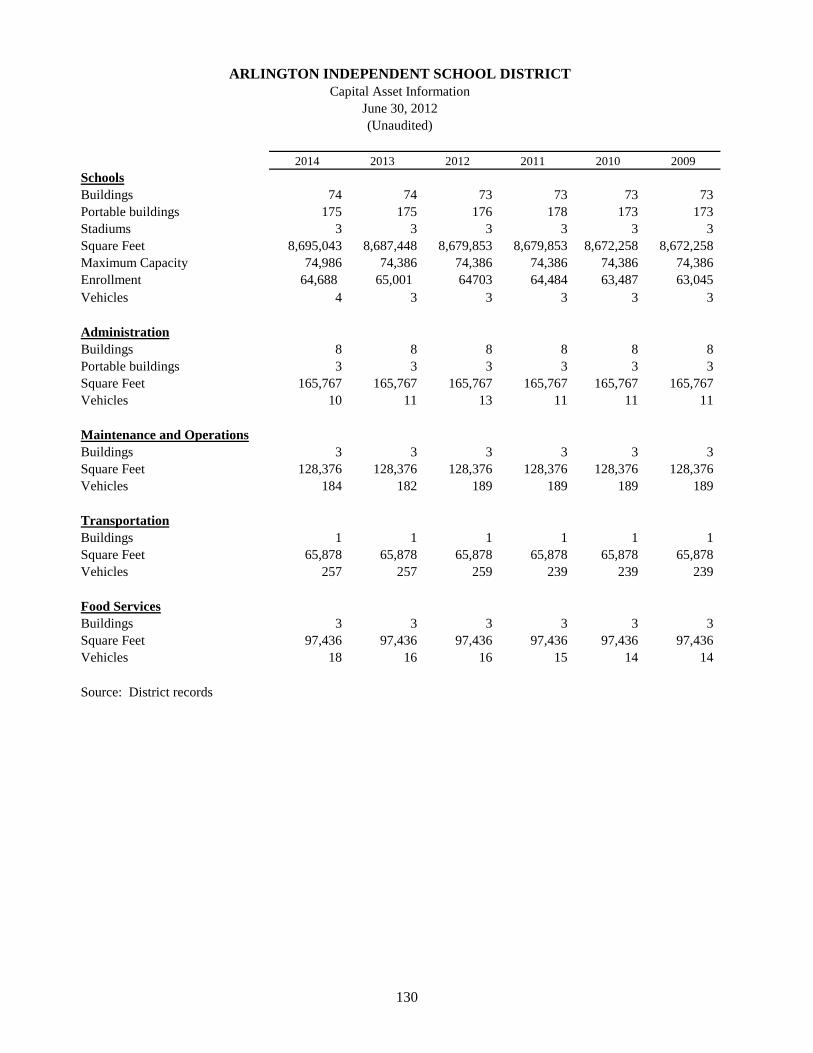
130
2014 2013 2012 2011 2010 2009
SchoolsBuildings 74 74 73 73 73 73 Portable buildings 175 175 176 178 173 173 Stadiums 3 3 3 3 3 3 Square Feet 8,695,043 8,687,448 8,679,853 8,679,853 8,672,258 8,672,258 Maximum Capacity 74,986 74,386 74,386 74,386 74,386 74,386 Enrollment 64,688 65,001 64703 64,484 63,487 63,045 Vehicles 4 3 3 3 3 3
AdministrationBuildings 8 8 8 8 8 8 Portable buildings 3 3 3 3 3 3 Square Feet 165,767 165,767 165,767 165,767 165,767 165,767 Vehicles 10 11 13 11 11 11
Maintenance and OperationsBuildings 3 3 3 3 3 3 Square Feet 128,376 128,376 128,376 128,376 128,376 128,376 Vehicles 184 182 189 189 189 189
TransportationBuildings 1 1 1 1 1 1 Square Feet 65,878 65,878 65,878 65,878 65,878 65,878 Vehicles 257 257 259 239 239 239
Food ServicesBuildings 3 3 3 3 3 3 Square Feet 97,436 97,436 97,436 97,436 97,436 97,436 Vehicles 18 16 16 15 14 14
Source: District records
Capital Asset InformationJune 30, 2012(Unaudited)
ARLINGTON INDEPENDENT SCHOOL DISTRICT

131
Table 21
2008 2007 2006 2005
73 73 73 73 167 155 142 136
3 3 3 3 8,658,491 8,640,059 8,640,059 8,640,059
74,386 74,386 74,386 74,386 62,863 63,082 63,397 62,267
3 3 1 1
8 8 8 8 3 3 3 3
165,767 165,767 165,767 165,767 11 11 11 11
3 3 3 3 128,376 128,376 128,376 128,376
192 184 184 184
1 1 1 1 65,878 65,878 65,878 65,878
239 233 233 233
3 3 3 3 97,436 97,436 97,436 97,436
13 11 11 11
132

133
FEDERAL AWARDS SECTION
134

Houston Offi ce 3411 Richmond AvenueSuite 500Houston, Texas 77046713.621.1515 Main
whitleypenn.com
An IndependentMember of
Dallas Fort Worth Houston
135
INDEPENDENT AUDITOR’S REPORT ON INTERNAL CONTROL OVER FINANCIAL REPORTING AND ON COMPLIANCE AND OTHER MATTERS BASED ON AN AUDIT OF
FINANCIAL STATEMENTS PERFORMED IN ACCORDANCE WITH GOVERNMENT AUDITING STANDARDS
To the Board of Trustees Arlington Independent School District Arlington, Texas
We have audited, in accordance with the auditing standards generally accepted in the United States of America and the standards applicable to financial audits contained in Government Auditing Standards issued by the Comptroller General of the United States, the financial statements of the governmental activities, the business-type activities, each major fund, and the aggregate remaining fund information of Arlington Independent School District (the “District”), as of and for the year ended June 30, 2014 , and the related notes to the financial statements, which collectively comprise the District’s basic financial statements, and have issued our report thereon dated November 20, 2014.
Internal Control Over Financial Reporting
In planning and performing our audit of the financial statements, we considered the District’s internal control over financial reporting (internal control) to determine the audit procedures that are appropriate in the circumstances for the purpose of expressing our opinions on the financial statements, but not for the purpose of expressing an opinion on the effectiveness of the District’s internal control. Accordingly, we do not express an opinion on the effectiveness of the District’s internal control.
A deficiency in internal control exists when the design or operation of a control does not allow management or employees, in the normal course of performing their assigned functions, to prevent, or detect and correct, misstatements on a timely basis. A material weakness is a deficiency, or a combination of deficiencies, in internal control, such that there is a reasonable possibility that a material misstatement of the entity’s financial statements will not be prevented, or detected and corrected on a timely basis. A significant deficiency is a deficiency, or a combination of deficiencies, in internal control that is less severe than a material weakness, yet important enough to merit attention by those charged with governance.
Our consideration of internal control was for the limited purpose described in the first paragraph of this section and was not designed to identify all deficiencies in internal control that might be material weaknesses or, significant deficiencies. Given these limitations, during our audit we did not identify any deficiencies in internal control that we consider to be material weaknesses. However, material weaknesses may exist that have not been identified.

Board of Trustees Arlington Independent School District
136
Compliance and Other Matters
As part of obtaining reasonable assurance about whether the District’s financial statements are free from material misstatement, we performed tests of its compliance with certain provisions of laws, regulations, contracts, and grant agreements, noncompliance with which could have a direct and material effect on the determination of financial statement amounts. However, providing an opinion on compliance with those provisions was not an objective of our audit, and accordingly, we do not express such an opinion. The results of our tests disclosed no instances of noncompliance or other matters that are required to be reported under Government Auditing Standards.
Purpose of this Report
The purpose of this report is solely to describe the scope of our testing of internal control and compliance and the results of that testing, and not to provide an opinion on the effectiveness of the entity’s internal control or on compliance. This report is an integral part of an audit performed in accordance with Government Auditing Standards in considering the entity’s internal control and compliance. Accordingly, this communication is not suitable for any other purpose.
Houston, Texas November 20, 2014

Houston Offi ce 3411 Richmond AvenueSuite 500Houston, Texas 77046713.621.1515 Main
whitleypenn.com
An IndependentMember of
Dallas Fort Worth Houston
137
INDEPENDENT AUDITOR’S REPORT ON COMPLIANCE FOR EACH MAJOR FEDERAL PROGRAM AND ON INTERNAL CONTROL OVER COMPLIANCE
REQUIRED BY OMB CIRCULAR A-133 To the Board of Trustees Arlington Independent School District Arlington, Texas Report on Compliance for Each Major Federal Program
We have audited Arlington Independent School District’s (the “District”) compliance with the types of compliance requirements described in the OMB Circular A-133 Compliance Supplement that could have a direct and material effect on each of the District’s major federal programs for the year ended June 30, 2014. The District’s major federal programs are identified in the summary of auditor’s results section of the accompanying schedule of findings and questioned costs.
Management’s Responsibility
Management is responsible for compliance with the requirements of laws, regulations, contracts, and grants applicable to its federal programs.
Auditor’s Responsibility
Our responsibility is to express an opinion on compliance for each of the District’s major federal programs based on our audit of the types of compliance requirements referred to above. We conducted our audit of compliance in accordance with auditing standards generally accepted in the United States of America; the standards applicable to financial audits contained in Government Auditing Standards, issued by the Comptroller General of the United States; and OMB Circular A-133, Audits of States, Local Governments, and Non-Profit Organizations. Those standards and OMB Circular A-133 require that we plan and perform the audit to obtain reasonable assurance about whether noncompliance with the types of compliance requirements referred to above that could have a direct and material effect on a major federal program occurred. An audit includes examining, on a test basis, evidence about the District’s compliance with those requirements and performing such other procedures as we considered necessary in the circumstances.
We believe that our audit provides a reasonable basis for our opinion on compliance for each major federal program. However, our audit does not provide a legal determination of the District’s compliance.
Opinion on Each Major Federal Program
In our opinion, the District, complied, in all material respects, with the types of compliance requirements referred to above that could have a direct and material effect on each of its major federal programs for the year ended June 30, 2014.

Board of Trustees Arlington Independent School District
138
Report on Internal Control Over Compliance
Management of the District is responsible for establishing and maintaining effective internal control over compliance with the types of compliance requirements referred to above. In planning and performing our audit of compliance, we considered the District’s internal control over compliance with the types of requirements that could have a direct and material effect on each major federal program to determine the auditing procedures that are appropriate in the circumstances for the purpose of expressing an opinion on compliance for each major federal program and to test and report on internal control over compliance in accordance with OMB Circular A-133, but not for the purpose of expressing an opinion on the effectiveness of internal control over compliance. Accordingly, we do not express an opinion on the effectiveness of the District’s internal control over compliance.
A deficiency in internal control over compliance exists when the design or operation of a control over compliance does not allow management or employees, in the normal course of performing their assigned functions, to prevent, or detect and correct, noncompliance with a type of compliance requirement of a federal program on a timely basis. A material weakness in internal control over compliance is a deficiency, or combination of deficiencies, in internal control over compliance, such that there is a reasonable possibility that material noncompliance with a type of compliance requirement of a federal program will not be prevented, or detected and corrected, on a timely basis. A significant deficiency in internal control over compliance is a deficiency, or a combination of deficiencies, in internal control over compliance with a type of compliance requirement of a federal program that is less severe than a material weakness in internal control over compliance, yet important enough to merit attention by those charged with governance.
Our consideration of internal control over compliance was for the limited purpose described in the first paragraph of this section and was not designed to identify all deficiencies in internal control over compliance that might be material weaknesses or significant deficiencies. We did not identify any deficiencies in internal control over compliance that we consider to be material weaknesses. However, material weaknesses may exist that have not been identified.
The purpose of this report on internal control over compliance is solely to describe the scope of our testing of internal control over compliance and the results of that testing based on the requirements of OMB Circular A-133. Accordingly, this report is not suitable for any other purpose.
Houston, Texas November 20, 2014
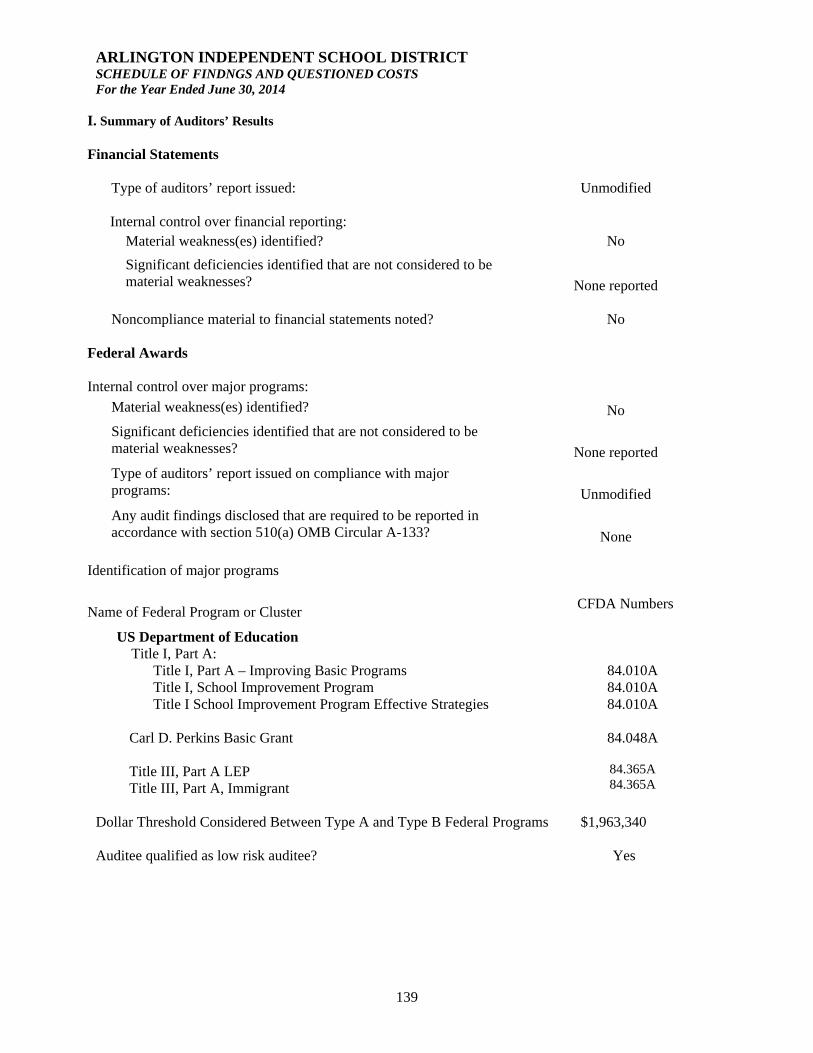
ARLINGTON INDEPENDENT SCHOOL DISTRICT SCHEDULE OF FINDNGS AND QUESTIONED COSTS For the Year Ended June 30, 2014
139
I. Summary of Auditors’ Results Financial Statements
Type of auditors’ report issued: Unmodified Internal control over financial reporting:
Material weakness(es) identified? No
Significant deficiencies identified that are not considered to be material weaknesses? None reported
Noncompliance material to financial statements noted? No Federal Awards Internal control over major programs:
Material weakness(es) identified? No
Significant deficiencies identified that are not considered to be material weaknesses? None reported
Type of auditors’ report issued on compliance with major programs: Unmodified
Any audit findings disclosed that are required to be reported in accordance with section 510(a) OMB Circular A-133? None
Identification of major programs
Name of Federal Program or Cluster
CFDA Numbers
US Department of Education Title I, Part A:
Title I, Part A – Improving Basic Programs Title I, School Improvement Program Title I School Improvement Program Effective Strategies
Carl D. Perkins Basic Grant Title III, Part A LEP Title III, Part A, Immigrant
84.010A 84.010A 84.010A
84.048A
84.365A 84.365A
Dollar Threshold Considered Between Type A and Type B Federal Programs $1,963,340 Auditee qualified as low risk auditee? Yes

ARLINGTON INDEPENDENT SCHOOL DISTRICT SCHEDULE OF FINDNGS AND QUESTIONED COSTS (continued) For the Year Ended June 30, 2014
140
II. Financial Statement Findings The audit disclosed no findings or questioned costs required to be reported.
III. Federal Awards Findings And Questioned Costs The audit disclosed no findings or questioned costs required to be reported. IV. Summary Schedule Of Prior Audit Findings No prior year findings. V. Corrective Action Plan
N/A
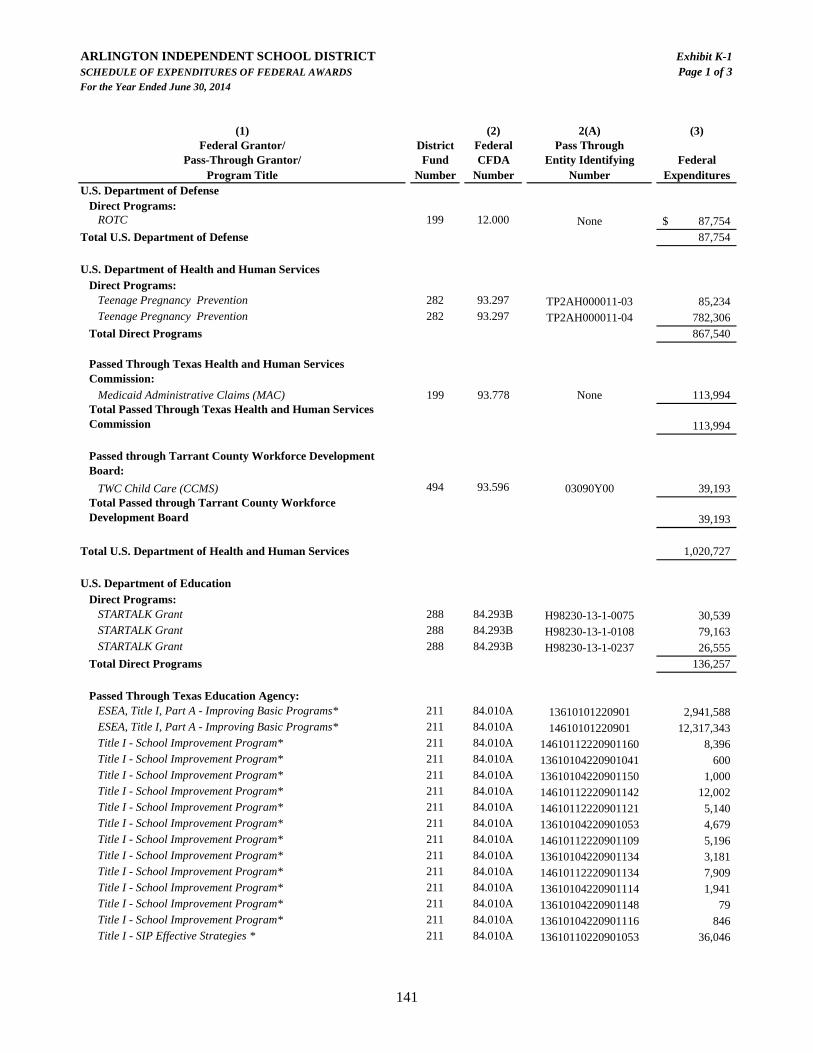
141
ARLINGTON INDEPENDENT SCHOOL DISTRICT Exhibit K-1SCHEDULE OF EXPENDITURES OF FEDERAL AWARDS Page 1 of 3For the Year Ended June 30, 2014
(1) (2) 2(A) (3)Federal Grantor/ District Federal Pass Through
Pass-Through Grantor/ Fund CFDA Entity Identifying FederalProgram Title Number Number Number Expenditures
U.S. Department of DefenseDirect Programs:
ROTC 199 12.000 None 87,754$
Total U.S. Department of Defense 87,754
U.S. Department of Health and Human ServicesDirect Programs:
Teenage Pregnancy Prevention 282 93.297 TP2AH000011-03 85,234 Teenage Pregnancy Prevention 282 93.297 TP2AH000011-04 782,306
Total Direct Programs 867,540
Passed Through Texas Health and Human Services Commission:
Medicaid Administrative Claims (MAC) 199 93.778 None 113,994 Total Passed Through Texas Health and Human Services Commission 113,994
Passed through Tarrant County Workforce Development Board:
TWC Child Care (CCMS) 494 93.596 03090Y00 39,193 Total Passed through Tarrant County Workforce Development Board 39,193
Total U.S. Department of Health and Human Services 1,020,727
U.S. Department of Education
Direct Programs:STARTALK Grant 288 84.293B H98230-13-1-0075 30,539 STARTALK Grant 288 84.293B H98230-13-1-0108 79,163 STARTALK Grant 288 84.293B H98230-13-1-0237 26,555
Total Direct Programs 136,257
Passed Through Texas Education Agency:ESEA, Title I, Part A - Improving Basic Programs* 211 84.010A 13610101220901 2,941,588 ESEA, Title I, Part A - Improving Basic Programs* 211 84.010A 14610101220901 12,317,343 Title I - School Improvement Program* 211 84.010A 14610112220901160 8,396 Title I - School Improvement Program* 211 84.010A 13610104220901041 600 Title I - School Improvement Program* 211 84.010A 13610104220901150 1,000 Title I - School Improvement Program* 211 84.010A 14610112220901142 12,002 Title I - School Improvement Program* 211 84.010A 14610112220901121 5,140 Title I - School Improvement Program* 211 84.010A 13610104220901053 4,679 Title I - School Improvement Program* 211 84.010A 14610112220901109 5,196 Title I - School Improvement Program* 211 84.010A 13610104220901134 3,181 Title I - School Improvement Program* 211 84.010A 14610112220901134 7,909 Title I - School Improvement Program* 211 84.010A 13610104220901114 1,941 Title I - School Improvement Program* 211 84.010A 13610104220901148 79 Title I - School Improvement Program* 211 84.010A 13610104220901116 846 Title I - SIP Effective Strategies * 211 84.010A 13610110220901053 36,046

142
ARLINGTON INDEPENDENT SCHOOL DISTRICT Exhibit K-1SCHEDULE OF EXPENDITURES OF FEDERAL AWARDS Page 2 of 3For the Year Ended June 30, 2014
(1) (2) 2(A) (3)Federal Grantor/ Federal Pass Through
Pass-Through Grantor/ CFDA Entity Identifying FederalProgram Title Number Number Expenditures
U.S. Department of Education (continued)Passed Through Texas Education Agency: (continued)
English Literacy and Civics Education 220 84.002A 134100087110474 1,961$ English Literacy and Civics Education 220 84.002A 0514ELC001 99,454 IDEA-B Formula * 224 84.027A 136600012209016000 259,284 IDEA-B Formula * 224 84.027A 146600012209016000 9,938,013 IDEA-B Preschool * 225 84.173A 136610012209016000 5,940 IDEA-B Preschool * 225 84.173A 146610012209016000 225,722 Carl D. Perkins Basic Grant 244 84.048A 14420006220901 747,311 ESEA Title II, Part A, Teacher/Principal Training 255 84.367A 13694501220901 64,754 ESEA Title II, Part A, Teacher/Principal Training 255 84.367A 14694501220901 1,087,003 Title III , Part A, LEP 263 84.365A 13671001220901 664,349 Title III , Part A, LEP 263 84.365A 14671001220901 819,041 Title III , Part A, Immigrant 263 84.365A 13671003220901 233,623 Title III , Part A, Immigrant 263 84.365A 14671003220901 89,526 21st Century Community Learning Centers 265 84.287C 126950127110001 5,291 Texas Literacy Initiative (TLI) 289 84.371C 126460037110002 2,744,656 Texas Literacy Initiative (TLI) 289 84.371C 136460037110002 4,137,233 Texas Literacy Initiative (TLI) 289 84.371C 146460037110002 692,729 Summer School LEP 289 84.369A 69551302 85,691 IDEA-B Discretionary (Deaf)* 315 84.027A 136600022209016000 7,595 IDEA-B Discretionary (Deaf)* 315 84.027A 146600022209016000 32,172 IDEA-B Formula (Deaf)* 316 84.027A 146600012209016000 42,042 IDEA-B Preschool (Deaf) * 317 84.173A 146610012209016000 1,130
Total Passed Through Texas Education Agency 37,330,466
Passed Through Fort Worth I.S.D.:Adult Basic Education 309 84.002 1241000710300 780 Adult Basic Education 309 84.002 1341000710300 61,901
Total Passed Through Fort Worth I.S.D. 62,681
Passed Through Region X Education Service Center:McKinney Vento Homeless Education 206 84.196 13-017 186,467
Total Passed Through Region X Education Service Center 186,467
Total Passed Through Programs 37,579,614
Total Department of Education 37,715,871

143
ARLINGTON INDEPENDENT SCHOOL DISTRICT Exhibit K-1SCHEDULE OF EXPENDITURES OF FEDERAL AWARDS Page 3 of 3For the Year Ended June 30, 2014
(1) (2) 2(A) (3)Federal Grantor/ District Federal Pass Through
Pass-Through Grantor/ Fund CFDA Entity Identifying FederalProgram Title Number Number Number Expenditures
U.S. Department of AgriculturePassed Through Texas Department of Agriculture
Texas Fresh Fruit and Vegetable Program 240 10.582 220901-156 190,072$ Summer Feeding Program * 242 10.559 1017 527,914
Non-Cash Assistance (Commodities)National School Lunch Program * 701 10.555 220-901 1,939,697
Total Passed Through Texas Department of Agriculture 2,657,683
Passed Through Texas Education Agency:
National School Lunch Program * 701 10.555 71301401 18,536,605 School Breakfast Program * 701 10.553 71401401 5,425,984
Total Passed Through Texas Education Agency 23,962,589
Total Department of Agriculture 26,620,272
Total Expenditures of Federal Awards 65,444,624$
* Clustered programs under OMB Circular A-133.
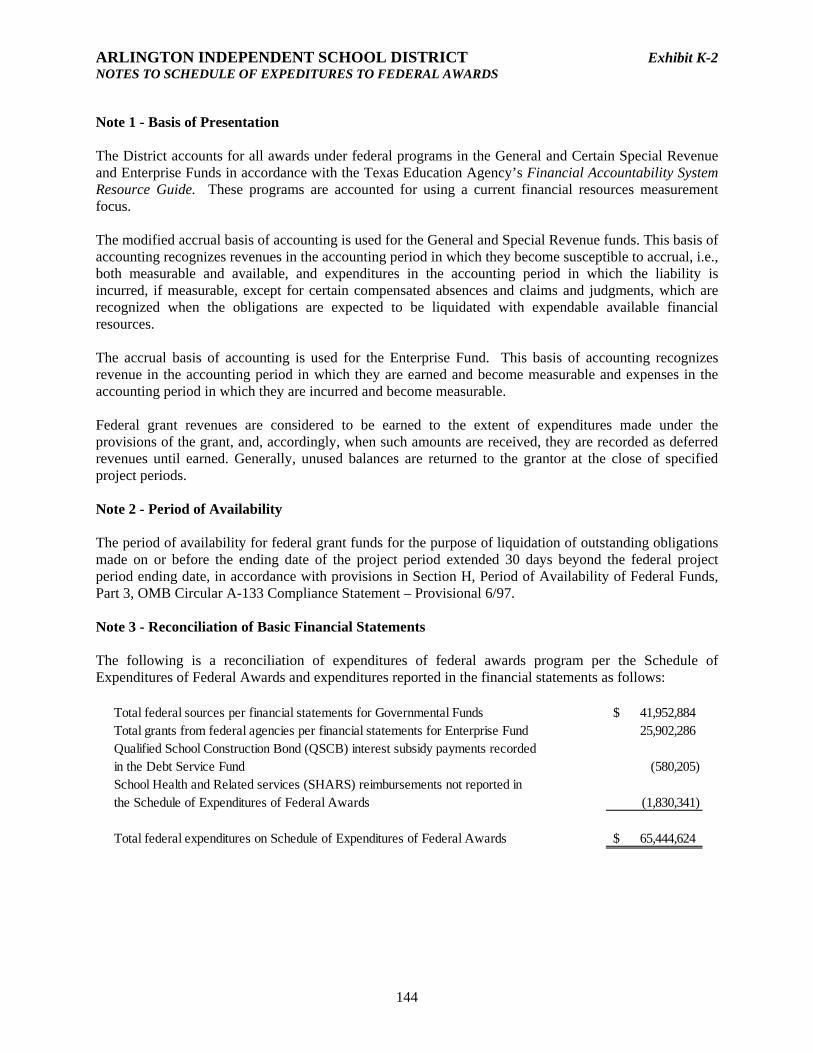
ARLINGTON INDEPENDENT SCHOOL DISTRICT Exhibit K-2 NOTES TO SCHEDULE OF EXPEDITURES TO FEDERAL AWARDS
144
Note 1 - Basis of Presentation The District accounts for all awards under federal programs in the General and Certain Special Revenue and Enterprise Funds in accordance with the Texas Education Agency’s Financial Accountability System Resource Guide. These programs are accounted for using a current financial resources measurement focus. The modified accrual basis of accounting is used for the General and Special Revenue funds. This basis of accounting recognizes revenues in the accounting period in which they become susceptible to accrual, i.e., both measurable and available, and expenditures in the accounting period in which the liability is incurred, if measurable, except for certain compensated absences and claims and judgments, which are recognized when the obligations are expected to be liquidated with expendable available financial resources. The accrual basis of accounting is used for the Enterprise Fund. This basis of accounting recognizes revenue in the accounting period in which they are earned and become measurable and expenses in the accounting period in which they are incurred and become measurable. Federal grant revenues are considered to be earned to the extent of expenditures made under the provisions of the grant, and, accordingly, when such amounts are received, they are recorded as deferred revenues until earned. Generally, unused balances are returned to the grantor at the close of specified project periods. Note 2 - Period of Availability The period of availability for federal grant funds for the purpose of liquidation of outstanding obligations made on or before the ending date of the project period extended 30 days beyond the federal project period ending date, in accordance with provisions in Section H, Period of Availability of Federal Funds, Part 3, OMB Circular A-133 Compliance Statement – Provisional 6/97. Note 3 - Reconciliation of Basic Financial Statements The following is a reconciliation of expenditures of federal awards program per the Schedule of Expenditures of Federal Awards and expenditures reported in the financial statements as follows:
Total federal sources per financial statements for Governmental Funds 41,952,884$ Total grants from federal agencies per financial statements for Enterprise Fund 25,902,286 Qualified School Construction Bond (QSCB) interest subsidy payments recordedin the Debt Service Fund (580,205) School Health and Related services (SHARS) reimbursements not reported inthe Schedule of Expenditures of Federal Awards (1,830,341)
Total federal expenditures on Schedule of Expenditures of Federal Awards 65,444,624$
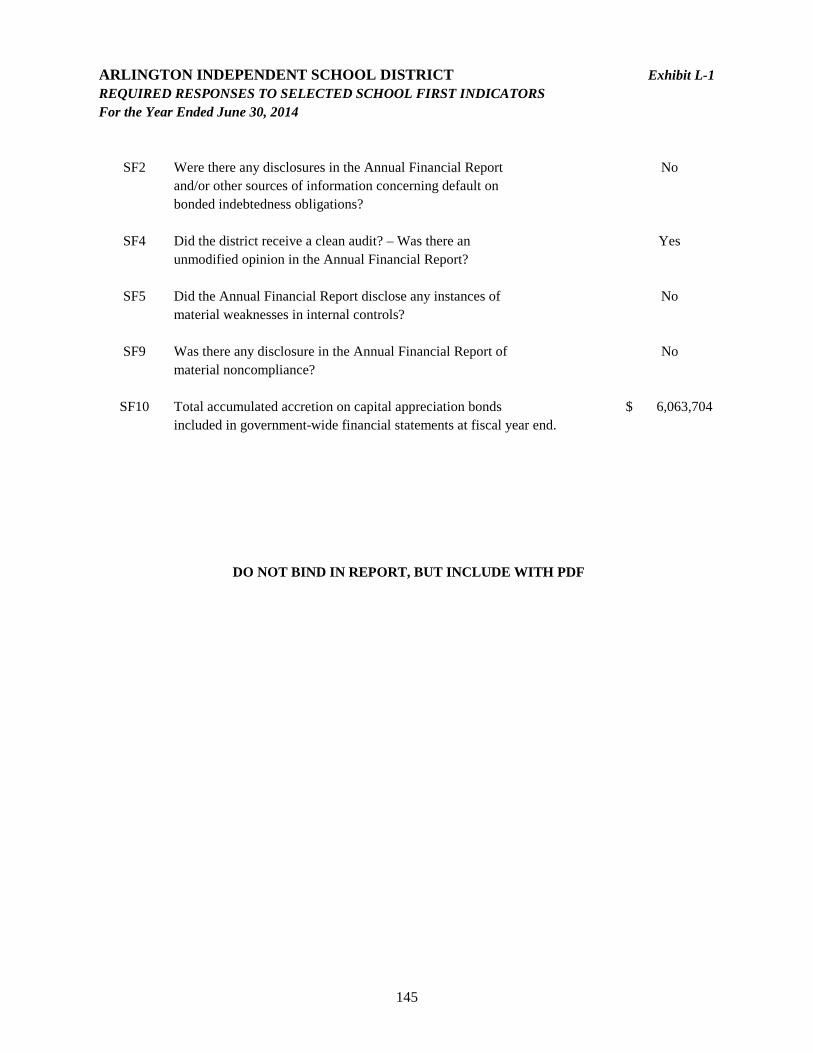
145
ARLINGTON INDEPENDENT SCHOOL DISTRICT Exhibit L-1REQUIRED RESPONSES TO SELECTED SCHOOL FIRST INDICATORS
SF2 Were there any disclosures in the Annual Financial Report Noand/or other sources of information concerning default onbonded indebtedness obligations?
SF4 Did the district receive a clean audit? – Was there an Yesunmodified opinion in the Annual Financial Report?
SF5 Did the Annual Financial Report disclose any instances of Nomaterial weaknesses in internal controls?
SF9 Was there any disclosure in the Annual Financial Report of Nomaterial noncompliance?
SF10 Total accumulated accretion on capital appreciation bonds 6,063,704$ included in government-wide financial statements at fiscal year end.
DO NOT BIND IN REPORT, BUT INCLUDE WITH PDF
For the Year Ended June 30, 2014


![Type Primary Contact ** Affiliated With * …...2019/08/02 · Type Primary Contact ** Affiliated With * ARLINGTON SAM HOUSTON [T] Men's Head Coach Jrodrig8@aisd.net [c] (325) 518-4291](https://img.pdfslide.net/doc/110x75/5ecedaf70e2bd5210370c88e/type-primary-contact-affiliated-with-20190802-type-primary-contact.jpg)