Embed Size (px)
Citation preview
2016 Central District Comprehensive Community Health Needs
Assessment
Foreword
About Redwoods…
You may be wondering why redwoods were chosen to represent the work contained in this document and in the planning to follow.First of all, we know that redwoods have shallow root systems that extend outward over 100 feet from the base of the tree, intertwining with the roots of other redwoods. This increases the redwoods’ stability to weather strong winds and floods. Secondly, we know that diversity is crucial to the redwood forest; every plant, tree and even fallen logs play a vital role in the balanced ecosystem in which all living organisms thrive.We as a community intertwine our roots just as the redwoods do for strength and endurance to tackle challenging health-related issues. Together we are stronger. Additionally, each organization or agency is similar to a plant, tree, or fallen log in the forest in that we each fill a specific role, working together as a community we represent the diversity needed for success.
Teresa Anderson, MSN APRN-CNS, BCHealth DirectorCentral District Health Department1137 South LocustGrand Island NE 68801-6771
1
2
Table of Contents
Introduction……………………………………………………………………………………...4
Overview of the Comprehensive Community Health Needs Assessment……………... .5
Community Health and the Local Public Health System……………………………….5
Mobilizing for Action through Planning and Partnerships……………………………...6
Section l. The Public Health System in the Central District…………………………………….8
The Ten Essential Public Health Services………………………………………………8
Resource Inventory…………………………………………………………………….12
Forces of Change………………………………………………………………………18
Section ll. Demographic and Public Health Data……………………………………………...25
Description of Data Sources…………………………………………………………...25
Demographics………………………………………………………………………….25
Children and Families………………………………………………………………….29
Child Well Being Indicators.…………………………………………………………..33
Access to Health Care………………………………………………………………….39
Census of Health Care Professionals…………………………………………………...41
Quality of Life………………………………………………………………………….49
County Health Rankings………………………………………………………………..50
Mental Health…………………………………………………………………………..51
Youth Substance Abuse………………………………………………………………..54
Adult Alcohol and Tobacco Abuse…………………………………………………….63
Education and Schools…………………………………………………………………68
Arrests………………………………………………………………………………….74
Bullying………………………………………………………………………………..76
Health Screening……………………………………………………………………….77
Obesity and Physical Activity………………………………………………………….80
Nutrition………………………………………………………………………………..83
Cancer………………………………………………………………………………….84
High Blood Pressure and Cholesterol………………………………………………….86
Heart Disease and Stroke………………………………………………………………87
3
Diabetes………………………………………………………………………………...91
Pulmonary Disease…………………………………………………………………......93
Teen Pregnancy and Sexual Activity…………………………………………………..94
Newborn Child Health…………………………………………………………………96
Accidental Deaths……………………………………………………………………...99
Motor Vehicle Safety…………………………………………………………………101
Falls…………………………………………………………………………………...103
Housing………………………………………………………………………………..104
Radon………………………………………………………………………………….106
Pneumonia and Infectious Diseases………………………………………..................107
Sexually Transmitted Diseases………………………………………………………..111
Aging Population……………………………………………………………………...113
Arthritis………………………………………………………………………………..114
Kidney Disease………………………………………………………………………..114
Oral Health……………………………………………………………………………115
Section III. Community Health Needs and Priorities…………………………………………116
Overall Central District……………………………………………………………….116
Hall County……………………………………………………………………………136
Hamilton………………………………………………………………………………145
Merrick………………………………………………………………………………..149
Appendices……………………………………………………………………………………153
Appendix A. Aurora Memorial Community Health Assessment (Community Themes and Strengths Assessment) ………………………………………………………………..154
Appendix B. Focus Group Summaries (Community Themes and Strengths
Assessment) …………………………………………………………………………..171
Appendix C. Forces of Change Assessment ………………………………………….188
Appendix D. The Local Public Health System Assessment (a selection from the
full report) …………………………………………………………………………….203
References ……………………………………………………………………………………207
4
Introduction
Overview of the Comprehensive Community Health Needs Assessment
Under the direction of the Central District Health Department the 2016 Comprehensive
Community Health Needs Assessment has been devised for the three counties in the Central
Health District (Hall, Hamilton, and Merrick Counties in Nebraska). This assessment was
conducted in partnership with multiple agencies within the district and will be the basis for the
Community Health Improvement Plan (CHIP). This assessment will also serve as a reference
document for the three non-profit hospitals in the district to assist in strategic planning. It is the
purpose of this assessment to inform all interested parties about the health status of the
population within the district and to provide community partners with a wide array of data that
can be used to educate and mobilize the community and its resources to improve the health of the
population.
The Comprehensive Community Health Needs Assessment process is collaborative and is
intended to serve a single data report for multiple coalitions, organizations, and hospitals in the
three county region unified by the Central District Health Department. It is the goal of the
Comprehensive Community Health Needs Assessment to describe the health status of the
population, identify areas for health improvement, determine factors that contribute to health
issues, and identify assets and resources that can be mobilized to address public health
improvement. This assessment will be updated and revised every three years, thus providing
communities with up to date data to evaluate progress made towards identified health priorities
and for the selection of new ones.
This report contains three sections. The first section describes the state of the public health system in the Central District, including the 10 Essential Public Health Services, the availability of health resources, and perceptions of community need. Section ll contains a broad array of demographic and public health data, and provides the main body of the report. Section lll contains district-wide and county-level health needs and priorities. This third section services as a succinct summary of the major health needs within the overall district and for each county in the district.
Garrison Consulting assembled this assessment of public health and community well-being under the provision of the Central District Health Department, based largely upon data collected through the process of Mobilizing for Action through P lanning and Partnerships (MAPP).
5
Community Health and the Local Public Health System
Community health includes a broad array of issues addressed by numerous agencies. Topics that fall under community health include such things as access to health care, perceptions of the well-being of the community, utilization of social programs, child welfare, crime, alcohol and tobacco use, drug use, poverty, obesity, diabetes, teen pregnancy, teen sexual activity, healthy children,
environmental factors affecting health, cancer, heart disease, and a broad array of other epidemiological topics.
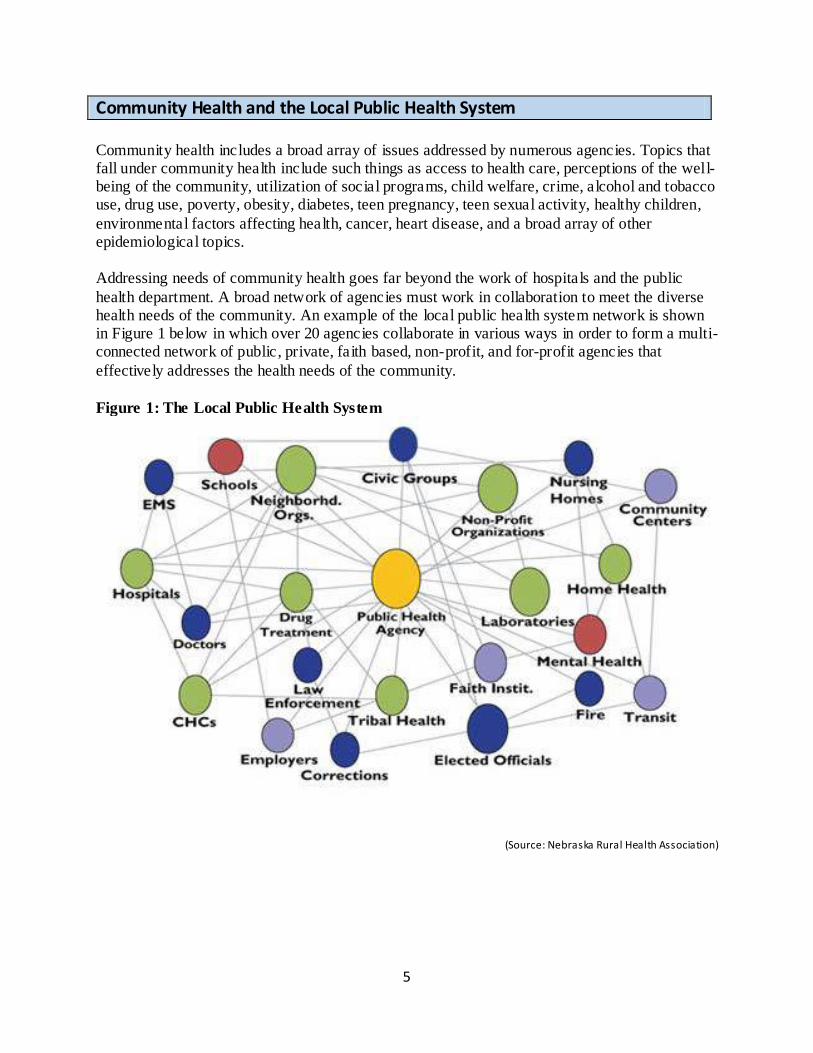
Addressing needs of community health goes far beyond the work of hospitals and the public
health department. A broad network of agencies must work in collaboration to meet the diverse health needs of the community. An example of the local public health system network is shown in Figure 1 below in which over 20 agencies collaborate in various ways in order to form a multi-connected network of public, private, faith based, non-profit, and for-profit agencies that
effectively addresses the health needs of the community.
Figure 1: The Local Public Health System
(Source: Nebraska Rural Health Association)
6
Mobilizing for Action through Planning and Partnerships
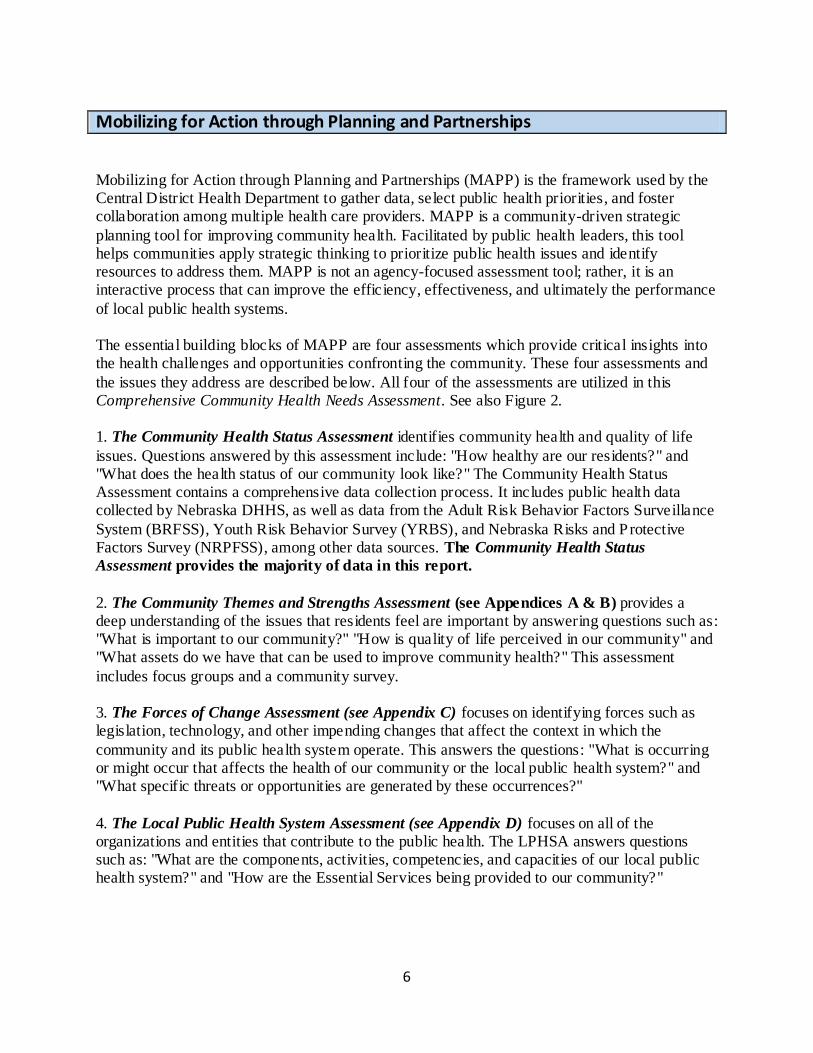
Mobilizing for Action through Planning and Partnerships (MAPP) is the framework used by the Central District Health Department to gather data, select public health priorities, and foster collaboration among multiple health care providers. MAPP is a community-driven strategic
planning tool for improving community health. Facilitated by public health leaders, this tool helps communities apply strategic thinking to prioritize public health issues and identify resources to address them. MAPP is not an agency-focused assessment tool; rather, it is an interactive process that can improve the efficiency, effectiveness, and ultimately the performance
of local public health systems.
The essential building blocks of MAPP are four assessments which provide critical insights into the health challenges and opportunities confronting the community. These four assessments and
the issues they address are described below. All four of the assessments are utilized in this Comprehensive Community Health Needs Assessment. See also Figure 2.
1. The Community Health Status Assessment identifies community health and quality of life
issues. Questions answered by this assessment include: "How healthy are our residents?" and"What does the health status of our community look like?" The Community Health StatusAssessment contains a comprehensive data collection process. It includes public health datacollected by Nebraska DHHS, as well as data from the Adult Risk Behavior Factors Surveillance
System (BRFSS), Youth Risk Behavior Survey (YRBS), and Nebraska Risks and ProtectiveFactors Survey (NRPFSS), among other data sources. The Community Health Status
Assessment provides the majority of data in this report.
2. The Community Themes and Strengths Assessment (see Appendices A & B) provides adeep understanding of the issues that residents feel are important by answering questions such as:"What is important to our community?" "How is quality of life perceived in our community" and"What assets do we have that can be used to improve community health?" This assessment
includes focus groups and a community survey.
3. The Forces of Change Assessment (see Appendix C) focuses on identifying forces such aslegislation, technology, and other impending changes that affect the context in which the
community and its public health system operate. This answers the questions: "What is occurringor might occur that affects the health of our community or the local public health system?" and"What specific threats or opportunities are generated by these occurrences?"
4. The Local Public Health System Assessment (see Appendix D) focuses on all of theorganizations and entities that contribute to the public health. The LPHSA answers questionssuch as: "What are the components, activities, competencies, and capacities of our local publichealth system?" and "How are the Essential Services being provided to our community?"
7
Figure 2: The MAPP Conceptual Model
(Source: National Association of County and City Health Officials)
8
Section I. The Public Health System in the
Central District
The Ten Essential Public Health Services
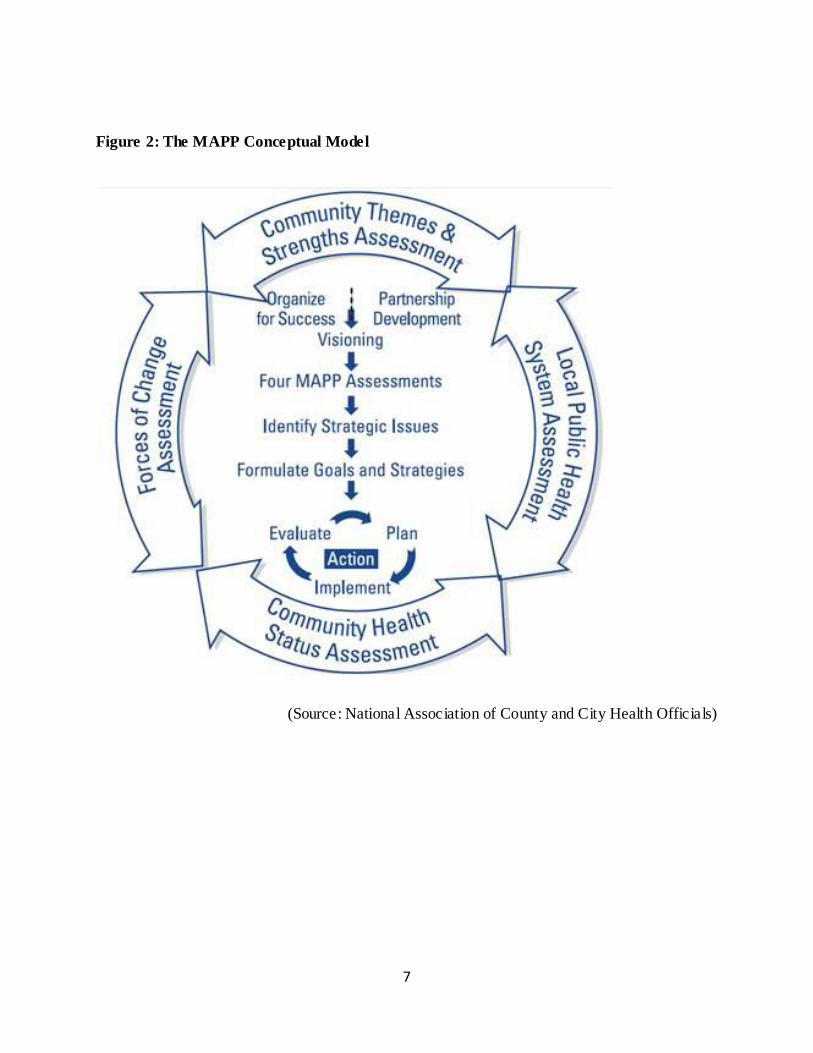
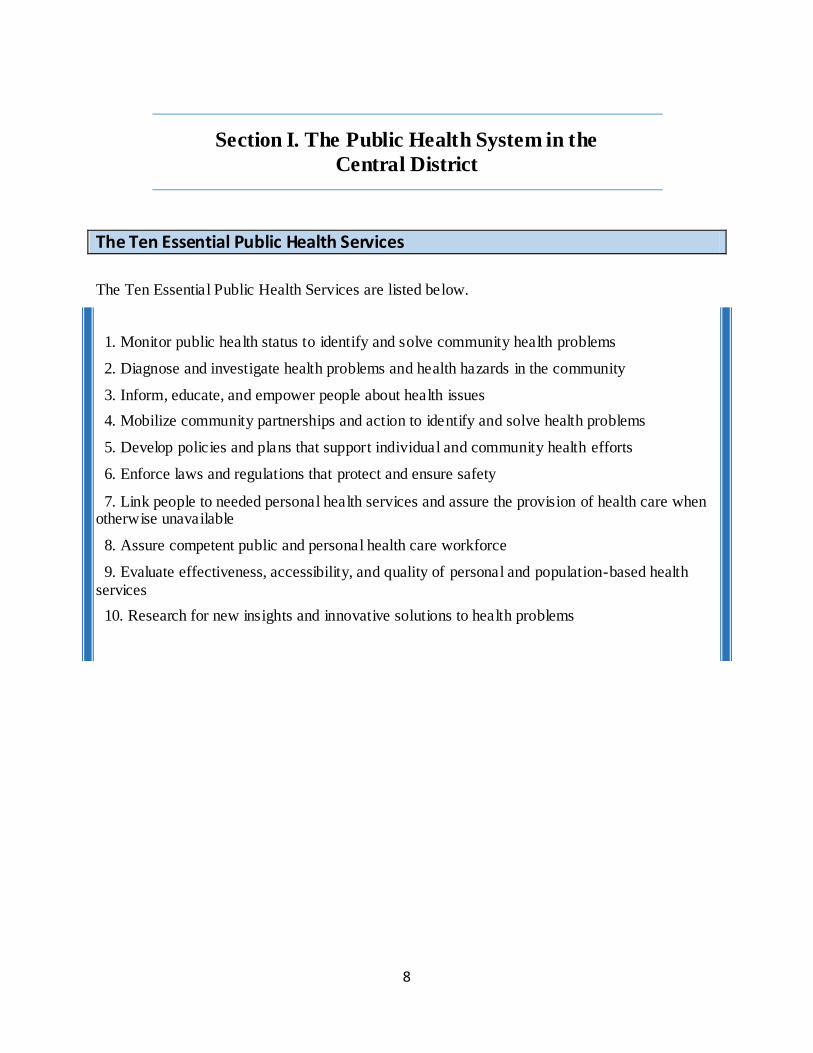
The Ten Essential Public Health Services are listed below.
1. Monitor public health status to identify and solve community health problems
2. Diagnose and investigate health problems and health hazards in the community
3. Inform, educate, and empower people about health issues
4. Mobilize community partnerships and action to identify and solve health problems
5. Develop policies and plans that support individual and community health efforts
6. Enforce laws and regulations that protect and ensure safety
7. Link people to needed personal health services and assure the provision of health care when otherwise unavailable
8. Assure competent public and personal health care workforce
9. Evaluate effectiveness, accessibility, and quality of personal and population-based health services
10. Research for new insights and innovative solutions to health problems
9
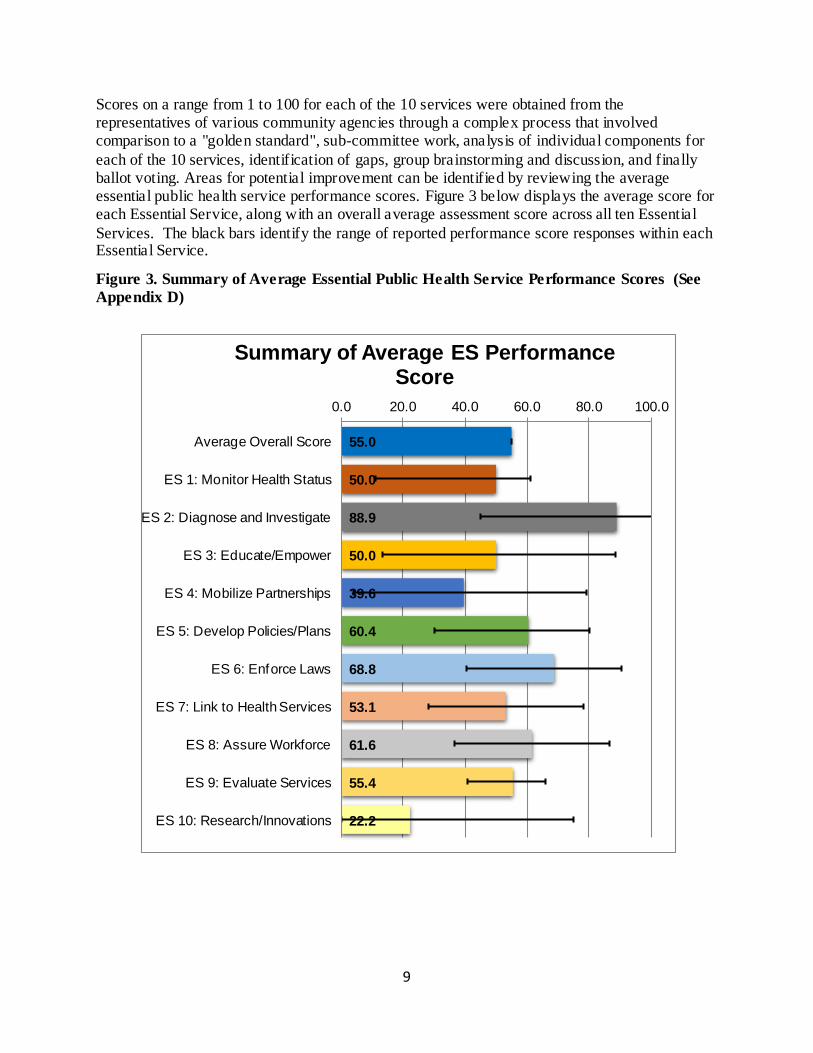
Scores on a range from 1 to 100 for each of the 10 services were obtained from the representatives of various community agencies through a complex process that involved comparison to a "golden standard", sub-committee work, analysis of individual components for
each of the 10 services, identification of gaps, group brainstorming and discussion, and finally ballot voting. Areas for potential improvement can be identified by reviewing the average essential public health service performance scores. Figure 3 below displays the average score for each Essential Service, along with an overall average assessment score across all ten Essential
Services. The black bars identify the range of reported performance score responses within each Essential Service.
Figure 3. Summary of Average Essential Public Health Service Performance Scores (See
Appendix D)
55.0
50.0
88.9
50.0
39.6
60.4
68.8
53.1
61.6
55.4
22.2
0.0 20.0 40.0 60.0 80.0 100.0
Average Overall Score
ES 1: Monitor Health Status
ES 2: Diagnose and Investigate
ES 3: Educate/Empower
ES 4: Mobilize Partnerships
ES 5: Develop Policies/Plans
ES 6: Enforce Laws
ES 7: Link to Health Services
ES 8: Assure Workforce
ES 9: Evaluate Services
ES 10: Research/Innovations
Summary of Average ES Performance Score
10
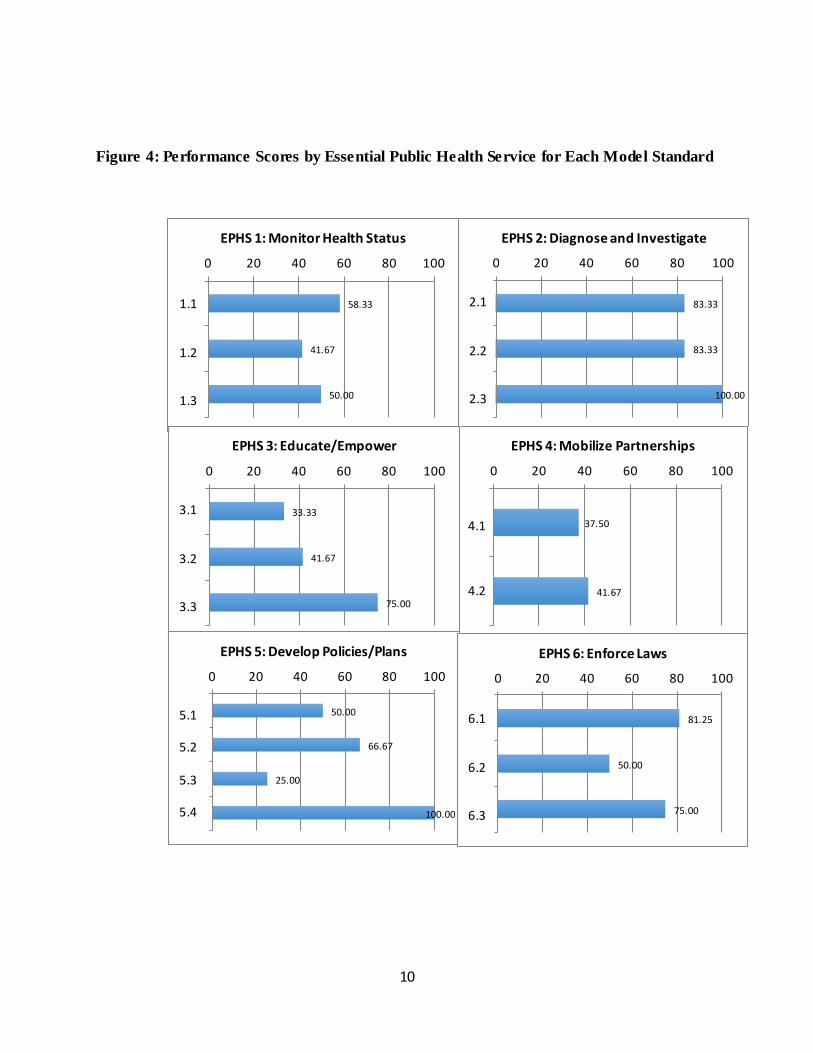
Figure 4: Performance Scores by Essential Public Health Service for Each Model Standard
58.33
41.67
50.00
0 20 40 60 80 100
1.1
1.2
1.3
EPHS 1: Monitor Health Status
83.33
83.33
100.00
0 20 40 60 80 100
2.1
2.2
2.3
EPHS 2: Diagnose and Investigate
37.50
41.67
0 20 40 60 80 100
4.1
4.2
EPHS 4: Mobilize Partnerships
33.33
41.67
75.00
0 20 40 60 80 100
3.1
3.2
3.3
EPHS 3: Educate/Empower
50.00
66.67
25.00
100.00
0 20 40 60 80 100
5.1
5.2
5.3
5.4
EPHS 5: Develop Policies/Plans
81.25
50.00
75.00
0 20 40 60 80 100
6.1
6.2
6.3
EPHS 6: Enforce Laws
11
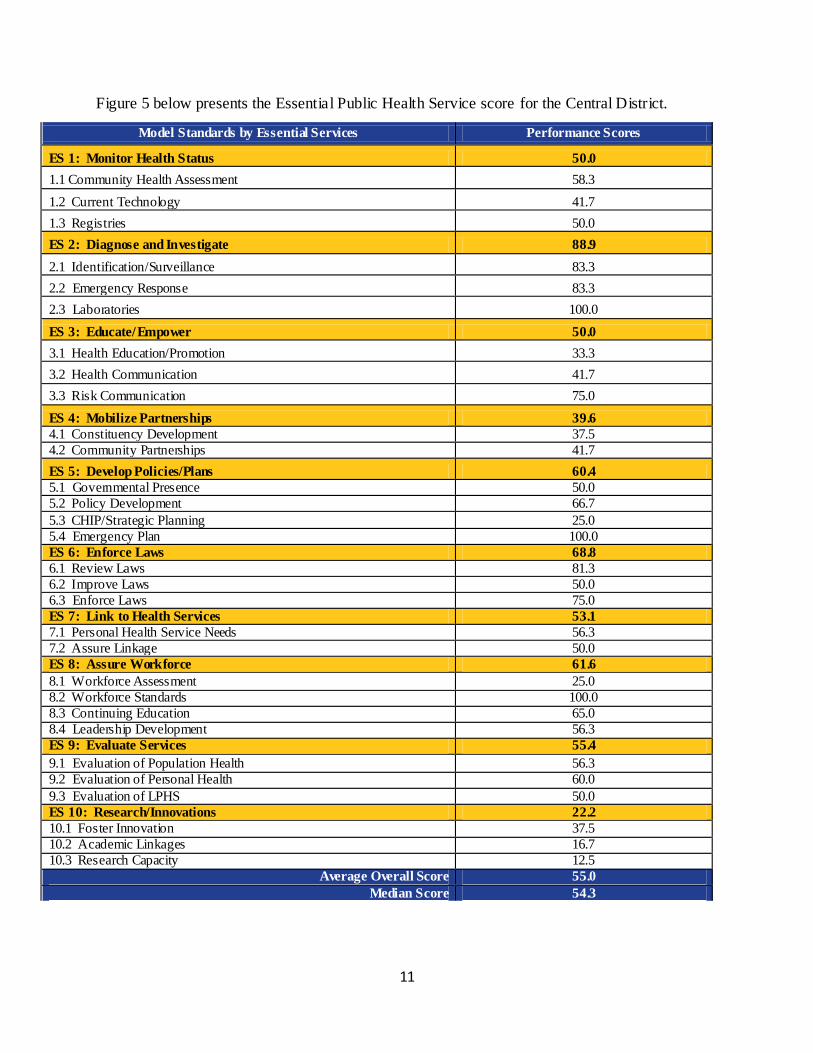
Figure 5 below presents the Essential Public Health Service score for the Central District.
Model Standards by Essential Services Performance Scores
ES 1: Monitor Health Status 50.0
1.1 Community Health Assessment 58.3
1.2 Current Technology 41.7
1.3 Registries 50.0
ES 2: Diagnose and Investigate 88.9
2.1 Identification/Surveillance 83.3
2.2 Emergency Response 83.3
2.3 Laboratories 100.0
ES 3: Educate/Empower 50.0
3.1 Health Education/Promotion 33.3
3.2 Health Communication 41.7
3.3 Risk Communication 75.0
ES 4: Mobilize Partnerships 39.6
4.1 Constituency Development 37.5
4.2 Community Partnerships 41.7
ES 5: Develop Policies/Plans 60.4
5.1 Governmental Presence 50.0
5.2 Policy Development 66.7
5.3 CHIP/Strategic Planning 25.0
5.4 Emergency Plan 100.0
ES 6: Enforce Laws 68.8
6.1 Review Laws 81.3
6.2 Improve Laws 50.0
6.3 Enforce Laws 75.0
ES 7: Link to Health Services 53.1
7.1 Personal Health Service Needs 56.3
7.2 Assure Linkage 50.0
ES 8: Assure Workforce 61.6
8.1 Workforce Assessment 25.0
8.2 Workforce Standards 100.0
8.3 Continuing Education 65.0
8.4 Leadership Development 56.3
ES 9: Evaluate Services 55.4
9.1 Evaluation of Population Health 56.3
9.2 Evaluation of Personal Health 60.0
9.3 Evaluation of LPHS 50.0
ES 10: Research/Innovations 22.2
10.1 Foster Innovation 37.5
10.2 Academic Linkages 16.7
10.3 Research Capacity 12.5
Average Overall Score 55.0
Median Score 54.3
12
Resource Inventory
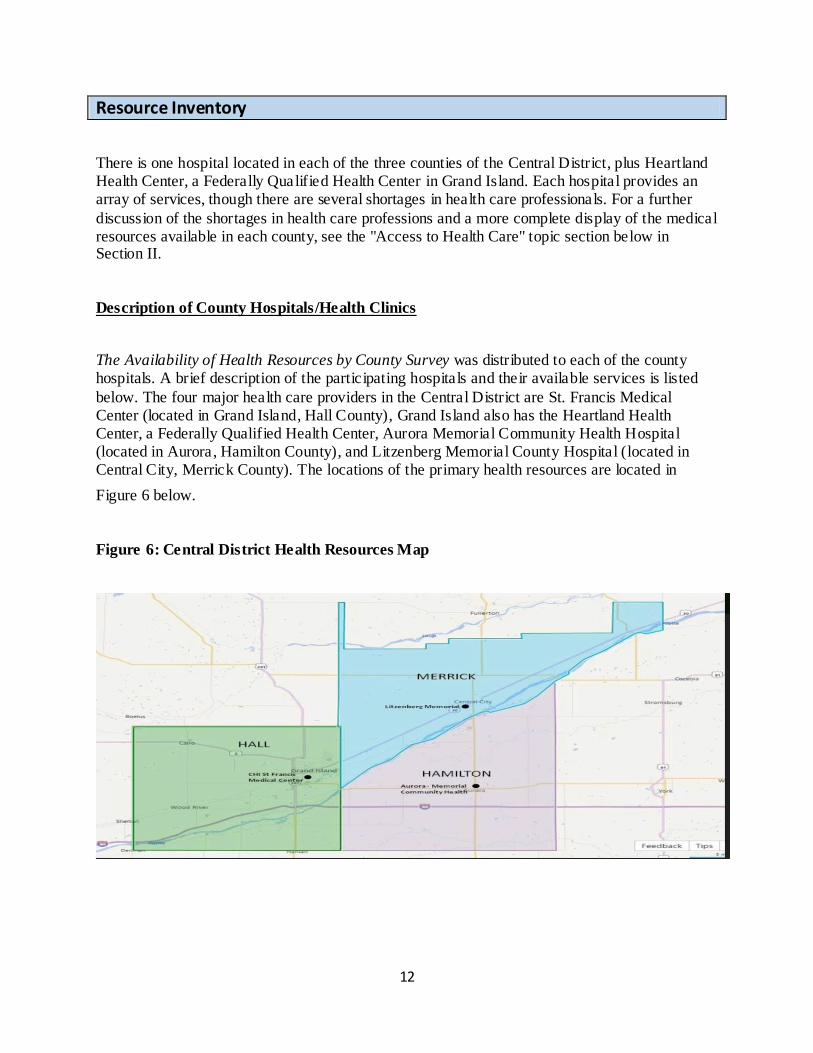
There is one hospital located in each of the three counties of the Central District, plus Heartland Health Center, a Federally Qualified Health Center in Grand Island. Each hospital provides an array of services, though there are several shortages in health care professionals. For a further
discussion of the shortages in health care professions and a more complete display of the medical resources available in each county, see the "Access to Health Care" topic section below in Section II.
Description of County Hospitals/Health Clinics
The Availability of Health Resources by County Survey was distributed to each of the county hospitals. A brief description of the participating hospitals and their available services is listed
below. The four major health care providers in the Central District are St. Francis Medical Center (located in Grand Island, Hall County), Grand Island also has the Heartland Health Center, a Federally Qualified Health Center, Aurora Memorial Community Health Hospital (located in Aurora, Hamilton County), and Litzenberg Memorial County Hospital (located in Central City, Merrick County). The locations of the primary health resources are located in
Figure 6 below.
Figure 6: Central District Health Resources Map
13
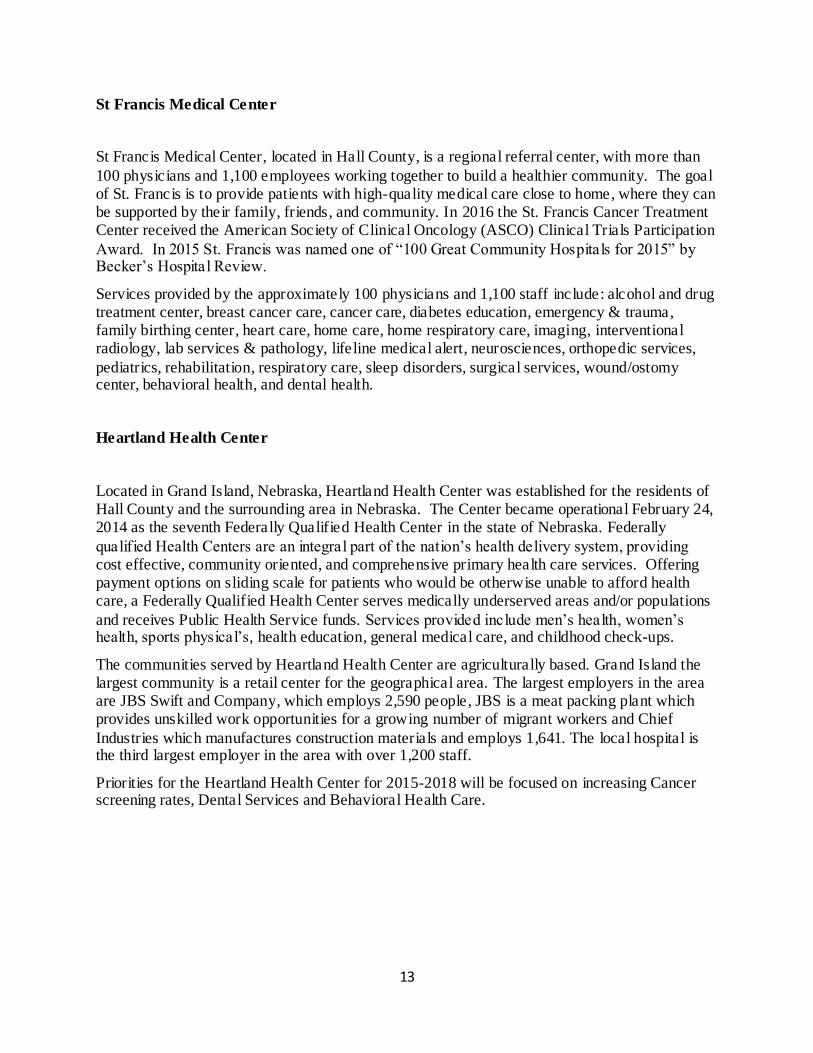
St Francis Medical Center
St Francis Medical Center, located in Hall County, is a regional referral center, with more than
100 physicians and 1,100 employees working together to build a healthier community. The goal of St. Francis is to provide patients with high-quality medical care close to home, where they can be supported by their family, friends, and community. In 2016 the St. Francis Cancer Treatment Center received the American Society of Clinical Oncology (ASCO) Clinical Trials Participation
Award. In 2015 St. Francis was named one of “100 Great Community Hospitals for 2015” by Becker’s Hospital Review.
Services provided by the approximately 100 physicians and 1,100 staff include: alcohol and drug treatment center, breast cancer care, cancer care, diabetes education, emergency & trauma, family birthing center, heart care, home care, home respiratory care, imaging, interventional radiology, lab services & pathology, lifeline medical alert, neurosciences, orthopedic services,
pediatrics, rehabilitation, respiratory care, sleep disorders, surgical services, wound/ostomy center, behavioral health, and dental health.
Heartland Health Center
Located in Grand Island, Nebraska, Heartland Health Center was established for the residents of Hall County and the surrounding area in Nebraska. The Center became operational February 24, 2014 as the seventh Federally Qualified Health Center in the state of Nebraska. Federally
qualified Health Centers are an integral part of the nation’s health delivery system, providing cost effective, community oriented, and comprehensive primary health care services. Offering payment options on sliding scale for patients who would be otherwise unable to afford health care, a Federally Qualified Health Center serves medically underserved areas and/or populations
and receives Public Health Service funds. Services provided include men’s health, women’s health, sports physical’s, health education, general medical care, and childhood check-ups.
The communities served by Heartland Health Center are agriculturally based. Grand Island the largest community is a retail center for the geographical area. The largest employers in the area are JBS Swift and Company, which employs 2,590 people, JBS is a meat packing plant which provides unskilled work opportunities for a growing number of migrant workers and Chief
Industries which manufactures construction materials and employs 1,641. The local hospital is the third largest employer in the area with over 1,200 staff.
Priorities for the Heartland Health Center for 2015-2018 will be focused on increasing Cancer screening rates, Dental Services and Behavioral Health Care.
14
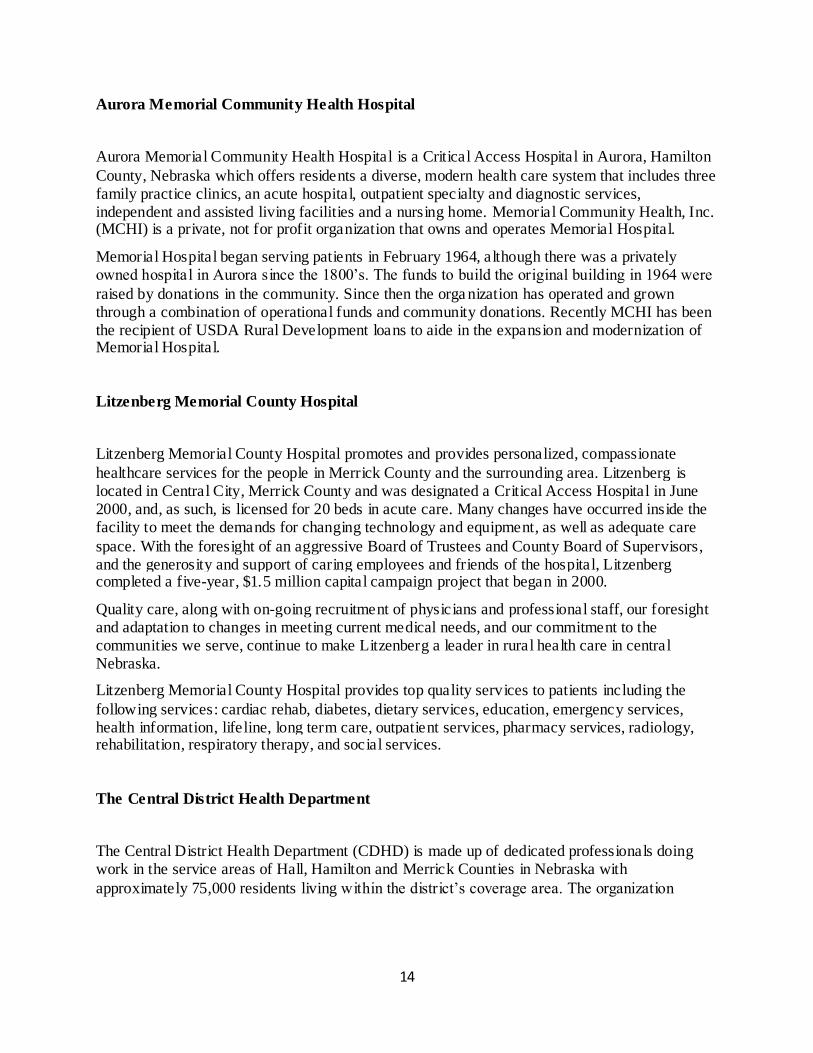
Aurora Memorial Community Health Hospital
Aurora Memorial Community Health Hospital is a Critical Access Hospital in Aurora, Hamilton
County, Nebraska which offers residents a diverse, modern health care system that includes three family practice clinics, an acute hospital, outpatient specialty and diagnostic services, independent and assisted living facilities and a nursing home. Memorial Community Health, Inc. (MCHI) is a private, not for profit organization that owns and operates Memorial Hospital.
Memorial Hospital began serving patients in February 1964, although there was a privately owned hospital in Aurora since the 1800’s. The funds to build the original building in 1964 were
raised by donations in the community. Since then the orga nization has operated and grown through a combination of operational funds and community donations. Recently MCHI has been the recipient of USDA Rural Development loans to aide in the expansion and modernization of Memorial Hospital.
Litzenberg Memorial County Hospital
Litzenberg Memorial County Hospital promotes and provides personalized, compassionate
healthcare services for the people in Merrick County and the surrounding area. Litzenberg is located in Central City, Merrick County and was designated a Critical Access Hospital in June 2000, and, as such, is licensed for 20 beds in acute care. Many changes have occurred inside the facility to meet the demands for changing technology and equipment, as well as adequate care
space. With the foresight of an aggressive Board of Trustees and County Board of Supervisors, and the generosity and support of caring employees and friends of the hospital, Litzenberg completed a five-year, $1.5 million capital campaign project that began in 2000.
Quality care, along with on-going recruitment of physicians and professional staff, our foresight and adaptation to changes in meeting current medical needs, and our commitment to the communities we serve, continue to make Litzenberg a leader in rural health care in central Nebraska.
Litzenberg Memorial County Hospital provides top quality services to patients including the
following services: cardiac rehab, diabetes, dietary services, education, emergency services, health information, lifeline, long term care, outpatient services, pharmacy services, radiology, rehabilitation, respiratory therapy, and social services.
The Central District Health Department
The Central District Health Department (CDHD) is made up of dedicated professionals doing work in the service areas of Hall, Hamilton and Merrick Counties in Nebraska with
approximately 75,000 residents living within the district’s coverage area. The organization
15
provides comprehensive public health services based on the needs of the community and the priorities of its residents. Public health efforts range from containing contagious diseases to advocating for healthier lifestyles, from preventing diseases to addressing catastrophic events,
and from providing basic sanitation to ensuring safe food and water. Public health makes the world in which we all live safer and, as a result, protects the health of every person.
The CDHD provides a broad array of services, some of which are listed below.
Children’s Immunizations
Adult Immunizations
Diseases and Conditions
Infectious Disease Tracking and Disease Surveillance Programs
Traveler’s Health
Water Testing/Water Quality
Women, Infants, and Children (WIC) Program
Community Health Needs Assessment and Strategic Planning
Environmental Programs
Public Health Emergency Response Program
Nutrition, Overweight and Obesity
Radon Measurement Community Health Workers
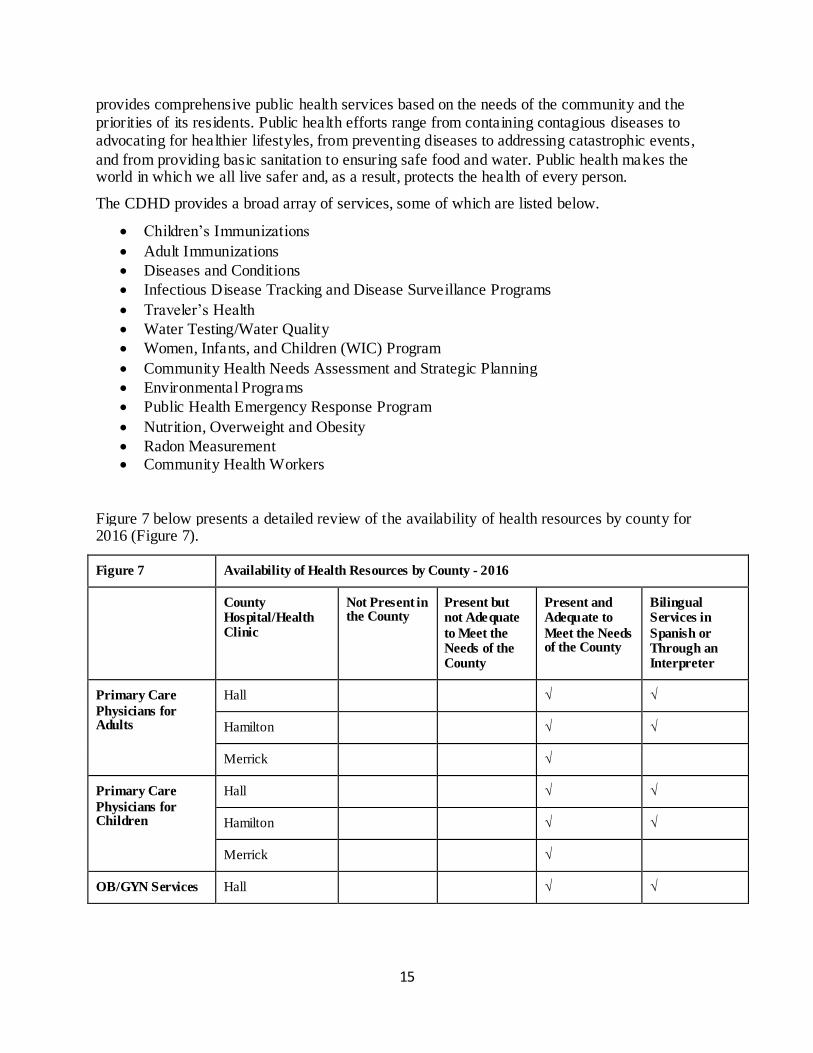
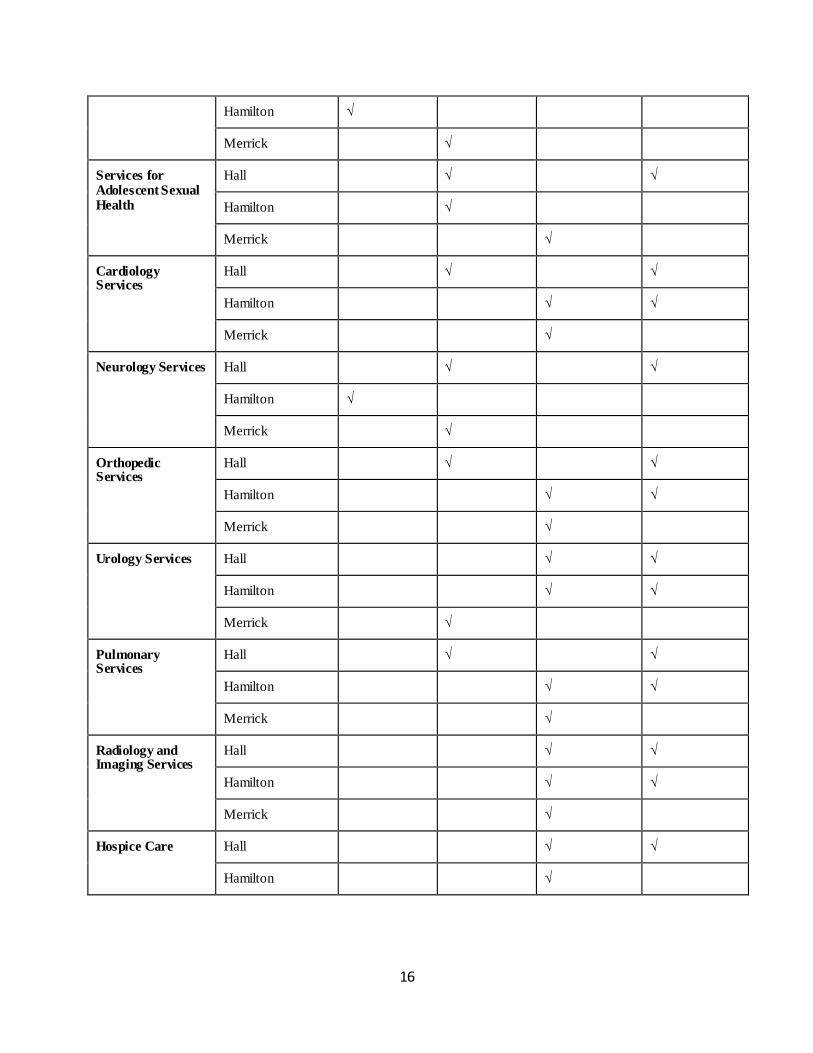
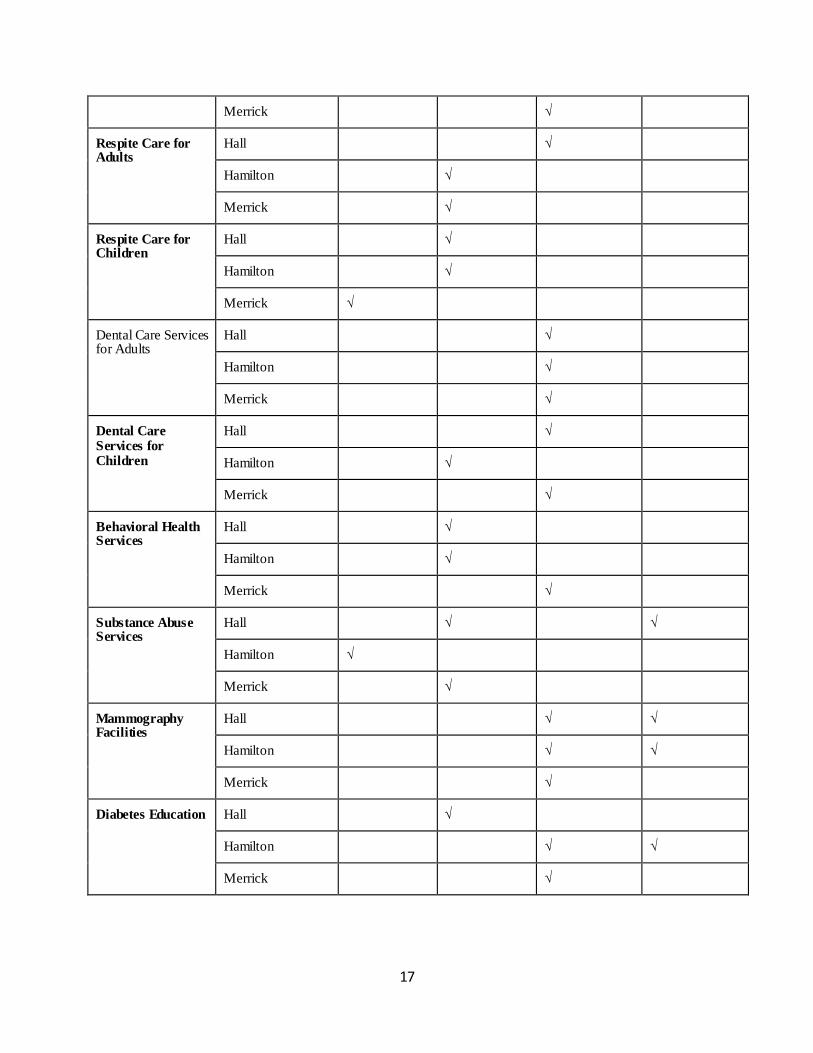
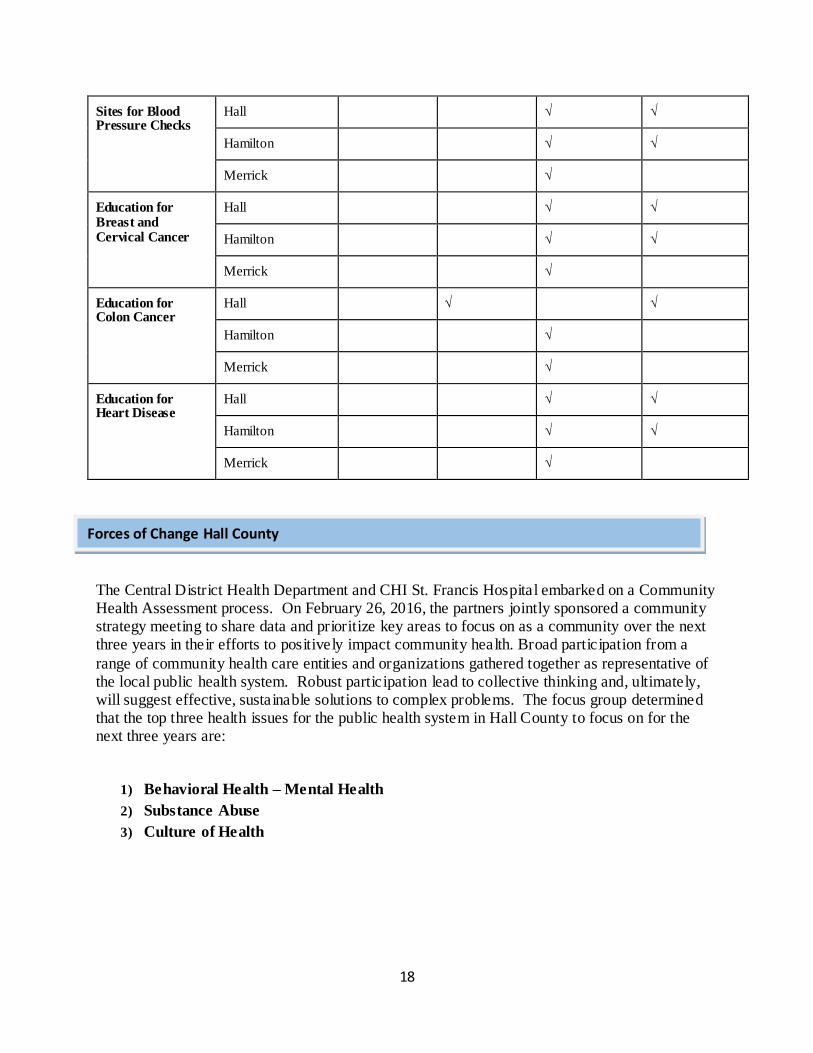
Figure 7 below presents a detailed review of the availability of health resources by county for 2016 (Figure 7).
Figure 7 Availability of Health Resources by County - 2016
County Hospital/Health Clinic
Not Present in the County
Present but not Adequate
to Meet the Needs of the County
Present and Adequate to
Meet the Needs of the County
Bilingual Services in
Spanish or Through an Interpreter
Primary Care
Physicians for Adults
Hall √ √
Hamilton √ √
Merrick √
Primary Care
Physicians for Children
Hall √ √
Hamilton √ √
Merrick √
OB/GYN Services Hall √ √
16
Hamilton √
Merrick √
Services for Adolescent Sexual Health
Hall √ √
Hamilton √
Merrick √
Cardiology Services
Hall √ √
Hamilton √ √
Merrick √
Neurology Services Hall √ √
Hamilton √
Merrick √
Orthopedic Services
Hall √ √
Hamilton √ √
Merrick √
Urology Services Hall √ √
Hamilton √ √
Merrick √
Pulmonary Services
Hall √ √
Hamilton √ √
Merrick √
Radiology and Imaging Services
Hall √ √
Hamilton √ √
Merrick √
Hospice Care Hall √ √
Hamilton √
17
Merrick √
Respite Care for Adults
Hall √
Hamilton √
Merrick √
Respite Care for Children
Hall √
Hamilton √
Merrick √
Dental Care Services for Adults
Hall √
Hamilton √
Merrick √
Dental Care Services for Children
Hall √
Hamilton √
Merrick √
Behavioral Health Services
Hall √
Hamilton √
Merrick √
Substance Abuse Services
Hall √ √
Hamilton √
Merrick √
Mammography Facilities
Hall √ √
Hamilton √ √
Merrick √
Diabetes Education Hall √
Hamilton √ √
Merrick √
18
Sites for Blood Pressure Checks
Hall √ √
Hamilton √ √
Merrick √
Education for Breast and Cervical Cancer
Hall √ √
Hamilton √ √
Merrick √
Education for Colon Cancer
Hall √ √
Hamilton √
Merrick √
Education for Heart Disease
Hall √ √
Hamilton √ √
Merrick √
The Central District Health Department and CHI St. Francis Hospital embarked on a Community Health Assessment process. On February 26, 2016, the partners jointly sponsored a community strategy meeting to share data and prioritize key areas to focus on as a community over the next three years in their efforts to positively impact community health. Broad participation from a
range of community health care entities and organizations gathered together as representative of the local public health system. Robust participation lead to collective thinking and, ultimately, will suggest effective, sustainable solutions to complex problems. The focus group determined that the top three health issues for the public health system in Hall County to focus on for the next three years are:
1) Behavioral Health – Mental Health
2) Substance Abuse
3) Culture of Health
Forces of Change Hall County
19
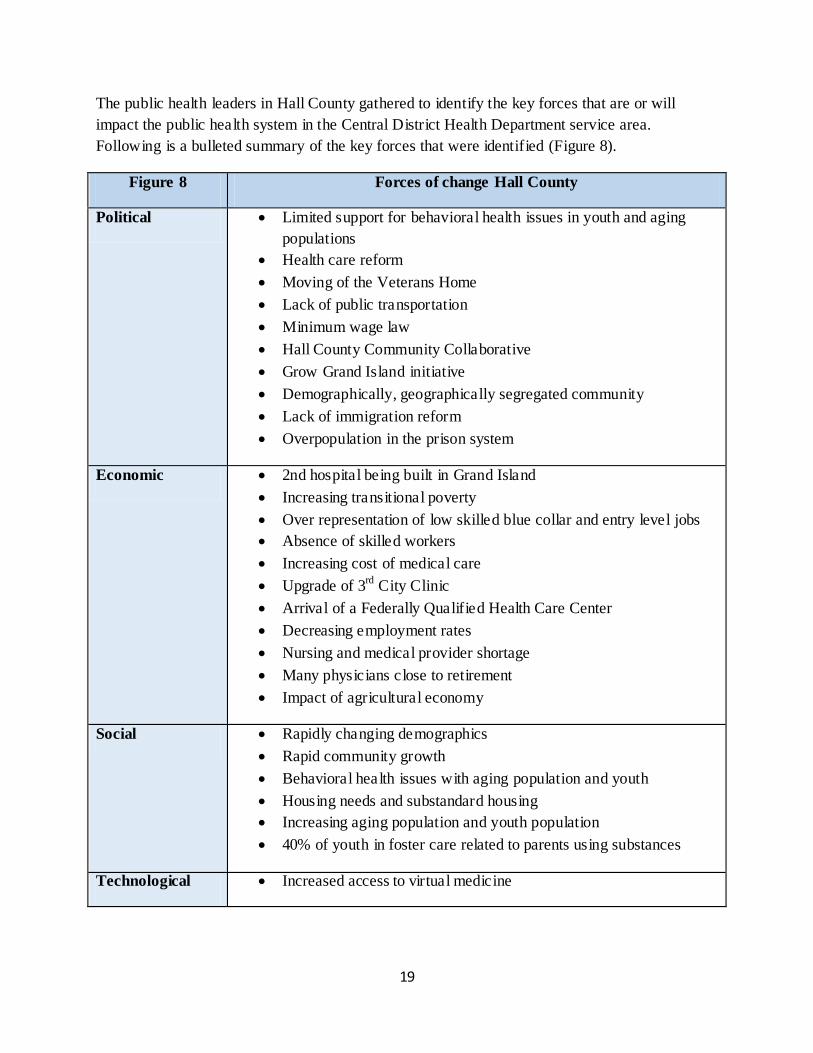
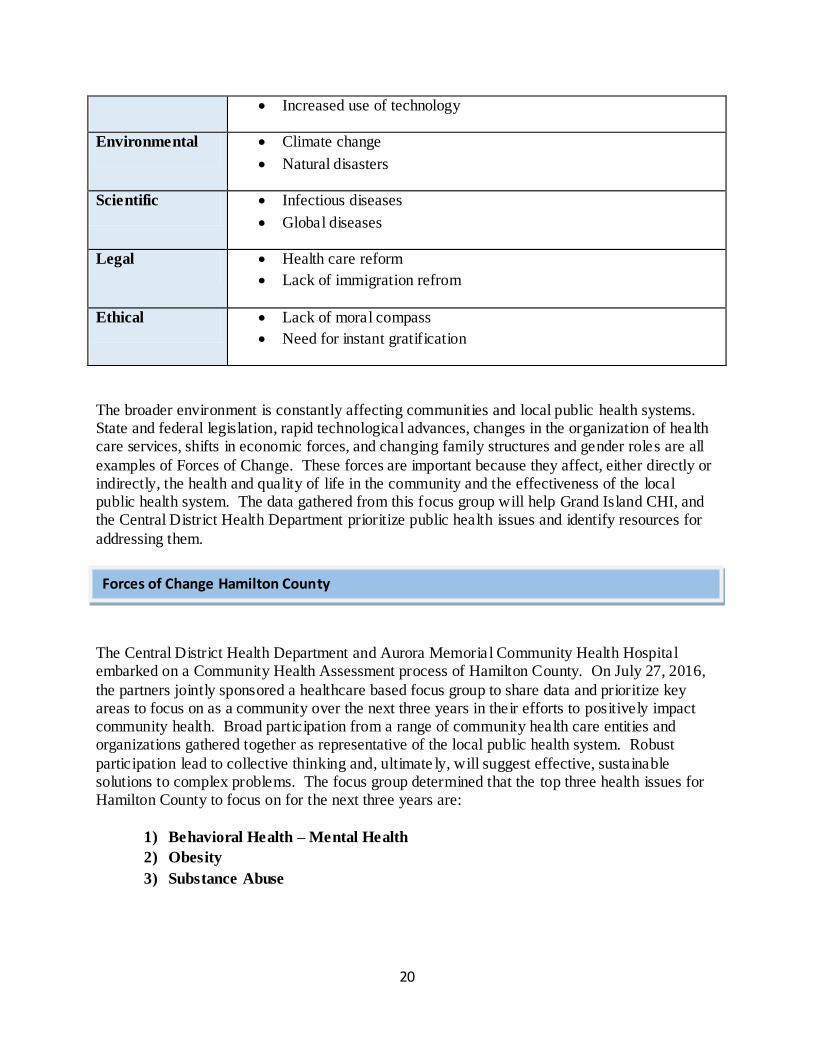
The public health leaders in Hall County gathered to identify the key forces that are or will
impact the public health system in the Central District Health Department service area.
Following is a bulleted summary of the key forces that were identified (Figure 8).
Figure 8 Forces of change Hall County
Political Limited support for behavioral health issues in youth and aging
populations
Health care reform
Moving of the Veterans Home
Lack of public transportation
Minimum wage law
Hall County Community Collaborative
Grow Grand Island initiative
Demographically, geographically segregated community
Lack of immigration reform
Overpopulation in the prison system
Economic 2nd hospital being built in Grand Island
Increasing transitional poverty
Over representation of low skilled blue collar and entry level jobs
Absence of skilled workers
Increasing cost of medical care
Upgrade of 3rd
City Clinic
Arrival of a Federally Qualified Health Care Center
Decreasing employment rates
Nursing and medical provider shortage
Many physicians close to retirement
Impact of agricultural economy
Social Rapidly changing demographics
Rapid community growth
Behavioral health issues with aging population and youth
Housing needs and substandard housing
Increasing aging population and youth population
40% of youth in foster care related to parents using substances
Technological Increased access to virtual medicine
20
Increased use of technology
Environmental Climate change
Natural disasters
Scientific Infectious diseases
Global diseases
Legal Health care reform
Lack of immigration refrom
Ethical Lack of moral compass
Need for instant gratification
The broader environment is constantly affecting communities and local public health systems. State and federal legislation, rapid technological advances, changes in the organization of health care services, shifts in economic forces, and changing family structures and gender roles are all
examples of Forces of Change. These forces are important because they affect, either directly or indirectly, the health and quality of life in the community and the effectiveness of the local public health system. The data gathered from this focus group will help Grand Island CHI, and the Central District Health Department prioritize public health issues and identify resources for
addressing them.
The Central District Health Department and Aurora Memoria l Community Health Hospital embarked on a Community Health Assessment process of Hamilton County. On July 27, 2016,
the partners jointly sponsored a healthcare based focus group to share data and prioritize key areas to focus on as a community over the next three years in their efforts to positively impact community health. Broad participation from a range of community health care entities and organizations gathered together as representative of the local public health system. Robust
participation lead to collective thinking and, ultimate ly, will suggest effective, sustainable solutions to complex problems. The focus group determined that the top three health issues for Hamilton County to focus on for the next three years are:
1) Behavioral Health – Mental Health
2) Obesity
3) Substance Abuse
Forces of Change Hamilton County
21
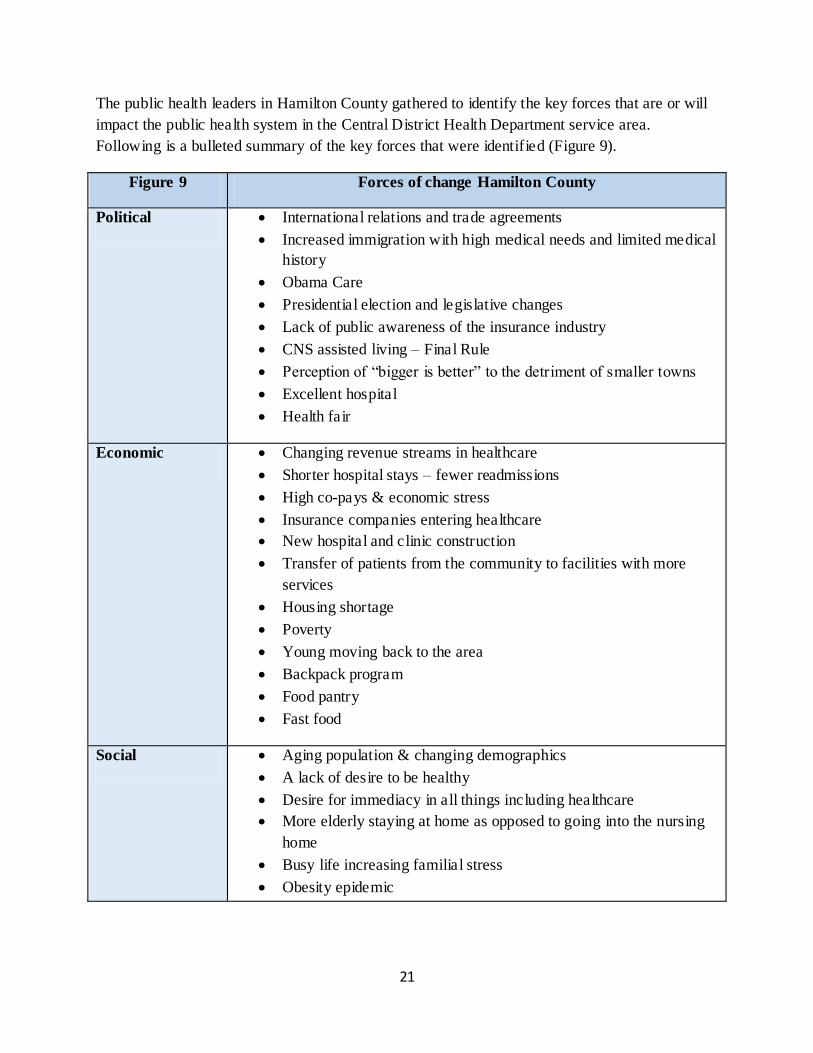
The public health leaders in Hamilton County gathered to identify the key forces that are or will
impact the public health system in the Central District Health Department service area.
Following is a bulleted summary of the key forces that were identified (Figure 9).
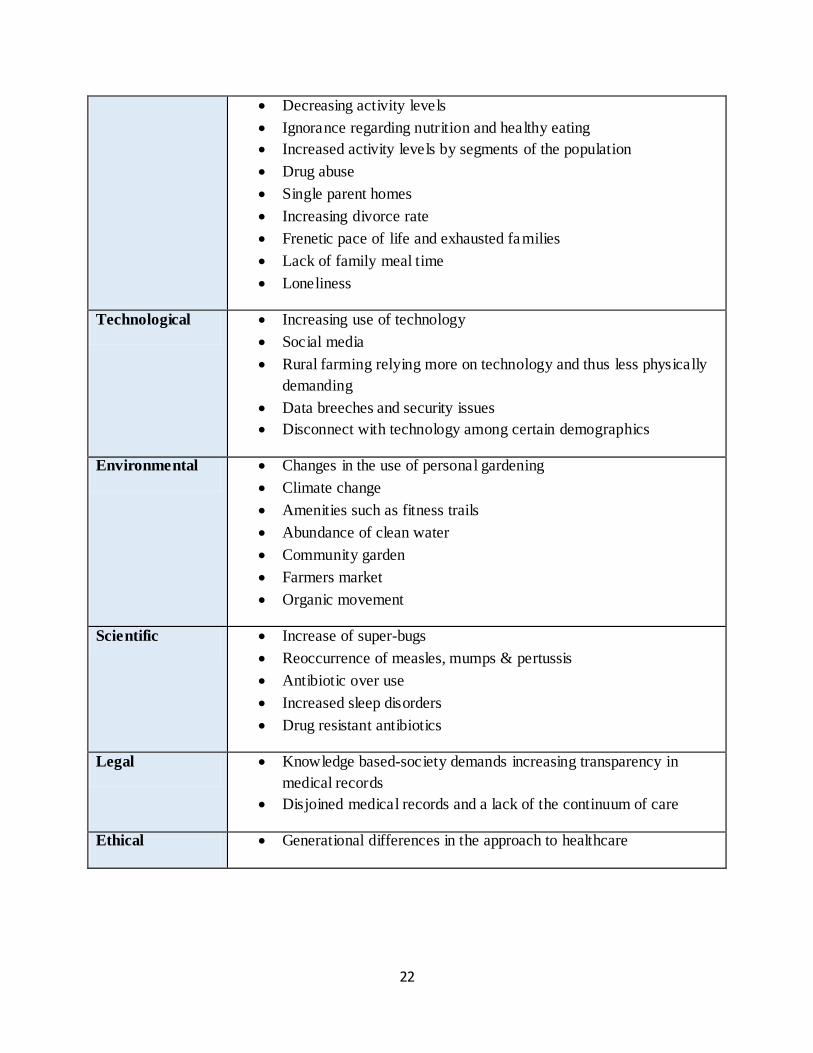
Figure 9 Forces of change Hamilton County
Political International relations and trade agreements
Increased immigration with high medical needs and limited medical
history
Obama Care
Presidential election and legislative changes
Lack of public awareness of the insurance industry
CNS assisted living – Final Rule
Perception of “bigger is better” to the detriment of smaller towns
Excellent hospital
Health fair
Economic Changing revenue streams in healthcare
Shorter hospital stays – fewer readmissions
High co-pays & economic stress
Insurance companies entering healthcare
New hospital and clinic construction
Transfer of patients from the community to facilities with more
services
Housing shortage
Poverty
Young moving back to the area
Backpack program
Food pantry
Fast food
Social Aging population & changing demographics
A lack of desire to be healthy
Desire for immediacy in all things including healthcare
More elderly staying at home as opposed to going into the nursing
home
Busy life increasing familial stress
Obesity epidemic
22
Decreasing activity levels
Ignorance regarding nutrition and healthy eating
Increased activity levels by segments of the population
Drug abuse
Single parent homes
Increasing divorce rate
Frenetic pace of life and exhausted families
Lack of family meal time
Loneliness
Technological Increasing use of technology
Social media
Rural farming relying more on technology and thus less physically
demanding
Data breeches and security issues
Disconnect with technology among certain demographics
Environmental Changes in the use of personal gardening
Climate change
Amenities such as fitness trails
Abundance of clean water
Community garden
Farmers market
Organic movement
Scientific Increase of super-bugs
Reoccurrence of measles, mumps & pertussis
Antibiotic over use
Increased sleep disorders
Drug resistant antibiotics
Legal Knowledge based-society demands increasing transparency in
medical records
Disjoined medical records and a lack of the continuum of care
Ethical Generational differences in the approach to healthcare
23
The broader environment is constantly affecting communities and local public health systems. State and federal legislation, rapid technological advances, changes in the organization of health care services, shifts in economic forces, and changing family structures and gender roles are all
examples of Forces of Change. These forces are important because they affect, either directly or indirectly, the health and quality of life in the community and the effectiveness of the local public health system. The data gathered from this focus group will help the Aurora Memorial Community Health Hospital, and the Central District Health Department prioritize public health
issues and identify resources for addressing them.
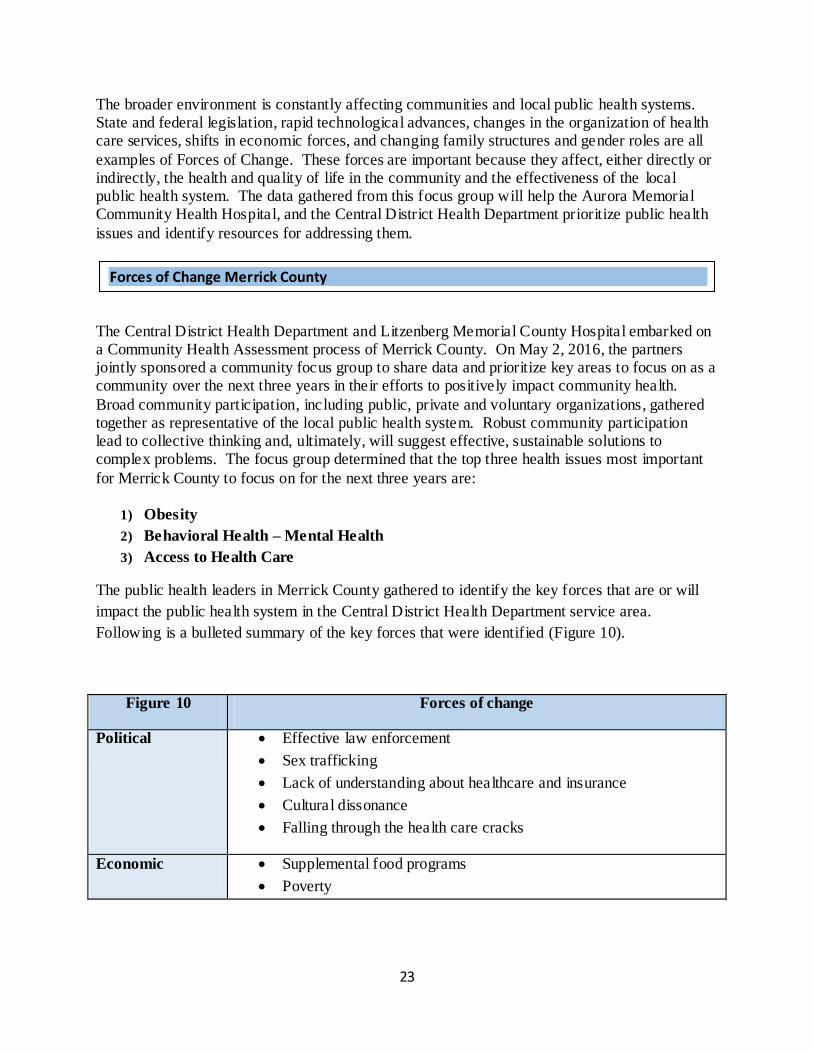
The Central District Health Department and Litzenberg Memorial County Hospital embarked on a Community Health Assessment process of Merrick County. On May 2, 2016, the partners jointly sponsored a community focus group to share data and prioritize key areas to focus on as a community over the next three years in their efforts to positively impact community health.
Broad community participation, including public, private and voluntary organizations, gathered together as representative of the local public health system. Robust community participation lead to collective thinking and, ultimately, will suggest effective, sustainable solutions to complex problems. The focus group determined that the top three health issues most important
for Merrick County to focus on for the next three years are:
1) Obesity
2) Behavioral Health – Mental Health
3) Access to Health Care
The public health leaders in Merrick County gathered to identify the key forces that are or will
impact the public health system in the Central District Health Department service area.
Following is a bulleted summary of the key forces that were identified (Figure 10).
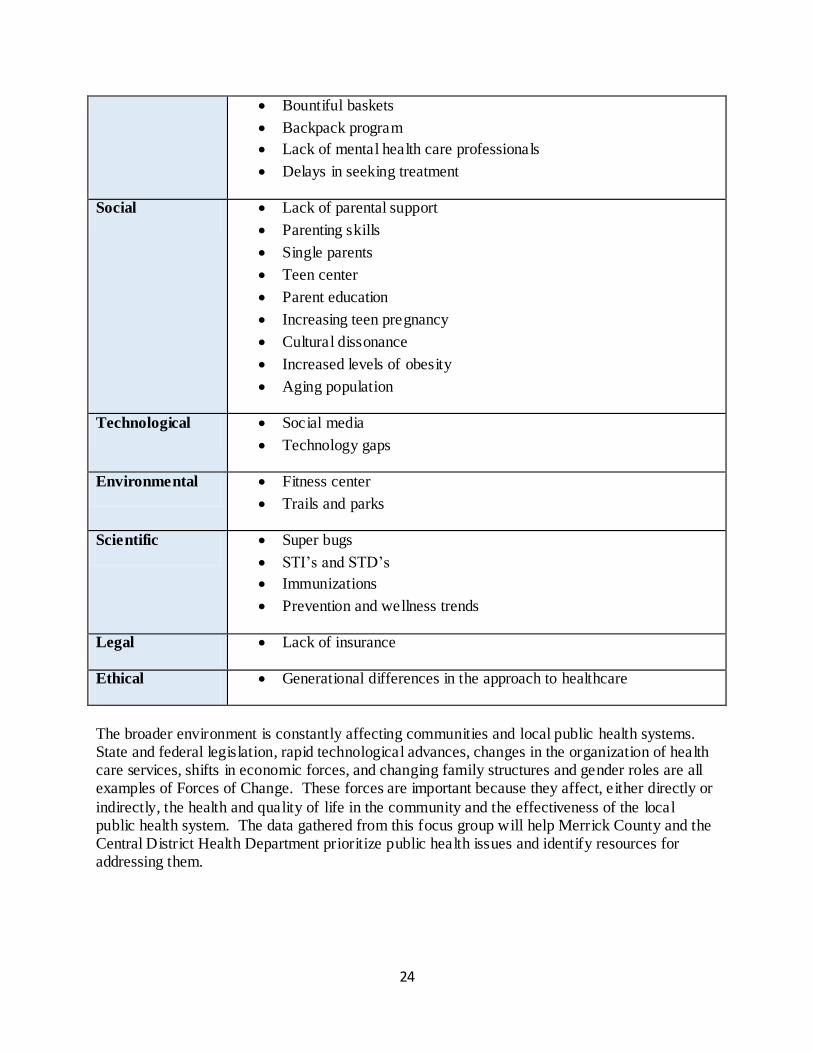
Figure 10 Forces of change
Political Effective law enforcement
Sex trafficking
Lack of understanding about healthcare and insurance
Cultural dissonance
Falling through the health care cracks
Economic Supplemental food programs
Poverty
Forces of Change Merrick County
24
Bountiful baskets
Backpack program
Lack of mental health care professionals
Delays in seeking treatment
Social Lack of parental support
Parenting skills
Single parents
Teen center
Parent education
Increasing teen pregnancy
Cultural dissonance
Increased levels of obesity
Aging population
Technological Social media
Technology gaps
Environmental Fitness center
Trails and parks
Scientific Super bugs
STI’s and STD’s
Immunizations
Prevention and wellness trends
Legal Lack of insurance
Ethical Generational differences in the approach to healthcare
The broader environment is constantly affecting communities and local public health systems. State and federal legislation, rapid technological advances, changes in the organization of health care services, shifts in economic forces, and changing family structures and gender roles are all examples of Forces of Change. These forces are important because they affect, either directly or
indirectly, the health and quality of life in the community and the effectiveness of the local public health system. The data gathered from this focus group will help Merrick County and the Central District Health Department prioritize public health issues and identify resources for addressing them.
25
Section II. Demographic and Public Health Data
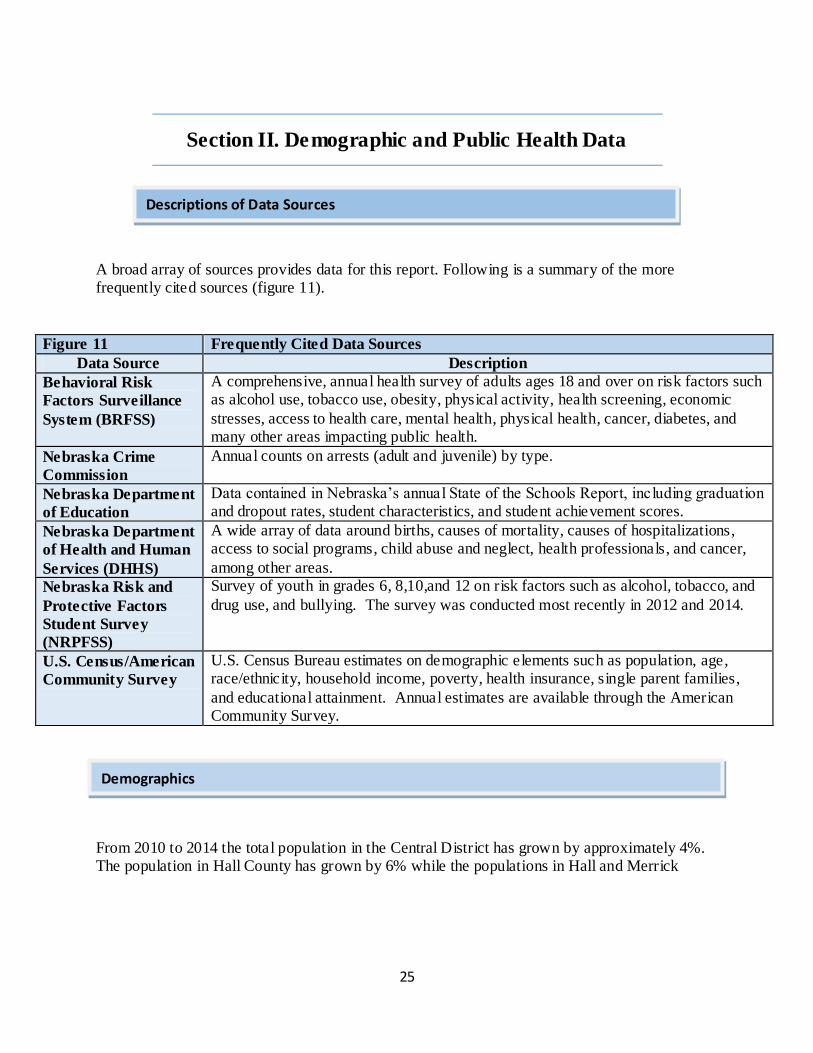
A broad array of sources provides data for this report. Following is a summary of the more frequently cited sources (figure 11).
Figure 11 Frequently Cited Data Sources
Data Source Description
Behavioral Risk
Factors Surveillance
System (BRFSS)
A comprehensive, annual health survey of adults ages 18 and over on risk factors such as alcohol use, tobacco use, obesity, physical activity, health screening, economic
stresses, access to health care, mental health, physical health, cancer, diabetes, and many other areas impacting public health.
Nebraska Crime
Commission
Annual counts on arrests (adult and juvenile) by type.
Nebraska Department
of Education
Data contained in Nebraska’s annual State of the Schools Report, including graduation and dropout rates, student characteristics, and student achievement scores.
Nebraska Department
of Health and Human
Services (DHHS)
A wide array of data around births, causes of mortality, causes of hospitalizations, access to social programs, child abuse and neglect, health professionals, and cancer,
among other areas.
Nebraska Risk and
Protective Factors
Student Survey
(NRPFSS)
Survey of youth in grades 6, 8,10,and 12 on risk factors such as alcohol, tobacco, and
drug use, and bullying. The survey was conducted most recently in 2012 and 2014.
U.S. Census/American
Community Survey
U.S. Census Bureau estimates on demographic elements such as population, age, race/ethnicity, household income, poverty, health insurance, single parent families,
and educational attainment. Annual estimates are available through the American Community Survey.
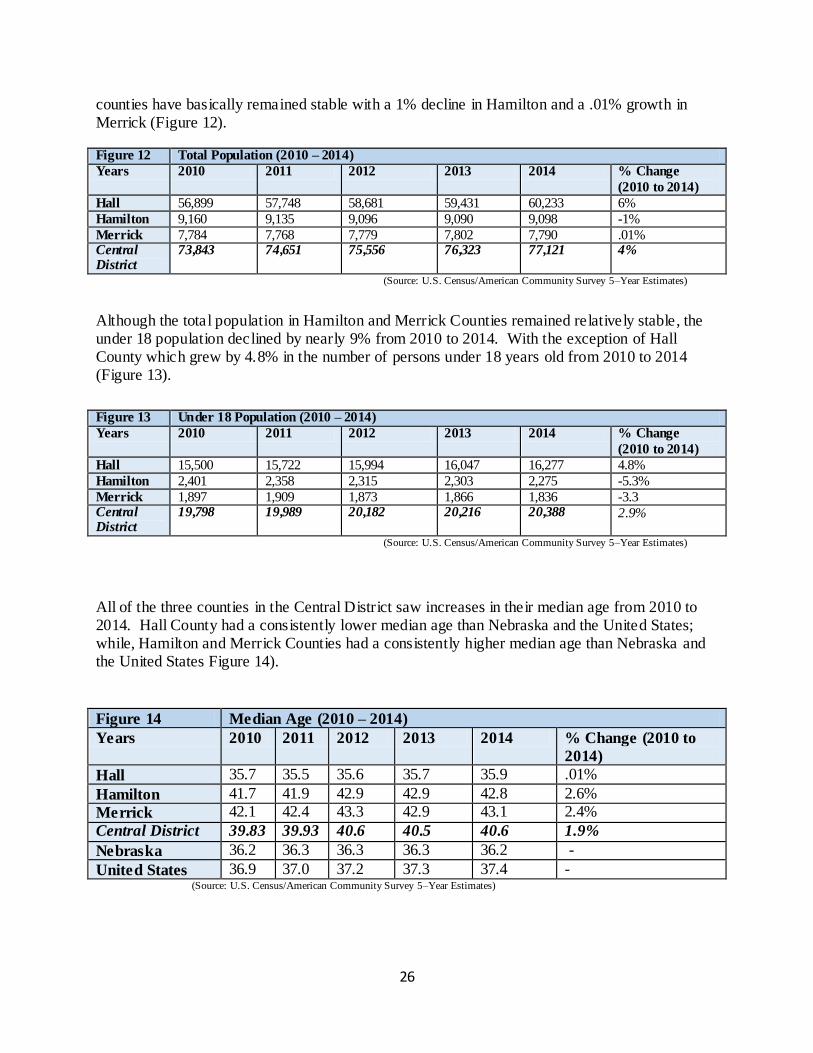
From 2010 to 2014 the total population in the Central District has grown by approximately 4%. The population in Hall County has grown by 6% while the populations in Hall and Merrick
Descriptions of Data Sources
Demographics
26
counties have basically remained stable with a 1% decline in Hamilton and a .01% growth in Merrick (Figure 12).
Figure 12 Total Population (2010 – 2014)
Years 2010 2011 2012 2013 2014 % Change
(2010 to 2014)
Hall 56,899 57,748 58,681 59,431 60,233 6%
Hamilton 9,160 9,135 9,096 9,090 9,098 -1%
Merrick 7,784 7,768 7,779 7,802 7,790 .01% Central District
73,843 74,651 75,556 76,323 77,121 4%
(Source: U.S. Census/American Community Survey 5–Year Estimates)
Although the total population in Hamilton and Merrick Counties remained relatively stable, the under 18 population declined by nearly 9% from 2010 to 2014. With the exception of Hall County which grew by 4.8% in the number of persons under 18 years old from 2010 to 2014 (Figure 13).
Figure 13 Under 18 Population (2010 – 2014)
Years 2010 2011 2012 2013 2014 % Change
(2010 to 2014)
Hall 15,500 15,722 15,994 16,047 16,277 4.8%
Hamilton 2,401 2,358 2,315 2,303 2,275 -5.3%
Merrick 1,897 1,909 1,873 1,866 1,836 -3.3 Central District
19,798 19,989 20,182 20,216 20,388 2.9%
(Source: U.S. Census/American Community Survey 5–Year Estimates)
All of the three counties in the Central District saw increases in their median age from 2010 to 2014. Hall County had a consistently lower median age than Nebraska and the United States; while, Hamilton and Merrick Counties had a consistently higher median age than Nebraska and the United States Figure 14).
Figure 14 Median Age (2010 – 2014)
Years 2010 2011 2012 2013 2014 % Change (2010 to
2014)
Hall 35.7 35.5 35.6 35.7 35.9 .01%
Hamilton 41.7 41.9 42.9 42.9 42.8 2.6%
Merrick 42.1 42.4 43.3 42.9 43.1 2.4%
Central District 39.83 39.93 40.6 40.5 40.6 1.9%
Nebraska 36.2 36.3 36.3 36.3 36.2 -
United States 36.9 37.0 37.2 37.3 37.4 - (Source: U.S. Census/American Community Survey 5–Year Estimates)
27
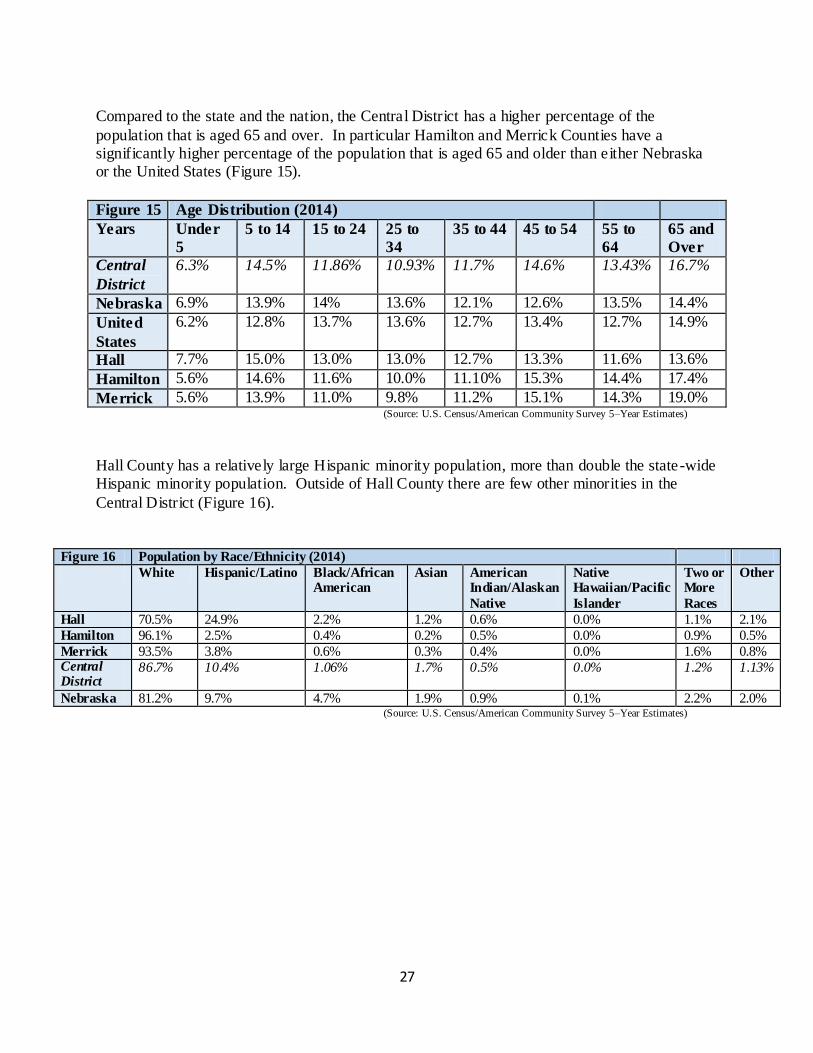
Compared to the state and the nation, the Central District has a higher percentage of the
population that is aged 65 and over. In particular Hamilton and Merrick Counties have a significantly higher percentage of the population that is aged 65 and older than either Nebraska or the United States (Figure 15).
Figure 15 Age Distribution (2014)
Years Under
5
5 to 14 15 to 24 25 to
34
35 to 44 45 to 54 55 to
64
65 and
Over
Central
District
6.3% 14.5% 11.86% 10.93% 11.7% 14.6% 13.43% 16.7%
Nebraska 6.9% 13.9% 14% 13.6% 12.1% 12.6% 13.5% 14.4%
United
States
6.2% 12.8% 13.7% 13.6% 12.7% 13.4% 12.7% 14.9%
Hall 7.7% 15.0% 13.0% 13.0% 12.7% 13.3% 11.6% 13.6%
Hamilton 5.6% 14.6% 11.6% 10.0% 11.10% 15.3% 14.4% 17.4%
Merrick 5.6% 13.9% 11.0% 9.8% 11.2% 15.1% 14.3% 19.0% (Source: U.S. Census/American Community Survey 5–Year Estimates)
Hall County has a relatively large Hispanic minority population, more than double the state-wide Hispanic minority population. Outside of Hall County there are few other minorities in the
Central District (Figure 16).
Figure 16 Population by Race/Ethnicity (2014)
White Hispanic/Latino Black/African American
Asian American Indian/Alaskan
Native
Native Hawaiian/Pacific
Islander
Two or More
Races
Other
Hall 70.5% 24.9% 2.2% 1.2% 0.6% 0.0% 1.1% 2.1%
Hamilton 96.1% 2.5% 0.4% 0.2% 0.5% 0.0% 0.9% 0.5%
Merrick 93.5% 3.8% 0.6% 0.3% 0.4% 0.0% 1.6% 0.8% Central District
86.7% 10.4% 1.06% 1.7% 0.5% 0.0% 1.2% 1.13%
Nebraska 81.2% 9.7% 4.7% 1.9% 0.9% 0.1% 2.2% 2.0% (Source: U.S. Census/American Community Survey 5–Year Estimates)
28
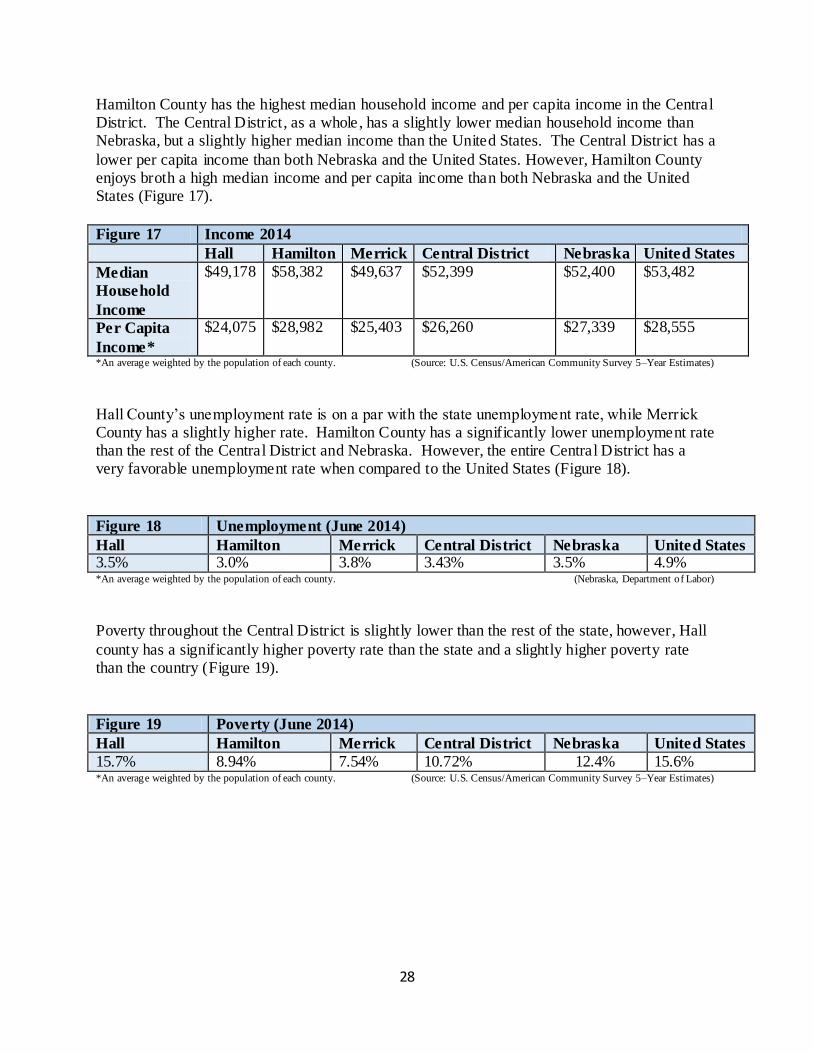
Hamilton County has the highest median household income and per capita income in the Central District. The Central District, as a whole, has a slightly lower median household income than Nebraska, but a slightly higher median income than the United States. The Central District has a
lower per capita income than both Nebraska and the United States. However, Hamilton County enjoys broth a high median income and per capita income than both Nebraska and the United States (Figure 17).
Figure 17 Income 2014
Hall Hamilton Merrick Central District Nebraska United States
Median
Household
Income
$49,178 $58,382 $49,637 $52,399 $52,400 $53,482
Per Capita
Income*
$24,075 $28,982 $25,403 $26,260 $27,339 $28,555
*An average weighted by the population of each county. (Source: U.S. Census/American Community Survey 5–Year Estimates)
Hall County’s unemployment rate is on a par with the state unemployment rate, while Merrick County has a slightly higher rate. Hamilton County has a significantly lower unemployment rate than the rest of the Central District and Nebraska. However, the entire Central District has a very favorable unemployment rate when compared to the United States (Figure 18).
Figure 18 Unemployment (June 2014)
Hall Hamilton Merrick Central District Nebraska United States 3.5% 3.0% 3.8% 3.43% 3.5% 4.9% *An average weighted by the population of each county. (Nebraska, Department of Labor)
Poverty throughout the Central District is slightly lower than the rest of the state, however, Hall
county has a significantly higher poverty rate than the state and a slightly higher poverty rate than the country (Figure 19).
Figure 19 Poverty (June 2014)
Hall Hamilton Merrick Central District Nebraska United States
15.7% 8.94% 7.54% 10.72% 12.4% 15.6% *An average weighted by the population of each county. (Source: U.S. Census/American Community Survey 5–Year Estimates)
29
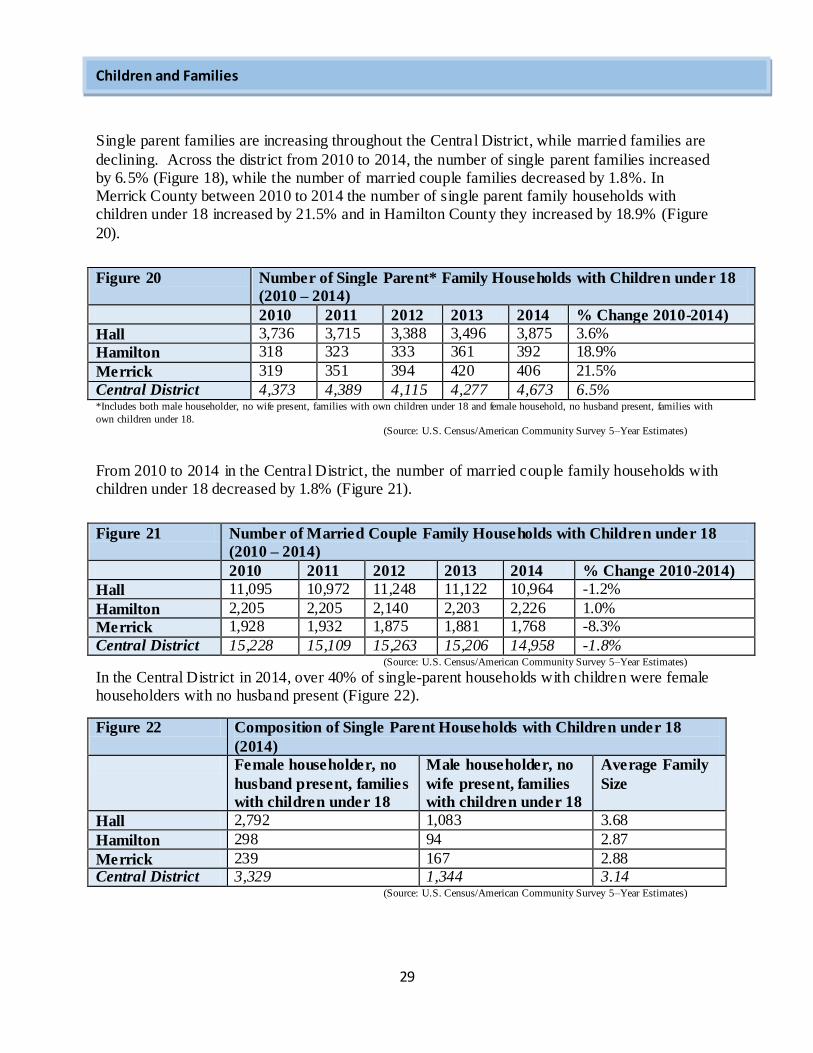
Single parent families are increasing throughout the Central District, while married families are
declining. Across the district from 2010 to 2014, the number of single parent families increased by 6.5% (Figure 18), while the number of married couple families decreased by 1.8%. In Merrick County between 2010 to 2014 the number of single parent family households with children under 18 increased by 21.5% and in Hamilton County they increased by 18.9% (Figure
20).
Figure 20 Number of Single Parent* Family Households with Children under 18
(2010 – 2014)
2010 2011 2012 2013 2014 % Change 2010-2014)
Hall 3,736 3,715 3,388 3,496 3,875 3.6%
Hamilton 318 323 333 361 392 18.9%
Merrick 319 351 394 420 406 21.5%
Central District 4,373 4,389 4,115 4,277 4,673 6.5% *Includes both male householder, no wife present, families with own children under 18 and female household, no husband present, families with
own children under 18. (Source: U.S. Census/American Community Survey 5–Year Estimates)
From 2010 to 2014 in the Central District, the number of married couple family households with children under 18 decreased by 1.8% (Figure 21).
Figure 21 Number of Married Couple Family Households with Children under 18
(2010 – 2014)
2010 2011 2012 2013 2014 % Change 2010-2014)
Hall 11,095 10,972 11,248 11,122 10,964 -1.2%
Hamilton 2,205 2,205 2,140 2,203 2,226 1.0%
Merrick 1,928 1,932 1,875 1,881 1,768 -8.3%
Central District 15,228 15,109 15,263 15,206 14,958 -1.8% (Source: U.S. Census/American Community Survey 5–Year Estimates)
In the Central District in 2014, over 40% of single-parent households with children were female householders with no husband present (Figure 22).
Figure 22 Composition of Single Parent Households with Children under 18
(2014)
Female householder, no
husband present, families
with children under 18
Male householder, no
wife present, families
with children under 18
Average Family
Size
Hall 2,792 1,083 3.68
Hamilton 298 94 2.87
Merrick 239 167 2.88 Central District 3,329 1,344 3.14
(Source: U.S. Census/American Community Survey 5–Year Estimates)
Children and Families
30
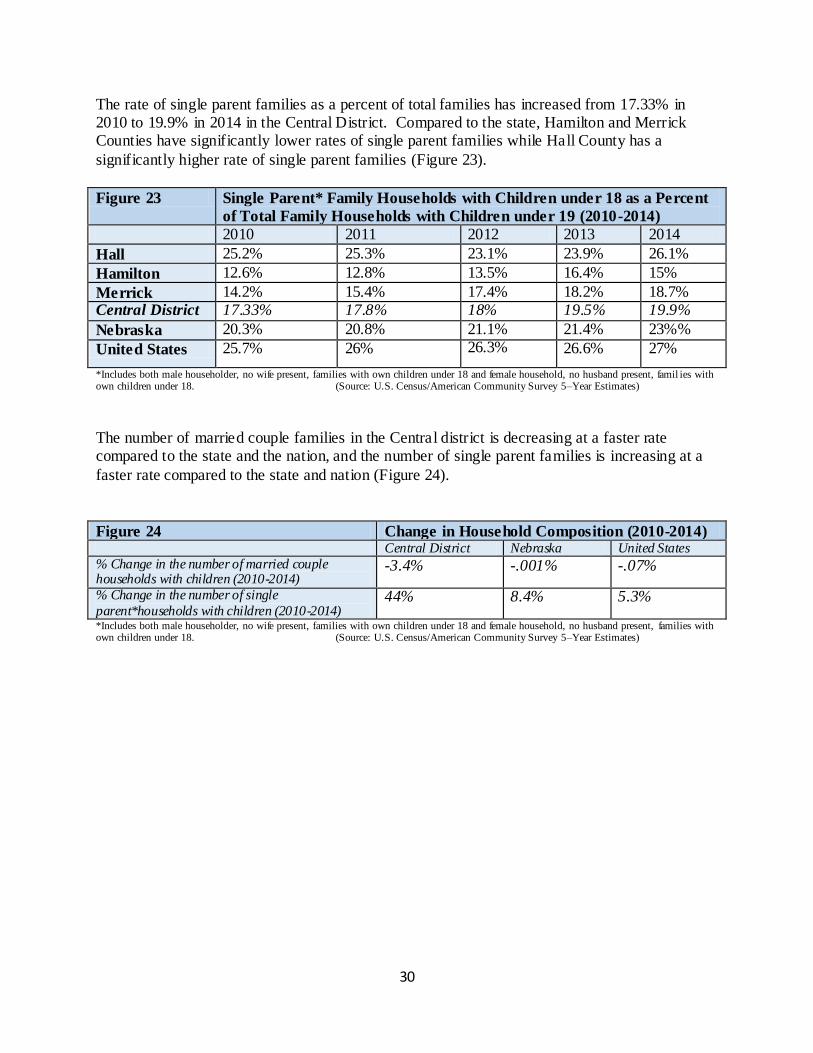
The rate of single parent families as a percent of total families has increased from 17.33% in 2010 to 19.9% in 2014 in the Central District. Compared to the state, Hamilton and Merrick Counties have significantly lower rates of single parent families while Hall County has a
significantly higher rate of single parent families (Figure 23).
Figure 23 Single Parent* Family Households with Children under 18 as a Percent
of Total Family Households with Children under 19 (2010-2014)
2010 2011 2012 2013 2014
Hall 25.2% 25.3% 23.1% 23.9% 26.1%
Hamilton 12.6% 12.8% 13.5% 16.4% 15%
Merrick 14.2% 15.4% 17.4% 18.2% 18.7% Central District 17.33% 17.8% 18% 19.5% 19.9%
Nebraska 20.3% 20.8% 21.1% 21.4% 23%%
United States 25.7% 26% 26.3% 26.6% 27%
*Includes both male householder, no wife present, families with own children under 18 and female household, no husband present, famil ies with own children under 18. (Source: U.S. Census/American Community Survey 5–Year Estimates)
The number of married couple families in the Central district is decreasing at a faster rate compared to the state and the nation, and the number of single parent families is increasing at a
faster rate compared to the state and nation (Figure 24).
Figure 24 Change in Household Composition (2010-2014) Central District Nebraska United States
% Change in the number of married couple households with children (2010-2014)
-3.4% -.001% -.07%
% Change in the number of single
parent*households with children (2010-2014) 44% 8.4% 5.3%
*Includes both male householder, no wife present, families with own children under 18 and female household, no husband present, families with own children under 18. (Source: U.S. Census/American Community Survey 5–Year Estimates)
31
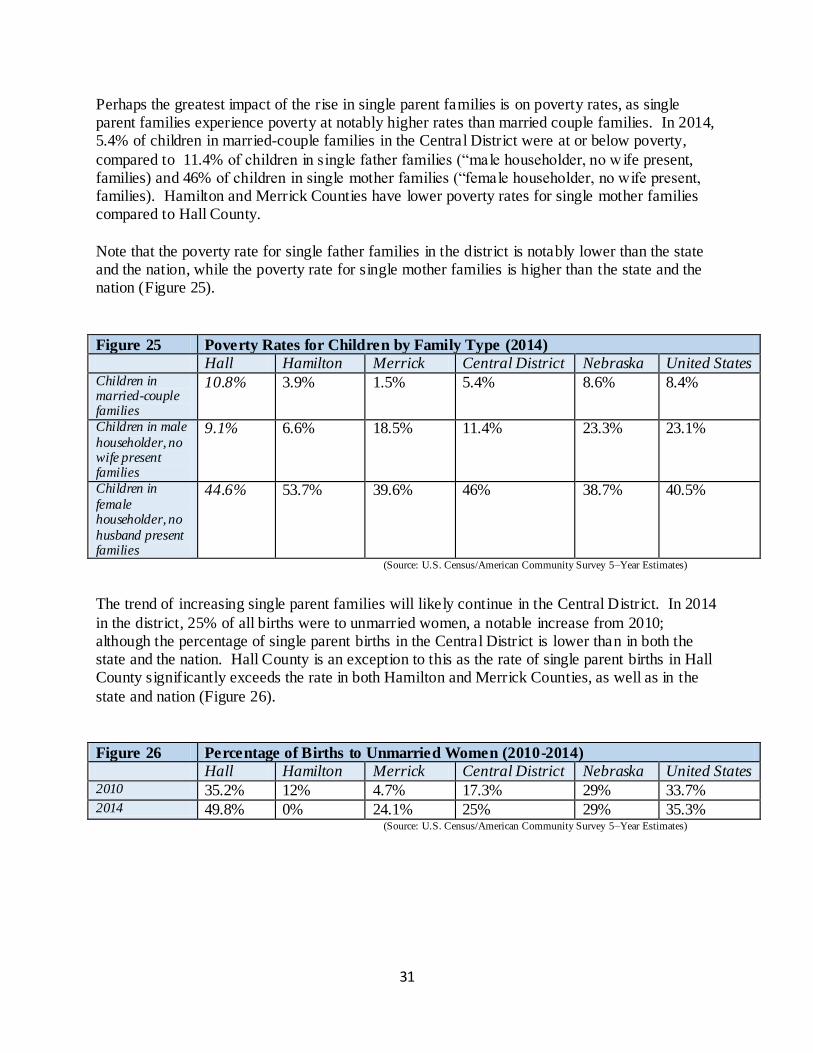
Perhaps the greatest impact of the rise in single parent families is on poverty rates, as single parent families experience poverty at notably higher rates than married couple families. In 2014, 5.4% of children in married-couple families in the Central District were at or below poverty,
compared to 11.4% of children in single father families (“male householder, no w ife present, families) and 46% of children in single mother families (“female householder, no wife present, families). Hamilton and Merrick Counties have lower poverty rates for single mother families compared to Hall County.
Note that the poverty rate for single father families in the district is notably lower than the state and the nation, while the poverty rate for single mother families is higher than the state and the nation (Figure 25).
Figure 25 Poverty Rates for Children by Family Type (2014)
Hall Hamilton Merrick Central District Nebraska United States Children in married-couple families
10.8% 3.9% 1.5% 5.4% 8.6% 8.4%
Children in male
householder, no wife present families
9.1% 6.6% 18.5% 11.4% 23.3% 23.1%
Children in
female householder, no
husband present families
44.6% 53.7% 39.6% 46% 38.7% 40.5%
(Source: U.S. Census/American Community Survey 5–Year Estimates)
The trend of increasing single parent families will likely continue in the Central District. In 2014
in the district, 25% of all births were to unmarried women, a notable increase from 2010; although the percentage of single parent births in the Central District is lower than in both the state and the nation. Hall County is an exception to this as the rate of single parent births in Hall County significantly exceeds the rate in both Hamilton and Merrick Counties, as well as in the
state and nation (Figure 26).
Figure 26 Percentage of Births to Unmarried Women (2010-2014)
Hall Hamilton Merrick Central District Nebraska United States 2010 35.2% 12% 4.7% 17.3% 29% 33.7% 2014 49.8% 0% 24.1% 25% 29% 35.3%
(Source: U.S. Census/American Community Survey 5–Year Estimates)
32
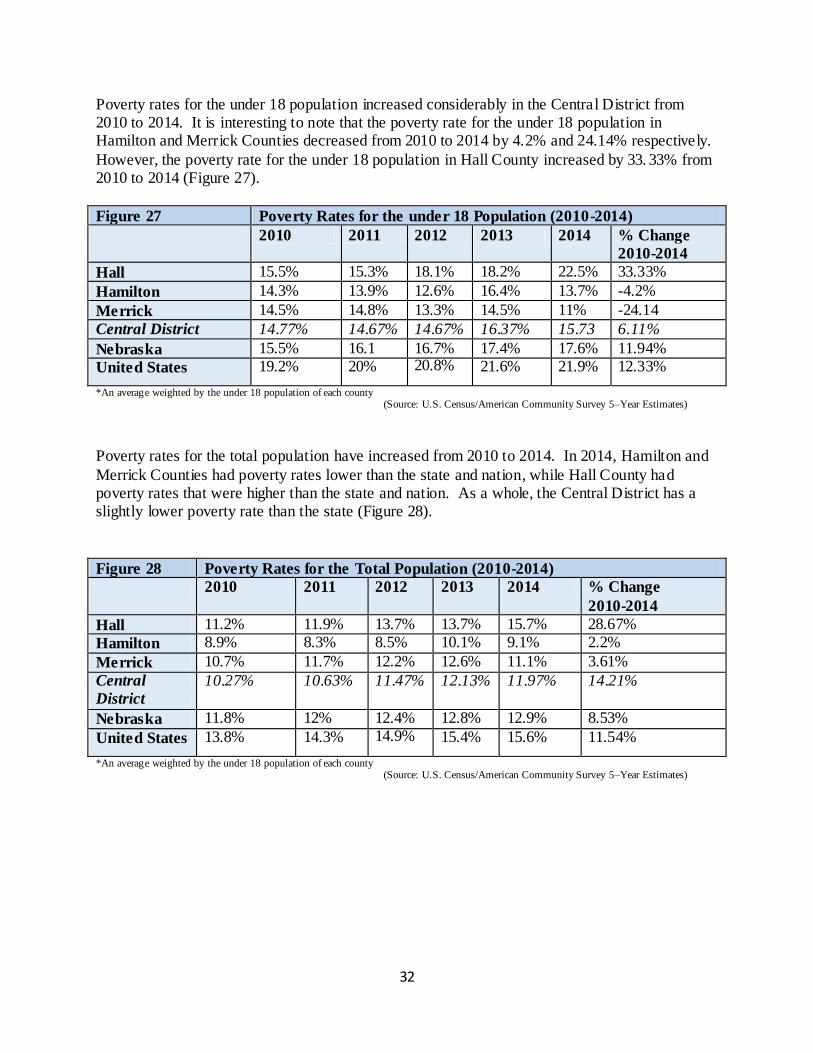
Poverty rates for the under 18 population increased considerably in the Central District from 2010 to 2014. It is interesting to note that the poverty rate for the under 18 population in Hamilton and Merrick Counties decreased from 2010 to 2014 by 4.2% and 24.14% respectively.
However, the poverty rate for the under 18 population in Hall County increased by 33. 33% from 2010 to 2014 (Figure 27).
Figure 27 Poverty Rates for the under 18 Population (2010-2014)
2010 2011 2012 2013 2014 % Change
2010-2014
Hall 15.5% 15.3% 18.1% 18.2% 22.5% 33.33%
Hamilton 14.3% 13.9% 12.6% 16.4% 13.7% -4.2%
Merrick 14.5% 14.8% 13.3% 14.5% 11% -24.14
Central District 14.77% 14.67% 14.67% 16.37% 15.73 6.11%
Nebraska 15.5% 16.1 16.7% 17.4% 17.6% 11.94%
United States 19.2% 20% 20.8% 21.6% 21.9% 12.33%
*An average weighted by the under 18 population of each county (Source: U.S. Census/American Community Survey 5–Year Estimates)
Poverty rates for the total population have increased from 2010 to 2014. In 2014, Hamilton and
Merrick Counties had poverty rates lower than the state and nation, while Hall County had poverty rates that were higher than the state and nation. As a whole, the Central District has a slightly lower poverty rate than the state (Figure 28).
Figure 28 Poverty Rates for the Total Population (2010-2014)
2010 2011 2012 2013 2014 % Change
2010-2014
Hall 11.2% 11.9% 13.7% 13.7% 15.7% 28.67%
Hamilton 8.9% 8.3% 8.5% 10.1% 9.1% 2.2%
Merrick 10.7% 11.7% 12.2% 12.6% 11.1% 3.61%
Central
District
10.27% 10.63% 11.47% 12.13% 11.97% 14.21%
Nebraska 11.8% 12% 12.4% 12.8% 12.9% 8.53%
United States 13.8% 14.3% 14.9% 15.4% 15.6% 11.54%
*An average weighted by the under 18 population of each county (Source: U.S. Census/American Community Survey 5–Year Estimates)
33
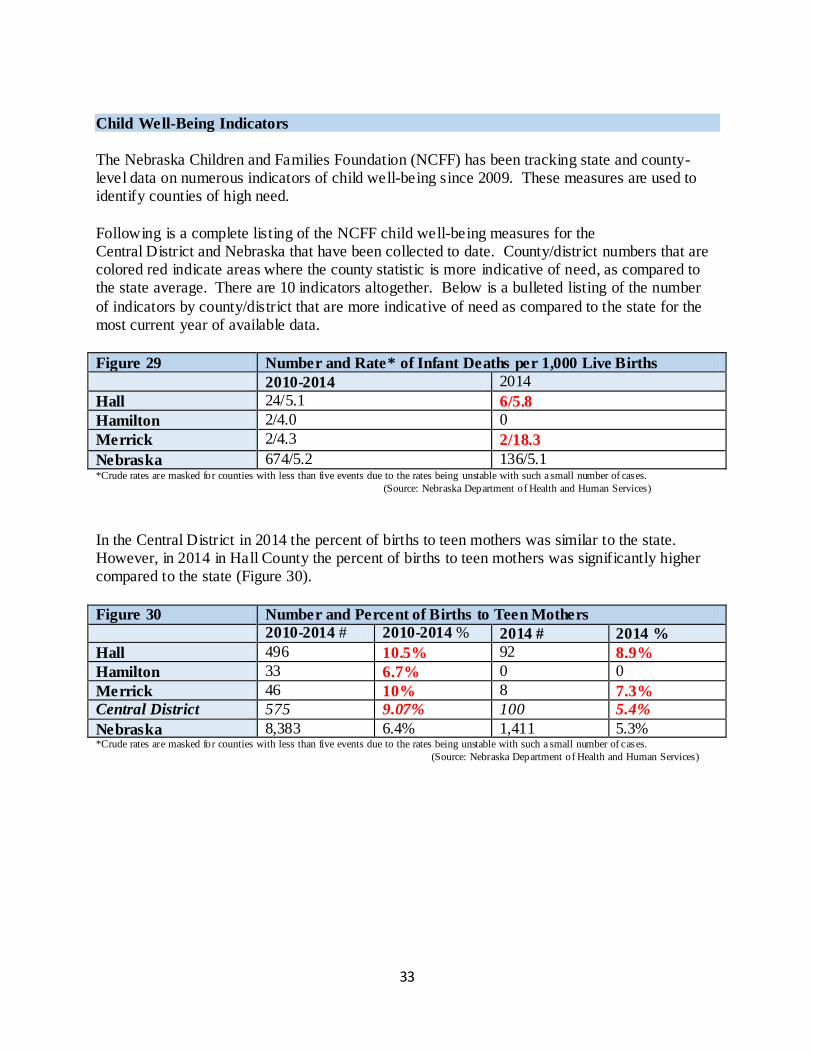
Child Well-Being Indicators
The Nebraska Children and Families Foundation (NCFF) has been tracking state and county-level data on numerous indicators of child well-being since 2009. These measures are used to identify counties of high need.
Following is a complete listing of the NCFF child well-being measures for the Central District and Nebraska that have been collected to date. County/district numbers that are colored red indicate areas where the county statistic is more indicative of need, as compared to the state average. There are 10 indicators altogether. Below is a bulleted listing of the number
of indicators by county/district that are more indicative of need as compared to the state for the most current year of available data.
Figure 29 Number and Rate* of Infant Deaths per 1,000 Live Births
2010-2014 2014
Hall 24/5.1 6/5.8
Hamilton 2/4.0 0
Merrick 2/4.3 2/18.3
Nebraska 674/5.2 136/5.1 *Crude rates are masked for counties with less than five events due to the rates being unstable with such a small number of cases.
(Source: Nebraska Department of Health and Human Services)
In the Central District in 2014 the percent of births to teen mothers was similar to the state. However, in 2014 in Hall County the percent of births to teen mothers was significantly higher compared to the state (Figure 30).
Figure 30 Number and Percent of Births to Teen Mothers
2010-2014 # 2010-2014 % 2014 # 2014 %
Hall 496 10.5% 92 8.9%
Hamilton 33 6.7% 0 0
Merrick 46 10% 8 7.3%
Central District 575 9.07% 100 5.4%
Nebraska 8,383 6.4% 1,411 5.3% *Crude rates are masked for counties with less than five events due to the rates being unstable with such a small number of cases.
(Source: Nebraska Department of Health and Human Services)
34
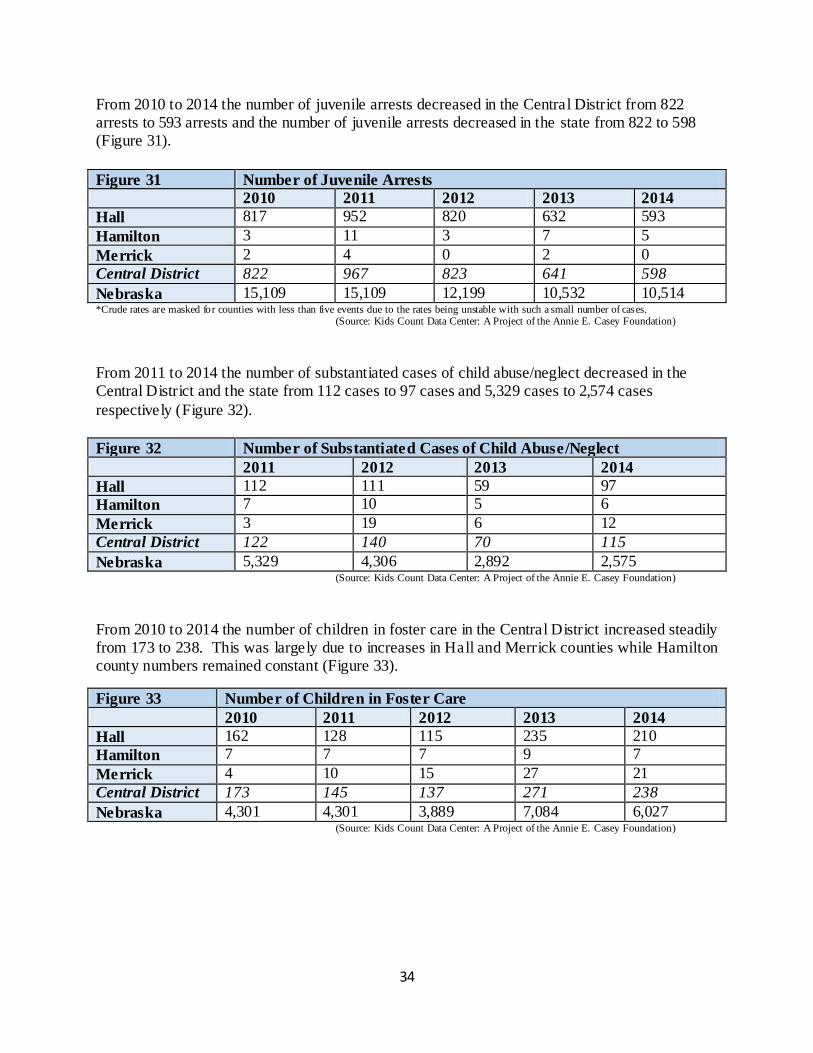
From 2010 to 2014 the number of juvenile arrests decreased in the Central District from 822 arrests to 593 arrests and the number of juvenile arrests decreased in the state from 822 to 598 (Figure 31).
Figure 31 Number of Juvenile Arrests
2010 2011 2012 2013 2014
Hall 817 952 820 632 593
Hamilton 3 11 3 7 5
Merrick 2 4 0 2 0
Central District 822 967 823 641 598
Nebraska 15,109 15,109 12,199 10,532 10,514 *Crude rates are masked for counties with less than five events due to the rates being unstable with such a small number of cases.
(Source: Kids Count Data Center: A Project of the Annie E. Casey Foundation)
From 2011 to 2014 the number of substantiated cases of child abuse/neglect decreased in the Central District and the state from 112 cases to 97 cases and 5,329 cases to 2,574 cases
respectively (Figure 32).
Figure 32 Number of Substantiated Cases of Child Abuse/Neglect
2011 2012 2013 2014
Hall 112 111 59 97
Hamilton 7 10 5 6
Merrick 3 19 6 12
Central District 122 140 70 115
Nebraska 5,329 4,306 2,892 2,575 (Source: Kids Count Data Center: A Project of the Annie E. Casey Foundation)
From 2010 to 2014 the number of children in foster care in the Central District increased steadily from 173 to 238. This was largely due to increases in Hall and Merrick counties while Hamilton county numbers remained constant (Figure 33).
Figure 33 Number of Children in Foster Care
2010 2011 2012 2013 2014
Hall 162 128 115 235 210
Hamilton 7 7 7 9 7
Merrick 4 10 15 27 21
Central District 173 145 137 271 238
Nebraska 4,301 4,301 3,889 7,084 6,027 (Source: Kids Count Data Center: A Project of the Annie E. Casey Foundation)
35
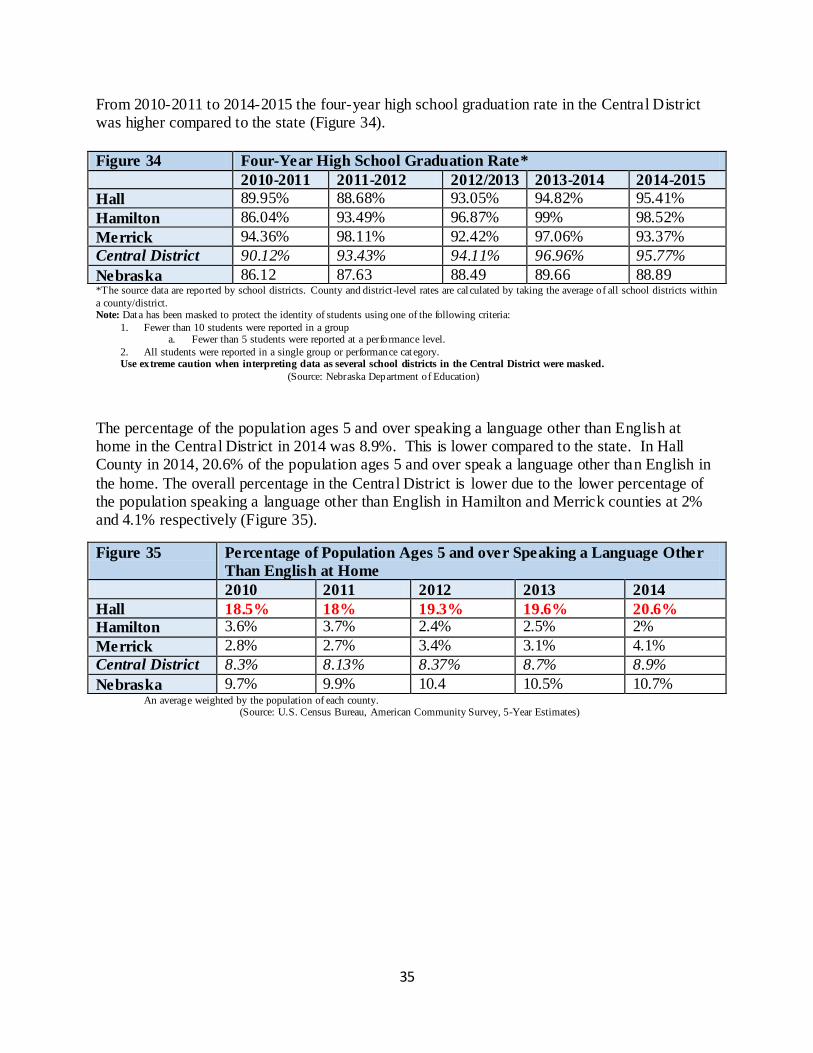
From 2010-2011 to 2014-2015 the four-year high school graduation rate in the Central District was higher compared to the state (Figure 34).
Figure 34 Four-Year High School Graduation Rate*
2010-2011 2011-2012 2012/2013 2013-2014 2014-2015
Hall 89.95% 88.68% 93.05% 94.82% 95.41%
Hamilton 86.04% 93.49% 96.87% 99% 98.52%
Merrick 94.36% 98.11% 92.42% 97.06% 93.37%
Central District 90.12% 93.43% 94.11% 96.96% 95.77%
Nebraska 86.12 87.63 88.49 89.66 88.89 *The source data are reported by school districts. County and district-level rates are cal culated by taking the average of all school districts within
a county/district. Note: Data has been masked to protect the identity of students using one of the following criteria:
1. Fewer than 10 students were reported in a group a. Fewer than 5 students were reported at a performance level.
2. All students were reported in a single group or performance cat egory. Use extreme caution when interpreting data as several school districts in the Central District were masked.
(Source: Nebraska Department of Education)
The percentage of the population ages 5 and over speaking a language other than English at home in the Central District in 2014 was 8.9%. This is lower compared to the state. In Hall County in 2014, 20.6% of the population ages 5 and over speak a language other than English in
the home. The overall percentage in the Central District is lower due to the lower percentage of the population speaking a language other than English in Hamilton and Merrick counties at 2% and 4.1% respectively (Figure 35).
Figure 35 Percentage of Population Ages 5 and over Speaking a Language Other
Than English at Home
2010 2011 2012 2013 2014
Hall 18.5% 18% 19.3% 19.6% 20.6%
Hamilton 3.6% 3.7% 2.4% 2.5% 2%
Merrick 2.8% 2.7% 3.4% 3.1% 4.1%
Central District 8.3% 8.13% 8.37% 8.7% 8.9%
Nebraska 9.7% 9.9% 10.4 10.5% 10.7% An average weighted by the population of each county. (Source: U.S. Census Bureau, American Community Survey, 5-Year Estimates)
36
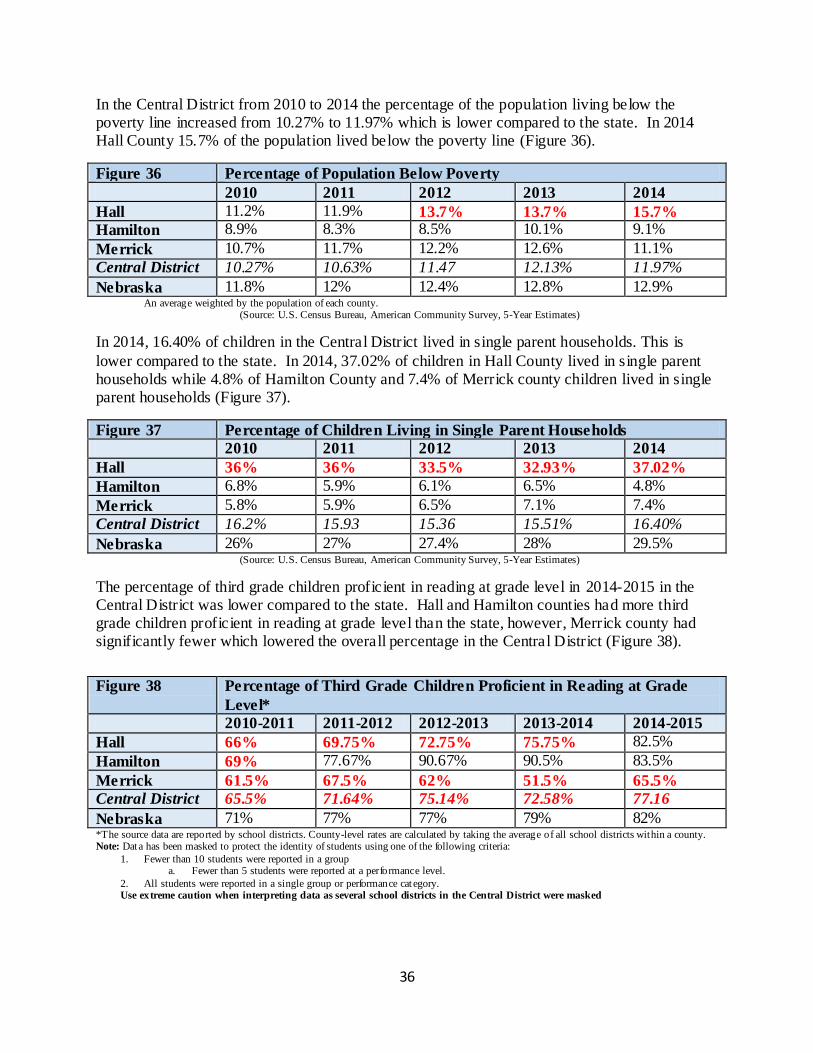
In the Central District from 2010 to 2014 the percentage of the population living below the poverty line increased from 10.27% to 11.97% which is lower compared to the state. In 2014 Hall County 15.7% of the population lived below the poverty line (Figure 36).
Figure 36 Percentage of Population Below Poverty
2010 2011 2012 2013 2014
Hall 11.2% 11.9% 13.7% 13.7% 15.7%
Hamilton 8.9% 8.3% 8.5% 10.1% 9.1%
Merrick 10.7% 11.7% 12.2% 12.6% 11.1%
Central District 10.27% 10.63% 11.47 12.13% 11.97%
Nebraska 11.8% 12% 12.4% 12.8% 12.9% An average weighted by the population of each county. (Source: U.S. Census Bureau, American Community Survey, 5-Year Estimates)
In 2014, 16.40% of children in the Central District lived in single parent households. This is
lower compared to the state. In 2014, 37.02% of children in Hall County lived in single parent households while 4.8% of Hamilton County and 7.4% of Merrick county children lived in single parent households (Figure 37).
Figure 37 Percentage of Children Living in Single Parent Households
2010 2011 2012 2013 2014
Hall 36% 36% 33.5% 32.93% 37.02%
Hamilton 6.8% 5.9% 6.1% 6.5% 4.8%
Merrick 5.8% 5.9% 6.5% 7.1% 7.4%
Central District 16.2% 15.93 15.36 15.51% 16.40%
Nebraska 26% 27% 27.4% 28% 29.5% (Source: U.S. Census Bureau, American Community Survey, 5-Year Estimates)
The percentage of third grade children proficient in reading at grade level in 2014-2015 in the Central District was lower compared to the state. Hall and Hamilton counties had more third grade children proficient in reading at grade level than the state, however, Merrick county had significantly fewer which lowered the overall percentage in the Central District (Figure 38).
Figure 38 Percentage of Third Grade Children Proficient in Reading at Grade
Level*
2010-2011 2011-2012 2012-2013 2013-2014 2014-2015
Hall 66% 69.75% 72.75% 75.75% 82.5%
Hamilton 69% 77.67% 90.67% 90.5% 83.5%
Merrick 61.5% 67.5% 62% 51.5% 65.5%
Central District 65.5% 71.64% 75.14% 72.58% 77.16
Nebraska 71% 77% 77% 79% 82% *The source data are reported by school districts. County-level rates are calculated by taking the average of all school districts within a county. Note: Data has been masked to protect the identity of students using one of the following criteria:
1. Fewer than 10 students were reported in a group a. Fewer than 5 students were reported at a performance level.
2. All students were reported in a single group or performance cat egory. Use extreme caution when interpreting data as several school districts in the Central District were masked
37
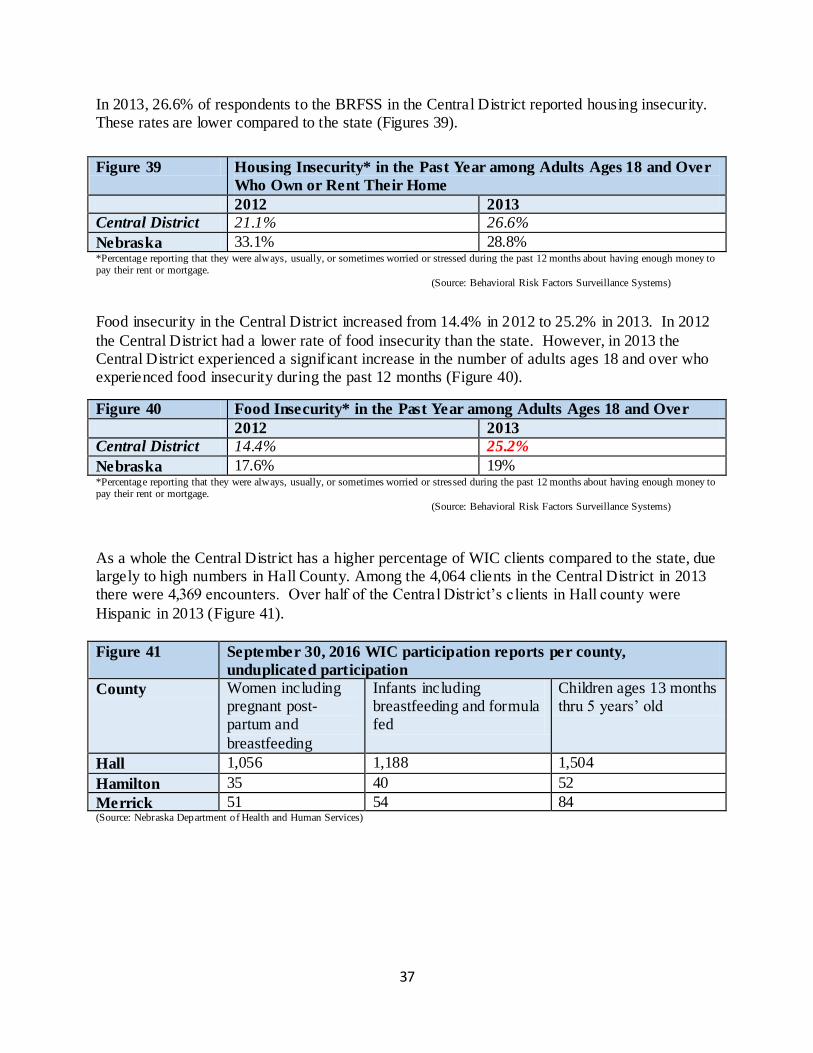
In 2013, 26.6% of respondents to the BRFSS in the Central District reported housing insecurity. These rates are lower compared to the state (Figures 39).
Figure 39 Housing Insecurity* in the Past Year among Adults Ages 18 and Over
Who Own or Rent Their Home
2012 2013
Central District 21.1% 26.6%
Nebraska 33.1% 28.8% *Percentage reporting that they were always, usually, or sometimes worried or stressed during the past 12 months about having enough money to pay their rent or mortgage.
(Source: Behavioral Risk Factors Surveillance Systems)
Food insecurity in the Central District increased from 14.4% in 2012 to 25.2% in 2013. In 2012
the Central District had a lower rate of food insecurity than the state. However, in 2013 the Central District experienced a significant increase in the number of adults ages 18 and over who experienced food insecurity during the past 12 months (Figure 40).
Figure 40 Food Insecurity* in the Past Year among Adults Ages 18 and Over
2012 2013
Central District 14.4% 25.2%
Nebraska 17.6% 19% *Percentage reporting that they were always, usually, or sometimes worried or stressed during the past 12 months about having enough money to pay their rent or mortgage.
(Source: Behavioral Risk Factors Surveillance Systems)
As a whole the Central District has a higher percentage of WIC clients compared to the state, due largely to high numbers in Hall County. Among the 4,064 clients in the Central District in 2013 there were 4,369 encounters. Over half of the Central District’s clients in Hall county were
Hispanic in 2013 (Figure 41).
Figure 41 September 30, 2016 WIC participation reports per county,
unduplicated participation
County Women including pregnant post-partum and
breastfeeding
Infants including breastfeeding and formula fed
Children ages 13 months thru 5 years’ old
Hall 1,056 1,188 1,504
Hamilton 35 40 52
Merrick 51 54 84 (Source: Nebraska Department of Health and Human Services)

38
Figure 42 Medicaid Eligible’s (Percent of Total Population)
Imputed Not Imputed Total
Hall 4,842 54,603 59,445
Hamilton 743 8,210 8,953
Merrick 754 6,918 7,672 (Source: Nebraska Department of Health and Human Services)
The Central District has a higher percentage of children enrolled in Medicaid compared to the state. Hall County has a notably higher rate of children enrolled in Medicaid while Hamilton and Merrick Counties have lower rates than the state (Figure 43).
Figure 43 Children Enrolled in Medicaid (Percent of Total Population)
2010 2011 2012 2013 2014
Hall 40.14% 41.28% 40.93% 40.78% 39.90%
Hamilton 21.33% 23.92% 24.10% 22.71% 22.23%
Merrick 29.84% 29.40% 28.33% 27.97% 28.18%
Central District 36.98% 38.25% 37.94% 38.05% 36.91%
Nebraska 30% 30% 30.62% 31.11% 30.94% (Source: Kids Count Data Center: A Project of the Annie E. Casey Foundation)
Enrollment in SNAP (formerly known as Food Stamps) is higher in the Central District compared to the rest of the state. Hall County has notably higher SNAP participation as a percent of all children compared to Hamilton or Merrick counties. Both Hamilton and Merrick Counties enrollment in SNAP is lower compared to the rest of the state (Figure 44).
Figure 44 Supplemental Nutrition Assistance Program (SNAP) Participation
Among Children (Percent of All Children)
2010 2011 2012 2013 2014
Hall 3,718 (21.33%)
6,267 (35.45%)
3,992 (22.23%)
3,950 (22.13%)
3,743 (20.87%)
Hamilton 237
(9.3%)
483
(19.42%)
248
(10.20%)
251
(10.11%)
186
(7.6%)
Merrick 291 (13.72%)
416 (20.20%)
225 (10.88%)
268 (13.13%)
225 (11.30%)
Central District 4,246 (19.21%)
7,166 (32.24%)
4,465 (19.88%)
4,469 (19.98%)
4,154 (18.56%)
Nebraska 83,597
(16.31%)
108,909
(21.25%)
89,075
(17.21%)
91,240
(17.63%)
84,274
(16.21%) (Source: Kids Count Data Center: A Project of the Annie E. Casey Foundation)
39
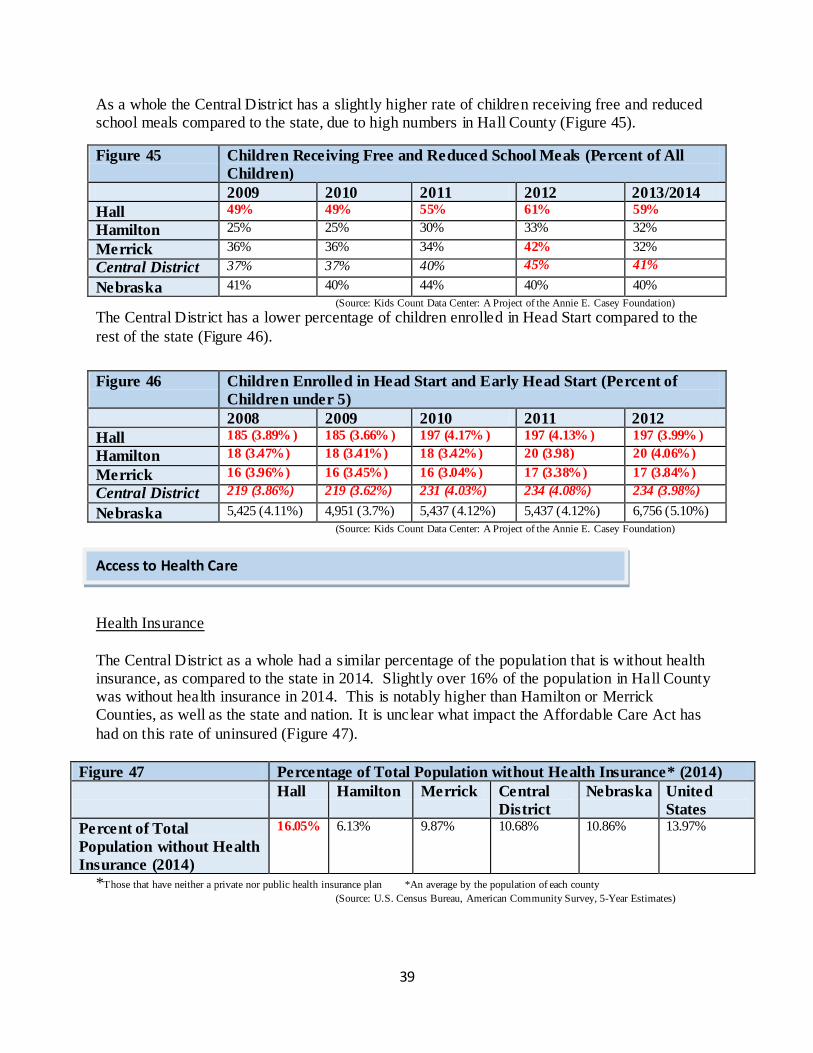
As a whole the Central District has a slightly higher rate of children receiving free and reduced school meals compared to the state, due to high numbers in Hall County (Figure 45).
Figure 45 Children Receiving Free and Reduced School Meals (Percent of All
Children)
2009 2010 2011 2012 2013/2014
Hall 49% 49% 55% 61% 59%
Hamilton 25% 25% 30% 33% 32%
Merrick 36% 36% 34% 42% 32%
Central District 37% 37% 40% 45% 41%
Nebraska 41% 40% 44% 40% 40%
(Source: Kids Count Data Center: A Project of the Annie E. Casey Foundation)
The Central District has a lower percentage of children enrolled in Head Start compared to the
rest of the state (Figure 46).
Figure 46 Children Enrolled in Head Start and Early Head Start (Percent of
Children under 5)
2008 2009 2010 2011 2012
Hall 185 (3.89% ) 185 (3.66% ) 197 (4.17% ) 197 (4.13% ) 197 (3.99% )
Hamilton 18 (3.47%) 18 (3.41%) 18 (3.42%) 20 (3.98) 20 (4.06%)
Merrick 16 (3.96%) 16 (3.45%) 16 (3.04%) 17 (3.38%) 17 (3.84%)
Central District 219 (3.86%) 219 (3.62%) 231 (4.03%) 234 (4.08%) 234 (3.98%)
Nebraska 5,425 (4.11%) 4,951 (3.7%) 5,437 (4.12%) 5,437 (4.12%) 6,756 (5.10%)
(Source: Kids Count Data Center: A Project of the Annie E. Casey Foundation)
Health Insurance
The Central District as a whole had a similar percentage of the population that is without health insurance, as compared to the state in 2014. Slightly over 16% of the population in Hall County was without health insurance in 2014. This is notably higher than Hamilton or Merrick Counties, as well as the state and nation. It is unclear what impact the Affordable Care Act has
had on this rate of uninsured (Figure 47).
Figure 47 Percentage of Total Population without Health Insurance* (2014)
Hall Hamilton Merrick Central
District
Nebraska United
States
Percent of Total
Population without Health
Insurance (2014)
16.05% 6.13% 9.87% 10.68% 10.86% 13.97%
*Those that have neither a private nor public health insurance plan *An average by the population of each county
(Source: U.S. Census Bureau, American Community Survey, 5-Year Estimates)
Access to Health Care
40
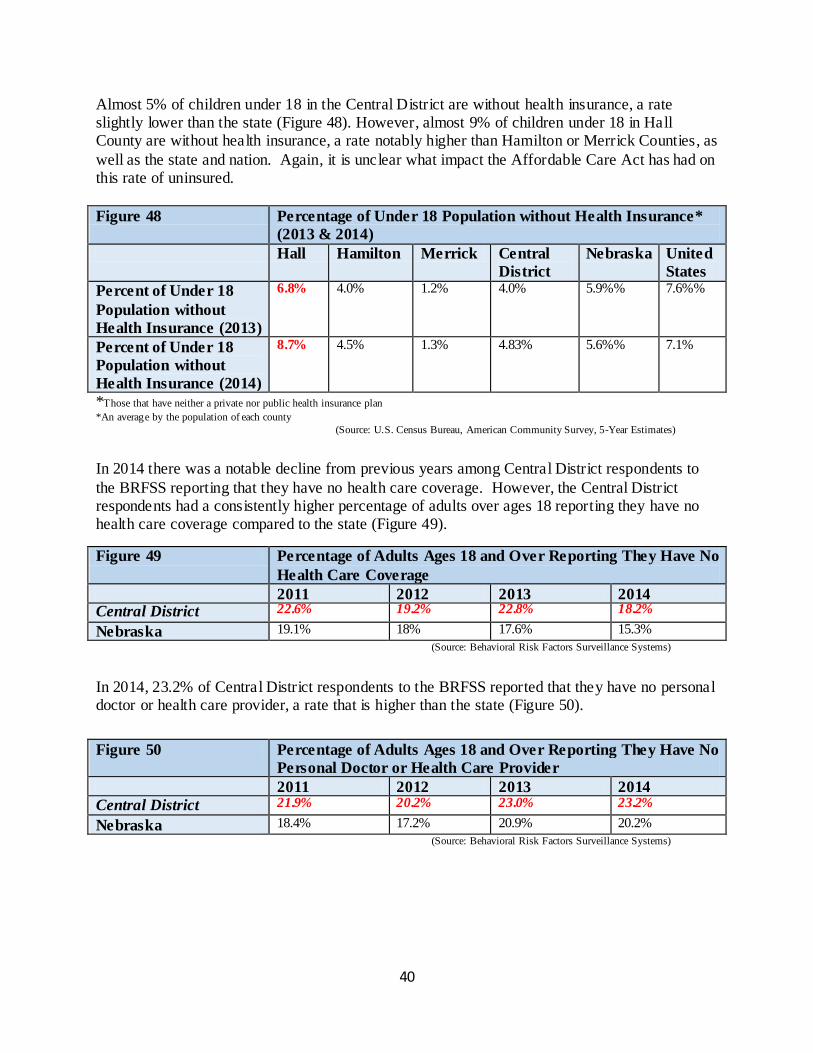
Almost 5% of children under 18 in the Central District are without health insurance, a rate slightly lower than the state (Figure 48). However, almost 9% of children under 18 in Hall County are without health insurance, a rate notably higher than Hamilton or Merrick Counties, as
well as the state and nation. Again, it is unclear what impact the Affordable Care Act has had on this rate of uninsured.
Figure 48 Percentage of Under 18 Population without Health Insurance*
(2013 & 2014)
Hall Hamilton Merrick Central
District
Nebraska United
States
Percent of Under 18
Population without
Health Insurance (2013)
6.8% 4.0% 1.2%
4.0% 5.9%% 7.6%%
Percent of Under 18
Population without
Health Insurance (2014)
8.7% 4.5% 1.3% 4.83% 5.6%% 7.1%
*Those that have neither a private nor public health insurance plan
*An average by the population of each county
(Source: U.S. Census Bureau, American Community Survey, 5-Year Estimates)
In 2014 there was a notable decline from previous years among Central District respondents to
the BRFSS reporting that they have no health care coverage. However, the Central District respondents had a consistently higher percentage of adults over ages 18 reporting they have no health care coverage compared to the state (Figure 49).
Figure 49 Percentage of Adults Ages 18 and Over Reporting They Have No
Health Care Coverage
2011 2012 2013 2014 Central District 22.6% 19.2% 22.8% 18.2%
Nebraska 19.1% 18% 17.6% 15.3%
(Source: Behavioral Risk Factors Surveillance Systems)
In 2014, 23.2% of Central District respondents to the BRFSS reported that they have no personal doctor or health care provider, a rate that is higher than the state (Figure 50).
Figure 50 Percentage of Adults Ages 18 and Over Reporting They Have No
Personal Doctor or Health Care Provider
2011 2012 2013 2014
Central District 21.9% 20.2% 23.0% 23.2%
Nebraska 18.4% 17.2% 20.9% 20.2%
(Source: Behavioral Risk Factors Surveillance Systems)
41
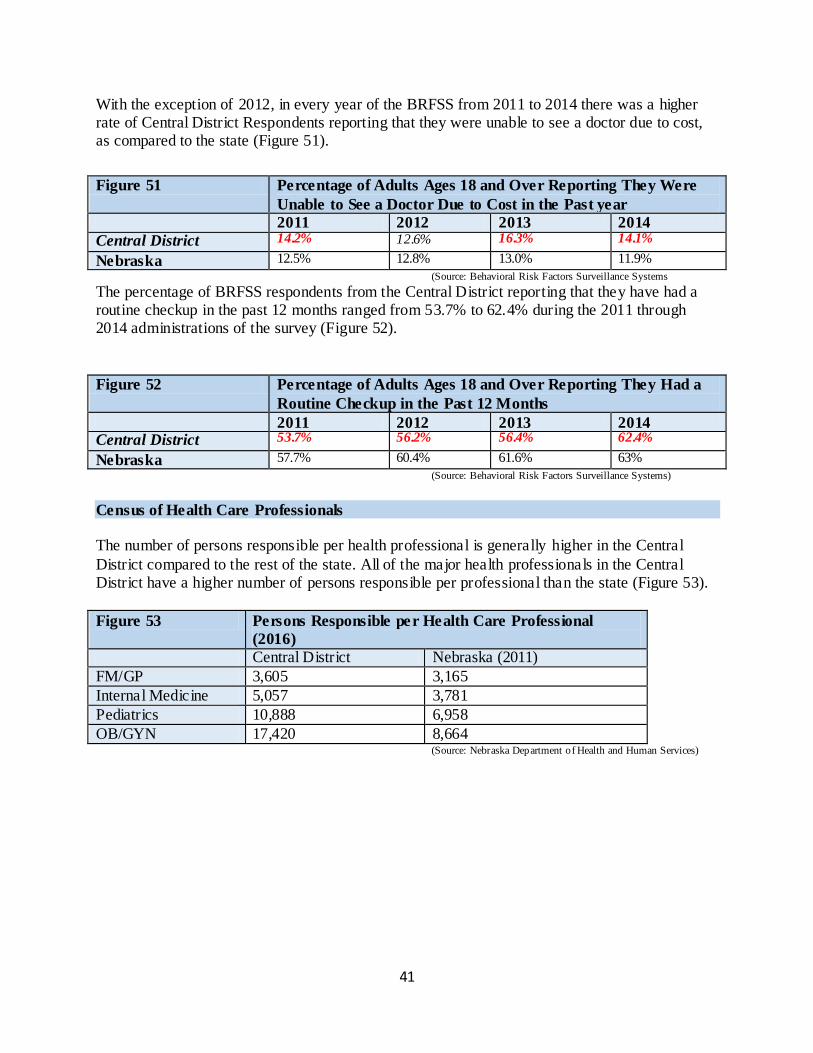
With the exception of 2012, in every year of the BRFSS from 2011 to 2014 there was a higher rate of Central District Respondents reporting that they were unable to see a doctor due to cost, as compared to the state (Figure 51).
Figure 51 Percentage of Adults Ages 18 and Over Reporting They Were
Unable to See a Doctor Due to Cost in the Past year
2011 2012 2013 2014
Central District 14.2% 12.6% 16.3% 14.1%
Nebraska 12.5% 12.8% 13.0% 11.9%
(Source: Behavioral Risk Factors Surveillance Systems
The percentage of BRFSS respondents from the Central District reporting that they have had a routine checkup in the past 12 months ranged from 53.7% to 62.4% during the 2011 through 2014 administrations of the survey (Figure 52).
Figure 52 Percentage of Adults Ages 18 and Over Reporting They Had a
Routine Checkup in the Past 12 Months
2011 2012 2013 2014 Central District 53.7% 56.2% 56.4% 62.4%
Nebraska 57.7% 60.4% 61.6% 63%
(Source: Behavioral Risk Factors Surveillance Systems)
Census of Health Care Professionals The number of persons responsible per health professional is generally higher in the Central
District compared to the rest of the state. All of the major health professionals in the Central District have a higher number of persons responsible per professional than the state (Figure 53).
Figure 53 Persons Responsible per Health Care Professional
(2016)
Central District Nebraska (2011)
FM/GP 3,605 3,165
Internal Medicine 5,057 3,781
Pediatrics 10,888 6,958
OB/GYN 17,420 8,664 (Source: Nebraska Department of Health and Human Services)
42
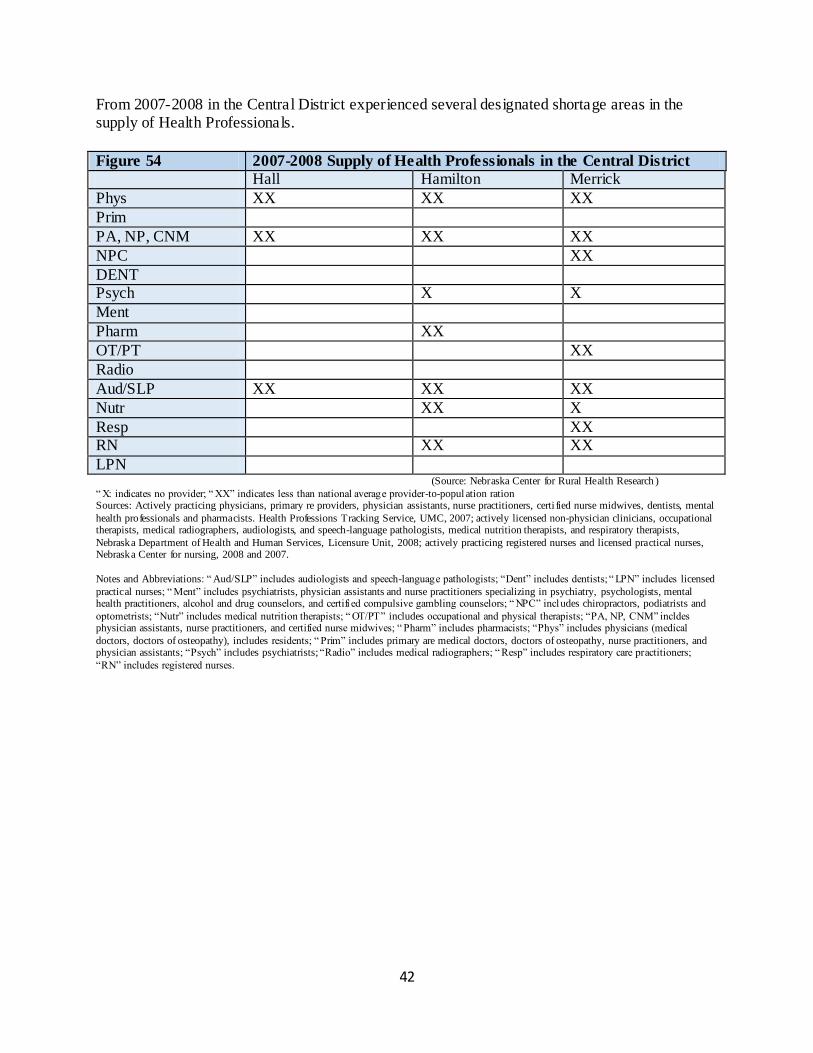
From 2007-2008 in the Central District experienced several designated shortage areas in the supply of Health Professionals.
Figure 54 2007-2008 Supply of Health Professionals in the Central District
Hall Hamilton Merrick
Phys XX XX XX
Prim
PA, NP, CNM XX XX XX
NPC XX
DENT Psych X X
Ment
Pharm XX
OT/PT XX
Radio
Aud/SLP XX XX XX
Nutr XX X
Resp XX RN XX XX
LPN (Source: Nebraska Center for Rural Health Research )
“ X: indicates no provider; “ XX” indicates less than national average provider-to-popul ation ration Sources: Actively practicing physicians, primary re providers, physician assistants, nurse practitioners, certi fied nurse midwives, dentists, mental
health professionals and pharmacists. Health Professions Tracking Service, UMC, 2007; actively licensed non-physician clinicians, occupational therapists, medical radiographers, audiologists, and speech-language pathologists, medical nutrition therapists, and respiratory therapists,
Nebraska Department of Health and Human Services, Licensure Unit, 2008; actively practicing registered nurses and licensed practical nurses, Nebraska Center for nursing, 2008 and 2007.
Notes and Abbreviations: “ Aud/SLP” includes audiologists and speech-language pathologists; “Dent” includes dentists; “ LPN” includes licensed
practical nurses; “ Ment” includes psychiatrists, physician assistants and nurse practitioners specializing in psychiatry, psychologists, mental health practitioners, alcohol and drug counselors, and certifi ed compulsive gambling counselors; “ NPC” includes chiropractors, podiatrists and
optometrists; “Nutr” includes medical nutrition therapists; “ OT/PT” includes occupational and physical therapists; “PA, NP, CNM” incldes physician assistants, nurse practitioners, and certified nurse midwives; “ Pharm” includes pharmacists; “Phys” includes physicians (medical
doctors, doctors of osteopathy), includes residents; “ Prim” includes primary are medical doctors, doctors of osteopathy, nurse practitioners, and physician assistants; “Psych” includes psychiatrists; “Radio” includes medical radiographers; “ Resp” includes respiratory care practitioners;
“RN” includes registered nurses.
43
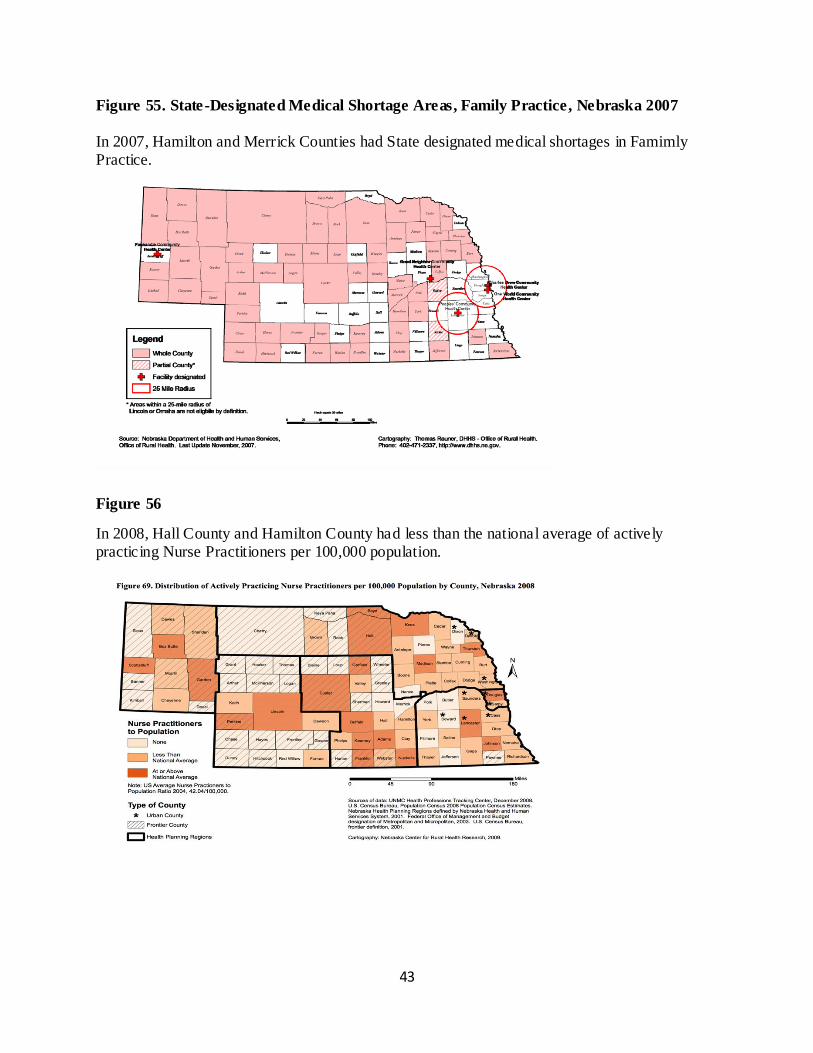
Figure 55. State-Designated Medical Shortage Areas, Family Practice, Nebraska 2007
In 2007, Hamilton and Merrick Counties had State designated medical shortages in Famimly Practice.
Figure 56
In 2008, Hall County and Hamilton County had less than the national average of actively practicing Nurse Practitioners per 100,000 population.
44
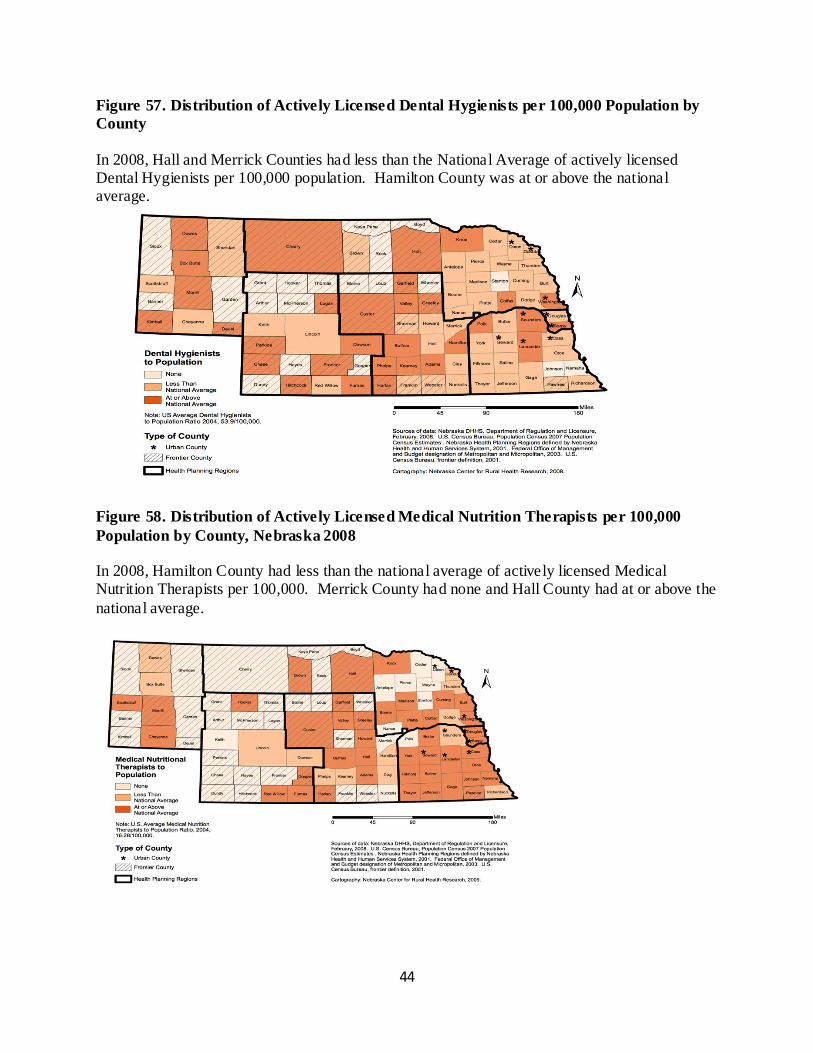
Figure 57. Distribution of Actively Licensed Dental Hygienists per 100,000 Population by
County
In 2008, Hall and Merrick Counties had less than the National Average of actively licensed Dental Hygienists per 100,000 population. Hamilton County was at or above the national average.
Figure 58. Distribution of Actively Licensed Medical Nutrition Therapists per 100,000
Population by County, Nebraska 2008
In 2008, Hamilton County had less than the national average of actively licensed Medical Nutrition Therapists per 100,000. Merrick County had none and Hall County had at or above the
national average.
45
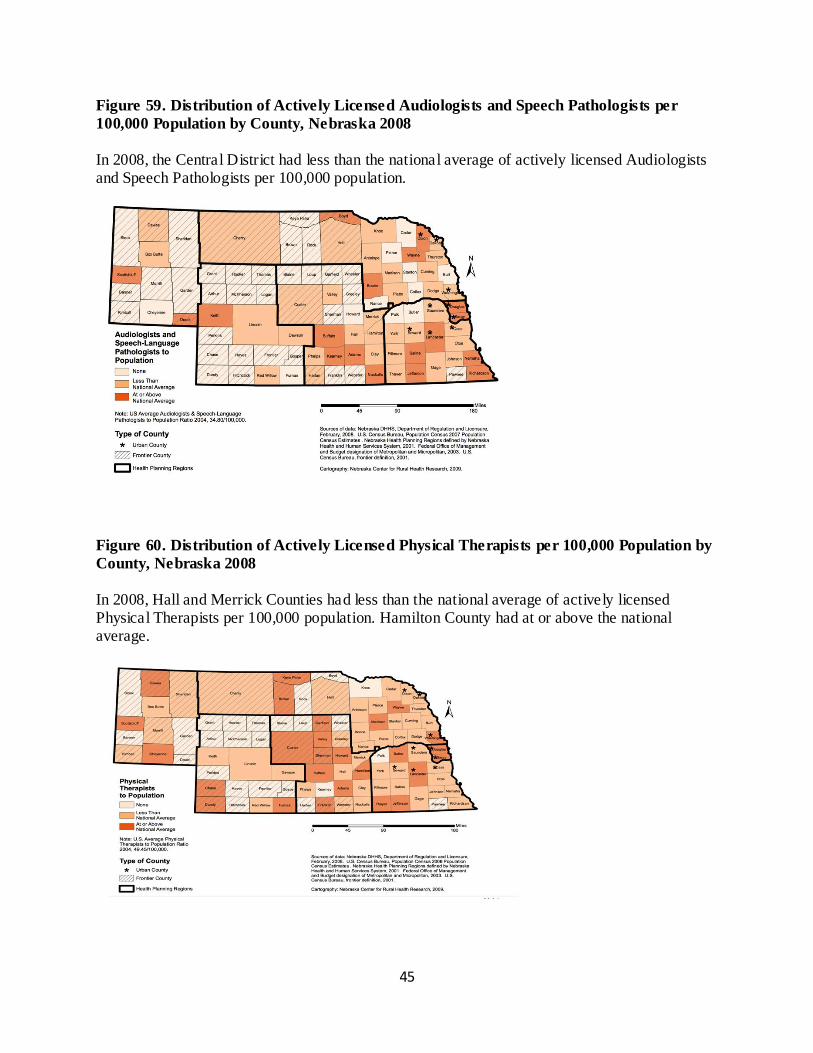
Figure 59. Distribution of Actively Licensed Audiologists and Speech Pathologists per
100,000 Population by County, Nebraska 2008
In 2008, the Central District had less than the national average of actively licensed Audiologists and Speech Pathologists per 100,000 population.
Figure 60. Distribution of Actively Licensed Physical Therapists per 100,000 Population by
County, Nebraska 2008
In 2008, Hall and Merrick Counties had less than the national average of actively licensed Physical Therapists per 100,000 population. Hamilton County had at or above the national average.
46
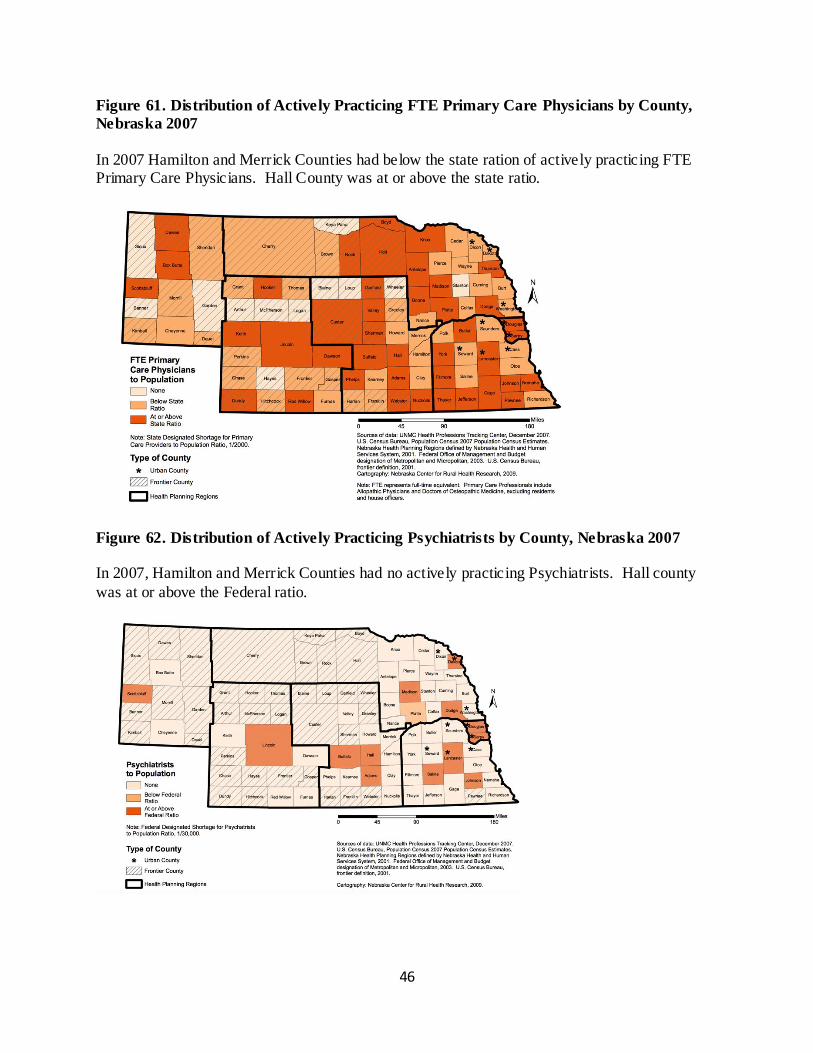
Figure 61. Distribution of Actively Practicing FTE Primary Care Physicians by County,
Nebraska 2007
In 2007 Hamilton and Merrick Counties had below the state ration of actively practicing FTE Primary Care Physicians. Hall County was at or above the state ratio.
Figure 62. Distribution of Actively Practicing Psychiatrists by County, Nebraska 2007
In 2007, Hamilton and Merrick Counties had no actively practicing Psychiatrists. Hall county
was at or above the Federal ratio.
47
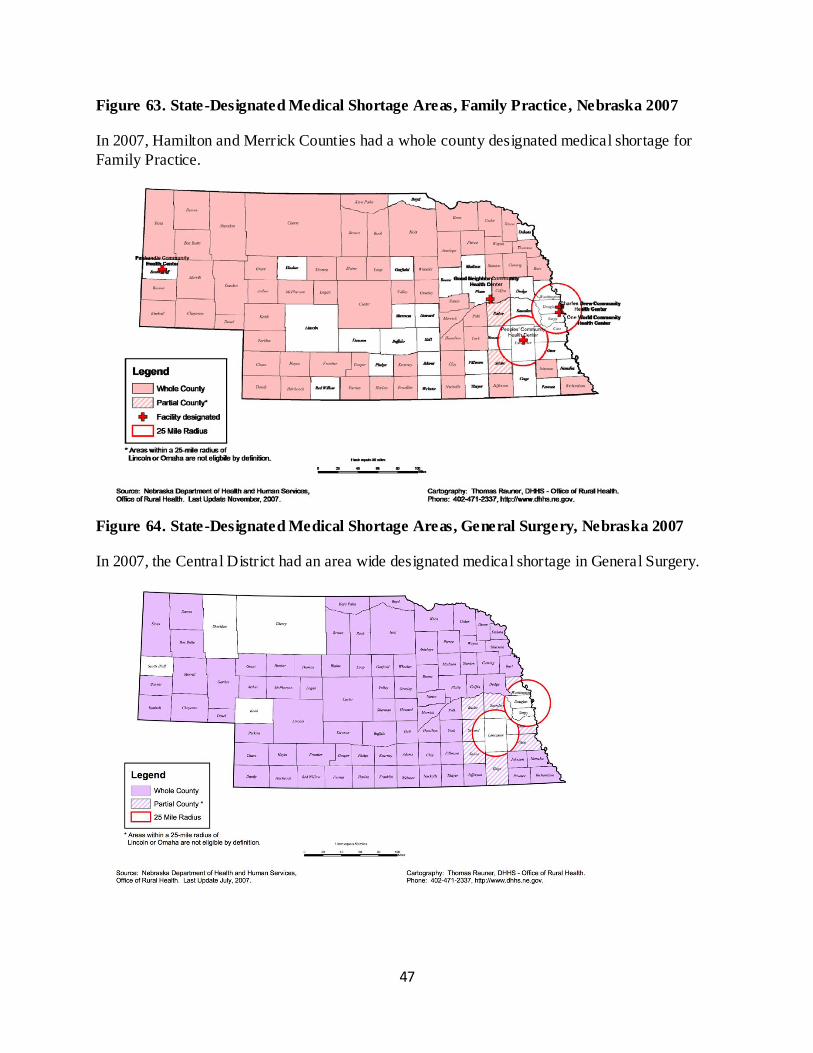
Figure 63. State-Designated Medical Shortage Areas, Family Practice, Nebraska 2007
In 2007, Hamilton and Merrick Counties had a whole county designated medical shortage for
Family Practice.
Figure 64. State-Designated Medical Shortage Areas, General Surgery, Nebraska 2007
In 2007, the Central District had an area wide designated medical shortage in General Surgery.
48
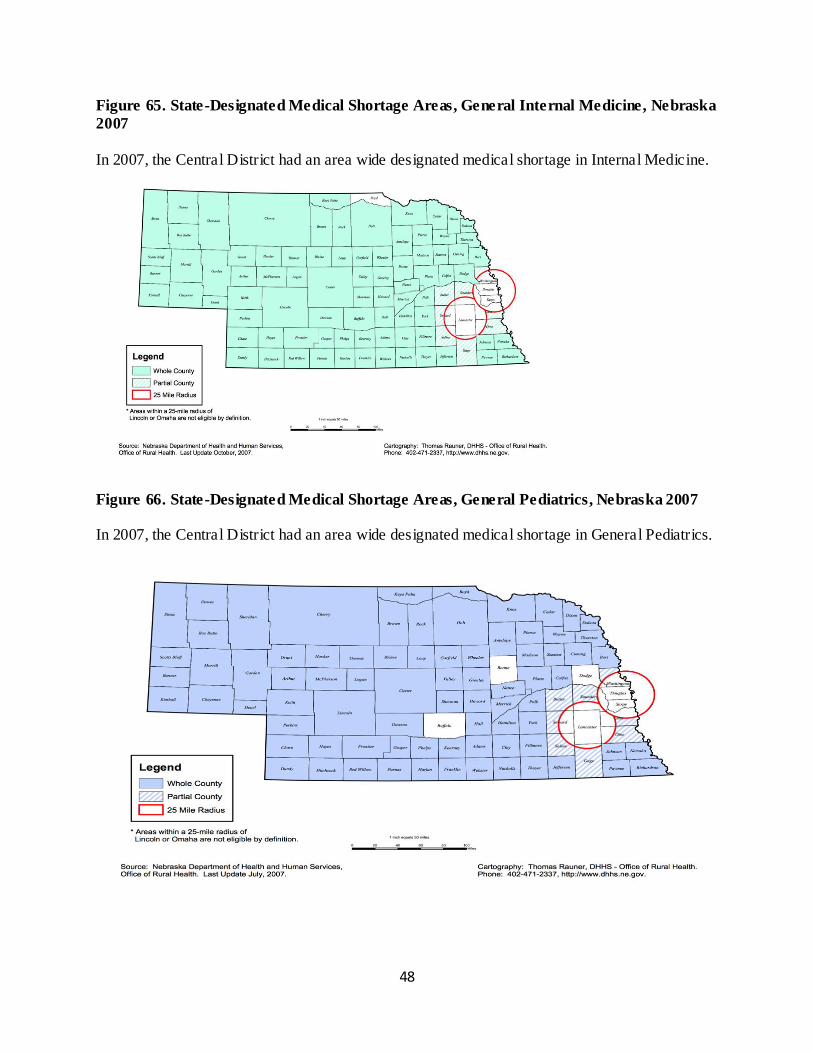
Figure 65. State-Designated Medical Shortage Areas, General Internal Medicine, Nebraska
2007
In 2007, the Central District had an area wide designated medical shortage in Internal Medicine.
Figure 66. State-Designated Medical Shortage Areas, General Pediatrics, Nebraska 2007
In 2007, the Central District had an area wide designated medical shortage in General Pediatrics.
49
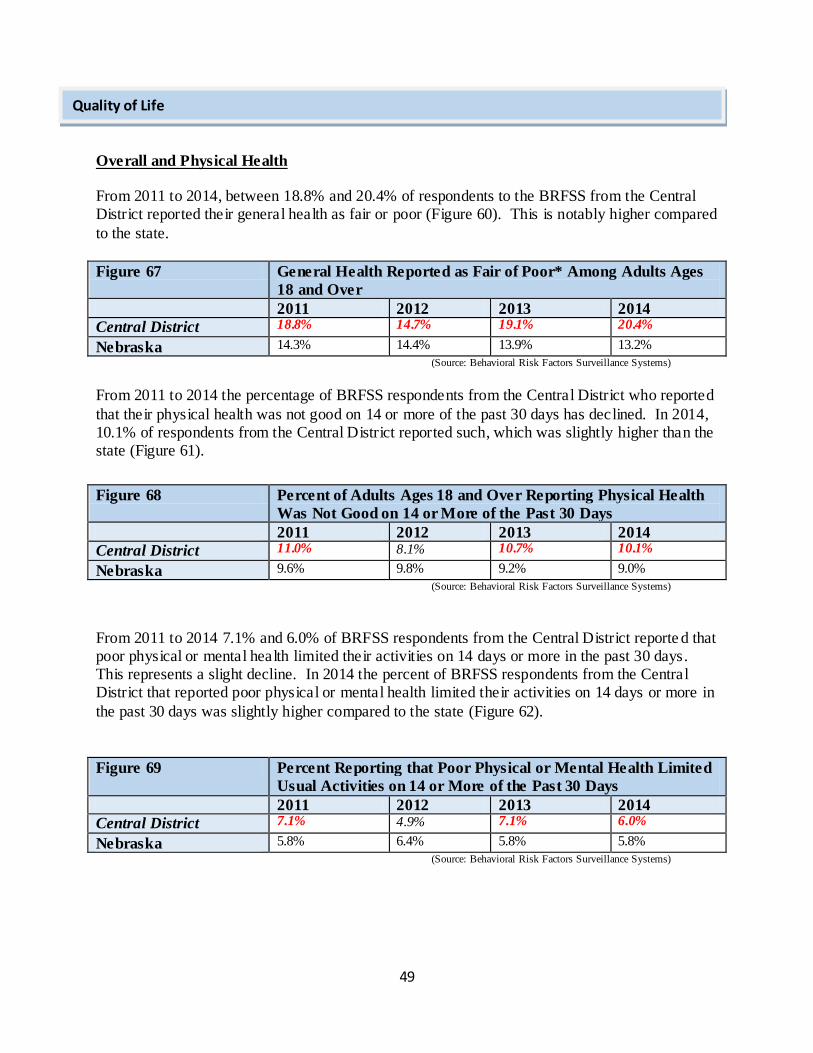
Overall and Physical Health
From 2011 to 2014, between 18.8% and 20.4% of respondents to the BRFSS from the Central District reported their general health as fair or poor (Figure 60). This is notably higher compared
to the state.
Figure 67 General Health Reported as Fair of Poor* Among Adults Ages
18 and Over
2011 2012 2013 2014
Central District 18.8% 14.7% 19.1% 20.4%
Nebraska 14.3% 14.4% 13.9% 13.2%
(Source: Behavioral Risk Factors Surveillance Systems)
From 2011 to 2014 the percentage of BRFSS respondents from the Central District who reported
that their physical health was not good on 14 or more of the past 30 days has declined. In 2014, 10.1% of respondents from the Central District reported such, which was slightly higher than the state (Figure 61).
Figure 68 Percent of Adults Ages 18 and Over Reporting Physical Health
Was Not Good on 14 or More of the Past 30 Days
2011 2012 2013 2014
Central District 11.0% 8.1% 10.7% 10.1%
Nebraska 9.6% 9.8% 9.2% 9.0%
(Source: Behavioral Risk Factors Surveillance Systems)
From 2011 to 2014 7.1% and 6.0% of BRFSS respondents from the Central District reporte d that poor physical or mental health limited their activities on 14 days or more in the past 30 days. This represents a slight decline. In 2014 the percent of BRFSS respondents from the Central District that reported poor physical or mental health limited their activities on 14 days or more in
the past 30 days was slightly higher compared to the state (Figure 62).
Figure 69 Percent Reporting that Poor Physical or Mental Health Limited
Usual Activities on 14 or More of the Past 30 Days
2011 2012 2013 2014
Central District 7.1% 4.9% 7.1% 6.0%
Nebraska 5.8% 6.4% 5.8% 5.8%
(Source: Behavioral Risk Factors Surveillance Systems)
Quality of Life
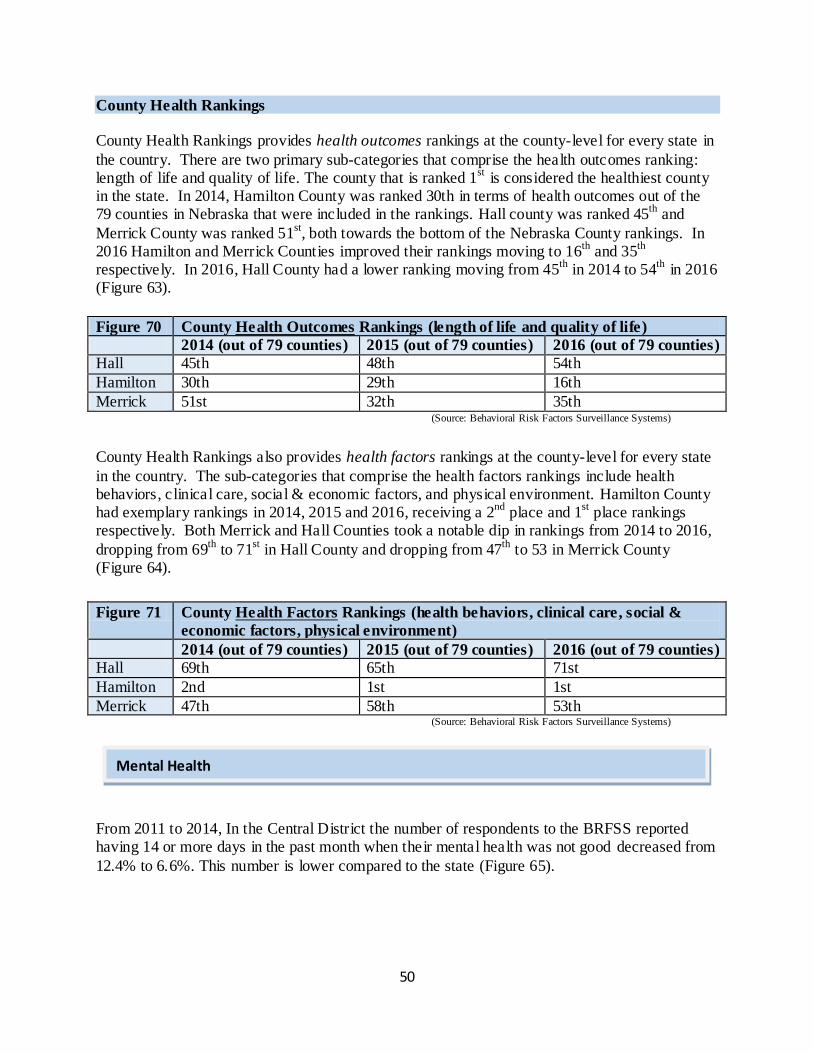
50
County Health Rankings
County Health Rankings provides health outcomes rankings at the county-level for every state in
the country. There are two primary sub-categories that comprise the health outcomes ranking: length of life and quality of life. The county that is ranked 1
st is considered the healthiest county
in the state. In 2014, Hamilton County was ranked 30th in terms of health outcomes out of the 79 counties in Nebraska that were included in the rankings. Hall county was ranked 45
th and
Merrick County was ranked 51st, both towards the bottom of the Nebraska County rankings. In
2016 Hamilton and Merrick Counties improved their rankings moving to 16th
and 35th
respectively. In 2016, Hall County had a lower ranking moving from 45
th in 2014 to 54
th in 2016
(Figure 63).
Figure 70 County Health Outcomes Rankings (length of life and quality of life)
2014 (out of 79 counties) 2015 (out of 79 counties) 2016 (out of 79 counties)
Hall 45th 48th 54th
Hamilton 30th 29th 16th
Merrick 51st 32th 35th (Source: Behavioral Risk Factors Surveillance Systems)
County Health Rankings also provides health factors rankings at the county-level for every state
in the country. The sub-categories that comprise the health factors rankings include health behaviors, clinical care, social & economic factors, and physical environment. Hamilton County had exemplary rankings in 2014, 2015 and 2016, receiving a 2
nd place and 1
st place rankings
respectively. Both Merrick and Hall Counties took a notable dip in rankings from 2014 to 2016,
dropping from 69th
to 71st in Hall County and dropping from 47
th to 53 in Merrick County
(Figure 64).
Figure 71 County Health Factors Rankings (health behaviors, clinical care, social &
economic factors, physical environment)
2014 (out of 79 counties) 2015 (out of 79 counties) 2016 (out of 79 counties)
Hall 69th 65th 71st
Hamilton 2nd 1st 1st
Merrick 47th 58th 53th (Source: Behavioral Risk Factors Surveillance Systems)
From 2011 to 2014, In the Central District the number of respondents to the BRFSS reported having 14 or more days in the past month when their mental health was not good decreased from
12.4% to 6.6%. This number is lower compared to the state (Figure 65).
Mental Health
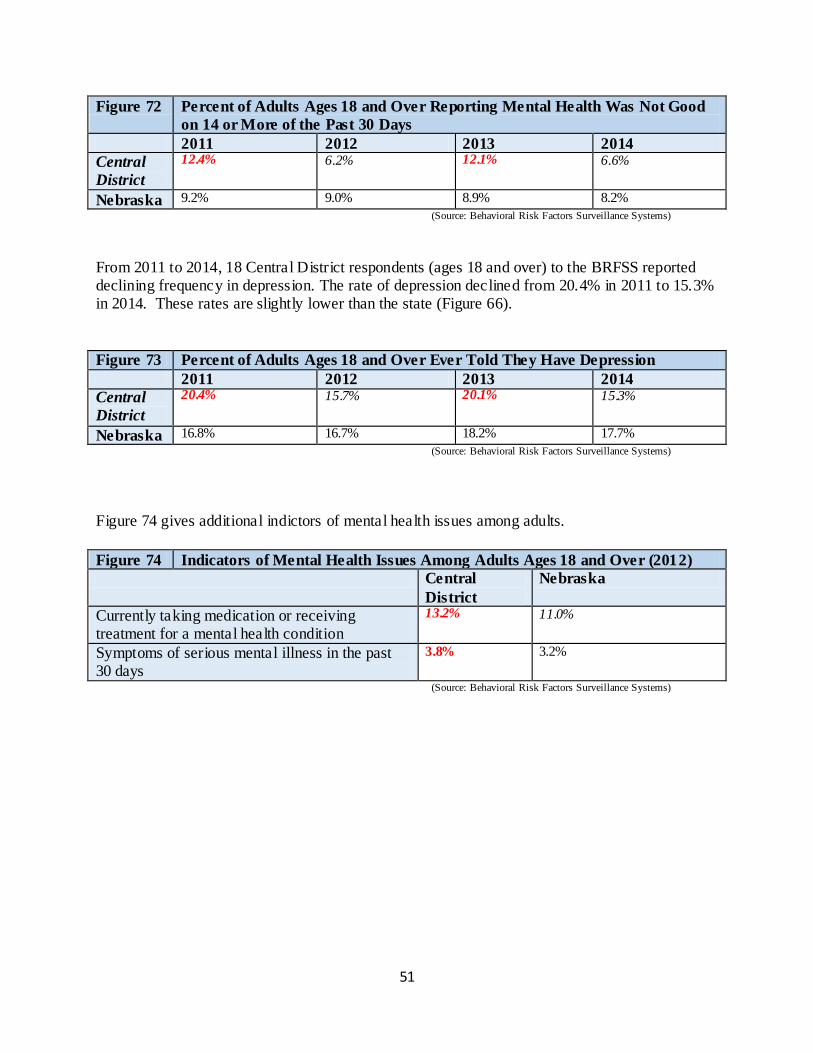
51
Figure 72 Percent of Adults Ages 18 and Over Reporting Mental Health Was Not Good
on 14 or More of the Past 30 Days
2011 2012 2013 2014
Central
District
12.4% 6.2% 12.1% 6.6%
Nebraska 9.2% 9.0% 8.9% 8.2%
(Source: Behavioral Risk Factors Surveillance Systems)
From 2011 to 2014, 18 Central District respondents (ages 18 and over) to the BRFSS reported declining frequency in depression. The rate of depression declined from 20.4% in 2011 to 15.3% in 2014. These rates are slightly lower than the state (Figure 66).
Figure 73 Percent of Adults Ages 18 and Over Ever Told They Have Depression
2011 2012 2013 2014
Central
District
20.4% 15.7% 20.1% 15.3%
Nebraska 16.8% 16.7% 18.2% 17.7%
(Source: Behavioral Risk Factors Surveillance Systems) Figure 74 gives additional indictors of mental health issues among adults.
Figure 74 Indicators of Mental Health Issues Among Adults Ages 18 and Over (2012)
Central
District
Nebraska
Currently taking medication or receiving treatment for a mental health condition
13.2% 11.0%
Symptoms of serious mental illness in the past 30 days
3.8% 3.2%
(Source: Behavioral Risk Factors Surveillance Systems)
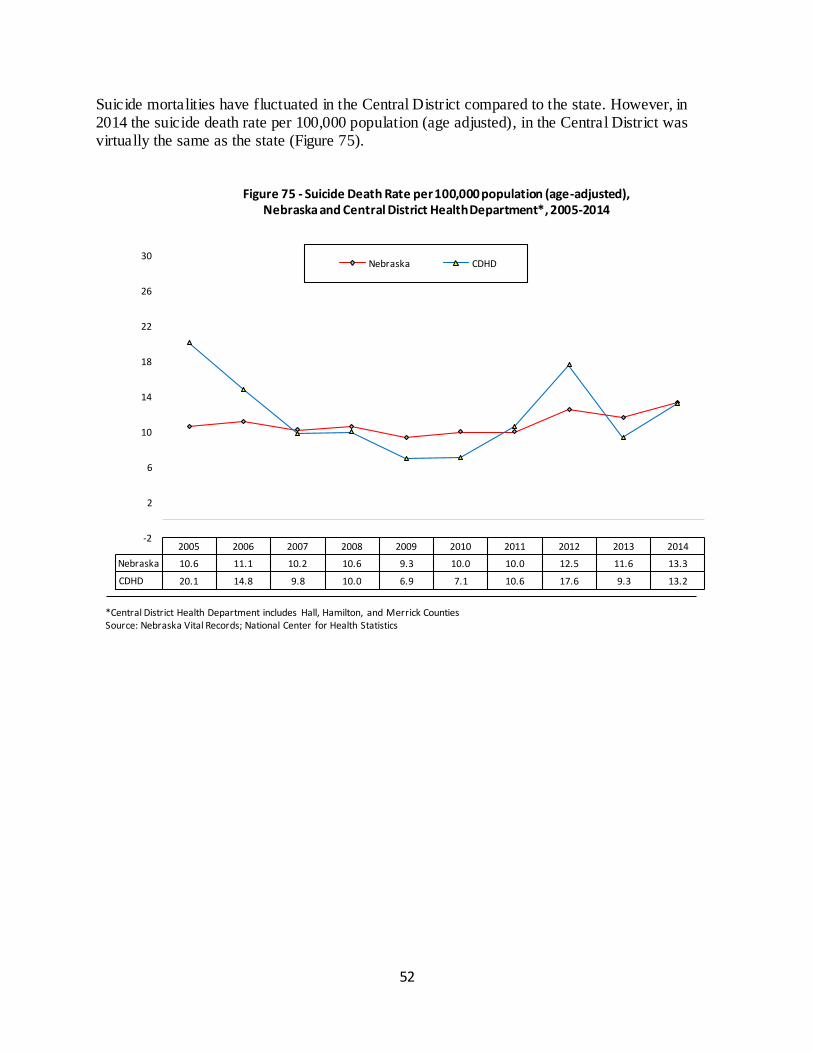
52
Suicide mortalities have fluctuated in the Central District compared to the state. However, in 2014 the suicide death rate per 100,000 population (age adjusted), in the Central District was virtually the same as the state (Figure 75).
2005 2006 2007 2008 2009 2010 2011 2012 2013 2014
Nebraska 10.6 11.1 10.2 10.6 9.3 10.0 10.0 12.5 11.6 13.3
CDHD 20.1 14.8 9.8 10.0 6.9 7.1 10.6 17.6 9.3 13.2
-2
2
6
10
14
18
22
26
30
Figure 75 - Suicide Death Rate per 100,000 population (age-adjusted), Nebraska and Central District Health Department*, 2005-2014
Nebraska CDHD
*Central District Health Department includes Hall, Hamilton, and Merrick Counties Source: Nebraska Vital Records; National Center for Health Statistics
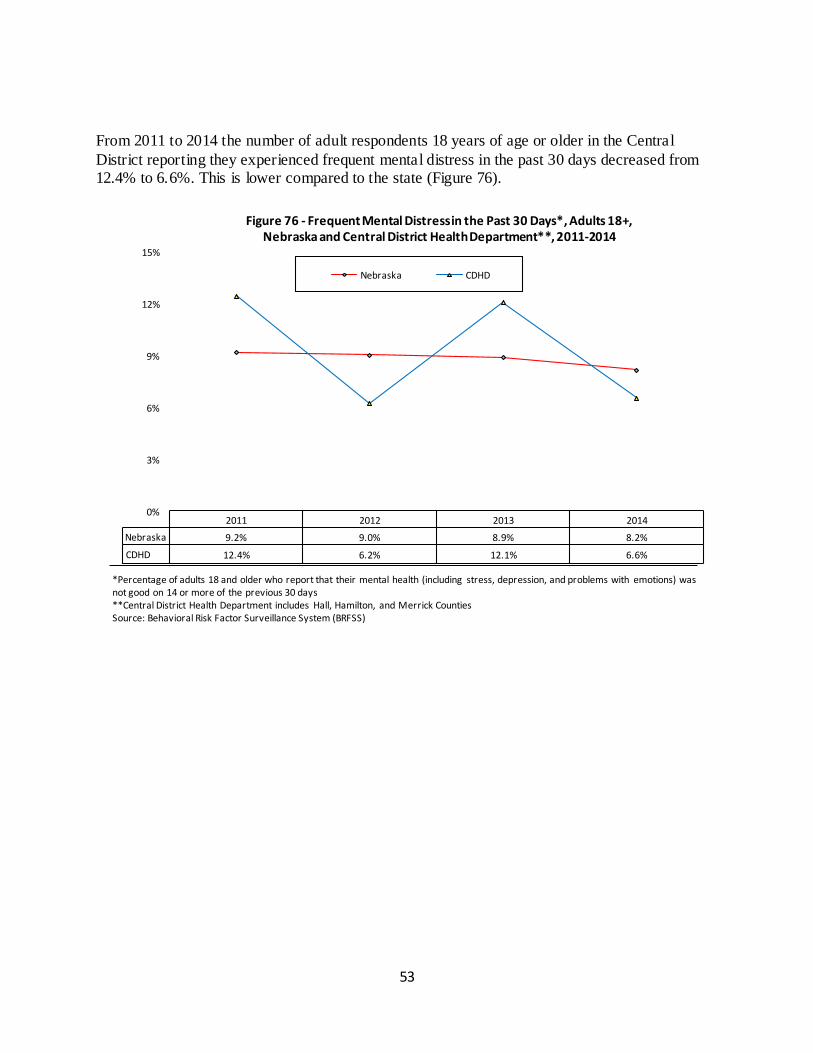
53
From 2011 to 2014 the number of adult respondents 18 years of age or older in the Central
District reporting they experienced frequent mental distress in the past 30 days decreased from 12.4% to 6.6%. This is lower compared to the state (Figure 76).
2011 2012 2013 2014
Nebraska 9.2% 9.0% 8.9% 8.2%
CDHD 12.4% 6.2% 12.1% 6.6%
0%
3%
6%
9%
12%
15%
Figure 76 - Frequent Mental Distress in the Past 30 Days*, Adults 18+, Nebraska and Central District Health Department**, 2011-2014
Nebraska CDHD
*Percentage of adults 18 and older who report that their mental health (including stress, depression, and problems with emotions) was not good on 14 or more of the previous 30 days **Central District Health Department includes Hall, Hamilton, and Merrick Counties Source: Behavioral Risk Factor Surveillance System (BRFSS)
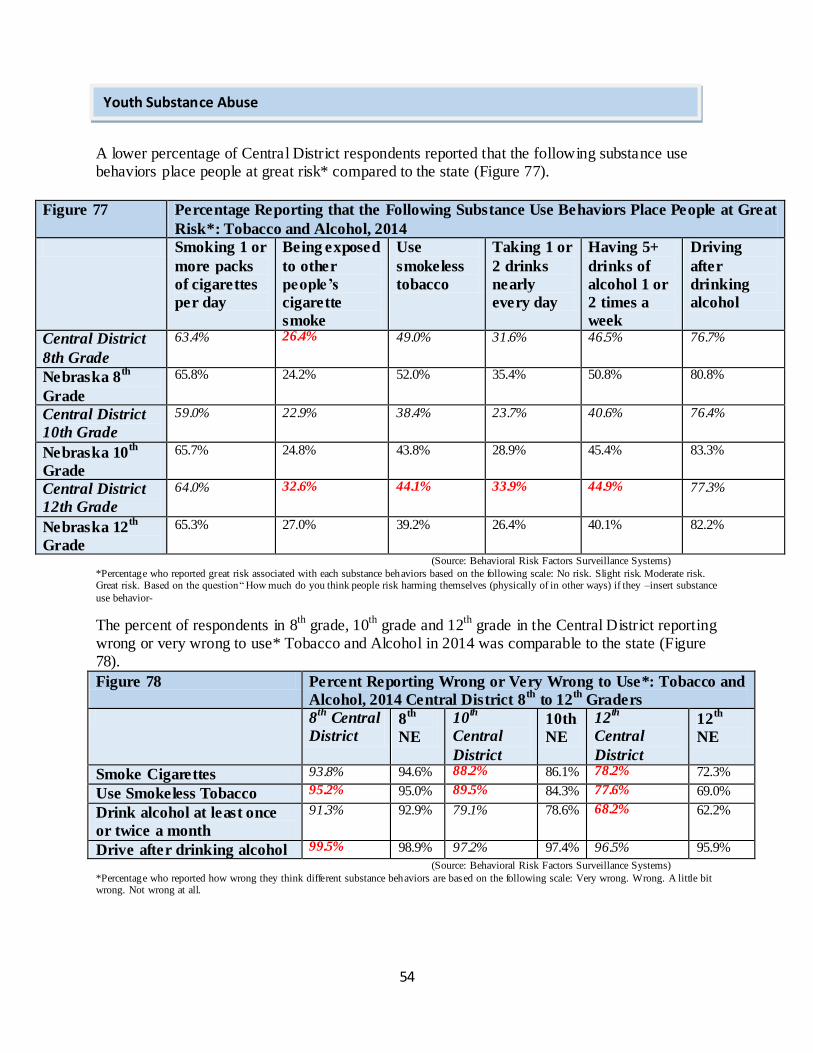
54
A lower percentage of Central District respondents reported that the following substance use behaviors place people at great risk* compared to the state (Figure 77).
Figure 77 Percentage Reporting that the Following Substance Use Behaviors Place People at Great
Risk*: Tobacco and Alcohol, 2014
Smoking 1 or
more packs
of cigarettes
per day
Being exposed
to other
people’s
cigarette
smoke
Use
smokeless
tobacco
Taking 1 or
2 drinks
nearly
every day
Having 5+
drinks of
alcohol 1 or
2 times a
week
Driving
after
drinking
alcohol
Central District
8th Grade
63.4% 26.4% 49.0% 31.6% 46.5% 76.7%
Nebraska 8th
Grade
65.8% 24.2% 52.0% 35.4% 50.8% 80.8%
Central District
10th Grade
59.0% 22.9% 38.4% 23.7% 40.6% 76.4%
Nebraska 10th
Grade
65.7% 24.8% 43.8% 28.9% 45.4% 83.3%
Central District
12th Grade
64.0% 32.6% 44.1% 33.9% 44.9% 77.3%
Nebraska 12th
Grade
65.3% 27.0% 39.2% 26.4% 40.1% 82.2%
(Source: Behavioral Risk Factors Surveillance Systems)
*Percentage who reported great risk associated with each substance behaviors based on the following scale: No risk. Slight risk. Moderate risk. Great risk. Based on the question “ How much do you think people risk harming themselves (physically of in other ways) if they –insert substance
use behavior-
The percent of respondents in 8th
grade, 10th
grade and 12th
grade in the Central District reporting wrong or very wrong to use* Tobacco and Alcohol in 2014 was comparable to the state (Figure 78).
Figure 78 Percent Reporting Wrong or Very Wrong to Use*: Tobacco and
Alcohol, 2014 Central District 8th
to 12th
Graders
8th
Central
District 8
th
NE
10th
Central
District
10th
NE
12th
Central
District
12th
NE
Smoke Cigarettes 93.8% 94.6% 88.2% 86.1% 78.2% 72.3%
Use Smokeless Tobacco 95.2% 95.0% 89.5% 84.3% 77.6% 69.0%
Drink alcohol at least once
or twice a month
91.3% 92.9% 79.1% 78.6% 68.2% 62.2%
Drive after drinking alcohol 99.5% 98.9% 97.2% 97.4% 96.5% 95.9%
(Source: Behavioral Risk Factors Surveillance Systems) *Percentage who reported how wrong they think different substance behaviors are based on the following scale: Very wrong. Wrong. A little bit wrong. Not wrong at all.
Youth Substance Abuse
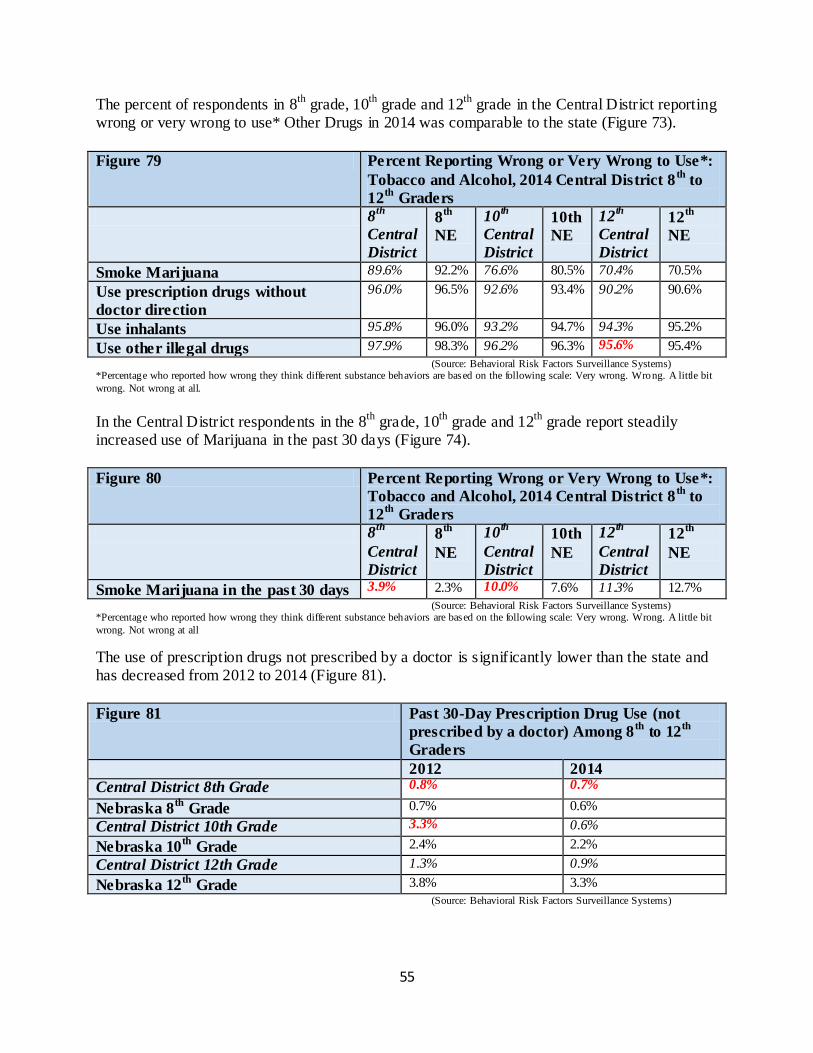
55
The percent of respondents in 8th
grade, 10th
grade and 12th
grade in the Central District reporting wrong or very wrong to use* Other Drugs in 2014 was comparable to the state (Figure 73).
Figure 79 Percent Reporting Wrong or Very Wrong to Use*:
Tobacco and Alcohol, 2014 Central District 8th
to
12th
Graders
8th
Central
District
8th
NE
10th
Central
District
10th
NE
12th
Central
District
12th
NE
Smoke Marijuana 89.6% 92.2% 76.6% 80.5% 70.4% 70.5%
Use prescription drugs without
doctor direction
96.0% 96.5% 92.6% 93.4% 90.2% 90.6%
Use inhalants 95.8% 96.0% 93.2% 94.7% 94.3% 95.2%
Use other illegal drugs 97.9% 98.3% 96.2% 96.3% 95.6% 95.4%
(Source: Behavioral Risk Factors Surveillance Systems) *Percentage who reported how wrong they think different substance behaviors are based on the following scale: Very wrong. Wrong. A little bit
wrong. Not wrong at all.
In the Central District respondents in the 8th
grade, 10th
grade and 12th
grade report steadily increased use of Marijuana in the past 30 days (Figure 74).
Figure 80 Percent Reporting Wrong or Very Wrong to Use*:
Tobacco and Alcohol, 2014 Central District 8th
to
12th
Graders
8th
Central
District
8th
NE
10th
Central
District
10th
NE
12th
Central
District
12th
NE
Smoke Marijuana in the past 30 days 3.9% 2.3% 10.0% 7.6% 11.3% 12.7%
(Source: Behavioral Risk Factors Surveillance Systems) *Percentage who reported how wrong they think different substance behaviors are based on the following scale: Very wrong. Wrong. A little bit
wrong. Not wrong at all
The use of prescription drugs not prescribed by a doctor is significantly lower than the state and has decreased from 2012 to 2014 (Figure 81).
Figure 81 Past 30-Day Prescription Drug Use (not
prescribed by a doctor) Among 8th
to 12th
Graders
2012 2014
Central District 8th Grade 0.8% 0.7%
Nebraska 8th
Grade 0.7% 0.6%
Central District 10th Grade 3.3% 0.6%
Nebraska 10th
Grade 2.4% 2.2%
Central District 12th Grade 1.3% 0.9%
Nebraska 12th
Grade 3.8% 3.3%
(Source: Behavioral Risk Factors Surveillance Systems)
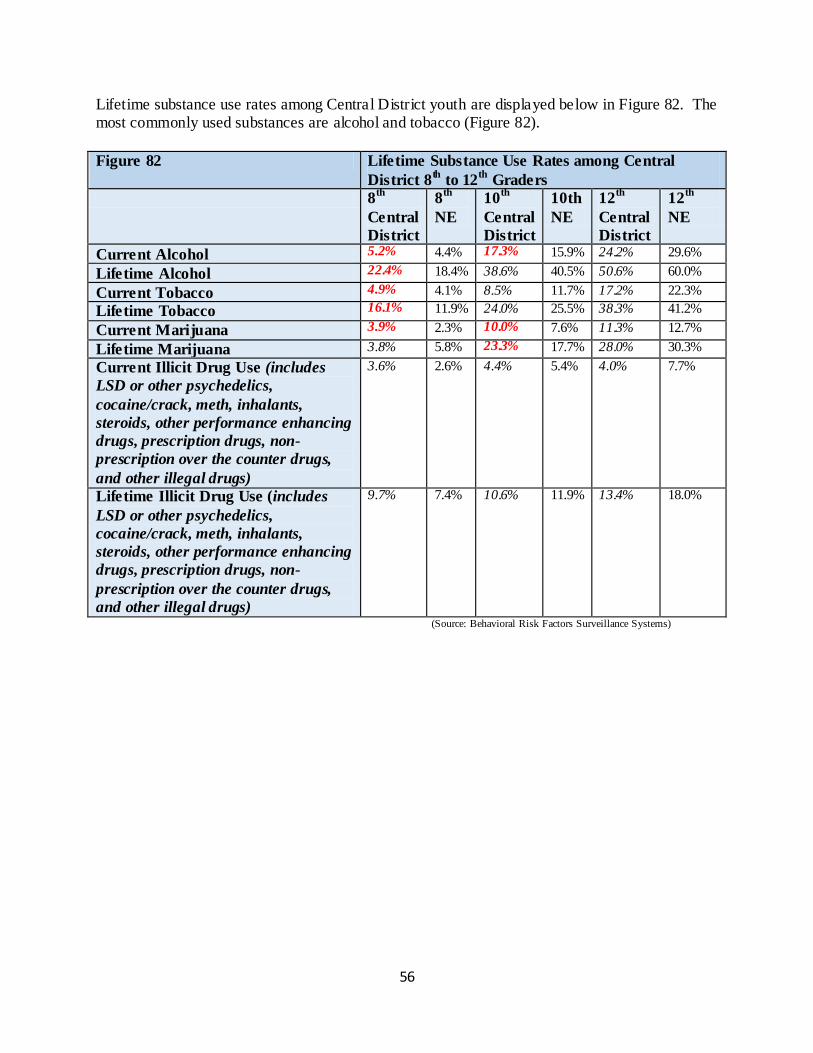
56
Lifetime substance use rates among Central District youth are displayed below in Figure 82. The most commonly used substances are alcohol and tobacco (Figure 82).
Figure 82 Lifetime Substance Use Rates among Central
District 8th
to 12th
Graders
8th
Central
District
8th
NE
10th
Central
District
10th
NE
12th
Central
District
12th
NE
Current Alcohol 5.2% 4.4% 17.3% 15.9% 24.2% 29.6%
Lifetime Alcohol 22.4% 18.4% 38.6% 40.5% 50.6% 60.0%
Current Tobacco 4.9% 4.1% 8.5% 11.7% 17.2% 22.3%
Lifetime Tobacco 16.1% 11.9% 24.0% 25.5% 38.3% 41.2%
Current Marijuana 3.9% 2.3% 10.0% 7.6% 11.3% 12.7%
Lifetime Marijuana 3.8% 5.8% 23.3% 17.7% 28.0% 30.3%
Current Illicit Drug Use (includes
LSD or other psychedelics,
cocaine/crack, meth, inhalants,
steroids, other performance enhancing
drugs, prescription drugs, non-
prescription over the counter drugs,
and other illegal drugs)
3.6% 2.6% 4.4% 5.4% 4.0% 7.7%
Lifetime Illicit Drug Use (includes
LSD or other psychedelics,
cocaine/crack, meth, inhalants,
steroids, other performance enhancing
drugs, prescription drugs, non-
prescription over the counter drugs,
and other illegal drugs)
9.7% 7.4% 10.6% 11.9% 13.4% 18.0%
(Source: Behavioral Risk Factors Surveillance Systems)
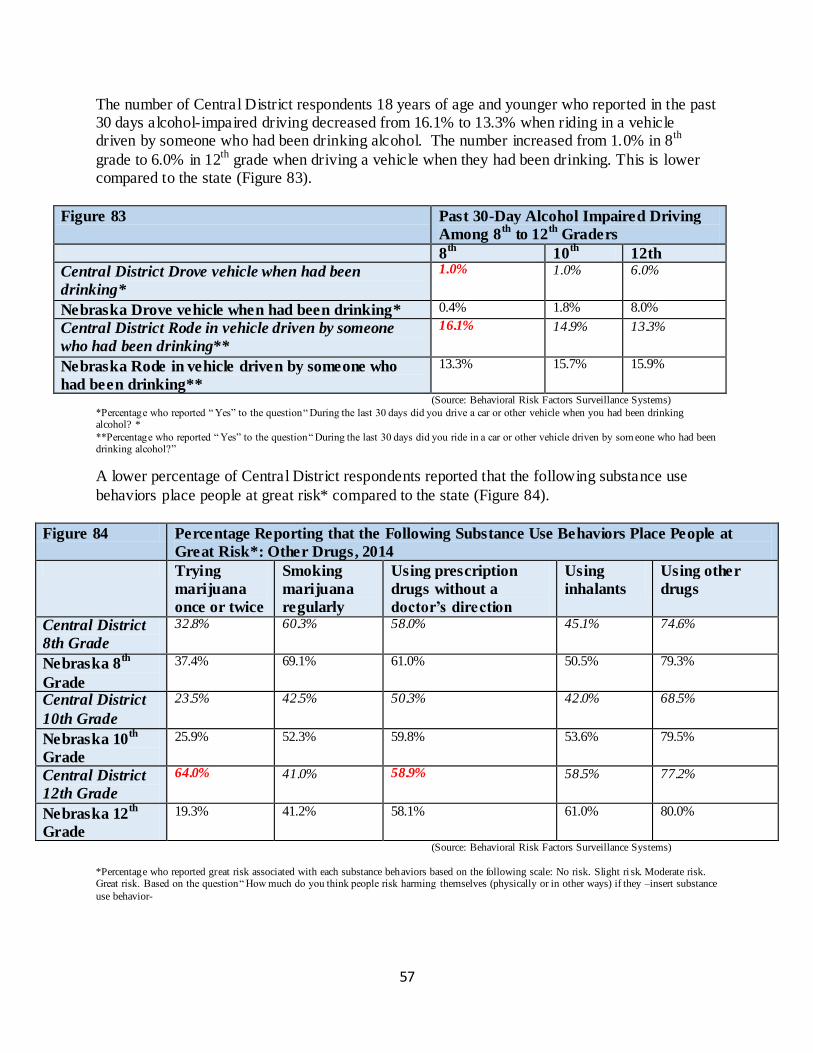
57
The number of Central District respondents 18 years of age and younger who reported in the past 30 days alcohol-impaired driving decreased from 16.1% to 13.3% when riding in a vehicle driven by someone who had been drinking alcohol. The number increased from 1.0% in 8
th
grade to 6.0% in 12th
grade when driving a vehicle when they had been drinking. This is lower compared to the state (Figure 83).
Figure 83 Past 30-Day Alcohol Impaired Driving
Among 8th
to 12th
Graders
8th
10th
12th
Central District Drove vehicle when had been
drinking*
1.0% 1.0% 6.0%
Nebraska Drove vehicle when had been drinking* 0.4% 1.8% 8.0%
Central District Rode in vehicle driven by someone
who had been drinking**
16.1% 14.9% 13.3%
Nebraska Rode in vehicle driven by someone who
had been drinking**
13.3% 15.7% 15.9%
(Source: Behavioral Risk Factors Surveillance Systems) *Percentage who reported “ Yes” to the question “ During the last 30 days did you drive a car or other vehicle when you had been drinking alcohol? *
**Percentage who reported “ Yes” to the question “ During the last 30 days did you ride in a car or other vehicle driven by som eone who had been drinking alcohol?”
A lower percentage of Central District respondents reported that the following substance use
behaviors place people at great risk* compared to the state (Figure 84).
Figure 84 Percentage Reporting that the Following Substance Use Behaviors Place People at
Great Risk*: Other Drugs, 2014
Trying
marijuana
once or twice
Smoking
marijuana
regularly
Using prescription
drugs without a
doctor’s direction
Using
inhalants
Using other
drugs
Central District
8th Grade
32.8% 60.3% 58.0% 45.1% 74.6%
Nebraska 8th
Grade
37.4% 69.1% 61.0% 50.5% 79.3%
Central District
10th Grade
23.5% 42.5% 50.3% 42.0% 68.5%
Nebraska 10th
Grade
25.9% 52.3% 59.8% 53.6% 79.5%
Central District
12th Grade
64.0% 41.0% 58.9% 58.5% 77.2%
Nebraska 12th
Grade
19.3% 41.2% 58.1% 61.0% 80.0%
(Source: Behavioral Risk Factors Surveillance Systems)
*Percentage who reported great risk associated with each substance behaviors based on the following scale: No risk. Slight ri sk. Moderate risk. Great risk. Based on the question “ How much do you think people risk harming themselves (physically or in other ways) if they –insert substance
use behavior-
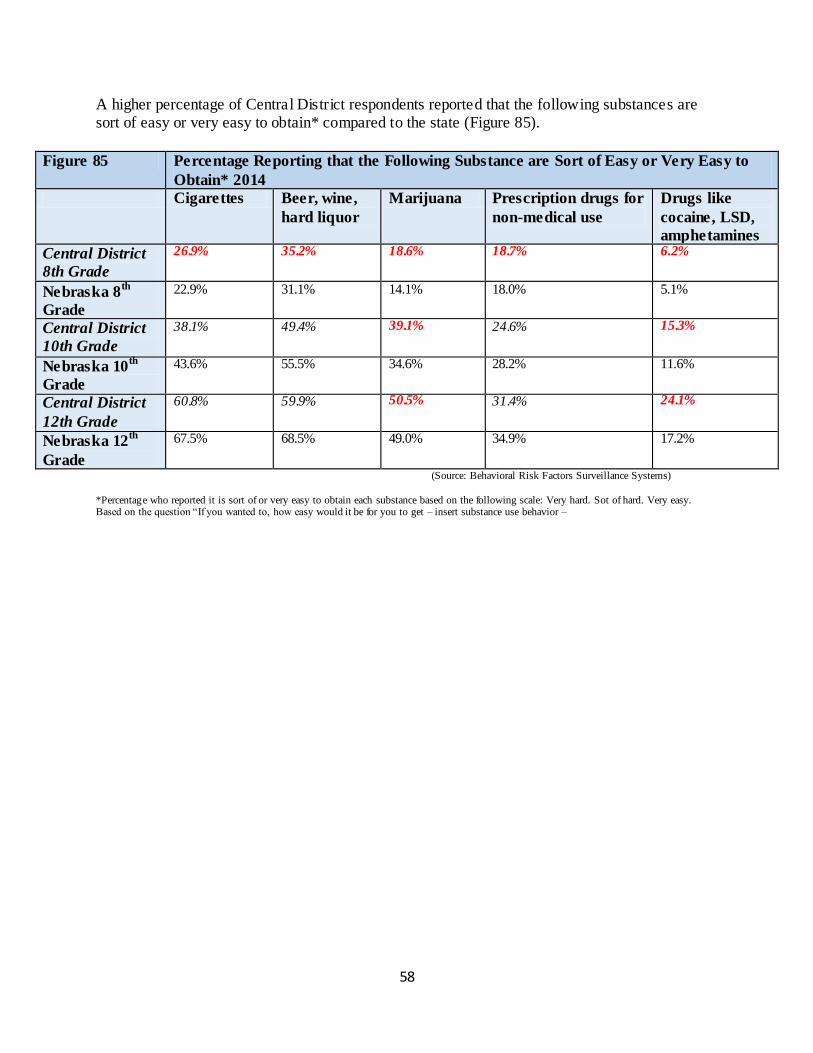
58
A higher percentage of Central District respondents reported that the following substances are sort of easy or very easy to obtain* compared to the state (Figure 85).
Figure 85 Percentage Reporting that the Following Substance are Sort of Easy or Very Easy to
Obtain* 2014
Cigarettes Beer, wine,
hard liquor
Marijuana Prescription drugs for
non-medical use
Drugs like
cocaine, LSD,
amphetamines
Central District
8th Grade
26.9% 35.2% 18.6% 18.7% 6.2%
Nebraska 8th
Grade
22.9% 31.1% 14.1% 18.0% 5.1%
Central District
10th Grade
38.1% 49.4% 39.1% 24.6% 15.3%
Nebraska 10th
Grade
43.6% 55.5% 34.6% 28.2% 11.6%
Central District
12th Grade
60.8% 59.9% 50.5% 31.4% 24.1%
Nebraska 12th
Grade
67.5% 68.5% 49.0% 34.9% 17.2%
(Source: Behavioral Risk Factors Surveillance Systems)
*Percentage who reported it is sort of or very easy to obtain each substance based on the following scale: Very hard. Sot of hard. Very easy. Based on the question “If you wanted to, how easy would it be for you to get – insert substance use behavior –
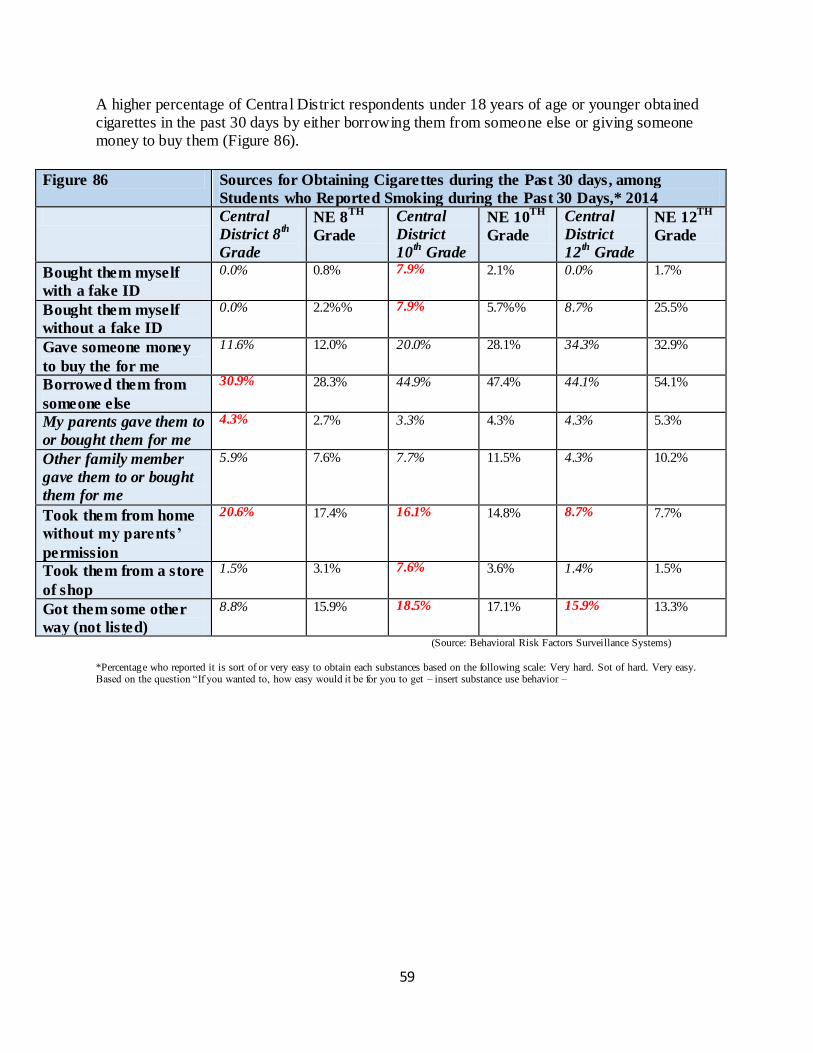
59
A higher percentage of Central District respondents under 18 years of age or younger obtained cigarettes in the past 30 days by either borrowing them from someone else or giving someone money to buy them (Figure 86).
Figure 86 Sources for Obtaining Cigarettes during the Past 30 days, among
Students who Reported Smoking during the Past 30 Days,* 2014
Central
District 8th
Grade
NE 8TH
Grade
Central
District
10th
Grade
NE 10TH
Grade
Central
District
12th
Grade
NE 12TH
Grade
Bought them myself
with a fake ID
0.0% 0.8% 7.9% 2.1% 0.0% 1.7%
Bought them myself
without a fake ID
0.0% 2.2%% 7.9% 5.7%% 8.7% 25.5%
Gave someone money
to buy the for me
11.6% 12.0% 20.0% 28.1% 34.3% 32.9%
Borrowed them from
someone else
30.9% 28.3% 44.9% 47.4% 44.1% 54.1%
My parents gave them to
or bought them for me
4.3% 2.7% 3.3% 4.3% 4.3% 5.3%
Other family member
gave them to or bought
them for me
5.9% 7.6% 7.7% 11.5% 4.3% 10.2%
Took them from home
without my parents’
permission
20.6% 17.4% 16.1% 14.8% 8.7% 7.7%
Took them from a store
of shop
1.5% 3.1% 7.6% 3.6% 1.4% 1.5%
Got them some other
way (not listed)
8.8% 15.9% 18.5% 17.1% 15.9% 13.3%
(Source: Behavioral Risk Factors Surveillance Systems)
*Percentage who reported it is sort of or very easy to obtain each substances based on the following scale: Very hard. Sot of hard. Very easy. Based on the question “If you wanted to, how easy would it be for you to get – insert substance use behavior –
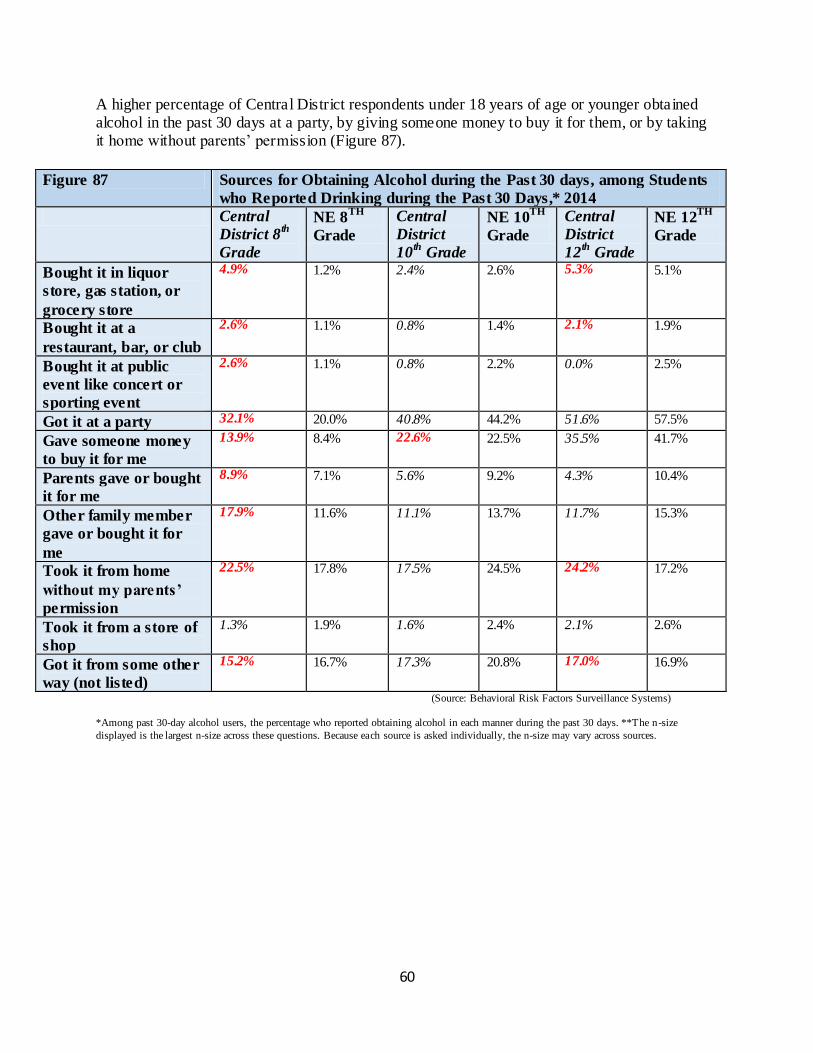
60
A higher percentage of Central District respondents under 18 years of age or younger obtained alcohol in the past 30 days at a party, by giving someone money to buy it for them, or by taking it home without parents’ permission (Figure 87).
Figure 87 Sources for Obtaining Alcohol during the Past 30 days, among Students
who Reported Drinking during the Past 30 Days,* 2014
Central
District 8th
Grade
NE 8TH
Grade
Central
District
10th
Grade
NE 10TH
Grade
Central
District
12th
Grade
NE 12TH
Grade
Bought it in liquor
store, gas station, or
grocery store
4.9% 1.2% 2.4% 2.6% 5.3% 5.1%
Bought it at a
restaurant, bar, or club
2.6% 1.1% 0.8% 1.4% 2.1% 1.9%
Bought it at public
event like concert or
sporting event
2.6% 1.1% 0.8% 2.2% 0.0% 2.5%
Got it at a party 32.1% 20.0% 40.8% 44.2% 51.6% 57.5%
Gave someone money
to buy it for me
13.9% 8.4% 22.6% 22.5% 35.5% 41.7%
Parents gave or bought
it for me
8.9% 7.1% 5.6% 9.2% 4.3% 10.4%
Other family member
gave or bought it for
me
17.9% 11.6% 11.1% 13.7% 11.7% 15.3%
Took it from home
without my parents’
permission
22.5% 17.8% 17.5% 24.5% 24.2% 17.2%
Took it from a store of
shop
1.3% 1.9% 1.6% 2.4% 2.1% 2.6%
Got it from some other
way (not listed)
15.2% 16.7% 17.3% 20.8% 17.0% 16.9%
(Source: Behavioral Risk Factors Surveillance Systems)
*Among past 30-day alcohol users, the percentage who reported obtaining alcohol in each manner during the past 30 days. **The n-size
displayed is the largest n-size across these questions. Because each source is asked individually, the n-size may vary across sources.
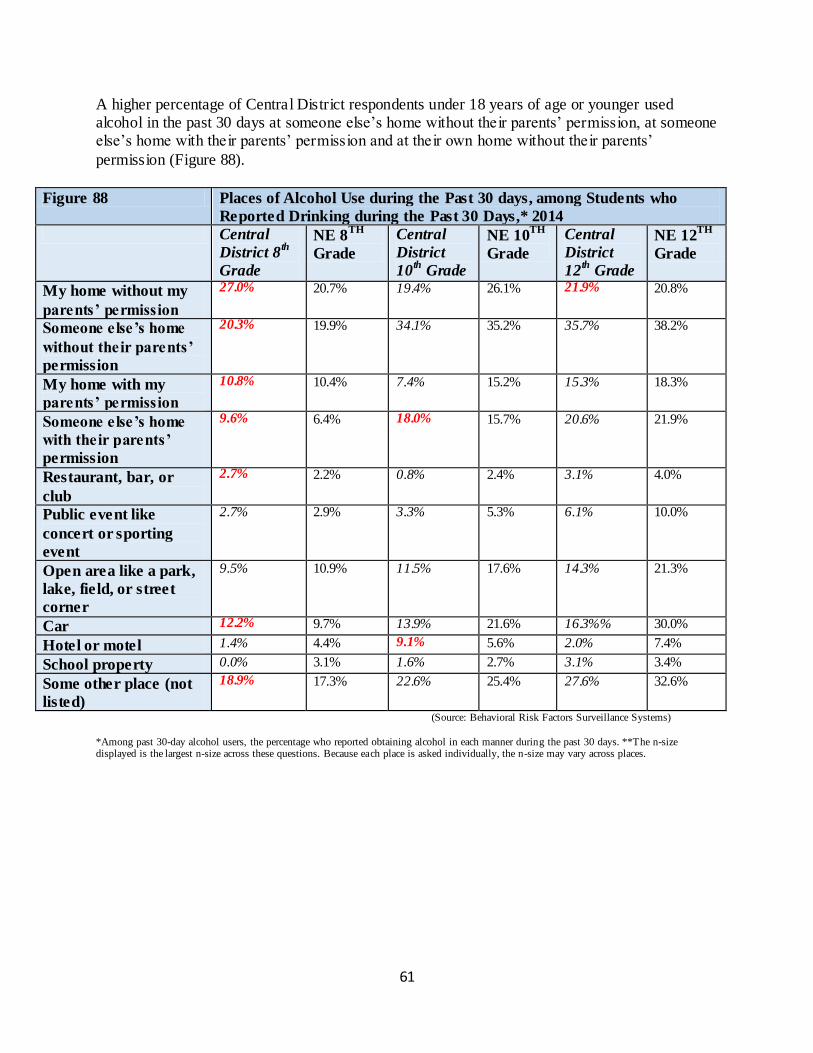
61
A higher percentage of Central District respondents under 18 years of age or younger used alcohol in the past 30 days at someone else’s home without their parents’ permission, at someone else’s home with their parents’ permission and at their own home without their parents’
permission (Figure 88).
Figure 88 Places of Alcohol Use during the Past 30 days, among Students who
Reported Drinking during the Past 30 Days,* 2014
Central
District 8th
Grade
NE 8TH
Grade
Central
District
10th
Grade
NE 10TH
Grade
Central
District
12th
Grade
NE 12TH
Grade
My home without my
parents’ permission
27.0% 20.7% 19.4% 26.1% 21.9% 20.8%
Someone else’s home
without their parents’
permission
20.3% 19.9% 34.1% 35.2% 35.7% 38.2%
My home with my
parents’ permission
10.8% 10.4% 7.4% 15.2% 15.3% 18.3%
Someone else’s home
with their parents’
permission
9.6% 6.4% 18.0% 15.7% 20.6% 21.9%
Restaurant, bar, or
club
2.7% 2.2% 0.8% 2.4% 3.1% 4.0%
Public event like
concert or sporting
event
2.7% 2.9% 3.3% 5.3% 6.1% 10.0%
Open area like a park,
lake, field, or street
corner
9.5% 10.9% 11.5% 17.6% 14.3% 21.3%
Car 12.2% 9.7% 13.9% 21.6% 16.3%% 30.0%
Hotel or motel 1.4% 4.4% 9.1% 5.6% 2.0% 7.4%
School property 0.0% 3.1% 1.6% 2.7% 3.1% 3.4%
Some other place (not
listed)
18.9% 17.3% 22.6% 25.4% 27.6% 32.6%
(Source: Behavioral Risk Factors Surveillance Systems)
*Among past 30-day alcohol users, the percentage who reported obtaining alcohol in each manner during the past 30 days. **The n-size displayed is the largest n-size across these questions. Because each place is asked individually, the n-size may vary across places.
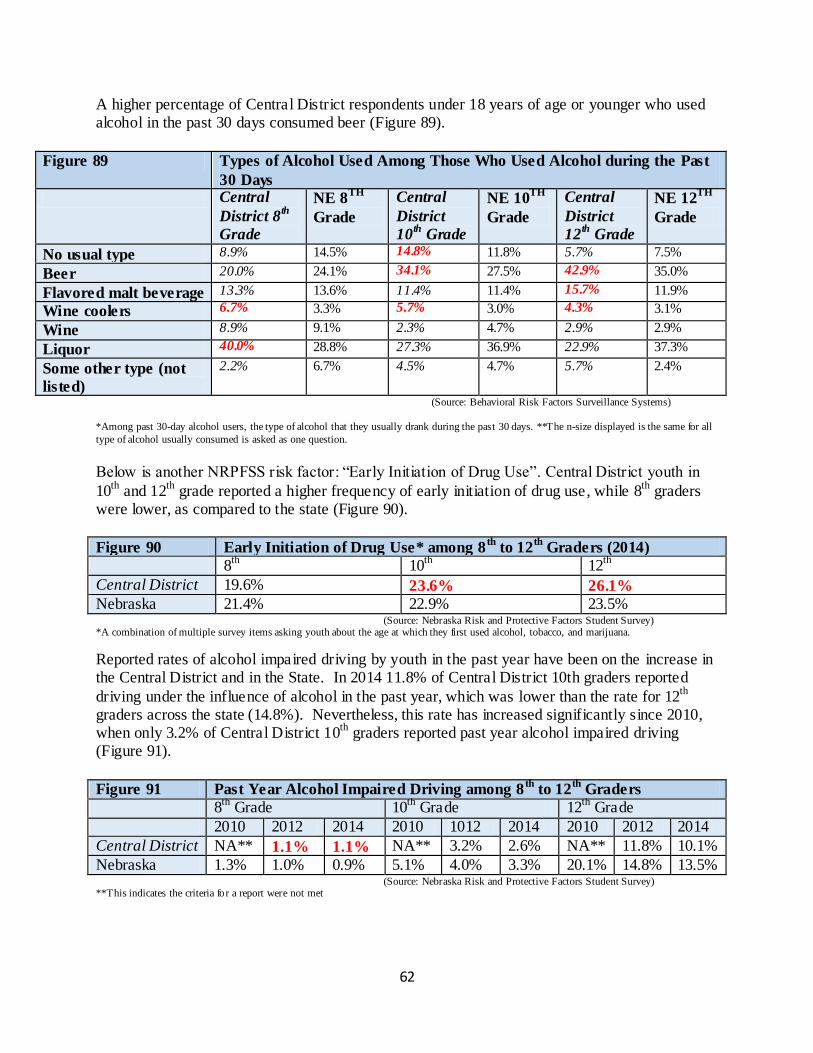
62
A higher percentage of Central District respondents under 18 years of age or younger who used alcohol in the past 30 days consumed beer (Figure 89).
Figure 89 Types of Alcohol Used Among Those Who Used Alcohol during the Past
30 Days
Central
District 8th
Grade
NE 8TH
Grade
Central
District
10th
Grade
NE 10TH
Grade
Central
District
12th
Grade
NE 12TH
Grade
No usual type 8.9% 14.5% 14.8% 11.8% 5.7% 7.5%
Beer 20.0% 24.1% 34.1% 27.5% 42.9% 35.0%
Flavored malt beverage 13.3% 13.6% 11.4% 11.4% 15.7% 11.9%
Wine coolers 6.7% 3.3% 5.7% 3.0% 4.3% 3.1%
Wine 8.9% 9.1% 2.3% 4.7% 2.9% 2.9%
Liquor 40.0% 28.8% 27.3% 36.9% 22.9% 37.3%
Some other type (not
listed)
2.2% 6.7% 4.5% 4.7% 5.7% 2.4%
(Source: Behavioral Risk Factors Surveillance Systems)
*Among past 30-day alcohol users, the type of alcohol that they usually drank during the past 30 days. **The n-size displayed is the same for all
type of alcohol usually consumed is asked as one question.
Below is another NRPFSS risk factor: “Early Initiation of Drug Use”. Central District youth in
10th
and 12th
grade reported a higher frequency of early initiation of drug use, while 8th
graders were lower, as compared to the state (Figure 90).
Figure 90 Early Initiation of Drug Use* among 8th
to 12th
Graders (2014)
8th
10th
12th
Central District 19.6% 23.6% 26.1%
Nebraska 21.4% 22.9% 23.5% (Source: Nebraska Risk and Protective Factors Student Survey) *A combination of multiple survey items asking youth about the age at which they first used alcohol, tobacco, and marijuana.
Reported rates of alcohol impaired driving by youth in the past year have been on the increase in the Central District and in the State. In 2014 11.8% of Central District 10th graders reported
driving under the influence of alcohol in the past year, which was lower than the rate for 12th
graders across the state (14.8%). Nevertheless, this rate has increased significantly since 2010, when only 3.2% of Central District 10
th graders reported past year alcohol impaired driving
(Figure 91).
Figure 91 Past Year Alcohol Impaired Driving among 8th
to 12th
Graders
8th
Grade 10th
Grade 12th
Grade
2010 2012 2014 2010 1012 2014 2010 2012 2014
Central District NA** 1.1% 1.1% NA** 3.2% 2.6% NA** 11.8% 10.1%
Nebraska 1.3% 1.0% 0.9% 5.1% 4.0% 3.3% 20.1% 14.8% 13.5% (Source: Nebraska Risk and Protective Factors Student Survey) **This indicates the criteria for a report were not met
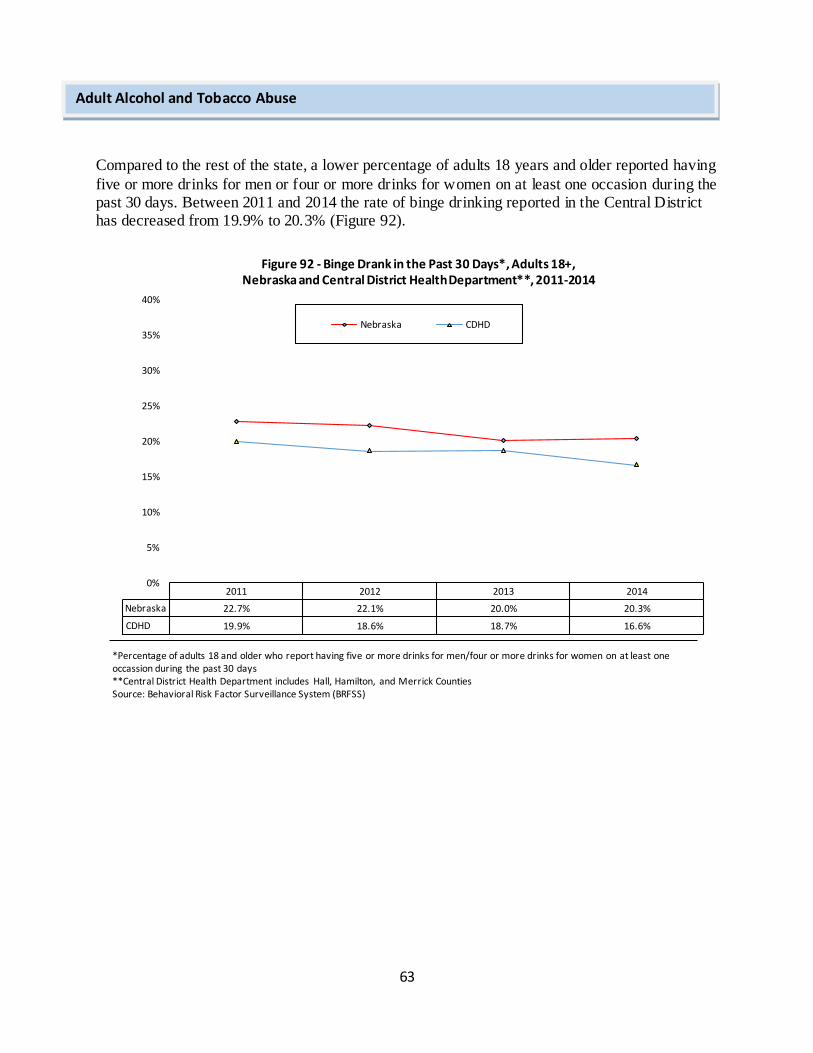
63
Compared to the rest of the state, a lower percentage of adults 18 years and older reported having
five or more drinks for men or four or more drinks for women on at least one occasion during the past 30 days. Between 2011 and 2014 the rate of binge drinking reported in the Central District has decreased from 19.9% to 20.3% (Figure 92).
2011 2012 2013 2014
Nebraska 22.7% 22.1% 20.0% 20.3%
CDHD 19.9% 18.6% 18.7% 16.6%
0%
5%
10%
15%
20%
25%
30%
35%
40%
Figure 92 - Binge Drank in the Past 30 Days*, Adults 18+, Nebraska and Central District Health Department**, 2011-2014
Nebraska CDHD
*Percentage of adults 18 and older who report having five or more drinks for men/four or more drinks for women on at least one occassion during the past 30 days **Central District Health Department includes Hall, Hamilton, and Merrick Counties Source: Behavioral Risk Factor Surveillance System (BRFSS)
Adult Alcohol and Tobacco Abuse
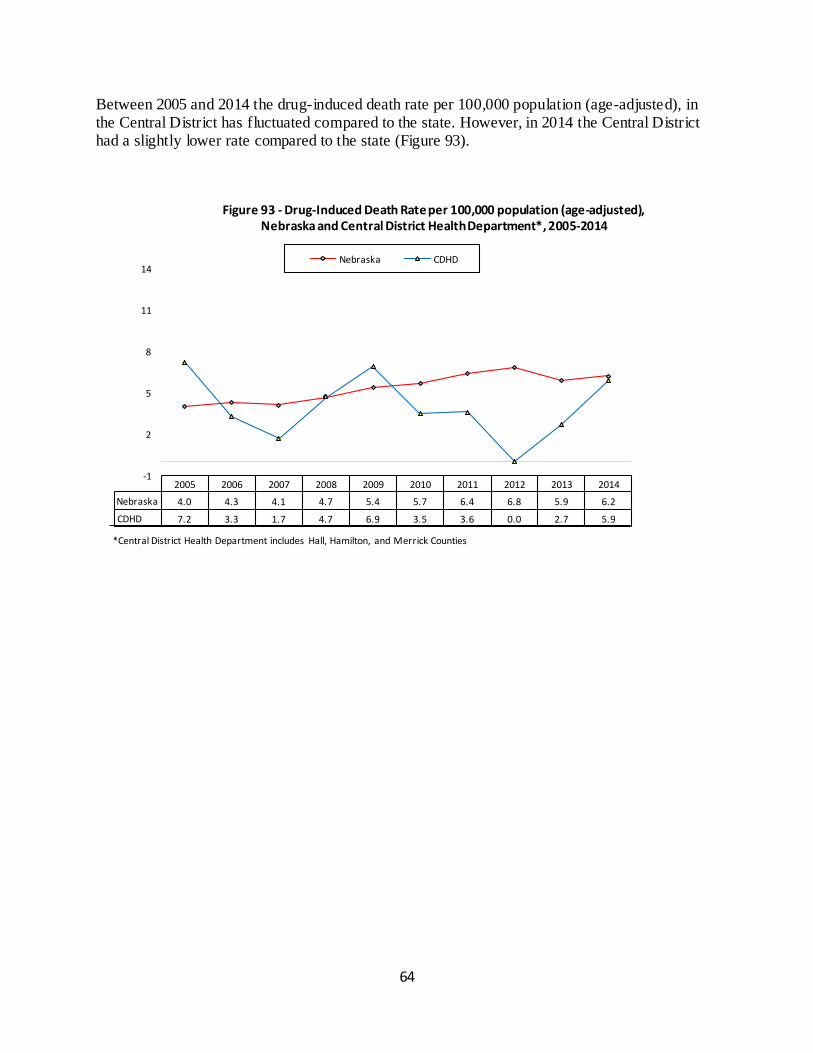
64
Between 2005 and 2014 the drug-induced death rate per 100,000 population (age-adjusted), in the Central District has fluctuated compared to the state. However, in 2014 the Central District had a slightly lower rate compared to the state (Figure 93).
2005 2006 2007 2008 2009 2010 2011 2012 2013 2014
Nebraska 4.0 4.3 4.1 4.7 5.4 5.7 6.4 6.8 5.9 6.2
CDHD 7.2 3.3 1.7 4.7 6.9 3.5 3.6 0.0 2.7 5.9
-1
2
5
8
11
14
Figure 93 - Drug-Induced Death Rate per 100,000 population (age-adjusted), Nebraska and Central District Health Department*, 2005-2014
Nebraska CDHD
*Central District Health Department includes Hall, Hamilton, and Merrick Counties
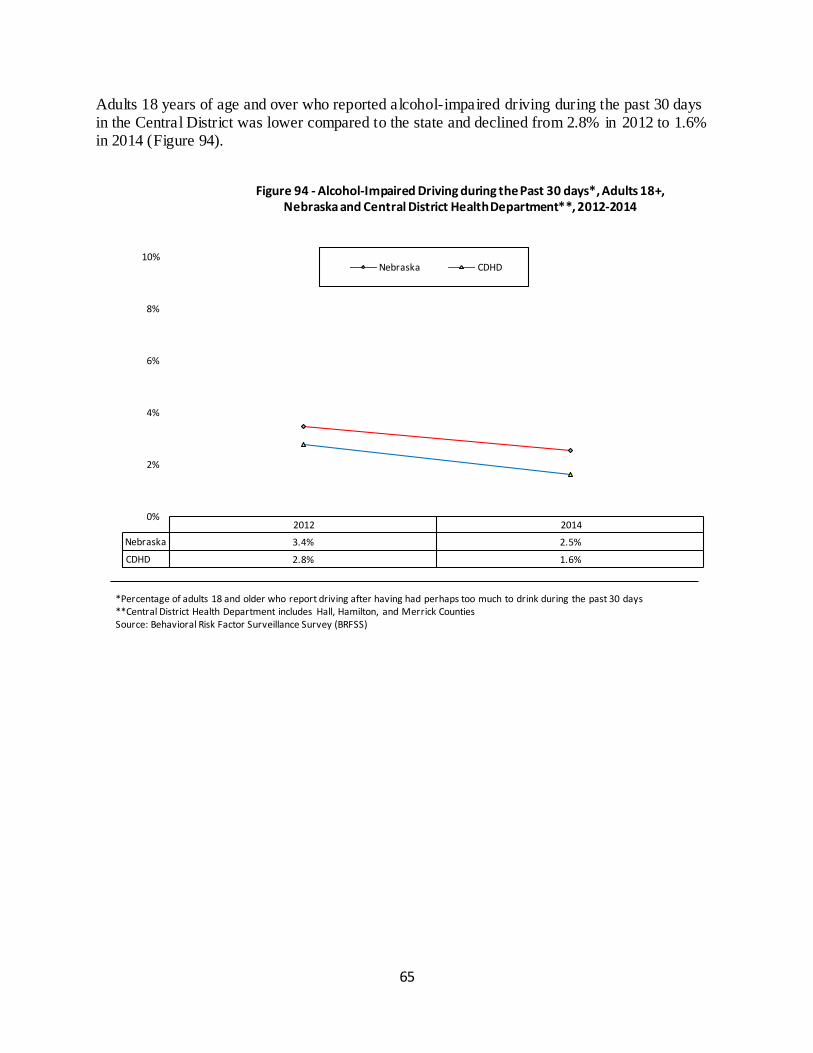
65
Adults 18 years of age and over who reported alcohol-impaired driving during the past 30 days in the Central District was lower compared to the state and declined from 2.8% in 2012 to 1.6% in 2014 (Figure 94).
2012 2014
Nebraska 3.4% 2.5%
CDHD 2.8% 1.6%
0%
2%
4%
6%
8%
10%
Figure 94 - Alcohol-Impaired Driving during the Past 30 days*, Adults 18+, Nebraska and Central District Health Department**, 2012-2014
Nebraska CDHD
*Percentage of adults 18 and older who report driving after having had perhaps too much to drink during the past 30 days **Central District Health Department includes Hall, Hamilton, and Merrick Counties Source: Behavioral Risk Factor Surveillance Survey (BRFSS)
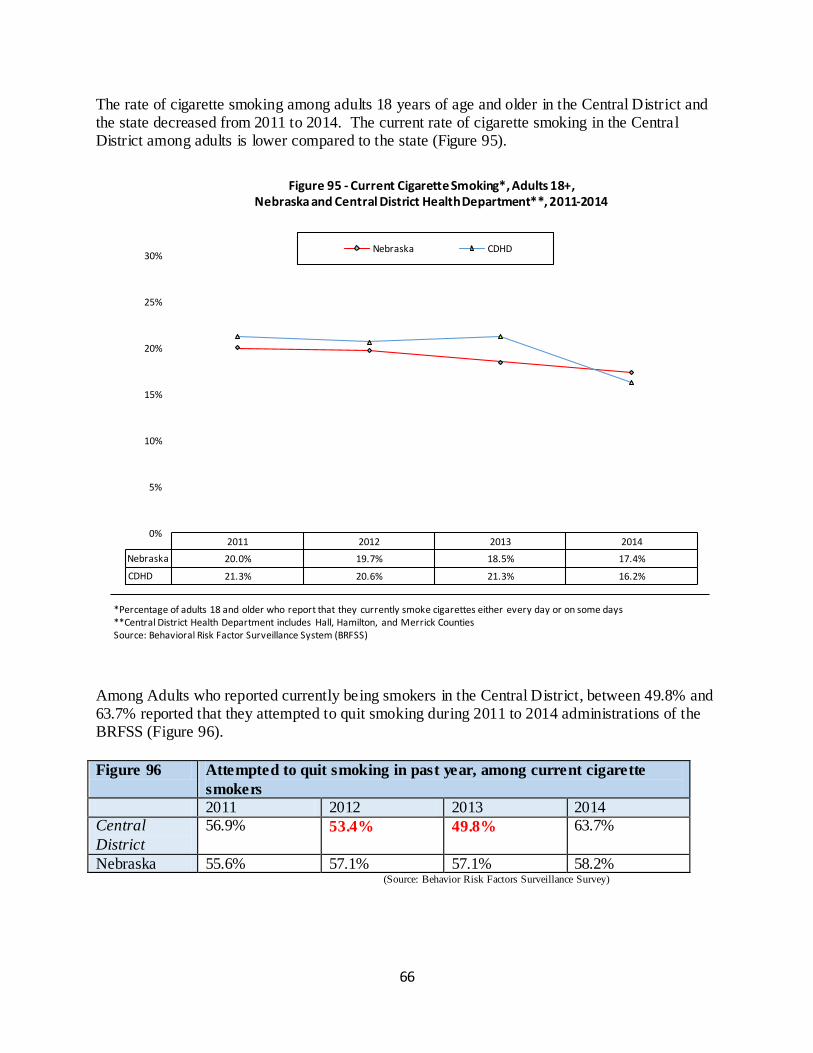
66
The rate of cigarette smoking among adults 18 years of age and older in the Central District and the state decreased from 2011 to 2014. The current rate of cigarette smoking in the Central District among adults is lower compared to the state (Figure 95).
Among Adults who reported currently being smokers in the Central District, between 49.8% and 63.7% reported that they attempted to quit smoking during 2011 to 2014 administrations of the BRFSS (Figure 96).
Figure 96 Attempted to quit smoking in past year, among current cigarette
smokers
2011 2012 2013 2014 Central
District
56.9% 53.4% 49.8% 63.7%
Nebraska 55.6% 57.1% 57.1% 58.2% (Source: Behavior Risk Factors Surveillance Survey)
2011 2012 2013 2014
Nebraska 20.0% 19.7% 18.5% 17.4%
CDHD 21.3% 20.6% 21.3% 16.2%
0%
5%
10%
15%
20%
25%
30%
Figure 95 - Current Cigarette Smoking*, Adults 18+, Nebraska and Central District Health Department**, 2011-2014
Nebraska CDHD
*Percentage of adults 18 and older who report that they currently smoke cigarettes either every day or on some days **Central District Health Department includes Hall, Hamilton, and Merrick Counties Source: Behavioral Risk Factor Surveillance System (BRFSS)
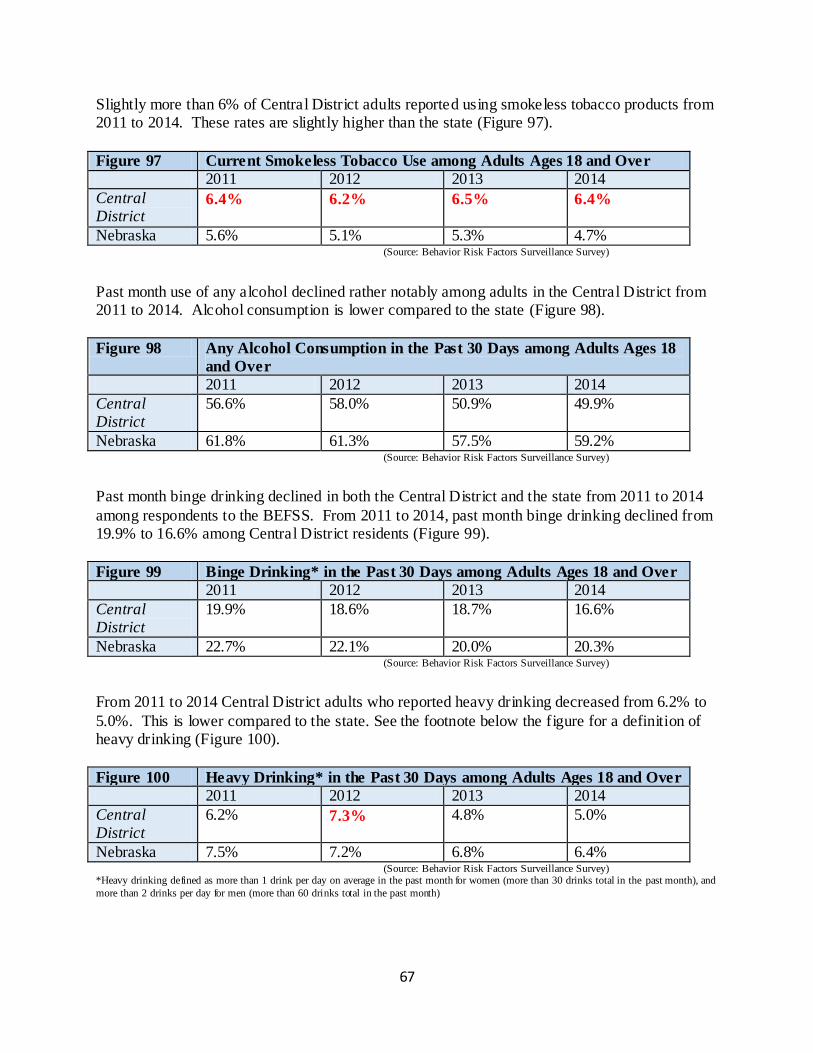
67
Slightly more than 6% of Central District adults reported using smokeless tobacco products from 2011 to 2014. These rates are slightly higher than the state (Figure 97).
Figure 97 Current Smokeless Tobacco Use among Adults Ages 18 and Over
2011 2012 2013 2014
Central District
6.4% 6.2% 6.5% 6.4%
Nebraska 5.6% 5.1% 5.3% 4.7% (Source: Behavior Risk Factors Surveillance Survey)
Past month use of any alcohol declined rather notably among adults in the Central District from 2011 to 2014. Alcohol consumption is lower compared to the state (Figure 98).
Figure 98 Any Alcohol Consumption in the Past 30 Days among Adults Ages 18
and Over
2011 2012 2013 2014
Central District
56.6% 58.0% 50.9% 49.9%
Nebraska 61.8% 61.3% 57.5% 59.2% (Source: Behavior Risk Factors Surveillance Survey)
Past month binge drinking declined in both the Central District and the state from 2011 to 2014
among respondents to the BEFSS. From 2011 to 2014, past month binge drinking declined from 19.9% to 16.6% among Central District residents (Figure 99).
Figure 99 Binge Drinking* in the Past 30 Days among Adults Ages 18 and Over
2011 2012 2013 2014
Central District
19.9% 18.6% 18.7% 16.6%
Nebraska 22.7% 22.1% 20.0% 20.3% (Source: Behavior Risk Factors Surveillance Survey)
From 2011 to 2014 Central District adults who reported heavy drinking decreased from 6.2% to
5.0%. This is lower compared to the state. See the footnote below the figure for a definition of heavy drinking (Figure 100).
Figure 100 Heavy Drinking* in the Past 30 Days among Adults Ages 18 and Over
2011 2012 2013 2014
Central District
6.2% 7.3% 4.8% 5.0%
Nebraska 7.5% 7.2% 6.8% 6.4% (Source: Behavior Risk Factors Surveillance Survey) *Heavy drinking defined as more than 1 drink per day on average in the past month for women (more than 30 drinks total in the past month), and
more than 2 drinks per day for men (more than 60 drinks total in the past month)
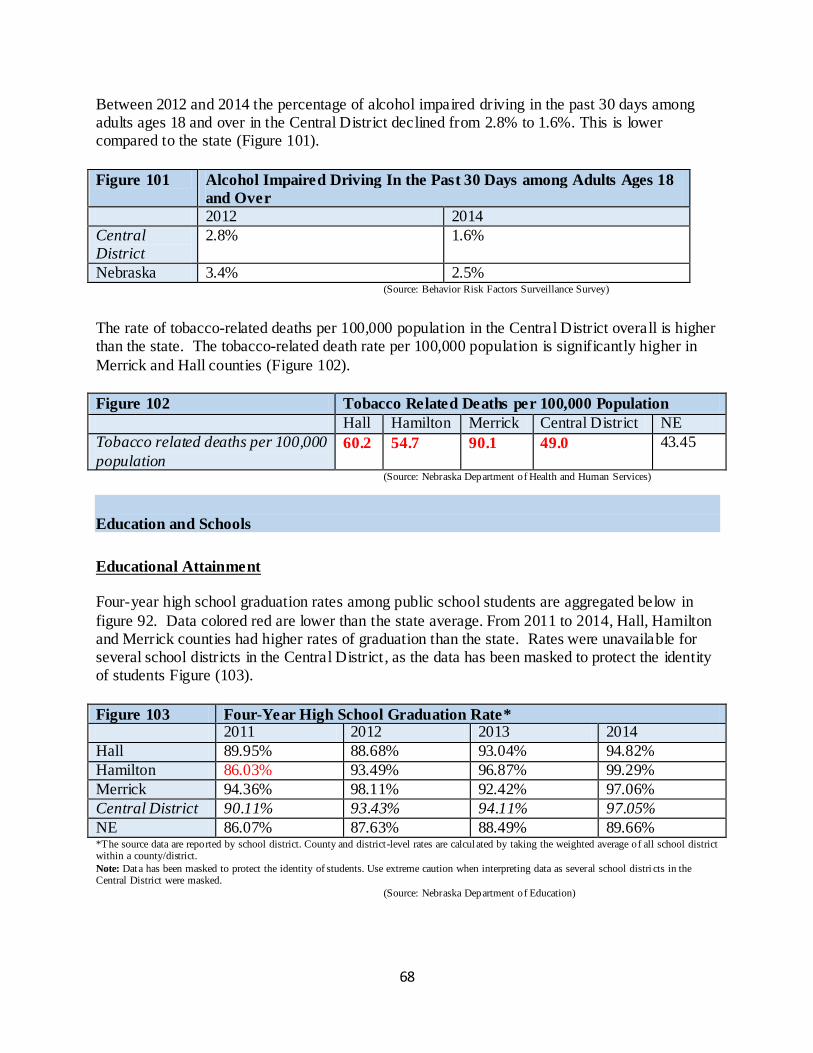
68
Between 2012 and 2014 the percentage of alcohol impaired driving in the past 30 days among adults ages 18 and over in the Central District declined from 2.8% to 1.6%. This is lower compared to the state (Figure 101).
Figure 101 Alcohol Impaired Driving In the Past 30 Days among Adults Ages 18
and Over
2012 2014
Central District
2.8% 1.6%
Nebraska 3.4% 2.5% (Source: Behavior Risk Factors Surveillance Survey)
The rate of tobacco-related deaths per 100,000 population in the Central District overall is higher than the state. The tobacco-related death rate per 100,000 population is significantly higher in
Merrick and Hall counties (Figure 102).
Figure 102 Tobacco Related Deaths per 100,000 Population
Hall Hamilton Merrick Central District NE
Tobacco related deaths per 100,000
population 60.2 54.7 90.1 49.0 43.45
(Source: Nebraska Department of Health and Human Services)
Education and Schools
Educational Attainment Four-year high school graduation rates among public school students are aggregated below in
figure 92. Data colored red are lower than the state average. From 2011 to 2014, Hall, Hamilton and Merrick counties had higher rates of graduation than the state. Rates were unavailable for several school districts in the Central District , as the data has been masked to protect the identity of students Figure (103).
Figure 103 Four-Year High School Graduation Rate* 2011 2012 2013 2014
Hall 89.95% 88.68% 93.04% 94.82%
Hamilton 86.03% 93.49% 96.87% 99.29%
Merrick 94.36% 98.11% 92.42% 97.06%
Central District 90.11% 93.43% 94.11% 97.05%
NE 86.07% 87.63% 88.49% 89.66% *The source data are reported by school district. County and district-level rates are calculated by taking the weighted average of all school district within a county/district.
Note: Data has been masked to protect the identity of students. Use extreme caution when interpreting data as several school distri cts in the Central District were masked.
(Source: Nebraska Department of Education)
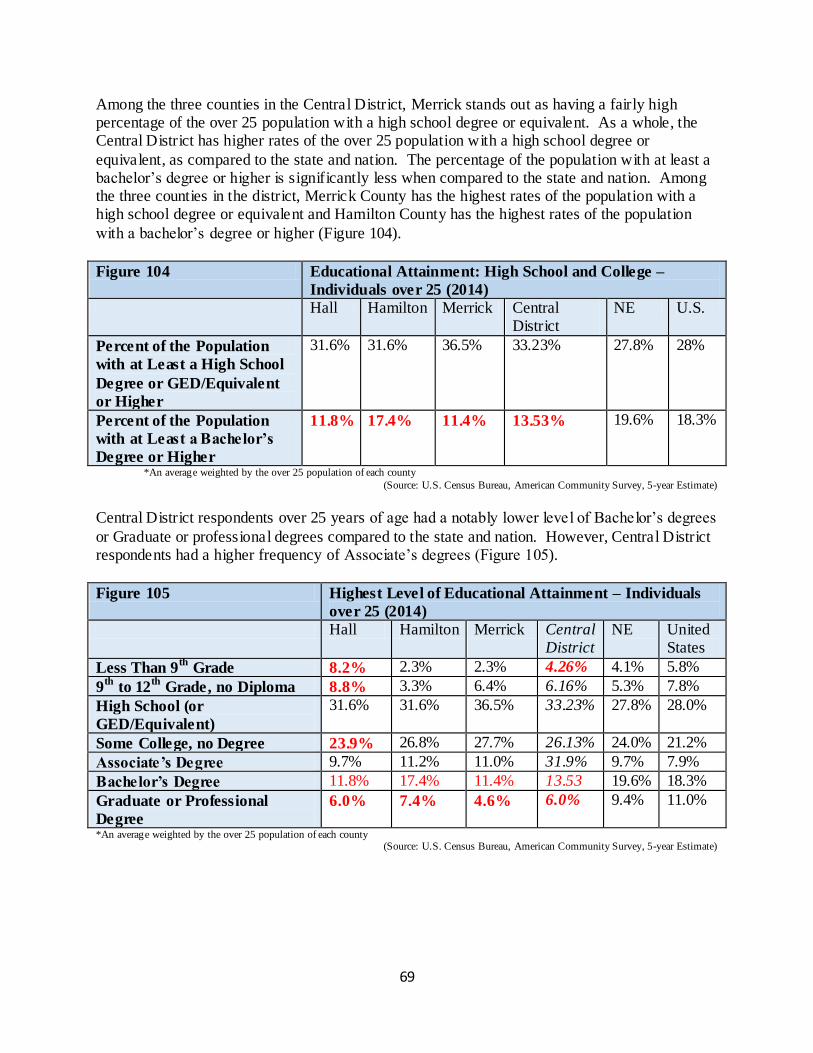
69
Among the three counties in the Central District, Merrick stands out as having a fairly high percentage of the over 25 population with a high school degree or equivalent. As a whole, the Central District has higher rates of the over 25 population with a high school degree or
equivalent, as compared to the state and nation. The percentage of the population with at least a bachelor’s degree or higher is significantly less when compared to the state and nation. Among the three counties in the district, Merrick County has the highest rates of the population with a high school degree or equivalent and Hamilton County has the highest rates of the population
with a bachelor’s degree or higher (Figure 104).
Figure 104 Educational Attainment: High School and College –
Individuals over 25 (2014)
Hall Hamilton Merrick Central District
NE U.S.
Percent of the Population
with at Least a High School
Degree or GED/Equivalent
or Higher
31.6% 31.6% 36.5% 33.23% 27.8% 28%
Percent of the Population
with at Least a Bachelor’s
Degree or Higher
11.8% 17.4% 11.4% 13.53% 19.6% 18.3%
*An average weighted by the over 25 population of each county
(Source: U.S. Census Bureau, American Community Survey, 5-year Estimate)
Central District respondents over 25 years of age had a notably lower level of Bachelor’s degrees
or Graduate or professional degrees compared to the state and nation. However, Central District respondents had a higher frequency of Associate’s degrees (Figure 105).
Figure 105 Highest Level of Educational Attainment – Individuals
over 25 (2014)
Hall Hamilton Merrick Central District
NE United States
Less Than 9th
Grade 8.2% 2.3% 2.3% 4.26% 4.1% 5.8%
9th
to 12th
Grade, no Diploma 8.8% 3.3% 6.4% 6.16% 5.3% 7.8%
High School (or
GED/Equivalent)
31.6% 31.6% 36.5% 33.23% 27.8% 28.0%
Some College, no Degree 23.9% 26.8% 27.7% 26.13% 24.0% 21.2%
Associate’s Degree 9.7% 11.2% 11.0% 31.9% 9.7% 7.9%
Bachelor’s Degree 11.8% 17.4% 11.4% 13.53 19.6% 18.3%
Graduate or Professional
Degree
6.0% 7.4% 4.6% 6.0% 9.4% 11.0%
*An average weighted by the over 25 population of each county (Source: U.S. Census Bureau, American Community Survey, 5-year Estimate)
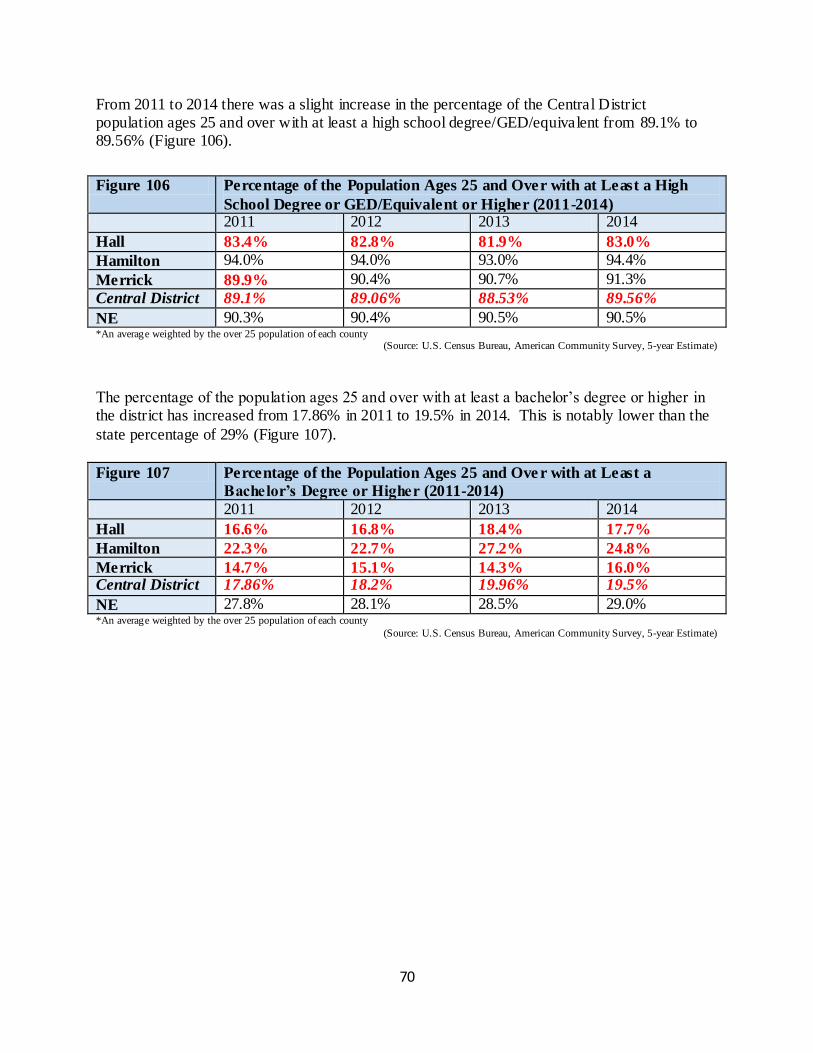
70
From 2011 to 2014 there was a slight increase in the percentage of the Central District population ages 25 and over with at least a high school degree/GED/equivalent from 89.1% to 89.56% (Figure 106).
Figure 106 Percentage of the Population Ages 25 and Over with at Least a High
School Degree or GED/Equivalent or Higher (2011-2014)
2011 2012 2013 2014
Hall 83.4% 82.8% 81.9% 83.0%
Hamilton 94.0% 94.0% 93.0% 94.4%
Merrick 89.9% 90.4% 90.7% 91.3%
Central District 89.1% 89.06% 88.53% 89.56%
NE 90.3% 90.4% 90.5% 90.5% *An average weighted by the over 25 population of each county (Source: U.S. Census Bureau, American Community Survey, 5-year Estimate)
The percentage of the population ages 25 and over with at least a bachelor’s degree or higher in the district has increased from 17.86% in 2011 to 19.5% in 2014. This is notably lower than the
state percentage of 29% (Figure 107).
Figure 107 Percentage of the Population Ages 25 and Ove r with at Least a
Bachelor’s Degree or Higher (2011-2014)
2011 2012 2013 2014
Hall 16.6% 16.8% 18.4% 17.7%
Hamilton 22.3% 22.7% 27.2% 24.8%
Merrick 14.7% 15.1% 14.3% 16.0% Central District 17.86% 18.2% 19.96% 19.5%
NE 27.8% 28.1% 28.5% 29.0% *An average weighted by the over 25 population of each county
(Source: U.S. Census Bureau, American Community Survey, 5-year Estimate)
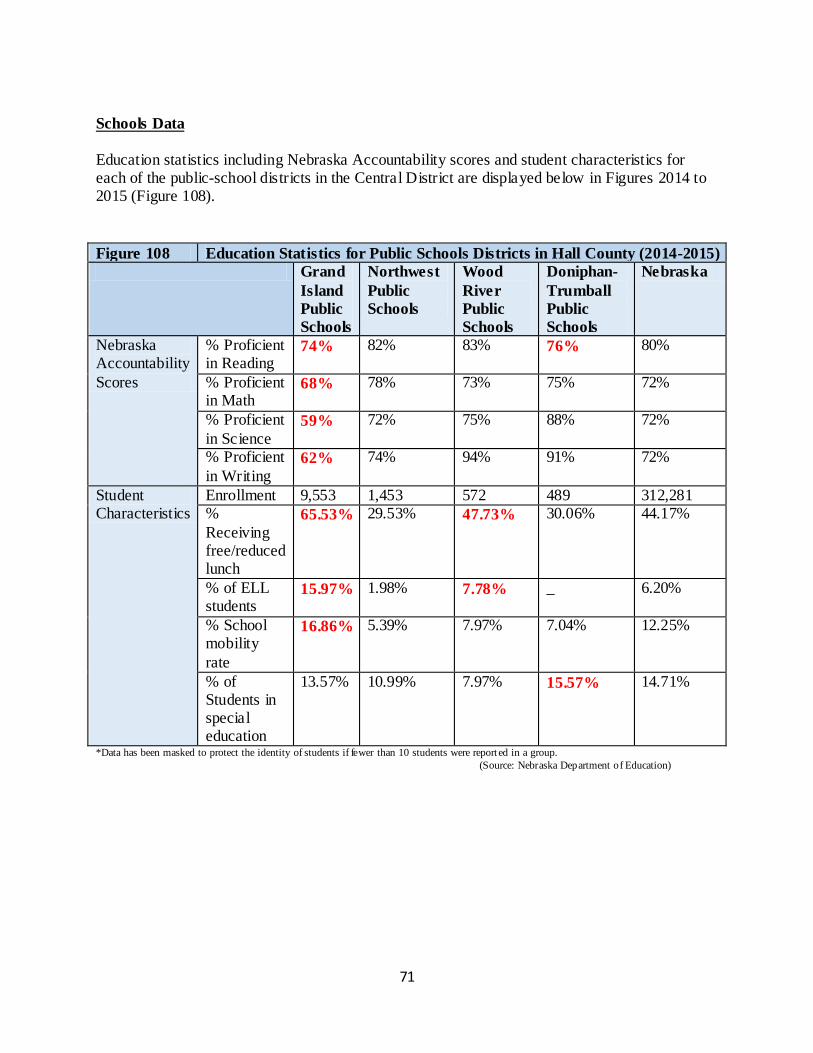
71
Schools Data
Education statistics including Nebraska Accountability scores and student characteristics for each of the public-school districts in the Central District are displayed below in Figures 2014 to 2015 (Figure 108).
Figure 108 Education Statistics for Public Schools Districts in Hall County (2014-2015)
Grand
Island
Public
Schools
Northwest
Public
Schools
Wood
River
Public
Schools
Doniphan-
Trumball
Public
Schools
Nebraska
Nebraska Accountability
Scores
% Proficient in Reading
74% 82% 83% 76% 80%
% Proficient in Math
68% 78% 73% 75% 72%
% Proficient
in Science 59% 72% 75% 88% 72%
% Proficient
in Writing 62% 74% 94% 91% 72%
Student Characteristics
Enrollment 9,553 1,453 572 489 312,281 %
Receiving free/reduced lunch
65.53% 29.53% 47.73% 30.06% 44.17%
% of ELL students
15.97% 1.98% 7.78% _ 6.20%
% School mobility
rate
16.86% 5.39% 7.97% 7.04% 12.25%
% of Students in special education
13.57% 10.99% 7.97% 15.57% 14.71%
*Data has been masked to protect the identity of students if fewer than 10 students were report ed in a group.
(Source: Nebraska Department of Education)
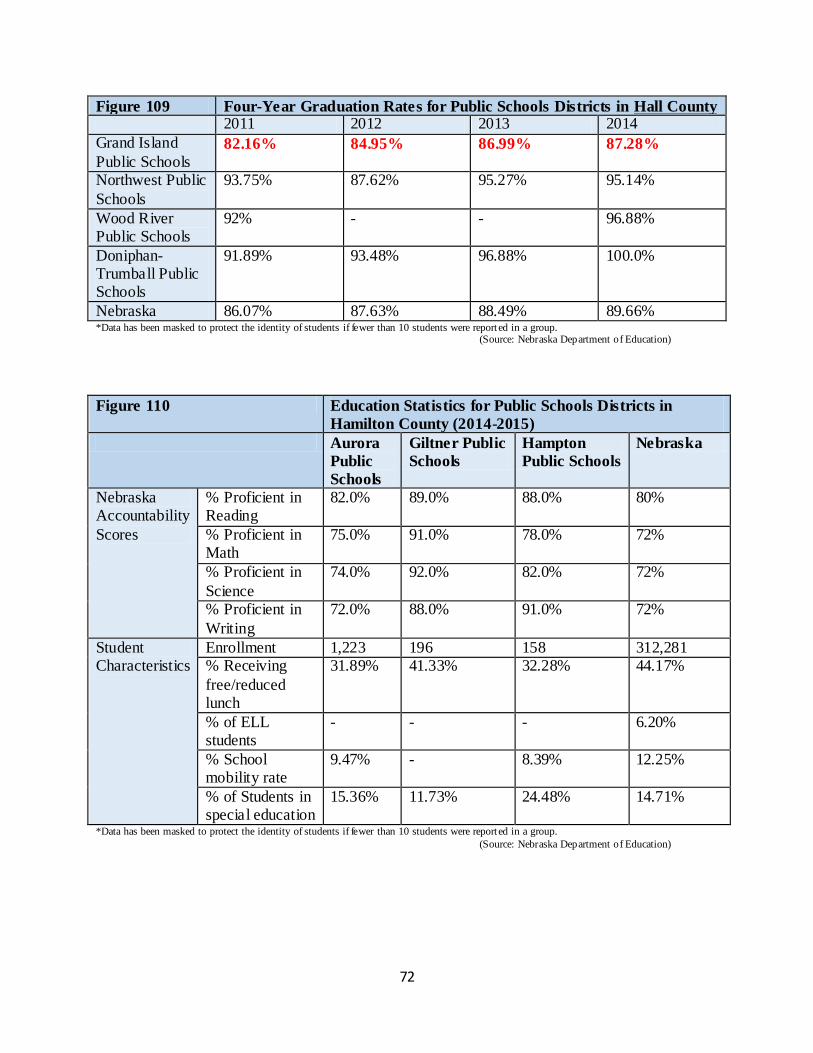
72
Figure 109 Four-Year Graduation Rates for Public Schools Districts in Hall County 2011 2012 2013 2014
Grand Island
Public Schools 82.16% 84.95% 86.99% 87.28%
Northwest Public
Schools
93.75% 87.62% 95.27% 95.14%
Wood River Public Schools
92% - - 96.88%
Doniphan-Trumball Public Schools
91.89% 93.48% 96.88% 100.0%
Nebraska 86.07% 87.63% 88.49% 89.66% *Data has been masked to protect the identity of students if fewer than 10 students were report ed in a group. (Source: Nebraska Department of Education)
Figure 110 Education Statistics for Public Schools Districts in
Hamilton County (2014-2015)
Aurora
Public
Schools
Giltner Public
Schools
Hampton
Public Schools
Nebraska
Nebraska Accountability
Scores
% Proficient in Reading
82.0% 89.0% 88.0% 80%
% Proficient in Math
75.0%
91.0% 78.0% 72%
% Proficient in
Science
74.0% 92.0% 82.0% 72%
% Proficient in
Writing
72.0% 88.0% 91.0% 72%
Student Characteristics
Enrollment 1,223 196 158 312,281 % Receiving
free/reduced lunch
31.89% 41.33% 32.28% 44.17%
% of ELL students
- - - 6.20%
% School mobility rate
9.47% - 8.39% 12.25%
% of Students in special education
15.36% 11.73% 24.48% 14.71%
*Data has been masked to protect the identity of students if fewer than 10 students were report ed in a group.
(Source: Nebraska Department of Education)
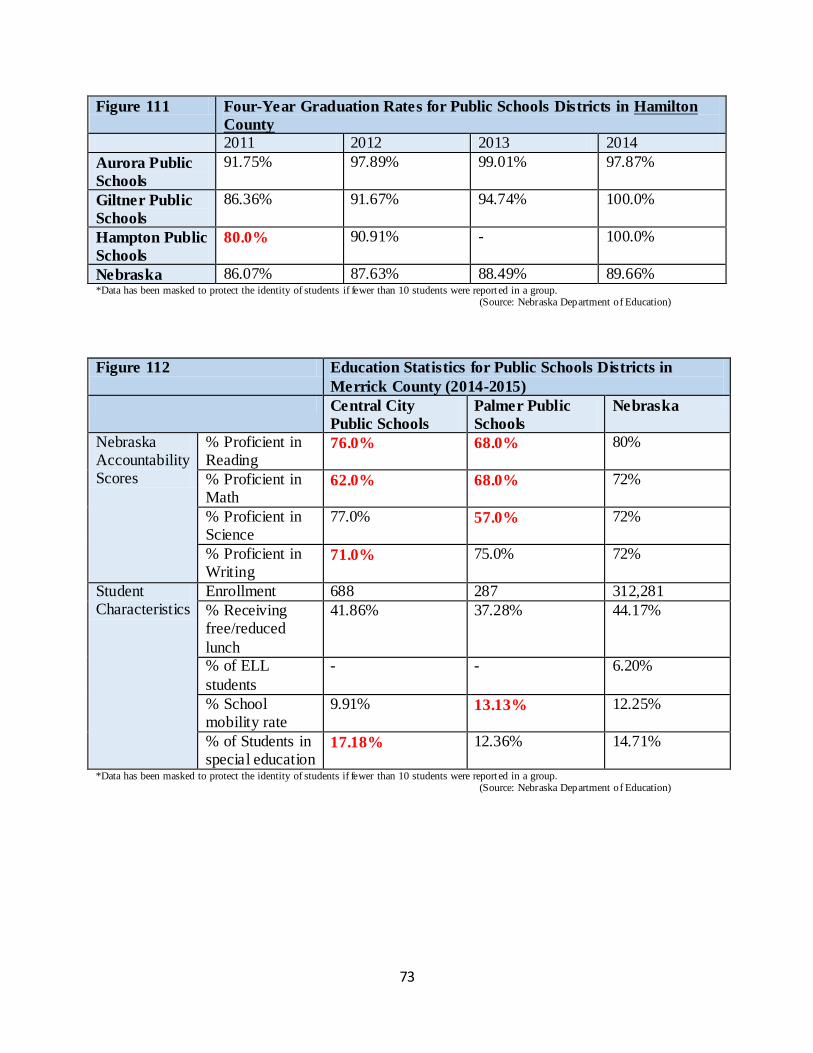
73
Figure 111 Four-Year Graduation Rates for Public Schools Districts in Hamilton
County
2011 2012 2013 2014
Aurora Public
Schools
91.75% 97.89% 99.01% 97.87%
Giltner Public
Schools
86.36% 91.67% 94.74% 100.0%
Hampton Public
Schools 80.0% 90.91% - 100.0%
Nebraska 86.07% 87.63% 88.49% 89.66% *Data has been masked to protect the identity of students if fewer than 10 students were report ed in a group. (Source: Nebraska Department of Education)
Figure 112 Education Statistics for Public Schools Districts in
Merrick County (2014-2015)
Central City
Public Schools
Palmer Public
Schools
Nebraska
Nebraska Accountability Scores
% Proficient in Reading
76.0% 68.0% 80%
% Proficient in Math
62.0% 68.0% 72%
% Proficient in Science
77.0% 57.0% 72%
% Proficient in Writing
71.0% 75.0% 72%
Student Characteristics
Enrollment 688 287 312,281
% Receiving free/reduced
lunch
41.86% 37.28% 44.17%
% of ELL
students
- - 6.20%
% School mobility rate
9.91% 13.13% 12.25%
% of Students in special education
17.18% 12.36% 14.71%
*Data has been masked to protect the identity of students if fewer than 10 students were report ed in a group. (Source: Nebraska Department of Education)
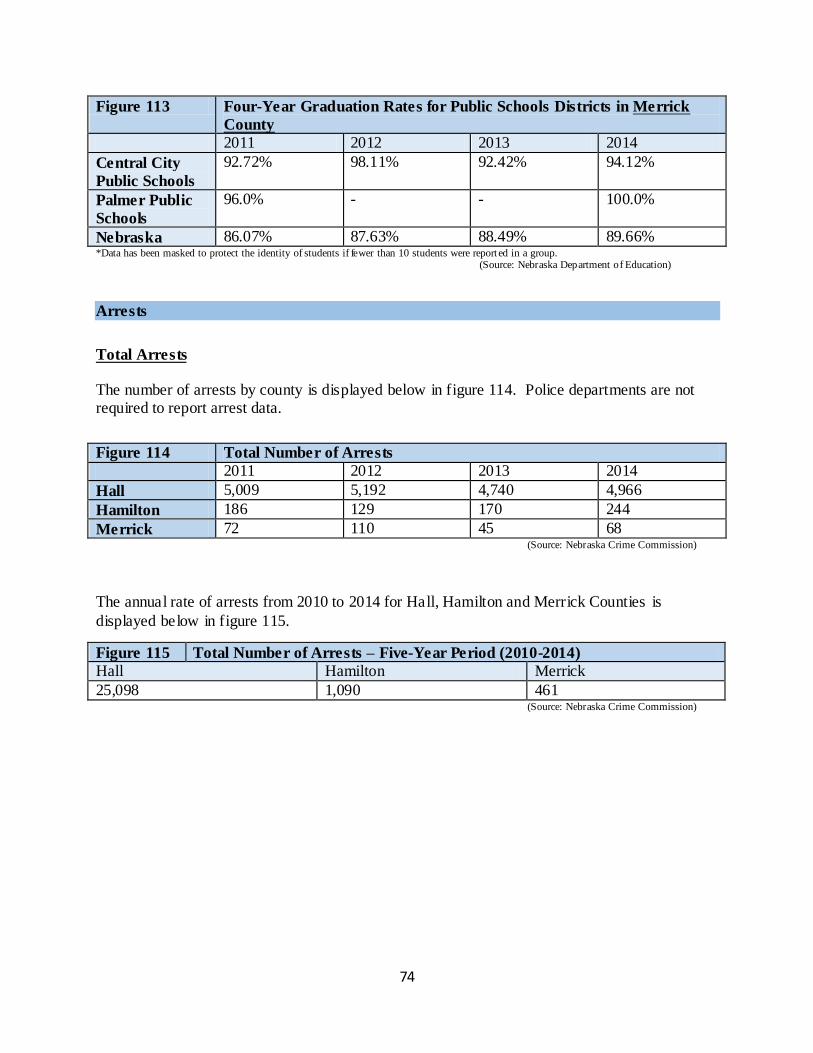
74
Figure 113 Four-Year Graduation Rates for Public Schools Districts in Merrick
County
2011 2012 2013 2014
Central City
Public Schools
92.72% 98.11% 92.42% 94.12%
Palmer Public
Schools
96.0% - - 100.0%
Nebraska 86.07% 87.63% 88.49% 89.66% *Data has been masked to protect the identity of students if fewer than 10 students were report ed in a group. (Source: Nebraska Department of Education)
Arrests
Total Arrests The number of arrests by county is displayed below in figure 114. Police departments are not required to report arrest data.
Figure 114 Total Number of Arrests
2011 2012 2013 2014
Hall 5,009 5,192 4,740 4,966
Hamilton 186 129 170 244
Merrick 72 110 45 68 (Source: Nebraska Crime Commission)
The annual rate of arrests from 2010 to 2014 for Hall, Hamilton and Merrick Counties is
displayed below in figure 115.
Figure 115 Total Number of Arrests – Five-Year Period (2010-2014)
Hall Hamilton Merrick
25,098 1,090 461 (Source: Nebraska Crime Commission)
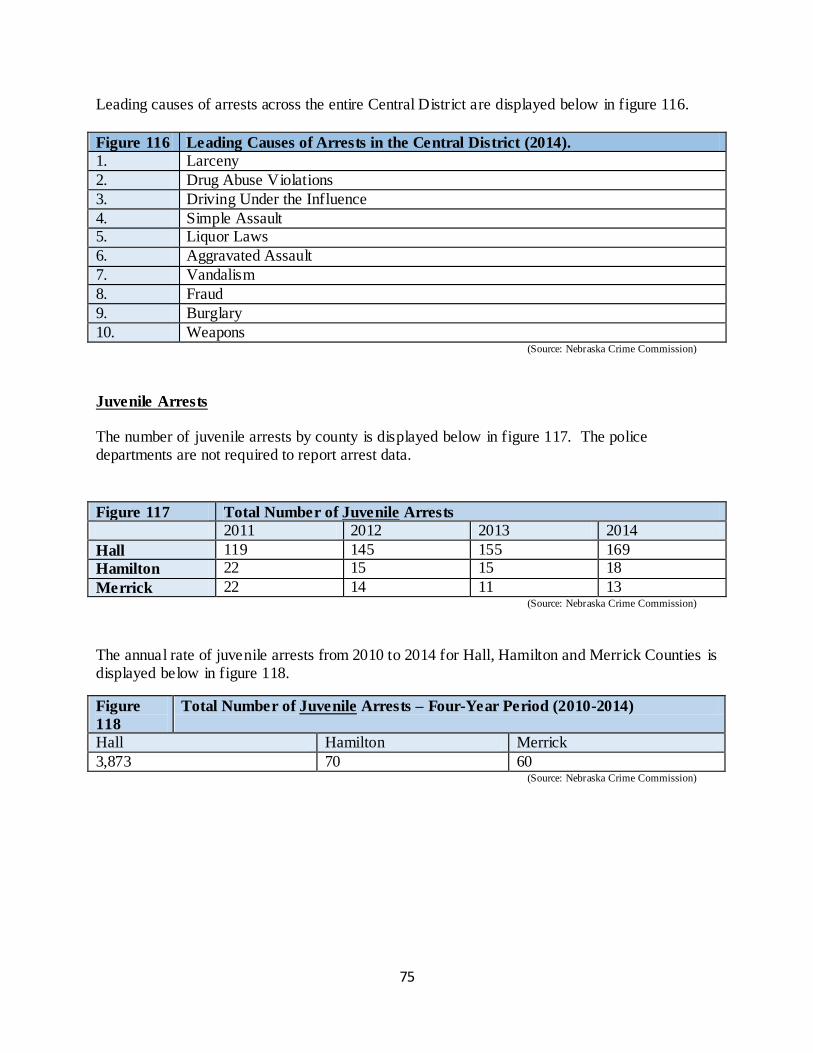
75
Leading causes of arrests across the entire Central District are displayed below in figure 116.
Figure 116 Leading Causes of Arrests in the Central District (2014).
1. Larceny
2. Drug Abuse Violations
3. Driving Under the Influence
4. Simple Assault 5. Liquor Laws
6. Aggravated Assault
7. Vandalism
8. Fraud
9. Burglary
10. Weapons (Source: Nebraska Crime Commission)
Juvenile Arrests The number of juvenile arrests by county is displayed below in figure 117. The police departments are not required to report arrest data.
Figure 117 Total Number of Juvenile Arrests
2011 2012 2013 2014
Hall 119 145 155 169
Hamilton 22 15 15 18
Merrick 22 14 11 13 (Source: Nebraska Crime Commission)
The annual rate of juvenile arrests from 2010 to 2014 for Hall, Hamilton and Merrick Counties is displayed below in figure 118.
Figure
118
Total Number of Juvenile Arrests – Four-Year Period (2010-2014)
Hall Hamilton Merrick
3,873 70 60 (Source: Nebraska Crime Commission)
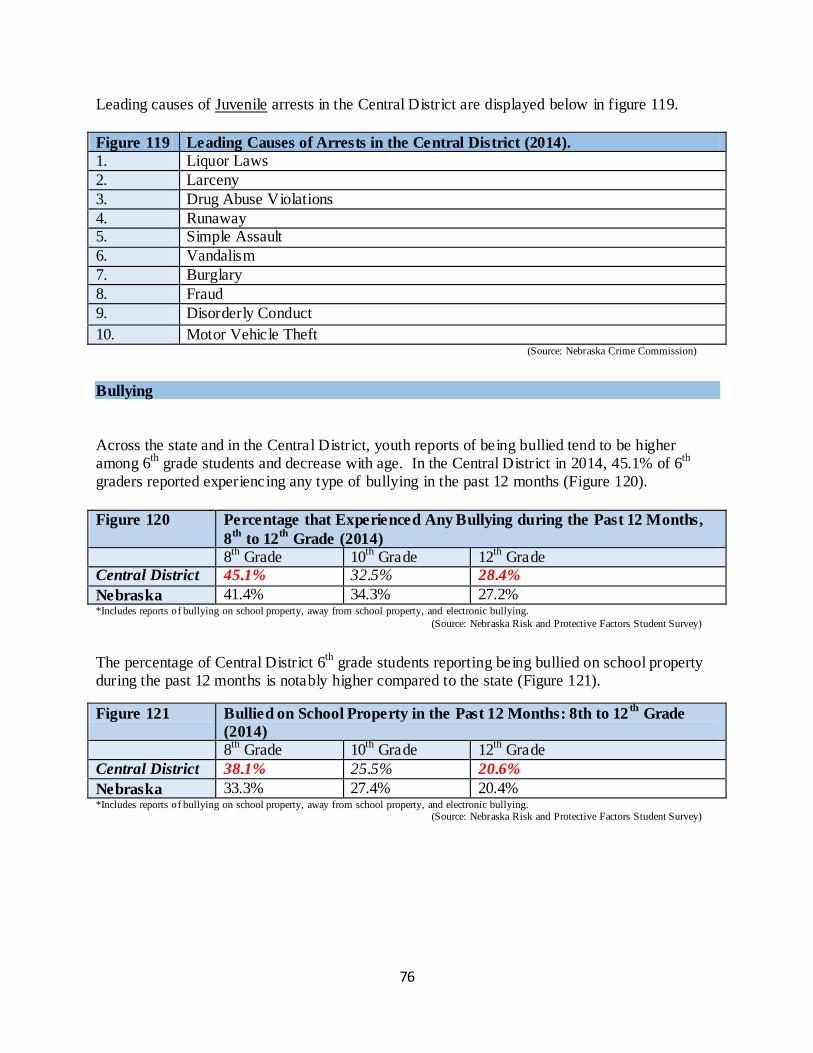
76
Leading causes of Juvenile arrests in the Central District are displayed below in figure 119.
Figure 119 Leading Causes of Arrests in the Central District (2014).
1. Liquor Laws
2. Larceny
3. Drug Abuse Violations
4. Runaway 5. Simple Assault
6. Vandalism
7. Burglary
8. Fraud
9. Disorderly Conduct
10. Motor Vehicle Theft (Source: Nebraska Crime Commission)
Bullying
Across the state and in the Central District, youth reports of being bullied tend to be higher among 6
th grade students and decrease with age. In the Central District in 2014, 45.1% of 6
th
graders reported experiencing any type of bullying in the past 12 months (Figure 120).
Figure 120 Percentage that Experienced Any Bullying during the Past 12 Months,
8th
to 12th
Grade (2014)
8th
Grade 10th
Grade 12th
Grade Central District 45.1% 32.5% 28.4%
Nebraska 41.4% 34.3% 27.2% *Includes reports of bullying on school property, away from school property, and electronic bullying.
(Source: Nebraska Risk and Protective Factors Student Survey)
The percentage of Central District 6th
grade students reporting being bullied on school property during the past 12 months is notably higher compared to the state (Figure 121).
Figure 121 Bullied on School Property in the Past 12 Months: 8th to 12th
Grade
(2014)
8th
Grade 10th
Grade 12th
Grade
Central District 38.1% 25.5% 20.6%
Nebraska 33.3% 27.4% 20.4% *Includes reports of bullying on school property, away from school property, and electronic bullying. (Source: Nebraska Risk and Protective Factors Student Survey)
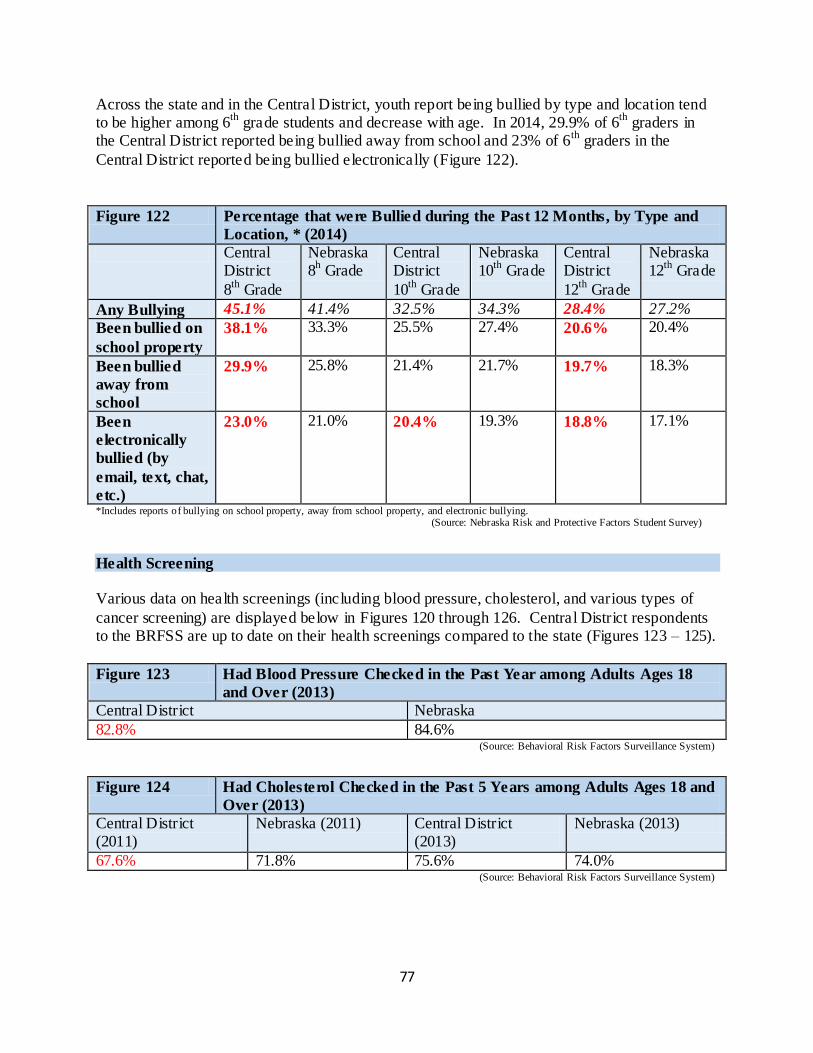
77
Across the state and in the Central District, youth report being bullied by type and location tend to be higher among 6
th grade students and decrease with age. In 2014, 29.9% of 6
th graders in
the Central District reported being bullied away from school and 23% of 6th
graders in the
Central District reported being bullied electronically (Figure 122).
Figure 122 Percentage that were Bullied during the Past 12 Months, by Type and
Location, * (2014)
Central District
8th
Grade
Nebraska 8
h Grade
Central District
10th
Grade
Nebraska 10
th Grade
Central District
12th
Grade
Nebraska 12
th Grade
Any Bullying 45.1% 41.4% 32.5% 34.3% 28.4% 27.2%
Been bullied on
school property
38.1% 33.3% 25.5% 27.4% 20.6% 20.4%
Been bullied
away from
school
29.9% 25.8% 21.4% 21.7% 19.7% 18.3%
Been
electronically
bullied (by
email, text, chat,
etc.)
23.0% 21.0% 20.4% 19.3% 18.8% 17.1%
*Includes reports of bullying on school property, away from school property, and electronic bullying. (Source: Nebraska Risk and Protective Factors Student Survey)
Health Screening Various data on health screenings (including blood pressure, cholesterol, and various types of
cancer screening) are displayed below in Figures 120 through 126. Central District respondents to the BRFSS are up to date on their health screenings compared to the state (Figures 123 – 125).
Figure 123 Had Blood Pressure Checked in the Past Year among Adults Ages 18
and Over (2013)
Central District Nebraska
82.8% 84.6% (Source: Behavioral Risk Factors Surveillance System)
Figure 124 Had Cholesterol Checked in the Past 5 Years among Adults Ages 18 and
Over (2013)
Central District (2011)
Nebraska (2011) Central District (2013)
Nebraska (2013)
67.6% 71.8% 75.6% 74.0% (Source: Behavioral Risk Factors Surveillance System)
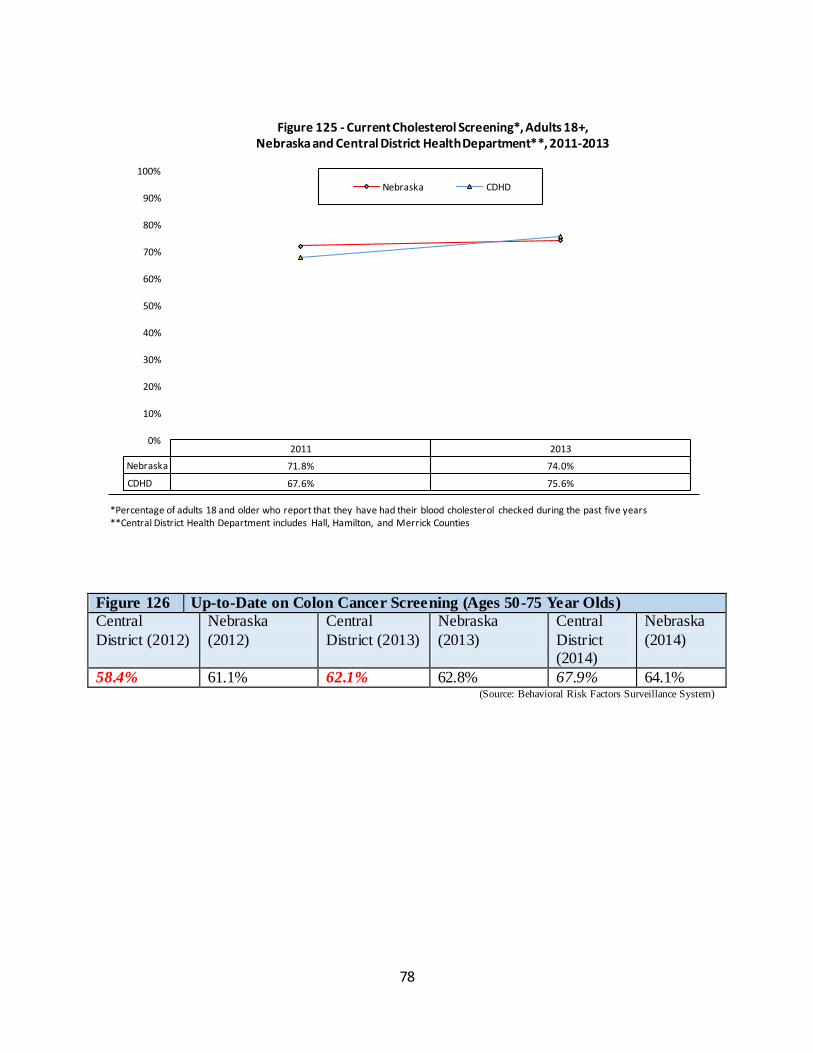
78
Figure 126 Up-to-Date on Colon Cancer Screening (Ages 50-75 Year Olds)
Central
District (2012)
Nebraska
(2012)
Central
District (2013)
Nebraska
(2013)
Central
District (2014)
Nebraska
(2014)
58.4% 61.1% 62.1% 62.8% 67.9% 64.1% (Source: Behavioral Risk Factors Surveillance System)
2011 2013
Nebraska 71.8% 74.0%
CDHD 67.6% 75.6%
0%
10%
20%
30%
40%
50%
60%
70%
80%
90%
100%
Figure 125 - Current Cholesterol Screening*, Adults 18+, Nebraska and Central District Health Department**, 2011-2013
Nebraska CDHD
*Percentage of adults 18 and older who report that they have had their blood cholesterol checked during the past five years **Central District Health Department includes Hall, Hamilton, and Merrick Counties
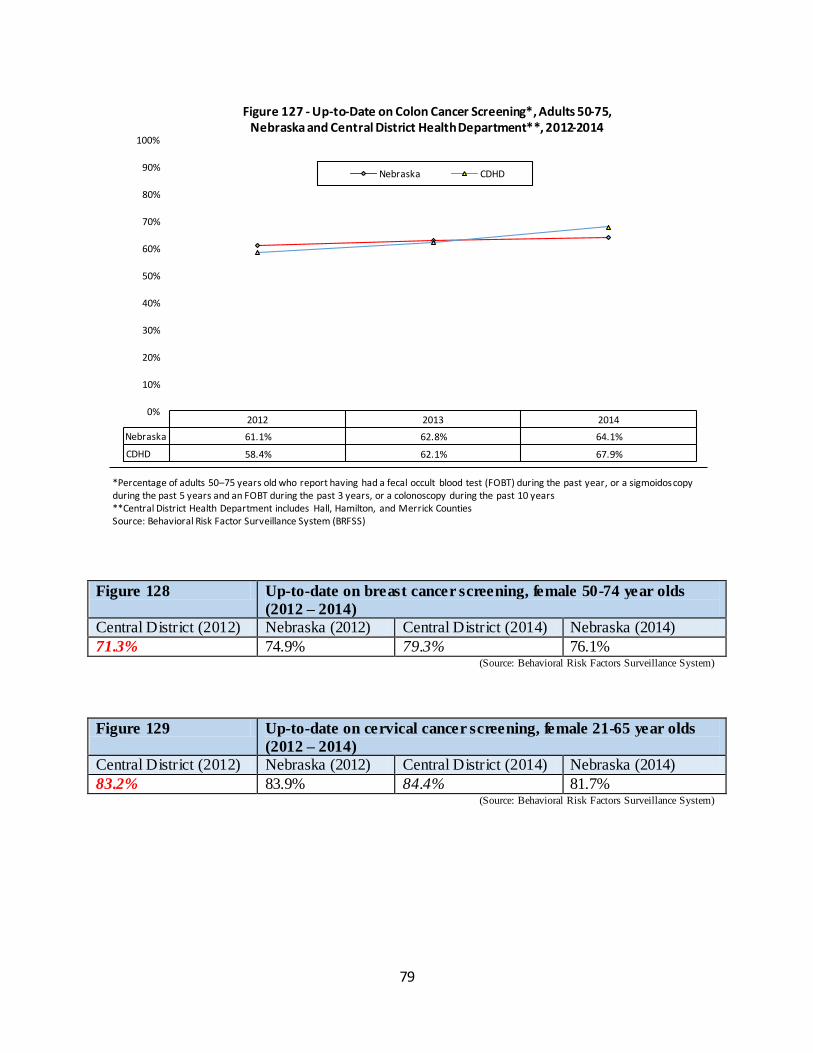
79
Figure 128 Up-to-date on breast cancer screening, female 50-74 year olds
(2012 – 2014)
Central District (2012) Nebraska (2012) Central District (2014) Nebraska (2014)
71.3% 74.9% 79.3% 76.1% (Source: Behavioral Risk Factors Surveillance System)
Figure 129 Up-to-date on cervical cancer screening, female 21-65 year olds
(2012 – 2014)
Central District (2012) Nebraska (2012) Central District (2014) Nebraska (2014)
83.2% 83.9% 84.4% 81.7% (Source: Behavioral Risk Factors Surveillance System)
2012 2013 2014
Nebraska 61.1% 62.8% 64.1%
CDHD 58.4% 62.1% 67.9%
0%
10%
20%
30%
40%
50%
60%
70%
80%
90%
100%
Figure 127 - Up-to-Date on Colon Cancer Screening*, Adults 50-75, Nebraska and Central District Health Department**, 2012-2014
Nebraska CDHD
*Percentage of adults 50–75 years old who report having had a fecal occult blood test (FOBT) during the past year, or a sigmoidoscopy during the past 5 years and an FOBT during the past 3 years, or a colonoscopy during the past 10 years **Central District Health Department includes Hall, Hamilton, and Merrick Counties Source: Behavioral Risk Factor Surveillance System (BRFSS)
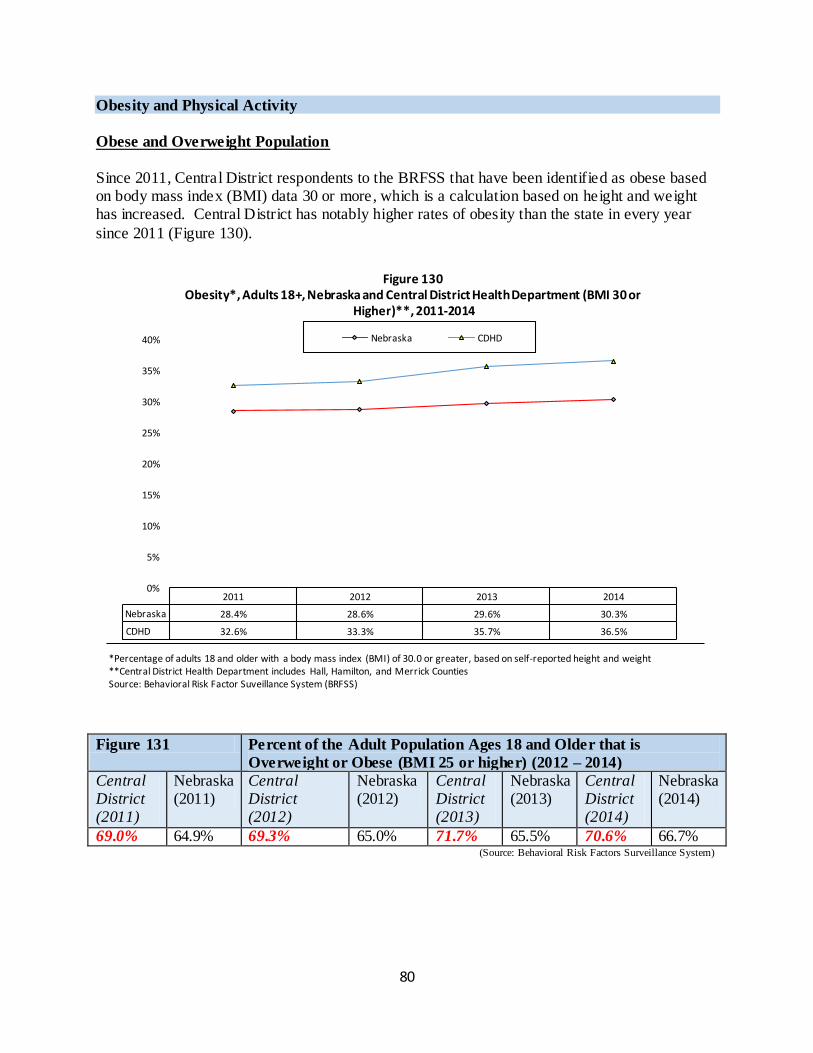
80
Obesity and Physical Activity
Obese and Overweight Population
Since 2011, Central District respondents to the BRFSS that have been identified as obese based on body mass index (BMI) data 30 or more, which is a calculation based on height and weight has increased. Central District has notably higher rates of obesity than the state in every year
since 2011 (Figure 130).
Figure 131 Percent of the Adult Population Ages 18 and Older that is
Overweight or Obese (BMI 25 or higher) (2012 – 2014)
Central District (2011)
Nebraska (2011)
Central District (2012)
Nebraska (2012)
Central District (2013)
Nebraska (2013)
Central District (2014)
Nebraska (2014)
69.0% 64.9% 69.3% 65.0% 71.7% 65.5% 70.6% 66.7% (Source: Behavioral Risk Factors Surveillance System)
2011 2012 2013 2014
Nebraska 28.4% 28.6% 29.6% 30.3%
CDHD 32.6% 33.3% 35.7% 36.5%
0%
5%
10%
15%
20%
25%
30%
35%
40%
Figure 130 Obesity*, Adults 18+, Nebraska and Central District Health Department (BMI 30 or
Higher)**, 2011-2014
Nebraska CDHD
*Percentage of adults 18 and older with a body mass index (BMI) of 30.0 or greater, based on self-reported height and weight **Central District Health Department includes Hall, Hamilton, and Merrick Counties Source: Behavioral Risk Factor Suveillance System (BRFSS)
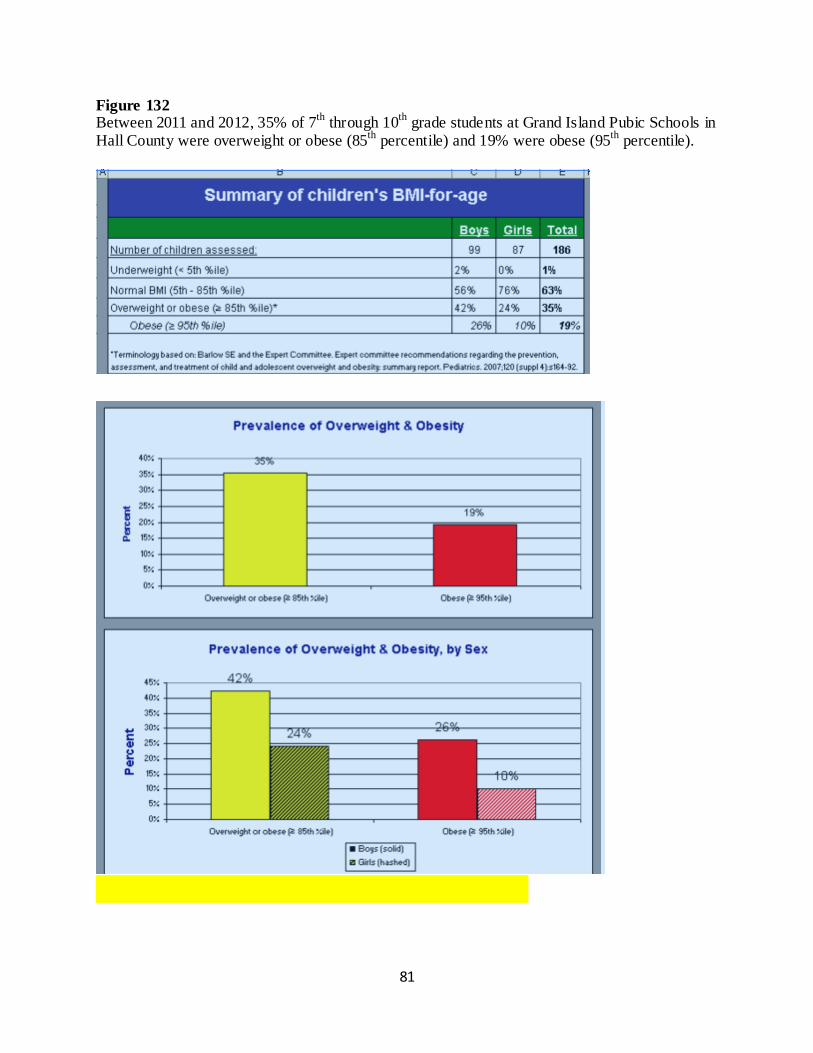
81
Figure 132 Between 2011 and 2012, 35% of 7
th through 10
th grade students at Grand Island Pubic Schools in
Hall County were overweight or obese (85th
percentile) and 19% were obese (95th
percentile).
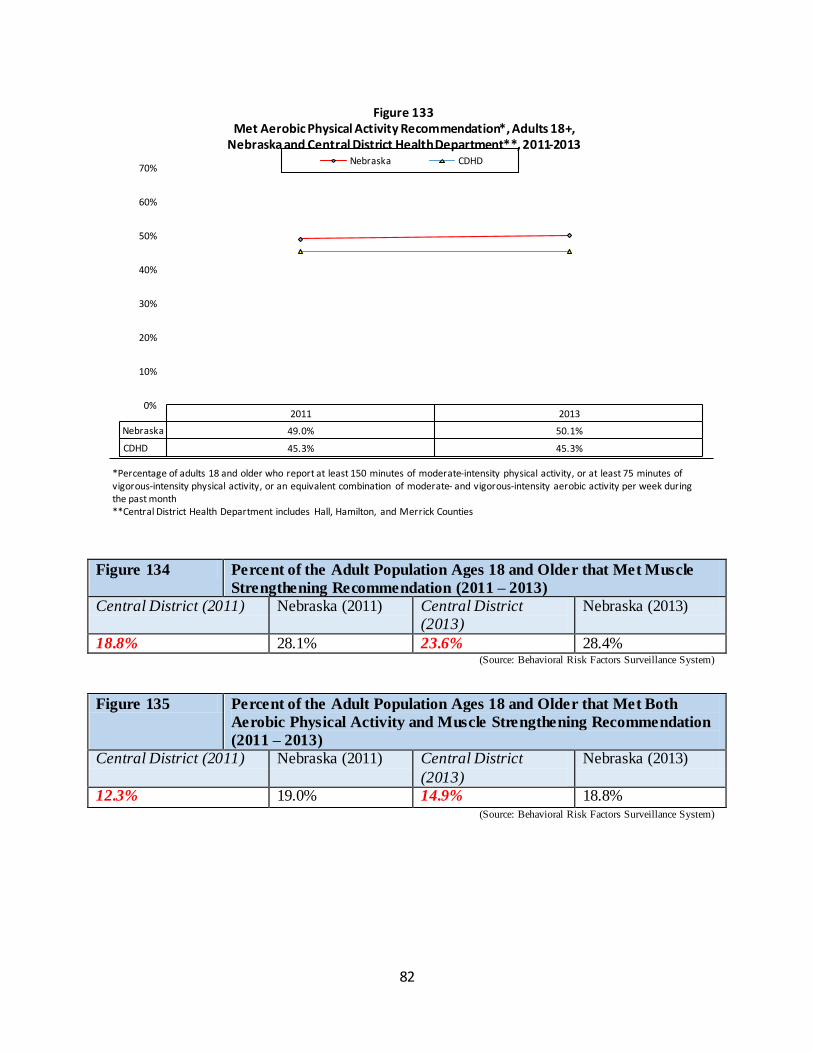
82
Figure 134 Percent of the Adult Population Ages 18 and Older that Met Muscle
Strengthening Recommendation (2011 – 2013)
Central District (2011) Nebraska (2011) Central District (2013)
Nebraska (2013)
18.8% 28.1% 23.6% 28.4% (Source: Behavioral Risk Factors Surveillance System)
Figure 135 Percent of the Adult Population Ages 18 and Older that Met Both
Aerobic Physical Activity and Muscle Strengthening Recommendation
(2011 – 2013)
Central District (2011) Nebraska (2011) Central District
(2013)
Nebraska (2013)
12.3% 19.0% 14.9% 18.8% (Source: Behavioral Risk Factors Surveillance System)
2011 2013
Nebraska 49.0% 50.1%
CDHD 45.3% 45.3%
0%
10%
20%
30%
40%
50%
60%
70%
Figure 133 Met Aerobic Physical Activity Recommendation*, Adults 18+,
Nebraska and Central District Health Department**, 2011-2013 Nebraska CDHD
*Percentage of adults 18 and older who report at least 150 minutes of moderate-intensity physical activity, or at least 75 minutes of vigorous-intensity physical activity, or an equivalent combination of moderate- and vigorous-intensity aerobic activity per week during the past month **Central District Health Department includes Hall, Hamilton, and Merrick Counties
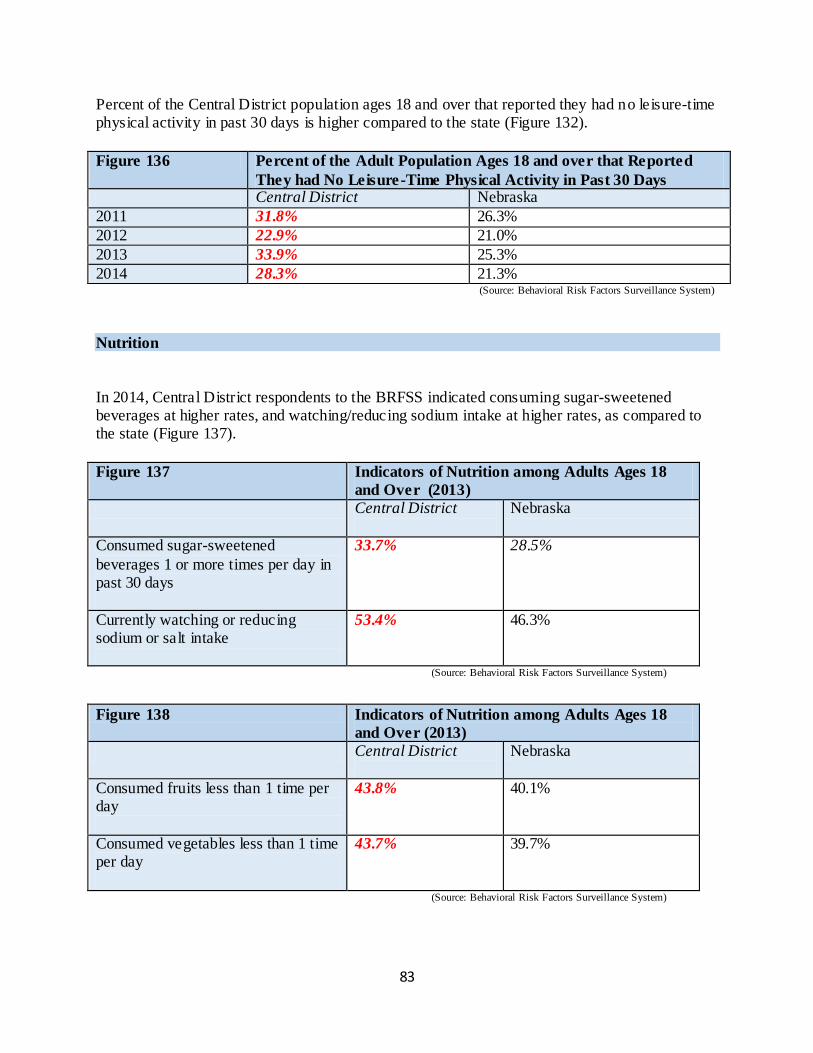
83
Percent of the Central District population ages 18 and over that reported they had no leisure-time physical activity in past 30 days is higher compared to the state (Figure 132).
Figure 136 Percent of the Adult Population Ages 18 and over that Reported
They had No Leisure-Time Physical Activity in Past 30 Days Central District Nebraska
2011 31.8% 26.3%
2012 22.9% 21.0%
2013 33.9% 25.3%
2014 28.3% 21.3% (Source: Behavioral Risk Factors Surveillance System)
Nutrition
In 2014, Central District respondents to the BRFSS indicated consuming sugar-sweetened beverages at higher rates, and watching/reducing sodium intake at higher rates, as compared to the state (Figure 137).
Figure 137 Indicators of Nutrition among Adults Ages 18
and Over (2013)
Central District
Nebraska
Consumed sugar-sweetened
beverages 1 or more times per day in past 30 days
33.7% 28.5%
Currently watching or reducing sodium or salt intake
53.4% 46.3%
(Source: Behavioral Risk Factors Surveillance System)
Figure 138 Indicators of Nutrition among Adults Ages 18
and Over (2013)
Central District
Nebraska
Consumed fruits less than 1 time per day
43.8% 40.1%
Consumed vegetables less than 1 time per day
43.7% 39.7%
(Source: Behavioral Risk Factors Surveillance System)
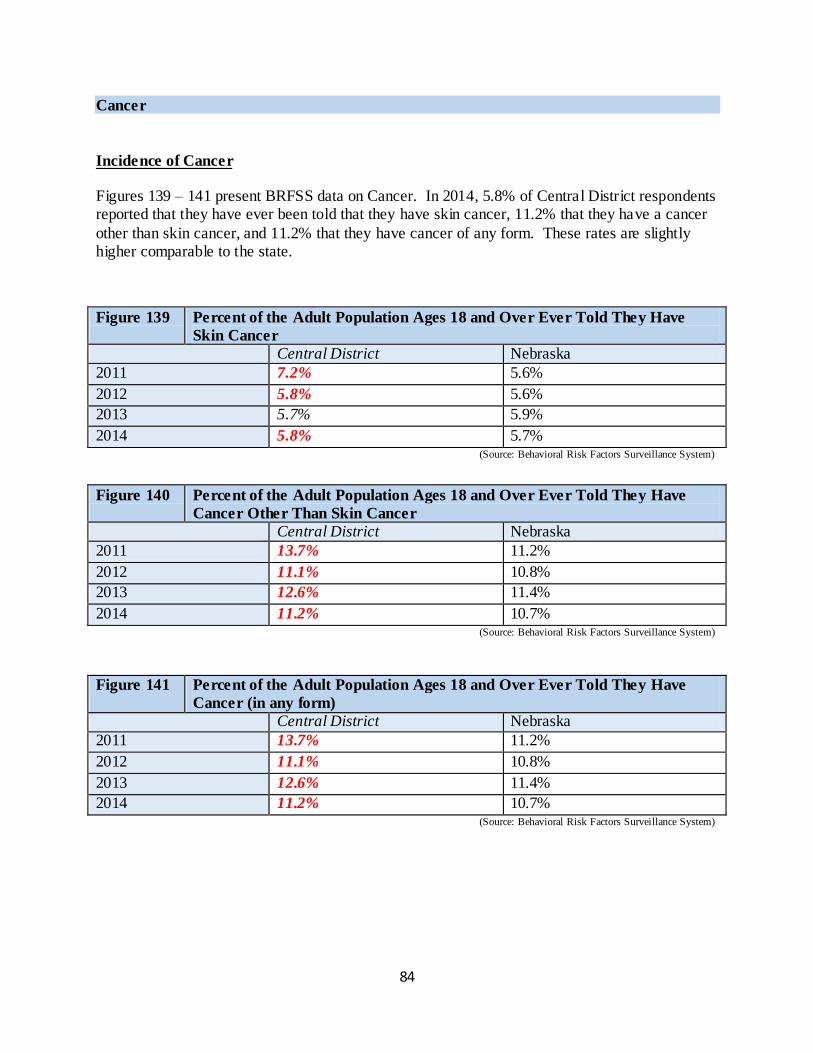
84
Cancer
Incidence of Cancer
Figures 139 – 141 present BRFSS data on Cancer. In 2014, 5.8% of Central District respondents reported that they have ever been told that they have skin cancer, 11.2% that they have a cancer
other than skin cancer, and 11.2% that they have cancer of any form. These rates are slightly higher comparable to the state.
Figure 139 Percent of the Adult Population Ages 18 and Over Ever Told They Have
Skin Cancer
Central District Nebraska
2011 7.2% 5.6%
2012 5.8% 5.6%
2013 5.7% 5.9%
2014 5.8% 5.7% (Source: Behavioral Risk Factors Surveillance System)
Figure 140 Percent of the Adult Population Ages 18 and Over Ever Told They Have
Cancer Other Than Skin Cancer
Central District Nebraska
2011 13.7% 11.2%
2012 11.1% 10.8%
2013 12.6% 11.4%
2014 11.2% 10.7% (Source: Behavioral Risk Factors Surveillance System)
Figure 141 Percent of the Adult Population Ages 18 and Over Ever Told They Have
Cancer (in any form)
Central District Nebraska
2011 13.7% 11.2%
2012 11.1% 10.8%
2013 12.6% 11.4%
2014 11.2% 10.7% (Source: Behavioral Risk Factors Surveillance System)
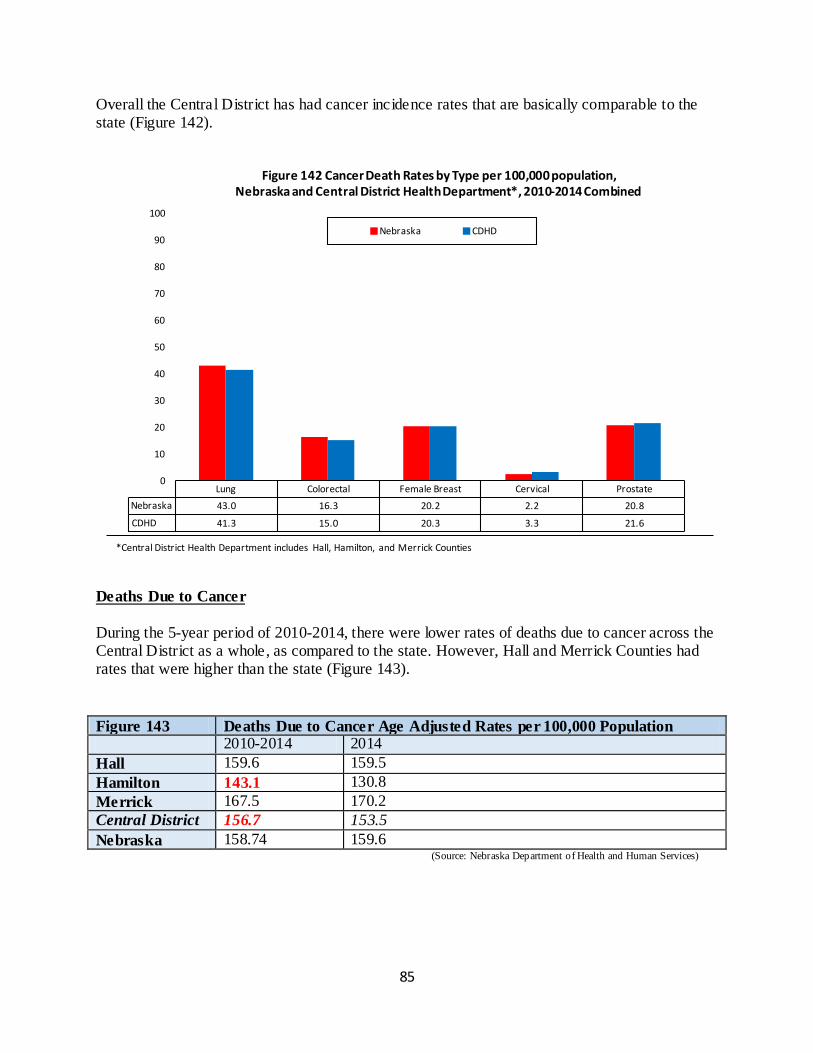
85
Overall the Central District has had cancer incidence rates that are basically comparable to the state (Figure 142).
Deaths Due to Cancer
During the 5-year period of 2010-2014, there were lower rates of deaths due to cancer across the Central District as a whole, as compared to the state. However, Hall and Merrick Counties had rates that were higher than the state (Figure 143).
Figure 143 Deaths Due to Cancer Age Adjusted Rates per 100,000 Population
2010-2014 2014
Hall 159.6 159.5
Hamilton 143.1 130.8
Merrick 167.5 170.2
Central District 156.7 153.5
Nebraska 158.74 159.6 (Source: Nebraska Department of Health and Human Services)
Lung Colorectal Female Breast Cervical Prostate
Nebraska 43.0 16.3 20.2 2.2 20.8
CDHD 41.3 15.0 20.3 3.3 21.6
0
10
20
30
40
50
60
70
80
90
100
Figure 142 Cancer Death Rates by Type per 100,000 population, Nebraska and Central District Health Department*, 2010-2014 Combined
Nebraska CDHD
*Central District Health Department includes Hall, Hamilton, and Merrick Counties
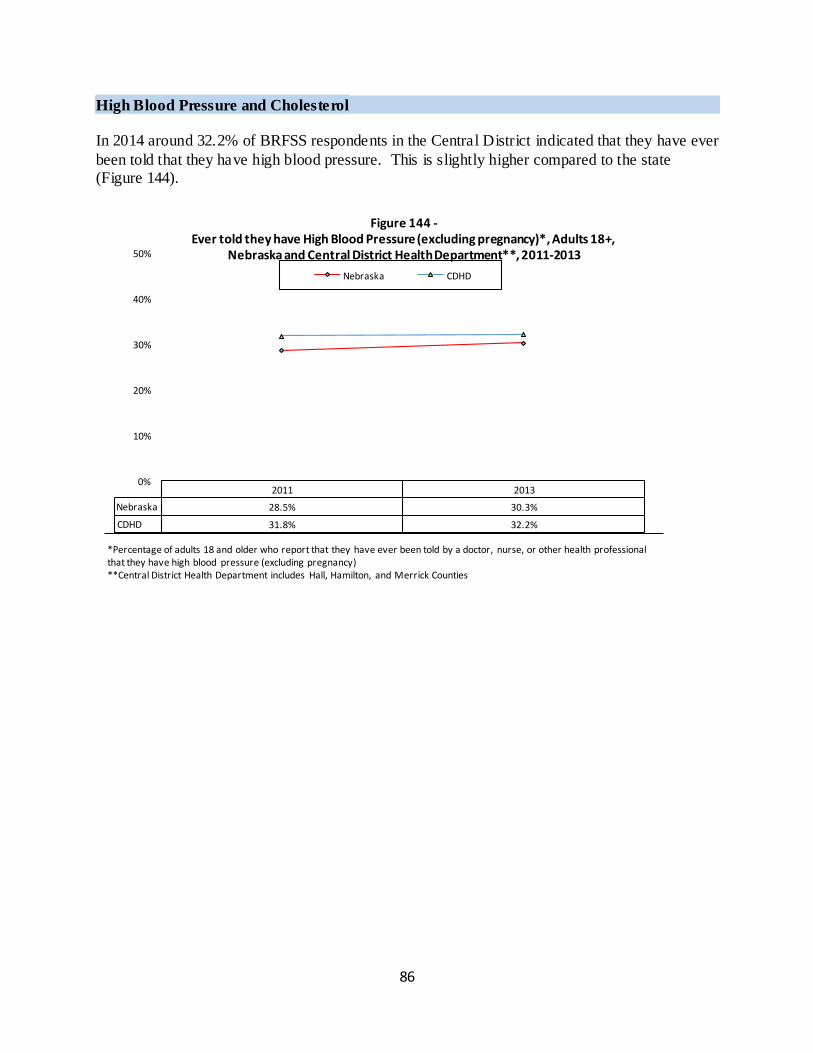
86
High Blood Pressure and Cholesterol
In 2014 around 32.2% of BRFSS respondents in the Central District indicated that they have ever
been told that they have high blood pressure. This is slightly higher compared to the state (Figure 144).
2011 2013
Nebraska 28.5% 30.3%
CDHD 31.8% 32.2%
0%
10%
20%
30%
40%
50%
Figure 144 - Ever told they have High Blood Pressure (excluding pregnancy)*, Adults 18+,
Nebraska and Central District Health Department**, 2011-2013
Nebraska CDHD
*Percentage of adults 18 and older who report that they have ever been told by a doctor, nurse, or other health professional that they have high blood pressure (excluding pregnancy) **Central District Health Department includes Hall, Hamilton, and Merrick Counties
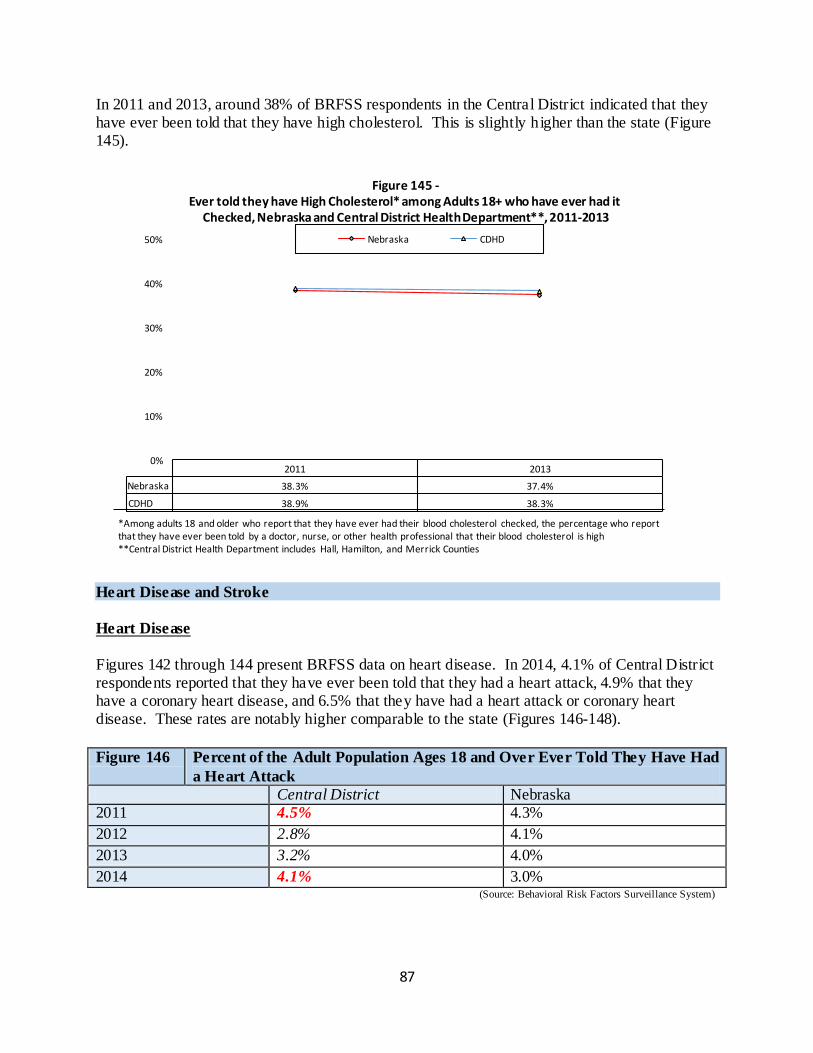
87
In 2011 and 2013, around 38% of BRFSS respondents in the Central District indicated that they have ever been told that they have high cholesterol. This is slightly higher than the state (Figure 145).
Heart Disease and Stroke
Heart Disease
Figures 142 through 144 present BRFSS data on heart disease. In 2014, 4.1% of Central District respondents reported that they have ever been told that they had a heart attack, 4.9% that they have a coronary heart disease, and 6.5% that they have had a heart attack or coronary heart disease. These rates are notably higher comparable to the state (Figures 146-148).
Figure 146 Percent of the Adult Population Ages 18 and Over Ever Told They Have Had
a Heart Attack
Central District Nebraska 2011 4.5% 4.3%
2012 2.8% 4.1%
2013 3.2% 4.0%
2014 4.1% 3.0% (Source: Behavioral Risk Factors Surveillance System)
2011 2013
Nebraska 38.3% 37.4%
CDHD 38.9% 38.3%
0%
10%
20%
30%
40%
50%
Figure 145 - Ever told they have High Cholesterol* among Adults 18+ who have ever had it
Checked, Nebraska and Central District Health Department**, 2011-2013
Nebraska CDHD
*Among adults 18 and older who report that they have ever had their blood cholesterol checked, the percentage who report that they have ever been told by a doctor, nurse, or other health professional that their blood cholesterol is high **Central District Health Department includes Hall, Hamilton, and Merrick Counties
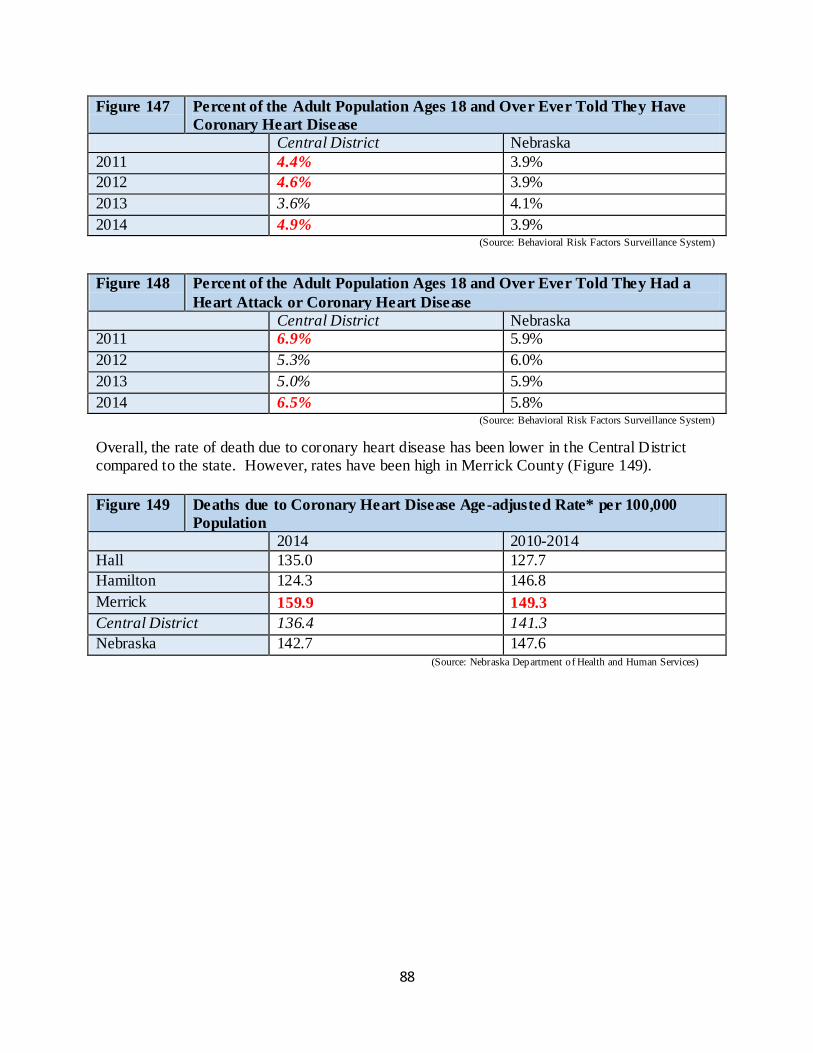
88
Figure 147 Percent of the Adult Population Ages 18 and Over Ever Told They Have
Coronary Heart Disease
Central District Nebraska
2011 4.4% 3.9%
2012 4.6% 3.9%
2013 3.6% 4.1%
2014 4.9% 3.9% (Source: Behavioral Risk Factors Surveillance System)
Figure 148 Percent of the Adult Population Ages 18 and Over Ever Told They Had a
Heart Attack or Coronary Heart Disease
Central District Nebraska 2011 6.9% 5.9%
2012 5.3% 6.0%
2013 5.0% 5.9%
2014 6.5% 5.8% (Source: Behavioral Risk Factors Surveillance System)
Overall, the rate of death due to coronary heart disease has been lower in the Central District compared to the state. However, rates have been high in Merrick County (Figure 149).
Figure 149 Deaths due to Coronary Heart Disease Age-adjusted Rate* per 100,000
Population
2014 2010-2014
Hall 135.0 127.7
Hamilton 124.3 146.8
Merrick 159.9 149.3
Central District 136.4 141.3
Nebraska 142.7 147.6 (Source: Nebraska Department of Health and Human Services)
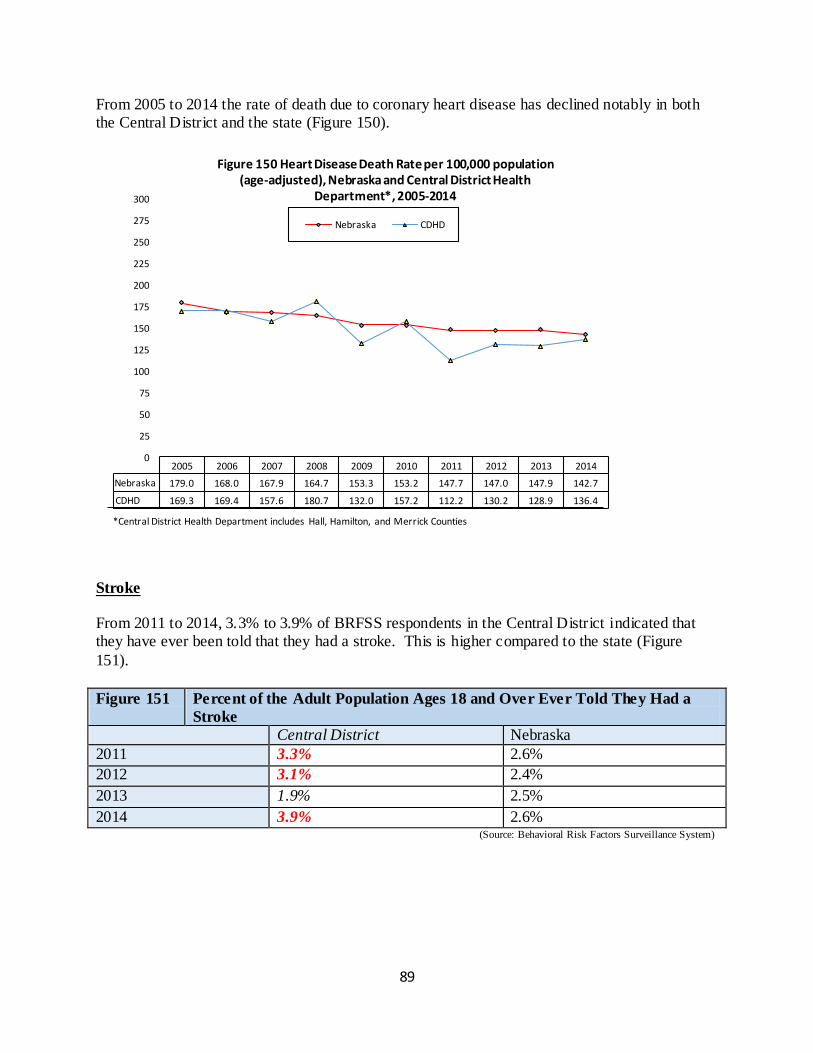
89
From 2005 to 2014 the rate of death due to coronary heart disease has declined notably in both the Central District and the state (Figure 150).
Stroke
From 2011 to 2014, 3.3% to 3.9% of BRFSS respondents in the Central District indicated that they have ever been told that they had a stroke. This is higher compared to the state (Figure
151).
Figure 151 Percent of the Adult Population Ages 18 and Over Ever Told They Had a
Stroke
Central District Nebraska
2011 3.3% 2.6%
2012 3.1% 2.4%
2013 1.9% 2.5%
2014 3.9% 2.6% (Source: Behavioral Risk Factors Surveillance System)
2005 2006 2007 2008 2009 2010 2011 2012 2013 2014
Nebraska 179.0 168.0 167.9 164.7 153.3 153.2 147.7 147.0 147.9 142.7
CDHD 169.3 169.4 157.6 180.7 132.0 157.2 112.2 130.2 128.9 136.4
0
25
50
75
100
125
150
175
200
225
250
275
300
Figure 150 Heart Disease Death Rate per 100,000 population (age-adjusted), Nebraska and Central District Health
Department*, 2005-2014
Nebraska CDHD
*Central District Health Department includes Hall, Hamilton, and Merrick Counties
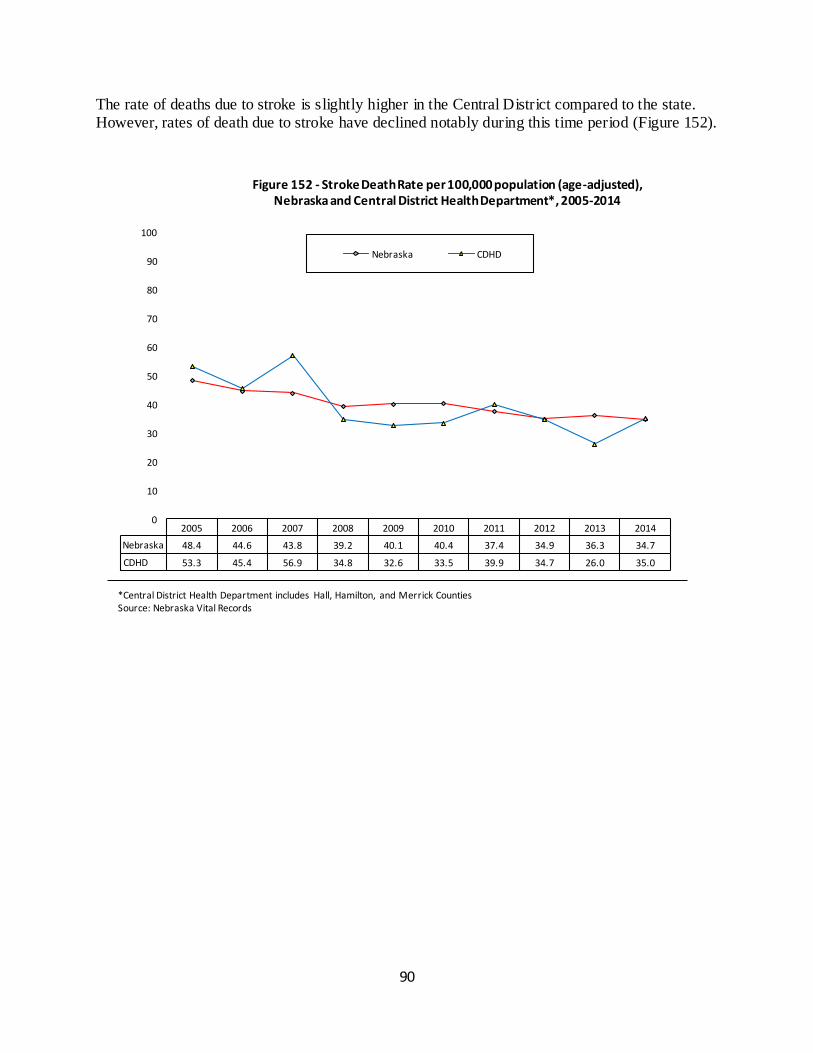
90
The rate of deaths due to stroke is slightly higher in the Central District compared to the state. However, rates of death due to stroke have declined notably during this time period (Figure 152).
2005 2006 2007 2008 2009 2010 2011 2012 2013 2014
Nebraska 48.4 44.6 43.8 39.2 40.1 40.4 37.4 34.9 36.3 34.7
CDHD 53.3 45.4 56.9 34.8 32.6 33.5 39.9 34.7 26.0 35.0
0
10
20
30
40
50
60
70
80
90
100
Figure 152 - Stroke Death Rate per 100,000 population (age-adjusted), Nebraska and Central District Health Department*, 2005-2014
Nebraska CDHD
*Central District Health Department includes Hall, Hamilton, and Merrick Counties Source: Nebraska Vital Records
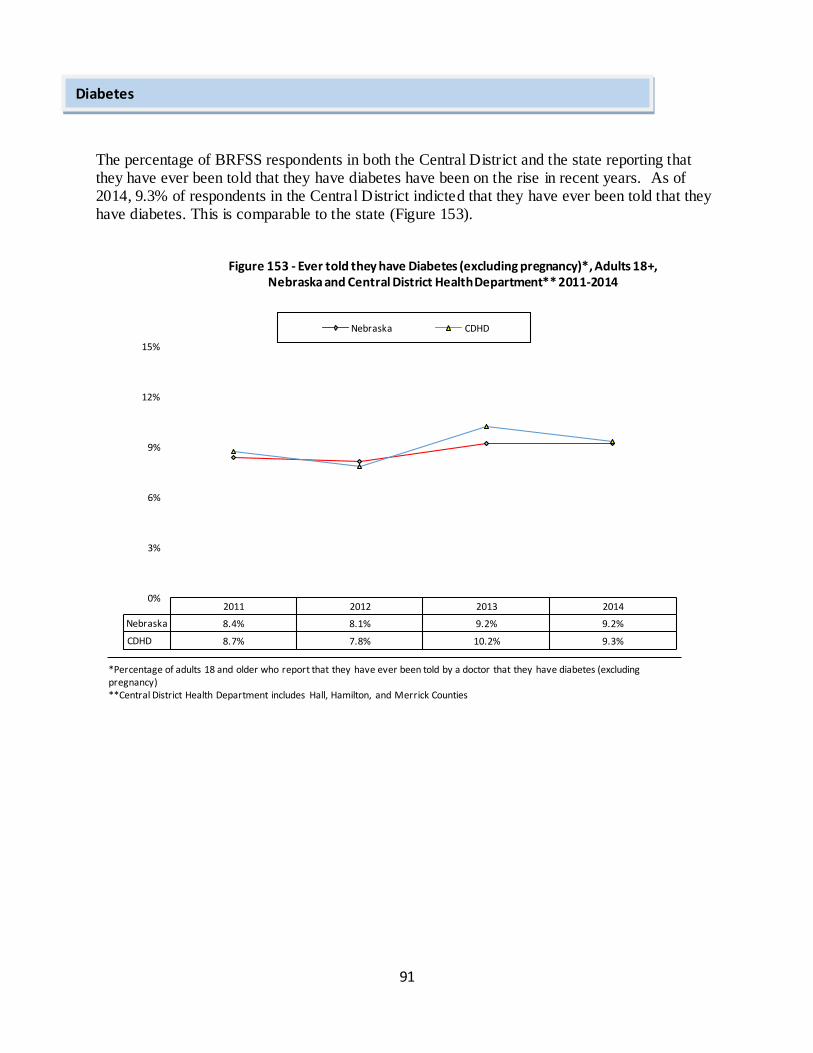
91
The percentage of BRFSS respondents in both the Central District and the state reporting that they have ever been told that they have diabetes have been on the rise in recent years. As of 2014, 9.3% of respondents in the Central District indicted that they have ever been told that they have diabetes. This is comparable to the state (Figure 153).
2011 2012 2013 2014
Nebraska 8.4% 8.1% 9.2% 9.2%
CDHD 8.7% 7.8% 10.2% 9.3%
0%
3%
6%
9%
12%
15%
Figure 153 - Ever told they have Diabetes (excluding pregnancy)*, Adults 18+, Nebraska and Central District Health Department** 2011-2014
Nebraska CDHD
*Percentage of adults 18 and older who report that they have ever been told by a doctor that they have diabetes (excluding pregnancy) **Central District Health Department includes Hall, Hamilton, and Merrick Counties
Diabetes
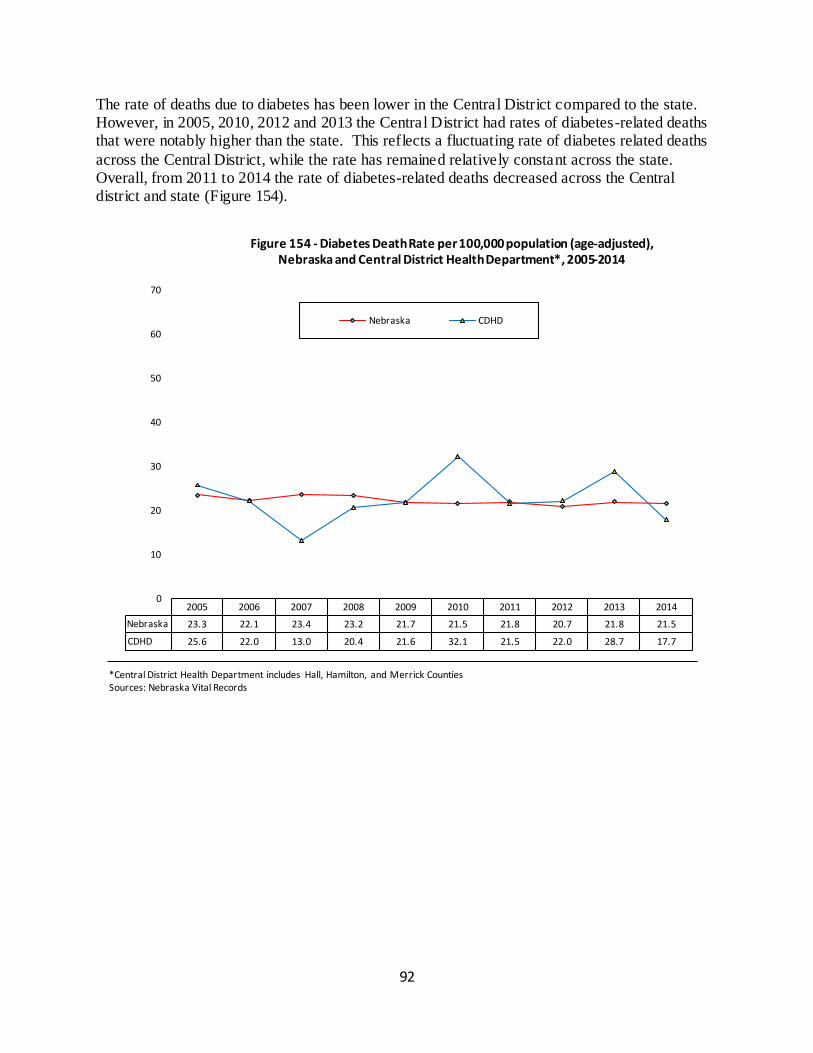
92
The rate of deaths due to diabetes has been lower in the Central District compared to the state. However, in 2005, 2010, 2012 and 2013 the Central District had rates of diabetes-related deaths that were notably higher than the state. This reflects a fluctuating rate of diabetes related deaths
across the Central District, while the rate has remained relatively constant across the state. Overall, from 2011 to 2014 the rate of diabetes-related deaths decreased across the Central district and state (Figure 154).
2005 2006 2007 2008 2009 2010 2011 2012 2013 2014
Nebraska 23.3 22.1 23.4 23.2 21.7 21.5 21.8 20.7 21.8 21.5
CDHD 25.6 22.0 13.0 20.4 21.6 32.1 21.5 22.0 28.7 17.7
0
10
20
30
40
50
60
70
Figure 154 - Diabetes Death Rate per 100,000 population (age-adjusted), Nebraska and Central District Health Department*, 2005-2014
Nebraska CDHD
*Central District Health Department includes Hall, Hamilton, and Merrick Counties Sources: Nebraska Vital Records
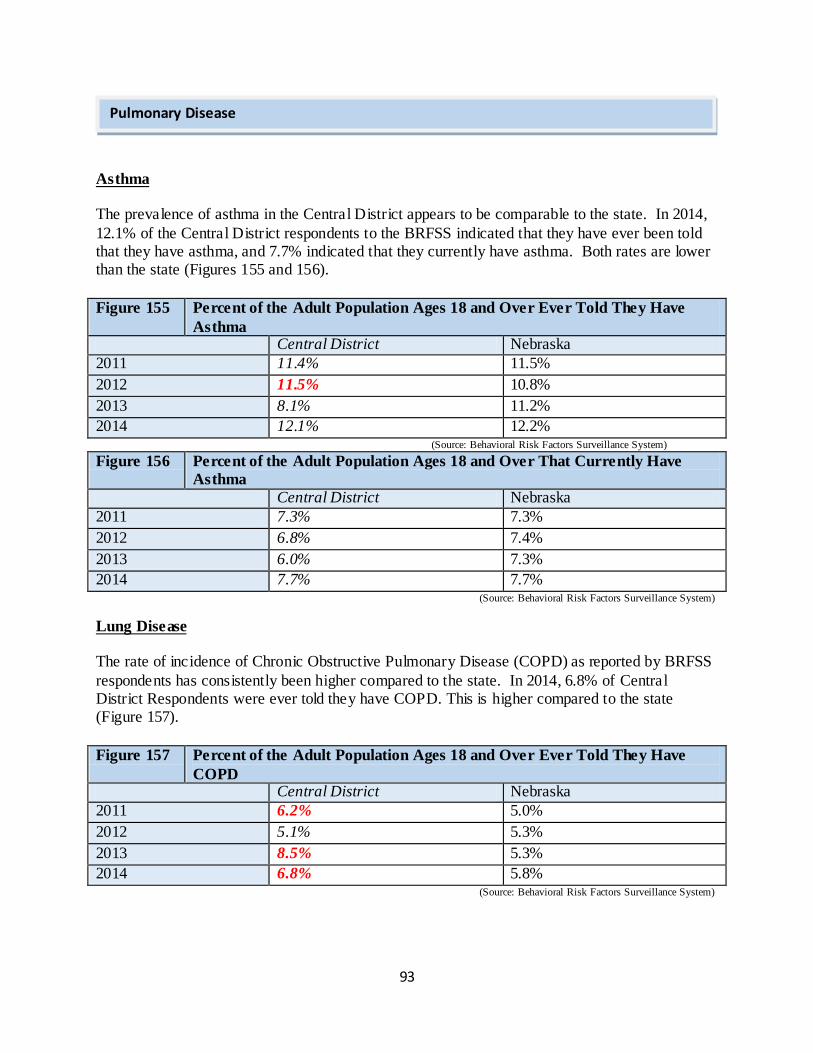
93
Asthma
The prevalence of asthma in the Central District appears to be comparable to the state. In 2014,
12.1% of the Central District respondents to the BRFSS indicated that they have ever been told that they have asthma, and 7.7% indicated that they currently have asthma. Both rates are lower than the state (Figures 155 and 156).
Figure 155 Percent of the Adult Population Ages 18 and Over Ever Told They Have
Asthma Central District Nebraska
2011 11.4% 11.5%
2012 11.5% 10.8%
2013 8.1% 11.2%
2014 12.1% 12.2% (Source: Behavioral Risk Factors Surveillance System)
Figure 156 Percent of the Adult Population Ages 18 and Over That Currently Have
Asthma
Central District Nebraska
2011 7.3% 7.3%
2012 6.8% 7.4%
2013 6.0% 7.3%
2014 7.7% 7.7% (Source: Behavioral Risk Factors Surveillance System)
Lung Disease
The rate of incidence of Chronic Obstructive Pulmonary Disease (COPD) as reported by BRFSS
respondents has consistently been higher compared to the state. In 2014, 6.8% of Central District Respondents were ever told they have COPD. This is higher compared to the state (Figure 157).
Figure 157 Percent of the Adult Population Ages 18 and Over Ever Told They Have
COPD Central District Nebraska
2011 6.2% 5.0%
2012 5.1% 5.3%
2013 8.5% 5.3%
2014 6.8% 5.8% (Source: Behavioral Risk Factors Surveillance System)
Pulmonary Disease
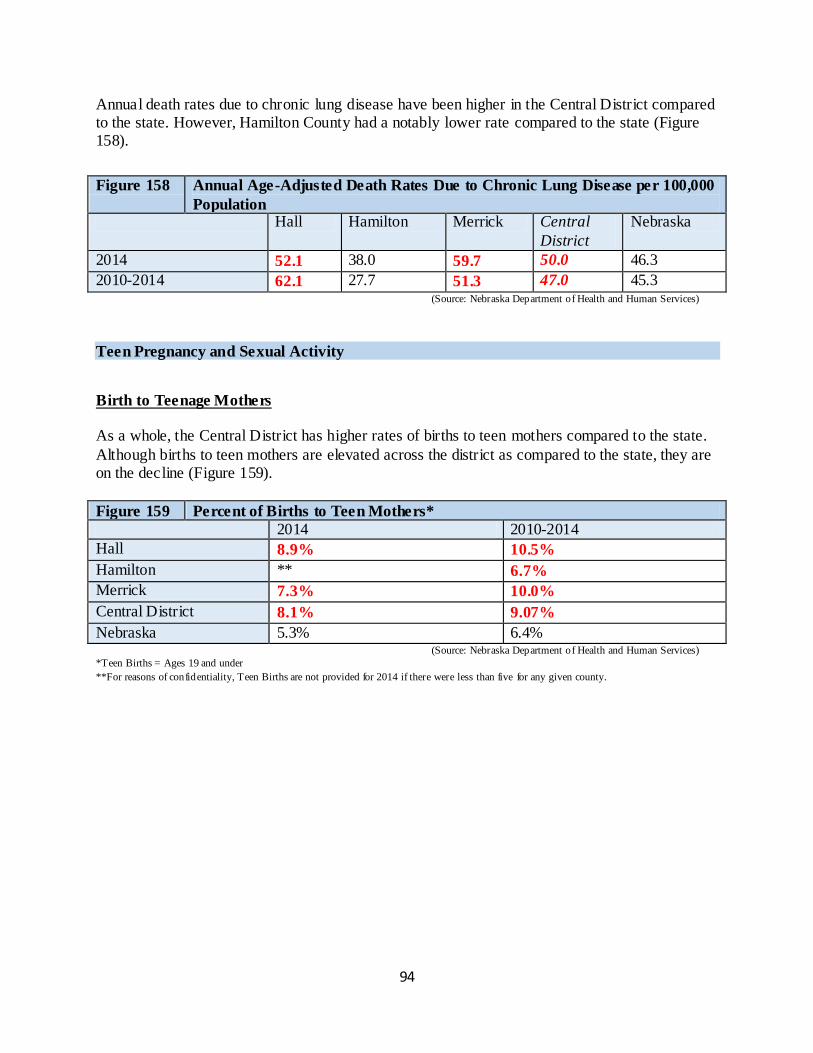
94
Annual death rates due to chronic lung disease have been higher in the Central District compared to the state. However, Hamilton County had a notably lower rate compared to the state (Figure 158).
Figure 158 Annual Age-Adjusted Death Rates Due to Chronic Lung Disease per 100,000
Population Hall Hamilton Merrick Central
District
Nebraska
2014 52.1 38.0 59.7 50.0 46.3
2010-2014 62.1 27.7 51.3 47.0 45.3 (Source: Nebraska Department of Health and Human Services)
Teen Pregnancy and Sexual Activity
Birth to Teenage Mothers
As a whole, the Central District has higher rates of births to teen mothers compared to the state.
Although births to teen mothers are elevated across the district as compared to the state, they are on the decline (Figure 159).
Figure 159 Percent of Births to Teen Mothers*
2014 2010-2014
Hall 8.9% 10.5%
Hamilton ** 6.7%
Merrick 7.3% 10.0%
Central District 8.1% 9.07%
Nebraska 5.3% 6.4% (Source: Nebraska Department of Health and Human Services)
*Teen Births = Ages 19 and under
**For reasons of confidentiality, Teen Births are not provided for 2014 if there were less than five for any given county.
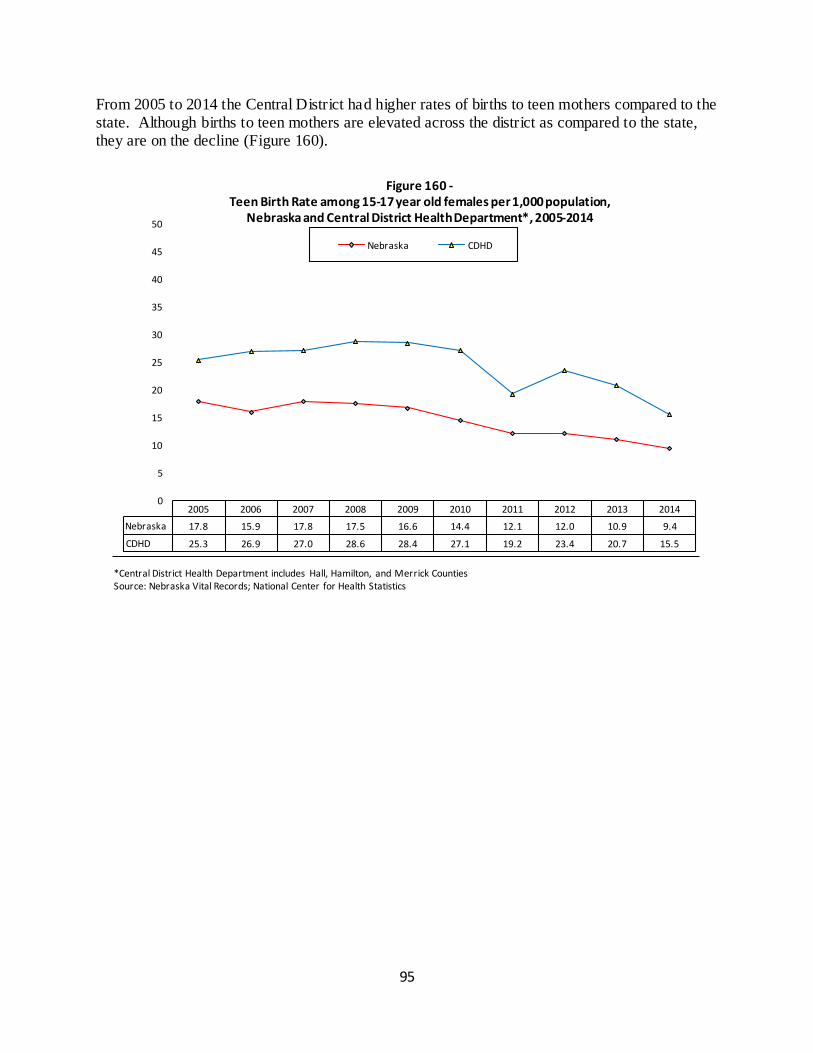
95
From 2005 to 2014 the Central District had higher rates of births to teen mothers compared to the state. Although births to teen mothers are elevated across the district as compared to the state, they are on the decline (Figure 160).
2005 2006 2007 2008 2009 2010 2011 2012 2013 2014
Nebraska 17.8 15.9 17.8 17.5 16.6 14.4 12.1 12.0 10.9 9.4
CDHD 25.3 26.9 27.0 28.6 28.4 27.1 19.2 23.4 20.7 15.5
0
5
10
15
20
25
30
35
40
45
50
Figure 160 - Teen Birth Rate among 15-17 year old females per 1,000 population,
Nebraska and Central District Health Department*, 2005-2014
Nebraska CDHD
*Central District Health Department includes Hall, Hamilton, and Merrick Counties Source: Nebraska Vital Records; National Center for Health Statistics
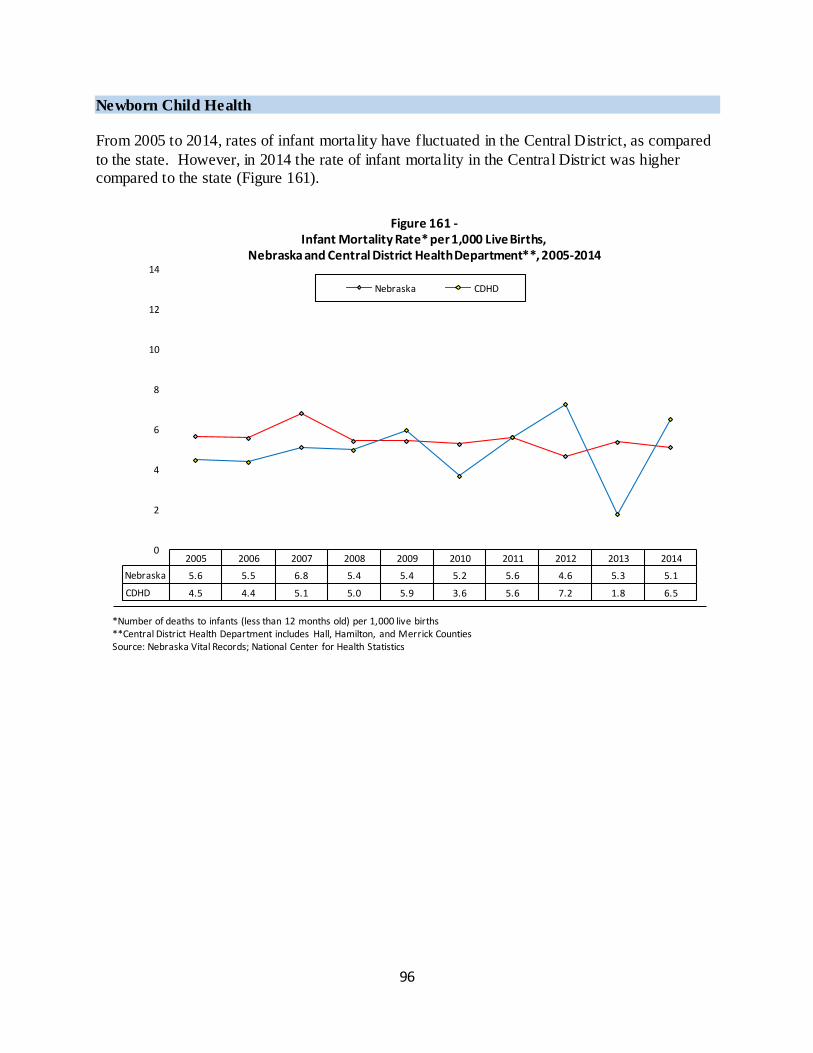
96
Newborn Child Health From 2005 to 2014, rates of infant mortality have fluctuated in the Central District, as compared
to the state. However, in 2014 the rate of infant mortality in the Central District was higher compared to the state (Figure 161).
2005 2006 2007 2008 2009 2010 2011 2012 2013 2014
Nebraska 5.6 5.5 6.8 5.4 5.4 5.2 5.6 4.6 5.3 5.1
CDHD 4.5 4.4 5.1 5.0 5.9 3.6 5.6 7.2 1.8 6.5
0
2
4
6
8
10
12
14
Figure 161 - Infant Mortality Rate* per 1,000 Live Births,
Nebraska and Central District Health Department**, 2005-2014
Nebraska CDHD
*Number of deaths to infants (less than 12 months old) per 1,000 live births **Central District Health Department includes Hall, Hamilton, and Merrick Counties Source: Nebraska Vital Records; National Center for Health Statistics
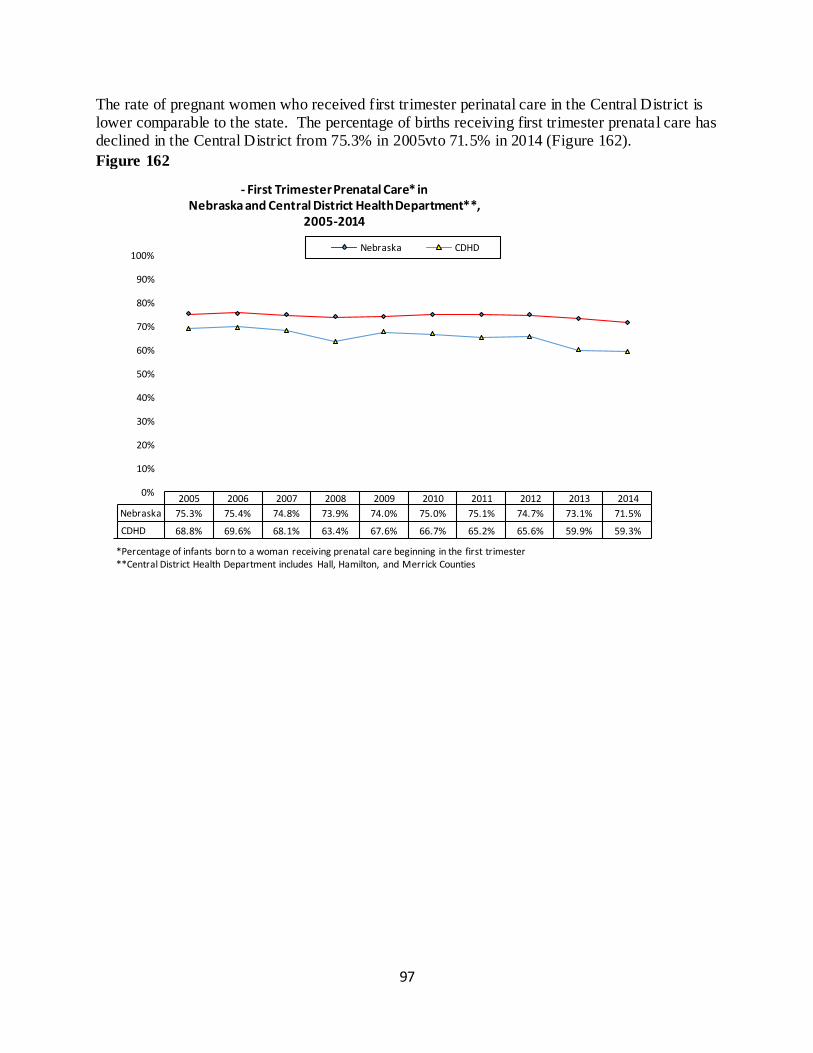
97
The rate of pregnant women who received first trimester perinatal care in the Central District is lower comparable to the state. The percentage of births receiving first trimester prenatal care has declined in the Central District from 75.3% in 2005vto 71.5% in 2014 (Figure 162).
Figure 162
2005 2006 2007 2008 2009 2010 2011 2012 2013 2014
Nebraska 75.3% 75.4% 74.8% 73.9% 74.0% 75.0% 75.1% 74.7% 73.1% 71.5%
CDHD 68.8% 69.6% 68.1% 63.4% 67.6% 66.7% 65.2% 65.6% 59.9% 59.3%
0%
10%
20%
30%
40%
50%
60%
70%
80%
90%
100%
- First Trimester Prenatal Care* in Nebraska and Central District Health Department**,
2005-2014
Nebraska CDHD
*Percentage of infants born to a woman receiving prenatal care beginning in the first trimester **Central District Health Department includes Hall, Hamilton, and Merrick Counties
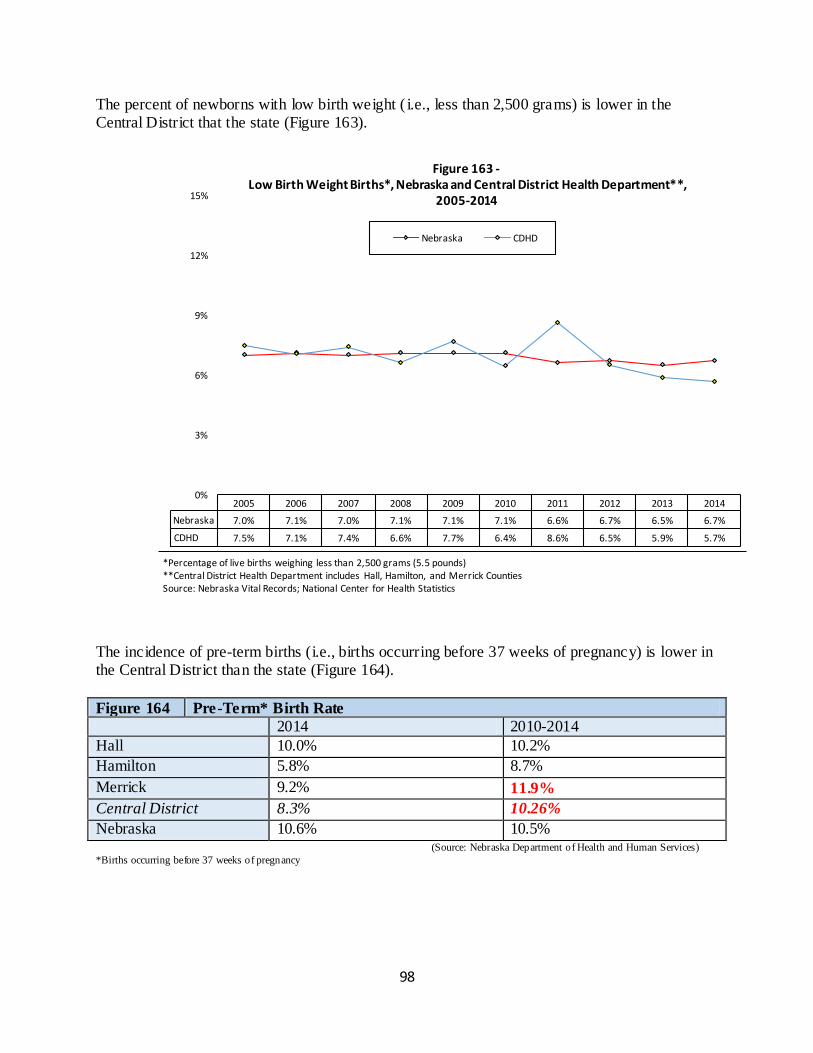
98
The percent of newborns with low birth weight ( i.e., less than 2,500 grams) is lower in the Central District that the state (Figure 163).
The incidence of pre-term births (i.e., births occurring before 37 weeks of pregnancy) is lower in the Central District than the state (Figure 164).
Figure 164 Pre-Term* Birth Rate
2014 2010-2014
Hall 10.0% 10.2%
Hamilton 5.8% 8.7%
Merrick 9.2% 11.9%
Central District 8.3% 10.26%
Nebraska 10.6% 10.5% (Source: Nebraska Department of Health and Human Services)
*Births occurring before 37 weeks of pregnancy
2005 2006 2007 2008 2009 2010 2011 2012 2013 2014
Nebraska 7.0% 7.1% 7.0% 7.1% 7.1% 7.1% 6.6% 6.7% 6.5% 6.7%
CDHD 7.5% 7.1% 7.4% 6.6% 7.7% 6.4% 8.6% 6.5% 5.9% 5.7%
0%
3%
6%
9%
12%
15%
Figure 163 - Low Birth Weight Births*, Nebraska and Central District Health Department**,
2005-2014
Nebraska CDHD
*Percentage of live births weighing less than 2,500 grams (5.5 pounds) **Central District Health Department includes Hall, Hamilton, and Merrick Counties Source: Nebraska Vital Records; National Center for Health Statistics
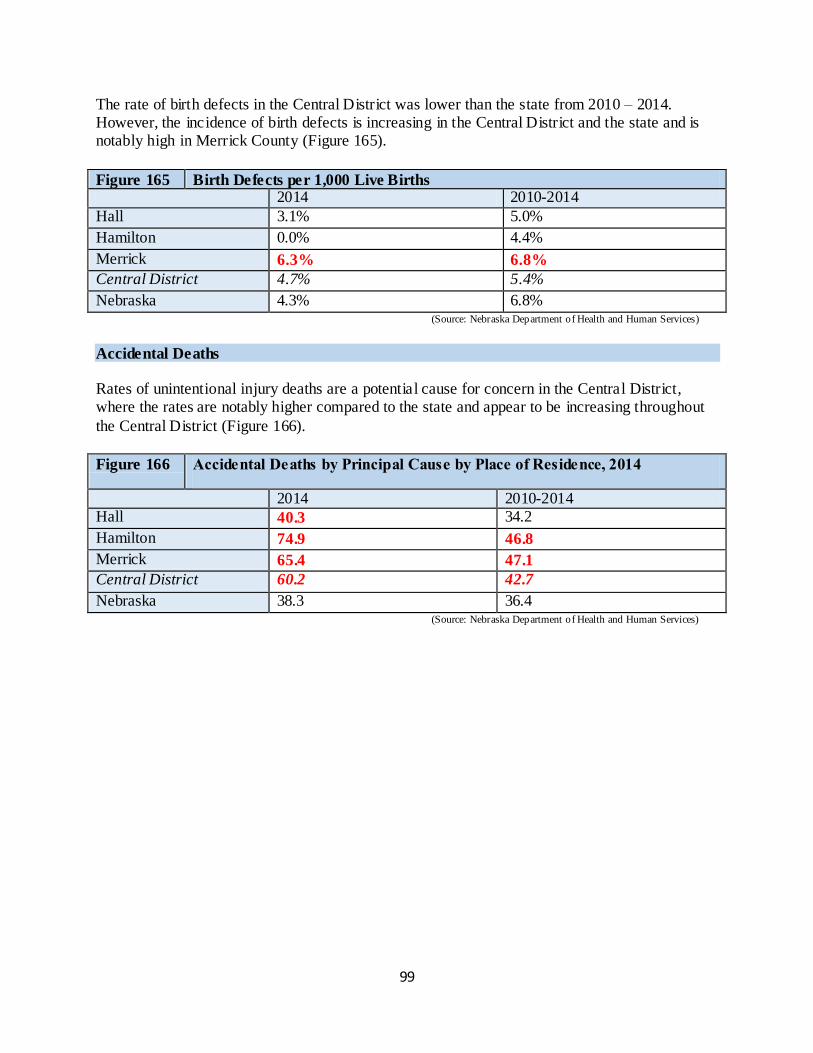
99
The rate of birth defects in the Central District was lower than the state from 2010 – 2014. However, the incidence of birth defects is increasing in the Central District and the state and is notably high in Merrick County (Figure 165).
Figure 165 Birth Defects per 1,000 Live Births 2014 2010-2014
Hall 3.1% 5.0%
Hamilton 0.0% 4.4%
Merrick 6.3% 6.8%
Central District 4.7% 5.4%
Nebraska 4.3% 6.8% (Source: Nebraska Department of Health and Human Services)
Accidental Deaths Rates of unintentional injury deaths are a potential cause for concern in the Central District, where the rates are notably higher compared to the state and appear to be increasing throughout
the Central District (Figure 166).
Figure 166 Accidental Deaths by Principal Cause by Place of Residence, 2014
2014 2010-2014 Hall 40.3 34.2
Hamilton 74.9 46.8
Merrick 65.4 47.1
Central District 60.2 42.7
Nebraska 38.3 36.4 (Source: Nebraska Department of Health and Human Services)
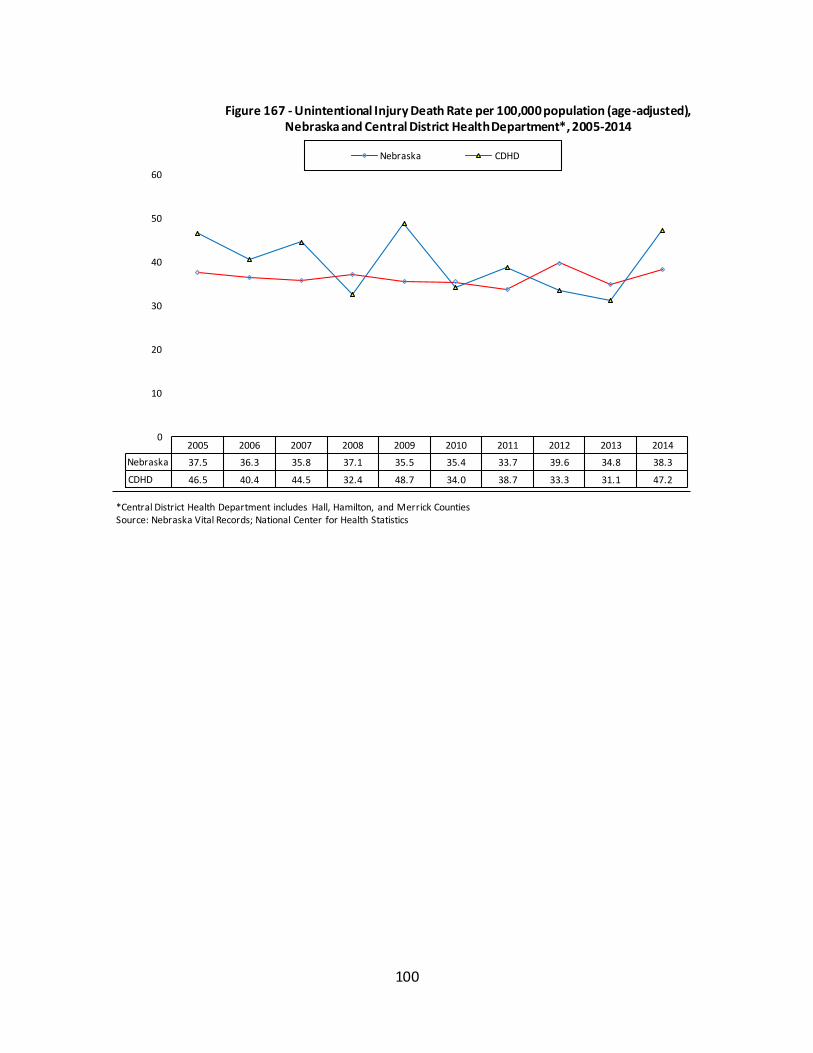
100
2005 2006 2007 2008 2009 2010 2011 2012 2013 2014
Nebraska 37.5 36.3 35.8 37.1 35.5 35.4 33.7 39.6 34.8 38.3
CDHD 46.5 40.4 44.5 32.4 48.7 34.0 38.7 33.3 31.1 47.2
0
10
20
30
40
50
60
Figure 167 - Unintentional Injury Death Rate per 100,000 population (age-adjusted), Nebraska and Central District Health Department*, 2005-2014
Nebraska CDHD
*Central District Health Department includes Hall, Hamilton, and Merrick Counties Source: Nebraska Vital Records; National Center for Health Statistics
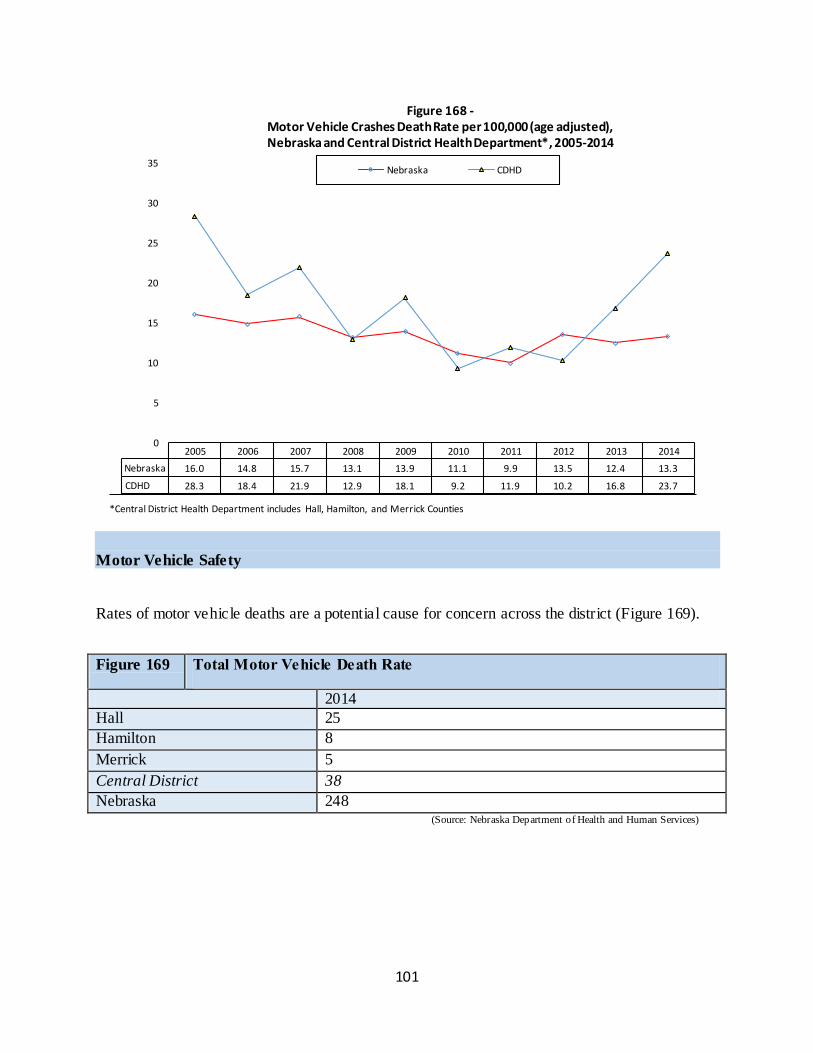
101
Motor Vehicle Safety Rates of motor vehicle deaths are a potential cause for concern across the district (Figure 169).
Figure 169 Total Motor Vehicle Death Rate
2014
Hall 25
Hamilton 8
Merrick 5
Central District 38
Nebraska 248 (Source: Nebraska Department of Health and Human Services)
2005 2006 2007 2008 2009 2010 2011 2012 2013 2014
Nebraska 16.0 14.8 15.7 13.1 13.9 11.1 9.9 13.5 12.4 13.3
CDHD 28.3 18.4 21.9 12.9 18.1 9.2 11.9 10.2 16.8 23.7
0
5
10
15
20
25
30
35
Figure 168 - Motor Vehicle Crashes Death Rate per 100,000 (age adjusted), Nebraska and Central District Health Department*, 2005-2014
Nebraska CDHD
*Central District Health Department includes Hall, Hamilton, and Merrick Counties
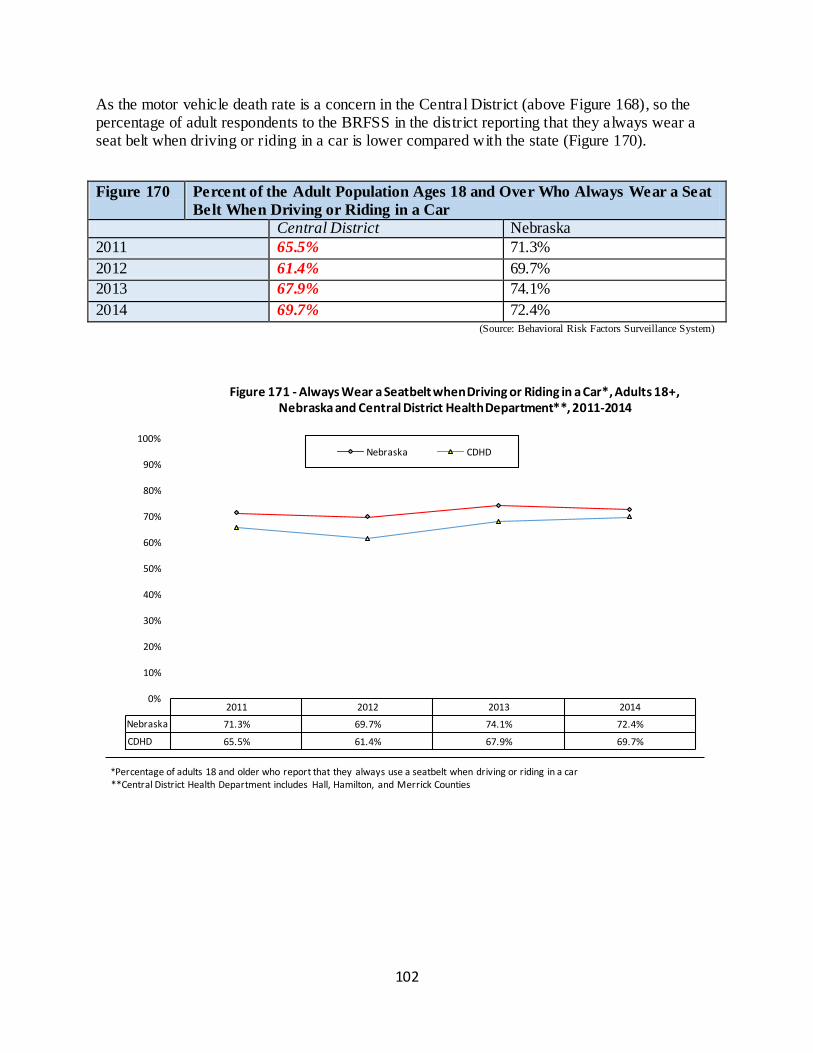
102
As the motor vehicle death rate is a concern in the Central District (above Figure 168), so the percentage of adult respondents to the BRFSS in the district reporting that they always wear a seat belt when driving or riding in a car is lower compared with the state (Figure 170).
Figure 170 Percent of the Adult Population Ages 18 and Over Who Always Wear a Seat
Belt When Driving or Riding in a Car
Central District Nebraska
2011 65.5% 71.3%
2012 61.4% 69.7%
2013 67.9% 74.1%
2014 69.7% 72.4% (Source: Behavioral Risk Factors Surveillance System)
2011 2012 2013 2014
Nebraska 71.3% 69.7% 74.1% 72.4%
CDHD 65.5% 61.4% 67.9% 69.7%
0%
10%
20%
30%
40%
50%
60%
70%
80%
90%
100%
Figure 171 - Always Wear a Seatbelt when Driving or Riding in a Car*, Adults 18+, Nebraska and Central District Health Department**, 2011-2014
Nebraska CDHD
*Percentage of adults 18 and older who report that they always use a seatbelt when driving or riding in a car **Central District Health Department includes Hall, Hamilton, and Merrick Counties
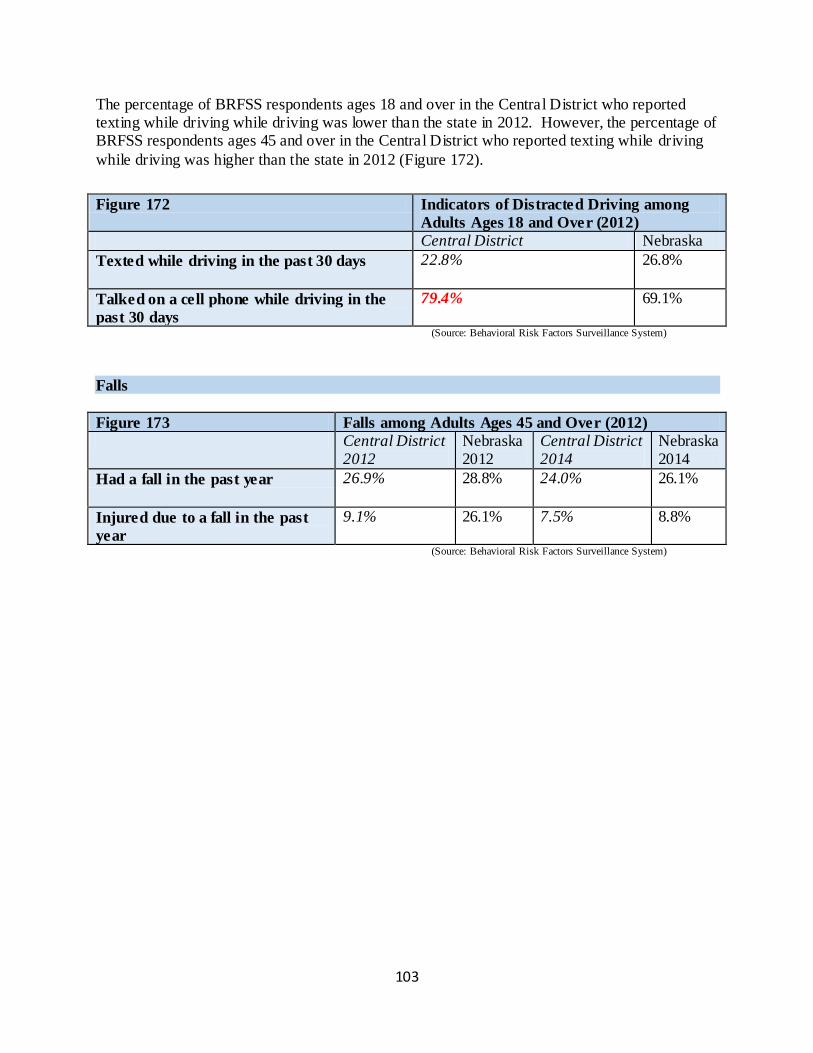
103
The percentage of BRFSS respondents ages 18 and over in the Central District who reported texting while driving while driving was lower than the state in 2012. However, the percentage of BRFSS respondents ages 45 and over in the Central District who reported texting while driving
while driving was higher than the state in 2012 (Figure 172).
Figure 172 Indicators of Distracted Driving among
Adults Ages 18 and Over (2012)
Central District Nebraska
Texted while driving in the past 30 days 22.8% 26.8%
Talked on a cell phone while driving in the
past 30 days
79.4% 69.1%
(Source: Behavioral Risk Factors Surveillance System)
Falls
Figure 173 Falls among Adults Ages 45 and Over (2012)
Central District 2012
Nebraska 2012
Central District 2014
Nebraska 2014
Had a fall in the past year 26.9% 28.8% 24.0% 26.1%
Injured due to a fall in the past
year
9.1% 26.1% 7.5% 8.8%
(Source: Behavioral Risk Factors Surveillance System)
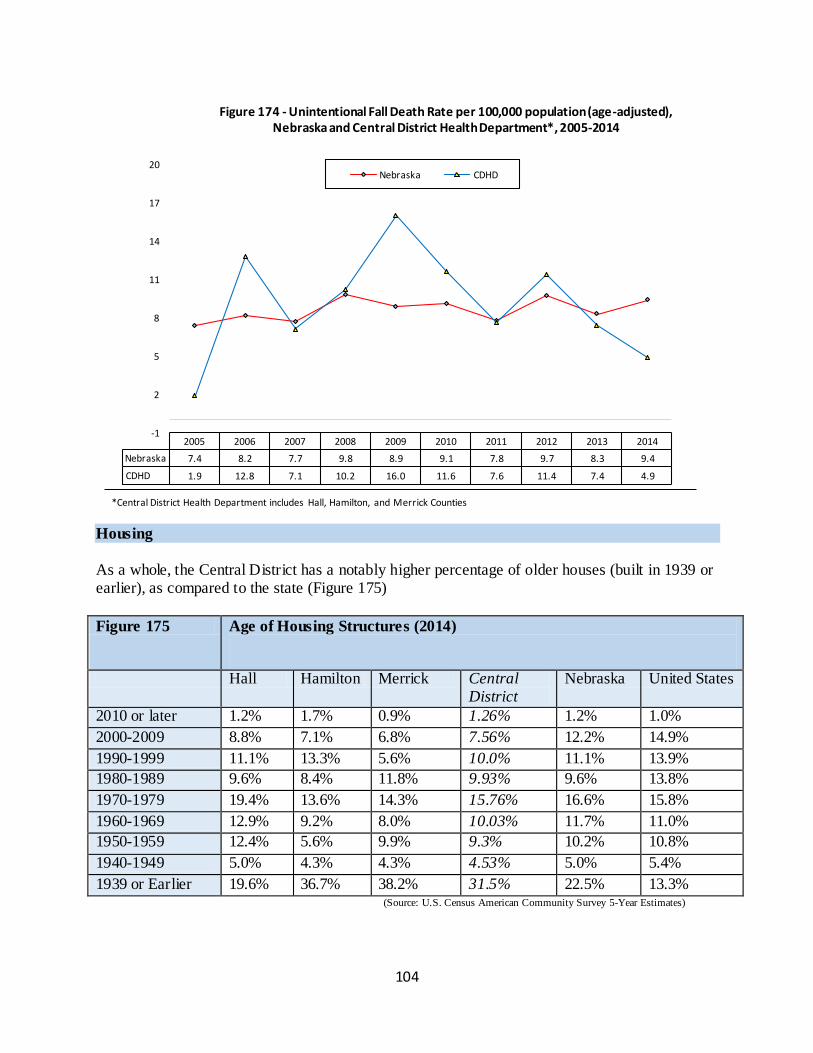
104
Housing
As a whole, the Central District has a notably higher percentage of older houses (built in 1939 or earlier), as compared to the state (Figure 175)
Figure 175 Age of Housing Structures (2014)
Hall Hamilton Merrick Central District
Nebraska United States
2010 or later 1.2% 1.7% 0.9% 1.26% 1.2% 1.0%
2000-2009 8.8% 7.1% 6.8% 7.56% 12.2% 14.9%
1990-1999 11.1% 13.3% 5.6% 10.0% 11.1% 13.9%
1980-1989 9.6% 8.4% 11.8% 9.93% 9.6% 13.8%
1970-1979 19.4% 13.6% 14.3% 15.76% 16.6% 15.8%
1960-1969 12.9% 9.2% 8.0% 10.03% 11.7% 11.0%
1950-1959 12.4% 5.6% 9.9% 9.3% 10.2% 10.8%
1940-1949 5.0% 4.3% 4.3% 4.53% 5.0% 5.4%
1939 or Earlier 19.6% 36.7% 38.2% 31.5% 22.5% 13.3% (Source: U.S. Census American Community Survey 5-Year Estimates)
2005 2006 2007 2008 2009 2010 2011 2012 2013 2014
Nebraska 7.4 8.2 7.7 9.8 8.9 9.1 7.8 9.7 8.3 9.4
CDHD 1.9 12.8 7.1 10.2 16.0 11.6 7.6 11.4 7.4 4.9
-1
2
5
8
11
14
17
20
Figure 174 - Unintentional Fall Death Rate per 100,000 population (age-adjusted), Nebraska and Central District Health Department*, 2005-2014
Nebraska CDHD
*Central District Health Department includes Hall, Hamilton, and Merrick Counties
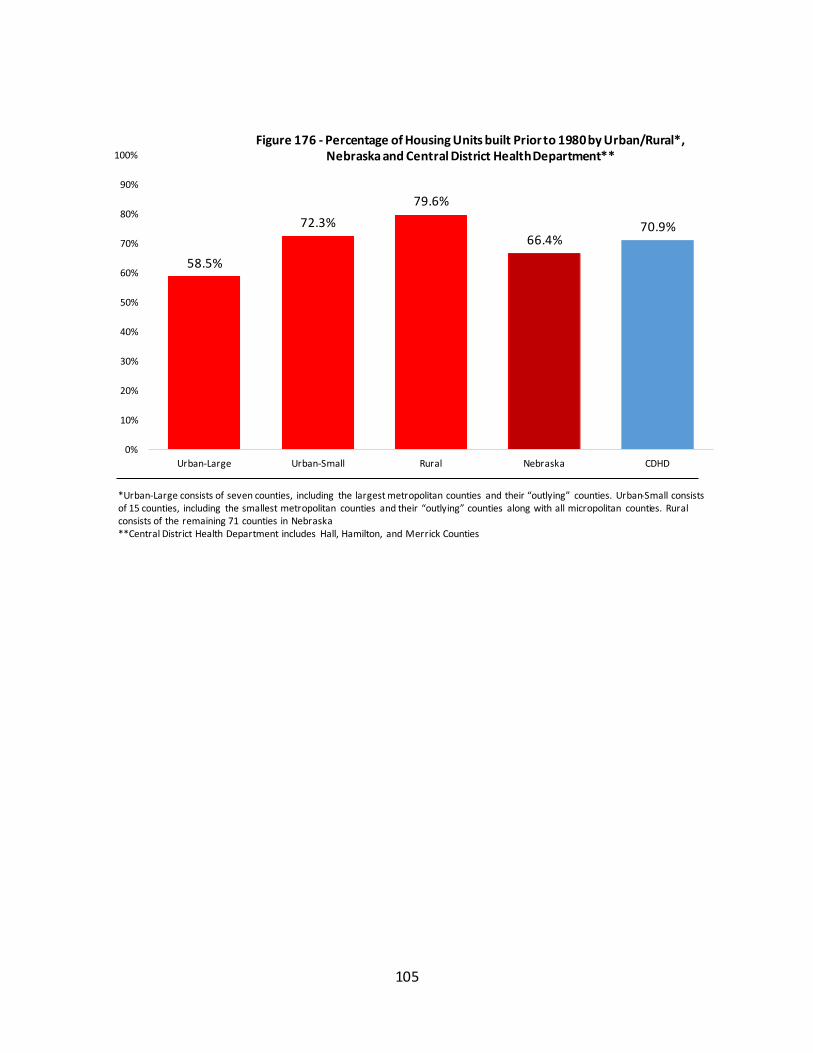
105
58.5%
72.3%
79.6%
66.4% 70.9%
0%
10%
20%
30%
40%
50%
60%
70%
80%
90%
100%
Urban-Large Urban-Small Rural Nebraska CDHD
Figure 176 - Percentage of Housing Units built Prior to 1980 by Urban/Rural*, Nebraska and Central District Health Department**
*Urban-Large consists of seven counties, including the largest metropolitan counties and their “outlying” counties. Urban-Small consists of 15 counties, including the smallest metropolitan counties and their “outlying” counties along with all micropolitan counties. Rural consists of the remaining 71 counties in Nebraska **Central District Health Department includes Hall, Hamilton, and Merrick Counties
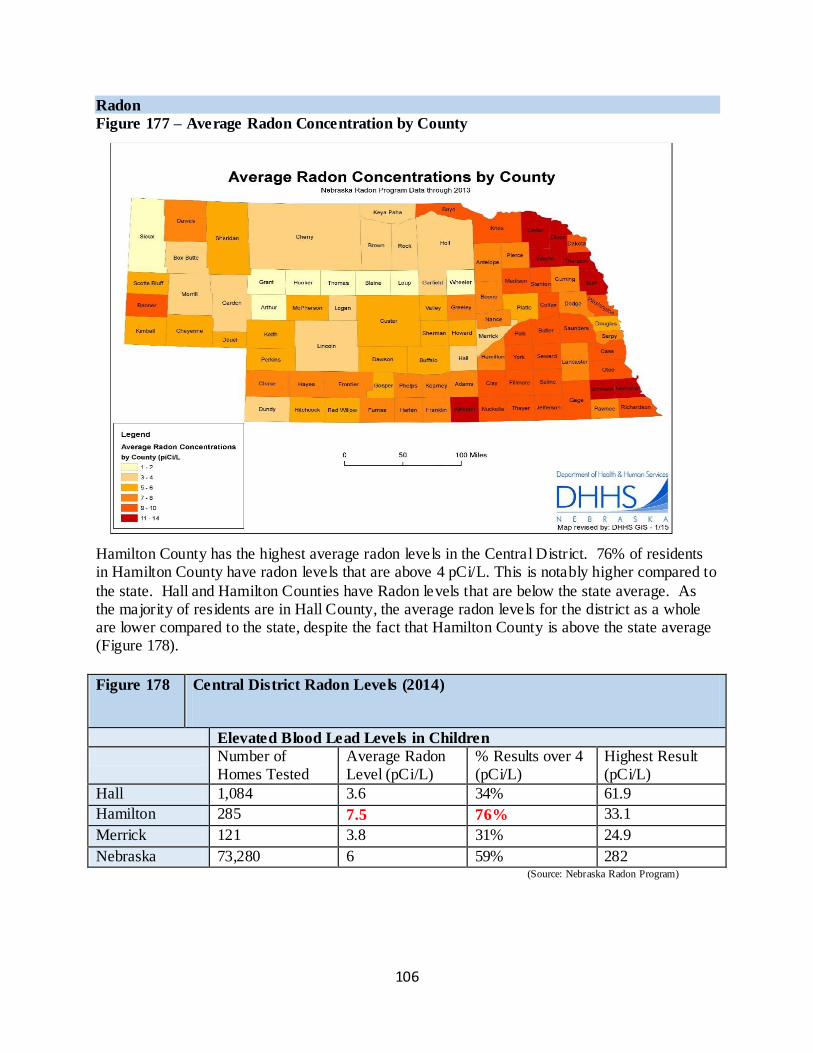
106
Radon
Figure 177 – Average Radon Concentration by County
Hamilton County has the highest average radon levels in the Central District. 76% of residents in Hamilton County have radon levels that are above 4 pCi/L. This is notably higher compared to
the state. Hall and Hamilton Counties have Radon levels that are below the state average. As the majority of residents are in Hall County, the average radon levels for the district as a whole are lower compared to the state, despite the fact that Hamilton County is above the state average (Figure 178).
Figure 178 Central District Radon Levels (2014)
Elevated Blood Lead Levels in Children
Number of Homes Tested
Average Radon Level (pCi/L)
% Results over 4 (pCi/L)
Highest Result (pCi/L)
Hall 1,084 3.6 34% 61.9
Hamilton 285 7.5 76% 33.1
Merrick 121 3.8 31% 24.9
Nebraska 73,280 6 59% 282 (Source: Nebraska Radon Program)
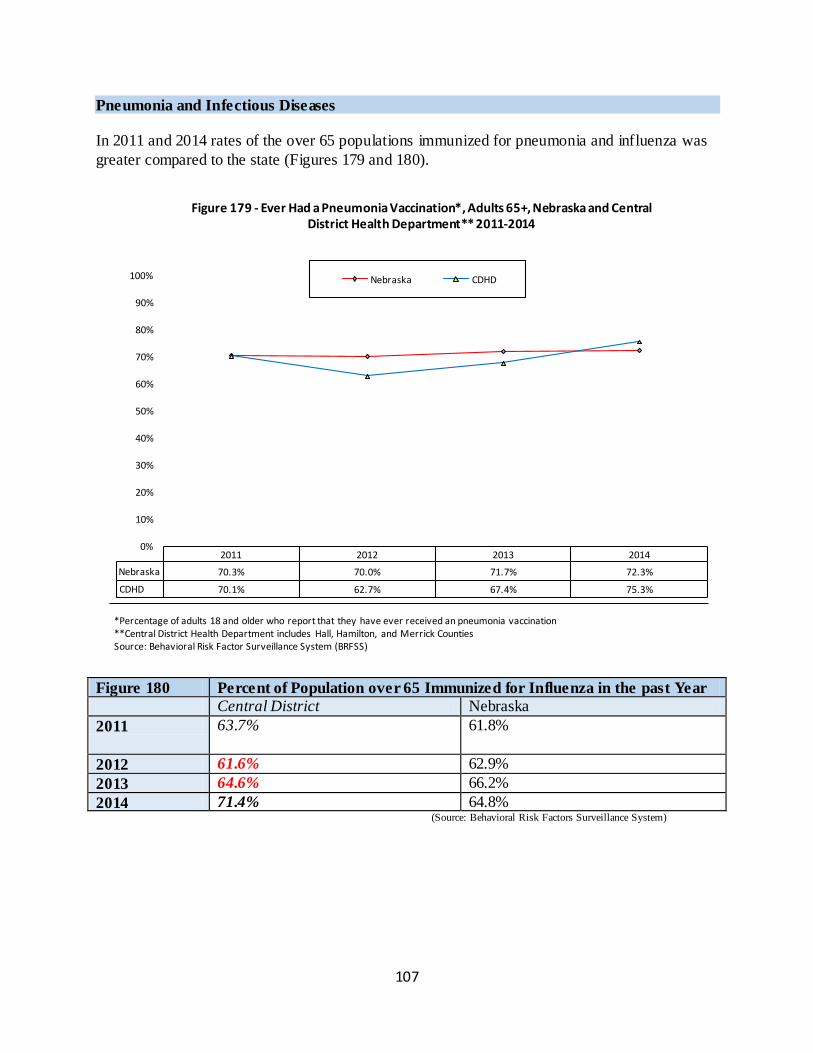
107
Pneumonia and Infectious Diseases
In 2011 and 2014 rates of the over 65 populations immunized for pneumonia and influenza was
greater compared to the state (Figures 179 and 180).
Figure 180 Percent of Population over 65 Immunized for Influenza in the past Year
Central District Nebraska
2011 63.7% 61.8%
2012 61.6% 62.9%
2013 64.6% 66.2%
2014 71.4% 64.8% (Source: Behavioral Risk Factors Surveillance System)
2011 2012 2013 2014
Nebraska 70.3% 70.0% 71.7% 72.3%
CDHD 70.1% 62.7% 67.4% 75.3%
0%
10%
20%
30%
40%
50%
60%
70%
80%
90%
100%
Figure 179 - Ever Had a Pneumonia Vaccination*, Adults 65+, Nebraska and Central District Health Department** 2011-2014
Nebraska CDHD
*Percentage of adults 18 and older who report that they have ever received an pneumonia vaccination **Central District Health Department includes Hall, Hamilton, and Merrick Counties Source: Behavioral Risk Factor Surveillance System (BRFSS)
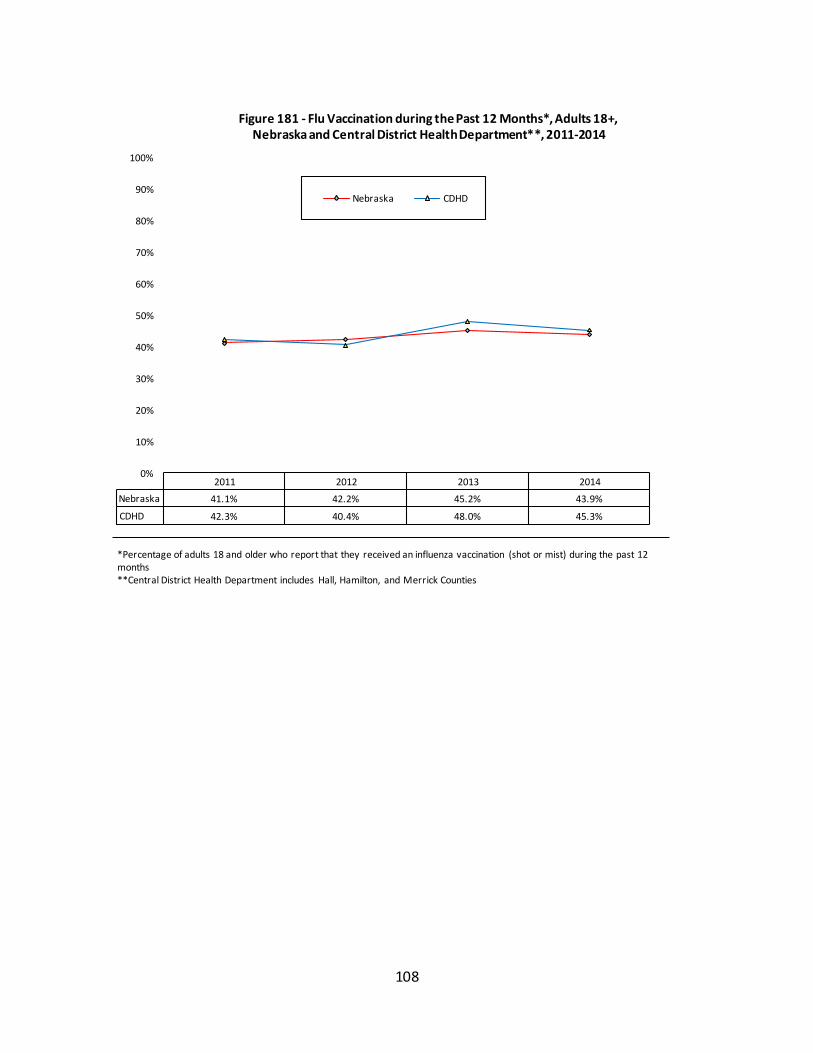
108
2011 2012 2013 2014
Nebraska 41.1% 42.2% 45.2% 43.9%
CDHD 42.3% 40.4% 48.0% 45.3%
0%
10%
20%
30%
40%
50%
60%
70%
80%
90%
100%
Figure 181 - Flu Vaccination during the Past 12 Months*, Adults 18+, Nebraska and Central District Health Department**, 2011-2014
Nebraska CDHD
*Percentage of adults 18 and older who report that they received an influenza vaccination (shot or mist) during the past 12 months **Central District Health Department includes Hall, Hamilton, and Merrick Counties
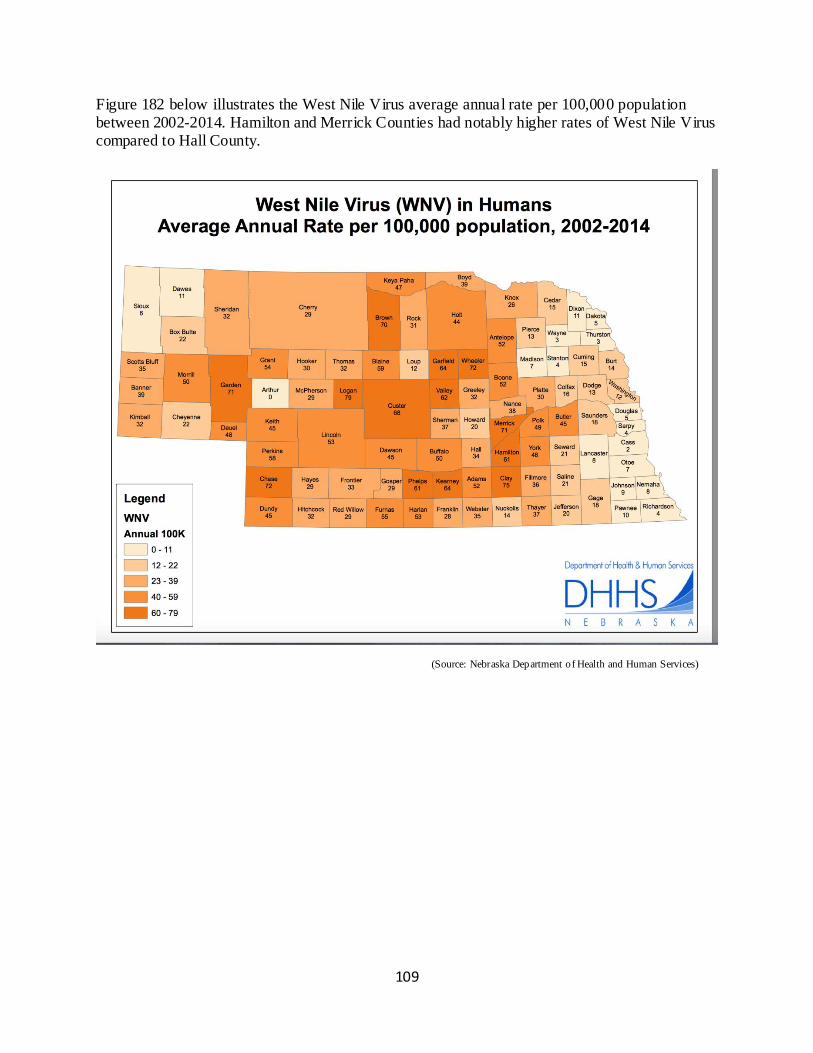
109
Figure 182 below illustrates the West Nile Virus average annual rate per 100,000 population between 2002-2014. Hamilton and Merrick Counties had notably higher rates of West Nile Virus compared to Hall County.
(Source: Nebraska Department of Health and Human Services)
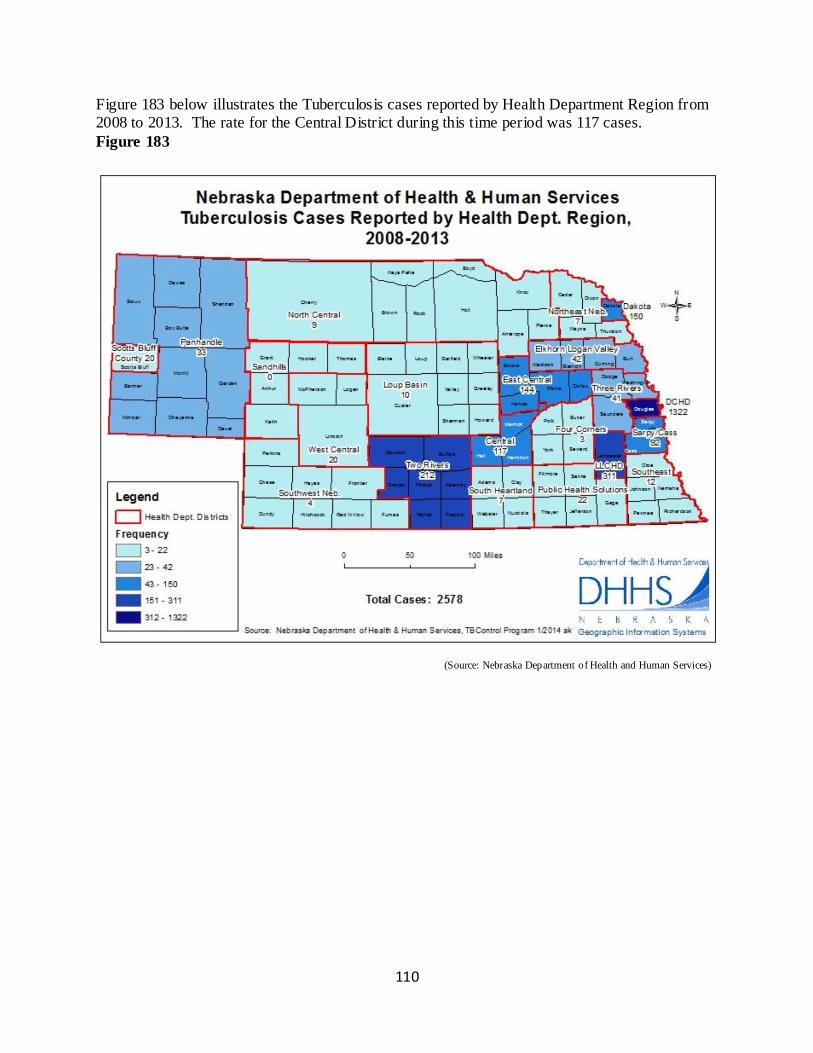
110
Figure 183 below illustrates the Tuberculosis cases reported by Health Department Region from 2008 to 2013. The rate for the Central District during this time period was 117 cases.
Figure 183
(Source: Nebraska Department of Health and Human Services)
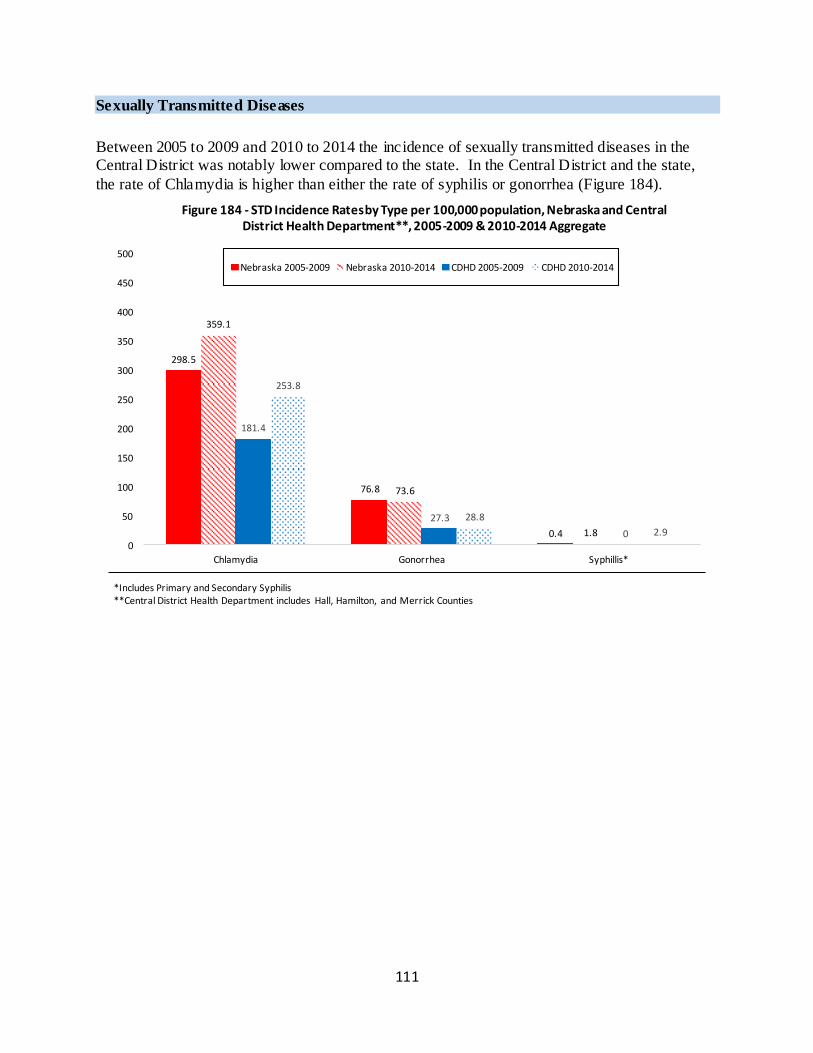
111
Sexually Transmitted Diseases
Between 2005 to 2009 and 2010 to 2014 the incidence of sexually transmitted diseases in the Central District was notably lower compared to the state. In the Central District and the state,
the rate of Chlamydia is higher than either the rate of syphilis or gonorrhea (Figure 184).
298.5
76.8
0.4
359.1
73.6
1.8
181.4
27.3
0
253.8
28.8
2.9
0
50
100
150
200
250
300
350
400
450
500
Chlamydia Gonorrhea Syphillis*
Figure 184 - STD Incidence Rates by Type per 100,000 population, Nebraska and Central District Health Department**, 2005-2009 & 2010-2014 Aggregate
Nebraska 2005-2009 Nebraska 2010-2014 CDHD 2005-2009 CDHD 2010-2014
*Includes Primary and Secondary Syphilis **Central District Health Department includes Hall, Hamilton, and Merrick Counties
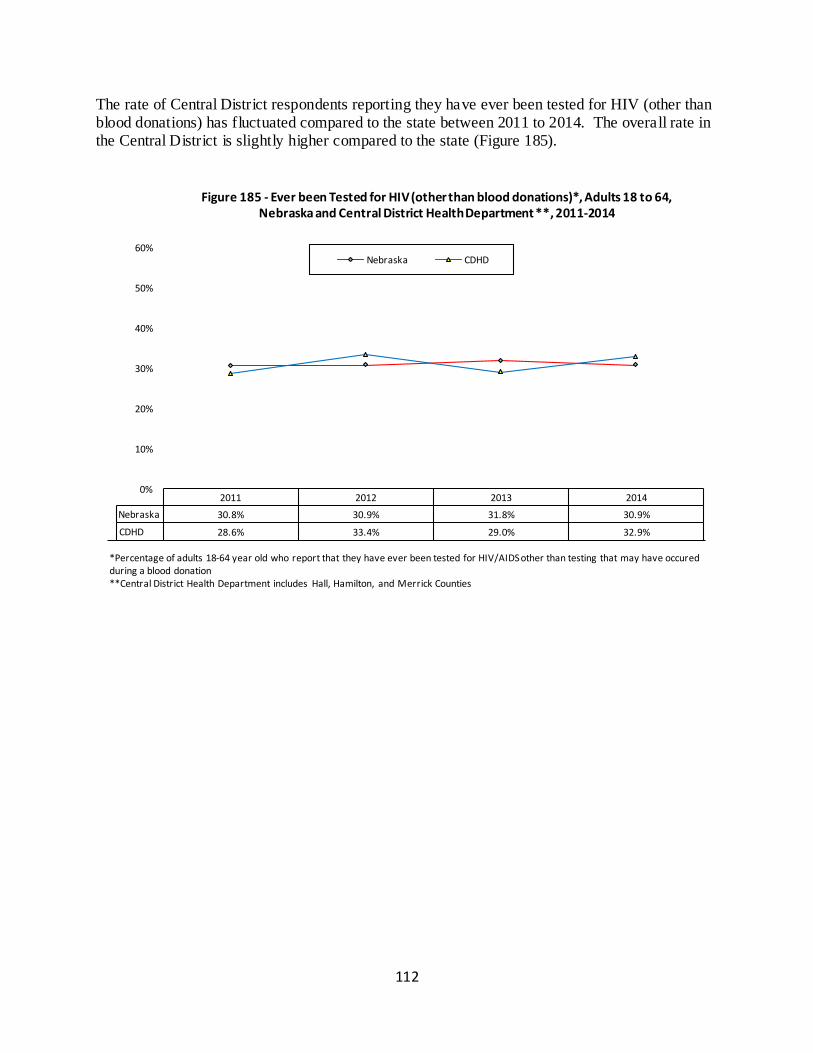
112
The rate of Central District respondents reporting they have ever been tested for HIV (other than blood donations) has fluctuated compared to the state between 2011 to 2014. The overall rate in the Central District is slightly higher compared to the state (Figure 185).
2011 2012 2013 2014
Nebraska 30.8% 30.9% 31.8% 30.9%
CDHD 28.6% 33.4% 29.0% 32.9%
0%
10%
20%
30%
40%
50%
60%
Figure 185 - Ever been Tested for HIV (other than blood donations)*, Adults 18 to 64, Nebraska and Central District Health Department **, 2011-2014
Nebraska CDHD
*Percentage of adults 18-64 year old who report that they have ever been tested for HIV/AIDS other than testing that may have occured during a blood donation **Central District Health Department includes Hall, Hamilton, and Merrick Counties
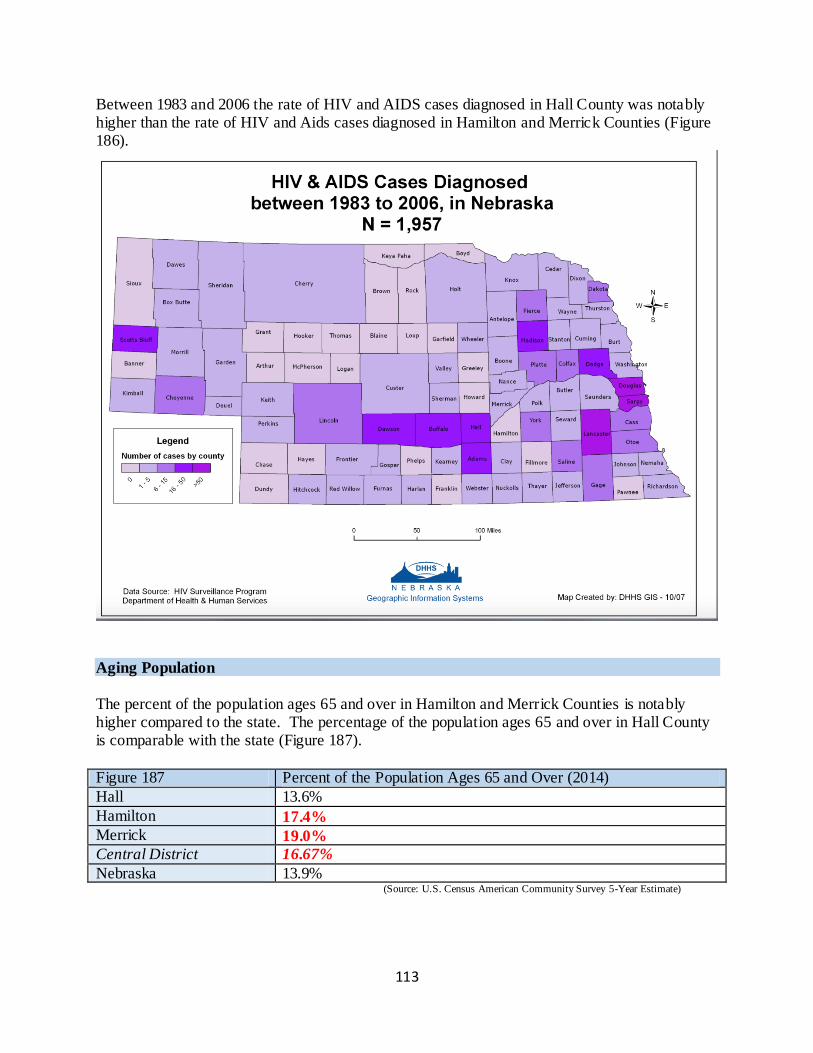
113
Between 1983 and 2006 the rate of HIV and AIDS cases diagnosed in Hall County was notably higher than the rate of HIV and Aids cases diagnosed in Hamilton and Merrick Counties (Figure 186).
Aging Population
The percent of the population ages 65 and over in Hamilton and Merrick Counties is notably higher compared to the state. The percentage of the population ages 65 and over in Hall County is comparable with the state (Figure 187).
Figure 187 Percent of the Population Ages 65 and Over (2014)
Hall 13.6%
Hamilton 17.4%
Merrick 19.0%
Central District 16.67%
Nebraska 13.9% (Source: U.S. Census American Community Survey 5-Year Estimate)
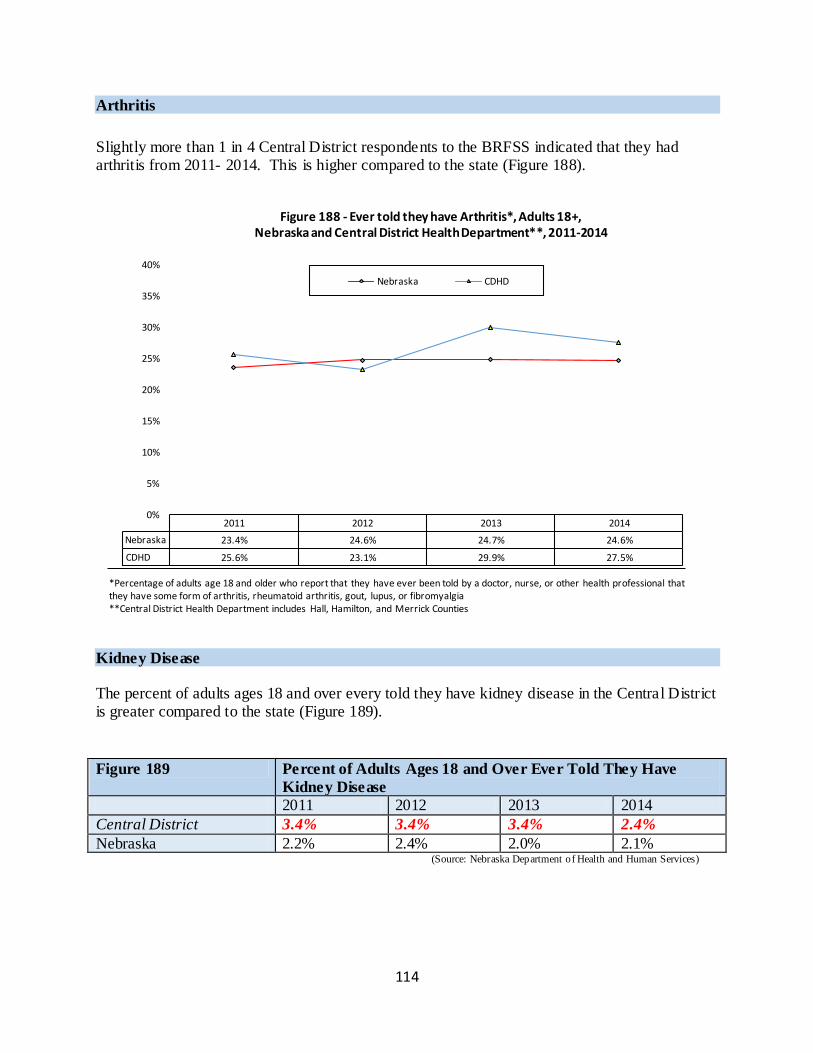
114
Arthritis
Slightly more than 1 in 4 Central District respondents to the BRFSS indicated that they had arthritis from 2011- 2014. This is higher compared to the state (Figure 188).
Kidney Disease
The percent of adults ages 18 and over every told they have kidney disease in the Central District is greater compared to the state (Figure 189).
Figure 189 Percent of Adults Ages 18 and Over Ever Told They Have
Kidney Disease
2011 2012 2013 2014
Central District 3.4% 3.4% 3.4% 2.4%
Nebraska 2.2% 2.4% 2.0% 2.1% (Source: Nebraska Department of Health and Human Services)
2011 2012 2013 2014
Nebraska 23.4% 24.6% 24.7% 24.6%
CDHD 25.6% 23.1% 29.9% 27.5%
0%
5%
10%
15%
20%
25%
30%
35%
40%
Figure 188 - Ever told they have Arthritis*, Adults 18+, Nebraska and Central District Health Department**, 2011-2014
Nebraska CDHD
*Percentage of adults age 18 and older who report that they have ever been told by a doctor, nurse, or other health professional that they have some form of arthritis, rheumatoid arthritis, gout, lupus, or fibromyalgia **Central District Health Department includes Hall, Hamilton, and Merrick Counties
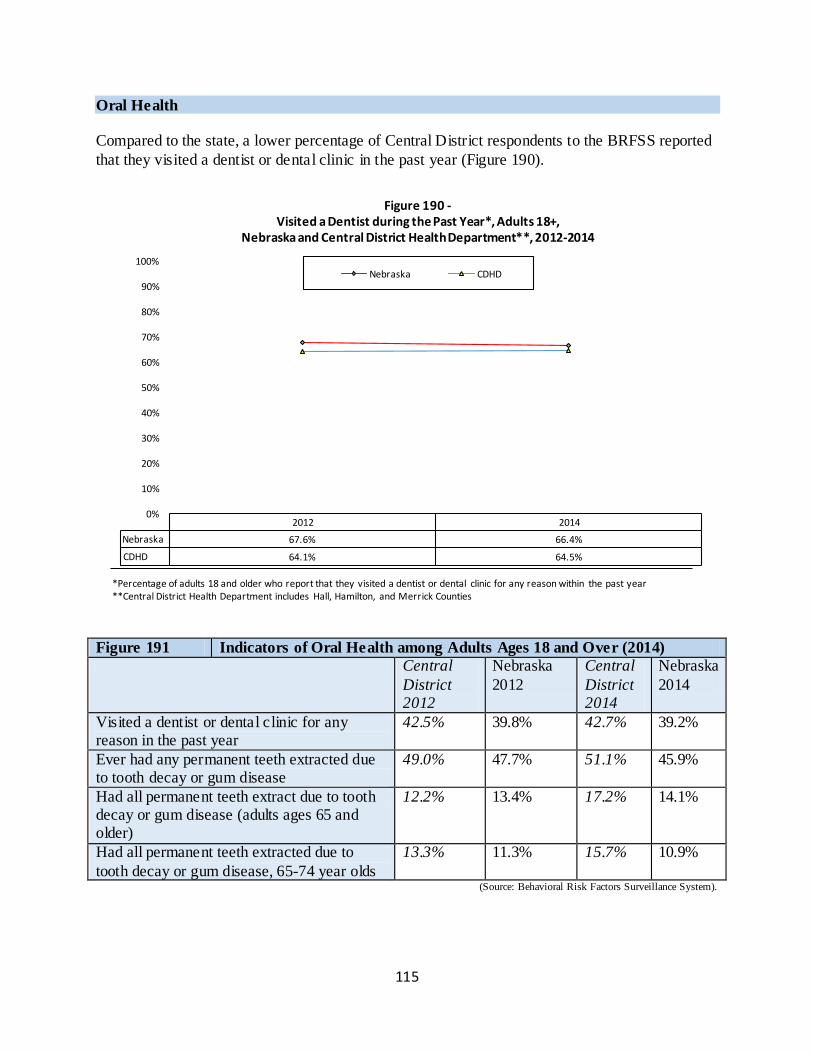
115
Oral Health
Compared to the state, a lower percentage of Central District respondents to the BRFSS reported
that they visited a dentist or dental clinic in the past year (Figure 190).
Figure 191 Indicators of Oral Health among Adults Ages 18 and Over (2014)
Central
District 2012
Nebraska
2012
Central
District 2014
Nebraska
2014
Visited a dentist or dental clinic for any reason in the past year
42.5% 39.8% 42.7% 39.2%
Ever had any permanent teeth extracted due to tooth decay or gum disease
49.0% 47.7% 51.1% 45.9%
Had all permanent teeth extract due to tooth decay or gum disease (adults ages 65 and older)
12.2% 13.4% 17.2% 14.1%
Had all permanent teeth extracted due to
tooth decay or gum disease, 65-74 year olds
13.3% 11.3% 15.7% 10.9%
(Source: Behavioral Risk Factors Surveillance System).
2012 2014
Nebraska 67.6% 66.4%
CDHD 64.1% 64.5%
0%
10%
20%
30%
40%
50%
60%
70%
80%
90%
100%
Figure 190 - Visited a Dentist during the Past Year*, Adults 18+,
Nebraska and Central District Health Department**, 2012-2014
Nebraska CDHD
*Percentage of adults 18 and older who report that they visited a dentist or dental clinic for any reason within the past year **Central District Health Department includes Hall, Hamilton, and Merrick Counties
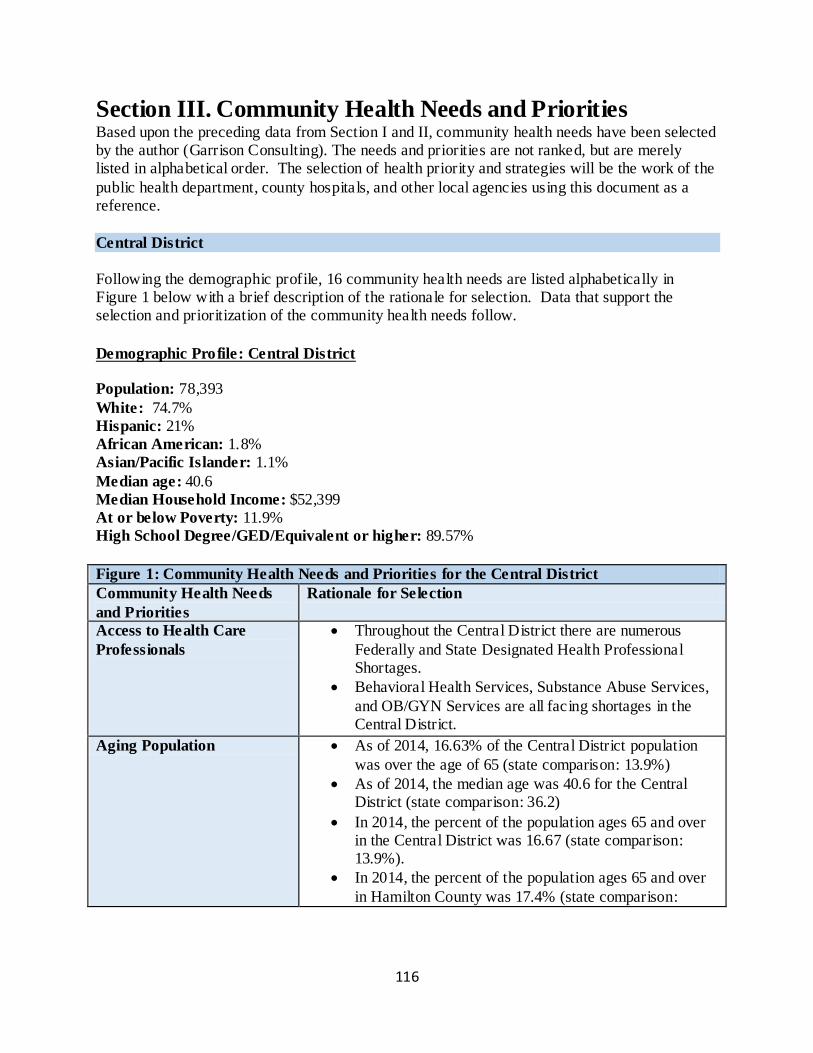
116
Section III. Community Health Needs and Priorities Based upon the preceding data from Section I and II, community health needs have been selected by the author (Garrison Consulting). The needs and priorities are not ranked, but are merely listed in alphabetical order. The selection of health priority and strategies will be the work of the
public health department, county hospitals, and other local agencies using this document as a reference.
Central District
Following the demographic profile, 16 community health needs are listed alphabetically in Figure 1 below with a brief description of the rationale for selection. Data that support the selection and prioritization of the community health needs follow.
Demographic Profile: Central District
Population: 78,393
White: 74.7%
Hispanic: 21% African American: 1.8% Asian/Pacific Islander: 1.1%
Median age: 40.6
Median Household Income: $52,399
At or below Poverty: 11.9%
High School Degree/GED/Equivalent or higher: 89.57%
Figure 1: Community Health Needs and Priorities for the Central District
Community Health Needs
and Priorities
Rationale for Selection
Access to Health Care
Professionals
Throughout the Central District there are numerous
Federally and State Designated Health Professional Shortages.
Behavioral Health Services, Substance Abuse Services,
and OB/GYN Services are all facing shortages in the Central District.
Aging Population As of 2014, 16.63% of the Central District population
was over the age of 65 (state comparison: 13.9%)
As of 2014, the median age was 40.6 for the Central District (state comparison: 36.2)
In 2014, the percent of the population ages 65 and over in the Central District was 16.67 (state comparison: 13.9%).
In 2014, the percent of the population ages 65 and over
in Hamilton County was 17.4% (state comparison:
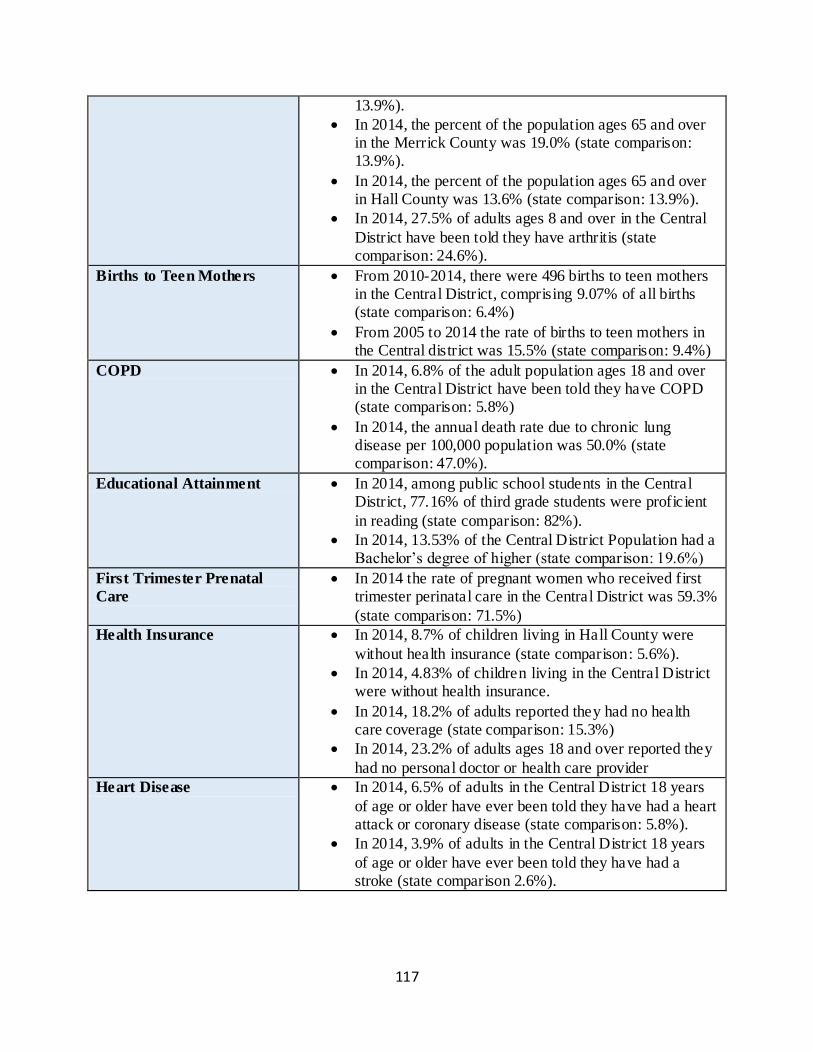
117
13.9%).
In 2014, the percent of the population ages 65 and over in the Merrick County was 19.0% (state comparison: 13.9%).
In 2014, the percent of the population ages 65 and over in Hall County was 13.6% (state comparison: 13.9%).
In 2014, 27.5% of adults ages 8 and over in the Central
District have been told they have arthritis (state comparison: 24.6%).
Births to Teen Mothers From 2010-2014, there were 496 births to teen mothers in the Central District, comprising 9.07% of all births (state comparison: 6.4%)
From 2005 to 2014 the rate of births to teen mothers in the Central district was 15.5% (state comparison: 9.4%)
COPD In 2014, 6.8% of the adult population ages 18 and over in the Central District have been told they have COPD (state comparison: 5.8%)
In 2014, the annual death rate due to chronic lung disease per 100,000 population was 50.0% (state comparison: 47.0%).
Educational Attainment In 2014, among public school students in the Central District, 77.16% of third grade students were proficient
in reading (state comparison: 82%).
In 2014, 13.53% of the Central District Population had a Bachelor’s degree of higher (state comparison: 19.6%)
First Trimester Prenatal
Care
In 2014 the rate of pregnant women who received first trimester perinatal care in the Central District was 59.3%
(state comparison: 71.5%)
Health Insurance In 2014, 8.7% of children living in Hall County were
without health insurance (state comparison: 5.6%).
In 2014, 4.83% of children living in the Central District were without health insurance.
In 2014, 18.2% of adults reported they had no health care coverage (state comparison: 15.3%)
In 2014, 23.2% of adults ages 18 and over reported they
had no personal doctor or health care provider
Heart Disease In 2014, 6.5% of adults in the Central District 18 years
of age or older have ever been told they have had a heart attack or coronary disease (state comparison: 5.8%).
In 2014, 3.9% of adults in the Central District 18 years
of age or older have ever been told they have had a stroke (state comparison 2.6%).
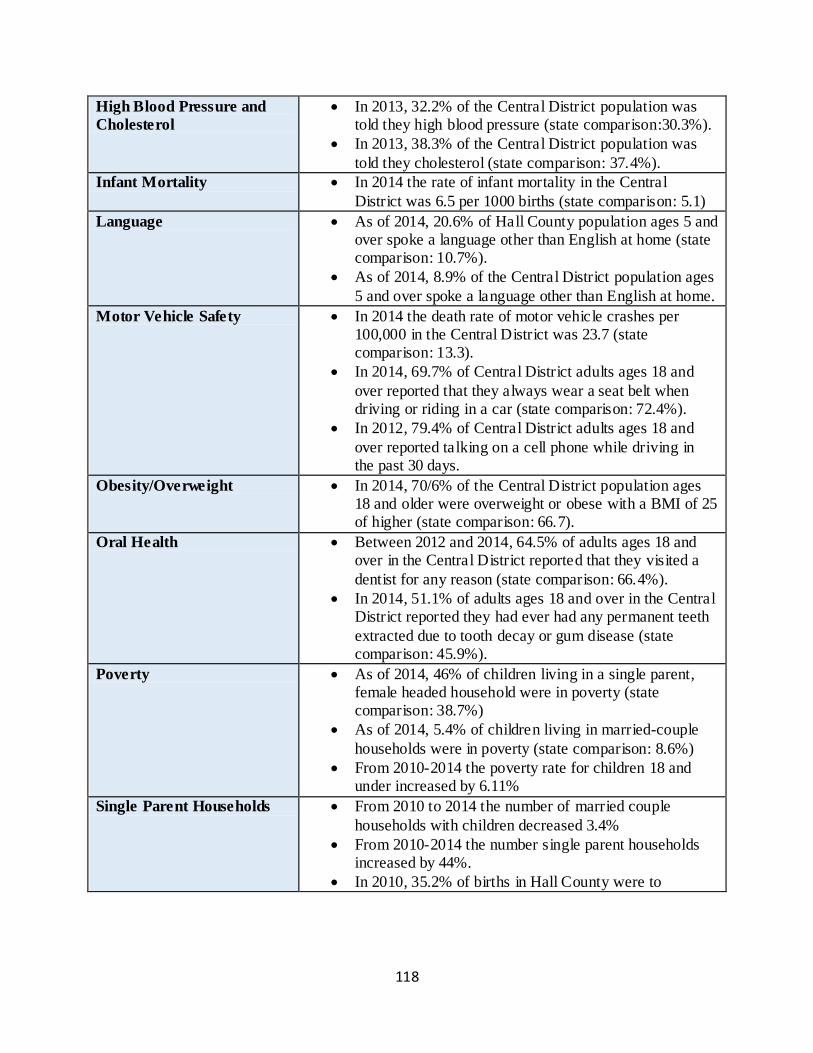
118
High Blood Pressure and
Cholesterol
In 2013, 32.2% of the Central District population was told they high blood pressure (state comparison:30.3%).
In 2013, 38.3% of the Central District population was
told they cholesterol (state comparison: 37.4%).
Infant Mortality In 2014 the rate of infant mortality in the Central
District was 6.5 per 1000 births (state comparison: 5.1)
Language As of 2014, 20.6% of Hall County population ages 5 and over spoke a language other than English at home (state comparison: 10.7%).
As of 2014, 8.9% of the Central District population ages
5 and over spoke a language other than English at home.
Motor Vehicle Safety In 2014 the death rate of motor vehicle crashes per 100,000 in the Central District was 23.7 (state comparison: 13.3).
In 2014, 69.7% of Central District adults ages 18 and
over reported that they always wear a seat belt when driving or riding in a car (state comparison: 72.4%).
In 2012, 79.4% of Central District adults ages 18 and
over reported talking on a cell phone while driving in the past 30 days.
Obesity/Overweight In 2014, 70/6% of the Central District population ages 18 and older were overweight or obese with a BMI of 25 of higher (state comparison: 66.7).
Oral Health Between 2012 and 2014, 64.5% of adults ages 18 and over in the Central District reported that they visited a
dentist for any reason (state comparison: 66.4%).
In 2014, 51.1% of adults ages 18 and over in the Central District reported they had ever had any permanent teeth
extracted due to tooth decay or gum disease (state comparison: 45.9%).
Poverty As of 2014, 46% of children living in a single parent, female headed household were in poverty (state comparison: 38.7%)
As of 2014, 5.4% of children living in married-couple
households were in poverty (state comparison: 8.6%)
From 2010-2014 the poverty rate for children 18 and under increased by 6.11%
Single Parent Households From 2010 to 2014 the number of married couple
households with children decreased 3.4%
From 2010-2014 the number single parent households increased by 44%.
In 2010, 35.2% of births in Hall County were to
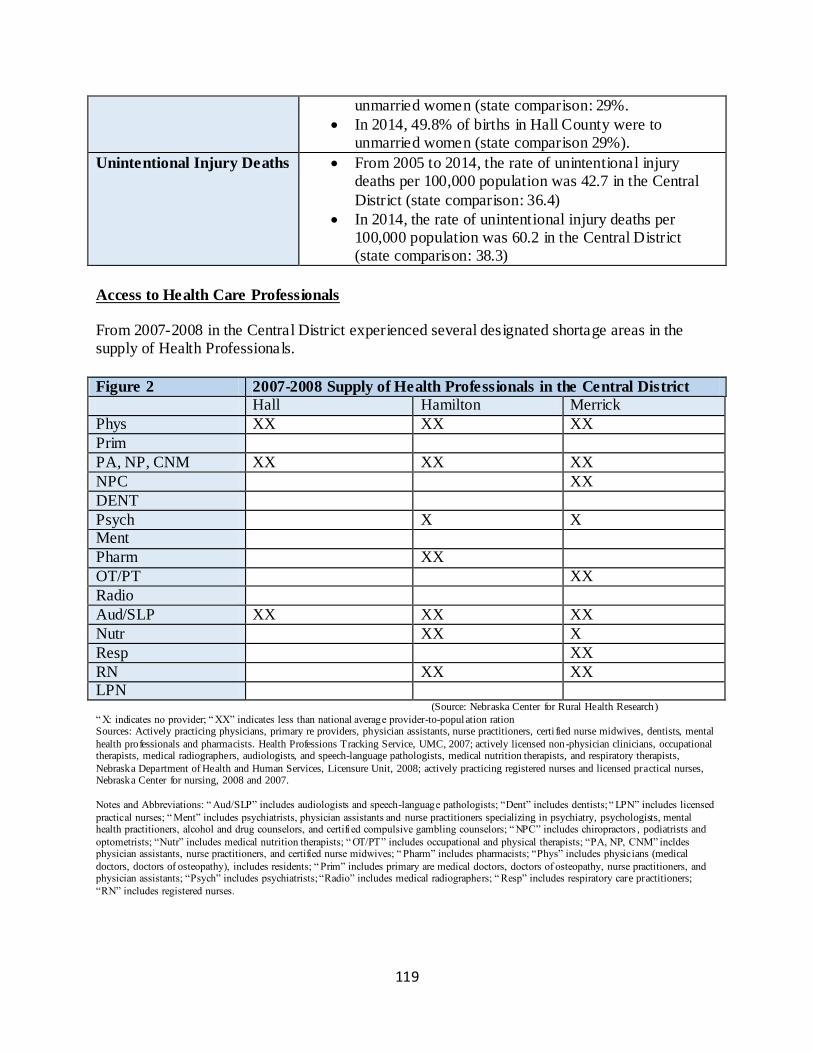
119
unmarried women (state comparison: 29%.
In 2014, 49.8% of births in Hall County were to unmarried women (state comparison 29%).
Unintentional Injury Deaths From 2005 to 2014, the rate of unintentional injury deaths per 100,000 population was 42.7 in the Central
District (state comparison: 36.4)
In 2014, the rate of unintentional injury deaths per 100,000 population was 60.2 in the Central District (state comparison: 38.3)
Access to Health Care Professionals From 2007-2008 in the Central District experienced several designated shortage areas in the supply of Health Professionals.
Figure 2 2007-2008 Supply of Health Professionals in the Central District
Hall Hamilton Merrick
Phys XX XX XX
Prim
PA, NP, CNM XX XX XX
NPC XX
DENT
Psych X X Ment
Pharm XX
OT/PT XX
Radio
Aud/SLP XX XX XX
Nutr XX X
Resp XX
RN XX XX LPN (Source: Nebraska Center for Rural Health Research)
“ X: indicates no provider; “ XX” indicates less than national average provider-to-population ration Sources: Actively practicing physicians, primary re providers, physician assistants, nurse practitioners, certi fied nurse midwives, dentists, mental
health professionals and pharmacists. Health Professions Tracking Service, UMC, 2007; actively licensed non-physician clinicians, occupational therapists, medical radiographers, audiologists, and speech-language pathologists, medical nutrition therapists, and respiratory therapists,
Nebraska Department of Health and Human Services, Licensure Unit, 2008; actively practicing registered nurses and licensed practical nurses, Nebraska Center for nursing, 2008 and 2007.
Notes and Abbreviations: “ Aud/SLP” includes audiologists and speech-language pathologists; “Dent” includes dentists; “ LPN” includes licensed
practical nurses; “ Ment” includes psychiatrists, physician assistants and nurse practitioners specializing in psychiatry, psychologists, mental health practitioners, alcohol and drug counselors, and certifi ed compulsive gambling counselors; “ NPC” includes chiropractors , podiatrists and
optometrists; “Nutr” includes medical nutrition therapists; “ OT/PT” includes occupational and physical therapists; “PA, NP, CNM” incldes physician assistants, nurse practitioners, and certified nurse midwives; “ Pharm” includes pharmacists; “Phys” includes physicians (medical
doctors, doctors of osteopathy), includes residents; “ Prim” includes primary are medical doctors, doctors of osteopathy, nurse practitioners, and physician assistants; “Psych” includes psychiatrists; “Radio” includes medical radiographers; “ Resp” includes respiratory care practitioners;
“RN” includes registered nurses.
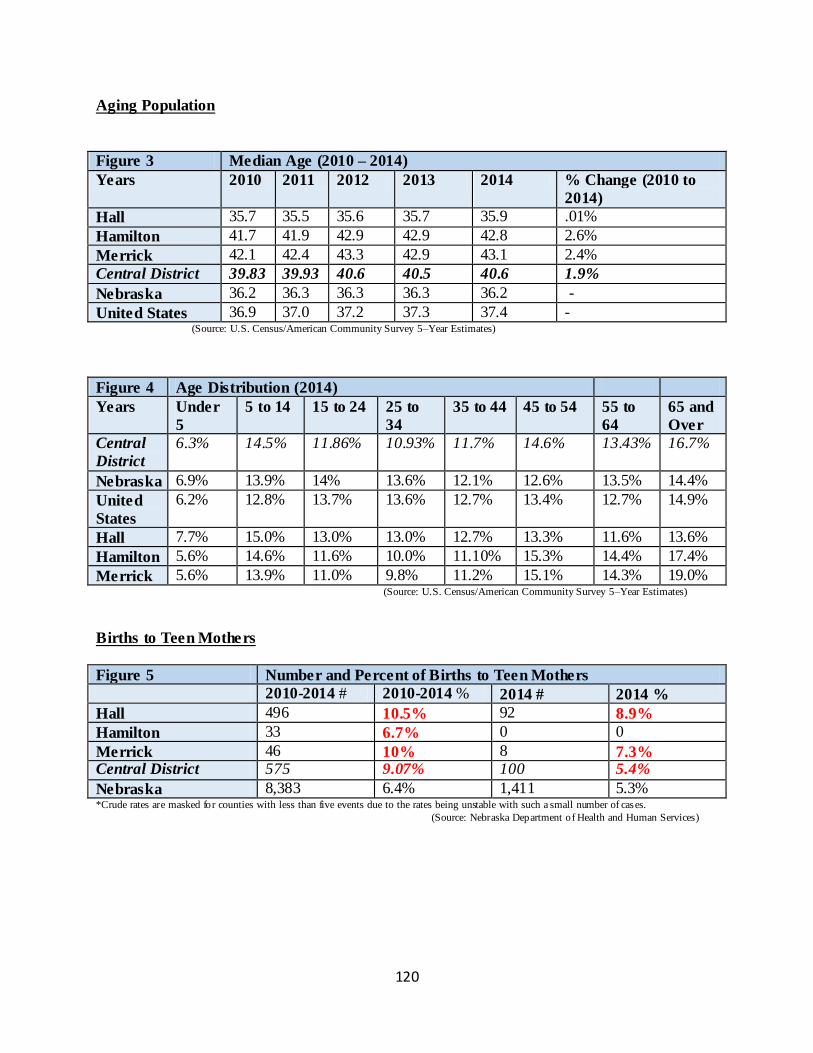
120
Aging Population
Figure 3 Median Age (2010 – 2014)
Years 2010 2011 2012 2013 2014 % Change (2010 to
2014)
Hall 35.7 35.5 35.6 35.7 35.9 .01%
Hamilton 41.7 41.9 42.9 42.9 42.8 2.6%
Merrick 42.1 42.4 43.3 42.9 43.1 2.4%
Central District 39.83 39.93 40.6 40.5 40.6 1.9%
Nebraska 36.2 36.3 36.3 36.3 36.2 -
United States 36.9 37.0 37.2 37.3 37.4 - (Source: U.S. Census/American Community Survey 5–Year Estimates)
Figure 4 Age Distribution (2014)
Years Under
5
5 to 14 15 to 24 25 to
34
35 to 44 45 to 54 55 to
64
65 and
Over
Central
District
6.3% 14.5% 11.86% 10.93% 11.7% 14.6% 13.43% 16.7%
Nebraska 6.9% 13.9% 14% 13.6% 12.1% 12.6% 13.5% 14.4%
United
States
6.2% 12.8% 13.7% 13.6% 12.7% 13.4% 12.7% 14.9%
Hall 7.7% 15.0% 13.0% 13.0% 12.7% 13.3% 11.6% 13.6%
Hamilton 5.6% 14.6% 11.6% 10.0% 11.10% 15.3% 14.4% 17.4%
Merrick 5.6% 13.9% 11.0% 9.8% 11.2% 15.1% 14.3% 19.0% (Source: U.S. Census/American Community Survey 5–Year Estimates)
Births to Teen Mothers
Figure 5 Number and Percent of Births to Teen Mothers
2010-2014 # 2010-2014 % 2014 # 2014 %
Hall 496 10.5% 92 8.9%
Hamilton 33 6.7% 0 0
Merrick 46 10% 8 7.3% Central District 575 9.07% 100 5.4%
Nebraska 8,383 6.4% 1,411 5.3% *Crude rates are masked for counties with less than five events due to the rates being unstable with such a small number of cases.
(Source: Nebraska Department of Health and Human Services)
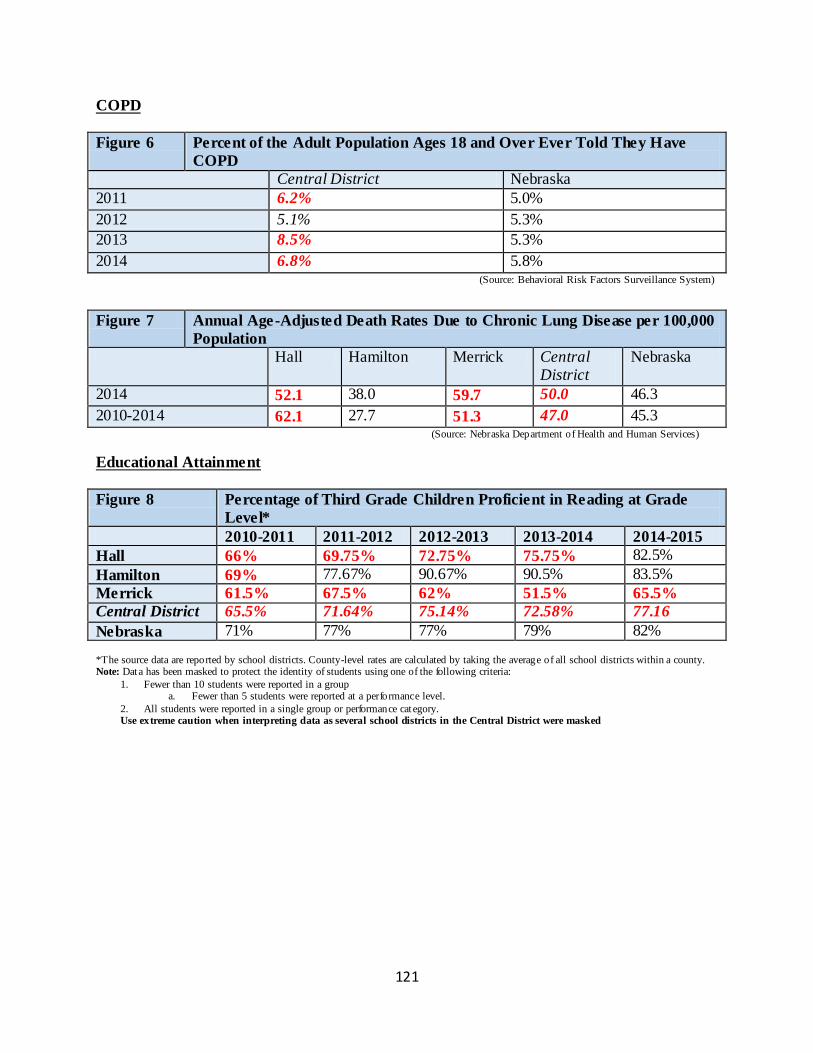
121
COPD
Figure 6 Percent of the Adult Population Ages 18 and Over Ever Told They Have
COPD
Central District Nebraska
2011 6.2% 5.0%
2012 5.1% 5.3%
2013 8.5% 5.3%
2014 6.8% 5.8% (Source: Behavioral Risk Factors Surveillance System)
Figure 7 Annual Age-Adjusted Death Rates Due to Chronic Lung Disease per 100,000
Population
Hall Hamilton Merrick Central District
Nebraska
2014 52.1 38.0 59.7 50.0 46.3
2010-2014 62.1 27.7 51.3 47.0 45.3 (Source: Nebraska Department of Health and Human Services)
Educational Attainment
Figure 8 Percentage of Third Grade Children Proficient in Reading at Grade
Level*
2010-2011 2011-2012 2012-2013 2013-2014 2014-2015
Hall 66% 69.75% 72.75% 75.75% 82.5%
Hamilton 69% 77.67% 90.67% 90.5% 83.5%
Merrick 61.5% 67.5% 62% 51.5% 65.5%
Central District 65.5% 71.64% 75.14% 72.58% 77.16
Nebraska 71% 77% 77% 79% 82%
*The source data are reported by school districts. County-level rates are calculated by taking the average of all school districts within a county. Note: Data has been masked to protect the identity of students using one of the following criteria:
1. Fewer than 10 students were reported in a group a. Fewer than 5 students were reported at a performance level.
2. All students were reported in a single group or performance cat egory. Use extreme caution when interpreting data as several school districts in the Central District were masked
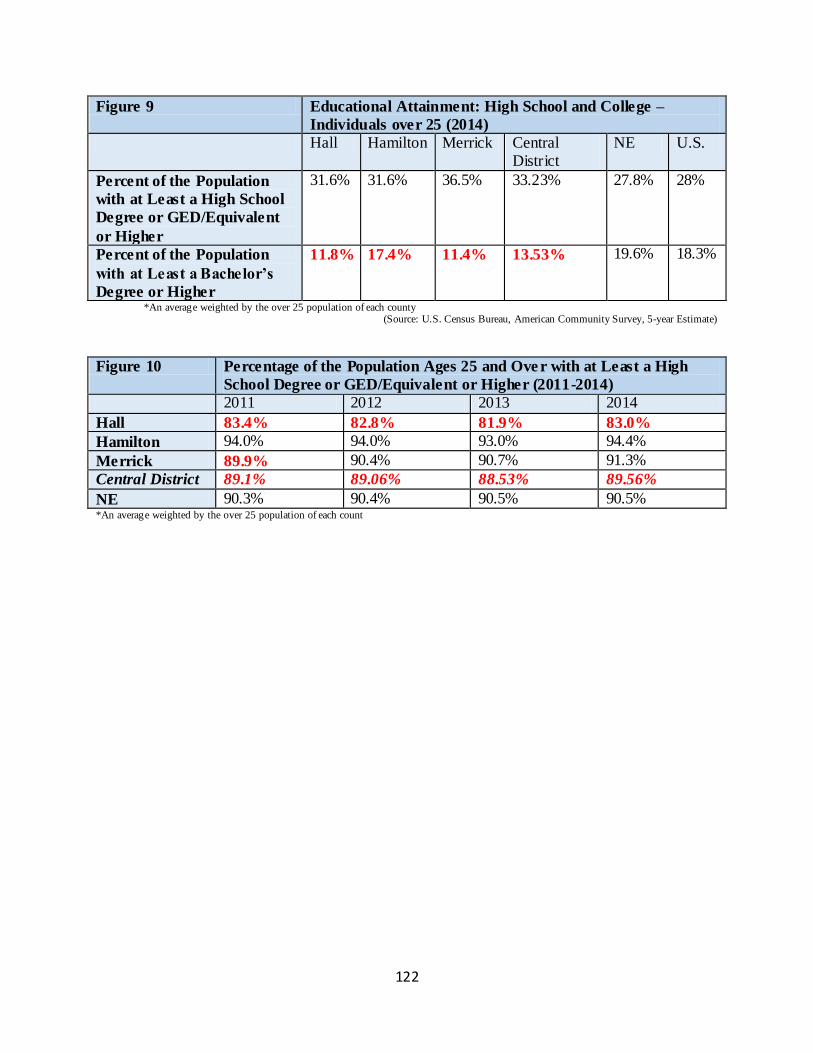
122
Figure 9 Educational Attainment: High School and College –
Individuals over 25 (2014)
Hall Hamilton Merrick Central District
NE U.S.
Percent of the Population
with at Least a High School
Degree or GED/Equivalent
or Higher
31.6% 31.6% 36.5% 33.23% 27.8% 28%
Percent of the Population
with at Least a Bachelor’s
Degree or Higher
11.8% 17.4% 11.4% 13.53% 19.6% 18.3%
*An average weighted by the over 25 population of each county (Source: U.S. Census Bureau, American Community Survey, 5-year Estimate)
Figure 10 Percentage of the Population Ages 25 and Ove r with at Least a High
School Degree or GED/Equivalent or Higher (2011-2014)
2011 2012 2013 2014
Hall 83.4% 82.8% 81.9% 83.0%
Hamilton 94.0% 94.0% 93.0% 94.4%
Merrick 89.9% 90.4% 90.7% 91.3%
Central District 89.1% 89.06% 88.53% 89.56%
NE 90.3% 90.4% 90.5% 90.5% *An average weighted by the over 25 population of each count
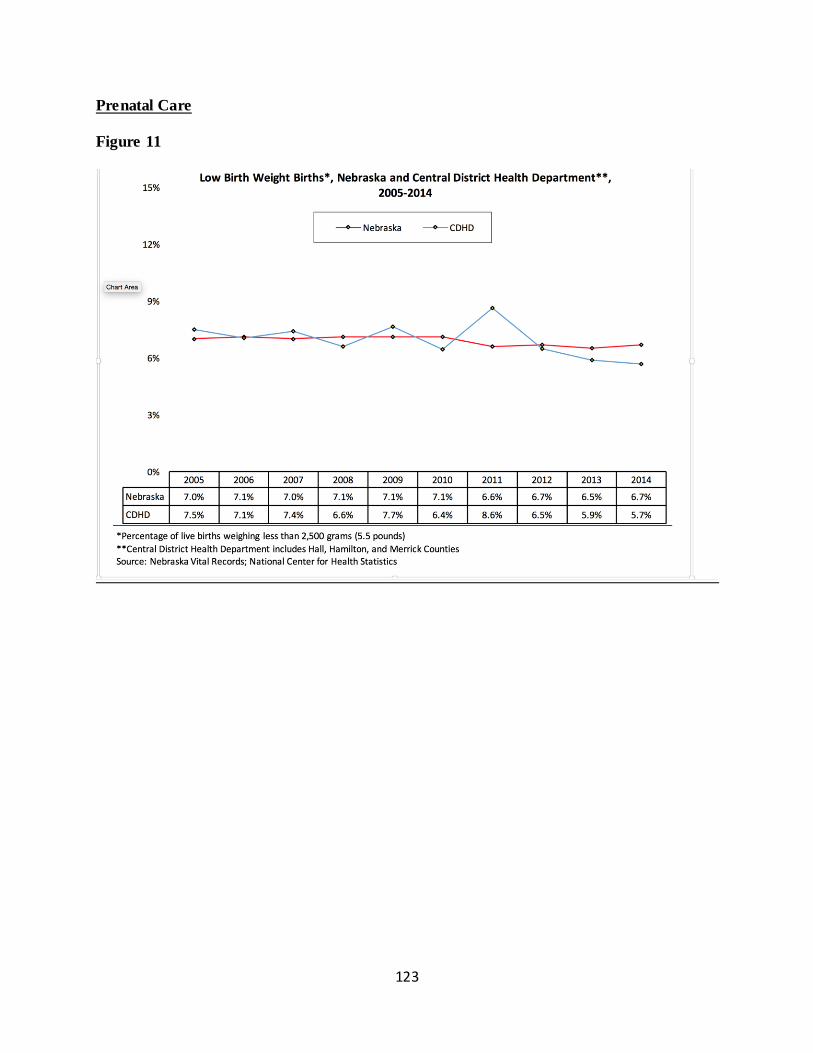
123
Prenatal Care
Figure 11
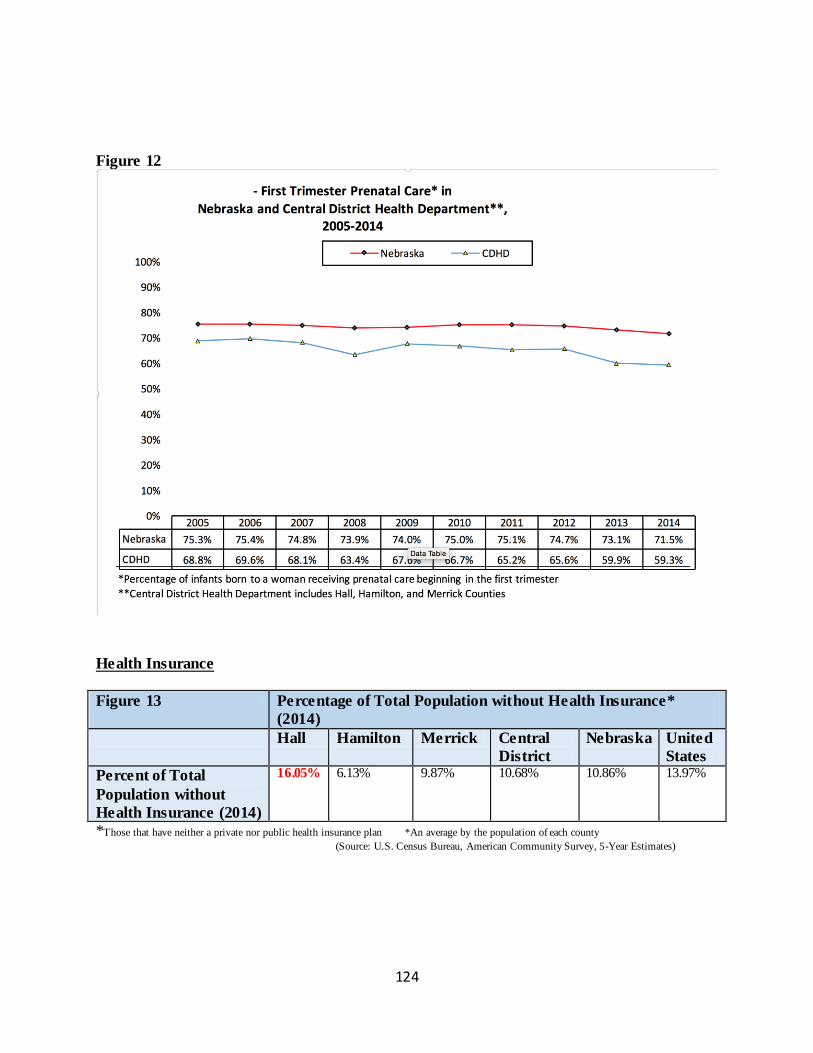
124
Figure 12
Health Insurance
Figure 13 Percentage of Total Population without Health Insurance*
(2014)
Hall Hamilton Merrick Central
District
Nebraska United
States
Percent of Total
Population without
Health Insurance (2014)
16.05% 6.13% 9.87% 10.68% 10.86% 13.97%
*Those that have neither a private nor public health insurance plan *An average by the population of each county
(Source: U.S. Census Bureau, American Community Survey, 5-Year Estimates)
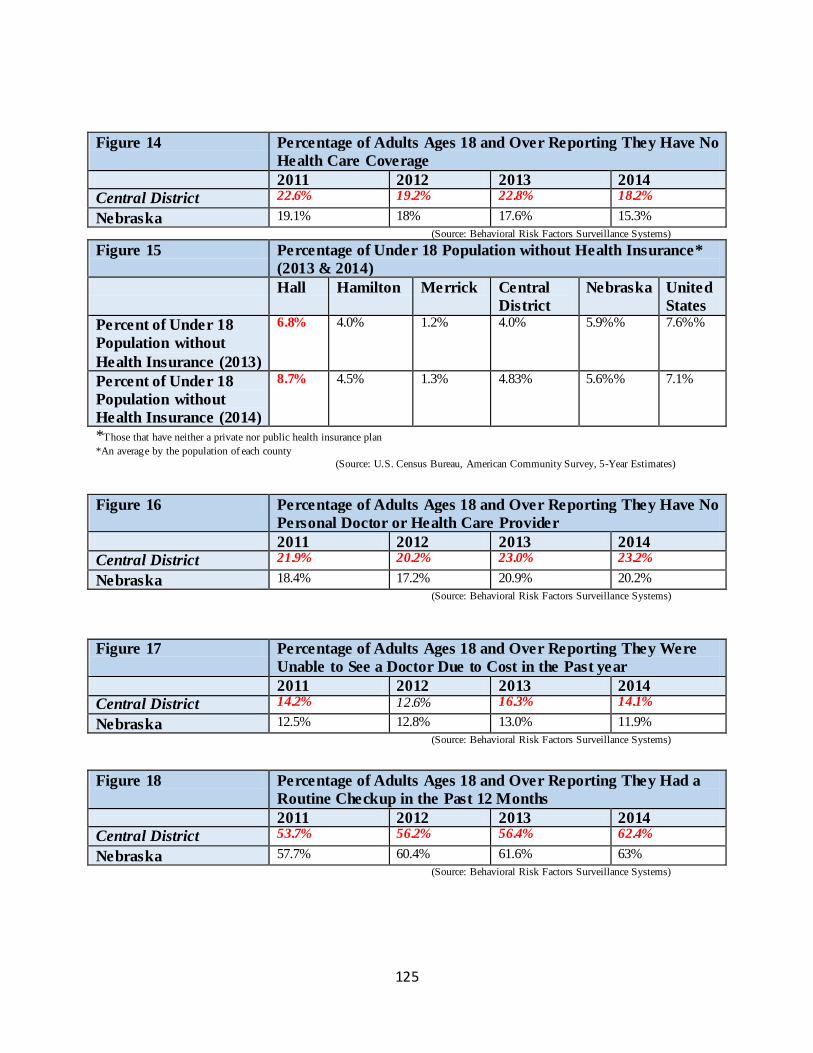
125
Figure 14 Percentage of Adults Ages 18 and Over Reporting They Have No
Health Care Coverage
2011 2012 2013 2014
Central District 22.6% 19.2% 22.8% 18.2%
Nebraska 19.1% 18% 17.6% 15.3%
(Source: Behavioral Risk Factors Surveillance Systems)
Figure 15 Percentage of Under 18 Population without Health Insurance*
(2013 & 2014)
Hall Hamilton Merrick Central
District
Nebraska United
States
Percent of Under 18
Population without
Health Insurance (2013)
6.8% 4.0% 1.2%
4.0% 5.9%% 7.6%%
Percent of Under 18
Population without
Health Insurance (2014)
8.7% 4.5% 1.3% 4.83% 5.6%% 7.1%
*Those that have neither a private nor public health insurance plan
*An average by the population of each county
(Source: U.S. Census Bureau, American Community Survey, 5-Year Estimates)
Figure 16 Percentage of Adults Ages 18 and Over Reporting They Have No
Personal Doctor or Health Care Provider
2011 2012 2013 2014
Central District 21.9% 20.2% 23.0% 23.2%
Nebraska 18.4% 17.2% 20.9% 20.2%
(Source: Behavioral Risk Factors Surveillance Systems)
Figure 17 Percentage of Adults Ages 18 and Over Reporting They Were
Unable to See a Doctor Due to Cost in the Past year
2011 2012 2013 2014
Central District 14.2% 12.6% 16.3% 14.1%
Nebraska 12.5% 12.8% 13.0% 11.9%
(Source: Behavioral Risk Factors Surveillance Systems)
Figure 18 Percentage of Adults Ages 18 and Over Reporting They Had a
Routine Checkup in the Past 12 Months
2011 2012 2013 2014
Central District 53.7% 56.2% 56.4% 62.4%
Nebraska 57.7% 60.4% 61.6% 63%
(Source: Behavioral Risk Factors Surveillance Systems)
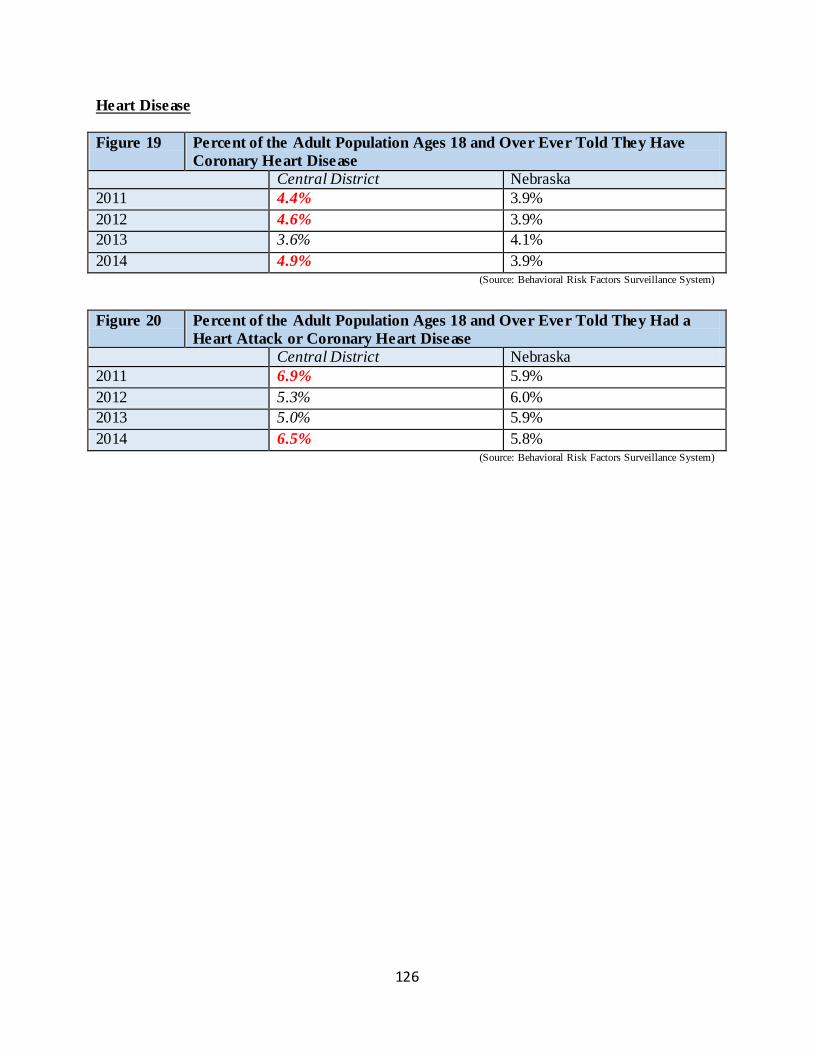
126
Heart Disease
Figure 19 Percent of the Adult Population Ages 18 and Over Ever Told They Have
Coronary Heart Disease
Central District Nebraska
2011 4.4% 3.9%
2012 4.6% 3.9%
2013 3.6% 4.1%
2014 4.9% 3.9% (Source: Behavioral Risk Factors Surveillance System)
Figure 20 Percent of the Adult Population Ages 18 and Over Ever Told They Had a
Heart Attack or Coronary Heart Disease
Central District Nebraska
2011 6.9% 5.9%
2012 5.3% 6.0%
2013 5.0% 5.9%
2014 6.5% 5.8% (Source: Behavioral Risk Factors Surveillance System)
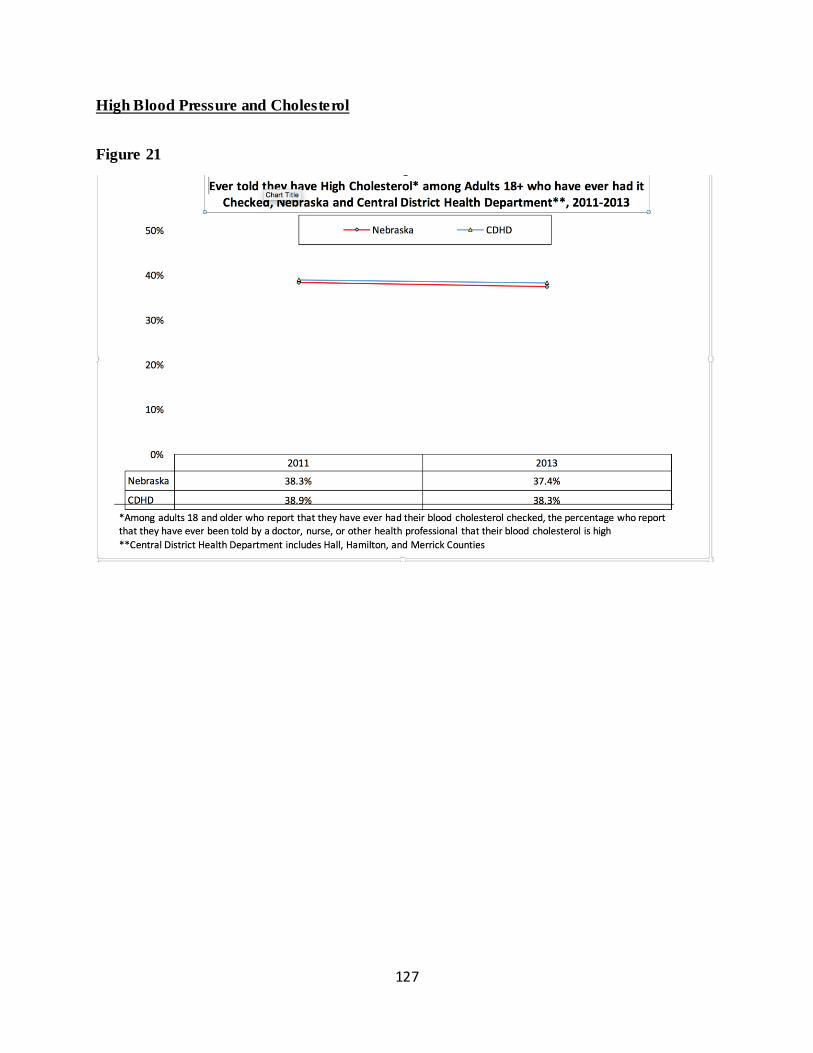
127
High Blood Pressure and Cholesterol
Figure 21
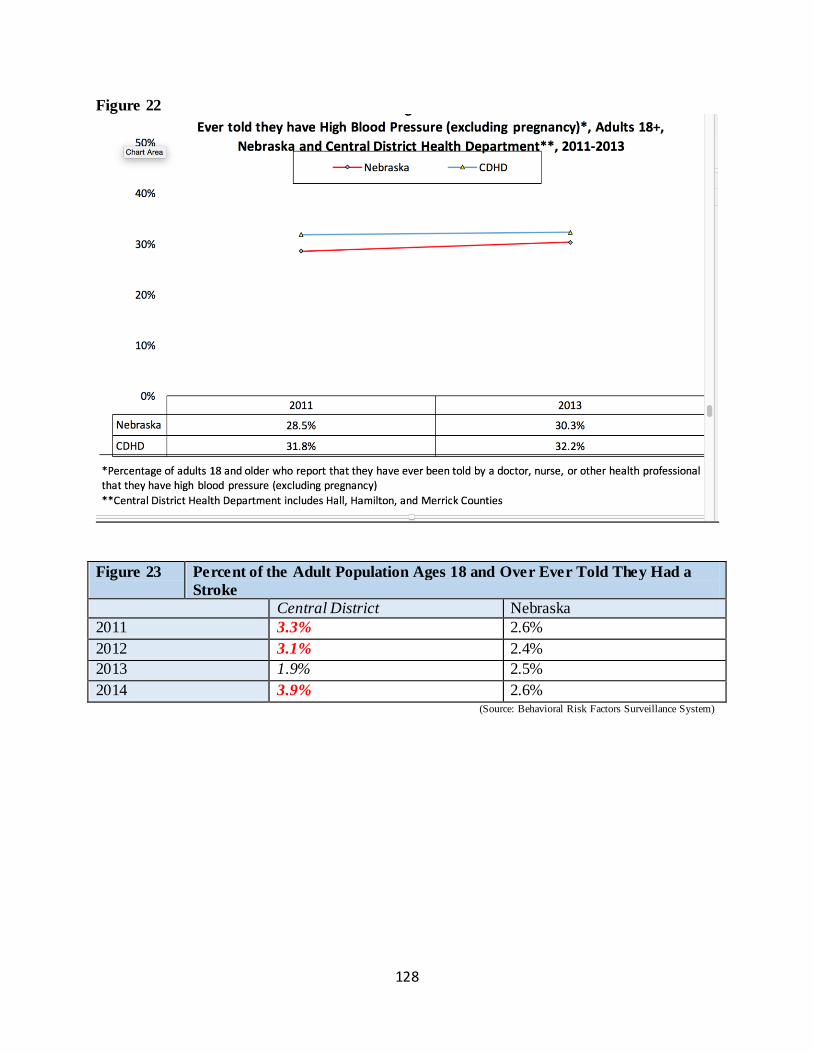
128
Figure 22
Figure 23 Percent of the Adult Population Ages 18 and Over Ever Told They Had a
Stroke
Central District Nebraska
2011 3.3% 2.6%
2012 3.1% 2.4%
2013 1.9% 2.5%
2014 3.9% 2.6% (Source: Behavioral Risk Factors Surveillance System)
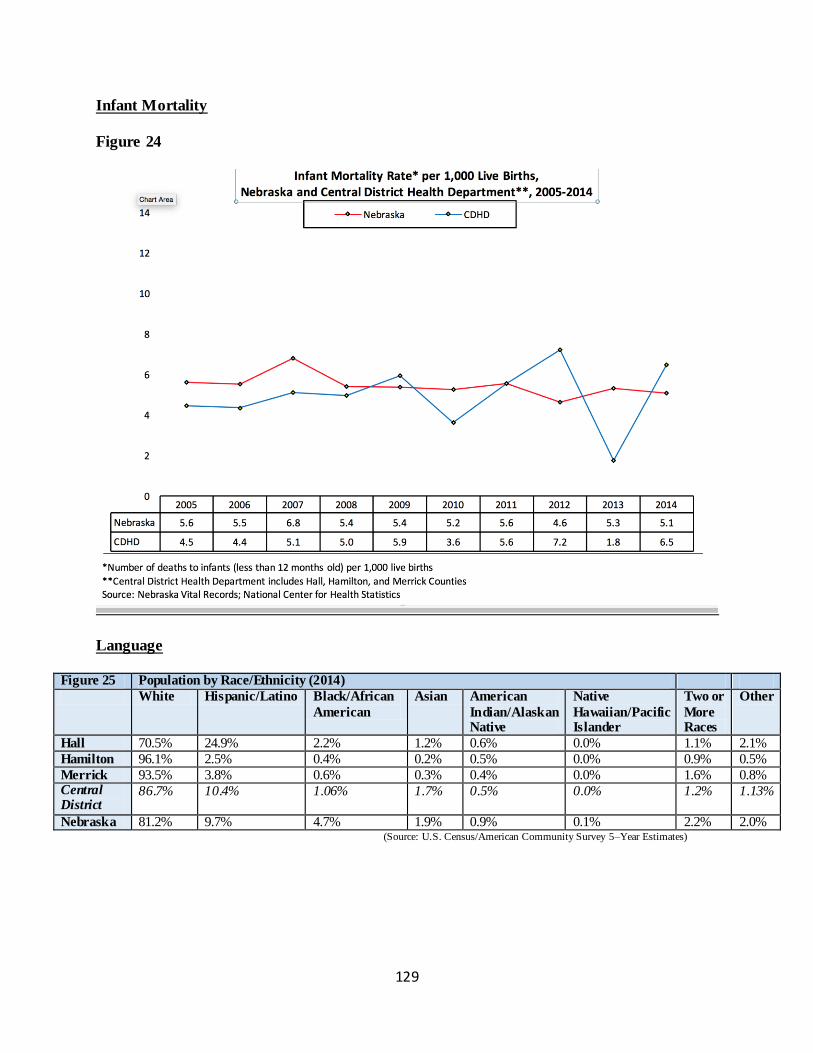
129
Infant Mortality
Figure 24
Language
Figure 25 Population by Race/Ethnicity (2014)
White Hispanic/Latino Black/African
American
Asian American
Indian/Alaskan Native
Native
Hawaiian/Pacific Islander
Two or
More Races
Other
Hall 70.5% 24.9% 2.2% 1.2% 0.6% 0.0% 1.1% 2.1%
Hamilton 96.1% 2.5% 0.4% 0.2% 0.5% 0.0% 0.9% 0.5%
Merrick 93.5% 3.8% 0.6% 0.3% 0.4% 0.0% 1.6% 0.8% Central District
86.7% 10.4% 1.06% 1.7% 0.5% 0.0% 1.2% 1.13%
Nebraska 81.2% 9.7% 4.7% 1.9% 0.9% 0.1% 2.2% 2.0% (Source: U.S. Census/American Community Survey 5–Year Estimates)
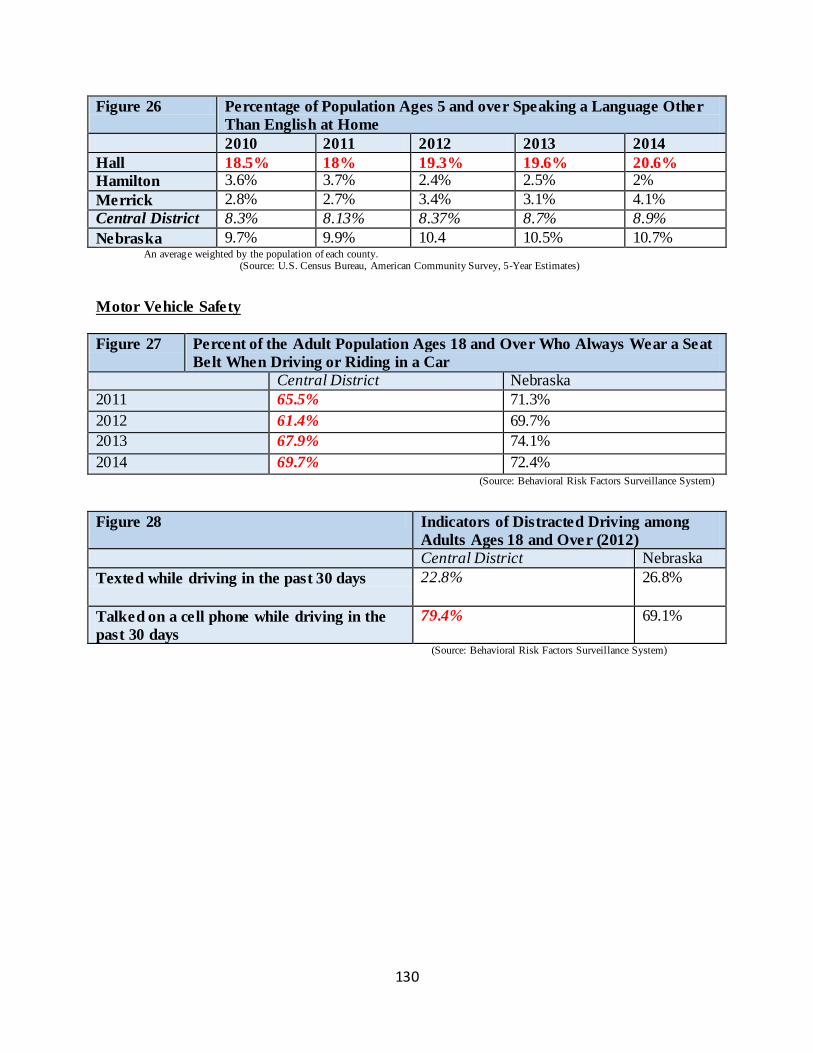
130
Figure 26 Percentage of Population Ages 5 and over Speaking a Language Other
Than English at Home
2010 2011 2012 2013 2014
Hall 18.5% 18% 19.3% 19.6% 20.6%
Hamilton 3.6% 3.7% 2.4% 2.5% 2%
Merrick 2.8% 2.7% 3.4% 3.1% 4.1%
Central District 8.3% 8.13% 8.37% 8.7% 8.9%
Nebraska 9.7% 9.9% 10.4 10.5% 10.7% An average weighted by the population of each county. (Source: U.S. Census Bureau, American Community Survey, 5-Year Estimates)
Motor Vehicle Safety
Figure 27 Percent of the Adult Population Ages 18 and Over Who Always Wear a Seat
Belt When Driving or Riding in a Car
Central District Nebraska
2011 65.5% 71.3%
2012 61.4% 69.7%
2013 67.9% 74.1%
2014 69.7% 72.4% (Source: Behavioral Risk Factors Surveillance System)
Figure 28 Indicators of Distracted Driving among
Adults Ages 18 and Over (2012)
Central District Nebraska
Texted while driving in the past 30 days 22.8% 26.8%
Talked on a cell phone while driving in the
past 30 days
79.4% 69.1%
(Source: Behavioral Risk Factors Surveillance System)
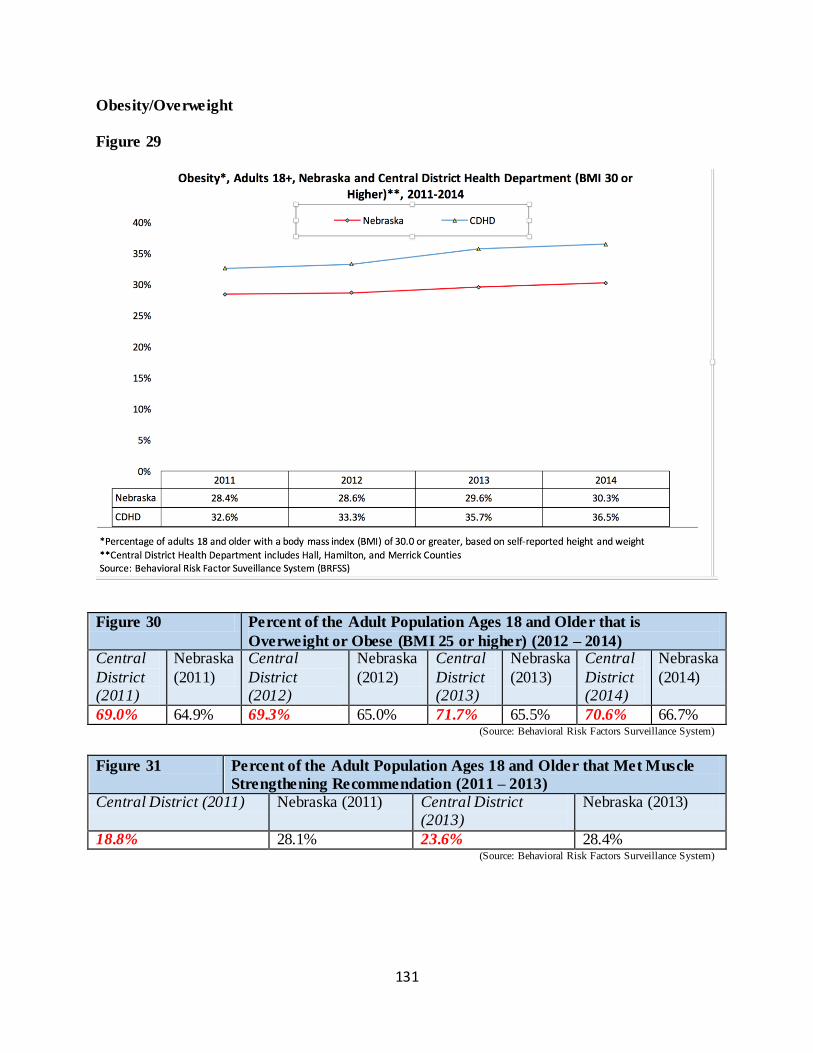
131
Obesity/Overweight
Figure 29
Figure 30 Percent of the Adult Population Ages 18 and Older that is
Overweight or Obese (BMI 25 or higher) (2012 – 2014) Central
District (2011)
Nebraska
(2011)
Central
District (2012)
Nebraska
(2012)
Central
District (2013)
Nebraska
(2013)
Central
District (2014)
Nebraska
(2014)
69.0% 64.9% 69.3% 65.0% 71.7% 65.5% 70.6% 66.7% (Source: Behavioral Risk Factors Surveillance System)
Figure 31 Percent of the Adult Population Ages 18 and Older that Met Muscle
Strengthening Recommendation (2011 – 2013)
Central District (2011) Nebraska (2011) Central District (2013)
Nebraska (2013)
18.8% 28.1% 23.6% 28.4% (Source: Behavioral Risk Factors Surveillance System)
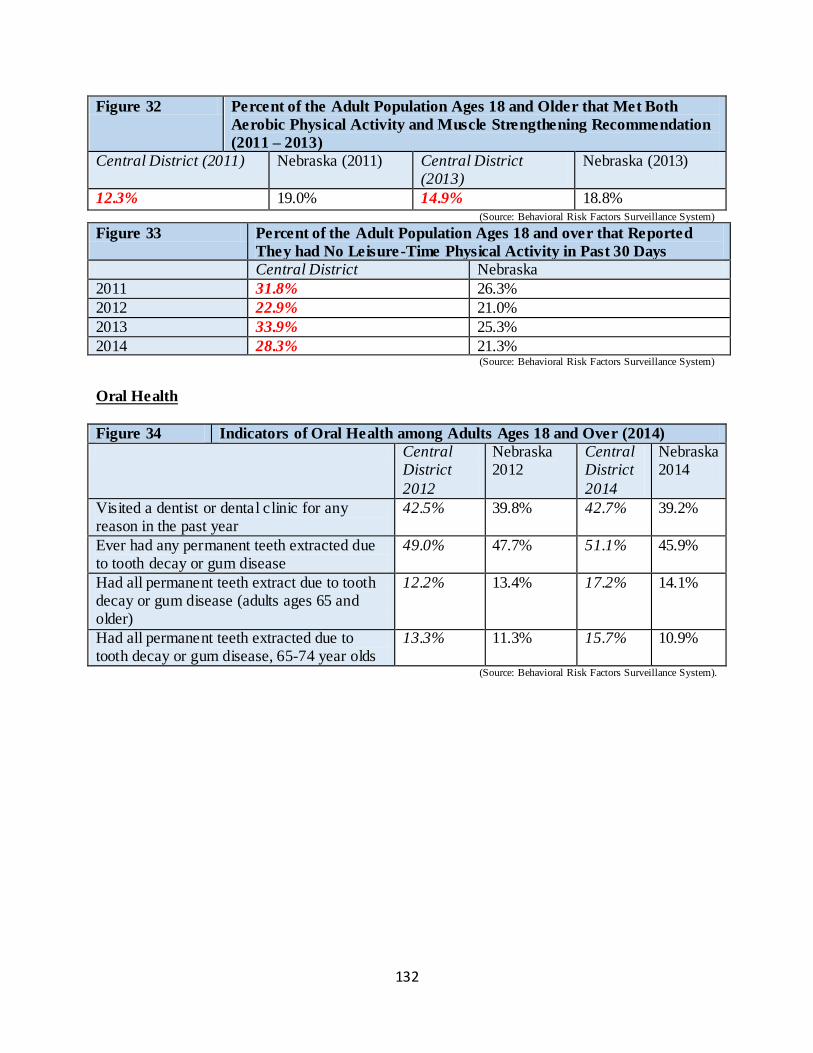
132
Figure 32 Percent of the Adult Population Ages 18 and Older that Met Both
Aerobic Physical Activity and Muscle Strengthening Recommendation
(2011 – 2013)
Central District (2011) Nebraska (2011) Central District (2013)
Nebraska (2013)
12.3% 19.0% 14.9% 18.8% (Source: Behavioral Risk Factors Surveillance System)
Figure 33 Percent of the Adult Population Ages 18 and over that Reported
They had No Leisure-Time Physical Activity in Past 30 Days
Central District Nebraska
2011 31.8% 26.3%
2012 22.9% 21.0%
2013 33.9% 25.3%
2014 28.3% 21.3% (Source: Behavioral Risk Factors Surveillance System)
Oral Health
Figure 34 Indicators of Oral Health among Adults Ages 18 and Over (2014)
Central District
2012
Nebraska 2012
Central District
2014
Nebraska 2014
Visited a dentist or dental clinic for any reason in the past year
42.5% 39.8% 42.7% 39.2%
Ever had any permanent teeth extracted due to tooth decay or gum disease
49.0% 47.7% 51.1% 45.9%
Had all permanent teeth extract due to tooth decay or gum disease (adults ages 65 and older)
12.2% 13.4% 17.2% 14.1%
Had all permanent teeth extracted due to tooth decay or gum disease, 65-74 year olds
13.3% 11.3% 15.7% 10.9%
(Source: Behavioral Risk Factors Surveillance System).
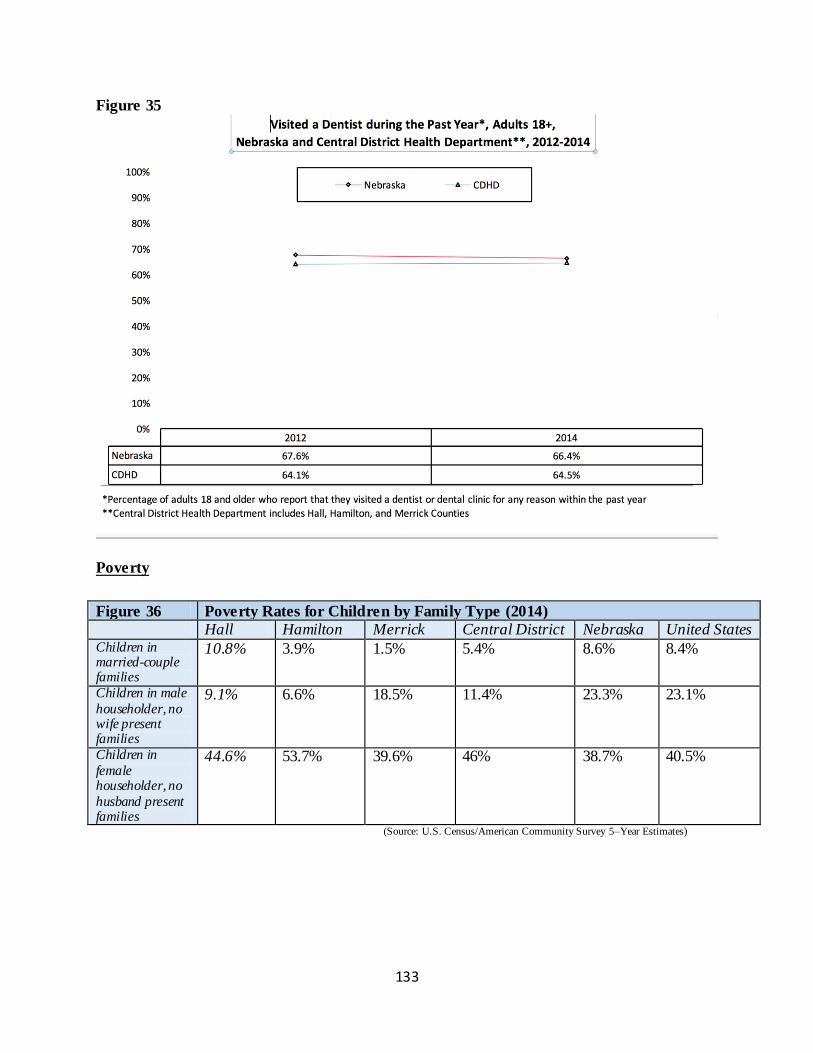
133
Figure 35
Poverty
Figure 36 Poverty Rates for Children by Family Type (2014)
Hall Hamilton Merrick Central District Nebraska United States Children in married-couple families
10.8% 3.9% 1.5% 5.4% 8.6% 8.4%
Children in male
householder, no wife present families
9.1% 6.6% 18.5% 11.4% 23.3% 23.1%
Children in
female householder, no
husband present families
44.6% 53.7% 39.6% 46% 38.7% 40.5%
(Source: U.S. Census/American Community Survey 5–Year Estimates)
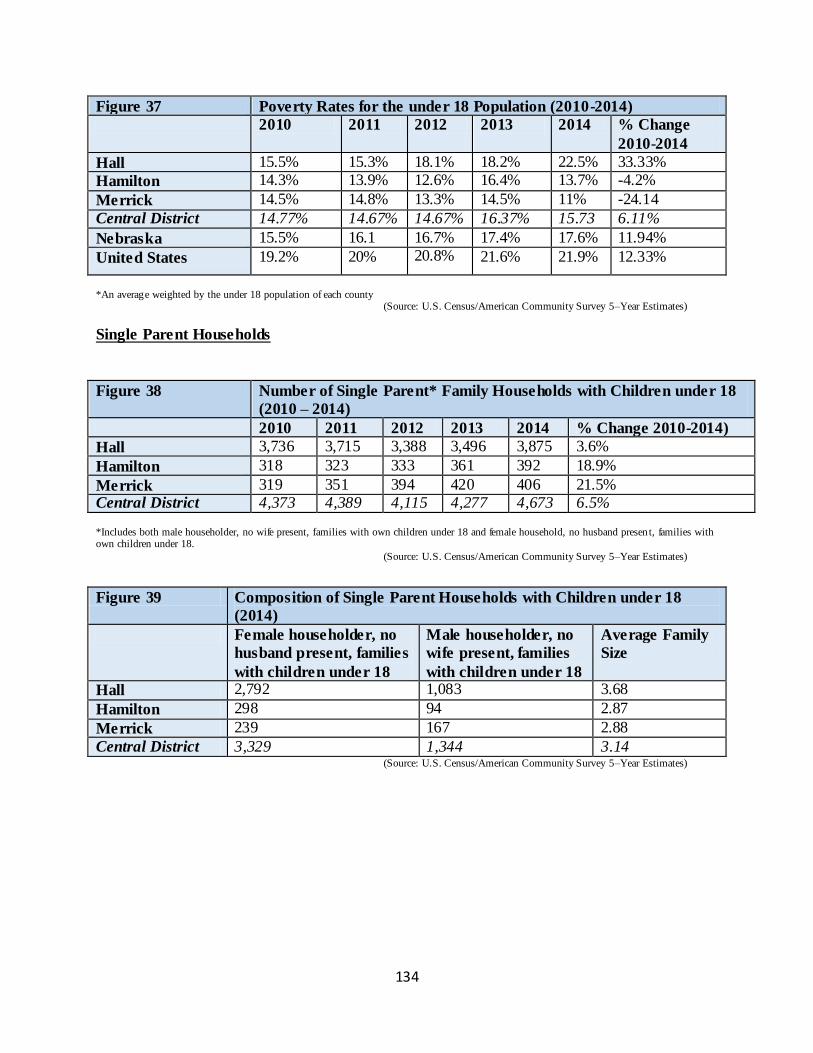
134
Figure 37 Poverty Rates for the under 18 Population (2010-2014)
2010 2011 2012 2013 2014 % Change
2010-2014
Hall 15.5% 15.3% 18.1% 18.2% 22.5% 33.33%
Hamilton 14.3% 13.9% 12.6% 16.4% 13.7% -4.2%
Merrick 14.5% 14.8% 13.3% 14.5% 11% -24.14
Central District 14.77% 14.67% 14.67% 16.37% 15.73 6.11%
Nebraska 15.5% 16.1 16.7% 17.4% 17.6% 11.94%
United States 19.2% 20% 20.8% 21.6% 21.9% 12.33%
*An average weighted by the under 18 population of each county (Source: U.S. Census/American Community Survey 5–Year Estimates)
Single Parent Households
Figure 38 Number of Single Parent* Family Households with Children under 18
(2010 – 2014)
2010 2011 2012 2013 2014 % Change 2010-2014)
Hall 3,736 3,715 3,388 3,496 3,875 3.6%
Hamilton 318 323 333 361 392 18.9%
Merrick 319 351 394 420 406 21.5% Central District 4,373 4,389 4,115 4,277 4,673 6.5%
*Includes both male householder, no wife present, families with own children under 18 and female household, no husband presen t, families with own children under 18.
(Source: U.S. Census/American Community Survey 5–Year Estimates)
Figure 39 Composition of Single Parent Households with Children under 18
(2014)
Female householder, no
husband present, families
with children under 18
Male householder, no
wife present, families
with children under 18
Average Family
Size
Hall 2,792 1,083 3.68
Hamilton 298 94 2.87
Merrick 239 167 2.88
Central District 3,329 1,344 3.14 (Source: U.S. Census/American Community Survey 5–Year Estimates)
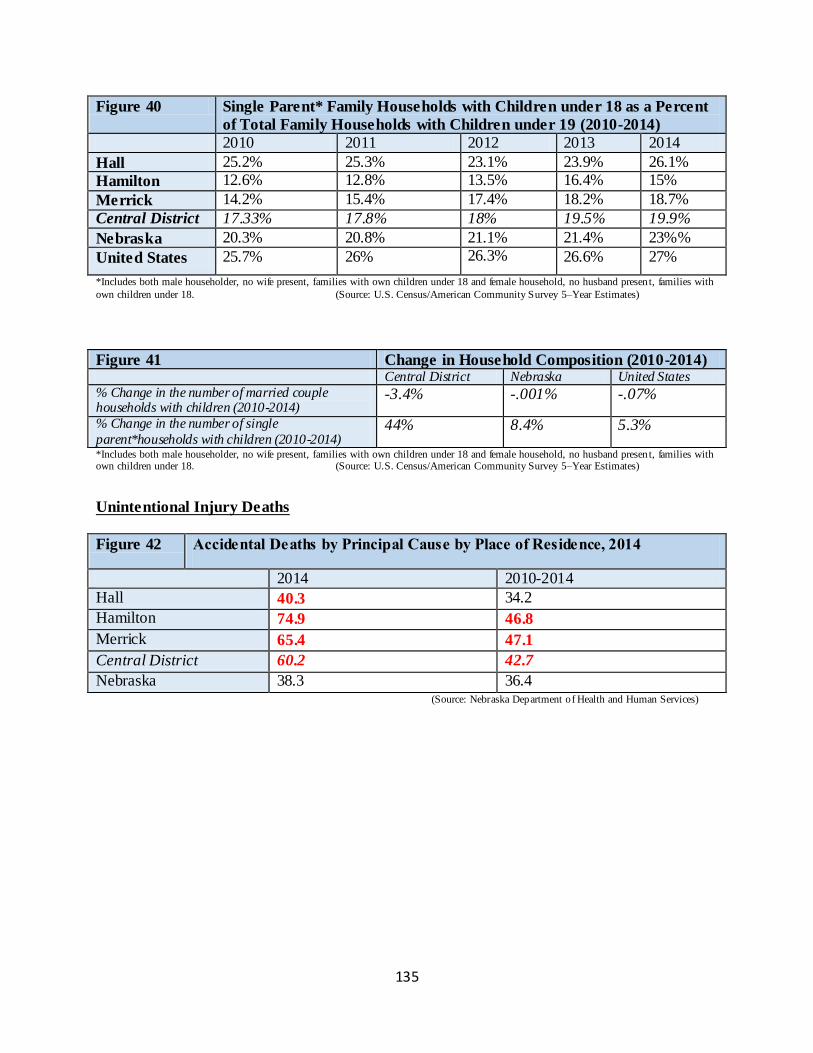
135
Figure 40 Single Parent* Family Households with Children under 18 as a Percent
of Total Family Households with Children under 19 (2010-2014)
2010 2011 2012 2013 2014
Hall 25.2% 25.3% 23.1% 23.9% 26.1%
Hamilton 12.6% 12.8% 13.5% 16.4% 15%
Merrick 14.2% 15.4% 17.4% 18.2% 18.7%
Central District 17.33% 17.8% 18% 19.5% 19.9%
Nebraska 20.3% 20.8% 21.1% 21.4% 23%%
United States 25.7% 26% 26.3% 26.6% 27%
*Includes both male householder, no wife present, families with own children under 18 and female household, no husband presen t, families with
own children under 18. (Source: U.S. Census/American Community Survey 5–Year Estimates)
Figure 41 Change in Household Composition (2010-2014) Central District Nebraska United States
% Change in the number of married couple households with children (2010-2014)
-3.4% -.001% -.07%
% Change in the number of single
parent*households with children (2010-2014) 44% 8.4% 5.3%
*Includes both male householder, no wife present, families with own children under 18 and female household, no husband presen t, families with own children under 18. (Source: U.S. Census/American Community Survey 5–Year Estimates)
Unintentional Injury Deaths
Figure 42 Accidental Deaths by Principal Cause by Place of Residence, 2014
2014 2010-2014
Hall 40.3 34.2
Hamilton 74.9 46.8
Merrick 65.4 47.1
Central District 60.2 42.7
Nebraska 38.3 36.4 (Source: Nebraska Department of Health and Human Services)
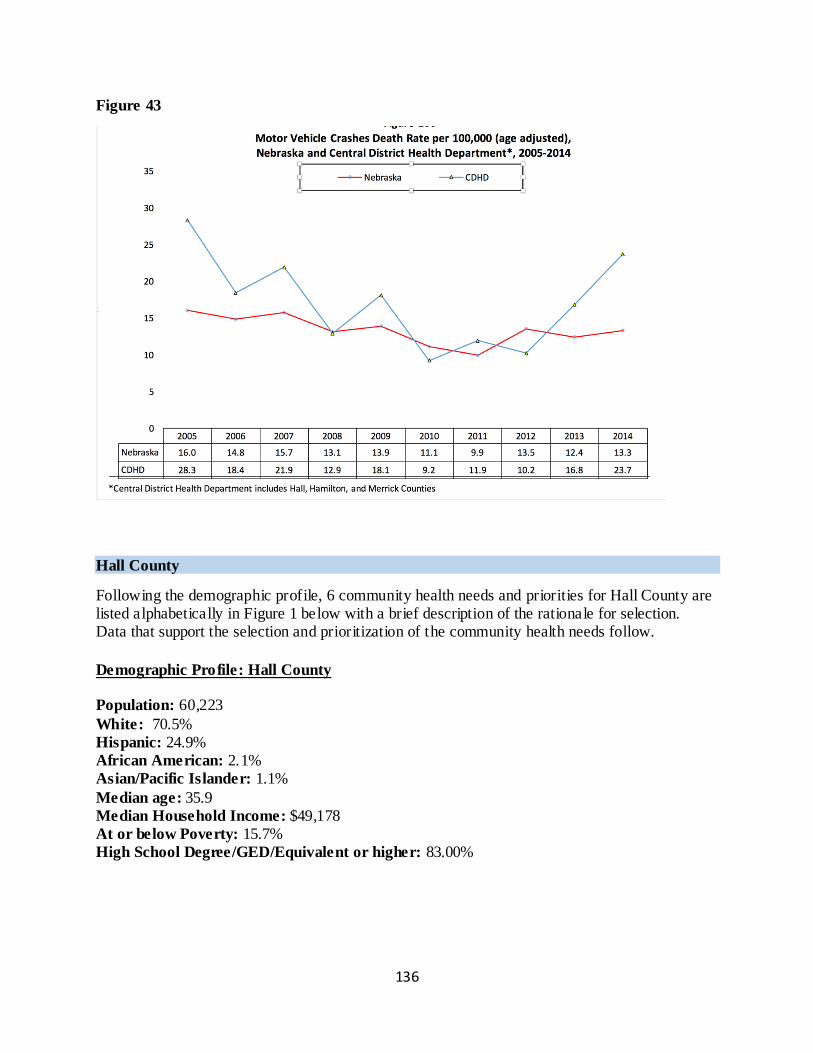
136
Figure 43
Hall County
Following the demographic profile, 6 community health needs and priorities for Hall County are listed alphabetically in Figure 1 below with a brief description of the rationale for selection. Data that support the selection and prioritization of the community health needs follow.
Demographic Profile: Hall County
Population: 60,223
White: 70.5%
Hispanic: 24.9% African American: 2.1% Asian/Pacific Islander: 1.1%
Median age: 35.9
Median Household Income: $49,178
At or below Poverty: 15.7%
High School Degree/GED/Equivalent or higher: 83.00%
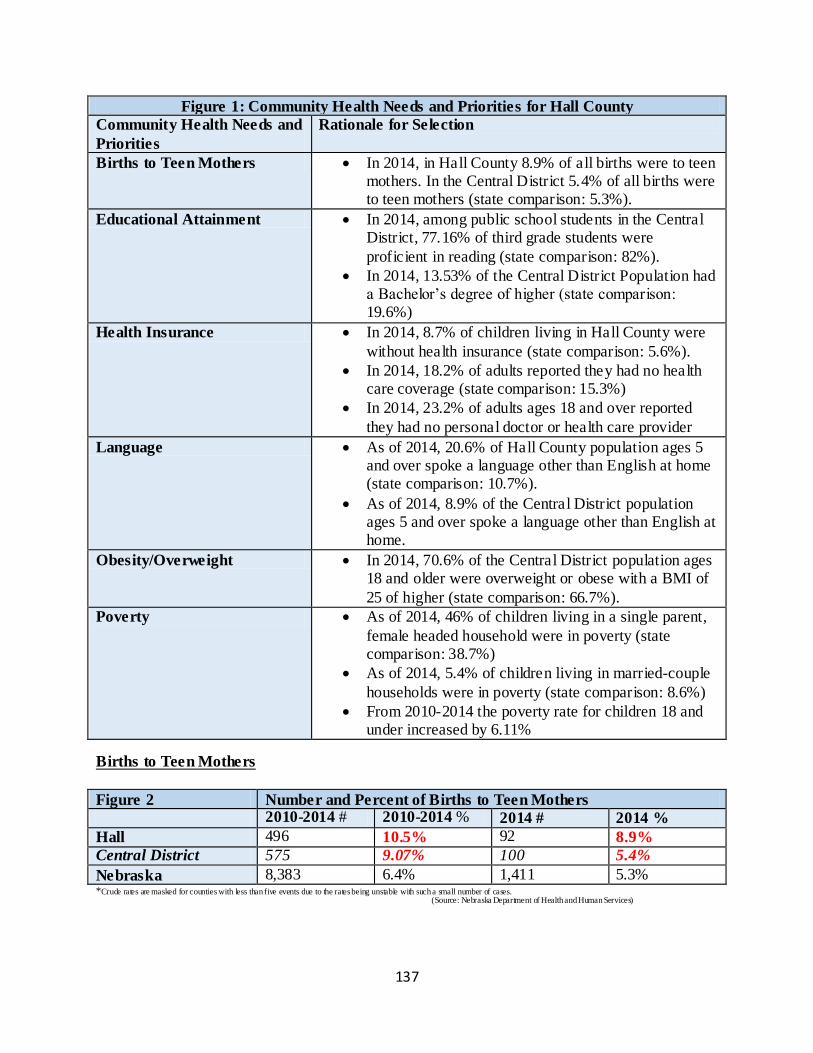
137
Figure 1: Community Health Needs and Priorities for Hall County
Community Health Needs and
Priorities
Rationale for Selection
Births to Teen Mothers In 2014, in Hall County 8.9% of all births were to teen mothers. In the Central District 5.4% of all births were to teen mothers (state comparison: 5.3%).
Educational Attainment In 2014, among public school students in the Central District, 77.16% of third grade students were
proficient in reading (state comparison: 82%).
In 2014, 13.53% of the Central District Population had a Bachelor’s degree of higher (state comparison: 19.6%)
Health Insurance In 2014, 8.7% of children living in Hall County were
without health insurance (state comparison: 5.6%).
In 2014, 18.2% of adults reported they had no health care coverage (state comparison: 15.3%)
In 2014, 23.2% of adults ages 18 and over reported
they had no personal doctor or health care provider
Language As of 2014, 20.6% of Hall County population ages 5 and over spoke a language other than English at home (state comparison: 10.7%).
As of 2014, 8.9% of the Central District population ages 5 and over spoke a language other than English at home.
Obesity/Overweight In 2014, 70.6% of the Central District population ages 18 and older were overweight or obese with a BMI of
25 of higher (state comparison: 66.7%).
Poverty As of 2014, 46% of children living in a single parent,
female headed household were in poverty (state comparison: 38.7%)
As of 2014, 5.4% of children living in married-couple
households were in poverty (state comparison: 8.6%)
From 2010-2014 the poverty rate for children 18 and under increased by 6.11%
Births to Teen Mothers
Figure 2 Number and Percent of Births to Teen Mothers
2010-2014 # 2010-2014 % 2014 # 2014 %
Hall 496 10.5% 92 8.9%
Central District 575 9.07% 100 5.4%
Nebraska 8,383 6.4% 1,411 5.3% *Crude rates are masked for counties with less than five events due to the rates being unstable with such a small number of cases.
(Source: Nebraska Department of Health and Human Services)
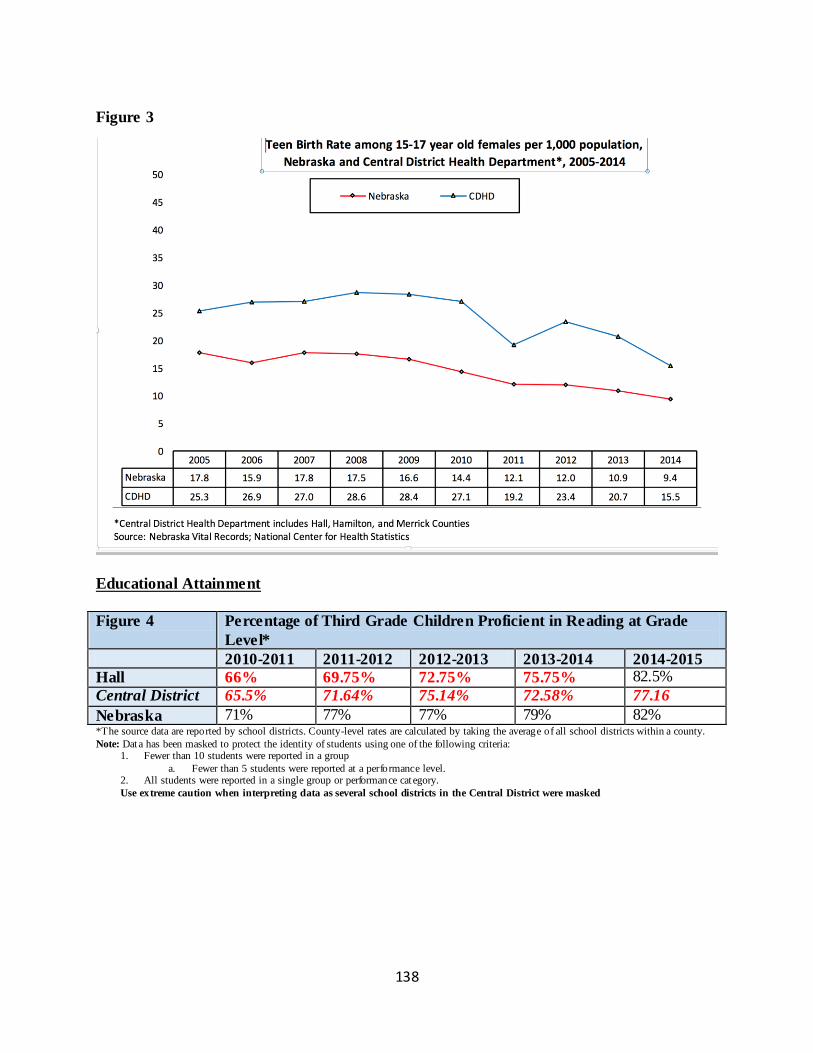
138
Figure 3
Educational Attainment
Figure 4 Percentage of Third Grade Children Proficient in Reading at Grade
Level*
2010-2011 2011-2012 2012-2013 2013-2014 2014-2015
Hall 66% 69.75% 72.75% 75.75% 82.5%
Central District 65.5% 71.64% 75.14% 72.58% 77.16
Nebraska 71% 77% 77% 79% 82% *The source data are reported by school districts. County-level rates are calculated by taking the average of all school districts within a county.
Note: Data has been masked to protect the identity of students using one of the following criteria: 1. Fewer than 10 students were reported in a group
a. Fewer than 5 students were reported at a performance level. 2. All students were reported in a single group or performance cat egory.
Use extreme caution when interpreting data as several school districts in the Central District were masked
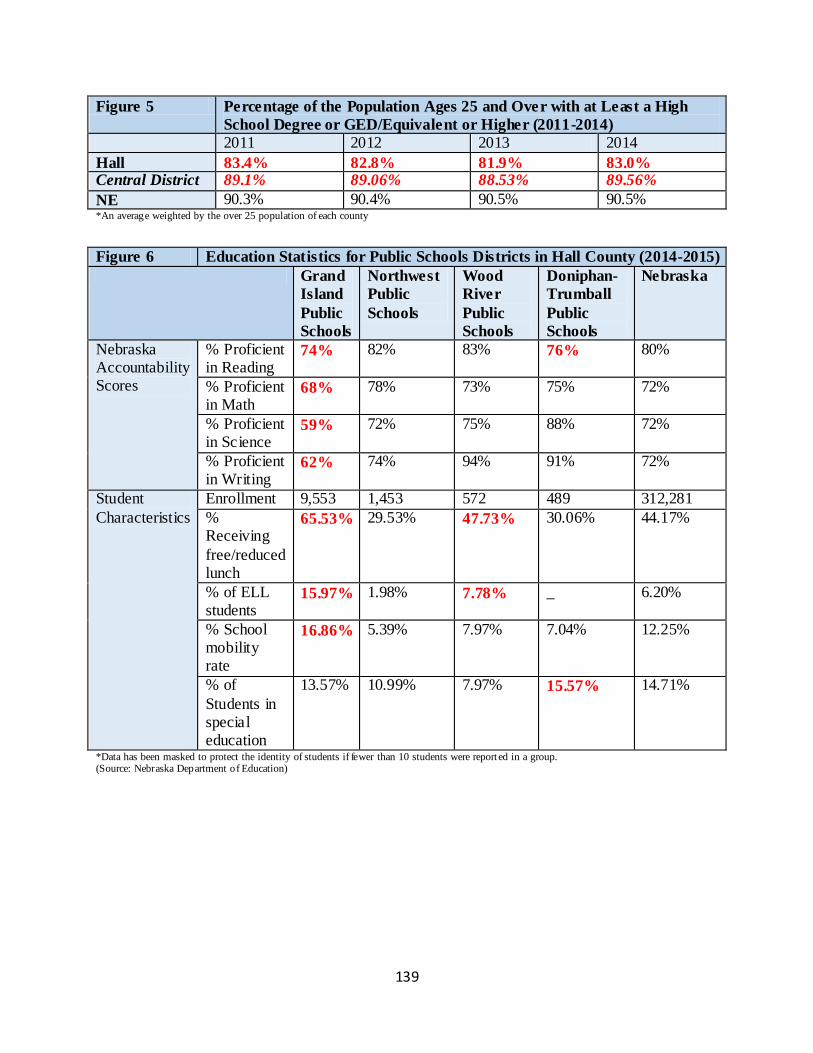
139
Figure 5 Percentage of the Population Ages 25 and Over with at Least a High
School Degree or GED/Equivalent or Higher (2011-2014)
2011 2012 2013 2014
Hall 83.4% 82.8% 81.9% 83.0% Central District 89.1% 89.06% 88.53% 89.56%
NE 90.3% 90.4% 90.5% 90.5% *An average weighted by the over 25 population of each county
Figure 6 Education Statistics for Public Schools Districts in Hall County (2014-2015)
Grand
Island
Public
Schools
Northwest
Public
Schools
Wood
River
Public
Schools
Doniphan-
Trumball
Public
Schools
Nebraska
Nebraska Accountability Scores
% Proficient in Reading
74% 82% 83% 76% 80%
% Proficient in Math
68% 78% 73% 75% 72%
% Proficient in Science
59% 72% 75% 88% 72%
% Proficient in Writing
62% 74% 94% 91% 72%
Student
Characteristics
Enrollment 9,553 1,453 572 489 312,281
% Receiving
free/reduced lunch
65.53% 29.53% 47.73% 30.06% 44.17%
% of ELL students
15.97% 1.98% 7.78% _ 6.20%
% School mobility rate
16.86% 5.39% 7.97% 7.04% 12.25%
% of
Students in special education
13.57% 10.99% 7.97% 15.57% 14.71%
*Data has been masked to protect the identity of students if fewer than 10 students were report ed in a group. (Source: Nebraska Department of Education)
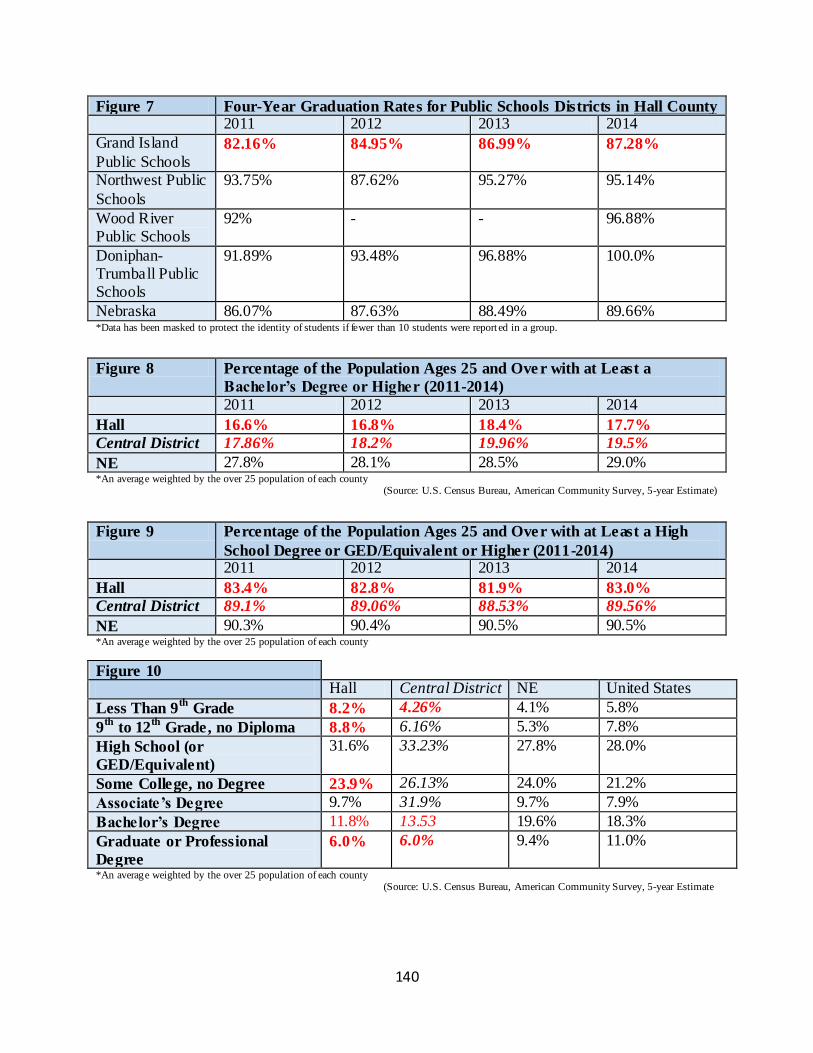
140
Figure 7 Four-Year Graduation Rates for Public Schools Districts in Hall County 2011 2012 2013 2014
Grand Island
Public Schools 82.16% 84.95% 86.99% 87.28%
Northwest Public
Schools
93.75% 87.62% 95.27% 95.14%
Wood River Public Schools
92% - - 96.88%
Doniphan-Trumball Public Schools
91.89% 93.48% 96.88% 100.0%
Nebraska 86.07% 87.63% 88.49% 89.66% *Data has been masked to protect the identity of students if fewer than 10 students were report ed in a group.
Figure 8 Percentage of the Population Ages 25 and Ove r with at Least a
Bachelor’s Degree or Higher (2011-2014)
2011 2012 2013 2014
Hall 16.6% 16.8% 18.4% 17.7%
Central District 17.86% 18.2% 19.96% 19.5%
NE 27.8% 28.1% 28.5% 29.0% *An average weighted by the over 25 population of each county (Source: U.S. Census Bureau, American Community Survey, 5-year Estimate)
Figure 9 Percentage of the Population Ages 25 and Over with at Least a High
School Degree or GED/Equivalent or Higher (2011-2014)
2011 2012 2013 2014
Hall 83.4% 82.8% 81.9% 83.0%
Central District 89.1% 89.06% 88.53% 89.56%
NE 90.3% 90.4% 90.5% 90.5% *An average weighted by the over 25 population of each county
Figure 10 Hall Central District NE United States
Less Than 9th
Grade 8.2% 4.26% 4.1% 5.8%
9th
to 12th
Grade, no Diploma 8.8% 6.16% 5.3% 7.8%
High School (or
GED/Equivalent)
31.6% 33.23% 27.8% 28.0%
Some College, no Degree 23.9% 26.13% 24.0% 21.2%
Associate’s Degree 9.7% 31.9% 9.7% 7.9%
Bachelor’s Degree 11.8% 13.53 19.6% 18.3%
Graduate or Professional
Degree
6.0% 6.0% 9.4% 11.0%
*An average weighted by the over 25 population of each county (Source: U.S. Census Bureau, American Community Survey, 5-year Estimate
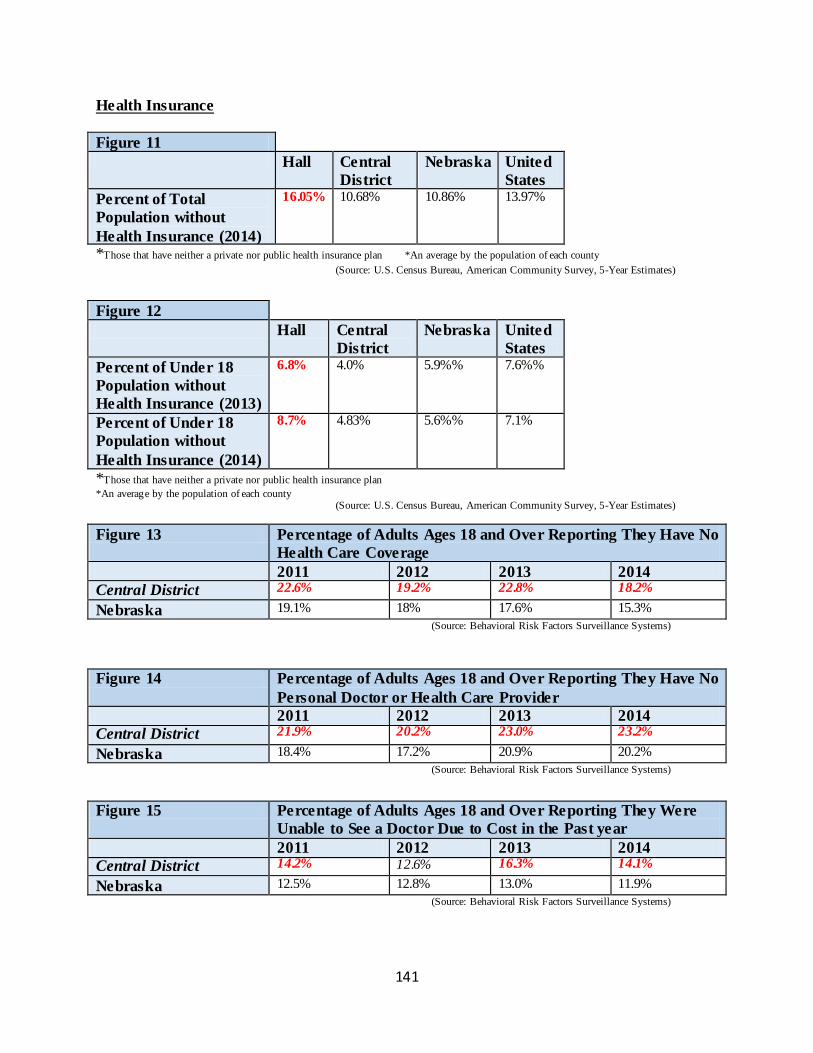
141
Health Insurance
Figure 11
Hall Central
District
Nebraska United
States
Percent of Total
Population without
Health Insurance (2014)
16.05% 10.68% 10.86% 13.97%
*Those that have neither a private nor public health insurance plan *An average by the population of each county
(Source: U.S. Census Bureau, American Community Survey, 5-Year Estimates)
Figure 12
Hall Central
District
Nebraska United
States
Percent of Under 18
Population without
Health Insurance (2013)
6.8% 4.0% 5.9%% 7.6%%
Percent of Under 18
Population without
Health Insurance (2014)
8.7% 4.83% 5.6%% 7.1%
*Those that have neither a private nor public health insurance plan
*An average by the population of each county (Source: U.S. Census Bureau, American Community Survey, 5-Year Estimates)
Figure 13 Percentage of Adults Ages 18 and Over Reporting They Have No
Health Care Coverage
2011 2012 2013 2014
Central District 22.6% 19.2% 22.8% 18.2%
Nebraska 19.1% 18% 17.6% 15.3%
(Source: Behavioral Risk Factors Surveillance Systems)
Figure 14 Percentage of Adults Ages 18 and Over Reporting They Have No
Personal Doctor or Health Care Provider
2011 2012 2013 2014
Central District 21.9% 20.2% 23.0% 23.2%
Nebraska 18.4% 17.2% 20.9% 20.2%
(Source: Behavioral Risk Factors Surveillance Systems)
Figure 15 Percentage of Adults Ages 18 and Over Reporting They Were
Unable to See a Doctor Due to Cost in the Past year
2011 2012 2013 2014
Central District 14.2% 12.6% 16.3% 14.1%
Nebraska 12.5% 12.8% 13.0% 11.9%
(Source: Behavioral Risk Factors Surveillance Systems)
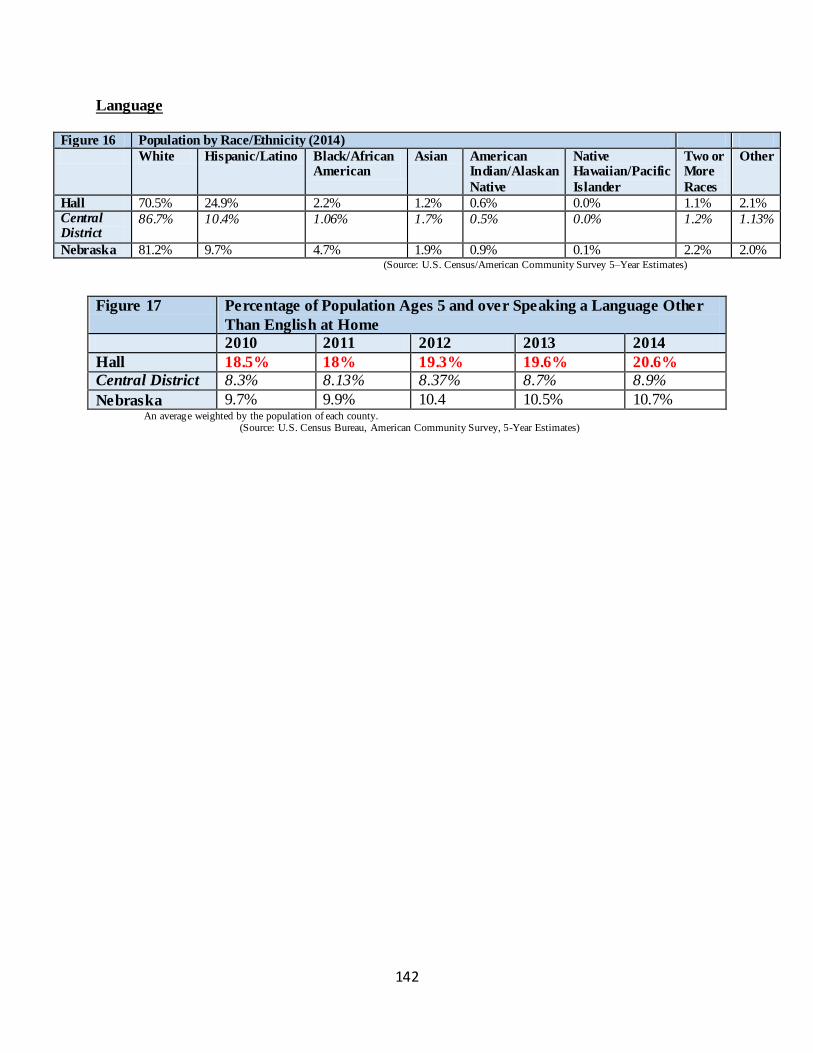
142
Language
Figure 16 Population by Race/Ethnicity (2014)
White Hispanic/Latino Black/African American
Asian American Indian/Alaskan
Native
Native Hawaiian/Pacific
Islander
Two or More
Races
Other
Hall 70.5% 24.9% 2.2% 1.2% 0.6% 0.0% 1.1% 2.1% Central District
86.7% 10.4% 1.06% 1.7% 0.5% 0.0% 1.2% 1.13%
Nebraska 81.2% 9.7% 4.7% 1.9% 0.9% 0.1% 2.2% 2.0% (Source: U.S. Census/American Community Survey 5–Year Estimates)
Figure 17 Percentage of Population Ages 5 and over Speaking a Language Other
Than English at Home
2010 2011 2012 2013 2014
Hall 18.5% 18% 19.3% 19.6% 20.6%
Central District 8.3% 8.13% 8.37% 8.7% 8.9%
Nebraska 9.7% 9.9% 10.4 10.5% 10.7% An average weighted by the population of each county. (Source: U.S. Census Bureau, American Community Survey, 5-Year Estimates)
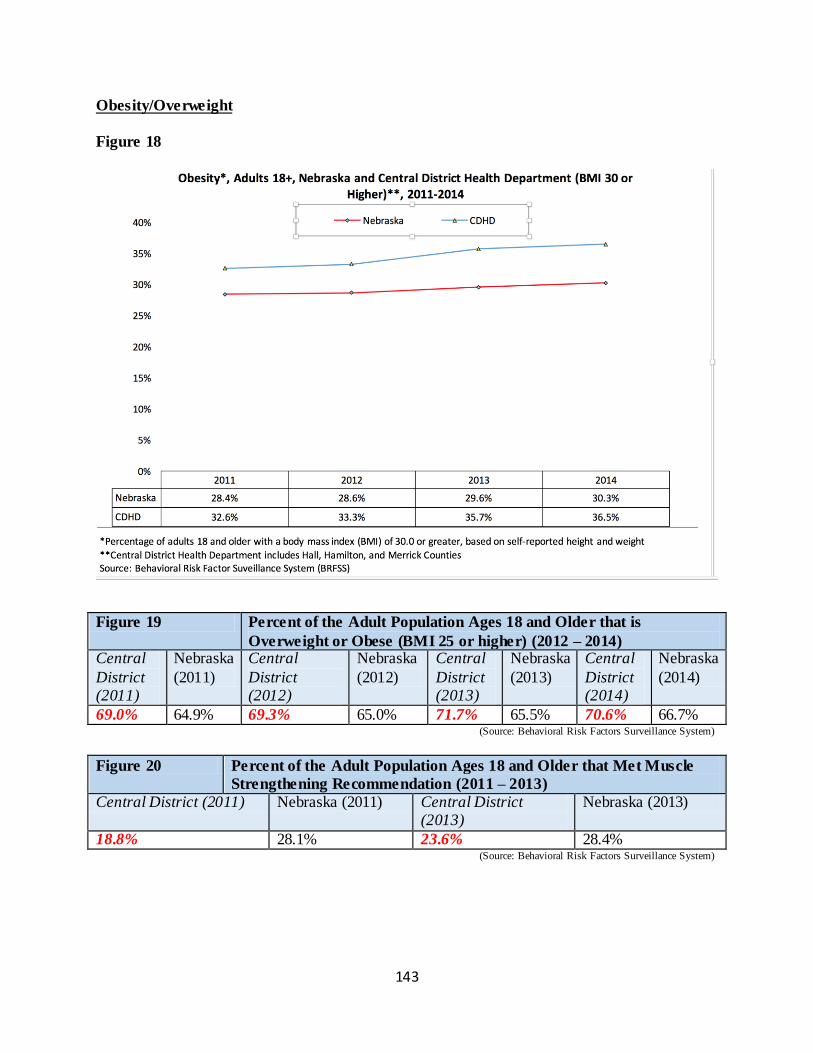
143
Obesity/Overweight
Figure 18
Figure 19 Percent of the Adult Population Ages 18 and Older that is
Overweight or Obese (BMI 25 or higher) (2012 – 2014) Central
District (2011)
Nebraska
(2011)
Central
District (2012)
Nebraska
(2012)
Central
District (2013)
Nebraska
(2013)
Central
District (2014)
Nebraska
(2014)
69.0% 64.9% 69.3% 65.0% 71.7% 65.5% 70.6% 66.7% (Source: Behavioral Risk Factors Surveillance System)
Figure 20 Percent of the Adult Population Ages 18 and Older that Met Muscle
Strengthening Recommendation (2011 – 2013)
Central District (2011) Nebraska (2011) Central District (2013)
Nebraska (2013)
18.8% 28.1% 23.6% 28.4% (Source: Behavioral Risk Factors Surveillance System)
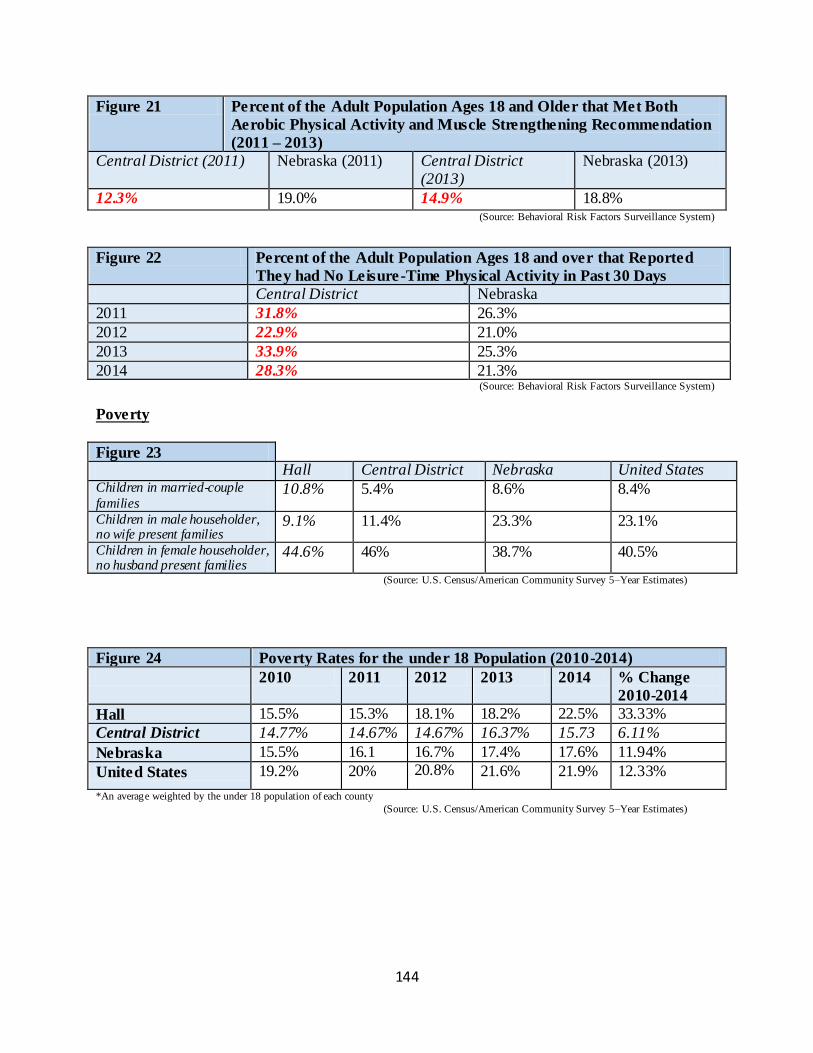
144
Figure 21 Percent of the Adult Population Ages 18 and Older that Met Both
Aerobic Physical Activity and Muscle Strengthening Recommendation
(2011 – 2013)
Central District (2011) Nebraska (2011) Central District (2013)
Nebraska (2013)
12.3% 19.0% 14.9% 18.8% (Source: Behavioral Risk Factors Surveillance System)
Figure 22 Percent of the Adult Population Ages 18 and over that Reported
They had No Leisure-Time Physical Activity in Past 30 Days
Central District Nebraska
2011 31.8% 26.3%
2012 22.9% 21.0%
2013 33.9% 25.3%
2014 28.3% 21.3% (Source: Behavioral Risk Factors Surveillance System)
Poverty
Figure 23 Hall Central District Nebraska United States Children in married-couple
families 10.8% 5.4% 8.6% 8.4%
Children in male householder, no wife present families
9.1% 11.4% 23.3% 23.1%
Children in female householder, no husband present families
44.6% 46% 38.7% 40.5%
(Source: U.S. Census/American Community Survey 5–Year Estimates)
Figure 24 Poverty Rates for the under 18 Population (2010-2014)
2010 2011 2012 2013 2014 % Change
2010-2014
Hall 15.5% 15.3% 18.1% 18.2% 22.5% 33.33%
Central District 14.77% 14.67% 14.67% 16.37% 15.73 6.11%
Nebraska 15.5% 16.1 16.7% 17.4% 17.6% 11.94%
United States 19.2% 20% 20.8% 21.6% 21.9% 12.33%
*An average weighted by the under 18 population of each county
(Source: U.S. Census/American Community Survey 5–Year Estimates)
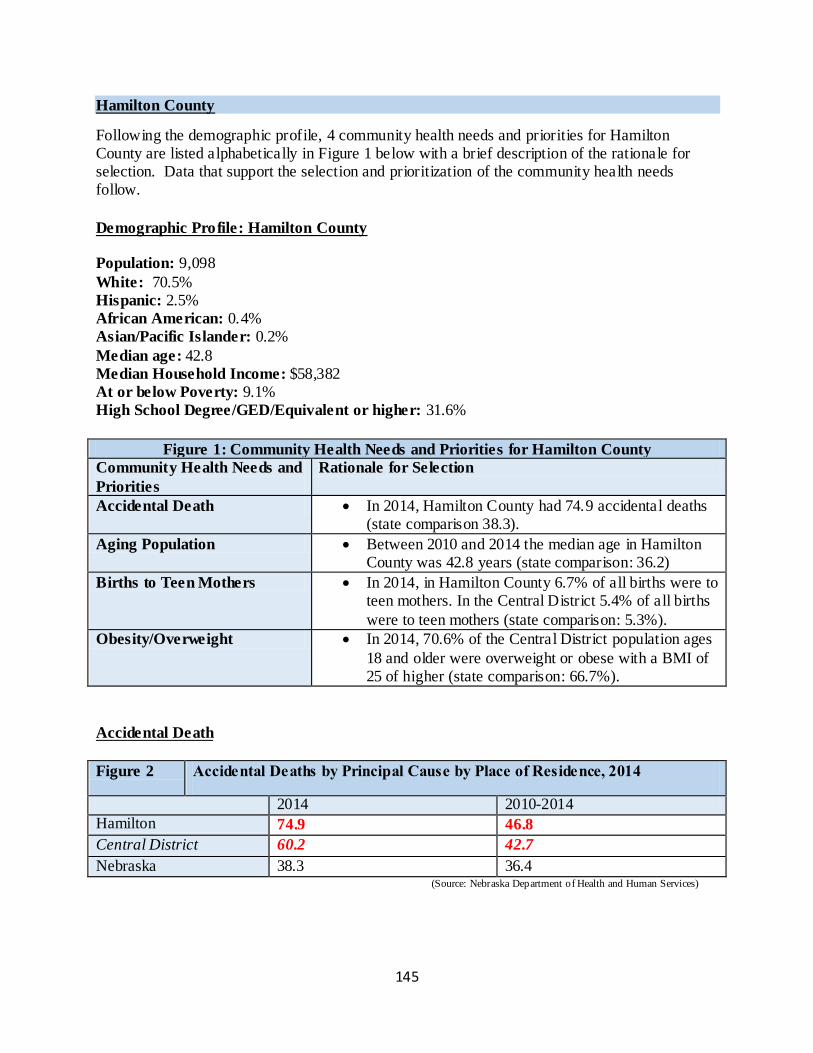
145
Hamilton County
Following the demographic profile, 4 community health needs and priorities for Hamilton County are listed alphabetically in Figure 1 below with a brief description of the rationale for selection. Data that support the selection and prioritization of the community health needs follow.
Demographic Profile: Hamilton County
Population: 9,098
White: 70.5%
Hispanic: 2.5% African American: 0.4% Asian/Pacific Islander: 0.2%
Median age: 42.8
Median Household Income: $58,382
At or below Poverty: 9.1%
High School Degree/GED/Equivalent or higher: 31.6%
Figure 1: Community Health Needs and Priorities for Hamilton County
Community Health Needs and
Priorities
Rationale for Selection
Accidental Death In 2014, Hamilton County had 74.9 accidental deaths (state comparison 38.3).
Aging Population Between 2010 and 2014 the median age in Hamilton County was 42.8 years (state comparison: 36.2)
Births to Teen Mothers In 2014, in Hamilton County 6.7% of all births were to teen mothers. In the Central District 5.4% of all births
were to teen mothers (state comparison: 5.3%).
Obesity/Overweight In 2014, 70.6% of the Central District population ages
18 and older were overweight or obese with a BMI of 25 of higher (state comparison: 66.7%).
Accidental Death
Figure 2 Accidental Deaths by Principal Cause by Place of Residence, 2014
2014 2010-2014
Hamilton 74.9 46.8
Central District 60.2 42.7
Nebraska 38.3 36.4 (Source: Nebraska Department of Health and Human Services)
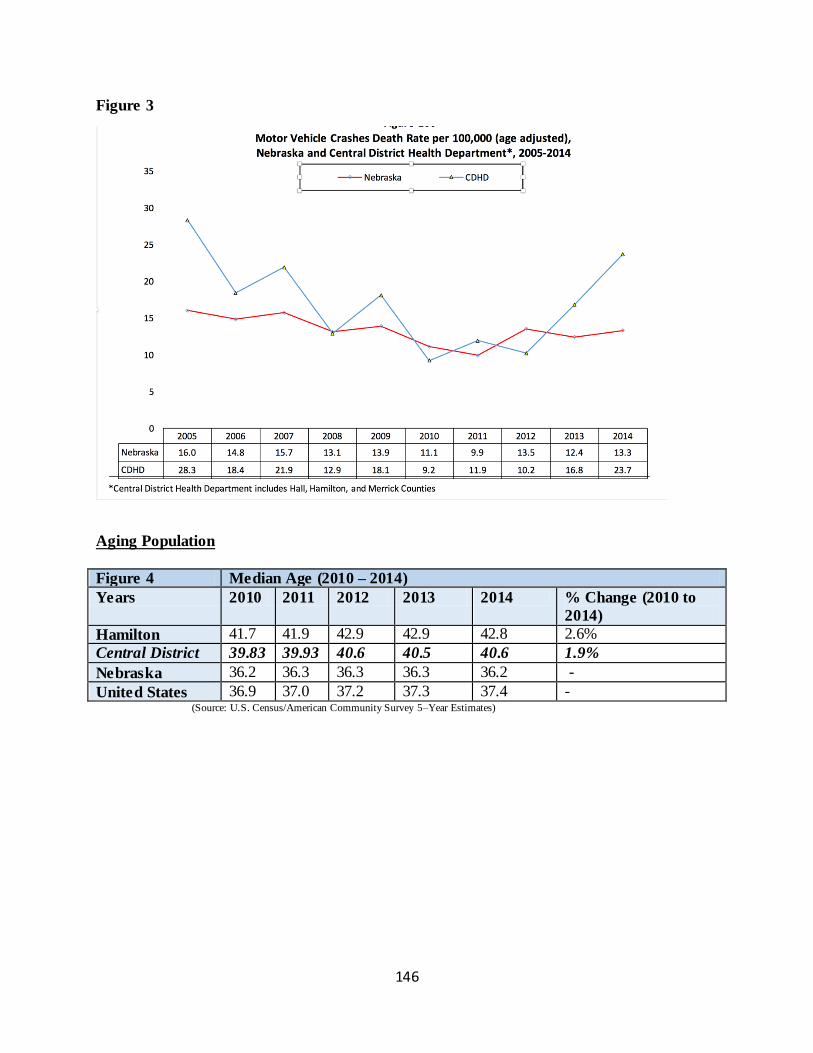
146
Figure 3
Aging Population
Figure 4 Median Age (2010 – 2014)
Years 2010 2011 2012 2013 2014 % Change (2010 to
2014)
Hamilton 41.7 41.9 42.9 42.9 42.8 2.6%
Central District 39.83 39.93 40.6 40.5 40.6 1.9%
Nebraska 36.2 36.3 36.3 36.3 36.2 -
United States 36.9 37.0 37.2 37.3 37.4 - (Source: U.S. Census/American Community Survey 5–Year Estimates)
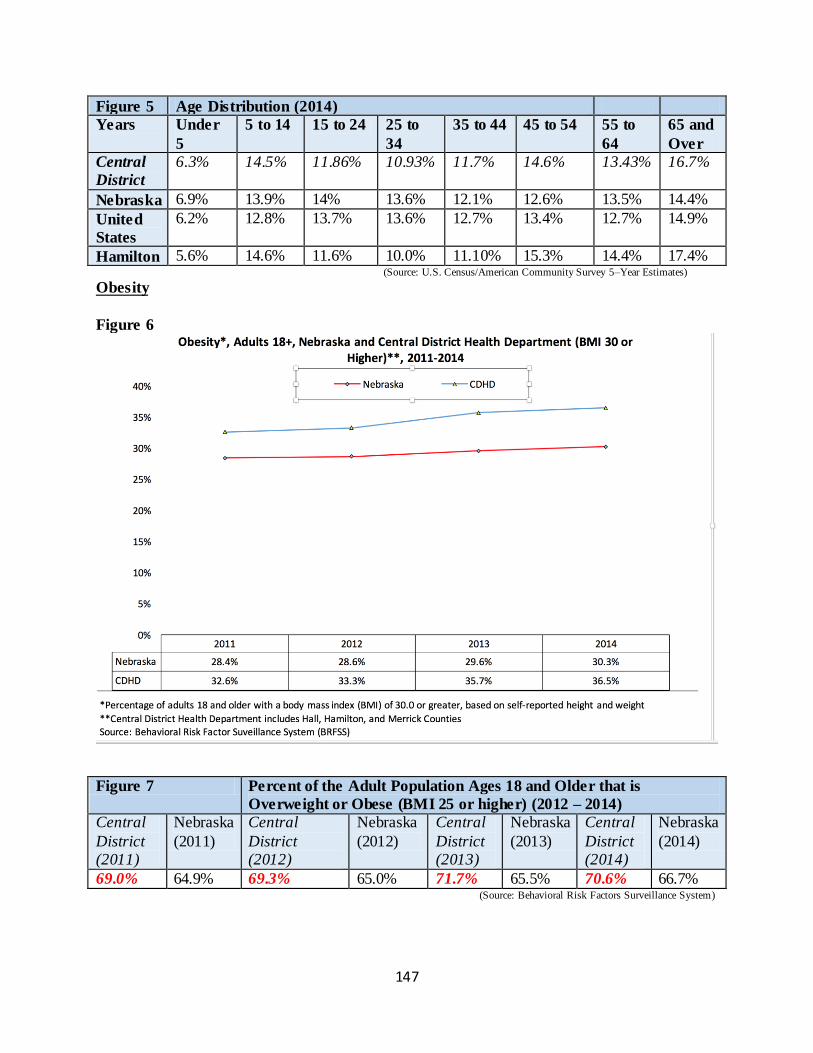
147
Figure 5 Age Distribution (2014)
Years Under
5
5 to 14 15 to 24 25 to
34
35 to 44 45 to 54 55 to
64
65 and
Over
Central
District
6.3% 14.5% 11.86% 10.93% 11.7% 14.6% 13.43% 16.7%
Nebraska 6.9% 13.9% 14% 13.6% 12.1% 12.6% 13.5% 14.4%
United
States
6.2% 12.8% 13.7% 13.6% 12.7% 13.4% 12.7% 14.9%
Hamilton 5.6% 14.6% 11.6% 10.0% 11.10% 15.3% 14.4% 17.4% (Source: U.S. Census/American Community Survey 5–Year Estimates)
Obesity
Figure 6
Figure 7 Percent of the Adult Population Ages 18 and Older that is
Overweight or Obese (BMI 25 or higher) (2012 – 2014)
Central
District (2011)
Nebraska
(2011)
Central
District (2012)
Nebraska
(2012)
Central
District (2013)
Nebraska
(2013)
Central
District (2014)
Nebraska
(2014)
69.0% 64.9% 69.3% 65.0% 71.7% 65.5% 70.6% 66.7% (Source: Behavioral Risk Factors Surveillance System)
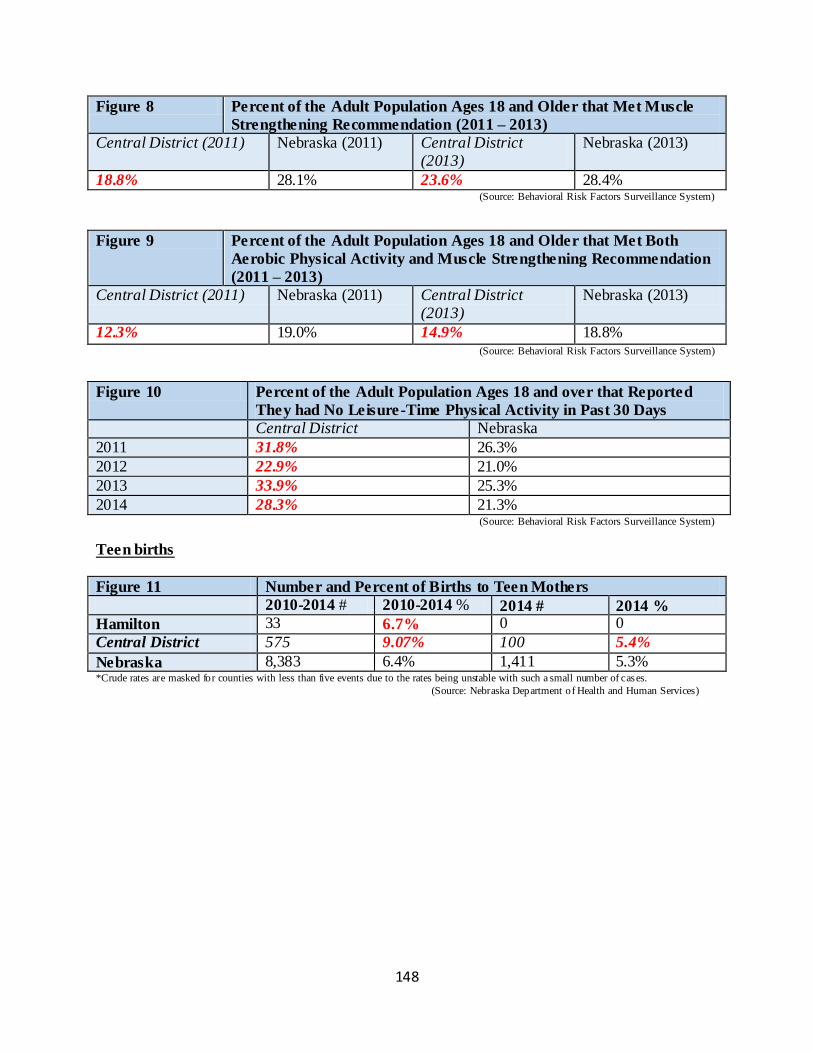
148
Figure 8 Percent of the Adult Population Ages 18 and Older that Met Muscle
Strengthening Recommendation (2011 – 2013)
Central District (2011) Nebraska (2011) Central District (2013)
Nebraska (2013)
18.8% 28.1% 23.6% 28.4% (Source: Behavioral Risk Factors Surveillance System)
Figure 9 Percent of the Adult Population Ages 18 and Older that Met Both
Aerobic Physical Activity and Muscle Strengthening Recommendation
(2011 – 2013)
Central District (2011) Nebraska (2011) Central District (2013)
Nebraska (2013)
12.3% 19.0% 14.9% 18.8% (Source: Behavioral Risk Factors Surveillance System)
Figure 10 Percent of the Adult Population Ages 18 and over that Reported
They had No Leisure-Time Physical Activity in Past 30 Days
Central District Nebraska
2011 31.8% 26.3%
2012 22.9% 21.0%
2013 33.9% 25.3%
2014 28.3% 21.3% (Source: Behavioral Risk Factors Surveillance System)
Teen births
Figure 11 Number and Percent of Births to Teen Mothers
2010-2014 # 2010-2014 % 2014 # 2014 %
Hamilton 33 6.7% 0 0
Central District 575 9.07% 100 5.4%
Nebraska 8,383 6.4% 1,411 5.3% *Crude rates are masked for counties with less than five events due to the rates being unstable with such a small number of cases.
(Source: Nebraska Department of Health and Human Services)
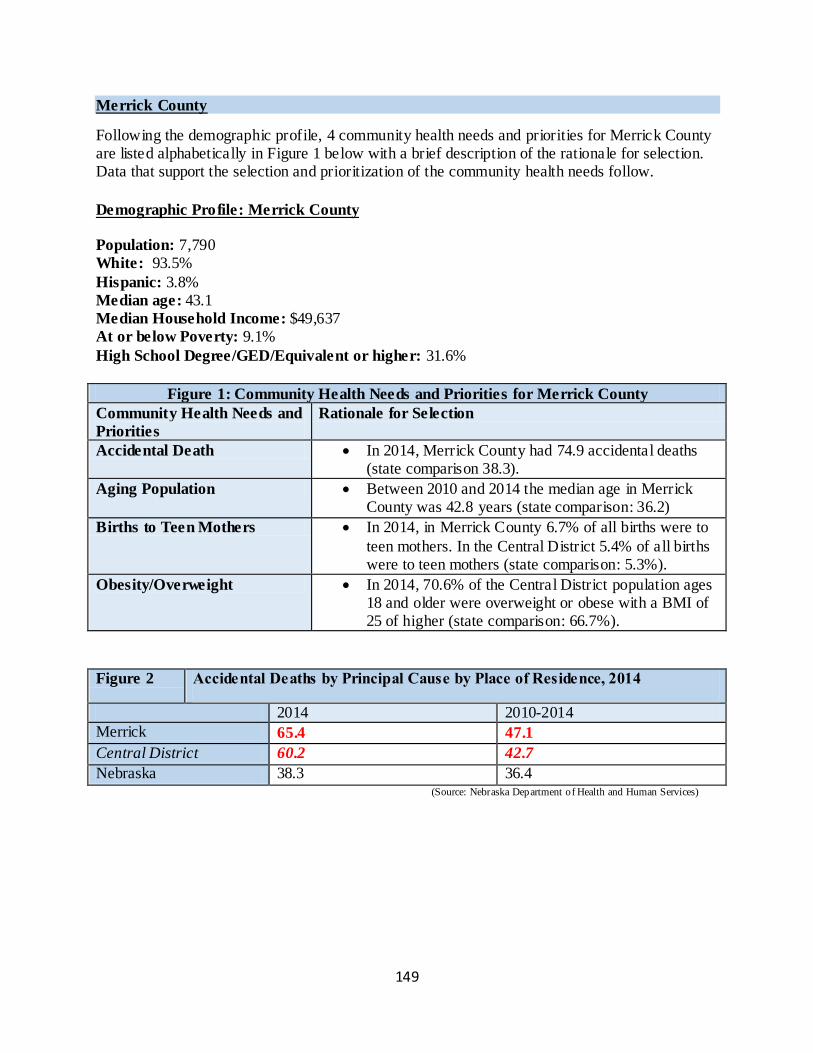
149
Merrick County
Following the demographic profile, 4 community health needs and priorities for Merrick County are listed alphabetically in Figure 1 below with a brief description of the rationale for selection. Data that support the selection and prioritization of the community health needs follow.
Demographic Profile: Merrick County
Population: 7,790
White: 93.5%
Hispanic: 3.8% Median age: 43.1
Median Household Income: $49,637
At or below Poverty: 9.1%
High School Degree/GED/Equivalent or higher: 31.6%
Figure 1: Community Health Needs and Priorities for Merrick County
Community Health Needs and
Priorities
Rationale for Selection
Accidental Death In 2014, Merrick County had 74.9 accidental deaths (state comparison 38.3).
Aging Population Between 2010 and 2014 the median age in Merrick County was 42.8 years (state comparison: 36.2)
Births to Teen Mothers In 2014, in Merrick County 6.7% of all births were to
teen mothers. In the Central District 5.4% of all births were to teen mothers (state comparison: 5.3%).
Obesity/Overweight In 2014, 70.6% of the Central District population ages 18 and older were overweight or obese with a BMI of 25 of higher (state comparison: 66.7%).
Figure 2 Accidental Deaths by Principal Cause by Place of Residence, 2014
2014 2010-2014
Merrick 65.4 47.1
Central District 60.2 42.7
Nebraska 38.3 36.4 (Source: Nebraska Department of Health and Human Services)
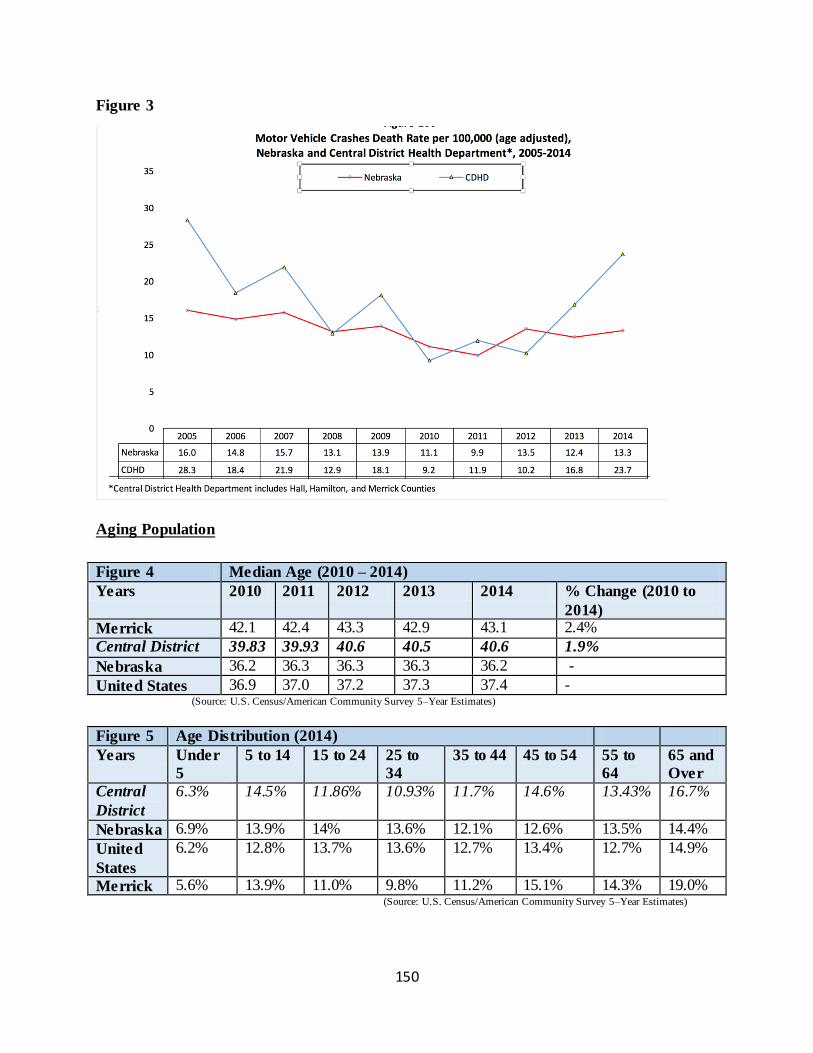
150
Figure 3
Aging Population
Figure 4 Median Age (2010 – 2014)
Years 2010 2011 2012 2013 2014 % Change (2010 to
2014)
Merrick 42.1 42.4 43.3 42.9 43.1 2.4%
Central District 39.83 39.93 40.6 40.5 40.6 1.9%
Nebraska 36.2 36.3 36.3 36.3 36.2 -
United States 36.9 37.0 37.2 37.3 37.4 - (Source: U.S. Census/American Community Survey 5–Year Estimates)
Figure 5 Age Distribution (2014)
Years Under
5
5 to 14 15 to 24 25 to
34
35 to 44 45 to 54 55 to
64
65 and
Over
Central
District
6.3% 14.5% 11.86% 10.93% 11.7% 14.6% 13.43% 16.7%
Nebraska 6.9% 13.9% 14% 13.6% 12.1% 12.6% 13.5% 14.4%
United
States
6.2% 12.8% 13.7% 13.6% 12.7% 13.4% 12.7% 14.9%
Merrick 5.6% 13.9% 11.0% 9.8% 11.2% 15.1% 14.3% 19.0% (Source: U.S. Census/American Community Survey 5–Year Estimates)
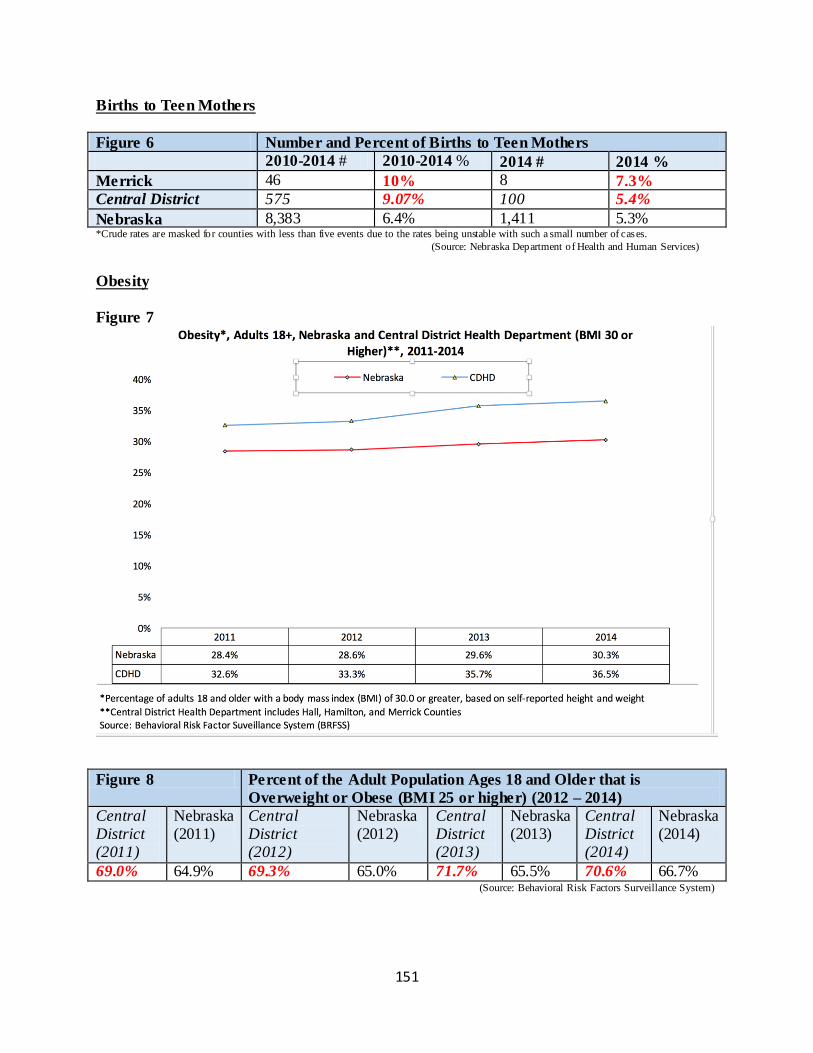
151
Births to Teen Mothers
Figure 6 Number and Percent of Births to Teen Mothers
2010-2014 # 2010-2014 % 2014 # 2014 %
Merrick 46 10% 8 7.3%
Central District 575 9.07% 100 5.4%
Nebraska 8,383 6.4% 1,411 5.3% *Crude rates are masked for counties with less than five events due to the rates being unstable with such a small number of cases.
(Source: Nebraska Department of Health and Human Services)
Obesity
Figure 7
Figure 8 Percent of the Adult Population Ages 18 and Older that is
Overweight or Obese (BMI 25 or higher) (2012 – 2014)
Central District (2011)
Nebraska (2011)
Central District (2012)
Nebraska (2012)
Central District (2013)
Nebraska (2013)
Central District (2014)
Nebraska (2014)
69.0% 64.9% 69.3% 65.0% 71.7% 65.5% 70.6% 66.7% (Source: Behavioral Risk Factors Surveillance System)
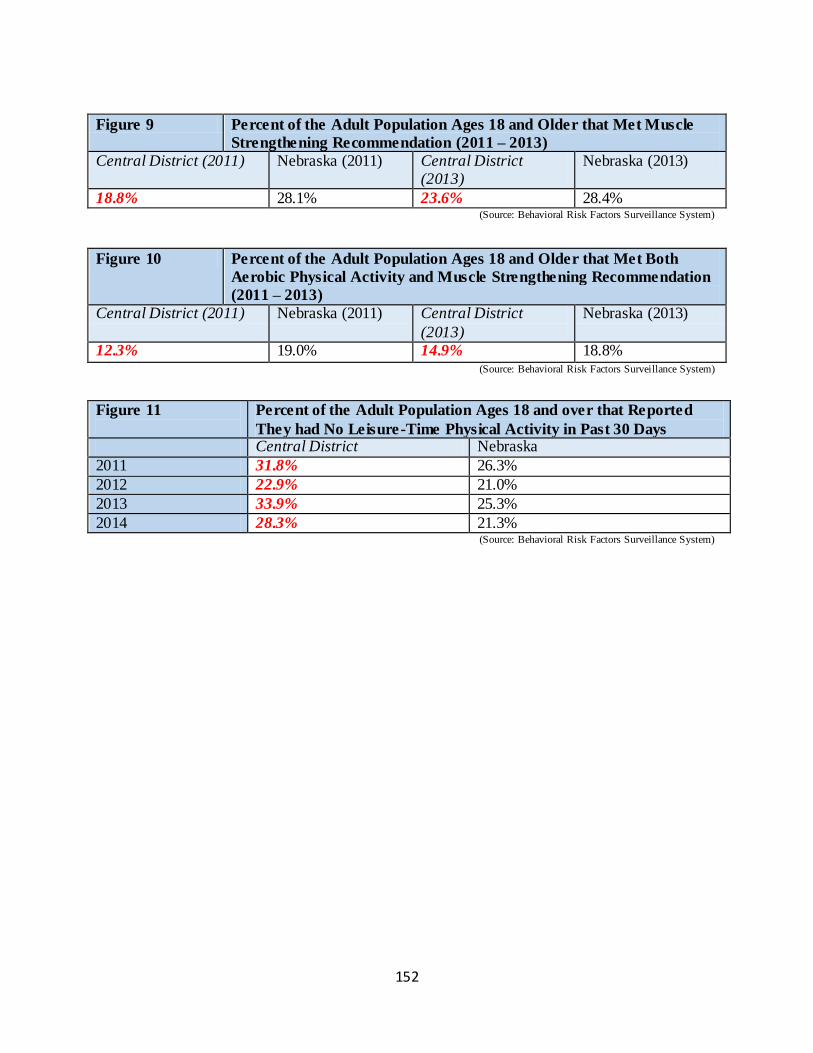
152
Figure 9 Percent of the Adult Population Ages 18 and Older that Met Muscle
Strengthening Recommendation (2011 – 2013)
Central District (2011) Nebraska (2011) Central District (2013)
Nebraska (2013)
18.8% 28.1% 23.6% 28.4% (Source: Behavioral Risk Factors Surveillance System)
Figure 10 Percent of the Adult Population Ages 18 and Older that Met Both
Aerobic Physical Activity and Muscle Strengthening Recommendation
(2011 – 2013)
Central District (2011) Nebraska (2011) Central District
(2013)
Nebraska (2013)
12.3% 19.0% 14.9% 18.8% (Source: Behavioral Risk Factors Surveillance System)
Figure 11
Percent of the Adult Population Ages 18 and over that Reported
They had No Leisure-Time Physical Activity in Past 30 Days Central District Nebraska
2011 31.8% 26.3%
2012 22.9% 21.0%
2013 33.9% 25.3%
2014 28.3% 21.3% (Source: Behavioral Risk Factors Surveillance System)
153
Appendices Appendix A. Aurora Memorial Community Health Assessment (Community Themes and
Strengths Assessment) Appendix B. Aurora Memorial Hospital Health Assessment (Community Themes and Strengths
Assessment)
Appendix C. Litzenberg Memorial County Hospital Health Assessment (Community Themes and
Strengths Assessment)
Appendix D. The Local Public Health System Assessment (a selection from the full report)
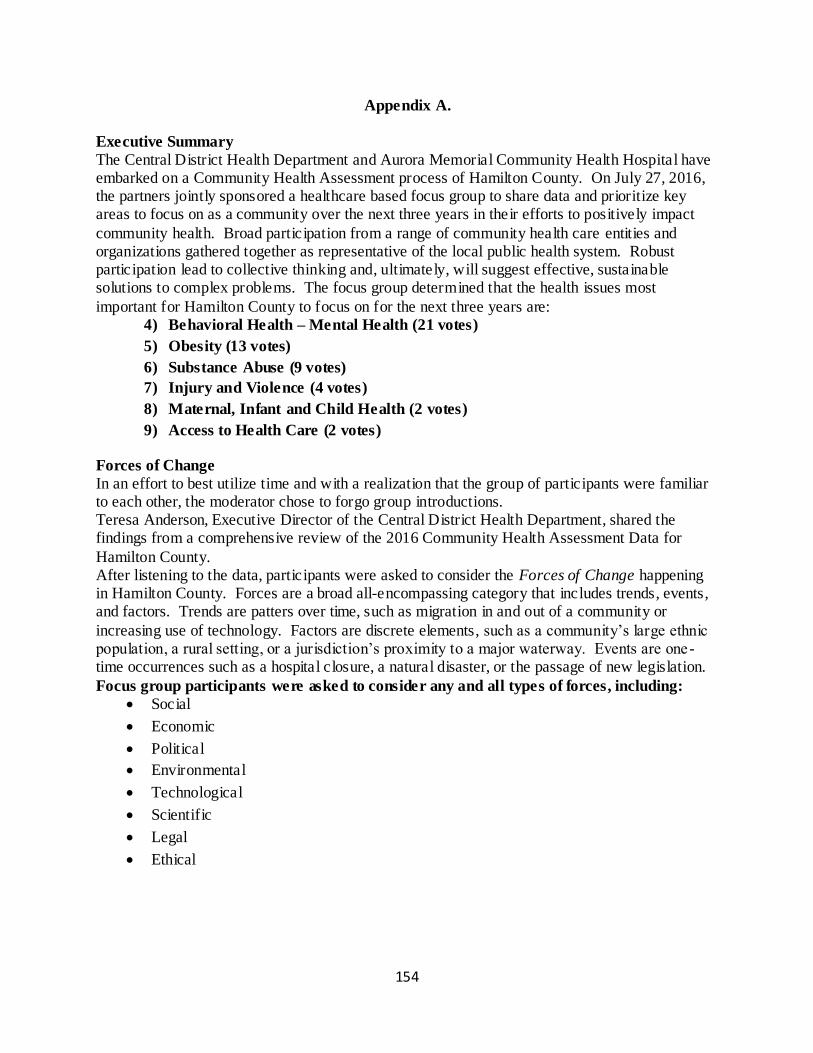
154
Appendix A.
Executive Summary
The Central District Health Department and Aurora Memorial Community Health Hospital have embarked on a Community Health Assessment process of Hamilton County. On July 27, 2016, the partners jointly sponsored a healthcare based focus group to share data and prioritize key areas to focus on as a community over the next three years in their efforts to positively impact
community health. Broad participation from a range of community health care entities and organizations gathered together as representative of the local public health system. Robust participation lead to collective thinking and, ultimately, will suggest effective, sustainable solutions to complex problems. The focus group determined that the health issues most
important for Hamilton County to focus on for the next three years are: 4) Behavioral Health – Mental Health (21 votes)
5) Obesity (13 votes)
6) Substance Abuse (9 votes)
7) Injury and Violence (4 votes)
8) Maternal, Infant and Child Health (2 votes)
9) Access to Health Care (2 votes)
Forces of Change
In an effort to best utilize time and with a realization that the group of participants were familiar to each other, the moderator chose to forgo group introductions. Teresa Anderson, Executive Director of the Central District Health Department, shared the findings from a comprehensive review of the 2016 Community Health Assessment Data for
Hamilton County. After listening to the data, participants were asked to consider the Forces of Change happening in Hamilton County. Forces are a broad all-encompassing category that includes trends, events, and factors. Trends are patters over time, such as migration in and out of a community or
increasing use of technology. Factors are discrete elements, such as a community’s large ethnic population, a rural setting, or a jurisdiction’s proximity to a major waterway. Events are one -time occurrences such as a hospital closure, a natural disaster, or the passage of new legislation.
Focus group participants were asked to consider any and all types of forces, including:
Social
Economic
Political
Environmental
Technological
Scientific
Legal
Ethical
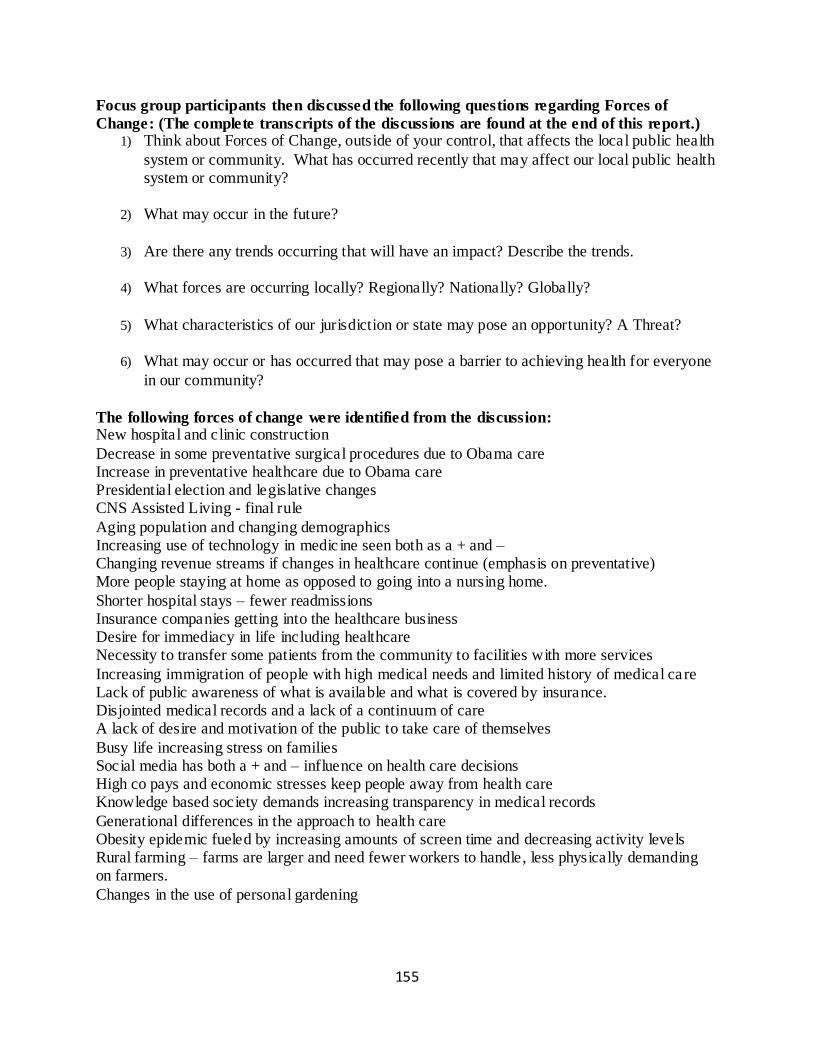
155
Focus group participants then discussed the following questions regarding Forces of
Change: (The complete transcripts of the discussions are found at the end of this report.) 1) Think about Forces of Change, outside of your control, that affects the local public health
system or community. What has occurred recently that may affect our local public health system or community?
2) What may occur in the future?
3) Are there any trends occurring that will have an impact? Describe the trends.
4) What forces are occurring locally? Regionally? Nationally? Globally?
5) What characteristics of our jurisdiction or state may pose an opportunity? A Threat?
6) What may occur or has occurred that may pose a barrier to achieving health for everyone
in our community?
The following forces of change were identified from the discussion: New hospital and clinic construction
Decrease in some preventative surgical procedures due to Obama care Increase in preventative healthcare due to Obama care Presidential election and legislative changes CNS Assisted Living - final rule
Aging population and changing demographics Increasing use of technology in medic ine seen both as a + and – Changing revenue streams if changes in healthcare continue (emphasis on preventative) More people staying at home as opposed to going into a nursing home.
Shorter hospital stays – fewer readmissions Insurance companies getting into the healthcare business Desire for immediacy in life including healthcare Necessity to transfer some patients from the community to facilities with more services
Increasing immigration of people with high medical needs and limited history of medical care Lack of public awareness of what is available and what is covered by insurance. Disjointed medical records and a lack of a continuum of care A lack of desire and motivation of the public to take care of themselves
Busy life increasing stress on families Social media has both a + and – influence on health care decisions High co pays and economic stresses keep people away from health care Knowledge based society demands increasing transparency in medical records
Generational differences in the approach to health care Obesity epidemic fueled by increasing amounts of screen time and decreasing activity levels Rural farming – farms are larger and need fewer workers to handle, less physically demanding on farmers.
Changes in the use of personal gardening
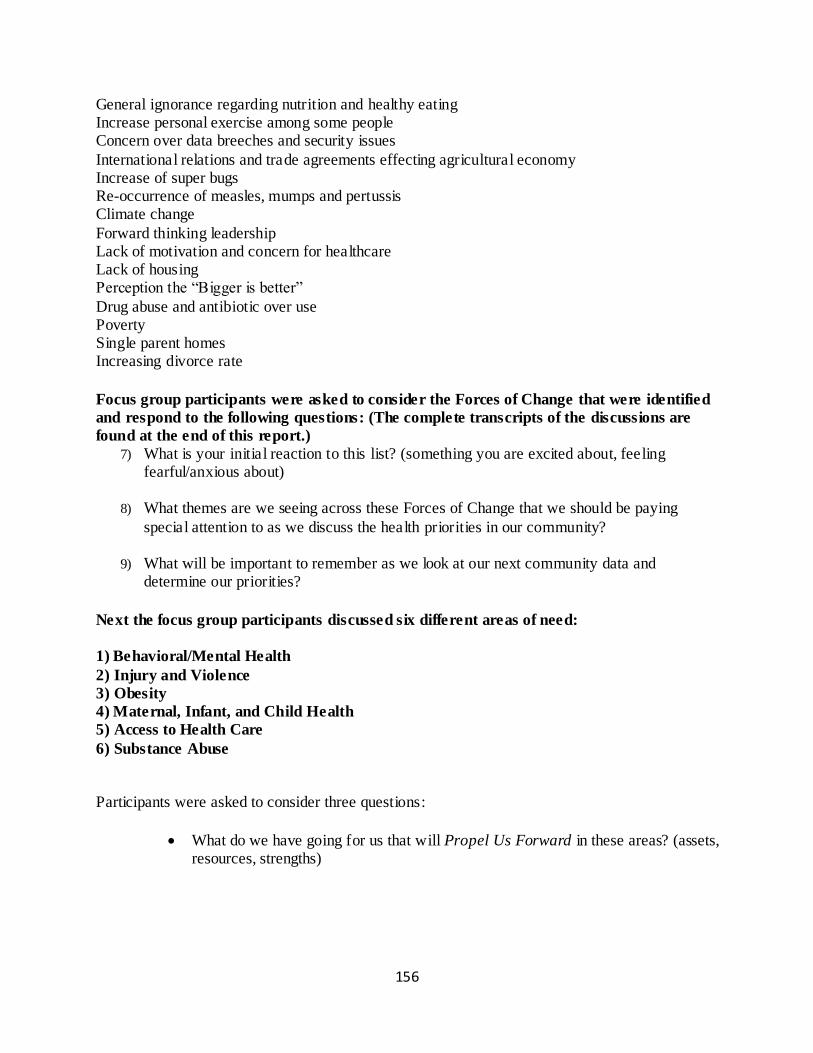
156
General ignorance regarding nutrition and healthy eating Increase personal exercise among some people Concern over data breeches and security issues
International relations and trade agreements effecting agricultural economy Increase of super bugs Re-occurrence of measles, mumps and pertussis Climate change
Forward thinking leadership Lack of motivation and concern for healthcare Lack of housing Perception the “Bigger is better”
Drug abuse and antibiotic over use Poverty Single parent homes Increasing divorce rate
Focus group participants were asked to consider the Forces of Change that were identified
and respond to the following questions: (The complete transcripts of the discussions are
found at the end of this report.)
7) What is your initial reaction to this list? (something you are excited about, feeling fearful/anxious about)
8) What themes are we seeing across these Forces of Change that we should be paying
special attention to as we discuss the health priorities in our community?
9) What will be important to remember as we look at our next community data and determine our priorities?
Next the focus group participants discussed six different areas of need:
1) Behavioral/Mental Health
2) Injury and Violence
3) Obesity
4) Maternal, Infant, and Child Health
5) Access to Health Care
6) Substance Abuse Participants were asked to consider three questions:
What do we have going for us that will Propel Us Forward in these areas? (assets, resources, strengths)
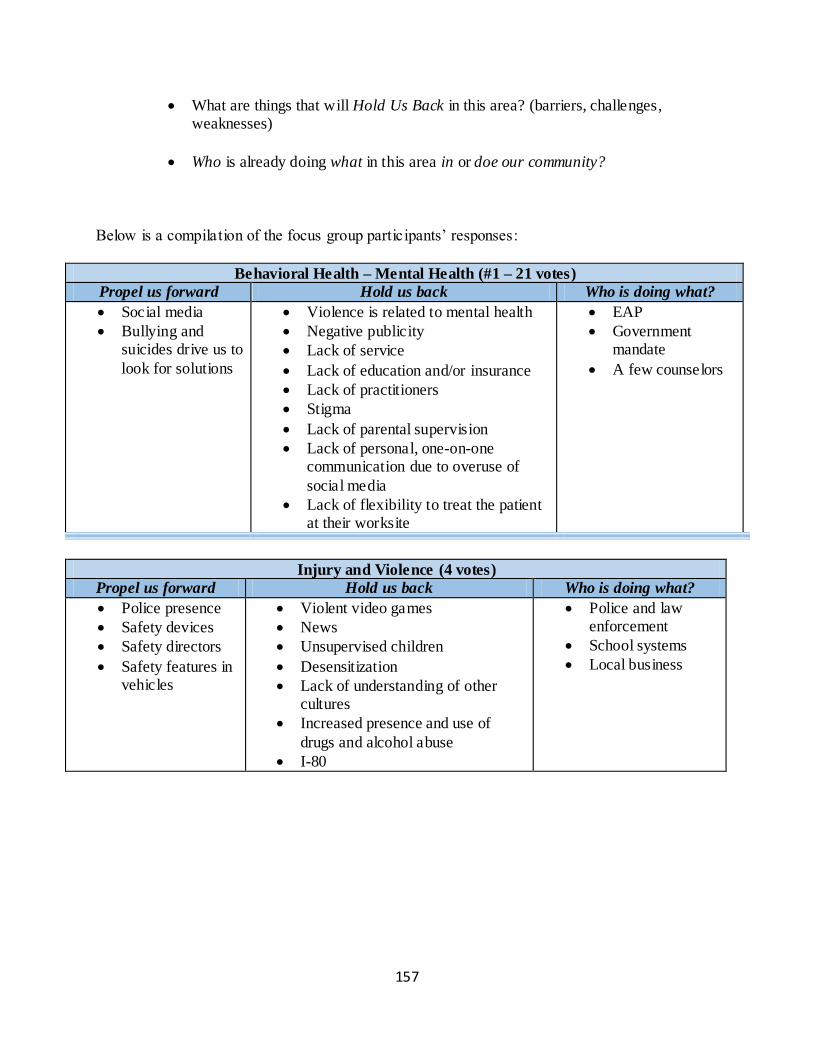
157
What are things that will Hold Us Back in this area? (barriers, challenges, weaknesses)
Who is already doing what in this area in or doe our community?
Below is a compilation of the focus group participants’ responses:
Behavioral Health – Mental Health (#1 – 21 votes)
Propel us forward Hold us back Who is doing what?
Social media
Bullying and suicides drive us to
look for solutions
Violence is related to mental health
Negative publicity
Lack of service
Lack of education and/or insurance
Lack of practitioners
Stigma
Lack of parental supervision
Lack of personal, one-on-one communication due to overuse of
social media
Lack of flexibility to treat the patient at their worksite
EAP
Government mandate
A few counselors
Injury and Violence (4 votes)
Propel us forward Hold us back Who is doing what?
Police presence
Safety devices
Safety directors
Safety features in vehicles
Violent video games
News
Unsupervised children
Desensitization
Lack of understanding of other cultures
Increased presence and use of
drugs and alcohol abuse
I-80
Police and law enforcement
School systems
Local business
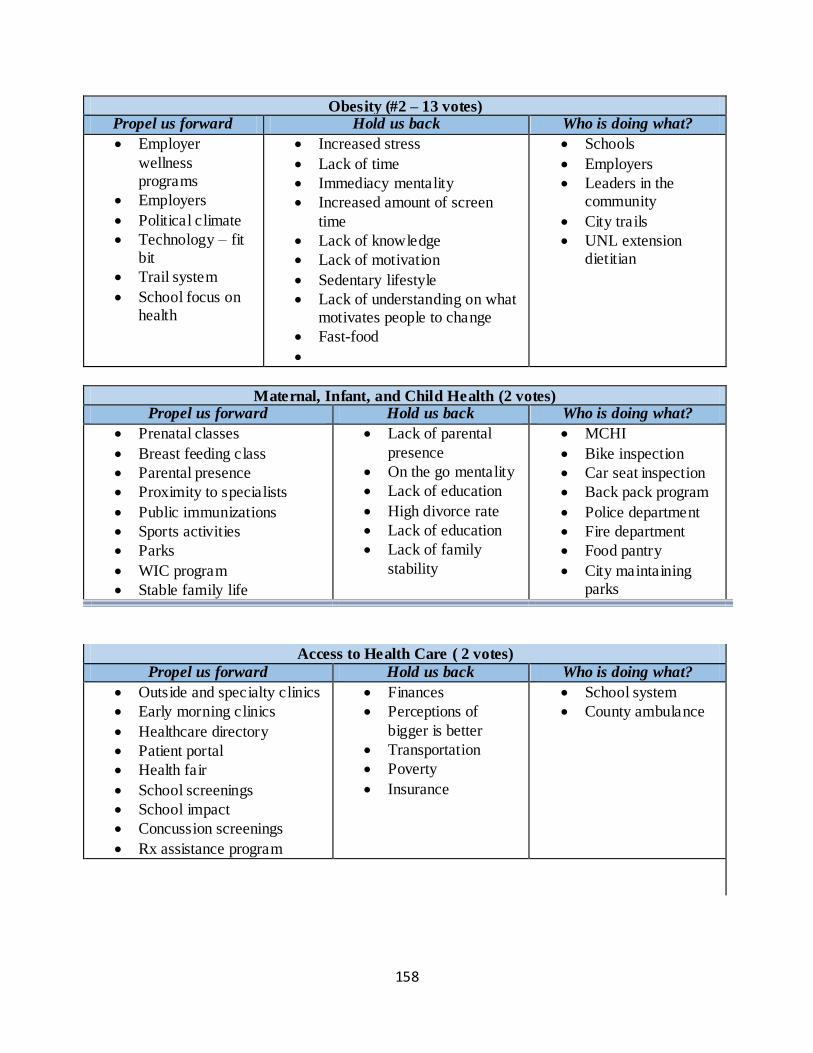
158
Obesity (#2 – 13 votes) Propel us forward Hold us back Who is doing what?
Employer
wellness programs
Employers
Political climate
Technology – fit bit
Trail system
School focus on health
Increased stress
Lack of time
Immediacy mentality
Increased amount of screen
time
Lack of knowledge
Lack of motivation
Sedentary lifestyle
Lack of understanding on what motivates people to change
Fast-food
Schools
Employers
Leaders in the community
City trails
UNL extension dietitian
Maternal, Infant, and Child Health (2 votes) Propel us forward Hold us back Who is doing what?
Prenatal classes
Breast feeding class
Parental presence
Proximity to specialists
Public immunizations
Sports activities
Parks
WIC program
Stable family life
Lack of parental
presence
On the go mentality
Lack of education
High divorce rate
Lack of education
Lack of family
stability
MCHI
Bike inspection
Car seat inspection
Back pack program
Police department
Fire department
Food pantry
City maintaining parks
Access to Health Care ( 2 votes)
Propel us forward Hold us back Who is doing what?
Outside and specialty clinics
Early morning clinics
Healthcare directory
Patient portal
Health fair
School screenings
School impact
Concussion screenings
Rx assistance program
Finances
Perceptions of
bigger is better
Transportation
Poverty
Insurance
School system
County ambulance
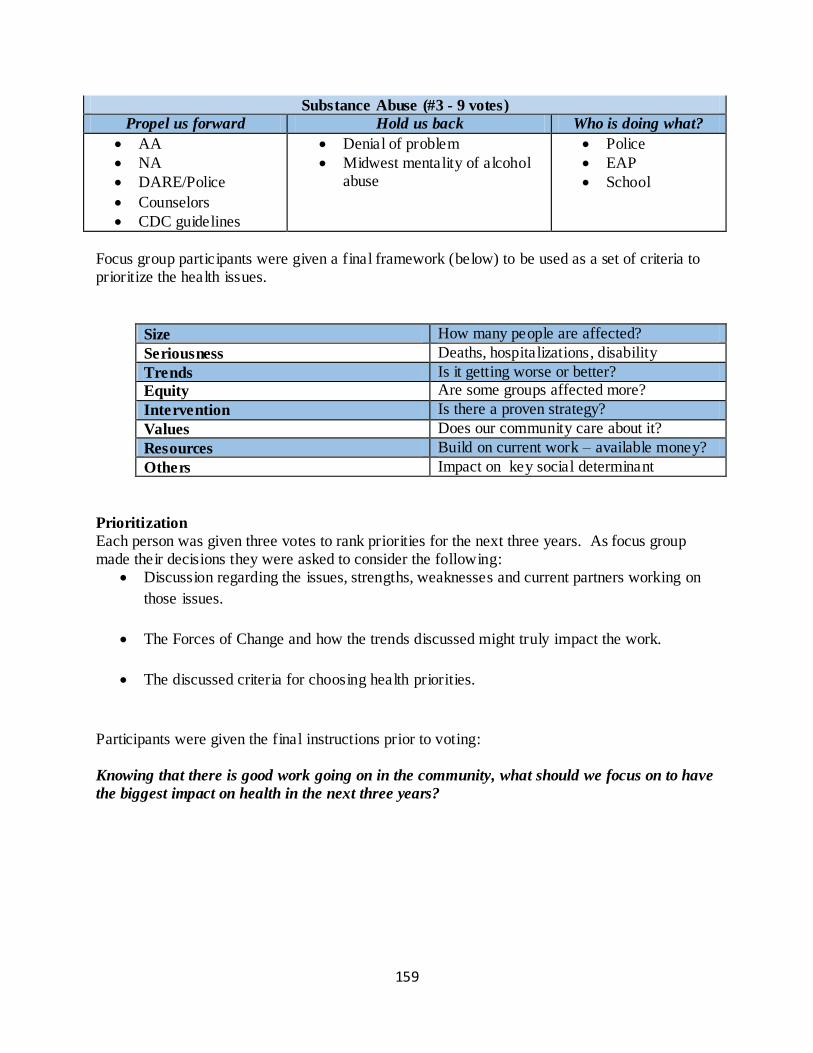
159
Substance Abuse (#3 - 9 votes)
Propel us forward Hold us back Who is doing what?
AA
NA
DARE/Police
Counselors
CDC guidelines
Denial of problem
Midwest mentality of alcohol abuse
Police
EAP
School
Focus group participants were given a final framework (below) to be used as a set of criteria to prioritize the health issues.
Size How many people are affected?
Seriousness Deaths, hospitalizations, disability
Trends Is it getting worse or better?
Equity Are some groups affected more?
Intervention Is there a proven strategy?
Values Does our community care about it?
Resources Build on current work – available money?
Others Impact on key social determinant
Prioritization
Each person was given three votes to rank priorities for the next three years. As focus group made their decisions they were asked to consider the following:
Discussion regarding the issues, strengths, weaknesses and current partners working on
those issues.
The Forces of Change and how the trends discussed might truly impact the work.
The discussed criteria for choosing health priorities.
Participants were given the final instructions prior to voting: Knowing that there is good work going on in the community, what should we focus on to have
the biggest impact on health in the next three years?
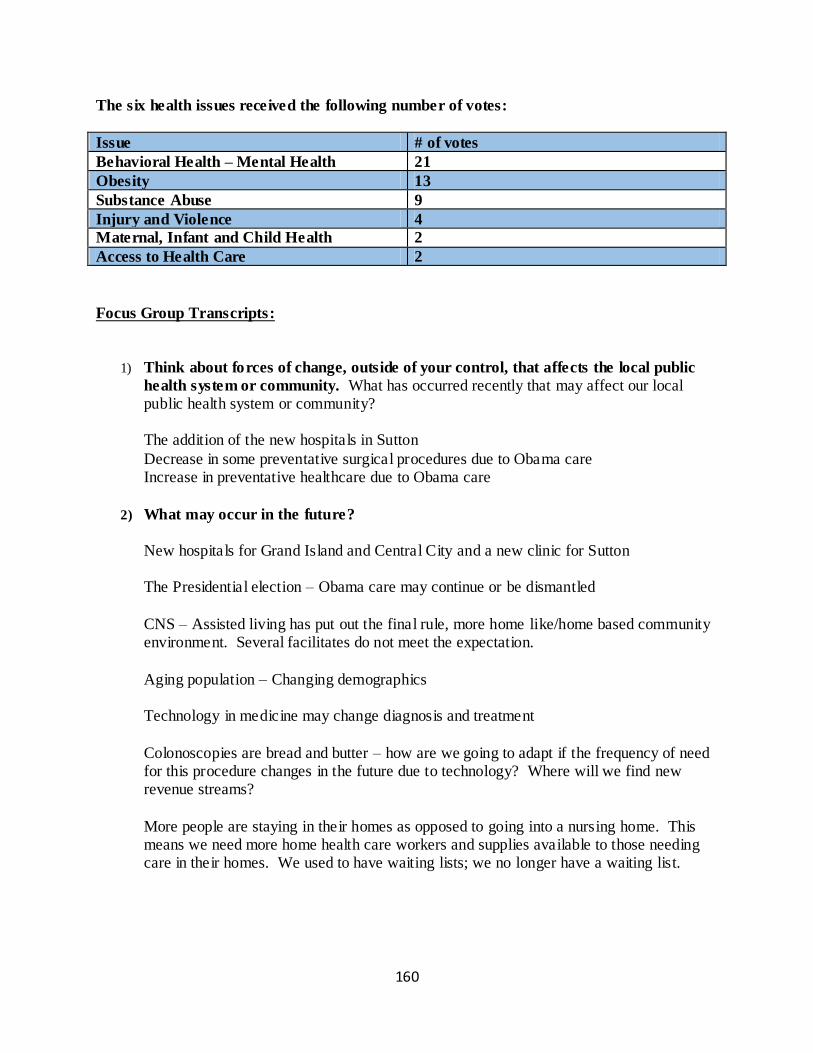
160
The six health issues received the following number of votes:
Issue # of votes
Behavioral Health – Mental Health 21
Obesity 13
Substance Abuse 9
Injury and Violence 4
Maternal, Infant and Child Health 2
Access to Health Care 2
Focus Group Transcripts:
1) Think about forces of change, outside of your control, that affects the local public
health system or community. What has occurred recently that may affect our local public health system or community?
The addition of the new hospitals in Sutton
Decrease in some preventative surgical procedures due to Obama care Increase in preventative healthcare due to Obama care
2) What may occur in the future?
New hospitals for Grand Island and Central City and a new clinic for Sutton The Presidential election – Obama care may continue or be dismantled
CNS – Assisted living has put out the final rule, more home like/home based community environment. Several facilitates do not meet the expectation.
Aging population – Changing demographics
Technology in medicine may change diagnosis and treatment
Colonoscopies are bread and butter – how are we going to adapt if the frequency of need for this procedure changes in the future due to technology? Where will we find new revenue streams?
More people are staying in their homes as opposed to going into a nursing home. This means we need more home health care workers and supplies available to those needing care in their homes. We used to have waiting lists; we no longer have a waiting list.
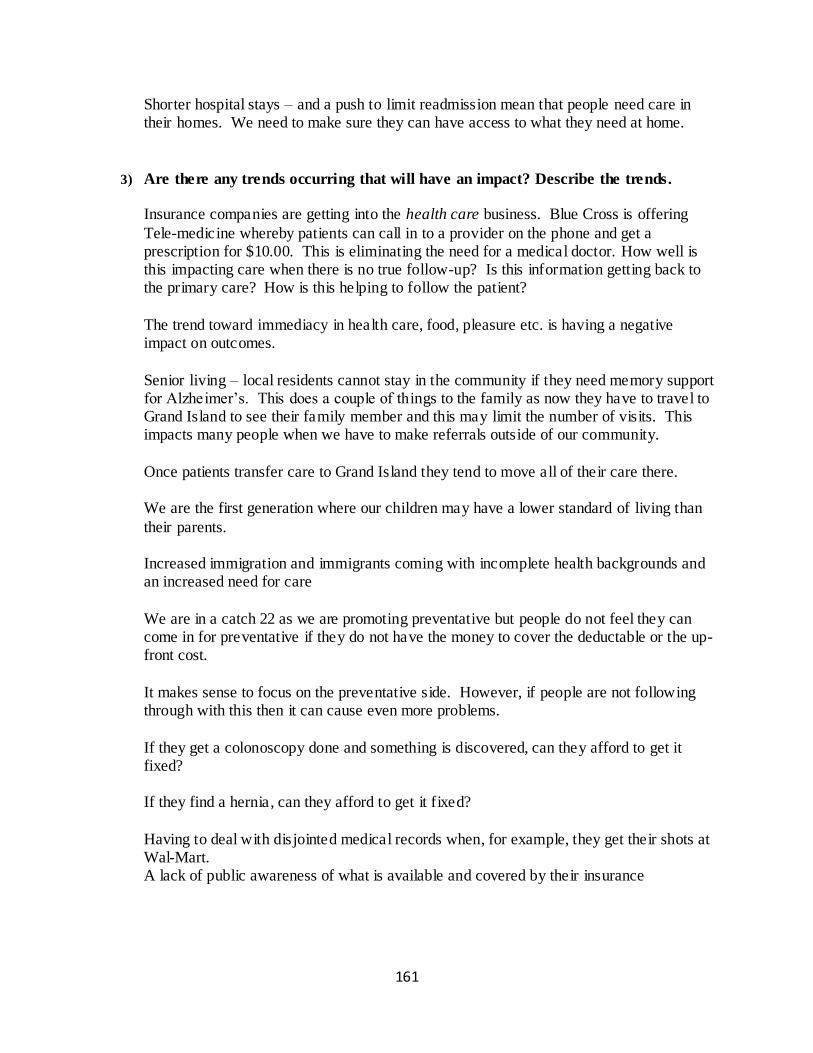
161
Shorter hospital stays – and a push to limit readmission mean that people need care in their homes. We need to make sure they can have access to what they need at home.
3) Are there any trends occurring that will have an impact? Describe the trends.
Insurance companies are getting into the health care business. Blue Cross is offering
Tele-medicine whereby patients can call in to a provider on the phone and get a prescription for $10.00. This is eliminating the need for a medical doctor. How well is this impacting care when there is no true follow-up? Is this information getting back to the primary care? How is this helping to follow the patient?
The trend toward immediacy in health care, food, pleasure etc. is having a negative impact on outcomes.
Senior living – local residents cannot stay in the community if they need memory support for Alzheimer’s. This does a couple of things to the family as now they have to travel to Grand Island to see their family member and this may limit the number of visits. This impacts many people when we have to make referrals outside of our community.
Once patients transfer care to Grand Island they tend to move all of their care there. We are the first generation where our children may have a lower standard of living than
their parents. Increased immigration and immigrants coming with incomplete health backgrounds and an increased need for care
We are in a catch 22 as we are promoting preventative but people do not feel they can come in for preventative if they do not have the money to cover the deductable or the up-front cost.
It makes sense to focus on the preventative side. However, if people are not following through with this then it can cause even more problems.
If they get a colonoscopy done and something is discovered, can they afford to get it fixed? If they find a hernia, can they afford to get it fixed?
Having to deal with disjointed medical records when, for example, they get their shots at Wal-Mart. A lack of public awareness of what is available and covered by their insurance
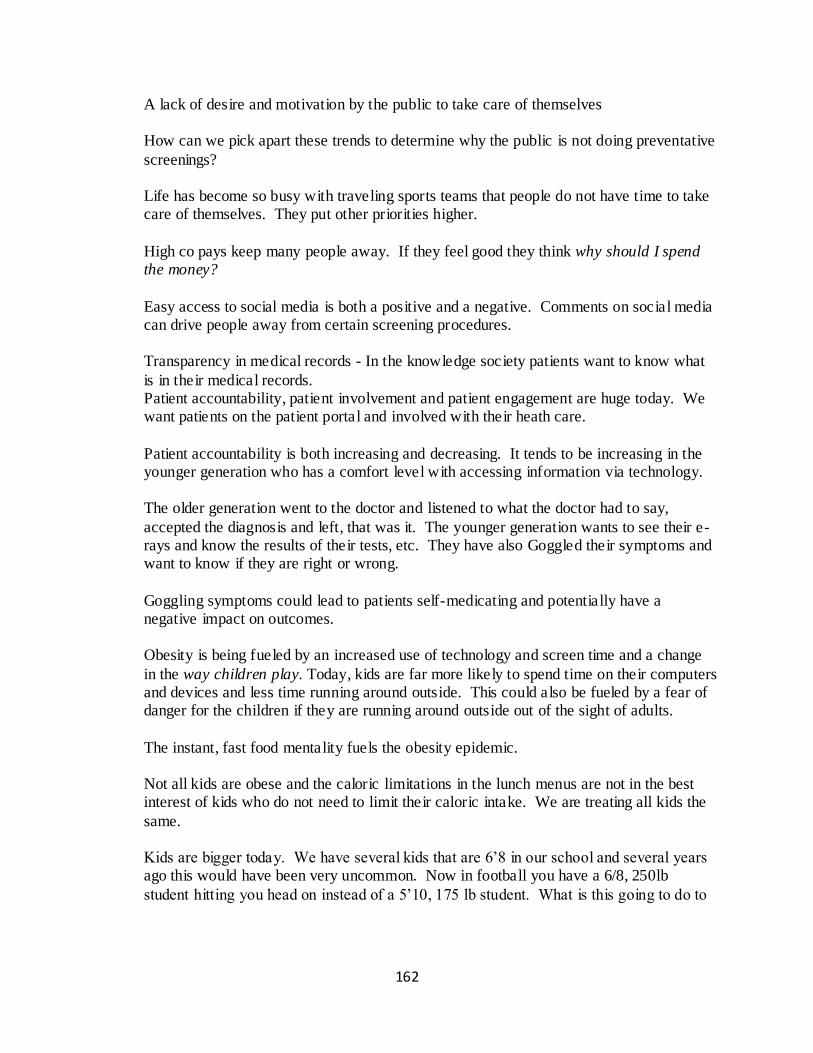
162
A lack of desire and motivation by the public to take care of themselves How can we pick apart these trends to determine why the public is not doing preventative
screenings? Life has become so busy with traveling sports teams that people do not have time to take care of themselves. They put other priorities higher.
High co pays keep many people away. If they feel good they think why should I spend the money?
Easy access to social media is both a positive and a negative. Comments on social media can drive people away from certain screening procedures. Transparency in medical records - In the knowledge society patients want to know what
is in their medical records. Patient accountability, patient involvement and patient engagement are huge today. We want patients on the patient portal and involved with their heath care.
Patient accountability is both increasing and decreasing. It tends to be increasing in the younger generation who has a comfort level with accessing information via technology. The older generation went to the doctor and listened to what the doctor had to say,
accepted the diagnosis and left, that was it. The younger generation wants to see their e-rays and know the results of their tests, etc. They have also Goggled their symptoms and want to know if they are right or wrong.
Goggling symptoms could lead to patients self-medicating and potentially have a negative impact on outcomes. Obesity is being fueled by an increased use of technology and screen time and a change
in the way children play. Today, kids are far more likely to spend time on their computers and devices and less time running around outside. This could also be fueled by a fear of danger for the children if they are running around outside out of the sight of adults.
The instant, fast food mentality fuels the obesity epidemic. Not all kids are obese and the caloric limitations in the lunch menus are not in the best interest of kids who do not need to limit their caloric intake. We are treating all kids the
same. Kids are bigger today. We have several kids that are 6’8 in our school and several years ago this would have been very uncommon. Now in football you have a 6/8, 250lb
student hitting you head on instead of a 5’10, 175 lb student. What is this going to do to
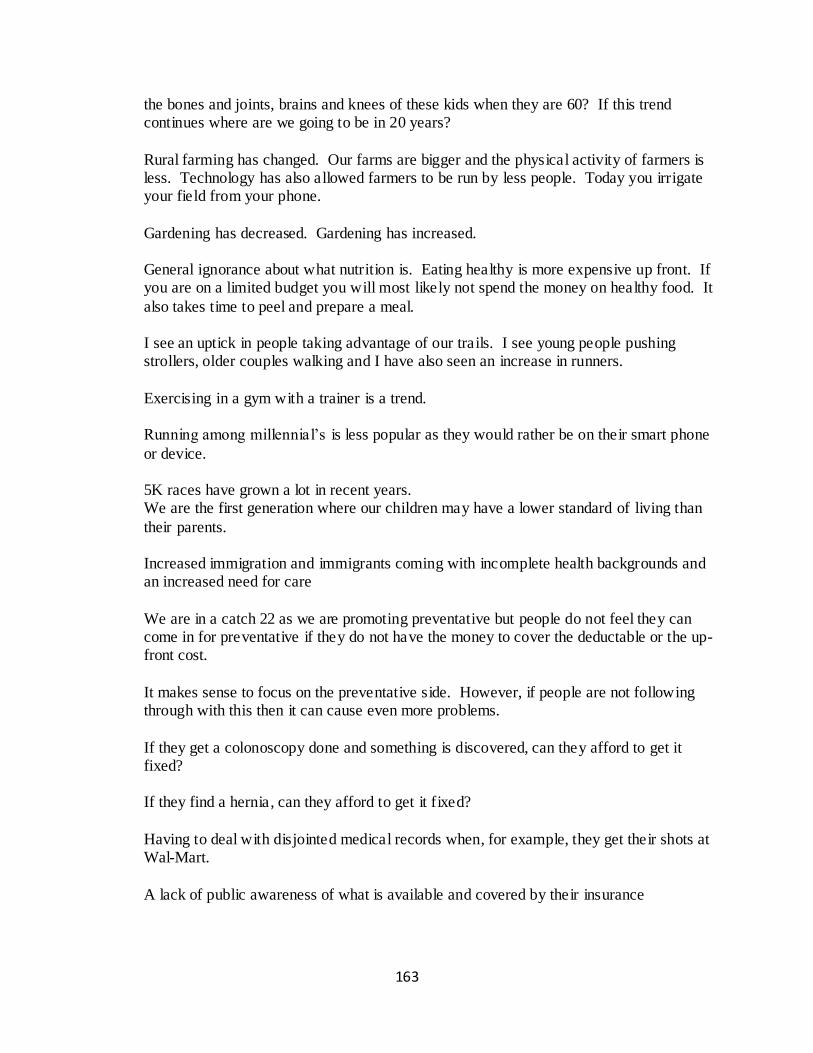
163
the bones and joints, brains and knees of these kids when they are 60? If this trend continues where are we going to be in 20 years?
Rural farming has changed. Our farms are bigger and the physical activity of farmers is less. Technology has also allowed farmers to be run by less people. Today you irrigate your field from your phone.
Gardening has decreased. Gardening has increased. General ignorance about what nutrition is. Eating healthy is more expensive up front. If you are on a limited budget you will most likely not spend the money on healthy food. It
also takes time to peel and prepare a meal. I see an uptick in people taking advantage of our trails. I see young people pushing strollers, older couples walking and I have also seen an increase in runners.
Exercising in a gym with a trainer is a trend. Running among millennial’s is less popular as they would rather be on their smart phone
or device.
5K races have grown a lot in recent years. We are the first generation where our children may have a lower standard of living than
their parents. Increased immigration and immigrants coming with incomplete health backgrounds and an increased need for care
We are in a catch 22 as we are promoting preventative but people do not feel they can come in for preventative if they do not have the money to cover the deductable or the up-front cost.
It makes sense to focus on the preventative side. However, if people are not following through with this then it can cause even more problems.
If they get a colonoscopy done and something is discovered, can they afford to get it fixed? If they find a hernia, can they afford to get it fixed?
Having to deal with disjointed medical records when, for example, they get their shots at Wal-Mart.
A lack of public awareness of what is available and covered by their insurance
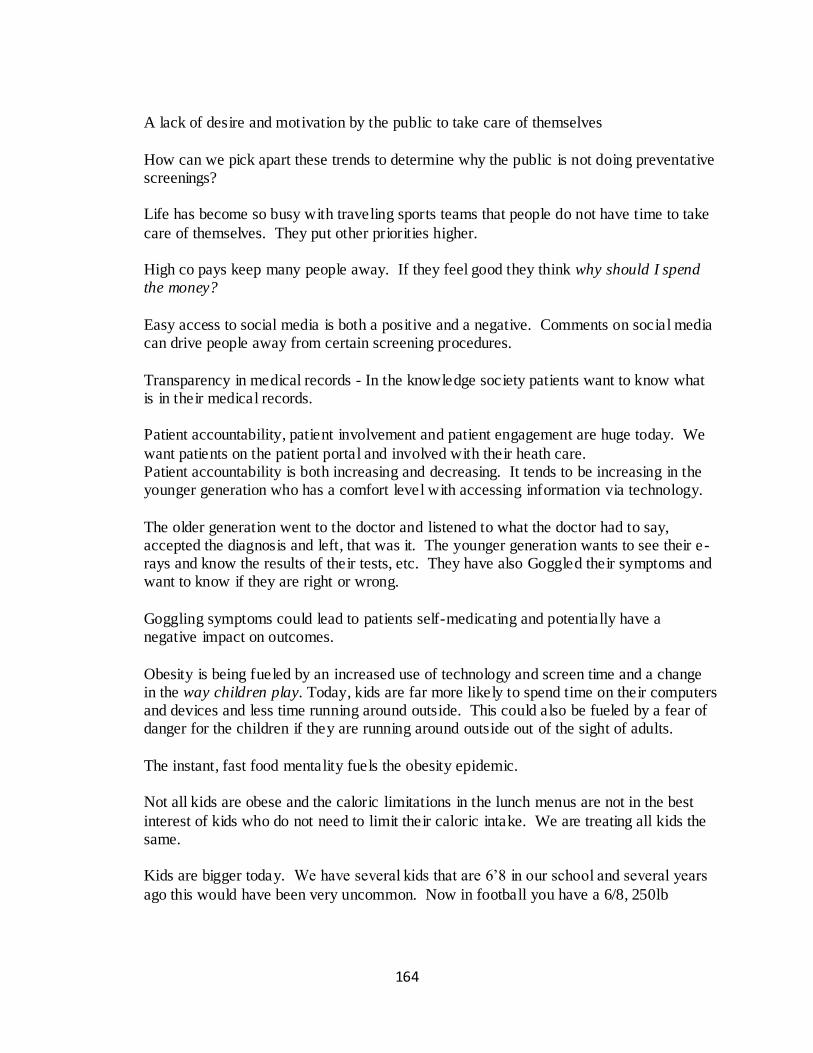
164
A lack of desire and motivation by the public to take care of themselves
How can we pick apart these trends to determine why the public is not doing preventative screenings? Life has become so busy with traveling sports teams that people do not have time to take
care of themselves. They put other priorities higher. High co pays keep many people away. If they feel good they think why should I spend the money?
Easy access to social media is both a positive and a negative. Comments on social media can drive people away from certain screening procedures.
Transparency in medical records - In the knowledge society patients want to know what is in their medical records. Patient accountability, patient involvement and patient engagement are huge today. We
want patients on the patient portal and involved with their heath care. Patient accountability is both increasing and decreasing. It tends to be increasing in the younger generation who has a comfort level with accessing information via technology.
The older generation went to the doctor and listened to what the doctor had to say, accepted the diagnosis and left, that was it. The younger generation wants to see their e-rays and know the results of their tests, etc. They have also Goggled their symptoms and want to know if they are right or wrong.
Goggling symptoms could lead to patients self-medicating and potentially have a negative impact on outcomes.
Obesity is being fueled by an increased use of technology and screen time and a change in the way children play. Today, kids are far more likely to spend time on their computers and devices and less time running around outside. This could also be fueled by a fear of danger for the children if they are running around outside out of the sight of adults.
The instant, fast food mentality fuels the obesity epidemic. Not all kids are obese and the caloric limitations in the lunch menus are not in the best
interest of kids who do not need to limit their caloric intake. We are treating all kids the same. Kids are bigger today. We have several kids that are 6’8 in our school and several years
ago this would have been very uncommon. Now in football you have a 6/8, 250lb
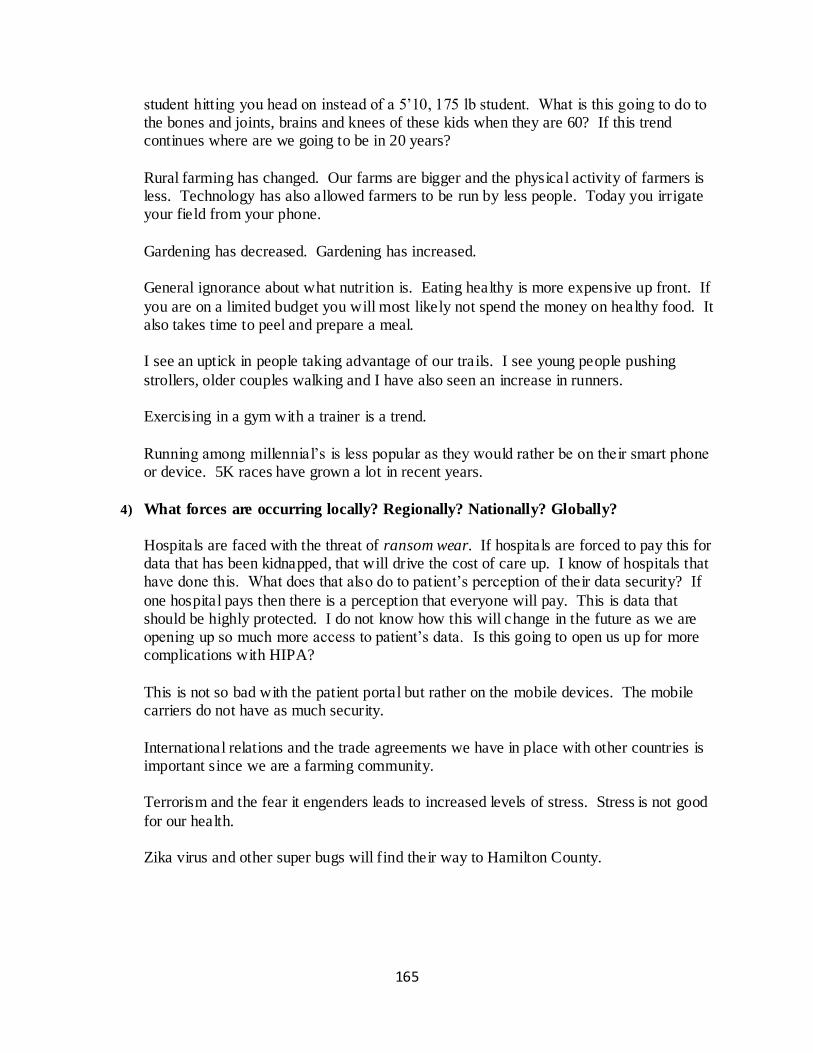
165
student hitting you head on instead of a 5’10, 175 lb student. What is this going to do to the bones and joints, brains and knees of these kids when they are 60? If this trend continues where are we going to be in 20 years?
Rural farming has changed. Our farms are bigger and the physical activity of farmers is less. Technology has also allowed farmers to be run by less people. Today you irrigate your field from your phone.
Gardening has decreased. Gardening has increased. General ignorance about what nutrition is. Eating healthy is more expensive up front. If
you are on a limited budget you will most likely not spend the money on healthy food. It also takes time to peel and prepare a meal. I see an uptick in people taking advantage of our trails. I see young people pushing
strollers, older couples walking and I have also seen an increase in runners. Exercising in a gym with a trainer is a trend.
Running among millennial’s is less popular as they would rather be on their smart phone or device. 5K races have grown a lot in recent years.
4) What forces are occurring locally? Regionally? Nationally? Globally?
Hospitals are faced with the threat of ransom wear. If hospitals are forced to pay this for data that has been kidnapped, that will drive the cost of care up. I know of hospitals that have done this. What does that also do to patient’s perception of their data security? If
one hospital pays then there is a perception that everyone will pay. This is data that should be highly protected. I do not know how this will change in the future as we are opening up so much more access to patient’s data. Is this going to open us up for more complications with HIPA?
This is not so bad with the patient portal but rather on the mobile devices. The mobile carriers do not have as much security.
International relations and the trade agreements we have in place with other countries is important since we are a farming community. Terrorism and the fear it engenders leads to increased levels of stress. Stress is not good
for our health. Zika virus and other super bugs will find their way to Hamilton County.
166
Immigration – immigrants may need more access to health care or they may experience no access to health care. Both situations impact the Public Health System in our community.
Measles, mumps, pertussis are all being seen again. This could be from immigrants that come in and are not vaccinated or from the no vaccers.
Celebrities can fuel people down a wrong path, such as encouraging people to not vaccinate their children. Increased travel leads to the increased spread of germs and diseases.
Climate change Tighter construction of homes can lead to a potential for increased air quality issues.
5) What characteristics of our jurisdiction or state may pose an opportunity? A
Threat?
We are locally owned so we can change faster. We have someone right here who can make it happen for us. Forward thinking and dynamic community leadership is a positive.
The internet is both a positive and negative. We can reach out to the world but the world also can come back to us. Social connectedness through the internet has both a positive or negative impact.
Recreation is both an opportunity and a threat. Young people want a lot to do. We do have a lot to offer young people, and many are coming back. However, we have fewer opportunities than some communities, and this keeps many young people away.
We have an opportunity to reach out to more people with a message that connects with them.
We do not seem to market potential health concerns enough to motivate people to take care of their health. How can we reach young people and create a sense of urgency regarding taking care of
their health. We have an opportunity to capitalize on the increasing activity among many in our community. How can we capitalize on this and increase it?
167
I think because we are a safe area of the country we have an opportunity to grow. We are a place where people can raise their families in a safe location, with clean air, and nice recreational facilitates.
We have a great school system. We do not have an abundance of housing. We need more entry level housing.
As more people stay in their homes, instead of going into a nursing home, we do not have the flow of entry level homes coming on the market.
Some people have a perception that bigger is better and do not see our hospital as a first option. There is a perception that a specialist will produce a better outcome than the local option.
We can have a sense of denial on the prevalence of drug abuse (prescription and illegal) Antibiotic abuse has created some of our issues with drug resistance. How can we
combat some of these issues?
6) What may occur or has occurred that may pose a barrier to achieving health for
everyone in our community?
Finances – people are making choices based on cost and not what is the best Lack of education about healthcare and insurance
Single parent homes and poverty Difficulty in recruiting specialists
Lack of knowledge about what services are available in our community Children in poverty, obesity and sexually transmitted diseases are three areas that the
report indicates are getting worse. We need more of a focus on mental health. Even the larger communities are cutting back on mental health services.
The busy life styles prevent us from having sufficient time to sit down to a nutritious family meal, as well as a lack of time to cook it. We are constantly running from one activity to another.
168
Stress is heightened when kids participate in high pressure travel sports. Weekends are devoted to following the kids from game to game, home and family tends to be neglected.
The rising divorce rate and the breakdown of the family structure impacts the stress levels of children and parents. Increased stress rates lead to poorer health outcomes.
Social pressure on both parents and kids leads to an over committed lifestyle. Kids who do not partake in all of the summer activities then frequently are not able to
play the sport during the school year. This added pressure on kids, to compete in high pressure sports and excel in school can lead to a stress filled life.
5 years ago kid’s headed for division 1 sports played travel sports. Today, it is the 2
nd tier
kids and kids that have no chance of starting that are involved in club sports and travel teams.
We have identified the following forces of change – Identify your top three forces?
New hospital and clinic construction
Decrease in some preventative surgical procedures due to Obama care Increase in preventative healthcare due to Obama care Presidential election and legislative changes CNS Assisted Living - final rule
Aging population and changing demographics Increasing use of technology in medicine seen both as a + and – Changing revenue streams if changes in healthcare continue (emphasis on preventative) More people staying at home as opposed to going into a nursing home.
Shorter hospital stays – fewer readmissions Insurance companies getting into the healthcare business Desire for immediacy in life including healthcare Necessity to transfer some patients from the community to facilities with more services
Increasing immigration of people with high medical needs and limited history of medical care Lack of public awareness of what is available and what is covered by insurance. Disjointed medical records and a lack of a continuum of care A lack of desire and motivation of the public to take care of themselves
Busy life increasing stress on families Social media has both a + and – influence on health care decisions High co pays and economic stresses keep people away from health care Knowledge based society demands increasing transparency in medical records
Generational differences in the approach to health care
169
Obesity epidemic fueled by increasing amounts of screen time and decreasing activity levels Rural farming – farms are larger and need fewer workers to handle, less physically demanding on farmers.
Changes in the use of personal gardening General ignorance regarding nutrition and healthy eating Increase personal exercise among some people Concern over data breeches and security issues
International relations and trade agreements effecting agricultural economy Increase of super bugs Re-occurrence of measles, mumps and pertussis Climate change
Forward thinking leadership Lack of motivation and concern for healthcare Lack of housing Perception the “Bigger is better”
Drug abuse and antibiotic over use Poverty Single parent homes Increasing divorce rate
7) What is your initial reaction to this list? (something you are excited about, feeling
fearful/anxious about)
Anxious about the new hospitals and clinics that are being built Confused – how do we bring this all together?
Exciting – I see lots of opportunity for growth Excited that we have such progressive leadership
Local hospital control will help us make changes
8) What themes are we seeing across these Forces of Change that we should be paying
special attention to as we discuss the health priorities in our community?
Increased use of technology is both a positive and a negative Nutrition – how can we educate people and help them afford to eat a healthy diet.
Change is happening
There are lots of misperceptions
170
9) What will be important to remember as we look at our next community data and
determine our priorities?
How are we going to educate the community? What are the resources that are available?
How can we affordably shop for healthy food? Mental health is a huge issue?
Conclusion
The broader environment is constantly affecting communities and local public health systems.
State and federal legislation, rapid technological advances, changes in the organization of health care services, shifts in economic forces, and changing family structures and gender roles are all examples of Forces of Change. These forces are important because they affect, either directly or indirectly, the health and quality of life in the community and the effectiveness of the local
public health system. The data gathered from this focus group will help the Aurora Memorial Community Health Hospital, and the Central District Health Department prioritize public health issues and identify resources for addressing them.
171
Appendix B
Executive Summary
The Central District Health Department and Aurora Memorial Community Health Hospital have embarked on a Community Health Assessment process of Hamilton County. On June 29, 2016, the partners jointly sponsored a community focus group to share data and prioritize key areas to focus on as a community over the next three years in their efforts to positively impact
community health. Broad community participation, including public, private and voluntary organizations, gathered together as representative of the local public health system. Robust community participation lead to collective thinking and, ultimately, will suggest effective, sustainable solutions to complex problems. The focus group determined that the health issues
most important for Hamilton County to focus on for the next three years are: 10) Obesity
11) Behavioral Health – Mental Health
12) Substance Abuse
13) Maternal, Infant and Child Health
14) Injury and Violence
15) Access to Health Care
Forces of Change
To begin the focus group participants introduced themselves and shared their occupations and what they do to promote public health in Hamilton County. Stephanie Bunner, Accreditation Coordinator of the Central District Health Department, shared the findings from a comprehensive review of the 2016 Community Health Assessment Data for
Hamilton County. After listening to the data, participants were asked to consider the Forces of Change happening in Hamilton County. Forces are a broad all-encompassing category that includes trends, events, and factors. Trends are patters over time, such as migration in and out of a community or
increasing use of technology. Factors are discrete elements, such as a community’s large ethnic population, a rural setting, or a jurisdiction’s proximity to a major waterway. Events are one -time occurrences such as a hospital closure, a natural disaster, or the passage of new legislation.
Focus group participants were asked to consider any and al l types of forces, including: Social
Economic
Political
Environmental
Technological
Scientific
Legal
Ethical
172
Focus group participants then discussed the following questions regarding Forces of
Change: (The complete transcripts of the discussions are found at the end of this report.) 10) Think about Forces of Change, outside of your control, that affects the local public health
system or community. What has occurred recently that may affect our local public health system or community?
11) What may occur in the future?
12) Are there any trends occurring that will have an impact? Describe the trends.
13) What forces are occurring locally? Regionally? Nationally? Globally?
14) What characteristics of our jurisdiction or state may pose an opportunity? A Threat?
15) What may occur or has occurred that may pose a barrier to achieving health for everyone
in our community?
The following forces of change were identified from the discussion: Aging population (+/-)
Young moving back Amenities, fitness, trails, Screen time (+/-) Health issues
Abundance of water Technology (+/-) Disconnect with technology Technology & Fitness
Hospital cutting edge Backpack program Disconnect Back Pack program Food panty
Single parent household Dual parent households – 2 exhausted parents Fast food Time shortages
Increased stress – Sleep Disorders–Obesity Lack of a family meal time Increased activity work & children’s schedules No time for exercise – vicious cycle
Health fair Insurance confusion Need more medical/insurance education Major changes in health care (+/-)
May look different
173
Prescription drug abuse Nutritional standards (+/-) Healthy Breakfast (+/-)
Portion size Economic disconnect Resources many are free Economic and generational disconnect
Mindset & Motivation How to develop a longitudinal mindset Prevention in healthcare and lifestyle Life-style change rather than a quick fix
Drug resistant antibiotics and super bugs Coordinate the message Longitudinal path Farmer’s market
Community Garden Produce Co-op Generativity Organic movement
Loneliness
Focus group participants were asked to consider the Forces of Change that were identified
and respond to the following questions: (The complete transcripts of the discussions are
found at the end of this report.) 16) What is your initial reaction to this list? (something you are excited about, feeling
fearful/anxious about)
17) What themes are we seeing across these Forces of Change that we should be paying
special attention to as we discuss the health priorities in our community?
18) What will be important to remember as we look at our next community data and determine our priorities?
Next the focus group participants discussed six different areas of need:
1) Behavioral/Mental Health
2) Injury and Violence
3) Obesity
4) Maternal, Infant, and Child Health
5) Access to Health Care
6) Substance Abuse Participants were asked to consider three questions:
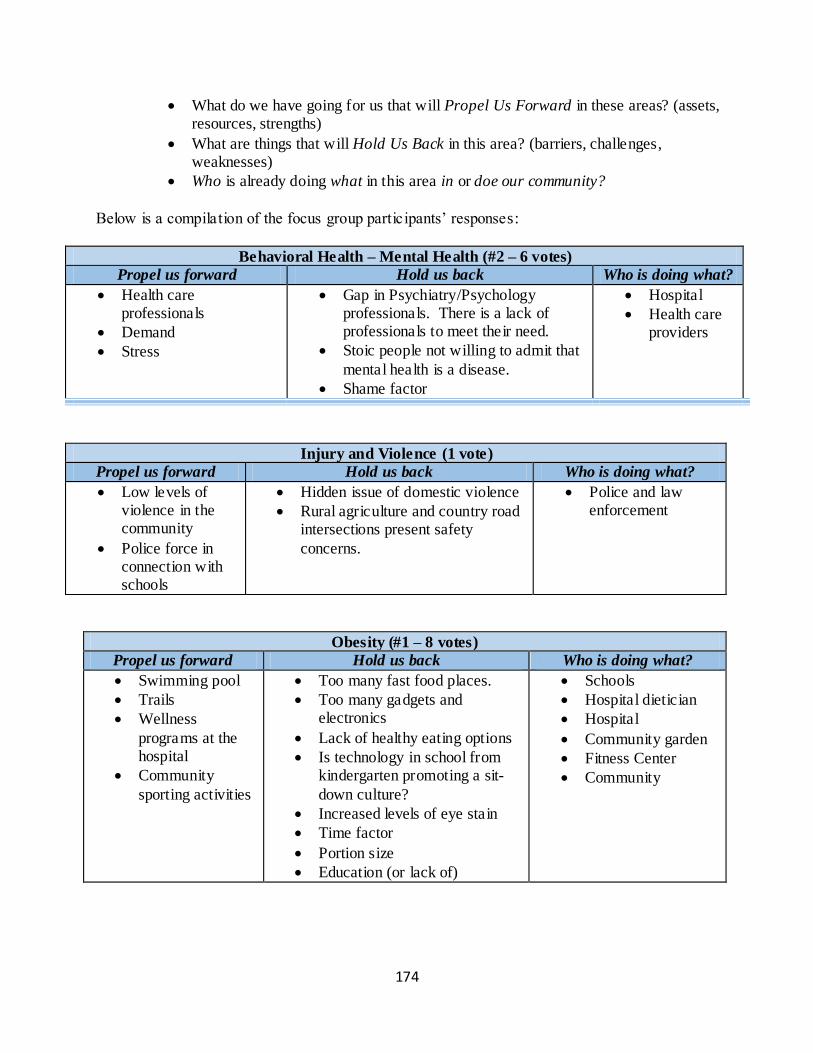
174
What do we have going for us that will Propel Us Forward in these areas? (assets, resources, strengths)
What are things that will Hold Us Back in this area? (barriers, challenges, weaknesses)
Who is already doing what in this area in or doe our community?
Below is a compilation of the focus group participants’ responses:
Behavioral Health – Mental Health (#2 – 6 votes)
Propel us forward Hold us back Who is doing what?
Health care professionals
Demand
Stress
Gap in Psychiatry/Psychology professionals. There is a lack of professionals to meet their need.
Stoic people not willing to admit that
mental health is a disease.
Shame factor
Hospital
Health care providers
Injury and Violence (1 vote)
Propel us forward Hold us back Who is doing what?
Low levels of violence in the community
Police force in connection with schools
Hidden issue of domestic violence
Rural agriculture and country road intersections present safety
concerns.
Police and law enforcement
Obesity (#1 – 8 votes)
Propel us forward Hold us back Who is doing what?
Swimming pool
Trails
Wellness
programs at the hospital
Community
sporting activities
Too many fast food places.
Too many gadgets and electronics
Lack of healthy eating options
Is technology in school from kindergarten promoting a sit-
down culture?
Increased levels of eye stain
Time factor
Portion size
Education (or lack of)
Schools
Hospital dietician
Hospital
Community garden
Fitness Center
Community
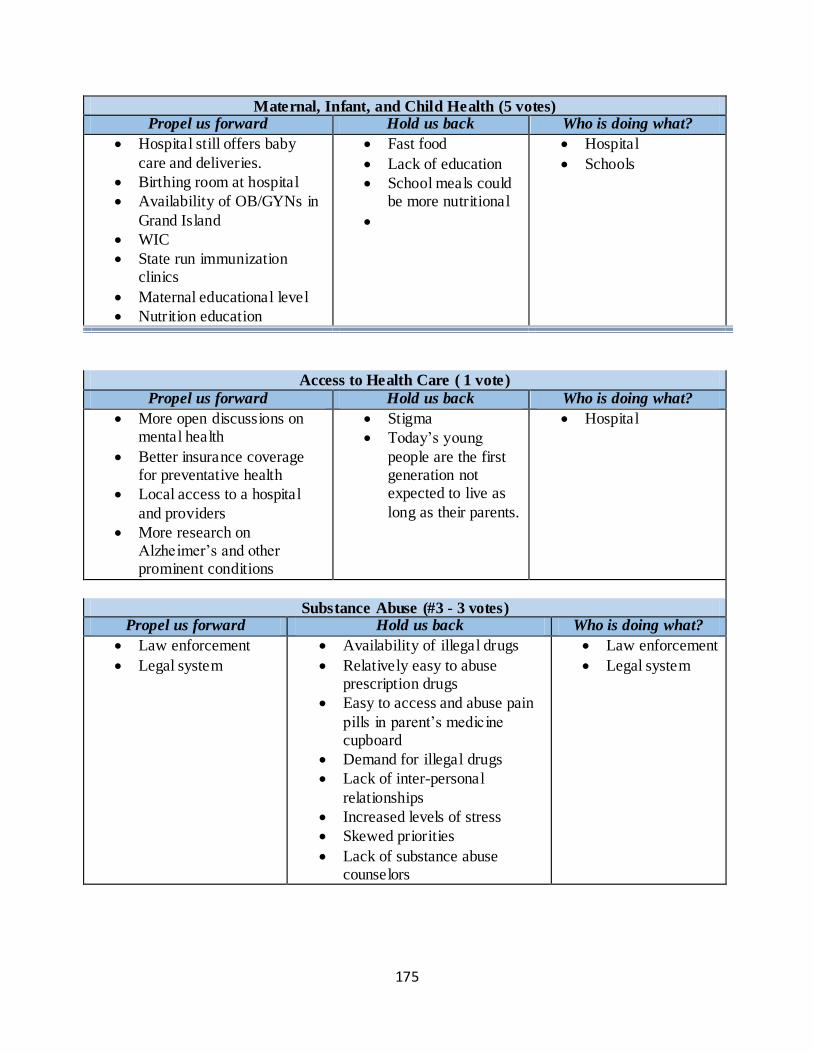
175
Maternal, Infant, and Child Health (5 votes) Propel us forward Hold us back Who is doing what?
Hospital still offers baby
care and deliveries.
Birthing room at hospital
Availability of OB/GYNs in
Grand Island
WIC
State run immunization clinics
Maternal educational level
Nutrition education
Fast food
Lack of education
School meals could be more nutritional
Hospital
Schools
Access to Health Care ( 1 vote)
Propel us forward Hold us back Who is doing what?
More open discussions on mental health
Better insurance coverage for preventative health
Local access to a hospital
and providers
More research on Alzheimer’s and other prominent conditions
Stigma
Today’s young
people are the first generation not expected to live as
long as their parents.
Hospital
Substance Abuse (#3 - 3 votes) Propel us forward Hold us back Who is doing what?
Law enforcement
Legal system
Availability of illegal drugs
Relatively easy to abuse prescription drugs
Easy to access and abuse pain
pills in parent’s medicine cupboard
Demand for illegal drugs
Lack of inter-personal
relationships
Increased levels of stress
Skewed priorities
Lack of substance abuse counselors
Law enforcement
Legal system
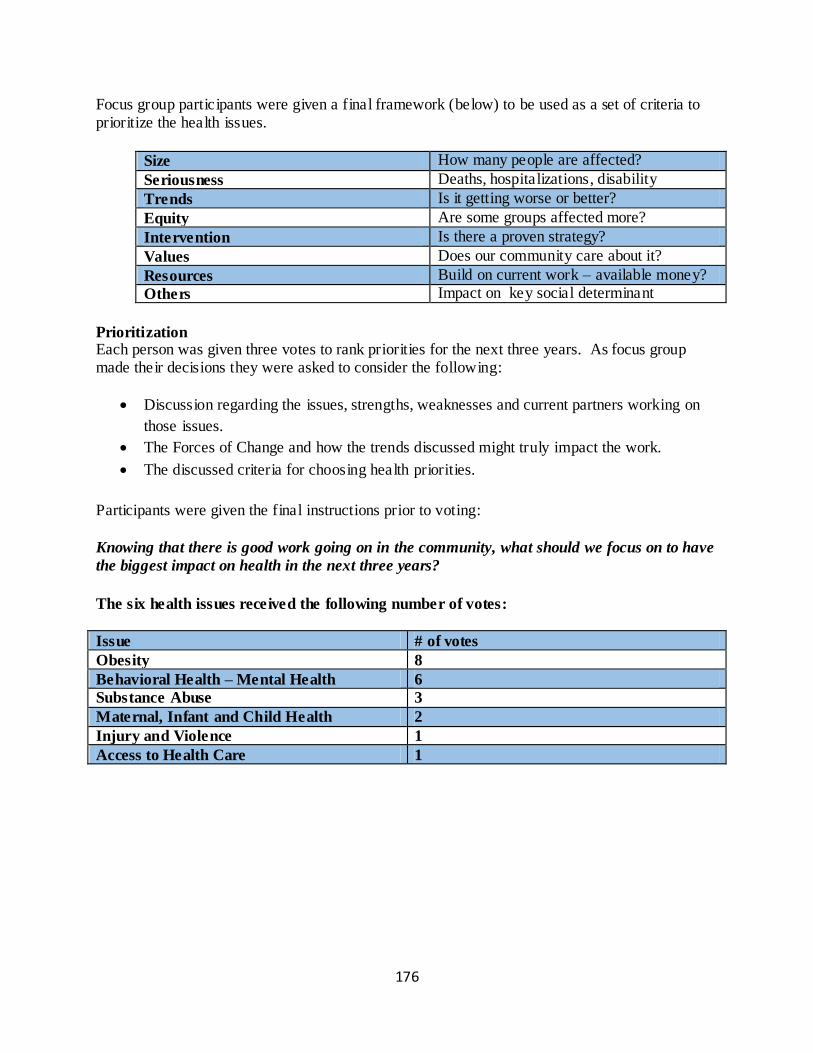
176
Focus group participants were given a final framework (below) to be used as a set of criteria to prioritize the health issues.
Size How many people are affected?
Seriousness Deaths, hospitalizations, disability
Trends Is it getting worse or better?
Equity Are some groups affected more?
Intervention Is there a proven strategy?
Values Does our community care about it?
Resources Build on current work – available money?
Others Impact on key social determinant
Prioritization Each person was given three votes to rank priorities for the next three years. As focus group made their decisions they were asked to consider the following:
Discussion regarding the issues, strengths, weaknesses and current partners working on
those issues.
The Forces of Change and how the trends discussed might truly impact the work.
The discussed criteria for choosing health priorities.
Participants were given the final instructions prior to voting:
Knowing that there is good work going on in the community, what should we focus on to have
the biggest impact on health in the next three years?
The six health issues received the following number of votes:
Issue # of votes
Obesity 8
Behavioral Health – Mental Health 6
Substance Abuse 3
Maternal, Infant and Child Health 2
Injury and Violence 1
Access to Health Care 1
177
Focus Group Transcripts:
10) Ice Breaker Question: Tell us who you are, what your occupation is and share with us
what you do to promote public health. (Have each person respond, but do not go around
in a circle. Start with co-facilitator and end with facilitator) (Opening Question) Registered nurse – Make sure family is up-to-date on vaccinations; Retired school teacher – sets good example by walking and biking; Mayor – Retired teacher – Walking, trail
system in Aurora, there is much more to do; Employee benefits to promote health; CEO from Memorial Community Health – provide sick care and an increased focus on wellness and how we can work with the community and the community to promote wellness – implemented a new wellness car program to promote annual physicals etc. and
also focusing on those that are sick to live the best life possible; Stay-at-home-mom – flowers around town; Retired teacher – walking & biking; HR from Aurora Cooperative – Personal exercise routine; research on health disparities and increasing the health and well-being of those in the community.
11) Think about forces of change, outside of your control, that affects the local public health system or community. What has occurred recently that may affect our local public health system or community?
Fast food – we do not make meals at home anymore we buy them.
Aging population and at the same time we have young people that are moving back to our
community. Aurora is a draw for those looking for a retirement community and also for young people – we benefit from their influx.
We have done a good job with keeping our amenities up-to-date, that draw young people.
We have a new pool, a fitness center and the Breemer center. Thus, we have positive draws on both ends of the age spectrum.
Technology is getting bad for kids. We are seeing more and more screen time and less
pay time which is adversely affecting the health and well-being of our children.
Water – we have an abundant resource of water and a ready access to that water. Our water supply is not polluted with nitrates and other contaminates, both from a city water
perspective and also in our rural areas.
12) What may occur in the future?
Technology has become important in fitness. We have all kinds of fitness apps but there is a disparity due to SES. There are lots of people that may want to use these apps but because they cannot afford the technology these apps are not available to them. They are
178
a luxury, whereas for some people they are an everyday occurrence. This represents a disconnect in our community.
Our community is fortunate in that we are very forward looking. Currently, there is a group that is looking at building a new tennis court to replace the one that was taken out when the pool was developed.
There is another group that is looking at developing a fitness center with an indoor pool like some of the other communities have. Again, these are things that take both a lot of resources and leadership.
Our hospital is on the cutting edge with the specialists we bring into town. I was at a ground break ceremony at the hospital for an outside center recently and it was not about money but rather how the new resources could benefit the health and well-being and quality of life of the patients and the community.
Since 2010 we have invested over 9 million dollars in resources for recreation in Aurora. I know we are forward thinking in this community. We are a progressive community and given time we can solve even some of the statistics in this report, if we can put our mind
to it.
I do see some group that we have that are not acing the needs of some people. My example there is the backpack program. I am for the program but currently we only have
one student that is taking advantage of this program. I know there are more families that could benefit from this program. This represents a disconnect. This program is not doing what it can do in our community. The resources are there; we are not getting them to the people in need.
The nutrition end of our food pantry fills a need in our community. This has been going for 27 years and the need continues to grow, especially with the recent recession and ongoing financial struggles of many in the community.
When we look at obesity and especially childhood obesity there seems to be a generational pattern. Parents who are not cooking as healthy and are not as physically active are raising children who do not know how to eat healthy or be active physically.
We have so many opportunities for children and adults to be physically active in our community. However, we see the same people participating in everything and likewise, the same groups of people do not participle. The non-participators are perhaps the groups that we need to participate the most!
How do we reach out to those groups that are not participating? I see the disconnect as continuing to grow in the future. A lot of people are recognizing obesity is an issue. However, there is another whole group the is not addressing the issue. Part of this is
fresh fruit is more expensive than a box of sure fine Mac & Cheese.
179
13) Are there any trends occurring that will have an impact? Describe the trends.
I see the obesity epidemic as a trend. When you see families at events you can see that
this appears to be something that is a pattern.
People are working so hard and so long during the day that they cannot find a moment to exercise.
I deal with a lot of people and very few of them are exercising, especially cardio. They may be walking but very few of them are actually getting their cardio in.
People do not understand how metabolism works. This is a difficult concept to understand – people do not know how weight loss works, or how to keep the weight off.
Family structure is another part of this issue. More families are single parent households.
They do not have enough time to cook. They are coming home and their one focus is to take care of the kids. They do not have time to cook. Plus, they want their down time too.
Even if there are to parents, they are both working. In addition, the fast food is so convenient. It is so easy and cheap to drive through Pizza Hut and pick up your $6.00 medium pizza on your way home.
People come home and they also have many children’s structured activities. Even if they wanted to exercise and found the time to do so, kids often have structured activities every night of the week. The whole day kids can be busy.
As a whole our lifestyles get busier and busier every year. This leads to the cycle of fast food – no time for exercise – increased levels of stress. Hotdogs at the baseball field.
This carries over to people own health – not getting the care they should. This may be
partly economic and also partly the time factor. People say, especially men, oh I will get into the doctor. They end up putting off something that should have been looked a much earlier.
A positive is the Health Fair that is put on by the hospital. This is so super for every member of our community. If they take advantage of it.
All of the activities that you have been talking about, the increased level of work and
busyness in or lives leads to elevated levels of stress, which in turn can lead to sleep disorders, which lead to obesity. Sleep disorders and obesity are related. This becomes a vicious circle as we get so busy. Tis does not seem to be getting any better, it is only getting worse.
180
14) What forces are occurring locally? Regionally? Nationally? Globally?
I think that understanding insurance is an issue. Many times, people do not understand
what their insurance covers. If there was some way to bring all of this together, then I think this would be in everyone’s best interest, at least as far as their hea lth and well-being is concerned.
However, today, we hear talk of the healthcare system being dismantled. If that happens where does that leave the average person in understanding their health care benefits?
The education piece, for health care, is lacking. Today, those individuals that can educate
the public on healthcare are being squeezed out. Large companies are actually determining what can be treated – this will tie the hands of hospitals. Most people have no idea this exists and no one wants to educate people on this. If people know what was coming you probably would not be thrilled with it.
Universal healthcare is being placed in a privatized sector. It is very difficult to marry universal health care with a private system to reach the entire benefit of the system. I think decisions are being made based upon the bottom line and not on the true healthcare
outcomes of the larger population.
Health care is becoming generalized as opposed to treating the needs of the individual. We need competition, we need a local hospital, we need a hospital 20 miles down the
road. Tis is slowly slipping away in our society. One of the concerns from an international perspective is all of the drug resistant viruses and super bugs are out there. This is coming to Nebraska and Hamilton County. This is exacerbated by people’s expectations of a quick and immediate fix for everything. They
want to walk in and get a pill for everything. There is an expectation nationwide that is creating the issue of bacteria resistant strains.
The trend of prescription drug abuse is here and it is getting a lot of national attention
now. It is getting a lot of attention and it needs to. We are having a lot of people die needlessly from overdoses.
We are probably not getting the correct help from our federal government. We face grid
lock in so many areas. The current health care system is a good example. We have one party one way and the other party the other way. This is a factor that directly affects us.
The Medicaid expansion is an example of this. There is a fight going on and there’re real
people that suffer and are caught in the middle. They cannot get the care they might in a neighboring state because we have not accepted the Medicare expansion. This is a political fight.
181
I wish we were set up better economically. If we can prevent some of this stuff, we will save so much money I do not think we will even be able to count it. If we can get people in for early, preventative measures, this will save millions of dollars.
Every dollar that is spent with Early childhood development raps exponential savings in the long run. The same is true for healthcare. Preventative and wellness programs also have the potential to save lots of money.
The nutrition standards set by the Federal Government are a good thing. It gives people guidelines that we did not have before.
The Affordable Care Act (ACA) did force insurance companies to pay for routine and annual physicals for preventative health and immunizations. This is money well spent.
The opposite of that is now the ACA is not covering something that previously were
covered. This is a give and take.
Isn’t there a change now for pay-for-service to outcome based measures?
Yes, we have joined an accountable care organization. It is now more of a pay for performance rather than a pay for service. By 2018 the Government is trying to get away
from all Medicaid services being pay for service to outcome based.
The accountable care service we are in gives us an advantage to position us to do the right thing and also learn how to document and prove that we did the right thing and
prove the outcomes.
Scoring is the next things coming. Hospitals we will be scored based on their service, cost and outcomes.
Health care is rapidly changing, faster than I have ever seen it change. The changes today are similar to when we were in the 1960s and Medicare was first in play. We are in a ground moving, changing force. I think the direction and concepts are good as far as
the right thing to do for patients. However, it is a challenge and some businesses will not survive it. It is a zero-dollar program. The federal government says if you do really well you get an incentive and if you do not do really well you get docked. When no new dollars are put into the system there is no money for the incentives. Thus, they have to
find some who are not doing well to create funds for the incentives for those who are doing well.
182
15) What characteristics of our jurisdiction or state may pose an opportunity? A
Threat?
I see an opportunity with our agriculture. The school breakfast program could use some improvement. I saw a calendar of the breakfasts provided. It was a pop tart on Monday, French toast on Tuesday a fruit cup on Wednesday. This really rubbed me the wrong way. We live in an agricultural community. There is a way to feed people. We have the
technology and the land. We can put more of this into our school system. We have an abundance of fresh food we can give our children, starting at the breakfast table. Especially for those children who may not have access to healthy foods at home. Instead of putting sugar in their bodies and then they crash by 10:00 am and are a disturbance in
the classroom, let’s give them healthy options. This also does not teach them health eating. We need to provide them with health options at school that they can, hopefully model at home. They may come home and say,
mom I want scrambled eggs for breakfast instead of the donut. Portion size is amazing. Our plates are getting bigger and people are not aware of what one serving is. We need to educate on portion size.
It takes about 20-30 minutes for your stomach to send your brain the message that you are full.
Is the Health District involved in schools at all? Can the Health District solicit schools or does tis come from the school’s first? There are programs at the CDHD that look at healthy vending.
The adults are going to have to step forward. If we want kids to eat healthy then we have to make sure the adults know what this is. If we want our kids to learn correctly, they have to have the right nutrition.
Portion size is out of control. My wife is a dietician and she would say that is you eat more than the size of your fist on a dinner plate you have eaten too much. This is historical, the size of dinner plates 50 ears ago are the size of our current dessert plates.
As plates have increased in size so to have our portions. We have created this whole image of ore is better. We have taken trays away one day per week at the hospital. Everything you are eating
should fit on a normal dinner plate. Taking the tray away can help to cut down on portion sizes.
183
There is another disconnect economically. People cannot afford a fitness center where they have to pay a membership. Finding ways to open this up to people who cannot afforded may be an opportunity.
The Bremmer Center is free – you do not need to have a membership. You can take care of some of the stress in your life if you exercise. Find the time for it is
a threat. We don’t always have the time or do not want to find the time. We have groups that have access to work out facilities that do not utilize them. It is a mental attitude People must want to be healthy. Even with the wellness programs we put
in place it is very difficult to get people to use them. At the Aurora Coop the exercise facilities ae open for all employees. I am the only one that uses them. This is out of 70 employees.
We are trying to figure out was to motivate people to be health. Healthcare is getting more expensive. Employers want people to have healthcare but they would also like to know that their employees are putting something into maintaining their heath as well.
The hospital has done some of this with the healthcare challenge. We did not do the community weight loss challenge this year, we just did it for our groups. Our group lost 886 lbs. this year. We laughed and said we lost a cow.
There was a lot of enthusiasm with this. We have tried with the CDHDF in fits and starts to brainstorm how we can get more excitement and community buy in. I think a community reaches a tipping point in this. You have to get the buy in and once you have
it you can move forward. However, we have never been able to reach that tipping point in our community so everything tends to fizzle. If we can do things as a group that tends to keep the enthusiasm up. My individual
enthusiasm is not that great. We have a wonderful walking track at the high school. If we can focus use on our existing facilities, we might see more success. However, this takes coordination. I do not know how you get into the businesses or how you can sustain it.
For example, how many of our group that lost the 886 lbs. will keep it off after a year? It needs to become a lifestyle change, more than anything else.
Let’s forget the short term goals and move our focus to the long term goals. This is a major challenge. Promoting the farmers market or looking into that style of living. This is becoming more
popular.
184
When you see a line of cars around McDonalds. We have only one Saturday for the Farmers market. How can we market this better? Maybe move it right across from McDonalds.
Aurora has community gardens. I think that is great. The Methodist church offers a community garden.
We also have a produce Co-op. This is great for the winter months. The younger people are buying more organics. This is seen as a health benefit. The younger people are starting to think about what is best for us in the long run, instead of
what is the cheapest. Even making a simple meal at home, with conversation around the dinner table is so important.
We need to control for sugar and salt, which we can do if we cook at home. Processed or fast food is loaded with both sugar and salt.
The family meal and the dinner table conversation is so important and seems to be so lost. Mental health issues are also important.
We are seeing a lot of individuals who are very lonely. After living with a spouse for many years and then one spouse dies, how do we come along side those people, rather than giving them a pill? How can we come alongside them so they feel validated and important, rather than taking a pill? Instead of encouraging them to get back into society
and contributing, they are checking out. The value that the older generation can bring to young kids is at times lost. Some of this is taken care of by the coffee groups that need in town. The Senior Center does a great
job but the people there are already social people. How can we reach those that are feeling alienated and lost in their homes? I also am concerned with young people moving into our community and how to help them connect. I do not think we are addressing this. I think there are ways to do both but
who is going to do this? I think we need to assign people to these project. Pancake feeds, Optimist and Rotary clubs, Lions Club etc. have people working them that are beginning to age out. The young professionals moving into town need to be
encouraged to take an active and vital role in the community and take on some of these leadership roles. These groups are in need of ne people to help.
16) What may occur or has occurred that may pose a barrier to achieving health for
everyone in our community?
185
Income – Health Plans and insurance – they do not have employer provided health insurance – the aging population and the financial woes that go along with living on a fixed income – a lack of awareness of when we should go for wellness visits – we should
be aware of what our wellness visits cover. A stoic mentality and a desire to wait until things are really bad before seeking care. Difficulty in reaching certain populations.
Not getting resources to those in most need. Individuals not have the motivation or knowledge to effectively advocate for their own
health care. Difficulty in making life style choices that lead to better health outcomes.
Lack of mental health professionals in the area is a significant barrier.
We have identified the following forces of change – Identify your top three forces?
Health issues Abundance of water
Technology (+/-) Disconnect with technology
Technology & Fitness Hospital cutting edge
Backpack program Disconnect Back Pack program
Food panty Single parent household
Dual parent households – 2 exhausted parents Fast food
Time shortages Increased stress – Sleep Disorders–
Obesity Lack of a family meal time
Increased activity work & children’s schedules No time for exercise – vicious cycle
Health fair Insurance confusion
Need more medical/insurance education Major changes in health care (+/-)
May look different Prescription drug abuse
Nutritional standards (+/-) Healthy Breakfast (+/-)
Portion size Economic disconnect
Resources many are free Economic and generational disconnect
Mindset & Motivation How to develop a longitudinal mindset
Prevention in healthcare and lifestyle Life-style change rather than a quick fix
Drug resistant antibiotics and super bugs Coordinate the message
Longitudinal path Farmer’s market
Community Garden Produce Co-op
Generativity Organic movement
Loneliness
17) What is your initial reaction to this list? (something you are excited about, feeling
fearful/anxious about)
186
Confusion – how do you bring this all together?
How do we address all these issues? I think there is an opportunity for an organization such as CDHD to organize and implement these issues.
People do not know how to plug in or unplug. I think there are a lot more positives than negatives on this list.
Our hospital is a leader in a lot of these things. I do not think the hospital can do it all. However, the hospital is a leader in our community and helps to set the direction. We are on the cutting edge. How do we get everyone involved in the good things that are happening?
Things are changing. Today, people are self-diagnosing. Now we have google. We have to make the positive choices than what people are currently doing. Now,
getting fast food through the drive through to get to the kid’s game is more important than cooking at home. How can we change that? We have to look at priorities.
Every ten years we do a strategic plan for Aurora. If we could get on that group right here we could get this done. We have to get this to the headlines so people can say, this is something we want to be involved in.
18) What themes are we seeing across these Forces of Change that we should be paying
special attention to as we discuss the health priorities in our community?
Time and money – thee fit into everything we have talked about. Motivation
Education gaps and motivation gap. Pride factor can get in the way. Ministerial association – they help many people in need and they will have to be on board
to solve these things. Aurora is friendly but not welcoming. This is a good picture of us. We will be kind to the person we are introduced to but I do not know if we will take the next step.
187
19) What will be important to remember as we look at our next community data and
determine our priorities?
To be as inclusive as we possibly can be. How do we reach people where they are today and to motivate them to make these changes?
Conclusion
The broader environment is constantly affecting communities and local public health systems.
State and federal legislation, rapid technological advances, changes in the organization of health care services, shifts in economic forces, and changing family structures and gender roles are all examples of Forces of Change. These forces are important because they affect, either directly or indirectly, the health and quality of life in the community and the effectiveness of the local
public health system. The data gathered from this focus group will help Hamilton County, the Aurora Memorial Community Health Hospital, and the Central District Health Department prioritize public health issues and identify resources for addressing them.
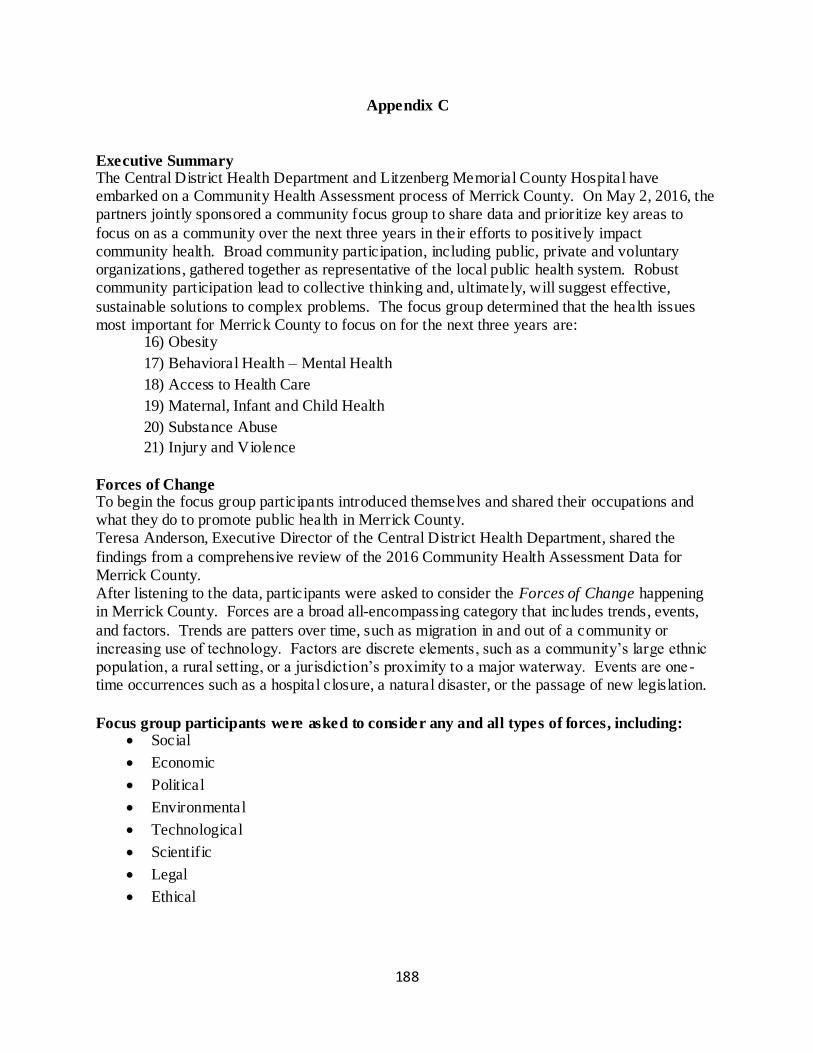
188
Appendix C
Executive Summary The Central District Health Department and Litzenberg Memorial County Hospital have embarked on a Community Health Assessment process of Merrick County. On May 2, 2016, the partners jointly sponsored a community focus group to share data and prioritize key areas to
focus on as a community over the next three years in their efforts to positively impact community health. Broad community participation, including public, private and voluntary organizations, gathered together as representative of the local public health system. Robust community participation lead to collective thinking and, ultimately, will suggest effective,
sustainable solutions to complex problems. The focus group determined that the health issues most important for Merrick County to focus on for the next three years are:
16) Obesity
17) Behavioral Health – Mental Health
18) Access to Health Care
19) Maternal, Infant and Child Health
20) Substance Abuse
21) Injury and Violence
Forces of Change To begin the focus group participants introduced themselves and shared their occupations and what they do to promote public health in Merrick County. Teresa Anderson, Executive Director of the Central District Health Department, shared the
findings from a comprehensive review of the 2016 Community Health Assessment Data for Merrick County. After listening to the data, participants were asked to consider the Forces of Change happening in Merrick County. Forces are a broad all-encompassing category that includes trends, events,
and factors. Trends are patters over time, such as migration in and out of a community or increasing use of technology. Factors are discrete elements, such as a community’s large ethnic population, a rural setting, or a jurisdiction’s proximity to a major waterway. Events are one -time occurrences such as a hospital closure, a natural disaster, or the passage of new legislation.
Focus group participants were asked to consider any and all types of forces, including: Social
Economic
Political
Environmental
Technological
Scientific
Legal
Ethical
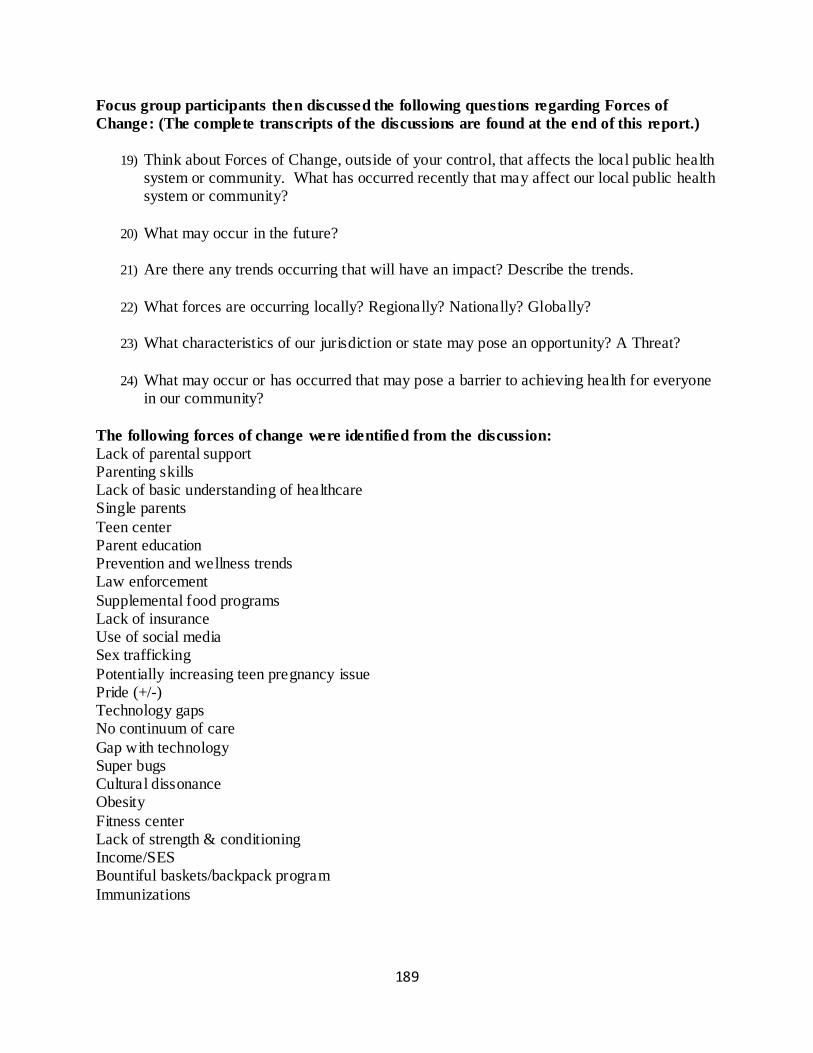
189
Focus group participants then discussed the following questions regarding Forces of
Change: (The complete transcripts of the discussions are found at the end of this report.)
19) Think about Forces of Change, outside of your control, that affects the local public health system or community. What has occurred recently that may affect our local public health system or community?
20) What may occur in the future?
21) Are there any trends occurring that will have an impact? Describe the trends.
22) What forces are occurring locally? Regionally? Nationally? Globally?
23) What characteristics of our jurisdiction or state may pose an opportunity? A Threat?
24) What may occur or has occurred that may pose a barrier to achieving health for everyone in our community?
The following forces of change were identified from the discussion:
Lack of parental support Parenting skills Lack of basic understanding of healthcare Single parents
Teen center Parent education Prevention and wellness trends Law enforcement
Supplemental food programs Lack of insurance Use of social media Sex trafficking
Potentially increasing teen pregnancy issue Pride (+/-) Technology gaps No continuum of care
Gap with technology Super bugs Cultural dissonance Obesity
Fitness center Lack of strength & conditioning Income/SES Bountiful baskets/backpack program
Immunizations
190
Falling through the health care cracks Detriments to communication STI’s and STD’s
Delays in seeking treatment Aging population No medical home Lack of mental health professionals
Focus group participants were asked to consider the Forces of Change that were identified
and respond to the following questions: (The complete transcripts of the discussions are
found at the end of this report.)
25) What is your initial reaction to this list? (something you are excited about, feeling
fearful/anxious about)
26) What themes are we seeing across these Forces of Change that we should be paying special attention to as we discuss the health priorities in our community?
27) What will be important to remember as we look at our next community data and
determine our priorities?
Next the focus group participants discussed six different areas of need:
1) Behavioral/Mental Health
2) Injury and Violence
3) Obesity
4) Maternal, Infant, and Child Health
5) Access to Health Care
6) Substance Abuse Participants were asked to consider three questions:
What do we have going for us that will Propel Us Forward in these areas? (assets, resources, strengths)
What are things that will Hold Us Back in this area? (barriers, challenges, weaknesses)
Who is already doing what in this area in or doe our community?
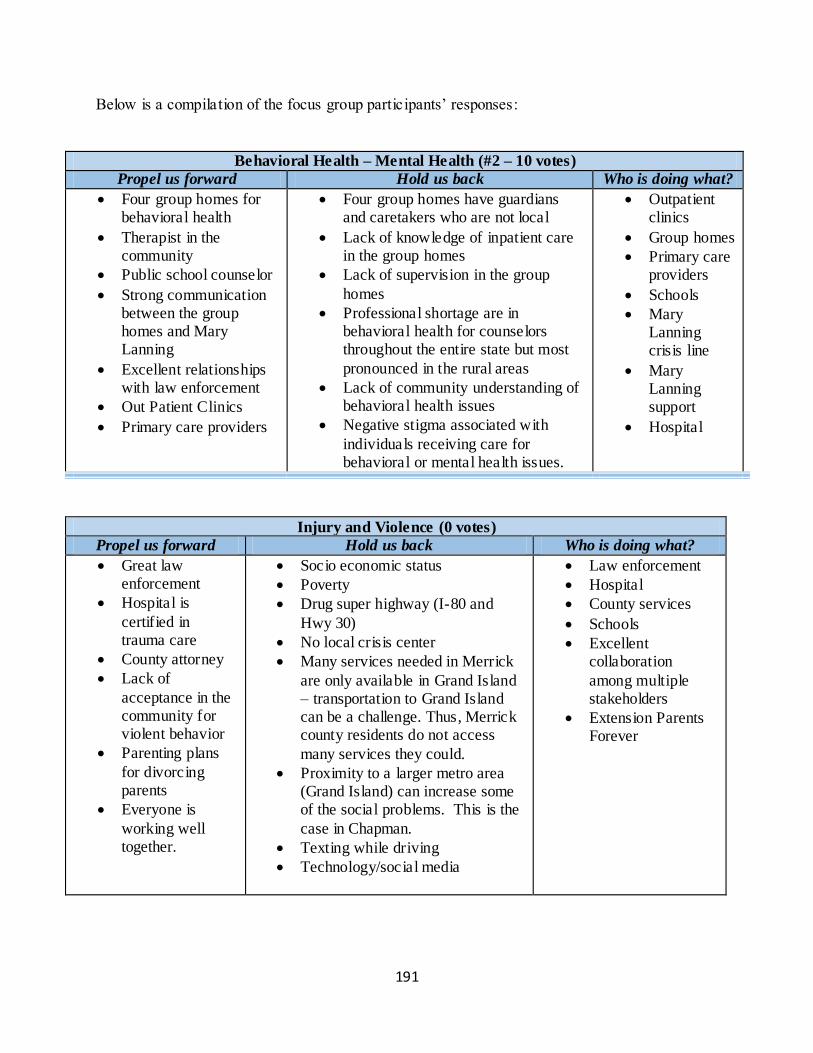
191
Below is a compilation of the focus group participants’ responses:
Behavioral Health – Mental Health (#2 – 10 votes)
Propel us forward Hold us back Who is doing what?
Four group homes for behavioral health
Therapist in the community
Public school counselor
Strong communication between the group homes and Mary Lanning
Excellent relationships with law enforcement
Out Patient Clinics
Primary care providers
Four group homes have guardians and caretakers who are not local
Lack of knowledge of inpatient care in the group homes
Lack of supervision in the group
homes
Professional shortage are in behavioral health for counselors throughout the entire state but most
pronounced in the rural areas
Lack of community understanding of behavioral health issues
Negative stigma associated with
individuals receiving care for behavioral or mental health issues.
Outpatient clinics
Group homes
Primary care providers
Schools
Mary Lanning crisis line
Mary Lanning support
Hospital
Injury and Violence (0 votes)
Propel us forward Hold us back Who is doing what?
Great law enforcement
Hospital is
certified in trauma care
County attorney
Lack of
acceptance in the community for violent behavior
Parenting plans
for divorcing parents
Everyone is
working well together.
Socio economic status
Poverty
Drug super highway (I-80 and
Hwy 30)
No local crisis center
Many services needed in Merrick
are only available in Grand Island – transportation to Grand Island can be a challenge. Thus, Merrick county residents do not access
many services they could.
Proximity to a larger metro area (Grand Island) can increase some of the social problems. This is the
case in Chapman.
Texting while driving
Technology/social media
Law enforcement
Hospital
County services
Schools
Excellent collaboration
among multiple stakeholders
Extension Parents Forever
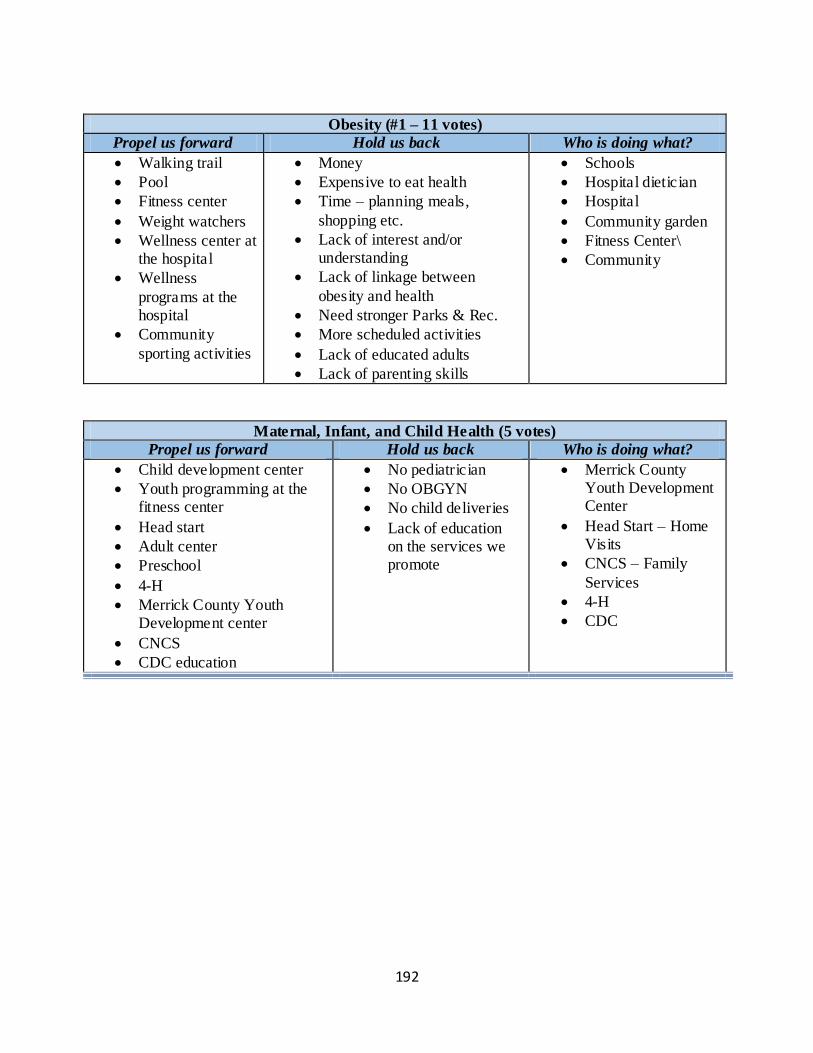
192
Obesity (#1 – 11 votes)
Propel us forward Hold us back Who is doing what?
Walking trail
Pool
Fitness center
Weight watchers
Wellness center at the hospital
Wellness
programs at the hospital
Community
sporting activities
Money
Expensive to eat health
Time – planning meals,
shopping etc.
Lack of interest and/or understanding
Lack of linkage between
obesity and health
Need stronger Parks & Rec.
More scheduled activities
Lack of educated adults
Lack of parenting skills
Schools
Hospital dietician
Hospital
Community garden
Fitness Center\
Community
Maternal, Infant, and Child Health (5 votes)
Propel us forward Hold us back Who is doing what?
Child development center
Youth programming at the fitness center
Head start
Adult center
Preschool
4-H
Merrick County Youth Development center
CNCS
CDC education
No pediatrician
No OBGYN
No child deliveries
Lack of education on the services we promote
Merrick County Youth Development Center
Head Start – Home Visits
CNCS – Family
Services
4-H
CDC
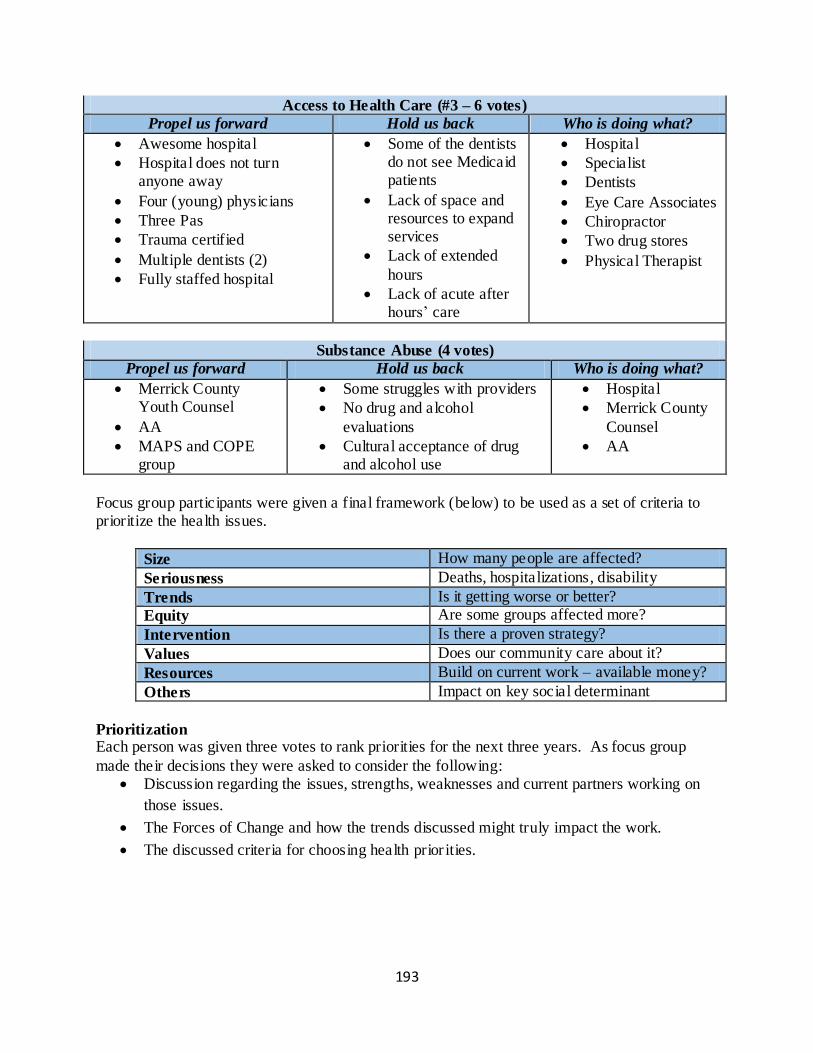
193
Access to Health Care (#3 – 6 votes)
Propel us forward Hold us back Who is doing what?
Awesome hospital
Hospital does not turn anyone away
Four (young) physicians
Three Pas
Trauma certified
Multiple dentists (2)
Fully staffed hospital
Some of the dentists do not see Medicaid patients
Lack of space and resources to expand services
Lack of extended
hours
Lack of acute after hours’ care
Hospital
Specialist
Dentists
Eye Care Associates
Chiropractor
Two drug stores
Physical Therapist
Substance Abuse (4 votes)
Propel us forward Hold us back Who is doing what?
Merrick County Youth Counsel
AA
MAPS and COPE group
Some struggles with providers
No drug and alcohol
evaluations
Cultural acceptance of drug and alcohol use
Hospital
Merrick County
Counsel
AA
Focus group participants were given a final framework (below) to be used as a set of criteria to prioritize the health issues.
Size How many people are affected?
Seriousness Deaths, hospitalizations, disability
Trends Is it getting worse or better?
Equity Are some groups affected more?
Intervention Is there a proven strategy?
Values Does our community care about it?
Resources Build on current work – available money?
Others Impact on key social determinant
Prioritization Each person was given three votes to rank priorities for the next three years. As focus group
made their decisions they were asked to consider the following: Discussion regarding the issues, strengths, weaknesses and current partners working on
those issues.
The Forces of Change and how the trends discussed might truly impact the work.
The discussed criteria for choosing health prior ities.
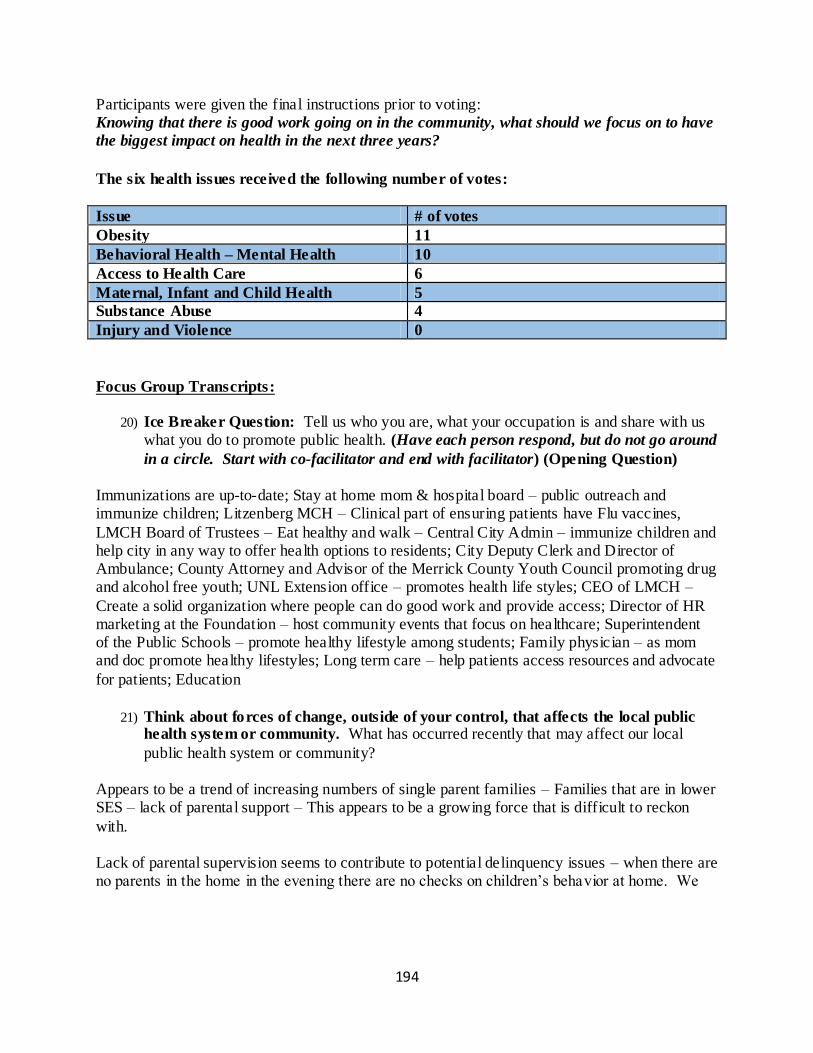
194
Participants were given the final instructions prior to voting: Knowing that there is good work going on in the community, what should we focus on to have
the biggest impact on health in the next three years?
The six health issues received the following number of votes:
Issue # of votes
Obesity 11
Behavioral Health – Mental Health 10
Access to Health Care 6
Maternal, Infant and Child Health 5
Substance Abuse 4
Injury and Violence 0
Focus Group Transcripts:
20) Ice Breaker Question: Tell us who you are, what your occupation is and share with us
what you do to promote public health. (Have each person respond, but do not go around
in a circle. Start with co-facilitator and end with facilitator) (Opening Question)
Immunizations are up-to-date; Stay at home mom & hospital board – public outreach and immunize children; Litzenberg MCH – Clinical part of ensuring patients have Flu vaccines,
LMCH Board of Trustees – Eat healthy and walk – Central City Admin – immunize children and help city in any way to offer health options to residents; City Deputy Clerk and Director of Ambulance; County Attorney and Advisor of the Merrick County Youth Council promoting drug and alcohol free youth; UNL Extension office – promotes health life styles; CEO of LMCH –
Create a solid organization where people can do good work and provide access; Director of HR marketing at the Foundation – host community events that focus on healthcare; Superintendent of the Public Schools – promote healthy lifestyle among students; Family physician – as mom and doc promote healthy lifestyles; Long term care – help patients access resources and advocate
for patients; Education
21) Think about forces of change, outside of your control, that affects the local public health system or community. What has occurred recently that may affect our local
public health system or community? Appears to be a trend of increasing numbers of single parent families – Families that are in lower SES – lack of parental support – This appears to be a growing force that is difficult to reckon
with. Lack of parental supervision seems to contribute to potential delinquency issues – when there are no parents in the home in the evening there are no checks on children’s behavior at home. We
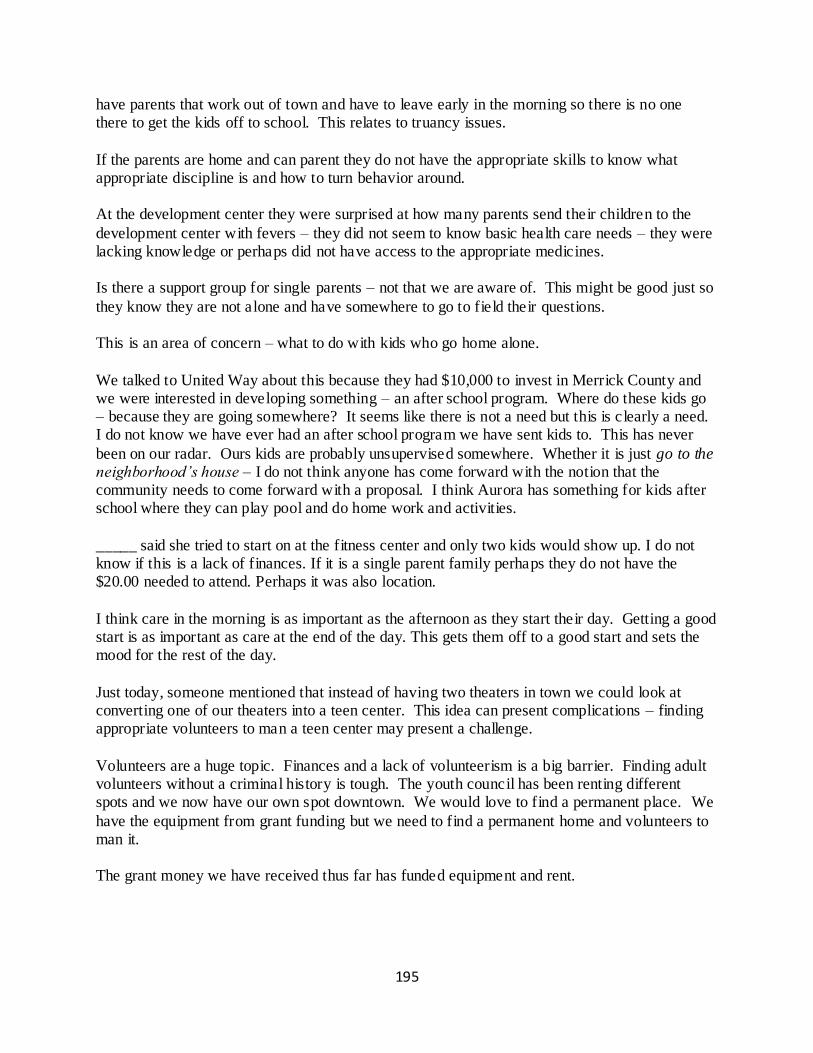
195
have parents that work out of town and have to leave early in the morning so there is no one there to get the kids off to school. This relates to truancy issues.
If the parents are home and can parent they do not have the appropriate skills to know what appropriate discipline is and how to turn behavior around. At the development center they were surprised at how many parents send their children to the
development center with fevers – they did not seem to know basic health care needs – they were lacking knowledge or perhaps did not have access to the appropriate medicines. Is there a support group for single parents – not that we are aware of. This might be good just so
they know they are not alone and have somewhere to go to field their questions. This is an area of concern – what to do with kids who go home alone.
We talked to United Way about this because they had $10,000 to invest in Merrick County and we were interested in developing something – an after school program. Where do these kids go – because they are going somewhere? It seems like there is not a need but this is clearly a need. I do not know we have ever had an after school program we have sent kids to. This has never
been on our radar. Ours kids are probably unsupervised somewhere. Whether it is just go to the neighborhood’s house – I do not think anyone has come forward with the notion that the community needs to come forward with a proposal. I think Aurora has something for kids after school where they can play pool and do home work and activities.
_____ said she tried to start on at the fitness center and only two kids would show up. I do not know if this is a lack of finances. If it is a single parent family perhaps they do not have the $20.00 needed to attend. Perhaps it was also location.
I think care in the morning is as important as the afternoon as they start their day. Getting a good start is as important as care at the end of the day. This gets them off to a good start and sets the mood for the rest of the day.
Just today, someone mentioned that instead of having two theaters in town we could look at converting one of our theaters into a teen center. This idea can present complications – finding appropriate volunteers to man a teen center may present a challenge.
Volunteers are a huge topic. Finances and a lack of volunteerism is a big barrier. Finding adult volunteers without a criminal history is tough. The youth council has been renting different spots and we now have our own spot downtown. We would love to find a permanent place. We
have the equipment from grant funding but we need to find a permanent home and volunteers to man it. The grant money we have received thus far has funded equipment and rent.
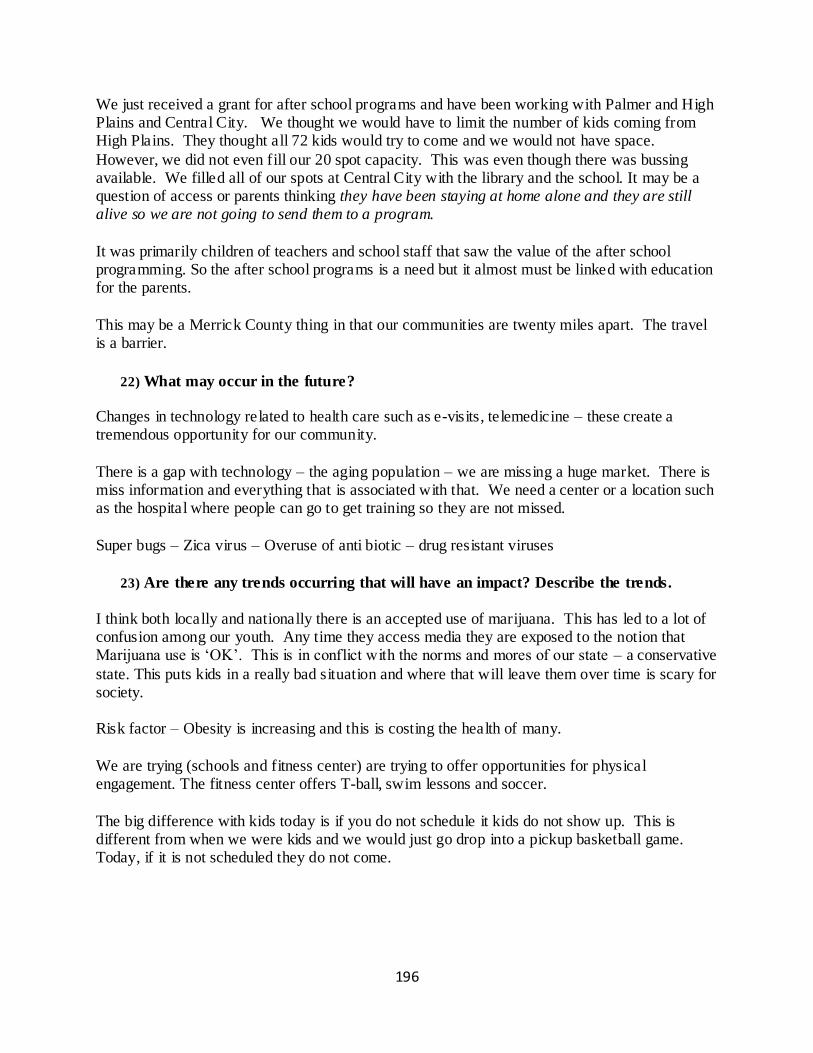
196
We just received a grant for after school programs and have been working with Palmer and High Plains and Central City. We thought we would have to limit the number of kids coming from High Plains. They thought all 72 kids would try to come and we would not have space.
However, we did not even fill our 20 spot capacity. This was even though there was bussing available. We filled all of our spots at Central City with the library and the school. It may be a question of access or parents thinking they have been staying at home alone and they are still alive so we are not going to send them to a program.
It was primarily children of teachers and school staff that saw the value of the after school programming. So the after school programs is a need but it almost must be linked with education for the parents.
This may be a Merrick County thing in that our communities are twenty miles apart. The travel is a barrier.
22) What may occur in the future? Changes in technology related to health care such as e-visits, telemedicine – these create a tremendous opportunity for our community.
There is a gap with technology – the aging population – we are missing a huge market. There is miss information and everything that is associated with that. We need a center or a location such as the hospital where people can go to get training so they are not missed.
Super bugs – Zica virus – Overuse of anti biotic – drug resistant viruses
23) Are there any trends occurring that will have an impact? Describe the trends.
I think both locally and nationally there is an accepted use of marijuana. This has led to a lot of confusion among our youth. Any time they access media they are exposed to the notion that Marijuana use is ‘OK’. This is in conflict with the norms and mores of our state – a conservative
state. This puts kids in a really bad situation and where that will leave them over time is scary for society. Risk factor – Obesity is increasing and this is costing the health of many.
We are trying (schools and fitness center) are trying to offer opportunities for physical engagement. The fitness center offers T-ball, swim lessons and soccer.
The big difference with kids today is if you do not schedule it kids do not show up. This is different from when we were kids and we would just go drop into a pickup basketball game. Today, if it is not scheduled they do not come.
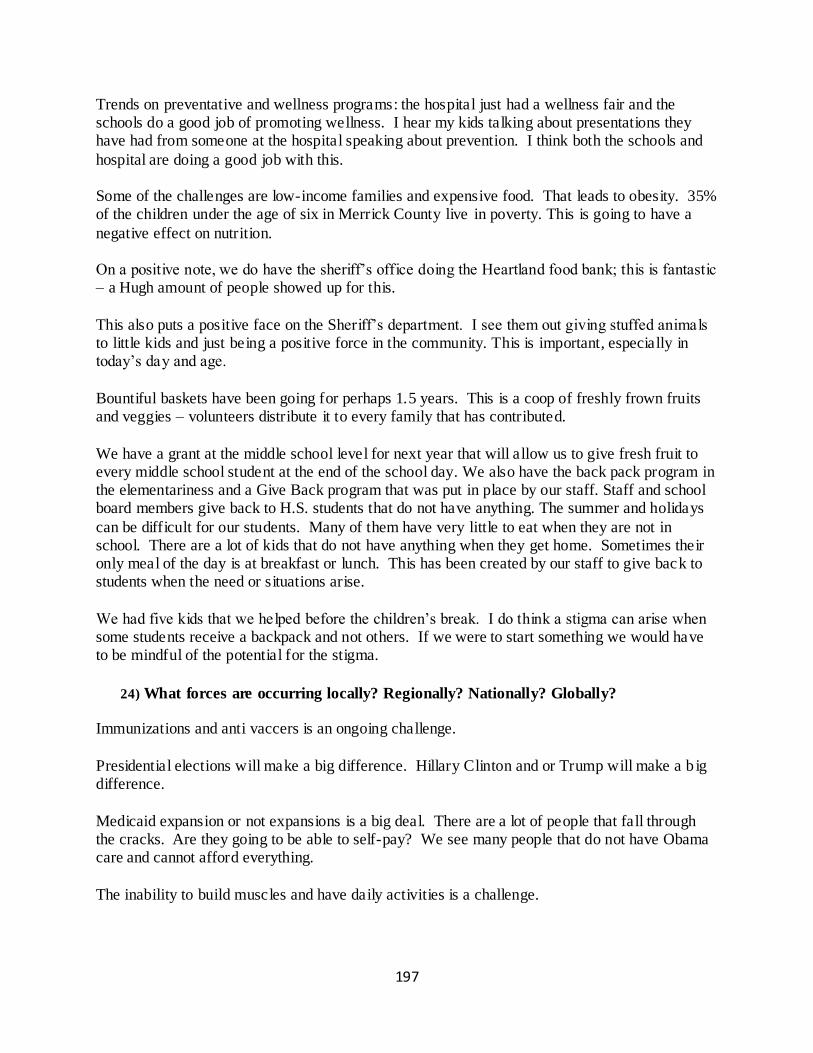
197
Trends on preventative and wellness programs: the hospital just had a wellness fair and the schools do a good job of promoting wellness. I hear my kids talking about presentations they have had from someone at the hospital speaking about prevention. I think both the schools and
hospital are doing a good job with this. Some of the challenges are low-income families and expensive food. That leads to obesity. 35% of the children under the age of six in Merrick County live in poverty. This is going to have a
negative effect on nutrition. On a positive note, we do have the sheriff’s office doing the Heartland food bank; this is fantastic – a Hugh amount of people showed up for this.
This also puts a positive face on the Sheriff’s department. I see them out giving stuffed animals to little kids and just being a positive force in the community. This is important, especially in today’s day and age.
Bountiful baskets have been going for perhaps 1.5 years. This is a coop of freshly frown fruits and veggies – volunteers distribute it to every family that has contributed.
We have a grant at the middle school level for next year that will allow us to give fresh fruit to every middle school student at the end of the school day. We also have the back pack program in the elementariness and a Give Back program that was put in place by our staff. Staff and school board members give back to H.S. students that do not have anything. The summer and holidays
can be difficult for our students. Many of them have very little to eat when they are not in school. There are a lot of kids that do not have anything when they get home. Sometimes their only meal of the day is at breakfast or lunch. This has been created by our staff to give back to students when the need or situations arise.
We had five kids that we helped before the children’s break. I do think a stigma can arise when some students receive a backpack and not others. If we were to start something we would have to be mindful of the potential for the stigma.
24) What forces are occurring locally? Regionally? Nationally? Globally? Immunizations and anti vaccers is an ongoing challenge.
Presidential elections will make a big difference. Hillary Clinton and or Trump will make a b ig difference.
Medicaid expansion or not expansions is a big deal. There are a lot of people that fall through the cracks. Are they going to be able to self-pay? We see many people that do not have Obama care and cannot afford everything.
The inability to build muscles and have daily activities is a challenge.
198
The ability or inability to react appropriately to rejection is being lost. I call it the pile of mush syndrome. They are so used to a video game – I have seen so many kids reduced to a pile of mush – crying etc. when they receive any kind of discipline or something does not go right.
With a video game if you are losing you shut it off or starts over. In a game of baseball if you strikeout etc. you have to learn to deal with it. Life is not a reset button. We have kids that can’t respond to being incorrect, doing it wrong, not doing it perfectly – they do not know how to deal with disappointment.
Kids seem to want immediate gratification at all times. There are several more kids coming out as gay or transgendered – questions arise as to which
bathroom should I go into? You cannot get onto social media today without seeing something derogatory posted about gay or transgendered people. As a whole as a population we are less willing to see other’s points of view. It is like, I am right and you are wrong. It is no longer that we both can be right. People most likely learn this as
children. Children are not learning the ability to see other’s points of view. So they grow up to be adults that are hard to employ. I know that I am right because I got 50 likes…
The inability to delay gratification is a problem with today’s youth. Kids are texting all the time. They hardly make a phone call
It is neat how we transitions into the behavioral and mental health issues. There is a whole new set of safety concerns with the way social media has changed in the last few years. Today we have concerns for inappropriate uses of social media – both their own inappropriate use by looking at or posting things that can get them into trouble, and concerns
with predators having access to kids in ways they never had in years past. Safety and stranger safety is a whole new thing now. Not talking to strangers is no longer that simple.
Nationally, we are seeing the trend of sex trafficking. This effects NE due to our I-80 corridor. There is a large of 12-14 years olds recruited into this trap.
The United Way in Grand Island is trying to focus on teen pregnancy rates and STI’s. Many feel the conversations around teen age sex need to happen earlier. Frequently, parents are not on board with this. If we do not have these conversations in a professional setting then our kids will learn this from someone else. If the conversations are not coming from an educator or parent,
kids are learning these things from their peers or someone else. When I was looking over the statistics, Merrick County is well below the national average for STIs; however, we are on the increase. I am not sure what is causing this trend. I am not sure if
199
it is being fueled by single parent homes, or parents working and not being able to supervise their children, but this stood out to me.
Omaha did a great job of education focusing on the STD angle. They showed photos of kids who had STDs and what that look like. There were photos of kids that had things on their hands and face and the message was this is what an STD can look like. It took the sex talk out of it and just focused on the repercussions.
25) What characteristics of our jurisdiction or state may pose an opportunity? A
Threat?
I am not in the health profession but the rate of cancer and the rumors that this is linked to all of the chemicals that are used in our agricultural industry.
We do hardware screenings – we just did 3 different sessions. It is amazing how many people come in that have high BP, or high blood sugar. We had one that needed a pace maker put in. Literally, we walked this person to the clinic to get them an immediate appointment.
So many people fall into the trend that I don’t feel good today but I will feel better tomorrow so I will put off getting any help until tomorrow. This can be true in non-threatening situations as well as situations that have the potential to be life threatening. As mid-westerners we have a very prideful attitude and we are tough – we will tough it out. This attitude was shocking to us
to see so many people that had toughed it out too long. At our health screenings we had people with blood sugar levels of 200-300. An average blood sugar level is low 100. They would say well I just had breakfast - we would tell them that does
not matter. We did not make anyone feel bad about their readings. However, we did stress, this is probably something you want to have checked out. I think our prideful attitude can also be an advantage. When you get Nebraskans something that
needs doing we will always step-forward and get it done. An opportunity, especially in the rural areas, is to expand on the farmers market for fresh produce. We concentrate mostly on cash crops and miss out on the market of selling fresh fruits
and vegetables directly to consumers. We have a lot of energy on the Dark Island trail. This is well used.
This is a real strength of Merrick County and is what attached our family to this areas – the trails, the parks, aquatic center and the Merrick foundation. Why would we not want to live in this area?
200
There is continuous growth – new homes that are being constructed – constantly being developed – this is both strength and an opportunity. Especially when you are working in rural communities – Merrick County is one of the best in NE.
We are fortunate to have four young physicians and PA’s, a wonderful hospital and specialists that come in.
26) What may occur or has occurred that may pose a barrier to achieving health for
everyone in our community? Income – Health Plans and insurance – we have a lot of self-employed farmers – they do not
have employer provided health insurance – the aging population and the financial woes that go along with living on a fixed income – a lack of awareness of when we should go for wellness visits – we should be aware of what our wellness visits cover, when we should go, and be advocates for our own health and wellness – with high school kids if they are not playing
supports then they may never be going to see a Doctor. They do not need to go in for immunizations or sports physicals, unless someone is advocating for their health and well-being, they may fall through the cracks in getting any preventative care – we catch a lot of kids during sports physicals or when they get immunizations. However, if they are not playing sports and do
not need any immunizations we may be missing them entirely – If H.S. kids are not coming into the Dr. For a wellness check then we are missing our opportunity to give them education on STDs and STIs. This is a golden opportunity we are missing –
Not having a medical home means there is no continuation of care. Urgent cares are great but without a continuum of care there is no one that is monitoring your long term care. We have lots of families that see a Dr. in G.I. and then another on in Central City and there is no
communication among the two. Lack of mental health professionals in the area is a signif icant barrier. I only know of one provider. We also have a tremendous number of inmates that have a duel diagnosis between addiction and mental health issues and we do not have any providers that can address this.
In the jails we do have one provider coming in from G.I. and we have one local provider but she is constantly busy with our youth.
We have identified the following forces of change – Identify your top three forces?
Lack of parental support Gap with technology
Parenting skills Super bugs
Lack of basic understanding of healthcare Cultural dissonance
Single parents Obesity
Teen center Fitness center
Parent education Lack of strength & conditioning
Prevention and wellness trends Income/SES
201
Las enforcement Bountiful baskets/backpack program
Supplemental food programs Immunizations
Lack of insurance Falling through the health care cracks
Use of social media Detriments to communication
Sex trafficking STI’s and STD’s
Potentially increasing teen pregnancy issue Delays in seeking treatment
Pride (+/-) Aging population
Technology gaps No medical home
No continuum of care lack of mental health professionals
27) What is your initial reaction to this list? (something you are excited about, feeling
fearful/anxious about) I think what the school is doing is exciting. This is where the students are learning skills that will stay with them for life. I am not sure if we can totally get rid of the stigma but we are doing
a great job with the backpack program in elementary and fruits in the afternoon in middle school. We are hitting all areas and ages of kids, which I think is great. I think strength is that our schools are a safe haven. My kids are excited to go to school.
Educating students, teaching them skills and a trade through our career pathways is a great way to expand beyond just the 4-year college option. It is important to start the career conversation early. By the time we start talking about careers
when they are juniors or seniors in high school we may be too late. Without the appropriate career counseling early on, kids may end up spending thoughts and thousands of dollars on a degree they do not want that will not help them that much. Kids can end up not having a clear idea of what they want or how to get it. We will begin offering career counseling beginning in
6th
grade and then have career pathways in high school. Specifically in the trade areas we have started with building construction, and welding in the next year or two. These can piggy back off what is happening in the hospital with the health sciences. When I look at this at first you can get blindsided and only see the issues and concerns.
However, I am more optimistic about the community than anything else. I see many more strengths than barriers.
28) What themes are we seeing across these Forces of Change that we should be paying
special attention to as we discuss the health priorities in our community? Finances – the haves and have not’s – continue to expand the arm of education such as diabetic education initiative – this should include all age groups and not just focused on one – Negative is
families needing a lot of assistance – parenting skills – acceptance of mediocrity is too high – pile of mush theory – how hard is anyone willing to work for things today? –
29) What will be important to remember as we look at our next community data and
determine our priorities?
202
We believe in the parents and people that work with our youth that they can actually make a difference, keep things on a positive note, or turn things to the positive.
Conclusion
The broader environment is constantly affecting communities and local public health systems.
State and federal legislation, rapid technological advances, changes in the organization of health care services, shifts in economic forces, and changing family structures and gender roles are all examples of Forces of Change. These forces are important because they affect, either directly or indirectly, the health and quality of life in the community and the effectiveness of the local
public health system. The data gathered from this focus group will help Merrick County and the Central District Health Department prioritize public health issues and identify resources for addressing them.
203
Appendix D. The Local Public Health System Assessment (a selection from the full report)
Results Now that your assessment is completed, one of the most exciting, yet challenging opportunities is to begin to review and analyze the findings. As you recall from your assessment, the data you
created now establishes the foundation upon which you ma et priorities or performance improvement and identify specific quality improvement (Q1) projects tot support your priorities. Based upon the responses you provided during your assessment, an average was calculated or
each of the ten Essential Services. Each Essential Service score can be interpreter as the overall degree to which your public health system meets the performance standards (quality indicators) for each Essential Service. Scores can range from a minimum value of 0% (no activity is performed pursuant to the standards) to a maximum value of 100% (all activities associated with
the standards are performed at optimal levels). In Figure 1 below, each score (performance, priority, and contribution scores) at the Essential Service level is a calculated average of the respective Model Standard scores within that
Essential Service. Note – The Priority rating and agency contribution scores will be blank if the Priority of Model Standards Questionnaire and the Agency Contribution Questionnaire are not completed.
Figure 2 displays the average score for each Essential Service, along with an overall average assessment score across all ten Essential Services. Take a look at the overall performance scores for each Essential Service. Examination of these scores can immediately give a sense of the local public health system’s greatest strengths and weaknesses. Note the black bars that identify
the range of reported performance score responses within each Essential Service.
Overall Scores for Each Essential Public Health Service
In Figure 2 below, each score (performance, priority, and contribution scores) at the Essential Service level is a calculated average of the respective Model Standard scores within that Essential Service. Note – The Priority rating and agency contribution scores will be blank if the Priority of Model Standards Questionnaire and the Agency Contribution Questionnaire are not
completed.
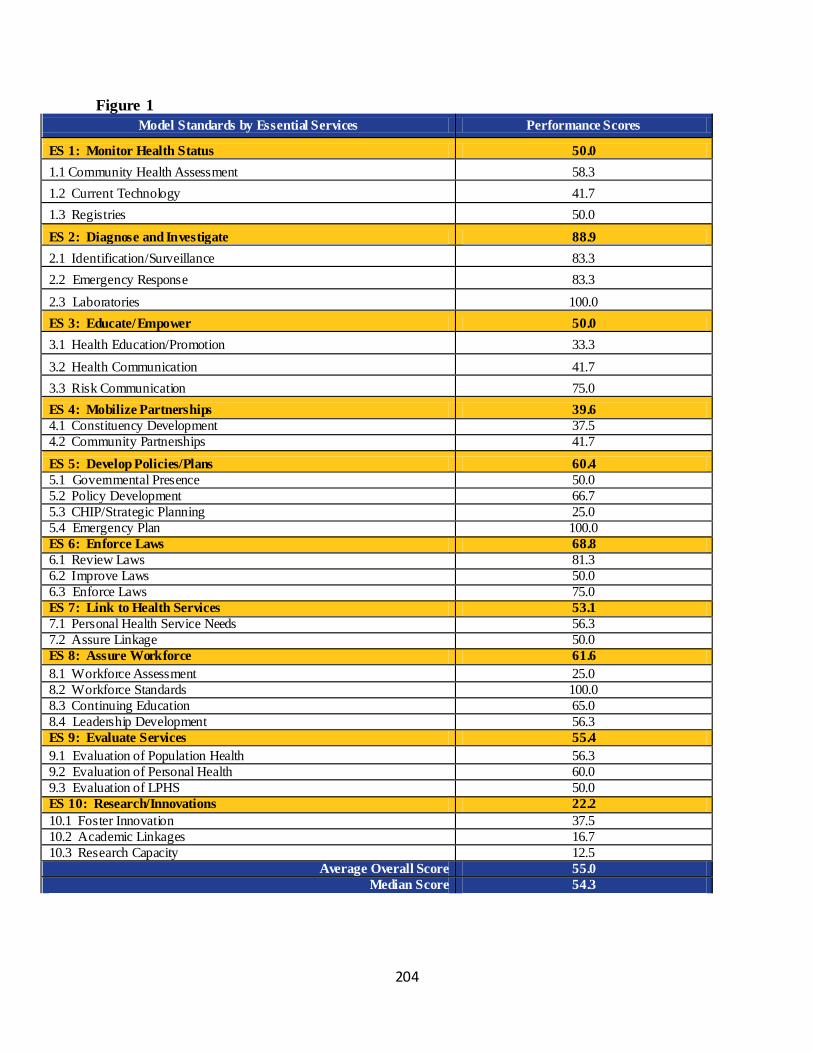
204
Figure 1
Model Standards by Essential Services Performance Scores
ES 1: Monitor Health Status 50.0
1.1 Community Health Assessment 58.3
1.2 Current Technology 41.7
1.3 Registries 50.0
ES 2: Diagnose and Investigate 88.9
2.1 Identification/Surveillance 83.3
2.2 Emergency Response 83.3
2.3 Laboratories 100.0
ES 3: Educate/Empower 50.0
3.1 Health Education/Promotion 33.3
3.2 Health Communication 41.7
3.3 Risk Communication 75.0
ES 4: Mobilize Partnerships 39.6
4.1 Constituency Development 37.5
4.2 Community Partnerships 41.7
ES 5: Develop Policies/Plans 60.4
5.1 Governmental Presence 50.0
5.2 Policy Development 66.7
5.3 CHIP/Strategic Planning 25.0
5.4 Emergency Plan 100.0
ES 6: Enforce Laws 68.8
6.1 Review Laws 81.3
6.2 Improve Laws 50.0
6.3 Enforce Laws 75.0
ES 7: Link to Health Services 53.1
7.1 Personal Health Service Needs 56.3
7.2 Assure Linkage 50.0
ES 8: Assure Workforce 61.6
8.1 Workforce Assessment 25.0
8.2 Workforce Standards 100.0
8.3 Continuing Education 65.0
8.4 Leadership Development 56.3
ES 9: Evaluate Services 55.4
9.1 Evaluation of Population Health 56.3
9.2 Evaluation of Personal Health 60.0
9.3 Evaluation of LPHS 50.0
ES 10: Research/Innovations 22.2
10.1 Foster Innovation 37.5
10.2 Academic Linkages 16.7
10.3 Research Capacity 12.5
Average Overall Score 55.0
Median Score 54.3
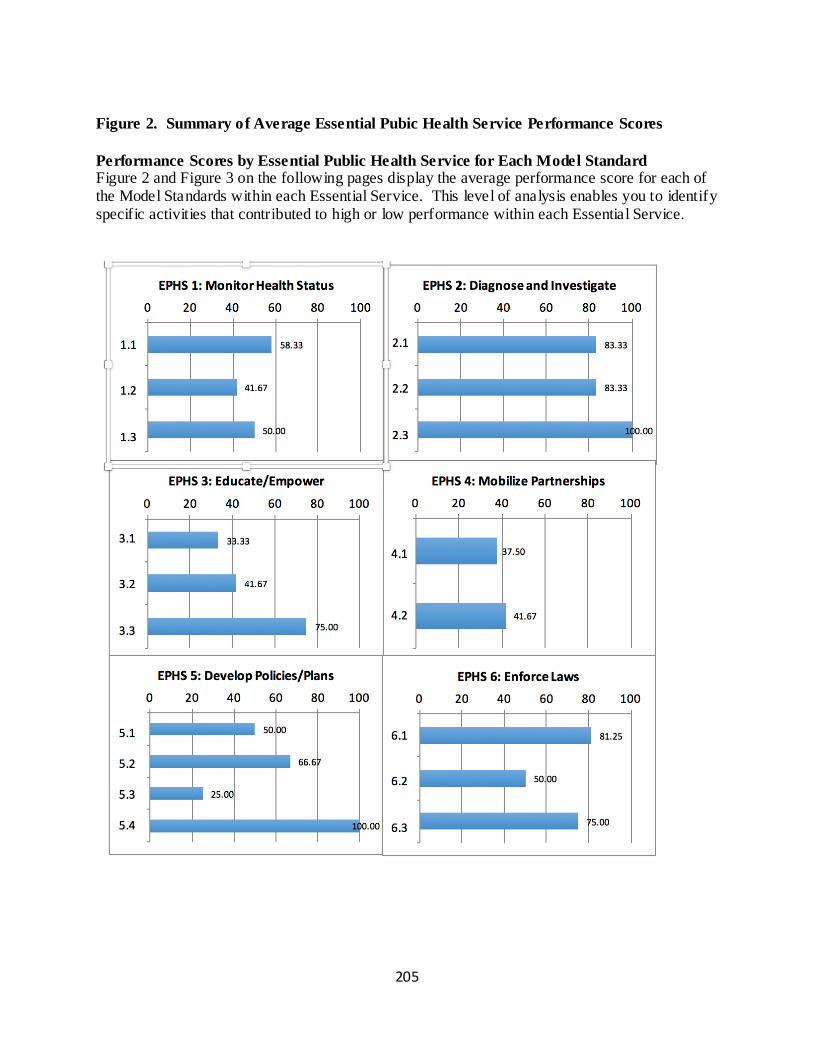
205
Figure 2. Summary of Average Essential Pubic Health Service Performance Scores
Performance Scores by Essential Public Health Service for Each Model Standard Figure 2 and Figure 3 on the following pages display the average performance score for each of the Model Standards within each Essential Service. This level of analysis enables you to identify specific activities that contributed to high or low performance within each Essential Service.
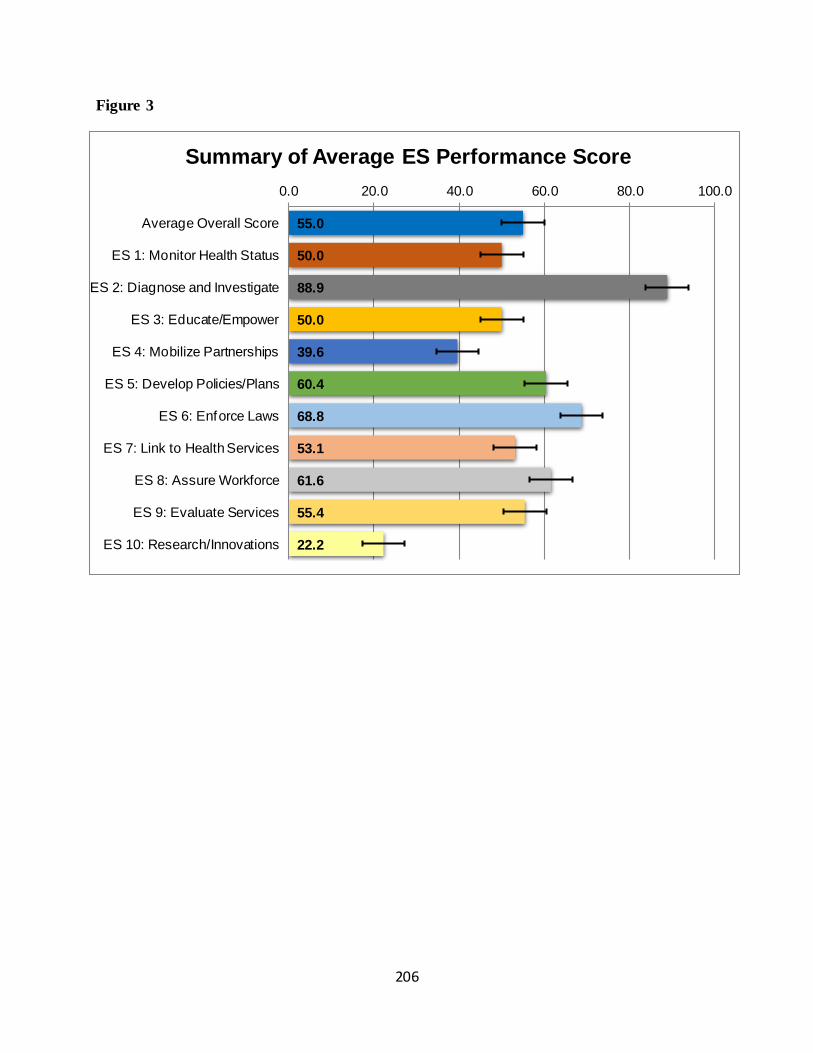
206
Figure 3
x
55.0
50.0
88.9
50.0
39.6
60.4
68.8
53.1
61.6
55.4
22.2
0.0 20.0 40.0 60.0 80.0 100.0
Average Overall Score
ES 1: Monitor Health Status
ES 2: Diagnose and Investigate
ES 3: Educate/Empower
ES 4: Mobilize Partnerships
ES 5: Develop Policies/Plans
ES 6: Enforce Laws
ES 7: Link to Health Services
ES 8: Assure Workforce
ES 9: Evaluate Services
ES 10: Research/Innovations
Summary of Average ES Performance Score
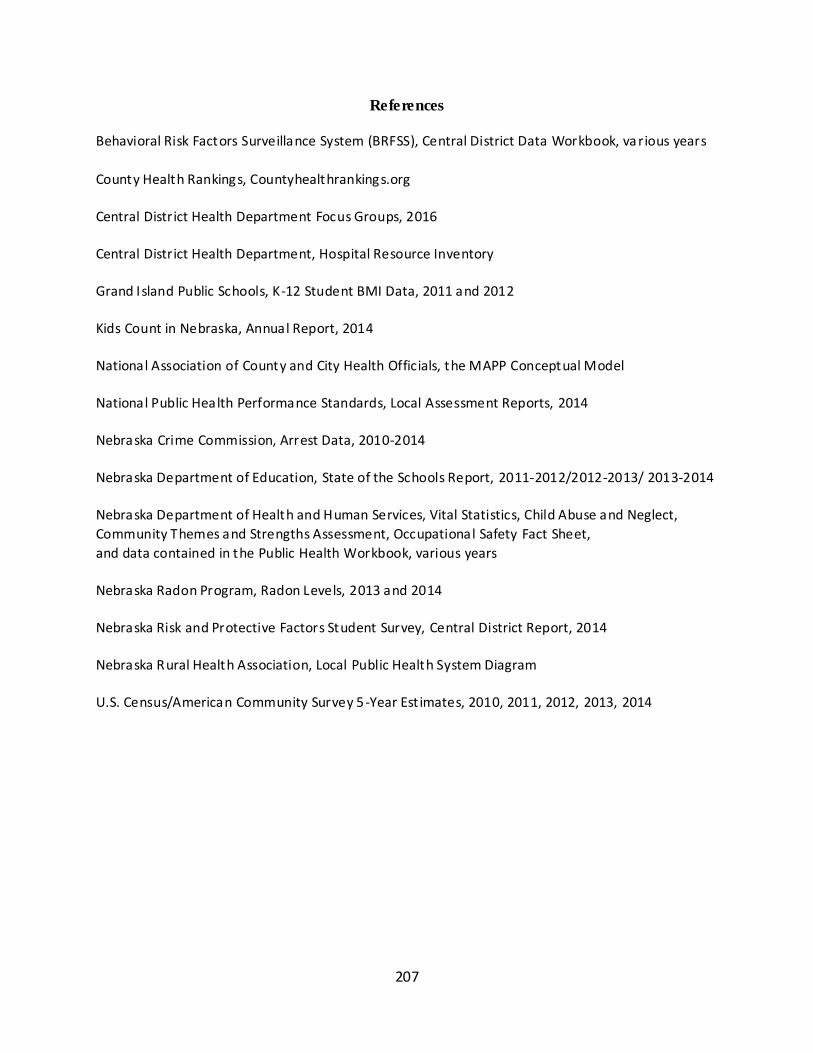
207
References Behavioral Risk Factors Surveillance System (BRFSS), Central District Data Workbook, va rious years
County Health Rankings, Countyhealthrankings.org
Central District Health Department Focus Groups, 2016
Central District Health Department, Hospital Resource Inventory
Grand Island Public Schools, K-12 Student BMI Data, 2011 and 2012
Kids Count in Nebraska, Annual Report, 2014
National Association of County and City Health Officials, the MAPP Conceptual Model
National Public Health Performance Standards, Local Assessment Reports, 2014
Nebraska Crime Commission, Arrest Data, 2010-2014
Nebraska Department of Education, State of the Schools Report, 2011-2012/2012-2013/ 2013-2014
Nebraska Department of Health and Human Services, Vital Statistics, Child Abuse and Neglect,
Community Themes and Strengths Assessment, Occupational Safety Fact Sheet,
and data contained in the Public Health Workbook, various years
Nebraska Radon Program, Radon Levels, 2013 and 2014
Nebraska Risk and Protective Factors Student Survey, Central District Report, 2014
Nebraska Rural Health Association, Local Public Health System Diagram
U.S. Census/American Community Survey 5-Year Est imates, 2010, 2011, 2012, 2013, 2014