Embed Size (px)
Citation preview
COMPREHENSIVE HOUSING MARKET ANALYSIS
U.S. Department of Housing and Urban Development, Office of Policy Development and Research
As of January 1, 2021
Share on:
Baltimore-Columbia-Towson, Maryland
The COVID-19 pandemic has resulted in unprecedented large and rapid changes in many data series, and similarly unprecedented large policy responses, making analysis of, and longer run predictions for, the economy and housing markets exceptionally difficult and uncertain. HUD will continue to monitor market conditions in the HMA and provide an updated report/addendum in the future.
Executive Summary 2Baltimore-Columbia-Towson, Maryland Comprehensive Housing Market Analysis as of January 1, 2021
Comprehensive Housing Market Analysis Baltimore-Columbia-Towson, MarylandU.S. Department of Housing and Urban Development, Office of Policy Development and Research
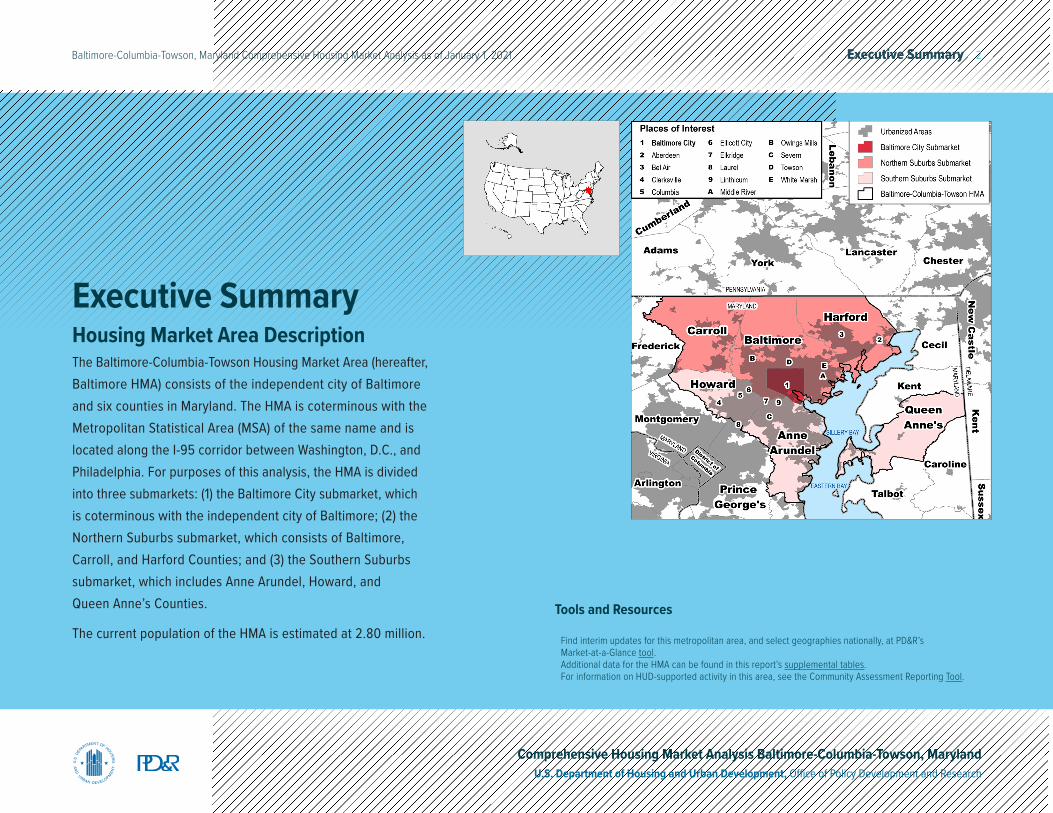
Executive SummaryHousing Market Area DescriptionThe Baltimore-Columbia-Towson Housing Market Area (hereafter, Baltimore HMA) consists of the independent city of Baltimore and six counties in Maryland. The HMA is coterminous with the Metropolitan Statistical Area (MSA) of the same name and is located along the I-95 corridor between Washington, D.C., and Philadelphia. For purposes of this analysis, the HMA is divided into three submarkets: (1) the Baltimore City submarket, which is coterminous with the independent city of Baltimore; (2) the Northern Suburbs submarket, which consists of Baltimore, Carroll, and Harford Counties; and (3) the Southern Suburbs submarket, which includes Anne Arundel, Howard, and Queen Anne’s Counties.
The current population of the HMA is estimated at 2.80 million.Tools and Resources
Find interim updates for this metropolitan area, and select geographies nationally, at PD&R’s Market-at-a-Glance tool.Additional data for the HMA can be found in this report’s supplemental tables.For information on HUD-supported activity in this area, see the Community Assessment Reporting Tool.
Executive Summary 3Baltimore-Columbia-Towson, Maryland Comprehensive Housing Market Analysis as of January 1, 2021
Comprehensive Housing Market Analysis Baltimore-Columbia-Towson, MarylandU.S. Department of Housing and Urban Development, Office of Policy Development and Research
Market Qualifiers
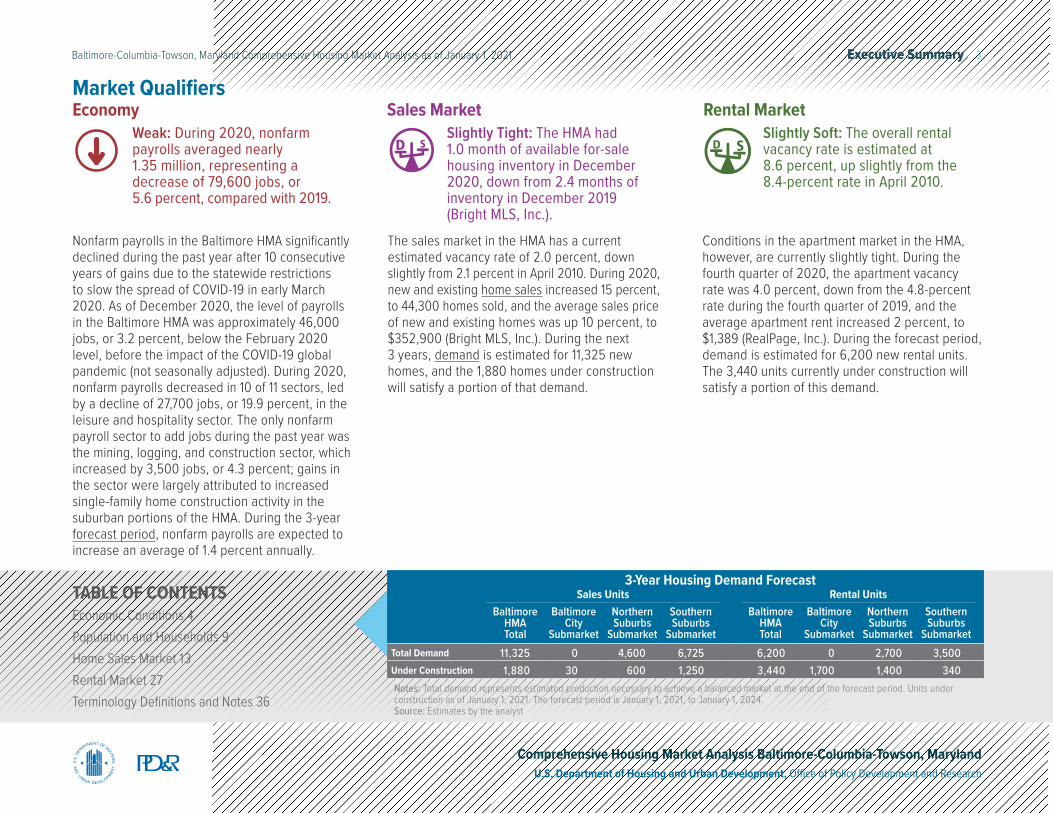
Nonfarm payrolls in the Baltimore HMA significantly declined during the past year after 10 consecutive years of gains due to the statewide restrictions to slow the spread of COVID-19 in early March 2020. As of December 2020, the level of payrolls in the Baltimore HMA was approximately 46,000 jobs, or 3.2 percent, below the February 2020 level, before the impact of the COVID-19 global pandemic (not seasonally adjusted). During 2020, nonfarm payrolls decreased in 10 of 11 sectors, led by a decline of 27,700 jobs, or 19.9 percent, in the leisure and hospitality sector. The only nonfarm payroll sector to add jobs during the past year was the mining, logging, and construction sector, which increased by 3,500 jobs, or 4.3 percent; gains in the sector were largely attributed to increased single-family home construction activity in the suburban portions of the HMA. During the 3-year forecast period, nonfarm payrolls are expected to increase an average of 1.4 percent annually.
The sales market in the HMA has a current estimated vacancy rate of 2.0 percent, down slightly from 2.1 percent in April 2010. During 2020, new and existing home sales increased 15 percent, to 44,300 homes sold, and the average sales price of new and existing homes was up 10 percent, to $352,900 (Bright MLS, Inc.). During the next 3 years, demand is estimated for 11,325 new homes, and the 1,880 homes under construction will satisfy a portion of that demand.
Conditions in the apartment market in the HMA, however, are currently slightly tight. During the fourth quarter of 2020, the apartment vacancy rate was 4.0 percent, down from the 4.8-percent rate during the fourth quarter of 2019, and the average apartment rent increased 2 percent, to $1,389 (RealPage, Inc.). During the forecast period, demand is estimated for 6,200 new rental units. The 3,440 units currently under construction will satisfy a portion of this demand.
EconomyWeak: During 2020, nonfarm payrolls averaged nearly 1.35 million, representing a decrease of 79,600 jobs, or 5.6 percent, compared with 2019.
Rental MarketSlightly Soft: The overall rental vacancy rate is estimated at 8.6 percent, up slightly from the 8.4-percent rate in April 2010.
Sales MarketSlightly Tight: The HMA had 1.0 month of available for-sale housing inventory in December 2020, down from 2.4 months of inventory in December 2019 (Bright MLS, Inc.).
TABLE OF CONTENTSEconomic Conditions 4Population and Households 9Home Sales Market 13Rental Market 27Terminology Definitions and Notes 36
Notes: Total demand represents estimated production necessary to achieve a balanced market at the end of the forecast period. Units under construction as of January 1, 2021. The forecast period is January 1, 2021, to January 1, 2024.Source: Estimates by the analyst
3-Year Housing Demand ForecastSales Units Rental Units
Baltimore HMA Total
Baltimore City
Submarket
Northern Suburbs
Submarket
Southern Suburbs
Submarket
Baltimore HMA Total
Baltimore City
Submarket
Northern Suburbs
Submarket
Southern Suburbs
SubmarketTotal Demand 11,325 0 4,600 6,725 6,200 0 2,700 3,500Under Construction 1,880 30 600 1,250 3,440 1,700 1,400 340
Economic Conditions 4Baltimore-Columbia-Towson, Maryland Comprehensive Housing Market Analysis as of January 1, 2021
Comprehensive Housing Market Analysis Baltimore-Columbia-Towson, MarylandU.S. Department of Housing and Urban Development, Office of Policy Development and Research
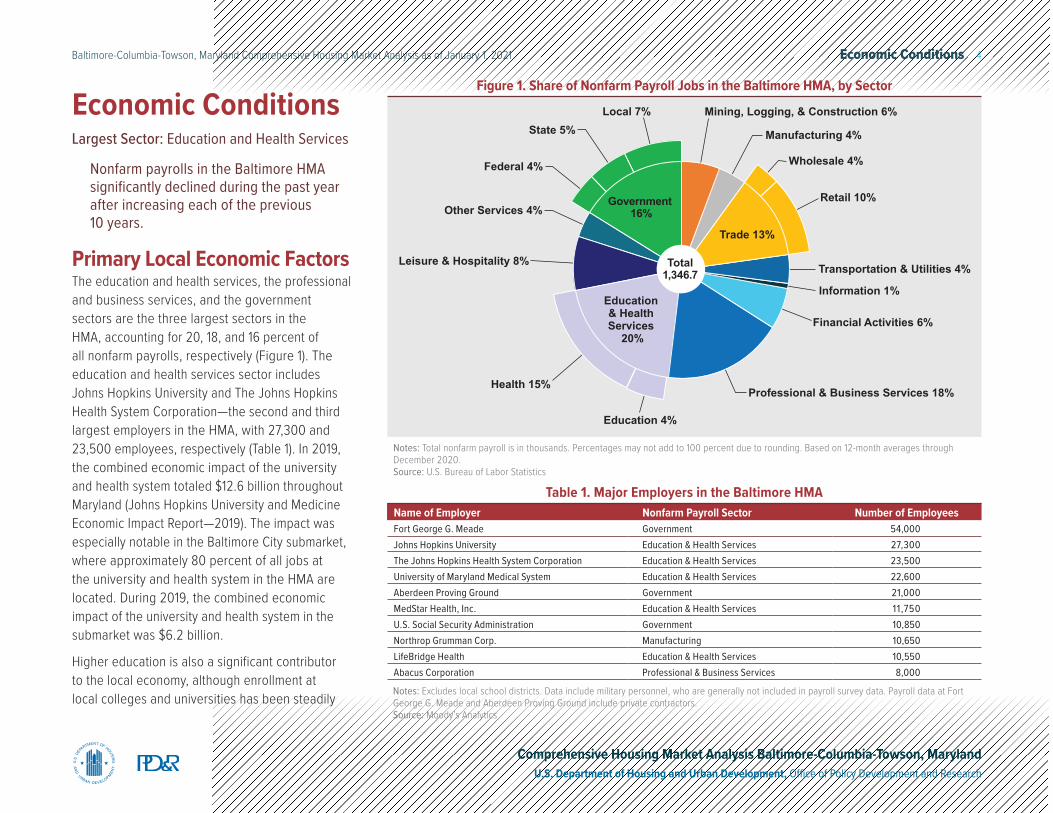
Primary Local Economic FactorsThe education and health services, the professional and business services, and the government sectors are the three largest sectors in the HMA, accounting for 20, 18, and 16 percent of all nonfarm payrolls, respectively (Figure 1). The education and health services sector includes Johns Hopkins University and The Johns Hopkins Health System Corporation—the second and third largest employers in the HMA, with 27,300 and 23,500 employees, respectively (Table 1). In 2019, the combined economic impact of the university and health system totaled $12.6 billion throughout Maryland (Johns Hopkins University and Medicine Economic Impact Report—2019). The impact was especially notable in the Baltimore City submarket, where approximately 80 percent of all jobs at the university and health system in the HMA are located. During 2019, the combined economic impact of the university and health system in the submarket was $6.2 billion.
Higher education is also a significant contributor to the local economy, although enrollment at local colleges and universities has been steadily
Economic ConditionsLargest Sector: Education and Health Services
Nonfarm payrolls in the Baltimore HMA significantly declined during the past year after increasing each of the previous 10 years.
Mining, Logging, & Construction 6%
Manufacturing 4%
Wholesale 4%
Retail 10%
Transportation & Utilities 4%
Information 1%
Financial Activities 6%
Professional & Business Services 18%
Leisure & Hospitality 8%
Other Services 4%
Federal 4%
State 5%Local 7%
Education & Health Services
20%
Health 15%
Education 4%
Government 16%
Trade 13%
Total1,346.7
Notes: Total nonfarm payroll is in thousands. Percentages may not add to 100 percent due to rounding. Based on 12-month averages through December 2020.Source: U.S. Bureau of Labor Statistics
Figure 1. Share of Nonfarm Payroll Jobs in the Baltimore HMA, by Sector
Name of Employer Nonfarm Payroll Sector Number of EmployeesFort George G. Meade Government 54,000Johns Hopkins University Education & Health Services 27,300The Johns Hopkins Health System Corporation Education & Health Services 23,500University of Maryland Medical System Education & Health Services 22,600Aberdeen Proving Ground Government 21,000MedStar Health, Inc. Education & Health Services 11,750U.S. Social Security Administration Government 10,850Northrop Grumman Corp. Manufacturing 10,650LifeBridge Health Education & Health Services 10,550Abacus Corporation Professional & Business Services 8,000
Table 1. Major Employers in the Baltimore HMA
Notes: Excludes local school districts. Data include military personnel, who are generally not included in payroll survey data. Payroll data at Fort George G. Meade and Aberdeen Proving Ground include private contractors.Source: Moody’s Analytics
Economic Conditions 5Baltimore-Columbia-Towson, Maryland Comprehensive Housing Market Analysis as of January 1, 2021
Comprehensive Housing Market Analysis Baltimore-Columbia-Towson, MarylandU.S. Department of Housing and Urban Development, Office of Policy Development and Research
declining during the past 9 years. The HMA contains more than 20 public and private colleges and universities, with approximately 162,000 students and 50,650 employees (National Center for Education Statistics). From 2012 through 2019, total enrollment at these schools declined an average of 1 percent annually, compared with an average annual 2-percent increase from 2002 through 2011. Seven community colleges, included in the colleges and universities, have approximately 55,400 students and 9,000 employees.
The HMA is also home to two military bases—Fort George G. Meade and Aberdeen Proving Ground, the first and fifth largest employers in the HMA, with 54,000 and 21,000 employees, respectively. Approximately 16 percent of the employees at these bases are active-duty military personnel, who are not included in the nonfarm payroll data. The remaining employees are a combination of civilian employees working for the government and private-sector contract employees. From 2009 through 2013, there was significant job growth at both bases because of the 2005 Defense Base Closure and Realignment Commission (BRAC) activities. During the 5-year period, employment at Fort George G. Meade and Aberdeen Proving Ground increased by 20,500 and 3,075 employees, respectively. In 2016, the combined economic impact of the military bases on the state of Maryland was $26.78 billion, accounting for approximately 7 percent of all statewide economic output (FY 2016 Economic Impact Analysis of Maryland’s Military Installations).
Current Conditions—Nonfarm PayrollsThe first confirmed case of COVID-19 in the Baltimore HMA was reported on March 8, 2020 (Centers for Disease Control and Prevention). Interventions taken in mid-March to slow the spread of COVID-19, including enforcing social distancing and discouraging nonessential travel, caused economic activity in the HMA to decline significantly. The nonfarm payroll sectors that were most affected were those that were heavily reliant on tourism as well as those dependent on in-person interactions, which were not able to easily adhere to the social distancing guidelines. Most job losses occurred in March and April 2020, and approximately 76 percent of the jobs lost during these months were recovered by December 2020 (not seasonally adjusted).
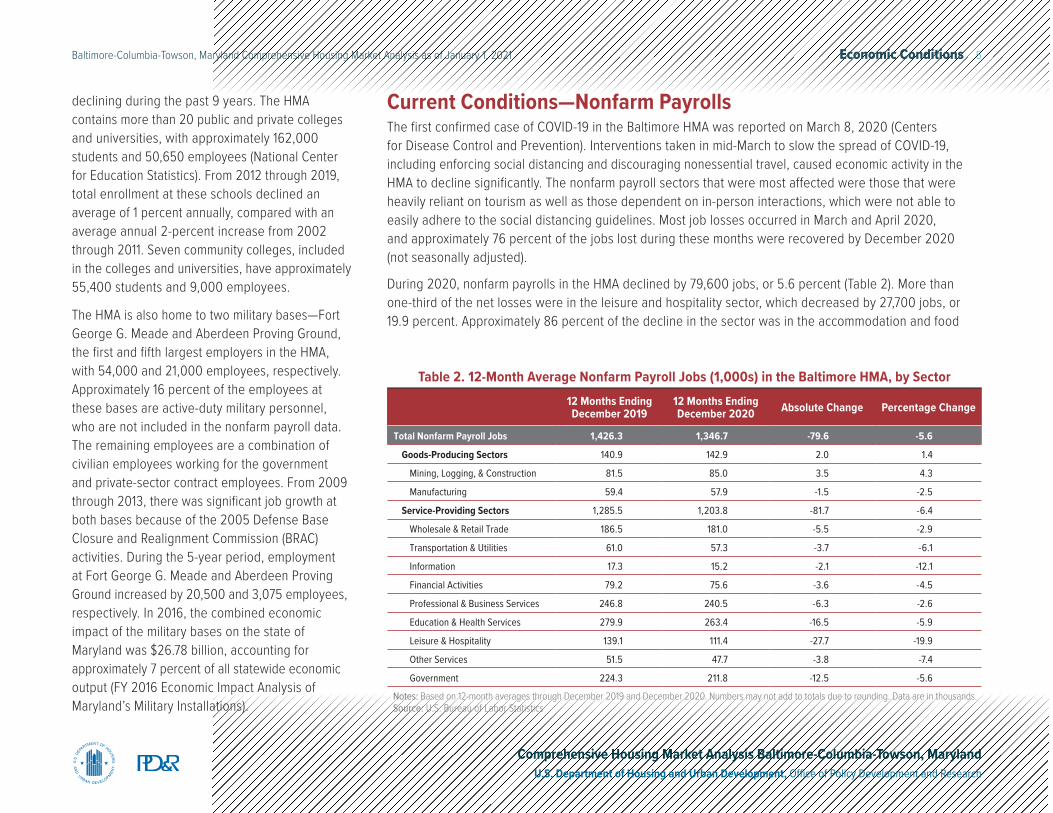
During 2020, nonfarm payrolls in the HMA declined by 79,600 jobs, or 5.6 percent (Table 2). More than one-third of the net losses were in the leisure and hospitality sector, which decreased by 27,700 jobs, or 19.9 percent. Approximately 86 percent of the decline in the sector was in the accommodation and food
Table 2. 12-Month Average Nonfarm Payroll Jobs (1,000s) in the Baltimore HMA, by Sector12 Months Ending December 2019
12 Months Ending December 2020 Absolute Change Percentage Change
Total Nonfarm Payroll Jobs 1,426.3 1,346.7 -79.6 -5.6
Goods-Producing Sectors 140.9 142.9 2.0 1.4
Mining, Logging, & Construction 81.5 85.0 3.5 4.3
Manufacturing 59.4 57.9 -1.5 -2.5
Service-Providing Sectors 1,285.5 1,203.8 -81.7 -6.4
Wholesale & Retail Trade 186.5 181.0 -5.5 -2.9
Transportation & Utilities 61.0 57.3 -3.7 -6.1
Information 17.3 15.2 -2.1 -12.1
Financial Activities 79.2 75.6 -3.6 -4.5
Professional & Business Services 246.8 240.5 -6.3 -2.6
Education & Health Services 279.9 263.4 -16.5 -5.9
Leisure & Hospitality 139.1 111.4 -27.7 -19.9
Other Services 51.5 47.7 -3.8 -7.4
Government 224.3 211.8 -12.5 -5.6
Notes: Based on 12-month averages through December 2019 and December 2020. Numbers may not add to totals due to rounding. Data are in thousands.Source: U.S. Bureau of Labor Statistics
Economic Conditions 6Baltimore-Columbia-Towson, Maryland Comprehensive Housing Market Analysis as of January 1, 2021
Comprehensive Housing Market Analysis Baltimore-Columbia-Towson, MarylandU.S. Department of Housing and Urban Development, Office of Policy Development and Research
services industry, which was down by 23,900 jobs, or 20.9 percent; decreases in the industry were largely attributed to statewide restrictions limiting or preventing restaurants and bars from offering indoor dining. Additional job losses were in the amusement, gambling, and recreation industries subsector, which decreased by 6,100 jobs, or 33.6 percent. To help slow the spread of COVID-19, Maryland Live! Casino Hotel and Horseshoe Casino Baltimore briefly closed in mid-March 2020, resulting in approximately 3,625 employees being temporarily laid off. The casinos reopened in mid-June but were permitted to operate only at 50-percent capacity; therefore, it is estimated that not all laid-off employees have returned to work.
In the education and health services and the government sectors, nonfarm payrolls were down by 16,500 and 12,500 jobs, or 5.9 and 5.6 percent, respectively. Nearly 70 percent of the education and health services sector losses were in the health care and social assistance industry, which decreased by 11,500 jobs, or 5.3 percent. Declines in the industry were partially attributed to nonessential and elective surgeries being prohibited during the year. In the government sector, Baltimore City Public Schools laid off more than 400 employees in late 2020 in response to a city budget shortfall.
The only nonfarm payroll sector to add jobs during the past year was the mining, logging, and construction sector, which increased by 3,500 jobs, or 4.3 percent. In response to increased single-family home construction activity, net gains in the sector were concentrated in the Northern Suburbs and Southern Suburbs submarkets, where nonfarm payrolls in the sector were up by a combined 4,000 jobs, or 4.4 percent.
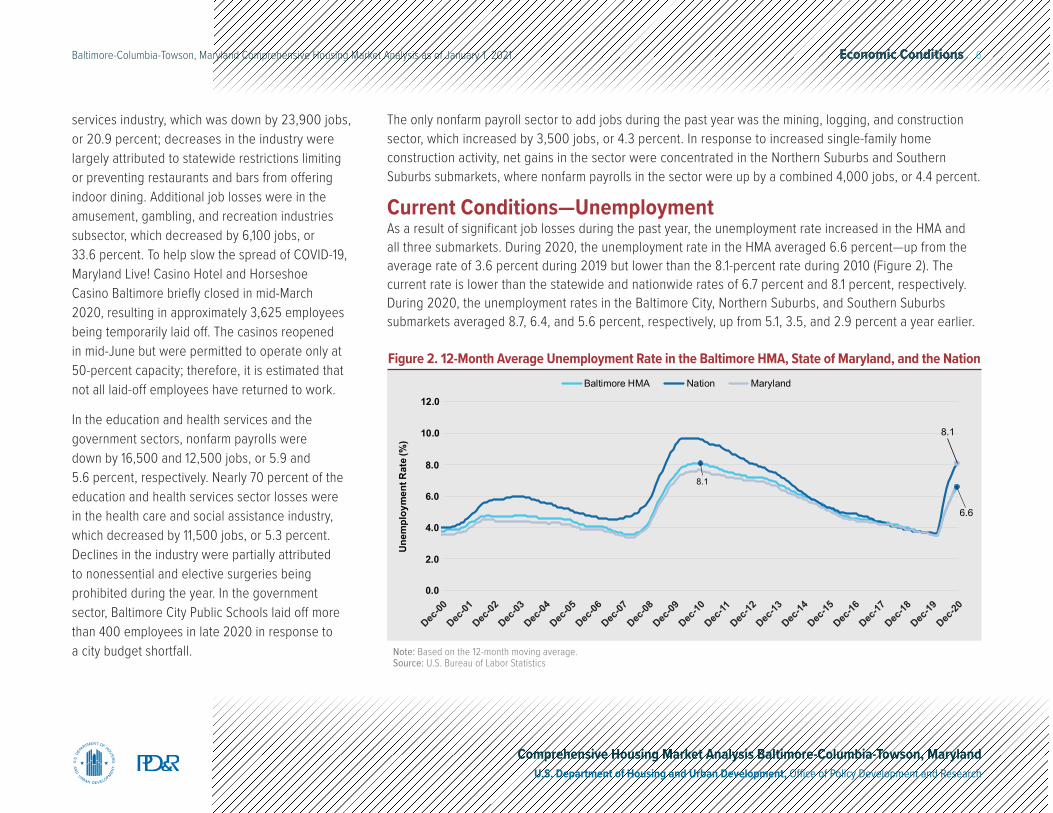
Current Conditions—UnemploymentAs a result of significant job losses during the past year, the unemployment rate increased in the HMA and all three submarkets. During 2020, the unemployment rate in the HMA averaged 6.6 percent—up from the average rate of 3.6 percent during 2019 but lower than the 8.1-percent rate during 2010 (Figure 2). The current rate is lower than the statewide and nationwide rates of 6.7 percent and 8.1 percent, respectively. During 2020, the unemployment rates in the Baltimore City, Northern Suburbs, and Southern Suburbs submarkets averaged 8.7, 6.4, and 5.6 percent, respectively, up from 5.1, 3.5, and 2.9 percent a year earlier.
8.1
6.6
8.1
0.0
2.0
4.0
6.0
8.0
10.0
12.0Un
empl
oym
ent R
ate
(%)
Baltimore HMA Nation Maryland
Dec-00
Dec-01
Dec-02
Dec-03
Dec-04
Dec-05
Dec-06
Dec-07
Dec-08
Dec-09
Dec-10
Dec-11
Dec-12
Dec-13
Dec-14
Dec-15
Dec-16
Dec-17
Dec-18
Dec-19
Dec-20
Note: Based on the 12-month moving average.Source: U.S. Bureau of Labor Statistics
Figure 2. 12-Month Average Unemployment Rate in the Baltimore HMA, State of Maryland, and the Nation
Economic Conditions 7Baltimore-Columbia-Towson, Maryland Comprehensive Housing Market Analysis as of January 1, 2021
Comprehensive Housing Market Analysis Baltimore-Columbia-Towson, MarylandU.S. Department of Housing and Urban Development, Office of Policy Development and Research
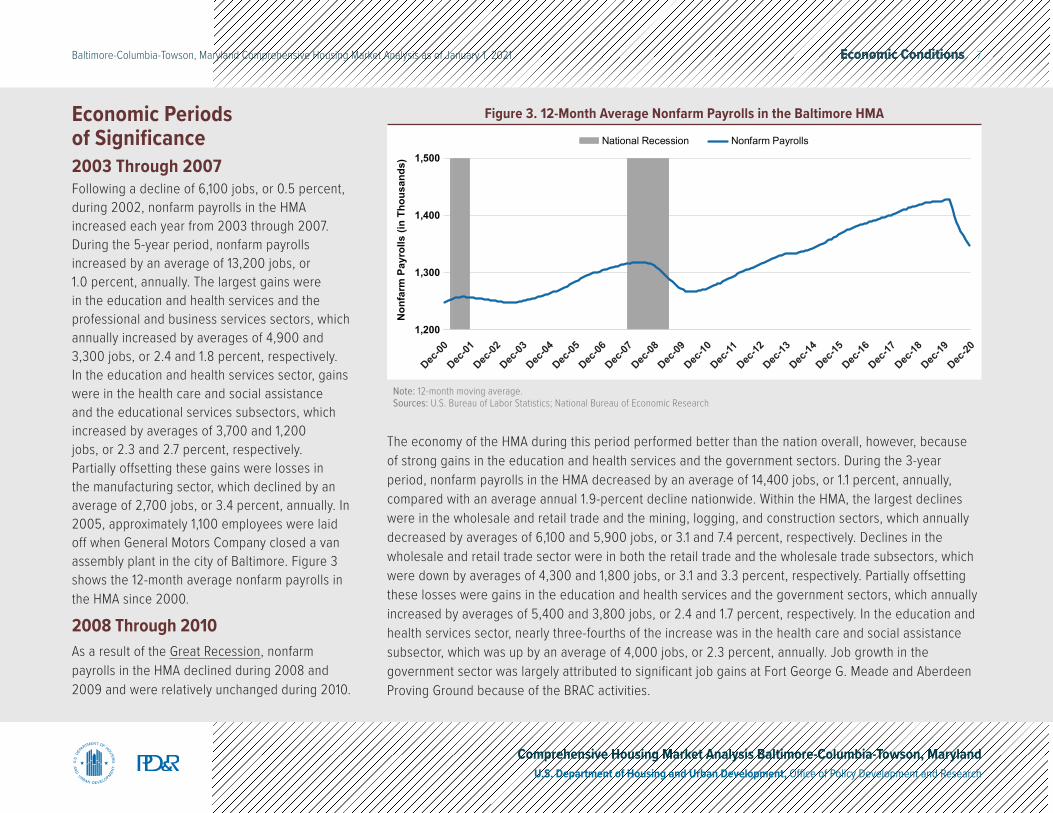
2003 Through 2007Following a decline of 6,100 jobs, or 0.5 percent, during 2002, nonfarm payrolls in the HMA increased each year from 2003 through 2007. During the 5-year period, nonfarm payrolls increased by an average of 13,200 jobs, or 1.0 percent, annually. The largest gains were in the education and health services and the professional and business services sectors, which annually increased by averages of 4,900 and 3,300 jobs, or 2.4 and 1.8 percent, respectively. In the education and health services sector, gains were in the health care and social assistance and the educational services subsectors, which increased by averages of 3,700 and 1,200 jobs, or 2.3 and 2.7 percent, respectively. Partially offsetting these gains were losses in the manufacturing sector, which declined by an average of 2,700 jobs, or 3.4 percent, annually. In 2005, approximately 1,100 employees were laid off when General Motors Company closed a van assembly plant in the city of Baltimore. Figure 3 shows the 12-month average nonfarm payrolls in the HMA since 2000.
2008 Through 2010As a result of the Great Recession, nonfarm payrolls in the HMA declined during 2008 and 2009 and were relatively unchanged during 2010.
Economic Periods of Significance
The economy of the HMA during this period performed better than the nation overall, however, because of strong gains in the education and health services and the government sectors. During the 3-year period, nonfarm payrolls in the HMA decreased by an average of 14,400 jobs, or 1.1 percent, annually, compared with an average annual 1.9-percent decline nationwide. Within the HMA, the largest declines were in the wholesale and retail trade and the mining, logging, and construction sectors, which annually decreased by averages of 6,100 and 5,900 jobs, or 3.1 and 7.4 percent, respectively. Declines in the wholesale and retail trade sector were in both the retail trade and the wholesale trade subsectors, which were down by averages of 4,300 and 1,800 jobs, or 3.1 and 3.3 percent, respectively. Partially offsetting these losses were gains in the education and health services and the government sectors, which annually increased by averages of 5,400 and 3,800 jobs, or 2.4 and 1.7 percent, respectively. In the education and health services sector, nearly three-fourths of the increase was in the health care and social assistance subsector, which was up by an average of 4,000 jobs, or 2.3 percent, annually. Job growth in the government sector was largely attributed to significant job gains at Fort George G. Meade and Aberdeen Proving Ground because of the BRAC activities.
National Recession Nonfarm Payrolls
1,200
1,300
1,400
1,500
Non
farm
Pay
rolls
(in
Thou
sand
s)
Dec-00
Dec-01
Dec-02
Dec-03
Dec-04
Dec-05
Dec-06
Dec-07
Dec-08
Dec-09
Dec-10
Dec-11
Dec-12
Dec-13
Dec-14
Dec-15
Dec-16
Dec-17
Dec-18
Dec-19
Dec-20
Note: 12-month moving average.Sources: U.S. Bureau of Labor Statistics; National Bureau of Economic Research
Figure 3. 12-Month Average Nonfarm Payrolls in the Baltimore HMA
Economic Conditions 8Baltimore-Columbia-Towson, Maryland Comprehensive Housing Market Analysis as of January 1, 2021
Comprehensive Housing Market Analysis Baltimore-Columbia-Towson, MarylandU.S. Department of Housing and Urban Development, Office of Policy Development and Research
2011 Through 2015From 2011 through 2015, nonfarm payrolls in the HMA increased each year, up by an average of 18,700 jobs, or 1.4 percent, annually. More than 90 percent of the net gains were in the professional and business services, the education and health services, and the leisure and hospitality sectors, which annually increased by averages of 8,300, 4,600, and 4,300 jobs, or 4.1, 1.9, and 3.6 percent, respectively. Nearly one-half of the job gains in the professional and business services sector were in the administrative and support and waste management and remediation services industry, which increased by an average of 4,100 jobs, or 5.1 percent, annually. In the
education and health services sector, Johns Hopkins Hospital, which is part of The Johns Hopkins Health System Corporation, added approximately 700 jobs during 2012, when a new $1.1 billion expansion of its existing facility was completed.
2016 Through 2019Nonfarm payrolls continued to increase from 2016 through 2019, but the rate of growth slowed due to declines in the retail trade subsector. During the 4-year period, nonfarm payrolls in the HMA were up by an average of 15,000 jobs, or 1.1 percent, annually. By comparison, nonfarm payrolls nationwide increased an average of 1.6 percent annually. Within the HMA, the largest gains were in the professional and business services and the education and health services sectors, which annually increased by averages of 5,200 and 4,900 jobs, or 2.2 and 1.8 percent, respectively. In the education and health services sector, employment at Johns Hopkins University increased by 1,175 employees during 2016 and 2017. In response to increased competition from online retailers, nonfarm payrolls in the retail trade subsector declined from 2016 through 2019 by an average of 1,800 jobs, or 1.3 percent, annually. Lord & Taylor closed a store in Anne Arundel County during 2018, resulting in approximately 140 jobs lost, and more than 50 employees were laid off during 2017 when Dollar Express Stores LLC closed four locations in the HMA.
Commuting PatternsDuring the 5-year period from 2011 to 2015, more than 88 percent of the people who worked in the HMA, or nearly 1.18 million people, also resided in the HMA (2011 to 2015 American Community Survey [ACS] 5-year data). The rest of the workers commuted from outside the HMA, including the Washington-Arlington-Alexandria, DC-VA-MD-WV Metropolitan Statistical Area (hereafter, Washington metropolitan area), where approximately 6 percent of all workers in the HMA resided. Among the working residents of the HMA, less than 87 percent were employed in the HMA, whereas more than 11 percent of the working residents of the HMA commuted into the Washington metropolitan area for their jobs.
Employment ForecastDuring the 3-year forecast period, the economy of the HMA is expected to steadily recover from the recent job losses, and nonfarm payrolls are
estimated to increase an average of 1.4 percent annually during the next 3 years. Job gains are expected to be largely concentrated in the leisure and hospitality and the education and health services sectors, as the restrictions put in place to slow the spread of COVID-19 are steadily eased. Job growth is expected to be at a stronger pace than during the previous decade, largely because a significant portion of the expected added jobs will be those that were lost during the pandemic. Additional jobs are also anticipated to be added in the transportation and utilities sector as companies build distribution centers to speed up the delivery of their products that are purchased online. Home Depot Product Authority, LLC; Floor & Decor Holdings, Inc.; and The Container Store Group, Inc. are all expected to open distribution centers in the HMA during the next year, resulting in a combined 530 new jobs.
Population and Households 9Baltimore-Columbia-Towson, Maryland Comprehensive Housing Market Analysis as of January 1, 2021
Comprehensive Housing Market Analysis Baltimore-Columbia-Towson, MarylandU.S. Department of Housing and Urban Development, Office of Policy Development and Research
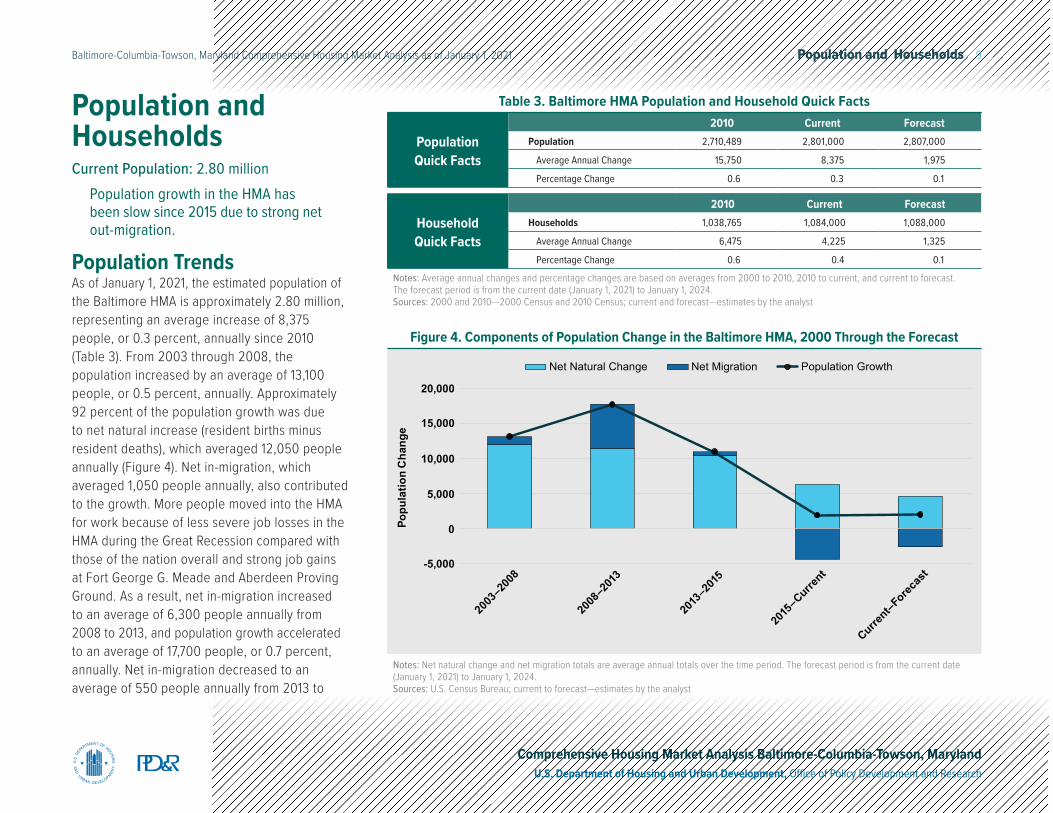
Population and HouseholdsCurrent Population: 2.80 million
Population growth in the HMA has been slow since 2015 due to strong net out-migration.
Population TrendsAs of January 1, 2021, the estimated population of the Baltimore HMA is approximately 2.80 million, representing an average increase of 8,375 people, or 0.3 percent, annually since 2010 (Table 3). From 2003 through 2008, the population increased by an average of 13,100 people, or 0.5 percent, annually. Approximately 92 percent of the population growth was due to net natural increase (resident births minus resident deaths), which averaged 12,050 people annually (Figure 4). Net in-migration, which averaged 1,050 people annually, also contributed to the growth. More people moved into the HMA for work because of less severe job losses in the HMA during the Great Recession compared with those of the nation overall and strong job gains at Fort George G. Meade and Aberdeen Proving Ground. As a result, net in-migration increased to an average of 6,300 people annually from 2008 to 2013, and population growth accelerated to an average of 17,700 people, or 0.7 percent, annually. Net in-migration decreased to an average of 550 people annually from 2013 to
Notes: Net natural change and net migration totals are average annual totals over the time period. The forecast period is from the current date (January 1, 2021) to January 1, 2024.Sources: U.S. Census Bureau; current to forecast—estimates by the analyst
Net Natural Change Net Migration Population Growth
-5,000
0
5,000
10,000
15,000
20,000Po
pula
tion
Cha
nge
2003
–200
8
2008
–201
3
2013
–201
5
2015
–Current
Current–Forec
ast
Figure 4. Components of Population Change in the Baltimore HMA, 2000 Through the Forecast
Population Quick Facts
2010 Current ForecastPopulation 2,710,489 2,801,000 2,807,000
Average Annual Change 15,750 8,375 1,975
Percentage Change 0.6 0.3 0.1
Household Quick Facts
2010 Current ForecastHouseholds 1,038,765 1,084,000 1,088,000
Average Annual Change 6,475 4,225 1,325
Percentage Change 0.6 0.4 0.1
Notes: Average annual changes and percentage changes are based on averages from 2000 to 2010, 2010 to current, and current to forecast. The forecast period is from the current date (January 1, 2021) to January 1, 2024.Sources: 2000 and 2010—2000 Census and 2010 Census; current and forecast—estimates by the analyst
Table 3. Baltimore HMA Population and Household Quick Facts
Population and Households 10Baltimore-Columbia-Towson, Maryland Comprehensive Housing Market Analysis as of January 1, 2021
Comprehensive Housing Market Analysis Baltimore-Columbia-Towson, MarylandU.S. Department of Housing and Urban Development, Office of Policy Development and Research
2015, mainly due to the BRAC-related expansions at the bases being completed, causing population growth to slow to an average of 10,900 people, or 0.4 percent, annually. Since 2015, there has been steady and strong net out-migration, which has averaged 4,375 people annually, causing population growth to significantly slow to an average of 1,925 people, or 0.1 percent, annually. The net out-migration is partially attributed to job losses during the past year and slow job growth during most of the previous 4 years, while increased retirements of baby boomers leaving the area also contributed to the out-migration.
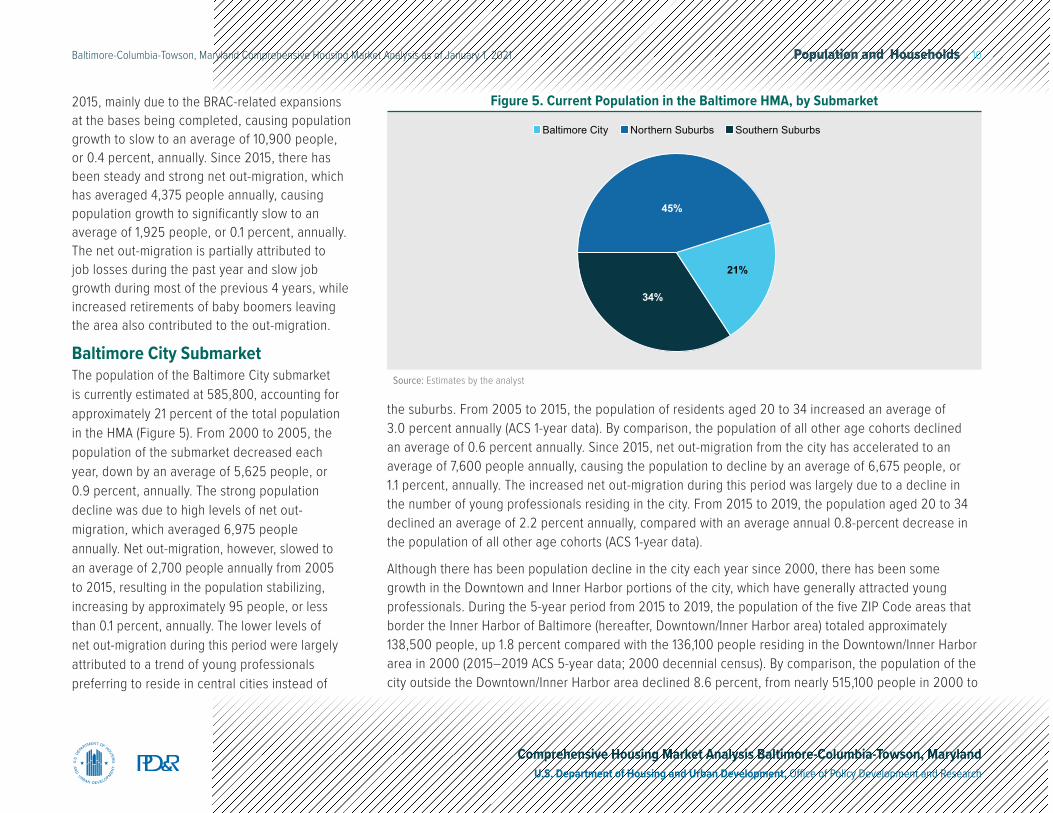
Baltimore City SubmarketThe population of the Baltimore City submarket is currently estimated at 585,800, accounting for approximately 21 percent of the total population in the HMA (Figure 5). From 2000 to 2005, the population of the submarket decreased each year, down by an average of 5,625 people, or 0.9 percent, annually. The strong population decline was due to high levels of net out-migration, which averaged 6,975 people annually. Net out-migration, however, slowed to an average of 2,700 people annually from 2005 to 2015, resulting in the population stabilizing, increasing by approximately 95 people, or less than 0.1 percent, annually. The lower levels of net out-migration during this period were largely attributed to a trend of young professionals preferring to reside in central cities instead of
the suburbs. From 2005 to 2015, the population of residents aged 20 to 34 increased an average of 3.0 percent annually (ACS 1-year data). By comparison, the population of all other age cohorts declined an average of 0.6 percent annually. Since 2015, net out-migration from the city has accelerated to an average of 7,600 people annually, causing the population to decline by an average of 6,675 people, or 1.1 percent, annually. The increased net out-migration during this period was largely due to a decline in the number of young professionals residing in the city. From 2015 to 2019, the population aged 20 to 34 declined an average of 2.2 percent annually, compared with an average annual 0.8-percent decrease in the population of all other age cohorts (ACS 1-year data).
Although there has been population decline in the city each year since 2000, there has been some growth in the Downtown and Inner Harbor portions of the city, which have generally attracted young professionals. During the 5-year period from 2015 to 2019, the population of the five ZIP Code areas that border the Inner Harbor of Baltimore (hereafter, Downtown/Inner Harbor area) totaled approximately 138,500 people, up 1.8 percent compared with the 136,100 people residing in the Downtown/Inner Harbor area in 2000 (2015–2019 ACS 5-year data; 2000 decennial census). By comparison, the population of the city outside the Downtown/Inner Harbor area declined 8.6 percent, from nearly 515,100 people in 2000 to
Source: Estimates by the analyst
21%
45%
34%
Baltimore City Northern Suburbs Southern Suburbs
Figure 5. Current Population in the Baltimore HMA, by Submarket
Population and Households 11Baltimore-Columbia-Towson, Maryland Comprehensive Housing Market Analysis as of January 1, 2021
Comprehensive Housing Market Analysis Baltimore-Columbia-Towson, MarylandU.S. Department of Housing and Urban Development, Office of Policy Development and Research
approximately 470,500 people during the 5-year period from 2015 to 2019.
Northern Suburbs SubmarketThe population of the Northern Suburbs submarket is currently estimated at 1.25 million, accounting for approximately 45 percent of the total population in the HMA. From 2000 to 2006, the population of the submarket increased by an average of 12,500 people, or 1.1 percent, annually. More than 70 percent of the population growth was due to net in-migration, which averaged 8,800 people annually. From 2006 to 2009, there was net out-migration each year, averaging 780 people annually, which caused population growth to slow to an average of 3,550 people, or 0.3 percent, annually. The net out-migration was partially attributed to more young professionals moving from the submarket into the Baltimore City submarket. Population growth accelerated to an average of 6,475 people, or 0.5 percent, annually from 2009 to 2013. The faster growth was due to net in-migration, which averaged 3,250 people annually and was attributed to BRAC-related job growth at Aberdeen Proving Ground, which is in the submarket. Once the growth at Aberdeen Proving Ground was completed, net out-migration again resumed and has occurred during most years since 2013, averaging 130 people annually. As a result of the net out-migration, population growth slowed to an average of 1,625 people, or 0.1 percent, annually.
Southern Suburbs SubmarketThe population of the Southern Suburbs submarket is currently estimated at 964,100, accounting for approximately 34 percent of the total population in the HMA. From 2002 to 2008, the population of the submarket increased by an average of 7,300 people, or 0.9 percent, annually. Approximately 76 percent of the population growth was due to net natural increase, which averaged 5,550 people annually, while net in-migration that averaged 1,750 people annually also contributed to the increase. As a result of the strong job growth at Fort George G. Meade, located in the submarket, net in-migration increased to an average of 6,225 people annually from 2008 to 2013, causing population growth to accelerate an average of 11,350 people, or 1.3 percent. Since 2013, population growth has slowed to an average of 7,550 people, or 0.8 percent, annually, primarily due to net in-migration decreasing to an average of 3,300 people. The lower levels of net in-migration are mainly a result of the expansions at Fort George G. Meade being completed. Net in-migration, however, is still higher than migration during the early to mid-2000s, which is largely attributed to more residents choosing to reside in the submarket and commute into the Washington metropolitan area. During the 5-year period from 2011 to 2015, approximately 23 percent of the working residents in the submarket, or nearly 110,800 residents, worked in the Washington metropolitan area, compared with a total of 5 percent of the working residents in the other two submarkets (2011–2015 ACS 5-year data).
Household TrendsAn estimated 1.08 million households currently reside in the HMA—243,500, 482,100, and 358,500 households reside in the Baltimore City, Northern Suburbs, and Southern Suburbs submarkets, respectively. Household growth trends in the HMA and all submarkets have been similar to population growth trends. Since 2010, the number of households in the HMA has increased by an average of 4,225 households, or 0.4 percent, annually. By comparison, from 2000 to 2010, the number of households increased by an average of 6,475 households, or 0.6 percent, annually. In the Baltimore City submarket, the number of households has decreased since 2010 by an average of 600 households, or 0.2 percent, annually, compared with an average decline of 810 households, or 0.3 percent, annually from 2000 to 2010. The number of households in the Northern Suburbs and Southern Suburbs submarkets has annually increased by averages of 1,425 and 3,375 households, or 0.3 and 1.0 percent, respectively, since 2010. By comparison, from 2000 to 2010, the number of households in the submarkets annually increased by averages of 3,475 and 3,800 households, or 0.8 and 1.3 percent, respectively.
Population and Households 12Baltimore-Columbia-Towson, Maryland Comprehensive Housing Market Analysis as of January 1, 2021
Comprehensive Housing Market Analysis Baltimore-Columbia-Towson, MarylandU.S. Department of Housing and Urban Development, Office of Policy Development and Research
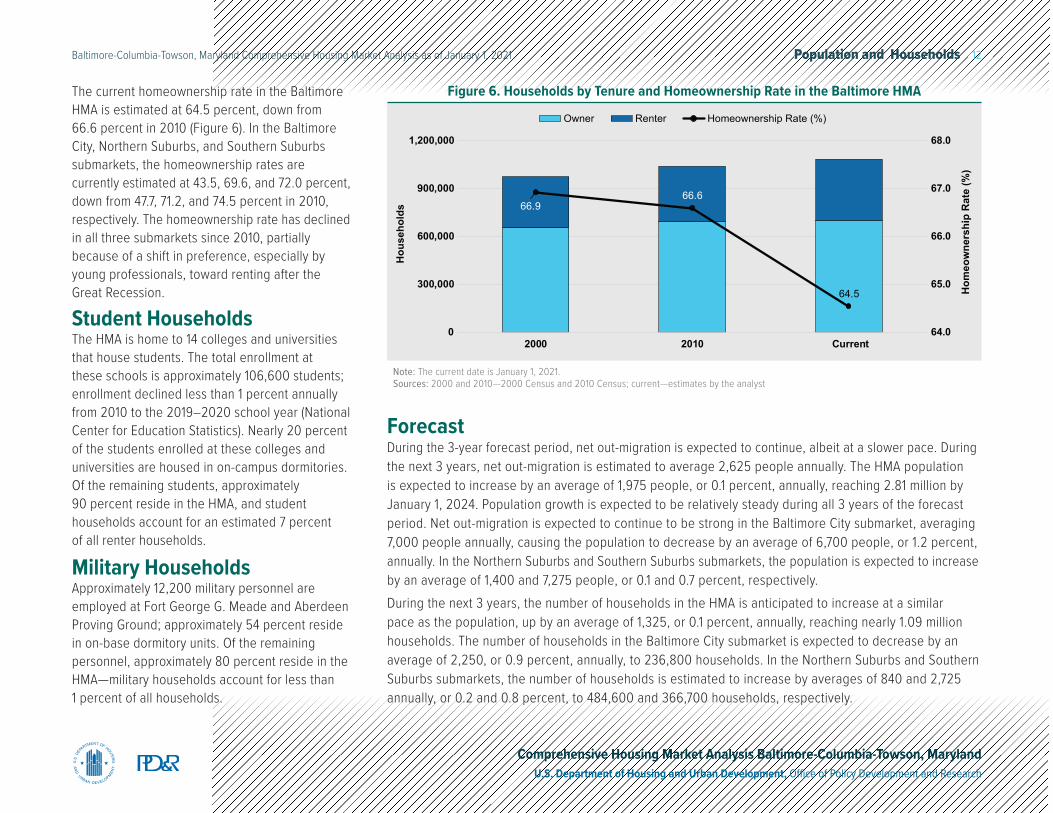
The current homeownership rate in the Baltimore HMA is estimated at 64.5 percent, down from 66.6 percent in 2010 (Figure 6). In the Baltimore City, Northern Suburbs, and Southern Suburbs submarkets, the homeownership rates are currently estimated at 43.5, 69.6, and 72.0 percent, down from 47.7, 71.2, and 74.5 percent in 2010, respectively. The homeownership rate has declined in all three submarkets since 2010, partially because of a shift in preference, especially by young professionals, toward renting after the Great Recession.
Student HouseholdsThe HMA is home to 14 colleges and universities that house students. The total enrollment at these schools is approximately 106,600 students; enrollment declined less than 1 percent annually from 2010 to the 2019–2020 school year (National Center for Education Statistics). Nearly 20 percent of the students enrolled at these colleges and universities are housed in on-campus dormitories. Of the remaining students, approximately 90 percent reside in the HMA, and student households account for an estimated 7 percent of all renter households.
Military HouseholdsApproximately 12,200 military personnel are employed at Fort George G. Meade and Aberdeen Proving Ground; approximately 54 percent reside in on-base dormitory units. Of the remaining personnel, approximately 80 percent reside in the HMA—military households account for less than 1 percent of all households.
Note: The current date is January 1, 2021.Sources: 2000 and 2010—2000 Census and 2010 Census; current—estimates by the analyst
Owner Renter Homeownership Rate (%)
66.966.6
64.5
64.0
65.0
66.0
67.0
68.0
0
300,000
600,000
900,000
1,200,000
2000 2010 Current
Hom
eow
ners
hip
Rat
e (%
)
Hou
seho
lds
Figure 6. Households by Tenure and Homeownership Rate in the Baltimore HMA
ForecastDuring the 3-year forecast period, net out-migration is expected to continue, albeit at a slower pace. During the next 3 years, net out-migration is estimated to average 2,625 people annually. The HMA population is expected to increase by an average of 1,975 people, or 0.1 percent, annually, reaching 2.81 million by January 1, 2024. Population growth is expected to be relatively steady during all 3 years of the forecast period. Net out-migration is expected to continue to be strong in the Baltimore City submarket, averaging 7,000 people annually, causing the population to decrease by an average of 6,700 people, or 1.2 percent, annually. In the Northern Suburbs and Southern Suburbs submarkets, the population is expected to increase by an average of 1,400 and 7,275 people, or 0.1 and 0.7 percent, respectively. During the next 3 years, the number of households in the HMA is anticipated to increase at a similar pace as the population, up by an average of 1,325, or 0.1 percent, annually, reaching nearly 1.09 million households. The number of households in the Baltimore City submarket is expected to decrease by an average of 2,250, or 0.9 percent, annually, to 236,800 households. In the Northern Suburbs and Southern Suburbs submarkets, the number of households is estimated to increase by averages of 840 and 2,725 annually, or 0.2 and 0.8 percent, to 484,600 and 366,700 households, respectively.
Home Sales Market 13Baltimore-Columbia-Towson, Maryland Comprehensive Housing Market Analysis as of January 1, 2021
Comprehensive Housing Market Analysis Baltimore-Columbia-Towson, MarylandU.S. Department of Housing and Urban Development, Office of Policy Development and Research
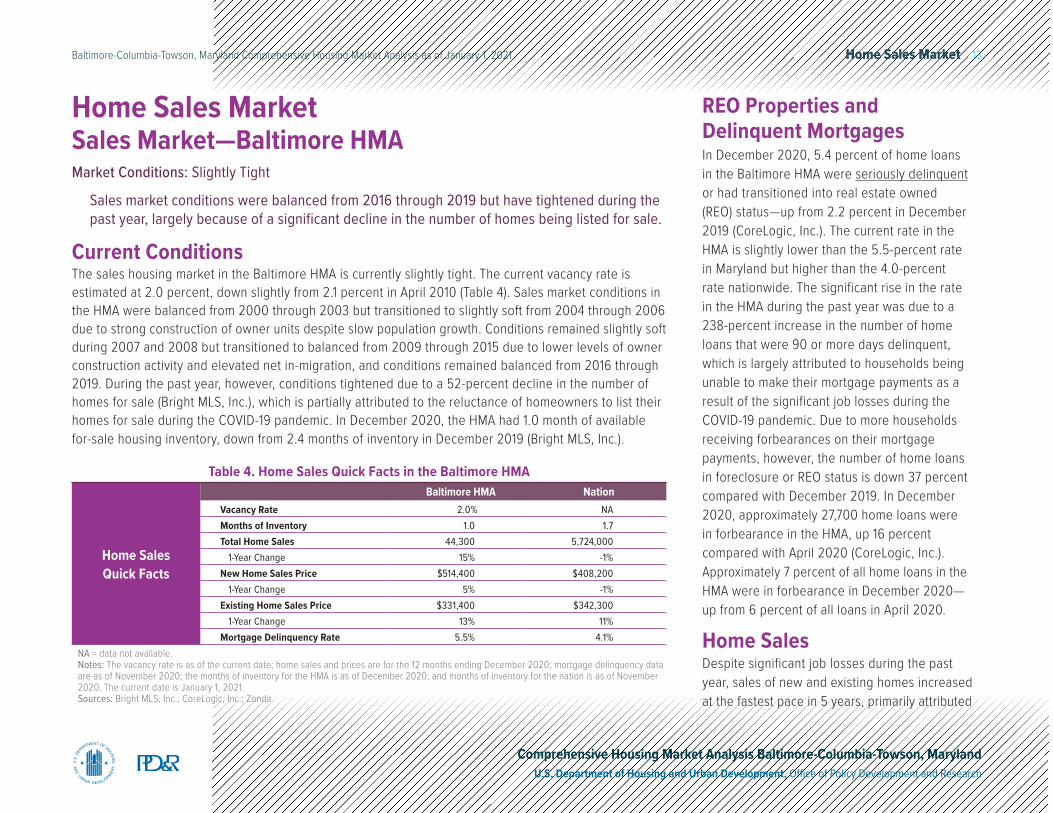
Current ConditionsThe sales housing market in the Baltimore HMA is currently slightly tight. The current vacancy rate is estimated at 2.0 percent, down slightly from 2.1 percent in April 2010 (Table 4). Sales market conditions in the HMA were balanced from 2000 through 2003 but transitioned to slightly soft from 2004 through 2006 due to strong construction of owner units despite slow population growth. Conditions remained slightly soft during 2007 and 2008 but transitioned to balanced from 2009 through 2015 due to lower levels of owner construction activity and elevated net in-migration, and conditions remained balanced from 2016 through 2019. During the past year, however, conditions tightened due to a 52-percent decline in the number of homes for sale (Bright MLS, Inc.), which is partially attributed to the reluctance of homeowners to list their homes for sale during the COVID-19 pandemic. In December 2020, the HMA had 1.0 month of available for-sale housing inventory, down from 2.4 months of inventory in December 2019 (Bright MLS, Inc.).
Home Sales Market
Market Conditions: Slightly Tight
Sales market conditions were balanced from 2016 through 2019 but have tightened during the past year, largely because of a significant decline in the number of homes being listed for sale.
Home Sales Quick Facts
Baltimore HMA NationVacancy Rate 2.0% NAMonths of Inventory 1.0 1.7Total Home Sales 44,300 5,724,000
1-Year Change 15% -1%New Home Sales Price $514,400 $408,200
1-Year Change 5% -1%Existing Home Sales Price $331,400 $342,300
1-Year Change 13% 11%Mortgage Delinquency Rate 5.5% 4.1%
NA = data not available.Notes: The vacancy rate is as of the current date; home sales and prices are for the 12 months ending December 2020; mortgage delinquency data are as of November 2020; the months of inventory for the HMA is as of December 2020; and months of inventory for the nation is as of November 2020. The current date is January 1, 2021.Sources: Bright MLS, Inc.; CoreLogic, Inc.; Zonda
Table 4. Home Sales Quick Facts in the Baltimore HMA
REO Properties and Delinquent MortgagesIn December 2020, 5.4 percent of home loans in the Baltimore HMA were seriously delinquent or had transitioned into real estate owned (REO) status—up from 2.2 percent in December 2019 (CoreLogic, Inc.). The current rate in the HMA is slightly lower than the 5.5-percent rate in Maryland but higher than the 4.0-percent rate nationwide. The significant rise in the rate in the HMA during the past year was due to a 238-percent increase in the number of home loans that were 90 or more days delinquent, which is largely attributed to households being unable to make their mortgage payments as a result of the significant job losses during the COVID-19 pandemic. Due to more households receiving forbearances on their mortgage payments, however, the number of home loans in foreclosure or REO status is down 37 percent compared with December 2019. In December 2020, approximately 27,700 home loans were in forbearance in the HMA, up 16 percent compared with April 2020 (CoreLogic, Inc.). Approximately 7 percent of all home loans in the HMA were in forbearance in December 2020— up from 6 percent of all loans in April 2020.
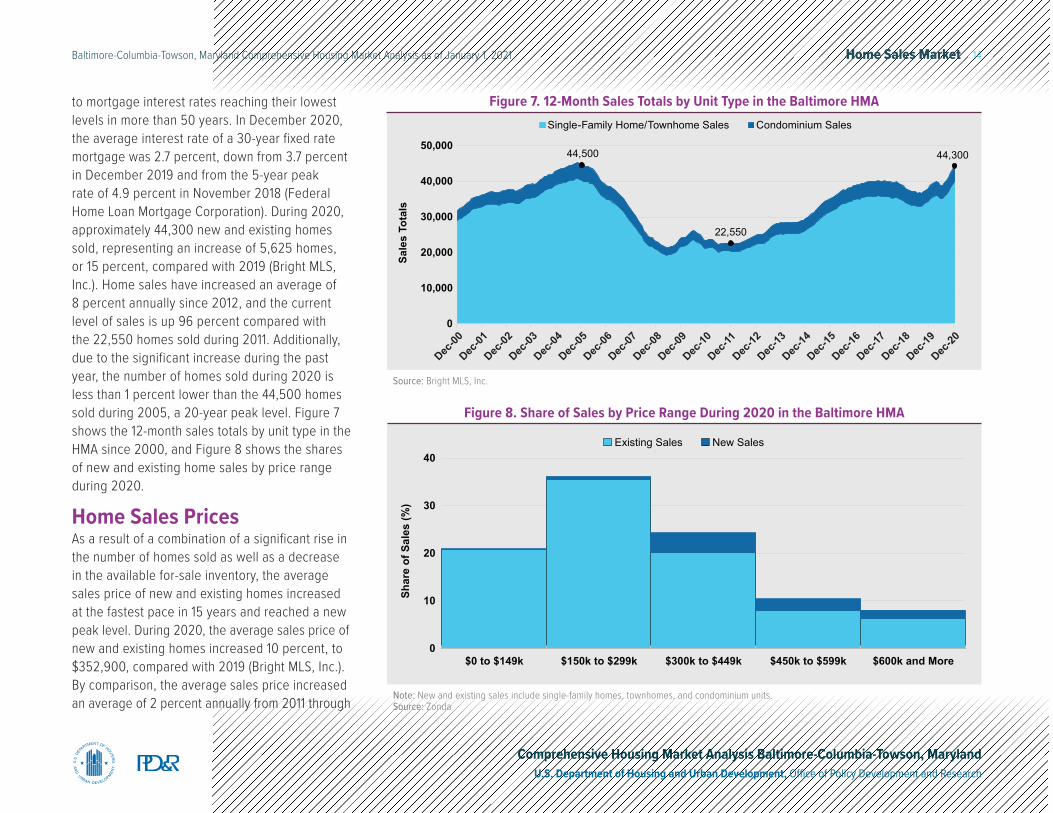
Home SalesDespite significant job losses during the past year, sales of new and existing homes increased at the fastest pace in 5 years, primarily attributed
Sales Market—Baltimore HMA
Home Sales Market 14Baltimore-Columbia-Towson, Maryland Comprehensive Housing Market Analysis as of January 1, 2021
Comprehensive Housing Market Analysis Baltimore-Columbia-Towson, MarylandU.S. Department of Housing and Urban Development, Office of Policy Development and Research
Note: New and existing sales include single-family homes, townhomes, and condominium units.Source: Zonda
Existing Sales New Sales
0
10
20
30
40
$0 to $149k $150k to $299k $300k to $449k $450k to $599k $600k and More
Shar
e of
Sal
es (%
)Figure 8. Share of Sales by Price Range During 2020 in the Baltimore HMA
Source: Bright MLS, Inc.
44,500
22,550
44,300
0
10,000
20,000
30,000
40,000
50,000
Sale
s To
tals
Single-Family Home/Townhome Sales Condominium Sales
Dec-00
Dec-01
Dec-02
Dec-03
Dec-04
Dec-05
Dec-06
Dec-07
Dec-08
Dec-09
Dec-10
Dec-11
Dec-12
Dec-13
Dec-14
Dec-15
Dec-16
Dec-17
Dec-18
Dec-19
Dec-20
Figure 7. 12-Month Sales Totals by Unit Type in the Baltimore HMAto mortgage interest rates reaching their lowest levels in more than 50 years. In December 2020, the average interest rate of a 30-year fixed rate mortgage was 2.7 percent, down from 3.7 percent in December 2019 and from the 5-year peak rate of 4.9 percent in November 2018 (Federal Home Loan Mortgage Corporation). During 2020, approximately 44,300 new and existing homes sold, representing an increase of 5,625 homes, or 15 percent, compared with 2019 (Bright MLS, Inc.). Home sales have increased an average of 8 percent annually since 2012, and the current level of sales is up 96 percent compared with the 22,550 homes sold during 2011. Additionally, due to the significant increase during the past year, the number of homes sold during 2020 is less than 1 percent lower than the 44,500 homes sold during 2005, a 20-year peak level. Figure 7 shows the 12-month sales totals by unit type in the HMA since 2000, and Figure 8 shows the shares of new and existing home sales by price range during 2020.
Home Sales PricesAs a result of a combination of a significant rise in the number of homes sold as well as a decrease in the available for-sale inventory, the average sales price of new and existing homes increased at the fastest pace in 15 years and reached a new peak level. During 2020, the average sales price of new and existing homes increased 10 percent, to $352,900, compared with 2019 (Bright MLS, Inc.). By comparison, the average sales price increased an average of 2 percent annually from 2011 through
Home Sales Market 15Baltimore-Columbia-Towson, Maryland Comprehensive Housing Market Analysis as of January 1, 2021
Comprehensive Housing Market Analysis Baltimore-Columbia-Towson, MarylandU.S. Department of Housing and Urban Development, Office of Policy Development and Research
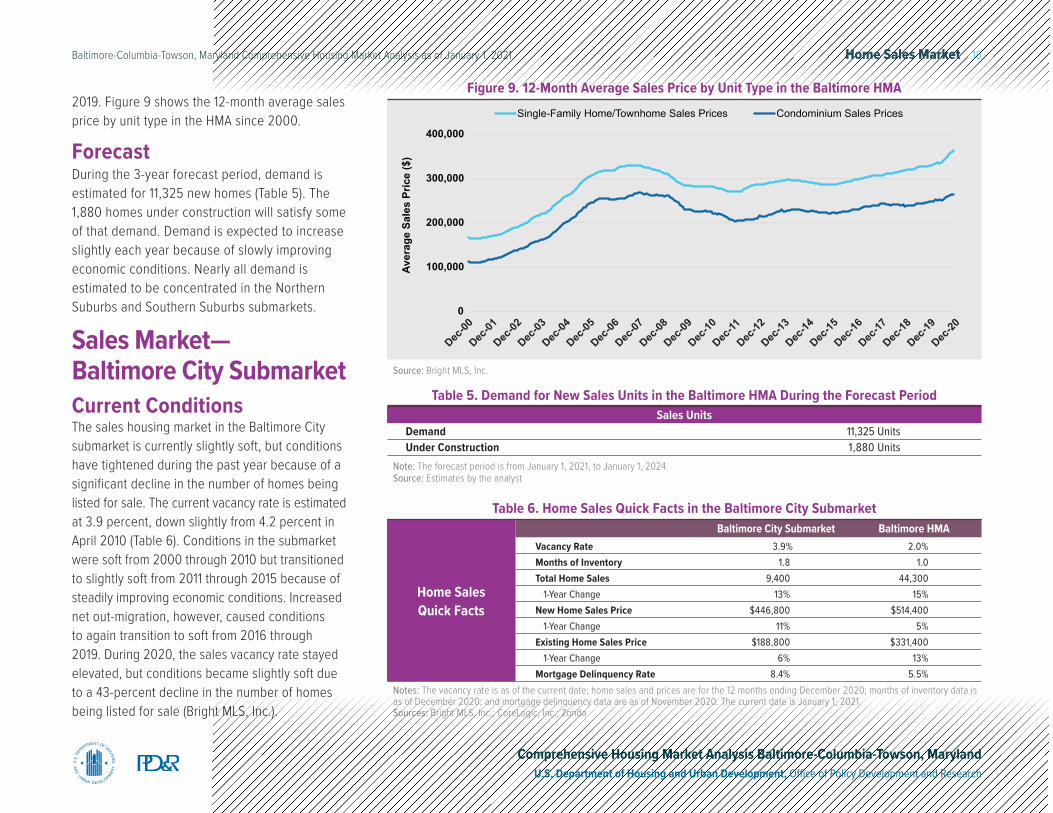
2019. Figure 9 shows the 12-month average sales price by unit type in the HMA since 2000.
ForecastDuring the 3-year forecast period, demand is estimated for 11,325 new homes (Table 5). The 1,880 homes under construction will satisfy some of that demand. Demand is expected to increase slightly each year because of slowly improving economic conditions. Nearly all demand is estimated to be concentrated in the Northern Suburbs and Southern Suburbs submarkets.
Sales Market— Baltimore City Submarket Current ConditionsThe sales housing market in the Baltimore City submarket is currently slightly soft, but conditions have tightened during the past year because of a significant decline in the number of homes being listed for sale. The current vacancy rate is estimated at 3.9 percent, down slightly from 4.2 percent in April 2010 (Table 6). Conditions in the submarket were soft from 2000 through 2010 but transitioned to slightly soft from 2011 through 2015 because of steadily improving economic conditions. Increased net out-migration, however, caused conditions to again transition to soft from 2016 through 2019. During 2020, the sales vacancy rate stayed elevated, but conditions became slightly soft due to a 43-percent decline in the number of homes being listed for sale (Bright MLS, Inc.).
Source: Bright MLS, Inc.
0
100,000
200,000
300,000
400,000
Aver
age
Sale
s Pr
ice
($)
Single-Family Home/Townhome Sales Prices Condominium Sales Prices
Dec-00
Dec-01
Dec-02
Dec-03
Dec-04
Dec-05
Dec-06
Dec-07
Dec-08
Dec-09
Dec-10
Dec-11
Dec-12
Dec-13
Dec-14
Dec-15
Dec-16
Dec-17
Dec-18
Dec-19
Dec-20
Figure 9. 12-Month Average Sales Price by Unit Type in the Baltimore HMA
Table 5. Demand for New Sales Units in the Baltimore HMA During the Forecast PeriodSales Units
Demand 11,325 UnitsUnder Construction 1,880 Units
Note: The forecast period is from January 1, 2021, to January 1, 2024.Source: Estimates by the analyst
Home Sales Quick Facts
Baltimore City Submarket Baltimore HMAVacancy Rate 3.9% 2.0%Months of Inventory 1.8 1.0Total Home Sales 9,400 44,300
1-Year Change 13% 15%New Home Sales Price $446,800 $514,400
1-Year Change 11% 5%Existing Home Sales Price $188,800 $331,400
1-Year Change 6% 13%Mortgage Delinquency Rate 8.4% 5.5%
Notes: The vacancy rate is as of the current date; home sales and prices are for the 12 months ending December 2020; months of inventory data is as of December 2020; and mortgage delinquency data are as of November 2020. The current date is January 1, 2021.Sources: Bright MLS, Inc.; CoreLogic, Inc.; Zonda
Table 6. Home Sales Quick Facts in the Baltimore City Submarket
Home Sales Market 16Baltimore-Columbia-Towson, Maryland Comprehensive Housing Market Analysis as of January 1, 2021
Comprehensive Housing Market Analysis Baltimore-Columbia-Towson, MarylandU.S. Department of Housing and Urban Development, Office of Policy Development and Research
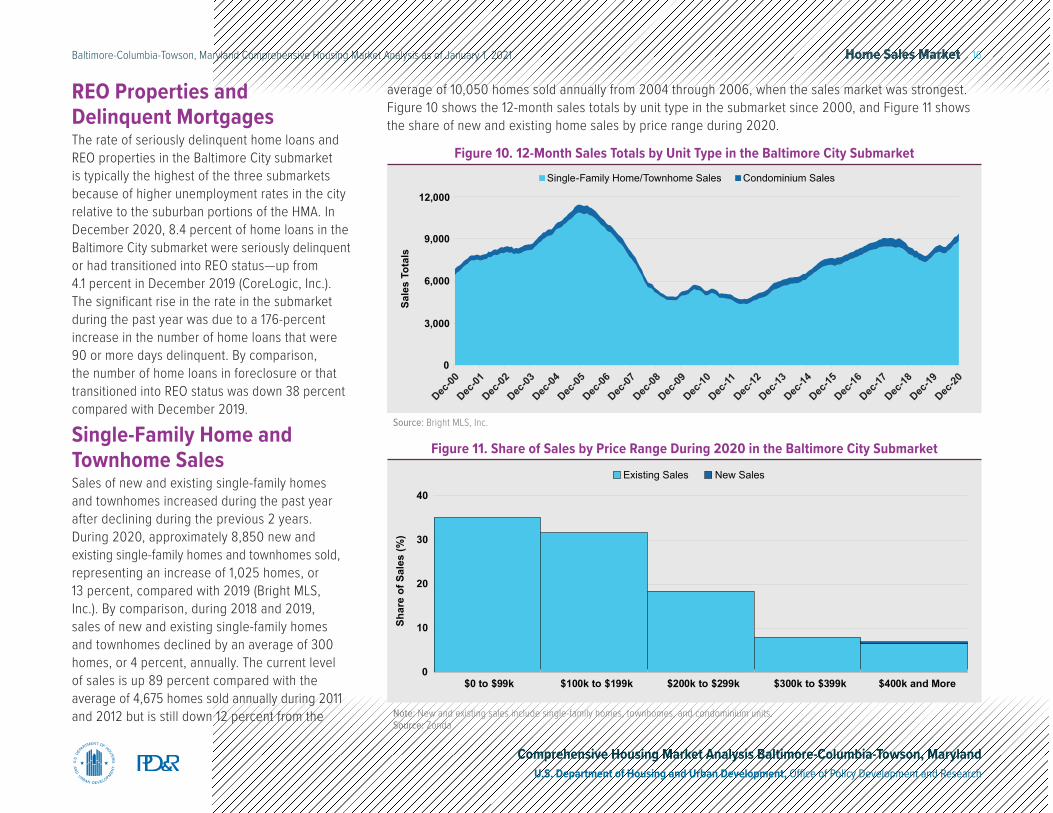
REO Properties and Delinquent MortgagesThe rate of seriously delinquent home loans and REO properties in the Baltimore City submarket is typically the highest of the three submarkets because of higher unemployment rates in the city relative to the suburban portions of the HMA. In December 2020, 8.4 percent of home loans in the Baltimore City submarket were seriously delinquent or had transitioned into REO status—up from 4.1 percent in December 2019 (CoreLogic, Inc.). The significant rise in the rate in the submarket during the past year was due to a 176-percent increase in the number of home loans that were 90 or more days delinquent. By comparison, the number of home loans in foreclosure or that transitioned into REO status was down 38 percent compared with December 2019.
Single-Family Home and Townhome SalesSales of new and existing single-family homes and townhomes increased during the past year after declining during the previous 2 years. During 2020, approximately 8,850 new and existing single-family homes and townhomes sold, representing an increase of 1,025 homes, or 13 percent, compared with 2019 (Bright MLS, Inc.). By comparison, during 2018 and 2019, sales of new and existing single-family homes and townhomes declined by an average of 300 homes, or 4 percent, annually. The current level of sales is up 89 percent compared with the average of 4,675 homes sold annually during 2011 and 2012 but is still down 12 percent from the
average of 10,050 homes sold annually from 2004 through 2006, when the sales market was strongest. Figure 10 shows the 12-month sales totals by unit type in the submarket since 2000, and Figure 11 shows the share of new and existing home sales by price range during 2020.
Note: New and existing sales include single-family homes, townhomes, and condominium units.Source: Zonda
0
10
20
30
40
$0 to $99k $100k to $199k $200k to $299k $300k to $399k $400k and More
Shar
e of
Sal
es (%
)
Existing Sales New Sales
Figure 11. Share of Sales by Price Range During 2020 in the Baltimore City Submarket
Source: Bright MLS, Inc.
Sale
s To
tals
Single-Family Home/Townhome Sales Condominium Sales
Dec-00
Dec-01
Dec-02
Dec-03
Dec-04
Dec-05
Dec-06
Dec-07
Dec-08
Dec-09
Dec-10
Dec-11
Dec-12
Dec-13
Dec-14
Dec-15
Dec-16
Dec-17
Dec-18
Dec-19
Dec-20
0
3,000
6,000
9,000
12,000
Figure 10. 12-Month Sales Totals by Unit Type in the Baltimore City Submarket
Home Sales Market 17Baltimore-Columbia-Towson, Maryland Comprehensive Housing Market Analysis as of January 1, 2021
Comprehensive Housing Market Analysis Baltimore-Columbia-Towson, MarylandU.S. Department of Housing and Urban Development, Office of Policy Development and Research
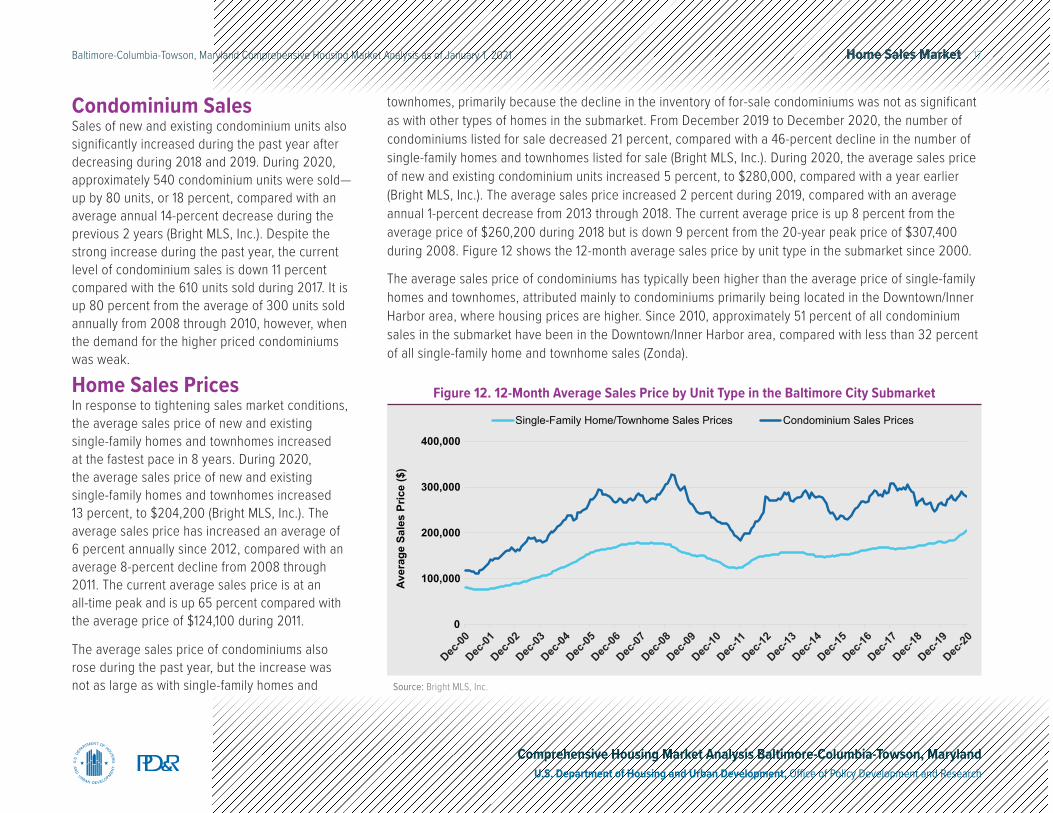
Condominium SalesSales of new and existing condominium units also significantly increased during the past year after decreasing during 2018 and 2019. During 2020, approximately 540 condominium units were sold—up by 80 units, or 18 percent, compared with an average annual 14-percent decrease during the previous 2 years (Bright MLS, Inc.). Despite the strong increase during the past year, the current level of condominium sales is down 11 percent compared with the 610 units sold during 2017. It is up 80 percent from the average of 300 units sold annually from 2008 through 2010, however, when the demand for the higher priced condominiums was weak.
Home Sales PricesIn response to tightening sales market conditions, the average sales price of new and existing single-family homes and townhomes increased at the fastest pace in 8 years. During 2020, the average sales price of new and existing single-family homes and townhomes increased 13 percent, to $204,200 (Bright MLS, Inc.). The average sales price has increased an average of 6 percent annually since 2012, compared with an average 8-percent decline from 2008 through 2011. The current average sales price is at an all-time peak and is up 65 percent compared with the average price of $124,100 during 2011.
The average sales price of condominiums also rose during the past year, but the increase was not as large as with single-family homes and Source: Bright MLS, Inc.
0
100,000
200,000
300,000
400,000
Aver
age
Sale
s Pr
ice
($)
Single-Family Home/Townhome Sales Prices Condominium Sales Prices
Dec-00
Dec-01
Dec-02
Dec-03
Dec-04
Dec-05
Dec-06
Dec-07
Dec-08
Dec-09
Dec-10
Dec-11
Dec-12
Dec-13
Dec-14
Dec-15
Dec-16
Dec-17
Dec-18
Dec-19
Dec-20
Figure 12. 12-Month Average Sales Price by Unit Type in the Baltimore City Submarket
townhomes, primarily because the decline in the inventory of for-sale condominiums was not as significant as with other types of homes in the submarket. From December 2019 to December 2020, the number of condominiums listed for sale decreased 21 percent, compared with a 46-percent decline in the number of single-family homes and townhomes listed for sale (Bright MLS, Inc.). During 2020, the average sales price of new and existing condominium units increased 5 percent, to $280,000, compared with a year earlier (Bright MLS, Inc.). The average sales price increased 2 percent during 2019, compared with an average annual 1-percent decrease from 2013 through 2018. The current average price is up 8 percent from the average price of $260,200 during 2018 but is down 9 percent from the 20-year peak price of $307,400 during 2008. Figure 12 shows the 12-month average sales price by unit type in the submarket since 2000.
The average sales price of condominiums has typically been higher than the average price of single-family homes and townhomes, attributed mainly to condominiums primarily being located in the Downtown/Inner Harbor area, where housing prices are higher. Since 2010, approximately 51 percent of all condominium sales in the submarket have been in the Downtown/Inner Harbor area, compared with less than 32 percent of all single-family home and townhome sales (Zonda).
Home Sales Market 18Baltimore-Columbia-Towson, Maryland Comprehensive Housing Market Analysis as of January 1, 2021
Comprehensive Housing Market Analysis Baltimore-Columbia-Towson, MarylandU.S. Department of Housing and Urban Development, Office of Policy Development and Research
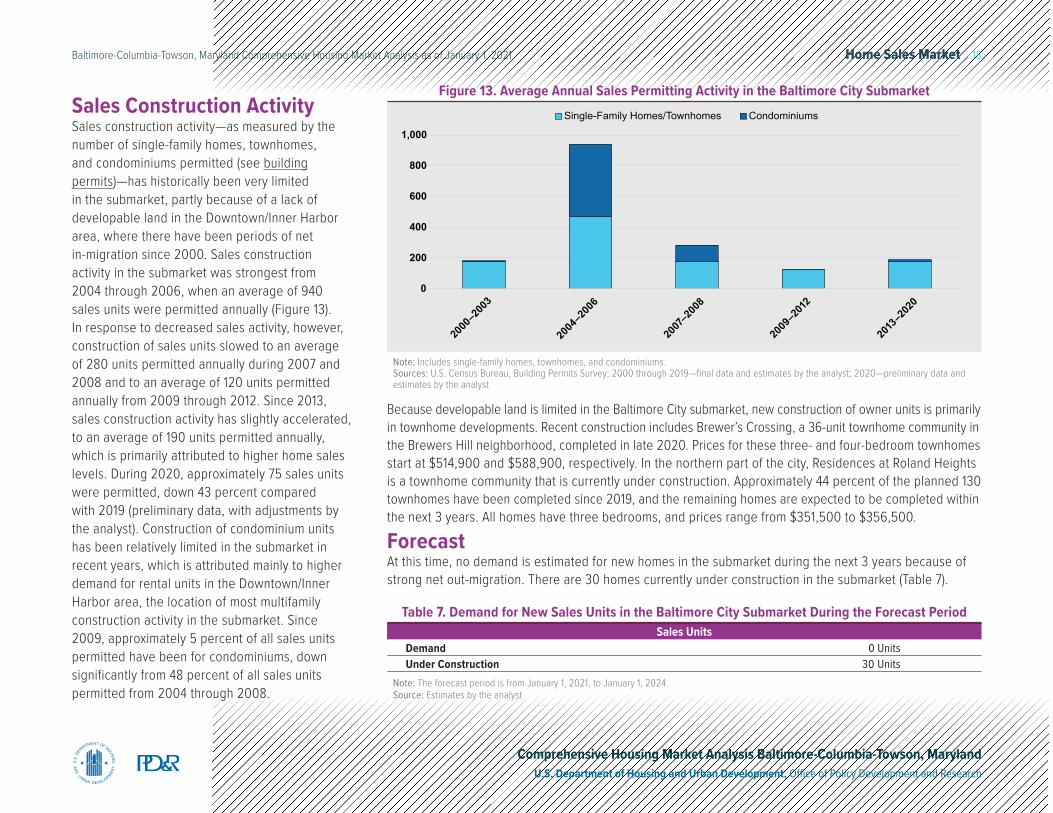
Sales Construction ActivitySales construction activity—as measured by the number of single-family homes, townhomes, and condominiums permitted (see building permits)—has historically been very limited in the submarket, partly because of a lack of developable land in the Downtown/Inner Harbor area, where there have been periods of net in-migration since 2000. Sales construction activity in the submarket was strongest from 2004 through 2006, when an average of 940 sales units were permitted annually (Figure 13). In response to decreased sales activity, however, construction of sales units slowed to an average of 280 units permitted annually during 2007 and 2008 and to an average of 120 units permitted annually from 2009 through 2012. Since 2013, sales construction activity has slightly accelerated, to an average of 190 units permitted annually, which is primarily attributed to higher home sales levels. During 2020, approximately 75 sales units were permitted, down 43 percent compared with 2019 (preliminary data, with adjustments by the analyst). Construction of condominium units has been relatively limited in the submarket in recent years, which is attributed mainly to higher demand for rental units in the Downtown/Inner Harbor area, the location of most multifamily construction activity in the submarket. Since 2009, approximately 5 percent of all sales units permitted have been for condominiums, down significantly from 48 percent of all sales units permitted from 2004 through 2008.
Note: Includes single-family homes, townhomes, and condominiums.Sources: U.S. Census Bureau, Building Permits Survey; 2000 through 2019—final data and estimates by the analyst; 2020—preliminary data and estimates by the analyst
0
200
400
600
800
1,000
Single-Family Homes/Townhomes Condominiums
2000
–200
3
2004
–200
6
2007
–200
8
2009
–201
2
2013
–202
0
Figure 13. Average Annual Sales Permitting Activity in the Baltimore City Submarket
Because developable land is limited in the Baltimore City submarket, new construction of owner units is primarily in townhome developments. Recent construction includes Brewer’s Crossing, a 36-unit townhome community in the Brewers Hill neighborhood, completed in late 2020. Prices for these three- and four-bedroom townhomes start at $514,900 and $588,900, respectively. In the northern part of the city, Residences at Roland Heights is a townhome community that is currently under construction. Approximately 44 percent of the planned 130 townhomes have been completed since 2019, and the remaining homes are expected to be completed within the next 3 years. All homes have three bedrooms, and prices range from $351,500 to $356,500.
ForecastAt this time, no demand is estimated for new homes in the submarket during the next 3 years because of strong net out-migration. There are 30 homes currently under construction in the submarket (Table 7).
Table 7. Demand for New Sales Units in the Baltimore City Submarket During the Forecast PeriodSales Units
Demand 0 UnitsUnder Construction 30 Units
Note: The forecast period is from January 1, 2021, to January 1, 2024.Source: Estimates by the analyst
Home Sales Market 19Baltimore-Columbia-Towson, Maryland Comprehensive Housing Market Analysis as of January 1, 2021
Comprehensive Housing Market Analysis Baltimore-Columbia-Towson, MarylandU.S. Department of Housing and Urban Development, Office of Policy Development and Research
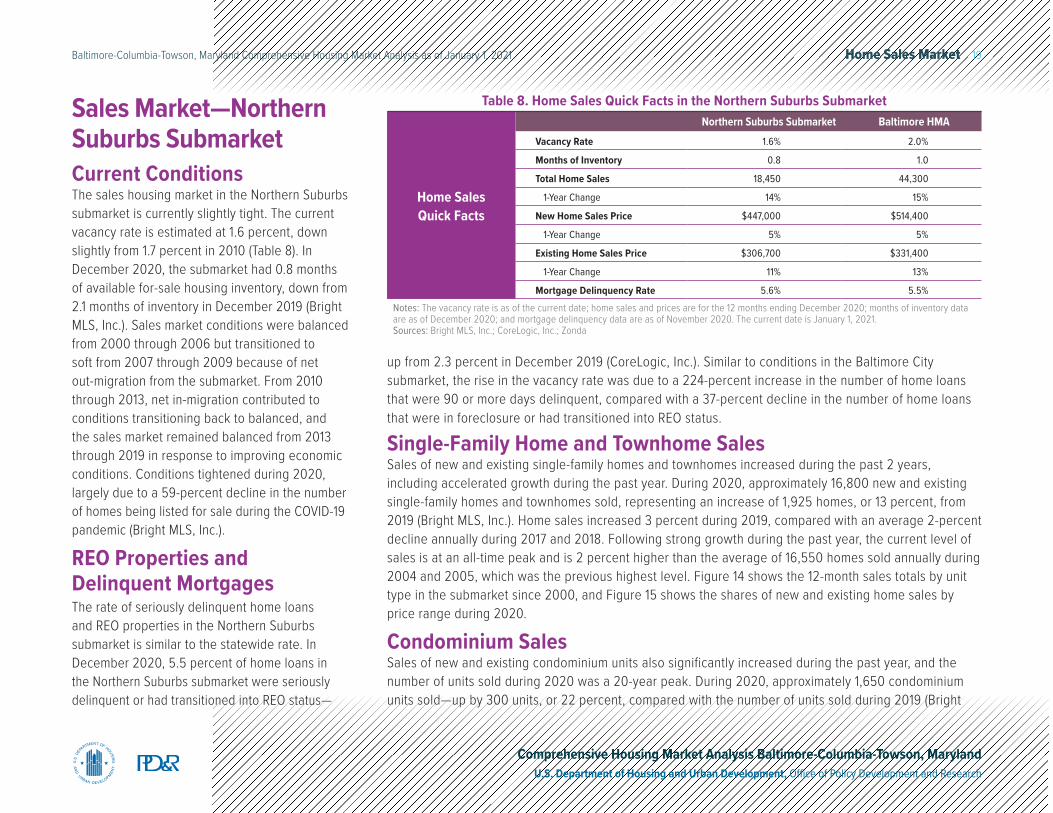
Sales Market—Northern Suburbs Submarket Current ConditionsThe sales housing market in the Northern Suburbs submarket is currently slightly tight. The current vacancy rate is estimated at 1.6 percent, down slightly from 1.7 percent in 2010 (Table 8). In December 2020, the submarket had 0.8 months of available for-sale housing inventory, down from 2.1 months of inventory in December 2019 (Bright MLS, Inc.). Sales market conditions were balanced from 2000 through 2006 but transitioned to soft from 2007 through 2009 because of net out-migration from the submarket. From 2010 through 2013, net in-migration contributed to conditions transitioning back to balanced, and the sales market remained balanced from 2013 through 2019 in response to improving economic conditions. Conditions tightened during 2020, largely due to a 59-percent decline in the number of homes being listed for sale during the COVID-19 pandemic (Bright MLS, Inc.).
REO Properties and Delinquent MortgagesThe rate of seriously delinquent home loans and REO properties in the Northern Suburbs submarket is similar to the statewide rate. In December 2020, 5.5 percent of home loans in the Northern Suburbs submarket were seriously delinquent or had transitioned into REO status—
up from 2.3 percent in December 2019 (CoreLogic, Inc.). Similar to conditions in the Baltimore City submarket, the rise in the vacancy rate was due to a 224-percent increase in the number of home loans that were 90 or more days delinquent, compared with a 37-percent decline in the number of home loans that were in foreclosure or had transitioned into REO status.
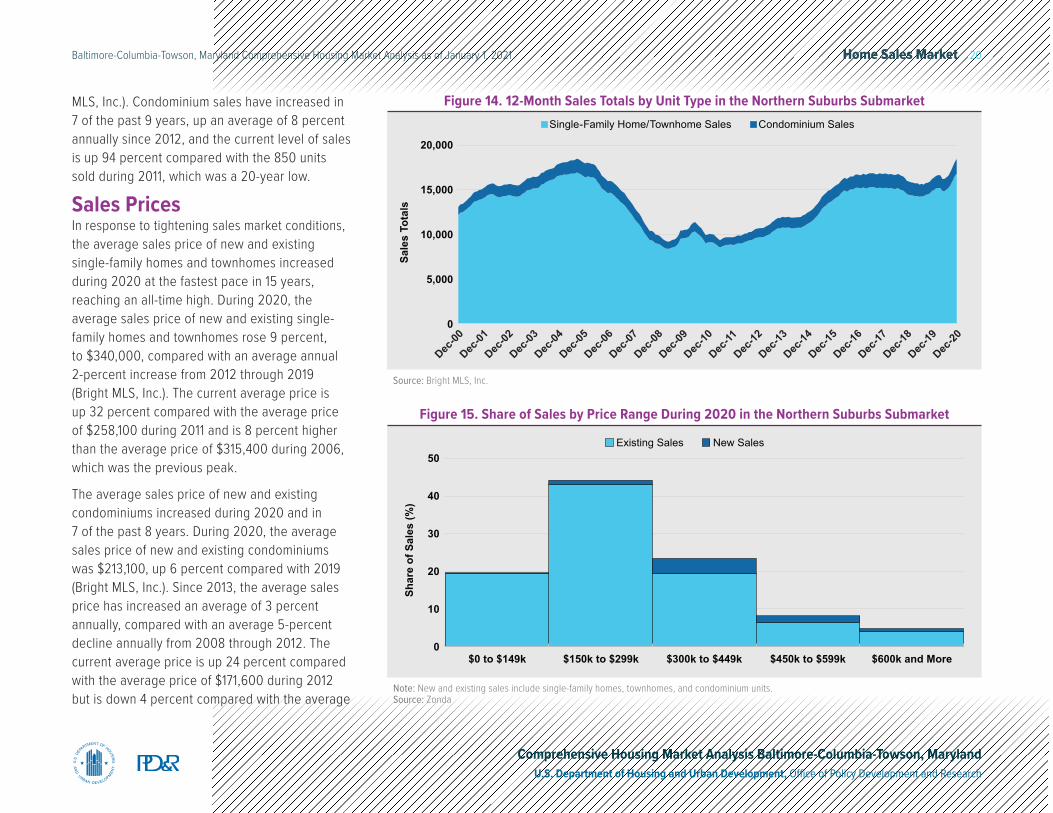
Single-Family Home and Townhome SalesSales of new and existing single-family homes and townhomes increased during the past 2 years, including accelerated growth during the past year. During 2020, approximately 16,800 new and existing single-family homes and townhomes sold, representing an increase of 1,925 homes, or 13 percent, from 2019 (Bright MLS, Inc.). Home sales increased 3 percent during 2019, compared with an average 2-percent decline annually during 2017 and 2018. Following strong growth during the past year, the current level of sales is at an all-time peak and is 2 percent higher than the average of 16,550 homes sold annually during 2004 and 2005, which was the previous highest level. Figure 14 shows the 12-month sales totals by unit type in the submarket since 2000, and Figure 15 shows the shares of new and existing home sales by price range during 2020.
Condominium SalesSales of new and existing condominium units also significantly increased during the past year, and the number of units sold during 2020 was a 20-year peak. During 2020, approximately 1,650 condominium units sold—up by 300 units, or 22 percent, compared with the number of units sold during 2019 (Bright
Home Sales Quick Facts
Northern Suburbs Submarket Baltimore HMAVacancy Rate 1.6% 2.0%
Months of Inventory 0.8 1.0
Total Home Sales 18,450 44,300
1-Year Change 14% 15%
New Home Sales Price $447,000 $514,400
1-Year Change 5% 5%
Existing Home Sales Price $306,700 $331,400
1-Year Change 11% 13%
Mortgage Delinquency Rate 5.6% 5.5%Notes: The vacancy rate is as of the current date; home sales and prices are for the 12 months ending December 2020; months of inventory data are as of December 2020; and mortgage delinquency data are as of November 2020. The current date is January 1, 2021.Sources: Bright MLS, Inc.; CoreLogic, Inc.; Zonda
Table 8. Home Sales Quick Facts in the Northern Suburbs Submarket
Home Sales Market 20Baltimore-Columbia-Towson, Maryland Comprehensive Housing Market Analysis as of January 1, 2021
Comprehensive Housing Market Analysis Baltimore-Columbia-Towson, MarylandU.S. Department of Housing and Urban Development, Office of Policy Development and Research
MLS, Inc.). Condominium sales have increased in 7 of the past 9 years, up an average of 8 percent annually since 2012, and the current level of sales is up 94 percent compared with the 850 units sold during 2011, which was a 20-year low.
Sales PricesIn response to tightening sales market conditions, the average sales price of new and existing single-family homes and townhomes increased during 2020 at the fastest pace in 15 years, reaching an all-time high. During 2020, the average sales price of new and existing single-family homes and townhomes rose 9 percent, to $340,000, compared with an average annual 2-percent increase from 2012 through 2019 (Bright MLS, Inc.). The current average price is up 32 percent compared with the average price of $258,100 during 2011 and is 8 percent higher than the average price of $315,400 during 2006, which was the previous peak.
The average sales price of new and existing condominiums increased during 2020 and in 7 of the past 8 years. During 2020, the average sales price of new and existing condominiums was $213,100, up 6 percent compared with 2019 (Bright MLS, Inc.). Since 2013, the average sales price has increased an average of 3 percent annually, compared with an average 5-percent decline annually from 2008 through 2012. The current average price is up 24 percent compared with the average price of $171,600 during 2012 but is down 4 percent compared with the average
Note: New and existing sales include single-family homes, townhomes, and condominium units.Source: Zonda
Existing Sales New Sales50
40
30
20
10
0$0 to $149k $150k to $299k $300k to $449k $450k to $599k $600k and More
Shar
e of
Sal
es (%
)Figure 15. Share of Sales by Price Range During 2020 in the Northern Suburbs Submarket
Source: Bright MLS, Inc.
Sale
s To
tals
Single-Family Home/Townhome Sales Condominium Sales
Dec-00
Dec-01
Dec-02
Dec-03
Dec-04
Dec-05
Dec-06
Dec-07
Dec-08
Dec-09
Dec-10
Dec-11
Dec-12
Dec-13
Dec-14
Dec-15
Dec-16
Dec-17
Dec-18
Dec-19
Dec-20
20,000
15,000
10,000
5,000
0
Figure 14. 12-Month Sales Totals by Unit Type in the Northern Suburbs Submarket
Home Sales Market 21Baltimore-Columbia-Towson, Maryland Comprehensive Housing Market Analysis as of January 1, 2021
Comprehensive Housing Market Analysis Baltimore-Columbia-Towson, MarylandU.S. Department of Housing and Urban Development, Office of Policy Development and Research
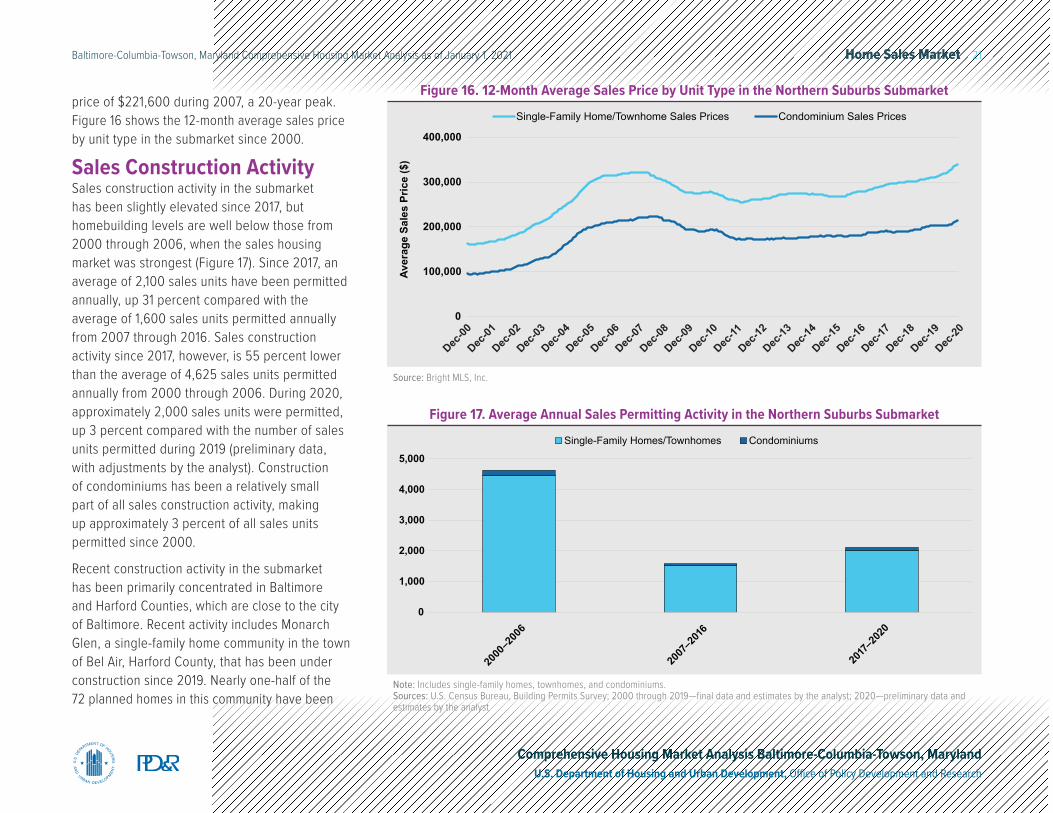
price of $221,600 during 2007, a 20-year peak. Figure 16 shows the 12-month average sales price by unit type in the submarket since 2000.
Sales Construction ActivitySales construction activity in the submarket has been slightly elevated since 2017, but homebuilding levels are well below those from 2000 through 2006, when the sales housing market was strongest (Figure 17). Since 2017, an average of 2,100 sales units have been permitted annually, up 31 percent compared with the average of 1,600 sales units permitted annually from 2007 through 2016. Sales construction activity since 2017, however, is 55 percent lower than the average of 4,625 sales units permitted annually from 2000 through 2006. During 2020, approximately 2,000 sales units were permitted, up 3 percent compared with the number of sales units permitted during 2019 (preliminary data, with adjustments by the analyst). Construction of condominiums has been a relatively small part of all sales construction activity, making up approximately 3 percent of all sales units permitted since 2000.
Recent construction activity in the submarket has been primarily concentrated in Baltimore and Harford Counties, which are close to the city of Baltimore. Recent activity includes Monarch Glen, a single-family home community in the town of Bel Air, Harford County, that has been under construction since 2019. Nearly one-half of the 72 planned homes in this community have been
Source: Bright MLS, Inc.
0
100,000
200,000
300,000
400,000
Aver
age
Sale
s Pr
ice
($)
Single-Family Home/Townhome Sales Prices Condominium Sales Prices
Dec-00
Dec-01
Dec-02
Dec-03
Dec-04
Dec-05
Dec-06
Dec-07
Dec-08
Dec-09
Dec-10
Dec-11
Dec-12
Dec-13
Dec-14
Dec-15
Dec-16
Dec-17
Dec-18
Dec-19
Dec-20
Figure 16. 12-Month Average Sales Price by Unit Type in the Northern Suburbs Submarket
Note: Includes single-family homes, townhomes, and condominiums.Sources: U.S. Census Bureau, Building Permits Survey; 2000 through 2019—final data and estimates by the analyst; 2020—preliminary data and estimates by the analyst
Single-Family Homes/Townhomes Condominiums
2000
–200
6
2007
–201
6
2017
–202
00
1,000
2,000
3,000
4,000
5,000
Figure 17. Average Annual Sales Permitting Activity in the Northern Suburbs Submarket
Home Sales Market 22Baltimore-Columbia-Towson, Maryland Comprehensive Housing Market Analysis as of January 1, 2021
Comprehensive Housing Market Analysis Baltimore-Columbia-Towson, MarylandU.S. Department of Housing and Urban Development, Office of Policy Development and Research
completed, and an additional 20 homes are under construction, with the remaining units expected to be built within the next 2 years. Prices for these four- and five-bedroom single-family homes start at $559,000 and $590,000, respectively. Also in Harford County, Trails at Beech Creek, a single-family home and townhome community in the city of Aberdeen, has been under construction since 2011. More than 80 percent of the 780 planned homes have been completed, with the remaining homes expected to be built during the next 3 years. Prices for the recently completed single-family homes and townhomes in this community start at $302,000 and $278,000, respectively. Greenleigh Townhomes is a townhome community that is currently under construction in Middle River (see Census Designated Place) in Baltimore County. Approximately 55 percent of the 424 planned townhomes have been constructed since 2017, and the remaining homes are expected to be built during the next 3 to 5 years. Prices for these three- and four-bedroom townhomes start at $362,000 and $398,700, respectively.
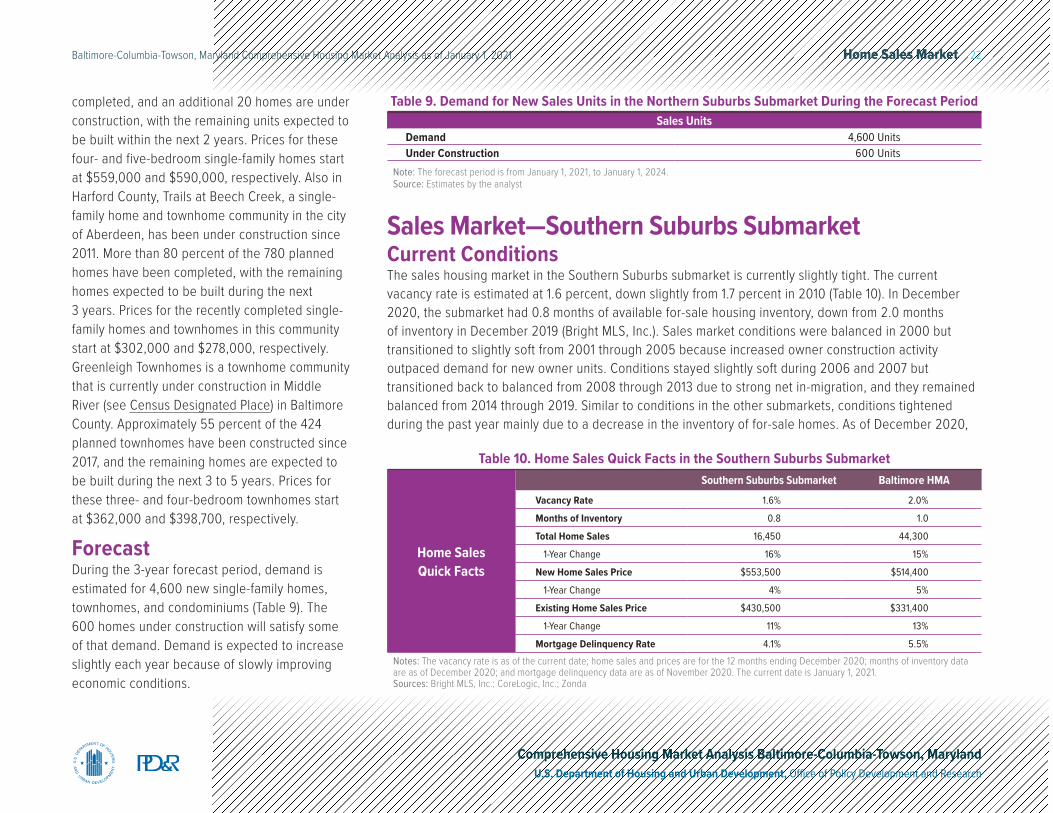
ForecastDuring the 3-year forecast period, demand is estimated for 4,600 new single-family homes, townhomes, and condominiums (Table 9). The 600 homes under construction will satisfy some of that demand. Demand is expected to increase slightly each year because of slowly improving economic conditions.
Table 9. Demand for New Sales Units in the Northern Suburbs Submarket During the Forecast PeriodSales Units
Demand 4,600 UnitsUnder Construction 600 Units
Note: The forecast period is from January 1, 2021, to January 1, 2024.Source: Estimates by the analyst
Sales Market—Southern Suburbs SubmarketCurrent ConditionsThe sales housing market in the Southern Suburbs submarket is currently slightly tight. The current vacancy rate is estimated at 1.6 percent, down slightly from 1.7 percent in 2010 (Table 10). In December 2020, the submarket had 0.8 months of available for-sale housing inventory, down from 2.0 months of inventory in December 2019 (Bright MLS, Inc.). Sales market conditions were balanced in 2000 but transitioned to slightly soft from 2001 through 2005 because increased owner construction activity outpaced demand for new owner units. Conditions stayed slightly soft during 2006 and 2007 but transitioned back to balanced from 2008 through 2013 due to strong net in-migration, and they remained balanced from 2014 through 2019. Similar to conditions in the other submarkets, conditions tightened during the past year mainly due to a decrease in the inventory of for-sale homes. As of December 2020,
Home Sales Quick Facts
Southern Suburbs Submarket Baltimore HMAVacancy Rate 1.6% 2.0%
Months of Inventory 0.8 1.0
Total Home Sales 16,450 44,300
1-Year Change 16% 15%
New Home Sales Price $553,500 $514,400
1-Year Change 4% 5%
Existing Home Sales Price $430,500 $331,400
1-Year Change 11% 13%
Mortgage Delinquency Rate 4.1% 5.5%Notes: The vacancy rate is as of the current date; home sales and prices are for the 12 months ending December 2020; months of inventory data are as of December 2020; and mortgage delinquency data are as of November 2020. The current date is January 1, 2021.Sources: Bright MLS, Inc.; CoreLogic, Inc.; Zonda
Table 10. Home Sales Quick Facts in the Southern Suburbs Submarket
Home Sales Market 23Baltimore-Columbia-Towson, Maryland Comprehensive Housing Market Analysis as of January 1, 2021
Comprehensive Housing Market Analysis Baltimore-Columbia-Towson, MarylandU.S. Department of Housing and Urban Development, Office of Policy Development and Research
there were approximately 1,125 new and existing homes for sale, down 53 percent compared with the number of homes for sale in December 2019 (Bright MLS, Inc.).
REO Properties and Delinquent MortgagesThe rate of seriously delinquent home loans and REO properties in the Southern Suburbs submarket is typically the lowest of the three submarkets. The rate in the submarket is similar to the national rate. In December 2020, 4.0 percent of home loans in the submarket were seriously delinquent or had transitioned into REO status—up from 1.2 percent in December 2019 (CoreLogic, Inc.). The increased rate in the submarket was due to the number of home loans that were 90 or more days delinquent increasing more than 350 percent during the past year.
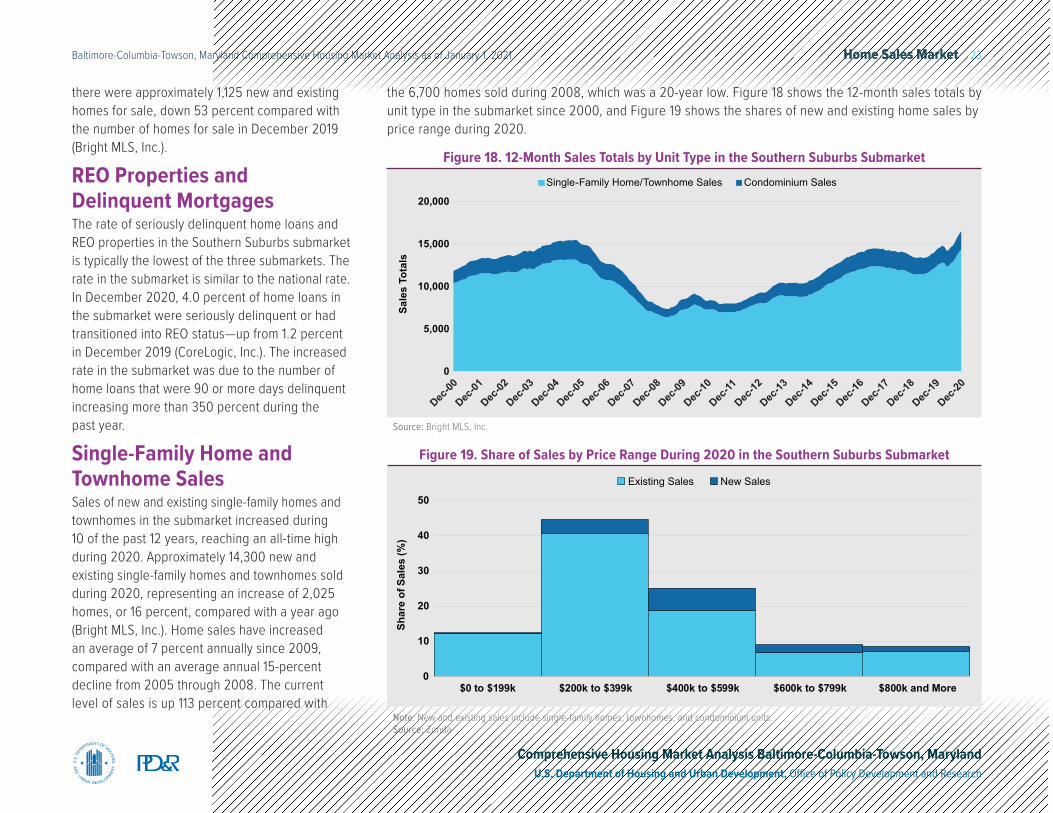
Single-Family Home and Townhome SalesSales of new and existing single-family homes and townhomes in the submarket increased during 10 of the past 12 years, reaching an all-time high during 2020. Approximately 14,300 new and existing single-family homes and townhomes sold during 2020, representing an increase of 2,025 homes, or 16 percent, compared with a year ago (Bright MLS, Inc.). Home sales have increased an average of 7 percent annually since 2009, compared with an average annual 15-percent decline from 2005 through 2008. The current level of sales is up 113 percent compared with
the 6,700 homes sold during 2008, which was a 20-year low. Figure 18 shows the 12-month sales totals by unit type in the submarket since 2000, and Figure 19 shows the shares of new and existing home sales by price range during 2020.
Note: New and existing sales include single-family homes, townhomes, and condominium units.Source: Zonda
Existing Sales New Sales
0
10
20
30
40
50
$0 to $199k $200k to $399k $400k to $599k $600k to $799k $800k and More
Shar
e of
Sal
es (%
)
Figure 19. Share of Sales by Price Range During 2020 in the Southern Suburbs Submarket
Source: Bright MLS, Inc.
Sale
s To
tals
Single-Family Home/Townhome Sales Condominium Sales
Dec-00
Dec-01
Dec-02
Dec-03
Dec-04
Dec-05
Dec-06
Dec-07
Dec-08
Dec-09
Dec-10
Dec-11
Dec-12
Dec-13
Dec-14
Dec-15
Dec-16
Dec-17
Dec-18
Dec-19
Dec-20
20,000
15,000
10,000
5,000
0
Figure 18. 12-Month Sales Totals by Unit Type in the Southern Suburbs Submarket
Home Sales Market 24Baltimore-Columbia-Towson, Maryland Comprehensive Housing Market Analysis as of January 1, 2021
Comprehensive Housing Market Analysis Baltimore-Columbia-Towson, MarylandU.S. Department of Housing and Urban Development, Office of Policy Development and Research
Condominium SalesSales of new and existing condominiums increased during the past year and 9 of the past 10 years. During 2020, approximately 2,150 new and existing condominium units sold—up by 270 units, or 14 percent, compared with a decrease of 170 units, or 8 percent, a year ago (Bright MLS, Inc.). Since 2012, condominium sales have increased an average of 9 percent annually, compared with an average annual 13-percent decrease from 2006 through 2011. The current level of sales is up 115 percent compared with the 1,000 units sold during 2011 but is down 7 percent compared with the 20-year peak level of 2,300 units sold during 2005.
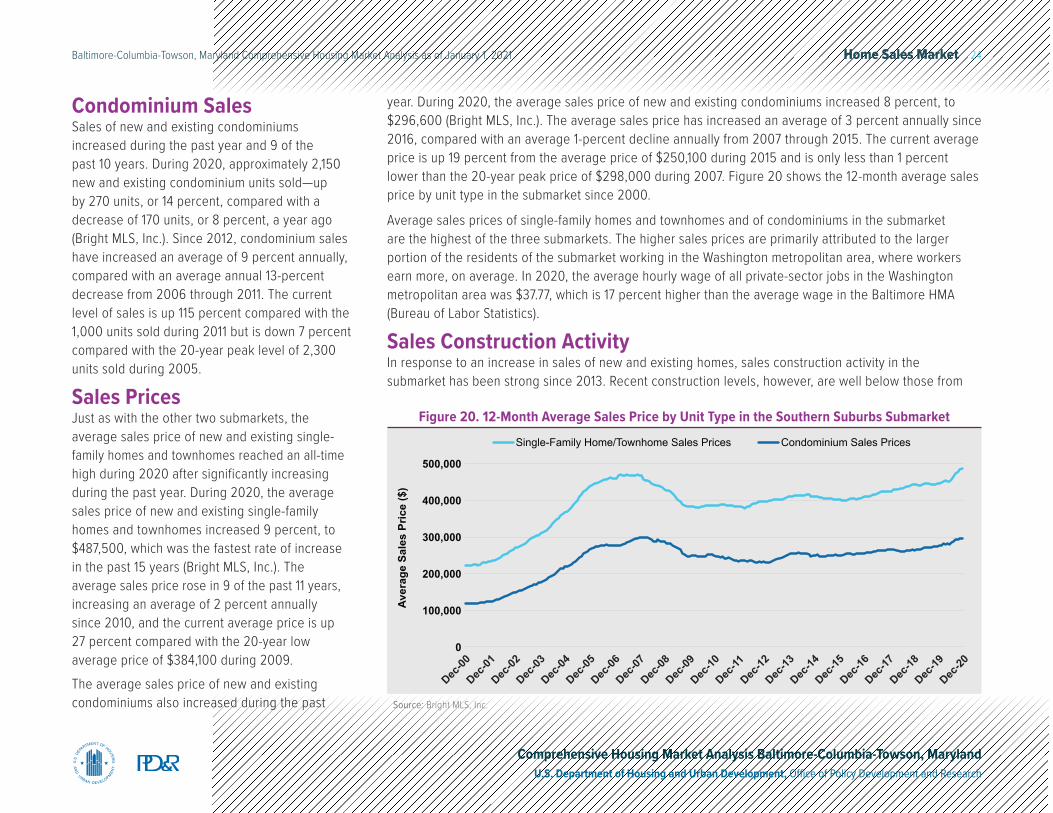
Sales PricesJust as with the other two submarkets, the average sales price of new and existing single-family homes and townhomes reached an all-time high during 2020 after significantly increasing during the past year. During 2020, the average sales price of new and existing single-family homes and townhomes increased 9 percent, to $487,500, which was the fastest rate of increase in the past 15 years (Bright MLS, Inc.). The average sales price rose in 9 of the past 11 years, increasing an average of 2 percent annually since 2010, and the current average price is up 27 percent compared with the 20-year low average price of $384,100 during 2009.The average sales price of new and existing condominiums also increased during the past
year. During 2020, the average sales price of new and existing condominiums increased 8 percent, to $296,600 (Bright MLS, Inc.). The average sales price has increased an average of 3 percent annually since 2016, compared with an average 1-percent decline annually from 2007 through 2015. The current average price is up 19 percent from the average price of $250,100 during 2015 and is only less than 1 percent lower than the 20-year peak price of $298,000 during 2007. Figure 20 shows the 12-month average sales price by unit type in the submarket since 2000.
Average sales prices of single-family homes and townhomes and of condominiums in the submarket are the highest of the three submarkets. The higher sales prices are primarily attributed to the larger portion of the residents of the submarket working in the Washington metropolitan area, where workers earn more, on average. In 2020, the average hourly wage of all private-sector jobs in the Washington metropolitan area was $37.77, which is 17 percent higher than the average wage in the Baltimore HMA (Bureau of Labor Statistics).
Sales Construction ActivityIn response to an increase in sales of new and existing homes, sales construction activity in the submarket has been strong since 2013. Recent construction levels, however, are well below those from
Source: Bright MLS, Inc.
500,000
400,000
300,000
200,000
100,000
0
Aver
age
Sale
s Pr
ice
($)
Single-Family Home/Townhome Sales Prices Condominium Sales Prices
Dec-00
Dec-01
Dec-02
Dec-03
Dec-04
Dec-05
Dec-06
Dec-07
Dec-08
Dec-09
Dec-10
Dec-11
Dec-12
Dec-13
Dec-14
Dec-15
Dec-16
Dec-17
Dec-18
Dec-19
Dec-20
Figure 20. 12-Month Average Sales Price by Unit Type in the Southern Suburbs Submarket
Home Sales Market 25Baltimore-Columbia-Towson, Maryland Comprehensive Housing Market Analysis as of January 1, 2021
Comprehensive Housing Market Analysis Baltimore-Columbia-Towson, MarylandU.S. Department of Housing and Urban Development, Office of Policy Development and Research
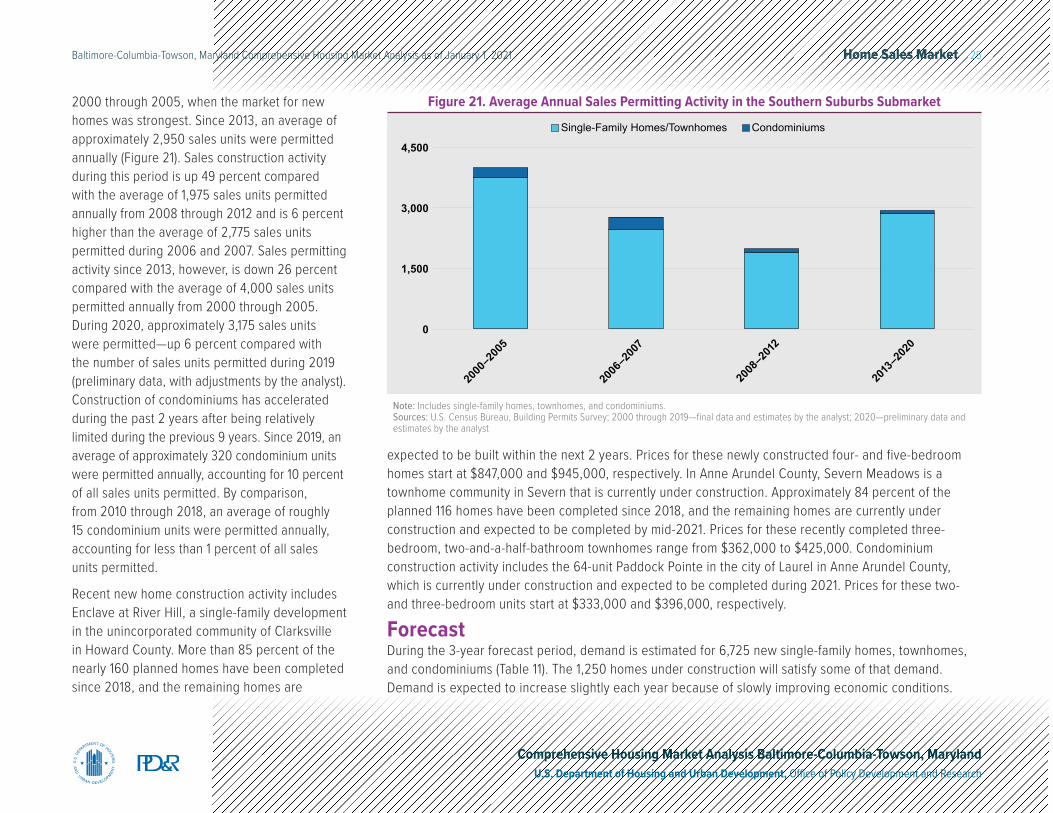
2000 through 2005, when the market for new homes was strongest. Since 2013, an average of approximately 2,950 sales units were permitted annually (Figure 21). Sales construction activity during this period is up 49 percent compared with the average of 1,975 sales units permitted annually from 2008 through 2012 and is 6 percent higher than the average of 2,775 sales units permitted during 2006 and 2007. Sales permitting activity since 2013, however, is down 26 percent compared with the average of 4,000 sales units permitted annually from 2000 through 2005. During 2020, approximately 3,175 sales units were permitted—up 6 percent compared with the number of sales units permitted during 2019 (preliminary data, with adjustments by the analyst). Construction of condominiums has accelerated during the past 2 years after being relatively limited during the previous 9 years. Since 2019, an average of approximately 320 condominium units were permitted annually, accounting for 10 percent of all sales units permitted. By comparison, from 2010 through 2018, an average of roughly 15 condominium units were permitted annually, accounting for less than 1 percent of all sales units permitted.
Recent new home construction activity includes Enclave at River Hill, a single-family development in the unincorporated community of Clarksville in Howard County. More than 85 percent of the nearly 160 planned homes have been completed since 2018, and the remaining homes are
Note: Includes single-family homes, townhomes, and condominiums.Sources: U.S. Census Bureau, Building Permits Survey; 2000 through 2019—final data and estimates by the analyst; 2020—preliminary data and estimates by the analyst
Single-Family Homes/Townhomes Condominiums
4,500
3,000
1,500
0
2000
–200
5
2006
–200
7
2008
–201
2
2013
–202
0
Figure 21. Average Annual Sales Permitting Activity in the Southern Suburbs Submarket
expected to be built within the next 2 years. Prices for these newly constructed four- and five-bedroom homes start at $847,000 and $945,000, respectively. In Anne Arundel County, Severn Meadows is a townhome community in Severn that is currently under construction. Approximately 84 percent of the planned 116 homes have been completed since 2018, and the remaining homes are currently under construction and expected to be completed by mid-2021. Prices for these recently completed three-bedroom, two-and-a-half-bathroom townhomes range from $362,000 to $425,000. Condominium construction activity includes the 64-unit Paddock Pointe in the city of Laurel in Anne Arundel County, which is currently under construction and expected to be completed during 2021. Prices for these two- and three-bedroom units start at $333,000 and $396,000, respectively.
ForecastDuring the 3-year forecast period, demand is estimated for 6,725 new single-family homes, townhomes, and condominiums (Table 11). The 1,250 homes under construction will satisfy some of that demand. Demand is expected to increase slightly each year because of slowly improving economic conditions.
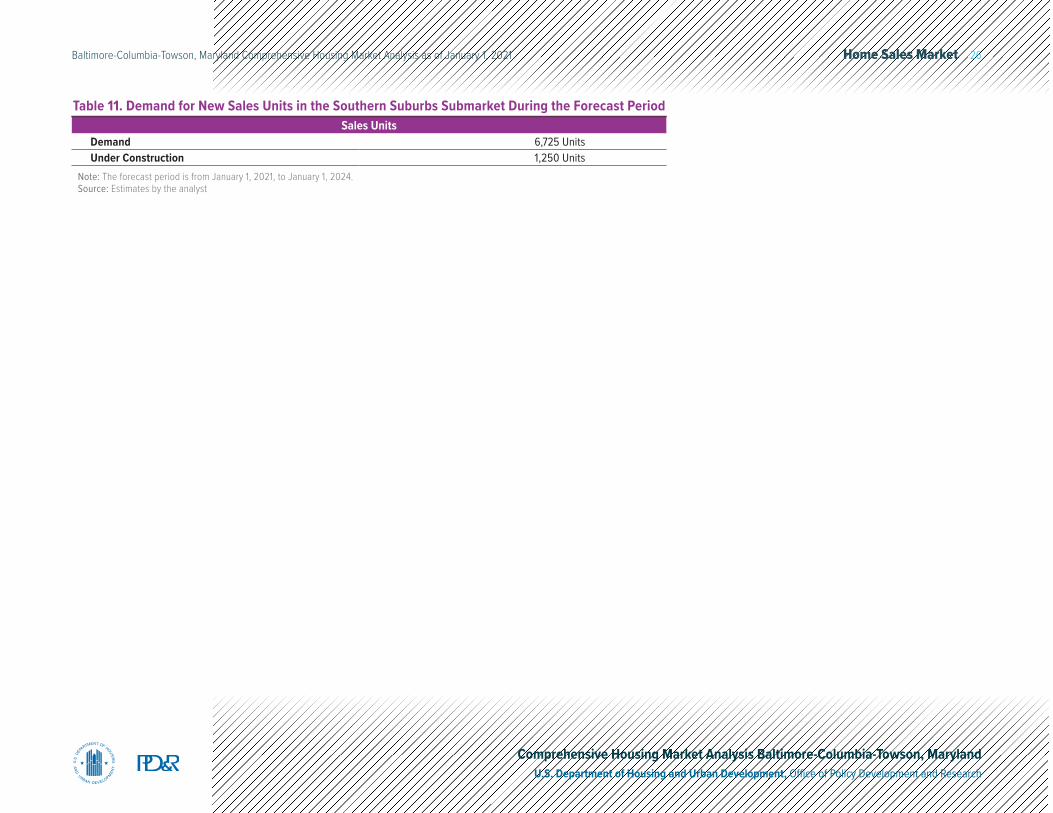
Home Sales Market 26Baltimore-Columbia-Towson, Maryland Comprehensive Housing Market Analysis as of January 1, 2021
Comprehensive Housing Market Analysis Baltimore-Columbia-Towson, MarylandU.S. Department of Housing and Urban Development, Office of Policy Development and Research
Table 11. Demand for New Sales Units in the Southern Suburbs Submarket During the Forecast PeriodSales Units
Demand 6,725 UnitsUnder Construction 1,250 Units
Note: The forecast period is from January 1, 2021, to January 1, 2024.Source: Estimates by the analyst
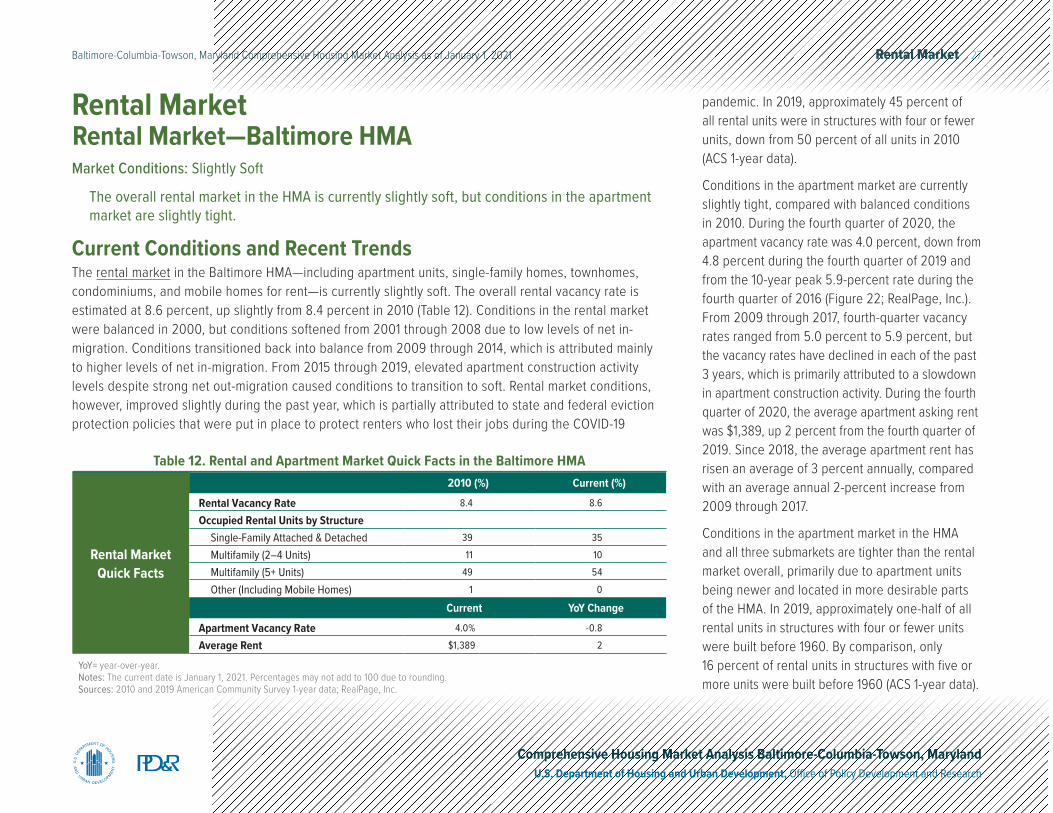
Rental Market 27Baltimore-Columbia-Towson, Maryland Comprehensive Housing Market Analysis as of January 1, 2021
Comprehensive Housing Market Analysis Baltimore-Columbia-Towson, MarylandU.S. Department of Housing and Urban Development, Office of Policy Development and Research
Rental Market
Market Conditions: Slightly Soft
The overall rental market in the HMA is currently slightly soft, but conditions in the apartment market are slightly tight.
Current Conditions and Recent TrendsThe rental market in the Baltimore HMA—including apartment units, single-family homes, townhomes, condominiums, and mobile homes for rent—is currently slightly soft. The overall rental vacancy rate is estimated at 8.6 percent, up slightly from 8.4 percent in 2010 (Table 12). Conditions in the rental market were balanced in 2000, but conditions softened from 2001 through 2008 due to low levels of net in-migration. Conditions transitioned back into balance from 2009 through 2014, which is attributed mainly to higher levels of net in-migration. From 2015 through 2019, elevated apartment construction activity levels despite strong net out-migration caused conditions to transition to soft. Rental market conditions, however, improved slightly during the past year, which is partially attributed to state and federal eviction protection policies that were put in place to protect renters who lost their jobs during the COVID-19
Rental Market Quick Facts
2010 (%) Current (%)
Rental Vacancy Rate 8.4 8.6
Occupied Rental Units by StructureSingle-Family Attached & Detached 39 35
Multifamily (2–4 Units) 11 10
Multifamily (5+ Units) 49 54
Other (Including Mobile Homes) 1 0
Current YoY Change
Apartment Vacancy Rate 4.0% -0.8
Average Rent $1,389 2
YoY= year-over-year.Notes: The current date is January 1, 2021. Percentages may not add to 100 due to rounding.Sources: 2010 and 2019 American Community Survey 1-year data; RealPage, Inc.
Table 12. Rental and Apartment Market Quick Facts in the Baltimore HMA
pandemic. In 2019, approximately 45 percent of all rental units were in structures with four or fewer units, down from 50 percent of all units in 2010 (ACS 1-year data).
Conditions in the apartment market are currently slightly tight, compared with balanced conditions in 2010. During the fourth quarter of 2020, the apartment vacancy rate was 4.0 percent, down from 4.8 percent during the fourth quarter of 2019 and from the 10-year peak 5.9-percent rate during the fourth quarter of 2016 (Figure 22; RealPage, Inc.). From 2009 through 2017, fourth-quarter vacancy rates ranged from 5.0 percent to 5.9 percent, but the vacancy rates have declined in each of the past 3 years, which is primarily attributed to a slowdown in apartment construction activity. During the fourth quarter of 2020, the average apartment asking rent was $1,389, up 2 percent from the fourth quarter of 2019. Since 2018, the average apartment rent has risen an average of 3 percent annually, compared with an average annual 2-percent increase from 2009 through 2017.
Conditions in the apartment market in the HMA and all three submarkets are tighter than the rental market overall, primarily due to apartment units being newer and located in more desirable parts of the HMA. In 2019, approximately one-half of all rental units in structures with four or fewer units were built before 1960. By comparison, only 16 percent of rental units in structures with five or more units were built before 1960 (ACS 1-year data).
Rental Market—Baltimore HMA
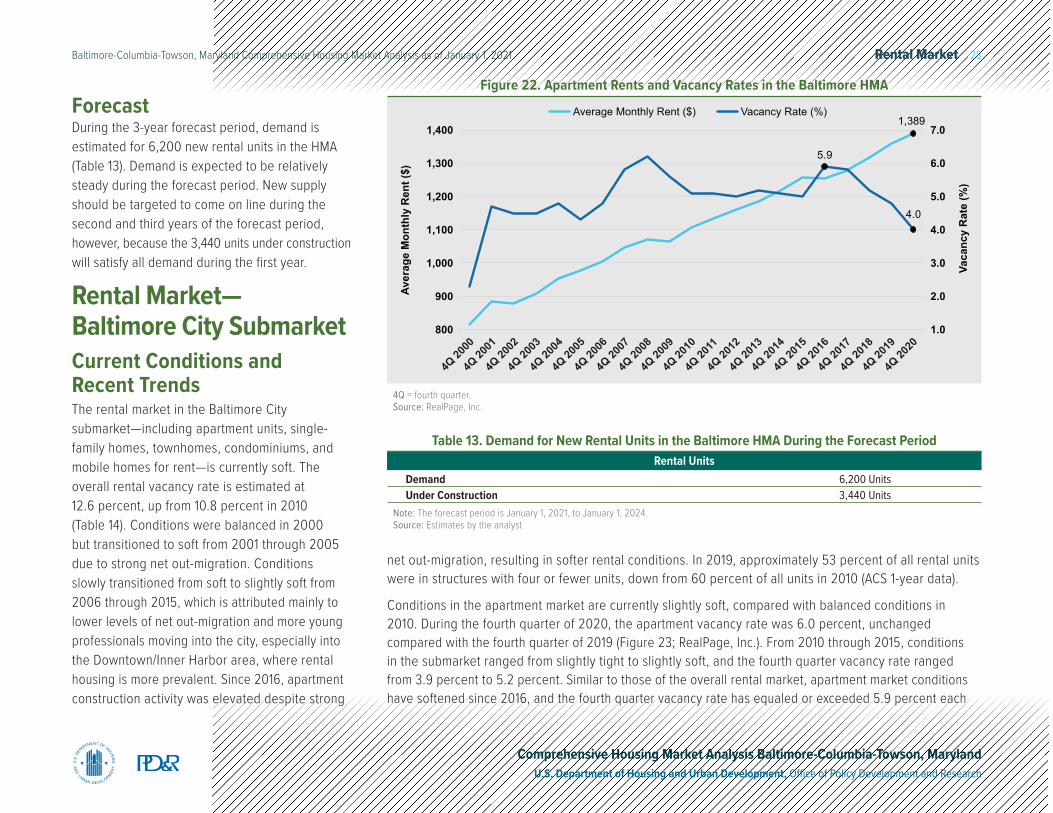
Rental Market 28Baltimore-Columbia-Towson, Maryland Comprehensive Housing Market Analysis as of January 1, 2021
Comprehensive Housing Market Analysis Baltimore-Columbia-Towson, MarylandU.S. Department of Housing and Urban Development, Office of Policy Development and Research
4Q = fourth quarter.Source: RealPage, Inc.
1,389
5.9
4.0
7.0
6.0
5.0
4.0
3.0
2.0
1.0
1,400
1,300
1,200
1,100
1,000
900
800
Vaca
ncy
Rat
e (%
)
Aver
age
Mon
thly
Ren
t ($)
Average Monthly Rent ($) Vacancy Rate (%)
4Q 20
00
4Q 20
01
4Q 20
02
4Q 20
03
4Q 20
04
4Q 20
05
4Q 20
06
4Q 20
07
4Q 20
08
4Q 20
09
4Q 20
10
4Q 20
11
4Q 20
12
4Q 20
13
4Q 20
14
4Q 20
15
4Q 20
16
4Q 20
17
4Q 20
18
4Q 20
19
4Q 20
20
Figure 22. Apartment Rents and Vacancy Rates in the Baltimore HMAForecastDuring the 3-year forecast period, demand is estimated for 6,200 new rental units in the HMA (Table 13). Demand is expected to be relatively steady during the forecast period. New supply should be targeted to come on line during the second and third years of the forecast period, however, because the 3,440 units under construction will satisfy all demand during the first year.
Rental Market— Baltimore City Submarket Current Conditions and Recent TrendsThe rental market in the Baltimore City submarket—including apartment units, single-family homes, townhomes, condominiums, and mobile homes for rent—is currently soft. The overall rental vacancy rate is estimated at 12.6 percent, up from 10.8 percent in 2010 (Table 14). Conditions were balanced in 2000 but transitioned to soft from 2001 through 2005 due to strong net out-migration. Conditions slowly transitioned from soft to slightly soft from 2006 through 2015, which is attributed mainly to lower levels of net out-migration and more young professionals moving into the city, especially into the Downtown/Inner Harbor area, where rental housing is more prevalent. Since 2016, apartment construction activity was elevated despite strong
Note: The forecast period is January 1, 2021, to January 1, 2024.Source: Estimates by the analyst
Rental UnitsDemand 6,200 UnitsUnder Construction 3,440 Units
Table 13. Demand for New Rental Units in the Baltimore HMA During the Forecast Period
net out-migration, resulting in softer rental conditions. In 2019, approximately 53 percent of all rental units were in structures with four or fewer units, down from 60 percent of all units in 2010 (ACS 1-year data).
Conditions in the apartment market are currently slightly soft, compared with balanced conditions in 2010. During the fourth quarter of 2020, the apartment vacancy rate was 6.0 percent, unchanged compared with the fourth quarter of 2019 (Figure 23; RealPage, Inc.). From 2010 through 2015, conditions in the submarket ranged from slightly tight to slightly soft, and the fourth quarter vacancy rate ranged from 3.9 percent to 5.2 percent. Similar to those of the overall rental market, apartment market conditions have softened since 2016, and the fourth quarter vacancy rate has equaled or exceeded 5.9 percent each
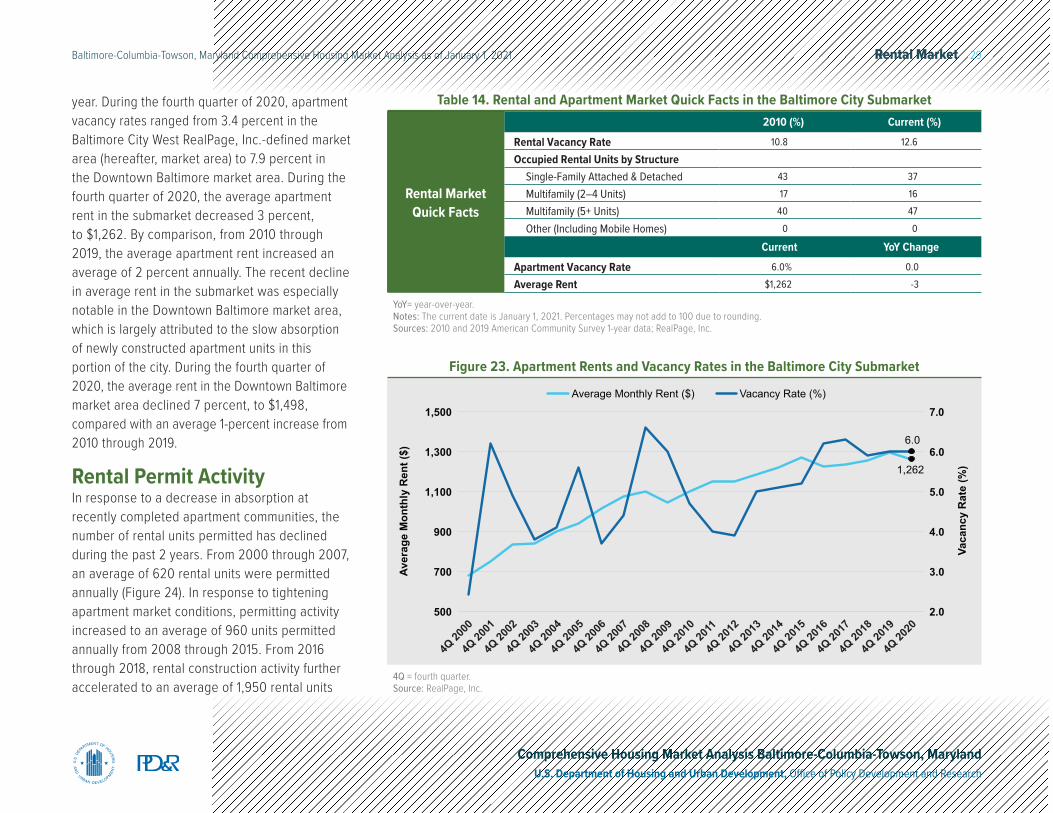
Rental Market 29Baltimore-Columbia-Towson, Maryland Comprehensive Housing Market Analysis as of January 1, 2021
Comprehensive Housing Market Analysis Baltimore-Columbia-Towson, MarylandU.S. Department of Housing and Urban Development, Office of Policy Development and Research
Rental Market Quick Facts
2010 (%) Current (%)
Rental Vacancy Rate 10.8 12.6
Occupied Rental Units by StructureSingle-Family Attached & Detached 43 37
Multifamily (2–4 Units) 17 16
Multifamily (5+ Units) 40 47
Other (Including Mobile Homes) 0 0
Current YoY Change
Apartment Vacancy Rate 6.0% 0.0
Average Rent $1,262 -3
YoY= year-over-year.Notes: The current date is January 1, 2021. Percentages may not add to 100 due to rounding.Sources: 2010 and 2019 American Community Survey 1-year data; RealPage, Inc.
Table 14. Rental and Apartment Market Quick Facts in the Baltimore City Submarketyear. During the fourth quarter of 2020, apartment vacancy rates ranged from 3.4 percent in the Baltimore City West RealPage, Inc.-defined market area (hereafter, market area) to 7.9 percent in the Downtown Baltimore market area. During the fourth quarter of 2020, the average apartment rent in the submarket decreased 3 percent, to $1,262. By comparison, from 2010 through 2019, the average apartment rent increased an average of 2 percent annually. The recent decline in average rent in the submarket was especially notable in the Downtown Baltimore market area, which is largely attributed to the slow absorption of newly constructed apartment units in this portion of the city. During the fourth quarter of 2020, the average rent in the Downtown Baltimore market area declined 7 percent, to $1,498, compared with an average 1-percent increase from 2010 through 2019.
Rental Permit ActivityIn response to a decrease in absorption at recently completed apartment communities, the number of rental units permitted has declined during the past 2 years. From 2000 through 2007, an average of 620 rental units were permitted annually (Figure 24). In response to tightening apartment market conditions, permitting activity increased to an average of 960 units permitted annually from 2008 through 2015. From 2016 through 2018, rental construction activity further accelerated to an average of 1,950 rental units
4Q = fourth quarter.Source: RealPage, Inc.
7.0
6.0
5.0
4.0
3.0
2.0
1,500
1,300
1,100
900
700
500
Vaca
ncy
Rat
e (%
)
Aver
age
Mon
thly
Ren
t ($)
Average Monthly Rent ($) Vacancy Rate (%)
4Q 20
00
4Q 20
01
4Q 20
02
4Q 20
03
4Q 20
04
4Q 20
05
4Q 20
06
4Q 20
07
4Q 20
08
4Q 20
09
4Q 20
10
4Q 20
11
4Q 20
12
4Q 20
13
4Q 20
14
4Q 20
15
4Q 20
16
4Q 20
17
4Q 20
18
4Q 20
19
4Q 20
20
1,262
6.0
Figure 23. Apartment Rents and Vacancy Rates in the Baltimore City Submarket
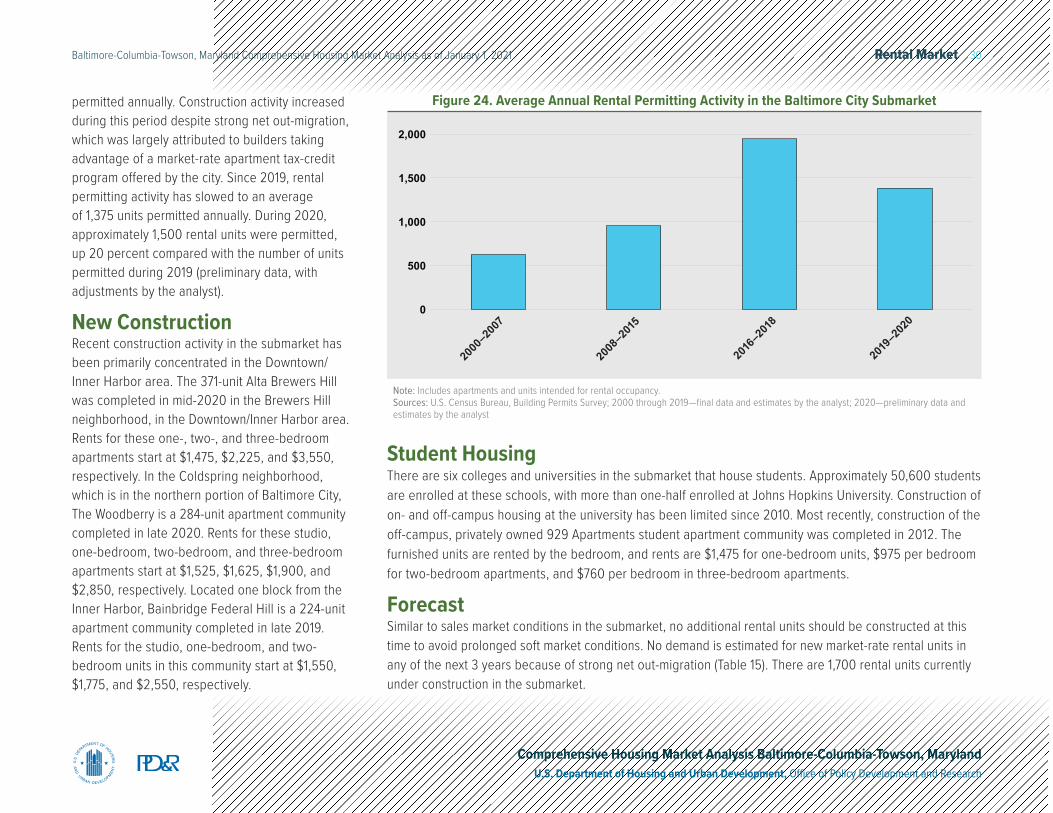
Rental Market 30Baltimore-Columbia-Towson, Maryland Comprehensive Housing Market Analysis as of January 1, 2021
Comprehensive Housing Market Analysis Baltimore-Columbia-Towson, MarylandU.S. Department of Housing and Urban Development, Office of Policy Development and Research
permitted annually. Construction activity increased during this period despite strong net out-migration, which was largely attributed to builders taking advantage of a market-rate apartment tax-credit program offered by the city. Since 2019, rental permitting activity has slowed to an average of 1,375 units permitted annually. During 2020, approximately 1,500 rental units were permitted, up 20 percent compared with the number of units permitted during 2019 (preliminary data, with adjustments by the analyst).
New ConstructionRecent construction activity in the submarket has been primarily concentrated in the Downtown/Inner Harbor area. The 371-unit Alta Brewers Hill was completed in mid-2020 in the Brewers Hill neighborhood, in the Downtown/Inner Harbor area. Rents for these one-, two-, and three-bedroom apartments start at $1,475, $2,225, and $3,550, respectively. In the Coldspring neighborhood, which is in the northern portion of Baltimore City, The Woodberry is a 284-unit apartment community completed in late 2020. Rents for these studio, one-bedroom, two-bedroom, and three-bedroom apartments start at $1,525, $1,625, $1,900, and $2,850, respectively. Located one block from the Inner Harbor, Bainbridge Federal Hill is a 224-unit apartment community completed in late 2019. Rents for the studio, one-bedroom, and two-bedroom units in this community start at $1,550, $1,775, and $2,550, respectively.
Note: Includes apartments and units intended for rental occupancy.Sources: U.S. Census Bureau, Building Permits Survey; 2000 through 2019—final data and estimates by the analyst; 2020—preliminary data and estimates by the analyst
2000
–200
7
2008
–201
5
2016
–201
8
2019
–202
0
2,000
1,500
1,000
500
0
Figure 24. Average Annual Rental Permitting Activity in the Baltimore City Submarket
Student HousingThere are six colleges and universities in the submarket that house students. Approximately 50,600 students are enrolled at these schools, with more than one-half enrolled at Johns Hopkins University. Construction of on- and off-campus housing at the university has been limited since 2010. Most recently, construction of the off-campus, privately owned 929 Apartments student apartment community was completed in 2012. The furnished units are rented by the bedroom, and rents are $1,475 for one-bedroom units, $975 per bedroom for two-bedroom apartments, and $760 per bedroom in three-bedroom apartments.
ForecastSimilar to sales market conditions in the submarket, no additional rental units should be constructed at this time to avoid prolonged soft market conditions. No demand is estimated for new market-rate rental units in any of the next 3 years because of strong net out-migration (Table 15). There are 1,700 rental units currently under construction in the submarket.
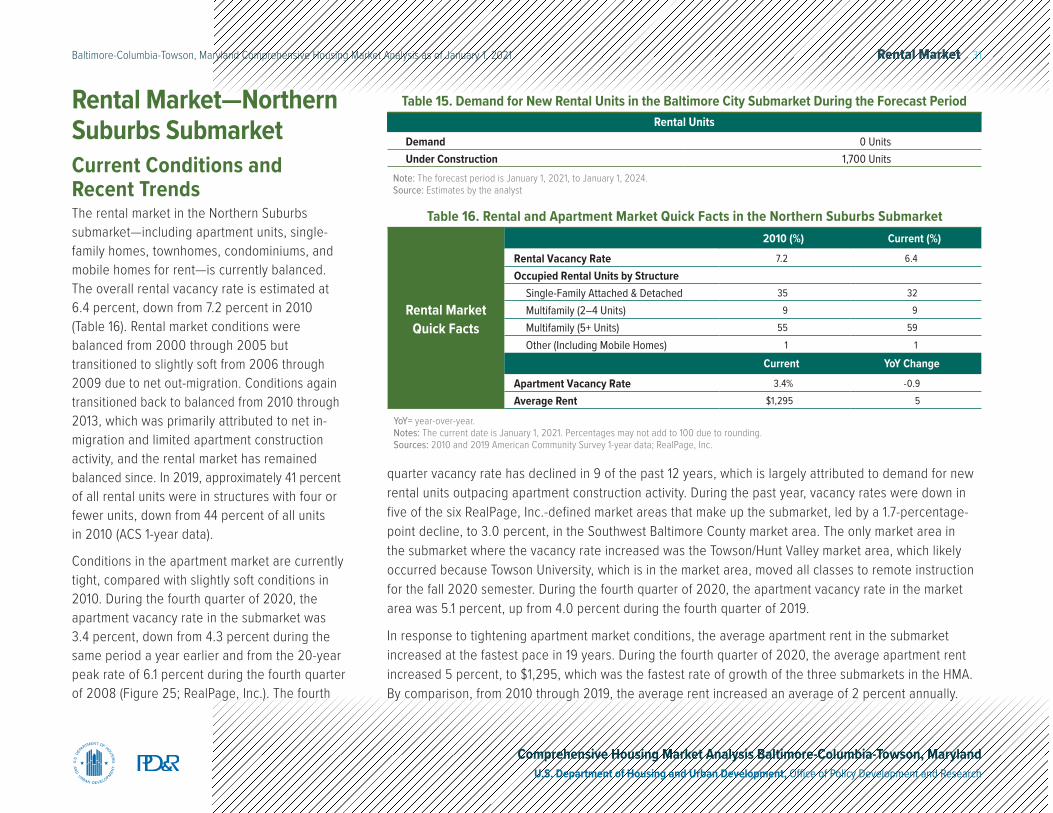
Rental Market 31Baltimore-Columbia-Towson, Maryland Comprehensive Housing Market Analysis as of January 1, 2021
Comprehensive Housing Market Analysis Baltimore-Columbia-Towson, MarylandU.S. Department of Housing and Urban Development, Office of Policy Development and Research
Rental Market—Northern Suburbs Submarket Current Conditions and Recent TrendsThe rental market in the Northern Suburbs submarket—including apartment units, single-family homes, townhomes, condominiums, and mobile homes for rent—is currently balanced. The overall rental vacancy rate is estimated at 6.4 percent, down from 7.2 percent in 2010 (Table 16). Rental market conditions were balanced from 2000 through 2005 but transitioned to slightly soft from 2006 through 2009 due to net out-migration. Conditions again transitioned back to balanced from 2010 through 2013, which was primarily attributed to net in-migration and limited apartment construction activity, and the rental market has remained balanced since. In 2019, approximately 41 percent of all rental units were in structures with four or fewer units, down from 44 percent of all units in 2010 (ACS 1-year data).
Conditions in the apartment market are currently tight, compared with slightly soft conditions in 2010. During the fourth quarter of 2020, the apartment vacancy rate in the submarket was 3.4 percent, down from 4.3 percent during the same period a year earlier and from the 20-year peak rate of 6.1 percent during the fourth quarter of 2008 (Figure 25; RealPage, Inc.). The fourth
Note: The forecast period is January 1, 2021, to January 1, 2024.Source: Estimates by the analyst
Rental UnitsDemand 0 UnitsUnder Construction 1,700 Units
Table 15. Demand for New Rental Units in the Baltimore City Submarket During the Forecast Period
quarter vacancy rate has declined in 9 of the past 12 years, which is largely attributed to demand for new rental units outpacing apartment construction activity. During the past year, vacancy rates were down in five of the six RealPage, Inc.-defined market areas that make up the submarket, led by a 1.7-percentage-point decline, to 3.0 percent, in the Southwest Baltimore County market area. The only market area in the submarket where the vacancy rate increased was the Towson/Hunt Valley market area, which likely occurred because Towson University, which is in the market area, moved all classes to remote instruction for the fall 2020 semester. During the fourth quarter of 2020, the apartment vacancy rate in the market area was 5.1 percent, up from 4.0 percent during the fourth quarter of 2019.
In response to tightening apartment market conditions, the average apartment rent in the submarket increased at the fastest pace in 19 years. During the fourth quarter of 2020, the average apartment rent increased 5 percent, to $1,295, which was the fastest rate of growth of the three submarkets in the HMA. By comparison, from 2010 through 2019, the average rent increased an average of 2 percent annually.
Rental Market Quick Facts
2010 (%) Current (%)
Rental Vacancy Rate 7.2 6.4
Occupied Rental Units by StructureSingle-Family Attached & Detached 35 32
Multifamily (2–4 Units) 9 9
Multifamily (5+ Units) 55 59
Other (Including Mobile Homes) 1 1
Current YoY Change
Apartment Vacancy Rate 3.4% -0.9
Average Rent $1,295 5
YoY= year-over-year.Notes: The current date is January 1, 2021. Percentages may not add to 100 due to rounding.Sources: 2010 and 2019 American Community Survey 1-year data; RealPage, Inc.
Table 16. Rental and Apartment Market Quick Facts in the Northern Suburbs Submarket
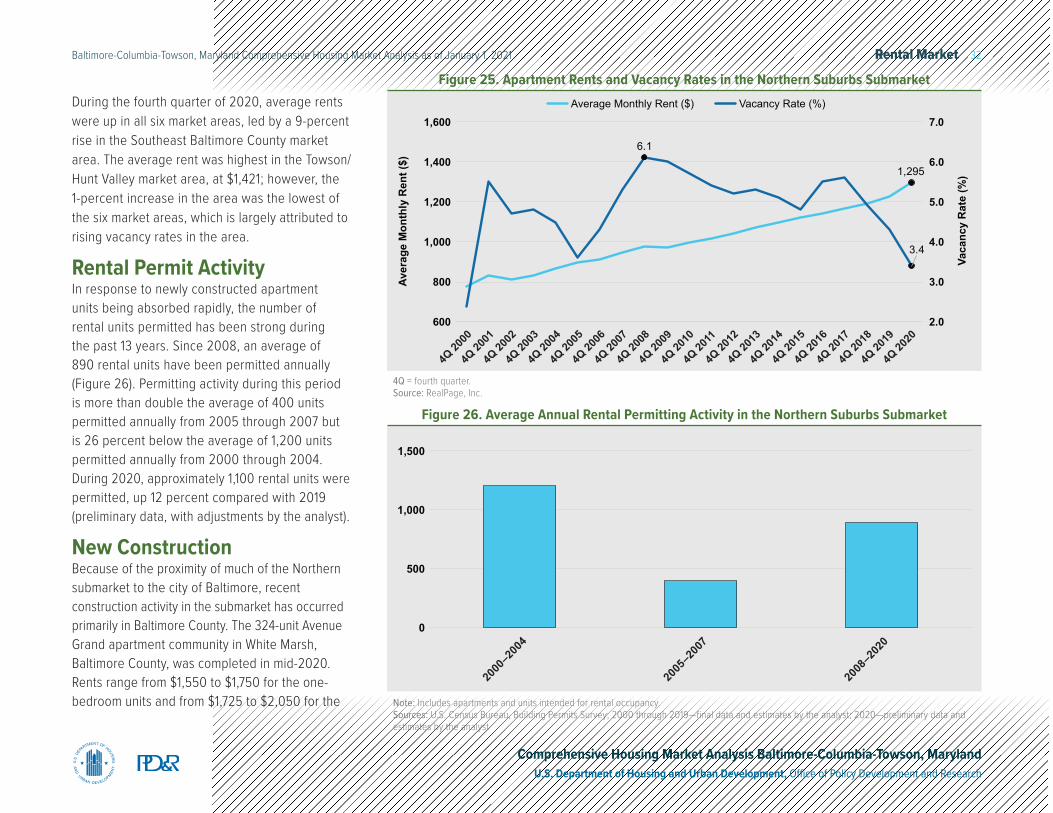
Rental Market 32Baltimore-Columbia-Towson, Maryland Comprehensive Housing Market Analysis as of January 1, 2021
Comprehensive Housing Market Analysis Baltimore-Columbia-Towson, MarylandU.S. Department of Housing and Urban Development, Office of Policy Development and Research
During the fourth quarter of 2020, average rents were up in all six market areas, led by a 9-percent rise in the Southeast Baltimore County market area. The average rent was highest in the Towson/Hunt Valley market area, at $1,421; however, the 1-percent increase in the area was the lowest of the six market areas, which is largely attributed to rising vacancy rates in the area.
Rental Permit ActivityIn response to newly constructed apartment units being absorbed rapidly, the number of rental units permitted has been strong during the past 13 years. Since 2008, an average of 890 rental units have been permitted annually (Figure 26). Permitting activity during this period is more than double the average of 400 units permitted annually from 2005 through 2007 but is 26 percent below the average of 1,200 units permitted annually from 2000 through 2004. During 2020, approximately 1,100 rental units were permitted, up 12 percent compared with 2019 (preliminary data, with adjustments by the analyst).
New ConstructionBecause of the proximity of much of the Northern submarket to the city of Baltimore, recent construction activity in the submarket has occurred primarily in Baltimore County. The 324-unit Avenue Grand apartment community in White Marsh, Baltimore County, was completed in mid-2020. Rents range from $1,550 to $1,750 for the one-bedroom units and from $1,725 to $2,050 for the
4Q = fourth quarter.Source: RealPage, Inc.
7.0
6.0
5.0
4.0
3.0
2.0
1,600
1,400
1,200
1,000
800
600
Vaca
ncy
Rat
e (%
)
Aver
age
Mon
thly
Ren
t ($)
Average Monthly Rent ($) Vacancy Rate (%)
4Q 20
00
4Q 20
01
4Q 20
02
4Q 20
03
4Q 20
04
4Q 20
05
4Q 20
06
4Q 20
07
4Q 20
08
4Q 20
09
4Q 20
10
4Q 20
11
4Q 20
12
4Q 20
13
4Q 20
14
4Q 20
15
4Q 20
16
4Q 20
17
4Q 20
18
4Q 20
19
4Q 20
20
1,295
6.1
3.4
Figure 25. Apartment Rents and Vacancy Rates in the Northern Suburbs Submarket
Note: Includes apartments and units intended for rental occupancy.Sources: U.S. Census Bureau, Building Permits Survey; 2000 through 2019—final data and estimates by the analyst; 2020—preliminary data and estimates by the analyst
2000
–200
4
2005
–200
7
2008
–202
0
1,500
1,000
500
0
Figure 26. Average Annual Rental Permitting Activity in the Northern Suburbs Submarket
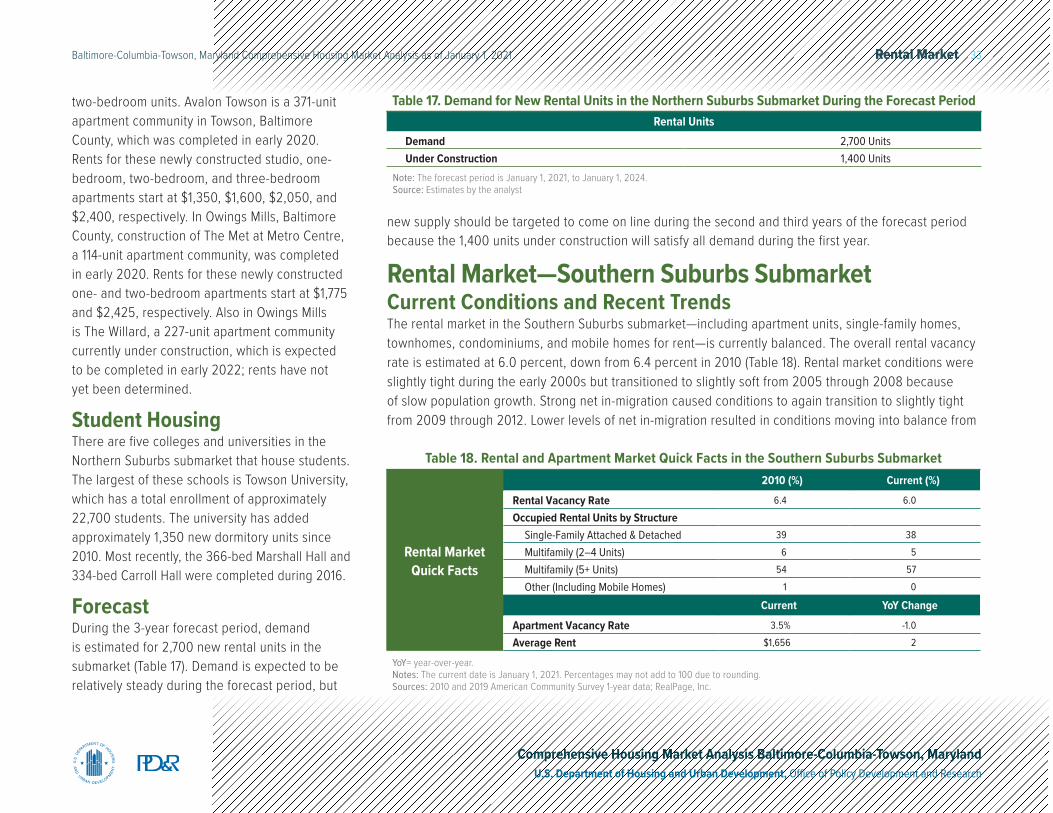
Rental Market 33Baltimore-Columbia-Towson, Maryland Comprehensive Housing Market Analysis as of January 1, 2021
Comprehensive Housing Market Analysis Baltimore-Columbia-Towson, MarylandU.S. Department of Housing and Urban Development, Office of Policy Development and Research
two-bedroom units. Avalon Towson is a 371-unit apartment community in Towson, Baltimore County, which was completed in early 2020. Rents for these newly constructed studio, one-bedroom, two-bedroom, and three-bedroom apartments start at $1,350, $1,600, $2,050, and $2,400, respectively. In Owings Mills, Baltimore County, construction of The Met at Metro Centre, a 114-unit apartment community, was completed in early 2020. Rents for these newly constructed one- and two-bedroom apartments start at $1,775 and $2,425, respectively. Also in Owings Mills is The Willard, a 227-unit apartment community currently under construction, which is expected to be completed in early 2022; rents have not yet been determined.
Student HousingThere are five colleges and universities in the Northern Suburbs submarket that house students. The largest of these schools is Towson University, which has a total enrollment of approximately 22,700 students. The university has added approximately 1,350 new dormitory units since 2010. Most recently, the 366-bed Marshall Hall and 334-bed Carroll Hall were completed during 2016.
ForecastDuring the 3-year forecast period, demand is estimated for 2,700 new rental units in the submarket (Table 17). Demand is expected to be relatively steady during the forecast period, but
new supply should be targeted to come on line during the second and third years of the forecast period because the 1,400 units under construction will satisfy all demand during the first year.
Rental Market—Southern Suburbs SubmarketCurrent Conditions and Recent TrendsThe rental market in the Southern Suburbs submarket—including apartment units, single-family homes, townhomes, condominiums, and mobile homes for rent—is currently balanced. The overall rental vacancy rate is estimated at 6.0 percent, down from 6.4 percent in 2010 (Table 18). Rental market conditions were slightly tight during the early 2000s but transitioned to slightly soft from 2005 through 2008 because of slow population growth. Strong net in-migration caused conditions to again transition to slightly tight from 2009 through 2012. Lower levels of net in-migration resulted in conditions moving into balance from
Note: The forecast period is January 1, 2021, to January 1, 2024.Source: Estimates by the analyst
Rental UnitsDemand 2,700 UnitsUnder Construction 1,400 Units
Table 17. Demand for New Rental Units in the Northern Suburbs Submarket During the Forecast Period
Rental Market Quick Facts
2010 (%) Current (%)
Rental Vacancy Rate 6.4 6.0
Occupied Rental Units by StructureSingle-Family Attached & Detached 39 38
Multifamily (2–4 Units) 6 5
Multifamily (5+ Units) 54 57
Other (Including Mobile Homes) 1 0
Current YoY Change
Apartment Vacancy Rate 3.5% -1.0
Average Rent $1,656 2
YoY= year-over-year.Notes: The current date is January 1, 2021. Percentages may not add to 100 due to rounding.Sources: 2010 and 2019 American Community Survey 1-year data; RealPage, Inc.
Table 18. Rental and Apartment Market Quick Facts in the Southern Suburbs Submarket
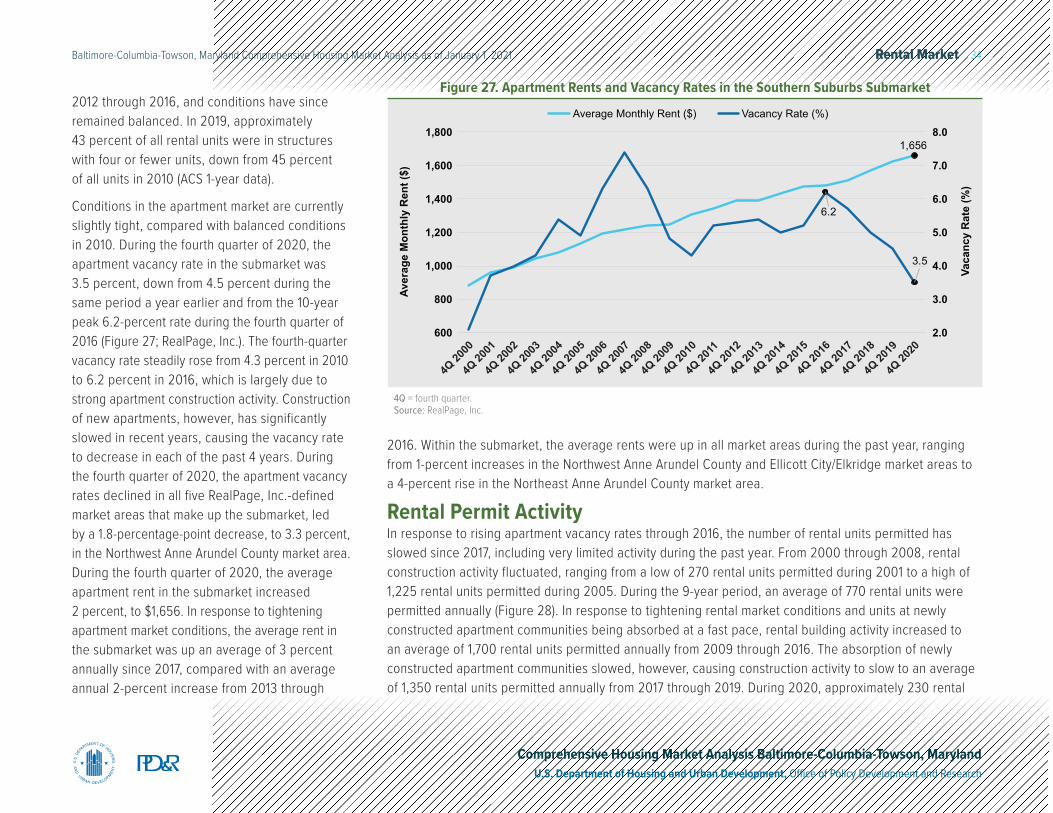
Rental Market 34Baltimore-Columbia-Towson, Maryland Comprehensive Housing Market Analysis as of January 1, 2021
Comprehensive Housing Market Analysis Baltimore-Columbia-Towson, MarylandU.S. Department of Housing and Urban Development, Office of Policy Development and Research
2012 through 2016, and conditions have since remained balanced. In 2019, approximately 43 percent of all rental units were in structures with four or fewer units, down from 45 percent of all units in 2010 (ACS 1-year data).
Conditions in the apartment market are currently slightly tight, compared with balanced conditions in 2010. During the fourth quarter of 2020, the apartment vacancy rate in the submarket was 3.5 percent, down from 4.5 percent during the same period a year earlier and from the 10-year peak 6.2-percent rate during the fourth quarter of 2016 (Figure 27; RealPage, Inc.). The fourth-quarter vacancy rate steadily rose from 4.3 percent in 2010 to 6.2 percent in 2016, which is largely due to strong apartment construction activity. Construction of new apartments, however, has significantly slowed in recent years, causing the vacancy rate to decrease in each of the past 4 years. During the fourth quarter of 2020, the apartment vacancy rates declined in all five RealPage, Inc.-defined market areas that make up the submarket, led by a 1.8-percentage-point decrease, to 3.3 percent, in the Northwest Anne Arundel County market area. During the fourth quarter of 2020, the average apartment rent in the submarket increased 2 percent, to $1,656. In response to tightening apartment market conditions, the average rent in the submarket was up an average of 3 percent annually since 2017, compared with an average annual 2-percent increase from 2013 through
4Q = fourth quarter.Source: RealPage, Inc.
8.0
7.0
6.0
5.0
4.0
3.0
2.0
1,800
1,600
1,400
1,200
1,000
800
600
Vaca
ncy
Rat
e (%
)
Aver
age
Mon
thly
Ren
t ($)
Average Monthly Rent ($) Vacancy Rate (%)
4Q 20
00
4Q 20
01
4Q 20
02
4Q 20
03
4Q 20
04
4Q 20
05
4Q 20
06
4Q 20
07
4Q 20
08
4Q 20
09
4Q 20
10
4Q 20
11
4Q 20
12
4Q 20
13
4Q 20
14
4Q 20
15
4Q 20
16
4Q 20
17
4Q 20
18
4Q 20
19
4Q 20
20
1,656
6.2
3.5
Figure 27. Apartment Rents and Vacancy Rates in the Southern Suburbs Submarket
2016. Within the submarket, the average rents were up in all market areas during the past year, ranging from 1-percent increases in the Northwest Anne Arundel County and Ellicott City/Elkridge market areas to a 4-percent rise in the Northeast Anne Arundel County market area.
Rental Permit ActivityIn response to rising apartment vacancy rates through 2016, the number of rental units permitted has slowed since 2017, including very limited activity during the past year. From 2000 through 2008, rental construction activity fluctuated, ranging from a low of 270 rental units permitted during 2001 to a high of 1,225 rental units permitted during 2005. During the 9-year period, an average of 770 rental units were permitted annually (Figure 28). In response to tightening rental market conditions and units at newly constructed apartment communities being absorbed at a fast pace, rental building activity increased to an average of 1,700 rental units permitted annually from 2009 through 2016. The absorption of newly constructed apartment communities slowed, however, causing construction activity to slow to an average of 1,350 rental units permitted annually from 2017 through 2019. During 2020, approximately 230 rental
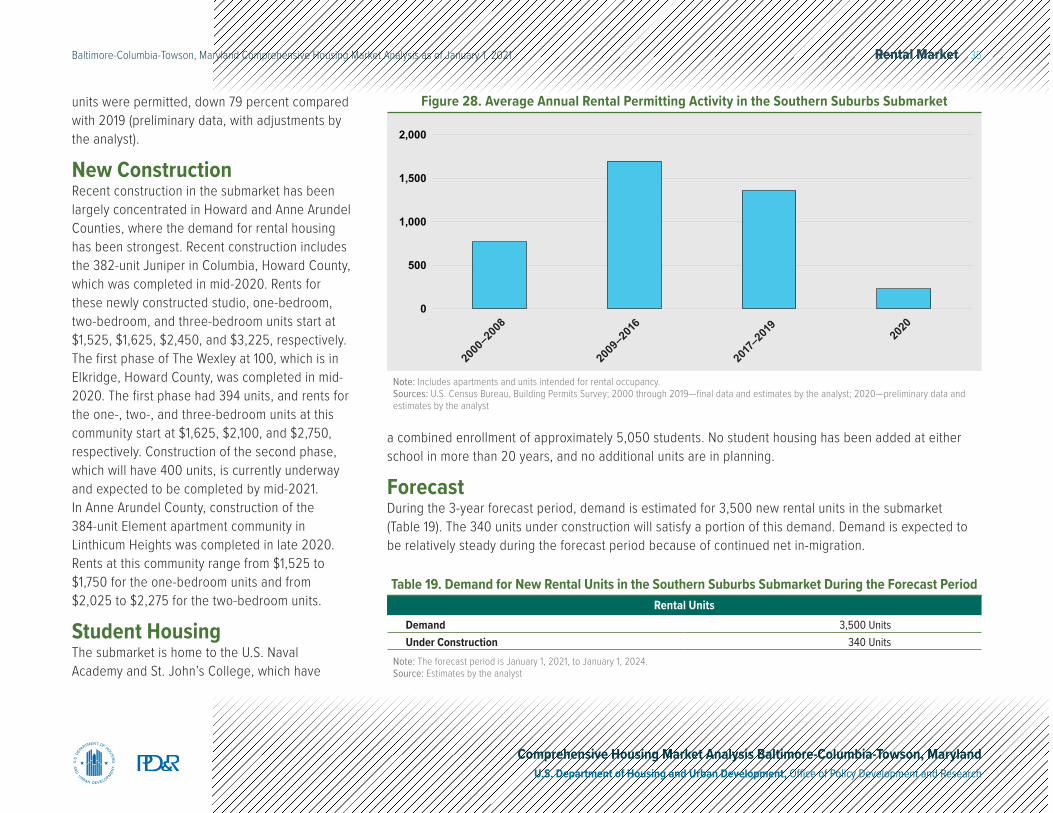
Rental Market 35Baltimore-Columbia-Towson, Maryland Comprehensive Housing Market Analysis as of January 1, 2021
Comprehensive Housing Market Analysis Baltimore-Columbia-Towson, MarylandU.S. Department of Housing and Urban Development, Office of Policy Development and Research
units were permitted, down 79 percent compared with 2019 (preliminary data, with adjustments by the analyst).
New ConstructionRecent construction in the submarket has been largely concentrated in Howard and Anne Arundel Counties, where the demand for rental housing has been strongest. Recent construction includes the 382-unit Juniper in Columbia, Howard County, which was completed in mid-2020. Rents for these newly constructed studio, one-bedroom, two-bedroom, and three-bedroom units start at $1,525, $1,625, $2,450, and $3,225, respectively. The first phase of The Wexley at 100, which is in Elkridge, Howard County, was completed in mid-2020. The first phase had 394 units, and rents for the one-, two-, and three-bedroom units at this community start at $1,625, $2,100, and $2,750, respectively. Construction of the second phase, which will have 400 units, is currently underway and expected to be completed by mid-2021. In Anne Arundel County, construction of the 384-unit Element apartment community in Linthicum Heights was completed in late 2020. Rents at this community range from $1,525 to $1,750 for the one-bedroom units and from $2,025 to $2,275 for the two-bedroom units.
Student HousingThe submarket is home to the U.S. Naval Academy and St. John’s College, which have
Note: Includes apartments and units intended for rental occupancy.Sources: U.S. Census Bureau, Building Permits Survey; 2000 through 2019—final data and estimates by the analyst; 2020—preliminary data and estimates by the analyst
0
500
1,000
1,500
2,000
2000
–200
8
2009
–201
6
2017
–201
920
20
Figure 28. Average Annual Rental Permitting Activity in the Southern Suburbs Submarket
a combined enrollment of approximately 5,050 students. No student housing has been added at either school in more than 20 years, and no additional units are in planning.
ForecastDuring the 3-year forecast period, demand is estimated for 3,500 new rental units in the submarket (Table 19). The 340 units under construction will satisfy a portion of this demand. Demand is expected to be relatively steady during the forecast period because of continued net in-migration.
Note: The forecast period is January 1, 2021, to January 1, 2024.Source: Estimates by the analyst
Rental UnitsDemand 3,500 UnitsUnder Construction 340 Units
Table 19. Demand for New Rental Units in the Southern Suburbs Submarket During the Forecast Period
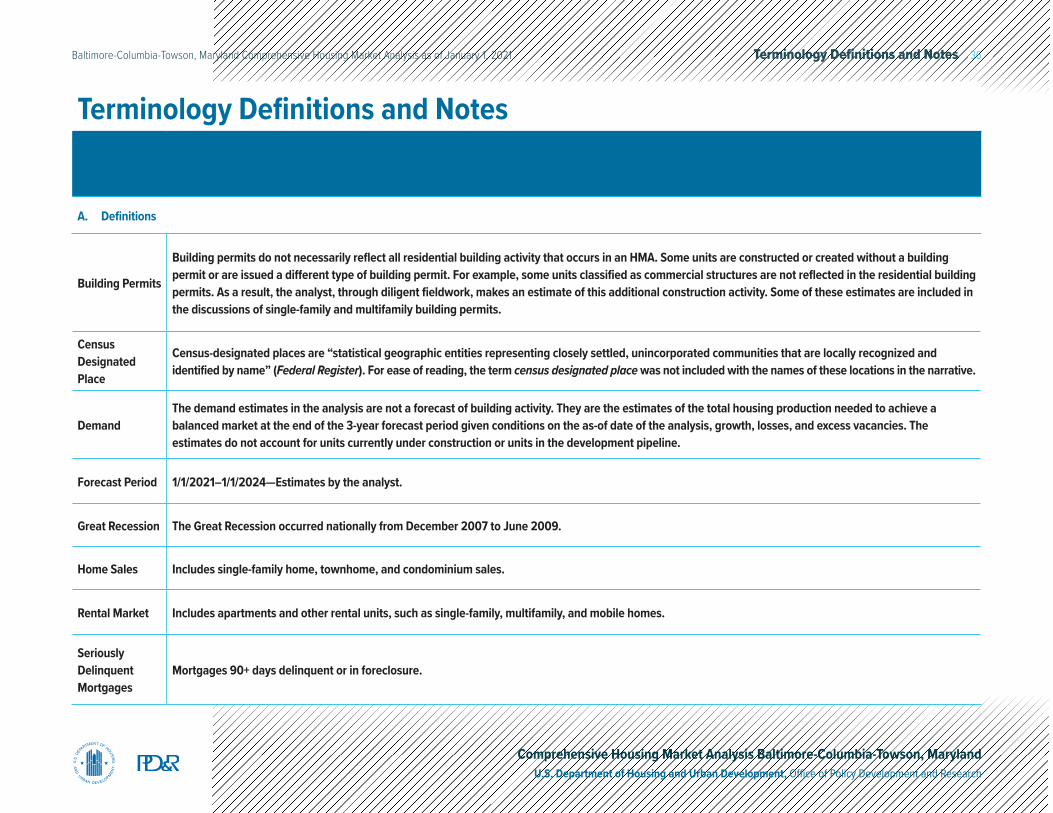
Terminology Definitions and Notes 36Baltimore-Columbia-Towson, Maryland Comprehensive Housing Market Analysis as of January 1, 2021
Comprehensive Housing Market Analysis Baltimore-Columbia-Towson, MarylandU.S. Department of Housing and Urban Development, Office of Policy Development and Research
Terminology Definitions and Notes
A. Definitions
Building Permits
Building permits do not necessarily reflect all residential building activity that occurs in an HMA. Some units are constructed or created without a building permit or are issued a different type of building permit. For example, some units classified as commercial structures are not reflected in the residential building permits. As a result, the analyst, through diligent fieldwork, makes an estimate of this additional construction activity. Some of these estimates are included in the discussions of single-family and multifamily building permits.
Census Designated Place
Census-designated places are “statistical geographic entities representing closely settled, unincorporated communities that are locally recognized and identified by name” (Federal Register). For ease of reading, the term census designated place was not included with the names of these locations in the narrative.
Demand
The demand estimates in the analysis are not a forecast of building activity. They are the estimates of the total housing production needed to achieve a balanced market at the end of the 3-year forecast period given conditions on the as-of date of the analysis, growth, losses, and excess vacancies. The estimates do not account for units currently under construction or units in the development pipeline.
Forecast Period 1/1/2021–1/1/2024—Estimates by the analyst.
Great Recession The Great Recession occurred nationally from December 2007 to June 2009.
Home Sales Includes single-family home, townhome, and condominium sales.
Rental Market Includes apartments and other rental units, such as single-family, multifamily, and mobile homes.
Seriously Delinquent Mortgages
Mortgages 90+ days delinquent or in foreclosure.
Terminology Definitions and Notes 37Baltimore-Columbia-Towson, Maryland Comprehensive Housing Market Analysis as of January 1, 2021
Comprehensive Housing Market Analysis Baltimore-Columbia-Towson, MarylandU.S. Department of Housing and Urban Development, Office of Policy Development and Research
B. Notes on Geography
1. The metropolitan statistical area definition noted in this report is based on the delineations established by the Office of Management and Budget (OMB) in the OMB Bulletin dated April 10, 2018.
C. Additional Notes
1.This analysis has been prepared for the assistance and guidance of HUD in its operations. The factual information, findings, and conclusions may also be useful to builders, mortgagees, and others concerned with local housing market conditions and trends. The analysis does not purport to make determinations regarding the acceptability of any mortgage insurance proposals that may be under consideration by the Department.
2.
The factual framework for this analysis follows the guidelines and methods developed by the Economic and Market Analysis Division within HUD. The analysis and findings are as thorough and current as possible based on information available on the as-of date from local and national sources. As such, findings or conclusions may be modified by subsequent developments. HUD expresses its appreciation to those industry sources and state and local government officials who provided data and information on local economic and housing market conditions.
D. Photo/Map Credits
Cover Photo iStock
Contact InformationJoseph Shinn, Economist Philadelphia HUD Regional Office215–430–[email protected]